CHENIERE ENERGY, INC.
10-Ks and 10-Qs
|
|
|
|
|
|
|
|
|
|
|
|
|
|
|
|
|
|
|
|
|
|
|
|
|
|
|
|
|
|
|
|
|
|
|
|
|
|
|
|
|
|
|
|
|
|
|
|
|
|
|
|
|
|
|
|
|
|
|
|
|
|
|
|
|
|
|
|
UNITED STATES
SECURITIES AND EXCHANGE COMMISSION
Washington, D.C. 20549
Form 10-K
|
x
|
ANNUAL REPORT PURSUANT TO SECTION 13 OR 15(D) OF THE SECURITIES EXCHANGE ACT OF 1934
|
For the fiscal year ended
December 31, 2012
OR
|
o
|
TRANSITION REPORT PURSUANT TO SECTION 13 OR 15(D) OF THE SECURITIES EXCHANGE ACT OF 1934
|
For the transition period from to
Commission File No. 001-16383
CHENIERE ENERGY, INC.
(Exact name of registrant as specified in its charter)
|
Delaware
|
95-4352386
|
|
(State or other jurisdiction of incorporation or organization)
|
(I.R.S. Employer Identification No.)
|
|
|
|
|
700 Milam Street, Suite 800
|
|
|
Houston, Texas
|
77002
|
|
(Address of principal executive offices)
|
(Zip code)
|
Registrant’s telephone number, including area code:
(713) 375-5000
Securities registered pursuant to Section 12(b) of the Act:
|
Common Stock, $ 0.003 par value
|
NYSE MKT
|
|
(Title of Class)
|
(Name of each exchange on which registered)
|
Securities registered pursuant to Section 12(g) of the Act:
None
Indicate by check mark if the registrant is a well-known seasoned issuer, as defined in Rule 405 of the Securities Act. Yes
x
No
o
Indicate by check mark if the registrant is not required to file reports pursuant to Section 13 or Section 15(d) of the Exchange Act. Yes
o
No
x
Indicate by check mark whether the registrant (1) has filed all reports required to be filed by Section 13 or 15(d) of the Securities Exchange Act of 1934 during the preceding 12 months (or for such shorter period that the registrant was required to file such reports), and (2) has been subject to such filing requirements for the past 90 days. Yes
x
No
o
Indicate by check mark whether the registrant has submitted electronically and posted on its corporate Web site, if any, every Interactive Data File required to be submitted and posted pursuant to Rule 405 of Regulation S-T during the preceding 12 months (or for such shorter period that the registrant was required to submit and post such files). Yes
x
No
o
Indicate by check mark if disclosure of delinquent filers pursuant to Item 405 of Regulation S-K is not contained herein, and will not be contained, to the best of the registrant’s knowledge, in definitive proxy or information statements incorporated by reference in Part III of this Form 10-K or any amendment to this Form 10-K.
x
Indicate by check mark whether the registrant is a large accelerated filer, an accelerated filer, a non-accelerated filer, or a smaller reporting company. See the definitions of "large accelerated filer", "accelerated filer" and "smaller reporting company" in Rule 12b-2 of the Exchange Act. (Check one):
|
Large accelerated filer
x
|
Accelerated filer
o
|
Non-accelerated filer
o
|
Smaller reporting company
o
|
|
(Do not check if a smaller reporting company)
|
|
||
Indicate by check mark whether the registrant is a shell company (as defined in Rule 12b-2 of the Exchange Act). Yes
o
No
x
The aggregate market value of the registrant’s Common Stock held by non-affiliates of the registrant was approximately $2.7 billion as of June 30, 2012.
241,513,095
shares of the registrant’s Common Stock were outstanding as of February 20, 2013.
Documents incorporated by reference: The definitive proxy statement for the registrant’s Annual Meeting of Stockholders (to be filed within 120 days of the close of the registrant’s fiscal year) is incorporated by reference into Part III.
CHENIERE ENERGY, INC.
TABLE OF CONTENTS
|
|
|
i
CAUTIONARY STATEMENT
REGARDING FORWARD-LOOKING STATEMENTS
This annual report contains certain statements that are, or may be deemed to be, "forward-looking statements" within the meaning of Section 27A of the Securities Act of 1933, as amended (the "Securities Act"), and Section 21E of the Securities Exchange Act of 1934, as amended (the "Exchange Act"). All statements, other than statements of historical facts, included herein or incorporated herein by reference are "forward-looking statements." Included among "forward-looking statements" are, among other things:
|
•
|
statements that we expect to commence or complete construction of our proposed liquefied natural gas ("LNG") terminals or our proposed pipelines, liquefaction facilities or other projects, or any expansions thereof, by certain dates, or at all;
|
|
•
|
s
tatements regarding future levels of domestic and international natural gas production, supply or consumption or future levels of liquefied natural gas ("LNG") imports into or exports from North America and other countries worldwide, regardless of the source of such information, or the transportation or demand for and prices related to natural gas, LNG or other hydrocarbon products
;
|
|
•
|
statements regarding any financing transactions or arrangements, or ability to enter into such transactions;
|
|
•
|
statements relating to the construction of our Trains, including statements concerning the engagement of any engineering, procurement and construction ("EPC") contractor or other contractor and the anticipated terms and provisions of any agreement with any EPC or other contractor, and anticipated costs related thereto;
|
|
•
|
statements regarding any agreement to be entered into or performed substantially in the future, including any revenues anticipated to be received and the anticipated timing thereof, and statements regarding the amounts of total LNG regasification, liquefaction or storage capacities that are, or may become subject to contracts;
|
|
•
|
statements regarding counterparties to our commercial contracts, construction contracts and other contracts;
|
|
•
|
statements regarding our planned construction of additional Trains, including the financing of such Trains;
|
|
•
|
statements that our Trains, when completed, will have certain characteristics, including amounts of liquefaction capacities;
|
|
•
|
statements regarding our business strategy, our strengths, our business and operation plans or any other plans, forecasts, projections or objectives, including anticipated revenues and capital expenditures, any or all of which are subject to change;
|
|
•
|
statements regarding legislative, governmental, regulatory, administrative or other public body actions, requirements, permits, investigations, proceedings or decisions;
|
|
•
|
statements regarding our anticipated LNG and natural gas marketing activities; and
|
|
•
|
any other statements that relate to non-historica
l or future information.
|
These forward-looking statements are often identified by the use of terms and phrases such as "achieve," "anticipate," "believe," "contemplate," "develop," "estimate," "expect," "forecast," "plan," "potential," "project," "propose," "strategy" and similar terms and phrases, or by the use of future tense. Although we believe that the expectations reflected in these forward-looking statements are reasonable, they do involve assumptions, risks and uncertainties, and these expectations may prove to be incorrect. You should not place undue reliance on these forward-looking statements, which are made as of the date of this annual report and speak only as of the date of this annual report.
Our actual results could differ materially from those anticipated in these forward-looking statements as a result of a variety of factors, including those discussed in "Risk Factors." All forward-looking statements attributable to us or persons acting on our behalf are expressly qualified in their entirety by these risk factors.
ii
DEFINITIONS
In this annual report, unless the context otherwise requires:
|
•
|
Bcf
means billion cubic feet;
|
|
•
|
Bcf/d
means billion cubic feet per day;
|
|
•
|
Bcfe
means billion cubic feet of natural gas equivalent using the ratio of six thousand cubic feet of natural gas to one barrel (or 42 U.S. gallons liquid volume) of crude oil, condensate and natural gas liquids;
|
|
•
|
cm
means cubic meter;
|
|
•
|
Dthd
means dekatherms per day which is equivalent to one million British thermal units or one MMBtu per day;
|
|
•
|
EPC
means engineering, procurement and construction;
|
|
•
|
Henry Hub
means the final settlement price (in USD per MMBtu) for the New York Mercantile Exchange's Henry Hub natural gas futures contract for the month in which a relevant cargo's delivery window is scheduled to begin;
|
|
•
|
LNG
means liquefied natural gas;
|
|
•
|
MMBtu
means million British thermal units;
|
|
•
|
mmtpa
means million metric tons per annum;
|
|
•
|
SPA
means a LNG sale and purchase agreement;
|
|
•
|
Tcf
means trillion cubic feet;
|
|
•
|
Train
means a natural gas liquefaction train; and
|
|
•
|
TUA
means terminal use agreement.
|
ITEMS 1. AND 2.
BUSINESS AND PROPERTIES
General
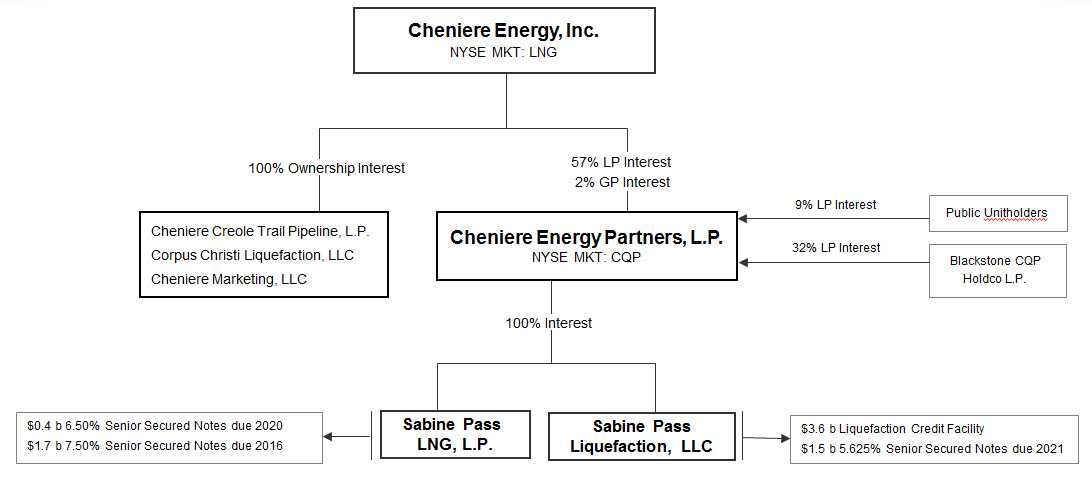
Cheniere Energy, Inc. (NYSE MKT: LNG), a Delaware corporation, is a Houston-based energy company primarily engaged in LNG-related businesses. We own and operate the Sabine Pass LNG terminal in Louisiana through our
59.5%
ownership interest in and management agreements with Cheniere Energy Partners, L.P. ("Cheniere Partners") (NYSE MKT: CQP), which is a publicly traded partnership that we created in 2007.
The Sabine Pass LNG terminal is located on the Sabine Pass deep water shipping channel less than four miles from the Gulf Coast. The Sabine Pass LNG terminal has regasification facilities owned by Cheniere Partners' wholly owned subsidiary, Sabine Pass LNG, L.P. ("Sabine Pass LNG"), that includes existing infrastructure of five LNG storage tanks with capacity of approximately16.9 Bcfe, two docks that can accommodate vessels of up to 265,000 cubic meters and vaporizers with regasification capacity of approximately 4.0 Bcf/d. Cheniere Partners is developing natural gas liquefaction facilities (the "Liquefaction Project") at the Sabine Pass LNG terminal adjacent to the existing regasification facilities through its wholly owned subsidiary, Sabine Pass Liquefaction, LLC ("Sabine Pass Liquefaction"). We also own and operate the Creole Trail Pipeline, which interconnects the Sabine Pass LNG terminal with natural gas markets in North America. Approximately one-half of the LNG receiving capacity at the Sabine Pass LNG terminal is contracted to two multinational energy companies. One of our subsidiaries, Cheniere Marketing, LLC ("Cheniere Marketing"), is marketing LNG and natural gas on its own behalf and on behalf of Cheniere Partners, in an effort to monetize the other half of the LNG capacity at the Sabine Pass LNG terminal during construction of the Liquefaction Project. We are also in various stages of developing other projects, including LNG terminal and associated pipeline related projects, each of which, among other things, will require acceptable commercial and financing arrangements before we make a final investment decision.
1
LNG is natural gas that, through a refrigeration process, has been cooled to a liquid state, which occupies a volume that is approximately 1/600th of its gaseous state. The liquefaction of natural gas into LNG allows it to be shipped economically from areas of the world where natural gas is abundant and inexpensive to produce to other areas where natural gas demand and infrastructure exist to justify economically the use of LNG. LNG is transported using large oceangoing LNG tankers specifically constructed for this purpose. LNG receiving terminals offload LNG from LNG tankers, store the LNG prior to processing, heat the LNG to return it to a gaseous state and deliver the resulting natural gas into pipelines for transportation to market.
Unless the context requires otherwise, references to the "Company", "Cheniere", "we", "us" and "our" refer to Cheniere Energy, Inc. and its subsidiaries, including our publicly traded subsidiary partnership, Cheniere Partners.
Although results are consolidated for financial reporting, we and Cheniere Partners operate with independent capital structures. Cash flow available to us from Cheniere Partners is primarily in the form of management fees and cash distributions declared and paid to us on our common units and general partner interest. See "Management's Discussion and Analysis of Financial Condition and Results of Operations" for more discussion on how we receive cash flow from Cheniere Partners.
The following diagram depicts our abbreviated capital structure, including our ownership of Cheniere Partners, Sabine Pass LNG and Sabine Pass Liquefaction as of
February 13, 2013
:
Our Business Strategy
Our primary business strategy is to identify markets where growth is constrained by lack of infrastructure and in those markets develop, construct, and operate assets supported by long-term, fixed fee contracts. We plan to implement our strategy by:
|
•
|
completing construction and commencing operation of our Trains (each in sequence, "Train 1", "Train 2", "Train 3", "Train 4", "Train 5" and "Train 6");
|
|
•
|
developing and operating our Trains safely, efficiently and reliably;
|
|
•
|
making LNG available to our long-term SPA customers to generate steady and reliable revenues and operating cash flows;
|
|
•
|
safely maintaining and operating the Sabine Pass LNG terminal and the Creole Trail Pipeline;
|
|
•
|
utilizing capacity at the Sabine Pass LNG terminal for short-term and spot LNG purchases and sales until such capacity is used in connection with the Liquefaction Project;
|
|
•
|
developing business relationships for the marketing of additional long-term and short-term agreements for excess LNG volumes at the Sabine Pass LNG terminal that have not been sold to our long-term customers, and for long-term and short-term contracts for potential future projects at other sites;
|
2
|
•
|
optimizing our capital structure to finance the construction and operation of the facilities needed to serve our customers; and
|
|
•
|
developing business opportunities for a second liquefaction facility near Corpus Christi, Texas and obtaining the requisite regulatory permits, long-term contracts and financing to reach a final investment decision regarding the development of this liquefaction project.
|
Business Segments
Our business activities are conducted by two operating segments for which we provide information in our consolidated financial statements for the years ended December 31,
2012
,
2011
and
2010
. These two segments are our:
|
•
|
LNG terminal business; and
|
|
•
|
LNG and natural gas marketing business.
|
For information about our segments’ revenues, profits and losses and total assets, see
Note 17—"Business Segment Information"
of our Notes to Consolidated Financial Statements.
LNG Terminal Business
We began developing our LNG terminal business in 1999 and were among the first companies to secure sites and commence development of new LNG terminals in North America. We focused our development efforts on three LNG terminal projects: Sabine Pass LNG in western Cameron Parish, Louisiana, less than four miles from the Gulf Coast on the deepwater ship channel; Corpus Christi LNG near Corpus Christi, Texas; and Creole Trail LNG at the mouth of the Calcasieu Channel in central Cameron Parish, Louisiana. We have constructed and are operating regasification facilities at the Sabine Pass LNG terminal and are developing and constructing the Liquefaction Project, which is owned through Cheniere Partners, in which we hold an approximate
59.5%
interest. We currently own 100% interests in both the Corpus Christi and Creole Trail LNG terminal projects.
Sabine Pass LNG Terminal
Regasification Facilities
The regasification facilities at the Sabine Pass LNG terminal have operational regasification capacity of approximately 4.0 Bcf/d and aggregate LNG storage capacity of approximately 16.9 Bcfe. Approximately 2.0 Bcf/d of the regasification capacity at the Sabine Pass LNG terminal has been reserved under two long-term third-party TUAs, under which Sabine Pass LNG’s customers are required to pay fixed monthly fees, whether or not they use the LNG terminal. Capacity reservation fee TUA payments are made by Sabine Pass LNG's third-party TUA customers as follows:
|
•
|
Total Gas & Power North America, Inc. ("Total") has reserved approximately 1.0 Bcf/d of regasification capacity and is obligated to make monthly capacity payments to Sabine Pass LNG aggregating approximately $125 million per year for 20 years that commenced April 1, 2009. Total, S.A. has guaranteed Total’s obligations under its TUA up to $2.5 billion, subject to certain exceptions; and
|
|
•
|
Chevron U.S.A. Inc. ("Chevron") has reserved approximately 1.0 Bcf/d of regasification capacity and is obligated to make monthly capacity payments to Sabine Pass LNG aggregating approximately $125 million per year for 20 years that commenced July 1, 2009. Chevron Corporation has guaranteed Chevron’s obligations under its TUA up to 80% of the fees payable by Chevron.
|
The remaining approximately 2.0 Bcf/d of capacity has been reserved under a TUA by Sabine Pass Liquefaction. Sabine Pass Liquefaction is obligated to make monthly capacity payments to Sabine Pass LNG aggregating approximately $250 million per year, continuing until at least 20 years after Sabine Pass Liquefaction delivers its first commercial cargo at Sabine Pass Liquefaction's facilities under construction, which may occur as early as late 2015. Sabine Pass Liquefaction obtained this reserved capacity as a result of an assignment in July 2012 by Cheniere Energy Investments, LLC ("Cheniere Investments"), a wholly owned subsidiary of Cheniere Partners, of its rights, title and interest under its TUA. In connection with the assignment, Sabine Pass Liquefaction, Cheniere Investments and Sabine Pass LNG entered into a terminal use rights assignment and agreement ("TURA") pursuant to which Cheniere Investments has the right to use Sabine Pass Liquefaction's reserved capacity under the
3
TUA and has the obligation to make the monthly capacity payments required by the TUA to Sabine Pass LNG. In an effort to monetize Cheniere Investments’ reserved capacity under its TURA during construction of the Liquefaction Project, Cheniere Marketing, a wholly owned subsidiary of Cheniere, has entered into a variable capacity rights agreement ("VCRA") pursuant to which Cheniere Marketing is obligated to pay Cheniere Investments 80% of the expected gross margin of each cargo of LNG that Cheniere Marketing arranges for delivery to the Sabine Pass LNG terminal. The revenue earned by Sabine Pass LNG from the capacity payments made under the TUA and the revenue earned by Cheniere Investments under the VCRA are eliminated upon consolidation of our financial statements. Cheniere Partners has guaranteed the obligations of Sabine Pass Liquefaction under its TUA and the obligations of Cheniere Investments under the TURA.
In September 2012, Sabine Pass Liquefaction entered into a partial TUA assignment agreement with Total, whereby Sabine Pass Liquefaction will progressively gain access to Total's capacity and other services provided under Total's TUA with Sabine Pass LNG. This agreement will provide Sabine Pass Liquefaction with additional berthing and storage capacity at the Sabine Pass LNG terminal that may be used to accommodate the development of Train 5 and Train 6, provide increased flexibility in managing LNG cargo loading and unloading activity starting with the commencement of commercial operations of Train 3, and permit Sabine Pass Liquefaction to more flexibly manage its LNG storage capacity with the commencement of Train 1. Notwithstanding any arrangements between Total and Sabine Pass Liquefaction, payments required to be made by Total to Sabine Pass LNG shall continue to be made by Total to Sabine Pass LNG in accordance with its TUA.
Under each of these TUAs, Sabine Pass LNG is entitled to retain 2% of the LNG delivered to the Sabine Pass LNG terminal.
Liquefaction Facilities
The Liquefaction Project is being developed at the Sabine Pass LNG terminal adjacent to the existing regasification facilities. We plan to construct up to six Trains, which are in various stages of development. We have commenced construction of Train 1 and Train 2 and the related new facilities needed to treat, liquefy, store and export natural gas. Construction of Train 3 and Train 4 and the related facilities is expected to commence upon, among other things, obtaining financing commitments sufficient to fund construction of such Trains and making a positive final investment decision. We recently began the development of Train 5 and Train 6 and expect to commence the regulatory approval process in the first half of 2013.
The Trains are being designed, constructed and commissioned by Bechtel Oil, Gas and Chemicals, Inc. ("Bechtel") using the ConocoPhillips Optimized Cascade® technology, a proven technology deployed in numerous LNG projects around the world. Sabine Pass Liquefaction has entered into lump sum turnkey contracts for the engineering, procurement and construction of Train 1 and Train 2 (the "EPC Contract (Train 1 and 2)") and Train 3 and Train 4 (the "EPC Contract (Train 3 and 4)", and together with the EPC Contract (Train 1 and 2), the "EPC Contracts"), with Bechtel in November 2011 and December 2012, respectively.
In August 2012, we received a final order from the U.S. Department of Energy ("DOE") to export 16 mmtpa of LNG to all nations with which trade is permitted. In April 2012, we received authorization from the Federal Energy Regulatory Commission ("FERC") to site, construct and operate Train 1, Train 2, Train 3 and Train 4.
As of December 31, 2012, the overall project completion for Train 1 and Train 2 was approximately 18% complete. Based on our current construction schedule, we anticipate that Train 1 will produce LNG as early as the end of 2015.
Customers
As of
February 13, 2013
, Sabine Pass Liquefaction has entered into the following third-party SPAs:
|
•
|
BG Gulf Coast LNG, LLC ("BG") SPA commences upon the date of first commercial delivery for Train 1 and includes an annual contract quantity of 182,500,000 MMBtu of LNG and a fixed fee of $2.25 per MMBtu and includes additional annual contract quantities of 36,500,000 MMBtu, 34,000,000 MMBtu, and 33,500,000 MMBtu upon the date of first commercial delivery for Train 2, Train 3 and Train 4, respectively, with a fixed fee of $3.00 per MMBtu. The total expected annual contracted cash flow from BG from the fixed fee component is $723 million. In addition, Sabine Pass Liquefaction has agreed to make LNG available to BG
to the extent that Train 1 becomes commercially operable prior to the beginning of the first delivery window. The obligations of BG are guaranteed by BG Energy Holdings Limited, a company organized under the laws of England and Wales, with a credit rating of A2/A.
|
|
•
|
Gas Natural Aprovisionamientos SDG S.A. ("Gas Natural Fenosa"), an affiliate of Gas Natural SDG, S.A., SPA
|
4
commences upon the date of first commercial delivery for Train 2 and includes an annual contract quantity of 182,500,000 MMBtu of LNG and a fixed fee of $2.49 per MMBtu, equating to expected annual contracted cash flow from the fixed fee component of $454 million. The obligations of Gas Natural Fenosa are guaranteed by Gas Natural SDG S.A., a company organized under the laws of Spain, with a credit rating of Baa2/BBB.
|
•
|
Korea Gas Corporation ("KOGAS")
SPA commences upon the date of first commercial delivery for Train 3 and includes an annual contract quantity of 182,500,000 MMBtu of LNG and a fixed fee of $3.00 per MMBtu, equating to expected annual contracted cash flow from fixed fees of $548 million. KOGAS is organized under the laws of the Republic of Korea, with a credit rating of A/A1.
|
|
•
|
GAIL (India) Limited ("
GAIL") SPA commences upon the date of first commercial delivery for Train 4 and includes an annual contract quantity of 182,500,000 MMBtu of LNG and a fixed fee of $3.00 per MMBtu, equating to expected annual contracted cash flow from fixed fees of $548 million. GAIL is organized under the laws of India, with a credit rating of Baa2/BBB-.
|
|
•
|
Total,
an affiliate of Total S.A., SPA commences upon the date of first commercial delivery for Train 5 and includes an annual contract quantity of 104,750,000 MMBtu of LNG and a fixed fee of $3.00 per MMBtu, equating to expected annual contracted cash flow from fixed fees of $314 million. The obligations of Total are guaranteed by Total S.A., a company orga
nized under the laws of France, with a credit rating of Aa1/AA.
|
In
aggregate, the fixed fee portion to be paid by these customers is approximately $2.6 billion annually, with fixed fees starting from the commencement of operations of Train 1, Train 2, Train 3, Train 4 and Train 5 equating to $411 million, $564 million, $650 million, $648 million and $314 million, respectively.
In addition, Cheniere Marketing has entered into an SPA to purchase, at its option, any excess LNG produced that is not committed to non-affiliate parties, for up to a maximum of 104,000,000 MMBtu per annum produced from Train 1 through Train 4. Cheniere Marketing may purchase incremental LNG volumes at a price of 115% of Henry Hub plus up to $3.00 per MMBtu for the first 36,000,000 MMBtu of the most profitable cargoes sold each year by Cheniere Marketing, and then 20% of net profits of the remaining 68,000,000 MMBtu sold each year by Cheniere Marketing.
Construction
In November 2011, Sabine Pass Liquefaction entered into the EPC Contract (Train 1 and 2) with Bechtel. Sabine Pass Liquefaction issued a notice to proceed for construction under the EPC Contract (Train 1 and 2) in August 2012.
In December 2012,
Sabine Pass Liquefaction
entered into the EPC Contract (Train 3 and 4) with Bechtel. Under the EPC Contract (Train 3 and 4), if
Sabine Pass Liquefaction
fails to issue notice to proceed to Bechtel by December 31, 2013, then either
Sabine Pass Liquefaction
or Bechtel may terminate the EPC Contract (Train 3 and 4), and Bechtel will be paid costs reasonably incurred on account of such termination and a lump sum of $5.0 million. The Trains are in various stages of development, as described above.
The contract price of the EPC Contract (Train 1 and 2) is approximately $3.97 billion, reflecting amounts incurred under change orders through December 31, 2012. Total expected capital costs for Train 1 and Train 2 are estimated to be between $4.5 billion and $5.0 billion before financing costs, including estimated owner's costs and contingencies. Budgeted total all-in costs for Train 1 and Train 2 are estimated to be between $5.5 billion and $6.0 billion, including financing costs and interest expense during construction. The contract price of the EPC Contract (Train 3 and 4) is $3.77 billion, only subject to adjustment by change order (including if
Sabine Pass Liquefaction
issues the notice to proceed after June 1, 2013).
The liquefaction technology to be employed under the EPC Contracts is the ConocoPhillips Optimized Cascade
®
Process, which was first used at the ConocoPhillips Petroleum Kenai plant built by Bechtel in 1969 in Kenai, Alaska. Bechtel has since designed and/or constructed LNG facilities using the ConocoP
hillips Optimized Cascade
®
technology in Angola, Australia, Egypt, Equatorial Guinea and Trinidad. The design and technology has been proven in over four decades of operation.
Pipeline Facilities
Cheniere Creole Trail Pipeline, L.P. ("Creole Trail"), an indirect wholly owned subsidiary of Cheniere, owns the Creole Trail Pipeline, a 94-mile pipeline interconnecting the Sabine Pass LNG terminal with a number of large interstate pipelines,
5
including Natural Gas Pipeline Company of America, Transcontinental Gas Pipeline Corporation, Tennessee Gas Pipeline Company, Florida Gas Transmission Company, Texas Eastern Gas Transmission, and Trunkline Gas Company, as well as the intrastate pipeline system of Bridgeline Holdings, L.P.
Sabine Pass Liquefaction has entered into a transportation precedent agreement to secure firm pipeline transportation capacity with Creole Trail and two other pipelines for Train 1 and Train 2. Creole Trail filed an application with the FERC in April 2012 for certain modifications to allow the Creole Trail Pipeline to be able to transport natural gas to the Sabine Pass LNG terminal. We estimate the capital costs to modify the Creole Trail Pipeline will be approximately $90 million. The modifications are expected to be in service in time for the commissioning and testing of Train 1 and Train 2.
We have entered into an agreement with Cheniere Partners to sell the equity interests of the entities that own the Creole Trail Pipeline if, among other things, Cheniere Partners obtains acceptable financing for the purchase price. The consideration to be paid by Cheniere Partners for the Creole Trail Pipeline is 12 million Class B units and $300 million, plus any costs incurred by Creole Trail from August 2012 until the sale date, including, if applicable, any portion of the expected $90 million for pipeline modifications.
Corpus Christi LNG Terminal
Liquefaction Facilities
In September 2011, we formed Corpus Christi Liquefaction, LLC ("Corpus Christi Liquefaction") to develop an LNG terminal near Corpus Christi on over 1,000 acres of land that we own or control. As currently contemplated, the proposed Corpus Christi Liquefaction LNG terminal would be designed for up to three Trains with aggregate nominal production capacity up to 15 mmtpa of LNG, have three LNG storage tanks with capacity of 10.1 Bcfe and two docks that can accommodate vessels of up to 265,000 cubic meters (the "Corpus Liquefaction Project").
In December 2011, Corpus Christi Liquefaction received approval from the FERC to begin the National Environmental Policy Act ("NEPA") pre-filing process required to seek authorization to commence construction of the Corpus Liquefaction Project. In August 2012, Corpus Christi Liquefaction filed an application with the FERC for authorization to site, construct and operate the Corpus Liquefaction Project. Simultaneously, Cheniere Marketing filed an application with the DOE to export up to 15 mmtpa of domestically produced LNG to FTA and non-FTA countries from the proposed Corpus Liquefaction Project. In October 2012, the DOE granted Cheniere Marketing authority to export 15 mmtpa per year of domestically produced LNG to FTA countries from the proposed Corpus Liquefaction Project.
We will contemplate making a final investment decision to commence construction of the Corpus Liquefaction Project based upon, among other things, entering into acceptable commercial arrangements, receiving regulatory authorization from the FERC to construct and operate the liquefaction assets, securing pipeline transportation of natural gas to the Corpus Liquefaction Project and obtaining adequate financing to construct the facility.
Pipeline Facilities
In conjunction with the Corpus Liquefaction Project, we filed an application with the FERC in August 2012 for authorization to site, construct and operate 23 miles of 48" pipeline that would interconnect the Corpus Liquefaction Project with approximately 3.25 Bcf/d of natural gas interconnect capacity (the "Corpus Christi Pipeline"). The pipeline is designed to transport 2.25 Bcf/d of feed and fuel gas required by the Corpus Liquefaction Project from the existing intra- and interstate natural gas pipeline grid.
We will contemplate making a final investment decision to commence construction of the Corpus Christi Pipeline based upon, among other things, receiving regulatory authorization from the FERC to construct and operate the pipeline and obtaining adequate financing.
Other LNG Terminal Sites
We continue to evaluate, and may develop, additional sites that we believe may be commercially desirable locations for LNG terminals and other facilities.
6
Competition
Sabine Pass LNG currently does not experience competition for its terminal capacity because the entire approximately 4.0 Bcf/d of regasification capacity that is available at the Sabine Pass LNG terminal has been fully contracted. If and when Sabine Pass LNG has to replace any TUAs, it will compete with other then-existing LNG terminals for customers.
T
he Liquefaction Project currently does not experience competition with respect to Train 1 through Train 4, and a portion of Train 5. Sabine Pass Liquefaction
has entered into five fixed price, 20-year LNG SPAs that will utilize substantially all of the liquefaction capacity available from these Trains. Each customer will be required to pay an escalating fixed fee for its annual contract quantity even if it elects not to purchase any LNG from us.
If and when Sabine Pass Liquefaction needs to replace any existing SPA or enter into new SPAs with respect to Train 5 and Train 6, Sabine Pass Liquefaction will compete on the basis of price per contracted volume of LNG with other LNG liquefaction projects throughout the world. Revenues associated with any incremental volumes of the Project, including those under the CMI SPA, will also be subject to market-based price competition.
Other LNG terminal sites that we may develop will compete for customers with other companies that are constructing and operating LNG receiving terminals and liquefaction facilities around the world. Many of the companies with which we compete are major energy corporations with longer operating histories, more development experience, greater name recognition, greater financial, technical and marketing resources and greater access to markets than we do.
Our pipelines will face competition from other interstate and/or intrastate pipelines that connect with our LNG terminals. In particular, our Creole Trail Pipeline competes with the Kinder Morgan Louisiana Pipeline owned by Kinder Morgan Energy Partners, L.P. ("Kinder Morgan"). Kinder Morgan has built a 3.2 Bcf/d take-away pipeline system from the Sabine Pass LNG terminal. Total and Chevron have both signed agreements with Kinder Morgan securing 100% of the initial capacity on the Kinder Morgan Louisiana Pipeline for 20 years.
Governmental Regulation
Our LNG operations and construction projects are subject to extensive regulation under federal, state and local statutes, rules, regulations and laws. These laws require that we engage in consultations with appropriate federal and state agencies and that we obtain and maintain applicable permits and other authorizations. This regulatory burden increases our cost of operations and construction, and failure to comply with such laws could result in substantial penalties.
Federal Energy Regulatory Commission ("FERC")
The
design, construction and operation of our proposed liquefaction facilities, and the export of LNG, are highly regulated activities.
In order to site and construct our LNG terminals, we must receive and are required to maintain authorization from the FERC under Section 3 of the Natural Gas Act of 1938, as amended ("NGA").
The FERC's approval under Section 3 of the NGA, as well as several other material governmental and regulatory approvals and permits, are required in order to site, construct and operate our liquefaction facilities.
T
he Energy Policy Act of 2005 ("EPAct"), amended Section 3 of the NGA to establish or clarify the FERC's exclusive authority to approve or deny an application for the siting, construction, expansion or operation of LNG terminals, although except as specifically provided in the EPAct, nothing in the EPAct is intended to affect otherwise applicable law related to any other federal agency's authorities or responsibilities related to LNG terminals. Sabine Pass Liquefaction filed an application with the FERC in January 2011 for an order under Section 3 of the NGA authorizing the siting, construction and operation of the Liquefaction Project, including the siting, construction and operation of Train 1 through Train 4. The FERC issued final orders in April and July 2012 approving Sabine Pass Liquefaction's application. Subsequently, the FERC issued written approval to commence site preparation work for Train 1 through Train 4. The FERC approval requires Sabine Pass Liquefaction to obtain certain additional FERC approvals as construction progresses. To date Sabine Pass Liquefaction has been able to obtain these approvals as needed. In October 2012, Sabine Pass Liquefaction filed an application at the FERC to amend its orders to reflect certain modifications of the Liquefaction Project. The pending modifications will require additional review by the FERC under the National Environmental Policy Act ("NEPA"), which will include preparation and evaluation of a supplemental Environmental Assessment for the project. The need for this approval has not materially affected Sabine Pass Liquefaction's construction progress. Sabine
7
Pass Liquefaction will also need the FERC's approval to construct Train 5 and Train 6, which have not yet been authorized at this time. Throughout the life of our proposed liquefaction facilities, we will be subject to regular reporting requirements to the FERC and the U.S. Department of Transportation regarding the operation and maintenance of the facilities.
The EPAct amended the NGA to prohibit market manipulation, and increased civil and criminal penalties for any
violations of the NGA and any rules, regulations or orders of the FERC, up to $1.0 million per day per violation. In accordance with the EPAct, the FERC issued a final rule making it unlawful for any entity, in connection with the purchase or sale of natural gas or transportation service subject to the FERC's jurisdiction, to defraud, make an untrue statement or omit a material fact or engage in any practice, act or course of business that operates or would operate as a fraud.
In addition to the approvals and authorizations we need to obtain, Creole Trail will need to obtain the FERC's approval prior to making any modifications to the Creole Trail Pipeline as it is a regulated, interstate pipeline. An application for authorization to construct, own, operate and maintain certain new facilities in o
rder to enable bi-directional natural gas flow on the Creole Trail Pipeline system to allow for the delivery of up to 1,530,000 Dthd of feed gas to the Liquefaction Project was submitted to the FERC by Creole Trail in April 2012. The application requested the FERC's authorization for the construction and operation of the following facilities: a new compressor station, reconfiguration of three existing meter and regulation stations to accommodate bi-directional natural gas flow, measurement and increased capacity, and approximately 200 feet of new 42-inch diameter piping to connect the Creole Trial Pipeline to the liquefaction facilities. In September 2012, the FERC issued an Environmental Assessment on the potential environmental effects of the construction and operation of the proposed pipeline facilities in accordance with NEPA requirements. Final FERC approval is expected to be received during the first quarter of 2013. In addition, in April 2012, Creole Trail applied for new Title V and PSD permits for the proposed modifications to the Creole Trail Pipeline system. We anticipate, but cannot guarantee, that these permits will be issued by t
he Louisiana Department of Environmental Quality ("LDEQ")
in 2013.
DOE Export License
The DOE has issued two orders authorizing exports from the Liquefaction Project: an order authorizing the export of up to the equivalent of 16 mmtpa (approximately 803 Bcf) of domestically produced LNG by vessel from the Sabine Pass LNG terminal to countries with which the United States has a Free Trade Agreement providing for national treatment for trade in natural gas ("FTA") for a 30-year term, beginning on the earlier of the date of first export or September 7, 2020, and another order authorizing the export of up to the equivalent of 803 Bcf per year (approximately 16 mmtpa) of domestically produced LNG by vessel from the Sabine Pass LNG terminal to non-FTA countries for a 20-year term, beginning on the earlier of the date of first export or August 7, 2017.
In October 2012, the DOE granted Cheniere Marketing authority to export 15 mmtpa of domestically produced LNG to FTA countries from the proposed Corpus Liquefaction Project. In August 2012, Cheniere Marketing filed an export application at the DOE for non-FTA countries. This application is pending at the DOE.
Exports
of natural gas to countries with which the United States has an FTA are "deemed to be consistent with the public interest" and authorization to export LNG to FTA countries shall be granted by the DOE without "modification or delay". Sabine Pass Liquefaction received approval to export to FTA countries in September 2010. FTA countries which import LNG now or will do so by 2016 include: Chile, Mexico, Singapore, South Korea and the Dominican Republic.
Exports
of natural gas to countries with which the United States does not have an FTA are considered by DOE in the context of a comment period whereby interveners are provided the opportunity to assert that such authorization would not be consistent with the public interest. Sabine Pass Liquefaction received final approval to export to non-FTA countries in August 2012.
Interstate Natural Gas Pipelines
Under the NGA, the FERC is granted authority to approve, and if necessary, set "just and reasonable rates" for the transportation or sale of natural gas in interstate commerce. In addition, under the NGA, we are not permitted to unduly discriminate or grant undue preference as to our rates or the terms and conditions of service. The FERC has the authority to grant certificates allowing construction and operation of facilities used in interstate gas transportation and authorizing the provision of services. Under the NGA, the FERC’s jurisdiction generally extends to the transportation of natural gas in interstate commerce, to the sale in interstate commerce of natural gas for resale for ultimate consumption for domestic, commercial, industrial, or any other use,
8
and to natural gas companies engaged in such transportation or sale. However, the FERC’s jurisdiction does not extend to the production, gathering, or local distribution of natural gas.
In general, the FERC’s authority to regulate interstate natural gas pipelines and the services that they provide includes:
|
•
|
rates and charges for natural gas transportation and related services;
|
|
•
|
the certification and construction of new facilities;
|
|
•
|
the extension and abandonment of services and facilities;
|
|
•
|
the maintenance of accounts and records;
|
|
•
|
the acquisition and disposition of facilities;
|
|
•
|
the initiation and discontinuation of services; and
|
|
•
|
various other matters.
|
Failure to comply with the NGA can result in the imposition of administrative, civil and criminal remedies, including civil and criminal penalties of up to $1.0 million per day per violation under the EPAct.
For a number of years the FERC has implemented certain rules referred to as Standards of Conduct aimed at ensuring that an interstate natural gas pipeline not provide certain affiliated entities with preferential access to transportation service or non-public information about such service. These rules have been subject to revision by the FERC from time to time, most recently in 2008 when the FERC issued a final rule, Order No. 717, on Standards of Conduct for Transmission Providers. Order No. 717 eliminated the concept of energy affiliates and adopted a "functional approach" that applies Standards of Conduct to individual officers and employees based on their job functions, not on the company or division in which the individual works. The general principles of the Standards of Conduct are: non-discrimination, independent functioning, no conduit and transparency. These general principles govern the relationship between marketing function employees conducting transactions with affiliated pipeline companies and transportation function employees. We have established the required policies and procedures to comply with the Standards of Conduct and are subject to audit by the FERC to review compliance, policies and our training programs.
Pipelines that interconnect with our LNG terminals are interstate natural gas pipelines. We are required to obtain authorization from the FERC pursuant to Section 7 of the NGA to construct and operate these pipelines. The rates that we charge are subject to the FERC's regulation under Sections 4 and 5 of the NGA. Our interstate pipelines also are subject to the FERC's open access requirements and the FERC's Standards of Conduct. The FERC's exercise of jurisdiction over interstate natural gas pipelines is substantially broader than its exercise of jurisdiction over LNG terminals.
Pipeline Safety
Our pipelines are subject to regulation by the U. S. Department of Transportation ("DOT"), under the Pipeline and Hazardous Materials Safety Administration ("PHMSA"), pursuant to which PHMSA has established requirements relating to the design, installation, testing, construction, operation, replacement and management of pipeline facilities.
Louisiana and Texas administer federal pipeline safety standards under the Natural Gas Pipeline Safety Act of 1968, as amended ("NGPSA"), which requires certain pipelines to comply with safety standards in constructing and operating the pipelines and subjects the pipelines to regular inspections. Failure to comply with the NGPSA may result in the imposition of administrative, civil and criminal remedies.
The Pipeline Safety Improvement Act of 2002, as amended ("PSIA"), which is administered by the DOT Office of Pipeline Safety, governs the areas of testing, education, training and communication. The PSIA requires pipeline companies to perform extensive integrity tests on natural gas transportation pipelines that exist in high population density areas designated as "high consequence areas." Pipeline companies are required to perform the integrity tests on a seven-year cycle. The risk ratings are based on numerous factors, including the population density in the geographic regions served by a particular pipeline, as well as the age and condition of the pipeline and its protective coating. Testing consists of hydrostatic testing, internal electronic testing, or direct assessment of the piping. In addition to the pipeline integrity tests, pipeline companies must implement a qualification program to make certain that employees are properly trained. Pipeline operators also must develop integrity management programs for gas transportation pipelines, which requires pipeline operators to perform ongoing assessments of pipeline integrity; identify and
9
characterize applicable threats to pipeline segments that could impact a high consequence area; improve data collection, integration and analysis; repair and remediate the pipeline, as necessary; and implement preventive and mitigation actions.
In 2010, the United States Department of Transportation issued a final rule (known as "Control Room Management Rule") requiring pipeline operators to write and institute certain control room procedures that address human factors and fatigue management.
Our pipelines are also subject to the Pipeline Safety, Regulatory Certainty, and Jobs Creation Act of 2011, which regulates safety requirements in the design, construction, operation and maintenance of interstate natural gas transmission facilities. Under the Pipeline Safety, Regulatory Certainty, and Job Creation Act of 2011, PHMSA has civil penalty authority up to $200,000 per day (from the prior $100,000), with a maximum of $2 million for any related series of violations (from the prior $1 million).
Other Governmental Permits, Approvals and Authorizations
The operation of our LNG terminals and related projects, and the construction and operation of our proposed liquefaction facilities, are also subject to additional federal permits, orders, approvals and consultations required by other federal agencies, including: the DOE, Advisory Council on Historic Preservation, United States Army Corps of Engineers, United States Department of Commerce, National Marine Fisheries Services, United States Department of the Interior, United States Fish and Wildlife Service, EPA and United States Department of Homeland Security.
Three significant permits are the United States Army Corps of Engineers ("USACE") Section 404 of the Clean Water Act/Section 10 of the Rivers and Harbors Act Permit (the "Section 10/404 Permit"), the Clean Air Act Title V Operating Permit and the Prevention of Significant Deterioration (PSD) Permit, the latter two permits issued by the LDEQ.
The application for revision of the Sabine Pass LNG terminal's Section 10/404 Permit to authorize construction of Train 1 through Train 4 was submitted in January 2011. The process included a public comment period which commenced in March 2011 and closed in April 2011. The revised Section 10/404 permit was received from the USACE in March 2012. The USACE acted in the capacity as a cooperating agency in the FERC's NEPA review process. The application to amend the Sabine Pass LNG terminal's existing Title V and PSD permits to authorize construction of Train 1 through Train 4 was initially submitted in December 2010 and revised in March 2011. The process included a public comment period from June 2011 to August 2011 and a public hearing in August 2011. The final revised Title V and PSD permits were issued by the LDEQ in December 2011. Although this permit is final, a petition with the EPA has been filed pursuant to the Clean Air Act requesting that the EPA object to the Title V permit. EPA has not ruled on this petition. In June 2012, we applied to the LDEQ for a further amendment to the Title V and PSD permits to reflect the proposed modifications to the Liquefaction Project that were filed with the FERC in October 2012 as discussed above. In November 2012, the LDEQ issued proposed revised air permits for public comment, and comments regarding the proposed revised air permits have been filed. We anticipate, but cannot guarantee, that the revised Title V and PSD permits will be issued during the first quarter of 2013.
We will also need to obtain a modification to the Sabine Pass LNG terminal's existing wastewater discharge permit to authorize discharges from the liquefaction facilities prior to the commencement of operation of the Liquefaction Project.
Our LNG terminals and our proposed liquefaction facilities are subject to United States Department of Transportation safety regulations and standards for the transportation and storage of LNG and regulations of the United States Coast Guard relating to maritime safety and facility security.
Commodity
Futures Trading Commission
Congress adopted comprehensive financial reform legislation that establishes federal oversight and regulation of the over-the-counter derivatives market and entities, such as us, that participate in that market. This legislation, known as the Dodd-Frank Wall Street Reform and Consumer Protection Act (the "Dodd-Frank Act"), is designed primarily to (1) regulate certain participants in the swaps markets, including new entities defined as "Swap Dealers" and "Major Swap Participants," (2) require clearing and exchange-trading of certain swaps that the Commodities Futures Trading Commission (the "CFTC") determines must be cleared, (3) increase swap market transparency through robust reporting and recordkeeping requirements, and (4) enhance the CFTC's rulemaking and enforcement authority, including the authority to establish position limits on swaps products. This legislation requires the CFTC, the SEC and other regulators to promulgate rules and regulations implementing the Dodd-Frank
10
Act. In November 2011, the CFTC adopted rules to impose new position limits on certain core futures and equivalent swaps contracts for physical commodities, including natural gas, with exceptions for certain bona fide hedging transactions. These new position limit rules were vacated by a federal district court in September 2012, and the CFTC has appealed this ruling. Consequently, the CFTC's vacated position limits rules will not go into effect unless and until the CFTC prevails on appeal of this ruling or issues and finalizes revised rules.
In October 2012, the CFTC's and SEC's joint rules further defining the term "swap" became effective, which triggered the start of certain Dodd-Frank Act regulatory obligations. The CFTC's swaps reporting and recordkeeping rules are to be phased in over 180 days following October 12, 2012, depending on swap asse
t class and counterparty. It is expected that entities that are end users of swaps or otherwise are not swap dealers or major swap participants will be required to comply with the Dodd-Frank Act reporting and recordkeeping rules in April 2013. In December 2012, the CFTC published final rules regarding mandatory clearing of certain interest rate swaps and certain index credit default swaps and setting compliance dates for different categories of market participants, the earliest of which is March 11, 2013. The CFTC has not yet proposed any rules requiring the clearing of any other classes of swaps, including physical commodity swaps. Although we expect to qualify for the end-user exception from the clearing requirement for our swaps, mandatory clearing requirements applicable to other market participants, such as swap dealers, may change the cost and availability of the swaps that we use for hedging. For uncleared swaps, the Dodd-Frank Act may also require our counterparties to require that we enter into credit support documentation and/or initial and variation margin requirements; however, the CFTC's and other agencies' margin rules are not yet final and therefore the application of those provisions to us is uncertain at this time. The financial reform legislation may also cause our derivatives counterparties to spin off some of their derivatives activities to a separate entity, which may not be as creditworthy as the current counterparty. The new legislation, and any additional regulations, may also adversely affect our existing derivative contracts and restrict our ability to monetize such contracts, cause us to restructure certain contracts, reduce the availability of derivatives to protect against risks or to optimize assets, and impact the liquidity of certain swaps products, all of which could increase our business costs.
Environmental Regulation
Our LNG operations, including the proposed liquefaction facilities, are subject to various federal, state and local laws and regulations relating to the protection of the environment. These environmental laws and regulations may impose substantial penalties for noncompliance and substantial liabilities for pollution. Many of these laws and regulations restrict or prohibit the types, quantities and concentration of substances that can be released into the environment and can lead to substantial civil and criminal fines and penalties for non-compliance.
Clean Air Act ("CAA")
Our LNG operations, including the proposed liquefaction facilities, are subject to the federal CAA and comparable state and local laws. We may be required to incur certain capital expenditures over the next several years for air pollution control equipment in connection with maintaining or obtaining permits and approvals addressing air emission-related issues. We do not believe, however, that our operations, or the construction and operations of our proposed liquefaction facilities, will be materially and adversely affected by any such requirements.
In
2009, the EPA promulgated and finalized the Mandatory Greenhouse Gas Reporting Rule for multiple sections of the economy. This rule requires mandatory reporting of greenhouse gas ("GHG") emissions from stationary fuel combustion sources as well as all fugitive emissions throughout LNG terminals. From time to time, Congress has considered proposed legislation directed at reducing GHG emissions, and the EPA has defined GHG emissions thresholds for requiring certain permits for new and existing industrial sources. It is not possible at this time to predict how future regulations or legislation may address GHG emissions and impact our business. However, future regulations and laws could result in increased compliance costs or additional operating restrictions and could have a material adverse effect on our business, financial position, results of operations and cash flows.
Coastal Zone Management Act ("CZMA")
Our LNG terminals, including the proposed liquefaction facilities, are
subject to the review and possible requirements of the CZMA throughout the construction of facilities located within the coastal zone. The CZMA is administered by the states (in Louisiana, by the Department of Natural Resources, and in Texas, by the General Land Office). This program is implemented to ensure that impacts to coastal areas are consistent with the intent of the CZMA to manage the coastal areas.
11
Clean Water Act ("CWA")
Our LNG terminal operations and the proposed liquefaction facilities are
subject to the federal CWA and analogous state and local laws. The CWA imposes strict controls on the discharge of pollutants into the navigable waters of the United States, including discharges of wastewater and storm water runoff and fill/discharges into waters of the United States. Permits must be obtained to discharge pollutants into state and federal waters. The CWA is administered by the EPA, the USACE, and by the states (in Louisiana, by the LDEQ, and in Texas, by the Texas Commission on Environmental Quality).
Resource Conservation and Recovery Act ("RCRA")
The federal RCRA and comparable state statutes govern the disposal of solid and hazardous wastes. In the event such wastes are generated in connection with our facilities, we are subject to regulatory requirements affecting the handling, transportation, treatment, storage and disposal of such wastes
Endangered Species Act
Our LNG terminal operations and the proposed liquefaction facilities
may be restricted by requirements under the Endangered Species Act, which seeks to protect endangered or threatened animal, fish and plant species and designated habitats.
LNG and Natural Gas Marketing Business
Our wholly owned subsidiary, Cheniere Marketing, is engaged in the LNG and natural gas marketing business and is seeking to develop a portfolio of long-term, short-term and spot LNG purchase and sale agreements, assist Cheniere Investments in negotiating with potential customers to monetize 2.0 Bcf/d of regasification capacity at the Sabine Pass LNG terminal to which it has access under the TURA during construction of the Liquefaction Project, and enter into business relationships for the domestic marketing of natural gas imported by Cheniere Marketing as LNG to the Sabine Pass LNG terminal.
Cheniere Marketing has been purchasing, transporting and unloading commercial LNG cargoes into the Sabine Pass LNG terminal and has used trading strategies intended to maximize margins on these cargoes. In addition, Cheniere Marketing has continued to enter into various business relationships to facilitate purchasing and selling commercial LNG cargoes.
In an effort to monetize Cheniere Investments’ reserved capacity under its TURA during construction of the Liquefaction Project, Cheniere Marketing has entered into the VCRA pursuant to which Cheniere Marketing is obligated to pay Cheniere Investments 80% of the expected gross margin of each cargo of LNG that Cheniere Marketing arranges for delivery to the Sabine Pass LNG terminal. To the extent payments from Cheniere Marketing to Cheniere Investments under the VCRA or new Cheniere Partners' business increase Cheniere Partners' available cash in excess of the common unit and general partner distributions and certain reserves, the cash would be distributed to Cheniere in the form of distributions on Cheniere’s subordinated units and related general partner distributions. During the term of the VCRA, Cheniere Marketing is responsible for the payment of taxes and new regulatory costs under Cheniere Investments assigned TUA. Cheniere has guaranteed all of Cheniere Marketing's payment obligations under the VCRA.
Cheniere Marketing has entered into an SPA to purchase, at its option, any excess LNG produced that is not committed to non-affiliate parties, for up to a maximum of 104,000,000 MMBtu per annum produced from Train 1 through Train 4.
LNG and Natural Gas Marketing Competition
In purchasing LNG, we compete for supplies of LNG with:
|
•
|
large, multinational and national companies with longer operating histories, more development experience, greater name recognition, larger staffs and substantially greater financial, technical and marketing resources;
|
|
•
|
oil and gas producers who sell or control LNG derived from their international oil and gas properties; and
|
|
•
|
purchasers located in other countries where prevailing market prices can be substantially different from those in the United States.
|
12
In marketing LNG and natural gas, we compete for sales of LNG and natural gas with a variety of competitors, including:
|
•
|
major integrated marketers who have large amounts of capital to support their marketing operations and offer a full-range of services and market numerous products other than natural gas;
|
|
•
|
producer marketers who sell their own natural gas production or the production of their affiliated natural gas production company;
|
|
•
|
small geographically focused marketers who focus on marketing natural gas for the geographic area in which their affiliated distributor operates; and
|
|
•
|
aggregators who gather small volumes of natural gas from various sources, combine them and sell the larger volumes for more favorable prices and terms than would be possible selling the smaller volumes separately.
|
LNG and Natural Gas Marketing Governmental Regulation
In 1992 and 1993, the FERC concluded that sellers of short-term or long-term natural gas supplies would not have market power over the sale for resale of natural gas. The FERC established light-handed regulation over sales for resale of natural gas and adopted regulations granting blanket certificates to allow entities selling natural gas to make interstate sales for resale at negotiated rates. In 2003, the FERC amended the blanket marketing certificates to require that all sellers adhere to a code of conduct with respect to natural gas sales. The code of conduct addresses such matters as natural gas withholding, manipulation of market prices, communication of accurate information and record retention.
The EPAct contains provisions intended to prohibit the manipulation of the natural gas markets and is applicable to our LNG, pipeline and natural gas marketing businesses.
The prices at which we sell natural gas are not regulated, insofar as the interstate market is concerned and, for the most part, are not subject to state regulation. We are permitted to make sales of natural gas for resale in interstate commerce pursuant to a blanket marketing certificate automatically granted by the FERC. Our sales of natural gas will be affected by the availability, terms and cost of pipeline transportation. As noted above, the price and terms of access to pipeline transportation are subject to extensive federal and state regulation.
Market Factors
Our ability to sell any seasonal quantities of LNG available from Train 1 through Train 4, develop additional Trains, or develop other new projects is subject to a broader array of market factors, including: changes in worldwide supply and demand for natural gas, LNG and substitute products; the relative prices for natural gas, crude oil and substitute products in North America and international markets; economic growth in developing countries; investment in energy infrastructure; the rate of fuel switching for power generation from coal, nuclear or oil to natural gas; and access to capital markets.
We expect global demand for natural gas and LNG to grow significantly as nations seek more abundant, reliable and environmentally cleaner fuel alternatives to oil and coal. Global demand for natural gas is projected by the International Energy Agency to grow by more than 24 Tcf between 2010 and 2020, fueled by the growth of emerging economies. Global demand for LNG is forecast to increase by 49%, or 5.7 Tcf, by 2020 and reach a total of 456 mmtpa, or 22.2 Tcf, by 2025. LNG is substantially more flexible than pipeline-delivered natural gas. As a result, the share of LNG in the global natural gas market is expected to increase as markets seek to improve security of supply by accessing a wide portfolio of producers that can readjust deliveries to meet the needs of changing markets.
While global natural gas consumption has been rising internationally, natural gas production in the United States has undergone a technological transformation that has resulted in a substantial increase in annual production capacity, decrease in the cost of production, and expansion of technically recoverable reserves.
Our ability to continue to develop new facilities in the United States will be driven in part by the continued success of the North American upstream natural gas sector in developing new reservoirs, continuing to drive down costs and producing higher valued condensates and natural gas liquids in conjunction with natural gas production. Any such facilities will compete with other international LNG export projects principally on a price basis. These projects generally require capital not only to build the marine, storage and liquefaction facilities, but also to drill wells and build processing and pipeline transportation infrastructure. Because
13
we rely on the natural gas market and transportation infrastructure already existing in the United States, we generally require less capital expenditures than competing projects. Furthermore, because natural gas is purchased from the United States market at a Henry Hub related price, we can offer LNG for sale at an alternative to crude oil prices, thereby providing customers with an opportunity to diversify their supply portfolios by geography and price index.
We continue to evaluate global energy market fundamentals to identify opportunities that open growth to constrained markets by providing infrastructure, services, and energy to customers. We believe that our strong base of business of long-term, fixed-fee contracts provides the platform to grow with the needs of the global market.
Subsidiaries
Our assets are generally held by or under our operating subsidiaries. We conduct most of our operations through these subsidiaries, including our operations relating to the development and operation of our LNG terminal business and the Liquefaction Project and the development and operation of our LNG and natural gas marketing business.
Employees and Labor Relations
We had
306
full-time employees at
February 13, 2013
, including 163 employees who directly supported the Sabine Pass LNG terminal operations and Liquefaction Project. We consider our current employee relations to be favorable.
Available Information
Our principal executive offices are located at 700 Milam Street, Suite 800, Houston, Texas 77002, and our telephone number is (713) 375-5000. Our internet address is http://www.cheniere.com. We provide public access to our annual reports on Form 10-K, quarterly reports on Form 10-Q, current reports on Form 8-K, and amendments to these reports as soon as reasonably practicable after we electronically file those materials with, or furnish those materials to, the Securities and Exchange Commission ("SEC") under the Exchange Act. These reports may be accessed free of charge through our internet website. We make our website content available for informational purposes only. The website should not be relied upon for investment purposes and is not incorporated by reference into this Form 10-K.
We will also make available to any stockholder, without charge, copies of our Annual Report on Form 10-K as filed with the SEC. For copies of this, or any other filing, please contact: Cheniere Energy, Inc., Investor Relations Department, 700 Milam Street, Suite 800, Houston, Texas 77002 or call (713) 562-5000. In addition, the public may read and copy any materials we file with the SEC at the SEC’s Public Reference Room at 100 F Street, N.E., Room 1580, Washington, D.C. 20549. The public may obtain information on the operation of the Public Reference Room by calling the SEC at 1-800-SEC-0330. The SEC maintains an internet site (www.sec.gov) that contains reports, proxy and information statements and other information regarding issuers, like us, that file electronically with the SEC.
14
ITEM 1A.
RISK FACTORS
The following are some of the important factors that could affect our financial performance or could cause actual results to differ materially from estimates or expectations contained in our forward-looking statements. We may encounter risks in addition to those described below. Additional risks and uncertainties not currently known to us, or that we currently deem to be immaterial, may also impair or adversely affect our business, contracts, financial condition, operating results, cash flows, liquidity and prospects.
The risk factors in this report are grouped into the following categories:
|
•
|
Risks Relating to Our Financial Matters;
|
|
•
|
Risks Relating to Our LNG Terminal Business;
|
|
•
|
Risks Relating to Our LNG and Natural Gas Marketing Business;
|
|
•
|
Risks Relating to Our LNG Businesses in General; and
|
|
•
|
Risks Relating to Our Business in General.
|
Risks Relating to Our Financial Matters
Our existing level of cash resources, negative operating cash flow and significant debt could cause us to have inadequate liquidity and could materially and adversely affect our business, financial condition and prospects.
As of December 31, 2012, we had $201.7 million of cash and cash equivalents and $793.2 million of restricted cash and cash equivalents, and we had $2.2 billion of total debt outstanding on a consolidated basis (before debt discounts). In addition, in February 2013, we issued an additional $1.5 billion of indebtedness to finance the capital costs in connection with the construction of Train 1 and Train 2. We incur significant interest expense relating to the assets at the Sabine Pass LNG terminal and Liquefaction Project, and we anticipate needing to incur substantial additional debt and issue equity to finance the construction of all six trains of the Liquefaction Project. Our ability to fund our capital expenditures and refinance our indebtedness will depend on our ability to access capital markets. Furthermore, our costs could increase or future borrowings or equity offerings may be unavailable to us or unsuccessful, which could cause us to be unable to pay or refinance our indebtedness or to fund our other liquidity needs.
We have not been profitable historically, and we have not had positive operating cash flow. Our ability to achieve profitability and generate positive operating cash flow in the future is subject to significant uncertainty.
We had net losses of $332.8 million, $198.8 million and $76.2 million for the years ended December 31, 2012, 2011 and 2010, respectively. In addition, our net cash flow used in operating activities was $107.8 million, $42.8 million and $16.9 million for the years ended December 31, 2012, 2011 and 2010, respectively. In the future, we may incur operating losses and experience negative operating cash flow. We may not be able to reduce costs, increase revenues, or reduce our debt service obligations sufficiently to maintain our cash resources, which could cause us to have inadequate liquidity to continue our business.
In addition, we will continue to incur significant capital and operating expenditures while we develop and construct the Liquefaction Project. We currently expect that we will not begin to receive cash flows from operations under any SPA until the end of 2015, at the earliest. Any delays beyond the expected development periods for Train 1 would prolong, and could increase the level of, our operating losses and negative operating cash flows. Our future liquidity may also be affected by the timing of construction financing availability in relation to the incurrence of construction costs and other outflows and by the timing of receipt of cash flow under SPAs in relation to the incurrence of project and operating expenses. Moreover, many factors (including factors beyond our control) could result in a disparity between liquidity sources and cash needs, including factors such as construction delays and breaches of agreements. Our ability to generate positive operating cash flow and achieve profitability in the future is dependent on our ability to successfully and timely complete the applicable Train.
In order to generate needed amounts of cash, we may sell equity or equity-related securities or assets, including equity interests in Cheniere Partners. Such sales could dilute our stockholders' proportionate indirect interests in our assets, business operations and proposed liquefaction and other projects of Cheniere Partners or other subsidiaries, and could adversely affect the market price of our common stock.
15
We have pursued and are pursuing a number of alternatives in order to generate needed amounts of cash, including potential issuances and sales of additional equity or equity-related securities by us, Cheniere Partners, or both, and potential sales of assets. Such sales, in one or more transactions, could dilute our stockholders' proportionate indirect interests in our assets, business operations and proposed projects of Cheniere Partners, including the Liquefaction Project, or in other subsidiaries. In addition, such sales, or the anticipation of such sales, could adversely affect the market price of our common stock.
Our ability to generate needed amounts of cash is substantially dependent upon the performance by customers under long-term contracts that we have entered into, and we could be materially and adversely affected if any customer fails to perform its contractual obligations for any reason.
Our future results and liquidity are substantially dependent upon performance by Chevron and Total, each of which has entered into a TUA with Sabine Pass LNG and agreed to pay us approximately $125 million annually, and, upon satisfaction of the conditions precedent to payment thereunder, by BG, Gas Natural Fenosa, KOGAS, GAIL and Total, each of which has entered into an SPA with Sabine Pass Liquefaction and agreed to pay us approximately $723 million, $454 million, $548 million, $548 million and $314 million annually, respectively. We are dependent on each customer's continued willingness and ability to perform its obligations under its SPA. We are also exposed to the credit risk of any guarantor of these customers' obligations under their respective TUA or SPA in the event that we must seek recourse under a guaranty. If any customer fails to perform its obligations under its TUA or SPA, our business, contracts, financial condition, operating results, cash flow, liquidity and prospects could be materially and adversely affected, even if we were ultimately successful in seeking damages from that customer or its guarantor for a breach of the TUA or SPA.
Each of our customer contracts is subject to termination under certain circumstances.
Each of Sabine Pass LNG's long-term TUAs contains various termination rights. For example, each customer may terminate its TUA if the Sabine Pass LNG terminal experiences a force majeure delay for longer than 18 months, fails to redeliver a specified amount of natural gas in accordance with the customer's redelivery nominations or fails to accept and unload a specified number of the customer's proposed LNG cargoes. Sabine Pass LNG may not be able to replace these TUAs on desirable terms, or at all, if they are terminated.
Each of Sabine Pass Liquefaction's SPAs contain various termination rights allowing our customers to terminate their SPAs including, without limitation: (i) upon the occurrence of certain events of force majeure; (ii) if we fail to make available specified scheduled cargo quantities; (iii) delays in the commencement of commercial operations; and (iv) if the conditions precedent contained in the SPAs are not met or waived by specified dates. We may not be able to replace these SPAs on desirable terms, or at all, if they are terminated.
Our subsidiaries may be restricted under the terms of their indebtedness from making distributions under certain circumstances, which may limit Cheniere Partners' ability to pay or increase distributions to us and could materially and adversely affect us.
The agreements governing our indebtedness restricts payments that our subsidiaries can make to Cheniere Partners in certain events and limits the indebtedness that our subsidiaries can incur. For example, Sabine Pass LNG may not make distributions until, among other requirements, a deposit has been made in an interest payment account for one-sixth of the semi-annual interest payment multiplied by the number of elapsed months since the last semi-annual interest payment, a deposit has been made to a permanent debt service reserve fund for one semi-annual interest payment and a fixed charge coverage ratio test of 2:1 is satisfied. Sabine Pass Liquefaction is likewise restricted from making distributions under agreements governing its indebtedness until, among other requirements, substantial completion of Train 1 and Train 2 has occurred, deposits are made into debt service reserve accounts and a debt service coverage ratio of 1.25:1.00 is satisfied. Our subsidiaries' inability to pay distributions to Cheniere Partners or to incur additional indebtedness as a result of the foregoing restrictions in the agreements governing their indebtedness may inhibit Cheniere Partners' ability to pay or increase distributions to us and its other unitholders.
Sabine Pass LNG is not permitted to make cash distributions if its consolidated cash flow is not at least twice its fixed charges, calculated as required in the indentures governing the Sabine Pass LNG Notes (the "Sabine Pass Indentures"). In order to satisfy this fixed charge coverage ratio test, we estimate that Sabine Pass LNG's consolidated cash flow, as defined in such indentures, must be greater than approximately $340 million. Thus, TUA payments from Sabine Pass Liquefaction and either Chevron or Total are needed to satisfy the test. If the fixed charge coverage ratio test is not satisfied, Sabine Pass LNG will not be permitted by the Sabine Pass Indentures to make distributions to Cheniere Partners, which may prevent Cheniere Partners from making distributions to us and its other unitholders, which could have a material adverse effect on our business, financial condition, operating results, liquidity and prospects.
16
Restrictions in agreements governing our subsidiaries' indebtedness may prevent our subsidiaries from engaging in certain beneficial transactions.
In addition to restrictions on the ability of Sabine Pass LNG and Sabine Pass Liquefaction to make distributions or incur additional indebtedness, the agreements governing their indebtedness also contain various other covenants that may prevent them from engaging in beneficial transactions, including limitations on their ability to:
|
•
|
make certain investments;
|
|
•
|
purchase, redeem or retire equity interests;
|
|
•
|
issue preferred stock;
|
|
•
|
sell or transfer assets;
|
|
•
|
incur liens;
|
|
•
|
enter into transactions with affiliates;
|
|
•
|
consolidate, merge, sell or lease all or substantially all of its assets; and
|
|
•
|
enter into sale and leaseback transactions.
|
Our use of hedging arrangements may adversely affect our future results of operations or liquidity.
To
reduce our exposure to fluctuations in the price, volume and timing risk associated with the purchase of natural gas, we use futures, swaps and option contracts traded or cleared on the Intercontinental Exchange and NYMEX, or over-the-counter options and swaps with other natural gas merchants and financial institutions. Hedging arrangements would expose us to risk of financial loss in some circumstances, including when:
|
•
|
expected supply is less than the amount hedged;
|
|
•
|
the counterparty to the hedging contract defaults on its contractual obligations; or
|
|
•
|
there is a change in the expected differential between the underlying price in the hedging agreement and actual prices received.
|
The use of derivatives also may require the posting of cash collateral with counterparties, which can impact working capital when commodity prices change.
The enactment of the Dodd-Frank Act could have an adverse impact on our ability to hedge risks associated with our business.
Congress adopted comprehensive financial reform legislation that establishes federal oversight and regulation of the OTC derivatives market and entities, such as us, that participate in that market. This legislation, known as the Dodd-Frank Wall Street Reform and Consumer Protection Act (the "Dodd-Frank Act"), requires the Commodities Futures Trading Commission (the "CFTC") and the SEC to promulgate certain rules and regulations, including relating to the regulation of certain swaps entities, the clearing of certain swaps, and the reporting and recordkeeping of swaps, and gave the CFTC the authority to establish position limits. Although the CFTC established position limits on certain core futures and equivalent swaps contracts for physical commodities, including natural gas, with exceptions for certain bona fide hedging transactions, those limits were vacated by federal district court in September 2012 and will not go into effect unless and until the CFTC prevails on appeal of this ruling or issues and finalizes revised rules.
In December 2012, the CFTC published final rules regarding mandatory clearing of certain interest rate swaps and certain index credit default swaps and setting compliance dates for different categories of market participants, the earliest of which is March 2013. The CFTC has not yet proposed any rules requiring the clearing of any other classes of swaps, including physical commodity swaps. Although we expect to qualify for the end-user exception from the clearing requirement for our swaps, mandatory clearing requirements applicable to other market participants, such as swap dealers, may change the cost and availability of the swaps that we use for hedging. In addition, for uncleared swaps, the CFTC or other regulators may require our counterparties to require that we enter into credit support documentation and/or post initial and variation margin as collateral; however, the proposed margin rules are not yet final, and therefore the application of those provisions to us is uncertain at this time. The financial reform legislation may also cause our derivatives counterparties to spin off some of their derivatives activities to a separate entity, which may not be as creditworthy as the current counterparty. The new legislation and any new regulations could significantly increase the cost of derivative contracts (including through requirements to post collateral which could adversely affect our available liquidity), materially alter the terms of derivative contracts, reduce the availability of derivatives to protect against risks that we encounter, reduce our ability to monetize or restructure our existing derivative contracts, and increase our exposure to less creditworthy counterparties.
17
Risks Relating to Our LNG Terminal Business
Operation of the Sabine Pass LNG terminal, the Liquefaction Project and other facilities that we may construct, involves significant risks.
As
more fully discussed in these Risk Factors, the Sabine Pass LNG terminal, the Liquefaction Project and our other existing and proposed LNG facilities face operational risks, including the following:
|
•
|
the facilities' performing below expected levels of efficiency;
|
|
•
|
breakdown or failures of equipment;
|
|
•
|
operational errors by vessel or tug operators;
|
|
•
|
operational errors by us or any contracted facility operator;
|
|
•
|
labor disputes; and
|
|
•
|
weather-related interruptions of operations.
|
We may not be successful in implementing our proposed business strategy to provide liquefaction capabilities at the Sabine Pass LNG terminal adjacent to the existing regasification facilities.
The Liquefaction Project will require very significant financial resources, which may not be available on terms reasonably acceptable to us or at all. Our SPAs with KOGAS, GAIL and Total contain certain conditions precedent, including, but not limited to, receiving regulatory approvals, securing necessary financing arrangements and making a final investment decision to construct Train 3, Train 4 or Train 5, respectively. If these conditions are not met by December 31, 2013 with respect to KOGAS and GAIL and June 30, 2015 with respect to Total, the applicable party may terminate the respective SPA. In addition, if, by June 30, 2013, we have not made a positive final investment decision (i) to construct Train 3, either party may cancel BG's annual contract quantity of 34.0 million MMBtu commencing upon the date of first commercial delivery for Train 3 and the 33.5 million MMBtu commencing upon the date of first commercial delivery for Train 4 and (ii) to construct Train 4, either party may cancel BG's annual contract quantity of 33.5 million MMBtu commencing upon the date of first commercial delivery for Train 4.
It will take several years to construct our proposed liquefaction facilities, and we do not expect Train 1 to be operational until the end of 2015, at the earliest. Even if successfully constructed, our proposed liquefaction facilities would be subject to the operating risks described herein. Accordingly, there are many risks associated with the Liquefaction Project, and if we are not successful in implementing our business strategy, we may not be able to generate cash flows, which could have a material adverse impact on our business, contracts, financial condition, operating results, cash flow, liquidity and prospects.
Cost overruns and delays in the completion of one or more Trains, as well as difficulties in obtaining sufficient financing to pay for such costs and delays, could have a material adverse effect on our business, contracts, financial condition, operating results, cash flow, liquidity and prospects.
The actual construction costs of the Trains may be significantly higher than our current estimates as a result of many factors, including change orders under existing or future engineering, procurement and construction contracts. We do not have any prior experience in constructing liquefaction facilities, and no liquefaction facilities have been constructed and placed in service in the United States in over 40 years. As construction progresses, we may decide or be forced to submit change orders to our contractor that could result in longer construction periods, higher construction costs or both.
Key factors that may affect the timing of, cost of, or our ability to complete, one or more of our proposed Trains include, but are not limited to:
|
•
|
the issuance and/or continued availability of necessary permits, licenses and approvals from governmental agencies and third parties as are required to construct and operate our proposed liquefaction facilities;
|
|
•
|
the availability of sufficient financing on reasonable terms, or at all;
|
|
•
|
our ability to satisfy the conditions precedent in SPAs with customers by specified dates;
|
18
|
•
|
our ability to enter into additional satisfactory agreements with contractors and to maintain good relationships with these contractors in order to construct our proposed liquefaction facilities within the expected cost parameters, and the ability of those contractors to perform their obligations under the contracts and to maintain their creditworthiness;
|
|
•
|
shortages of materials or delays in delivery of materials;
|
|
•
|
local and general economic conditions;
|
|
•
|
catastrophes, such as explosions, fires and product spills;
|
|
•
|
resistance in the local community to the project to add liquefaction capabilities at the Sabine Pass LNG terminal adjacent to the existing regasification facilities;
|
|
•
|
the ability to attract sufficient skilled and unskilled labor, increases in the level of labor costs and the existence of any labor disputes; and
|
|
•
|
weather conditions, such as hurricanes.
|
Delays in the construction of one or more Trains beyond the estimated development periods, as well as change orders to the EPC Contracts with Bechtel or any future engineering, procurement and construction contract related to additional Trains, could increase the cost of completion beyond the amounts that we estimate, which could require us to obtain additional sources of financing to fund our operations until the Liquefaction Project is constructed (which could cause further delays). Our ability to obtain financing that may be needed to provide additional funding to cover increased costs will depend, in part, on factors beyond our control. Accordingly, we may not be able to obtain financing on terms that are acceptable to us, or at all. Even if we are able to obtain financing, we may have to accept terms that are disadvantageous to us or that may have a material adverse effect on our current or future business, contracts, financial condition, operating results, cash flow, liquidity and prospects.
Delays in the completion of one or more Trains could lead to reduced revenues or termination of one or more of the SPAs by our counterparties.
Any delay in completion of a Train may prevent us from commencing operations when anticipated, which could cause a delay in the receipt of revenues projected therefrom or cause a loss of one or more customers in the event of significant delays. As a result, any significant construction delay, whatever the cause, could have a material adverse effect on our business, contracts, financial condition, operating results, cash flow, liquidity and prospects.
Our ability to complete development of additional Trains will be contingent on our ability to obtain additional funding. If we are unable to obtain sufficient funding, we may be unable to implement or complete our business plan and our business may ultimately be unsuccessful.
We will require significant additional funding to be able to commence construction of Train 3 through Train 6, which we may not be able to obtain at a cost that results in positive economics, or at all. The inability to achieve acceptable funding may cause a delay in development of additional Trains, and we may never be able to complete the development of our business plan. Even if we are able to obtain funding, the funding may be inadequate to cover any increases in costs or delays in completion of the applicable Train, which may cause a delay in the receipt of revenues projected therefrom or cause a loss of one or more customers in the event of significant delays. As a result, any significant construction delay, whatever the cause, could have a material adverse effect on our business, contracts, financial condition, operating results, cash flow, liquidity and prospects.
To maintain the cryogenic readiness of the Sabine Pass LNG terminal, Sabine Pass LNG may need to purchase and process LNG. Sabine Pass LNG's TUA customers have the obligation to procure LNG if necessary for the Sabine Pass LNG terminal to maintain its cryogenic state. If they fail to do so, Sabine Pass LNG may need to procure such LNG.
Sabine Pass LNG needs to maintain the cryogenic readiness of the Sabine Pass LNG terminal. Together with Sabine Pass Liquefaction, the two third-party TUA customers have the obligation to maintain minimum inventory levels, and under certain circumstances, to procure LNG to maintain the cryogenic readiness of the terminal. In the event that aggregate minimum inventory levels are not maintained, Sabine Pass LNG has the right to procure a cryogenic readiness cargo, and to the extent that the TUA customers have failed to maintain their minimum inventory levels, be reimbursed by each TUA customer for their allocable share of the LNG acquisition costs. If Sabine Pass LNG is not able to obtain financing on acceptable terms, it will need to maintain
19
sufficient working capital for such a purchase until it receives reimbursement for the allocable costs of the LNG from its TUA customers or sells the regasified LNG. Sabine Pass LNG may also bear the commodity price and other risks of purchasing LNG, holding it in its inventory for a period of time and selling the regasified LNG.
Sabine Pass LNG may be required to purchase natural gas to provide fuel at the Sabine Pass LNG terminal, which would increase operating costs and could have a material adverse effect on our results of operations.
Sabine Pass LNG's TUAs provide for an in-kind deduction of 2% of the LNG delivered to the Sabine Pass LNG terminal, which it uses primarily as fuel for revaporization and self-generated power and to cover natural gas unavoidably lost at the facility. There is a risk that this 2% in-kind deduction will be insufficient for these needs and that Sabine Pass LNG will have to purchase additional natural gas from third parties. Sabine Pass LNG will bear the cost and risk of changing prices for any such fuel.
Hurricanes or other disasters could result in an interruption of our operations, a delay in the completion of the Liquefaction Project, higher construction costs, and the deferral of the dates on which payments are due to Sabine Pass Liquefaction under the SPAs, all of which could adversely affect us.
In
August and September of 2005, Hurricanes Katrina and Rita damaged coastal and inland areas located in Texas, Louisiana, Mississippi and Alabama, resulting in the temporary suspension of construction of the Sabine Pass LNG terminal. In September 2008, Hurricane Ike struck the Texas and Louisiana coast, and the Sabine Pass LNG terminal experienced minor damage.
Future storms and related storm activity and collateral effects, or other disasters such as explosions, fires, floods or accidents, could result in damage to, or interruption of operations at, the Sabine Pass LNG terminal or related infrastructure, as well as delays or cost increases in the construction of the Liquefaction Project or our other facilities. If there are changes in the global climate, storm frequency and intensity may increase; should it result in rising seas, our coastal operations may be impacted.
Failure to obtain and maintain approvals and permits from governmental and regulatory agencies with respect to the design, construction and operation of our facilities could impede operations and construction and could have a material adverse effect on us.
The design, construction and operation of LNG terminals, including the Liquefaction Project, and other facilities, and the import and export of LNG, are highly regulated activities. The FERC's approval under Section 3 of the NGA, as well as several other material governmental and regulatory approvals and permits, are required in order to construct and operate an LNG facility. Although the FERC has issued an order under the Section 3 of the NGA authorizing the siting, construction and operation of four Trains, the FERC order requires us to obtain certain additional approvals in conjunction with ongoing construction and operations of our proposed liquefaction facilities. Authorizations obtained from other federal and state regulatory agencies also contain ongoing conditions, and additional approval and permit requirements may be imposed. We
have no control over the outcome of the review and approval process. We do not know whether or when any such approvals or permits can be obtained, or whether or not any existing or potential interventions or other actions by third parties will interfere with our ability to obtain and maintain such permits or approvals. If we are unable to obtain and maintain the necessary approvals and permits, we may not be able to recover our investment in our projects.
There is no assurance that we will obtain and maintain these governmental permits, approvals and authorizations, or that we will be able to obtain them on a timely basis, and failure to obtain and maintain any of these permits, approvals or authorizations could have a material adverse effect on our business, financial condition, operating results, liquidity and prospects.
We are dependent on Bechtel and other contractors for the successful completion of the Liquefaction Project.
Timely and cost-effective completion of the Liquefaction Project in compliance with agreed specifications is central to our business strategy and is highly dependent on Bechtel's and our other contractors' performance under their agreements. Bechtel's and our other contractors' ability to perform successfully under their agreements is dependent on a number of factors, including their ability to:
|
•
|
design and engineer each Train to operate in accordance with specifications;
|
|
•
|
engage and retain third-party subcontractors and procure equipment and supplies;
|
20
|
•
|
respond to difficulties such as equipment failure, delivery delays, schedule changes and failure to perform by subcontractors, some of which are beyond their control;
|
|
•
|
attract, develop and retain skilled personnel, including engineers;
|
|
•
|
post required construction bonds and comply with the terms thereof;
|
|
•
|
manage the construction process generally, including coordinating with other contractors and regulatory agencies; and
|
|
•
|
maintain their own financial condition, including adequate working capital.
|
Although some agreements may provide for liquidated damages, if the contractor fails to perform in the manner required with respect to certain of its obligations, the events that trigger a requirement to pay liquidated damages may delay or impair the operation of the applicable liquefaction facility, and any liquidated damages that we receive may not be sufficient to cover the damages that we suffer as a result of any such delay or impairment. The obligations of Bechtel and our other contractors to pay liquidated damages under their agreements are subject to caps on liability, as set forth therein. Furthermore, we may have disagreements with our contractors about different elements of the construction process, which could lead to the assertion of rights and remedies under their contracts and increase the cost of the applicable liquefaction facility or result in a contractor's unwillingness to perform further work on the Liquefaction Project. If any contractor is unable or unwilling to perform according to the negotiated terms and timetable of its respective agreement for any reason or terminates its agreement, we would be required to engage a substitute contractor. This would likely result in significant project delays and increased costs, which could have a material adverse effect on our business, contracts, financial condition, operating results, cash flow, liquidity and prospects.
We are relying on third-party engineers to estimate the future capacity ratings and performance capabilities of our proposed liquefaction facilities, and these estimates may prove to be inaccurate.
We
are relying on third parties, principally Bechtel, for the design and engineering services underlying our estimates of the future capacity ratings and performance capabilities of our proposed liquefaction facilities. If any Train, when actually constructed, fails to have the capacity ratings and performance capabilities that we intend, our estimates may not be accurate. Failure of any of our Trains to achieve our intended capacity ratings and performance capabilities could prevent us from achieving the commercial start dates under our SPAs and could have a material adverse effect on our business, contracts, financial condition, operating results, cash flow, liquidity and prospects.
If third-party pipelines and other facilities interconnected to our pipelines and facilities are or become unavailable to transport natural gas, this could have a material adverse effect on our business, financial condition, operating results, liquidity and prospects.
We will depend upon third-party pipelines and other facilities that will provide gas delivery options to our proposed liquefaction facilities and pipelines. If the construction of new or modified pipeline connections is not completed on schedule or any pipeline connection were to become unavailable for current or future volumes of natural gas due to repairs, damage to the facility, lack of capacity or any other reason, our ability to meet our SPA obligations could be restricted, thereby reducing our revenues and this could have a material adverse effect on our business, financial condition, operating results, liquidity and prospects.
We may not be able to purchase or receive physical delivery of sufficient natural gas to satisfy our delivery obligations under the SPAs, which could have a material adverse effect on us.
Under the SPAs with our liquefaction customers, we are required to deliver to them a specified amount of LNG at specified times. However, we may not be able to purchase or receive physical delivery of sufficient quantities of natural gas to satisfy those delivery obligations, which may provide affected SPA customers with the right to terminate their SPAs. Our failure to purchase or receive physical delivery of sufficient quantities of natural gas could have a material adverse effect on our business, contracts, financial condition, operating results, cash flow, liquidity and prospects.
Our interstate natural gas pipelines and their FERC gas tariffs, are subject to FERC regulation.
Our interstate natural gas pipelines are subject to regulation by the FERC under the NGA and under the Natural Gas Policy Act of 1978. The FERC regulates the transportation of natural gas in interstate commerce, including the construction and operation of our pipelines, the rates and terms of conditions of service and abandonment of facilities. Under the NGA, the rates charged by our interstate natural gas pipelines must be just and reasonable and we are prohibited from unduly preferring or unreasonably
21
discriminating against any person with respect to pipeline rates or terms and conditions of service. If we fail to comply with all applicable statutes, rules, regulations and orders, our interstate pipelines could be subject to substantial penalties and fines.
Our FERC gas tariffs, including our pro forma transportation agreements, must be filed and approved by the FERC. Before we enter into a transportation agreement with a shipper that contains a term that materially deviates from our tariff, we must seek FERC approval. The FERC may approve the material deviation in the transportation agreement; however, in that case, the materially deviating terms must be made available to our other similarly-situated customers. If we fail to seek FERC approval of a transportation agreement that materially deviates from our tariff, or if the FERC audits our contracts and finds deviations that appear to be unduly discriminatory, the FERC could conduct a formal enforcement investigation, resulting in serious penalties and/or onerous ongoing compliance obligations.
Should we fail to comply with all applicable FERC-administered statutes, rules, regulations and orders, we could be subject to substantial penalties and fines. Under the EPAct, the FERC has civil penalty authority under the NGA to impose penalties for current violations of up to $1.0 million per day for each violation.
Pipeline safety integrity programs and repairs may impose significant costs and liabilities on us.
The Federal Office of Pipeline Safety requires pipeline operators to develop integrity management programs to comprehensively evaluate certain areas along their pipelines and to take additional measures to protect pipeline segments located in "high consequence areas" where a leak or rupture could potentially do the most harm. As an operator, we are required to:
|
•
|
perform ongoing assessments of pipeline integrity;
|
|
•
|
identify and characterize applicable threats to pipeline segments that could impact a high consequence area;
|
|
•
|
improve data collection, integration and analysis;
|
|
•
|
repair and remediate the pipeline as necessary; and
|
|
•
|
implement preventative and mitigating actions.
|
We are required to maintain pipeline integrity testing programs that are intended to assess pipeline integrity. Any repair, remediation, preventative or mitigating actions may require significant capital and operating expenditures. Should we fail to comply with the Office of Pipeline Safety's rules and related regulations and orders, we could be subject to significant penalties and fines.
Any reduction in the capacity of, or the allocations to, interconnecting, third-party pipelines could cause a reduction of volumes transported in our pipelines, which would adversely affect our revenues and cash flow.
We will be dependent upon third-party pipelines and other facilities to provide delivery options to and from our pipelines. If any pipeline connection were to become unavailable for volumes of natural gas due to repairs, damage to the facility, lack of capacity or any other reason, our ability to continue shipping natural gas to end markets could be restricted, thereby reducing our revenues. Any permanent interruption at any key pipeline interconnect which caused a material reduction in volumes transported on our pipelines could have a material adverse effect on our business, financial condition, operating results, cash flow, liquidity and prospects.
Failure to obtain and maintain approvals and permits from governmental and regulatory agencies with respect to the development and operation of our interstate natural gas pipelines would have a detrimental effect on us and our pipeline projects.
The design, construction and operation of interstate natural gas pipelines and the transportation of natural gas are all highly regulated activities. The FERC's approval under Section 7 of the NGA, as well as several other material governmental and regulatory approvals and permits, including several under the CAA and the CWA from the United States Army Corps of Engineers and state environmental agencies, are required in order to construct and operate an interstate natural gas pipeline. We
have no control over the outcome of the review and approval process. We do not know whether or when any such approvals or permits can be obtained, or whether or not any existing or potential interventions or other actions by third parties will interfere with our ability to obtain and maintain such permits or approvals. If we are unable to obtain and maintain the necessary approvals and permits, we may not be able to recover our investment in our pipeline projects.
There is no assurance that we will obtain and
22
maintain these governmental permits, approvals and authorizations, or that we will be able to obtain them on a timely basis, and failure to obtain and maintain any of these permits, approvals or authorizations could have a material adverse effect on our business, financial condition, operating results, liquidity and prospects.
Our business could be materially and adversely affected if we lose the right to situate our pipelines on property owned by third parties.
We do not own the land on which our pipelines are situated, and we are subject to the possibility of increased costs to retain necessary land use rights. If we were to lose these rights or be required to relocate our pipelines, our business could be materially and adversely affected.
Risks Relating to Our LNG and Natural Gas Marketing Business
The limited capital resources and credit available to our LNG and natural gas marketing business may limit our ability to develop that business.
We have limited capital available to our LNG and natural gas marketing business. The business also currently has limited access to third-party sources of financing. Other investment-grade marketing companies have greater financial resources than we do. Our LNG and natural gas marketing business continues to develop and implement its business strategy and may not generate sufficient revenues and cash flows to cover the significant fixed costs of the business.
Our exposure to the performance and credit risks of counterparties under agreements may adversely affect our results of operations, liquidity and access to financing.
Our LNG and natural gas marketing business involves our entering into various purchase and sale, hedging and other transactions with numerous third parties (commonly referred to as "counterparties"). In such arrangements, we are exposed to the performance and credit risks of our counterparties, including the risk that one or more counterparties fails to perform its obligation to make deliveries of commodities and/or to make payments. These risks may increase during periods of commodity price volatility. Defaults by suppliers and other counterparties may adversely affect our results of operations, liquidity and access to financing.
Risks Relating to Our LNG Businesses in General
We may not construct or operate any additional LNG facilities or Trains beyond those currently planned, which could limit our growth prospects.
We may not construct some of our proposed LNG facilities, including the proposed Corpus Christi Project or natural gas pipelines, whether due to lack of commercial interest or inability to obtain financing or otherwise. Our ability to develop additional regasification or liquefaction facilities will also depend on the availability and pricing of LNG and natural gas in North America and other places around the world. Competitors may have longer operating histories, more development experience, greater name recognition, larger staffs and substantially greater financial, technical and marketing resources and access to sources of natural gas and LNG than we do. If we are unable or unwilling to construct and operate additional LNG facilities, our prospects for growth will be limited.
Our cost estimates for Trains are subject to change as a result of cost overruns, change orders under existing or future construction contracts, changes in commodity prices (particularly nickel and steel), escalating labor costs and the potential need for additional funds to be expended to maintain construction schedules. In the event we experience cost overruns, delays or both, the amount of funding needed to complete a Train could exceed our available funds and result in our failure to complete such Train and thereby negatively impact our business and limit our growth prospects.
23
Decreases in the demand for and price of LNG and natural gas could affect the performance of our customers and could have a material adverse effect on our business, contracts, financial condition, operating results, cash flows, liquidity and prospects.
The development of domestic LNG facilities and projects generally is based on assumptions about the future availability of natural gas, price of natural gas and LNG, and the prospects for international natural gas and LNG markets. Natural gas prices have been, and are likely to continue to be, volatile and subject to wide fluctuations in response to one or more of the following factors:
|
•
|
relatively minor changes in the supply of, and demand for, natural gas in relevant markets;
|
|
•
|
political conditions in natural gas producing regions;
|
|
•
|
the extent of domestic production and importation of natural gas in relevant markets;
|
|
•
|
the level of demand for LNG and natural gas in relevant markets, including the effects of economic downturns or upturns;
|
|
•
|
weather conditions;
|
|
•
|
the competitive position of natural gas as a source of energy compared with other energy sources; and
|
|
•
|
the effect of government regulation on the production, transportation and sale of natural gas.
|
Adverse trends or developments affecting any of these factors could result in decreases in the price of LNG and natural gas, which could adversely affect the performance of our customers, and could have a material adverse effect on our business, contracts, financial condition, operating results, cash flows, liquidity and prospects.
Cyclical or other changes in the demand for LNG and natural gas may adversely affect our LNG businesses and the performance of our customers and could reduce our operating revenues and may cause us operating losses.
The economics of our LNG businesses could be subject to cyclical swings, reflecting alternating periods of under-supply and over-supply of LNG import or export capacity and available natural gas, principally due to the combined impact of several factors, including:
|
•
|
additions to competitive regasification capacity in North America, Europe, Asia and other markets, which could divert LNG from the Sabine Pass LNG terminal;
|
|
•
|
competitive liquefaction capacity in North America, which could divert natural gas from our proposed liquefaction facilities;
|
|
•
|
insufficient or oversupply of LNG liquefaction or receiving capacity worldwide;
|
|
•
|
insufficient LNG tanker capacity;
|
|
•
|
reduced demand and lower prices for natural gas;
|
|
•
|
increased natural gas production deliverable by pipelines, which could suppress demand for LNG;
|
|
•
|
cost improvements that allow competitors to offer LNG regasification services or provide liquefaction capabilities at reduced prices;
|
|
•
|
changes in supplies of, and prices for, alternative energy sources such as coal, oil, nuclear, hydroelectric, wind and solar energy, which may reduce the demand for natural gas;
|
|
•
|
changes in regulatory, tax or other governmental policies regarding imported or exported LNG, natural gas or alternative energy sources, which may reduce the demand for imported or exported LNG and/or natural gas;
|
|
•
|
adverse relative demand for LNG compared to other markets, which may decrease LNG imports into or exports from North America; and
|
|
•
|
cyclical trends in general business and economic conditions that cause changes in the demand for natural gas.
|
These factors could materially and adversely affect our ability, and the ability of our current and prospective customers, to procure supplies of LNG to be imported into North America, to procure customers for LNG or regasified LNG, or to procure natural gas to be liquefied and exported to international markets, at economical prices, or at all.
24
Failure of imported or exported LNG to be a competitive source of energy could adversely affect our customers and could materially and adversely affect our business, contracts, financial condition, operating results, cash flow, liquidity and prospects.
Current operations at the Sabine Pass LNG terminal are dependent upon the ability of our TUA customers to import LNG supplies into the United States, which is primarily dependent upon LNG being a competitive source of energy in North America. In North America, due mainly to a historically abundant supply of natural gas and recent discoveries of substantial quantities of unconventional, or shale, natural gas, imported LNG has not developed into a significant energy source. The success of the regasification services component of our business plan is dependent, in part, on the extent to which LNG can, for significant periods and in significant volumes, be produced internationally and delivered to North America at a lower cost than the cost to produce some domestic supplies of natural gas, or other alternative energy sources. Through the use of improved exploration technologies, additional sources of natural gas have recently been and may continue to be discovered in North America, which could further increase the available supply of natural gas and could result in natural gas being available at a lower cost than imported LNG.
Operations
at our proposed liquefaction facilities will be dependent upon the ability of our SPA customers to deliver LNG supplies from the United States, which is primarily dependent upon LNG being a competitive source of energy internationally. The success of our business plan is dependent, in part, on the extent to which LNG can, for significant periods and in significant volumes, be supplied from North America and delivered to international markets at a lower cost than the cost of other alternative energy sources. Through the use of improved exploration technologies, additional sources of natural gas have recently been and may continue to be discovered outside North America, which could further increase the available supply of natural gas and could result in natural gas being available at a lower cost than LNG exported to these markets.
Political
instability in foreign countries that import or export natural gas, or strained relations between such countries and the United States, may also impede the willingness or ability of LNG suppliers and merchants in such countries to import or export LNG from or to the United States. Furthermore, some foreign suppliers of LNG may have economic or other reasons to obtain their LNG from, or direct their LNG to, non-United States markets or from or to competitors' LNG facilities in the United States. In addition to natural gas, LNG also competes with other sources of energy, including coal, oil, nuclear, hydroelectric, wind and solar energy, which can be or become available at a lower cost in certain markets.
As
a result of these and other factors, LNG may not be a competitive source of energy in the United States or internationally. The failure of LNG to be a competitive supply alternative to local natural gas, oil and other alternative energy sources could adversely affect the ability of our customers to deliver LNG from the United States or to the United States on a commercial basis. Any significant impediment to the ability to deliver LNG to or from the United States generally, or to the Sabine Pass LNG terminal or from our proposed liquefaction facilities specifically, could have a material adverse effect on our customers and on our business, contracts, financial condition, operating results, cash flow, liquidity and prospects.
Various economic and political factors could negatively affect the development of LNG facilities, including the Liquefaction Project, which could have a material adverse effect on our business, contracts, financial condition, operating results, cash flow, liquidity and prospects.
Commercial
development of an LNG facility takes a number of years, requires a substantial capital investment and may be delayed by factors such as:
|
•
|
increased construction costs;
|
|
•
|
economic downturns, increases in interest rates or other events that may affect the availability of sufficient financing for LNG projects on commercially reasonable terms;
|
|
•
|
decreases in the price of LNG, which might decrease the expected returns relating to investments in LNG projects;
|
|
•
|
the inability of project owners or operators to obtain governmental approvals to construct or operate LNG facilities;
|
|
•
|
political unrest or local community resistance to the siting of LNG facilities due to safety, environmental or security concerns; and
|
|
•
|
any significant explosion, spill or similar incident involving an LNG facility or LNG vessel.
|
25
There may be shortages of LNG vessels worldwide, which could have a material adverse effect on our business, contracts, financial condition, operating results, cash flow, liquidity and prospects.
The construction and delivery of LNG vessels require significant capital and long construction lead times, and the availability of the vessels could be delayed to the detriment of our LNG business and our customers because of:
|
•
|
an inadequate number of shipyards constructing LNG vessels and a backlog of orders at these shipyards;
|
|
•
|
political or economic disturbances in the countries where the vessels are being constructed;
|
|
•
|
changes in governmental regulations or maritime self-regulatory organizations;
|
|
•
|
work stoppages or other labor disturbances at the shipyards;
|
|
•
|
bankruptcy or other financial crisis of shipbuilders;
|
|
•
|
quality or engineering problems;
|
|
•
|
weather interference or a catastrophic event, such as a major earthquake, tsunami or fire; and
|
|
•
|
shortages of or delays in the receipt of necessary construction materials.
|
We may not be able to secure firm pipeline transportation capacity on economic terms that is sufficient to meet our feed gas transportation requirements which could have a material adverse effect on us.
We
believe that there is sufficient capacity on the Creole Trail Pipeline to accommodate all of our natural gas supply requirements for Train 1 and Train 2 but not for additional Trains. We plan to secure additional pipeline transportation capacity but we may not be able to do so on commercially reasonable terms or at all, which would impair our ability to fulfill our obligations under certain of our SPAs and could have a material adverse effect on our business, contracts, financial condition, operating results, cash flow, liquidity and prospects.
We face competition based upon the international market price for LNG.
The
Liquefaction Project is subject to the risk of LNG price competition at times when we need to replace any existing SPA, whether due to natural expiration, default or otherwise, or enter into new SPAs with respect to Train 5 and Train 6. Should we find it necessary to replace an existing SPA, factors relating to competition may prevent us from entering into a replacement SPA on economically comparable terms, or at all. Such an event could have a material adverse effect on our business, contracts, financial condition, operating results, cash flow, liquidity and prospects. Factors which may negatively affect potential demand for LNG from the Liquefaction Project are diverse and include, among others:
|
•
|
increases in worldwide LNG production capacity and availability of LNG for market supply;
|
|
•
|
increases in demand for LNG but at levels below those required to maintain current price equilibrium with respect to supply;
|
|
•
|
increases in the cost to supply natural gas feedstock to the Liquefaction Project;
|
|
•
|
decreases in the cost of competing sources of natural gas or alternate fuels such as coal, heavy fuel oil and diesel;
|
|
•
|
increases in capacity and utilization of nuclear power and related facilities; and
|
|
•
|
displacement of LNG by pipeline natural gas or alternate fuels in locations where access to these energy sources is not currently available.
|
Terrorist attacks or military campaigns may adversely impact our business.
A terrorist or military incident involving an LNG facility or LNG vessel may result in delays in, or cancellation of, construction of new LNG facilities, including one or more of the Trains, which would increase our costs and decrease our cash flows. A terrorist incident may also result in temporary or permanent closure of existing LNG facilities, including the Sabine Pass LNG terminal, which could increase our costs and decrease our cash flows, depending on the duration of the closure. Our operations could also become subject to increased governmental scrutiny that may result in additional security measures at a significant incremental cost to us. In addition, the threat of terrorism and the impact of military campaigns may lead to continued volatility
26
in prices for natural gas that could adversely affect our business and our customers, including their ability to satisfy their obligations to us under our commercial agreements. Instability in the financial markets as a result of terrorism or war could also materially adversely affect our ability to raise capital. The continuation of these developments may subject our construction and our operations to increased risks, as well as increased costs, and, depending on their ultimate magnitude, could have a material adverse effect on our business, contracts, financial condition, operating results, cash flow, liquidity and prospects.
Risks Relating to Our Business in General
We are subject to significant operating hazards and uninsured risks, one or more of which may create significant liabilities and losses for us.
The construction and operation of our LNG facilities, including the Liquefaction Project, and pipelines are and will be subject to the inherent risks associated with these types of operations, including explosions, pollution, release of toxic substances, fires, hurricanes and adverse weather conditions, and other hazards, each of which could result in significant delays in commencement or interruptions of operations and/or in damage to or destruction of our facilities or damage to persons and property. In addition, our operations and the facilities and vessels of third parties on which our operations are dependent face possible risks associated with acts of aggression or terrorism.
We do not, nor do we intend to, maintain insurance against all of these risks and losses. We may not be able to maintain desired or required insurance in the future at rates that we consider reasonable. The occurrence of a significant event not fully insured or indemnified against could have a material adverse effect on our business, contracts, financial condition, operating results, cash flow, liquidity and prospects.
Existing and future environmental and similar laws and governmental regulations could result in increased compliance costs or additional operating costs or construction costs and restrictions.
Our business is and will be subject to extensive federal, state and local laws and regulations that regulate and restrict, among other things, discharges to air, land and water, with particular respect to the protection of the environment; the handling, storage and disposal of hazardous materials, hazardous waste, and petroleum products; and remediation associated with the release of hazardous substances. Many of these laws and regulations, such as the CAA, the Oil Pollution Act, the Clean Water Act (the "CWA") and the Resource Conservation and Recovery Act (the "RCRA"), and analogous state laws and regulations, restrict or prohibit the types, quantities and concentration of substances that can be released into the environment in connection with the construction and operation of our facilities, and require us to maintain permits and provide governmental authorities with access to our facilities for inspection and reports related to our compliance. Violation of these laws and regulations could lead to substantial liabilities, fines and penalties or to capital expenditures related to pollution control equipment that could have a material adverse effect on our business, contracts, financial condition, operating results, cash flow, liquidity and prospects. Federal and state laws impose liability, without regard to fault or the lawfulness of the original conduct, for the release of certain types or quantities of hazardous substances into the environment. As the owner and operator of our facilities, we could be liable for the costs of cleaning up hazardous substances released into the environment and for damage to natural resources.
There are numerous regulatory approaches currently in effect or being considered to address greenhouse gases, including possible future United States treaty commitments, new federal or state legislation that may impose a carbon emissions tax or establish a cap-and-trade program, and regulation by the Environmental Protection Agency (the "EPA"). In addition, as we consume natural gas at the Sabine Pass LNG terminal, this carbon tax may also be imposed on us directly.
Other future legislation and regulations, such as those relating to the transportation and security of LNG imported to or exported from the Sabine Pass LNG terminal through the Sabine Pass Channel, could cause additional expenditures, restrictions and delays in our business and to our proposed construction, the extent of which cannot be predicted and which may require us to limit substantially, delay or cease operations in some circumstances. Revised, reinterpreted or additional laws and regulations that result in increased compliance costs or additional operating or construction costs and restrictions could have a material adverse effect on our business, contracts, financial condition, operating results, cash flow, liquidity and prospects.
27
We may experience increased labor costs, and the unavailability of skilled workers or our failure to attract and retain key personnel could adversely affect us.
We
are dependent upon the available labor pool of skilled employees. We compete with other energy companies and other employers to attract and retain qualified personnel with the technical skills and experience required to construct and operate our facilities and pipelines and to provide our customers with the highest quality service. Our affiliates who hire personnel on our behalf are also subject to the Fair Labor Standards Act, which governs such matters as minimum wage, overtime and other working conditions. A shortage in the labor pool of skilled workers or other general inflationary pressures or changes in applicable laws and regulations could make it more difficult for us to attract and retain personnel and could require an increase in the wage and benefits packages that we offer, thereby increasing our operating costs. Any increase in our operating costs could materially and adversely affect our business, financial condition, operating results, liquidity and prospects.
We depend on our executive officers for various activities. We do not maintain key person life insurance policies on any of our personnel. Although we have arrangements relating to compensation and benefits with certain of our executive officers, we do not have any employment contracts or other agreements with key personnel binding them to provide services for any particular term. The loss of the services of any of these individuals could seriously harm us.
Our lack of diversification could have an adverse effect on our financial condition and results of operations.
Substantially all of our anticipated revenue in 2013 will be dependent upon one facility, the Sabine Pass LNG receiving terminal and related pipeline located in southern Louisiana. Due to our lack of asset and geographic diversification, an adverse development at the Sabine Pass LNG terminal or pipeline, or in the LNG industry, would have a significantly greater impact on our financial condition and results of operations than if we maintained more diverse assets and operating areas.
We may engage in operations or make substantial commitments and investments located, or enter into agreements with counterparties located, outside the United States, which would expose us to political, governmental and economic instability and foreign currency exchange rate fluctuations.
Conducting operations or making commitments and investments located, or entering into agreements with counterparties located, outside of the United States will cause us to be affected by economic, political and governmental conditions in the countries where we engage in business. Any disruption caused by these factors could harm our business. Risks associated with operations, commitments and investments outside of the United States include the risks of:
|
•
|
currency fluctuations;
|
|
•
|
war;
|
|
•
|
expropriation or nationalization of assets;
|
|
•
|
renegotiation or nullification of existing contracts;
|
|
•
|
changing political conditions;
|
|
•
|
changing laws and policies affecting trade, taxation and investment;
|
|
•
|
multiple taxation due to different tax structures; and
|
|
•
|
the general hazards associated with the assertion of sovereignty over certain areas in which operations are conducted.
|
Because our reporting currency is the United States dollar, any of our operations conducted outside the United States or denominated in foreign currencies would face additional risks of fluctuating currency values and exchange rates, hard currency shortages and controls on currency exchange. We would be subject to the impact of foreign currency fluctuations and exchange rate changes on our reporting for results from those operations in our consolidated financial statements.
28
We may incur impairments to goodwill or long-lived assets.
We review our long-lived assets, including goodwill and other intangible assets, for impairment annually in the fourth quarter or whenever events or changes in circumstances indicate that the carrying amount of these assets may not be recoverable. Significant negative industry or economic trends, including a significant decline in the market price of our common stock, reduced estimates of future cash flows for our business segments or disruptions to our business could lead to an impairment charge of our long-lived assets, including goodwill and other intangible assets. Our valuation methodology for assessing impairment requires management to make judgments and assumptions based on historical experience and to rely heavily on projections of future operating performance. Projections of future operating results and cash flows may vary significantly from results. In addition, if our analysis results in an impairment to our goodwill, we may be required to record a charge to earnings in our consolidated financial statements during a period in which such impairment is determined to exist, which may negatively impact our results of operations.
The price of our common stock may fluctuate significantly, and our stockholders could lose all or part of their investment.
The market price of our common stock may fluctuate significantly as a result of a variety factors, some of which are beyond our control, including:
|
•
|
announcements relating to significant business transactions, including those concerning financings, customers and construction of our LNG facilities;
|
|
•
|
fluctuations in our quarterly and annual financial results;
|
|
•
|
issuance of additional equity securities which causes further dilution to stockholders;
|
|
•
|
operating and stock price performance of companies that investors deem comparable to us;
|
|
•
|
changes in government regulation or proposals applicable to us;
|
|
•
|
actual or potential non-performance by any customer or a counterparty under any agreement;
|
|
•
|
changes in accounting standards, policies, guidance, interpretations or principles; and
|
|
•
|
the failure of securities analysts to cover our common stock or changes in financial or other estimates by analysts.
|
In addition, the United States securities markets have experienced significant price and volume fluctuations. These fluctuations have often been unrelated to the operating performance of companies in these markets. Market fluctuations and broad market, economic and industry factors may negatively affect the price of our common stock, regardless of our operating performance. If we were to be the object of securities class litigation as a result of volatility in our common stock price or for other reasons, it could result in substantial diversion of our management's attention and resources, which could negatively affect our financial results.
ITEM 1B.
UNRESOLVED STAFF COMMENTS
None.
ITEM 3.
LEGAL PROCEEDINGS
We
may in the future be involved as a party to various legal proceedings, which are incidental to the ordinary course of business. We regularly analyze current information and, as necessary, provide accruals for probable liabilities on the eventual disposition of these matters. In the opinion of management, as of December 31,
2012
, there were no threatened or pending legal matters that would have a material impact on our consolidated results of operations, financial position or cash flows.
ITEM 4.
MINE SAFETY DISCLOSURE
None.
29
ITEM 5.
MARKET FOR REGISTRANT’S COMMON EQUITY, RELATED STOCKHOLDER MATTERS AND ISSUER
PURCHASES OF EQUITY SECURITIES
Our common stock has traded on the NYSE MKT under the symbol "LNG" since March 24, 2003. The table below presents the high and low daily closing sales prices of our common stock, as reported by the NYSE MKT, for each quarter during
2011
and
2012
.
|
|
High
|
Low
|
||||||
|
Three Months Ended
|
|
|
||||||
|
March 31, 2011
|
$
|
10.38
|
|
$
|
6.25
|
|
||
|
June 30, 2011
|
11.76
|
|
7.49
|
|
||||
|
September 30, 2011
|
10.64
|
|
5.07
|
|
||||
|
December 31, 2011
|
11.93
|
|
4.00
|
|
||||
|
Three Months Ended
|
|
|
|
|
||||
|
March 31, 2012
|
$
|
16.67
|
|
$
|
8.70
|
|
||
|
June 30, 2012
|
18.74
|
|
11.75
|
|
||||
|
September 30, 2012
|
16.80
|
|
12.81
|
|
||||
|
December 31, 2012
|
18.78
|
|
14.11
|
|
||||
As of February 20, 2013, we had
241.5 million
shares of common stock outstanding held by approximately 413 record owners.
We have never paid a cash dividend on our common stock. We currently intend to retain earnings to finance the growth and development of our business and do not anticipate paying any cash dividends on the common stock in the foreseeable future. Any future change in our dividend policy will be made at the discretion of our board of directors in light of our financial condition, capital requirements, earnings, prospects and any restrictions under any financing agreements, as well as other factors the board of directors deems relevant.
Issuer Purchases of Equity Securities
During the twelve months ended December 31,
2012
, we purchased 1.3 million shares of restricted stock at a weighted average cash price of $14.23 per share related to restricted stock that vested during
2012
and that was returned to the Company by employees to cover taxes.
Total Stockholder Return
The following graph compares the cumulative total stockholder return on our common stock against the S&P Oil and Gas Exploration and Production Index, and the Russell 2000 Index for the five years ended December 31,
2012
. The graph was constructed on the assumption that $100 was invested in our common stock, the S&P Oil & Gas Exploration & Production Index and the Russell 2000 Index on December 31, 2007 and that any dividends were fully reinvested.
|
Company / Index
|
2008
|
2009
|
2010
|
2011
|
2012
|
||||||||||
|
Cheniere Energy, Inc.
|
9
|
|
7
|
|
17
|
|
27
|
|
58
|
|
|||||
|
Russell 2000 Index
|
66
|
|
84
|
|
107
|
|
102
|
|
119
|
|
|||||
|
S&P Oil & Gas Exploration & Production
|
65
|
|
93
|
|
102
|
|
95
|
|
99
|
|
|||||
30
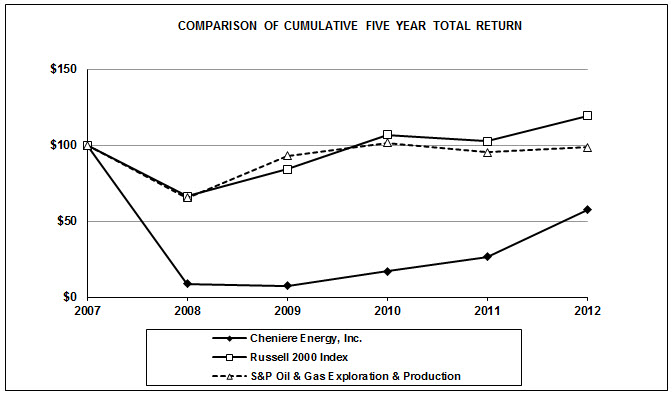
ITEM 6.
SELECTED FINANCIAL DATA
Selected financial data set forth below are derived from our audited consolidated financial statements for the periods indicated. The financial data should be read in conjunction with Management’s Discussion and Analysis of Financial Condition and Results of Operations and our Consolidated Financial Statements and the accompanying notes thereto included elsewhere in this report.
|
|
Year Ended December 31,
|
|||||||||||||||||||
|
|
(in thousands, except per share data)
|
|||||||||||||||||||
|
|
2012
|
2011
|
2010
|
2009
|
2008
|
|||||||||||||||
|
Revenues
|
$
|
266,220
|
|
$
|
290,444
|
|
$
|
291,513
|
|
$
|
181,126
|
|
$
|
7,144
|
|
|||||
|
LNG terminal and pipeline development expense
|
66,112
|
|
40,803
|
|
11,971
|
|
223
|
|
10,556
|
|
||||||||||
|
LNG terminal and pipeline operating expense
|
57,076
|
|
39,101
|
|
42,415
|
|
36,857
|
|
14,522
|
|
||||||||||
|
Depreciation, depletion and amortization
|
66,407
|
|
63,405
|
|
63,251
|
|
54,229
|
|
24,346
|
|
||||||||||
|
General and administrative expense (1)
|
152,081
|
|
88,427
|
|
68,626
|
|
65,830
|
|
122,678
|
|
||||||||||
|
Restructuring charges (2)
|
—
|
|
—
|
|
—
|
|
20
|
|
78,704
|
|
||||||||||
|
Income (loss) from operations
|
(75,832
|
)
|
58,146
|
|
104,623
|
|
23,496
|
|
(244,188
|
)
|
||||||||||
|
Gain (loss) from equity method investment (3)
|
—
|
|
—
|
|
128,330
|
|
—
|
|
(4,800
|
)
|
||||||||||
|
Gain (loss) on early extinguishment of debt (4)
|
(57,685
|
)
|
—
|
|
(50,320
|
)
|
45,363
|
|
(10,691
|
)
|
||||||||||
|
Derivative gain (loss)
|
58
|
|
(2,251
|
)
|
461
|
|
5,277
|
|
4,652
|
|
||||||||||
|
Interest expense, net
|
(200,811
|
)
|
(259,393
|
)
|
(262,046
|
)
|
(243,295
|
)
|
(147,136
|
)
|
||||||||||
|
Interest income
|
1,157
|
|
348
|
|
534
|
|
1,405
|
|
20,337
|
|
||||||||||
|
Non-controlling interest
|
12,861
|
|
4,582
|
|
2,191
|
|
6,165
|
|
8,777
|
|
||||||||||
|
Net loss attributable to common stockholders
|
(332,780
|
)
|
(198,756
|
)
|
(76,203
|
)
|
(161,490
|
)
|
(372,959
|
)
|
||||||||||
|
Net loss per share attributable to common stockholders - basic and diluted
|
$
|
(1.83
|
)
|
$
|
(2.60
|
)
|
$
|
(1.37
|
)
|
$
|
(3.13
|
)
|
$
|
(7.87
|
)
|
|||||
|
Weighted average number of common shares outstanding - basic and diluted
|
181,768
|
|
76,483
|
|
55,765
|
|
51,598
|
|
47,365
|
|
||||||||||
31
|
|
December 31,
|
|||||||||||||||||||
|
|
2012
|
2011
|
2010
|
2009
|
2008
|
|||||||||||||||
|
Cash and cash equivalents
|
$
|
201,711
|
|
$
|
459,160
|
|
$
|
74,161
|
|
$
|
88,372
|
|
$
|
102,192
|
|
|||||
|
Restricted cash and cash equivalents (current)
|
520,263
|
|
102,165
|
|
73,062
|
|
138,309
|
|
301,550
|
|
||||||||||
|
Working capital
|
588,800
|
|
6,492
|
|
99,276
|
|
220,063
|
|
350,459
|
|
||||||||||
|
Non-current restricted cash and cash equivalents
|
272,924
|
|
82,892
|
|
82,892
|
|
82,892
|
|
138,483
|
|
||||||||||
|
Non-current restricted U.S. Treasury securities
|
—
|
|
—
|
|
—
|
|
—
|
|
20,829
|
|
||||||||||
|
Property, plant and equipment, net
|
3,282,305
|
|
2,107,129
|
|
2,157,597
|
|
2,216,855
|
|
2,170,158
|
|
||||||||||
|
Debt issuances costs, net
|
220,949
|
|
33,356
|
|
41,656
|
|
47,043
|
|
55,688
|
|
||||||||||
|
Goodwill
|
76,819
|
|
76,819
|
|
76,819
|
|
76,819
|
|
76,844
|
|
||||||||||
|
Total assets
|
4,639,085
|
|
2,915,325
|
|
2,553,507
|
|
2,732,622
|
|
2,920,082
|
|
||||||||||
|
Current debt, net of discount
|
—
|
|
492,724
|
|
—
|
|
—
|
|
—
|
|
||||||||||
|
Long-term debt, net of discount
|
2,167,113
|
|
2,465,113
|
|
2,918,579
|
|
2,692,740
|
|
2,750,308
|
|
||||||||||
|
Long-term debt-related parties, net of discount
|
—
|
|
9,598
|
|
8,930
|
|
349,135
|
|
332,054
|
|
||||||||||
|
Long-term deferred revenues
|
21,500
|
|
25,500
|
|
29,994
|
|
33,500
|
|
37,500
|
|
||||||||||
|
Total liabilities
|
2,377,480
|
|
3,088,317
|
|
3,026,117
|
|
3,164,749
|
|
3,194,136
|
|
||||||||||
|
Total stockholders’ equity (deficit)
|
$
|
2,261,605
|
|
$
|
(172,992
|
)
|
$
|
(472,610
|
)
|
$
|
(649,732
|
)
|
$
|
(524,216
|
)
|
|||||
|
(1)
|
General and administrative expense includes $53.2 million, $24.4 million, $16.1 million, $19.2 million, and $55.0 million share-based compensation expense recognized in the years ended December 31,
2012
,
2011
,
2010
,
2009
, and
2008
, respectively.
|
|
(2)
|
In the second quarter of 2008, we announced a cost savings program in connection with the downsizing of our natural gas marketing business activities, the nearing completion of significant construction activities for both the Sabine Pass LNG terminal and Creole Trail Pipeline and the seeking of alternative arrangements for our time charter interest in two LNG vessels.
|
|
(3)
|
In 2010, our investment in Freeport LNG Development, L.P. ("Freeport LNG") was sold, generating net cash proceeds of $104.3 million and a gain to Cheniere of $128.3 million.
|
|
(4)
|
Amount in 2012 related to the early repayments in full of the 2007 Term Loan, the 2008 Loans, and the 2013 Notes. Amount in 2010 related to the cost to amend certain provisions of our 2008 Loans. Amount in 2009 relates to gains on the termination of $120.4 million of our Convertible Senior Unsecured Notes. Amount in 2008 relates to losses on the termination of a $95.0 million bridge loan in August 2008. See
Note 9—"Debt and Debt—Related Parties"
of our Notes to Consolidated Financial Statements.
|
32
ITEM 7.
MANAGEMENT’S DISCUSSION AND ANALYSIS OF FINANCIAL CONDITION AND RESULTS OF
OPERATION
Introduction
The following discussion and analysis presents management’s view of our business, financial condition and overall performance and should be read in conjunction with our Consolidated Financial Statements and the accompanying notes in "Financial Statements and Supplementary Data." This information is intended to provide investors with an understanding of our past performance, current financial condition and outlook for the future. Our discussion and analysis include the following subjects:
|
•
|
Overview of Business
|
|
•
|
Overview of Significant Events
|
|
•
|
Liquidity and Capital Resources
|
|
•
|
Contractual Obligations
|
|
•
|
Results of Operations
|
|
•
|
Off-Balance Sheet Arrangements
|
|
•
|
Inflation and Changing Prices
|
|
•
|
Summary of Critical Accounting Policies and Estimates
|
|
•
|
Recent Accounting Standards
|
Overview of Business
We own and operate the Sabine Pass liquefied natural gas ("LNG") terminal in Louisiana through our
59.5%
ownership interest in and management agreements with Cheniere Energy Partners, L.P. ("Cheniere Partners") (NYSE MKT: CQP), which is a publicly traded partnership that we created in 2007. The Sabine Pass LNG terminal is located on the Sabine Pass deep water shipping channel less than four miles from the Gulf Coast. The Sabine Pass LNG terminal has regasification facilities owned by Cheniere Partners' wholly owned subsidiary, Sabine Pass LNG, L.P. ("Sabine Pass LNG") that includes existing infrastructure of five LNG storage tanks with capacity of approximately 16.9 Bcfe, two docks that can accommodate vessels of up to 265,000 cubic meters and vaporizers with regasification capacity of approximately 4.0 Bcf/d. Cheniere Partners is developing natural gas liquefaction facilities (the "Liquefaction Project") at the Sabine Pass LNG terminal adjacent to the existing regasification facilities through a wholly owned subsidiary, Sabine Pass Liquefaction, LLC ("Sabine Pass Liquefaction"). We plan to construct up to six Trains (each in sequence, "Train 1", "Train 2", "Train 3", "Train 4", "Train 5" and "Train 6"), which are in various stages of development. Each Train has a nominal production capacity of approximately 4.5 mmtpa.
We also own and operate the Creole Trail Pipeline, which interconnects the Sabine Pass LNG terminal with natural gas markets in North America. Approximately one-half of the receiving capacity at the Sabine Pass LNG terminal is contracted to two multinational energy companies. One of our subsidiaries, Cheniere Marketing, LLC ("Cheniere Marketing"), is marketing LNG and natural gas on its own behalf and on behalf of Cheniere Partners, in an effort to monetize the other half of the LNG receiving capacity at the Sabine Pass LNG terminal during construction of the Liquefaction Project.
We are in various stages of developing other projects, including LNG terminal and associated pipeline related projects, each of which, among other things, will require acceptable commercial and financing arrangements before we make a final investment decision.
33
Overview of Significant Events
Our significant accomplishments since January 1, 2012 and through the filing date of this Form 10-K, include the following:
Cheniere
|
•
|
We repaid or converted to equity all of our debt, excluding debt of Cheniere Partners' subsidiaries;
|
|
•
|
We raised approximately $1.2 billion of net proceeds from certain equity offerings, which we used for general corporate purposes, repayment of debt, and to invest in the Liquefaction Project;
|
|
•
|
We entered into a unit purchase agreement ("CEI Unit Purchase Agreement") with Cheniere Partners, pursuant to which we purchased in a series of transactions from Cheniere Partners 33.3 million Class B units in the aggregate at a price of $15.00 per unit for total consideration of $500.0 million, which has been used by Cheniere Partners to fund part of the equity portion of the costs of developing, constructing and placing into service the Liquefaction Project; and
|
|
•
|
The Department of Energy ("DOE") granted us authority to export 767 Bcf per year of domestically produced LNG to Free Trade Agreement ("FTA") countries from the proposed Corpus Christi Liquefaction LNG terminal.
|
Cheniere Partners
|
•
|
Sabine Pass Liquefaction entered into three LNG sale and purchase agreements ("SPAs"): (i) an amended and restated SPA with BG Gulf Coast LNG, LLC ("BG"), a subsidiary of BG Group plc, (ii) an SPA with Korea Gas Corporation ("KOGAS") and (iii) an SPA with Total Gas & Power North America, Inc. ("Total"), under which each customer has agreed to purchase LNG in the amount and upon the commencement of operations as designated in the SPAs;
|
|
•
|
Sabine Pass Liquefaction and Sabine Pass LNG received authorization from the Federal Energy Regulatory Commission ("FERC") to site, construct and operate facilities for the liquefaction and export of domestically produced natural gas at the Sabine Pass LNG terminal adjacent to the existing regasification facilities. The FERC order authorizes the development of up to four modular Trains;
|
|
•
|
We, Cheniere Partners and Blackstone CQP Holdco LP ("Blackstone") entered into a unit purchase agreement, pursuant to which Cheniere Partners sold in a series of transactions to Blackstone in a private placement 100 million Class B units in the aggregate at a price of $15.00 per Class B unit, for a total investment of $1.5 billion. Proceeds from the private placement have been used to fund part of the equity portion of the costs of developing, constructing and placing into service the Liquefaction Project;
|
|
•
|
Sabine Pass Liquefaction closed on a $3.6 billion senior secured credit facility (the "Liquefaction Credit Facility") that will be used to fund a portion of the costs of developing, constructing and placing into service Train 1 and Train 2 of the Liquefaction Project;
|
|
•
|
Cheniere Partners issued a full notice to proceed ("NTP") to Bechtel Oil , Gas and Chemical, Inc. ("Bechtel") to construct Train 1 and Train 2 of the Liquefaction Project;
|
|
•
|
Sabine Pass LNG repurchased its $550.0 million 7.25% Senior Secured Notes due 2013 (the "2013 Notes") by issuing $420.0 million of 6.50% Senior Secured Notes due in 2020 (the "2020 Notes") and by Cheniere Partners selling 8.0 million common units in an underwritten public offering at a price of $25.07 per common unit for net cash proceeds of $194.0 million;
|
|
•
|
Sabine Pass Liquefaction and Bechtel entered into a lump sum turnkey contract for the engineering, procurement and construction of Train 3 and Train 4 (the "EPC Contract (Train 3 and 4)"); and
|
|
•
|
In February 2013, Sabine Pass Liquefaction issued an aggregate principal amount of $1.5 billion of 5.625% Senior Secured Notes due 2021 (the "Sabine Liquefaction Notes"). Net proceeds from the offering are intended to be used to pay capital costs incurred in connection with the construction of Train 1 and Train 2 of the Liquefaction Project in lieu of a portion of the commitments under the Liquefaction Credit Facility.
|
Liquidity and Capital Resources
Although consolidated for financial reporting, Cheniere, Sabine Pass LNG and Cheniere Partners operate with independent capital structures. We expect the cash needs for Sabine Pass LNG's operating activities for at least the next twelve months will be met through operating cash flows and existing unrestricted cash. We expect the cash needs for Cheniere Partners' operating
34
activities and capital expenditures for at least the next twelve months will be met through operating cash flows from Sabine Pass LNG, existing unrestricted cash, project debt and equity financings. We expect the cash needs of Cheniere's operating activities and capital expenditures for at least the next twelve months will be met by utilizing existing unrestricted cash, management fees from Cheniere Partners, distributions from our investment in Cheniere Partners and operating cash flows from our pipeline and LNG and natural gas marketing businesses.
The following table presents (in thousands) Cheniere's restricted and unrestricted cash and cash equivalents for each portion of our capital structure as of
December 31, 2012
. All restricted and unrestricted cash and cash equivalents held by Cheniere Partners and Sabine Pass LNG are considered restricted as to usage or withdrawal by Cheniere:
|
Sabine
Pass LNG
|
Cheniere Partners
|
Other Cheniere
|
Consolidated Cheniere
|
|||||||||||||
|
Cash and cash equivalents
|
$
|
—
|
|
$
|
—
|
|
$
|
201,711
|
|
$
|
201,711
|
|
||||
|
Restricted cash and cash equivalents
|
98,694
|
|
(1)
|
685,542
|
|
(2)
|
8,951
|
|
793,187
|
|
||||||
|
Total
|
$
|
98,694
|
|
$
|
685,542
|
|
$
|
210,662
|
|
$
|
994,898
|
|
||||
|
(1)
|
All cash and cash equivalents presented above for Sabine Pass LNG are considered restricted to us, but $5.2 million is considered unrestricted for Sabine Pass LNG.
|
|
(2)
|
All cash and cash equivalents presented above for Cheniere Partners are considered restricted to us, but $419.3 million is considered unrestricted for Cheniere Partners, including the $5.2 million considered unrestricted for Sabine Pass LNG. Subsequent to December 31, 2012, Sabine Pass Liquefaction issued the Sabine Liquefaction Notes. The $1,466 million net proceeds are considered restricted to us and Cheniere Partners.
|
As of
December 31, 2012
, we had unrestricted cash and cash equivalents of $201.7 million available to Cheniere. In addition, we had consolidated restricted cash and cash equivalents of $793.2 million (which included cash and cash equivalents and other working capital available to Cheniere Partners, in which we own a
59.5%
interest, and Sabine Pass LNG) designated for the following purposes: $685.5 million for the Liquefaction Project and for Cheniere Partners' working capital, $92.3 million for interest payments related to the Sabine Pass LNG Senior Secured Notes described below; $6.4 million for Sabine Pass LNG's working capital; and $9.0 million for other restricted purposes.
Cheniere Partners
Our ownership interest in the Sabine Pass LNG terminal is held through Cheniere Partners. We own approximately
59.5%
of Cheniere Partners in the form of 12.0 million common units, 33.3 million Class B units, 135.4 million subordinated units and a 2% general partner interest. Cheniere Partners owns a 100% interest in Sabine Pass LNG, which is operating the Sabine Pass LNG terminal, and a 100% interest in Sabine Pass Liquefaction, which is constructing the Liquefaction Project.
We receive quarterly equity distributions from Cheniere Partners, and we receive management fees for managing Sabine Pass LNG, Sabine Pass Liquefaction and Cheniere Partners. For the
year ended
December 31, 2012
, we received $20.3 million in distributions on our common units, no cash distributions on our subordinated units or Class B units and $1.2 million in distributions on our general partner interest. During the
year ended
December 31, 2012
, we received fees of $11.1 million, $8.3 million and $31.5 million under our management agreements with Cheniere Partners, Sabine Pass LNG and Sabine Pass Liquefaction, respectively.
Cheniere Partners' common unit and general partner distributions are being funded from accumulated operating surplus. We have not received distributions on our subordinated units since the distribution made with respect to the quarter ended March 31, 2010. Cheniere Partners will not make distributions on our subordinated units unless it generates additional cash flow from Sabine Pass LNG's excess capacity or new business. Therefore, distributions to us on our subordinated units and conversion of the subordinated units into common units will depend upon the future business development of Cheniere Partners. We expect that additional cash flows generated by the Liquefaction Project or other new Cheniere Partners' business would be used to make quarterly distributions on our subordinated units before any increase in distributions to the common unitholders.
Our Class B units are subject to conversion, mandatorily or at our option under specified circumstances, into a number of common units based on the then-applicable conversion value of the Class B units. On a quarterly basis beginning on the initial purchase of the Class B units and ending on the conversion date of the Class B units, the conversion value of the Class B units
35
increases at a compounded rate of
3.5%
per quarter, subject to an additional upward adjustment for certain equity and debt financings. The Class B units are not entitled to cash distributions except in the event of a liquidation (or merger, combination or sale of substantially all of Cheniere Partners' assets). The Class B units will mandatorily convert into common units upon the earlier of the substantial completion date of Train 3 or August 9, 2017, provided that if Train 3 notice to proceed with construction is issued prior to August 9, 2017, then the mandatory conversion date becomes the substantial completion date of Train 3.
We and Cheniere Partners have entered into a services agreement pursuant to which Cheniere Partners pays us a quarterly non-accountable overhead reimbursement charge of $2.8 million (adjusted for inflation) for providing various general and administrative services for Cheniere Partners' benefit. In addition, Cheniere Partners reimburses us for all audit, tax, legal and finance fees incurred by us that are necessary to perform the services under the agreement.
In January 2011, Cheniere Partners initiated an at-the-market program to sell up to 1.0 million common units, the proceeds from which are used primarily to fund development costs associated with the Liquefaction Project. As of December 31, 2011, Cheniere Partners had sold 0.5 million common units with net proceeds of $9.0 million. During the
year ended
December 31, 2012
, Cheniere Partners sold 0.5 million common units with net proceeds of $11.1 million related to this at-the-market program.
In September 2011, Cheniere Partners sold 3.0 million common units in an underwritten public offering and 1.1 million common units to Cheniere Common Units Holding, LLC, our wholly owned subsidiary, at a price of $15.25 per common unit. Cheniere Partners received net proceeds of $43.3 million and $16.4 million from the public offering and Cheniere Common Units Holding, LLC sale, respectively, that it has used for general business purposes, including development costs associated with the Liquefaction Project. In September 2012, Cheniere Partners sold 8.0 million common units in an underwritten public offering at a price of $25.07 per common unit. Cheniere Partners received net proceeds of $194.0 million, a portion of which was used for the partial repayment of the 2013 Notes.
During the
year ended
December 31, 2012
, Cheniere Partners issued and sold 133.3 million Class B units (including 33.3 million Class B units purchased by us) at a price of $15.00 per Class B unit, resulting in total gross proceeds of $2.0 billion that have been used to fund the equity portion of the costs of developing, constructing and placing into service the Liquefaction Project.
LNG Terminal Business
Sabine Pass LNG Terminal
Regasification Facilities
The Sabine Pass LNG terminal has operational regasification capacity of approximately 4.0 Bcf/d and aggregate LNG storage capacity of approximately 16.9 Bcfe. Approximately 2.0 Bcf/d of the regasification capacity at the Sabine Pass LNG terminal has been reserved under two long-term third-party TUAs, under which Sabine Pass LNG’s customers are required to pay fixed monthly fees, whether or not they use the LNG terminal. Capacity reservation fee TUA payments are made by Sabine Pass LNG's third-party TUA customers as follows:
|
•
|
Total has reserved approximately 1.0 Bcf/d of regasification capacity and is obligated to make monthly capacity payments to Sabine Pass LNG aggregating approximately $125 million per year for 20 years that commenced April 1, 2009. Total, S.A. has guaranteed Total’s obligations under its TUA up to $2.5 billion, subject to certain exceptions; and
|
|
•
|
Chevron U.S.A. Inc. ("Chevron") has reserved approximately 1.0 Bcf/d of regasification capacity and is obligated to make monthly capacity payments to Sabine Pass LNG aggregating approximately $125 million per year for 20 years that commenced July 1, 2009. Chevron Corporation has guaranteed Chevron’s obligations under its TUA up to 80% of the fees payable by Chevron.
|
The remaining approximately 2.0 Bcf/d of capacity has been reserved under a TUA by Sabine Pass Liquefaction. Sabine Pass Liquefaction is obligated to make monthly capacity payments to Sabine Pass LNG aggregating approximately $250 million per year, continuing until at least 20 years after Sabine Pass Liquefaction delivers its first commercial cargo at Sabine Pass Liquefaction's facilities under construction, which may occur as early as late 2015. Sabine Pass Liquefaction obtained this reserved capacity as a result of an assignment in July 2012 by Cheniere Energy Investments, LLC ("Cheniere Investments"), a wholly owned subsidiary of Cheniere Partners, of its rights, title and interest under its TUA. In connection with the assignment, Sabine Pass Liquefaction, Cheniere Investments and Sabine Pass LNG entered into a terminal use rights assignment and agreement
36
("TURA") pursuant to which Cheniere Investments has the right to use Sabine Pass Liquefaction's reserved capacity under the TUA and has the obligation to make the monthly capacity payments required by the TUA to Sabine Pass LNG. In an effort to monetize Cheniere Investments’ reserved capacity under its TURA during construction of the Liquefaction Project, Cheniere Marketing, LLC ("Cheniere Marketing"), a wholly owned subsidiary of Cheniere, has entered into a variable capacity rights agreement ("VCRA") pursuant to which Cheniere Marketing is obligated to pay Cheniere Investments 80% of the expected gross margin of each cargo of LNG that Cheniere Marketing arranges for delivery to the Sabine Pass LNG terminal. The revenue earned by Sabine Pass LNG from the capacity payments made under the TUA and the revenue earned by Cheniere Investments under the VCRA are eliminated upon consolidation of our financial statements. Cheniere Partners has guaranteed the obligations of Sabine Pass Liquefaction under its TUA and the obligations of Cheniere Investments under the TURA.
In September 2012, Sabine Pass Liquefaction entered into a partial TUA assignment agreement with Total, whereby Sabine Pass Liquefaction will progressively gain access to Total's capacity and other services provided under Total's TUA with Sabine Pass LNG. This agreement will provide Sabine Pass Liquefaction with additional berthing and storage capacity at the Sabine Pass LNG terminal that may be used to accommodate the development of Train 5 and Train 6, provide increased flexibility in managing LNG cargo loading and unloading activity starting with the commencement of commercial operations of Train 3, and permit Sabine Pass Liquefaction to more flexibly manage its LNG storage capacity with the commencement of Train 1. Notwithstanding any arrangements between Total and Sabine Pass Liquefaction, payments required to be made by Total to Sabine Pass LNG shall continue to be made by Total to Sabine Pass LNG in accordance with its TUA.
Under each of these TUAs, Sabine Pass LNG is entitled to retain 2% of the LNG delivered to the Sabine Pass LNG terminal.
Liquefaction Facilities
The Liquefaction Project is being developed at the Sabine Pass LNG terminal adjacent to the existing regasification facilities. We plan to construct up to six Trains, which are in various stages of development. We have commenced construction of Train 1 and Train 2 and the related new facilities needed to treat, liquefy, store and export natural gas. Construction of Train 3 and Train 4 and the related facilities is expected to commence upon, among other things, obtaining financing commitments sufficient to fund construction of such Trains and making a positive final investment decision. We recently began the development of Train 5 and Train 6 and expect to commence the regulatory approval process in the first half of 2013.
The Trains are being designed, constructed and commissioned by Bechtel using the ConocoPhillips Optimized Cascade® technology, a proven technology deployed in numerous LNG projects around the world. Sabine Pass Liquefaction has entered into lump sum turnkey contracts for the engineering, procurement and construction of Train 1 and Train 2 (the "EPC Contract (Train 1 and 2)") and Train 3 and Train 4 (the "EPC Contract (Train 3 and 4)", and together with the EPC Contract (Train 1 and 2), the "EPC Contracts"), with Bechtel in November 2011 and December 2012, respectively.
In August 2012, we received a final order from the DOE to export 16 mmtpa of LNG to all nations with which trade is permitted. In April 2012, we received authorization from the FERC to site, construct and operate Train 1, Train 2, Train 3 and Train 4.
As of December 31, 2012, the overall project completion for Train 1 and Train 2 was approximately 18% complete. Based on our current construction schedule, we anticipate that Train 1 will produce LNG as early as the end of 2015.
Customers
As of
February 13, 2013
, Sabine Pass Liquefaction has entered into the following third-party SPAs:
|
•
|
BG Gulf Coast LNG, LLC ("BG") SPA commences upon the date of first commercial delivery for Train 1 and includes an annual contract quantity of 182,500,000 MMBtu of LNG and a fixed fee of $2.25 per MMBtu and includes additional annual contract quantities of 36,500,000 MMBtu, 34,000,000 MMBtu, and 33,500,000 MMBtu upon the date of first commercial delivery for Train 2, Train 3 and Train 4, respectively, with a fixed fee of $3.00 per MMBtu. The total expected annual contracted cash flow from BG from the fixed fee component is $723 million. In addition, Sabine Pass Liquefaction has agreed to make LNG available to BG
to the extent that Train 1 becomes commercially operable prior to the beginning of the first delivery window. The obligations of BG are guaranteed by BG Energy Holdings Limited, a company organized under the laws of England and Wales, with a credit rating of A2/A.
|
37
|
•
|
Gas Natural Aprovisionamientos SDG S.A. ("Gas Natural Fenosa"), an affiliate of Gas Natural SDG, S.A., SPA commences upon the date of first commercial delivery for Train 2 and includes an annual contract quantity of 182,500,000 MMBtu of LNG and a fixed fee of $2.49 per MMBtu, equating to expected annual contracted cash flow from the fixed fee component of $454 million. The obligations of Gas Natural Fenosa are guaranteed by Gas Natural SDG S.A., a company organized under the laws of Spain, with a credit rating of Baa2/BBB.
|
|
•
|
Korea Gas Corporation ("KOGAS")
SPA commences upon the date of first commercial delivery for Train 3 and includes an annual contract quantity of 182,500,000 MMBtu of LNG and a fixed fee of $3.00 per MMBtu, equating to expected annual contracted cash flow from fixed fees of $548 million. KOGAS is organized under the laws of the Republic of Korea, with a credit rating of A/A1.
|
|
•
|
GAIL (India) Limited ("
GAIL") SPA commences upon the date of first commercial delivery for Train 4 and includes an annual contract quantity of 182,500,000 MMBtu of LNG and a fixed fee of $3.00 per MMBtu, equating to expected annual contracted cash flow from fixed fees of $548 million. GAIL is organized under the laws of India, with a credit rating of Baa2/BBB-.
|
|
•
|
Total,
an affiliate of Total S.A., SPA commences upon the date of first commercial delivery for Train 5 and includes an annual contract quantity of 104,750,000 MMBtu of LNG and a fixed fee of $3.00 per MMBtu, equating to expected annual contracted cash flow from fixed fees of $314 million. The obligations of Total are guaranteed by Total S.A., a company orga
nized under the laws of France, with a credit rating of Aa1/AA.
|
In
aggregate, the fixed fee portion to be paid by these customers is approximately $2.6 billion annually, with fixed fees starting from the commencement of operations of Train 1, Train 2, Train 3, Train 4 and Train 5 equating to $411 million, $564 million, $650 million, $648 million and $314 million, respectively.
In addition, Cheniere Marketing has entered into an SPA to purchase, at its option, any excess LNG produced that is not committed to non-affiliate parties, for up to a maximum of 104,000,000 MMBtu per annum produced from Train 1 through Train 4. Cheniere Marketing may purchase incremental LNG volumes at a price of 115% of Henry Hub plus up to $3.00 per MMBtu for the first 36,000,000 MMBtu of the most profitable cargoes sold each year by Cheniere Marketing, and then 20% of net profits of the remaining 68,000,000 MMBtu sold each year by Cheniere Marketing.
Construction
In November 2011, Sabine Pass Liquefaction entered into the EPC Contract (Train 1 and 2) with Bechtel. Sabine Pass Liquefaction issued a notice to proceed for construction under the EPC Contract (Train 1 and 2) in August 2012.
In December 2012,
Sabine Pass Liquefaction
entered into the EPC Contract (Train 3 and 4) with Bechtel. Under the EPC Contract (Train 3 and 4), if
Sabine Pass Liquefaction
fails to issue notice to proceed to Bechtel by December 31, 2013, then either
Sabine Pass Liquefaction
or Bechtel may terminate the EPC Contract (Train 3 and 4), and Bechtel will be paid costs reasonably incurred on account of such termination and a lump sum of $5.0 million. The Trains are in various stages of development, as described above.
The total contract price of the EPC Contract (Train 1 and 2) is approximately $3.97 billion, reflecting amounts incurred under change orders through December 31, 2012. Total expected capital costs for Train 1 and Train 2 are estimated to be between $4.5 billion and $5.0 billion before financing costs, including estimated owner's costs and contingencies. Budgeted total all-in costs for Train 1 and Train 2 are estimated to be between $5.5 billion and $6.0 billion, including financing costs and interest expense during construction. The contract price of the EPC Contract (Train 3 and 4) is $3.77 billion, only subject to adjustment by change order (including if Sabine Pass Liquefaction issues the notice to proceed after June 1, 2013). The cost to construct Train 3 and Train 4 is currently estimated to be between $4.5 billion and $5.0 billion before financing costs, including estimated owner's costs and contingencies.
The liquefaction technology to be employed under the EPC Contracts is the ConocoPhillips Optimized Cascade
®
Process, which was first used at the ConocoPhillips Petroleum Kenai plant built by Bechtel in 1969 in Kenai, Alaska. Bechtel has since designed and/or constructed LNG facilities using the ConocoP
hillips Optimized Cascade
®
technology in Angola, Australia, Egypt, Equatorial Guinea and Trinidad. The design and technology has been proven in over four decades of operation.
38
Sabine Pass Liquefaction's Trains will require significant amounts of capital to construct and operate and are subject to risks and delays in completion. Even if successfully completed, Train 1 is not expected to operate and generate significant cash flows before the end of 2015.
We currently expect that Sabine Pass Liquefaction's capital resources requirements with respect to Train 1 and Train 2 will be financed through borrowings, equity contributions from Cheniere Partners and cash flows under our SPAs. We believe that with the net proceeds of borrowings, in addition to construction loans and unfunded commitments under the Liquefaction Credit Facility, Sabine Pass Liquefaction will have adequate financial resources available to complete Train 1 and Train 2 and to meet its currently anticipated capital, operating and debt service requirements. We currently project that Sabine Pass Liquefaction will generate cash flow from operations by the end of 2015, when Train 1 is anticipated to achieve initial LNG production, and that such cash flow will be sufficient to meet Sabine Pass Liquefaction's ongoing capital and operating requirements and to pay the interest on its outstanding debt relating to Train 1 and Train 2.
Pipeline Facilities
Cheniere Creole Trail Pipeline, L.P. ("Creole Trail"), an indirect wholly owned subsidiary of Cheniere, owns the Creole Trail Pipeline, a 94-mile pipeline interconnecting the Sabine Pass LNG terminal with a number of large interstate pipelines, including Natural Gas Pipeline Company of America, Transcontinental Gas Pipeline Corporation, Tennessee Gas Pipeline Company, Florida Gas Transmission Company, Texas Eastern Gas Transmission, and Trunkline Gas Company, as well as the intrastate pipeline system of Bridgeline Holdings, L.P.
Sabine Pass Liquefaction has entered into a transportation precedent agreement to secure firm pipeline transportation capacity with Creole Trail and two other pipelines for Train 1 and Train 2. Creole Trail filed an application with the FERC in April 2012 for certain modifications to allow the Creole Trail Pipeline to be able to transport natural gas to the Sabine Pass LNG terminal. We estimate the capital costs to modify the Creole Trail Pipeline will be approximately $90 million. The modifications are expected to be in service in time for the commissioning and testing of Train 1 and Train 2.
We have entered into an agreement with Cheniere Partners to sell the equity interests of the entities that own the Creole Trail Pipeline if, among other things, Cheniere Partners obtains acceptable financing for the purchase price. The consideration to be paid by Cheniere Partners for the Creole Trail Pipeline is 12 million Class B units and $300 million, plus any costs incurred by Creole Trail from August 2012 until the sale date, including, if applicable, any portion of the expected $90 million for pipeline modifications.
Capital Resources
Senior Secured Notes
We currently have three series of senior notes outstanding: $1,665.0 million of 7½% Senior Secured Notes due 2016 issued by Sabine Pass LNG (the "2016 Notes"), $420.0 million of 6.50% of Senior Secured Notes due 2020 issued by Sabine Pass LNG (the "2020 Notes" and collectively with the 2016 Notes, the "Sabine Pass LNG Senior Notes") and $1,500.0 million of 5.625% Senior Secured Notes due 2021 issued by Sabine Pass Liquefaction (the "Sabine Liquefaction Notes"). Interest on the 2016 Notes is payable semi-annually in arrears on May 30 and November 30 of each year, interest on the 2020 Notes is payable semi-annually in arrears on May 1 and November 1 of each year and interest on the Sabine Liquefaction Notes is payable semi-annually in arrears on February 1 and August 1 of each year. Subject to permitted liens, the Sabine Pass LNG Senior Notes are secured on a first-priority basis by a security interest in all of Sabine Pass LNG's equity interests and substantially all of Sabine Pass LNG's operating assets, and the Sabine Liquefaction Notes are secured on a first-priority basis by a security interest in all of Sabine Pass Liquefaction's equity interests and substantially all of Sabine Pass Liquefaction's assets.
Sabine Pass LNG may redeem some or all of the 2016 Notes at any time, and from time to time, at a redemption price equal to 100% of the principal plus any accrued and unpaid interest plus the greater of 1.0% of the principal amount of the 2016 Notes or the excess of (i) the present value at such redemption date of the redemption price of the 2016 Notes plus all required interest payments due on the 2016 Notes (excluding accrued but unpaid interest to the redemption date), computed using a discount rate equal to the Treasury Rate as of such redemption date plus 50 basis points, over (ii) the principal amount of the 2016 Notes, if greater.
39
Sabine Pass LNG may redeem some or all of the 2020 Notes at any time on or after November 1, 2016 at fixed redemption prices specified in the indenture governing the 2020 Notes, plus accrued and unpaid interest, if any, to the date of redemption. Sabine Pass LNG may also redeem some or all of the 2020 Notes at any time prior to November 1, 2016 at a "make-whole" price set forth in the indenture, plus accrued and unpaid interest, if any, to the date of redemption. At any time before November 1, 2015, Sabine Pass LNG may redeem up to 35% of the aggregate principal amount of the 2020 Notes at a redemption price of 106.5% of the principal amount of the 2020 Notes to be redeemed, plus accrued and unpaid interest, if any, to the redemption date, in an amount not to exceed the net proceeds of one or more completed equity offerings as long as we redeem the 2020 Notes within 180 days of the closing date for such equity offering and at least 65% of the aggregate principal amount of the 2020 Notes originally issued remains outstanding after the redemption.
Sabine Pass Liquefaction may redeem some or all of the Sabine Liquefaction Notes at any time prior to November 1, 2020 at a redemption price equal to the "make-whole" price set forth in the indenture governing the Sabine Liquefaction Notes, plus accrued and unpaid interest, if any, to the date of redemption. Sabine Pass Liquefaction may also at any time on or after November 1, 2020, redeem the Sabine Liquefaction Notes, in whole or in part, at a redemption price equal to 100% of the principal amount of the Sabine Liquefaction Notes to be redeemed, plus accrued and unpaid interest, if any, to the date of redemption.
Under the indentures governing the Sabine Pass LNG Senior Notes, except for permitted tax distributions, Sabine Pass LNG may not make distributions until certain conditions are satisfied: there must be on deposit in an interest payment account an amount equal to one-sixth of the semi-annual interest payment multiplied by the number of elapsed months since the last semi-annual interest payment, and there must be on deposit in a permanent debt service reserve fund an amount equal to one semi-annual interest payment. Distributions are permitted under the Sabine Pass LNG Senior Notes only after satisfying the foregoing funding requirements, a fixed charge coverage ratio test of 2:1 and other conditions specified in the indentures governing the Sabine Pass LNG Senior Notes. Under the indenture governing the Sabine Liquefaction Notes, Sabine Pass Liquefaction may not make any distributions until, among other requirements, substantial completion of Train 1 and Train 2 has occurred, deposits are made into debt service reserve accounts and a debt service coverage ratio of 1.25:1.00 is satisfied.
Liquefaction Credit Facility
In July 2012, Sabine Pass Liquefaction entered into a construction/term loan facility in an amount up to $3.626 billion available to us in four tranches solely to
fund Liquefaction Project costs for Train 1 and Train 2, the related debt service reserve account up to an amount equal to six months of scheduled debt service and the return of equity and affiliate subordinated debt funding to Cheniere or its affiliates up to an amount that will result in senior debt being no more than 65% of our total capitalization. The four tranches are as follows:
|
•
|
Tranche
1
: up to $200 million;
|
|
•
|
Tranche 2
: up to $150 million;
|
|
•
|
Tranche 3
: up to $150 million; and
|
|
•
|
Tranche 4
: up to $3.126 billion.
|
The principal of the construction/term loan is repayable in quarterly installments beginning on the first quarter-end date to occur at least three months after the earlier of the date on which all conditions for project completion under the Liquefaction Credit Facility have been satisfied and the date on which all of the construction/term loan commitments have been used or terminated.
Sabine Pass Liquefaction may make borrowings based on LIBOR plus the applicable margin (3.50% prior to the Liquefaction Project completion date or 3.75% thereafter) or the base rate plus the applicable margin (2.50% prior to the Liquefaction Project completion date or 2.75% thereafter). Sabine Pass Liquefaction is also required to pay commitment fees on the undrawn amount. Sabine Pass Liquefaction is party to interest rate protection agreements with respect to no less than 75% (calculated on a weighted average basis) of the projected outstanding balance for a term of no less than seven years on terms reasonably satisfactory to us and the required secured parties. Upon our incurrence of any replacement debt prior to June 30, 2013, including the sale of the Sabine Liquefaction Notes, Tranche 4 of the Liquefaction Credit Facility commitments, in an amount equal to the proceeds from such replacement debt less certain fees and expenses, will be suspended and extended until December 31, 2013 unless expansion debt shall have been approved prior to such date. Subject to approval by Sabine Pass Liquefaction's lenders, Sabine Pass Liquefaction currently intends to use such suspended commitments to finance the construction of Train 3 and Train 4.
40
Corpus Christi LNG Terminal
Liquefaction Facilities
In September 2011, we formed Corpus Christi Liquefaction, LLC ("Corpus Christi Liquefaction") to develop an LNG terminal near Corpus Christi on over 1,000 acres of land that we own or control. As currently contemplated, the proposed Corpus Christi Liquefaction LNG terminal would be designed for up to three Trains with aggregate nominal production capacity up to 15 mmtpa of LNG, have three LNG storage tanks with capacity of 10.1 Bcfe and two docs that can accommodate vessels of up to 265,000 cubic meters (the "Corpus Liquefaction Project").
In December 2011, Corpus Christi Liquefaction received approval from the FERC to begin the National Environmental Policy Act ("NEPA") pre-filing process required to seek authorization to commence construction of the Corpus Liquefaction Project. In August 2012, Corpus Christi Liquefaction filed an application with the FERC for authorization to site, construct and operate the Corpus Liquefaction Project. Simultaneously, Cheniere Marketing filed an application with the DOE to export up to 15 mmtpa of domestically produced LNG to FTA and non-FTA countries from the proposed Corpus Liquefaction Project. In October 2012, the DOE granted Cheniere Marketing authority to export 15 mmtpa of domestically produced LNG to FTA countries from the proposed Corpus Liquefaction Project.
We will contemplate making a final investment decision to commence construction of the Corpus Liquefaction Project based upon, among other things, entering into acceptable commercial arrangements, receiving regulatory authorization from the FERC to construct and operate the liquefaction assets, securing pipeline transportation of natural gas to the Corpus Liquefaction Project and obtaining adequate financing to construct the facility.
Pipeline Facilities
In conjunction with the Corpus Liquefaction Project, we filed an application with the FERC in August 2012 for authorization to site, construct and operate 23 miles of 48" pipeline that would interconnect the Corpus Liquefaction Project with approximately 3.25 Bcf/d of natural gas interconnect capacity (the "Corpus Christi Pipeline"). The pipeline is designed to transport 2.25 Bcf/d of feed and fuel gas required by the Corpus Liquefaction Project from the existing intra- and interstate natural gas pipeline grid.
We will contemplate making a final investment decision to commence construction of the Corpus Christi Pipeline based upon, among other things, a final investment decision of the Corpus Christi LNG terminal, receiving regulatory authorization from the FERC to construct and operate the pipeline and obtaining adequate financing.
Other LNG Terminal Sites
We continue to evaluate, and may develop, additional sites that we believe may be commercially desirable locations for LNG terminals and other facilities.
LNG and Natural Gas Marketing Business
Our wholly owned subsidiary, Cheniere Marketing, is engaged in the LNG and natural gas marketing business and is seeking to develop a portfolio of long-term, short-term and spot LNG purchase and sale agreements, assist Cheniere Investments in negotiating with potential customers to monetize 2.0 Bcf/d of regasification capacity at the Sabine Pass LNG terminal to which it has access under the TURA during construction of the Liquefaction Project, and enter into business relationships for the domestic marketing of natural gas imported by Cheniere Marketing as LNG to the Sabine Pass LNG terminal.
Cheniere Marketing has been purchasing, transporting and unloading commercial LNG cargoes into the Sabine Pass LNG terminal and has used trading strategies intended to maximize margins on these cargoes. In addition, Cheniere Marketing has continued to enter into various business relationships to facilitate purchasing and selling commercial LNG cargoes.
In an effort to monetize Cheniere Investments’ reserved capacity under its TURA during construction of the Liquefaction Project, Cheniere Marketing has entered into the VCRA pursuant to which Cheniere Marketing is obligated to pay Cheniere Investments 80% of the expected gross margin of each cargo of LNG that Cheniere Marketing arranges for delivery to the Sabine Pass LNG terminal. To the extent payments from Cheniere Marketing to Cheniere Investments under the VCRA or new Cheniere
41
Partners' business increase Cheniere Partners' available cash in excess of the common unit and general partner distributions and certain reserves, the cash would be distributed to Cheniere in the form of distributions on Cheniere’s subordinated units and related general partner distributions. During the term of the VCRA, Cheniere Marketing is responsible for the payment of taxes and new regulatory costs under Cheniere Investments assigned TUA. Cheniere has guaranteed all of Cheniere Marketing's payment obligations under the VCRA.
As described above, Cheniere Marketing has entered into an SPA to purchase, at its option, any excess LNG produced that is not committed to non-affiliate parties, for up to a maximum of 104,000,000 MMBtu per annum produced from Train 1 through Train 4.
The accounting treatment for LNG inventory differs from the treatment for derivative positions such that the economics of Cheniere Marketing's activities are not transparent in our consolidated financial statements until all LNG inventory is sold and all derivative positions are settled. Our LNG inventory is recorded as an asset at cost and is subject to lower of cost or market ("LCM") adjustments at the end of each reporting period. The LCM adjustment market price is based on period-end natural gas spot prices, and any gain or loss from an LCM adjustment is recorded in our earnings at the end of each period. Revenue and cost of goods sold are not recognized in our earnings until the LNG is sold. Generally, our unrealized derivatives positions at the end of each period extend into the future to hedge the cash flow from future sales of our LNG inventory or to take market positions and hedge exposure associated with LNG and natural gas. These positions are measured at fair value, and we record the gains and losses from the change in their fair value currently in earnings. Thus, earnings from changes in the fair value of our derivatives may not be offset by losses from LCM adjustments to our LNG inventory because the LCM adjustments that may be made to LNG inventory are based on period-end spot prices that are different from the time periods of the prices used to determine the fair value of our derivatives. Any losses from changes in the fair value of our derivatives will not be offset by gains until the LNG is actually sold.
Corporate and Other Activities
We are required to maintain corporate general and administrative functions to serve our business activities described above.
42
Sources and Uses of Cash
The following table summarizes (in thousands) the sources and uses of our cash and cash equivalents for the years ended December 31,
2012
,
2011
and
2010
. The table presents capital expenditures on a cash basis; therefore, these amounts differ from the amounts of capital expenditures, including accruals, that are referred to elsewhere in this report. Additional discussion of these items follows the table.
|
Year Ended December 31,
|
|||||||||||
|
|
2012
|
2011
|
2010
|
||||||||
|
Sources of cash and cash equivalents
|
|
|
|||||||||
|
Sale of common stock, net
|
$
|
1,200,705
|
|
$
|
468,598
|
|
$
|
—
|
|
||
|
Sale of Class B units by Cheniere Partners
|
1,387,342
|
|
—
|
|
—
|
|
|||||
|
Proceeds from debt issuances
|
520,000
|
|
—
|
|
—
|
|
|||||
|
Sale of common units by Cheniere Partners
|
204,878
|
|
52,351
|
|
—
|
|
|||||
|
Use of restricted cash and cash equivalents
|
—
|
|
—
|
|
34,423
|
|
|||||
|
Distribution from limited partner investment in Freeport LNG
|
—
|
|
—
|
|
3,900
|
|
|||||
|
Proceeds from sale of limited partner investment in Freeport LNG
|
—
|
|
—
|
|
104,330
|
|
|||||
|
Other
|
—
|
|
—
|
|
104
|
|
|||||
|
Total sources of cash and cash equivalents
|
3,312,925
|
|
520,949
|
|
142,757
|
|
|||||
|
Uses of cash and cash equivalents
|
|
|
|
|
|
|
|||||
|
LNG terminal and pipeline costs, net
|
(1,117,956
|
)
|
(8,934
|
)
|
(4,223
|
)
|
|||||
|
Repurchases and prepayments of debt
|
(1,326,514
|
)
|
—
|
|
(104,681
|
)
|
|||||
|
Investment in Cheniere Partners
|
(545,144
|
)
|
(17,806
|
)
|
—
|
|
|||||
|
Debt issuance and deferred financing costs
|
(223,079
|
)
|
(4,341
|
)
|
(1,432
|
)
|
|||||
|
Operating cash flow
|
(107,840
|
)
|
(42,764
|
)
|
(16,920
|
)
|
|||||
|
Investment in restricted cash and cash equivalents
|
(184,171
|
)
|
(15,914
|
)
|
—
|
|
|||||
|
Distributions to non-controlling interest
|
(36,327
|
)
|
(28,215
|
)
|
(26,393
|
)
|
|||||
|
Purchase of treasury shares
|
(20,414
|
)
|
(14,363
|
)
|
(2,844
|
)
|
|||||
|
Other
|
(8,929
|
)
|
(3,613
|
)
|
(475
|
)
|
|||||
|
Total uses of cash and cash equivalents
|
(3,570,374
|
)
|
(135,950
|
)
|
(156,968
|
)
|
|||||
|
Net increase (decrease) in cash and cash equivalents
|
(257,449
|
)
|
384,999
|
|
(14,211
|
)
|
|||||
|
Cash and cash equivalents—beginning of period
|
459,160
|
|
74,161
|
|
88,372
|
|
|||||
|
Cash and cash equivalents—end of period
|
$
|
201,711
|
|
$
|
459,160
|
|
$
|
74,161
|
|
||
Sale of Common Stock, net
In March 2012, we sold 24.2 million shares of Cheniere common stock in an underwritten public offering for net cash proceeds of approximately $351.9 million. We used a portion of the net proceeds from this offering to repay the 2008 Loans in full in June 2012. In May 2012, we sold 31.0 million shares of Cheniere common stock pursuant to a stock purchase agreement for net proceeds of $468.1 million, which has been used, along with cash on hand, to purchase the $500 million of Class B units from Cheniere Partners. In July 2012, we sold 28.0 million shares of Cheniere common stock in an underwritten public offering for net cash proceeds of $380.3 million. We used a portion of the net proceeds from the offering to repay our Convertible Senior Unsecured Notes due August 1, 2012, and will use the remaining amount for capital expenditures on the Creole Trail Pipeline and general corporate purposes.
In June 2011, we sold 12.7 million shares of Cheniere common stock in an underwritten public offering at a price of $10.35 per share. In December 2011, we sold 41.7 million shares of common stock in an underwritten public offering at a price of $8.35 per share. The Company intends to use the net proceeds from the offerings for general corporate purposes, including repayment of indebtedness.
Sale of Class B Units by Cheniere Partners
During the
year ended
December 31, 2012
, Cheniere Partners issued and sold an aggregate of 100 million Class B units to Blackstone at a price of $15.00 per Class B unit, resulting in total net proceeds of
$1,387.3 million
.
43
Proceeds from Debt Issuances and Debt Issuance Costs
In October 2012, Sabine Pass LNG issued the $420.0 million 2020 Notes. In July 2012, Sabine Pass Liquefaction entered into the $3.6 billion Liquefaction Credit Facility with a syndicate of lenders. Sabine Pass Liquefaction made $100.0 million of borrowings under the Liquefaction Credit Facility in August 2012 after meeting the required conditions precedent to the initial advance. Debt issuance costs primarily relate to $212.8 million paid by Sabine Pass Liquefaction upon the closing of the Liquefaction Credit Facility.
Sale of Common Units by Cheniere Partners
In September 2012, Cheniere Partners sold 8.0 million common units in an underwritten public offering at a price of $25.07 per common unit for net cash proceeds of $194.0 million. In addition, during the
year ended
December 31, 2012
, Cheniere Partners sold 0.5 million common units for net cash proceeds of $11.1 million under its at-the-market program initiated in January 2011.
In January 2011, Cheniere Partners initiated an at-the-market program to sell up to 1.0 million common units, the proceeds from which have primarily been used to fund development costs associated with the Liquefaction Project. As of December 31, 2011, Cheniere Partners had received $9.0 million in net proceeds from its sale of common units related to this at-the-market program.
In September 2011, Cheniere Partners sold 3.0 million common units in an underwritten public offering and 1.1 million common units to our subsidiary, Cheniere Common Units Holding, LLC, at a price of $15.25 per common unit. Cheniere Partners used the net proceeds from the offering for general business purposes, including development costs for the Liquefaction Project.
Distribution from Limited Partner Investment in Freeport LNG
In 2010 and 2009, we received $3.9 million and $15.3 million of distributions from Freeport LNG, respectively. In May 2010, we sold our investment in Freeport LNG and, therefore, have not received distributions since that date.
Proceeds from Sale of Limited Partner Investment in Freeport LNG
We sold our 30% limited partner interest in Freeport LNG to institutional investors for net proceeds of $104.3 million and used $102.0 million of the proceeds to prepay principal of the 2007 Term Loan in June 2010.
LNG Terminal and Pipeline Construction-in-Process, net
Capital expenditures of
$1,118.0 million
in the
year ended
December 31, 2012
primarily related to the construction of Train 1 and Train 2. We began capitalizing costs associated with construction of Train 1 and Train 2 as construction-in-process during the second quarter of 2012. Capital expenditures for our LNG terminals and pipeline projects were $8.9 million and $4.2 million in
2011
and
2010
, respectively.
Repurchases and Prepayments of Debt
In the
year ended
December 31, 2012
, we repurchased
$1,326.5 million
of debt. In January 2012, we used a portion of the net proceeds from the public offering of Cheniere common stock in December 2011 to repay in full the 2007 Term Loan. In June 2012, we used a portion of the net proceeds from the public offering of Cheniere common stock in March 2012 to repay in full the 2008 Loans. In August 2012, we used a portion of the net proceeds from the public offering of Cheniere common stock in July 2012 to repay in full the 2005 Convertible Senior Unsecured Notes. During the fourth quarter of 2012, Sabine Pass LNG repurchased its $550.0 million 2013 Notes. Funds used for the repurchase included proceeds received from the newly issued 2020 Notes and from an equity contribution from Cheniere Partners.
In
2011
and
2010
, we used $104.7 million and $30.0 million, respectively, of cash and cash equivalents to repay/repurchase a portion of our long-term debt. In the second quarter of 2010, we used $102.0 million of the net proceeds from the sale of our limited partner interest in Freeport LNG to partially prepay the 2007 Term Loan. In addition, as a result of the assignment of the Cheniere Marketing TUA to Cheniere Investments in the second quarter of 2010, we used $2.7 million to partially prepay the 2008 Loans.
44
Investment in Cheniere Partners
In the
year ended
December 31, 2012
, we invested $534.9 million in Cheniere Partners related to the purchase of Class B units and general partner units.
In September 2011, we invested $17.8 million in Cheniere Partners related to our purchase of 1.1 million common units concurrent with an underwritten public offering of 3.0 million common units at a price of $15.25 per common unit. Cheniere Partners used the net proceeds from the offering for general business purposes, including the development costs of the Liquefaction Project.
Operating Cash Flow
Net cash used in operations was
$107.8 million
, $42.8 million and $16.9 million in
2012
,
2011
and
2010
, respectively. Net cash used in operations related primarily to the general administrative overhead costs, pipeline operations costs and LNG and natural gas marketing overhead, offset by earnings from our LNG and natural gas marketing business. The increase in cash used in operations in the
year ended
December 31, 2012
compared to 2011 primarily resulted from increased general administrative overhead costs primarily resulting from the August 2012 vesting of awards under the long-term commercial bonus pool and the purchase of the Crest Royalty in March 2012 as described in
Note 16—"Commitments and Contingencies"
of our Notes to Consolidated Financial Statements. The increase in 2011 compared to 2010 primarily resulted from increased costs incurred to develop the Liquefaction Project.
Use of (Investment in) Restricted Cash and Cash Equivalents
In the
year ended
December 31, 2012
, we invested
$184.2 million
in restricted cash and cash equivalents. This investment in restricted cash and cash equivalents is a result of the
$1,771.7 million
investment in restricted cash and cash equivalents related to the net proceeds from Blackstone's purchase of $1.5 billion of Class B units and the June 2012 sale of Cheniere common stock, the proceeds of which were restricted to our purchase of Class B units from Cheniere Partners. This investment in restricted cash and cash equivalents in the
year ended
December 31, 2012
was partially offset by the use of
$1,587.5 million
of restricted cash and cash equivalents for the construction of Train 1 and Train 2 and our purchase of Class B units from Cheniere Partners, the proceeds of which are being used for the construction of Train 1 and Train 2.
In the
year ended
December 31, 2011
, the $15.9 million investment in restricted cash and cash equivalents primarily resulted from Cheniere Partners' public offering in September 2011 in which Cheniere Partners sold 3.0 million common units in an underwritten public offering and 1.1 million common units to Cheniere Common Units Holding, LLC at a price of $15.25 per common unit. Cheniere Partners used the net proceeds from the offering for general business purposes, including development costs for the Liquefaction Project.
In 2010, the
$34.4 million of restricted cash and cash equivalents was used primarily to make distributions of $26.4 million to non-controlling interest holders, pay for construction activities at the Sabine Pass LNG terminal of $4.2 million and incur costs for other individually immaterial items of $3.8 million.
Distributions to Non-controlling Interest Holders
During
2012
,
2011
and
2010
, Cheniere Partners distributed
$36.3 million
, $28.2 million and $26.4 million, respectively, to its non-affiliated common unitholders.
Purchase of Treasury Shares
During
2012
,
2011
and
2010
, we used
$20.4 million
, $14.4 million and $2.8 million, respectively, of cash and cash equivalents to purchase restricted stock that was returned to us by employees to cover taxes related to their restricted stock that vested during such periods. The increase in 2012 as compared to 2011 primarily resulted from the vesting of awards under the long-term commercial bonus pool when Sabine Pass Liquefaction issued its full notice to proceed to Bechtel under the EPC Contract (Train 1 and 2).
45
Issuances of Common Stock
During
2012
, 2011 and 2010, 0.1 million, zero and zero shares, respectively, of our common stock were issued pursuant to the exercise of stock options.
During 2012 and 2011, we issued 10.3 million and 7.8 million shares, respectively, of restricted stock to new and existing employees. During 2010, we issued 1.2 million shares of restricted stock to new and existing employees, and 10.1 million shares of our common stock to the lenders of our 2008 Loans in connection with the December 2010 amendment to the 2008 Loans.
During
2012
,
2011
and 2010, we raised $0.8 million, zero and zero proceeds from the exercise of stock options or the exchange or exercise of warrants.
Contractual Obligations
We are committed to make cash payments in the future pursuant to certain of our contracts. The following table summarizes certain contractual obligations in place as of December 31,
2012
(in thousands).
|
|
Payments Due for Years Ended December 31,
|
|||||||||||||||||||
|
|
Total
|
2013
|
2014-2015
|
2016-2017
|
Thereafter
|
|||||||||||||||
|
Construction and purchase obligations (1)
|
$
|
3,045,185
|
|
$
|
1,286,763
|
|
$
|
1,532,576
|
|
$
|
225,846
|
|
$
|
—
|
|
|||||
|
Long-term debt (excluding interest) (2)
|
2,185,500
|
|
—
|
|
—
|
|
1,665,500
|
|
520,000
|
|
||||||||||
|
Operating lease obligations (3)(4)
|
315,437
|
|
14,411
|
|
25,762
|
|
24,580
|
|
250,684
|
|
||||||||||
|
Other obligations (5)
|
10,998
|
|
3,638
|
|
4,907
|
|
2,453
|
|
—
|
|
||||||||||
|
Total
|
$
|
5,557,120
|
|
$
|
1,304,812
|
|
$
|
1,563,245
|
|
$
|
1,918,379
|
|
$
|
770,684
|
|
|||||
|
(1)
|
A discussion of these obligations can be found at
Note 16—"Commitments and Contingencies"
of our Notes to Consolidated Financial Statements.
|
|
(2)
|
Based on the total debt balance, scheduled maturities and interest rates in effect at December 31,
2012
, our cash payments for interest would be $202.8 million in 2013, $201.6 million in 2014, $201.6 million in 2015, $191.2 million in 2016, $76.7 million in 2017 and $155.4 million for the remaining years for a total of $1,029.3 million. See
Note 9—"Debt and Debt—Related Parties"
of our Notes to Consolidated Financial Statements.
|
|
(3)
|
A discussion of these obligations can be found at
Note 15—"Leases"
of our Notes to Consolidated Financial Statements.
|
|
(4)
|
Minimum lease payments have not been reduced by a minimum sublease rental of $75.9 million due in the future under non-cancelable subleases. A discussion of these sublease rental payments can be found at
Note 15—"Leases"
of our Notes to Consolidated Financial Statements.
|
|
(5)
|
Includes obligations for cooperative endeavor agreements, LNG terminal security services, telecommunication services and software licensing.
|
In addition, in the ordinary course of business, we maintain letters of credit and have certain cash and cash equivalents restricted in support of certain performance obligations of our subsidiaries. Restricted cash and cash equivalents totaled approximately
$793.2 million
at December 31,
2012
. For more information, see
Note 3—"Restricted Cash and Cash Equivalents"
of our Notes to Consolidated Financial Statements.
46
Results of Operations
Overall Operations
2012
vs.
2011
Our consolidated net loss was
$332.8 million
, or
$1.83
per share (basic and diluted), in
2012
compared to a net loss of
$198.8 million
, or
$2.60
per share (basic and diluted), in
2011
. This increase in net loss was primarily a result of increased general and administrative expense ("G&A Expense"), loss on early extinguishment of debt, increased LNG terminal and pipeline development expense, other expense, and decreased LNG and natural gas marketing and trading revenues, which was partially offset by decreased interest expense.
We recognized one-time charges in 2012 of
$57.7 million
for losses on early extinguishment of debt. In addition, a portion of our net loss was attributable to the recognition of non-cash, share-based payments recognized in the consolidated financial statements based on fair value at the date of grant. As a result of our issuance of non-cash, share-based payments to employees, we recorded $58.7 million and $26.4 million of non-cash compensation expense in
2012
and
2011
, respectively. Not including the impact of these one-time charges in
2012
and the impact of non-cash expense in
2012
and
2011
, our net loss would have been $216.4 million, or $1.21 net loss per common share (basic and diluted), and $172.4 million, or $2.25 net loss per common share (basic and diluted), in
2012
and
2011
, respectively.
2011
vs.
2010
Our consolidated net loss was $198.8 million, or $2.60 per share (basic and diluted), in 2011 compared to a net loss of $76.2 million, or $1.37 per share (basic and diluted), in 2010. This increase in net loss was primarily due to the $128.3 million gain in May 2010 from the sale of our 30% interest in Freeport LNG. In addition, the increase in net loss was a result of increased development expense, increased G&A Expense, and decreased marketing and trading revenues, which was partially offset by decreased LNG terminal and pipeline operating expenses and decreased interest expense, net.
We recognized one-time charges in 2010 of $128.3 million for a gain on sale of equity method investment and $50.3 million for a loss on early extinguishment of debt. In addition, a portion of our loss was attributable to the recognition of non-cash, share-based payments recognized in the consolidated financial statements based on fair value at the date of grant. As a result of our issuance of non-cash, share-based payments to employees, we recorded $26.4 million and $17.9 million of non-cash compensation expense in 2011 and 2010, respectively. Not including the impact of these one-time charges in 2011 and 2010 and the impact of non-cash expense in 2011 and 2010, our net loss would have been $172.4 million, or $2.25 net loss per common share (basic and diluted), and $136.3 million, or $2.44 net loss per common share (basic and diluted), in 2011 and 2010, respectively.
G&A Expense
Our G&A Expense includes costs that are incurred for general corporate purposes, LNG and natural gas marketing activities, the Sabine Pass LNG terminal and Creole Trail Pipeline activities.
2012
vs.
2011
G&A Expense increased
$63.7 million
, from
$88.4 million
in 2011 to
$152.1 million
in 2012. This increase in G&A Expense primarily resulted from the August 2012 vesting of the awards under the Long-Term Commercial Bonus Pool in connection with financing the construction of Train 1 and Train 2.
2011 vs. 2010
G&A Expense increased $19.8 million, from $68.6 million in 2010 to $88.4 million in 2011. This increase primarily resulted from increased salary and non-cash compensation expense related to an increased number of corporate employees.
47
2012
vs.
2011
Loss on early extinguishment of debt increased from zero in 2011 to
$57.7 million
in 2012 as a result of the early repayments in full of the 2007 Term Loan and the 2008 Loans and the make-whole payments associated with the early repayments in full of the 2013 Notes.
2011 vs. 2010
Loss on early extinguishment of debt decreased $50.3 million, from a $50.3 million loss in 2010 to zero in 2011. During the fourth quarter of 2010, the 2008 Loans were amended to, among other things: eliminate the "put right," which had allowed the lenders to demand repayment of the 2008 Loans on the third, fifth and seventh anniversaries thereof; allow for the early prepayment of the 2008 Loans; allow us to sell Cheniere Partners common units held as collateral and prepay the 2008 Loans with the proceeds; and release restrictions on prepayments of other indebtedness of Cheniere as certain conditions are met. In addition, 96.6% of the lenders agreed to terminate their rights to exchange the 2008 Loans for Series B Preferred Stock. As part of the amendments to the 2008 Loans, we issued 10.1 million shares of Cheniere common stock to such lenders. The value of the 10.1 million shares of Cheniere common stock were expensed as a loss on early extinguishment of debt in the fourth quarter of 2010.
LNG and Natural Gas Marketing and Trading Revenues
Operating results from marketing and trading activities are presented on a net basis on our Consolidated Statements of Operations. Marketing and trading revenues represent the margin earned on the purchase and transportation costs of LNG and subsequent sales of natural gas to third parties. Our marketing and trading revenues also include pretax derivative gains/losses and inventory lower-of-cost-or-market adjustments, if any. See the table below (in thousands) for an itemized comparison of each major type of energy trading and risk management activity:
|
|
Years Ended December 31,
|
|||||||||||
|
|
2012
|
2011
|
2010
|
|||||||||
|
Physical LNG and natural gas sales, net of costs
|
$
|
4,194
|
|
$
|
9,909
|
|
$
|
6,724
|
|
|||
|
Inventory lower-of-cost-or-market write-downs
|
(10,806
|
)
|
(10,820
|
)
|
—
|
|
||||||
|
Gain from derivatives
|
995
|
|
2,475
|
|
2,265
|
|
||||||
|
Other energy trading activities
|
4,445
|
|
11,990
|
|
10,033
|
|
||||||
|
Total LNG and natural gas marketing and trading revenues
|
$
|
(1,172
|
)
|
$
|
13,554
|
|
$
|
19,022
|
|
|||
2012
vs.
2011
LNG and natural gas marketing and trading revenues decreased
$14.7 million
, from $13.6 million revenue in
2011
to a
$1.2 million
loss in
2012
. The
$14.7 million
decrease in marketing and trading revenues primarily resulted from LCM adjustments to LNG inventory and less LNG export activity. Other energy trading activities primarily consisted of our agreements with JPMorgan LNG Co. ("LNGCo") which were terminated in June 2012.
2011
vs.
2010
LNG and natural gas marketing and trading revenues decreased $5.4 million, from $19.0 million in 2010 to $13.6 million in 2011. The $5.4 million decrease in marketing and trading revenues primarily resulted from LCM adjustments to LNG inventory in 2011. Other energy trading activities primarily consist of our agreements with LNGCo that became effective on April 1, 2010. During 2011 and 2010, we recognized
$12.0 million and $10.1 million, respectively, of marketing and trading revenues from LNGCo.
48
LNG Terminal and Pipeline Development Expense
Our LNG terminal and pipeline development expenses include primarily professional costs associated with front-end engineering and design work, obtaining regulatory approvals authorizing construction of our facilities and other required permitting for our planned LNG terminals and natural gas pipelines.
2012
vs.
2011
LNG terminal and pipeline development expenses increased
$25.3 million
, from
$40.8 million
in
2011
to
$66.1 million
in
2012
. This increase resulted from costs incurred to develop the Liquefaction Project.
2011
vs. 2010
LNG terminal and pipeline development expenses increased $28.8 million, from $12.0 million in 2010 to $40.8 million in 2011. This increase resulted from costs incurred to develop the Liquefaction Project.
LNG Terminal and Pipeline Operating Expense
Our LNG terminal and pipeline operating expenses include costs incurred to operate the Sabine Pass LNG terminal and the Creole Trail Pipeline.
2012
vs.
2011
LNG terminal and pipeline operating expense increased
$18.0 million
, from
$39.1 million
in
2011
to
$57.1 million
in
2012
. This increase primarily resulted from the loss incurred to purchase LNG to maintain the cryogenic readiness of the Sabine Pass LNG terminal and increased dredging services in the 2012.
2011
vs. 2010
LNG terminal and pipeline operating expense decreased $3.3 million, from $42.4 million in 2010 to $39.1 million in 2011. This decrease primarily resulted from decreased fuel costs in 2011 as a result of efficiencies in our LNG inventory management.
Interest Expense, net
2012
vs.
2011
Interest expense, net of amounts capitalized, decreased
$58.6 million
, from
$259.4 million
in
2011
to
$200.8 million
in
2012
. This decrease in interest expense resulted from the reduction of our indebtedness outstanding in 2012.
2011 vs. 2010
Interest expense, net of amounts capitalized, decreased $2.6 million, from $262.0 million in 2010 to $259.4 million in 2011. This decrease in interest expense resulted from the reduction of our indebtedness during the second quarter of 2010.
Gain on Sale of Equity Method Investment
In May 2010, we sold our 30% interest in Freeport LNG and recognized a net gain of $128.3 million. The gain was comprised of net proceeds received of $104.3 million and $24.0 million of distributions in excess of income.
Off-Balance Sheet Arrangements
As of December 31,
2012
, we had no "off-balance sheet arrangements" that may have a current or future material affect on our consolidated financial position or results of operations.
49
Inflation and Changing Prices
During the years ended December 31,
2012
,
2011
and
2010
, inflation and changing commodity prices have had an impact on our oil and gas revenues but have not significantly impacted our results of operations.
Summary of Critical Accounting Policies and Estimates
The selection and application of accounting policies is an important process that has developed as our business activities have evolved and as the accounting rules have developed. Accounting rules generally do not involve a selection among alternatives but involve an implementation and interpretation of existing rules, and the use of judgment, to apply the accounting rules to the specific set of circumstances existing in our business. In preparing our consolidated financial statements in conformity with generally accepted accounting principles in the United States ("GAAP"), we endeavor to comply with all applicable rules on or before their adoption, and we believe that the proper implementation and consistent application of the accounting rules are critical. However, not all situations are specifically addressed in the accounting literature. In these cases, we must use our best judgment to adopt a policy for accounting for these situations. We accomplish this by analogizing to similar situations and the accounting guidance governing them.
Cash and Cash Equivalents
We consider all highly liquid investments with an original maturity of
three
months or less to be cash equivalents. Our investments are primarily in commercial paper and are made in accordance with corporate policy, which, among other things, stipulates minimum acceptable credit ratings of commercial paper issuers.
Accounting for LNG Activities
Generally, we begin capitalizing the costs of our LNG terminals and related pipelines once the individual project meets the following criteria: (i) regulatory approval has been received, (ii) financing for the project is available and (iii) management has committed to commence construction. Prior to meeting these criteria, most of the costs associated with a project are expensed as incurred. These costs primarily include professional fees associated with front-end engineering and design work, costs of securing necessary regulatory approvals, and other preliminary investigation and development activities related to our LNG terminals and related pipelines.
Generally, costs that are capitalized prior to a project meeting the criteria otherwise necessary for capitalization include: land and lease option costs that are capitalized as property, plant and equipment and certain permits that are capitalized as intangible LNG assets. The costs of lease options are amortized over the life of the lease once obtained. If no lease is obtained, the costs are expensed.
We capitalize interest and other related debt costs during the construction period of our LNG terminal. Upon commencement of operations, capitalized interest, as a component of the total cost, will be amortized over the estimated useful life of the asset.
Revenue Recognition
LNG regasification capacity reservation fees are recognized as revenue over the term of the respective TUAs. Advance capacity reservation fees are initially deferred and amortized over a
10
-year period as a reduction of a customer’s regasification capacity reservation fees payable under its TUA. The retained
2%
of LNG delivered for each customer’s account at the Sabine Pass LNG terminal is recognized as revenues as Sabine Pass LNG performs the services set forth in each customer’s TUA.
LNG and Natural Gas Marketing
We have determined that our LNG and natural gas marketing business activities are energy trading and risk management activities for trading purposes and have elected to present these activities on a net basis on our Consolidated Statements of Operations. Marketing and trading revenues represent the margin earned on the purchase and transportation of LNG purchases and subsequent sales of natural gas to third parties. These energy trading and risk management activities include, but are not limited to: purchase of LNG and natural gas, transportation contracts, and derivatives. Below is a brief description of our accounting treatment of each type of energy trading and risk management activity and how we account for it:
50
Purchase of LNG and natural gas
The purchase value of LNG or natural gas inventory is recorded as an asset on our Consolidated Balance Sheets at the cost to acquire the product. Our inventory is subject to lower of cost or market adjustment each quarter. Recoveries of losses resulting from interim period lower of cost or market adjustments are made due to market price recoveries on the same inventory in the same fiscal year and are recognized as gains in later interim periods with such gains not exceeding previously recognized losses. Any adjustment to our inventory is recorded on a net basis as LNG and natural gas marketing revenue on our Consolidated Statements of Operations.
Transportation contracts
We enter into transportation contracts with respect to the transport of LNG or natural gas to a specific location for storage or sale. Transportation costs that are incurred during the purchase of LNG or natural gas are capitalized as part of the acquisition costs of the product. Transportation costs incurred to sell LNG or natural gas are recorded on a net basis as LNG and natural gas marketing revenue on our Consolidated Statements of Operations.
LNG Inventory Derivatives
We use derivative instruments to hedge cash flows attributable to the future sale of LNG inventory. Gains and losses in positions to hedge the cash flows attributable to the future sale of LNG inventory are classified as marketing and trading revenues on our Consolidated Statements of Operations.
Derivatives
We use derivative instruments from time to time to hedge the exposure to variability in expected future cash flows attributable to the future sale of our LNG inventory, to hedge the exposure to price risk attributable to future purchases of natural gas to be utilized as fuel to operate the Sabine Pass LNG terminal, and to hedge the exposure to volatility in a portion of the floating-rate interest payments under the Liquefaction Credit Facility. We have disclosed certain information regarding these derivative positions, including the fair value of our derivative positions, in
Note 11—"Financial Instruments"
of our Notes to Consolidated Financial Statements.
Accounting guidance for derivative instruments and hedging activities establishes accounting and reporting standards requiring that derivative instruments be recorded at fair value and included in the consolidated balance sheet as assets or liabilities. The accounting for changes in the fair value of a derivative instrument depends on the intended use of the derivative and the resulting designation, which is established at the inception of a derivative. We record changes in the fair value of our derivative positions based on the value for which the derivative instrument could be exchanged between willing parties. To date, all of our derivative positions fair value determinations have been made by management using quoted prices in active markets for similar assets or liabilities. The ultimate fair value of our derivative instruments is uncertain, and we believe that it is possible that a change in the estimated fair value will occur in the near future as commodity prices and interest rates change.
Changes in fair value of contracts that do not qualify as hedges or are not designated as hedges are recognized currently in earnings. Gains and losses in positions to hedge the cash flows attributable to the future sale of LNG inventory are classified as marketing and trading revenues on our Consolidated Statements of Operations. Gains or losses in the positions to mitigate the price risk from future purchases of natural gas to be utilized as fuel to operate the Sabine Pass LNG terminal are classified as derivative gain (loss) on our Consolidated Statements of Operations.
We have elected cash flow hedge accounting for derivatives that we use to hedge the exposure to volatility in floating-rate interest payments. Changes in fair value of derivative instruments designated as cash flow hedges, to the extent the hedge is effective, are recognized in accumulated other comprehensive loss on our Consolidated Balance Sheets. We reclassify gains and losses on the hedges from accumulated other comprehensive loss into interest expense in our Consolidated Statements of Operations as the hedged item is recognized. Any change in the fair value resulting from ineffectiveness is recognized immediately as derivative gain (loss) on our Consolidated Statements of Operations. We use regression analysis to determine whether we expect a derivative to be highly effective as a cash flow hedge prior to electing hedge accounting and also to determine whether all derivatives designated as cash flow hedges have been effective. We perform these effectiveness tests prior to designation for all new hedges and on a quarterly basis for all existing hedges. We calculate the actual amount of ineffectiveness on our cash flow hedges using the "dollar offset" method, which compares changes in the expected cash flows of the hedged transaction to changes in the value of expected cash flows from the hedge. We discontinue hedge accounting when our effectiveness tests indicate that
51
a derivative is no longer highly effective as a hedge; when the derivative expires or is sold, terminated or exercised; when the hedged item matures, is sold or repaid; or when we determine that the occurrence of the hedged forecasted transaction is not probable. When we discontinue hedge accounting but continue to hold the derivative, we begin to apply mark-to-market accounting at that time.
Fair Value of Financial Instruments
The carrying amounts of cash and cash equivalents, restricted cash and cash equivalents, restricted certificates of deposit, accounts receivable, and accounts payable approximate fair value because of the short maturity of those instruments. We use available market data and valuation methodologies to estimate the fair value of debt.
Concentration of Credit Risk
Financial instruments that potentially subject us to a concentration of credit risk consist principally of cash and cash equivalents and restricted cash. We maintain cash balances at financial institutions, which may at times be in excess of federally insured levels. We have not incurred losses related to these balances to date.
The use of derivative instruments exposes us to counterparty credit risk, or the risk that a counterparty will be unable to meet its commitments. Our commodity derivative transactions are executed through over-the-counter contracts which are subject to nominal credit risk as these transactions are settled on a daily margin basis with investment grade financial institutions. Collateral deposited for such contracts is recorded as an other current asset and not netted within the derivative fair value. Our interest rate derivative instruments are placed with investment grade financial institutions whom we believe are acceptable credit risks. We monitor counterparty creditworthiness on an ongoing basis; however, we cannot predict sudden changes in counterparties’ creditworthiness. In addition, even if such changes are not sudden, we may be limited in our ability to mitigate an increase in counterparty credit risk. Should one of these counterparties not perform, we may not realize the benefit of some of our derivative instruments.
Sabine Pass LNG has entered into certain long-term TUAs with unaffiliated third parties for regasification capacity at our Sabine Pass LNG terminal. We are dependent on the respective counterparties’ creditworthiness and their willingness to perform under their respective TUAs. We have mitigated this credit risk by securing TUAs for a significant portion of our regasification capacity with creditworthy third-party customers with a minimum Standard & Poor’s rating of AA.
Regulated Natural Gas Pipelines
Our natural gas pipeline is subject to the jurisdiction of the Federal Energy Regulatory Commission ("FERC") in accordance with the Natural Gas Act of 1938 and the Natural Gas Policy Act of 1978. The economic effects of regulation can result in a regulated company recording as assets those costs that have been or are expected to be approved for recovery from customers, or recording as liabilities those amounts that are expected to be required to be returned to customers, in a rate-setting process in a period different from the period in which the amounts would be recorded by an unregulated enterprise. Accordingly, we record assets and liabilities that result from the regulated rate-making process that may not be recorded under accounting principles generally accepted in the United States of America ("GAAP") for non-regulated entities. We continually assess whether regulatory assets are probable of future recovery by considering factors such as applicable regulatory changes and recent rate orders applicable to other regulated entities. Based on this continual assessment, we believe the existing regulatory assets are probable of recovery. These regulatory assets and liabilities are primarily classified in the Consolidated Balance Sheets as other assets and other liabilities. We periodically evaluate their applicability under GAAP, and consider factors such as regulatory changes and the effect of competition. If cost-based regulation ends or competition increases, we may have to reduce our asset balances to reflect a market basis less than cost and write-off the associated regulatory assets and liabilities.
Items that may influence our assessment are:
|
•
|
inability to recover cost increases due to rate caps and rate case moratoriums;
|
|
•
|
inability to recover capitalized costs, including an adequate return on those costs through the rate-making process and the FERC proceedings;
|
|
•
|
excess capacity;
|
|
•
|
increased competition and discounting in the markets we serve; and
|
52
|
•
|
impacts of ongoing regulatory initiatives in the natural gas industry.
|
Natural gas pipeline costs include amounts capitalized as an Allowance for Funds Used During Construction ("AFUDC"). The rates used in the calculation of AFUDC are determined in accordance with guidelines established by the FERC. AFUDC represents the cost of debt and equity funds used to finance our natural gas pipeline additions during construction. AFUDC is capitalized as a part of the cost of our natural gas pipelines. Under regulatory rate practices, we generally are permitted to recover AFUDC, and a fair return thereon, through our rate base after our natural gas pipelines are placed in service.
Property, Plant and Equipment
Property, plant and equipment are recorded at cost. Expenditures for construction activities, major renewals and betterments are capitalized, while expenditures for maintenance and repairs and general and administrative activities are charged to expense as incurred. Interest costs incurred on debt obtained for the construction of property, plant and equipment are capitalized as construction-in-process over the construction period or related debt term, whichever is shorter. We depreciate our property, plant and equipment using the straight-line depreciation method. Upon retirement or other disposition of property, plant and equipment, the cost and related accumulated depreciation are removed from the account, and the resulting gains or losses are recorded in operations.
Management reviews property, plant and equipment for impairment periodically and whenever events or changes in circumstances have indicated that the carrying amount of property, plant and equipment might not be recoverable. We have recorded no significant impairments related to property, plant and equipment for
2012
,
2011
or
2010
.
Income Taxes
Provisions for income taxes are based on taxes payable or refundable for the current year and deferred taxes on temporary differences between the tax basis of assets and liabilities and their reported amounts in the consolidated financial statements. Deferred tax assets and liabilities are included in the consolidated financial statements at currently enacted income tax rates applicable to the period in which the deferred tax assets and liabilities are expected to be realized or settled. As changes in tax laws or rates are enacted, deferred tax assets and liabilities are adjusted through the current period's provision for income taxes. A valuation allowance is provided for deferred tax assets if it is more likely than not that such asset will not be realized.
Use of Estimates
The preparation of consolidated financial statements in conformity with GAAP requires management to make certain estimates and assumptions that affect the amounts reported in the consolidated financial statements and the accompanying notes. Actual results could differ from the estimates and assumptions used.
Estimates used in the assessment of impairment of our long-lived assets, including goodwill, are the most significant of our estimates. There are numerous uncertainties inherent in estimating future cash flows of assets or business segments. The accuracy of any cash flow estimate is a function of judgment used in determining the amount of cash flows generated. As a result, cash flows may be different from the cash flows that we use to assess impairment of our assets. Management reviews its estimates of cash flows on an ongoing basis using historical experience and other factors, including the current economic and commodity price environment. Significant negative industry or economic trends, including a significant decline in the market price of our common stock, reduced estimates of future cash flows for our business segments or disruptions to our business could lead to an impairment charge of our long-lived assets, including goodwill and other intangible assets. Our valuation methodology for assessing impairment requires management to make judgments and assumptions based on historical experience and to rely heavily on projections of future operating performance. Projections of future operating results and cash flows may vary significantly from results. In addition, if our analysis results in an impairment of our long-lived assets, including goodwill, we may be required to record a charge to earnings in our consolidated financial statements during a period in which such impairment is determined to exist, which may negatively impact our results of operations.
Other items subject to estimates and assumptions include asset retirement obligations, valuation allowances for net deferred tax assets, valuations of derivative instruments, valuations of noncash compensation and collectability of accounts receivable and other assets.
As future events and their effects cannot be determined accurately, actual results could differ significantly from our estimates.
53
Goodwill
Goodwill represents the excess of cost over fair value of the assets of businesses acquired. The goodwill on our Consolidated Balance Sheets as of
December 31, 2012
and
2011
is associated with our LNG terminal reporting unit. We determine our reporting units by identifying each unit that engaged in business activities from which it may earn revenues and incur expenses, had operating results regularly reviewed by the entities' chief operating decision makers for purposes of resource allocation and performance assessment, and had discrete financial information.
Goodwill is assessed for impairment whenever events or circumstances indicate that impairment of the carrying value of goodwill is likely, but no less often than annually. During the fourth quarters of
2012
and
2011
, we performed a qualitative assessment of goodwill in accordance with FASB guidance which permits an entity to first assess qualitative factors to determine whether it is more likely than not that the fair value of a reporting unit is less than its carrying amount as a basis for determining whether it is necessary to perform the two-step goodwill impairment test. If the carrying value of the reporting unit exceeds its fair value, a computation of the implied fair value of the goodwill is compared with its related carrying value. If the carrying value of the reporting unit goodwill exceeds the implied fair value of that goodwill, an impairment loss is recognized in the amount of the excess.
The annual reviews of goodwill in
2012
and
2011
did not result in impairment charges. The fair value of the reporting unit substantially exceeds its carrying value for both periods and it was not "more likely than not" that the fair value of our LNG terminal segment was less than its carrying value. As discussed above regarding our use of estimates, our judgments and assumptions are inherent in our management’s estimate of future cash flows used to determine the estimate of the reporting unit’s fair value. The use of alternate judgments and/or assumptions could result in the recognition of different levels of impairment charges in the consolidated financial statements.
Debt Issuance Costs
Debt issuance costs consist primarily of arrangement fees, professional fees, legal fees and printing costs. These costs are capitalized and are being amortized to interest expense over the term of the related debt facility.
Share-Based Compensation Expense
We recognize compensation expense for all share-based payments using the Black-Scholes-Merton option valuation model. We recognize share-based compensation net of an estimated forfeiture rate and only recognize compensation cost for those shares expected to vest on a straight-line or accelerated basis over the requisite service period of the award.
Determining the appropriate fair value model and calculating the fair value of share-based payment awards requires the use of highly subjective assumptions, including the expected life of the share-based payment awards and stock price volatility. We believe that implied volatility, calculated based on traded options of our common stock, combined with historical volatility is an appropriate indicator of expected volatility and future stock price trends. Therefore, the expected volatility for the
years ended
December 31, 2012
and
2011
used in our fair value model was based on a combination of implied and historical volatilities. The assumptions used in calculating the fair value of share-based payment awards represent our best estimates, but these estimates involve inherent uncertainties and the application of management's judgment. As a result, if factors change and we use different assumptions, our share-based compensation expense could be materially different in the future. In addition, we are required to estimate the expected forfeiture rate and only recognize expense for those shares expected to vest. If our actual forfeiture rate is materially different from our estimate, future share-based compensation expense could be significantly different from what we have recorded in the current period (See
Note 14—"Share-Based Compensation"
of our Notes to Consolidated Financial Statements).
Net Loss Per Share
Net loss per share ("EPS") is computed in accordance with GAAP. Basic EPS excludes dilution and is computed by dividing net income (loss) by the weighted average number of common shares outstanding during the period. Diluted EPS reflects potential dilution and is computed by dividing net income by the weighted average number of common shares outstanding during the period increased by the number of additional common shares that would have been outstanding if the potential common shares had been issued. Basic and diluted EPS for all periods presented are the same since the effect of our options and unvested stock is anti-dilutive to our net loss per share. Stock options, warrants and unvested stock representing securities that could potentially dilute basic EPS in the future that were not included in the diluted computation because they would have been anti-dilutive for the years
54
2012
,
2011
and
2010
, were 4.4 million shares, 2.4 million shares and 5.8 million shares, respectively. Common shares of 7.5 million on a weighted average basis, issuable upon conversion of the 2008 Loans and the Convertible Senior Unsecured Notes (described in
Note 9—"Debt and Debt—Related Parties"
), were not included in the computation of diluted net loss per share for 2011 and 2010, because the computation of diluted net loss per share utilizing the "if-converted" method would be anti-dilutive. No adjustments were made to reported net loss in the computation of EPS.
Asset Retirement Obligations
We recognize asset retirement obligations ("AROs") for legal obligations associated with the retirement of long-lived assets that result from the acquisition, construction, development and/or normal use of the asset and for conditional AROs in which the timing or method of settlement are conditional on a future event that may or may not be within our control. The fair value of a liability for an ARO is recognized in the period in which it is incurred, if a reasonable estimate of fair value can be made. The fair value of the liability is added to the carrying amount of the associated asset. This additional carrying amount is depreciated over the estimated useful life of the asset. Our recognition of asset retirement obligations is described below:
Currently, the Sabine Pass LNG terminal is our only constructed and operating LNG terminal. Based on the real property lease agreements at the Sabine Pass LNG terminal, at the expiration of the term of the leases we are required to surrender the LNG terminal in good working order and repair, with normal wear and tear and casualty expected. Our property lease agreements at the Sabine Pass LNG terminal have terms of up to 90 years including renewal options. We have determined that the cost to surrender the Sabine Pass LNG terminal in good order and repair, with normal wear and tear and casualty expected, is zero. Therefore, we have not recorded an asset retirement obligation associated with the Sabine Pass LNG terminal.
Currently, the Creole Trail Pipeline is our only constructed and operating natural gas pipeline. We believe that it is not feasible to predict when the natural gas transportation services provided by the Creole Trail Pipeline will no longer be utilized. In addition, our right-of-way agreements associated with the Creole Trail Pipeline have no stipulated termination dates. Therefore, we have concluded that due to advanced technology associated with current natural gas pipelines and our intent to operate the Creole Trail Pipeline as long as supply and demand for natural gas exists in the United States, we have not recorded an ARO associated with the Creole Trail Pipeline.
Recent Accounting Standards
In May 2011, the Financial Accounting Standards Board ("FASB") issued guidance that further addresses fair value measurement accounting and related disclosure requirements. The guidance clarifies the FASB's intent regarding the application of existing fair value measurement and disclosure requirements, changes the fair value measurement requirements for certain financial instruments, and sets forth additional disclosure requirements for other fair value measurements. The guidance is to be applied prospectively and is effective for periods beginning after December 15, 2011. We adopted this guidance effective January 1, 2012. The adoption of this guidance did not have an impact on our consolidated financial position, results of operations or cash flows, as it only expanded disclosures.
In June 2011, the FASB amended current comprehensive income guidance. The amended guidance eliminates the option to present the components of other comprehensive income as part of the statement of shareholders’ equity. Instead, we must report comprehensive income in either a single continuous statement of comprehensive income which contains two sections, net income and other comprehensive income, or in two separate but consecutive statements. This guidance will be effective for public companies during the interim and annual periods beginning after December 15, 2011 with early adoption permitted. Also, in December 2011, FASB issued an accounting standard update to abrogate the requirement for presentation in the income statement of the effect on net income of reclassification adjustments out of AOCI as required in FASB's June 2011 amendment. We adopted this guidance in our first fiscal quarter ending March 31, 2012. The adoption of this guidance did not have an impact on our consolidated financial position, results of operations or cash flows as it only required a change in the format of the current presentation.
ITEM 7A.
QUANTITATIVE AND QUALITATIVE DISCLOSURES ABOUT MARKET RISK
Cash Investments
We have cash investments that we manage based on internal investment guidelines that emphasize liquidity and preservation of capital. Such cash investments are stated at historical cost, which approximates fair market value on our Consolidated Balance Sheets.
55
Marketing and Trading Commodity Price Risk
We have entered into certain instruments to hedge the exposure to variability in expected future cash flows attributable to the future sale of our LNG inventory ("LNG Inventory Derivatives") and to hedge the exposure to price risk attributable to future purchases of natural gas to be utilized as fuel to operate the Sabine Pass LNG terminal ("Fuel Derivatives"). We use one-day value at risk ("VaR") with a 95% confidence interval and other methodologies for market risk measurement and control purposes of our LNG Inventory Derivatives and Fuel Derivatives. The VaR is calculated using the Monte Carlo simulation method. The table below provides information about our LNG Inventory Derivatives and Fuel Derivatives that are sensitive to changes in natural gas prices and interest rates as of
December 31, 2012
.
|
Hedge Description
|
Hedge Instrument
|
Contract Volume (MMBtu)
|
Price Range ($/MMBtu)
|
Final Hedge Maturity Date
|
Fair Value (in thousands)
|
VaR (in thousands)
|
||||||||||
|
LNG Inventory Derivatives
|
Fixed price natural gas swaps
|
1,567,500
|
$3.366 - $3.893
|
May 2013
|
$
|
237
|
|
$
|
37
|
|
||||||
|
Fuel Derivatives
|
Fixed price natural gas swaps
|
1,095,000
|
$3.351 - $4.050
|
January 2014
|
$
|
(98
|
)
|
$
|
5
|
|
||||||
We have entered into interest rate swaps to hedge the exposure to volatility in a portion of the floating-rate interest payments under the Liquefaction Credit Facility ("Interest Rate Derivatives"). In order to test the sensitivity of the fair value of the Interest Rate Derivatives to changes in interest rates, management modeled a 10% change in the forward 1-month LIBOR curve across the full 7-year term of the Interest Rate Derivatives. This 10% change in interest rates resulted in a change in the fair value of the Interest Rate Derivatives of $19.2 million. The table below provides information about our Interest Rate Derivatives that are sensitive to changes in the forward 1-month LIBOR curve as of
December 31, 2012
.
|
Hedge Description
|
Hedge Instrument
|
Initial Notional Amount
|
Maximum Notional Amount
|
Fixed Interest Rate Range (%)
|
Final Hedge Maturity Date
|
Fair Value (in thousands)
|
10% Change in LIBOR (in thousands)
|
|||||||||||
|
Interest Rate Derivatives
|
Interest rate swaps
|
$20.0 million
|
$2.9 billion
|
1.978 - 1.981
|
July 2019
|
$
|
(26,424
|
)
|
$
|
19,241
|
|
|||||||
56
ITEM 8.
FINANCIAL STATEMENTS AND SUPPLEMENTARY DATA
INDEX TO CONSOLIDATED FINANCIAL STATEMENTS
CHENIERE ENERGY, INC. AND SUBSIDIARIES
|
|
|
57
MANAGEMENT’S REPORTS TO THE STOCKHOLDERS OF CHENIERE ENERGY, INC.
Management’s Report on Internal Control Over Financial Reporting
As management, we are responsible for establishing and maintaining adequate internal control over financial reporting for Cheniere Energy, Inc. and its subsidiaries ("Cheniere"). In order to evaluate the effectiveness of internal control over financial reporting, as required by Section 404 of the Sarbanes-Oxley Act of 2002, we have conducted an assessment, including testing using the criteria in
Internal Control—Integrated Framework
issued by the Committee of Sponsoring Organizations of the Treadway Commission ("COSO"). Cheniere’s system of internal control over financial reporting is designed to provide reasonable assurance regarding the reliability of financial reporting and the preparation of financial statements for external purposes in accordance with accounting principles generally accepted in the United States of America. Because of its inherent limitations, internal control over financial reporting may not prevent or detect misstatements and, even when determined to be effective, can only provide reasonable assurance with respect to financial statement preparation and presentation.
Based on our assessment, we have concluded that Cheniere maintained effective internal control over financial reporting as of December 31,
2012
, based on criteria in
Internal Control—Integrated Framework
issued by the COSO.
Cheniere’s independent auditors, Ernst & Young LLP, have issued an audit report on Cheniere’s internal control over financial reporting as of December 31,
2012
, which is contained in this Form 10-K.
Management’s Certifications
The certifications of Cheniere’s Chief Executive Officer and Chief Financial Officer required by the Sarbanes-Oxley Act of 2002 have been included as Exhibits 31 and 32 in Cheniere’s Form 10-K.
CHENIERE ENERGY, INC.
|
|
|
|
|
|
|
By:
|
/s/ Charif Souki
|
|
By:
|
/s/ Meg A. Gentle
|
|
|
Charif Souki
Chief Executive Officer and President
(Principal Executive Officer) |
|
|
Meg A. Gentle
Senior Vice President
and Chief Financial Officer
(Principal Financial Officer) |
58
REPORT OF INDEPENDENT REGISTERED PUBLIC ACCOUNTING FIRM
The Board of Directors and Stockholders of
Cheniere Energy, Inc.
We have audited the accompanying consolidated balance sheets of Cheniere Energy, Inc. and subsidiaries as of December 31, 2012 and 2011, and the related consolidated statements of operations, comprehensive loss, stockholders' (deficit) equity, and cash flows for each of the three years in the period ended December 31,
2012
. Our audits also included the financial statement schedule listed in the Index at Item 15(a). These financial statements and schedule are the responsibility of the Company's management. Our responsibility is to express an opinion on these financial statements and schedule based on our audits.
We conducted our audits in accordance with the standards of the Public Company Accounting Oversight Board (United States). Those standards require that we plan and perform the audit to obtain reasonable assurance about whether the financial statements are free of material misstatement. An audit includes examining, on a test basis, evidence supporting the amounts and disclosures in the financial statements. An audit also includes assessing the accounting principles used and significant estimates made by management, as well as evaluating the overall financial statement presentation. We believe that our audits provide a reasonable basis for our opinion.
In our opinion, the financial statements referred to above present fairly, in all material respects, the consolidated financial position of Cheniere Energy, Inc. and subsidiaries at December 31,
2012
and 2011, and the consolidated results of their operations and their cash flows for each of the three years in the period ended December 31, 2012, in conformity with U.S. generally accepted accounting principles. Also, in our opinion, the related financial statement schedule, when considered in relation to the basic financial statements taken as a whole, presents fairly in all material respects the information set forth therein.
We also have audited, in accordance with the standards of the Public Company Accounting Oversight Board (United States), Cheniere Energy, Inc.'s internal control over financial reporting as of December 31, 2012, based on criteria established in Internal Control-Integrated Framework issued by the Committee of Sponsoring Organizations of the Treadway Commission and our report dated
February 22, 2013
expressed an unqualified opinion thereon.
|
|
|
/s/ ERNST & YOUNG LLP
|
|
Ernst & Young LLP
|
|
|
Houston, Texas
February 22, 2013
59
REPORT OF INDEPENDENT REGISTERED PUBLIC ACCOUNTING FIRM
The Board of Directors and Stockholders of
Cheniere Energy, Inc.
We have audited Cheniere Energy, Inc. and subsidiaries' internal control over financial reporting as of December 31, 2012, based on criteria established in Internal Control-Integrated Framework issued by the Committee of Sponsoring Organizations of the Treadway Commission (the COSO criteria). Cheniere Energy, Inc. and subsidiaries' management is responsible for maintaining effective internal control over financial reporting, and for its assessment of the effectiveness of internal control over financial reporting included in the accompanying Management's Report on Internal Control Over Financial Reporting. Our responsibility is to express an opinion on the company's internal control over financial reporting based on our audit.
We conducted our audit in accordance with the standards of the Public Company Accounting Oversight Board (United States). Those standards require that we plan and perform the audit to obtain reasonable assurance about whether effective internal control over financial reporting was maintained in all material respects. Our audit included obtaining an understanding of internal control over financial reporting, assessing the risk that a material weakness exists, testing and evaluating the design and operating effectiveness of internal control based on the assessed risk, and performing such other procedures as we considered necessary in the circumstances. We believe that our audit provides a reasonable basis for our opinion.
A company's internal control over financial reporting is a process designed to provide reasonable assurance regarding the reliability of financial reporting and the preparation of financial statements for external purposes in accordance with generally accepted accounting principles. A company's internal control over financial reporting includes those policies and procedures that (1) pertain to the maintenance of records that, in reasonable detail, accurately and fairly reflect the transactions and dispositions of the assets of the company; (2) provide reasonable assurance that transactions are recorded as necessary to permit preparation of financial statements in accordance with generally accepted accounting principles, and that receipts and expenditures of the company are being made only in accordance with authorizations of management and directors of the company; and (3) provide reasonable assurance regarding prevention or timely detection of unauthorized acquisition, use, or disposition of the company's assets that could have a material effect on the financial statements.
Because of its inherent limitations, internal control over financial reporting may not prevent or detect misstatements. Also, projections of any evaluation of effectiveness to future periods are subject to the risk that controls may become inadequate because of changes in conditions, or that the degree of compliance with the policies or procedures may deteriorate.
In our opinion, Cheniere Energy, Inc. and subsidiaries maintained, in all material respects, effective internal control over financial reporting as of December 31, 2012, based on the COSO criteria.
We also have audited, in accordance with the standards of the Public Company Accounting Oversight Board (United States), the consolidated balance sheets of Cheniere Energy, Inc. and subsidiaries as of December 31, 2012 and 2011, and the related consolidated statements of operations, comprehensive loss, stockholders' (deficit) equity, and cash flows for each of the three years in the period ended December 31, 2012, and our report dated
February 22, 2013
expressed an unqualified opinion thereon.
|
|
|
/s/ ERNST & YOUNG LLP
|
|
Ernst & Young LLP
|
|
|
Houston, Texas
February 22, 2013
60
CHENIERE ENERGY, INC. AND SUBSIDIARIES
(in thousands, except share data)
|
|
December 31,
|
||||||
|
|
2012
|
2011
|
|||||
|
ASSETS
|
|
|
|||||
|
Current assets
|
|
|
|||||
|
Cash and cash equivalents
|
$
|
201,711
|
|
$
|
459,160
|
|
|
|
Restricted cash and cash equivalents
|
520,263
|
|
102,165
|
|
|||
|
Accounts and interest receivable
|
3,486
|
|
3,043
|
|
|||
|
LNG inventory
|
7,045
|
|
6,562
|
|
|||
|
Prepaid expenses and other
|
16,058
|
|
20,522
|
|
|||
|
Total current assets
|
748,563
|
|
591,452
|
|
|||
|
Non-current restricted cash and cash equivalents
|
272,924
|
|
82,892
|
|
|||
|
Property, plant and equipment, net
|
3,282,305
|
|
2,107,129
|
|
|||
|
Debt issuance costs, net
|
220,949
|
|
33,356
|
|
|||
|
Goodwill
|
76,819
|
|
76,819
|
|
|||
|
Intangible LNG assets
|
4,356
|
|
4,782
|
|
|||
|
Other
|
33,169
|
|
18,895
|
|
|||
|
Total assets
|
$
|
4,639,085
|
|
$
|
2,915,325
|
|
|
|
LIABILITIES AND STOCKHOLDERS' DEFICIT
|
|
|
|
|
|||
|
Current liabilities
|
|
|
|
|
|||
|
Accounts payable
|
$
|
74,360
|
|
$
|
1,103
|
|
|
|
Current debt, net of discount
|
—
|
|
492,724
|
|
|||
|
Accrued liabilities
|
58,737
|
|
63,074
|
|
|||
|
Deferred revenue
|
26,540
|
|
26,628
|
|
|||
|
Other
|
126
|
|
1,431
|
|
|||
|
Total current liabilities
|
159,763
|
|
584,960
|
|
|||
|
Long-term debt, net of discount
|
2,167,113
|
|
2,465,113
|
|
|||
|
Long-term debt-related parties, net of discount
|
—
|
|
9,598
|
|
|||
|
Non-current derivative liabilities
|
26,424
|
|
—
|
|
|||
|
Long-term deferred revenue
|
21,500
|
|
25,500
|
|
|||
|
Other non-current liabilities
|
2,680
|
|
3,146
|
|
|||
|
|
|
|
|||||
|
Commitments and contingencies
|
|
|
|
|
|||
|
Stockholders' equity (deficit)
|
|
|
|
|
|||
|
Preferred stock, $0.0001 par value, 5.0 million shares authorized, none issued
|
—
|
|
—
|
|
|||
|
Common stock, $0.003 par value
|
|
|
|
|
|||
|
Authorized: 480.0 million shares and 240.0 million shares at December 31, 2012 and 2011, respectively
|
|
|
|
|
|||
|
Issued and outstanding: 223.4 million and 129.5 million shares at December 31, 2012 and 2011, respectively
|
671
|
|
389
|
|
|||
|
Treasury stock: 4.7 million and 3.4 million shares at December 31, 2012 and 2011, respectively, at cost
|
(39,115
|
)
|
(20,195
|
)
|
|||
|
Additional paid-in-capital
|
2,168,781
|
|
898,702
|
|
|||
|
Accumulated deficit
|
(1,592,985
|
)
|
(1,260,205
|
)
|
|||
|
Accumulated other comprehensive loss
|
(27,351
|
)
|
(258
|
)
|
|||
|
Total stockholders' equity (deficit)
|
510,001
|
|
(381,567
|
)
|
|||
|
Non-controlling interest
|
1,751,604
|
|
208,575
|
|
|||
|
Total equity (deficit)
|
2,261,605
|
|
(172,992
|
)
|
|||
|
Total liabilities and equity (deficit)
|
$
|
4,639,085
|
|
$
|
2,915,325
|
|
|
The accompanying notes are an integral part of these consolidated financial statements.
61
CHENIERE ENERGY, INC. AND SUBSIDIARIES
(in thousands, except per share data)
|
|
Year Ended December 31,
|
||||||||||
|
|
2012
|
2011
|
2010
|
||||||||
|
Revenues
|
|||||||||||
|
LNG terminal revenues
|
$
|
265,894
|
|
$
|
274,272
|
|
$
|
269,538
|
|
||
|
Marketing and trading revenues
|
(1,172
|
)
|
13,554
|
|
19,022
|
|
|||||
|
Oil and gas sales
|
1,492
|
|
2,568
|
|
2,858
|
|
|||||
|
Other
|
6
|
|
50
|
|
95
|
|
|||||
|
Total revenues
|
266,220
|
|
290,444
|
|
291,513
|
|
|||||
|
|
|||||||||||
|
Operating costs and expenses
|
|||||||||||
|
General and administrative expense
|
152,081
|
|
88,427
|
|
68,626
|
|
|||||
|
Depreciation, depletion and amortization
|
66,407
|
|
63,405
|
|
63,251
|
|
|||||
|
LNG terminal and pipeline operating expense
|
57,076
|
|
39,101
|
|
42,415
|
|
|||||
|
LNG terminal and pipeline development expense
|
66,112
|
|
40,803
|
|
11,971
|
|
|||||
|
Other
|
376
|
|
562
|
|
627
|
|
|||||
|
Total operating costs and expenses
|
342,052
|
|
232,298
|
|
186,890
|
|
|||||
|
Income (loss) from operations
|
(75,832
|
)
|
58,146
|
|
104,623
|
|
|||||
|
Other income (expense)
|
|||||||||||
|
Interest expense, net
|
(200,811
|
)
|
(259,393
|
)
|
(262,046
|
)
|
|||||
|
Loss on early extinguishment of debt
|
(57,685
|
)
|
—
|
|
(50,320
|
)
|
|||||
|
Gain on sale of equity method investment
|
—
|
|
—
|
|
128,330
|
|
|||||
|
Derivative gain (loss)
|
58
|
|
(2,251
|
)
|
461
|
|
|||||
|
Other income (expense)
|
(11,367
|
)
|
320
|
|
558
|
|
|||||
|
Total other expense
|
(269,805
|
)
|
(261,324
|
)
|
(183,017
|
)
|
|||||
|
Loss before income taxes and non-controlling interest
|
(345,637
|
)
|
(203,178
|
)
|
(78,394
|
)
|
|||||
|
Income tax provision
|
(4
|
)
|
(160
|
)
|
—
|
|
|||||
|
Net loss
|
(345,641
|
)
|
(203,338
|
)
|
(78,394
|
)
|
|||||
|
Non-controlling interest
|
12,861
|
|
4,582
|
|
2,191
|
|
|||||
|
Net loss attributable to common stockholders
|
$
|
(332,780
|
)
|
$
|
(198,756
|
)
|
$
|
(76,203
|
)
|
||
|
|
|||||||||||
|
Net loss per share attributable to common stockholders - basic and diluted
|
$
|
(1.83
|
)
|
$
|
(2.60
|
)
|
$
|
(1.37
|
)
|
||
|
Weighted average number of common shares outstanding - basic and diluted
|
181,768
|
|
76,483
|
|
55,765
|
|
|||||
The accompanying notes are an integral part of these consolidated financial statements.
62
CHENIERE ENERGY, INC. AND SUBSIDIARIES
CONSOLIDATED STATEMENTS OF COMPREHENSIVE LOSS
(in thousands)
|
|
Year Ended December 31,
|
|||||||||||
|
|
2012
|
2011
|
2010
|
|||||||||
|
Net loss
|
$
|
(345,641
|
)
|
$
|
(203,338
|
)
|
$
|
(78,394
|
)
|
|||
|
Other comprehensive loss
|
||||||||||||
|
Interest rate cash flow hedges
|
||||||||||||
|
Loss on settlements retained in other comprehensive income
|
(136
|
)
|
—
|
|
—
|
|
||||||
|
Change in fair value of interest rate cash flow hedges
|
(27,104
|
)
|
—
|
|
—
|
|
||||||
|
Foreign currency translation
|
147
|
|
(85
|
)
|
(40
|
)
|
||||||
|
Total other comprehensive loss
|
(27,093
|
)
|
(85
|
)
|
(40
|
)
|
||||||
|
Comprehensive loss
|
(372,734
|
)
|
(203,423
|
)
|
(78,434
|
)
|
||||||
|
Comprehensive income attributable to non-controlling interest
|
12,861
|
|
4,582
|
|
2,191
|
|
||||||
|
Comprehensive loss attributable to common stockholders
|
$
|
(359,873
|
)
|
$
|
(198,841
|
)
|
$
|
(76,243
|
)
|
|||
The accompanying notes are an integral part of these consolidated financial statements.
63
CHENIERE ENERGY, INC. AND SUBSIDIARIES
CONSOLIDATED STATEMENTS OF STOCKHOLDERS’ (DEFICIT) EQUITY
(in thousands)
|
Total Stockholders' (Deficit) Equity
|
|||||||||||||||||||||||||||||||||
|
|
Common Stock
|
Treasury Stock
|
Additional Paid-in Capital
|
Accumulated Deficit
|
Accumulated Other Comprehensive Loss
|
Non- controlling Interest
|
Total
(Deficit) Equity
|
||||||||||||||||||||||||||
|
|
Shares
|
Amount
|
Shares
|
Amount
|
|||||||||||||||||||||||||||||
|
Balance—December 31, 2009
|
56,651
|
|
$
|
170
|
|
697
|
|
$
|
(1,494
|
)
|
$
|
336,971
|
|
$
|
(985,246
|
)
|
$
|
(133
|
)
|
$
|
217,605
|
|
$
|
(432,127
|
)
|
||||||||
|
Issuances of stock
|
10,125
|
|
31
|
|
—
|
|
—
|
|
49,278
|
|
—
|
|
—
|
|
—
|
|
49,309
|
|
|||||||||||||||
|
Issuances of restricted stock
|
1,751
|
|
4
|
|
—
|
|
—
|
|
(5
|
)
|
—
|
|
—
|
|
—
|
|
(1
|
)
|
|||||||||||||||
|
Forfeitures of restricted stock
|
(161
|
)
|
—
|
|
161
|
|
—
|
|
—
|
|
—
|
|
—
|
|
—
|
|
—
|
|
|||||||||||||||
|
Stock-based compensation
|
—
|
|
—
|
|
—
|
|
—
|
|
17,878
|
|
—
|
|
—
|
|
—
|
|
17,878
|
|
|||||||||||||||
|
Treasury stock acquired
|
(605
|
)
|
(1
|
)
|
605
|
|
(2,844
|
)
|
3
|
|
—
|
|
—
|
|
—
|
|
(2,842
|
)
|
|||||||||||||||
|
Comprehensive gain: Foreign currency translation
|
—
|
|
—
|
|
—
|
|
—
|
|
—
|
|
—
|
|
(40
|
)
|
—
|
|
(40
|
)
|
|||||||||||||||
|
Loss attributable to non-controlling interest
|
—
|
|
—
|
|
—
|
|
—
|
|
—
|
|
—
|
|
—
|
|
(2,191
|
)
|
(2,191
|
)
|
|||||||||||||||
|
Distribution to non-controlling interest
|
—
|
|
—
|
|
—
|
|
—
|
|
—
|
|
—
|
|
—
|
|
(26,393
|
)
|
(26,393
|
)
|
|||||||||||||||
|
Net loss
|
—
|
|
—
|
|
—
|
|
—
|
|
—
|
|
(76,203
|
)
|
—
|
|
—
|
|
(76,203
|
)
|
|||||||||||||||
|
Balance—December 31, 2010
|
67,761
|
|
204
|
|
1,463
|
|
(4,338
|
)
|
404,125
|
|
(1,061,449
|
)
|
(173
|
)
|
189,021
|
|
(472,610
|
)
|
|||||||||||||||
|
Issuances of stock
|
55,845
|
|
168
|
|
|
|
—
|
|
468,230
|
|
—
|
|
—
|
|
—
|
|
468,398
|
|
|||||||||||||||
|
Issuances of restricted stock
|
7,827
|
|
23
|
|
—
|
|
—
|
|
(23
|
)
|
—
|
|
—
|
|
—
|
|
—
|
|
|||||||||||||||
|
Forfeitures of restricted stock
|
(39
|
)
|
—
|
|
39
|
|
—
|
|
—
|
|
—
|
|
—
|
|
—
|
|
—
|
|
|||||||||||||||
|
Stock-based compensation
|
—
|
|
—
|
|
—
|
|
—
|
|
26,364
|
|
—
|
|
—
|
|
—
|
|
26,364
|
|
|||||||||||||||
|
Treasury stock acquired
|
(1,884
|
)
|
(6
|
)
|
1,884
|
|
(15,857
|
)
|
6
|
|
—
|
|
—
|
|
—
|
|
(15,857
|
)
|
|||||||||||||||
|
Comprehensive loss: Foreign currency translation
|
—
|
|
—
|
|
—
|
|
—
|
|
—
|
|
—
|
|
(85
|
)
|
—
|
|
(85
|
)
|
|||||||||||||||
|
Loss attributable to non-controlling interest
|
—
|
|
—
|
|
—
|
|
—
|
|
—
|
|
—
|
|
—
|
|
(4,582
|
)
|
(4,582
|
)
|
|||||||||||||||
|
Sale of common units to non-controlling interest
|
—
|
|
—
|
|
—
|
|
—
|
|
—
|
|
—
|
|
—
|
|
52,351
|
|
52,351
|
|
|||||||||||||||
|
Distribution to non-controlling interest
|
—
|
|
—
|
|
—
|
|
—
|
|
—
|
|
—
|
|
—
|
|
(28,215
|
)
|
(28,215
|
)
|
|||||||||||||||
|
Net loss
|
—
|
|
—
|
|
—
|
|
—
|
|
—
|
|
(198,756
|
)
|
—
|
|
—
|
|
(198,756
|
)
|
|||||||||||||||
|
Balance—December 31, 2011
|
129,510
|
|
389
|
|
3,386
|
|
(20,195
|
)
|
898,702
|
|
(1,260,205
|
)
|
(258
|
)
|
208,575
|
|
(172,992
|
)
|
|||||||||||||||
|
Issuances of stock
|
84,938
|
|
255
|
|
|
|
—
|
|
1,209,059
|
|
—
|
|
—
|
|
—
|
|
1,209,314
|
|
|||||||||||||||
|
Issuances of restricted stock
|
10,293
|
|
31
|
|
—
|
|
—
|
|
(31
|
)
|
—
|
|
—
|
|
—
|
|
—
|
|
|||||||||||||||
|
Forfeitures of restricted stock
|
(14
|
)
|
—
|
|
11
|
|
—
|
|
—
|
|
—
|
|
—
|
|
—
|
|
—
|
|
|||||||||||||||
|
Stock-based compensation
|
—
|
|
—
|
|
—
|
|
—
|
|
61,047
|
|
—
|
|
—
|
|
—
|
|
61,047
|
|
|||||||||||||||
|
Treasury stock acquired
|
(1,330
|
)
|
(4
|
)
|
1,330
|
|
(18,920
|
)
|
4
|
|
—
|
|
—
|
|
—
|
|
(18,920
|
)
|
|||||||||||||||
|
Foreign currency translation
|
—
|
|
—
|
|
—
|
|
—
|
|
—
|
|
—
|
|
147
|
|
—
|
|
147
|
|
|||||||||||||||
|
Interest rate cash flow hedges
|
—
|
|
—
|
|
—
|
|
—
|
|
—
|
|
—
|
|
(27,240
|
)
|
—
|
|
(27,240
|
)
|
|||||||||||||||
|
Loss attributable to non-controlling interest
|
—
|
|
—
|
|
—
|
|
—
|
|
—
|
|
—
|
|
—
|
|
(12,861
|
)
|
(12,861
|
)
|
|||||||||||||||
|
Sale of Class B units to non-controlling interest
|
—
|
|
—
|
|
—
|
|
—
|
|
—
|
|
—
|
|
—
|
|
1,387,339
|
|
1,387,339
|
|
|||||||||||||||
|
Sale of common units to non-controlling interest
|
—
|
|
—
|
|
—
|
|
—
|
|
—
|
|
—
|
|
—
|
|
204,878
|
|
204,878
|
|
|||||||||||||||
|
Distribution to non-controlling interest
|
—
|
|
—
|
|
—
|
|
—
|
|
—
|
|
—
|
|
—
|
|
(36,327
|
)
|
(36,327
|
)
|
|||||||||||||||
|
Net loss
|
—
|
|
—
|
|
—
|
|
—
|
|
—
|
|
(332,780
|
)
|
—
|
|
—
|
|
(332,780
|
)
|
|||||||||||||||
|
Balance—December 31, 2012
|
223,397
|
|
$
|
671
|
|
4,727
|
|
$
|
(39,115
|
)
|
$
|
2,168,781
|
|
$
|
(1,592,985
|
)
|
$
|
(27,351
|
)
|
$
|
1,751,604
|
|
$
|
2,261,605
|
|
||||||||
The accompanying notes are an integral part of these consolidated financial statements.
64
CHENIERE ENERGY, INC. AND SUBSIDIARIES
(in thousands)
|
|
Year Ended December 31,
|
||||||||||
|
|
2012
|
2011
|
2010
|
||||||||
|
Cash flows from operating activities
|
|||||||||||
|
Net loss
|
$
|
(332,780
|
)
|
$
|
(198,756
|
)
|
$
|
(76,203
|
)
|
||
|
Adjustments to reconcile net loss to net cash used in operating activities:
|
|||||||||||
|
Gain on sale of limited partnership investment
|
—
|
|
—
|
|
(128,330
|
)
|
|||||
|
Depreciation, depletion and amortization
|
66,407
|
|
63,405
|
|
63,251
|
|
|||||
|
Loss on early extinguishment of debt
|
16,565
|
|
—
|
|
50,320
|
|
|||||
|
Non-cash interest expense on 2008 Loans
|
—
|
|
19,636
|
|
32,523
|
|
|||||
|
Use of cash for accrued interest
|
—
|
|
—
|
|
(60,899
|
)
|
|||||
|
Amortization of debt issuance and discount costs
|
20,307
|
|
28,677
|
|
27,185
|
|
|||||
|
Non-cash compensation
|
58,696
|
|
26,364
|
|
17,839
|
|
|||||
|
Non-cash LNG inventory write-downs
|
—
|
|
10,992
|
|
264
|
|
|||||
|
Crest royalty
|
(11,732
|
)
|
—
|
|
—
|
|
|||||
|
Net loss attributable to non-controlling interest
|
(12,861
|
)
|
(4,582
|
)
|
(2,191
|
)
|
|||||
|
Use of restricted cash and cash equivalents
|
121,186
|
|
4,616
|
|
30,823
|
|
|||||
|
Other
|
(3,348
|
)
|
1,413
|
|
(7,095
|
)
|
|||||
|
Changes in operating assets and liabilities:
|
|
|
|||||||||
|
Accounts and interest receivable
|
704
|
|
1,463
|
|
466
|
|
|||||
|
Accounts payable and accrued liabilities
|
(29,295
|
)
|
28,857
|
|
3,035
|
|
|||||
|
LNG inventory
|
(483
|
)
|
(16,342
|
)
|
31,126
|
|
|||||
|
Deferred revenue
|
(4,089
|
)
|
(4,458
|
)
|
(3,864
|
)
|
|||||
|
Prepaid expenses and other
|
2,883
|
|
(4,049
|
)
|
4,830
|
|
|||||
|
Net cash used in operating activities
|
(107,840
|
)
|
(42,764
|
)
|
(16,920
|
)
|
|||||
|
|
|||||||||||
|
Cash flows from investing activities
|
|||||||||||
|
Proceeds from sale of limited partnership investment
|
—
|
|
—
|
|
104,330
|
|
|||||
|
Investment in Cheniere Partners
|
(545,144
|
)
|
(17,806
|
)
|
—
|
|
|||||
|
LNG terminal and pipeline costs, net
|
(1,117,956
|
)
|
(8,934
|
)
|
(4,223
|
)
|
|||||
|
Use of restricted cash and cash equivalents
|
1,587,495
|
|
8,222
|
|
5,350
|
|
|||||
|
Distributions from limited partnership investment
|
—
|
|
—
|
|
3,900
|
|
|||||
|
Other
|
(8,929
|
)
|
(3,613
|
)
|
(371
|
)
|
|||||
|
Net cash provided by (used in) investing activities
|
(84,534
|
)
|
(22,131
|
)
|
108,986
|
|
|||||
|
|
|||||||||||
|
Cash flows from financing activities
|
|||||||||||
|
Proceeds from sales of Class B units by Cheniere Partners
|
1,387,342
|
|
—
|
|
—
|
|
|||||
|
Proceeds from sale of common stock, net
|
1,200,705
|
|
468,598
|
|
—
|
|
|||||
|
Proceeds from 2020 Notes
|
420,000
|
|
—
|
|
—
|
|
|||||
|
Proceeds from Liquefaction Credit Facility
|
100,000
|
|
—
|
|
—
|
|
|||||
|
Proceeds from sale of common units by Cheniere Partners
|
204,878
|
|
52,351
|
|
—
|
|
|||||
|
Repurchases and prepayments of debt
|
(1,326,514
|
)
|
—
|
|
(104,681
|
)
|
|||||
|
Use of (investment in) restricted cash and cash equivalents
|
(1,771,666
|
)
|
(24,136
|
)
|
29,073
|
|
|||||
|
Debt issuance and deferred financing costs
|
(223,079
|
)
|
(4,341
|
)
|
(1,432
|
)
|
|||||
|
Distributions to non-controlling interest
|
(36,327
|
)
|
(28,215
|
)
|
(26,393
|
)
|
|||||
|
Purchase of treasury shares
|
(20,414
|
)
|
(14,363
|
)
|
(2,844
|
)
|
|||||
|
Net cash provided by (used in) financing activities
|
(65,075
|
)
|
449,894
|
|
(106,277
|
)
|
|||||
|
|
|||||||||||
|
Net increase (decrease) in cash and cash equivalents
|
(257,449
|
)
|
384,999
|
|
(14,211
|
)
|
|||||
|
Cash and cash equivalents—beginning of period
|
459,160
|
|
74,161
|
|
88,372
|
|
|||||
|
Cash and cash equivalents—end of period
|
$
|
201,711
|
|
$
|
459,160
|
|
$
|
74,161
|
|
||
The accompanying notes are an integral part of these consolidated financial statements.
65
CHENIERE ENERGY, INC. AND SUBSIDIARIES
NOTES TO CONSOLIDATED FINANCIAL STATEMENTS
Cheniere Energy, Inc., a Delaware corporation, is a Houston-based energy company primarily engaged in liquefied natural gas ("LNG") related businesses. We own and operate the Sabine Pass liquefied natural gas ("LNG") terminal in Louisiana through our
59.5%
ownership interest in and management agreements with Cheniere Energy Partners, L.P. ("Cheniere Partners") (NYSE MKT: CQP), which is a publicly traded partnership that we created in 2007. The Sabine Pass LNG terminal is located on the Sabine Pass deep water shipping channel less than four miles from the Gulf Coast. The Sabine Pass LNG terminal has regasification facilities owned by Cheniere Partners' wholly owned subsidiary, Sabine Pass LNG, L.P. ("Sabine Pass LNG") that includes existing infrastructure of five LNG storage tanks with capacity of approximately
16.9
Bcfe, two docks that can accommodate vessels of up to
265,000
cubic meters and vaporizers with regasification capacity of approximately
4.0
Bcf/d. Cheniere Partners is developing natural gas liquefaction facilities (the "Liquefaction Project") at the Sabine Pass LNG terminal adjacent to the existing regasification facilities through a wholly owned subsidiary, Sabine Pass Liquefaction, LLC ("Sabine Pass Liquefaction"). We plan to construct up to six Trains (each in sequence, "Train 1", "Train 2", "Train 3", "Train 4", "Train 5" and "Train 6"), which are in various stages of development. Each Train has a nominal production capacity of approximately
4.5
mmtpa.
We also own and operate the Creole Trail Pipeline, which interconnects the Sabine Pass LNG terminal with natural gas markets in North America. Approximately one-half of the receiving capacity at the Sabine Pass LNG terminal is contracted to two multinational energy companies. One of our subsidiaries, Cheniere Marketing, LLC ("Cheniere Marketing"), is marketing LNG and natural gas on its own behalf and on behalf of Cheniere Partners, in an effort to monetize the other half of the LNG receiving capacity at the Sabine Pass LNG terminal during construction of the Liquefaction Project.
We are in various stages of developing other projects, including LNG terminal and associated pipeline related projects, each of which, among other things, will require acceptable commercial and financing arrangements before we make a final investment decision.
Unless the context requires otherwise, references to the "Company", "Cheniere", "we", "us" and "our" refer to Cheniere Energy, Inc. and its subsidiaries, including our publicly traded subsidiary partnership, Cheniere Partners.
Basis of Presentation
Our Consolidated Financial Statements were prepared in accordance with accounting principles generally accepted in the United States of America ("GAAP"). The consolidated financial statements include the accounts of Cheniere Energy, Inc. and its majority-owned subsidiaries. All significant intercompany accounts and transactions have been eliminated in consolidation.
Certain reclassifications have been made to conform prior period information to the current presentation. The reclassifications had no effect on our overall consolidated financial position, results of operations or cash flows.
Cash and Cash Equivalents
We consider all highly liquid investments with an original maturity of
three
months or less to be cash equivalents. Our investments are primarily in commercial paper and are made in accordance with corporate policy, which, among other things, stipulates minimum acceptable credit ratings of commercial paper issuers.
Accounting for LNG Activities
Generally, we begin capitalizing the costs of our LNG terminals and related pipelines once the individual project meets the following criteria: (i) regulatory approval has been received, (ii) financing for the project is available and (iii) management has committed to commence construction. Prior to meeting these criteria, most of the costs associated with a project are expensed as incurred. These costs primarily include professional fees associated with front-end engineering and design work, costs of securing necessary regulatory approvals, and other preliminary investigation and development activities related to our LNG terminals and related pipelines.
66
CHENIERE ENERGY, INC. AND SUBSIDIARIES
NOTES TO CONSOLIDATED FINANCIAL STATEMENTS—Continued
Generally, costs that are capitalized prior to a project meeting the criteria otherwise necessary for capitalization include land costs that are capitalized as property, plant and equipment and certain permits that are capitalized as intangible LNG assets.
We capitalize interest and other related debt costs during the construction period of our LNG terminal. Upon commencement of operations, capitalized interest, as a component of the total cost, will be amortized over the estimated useful life of the asset.
Revenue Recognition
LNG regasification capacity reservation fees are recognized as revenue over the term of the respective terminal use agreements ("TUAs"). Advance capacity reservation fees are initially deferred and amortized over a
10
-year period as a reduction of a customer’s regasification capacity reservation fees payable under its TUA. The retained
2%
of LNG delivered for each customer’s account at the Sabine Pass LNG terminal is recognized as revenues as Sabine Pass LNG, L.P. ("Sabine Pass LNG"), a subsidiary of Cheniere Partners, performs the services set forth in each customer’s TUA.
LNG and Natural Gas Marketing
We have determined that our LNG and natural gas marketing business activities are energy trading and risk management activities for trading purposes and have elected to present these activities on a net basis on our Consolidated Statements of Operations. Marketing and trading revenues represent the margin earned on the purchase and transportation of LNG purchases and subsequent sales of natural gas to third parties. These energy trading and risk management activities include, but are not limited to: purchase of LNG and natural gas, transportation contracts, and derivatives. Below is a brief description of our accounting treatment of each type of energy trading and risk management activity and how we account for it:
Purchase of LNG and natural gas
The purchase value of LNG or natural gas inventory is recorded as an asset on our Consolidated Balance Sheets at the cost to acquire the product. Our inventory is subject to lower of cost or market adjustment each quarter. Recoveries of losses resulting from interim period lower of cost or market adjustments are made due to market price recoveries on the same inventory in the same fiscal year and are recognized as gains in later interim periods with such gains not exceeding previously recognized losses. Any adjustment to our inventory is recorded on a net basis as LNG and natural gas marketing revenue on our Consolidated Statements of Operations.
Transportation contracts
We enter into transportation contracts with respect to the transport of LNG or natural gas to a specific location for storage or sale. Transportation costs that are incurred during the purchase of LNG or natural gas are capitalized as part of the acquisition costs of the product. Transportation costs incurred to sell LNG or natural gas are recorded on a net basis as LNG and natural gas marketing revenue on our Consolidated Statements of Operations.
LNG Inventory Derivatives
We use derivative instruments to hedge cash flows attributable to the future sale of LNG inventory. Gains and losses in positions to hedge the cash flows attributable to the future sale of LNG inventory are classified as marketing and trading revenues on our Consolidated Statements of Operations.
Derivatives
We use derivative instruments from time to time to hedge the exposure to variability in expected future cash flows attributable to the future sale of our LNG inventory, to hedge the exposure to price risk attributable to future purchases of natural gas to be utilized as fuel to operate the Sabine Pass LNG terminal, and to hedge the exposure to volatility in a portion of the floating-rate interest payments under the Liquefaction Credit Facility. We do not offset the fair value amounts of our LNG inventory, fuel and interest rate derivatives, and collateral deposited for such contracts are not netted within the derivative fair value. We have disclosed certain information regarding these derivative positions, including the fair value of our derivative positions, in
Note 11—"Financial Instruments"
of our Notes to Consolidated Financial Statements.
67
CHENIERE ENERGY, INC. AND SUBSIDIARIES
NOTES TO CONSOLIDATED FINANCIAL STATEMENTS—Continued
Accounting guidance for derivative instruments and hedging activities establishes accounting and reporting standards requiring that derivative instruments be recorded at fair value and included in the consolidated balance sheet as assets or liabilities. The accounting for changes in the fair value of a derivative instrument depends on the intended use of the derivative and the resulting designation, which is established at the inception of a derivative. We record changes in the fair value of our derivative positions based on the value for which the derivative instrument could be exchanged between willing parties. To date, all of our derivative positions fair value determinations have been made by management using quoted prices in active markets for similar assets or liabilities. The ultimate fair value of our derivative instruments is uncertain, and we believe that it is possible that a change in the estimated fair value will occur in the near future as commodity prices and interest rates change.
Changes in fair value of contracts that do not qualify as hedges or are not designated as hedges are recognized currently in earnings. Gains and losses in positions to hedge the cash flows attributable to the future sale of LNG inventory are classified as marketing and trading revenues on our Consolidated Statements of Operations. Gains or losses in the positions to mitigate the price risk from future purchases of natural gas to be utilized as fuel to operate the Sabine Pass LNG terminal are classified as derivative gain (loss) on our Consolidated Statements of Operations.
We have elected cash flow hedge accounting for derivatives that we use to hedge the exposure to volatility in floating-rate interest payments. Changes in fair value of derivative instruments designated as cash flow hedges, to the extent the hedge is effective, are recognized in accumulated other comprehensive loss on our Consolidated Balance Sheets. We reclassify gains and losses on the hedges from accumulated other comprehensive loss into interest expense in our Consolidated Statements of Operations as the hedged item is recognized. Any change in the fair value resulting from ineffectiveness is recognized immediately as derivative gain (loss) on our Consolidated Statements of Operations. We use regression analysis to determine whether we expect a derivative to be highly effective as a cash flow hedge prior to electing hedge accounting and also to determine whether all derivatives designated as cash flow hedges have been effective. We perform these effectiveness tests prior to designation for all new hedges and on a quarterly basis for all existing hedges. We calculate the actual amount of ineffectiveness on our cash flow hedges using the "dollar offset" method, which compares changes in the expected cash flows of the hedged transaction to changes in the value of expected cash flows from the hedge. We discontinue hedge accounting when our effectiveness tests indicate that a derivative is no longer highly effective as a hedge; when the derivative expires or is sold, terminated or exercised; when the hedged item matures, is sold or repaid; or when we determine that the occurrence of the hedged forecasted transaction is not probable. When we discontinue hedge accounting but continue to hold the derivative, we begin to apply mark-to-market accounting at that time.
Fair Value of Financial Instruments
The carrying amounts of cash and cash equivalents, restricted cash and cash equivalents, restricted certificates of deposit, accounts receivable, and accounts payable approximate fair value because of the short maturity of those instruments. We use available market data and valuation methodologies to estimate the fair value of debt.
Concentration of Credit Risk
Financial instruments that potentially subject us to a concentration of credit risk consist principally of cash and cash equivalents and restricted cash. We maintain cash balances at financial institutions, which may at times be in excess of federally insured levels. We have not incurred losses related to these balances to date.
The use of derivative instruments exposes us to counterparty credit risk, or the risk that a counterparty will be unable to meet its commitments. Our commodity derivative transactions are executed through over-the-counter contracts which are subject to nominal credit risk as these transactions are settled on a daily margin basis with investment grade financial institutions. Collateral deposited for such contracts is recorded as an other current asset and not netted within the derivative fair value. Our interest rate derivative instruments are placed with investment grade financial institutions whom we believe are acceptable credit risks. We monitor counterparty creditworthiness on an ongoing basis; however, we cannot predict sudden changes in counterparties’ creditworthiness. In addition, even if such changes are not sudden, we may be limited in our ability to mitigate an increase in counterparty credit risk. Should one of these counterparties not perform, we may not realize the benefit of some of our derivative instruments.
68
CHENIERE ENERGY, INC. AND SUBSIDIARIES
NOTES TO CONSOLIDATED FINANCIAL STATEMENTS—Continued
Regulated Natural Gas Pipelines
Our natural gas pipeline is subject to the jurisdiction of the Federal Energy Regulatory Commission ("FERC") in accordance with the Natural Gas Act of 1938 and the Natural Gas Policy Act of 1978. The economic effects of regulation can result in a regulated company recording as assets those costs that have been or are expected to be approved for recovery from customers, or recording as liabilities those amounts that are expected to be required to be returned to customers, in a rate-setting process in a period different from the period in which the amounts would be recorded by an unregulated enterprise. Accordingly, we record assets and liabilities that result from the regulated rate-making process that may not be recorded under accounting principles generally accepted in the United States of America ("GAAP") for non-regulated entities. We continually assess whether regulatory assets are probable of future recovery by considering factors such as applicable regulatory changes and recent rate orders applicable to other regulated entities. Based on this continual assessment, we believe the existing regulatory assets are probable of recovery. These regulatory assets and liabilities are primarily classified in the Consolidated Balance Sheets as other assets and other liabilities. We periodically evaluate their applicability under GAAP, and consider factors such as regulatory changes and the effect of competition. If cost-based regulation ends or competition increases, we may have to reduce our asset balances to reflect a market basis less than cost and write-off the associated regulatory assets and liabilities.
Items that may influence our assessment are:
|
•
|
inability to recover cost increases due to rate caps and rate case moratoriums;
|
|
•
|
inability to recover capitalized costs, including an adequate return on those costs through the rate-making process and the FERC proceedings;
|
|
•
|
excess capacity;
|
|
•
|
increased competition and discounting in the markets we serve; and
|
|
•
|
impacts of ongoing regulatory initiatives in the natural gas industry.
|
Natural gas pipeline costs include amounts capitalized as an Allowance for Funds Used During Construction ("AFUDC"). The rates used in the calculation of AFUDC are determined in accordance with guidelines established by the FERC. AFUDC represents the cost of debt and equity funds used to finance our natural gas pipeline additions during construction. AFUDC is capitalized as a part of the cost of our natural gas pipelines. Under regulatory rate practices, we generally are permitted to recover AFUDC, and a fair return thereon, through our rate base after our natural gas pipelines are placed in service.
Property, Plant and Equipment
Property, plant and equipment are recorded at cost. Expenditures for construction activities, major renewals and betterments are capitalized, while expenditures for maintenance and repairs and general and administrative activities are charged to expense as incurred. Interest costs incurred on debt obtained for the construction of property, plant and equipment are capitalized as construction-in-process over the construction period or related debt term, whichever is shorter. We depreciate our property, plant and equipment using the straight-line depreciation method. Upon retirement or other disposition of property, plant and equipment, the cost and related accumulated depreciation are removed from the account, and the resulting gains or losses are recorded in operations.
Management reviews property, plant and equipment for impairment periodically and whenever events or changes in circumstances have indicated that the carrying amount of property, plant and equipment might not be recoverable. We have recorded no significant impairments related to property, plant and equipment for
2012
,
2011
or
2010
.
69
CHENIERE ENERGY, INC. AND SUBSIDIARIES
NOTES TO CONSOLIDATED FINANCIAL STATEMENTS—Continued
Income Taxes
Provisions for income taxes are based on taxes payable or refundable for the current year and deferred taxes on temporary differences between the tax basis of assets and liabilities and their reported amounts in the consolidated financial statements. Deferred tax assets and liabilities are included in the consolidated financial statements at currently enacted income tax rates applicable to the period in which the deferred tax assets and liabilities are expected to be realized or settled. As changes in tax laws or rates are enacted, deferred tax assets and liabilities are adjusted through the current period's provision for income taxes. A valuation allowance is provided for deferred tax assets if it is more likely than not that such asset will not be realized.
Use of Estimates
The preparation of consolidated financial statements in conformity with GAAP requires management to make certain estimates and assumptions that affect the amounts reported in the consolidated financial statements and the accompanying notes. Actual results could differ from the estimates and assumptions used.
Estimates used in the assessment of impairment of our long-lived assets, including goodwill, are the most significant of our estimates. There are numerous uncertainties inherent in estimating future cash flows of assets or business segments. The accuracy of any cash flow estimate is a function of judgment used in determining the amount of cash flows generated. As a result, cash flows may be different from the cash flows that we use to assess impairment of our assets. Management reviews its estimates of cash flows on an ongoing basis using historical experience and other factors, including the current economic and commodity price environment. Significant negative industry or economic trends, including a significant decline in the market price of our common stock, reduced estimates of future cash flows for our business segments or disruptions to our business could lead to an impairment charge of our long-lived assets, including goodwill and other intangible assets. Our valuation methodology for assessing impairment requires management to make judgments and assumptions based on historical experience and to rely heavily on projections of future operating performance. Projections of future operating results and cash flows may vary significantly from results. In addition, if our analysis results in an impairment of our long-lived assets, including goodwill, we may be required to record a charge to earnings in our consolidated financial statements during a period in which such impairment is determined to exist, which may negatively impact our results of operations.
Other items subject to estimates and assumptions include asset retirement obligations, valuation allowances for net deferred tax assets, valuations of derivative instruments, valuations of noncash compensation and collectability of accounts receivable and other assets.
As future events and their effects cannot be determined accurately, actual results could differ significantly from our estimates.
Goodwill
Goodwill represents the excess of cost over fair value of the assets of businesses acquired. The goodwill on our Consolidated Balance Sheets as of
December 31, 2012
and
2011
is associated with our LNG terminal reporting unit. We determine our reporting units by identifying each unit that engaged in business activities from which it may earn revenues and incur expenses, had operating results regularly reviewed by the entities' chief operating decision makers for purposes of resource allocation and performance assessment, and had discrete financial information.
Goodwill is assessed for impairment whenever events or circumstances indicate that impairment of the carrying value of goodwill is likely, but no less often than annually. During the fourth quarters of
2012
and
2011
, we performed a qualitative assessment of goodwill in accordance with FASB guidance which permits an entity to first assess qualitative factors to determine whether it is more likely than not that the fair value of a reporting unit is less than its carrying amount as a basis for determining whether it is necessary to perform the two-step goodwill impairment test. If we fail the qualitative test, then we must compare our management's estimate of the fair value of a reporting unit with its carrying value, including goodwill. If the carrying value of the reporting unit exceeds its fair value, a computation of the implied fair value of the goodwill is compared with its related carrying value. If the carrying value of the reporting unit goodwill exceeds the implied fair value of that goodwill, an impairment loss is recognized in the amount of the excess.
70
CHENIERE ENERGY, INC. AND SUBSIDIARIES
NOTES TO CONSOLIDATED FINANCIAL STATEMENTS—Continued
The annual reviews of goodwill in
2012
and
2011
did not result in impairment charges. The fair value of the reporting unit substantially exceeds its carrying value for both periods and it was not "more likely than not" that the fair value of our LNG terminal segment was less than its carrying value. As discussed above regarding our use of estimates, our judgments and assumptions are inherent in our management’s estimate of future cash flows used to determine the estimate of the reporting unit’s fair value. The use of alternate judgments and/or assumptions could result in the recognition of different levels of impairment charges in the consolidated financial statements.
Debt Issuance Costs
Debt issuance costs consist primarily of arrangement fees, professional fees, legal fees and printing costs. These costs are capitalized and are being amortized to interest expense over the term of the related debt facility.
Share-Based Compensation Expense
We recognize compensation expense for all share-based payments using the Black-Scholes-Merton option valuation model. We recognize share-based compensation net of an estimated forfeiture rate and only recognize compensation cost for those shares expected to vest on a straight-line or accelerated basis over the requisite service period of the award.
Determining the appropriate fair value model and calculating the fair value of share-based payment awards requires the use of highly subjective assumptions, including the expected life of the share-based payment awards and stock price volatility. We believe that implied volatility, calculated based on traded options of our common stock, combined with historical volatility is an appropriate indicator of expected volatility and future stock price trends. Therefore, the expected volatility for the
years ended
December 31, 2012
and
2011
used in our fair value model was based on a combination of implied and historical volatilities. The assumptions used in calculating the fair value of share-based payment awards represent our best estimates, but these estimates involve inherent uncertainties and the application of management's judgment. As a result, if factors change and we use different assumptions, our share-based compensation expense could be materially different in the future. In addition, we are required to estimate the expected forfeiture rate and only recognize expense for those shares expected to vest. If our actual forfeiture rate is materially different from our estimate, future share-based compensation expense could be significantly different from what we have recorded in the current period (See
Note 14—"Share-Based Compensation"
of our Notes to Consolidated Financial Statements).
Net Loss Per Share
Net loss per share ("EPS") is computed in accordance with GAAP. Basic EPS excludes dilution and is computed by dividing net income (loss) by the weighted average number of common shares outstanding during the period. Diluted EPS reflects potential dilution and is computed by dividing net income by the weighted average number of common shares outstanding during the period increased by the number of additional common shares that would have been outstanding if the potential common shares had been issued. Basic and diluted EPS for all periods presented are the same since the effect of our options and unvested stock is anti-dilutive to our net loss per share. Stock options, warrants and unvested stock representing securities that could potentially dilute basic EPS in the future that were not included in the diluted computation because they would have been anti-dilutive for the years
2012
,
2011
and
2010
, were
4.4 million
shares,
2.4 million
shares and
5.8 million
shares, respectively. Common shares of
7.5 million
on a weighted average basis, issuable upon conversion of the 2008 Loans and the Convertible Senior Unsecured Notes (described in
Note 9—"Debt and Debt—Related Parties"
), were not included in the computation of diluted net loss per share for 2011 and 2010, because the computation of diluted net loss per share utilizing the "if-converted" method would be anti-dilutive. No adjustments were made to reported net loss in the computation of EPS.
71
CHENIERE ENERGY, INC. AND SUBSIDIARIES
NOTES TO CONSOLIDATED FINANCIAL STATEMENTS—Continued
Asset Retirement Obligations
We recognize asset retirement obligations ("AROs") for legal obligations associated with the retirement of long-lived assets that result from the acquisition, construction, development and/or normal use of the asset and for conditional AROs in which the timing or method of settlement are conditional on a future event that may or may not be within our control. The fair value of a liability for an ARO is recognized in the period in which it is incurred, if a reasonable estimate of fair value can be made. The fair value of the liability is added to the carrying amount of the associated asset. This additional carrying amount is depreciated over the estimated useful life of the asset. Our recognition of asset retirement obligations is described below:
Currently, the Sabine Pass LNG terminal is our only constructed and operating LNG terminal. Based on the real property lease agreements at the Sabine Pass LNG terminal, at the expiration of the term of the leases we are required to surrender the LNG terminal in good working order and repair, with normal wear and tear and casualty expected. Our property lease agreements at the Sabine Pass LNG terminal have terms of up to
90 years
including renewal options. We have determined that the cost to surrender the Sabine Pass LNG terminal in good order and repair, with normal wear and tear and casualty expected, is zero. Therefore, we have not recorded an asset retirement obligation associated with the Sabine Pass LNG terminal.
Currently, the Creole Trail Pipeline is our only constructed and operating natural gas pipeline. We believe that it is not feasible to predict when the natural gas transportation services provided by the Creole Trail Pipeline will no longer be utilized. In addition, our right-of-way agreements associated with the Creole Trail Pipeline have no stipulated termination dates. Therefore, we have concluded that due to advanced technology associated with current natural gas pipelines and our intent to operate the Creole Trail Pipeline as long as supply and demand for natural gas exists in the United States, we have not recorded an ARO associated with the Creole Trail Pipeline.
Recent Accounting Standards Not Yet Adopted
We have also considered all other newly issued accounting guidance that is applicable to our operations and the preparation of our consolidated financial statements, including that which is not yet effective. We do not believe that any such guidance will have a material impact on our consolidated financial position, results of operations or cash flows.
Restricted cash and cash equivalents consists of cash and cash equivalents that are contractually restricted as to usage or withdrawal, as follows:
Senior Notes Debt Service Reserve
Sabine Pass LNG has consummated private offerings of an aggregate principal amount of
$2,215.5 million
of
2013 Notes
and
2016 Notes
and
$420.0 million
of
2020 Notes
(See
Note 9—"Debt and Debt—Related Parties"
). Collectively, the
2013 Notes
,
2016 Notes
, and
2020 Notes
are referred to as the "Senior Notes." Under the indentures governing the Senior Notes (the "Sabine Pass Indentures"), except for permitted tax distributions, Sabine Pass LNG may not make distributions until certain conditions are satisfied, including that there must be on deposit in an interest payment account an amount equal to one-sixth of the semi-annual interest payment multiplied by the number of elapsed months since the last semi-annual interest payment and there must be on deposit in a permanent debt service reserve fund an amount equal to one semi-annual interest payment. Distributions are permitted only after satisfying the foregoing funding requirements, a fixed charge coverage ratio test of
2
:1 and other conditions specified in the Sabine Pass Indentures.
As of
December 31, 2012
and
2011
, we classified
$17.4 million
and
$13.7 million
, respectively, as current restricted cash and cash equivalents for the payment of interest due within
twelve months
. As of
December 31, 2012
and
2011
, we classified the permanent debt service reserve fund of
$76.1 million
and
$82.4 million
, respectively, as non-current restricted cash and cash equivalents. These cash accounts are controlled by a collateral trustee, and, therefore, are shown as restricted cash and cash equivalents on our Consolidated Balance Sheets.
72
CHENIERE ENERGY, INC. AND SUBSIDIARIES
NOTES TO CONSOLIDATED FINANCIAL STATEMENTS—Continued
Liquefaction Reserve
In
July 2012
, Sabine Pass Liquefaction closed on a
$3.6 billion
senior secured credit facility (the "Liquefaction Credit Facility"). Under the terms and conditions of the Liquefaction Credit Facility, Sabine Pass Liquefaction is required to deposit all cash received into reserve accounts controlled by a collateral trustee. Therefore, all of Sabine Pass Liquefaction's cash and cash equivalents are shown as restricted cash and cash equivalents on our Consolidated Balance Sheets. As of
December 31, 2012
, we classified
$100.0 million
as non-current restricted cash and cash equivalents held by Sabine Pass Liquefaction as such funds are to be used to acquire non-current assets. As of
December 31, 2012
, we classified
$75.1 million
as current restricted cash and cash equivalents held by Sabine Pass Liquefaction as such funds are to be used to pay for current liabilities. As of
December 31, 2012
, we classified
$96.3 million
as non-current restricted cash and cash equivalents held by Sabine Pass Liquefaction as such funds are to be used to pay for the Liquefaction Project.
Other Restricted Cash and Cash Equivalents
As of
December 31, 2012
and
2011
,
$419.3 million
and
$81.4 million
, respectively, of current restricted cash and cash equivalents were primarily related to cash and cash equivalents held by Sabine Pass LNG and Cheniere Partners that were considered restricted to Cheniere. As of
December 31, 2012
and
2011
,
$8.5 million
and
$6.4 million
, respectively, had been classified as current restricted cash and cash equivalents on our Consolidated Balance Sheets due to various other contractual restrictions. As of
December 31, 2012
and
December 31, 2011
,
$0.5 million
had been classified as non-current restricted cash and cash equivalents due to various other contractual restrictions on our Consolidated Balance Sheets.
LNG inventory is recorded at cost and is subject to lower of cost or market ("LCM") adjustments at the end of each period. LNG inventory cost is determined using the average cost method. Recoveries of losses resulting from interim period LCM adjustments are recorded when market price recoveries occur on the same inventory in the same fiscal year. These recoveries are recognized as gains in later interim periods with such gains not exceeding previously recognized losses. As of
December 31, 2012
, we had
2,298,000
MMBtu of LNG inventory recorded at
$7.0 million
, and as of
December 31, 2011
, we had
1,995,000
MMBtu of LNG inventory recorded at
$6.6 million
on our Consolidated Balance Sheets. During the years ended
December 31, 2012
,
2011
and
2010
, we recognized
$20.4 million
,
$11.0 million
and
$0.3 million
, respectively, as a result of LCM adjustments to our LNG inventory.
73
CHENIERE ENERGY, INC. AND SUBSIDIARIES
NOTES TO CONSOLIDATED FINANCIAL STATEMENTS—Continued
Property, plant and equipment consists of LNG terminal and natural gas pipeline costs,, investments in oil and gas properties, and fixed assets, as follows (in thousands):
|
|
December 31,
|
||||||
|
|
2012
|
2011
|
|||||
|
LNG terminal costs
|
|
|
|||||
|
LNG terminal
|
$
|
1,651,106
|
|
$
|
1,647,107
|
|
|
|
LNG terminal construction-in-process
|
1,267,371
|
|
39,010
|
|
|||
|
LNG site and related costs, net
|
5,398
|
|
4,982
|
|
|||
|
Accumulated depreciation
|
(167,472
|
)
|
(125,108
|
)
|
|||
|
Total LNG terminal costs, net
|
$
|
2,756,403
|
|
$
|
1,565,991
|
|
|
|
Natural gas pipeline costs
|
|
|
|
|
|||
|
Natural gas pipeline
|
$
|
564,034
|
|
$
|
564,021
|
|
|
|
Natural gas pipeline construction-in-process
|
2,427
|
|
2,427
|
|
|||
|
Pipeline right-of-ways
|
18,455
|
|
18,455
|
|
|||
|
Accumulated depreciation
|
(67,803
|
)
|
(52,878
|
)
|
|||
|
Total natural gas pipeline costs, net
|
$
|
517,113
|
|
$
|
532,025
|
|
|
|
Oil and gas properties, successful efforts method
|
|
|
|
|
|||
|
Proved
|
$
|
3,917
|
|
$
|
4,170
|
|
|
|
Accumulated depreciation, depletion and amortization
|
(3,209
|
)
|
(3,033
|
)
|
|||
|
Total oil and gas properties, net
|
$
|
708
|
|
$
|
1,137
|
|
|
|
Fixed assets
|
|
|
|
|
|||
|
Computer and office equipment
|
$
|
7,014
|
|
$
|
5,952
|
|
|
|
Furniture and fixtures
|
4,057
|
|
4,057
|
|
|||
|
Computer software
|
13,012
|
|
12,601
|
|
|||
|
Leasehold improvements
|
6,989
|
|
7,318
|
|
|||
|
Other
|
2,927
|
|
1,892
|
|
|||
|
Accumulated depreciation
|
(25,918
|
)
|
(23,844
|
)
|
|||
|
Total fixed assets, net
|
$
|
8,081
|
|
$
|
7,976
|
|
|
|
Property, plant and equipment, net
|
$
|
3,282,305
|
|
$
|
2,107,129
|
|
|
LNG Terminal Costs
Depreciation expense related to the Sabine Pass LNG terminal totaled
$42.1
million,
$42.6
million and
$41.8
million for the years ended
December 31, 2012
,
2011
and
2010
, respectively.
The Sabine Pass LNG terminal is depreciated using the straight-line depreciation method applied to groups of LNG terminal assets with varying useful lives. The identifiable components of the Sabine Pass LNG terminal with similar estimated useful lives have a depreciable range between
15
and
50
years, as follows:
|
Components
|
Useful life (yrs)
|
|
|
LNG storage tanks
|
50
|
|
|
Marine berth, electrical, facility and roads
|
35
|
|
|
Regasification processing equipment (recondensers, vaporization, and vents)
|
30
|
|
|
Sendout pumps
|
20
|
|
|
Other
|
15-30
|
|
74
CHENIERE ENERGY, INC. AND SUBSIDIARIES
NOTES TO CONSOLIDATED FINANCIAL STATEMENTS—Continued
In June 2012, Train 1 and Train 2 of the Liquefaction Project satisfied the criteria for capitalization. Accordingly, costs associated with the construction of Train 1 and Train 2 of the Liquefaction Project have been recorded as construction-in-process since that date. For the year ended
December 31, 2012
, we capitalized
$35.1 million
of interest expense related to the construction of Train 1 and Train 2 of the Liquefaction Project.
In March 2006, our Corpus Christi LNG terminal project satisfied the criteria for capitalization for certain site work that improved the associated land. Accordingly, costs associated with the initial site work for the Corpus Christi LNG terminal have been capitalized. As of December 31,
2012
,
$35.5 million
of costs associated with the initial site work for the Corpus Christi LNG terminal were capitalized as LNG terminal construction-in-process. As noted in
Note 2—"Summary of Significant Accounting Policies,"
management reviews property, plant and equipment for impairment periodically and whenever events or changes in circumstances have indicated that the carrying amount of property, plant and equipment might not be recoverable. Management’s assessment is based on certain estimates and assumptions used to determine if impairment is warranted. If the estimates and assumptions used are determined to be different in the future, the amount capitalized may be subject to impairment.
Natural Gas Pipeline Costs
Our natural gas pipeline is subject to the jurisdiction of the FERC in accordance with the Natural Gas Act of 1938 and the Natural Gas Policy Act of 1978. The economic effects of regulation can result in a regulated company recording as assets those costs that have been or are expected to be approved for recovery from customers, or recording as liabilities those amounts that are expected to be required to be returned to customers, in a rate-setting process in a period different from the period in which the amounts would be recorded by an unregulated enterprise. Accordingly, we record assets and liabilities that result from the regulated rate-making process that may not be recorded under GAAP for non-regulated entities. We continually assess whether regulatory assets are probable of future recovery by considering factors such as applicable regulatory changes and recent rate orders applicable to other regulated entities. Based on this continual assessment, we believe the existing regulatory assets are probable of recovery. These regulatory assets and liabilities are primarily classified in our Consolidated Balance Sheets as other assets and other liabilities. We periodically evaluate their applicability under GAAP and consider factors such as regulatory changes and the effect of competition. If cost-based regulation ends or competition increases, we may have to reduce our asset balances to reflect a market basis less than cost and write-off the associated regulatory assets and liabilities.
Regulatory assets and liabilities for the Creole Trail Pipeline are tariff provisions related to a "Deferred Fuel Account" (fuel tracker). Creole Trail Pipeline collects and retains a portion of shippers' gas to reimburse itself for actual fuel usage, incidental fuel usage, and lost and unaccounted for gas. Regulatory assets are recorded for net volumes of fuel gas under-retained and regulatory liabilities are recorded for net volumes of fuel gas over-retained.
Fixed Assets
Our fixed assets are recorded at cost and are depreciated on a straight-line method based on estimated lives of the individual assets or groups of assets.
75
CHENIERE ENERGY, INC. AND SUBSIDIARIES
NOTES TO CONSOLIDATED FINANCIAL STATEMENTS—Continued
We have consolidated certain partnerships because we have a controlling interest in these ventures. Therefore, the entities’ financial statements are consolidated in our Consolidated Financial Statements and the entities’ other equity is recorded as a non-controlling interest. The following table sets forth the components of our non-controlling interest balance since inception attributable to third-party investors’ interests at
December 31, 2012
(in thousands):
|
Net proceeds from Cheniere Partners’ issuance of common units (1)
|
$
|
355,671
|
|
|
Net proceeds from Holdings’ sale of Cheniere Partners common units (2)
|
203,946
|
|
|
|
Distributions to Cheniere Partners’ non-controlling interest (3)
|
(157,350
|
)
|
|
|
Net proceeds from Cheniere Partners' issuance of Class B units (4)
|
1,387,339
|
|
|
|
Non-controlling interest share of loss of Cheniere Partners
|
(38,002
|
)
|
|
|
Non-controlling interest at December 31, 2012
|
$
|
1,751,604
|
|
|
(1)
|
In March and April 2007, we and Cheniere Partners completed a public offering of
15,525,000
Cheniere Partners common units (the "Cheniere Partners Offering"). Cheniere Partners received
$98.4 million
in net proceeds from the issuance of its common units to the public. Prior to January 1, 2009, a company was able to elect an accounting policy of recording a gain or loss on the sale of common equity of a subsidiary equal to the amount of proceeds received in excess of the carrying value of the parent’s investment. Effective January 1, 2009, the sale of common equity of a subsidiary is accounted for as an equity transaction.
|
In January 2011, Cheniere Partners initiated an at-the-market program to sell up to
1.0 million
common units, the proceeds from which would be used primarily to fund development costs associated with the Liquefaction Project. As of December 31, 2011, Cheniere Partners had sold
0.5 million
common units with net proceeds of
$9.0 million
. During the
year ended
December 31, 2012
, Cheniere Partners sold
0.5 million
common units with net proceeds of
$11.1 million
.
In September 2011, Cheniere Partners sold
3.0 million
common units in an underwritten public offering and
1.1 million
common units to Cheniere Common Units Holding, LLC, a wholly owned subsidiary of Cheniere, at a price of
$15.25
per common unit. Cheniere Partners received net proceeds of
$43.3 million
and
$16.4 million
from the public offering and Cheniere Common Units Holding, LLC sale, respectively.
In September 2012, Cheniere Partners sold
8.0 million
common units in an underwritten public offering at a price of
$25.07
per common unit for net cash proceeds of
$194.0 million
.
|
(2)
|
In conjunction with the Cheniere Partners Offering, Cheniere LNG Holdings, LLC ("Holdings") sold a portion of the Cheniere Partners common units held by it to the public, realizing net proceeds of
$203.9 million
, which included
$39.4 million
of net proceeds realized once the underwriters exercised their option to purchase an additional
2,025,000
common units from Holdings. Due to the subordinated distribution rights on our subordinated units, we recorded those proceeds as non-controlling interest.
|
|
(3)
|
Cash distributions to the non-controlling interest are recorded directly against the non-controlling interest on our Consolidated Balance Sheets. There is no obligation beyond what is reflected in our consolidated financial statements to fund or absorb such distributions to the non-controlling interest. If in the future the non-controlling interest on our Consolidated Balance Sheets is reduced to zero, these distributions may increase the loss allocated to us.
|
|
(4)
|
In May 2012, Cheniere Partners and Blackstone CQP Holdco LP ("Blackstone") entered into a unit purchase agreement (the "Blackstone Unit Purchase Agreement") whereby Cheniere Partners agreed to sell to Blackstone in a private placement
100.0 million
Class B units of Cheniere Partners ("Class B units") at a price of
$15.00
per Class B unit. Cheniere Partners has issued and sold
100.0 million
Class B units to Blackstone as of
December 31, 2012
. The net proceeds will be used to fund the equity portion of the costs of developing, constructing and placing into service Train 1 and Train 2 of the Liquefaction Project.
|
76
CHENIERE ENERGY, INC. AND SUBSIDIARIES
NOTES TO CONSOLIDATED FINANCIAL STATEMENTS—Continued
LNGCo
In 2010, Cheniere Marketing entered into various agreements ("LNGCo Agreements") with JPMorgan LNG Co. ("LNGCo") under which Cheniere Marketing agreed to develop and maintain commercial and trading opportunities in the LNG industry and present any such opportunities exclusively to LNGCo. Cheniere Marketing also agreed to provide, or arrange for the provision of, all of the operations and administrative services required by LNGCo in connection with any LNG cargoes purchased by LNGCo, including negotiating agreements and arranging for transporting, receiving, storing, hedging and regasifying LNG cargoes. In return for the services provided by Cheniere Marketing, LNGCo paid a fixed fee to Cheniere Marketing and additional fees depending upon the gross margin of each transaction. Cheniere Marketing held no ownership interest in LNGCo and did not have the authority to contractually bind LNGCo under the LNGCo Agreements. LNGCo had various operational responsibilities and unilateral participating rights to direct the activities of LNGCo that most significantly impacted LNGCo's economic performance. In June 2012, Cheniere Marketing and LNGCo terminated the LNGCo Agreements.
During the years ended
December 31, 2012
,
2011
and 2010, we recognized
$4.0 million
,
$12.0 million
and
$10.1 million
, respectively, of marketing and trading revenues from LNGCo under the LNGCo Agreements.
Cheniere Energy Partners
Cheniere Partners is a master limited partnership formed by us to own and operate the Sabine Pass LNG terminal and related assets. As of
December 31, 2012
, we owned
59.5%
of Cheniere Partners in the form of
12.0 million
common units,
33.3 million
Class B units,
135.4 million
subordinated units and a
2%
general partner interest. Cheniere Energy Partners GP, LLC ("Cheniere Partners GP"), our wholly owned subsidiary, is the general partner of Cheniere Partners. In May 2012, Cheniere Partners and Blackstone entered into the Blackstone Unit Purchase Agreement whereby Cheniere Partners agreed to sell to Blackstone in a private placement
100.0 million
Class B units at a price of
$15.00
per Class B unit. In August 2012, all conditions to funding were met and Blackstone purchased its initial
33.3 million
Class B units. At initial funding, the board of directors of Cheniere Partners GP was modified to include three directors appointed by Blackstone, four directors appointed by us and four independent directors mutually agreed by Blackstone and us and appointed by us. A quorum consists of a majority of all directors, including at least two directors appointed by Blackstone, two directors appointed by us and two independent directors. Blackstone will no longer be entitled to appoint directors in the event that Blackstone's ownership in Cheniere Partners is less than: (i)
20%
of outstanding common units, subordinated units and Class B units, and (ii)
50.0 million
Class B units. In addition, we have provided Blackstone with a right to maintain one board seat on our board of directors.
As a result of contractual changes in the governance of Cheniere Partners GP in connection with the Blackstone Unit Purchase Agreement, we have determined that Cheniere Partners GP is a variable interest entity and that we, as the holder of the equity at risk, do not have a controlling financial interest due to the rights held by Blackstone. However, we continue to consolidate Cheniere Partners as a result of Blackstone's right to maintain one board seat on our board of directors which creates a de facto agency relationship between Blackstone and us. GAAP requires that when a de facto agency relationship exists, one of the members of the de facto agency relationship must consolidate the variable interest entity based on certain criteria. As a result, we consolidate Cheniere Partners in our consolidated financial statements.
As of December 31,
2012
and
2011
, accrued liabilities consisted of the following (in thousands):
|
|
December 31,
|
|||||||
|
|
2012
|
2011
|
||||||
|
Accrued interest expense and related fees
|
$
|
16,327
|
|
$
|
35,884
|
|
||
|
Payroll
|
6,369
|
|
19,321
|
|
||||
|
LNG liquefaction costs
|
27,919
|
|
1,702
|
|
||||
|
Deferred financing costs
|
425
|
|
—
|
|
||||
|
LNG terminal costs
|
977
|
|
1,122
|
|
||||
|
Other accrued liabilities
|
6,720
|
|
5,045
|
|
||||
|
Accrued liabilities
|
$
|
58,737
|
|
$
|
63,074
|
|
||
77
CHENIERE ENERGY, INC. AND SUBSIDIARIES
NOTES TO CONSOLIDATED FINANCIAL STATEMENTS—Continued
As of December 31,
2012
and
2011
, our debt consisted of the following (in thousands):
|
|
December 31,
|
|||||||
|
|
2012
|
2011
|
||||||
|
Current debt
|
||||||||
|
2007 Term Loan
|
$
|
—
|
|
$
|
298,000
|
|
||
|
Convertible Senior Unsecured Notes
|
—
|
|
204,630
|
|
||||
|
Total current debt
|
—
|
|
502,630
|
|
||||
|
Current debt discount
|
|
|
||||||
|
Convertible Senior Unsecured Notes
|
—
|
|
(9,906
|
)
|
||||
|
Total current debt, net of discount
|
$
|
—
|
|
$
|
492,724
|
|
||
|
Long-term debt (including related parties)
|
||||||||
|
2013 Notes
|
$
|
—
|
|
$
|
550,000
|
|
||
|
2016 Notes
|
1,665,500
|
|
1,665,500
|
|
||||
|
2020 Notes
|
420,000
|
|
—
|
|
||||
|
Liquefaction Credit Facility
|
100,000
|
|
—
|
|
||||
|
2008 Loans (including related parties)
|
—
|
|
282,293
|
|
||||
|
Total long-term debt
|
2,185,500
|
|
2,497,793
|
|
||||
|
Long-term debt discount
|
|
|
|
|
||||
|
2016 Notes
|
(18,387
|
)
|
(23,082
|
)
|
||||
|
Total long-term debt (including related parties), net of discount
|
$
|
2,167,113
|
|
$
|
2,474,711
|
|
||
Below is a schedule of future principal payments that we are obligated to make on our outstanding debt at December 31,
2012
(in thousands):
|
|
Payments Due for the Years Ended December 31,
|
|||||||||||||||||||
|
|
Total
|
2013
|
2014 to 2015
|
2016 to 2017
|
Thereafter
|
|||||||||||||||
|
Debt (including related parties):
|
|
|
|
|
|
|||||||||||||||
|
2016 Notes
|
$
|
1,665,500
|
|
$
|
—
|
|
$
|
—
|
|
$
|
1,665,500
|
|
$
|
—
|
|
|||||
|
2020 Notes
|
420,000
|
|
—
|
|
—
|
|
—
|
|
420,000
|
|
||||||||||
|
Liquefaction Credit Facility
|
100,000
|
|
—
|
|
—
|
|
—
|
|
100,000
|
|
||||||||||
|
Debt (including related parties)
|
$
|
2,185,500
|
|
$
|
—
|
|
$
|
—
|
|
$
|
1,665,500
|
|
$
|
520,000
|
|
|||||
2007 Term Loan
In
May 2007
, Cheniere Subsidiary Holdings, LLC, a wholly owned subsidiary of Cheniere, entered into a
$400.0 million
credit agreement ("2007 Term Loan"). Borrowings under the 2007 Term Loan generally bear interest at a fixed rate of
9¾%
per annum. Interest is calculated on the unpaid principal amount of the 2007 Term Loan outstanding and is payable quarterly in arrears on
March 31
,
June 30
,
September 30
and
December 31
of each year. The 2007 Term Loan will mature on
May 31, 2012
. The 2007 Term Loan is secured by a pledge of our
135,383,831
subordinated units in Cheniere Partners.
In May 2010, we sold our
30%
interest in Freeport LNG Development, L.P. ("Freeport LNG") to institutional investors for net proceeds of
$104.3 million
. The net proceeds from the sale were used to prepay
$102.0 million
of the 2007 Term Loan in May 2010. As of
December 31, 2010
,
$298.0 million
was outstanding under the 2007 Term Loan and included in long-term debt on our Consolidated Balance Sheets. During the second quarter of 2011, we reclassified
$298.0 million
of debt from a long-term liability to a current liability because our 2007 Term Loan was due within 12 months as of May 31, 2011.
In January 2012, we used a portion of the net proceeds from the public offering of common stock in December 2011 to repay in full the outstanding principal balance of the 2007 Term Loan. The aggregate repayment amount was
$298.2 million
, including the outstanding principal amount and accrued interest through
January 5, 2012
.
78
CHENIERE ENERGY, INC. AND SUBSIDIARIES
NOTES TO CONSOLIDATED FINANCIAL STATEMENTS—Continued
Convertible Senior Unsecured Notes
In July 2005, we consummated a private offering of
$325.0 million
aggregate principal amount of Convertible Senior Unsecured Notes to qualified institutional buyers pursuant to Rule 144A under the Securities Act of 1933, as amended ("the Securities Act"). The notes bore interest at a rate of
2¼
% per year. The notes were convertible at any time into our common stock under certain circumstances at an initial conversion rate of
28.23
shares per
$1,000
principal amount of the notes, which was equal to a conversion price of approximately
$35.42
per share.
We had the right to redeem some or all of the notes on or before August 1, 2012, for cash equal to
100%
of the principal plus any accrued and unpaid interest if in the previous
10
trading days the volume-weighted average price of our common stock exceeded
$53.13
, subject to adjustment, for at least five consecutive trading days. In the event of such redemption, we would have made an additional payment equal to the present value of all remaining scheduled interest payments through August 1, 2012, discounted at the U.S. Treasury securities rate plus
50
basis points. The indenture governing the notes contained customary reporting requirements.
During the second quarter of 2009, we reduced debt by exchanging
$120.4 million
aggregate principal amount of our Convertible Senior Unsecured Notes for a combination of
$30.0 million
cash and cash equivalents and
4.0 million
shares of common stock, reducing our principal amount due in 2012 to
$204.6 million
. The remaining principal amount of the Convertible Senior Unsecured Notes was convertible into
5.8 million
shares.
During the third quarter of 2011, we reclassified
$190.7 million
of debt, net of discount, from a long-term liability to a current liability because our Convertible Senior Unsecured Notes were due within
12 months
as of August 1, 2011.
We adopted on January 1, 2009 an accounting standard that requires issuers of certain convertible debt instruments to separately account for the liability component and the equity component represented by the embedded conversion option in a manner that will reflect that entity's nonconvertible debt borrowing rate when interest costs are recognized in subsequent periods. The fair value of the embedded conversion option at the date of issuance of the Convertible Senior Unsecured Notes was determined to be
$134.0 million
and has been recorded as a debt discount to the Convertible Senior Unsecured Notes, with a corresponding adjustment to additional paid-in capital.
In August 2012, we repaid in full the outstanding principal balance of the Convertible Senior Unsecured Notes. The aggregate repayment amount was
$206.9 million
including the outstanding principal amount and accrued interest through August 1, 2012.
Senior Notes
In
November 2006
, Sabine Pass LNG issued an aggregate principal amount of
$2,032.0 million
of Senior Secured Notes, consisting of
$550.0 million
of
7.25%
Senior Secured Notes due 2013 (the "
2013 Notes
") and
$1,482.0 million
of
7.50%
Senior Secured Notes due 2016 (the "
2016 Notes
"). In
September 2008
, Sabine Pass LNG issued an additional
$183.5 million
, before discount, of
2016 Notes
whose terms were identical to the previously outstanding
2016 Notes
. In
October 2012
, Sabine Pass LNG issued an aggregate principal amount of
$420.0 million
of
6.50%
Senior Secured Notes due in 2020 (the "
2020 Notes
"), whose terms were substantially similar to the outstanding
2016 Notes
, and redeemed all of the
2013 Notes
. As a result, we recorded a
$42.6 million
loss on early extinguishment of debt primarily related to make-whole payments. Collectively, the
2013 Notes
,
2016 Notes
, and
2020 Notes
are referred to as the "Senior Notes." Interest on the
2016 Notes
is payable semi-annually in arrears on
May 30
and
November 30
of each year. Interest on the
2020 Notes
is payable semi-annually in arrears on
May 1
and
November 1
of each year. The Senior Notes are secured on a first-priority basis by a security interest in all of Sabine Pass LNG's equity interests and substantially all of its operating assets.
Sabine Pass LNG may redeem some or all of its
2016 Notes
at any time, and from time to time, at a redemption price equal to
100%
of the principal plus any accrued and unpaid interest plus the greater of:
•
1.0%
of the principal amount of the
2016 Notes
; or
|
•
|
the excess of: a) the present value at such redemption date of (i) the redemption price of the
2016 Notes
plus (ii) all required interest payments due on the
2016 Notes
(excluding accrued but unpaid interest to the redemption
|
79
CHENIERE ENERGY, INC. AND SUBSIDIARIES
NOTES TO CONSOLIDATED FINANCIAL STATEMENTS—Continued
date), computed using a discount rate equal to the Treasury Rate as of such redemption date plus
50
basis points; over b) the principal amount of the
2016 Notes
, if greater.
Sabine Pass LNG may redeem all or part of its
2020 Notes
at any time on or after November 1, 2016, at fixed redemption prices specified in the indenture governing the 2020 Notes, plus accrued and unpaid interest, if any, to the date of redemption. Sabine Pass LNG may also, at its option, redeem all or part of the
2020 Notes
at any time prior to
November 1, 2016
, at a "make-whole" price set forth in the indenture governing the 2020 Notes, plus accrued and unpaid interest, if any, to the date of redemption.
Under the indentures governing the Senior Notes, except for permitted tax distributions, Sabine Pass LNG may not make distributions until certain conditions are satisfied: there must be on deposit in an interest payment account an amount equal to one-sixth of the semi-annual interest payment multiplied by the number of elapsed months since the last semi-annual interest payment, and there must be on deposit in a permanent debt service reserve fund an amount equal to one semi-annual interest payment. Distributions are permitted only after satisfying the foregoing funding requirements, a fixed charge coverage ratio test of
2
:1 and other conditions specified in the indentures. During the years ended
December 31, 2012
,
2011
and
2010
, Sabine Pass LNG made distributions of
$333.5 million
,
$313.6 million
and
$374.8 million
, respectively, after satisfying all the applicable conditions in the indentures.
In connection with the issuance of the
2020 Notes
, Sabine Pass LNG also entered into a registration rights agreement (the "Registration Rights Agreement"). Under the Registration Rights Agreement, Sabine Pass LNG has agreed to use reasonable efforts to file with the SEC and cause to become effective a registration statement relating to an offer to exchange the notes for an issue of SEC-registered notes with terms substantially identical to the
2020 Notes
within
360
days after the
2020 Notes
were issued. In certain circumstances, Sabine Pass LNG may be required to file a shelf registration statement to cover resales of the
2020 Notes
. If Sabine Pass LNG fails to satisfy these obligations, Sabine Pass LNG may be required to pay additional interest to holders of the
2020 Notes
under certain circumstances.
Liquefaction Credit Facility
In
July 2012
, Sabine Pass Liquefaction entered into the
$3.6 billion
Liquefaction Credit Facility with a syndicate of lenders. The Liquefaction Credit Facility will be used to fund a portion of the costs of developing, constructing and placing into operation Train 1 and Train 2 of the Liquefaction Project. The Liquefaction Credit Facility will mature on the earlier of July 31, 2019 or the second anniversary of the completion date of Train 1 and Train 2 of the Liquefaction Project, as defined in the Liquefaction Credit Facility. Borrowings under the Liquefaction Credit Facility may be refinanced, in whole or in part, at any time without premium or penalty, except for interest hedging and interest rate breakage costs. Sabine Pass Liquefaction made a
$100.0 million
borrowing under the Liquefaction Credit Facility in August 2012 after meeting the required conditions precedent to the initial advance.
Borrowings under the Liquefaction Credit Facility bear interest, at Sabine Pass Liquefaction's election, at a variable rate equal to LIBOR or the base rate, plus the applicable margin. The applicable margin for
LIBOR
loans is
3.50%
during construction and
3.75%
during operations, and the applicable margin for base rate loans is
2.50%
during construction and
2.75%
during operations. Interest on LIBOR loans is due and payable at the end of each LIBOR period, and interest on base rate loans is due and payable at the end of each calendar quarter. The Liquefaction Credit Facility required Sabine Pass Liquefaction to pay certain up-front fees to the agents and lenders in the aggregate amount of approximately
$178 million
and provides for a commitment fee calculated at a rate per annum equal to
40%
of the applicable margin for LIBOR loans, multiplied by the average daily amount of the undrawn commitment. Annual administrative fees must also be paid to the agent and the trustee. The principal of loans made under the Liquefaction Credit Facility must be repaid in quarterly installments, commencing with the first calendar quarter ending at least three months following the completion of Train 1 and Train 2 of the Liquefaction Project. Scheduled repayments are based upon an
18
-year amortization, with the remaining balance due upon the maturity of the Liquefaction Credit Facility.
Under the terms and conditions of the Liquefaction Credit Facility, all cash held by Sabine Pass Liquefaction is controlled by the collateral agent. These funds can only be released by the collateral agent upon satisfaction of certain terms and conditions, including receipt of satisfactory documentation that the Liquefaction Project costs are bona fide expenditures and are permitted under the terms of the Liquefaction Credit Facility. The Liquefaction Credit Facility does not permit Sabine Pass Liquefaction to hold any cash, or cash equivalents, outside of the accounts established under the agreement. Because these cash accounts are controlled by the collateral agent, the cash balance of
$100.0 million
held in these accounts as of
December 31, 2012
is classified as restricted on our Consolidated Balance Sheets.
80
CHENIERE ENERGY, INC. AND SUBSIDIARIES
NOTES TO CONSOLIDATED FINANCIAL STATEMENTS—Continued
The Liquefaction Credit Facility contains customary conditions precedent for the second borrowing and any subsequent borrowings, as well as customary affirmative and negative covenants. The obligations of Sabine Pass Liquefaction under the Liquefaction Credit Facility are secured by substantially all of the assets of Sabine Pass Liquefaction as well as all of the membership interests in Sabine Pass Liquefaction, and a security interest in Cheniere Partners' rights under the Blackstone Unit Purchase Agreement and the guaranty related thereto.
Under the terms of the Liquefaction Credit Facility, Sabine Pass Liquefaction is required to hedge against the potential of rising interest rates with respect to no less than
75%
(calculated on a weighted average basis) of the projected outstanding borrowings. In connection with the closing of the Liquefaction Credit Facility, Sabine Pass Liquefaction entered into interest rate swap agreements. The swap agreements have the effect of fixing the LIBOR component of the interest rate payable under the Liquefaction Credit Facility with respect to forecasted borrowings under the Liquefaction Credit Facility up to a maximum of
$2.9 billion
at
1.98%
from
August 14, 2012
to
July 31, 2019
, the final termination date of the swap agreements.
2008 Loans
In August 2008, we entered into a credit agreement pursuant to which we obtained
$250.0 million
in convertible term loans ("2008 Loans"). The 2008 Loans had a maturity date in 2018. The 2008 Loans bore interest at a fixed rate of
12%
per annum, except during the occurrence of an event of default during which time the rate of interest would have been
14%
per annum. Interest was due semi-annually on the last business day of January and July. The 2008 Loans were secured by Cheniere's rights and fees payable under management services agreements with Sabine Pass LNG and Cheniere Partners, by Cheniere's
12.0 million
common units in Cheniere Partners, by the equity and assets of Cheniere's pipeline entities, by the equity of various other subsidiaries and by certain other assets and subsidiary guarantees.
In June 2010, the 2008 Loans were amended to permit all funds on deposit in a terminal use agreement ("TUA") reserve payment account to be applied to the prepayment of the accrued interest on the loans outstanding under the 2008 Loans, with any remainder to be applied to the prepayment of the principal balance of such 2008 Loans. As a result,
$63.6 million
from the TUA reserve account was used to prepay
$60.9 million
of accrued interest and
$2.7 million
of principal of the 2008 Loans.
In December 2010, the 2008 Loans were amended to, among other things: eliminate the "put rights" which had allowed the lenders to demand repayment of the 2008 Loans on the third, fifth, and seventh anniversaries thereof; allow for the early prepayment of the 2008 Loans; allow Cheniere for a limited period to sell Cheniere Partners common units held as collateral and prepay the 2008 Loans with the proceeds; and release restrictions on prepayments of other indebtedness of Cheniere as certain conditions were met. In addition,
96.6%
of the lenders agreed to terminate their rights to exchange the 2008 Loans for Series B Preferred Stock of Cheniere.
The outstanding principal amount of the 2008 Loans held by Scorpion Capital Partners, L.P. ("Scorpion") was exchangeable for shares of Cheniere common stock at a price of
$5.00
per share pursuant to an amendment to the 2008 Loans adopted in September 2011. No portion of any accrued interest was eligible for exchange into Cheniere common stock. On June 16, 2011, our stockholders approved a proposal to permit Scorpion to exchange its 2008 Loans for common stock, to hold such shares of common stock, and to allow Scorpion to vote the common stock as any other stockholder. The portion of the outstanding principal amount of the 2008 Loans for Scorpion was classified as related party long-term debt on our consolidated financial statements because Scorpion is an affiliate of one of Cheniere's directors. As of
December 31, 2011
, we classified
$9.6 million
of the 2008 Loans as part of Long-Term Debt—Related Parties on our Consolidated Balance Sheets because a related party then held these portions of this debt. In April 2012, Scorpion exchanged all
$8.4 million
of its loan for
1.7 million
shares of Cheniere common stock and
$1.4 million
cash.
In June 2012, we repaid in full the entire outstanding principal balance of the 2008 Loans. Upon such payment, the credit agreement and related agreements were terminated. As a result, we recorded a $
15.1 million
loss on early extinguishment of debt in the year ended December 31, 2012.
81
CHENIERE ENERGY, INC. AND SUBSIDIARIES
NOTES TO CONSOLIDATED FINANCIAL STATEMENTS—Continued
We have incurred debt issuance costs in connection with our long-term debt. These costs are capitalized and are being amortized over the term of the related debt. The amortization of debt issuance costs associated with the
2016 Notes
and
2020 Notes
was recorded as interest expense. The amortization of debt issuance costs associated with the Liquefaction Credit Facility for the construction of Train 1 and Train 2 of the Liquefaction Project was capitalized. As of December 31,
2012
, we had capitalized
$220.9 million
of costs directly associated with the arrangement of debt financing, net of accumulated amortization, as follows (in thousands):
|
Debt
|
Debt Issuance
Costs
|
Amortization Period
|
Accumulated Amortization
|
Net Costs
|
||||||||||
|
Liquefaction Credit Facility
|
$
|
212,795
|
|
7 years
|
$
|
(12,728
|
)
|
$
|
200,067
|
|
||||
|
2016 Notes
|
30,057
|
|
10 years
|
(18,030
|
)
|
12,027
|
|
|||||||
|
2020 Notes
|
9,092
|
|
8 years
|
(237
|
)
|
8,855
|
|
|||||||
|
Total
|
$
|
251,944
|
|
|
$
|
(30,995
|
)
|
$
|
220,949
|
|
||||
Derivative Instruments
We have entered into certain instruments to hedge the exposure to variability in expected future cash flows attributable to the future sale of our LNG inventory ("LNG Inventory Derivatives"), to hedge the exposure to price risk attributable to future purchases of natural gas to be utilized as fuel to operate the Sabine Pass LNG terminal ("Fuel Derivatives"), and to hedge the exposure to volatility in a portion of the floating-rate interest payments under the Liquefaction Credit Facility ("Interest Rate Derivatives").
The following table (in thousands) shows the fair value of our derivative assets and liabilities that are required to be measured at fair value on a recurring basis as of
December 31, 2012
and
2011
, which are classified as other current assets, other current liabilities and other non-current liabilities in our Consolidated Balance Sheets.
|
Fair Value Measurements as of
|
|||||||||||||||||||||||||||||||
|
December 31, 2012
|
December 31, 2011
|
||||||||||||||||||||||||||||||
|
Quoted Prices in Active Markets
(Level 1)
|
Significant Other Observable Inputs (Level 2)
|
Significant Unobservable Inputs (Level 3)
|
Total
|
Quoted Prices in Active Markets
(Level 1)
|
Significant Other Observable Inputs (Level 2)
|
Significant Unobservable Inputs (Level 3)
|
Total
|
||||||||||||||||||||||||
|
LNG Inventory Derivatives asset
|
$
|
—
|
|
$
|
237
|
|
$
|
—
|
|
$
|
237
|
|
$
|
—
|
|
$
|
1,951
|
|
$
|
—
|
|
$
|
1,951
|
|
|||||||
|
Fuel Derivatives liability
|
—
|
|
98
|
|
—
|
|
98
|
|
—
|
|
1,415
|
|
—
|
|
1,415
|
|
|||||||||||||||
|
Interest Rate Derivatives liability
|
—
|
|
26,424
|
|
—
|
|
26,424
|
|
—
|
|
—
|
|
—
|
|
—
|
|
|||||||||||||||
The estimated fair values of our LNG Inventory Derivatives and Fuel Derivatives are the amount at which the instruments could be exchanged currently between willing parties. We value these derivatives using observable commodity price curves and other relevant data. We value our Interest Rate Derivatives using valuations based on the initial trade prices. Using an income-based approach, subsequent valuations are based on observable inputs to the valuation model including interest rate curves, risk adjusted discount rates, credit spreads and other relevant data.
Commodity Derivatives
Changes in the fair value of our LNG Inventory Derivatives and Fuel Derivatives are reported in earnings because we have not elected to designate these derivative instruments as a hedging instrument that is required to qualify for cash flow hedge accounting. The following table (in thousands) shows the fair value and location of our LNG Inventory Derivatives and Fuel Derivatives on our Consolidated Balance Sheets:
82
CHENIERE ENERGY, INC. AND SUBSIDIARIES
NOTES TO CONSOLIDATED FINANCIAL STATEMENTS—Continued
|
Fair Value Measurements as of
|
||||||||||
|
Balance Sheet Location
|
December 31, 2012
|
December 31, 2011
|
||||||||
|
LNG Inventory Derivatives asset
|
Prepaid expenses and other
|
$
|
237
|
|
$
|
1,951
|
|
|||
|
Fuel Derivatives liability
|
Other current liabilities
|
98
|
|
1,415
|
|
|||||
The following table (in thousands) shows the changes in the fair value and settlements of our LNG Inventory Derivatives recorded in marketing and trading revenues (losses) on our Consolidated Statements of Operations during the
years ended
December 31, 2012
,
2011
and
2010
:
|
Year Ended December 31,
|
|||||||||||
|
2012
|
2011
|
2010
|
|||||||||
|
LNG Inventory Derivatives gain
|
$
|
995
|
|
$
|
2,475
|
|
$
|
2,265
|
|
||
The following table (in thousands) shows the changes in the fair value and settlements of our Fuel Derivatives recorded in derivative gain (loss) on our Consolidated Statements of Operations during the
years ended
December 31, 2012
,
2011
and
2010
:
|
Year Ended December 31,
|
|||||||||||
|
2012
|
2011
|
2010
|
|||||||||
|
Fuel Derivatives gain (loss)
|
$
|
(622
|
)
|
$
|
(2,251
|
)
|
$
|
461
|
|
||
The use of derivative instruments exposes us to counterparty credit risk, or the risk that a counterparty will be unable to meet its commitments. Our commodity derivative transactions are executed through over-the-counter contracts which are subject to nominal credit risk as these transactions are settled on a daily margin basis with investment grade financial institutions. Collateral of
$5.9 million
and
$5.5 million
deposited for such contracts, which has not been reflected in the derivative fair value tables, is included in the other current assets balance as of
December 31, 2012
, and
2011
, respectively.
Interest Rate Swaps Designated as Cash Flow Hedges
In
August 2012
, Sabine Pass Liquefaction entered into Interest Rate Derivatives to protect against volatility of future cash flows and hedge a portion of the variable interest payments on the Liquefaction Credit Facility.
Sabine Pass Liquefaction has elected to designate these Interest Rate Derivatives as hedging instruments which is required in order to qualify for cash flow hedge accounting. As a result of this cash flow hedge designation, we recognize the Interest Rate Derivatives as an asset or liability at fair value, and reflect changes in fair value through other comprehensive income in our Consolidated Statements of Comprehensive Loss. Any hedge ineffectiveness associated with the Interest Rate Derivatives is recorded immediately as derivative gain (loss) in our Consolidated Statements of Operations. The realized gain (loss) on the Interest Rate Derivatives is recorded as an (increase) decrease in interest expense on our Consolidated Statements of Operations to the extent not capitalized as part of the Liquefaction Project. The effective portion of the gains or losses on our Interest Rate Derivatives recorded in other comprehensive income is reclassified to earnings as interest payments on the Liquefaction Credit Facility impact earnings. In addition, amounts recorded in other comprehensive income are also reclassified into earnings if it becomes probable that the hedged forecasted transaction will not occur.
The Interest Rate Derivatives hedge approximately
75%
of the weighted average of the expected outstanding borrowings over the term of the Liquefaction Credit Facility. The aggregate notional amount each month follows our expected borrowing schedule under the Liquefaction Credit Facility with an expected maximum swap notional amount outstanding of
$2.9 billion
in 2017. Based on the continued development of our financing strategy for the Liquefaction Project, in particular the fixed-rate debt as described in
Note 19—"Subsequent Events"
, during the fourth quarter of 2012 we determined it was no longer probable that a portion of the forecasted variable interest payments on the Liquefaction Credit Facility would occur in the time period originally specified. As a result, a portion of the Interest Rate Derivatives were no longer effective hedges and the hedge relationships for this portion were de-designated as of
October 1, 2012
. Fair value adjustments on this de-designated portion of the Interest Rate Derivatives subsequent to
October 1, 2012
are recorded within the Consolidated Statements of Operations. We have continued to maintain the Interest Rate Derivatives (both designated and de-designated) in anticipation of our upcoming financing needs, particularly for the financing of the construction of Train 3 and Train 4 of the Liquefaction Project, and have concluded that the likelihood of occurrence of our variable interest payments has not changed to probable not to occur. As a result, amounts recorded
83
CHENIERE ENERGY, INC. AND SUBSIDIARIES
NOTES TO CONSOLIDATED FINANCIAL STATEMENTS—Continued
in other comprehensive income related to our designated and de-designated Interest Rate Derivatives will continue to remain in other comprehensive income until interest payments on the Liquefaction Credit Facility impact earnings.
At
December 31, 2012
, Sabine Pass Liquefaction had the following Interest Rate Derivatives outstanding that converted
$20.0 million
of the Liquefaction Credit Facility from a variable to a fixed interest rate. Sabine Pass Liquefaction pays a fixed interest rate on the swap and in exchange receives a variable interest rate based on the one-month LIBOR.
|
Initial Notional Amount
|
Maximum Notional Amount
|
Effective Date
|
Maturity Date
|
Weighted Average Fixed Interest Rate Paid
|
Variable Interest Rate Received
|
|||||||
|
Interest Rate Derivatives - Designated
|
$16.1 million
|
$2.3 billion
|
August 14, 2012
|
July 31, 2019
|
1.98%
|
One-month LIBOR
|
||||||
|
Interest Rate Derivatives - De-designated
|
$3.9 million
|
$575.3 million
|
August 14, 2012
|
July 31, 2019
|
1.98%
|
One-month LIBOR
|
||||||
Interest Rate Derivatives were reflected in our Consolidated Balance Sheets at fair value with the effective portion of the Interest Rate Derivatives' gain or loss recorded in other comprehensive income. Fair value adjustments subsequent to
October 1, 2012
on the de-designated portion of the Interest Rate Derivatives were recorded within the Consolidated Statements of Operations. The following table (in thousands) shows the fair value of our interest rate swaps:
|
Fair Value Measurements as of
|
||||||||||
|
Balance Sheet Location
|
December 31, 2012
|
December 31, 2011
|
||||||||
|
Interest Rate Derivatives - Designated
|
Non-current derivative liabilities
|
$
|
21,290
|
|
$
|
—
|
|
|||
|
Interest Rate Derivatives - De-designated
|
Non-current derivative liabilities
|
5,134
|
|
—
|
|
|||||
The following table (in thousands) shows our Interest Rate Derivatives market adjustments recorded during the
year ended
December 31, 2012
:
|
Gain (Loss) in Other Comprehensive Income
|
Gain (Loss) Reclassified from Accumulated OCI into Interest Expense (Effective Portion)
|
Gain (Loss) Recognized in Income (Ineffective Portion and Amount Excluded from Effectiveness Testing)
|
|||||||||||||||||||||
|
2012
|
2011
|
2012
|
2011
|
2012
|
2011
|
||||||||||||||||||
|
Interest Rate Derivatives - Designated
|
$
|
(21,290
|
)
|
$
|
—
|
|
$
|
—
|
|
$
|
—
|
|
$
|
—
|
|
$
|
—
|
|
|||||
|
Interest Rate Derivatives - De-designated
|
(5,814
|
)
|
—
|
|
—
|
|
—
|
|
—
|
|
—
|
|
|||||||||||
|
Interest Rate Derivatives - Settlements
|
(136
|
)
|
—
|
|
—
|
|
—
|
|
—
|
|
—
|
|
|||||||||||
The following table (in thousands) shows the changes in the fair value of our De-designated Interest Rate Derivatives recorded in derivative gain on our Consolidated Statements of Operations during the
years ended
December 31, 2012
,
2011
and
2010
:
|
Year Ended December 31,
|
|||||||||||
|
2012
|
2011
|
2010
|
|||||||||
|
Interest Rate Derivatives - De-designated
|
$
|
679
|
|
$
|
—
|
|
$
|
—
|
|
||
84
CHENIERE ENERGY, INC. AND SUBSIDIARIES
NOTES TO CONSOLIDATED FINANCIAL STATEMENTS—Continued
Balance Sheet Presentation
The Company's commodity and interest rate derivatives are presented on a net basis on our Consolidated Balance Sheets as described above. The following table (in thousands) shows the fair value of our derivatives outstanding on a gross basis:
|
December 31, 2012
|
December 31, 2011
|
|||||||
|
Commodity Derivatives:
|
||||||||
|
Assets
|
$
|
613
|
|
$
|
2,310
|
|
||
|
Liabilities
|
474
|
|
1,774
|
|
||||
|
Interest Rate Derivatives:
|
||||||||
|
Assets - designated
|
$
|
17,512
|
|
$
|
—
|
|
||
|
Assets - de-designated
|
4,283
|
|
—
|
|
||||
|
Liabilities - designated
|
38,729
|
|
—
|
|
||||
|
Liabilities - de-designated
|
9,491
|
|
—
|
|
||||
Other Financial Instruments
The estimated fair value of our other financial instruments, including those financial instruments for which the fair value option was not elected are set forth in the table below. The carrying amounts reported on our Consolidated Balance Sheets for cash and cash equivalents, restricted cash and cash equivalents, accounts receivable, interest receivable and accounts payable approximate fair value due to their short-term nature.
Other Financial Instruments (in thousands):
|
|
December 31, 2012
|
December 31, 2011
|
||||||||||||||
|
|
Carrying
Amount
|
Estimated
Fair Value
|
Carrying
Amount
|
Estimated
Fair Value
|
||||||||||||
|
2016 Notes, net of discount (1)
|
$
|
1,647,113
|
|
$
|
1,824,177
|
|
$
|
1,642,418
|
|
$
|
1,650,630
|
|
||||
|
2020 Notes (1)
|
420,000
|
|
437,850
|
|
—
|
|
—
|
|
||||||||
|
Liquefaction Credit Facility (2)
|
100,000
|
|
100,000
|
|
—
|
|
—
|
|
||||||||
|
2013 Notes (1)
|
—
|
|
—
|
|
550,000
|
|
555,500
|
|
||||||||
|
Convertible Senior Unsecured Notes, net of discount (1)
|
—
|
|
—
|
|
194,724
|
|
186,740
|
|
||||||||
|
2007 Term Loan (3)
|
—
|
|
—
|
|
298,000
|
|
292,728
|
|
||||||||
|
2008 Loans (4)
|
—
|
|
—
|
|
282,293
|
|
282,293
|
|
||||||||
|
(1)
|
The Level 2 estimated fair value was based on quotations obtained from broker-dealers who make markets in these and similar instruments based on the closing trading prices on
December 31, 2012
and
2011
, as applicable.
|
|
(2)
|
The Level 3 estimated fair value of the Liquefaction Credit Facility as of
December 31, 2012
was determined to be the carrying amount due to our ability to call this debt at anytime without penalty.
|
|
(3)
|
The 2007 Term Loan was closely held by few holders, and purchases and sales were infrequent and were conducted on a bilateral basis without price discovery by us. This loan was not rated and had unique covenants and collateral packages such that comparisons to other instruments were imprecise. Nonetheless, we provided an estimate of the fair value of this loan as of
December 31, 2011
based on an index of the yield to maturity of CCC rated debt of other companies in the energy sector, resulting in Level 3 categorization. In January 2012, the 2007 Term Loan was paid in full.
|
|
(4)
|
The Level 3 estimated fair value of the 2008 Loans as of
December 31, 2011
was determined to be the same as the carrying amount due to our ability to call the debt (other than the debt held by Scorpion) at anytime without penalty or a make-whole payment for an early redemption. In April 2012, Scorpion exchanged all
$8.4 million
of its loan for
1.7 million
shares of Cheniere common stock and
$1.4 million
cash. In June 2012, the 2008 Loans were paid in full and the credit agreement and related agreements were terminated.
|
85
CHENIERE ENERGY, INC. AND SUBSIDIARIES
NOTES TO CONSOLIDATED FINANCIAL STATEMENTS—Continued
As of December 31,
2012
and
2011
, we had recorded
$26.5 million
and
$26.6 million
, respectively, as current deferred revenue and
$21.5 million
and
$25.5 million
, respectively, as non-current deferred revenue related to advance capacity reservation fee payments on our Consolidated Balance Sheets.
Advance Capacity Reservation Fee
In
November 2004
, Total Gas & Power North America, Inc. ("Total") paid Sabine Pass LNG a nonrefundable advance capacity reservation fee of
$10.0 million
in connection with the reservation of approximately
1.0
Bcf/d of LNG regasification capacity at the Sabine Pass LNG terminal. An additional advance capacity reservation fee payment of
$10.0 million
was paid by Total to Sabine Pass LNG in
April 2005
. The advance capacity reservation fee payments are being amortized as a reduction of Total’s regasification capacity reservation fee under its TUA over a
10
-year period beginning with the commencement of its TUA on
April 1, 2009
. As a result, we recorded the advance capacity reservation fee payments that Sabine Pass LNG received, although non-refundable, as deferred revenue to be amortized to income over the corresponding
10
-year period.
In
November 2004
, Sabine Pass LNG also entered into a TUA to provide Chevron U.S.A. Inc. ("Chevron") with approximately
0.7
Bcf/d of LNG regasification capacity at the Sabine Pass LNG terminal. In
December 2005
, Chevron exercised its option to increase its reserved capacity by approximately
0.3
Bcf/d to approximately
1.0
Bcf/d, making advance capacity reservation fee payments to Sabine Pass LNG totaling
$20.0 million
. The advance capacity reservation fee payments are being amortized as a reduction of Chevron’s regasification capacity reservation fee under its TUA over a
10
-year period beginning with the commencement of its TUA on
July 1, 2009
. As a result, we recorded the advance capacity reservation fee payments that Sabine Pass LNG received, although non-refundable, as deferred revenue to be amortized to income over the corresponding
10
-year period.
As of December 31,
2012
, we had recorded
$4.0 million
and
$21.5 million
as current and non-current deferred revenue on our Consolidated Balance Sheets, respectively, related to the Total and Chevron advance capacity reservation fees. As of December 31,
2011
, we had recorded
$4.0 million
and
$25.5 million
as current and non-current deferred revenue on our Consolidated Balance Sheets, respectively, related to the Total and Chevron advance capacity reservation fees.
TUA Payments
Total and Chevron are obligated to make monthly TUA payments to Sabine Pass LNG in advance of the month of service. These monthly payments are recorded to current deferred revenue in the period cash is received and are then recorded as revenue in the next month when the TUA service is performed. As of
December 31, 2012
and
2011
, we had recorded
$21.1 million
and
$21.1 million
, respectively, as current deferred revenue on our Consolidated Balance Sheets related to Total's and Chevron's monthly TUA payments.
86
CHENIERE ENERGY, INC. AND SUBSIDIARIES
NOTES TO CONSOLIDATED FINANCIAL STATEMENTS—Continued
Income tax provision included in our reported net loss consisted of the following (in thousands):
|
|
Year Ended December 31,
|
|||||||||||
|
|
2012
|
2011
|
2010
|
|||||||||
|
Current:
|
||||||||||||
|
Federal
|
$
|
—
|
|
$
|
—
|
|
$
|
—
|
|
|||
|
State
|
—
|
|
—
|
|
—
|
|
||||||
|
Foreign
|
145
|
|
277
|
|
—
|
|
||||||
|
Total current
|
145
|
|
277
|
|
—
|
|
||||||
|
Deferred:
|
||||||||||||
|
Federal
|
—
|
|
—
|
|
—
|
|
||||||
|
State
|
—
|
|
—
|
|
—
|
|
||||||
|
Foreign
|
(141
|
)
|
(117
|
)
|
—
|
|
||||||
|
Total deferred
|
(141
|
)
|
(117
|
)
|
—
|
|
||||||
|
Total income tax provision
|
$
|
4
|
|
$
|
160
|
|
$
|
—
|
|
|||
The reconciliation of the federal statutory income tax rate to our effective income tax rate is as follows:
|
|
Year Ended December 31,
|
||||||||
|
|
2012
|
2011
|
2010
(1)
|
||||||
|
U.S. statutory tax rate
|
(35.0
|
)%
|
(35.0
|
)%
|
(35.0
|
)%
|
|||
|
State tax benefit (net of federal benefits)
|
(2.7
|
)%
|
(6.2
|
)%
|
(9.2
|
)%
|
|||
|
Foreign income tax provision
|
—
|
%
|
—
|
%
|
—
|
%
|
|||
|
Deferred tax asset valuation reserve
|
33.2
|
%
|
42.1
|
%
|
26.0
|
%
|
|||
|
Loss on early extinguishment of debt
|
—
|
%
|
—
|
%
|
17.8
|
%
|
|||
|
Other
|
4.5
|
%
|
(0.9
|
)%
|
0.4
|
%
|
|||
|
Effective tax rate as reported
|
—
|
%
|
—
|
%
|
—
|
%
|
|||
|
(1)
|
We have made certain changes in the classification and presentation of certain items. These changes do not affect the disclosed effective tax rate.
|
87
CHENIERE ENERGY, INC. AND SUBSIDIARIES
NOTES TO CONSOLIDATED FINANCIAL STATEMENTS—Continued
Significant components of our deferred tax assets and liabilities at December 31,
2012
and
2011
are as follows (in thousands):
|
|
Year Ended December 31,
|
|||||||
|
|
2012
|
2011
|
||||||
|
Deferred tax assets
|
|
|||||||
|
Net operating loss carryforwards
(1)
|
||||||||
|
Federal
|
$
|
476,228
|
|
$
|
365,811
|
|
||
|
State
|
83,242
|
|
49,847
|
|
||||
|
Capital gains
|
81,388
|
|
81,388
|
|
||||
|
Share-based compensation expense
|
5,679
|
|
4,165
|
|
||||
|
United Kingdom deferred tax assets
|
258
|
|
117
|
|
||||
|
Other
|
17,606
|
|
19,565
|
|
||||
|
Total deferred tax assets
|
$
|
664,401
|
|
$
|
520,893
|
|
||
|
Deferred tax liabilities
|
|
|
|
|
||||
|
Investment in limited partnership
|
$
|
(94,434
|
)
|
$
|
(79,281
|
)
|
||
|
Other
|
(307
|
)
|
(4,856
|
)
|
||||
|
Total deferred tax liabilities
|
$
|
(94,741
|
)
|
$
|
(84,137
|
)
|
||
|
Net deferred tax assets
|
569,660
|
|
436,756
|
|
||||
|
Less: net deferred tax asset valuation allowance
(2)
|
(569,402
|
)
|
(436,639
|
)
|
||||
|
Total net deferred tax asset
|
$
|
258
|
|
$
|
117
|
|
||
|
(1)
|
The federal net operating loss ("NOL") carryforward expires between 2017 and 2031. The state NOL carryforward expires between 2020 and 2027.
|
(2) A valuation allowance equal to our U.S. and state net deferred tax asset balance has been established due to the uncertainty of realizing the tax benefits related to our U.S. and state net deferred tax assets. The change in the U.S. and state deferred tax asset valuation allowance was
$132.7 million
for the year ended December 31, 2012, of which
$114.5 million
relates to continuing operations and
$9.2 million
relates to other comprehensive income. Additionally,
$9 million
relates to an additional deferred tax asset and related valuation reserve due to previously unrecorded net deferred federal and state tax assets. The change in the U.S. and state deferred tax asset valuation was
$83.5 million
for the year ended December 31, 2011.
Changes in the balance of unrecognized tax benefits are as follows (in thousands):
|
Year Ended December 31,
|
|||||||
|
2012
|
2011
|
||||||
|
Balance at beginning of the year
|
$
|
135,349
|
|
$
|
20,969
|
|
|
|
Additions based on tax positions related to current year
|
—
|
|
115,073
|
|
|||
|
Additions for tax positions of prior years
|
—
|
|
—
|
|
|||
|
Reductions for tax positions of prior years
|
(115,576
|
)
|
(693
|
)
|
|||
|
Settlements
|
—
|
|
—
|
|
|||
|
Balance at end of the year
|
$
|
19,773
|
|
$
|
135,349
|
|
|
Our effective tax rate will not be affected if the unrecognized federal income tax benefits provided above were recognized. Currently, we do not recognize any accrued liabilities, interest and penalties associated with the unrecognized tax benefits provided above in the Consolidated Statements of Operations or the Consolidated Balance Sheets. We record interest and penalties related to unrecognized tax benefits to our income tax provision.
During the third quarter of 2012, largely due to the increased level of trading activity in our shares, we experienced an ownership change within the provisions of Internal Revenue Code Section 382 ("Section 382") that will subject approximately
$1.5 billion
of our existing federal NOL carryforwards to an annual NOL utilization limitation. The applicable Section 382
88
CHENIERE ENERGY, INC. AND SUBSIDIARIES
NOTES TO CONSOLIDATED FINANCIAL STATEMENTS—Continued
limitation may affect our ability to fully utilize approximately
$1.5 billion
of our existing federal NOL carryforward. Our ability to fully utilize our existing federal NOL carryforward is dependent on increasing the recognition of built-in gains in the five-year period following the above-referenced ownership change. We will continue to monitor trading activity in our shares which may cause an additional ownership change which may ultimately affect our ability to fully utilize our existing federal NOL carryforwards.
We currently file tax returns in the U.S. federal jurisdiction, the United Kingdom and various state and local jurisdictions. We are no longer subject to U.S. federal, state or local income tax examinations by tax authorities for tax years prior to 2008. The Internal Revenue Service is currently examining Cheniere Marketing's 2009 and 2010 income tax returns. The Louisiana Department of Revenue is currently examining Cheniere LNG Terminals, Inc.'s 2008 - 2010 income tax returns.
Accounting for share-based compensation provides that when settlement of a share based award contributes to an NOL carryforward, neither the associated excess tax benefit nor the credit to additional paid-in capital ("APIC") should be recorded until the share-based award deduction reduces income tax payable. Upon utilization of the loss in future periods, a benefit of
$22.5 million
will be reflected in APIC.
We have granted options to purchase common stock to employees, consultants and outside directors under the Cheniere Energy, Inc. Amended and Restated 1997 Stock Option Plan ("1997 Plan"), Amended and Restated 2003 Stock Incentive Plan, as amended ("2003 Plan"), and 2011 Incentive Plan, as amended (the"2011 Plan"). We recognize our share-based payments to employees in the consolidated financial statements based on their fair values at the date of grant. The calculated fair value is recognized as expense (net of any capitalization) over the requisite service period, net of estimated forfeitures, using the straight-line or accelerated recognition methods.
For the years ended December 31,
2012
,
2011
and
2010
, the total share-based compensation expense recognized in our net loss (net of capitalization) was
$58.7 million
,
$26.4 million
and
$17.9 million
, respectively. The effect of a change in estimated forfeitures is recognized through a cumulative adjustment included in share-based compensation cost in the period of change in estimate. We consider many factors when estimating expected forfeitures, including types of awards, employee class and historical experience. For the years ended December 31,
2012
,
2011
and
2010
, the cumulative adjustment recognized in our compensation expense was
zero
,
$0.6 million
and
$1.1 million
, respectively. For the years ended December 31,
2012
,
2011
and
2010
, the total share-based compensation cost capitalized as part of the cost of capital assets was
$2.4
million,
zero
and
zero
respectively.
The total unrecognized compensation cost at December 31,
2012
relating to non-vested share-based compensation arrangements granted under the 1997 Plan, 2003 Plan and 2011 Plan was
$90.9 million
. That cost is expected to be recognized over
4.0 years
, with a weighted average period of
3.5 years
.
We have disclosed the deferred tax benefit realized from share-based compensation exercised during the annual period in
Note 13—"Income Taxes"
. A valuation allowance equal to the deferred tax asset has been established due to the uncertainty of realizing the tax benefits related to this deferred tax asset.
Phantom Stock
On February 25, 2009, the Compensation Committee of our Board of Directors (the "Compensation Committee") made phantom stock grants of
5,545,000
shares pursuant to our 2003 Plan to all Cheniere executives, designated employees and one consultant. On June 12, 2009, the Compensation Committee made additional phantom stock grants of
800,000
shares to our Chief Executive Officer pursuant to the approval from our stockholders to increase the maximum number of shares granted to any one individual under our 2003 Plan during a calendar year from
1.0 million
shares to
3.0 million
shares. The shares were awarded under a time based plan and a performance based plan. The time based plan included an aggregate of
1,565,000
shares of phantom stock and provided for a
three
-year graded vesting schedule. The shares awarded under the time based plan vested equally on each of December 15, 2009, 2010 and 2011. The performance based plan included an aggregate of
4,780,000
shares of phantom stock with each grant divided into three equal parts providing incentive compensation based on separate vesting terms. Vested shares of phantom stock were settled in cash or in shares of common stock, as determined by the Compensation Committee. In June 2009, we obtained approval from our stockholders to increase the number of shares of common stock available for issuance under our 2003 Plan from
11.0 million
common shares to
21.0 million
shares of common stock, which provided the requisite shares of
89
CHENIERE ENERGY, INC. AND SUBSIDIARIES
NOTES TO CONSOLIDATED FINANCIAL STATEMENTS—Continued
common stock needed to satisfy vested phantom stock. We transferred the fair valued compensation liability associated with these phantom stock grants into additional paid-in capital. Using a Monte Carlo simulation, fair values were calculated as of June 12, 2009 for the time and performance based plans. For the years ended December 31,
2012
, 2011 and 2010, a total of
zero
,
$12.2 million
and
$7.0 million
was recognized as compensation expense relating to the vesting of time and performance based phantom stock grants. There was no unrecognized compensation cost at December 31,
2012
relating to non-vested phantom stock.
Stock Options
We estimate the fair value of stock options at the date of grant using a Black-Scholes valuation model. The risk-free rate is based on the U.S. Treasury securities yield curve in effect at the time of grant. The expected term (estimated period of time outstanding) of stock options granted is based on the "simplified" method of estimating the expected term for "plain vanilla" stock options, and varies based on the vesting period and contractual term of the stock option. Expected volatility for stock options granted is based on an equally weighted average of the implied volatility of exchange traded stock options on our common stock expiring more than one year from the measurement date, and historical volatility of our common stock for a period equal to the stock option’s expected life. We have not declared dividends on our common stock. We did not issue any options to purchase shares of our common stock during the year ended December 31,
2012
.
The table below provides a summary of option activity under the 1997 Plan, 2003 Plan and 2011 Plan as of December 31,
2012
:
|
|
Options
|
Weighted Average Exercise Price
|
Weighted Average Remaining Contractual Term
|
Aggregate Intrinsic Value
|
||||||||||
|
|
(in thousands)
|
|
|
(in thousands)
|
||||||||||
|
Outstanding at January 1, 2012
|
771
|
|
$
|
26.45
|
|
|
||||||||
|
Granted
|
—
|
|
—
|
|
|
|||||||||
|
Exercised
|
(106
|
)
|
7.86
|
|
|
|
||||||||
|
Forfeited or Expired
|
(27
|
)
|
38.22
|
|
|
|||||||||
|
Outstanding at December 31, 2012
|
638
|
|
$
|
29.08
|
|
—
|
|
2.27
|
$
|
1,552
|
|
|||
|
Exercisable at December 31, 2012
|
638
|
|
$
|
29.08
|
|
2.27
|
$
|
—
|
|
|||||
The weighted average grant-date fair value of options granted during the years ended December 31, 2012, 2011 and 2010 was
zero
. The total intrinsic value of options exercised during the years ended December 31,
2012
,
2011
and
2010
was
$0.7 million
,
zero
and
zero
, respectively.
We received
$0.8 million
,
zero
and
zero
proceeds from the exercise of stock options in the years ended December 31,
2012
,
2011
and
2010
, respectively.
Stock and Non-Vested Stock
We have granted stock, phantom stock and restricted stock and non-vested restricted stock to employees, executive officers, outside directors and consultants under the 2003 Plan and 2011 Plan. Grants of non-vested stock are accounted for on an intrinsic value basis. The amortization of the calculated value of non-vested stock grants is accounted for as a charge to compensation expense or capitalized with a corresponding increase to additional paid-in-capital over the requisite service period.
For the years ended December 31,
2012
,
2011
and
2010
, we issued
zero
shares,
5,262,000
shares and
502,000
shares, respectively, of phantom stock awards to our executives and certain officers.
For the years ended December 31,
2012
,
2011
and
2010
, we issued
10,293,000
shares,
2,565,000
shares and
1,234,000
shares, respectively, of restricted stock awards to our employees, executives, directors and a consultant as performance, retention, service and new hire awards. A majority of the awards were issued with a
one
,
three
or
four
-year graded vesting period. A certain group of 2007 retention grants received a vesting schedule of
50%
on December 1, 2008,
30%
on December 1, 2009 and
20%
on June 1, 2010. A certain group of 2011 restricted stock awards received a vesting schedule of
33%
on June 30, 2011,
33%
on June 30, 2012, and
33%
on June 30, 2013.
90
CHENIERE ENERGY, INC. AND SUBSIDIARIES
NOTES TO CONSOLIDATED FINANCIAL STATEMENTS—Continued
On May 25, 2007, the Compensation Committee approved a bonus plan covering substantially all employees not otherwise included in the 2007 Plan. This plan provided covered employees the ability to earn bonuses based on the achievement of established annual performance goals as well as a stock price appreciation goal. The fair value of the grants was recalculated at each balance sheet date until the total number of restricted shares was granted in January 2008. Because of the existence of the stock price appreciation goal, which was a market condition, the restricted stock was not eligible for amortization under the straight-line method, and each vesting tranche is being amortized separately.
In July 2012, we met the criteria to determine the Long-Term Commercial Bonus Pool that was established by the Compensation Committee of the Board of Directors in the 2011-2013 Bonus Plan in relation to LNG trains 1 and 2 of the Liquefaction Project. In August 2012, the Compensation Committee approved a Long-Term Commercial Bonus Pool, which consisted of approximately
$60 million
in cash awards and
10 million
restricted shares of common stock to be issued under the 2011 Plan. The restricted stock awards vest in five installments. The first restricted stock award installment vested in August 2012 when Sabine Pass Liquefaction issued its full notice to proceed ("NTP") to Bechtel under the lump sum turnkey agreement with respect to LNG Train 1 and Train 2 of the Liquefaction Project. The restricted stock awards vest in
five
installments as follows:
|
•
|
35%
when NTP is issued;
|
|
•
|
10%
on the first anniversary of the issuance of NTP;
|
|
•
|
15%
on the second anniversary of the issuance of NTP;
|
|
•
|
15%
on the third anniversary of the issuance of NTP; and
|
|
•
|
25%
on the fourth anniversary of the issuance of NTP.
|
In general, employees must be employed at the time of each vesting to receive the awards or will otherwise forfeit such awards. Vesting and payment of the awards would accelerate in full upon (i) termination of employment by the Company without "Cause" or, solely in the case of executive officers, termination of employment by the employee for "Good Reason" (each as defined in the 2003 Plan), (ii) the employee's death or disability, or (iii) the occurrence of a change of control.
The table below provides a summary of the status of our non-vested shares under the 2003 Plan and 2011 Plan as of December 31,
2012
(in thousands except for per share information):
|
|
Non-Vested
Shares
|
Weighted
Average Grant
Date Fair Value
Per Share
|
|||||
|
Non-vested at January 1, 2012
|
1,879
|
|
$
|
7.75
|
|
||
|
Granted
|
10,293
|
|
14.06
|
|
|||
|
Vested
|
(4,361
|
)
|
12.76
|
|
|||
|
Forfeited
|
(14
|
)
|
12.78
|
|
|||
|
Non-vested at December 31, 2012
|
7,797
|
|
$
|
13.27
|
|
||
The weighted average grant date fair values per share of restricted stock granted during the years ended December 31,
2012
,
2011
and
2010
were
$14.06
,
$7.72
, and
$3.31
, respectively. The total grant date fair value per share of shares vested during the years ended December 31,
2012
,
2011
and
2010
were
$12.76
,
$7.26
and
$5.54
, respectively.
Share-based Plan Descriptions and Information
Our 1997 Plan provides for the issuance of stock options to purchase up to
5.0 million
shares of our common stock, all of which have been granted. Non-qualified stock options were granted to employees, contract service providers and outside directors.
In June 2009, we obtained approval from our stockholders to increase the number of shares of common stock available for issuance under our 2003 Plan from
11.0 million
shares to
21.0 million
shares. These awards may be in the form of non-qualified stock options, incentive stock options, purchased stock, restricted (non-vested) stock, bonus (unrestricted) stock, stock appreciation rights, phantom stock and other share-based performance awards deemed by the Compensation Committee to be consistent with the purposes of the 2003 Plan. To date, the only awards made by the Compensation Committee have been in the form of non-qualified stock options, restricted stock, restricted stock units and phantom shares.
91
CHENIERE ENERGY, INC. AND SUBSIDIARIES
NOTES TO CONSOLIDATED FINANCIAL STATEMENTS—Continued
401(k) Plan
In 2005, we established a defined contribution pension plan ("401(k) Plan"). The 401(k) Plan allows eligible employees to contribute up to
100%
of their compensation up to the IRS maximum. We match each employee’s salary deferrals (contributions) up to
five percent
of compensation and may make additional contributions at our discretion. Effective January 1, 2007, employees are immediately vested in the contributions made by us. Our contributions to the 401(k) Plan were
$1.4 million
,
$1.1 million
and
$1.0 million
for the years ended December 31,
2012
,
2011
and
2010
, respectively. We have made no discretionary contributions to the 401(k) Plan to date.
During the years ended
December 31, 2012
,
2011
and
2010
, we recognized rental expense for all operating leases of
$12.9 million
,
$11.5 million
and
$10.2 million
, respectively.
Future Annual Minimum Lease Payments
Future annual minimum lease payments, excluding inflationary adjustments, are as follows (in thousands):
|
Years Ending December 31,
|
Operating
Leases (2) (3)
|
||
|
2013
|
$
|
14,411
|
|
|
2014
|
12,863
|
|
|
|
2015
|
12,900
|
|
|
|
2016
|
12,937
|
|
|
|
2017
|
11,643
|
|
|
|
Thereafter (1)
|
250,684
|
|
|
|
Total
|
$
|
315,438
|
|
|
(1)
|
Includes certain lease option renewals as they are reasonably assured
.
|
|
(2)
|
Future annual minimum lease payments do not include
$0.7 million
expected to be recovered through sublease agreements for our office leases in Houston, Texas.
|
|
(3)
|
Lease payments for Sabine Pass LNG’s tug boat lease represent its lease payment obligation and do not take into account the payments Sabine Pass LNG will receive from third-party TUA customers that effectively offset
$75.2 million
, or two-thirds, of Sabine Pass LNG's lease payment obligation, as discussed below.
|
Tug Boat Agreements
Sabine Pass Tug Services, LLC ("Tug Services"), Cheniere Partners' wholly owned subsidiary, entered into a Marine Services Agreement (the "Tug Agreement") for the use of tug boats and marine services for the Sabine Pass LNG terminal. The term of the Tug Agreement commenced in
January 2008
for a period of
10
years, with an option to renew
two
additional, consecutive terms of
five years
each. In accordance with accounting literature on how to determine whether an arrangement contains a lease, we determined that the Tug Agreement contains a lease for the tugs specified in the Tug Agreement. In addition, we concluded that the tug boat lease contained in the Tug Agreement is an operating lease, and as such, the equipment component of the Tug Agreement is charged to expense over the term of the Tug Agreement as it becomes payable.
In the second quarter of 2009, Tug Services entered into a Tug Sharing Agreement with Sabine Pass LNG's three TUA customers to provide their LNG cargo vessels with tug boat and marine services at the Sabine Pass LNG terminal and effectively offset the cost of the tug boat lease. The Tug Sharing Agreement provides for each of our customers to pay Tug Services an annual service fee.
92
CHENIERE ENERGY, INC. AND SUBSIDIARIES
NOTES TO CONSOLIDATED FINANCIAL STATEMENTS—Continued
LNG Site Leases
In
January 2005
, Sabine Pass LNG exercised its options and entered into
three
land leases for the site of the Sabine Pass LNG terminal. The leases have an initial term of
30 years
, with options to renew for
six
10
-year extensions with similar terms as the initial term. In
February 2005
, two of the three leases were amended, thereby increasing the total acreage under lease to
853
acres and increasing the annual lease payments to
$1.5 million
. In
July 2012
, Sabine Pass LNG entered into an additional land lease, thereby increasing the total acreage under lease to
883
acres. The annual lease payments are adjusted for inflation every
5 years
based on a consumer price index, as defined in the lease agreements.
In
November 2011
, Sabine Pass Liquefaction entered into a land lease of
80.7
acres to be used as the laydown area during the construction of the Liquefaction Project. The annual lease payment is
$138,000
. The lease has an initial term of
five
years, with options to renew for
five
1
-year extensions with similar terms as the initial term. In
December 2011
, Sabine Pass Liquefaction entered into a land lease of
80.6
acres to be used for the site of the Liquefaction Project. The annual lease payment is
$257,800
. The lease has an initial term of
30 years
, with options to renew for
six
10
-year extensions with similar terms as the initial term. The annual lease payment is adjusted for inflation every
5 years
based on a consumer price index, as defined in the lease agreement.
We recognized
$2.3 million
,
$1.8 million
and
$1.7 million
of site lease expense on our Consolidated Statements of Operations in
2012
,
2011
and
2010
, respectively.
LNG Terminal Commitments and Contingencies
Obligations under LNG TUAs
Sabine Pass LNG has entered into third-party TUAs with Total and Chevron to provide berthing for LNG vessels and for the unloading, storage and regasification of LNG at the Sabine Pass LNG terminal.
Obligations under Bechtel EPC Contracts
Sabine Pass Liquefaction has entered into lump sum turnkey contracts for the engineering, procurement and construction of Train 1 and Train 2 (the "EPC Contract (Train 1 and 2)") and Train 3 and Train 4 (the "EPC Contract (Train 3 and 4)", and together with the EPC Contract (Train 1 and 2), the "EPC Contracts"), with Bechtel in November 2011 and December 2012, respectively.
The EPC Contract (Train 1 and 2) provides that Sabine Pass Liquefaction will pay Bechtel a contract price of
$3.9 billion
, which is subject to adjustment by change order. Sabine Pass Liquefaction has the right to terminate the EPC Contract for its convenience, in which case Bechtel will be paid (i) the portion of the contract price for the work performed, (ii) costs reasonably incurred by Bechtel on account of such termination and demobilization, and (iii) a lump sum of up to
$30.0 million
depending on the termination date.
The EPC Contract (Train 3 and 4) with Bechtel provides for (i) the procurement, engineering, design, installation, training, commissioning and placing into service of Train 3 and Train 4 and related facilities and (ii) certain modifications and improvements to Train 1, Train 2 and the Sabine Pass LNG terminal. The EPC Contract (Train 3 and 4) provides that Sabine Pass Liquefaction will pay Bechtel a contract price of
$3.8 billion
, which is subject to adjustment by change order. Sabine Pass Liquefaction has the right to terminate the EPC Contract for its convenience, in which case Bechtel will be paid (i) the portion of the contract price for the work performed, (ii) costs reasonably incurred by Bechtel on account of such termination and demobilization, and (iii) a lump sum of between
$1.0 million
and
$2.5 million
depending on the termination date if the EPC Contract is terminated prior to issuance of the notice to proceed and up to
$30.0 million
depending on the termination date if the EPC Contract is terminated after issuance of the notice to proceed. If Sabine Pass Liquefaction fails to issue the notice to proceed by December 31, 2013, then either party may terminate the EPC Contract, and Bechtel will be paid costs reasonably incurred by Bechtel on account of such termination and a lump sum of
$5.0 million
.
93
CHENIERE ENERGY, INC. AND SUBSIDIARIES
NOTES TO CONSOLIDATED FINANCIAL STATEMENTS—Continued
Crest Royalty
Under a settlement agreement with Crest Energy dated as of June 14, 2001, we agreed to pay or cause certain affiliates, successors and assigns to pay a royalty, which we refer to as the Crest Royalty. This Crest Royalty was calculated based on the volume of natural gas processed through covered LNG facilities, subject to a minimum of
$2.0 million
and a maximum of approximately
$11.0 million
per production year. In 2003, Freeport LNG contractually assumed the obligation to pay the Crest Royalty for natural gas processed at Freeport LNG's receiving terminal. Subsequently, the calculation of the Crest Royalty and the scope of Freeport LNG's assumed obligation to pay the Crest Royalty became the subject of litigation involving Cheniere, Crest Energy, and Freeport LNG ("Crest Royalty Litigation").
In March 2012, we purchased all of the rights, title, and interest in the Crest Royalty from Crest Energy. In September 2012, we entered into a settlement of the remaining claims in the Crest Royalty Litigation with Freeport LNG. As part of the settlement agreement, we terminated the Crest Royalty. As a result of the settlement with Freeport LNG, we recorded
$13.2 million
as an other non-current asset on our Consolidated Balance Sheets that represents the discounted cash flow fair value of the expected proceeds from Freeport LNG over the next 20 years. The fair value was determined utilizing a discount rate based on counterparty credit risk. The difference from the fair value asset recorded and the actual cash proceeds will be recorded as interest income on our Consolidated Income Statement over the next
20 years
.
As a result of all of these transactions, we have resolved disputes persisting since 2001 related to real property at Freeport LNG and we have released certain of our subsidiaries from the first priority lien that had been granted to holders of the Crest Royalty, thereby improving our financial flexibility.
Restricted Net Assets
At December 31,
2012
, our restricted net assets of consolidated subsidiaries were approximately
$1,636.8 million
.
Other Commitments
In the ordinary course of business, we have issued surety bonds related to our offshore oil and gas operations and entered into certain multi-year licensing and service agreements, none of which are considered material to our financial position.
Legal Proceedings
We may in the future be involved as a party to various legal proceedings, which are incidental to the ordinary course of business. We regularly analyze current information and, as necessary, provide accruals for probable liabilities on the eventual disposition of these matters. In the opinion of management, as of December 31,
2012
, there were no threatened or pending legal matters that would have a material impact on our consolidated results of operations, financial position or cash flows.
We have two operating business segments: LNG terminal business and LNG and natural gas marketing business. We determine our reporting units by identifying each unit that engaged in business activities from which it may earn revenues and incur expenses, had operating results regularly reviewed by the entities' chief operating decision makers for purposes of resource allocation and performance assessment, and had discrete financial information.
Our LNG terminal business segment consists of the operational Sabine Pass LNG terminal, approximately
59.5%
owned (at
December 31, 2012
), located on the Sabine Pass deep water shipping channel less than four miles from the Gulf Coast, and two other LNG terminals that are in various stages of development at the following locations: Corpus Christi LNG,
100%
owned, near Corpus Christi, Texas; and Creole Trail LNG,
100%
owned, at the mouth of the Calcasieu Channel in central Cameron Parish, Louisiana. The Sabine Pass LNG terminal includes existing infrastructure of five LNG storage tanks with capacity of approximately
16.9
Bcfe, two docks that can accommodate vessels of up to
265,000
cubic meters and vaporizers with regasification capacity of approximately
4.0
Bcf/d and pipeline facilities interconnecting the Sabine Pass LNG terminal with a number of large interstate pipelines. Cheniere Partners is currently developing the Liquefaction Project at the Sabine Pass LNG terminal adjacent to the existing regasification facilities. During the fourth quarter of 2012, we merged our natural gas pipeline business segment into our
94
CHENIERE ENERGY, INC. AND SUBSIDIARIES
NOTES TO CONSOLIDATED FINANCIAL STATEMENTS—Continued
LNG terminal business segment because we were no longer developing or making resource allocation decisions on other pipeline projects not primarily related to our LNG terminals. We have adjusted the corresponding items of segment information for 2011 and 2010 to reflect this change.
Our LNG and natural gas marketing business segment consists of Cheniere Marketing marketing LNG and natural gas on its own behalf and assisting Cheniere Investments in an effort to monetize the other half of the LNG receiving capacity at the Sabine Pass LNG terminal during construction of the Liquefaction Project on behalf of Cheniere Partners.
The following table summarizes revenues, net income (loss) from operations and total assets for each of our operating segments (in thousands):
|
|
Segments
|
||||||||||||||
|
|
LNG Terminal
|
LNG & Natural Gas Marketing
|
Corporate and Other (1)
|
Total
Consolidation
|
|||||||||||
|
As of or for the Year Ended December 31, 2012
|
|||||||||||||||
|
Revenues (2)
|
$
|
274,037
|
|
$
|
4,182
|
|
$
|
(11,999
|
)
|
$
|
266,220
|
|
|||
|
Intersegment revenues (losses) (3) (4)
|
8,137
|
|
5,354
|
|
(13,491
|
)
|
—
|
|
|||||||
|
Depreciation, depletion and amortization
|
62,547
|
|
2,067
|
|
1,793
|
|
66,407
|
|
|||||||
|
Non-cash compensation
|
7,539
|
|
11,485
|
|
42,023
|
|
61,047
|
|
|||||||
|
Income (loss) from operations
|
5,176
|
|
(35,988
|
)
|
(45,020
|
)
|
(75,832
|
)
|
|||||||
|
Interest expense, net
|
(218,143
|
)
|
12
|
|
17,320
|
|
(200,811
|
)
|
|||||||
|
Goodwill
|
76,819
|
|
—
|
|
—
|
|
76,819
|
|
|||||||
|
Total assets
|
4,411,396
|
|
62,797
|
|
164,892
|
|
4,639,085
|
|
|||||||
|
Expenditures for additions to long-lived assets
|
1,233,577
|
|
(374
|
)
|
1,512
|
|
1,234,715
|
|
|||||||
|
As of or for the Year Ended December 31, 2011
|
|
|
|
|
|||||||||||
|
Revenues
|
$
|
274,322
|
|
$
|
13,554
|
|
$
|
2,568
|
|
$
|
290,444
|
|
|||
|
Intersegment revenues (losses) (3) (4)
|
14,655
|
|
(13,731
|
)
|
(924
|
)
|
—
|
|
|||||||
|
Depreciation, depletion and amortization
|
60,062
|
|
1,105
|
|
2,238
|
|
63,405
|
|
|||||||
|
Non-cash compensation
|
2,646
|
|
9,258
|
|
14,460
|
|
26,364
|
|
|||||||
|
Income (loss) from operations
|
119,337
|
|
(28,380
|
)
|
(32,811
|
)
|
58,146
|
|
|||||||
|
Interest expense, net
|
(219,323
|
)
|
—
|
|
(40,070
|
)
|
(259,393
|
)
|
|||||||
|
Goodwill
|
76,819
|
|
—
|
|
—
|
|
76,819
|
|
|||||||
|
Total assets
|
2,413,284
|
|
67,792
|
|
434,249
|
|
2,915,325
|
|
|||||||
|
Expenditures for additions to long-lived assets
|
9,875
|
|
16
|
|
732
|
|
10,623
|
|
|||||||
|
As of or for the Year Ended December 31, 2010
|
|
|
|
|
|||||||||||
|
Revenues
|
$
|
269,633
|
|
$
|
19,022
|
|
$
|
2,858
|
|
$
|
291,513
|
|
|||
|
Intersegment revenues (losses) (5) (6) (7)
|
131,209
|
|
(129,137
|
)
|
(2,072
|
)
|
—
|
|
|||||||
|
Depreciation, depletion and amortization
|
57,746
|
|
1,087
|
|
4,418
|
|
63,251
|
|
|||||||
|
Non-cash compensation
|
2,317
|
|
5,791
|
|
9,770
|
|
17,878
|
|
|||||||
|
Income (loss) from operations
|
251,796
|
|
(131,891
|
)
|
(15,282
|
)
|
104,623
|
|
|||||||
|
Interest expense, net
|
(244,633
|
)
|
—
|
|
(17,413
|
)
|
(262,046
|
)
|
|||||||
|
Goodwill
|
76,819
|
|
—
|
|
—
|
|
76,819
|
|
|||||||
|
Total assets
|
2,453,179
|
|
96,781
|
|
3,548
|
|
2,553,508
|
|
|||||||
|
Expenditures for additions to long-lived assets
|
4,583
|
|
(349
|
)
|
1,543
|
|
5,777
|
|
|||||||
|
(1)
|
Includes corporate activities, oil and gas exploration, development and exploitation activities and certain intercompany eliminations. Our oil and gas exploration, development and exploitation operating activities have been included in the corporate and other column due to the lack of a material impact that these activities have on our consolidated financial statements.
|
|
(2)
|
Substantially all of the LNG terminal revenues relate to regasification capacity reservation fee payments made by Total and Chevron.
|
95
CHENIERE ENERGY, INC. AND SUBSIDIARIES
NOTES TO CONSOLIDATED FINANCIAL STATEMENTS—Continued
|
(3)
|
Intersegment revenues related to our LNG terminal segment are primarily from tug revenues from Cheniere Marketing and the receipt of
80%
of gross margins earned by Cheniere Marketing in an effort to monetize the TUA capacity of Cheniere Energy Investments, LLC ("Cheniere Investments") at the Sabine Pass LNG terminal in the
year ended
December 31, 2012
and
2011
. These LNG terminal segment intersegment revenues are eliminated with intersegment expenses in our Consolidated Statements of Operations.
|
|
(4)
|
Intersegment revenues (losses) related to our LNG and natural gas marketing segment are primarily from Cheniere Marketing's tug costs and the payment of
80%
of gross margins earned by Cheniere Marketing in an effort to monetize the TUA capacity of Cheniere Investments at the Sabine Pass LNG terminal in the
year ended
December 31, 2012
and
2011
. These LNG terminal segment intersegment costs are eliminated with intersegment revenues in our Consolidated Statements of Operations.
|
|
(5)
|
Intersegment revenues related to our LNG terminal segment are primarily from TUA capacity reservation fee revenues and tug revenues of
$125.5 million
that were received from our LNG and natural gas marketing segment for the
year ended
December 31, 2010
. These LNG terminal segment intersegment revenues are eliminated with intersegment expenses in our Consolidated Statements of Operations.
|
|
(6)
|
Intersegment losses related to our LNG and natural gas marketing segment are primarily from TUA capacity reservation fee expenses and tug costs of
$125.5 million
that were incurred from our LNG terminal segment for the
year ended
December 31, 2010
. These costs and expenses are classified as marketing trading gains (losses) as they are considered capacity contracts related to our energy trading and risk management activities. These LNG and natural gas marketing segment intersegment costs and expenses are eliminated with intersegment revenues in our Consolidated Statements of Operations.
|
|
(7)
|
Intersegment losses related to corporate and other are from various transactions between our LNG terminal and LNG and natural gas marketing segments in which revenue recorded by one operating segment is eliminated with a non-revenue line item (i.e., operating expense or is capitalized) by the other operating segment.
|
The following table provides supplemental disclosure of cash flow information (in thousands):
|
|
Year Ended December 31,
|
|||||||||||
|
|
2012
|
2011
|
2010
|
|||||||||
|
Cash paid during the year for interest, net of amounts capitalized
|
$
|
200,323
|
|
$
|
190,849
|
|
$
|
263,520
|
|
|||
|
LNG terminal costs funded with accounts payable and accrued liabilities
|
99,751
|
|
—
|
|
—
|
|
||||||
Sabine Liquefaction Notes
In February 2013, Sabine Pass Liquefaction issued an aggregate principal amount of
$1.5 billion
of
5.625%
Senior Secured Notes due
2021
(the "Sabine Liquefaction Notes"). Net proceeds from the offering are intended to be used to pay capital costs incurred in connection with the construction of Train 1 and Train 2 of the Liquefaction Project in lieu of a portion of the commitments under the Liquefaction Credit Facility.
96
CHENIERE ENERGY, INC. AND SUBSIDIARIES
SUPPLEMENTAL INFORMATION TO CONSOLIDATED FINANCIAL STATEMENTS
SUMMARIZED QUARTERLY FINANCIAL DATA
(unaudited)
Quarterly Financial Data—(in thousands, except per share amounts)
|
|
First
Quarter
|
Second
Quarter
|
Third
Quarter
|
Fourth
Quarter
|
||||||||||||
|
Year ended December 31, 2012:
|
|
|
|
|
|
|
|
|
||||||||
|
Revenues
|
$
|
70,474
|
|
$
|
62,328
|
|
$
|
65,998
|
|
$
|
67,420
|
|
||||
|
Income (loss) from operations
|
721
|
|
(6,121
|
)
|
(54,517
|
)
|
(15,915
|
)
|
||||||||
|
Net loss
|
(58,853
|
)
|
(76,003
|
)
|
(111,876
|
)
|
(98,909
|
)
|
||||||||
|
Net loss attributable to common stockholders
|
(56,415
|
)
|
(73,040
|
)
|
(109,001
|
)
|
(94,324
|
)
|
||||||||
|
Net loss per share—basic and diluted
|
(0.43
|
)
|
(0.43
|
)
|
(0.52
|
)
|
(0.44
|
)
|
||||||||
|
Year ended December 31, 2011:
|
|
|
|
|
|
|
|
|
||||||||
|
Revenues
|
$
|
79,231
|
|
$
|
72,810
|
|
$
|
65,813
|
|
$
|
72,590
|
|
||||
|
Income from operations
|
23,566
|
|
16,461
|
|
10,355
|
|
7,764
|
|
||||||||
|
Net loss
|
(40,479
|
)
|
(48,456
|
)
|
(55,469
|
)
|
(58,934
|
)
|
||||||||
|
Net loss attributable to common stockholders
|
(39,838
|
)
|
(47,171
|
)
|
(53,936
|
)
|
(57,811
|
)
|
||||||||
|
Net loss per share—basic and diluted
|
(0.60
|
)
|
(0.67
|
)
|
(0.67
|
)
|
(0.54
|
)
|
||||||||
97
ITEM 9.
CHANGES IN AND DISAGREEMENTS WITH ACCOUNTANTS ON ACCOUNTING AND FINANCIAL
DISCLOSURE
None.
ITEM 9A.
CONTROLS AND PROCEDURES
Evaluation of Disclosure Controls and Procedures
Disclosure controls and procedures include, without limitation, controls and procedures designed to ensure that information required to be disclosed by us in reports we file or submit under the Exchange Act is recorded, processed, summarized and reported within the time periods specified in the SEC's rules and forms, and that such information is accumulated and communicated to our management, including our principal executive officer and principal financial officer, as appropriate, to allow timely decisions regarding required disclosure.
Based on their evaluation as of the end of the fiscal year ended December 31,
2012
, our principal executive officer and principal financial officer have concluded that our disclosure controls and procedures (as defined in Rules 13a-15(e) and 15d-15(e) under the Exchange Act) are effective to ensure that information required to be disclosed in reports that we file or submit under the Exchange Act are (i) accumulated and communicated to our management, including our principal executive officer and principal financial officer, as appropriate, to allow timely decisions regarding required disclosure and (ii) recorded, processed, summarized and reported within the time periods specified in the SEC’s rules and forms.
During the most recent fiscal quarter, there have been no changes in our internal control over financial reporting that have materially affected, or are reasonably likely to materially affect, our internal control over financial reporting.
Management’s Report on Internal Control Over Financial Reporting
Our Management's Report on Internal Control Over Financial Reporting is included in our Consolidated Financial Statements on page 63 and is incorporated herein by reference.
ITEM 9B.
OTHER INFORMATION
Sabine Pass LNG Notes
On October 16, 2012, Sabine Pass LNG, L.P. ("Sabine Pass LNG"), a wholly owned subsidiary of Cheniere Energy Partners, L.P., closed the sale of $420 million aggregate principal amount of its 6.5% Senior Secured Notes due 2020 (the "2020 Notes") pursuant to the Purchase Agreement dated October 1, 2012 by and among Sabine Pass LNG and Credit Suisse Securities (USA) LLC and HSBC Securities (USA) Inc., as representatives of the initial purchasers named therein (the "SPLNG Initial Purchasers"). The sale of the 2020 Notes was not registered under the Securities Act of 1933, as amended (the "Securities Act"), and the 2020 Notes were sold on a private placement basis in reliance on Section 4(2) of the Securities Act and Rule 144A and Regulation S thereunder.
Indenture
The 2020 Notes were issued pursuant to the Indenture, dated as of October 16, 2012 (the "SPLNG Indenture"), by and among Sabine Pass LNG, the guarantors that may become party thereto from time to time and The Bank of New York Mellon, as trustee. Under the terms of the SPLNG Indenture, the 2020 Notes will mature on November 1, 2020 and will accrue interest at a rate equal to 6.5% per annum on the principal amount from October 16, 2012, with such interest payable semi-annually, in cash in arrears, on May 1 and November 1 of each year, beginning May 1, 2013. The 2020 Notes are senior secured obligations of Sabine Pass LNG and rank senior in right of payment to any and all of Sabine Pass LNG's future indebtedness that is subordinated in right of payment to the 2020 Notes and equal in right of payment with all of Sabine Pass LNG's existing and future indebtedness that is senior and secured by the same collateral as that securing the 2020 Notes. The 2020 Notes are effectively senior to all of Sabine Pass LNG's senior indebtedness that is unsecured to the extent of the value of the assets constituting the collateral securing the 2020 Notes. The 2020 Notes are effectively subordinated to all of Sabine Pass LNG's indebtedness that is secured by assets other than the collateral securing the 2020 Notes, to the extent of the value of such assets, and is structurally subordinated to all indebtedness and other liabilities of Sabine Pass LNG's subsidiaries that do not provide guarantees with respect to the 2020 Notes.
98
As of October 16, 2012, the 2020 Notes were not guaranteed but will be guaranteed in the future by all of Sabine Pass LNG's future restricted subsidiaries that guarantee other indebtedness of Sabine Pass LNG, subject to certain exceptions. Such guarantees will be joint and several obligations of the guarantors of the 2020 Notes. The guarantees of the 2020 Notes will be senior secured obligations of the guarantors.
Sabine Pass LNG may, at its option, redeem all or part of the 2020 Notes at any time on or after November 1, 2016, at fixed redemption prices specified in the SPLNG Indenture, plus accrued and unpaid interest, if any, to the date of redemption. Sabine Pass LNG may also, at its option, redeem all or part of the 2020 Notes at any time prior to November 1, 2016, at a "make-whole" price set forth in the SPLNG Indenture, plus accrued and unpaid interest, if any, to the date of redemption. At any time before November 1, 2015, Sabine Pass LNG may, on one or more occasions, redeem up to 35% of the aggregate principal amount of the 2020 Notes at a redemption price of 106.5% of the principal amount of the 2020 Notes to be redeemed, plus accrued and unpaid interest, if any, to the redemption date, in an amount not to exceed the net proceeds of one or more completed equity offerings as long as it redeems the 2020 Notes within 180 days of completing such equity offering and at least 65% of the aggregate principal amount of the 2020 Notes issued under the SPLNG Indenture on October 16, 2012 remains outstanding after the redemption.
The SPLNG Indenture also contains customary terms, events of default and covenants relating to, among other things, incurring additional indebtedness or issuing preferred stock, making certain investments or paying dividends or distributions on capital stock or subordinated indebtedness or purchasing, redeeming or retiring capital stock, selling or transferring assets, including capital stock of Sabine Pass LNG's restricted subsidiaries, restricting dividends or other payments by Sabine Pass LNG's restricted subsidiaries, incurring liens, entering into transactions with affiliates, consolidating, merging, selling or leasing all or substantially all of Sabine Pass LNG's assets and entering into sale and leaseback transactions. In addition, Sabine Pass LNG will be required to deposit in a debt payment account one-sixth of the amount of interest due on the 2020 Notes and Sabine Pass LNG's outstanding 7.5% Senior Secured Notes due 2016 on the next interest payment date (plus any shortfall from any such month subsequent to the preceding interest payment date) at the end of each month. The SPLNG Indenture covenants are subject to a number of important limitations and exceptions.
This description of the SPLNG Indenture is qualified in its entirety by reference to the SPLNG Indenture, a copy of which is filed as Exhibit 4.1 to Sabine Pass LNG's Current Report on Form 8-K filed on October 19, 2012, and is incorporated by reference herein.
Registration Rights Agreement
In connection with the closing of the sale of the 2020 Notes, Sabine Pass LNG and the SPLNG Initial Purchasers entered into a Registration Rights Agreement, dated October 16, 2012 (the "Registration Rights Agreement"). Under the terms of the Registration Rights Agreement, Sabine Pass LNG has agreed, and any future guarantors of the 2020 Notes will agree, to use commercially reasonable efforts to file with the U.S. Securities and Exchange Commission and cause to become effective a registration statement with respect to an offer to exchange the 2020 Notes for a like aggregate principal amount of debt securities of Sabine Pass LNG issued under the SPLNG Indenture and identical in all material respects with the 2020 Notes (other than with respect to restrictions on transfer or to any increase in annual interest rate) that are registered under the Securities Act. Sabine Pass LNG has agreed, and any future guarantors of the 2020 Notes will agree, to use commercially reasonable efforts to cause such registration statement to become effective within 360 days after October 16, 2012. Under specified circumstances, Sabine Pass LNG has also agreed, and any future guarantors will also agree, to use commercially reasonable efforts to cause to become effective a shelf registration statement relating to resales of the Notes. Sabine Pass LNG will be obligated to pay additional interest if it fails to comply with its obligations to register the Notes within the specified time periods.
This description of the Registration Rights Agreement is qualified in its entirety by reference to the Registration Rights Agreement, a copy of which is filed as Exhibit 10.1 to Sabine Pass LNG's Current Report on Form 8-K, filed on October 19, 2012, and is incorporated by reference herein.
Sabine Pass Liquefaction Notes
On February 1, 2013, Sabine Pass Liquefaction, LLC ("Sabine Pass Liquefaction"), a wholly owned subsidiary of Cheniere Partners, closed the sale of $1.5 billion aggregate principal amount of its 5.625% Senior Secured Notes due 2021 (the "2021 Notes") pursuant to the Purchase Agreement dated January 29, 2013 (the "SPL Purchase Agreement") by and among Sabine Pass
99
Liquefaction and Morgan Stanley & Co. LLC, as representative of the initial purchasers named therein (the "SPL Initial Purchasers"). The sale of the 2021 Notes was not registered under the Securities Act, and the 2021 Notes were sold on a private placement basis in reliance on Section 4(2) of the Securities Act and Rule 144A and Regulation S thereunder.
Purchase Agreement
The SPL Purchase Agreement contains customary representations, warranties and agreements by Sabine Pass Liquefaction and customary conditions to closing and indemnification obligations of Sabine Pass Liquefaction and the SPL Initial Purchasers. The foregoing description of the SPL Purchase Agreement is not complete and is qualified in its entirety by reference to the full text of the SPL Purchase Agreement, which was filed as Exhibit 1.1 to Cheniere Partners' Current Report on Form 8-K, filed on February 4, 2013 and is incorporated by reference herein.
The SPL Initial Purchasers and certain of their affiliates have provided from time to time, and may provide in the future, certain investment and commercial banking and financial advisory services to Sabine Pass Liquefaction and Cheniere Partners in the ordinary course of business, for which they have received and may continue to receive customary fees and commissions.
Indenture
The 2021 Notes were issued pursuant to the Indenture, dated as of February 1, 2013 (the "SPL Indenture"), by and among Sabine Pass Liquefaction, the guarantors that may become party thereto from time to time and The Bank of New York Mellon, as trustee. Under the terms of the SPL Indenture, the 2021 Notes will mature on February 1, 2021 and will accrue interest at a rate equal to 5.625% per annum on the principal amount from February 1, 2013, with such interest payable semi-annually, in cash in arrears, on February 1 and August 1 of each year, beginning August 1, 2013. The 2021 Notes are senior secured obligations of Sabine Pass Liquefaction and rank senior in right of payment to any and all of Sabine Pass Liquefaction's future indebtedness that is subordinated in right of payment to the 2021 Notes and equal in right of payment with all of Sabine Pass Liquefaction's existing and future indebtedness that is senior and secured by the same collateral securing the 2021 Notes. The 2021 Notes are effectively senior to all of Sabine Pass Liquefaction's senior indebtedness that is unsecured to the extent of the value of the assets constituting the collateral securing the 2021 Notes.
As of February 1, 2013, the 2021 Notes were not guaranteed but will be guaranteed in the future by all of Sabine Pass Liquefaction's future restricted subsidiaries. Such guarantees will be joint and several obligations of the guarantors of the 2021 Notes. The guarantees of the 2021 Notes will be senior secured obligations of the guarantors.
At any time or from time to time prior to November 1, 2020, Sabine Pass Liquefaction may redeem all or a part of the 2021 Notes, at a redemption price equal to the "make-whole" price set forth in the SPL Indenture, plus accrued and unpaid interest, if any, to the date of redemption. Sabine Pass Liquefaction also may at any time on or after November 1, 2020, redeem the 2021 Notes, in whole or in part, at a redemption price equal to 100% of the principal amount of the 2021 Notes to be redeemed, plus accrued and unpaid interest, if any, to the date of redemption.
The SPL Indenture also contains customary terms and events of default and certain covenants that, among other things, limit Sabine Pass Liquefaction's ability and the ability of Sabine Pass Liquefaction's restricted subsidiaries to incur additional indebtedness or issue preferred stock, make certain investments or pay dividends or distributions on capital stock or subordinated indebtedness or purchase, redeem or retire capital stock, sell or transfer assets, including capital stock of Sabine Pass Liquefaction's restricted subsidiaries, restrict dividends or other payments by restricted subsidiaries, incur liens, enter into transactions with affiliates, consolidate, merge, sell or lease all or substantially all of Sabine Pass Liquefaction's assets and enter into certain LNG sales contracts. The SPL Indenture covenants are subject to a number of important limitations and exceptions.
This description of the SPL Indenture is qualified in its entirety by reference to the SPL Indenture, a copy of which was filed as Exhibit 4.1 to Cheniere Partners' Current Report on Form 8-K, filed on February 4, 2013 and is incorporated by reference herein.
100
Registration Rights Agreement
In connection with the closing of the sale of the 2021 Notes, Sabine Pass Liquefaction and Morgan Stanley & Co. LLC, as representative of the SPL Initial Purchasers, entered into a Registration Rights Agreement, dated February 1, 2013 (the "SPL Registration Rights Agreement"). Under the terms of the SPL Registration Rights Agreement, Sabine Pass Liquefaction has agreed, and any future guarantors of the 2021 Notes will agree, to use commercially reasonable efforts to file with the U.S. Securities and Exchange Commission and cause to become effective a registration statement with respect to an offer to exchange the 2021 Notes for a like aggregate principal amount of debt securities of Sabine Pass Liquefaction issued under the SPL Indenture and identical in all material respects with the 2021 Notes (other than with respect to restrictions on transfer or to any increase in annual interest rate) that are registered under the Securities Act. Sabine Pass Liquefaction has agreed, and any future guarantors of the 2021 Notes will agree, to use commercially reasonable efforts to cause such registration statement to become effective within 360 days after February 1, 2013. Under specified circumstances, Sabine Pass Liquefaction has also agreed, and any future guarantors will also agree, to use commercially reasonable efforts to cause to become effective a shelf registration statement relating to resales of the 2021 Notes. Sabine Pass Liquefaction will be obligated to pay additional interest if it fails to comply with its obligations to register the 2021 Notes within the specified time periods.
This description of the SPL Registration Rights Agreement is qualified in its entirety by reference to the SPL Registration Rights Agreement, a copy of which is filed as Exhibit 10.1 to Cheniere Partners' Current Report on Form 8-K, filed on February 4, 2013 and is incorporated by reference herein.
Amendment to SPA with KOGAS
On February 18, 2013, Sabine Pass Liquefaction and KOGAS entered into Amendment No. 1 of LNG Sale and Purchase Agreement. Amendment No. 1 amends the SPA entered into on January 30, 2012 between Sabine Pass Liquefaction and KOGAS to provide, among other things, that Sabine Pass Liquefaction will designate the date of the first commercial delivery of LNG from Train 3 within the 180-day period commencing 48 months after the date the conditions precedent have been satisfied or waived. The amendment aligns the start date of the KOGAS SPA with the completion dates in the EPC Contract (Train 3 and Train 4). In addition, Amendment No. 1 provides that the requirement that certain conditions precedent, including, but not limited to, receiving regulatory approvals, securing necessary financing arrangements and making a final investment decision to construct Train 3 be satisfied or waived on or prior to December 31, 2013, rather than June 30, 2013.
Amendment to SPA with GAIL
On February 18, 2013, Sabine Pass Liquefaction and GAIL entered into Amendment No. 1 of LNG Sale and Purchase Agreement. Amendment No. 1 amends the SPA entered into on December 11, 2011 between Sabine Pass Liquefaction and GAIL to provide, among other things, that Sabine Pass Liquefaction will designate the date of the first commercial delivery of LNG from Train 4 within the 180-day period commencing 57 months after the date the conditions precedent have been satisfied or waived. The amendment aligns the start date of the GAIL SPA with the completion dates in the EPC Contract (Train 3 and Train 4). In addition, Amendment No. 1 provides that the requirement that certain conditions precedent, including, but not limited to, receiving regulatory approvals, securing necessary financing arrangements and making a final investment decision to construct Train 4 be satisfied or waived on or prior to December 31, 2013, rather than June 30, 2013.
Pursuant to paragraph 3 of General Instruction G to Form 10-K, the information required by Items 10 through 14 of Part III of this Report is incorporated by reference from Cheniere’s definitive proxy statement, which is to be filed pursuant to Regulation 14A within 120 days after the end of Cheniere’s fiscal year ended December 31,
2012
.
101
ITEM 15.
EXHIBITS AND FINANCIAL STATEMENT SCHEDULES
|
(a)
|
Financial Statements, Schedules and Exhibits
|
|
(1)
|
Financial Statements—Cheniere Energy, Inc. and Subsidiaries:
|
|
(2)
|
Financial Statement Schedules:
|
(3) Exhibits:
|
Exhibit No.
|
Description
|
|
|
3.1*
|
Restated Certificate of Incorporation of the Company. (Incorporated by reference to Exhibit 3.1 to the Company's Quarterly Report on Form 10-Q for the fiscal quarter ended June 30, 2004 (SEC File No. 001-16383), filed on August 10, 2004)
|
|
|
3.2*
|
Certificate of Amendment of Restated Certificate of Incorporation of the Company. (Incorporated by reference to Exhibit 3.1 to the Company's Current Report on Form 8-K (SEC File No. 001-16383), filed on February 8, 2005)
|
|
|
3.3*
|
Certificate of Amendment of Restated Certificate of Incorporation of the Company. (Incorporated by reference to Exhibit 4.3 to the Company's Registration Statement on Form S-8 (SEC File No. 333-160017), filed on June 16, 2009)
|
|
|
3.4*
|
Certificate of Amendment of Restated Certificate of Incorporation of the Company. (Incorporated by reference to Exhibit 3.1 to the Company’s Current Report on Form 8-K (SEC File No. 001-16383), filed on June 7, 2012)
|
|
|
3.5*
|
Certificate of Amendment of Restated Certificate of Incorporation of the Company (Incorporated by reference to Exhibit 3.1 to the Company’s Current Report on 8-K (SEC File No. 001-16383), filed on February 5, 2013)
|
|
|
3.6*
|
Amended and Restated By-Laws of the Company. (Incorporated by reference to Exhibit 4.3 to the Company's Registration Statement on Form S-8 (SEC File No. 333-112379), filed on January 30, 2004)
|
|
|
3.7*
|
Amendment No. 1 to Amended and Restated By-Laws of the Company. (Incorporated by reference to Exhibit 3.1 to the Company's Quarterly Report on Form 10-Q (SEC File No. 001-16383), filed on May 6, 2005)
|
|
|
3.8*
|
Amendment No. 2 to the Amended and Restated By-Laws of Cheniere Energy, Inc. (Incorporated by reference to Exhibit 3.1 to the Company's Current Report on Form 8-K (SEC File No. 001-16383), filed on September 12, 2007)
|
|
|
4.1*
|
Specimen Common Stock Certificate of the Company. (Incorporated by reference to Exhibit 4.1 to the Company's Registration Statement on Form S-1 (SEC File No. 333-10905), filed on August 27, 1996)
|
|
|
4.2*
|
Indenture, dated as of November 9, 2006, between Sabine Pass LNG, L.P., as issuer, and The Bank of New York, as trustee. (Incorporated by reference to Exhibit 4.1 to the Company's Current Report on Form 8-K (SEC File No. 001-16383), filed on November 16, 2006)
|
|
|
4.3*
|
Form of 7.50% Senior Secured Note due 2016. (Included as Exhibit A1 to Exhibit 4.2 above)
|
|
102
|
4.4*
|
Indenture, dated as of October 16, 2012, by and among Sabine Pass LNG, L.P., the guarantors that may become party thereto from time to time and The Bank of New York Mellon, as trustee. (Incorporated by reference to Exhibit 4.1 to Sabine Pass LNG L.P.’s Current Report on Form 8-K (SEC File No. 001-138916), filed on October 19, 2012)
|
|
|
4.5*
|
Form of 6.5% Senior Secured Note due 2020. (Included as Exhibit A1 to Exhibit 4.4 above)
|
|
|
4.6*
|
Indenture, dated as of February 1, 2013, by and among Sabine Pass Liquefaction, LLC, the guarantors that may become party thereto from time to time and The Bank of New York Mellon, as trustee. (Incorporated by reference to Exhibit 4.1 to Cheniere Partners’ Current Report on Form 8-K (SEC File No. 001-33363), filed on February 4, 2013)
|
|
|
4.7*
|
Form of 5.625% Senior Secured Notes due 2021. (Included as Exhibit A-1 to Exhibit 4.6 above)
|
|
|
10.1*
|
LNG Terminal Use Agreement, dated September 2, 2004, by and between Total LNG USA, Inc. and Sabine Pass LNG, L.P. (Incorporated by reference to Exhibit 10.1 to the Company's Quarterly Report on Form 10-Q (SEC File No. 001-16383), filed on November 15, 2004)
|
|
|
10.2*
|
Amendment of LNG Terminal Use Agreement, dated January 24, 2005, by and between Total LNG USA, Inc. and Sabine Pass LNG, L.P. (Incorporated by reference to Exhibit 10.40 to the Company's Annual Report on Form 10-K (SEC File No. 001-16383), filed on March 10, 2005)
|
|
|
10.3*
|
Amendment to LNG Terminal Use Agreement, dated June 15, 2010, by and between Total Gas & Power North America, Inc. and Sabine Pass LNG, L.P. (Incorporated by reference to Exhibit 10.2 to the Company's Quarterly Report on Form 10-Q (SEC File No. 001-16383), filed on August 6, 2010)
|
|
|
10.4*
|
Letter Agreement, dated September 11, 2012, between Total Gas & Power North America, Inc. and Sabine Pass LNG, L.P. (Incorporated by reference to Exhibit 10.1 to Cheniere Partners’ Quarterly Report on Form 10-Q (SEC File No. 001-33366), filed on November 2, 2012)
|
|
|
10.5*
|
Omnibus Agreement, dated September 2, 2004, by and between Total LNG USA, Inc. and Sabine Pass LNG, L.P. (Incorporated by reference to Exhibit 10.2 to the Company's Quarterly Report on Form 10-Q (SEC File No. 001-16383), filed on November 15, 2004)
|
|
|
10.6*
|
Guaranty, dated as of November 9, 2004, by Total S.A. in favor of Sabine Pass LNG, L.P. (Incorporated by reference to Exhibit 10.3 to the Company's Quarterly Report on Form 10-Q (SEC File No. 001 16383), filed on November 15, 2004)
|
|
|
10.7*
|
LNG Terminal Use Agreement, dated November 8, 2004, between Chevron U.S.A. Inc. and Sabine Pass LNG, L.P. (Incorporated by reference to Exhibit 10.4 to the Company's Quarterly Report on Form 10-Q (SEC File No. 001-16383), filed on November 15, 2004)
|
|
|
10.8*
|
Amendment to LNG Terminal Use Agreement, dated December 1, 2005, by and between Chevron U.S.A. Inc. and Sabine Pass LNG, L.P. (Incorporated by reference to Exhibit 10.28 to Sabine Pass LNG, L.P.'s Registration Statement on Form S-4 (SEC File No. 333-138916), filed on November 22, 2006)
|
|
|
10.9*
|
Amendment of LNG Terminal Use Agreement, dated June 16, 2010, by and between Chevron U.S.A. Inc. and Sabine Pass LNG, L.P. (Incorporated by reference to Exhibit 10.3 to the Company's Quarterly Report on Form 10-Q (SEC File No. 001-16383), filed on August 6, 2010)
|
|
|
10.10*
|
Omnibus Agreement, dated November 8, 2004, between Chevron U.S.A., Inc. and Sabine Pass LNG, L.P. (Incorporated by reference to Exhibit 10.5 to the Company's Quarterly Report on Form 10-Q (SEC File No. 001-16383), filed on November 15, 2004)
|
|
|
10.11*
|
Guaranty Agreement, dated as of December 15, 2004, from ChevronTexaco Corporation to Sabine Pass LNG, L.P. (Incorporated by reference to Exhibit 10.12 to Sabine Pass LNG, L.P.'s Registration Statement on Form S-4 (SEC File No. 333-138916), filed on November 22, 2006)
|
|
|
10.12*
|
Second Amended and Restated Terminal Use Agreement, dated as of July 31, 2012, between Sabine Pass LNG, L.P. and Sabine Pass Liquefaction, LLC (Incorporated by reference to Exhibit 10.1 to Sabine Pass LNG, L.P.’s Current Report on Form 8-K (SEC File No. 333-138916), filed on August 6, 2012)
|
|
|
10.13*
|
Guarantee Agreement, dated as of July 31, 2012, by Cheniere Partners’ in favor of Sabine Pass LNG, L.P. (Incorporated by reference to Exhibit 10.1 to Sabine Pass LNG, L.P.’s Current Report on Form 8-K (SEC File No. 333-138916), filed on August 6, 2012)
|
|
103
|
10.14*
|
Cooperative Endeavor Agreement & Payment in Lieu of Tax Agreement, dated October 23, 2007. (Incorporated by reference to Exhibit 10.7 to the Company's Quarterly Report on Form 10-Q (SEC File No. 001-16383), filed on November 6, 2007)
|
|
|
10.15*
|
Amended and Restated LNG Sale and Purchase Agreement (FOB), dated January 25, 2012, between Sabine Pass Liquefaction, LLC (Seller) and BG Gulf Coast LNG, LLC (Buyer). (Incorporated by reference to Exhibit 10.1 to Cheniere Partners' Current Report on Form 8-K (SEC File No. 001-33366), filed on January 26, 2012)
|
|
|
10.16*
|
LNG Sale and Purchase Agreement (FOB), dated November 21, 2011, between Sabine Pass Liquefaction, LLC (Seller) and Gas Natural Aprovisionamientos SDG S.A. (Buyer). (Incorporated by reference to Exhibit 10.1 to Cheniere Partners' Current Report on Form 8-K (SEC File No. 001-33366), filed on November 21, 2011)
|
|
|
10.17*
|
LNG Sale and Purchase Agreement (FOB), dated December 11, 2011, between Sabine Pass Liquefaction, LLC (Seller) and GAIL (India) Limited (Buyer). (Incorporated by reference to Exhibit 10.1 to Cheniere Partners' Current Report on Form 8-K (SEC File No. 001-33366), filed on December 12, 2011)
|
|
|
10.18*
|
Amendment No. 1 of LNG Sale and Purchase Agreement (FOB), dated February 18, 2013, between Sabine Pass Liquefaction, LLC (Seller) and GAIL (India) Limited (Buyer). (Incorporated by reference to Exhibit 10.18 to Cheniere Partners' Annual Report on Form 10-K (SEC File No. 001-33366), filed on February 22, 2013)
|
|
|
10.19*
|
LNG Sale and Purchase Agreement (FOB), dated January 30, 2012, between Sabine Pass Liquefaction, LLC (Seller) and Korea Gas Corporation (Buyer). (Incorporated by reference to Exhibit 10.1 to Cheniere Partners' Current Report on Form 8-K (SEC File No. 001-33366), filed on January 30, 2012)
|
|
|
10.20*
|
Amendment No. 1 of LNG Sale and Purchase Agreement (FOB), dated February 18, 2013, between Sabine Pass Liquefaction, LLC (Seller) and Korea Gas Corporation (Buyer). (Incorporated by reference to Exhibit 10.20 to Cheniere Partners' Annual Report on Form 10-K (SEC File No. 001-33366), filed on February 22, 2013)
|
|
|
10.21*
|
LNG Sale and Purchase Agreement (FOB), dated May 14, 2012, by and between Sabine Pass Liquefaction, LLC and Cheniere Marketing, LLC. (Incorporated by reference to Exhibit 10.7 to Cheniere Partners’ Current Report on Form 8-K (SEC File No. 001-33366), filed on May 15, 2012)
|
|
|
10.22*
|
LNG Sale and Purchase Agreement (FOB), dated December 14, 2012, between Sabine Pass Liquefaction, LLC (Seller) and Total Gas & Power North America, Inc. (Buyer). (Incorporated by reference to Exhibit 10.1 to Cheniere Partners' Current Report on Form 8-K (SEC File No. 001-33366), filed on December 17, 2012)
|
|
|
10.23*
|
Lump Sum Turnkey Agreement for the Engineering, Procurement and Construction of the Sabine Pass LNG Liquefaction Facility, dated November 11, 2011, between Sabine Pass Liquefaction, LLC and Bechtel Oil, Gas and Chemicals, Inc. (Portions of this exhibit have been omitted and filed separately with the SEC pursuant to the SEC’s grant of a confidential treatment request.) (Incorporated by reference to Exhibit 10.1 to Cheniere Partners' Current Report on Form 8-K (SEC File No. 001-33366), filed on November 14, 2011)
|
|
|
10.24*
|
Change orders to the Lump Sum Turnkey Agreement for the Engineering, Procurement and Construction of the Sabine Pass LNG Liquefaction Facility, dated as of November 11, 2011, between Sabine Pass Liquefaction, LLC and Bechtel Oil, Gas and Chemicals, Inc.: (i) the Change Order CO-0001 EPC Terms and Conditions, dated May 1, 2012, (ii) the Change Order CO-0002 Heavies Removal Unit, dated May 23, 2012, (iii) the Change Order CO-0003 LNTP, dated June 6, 2012, (iv) the Change Order CO-0004 Addition of Inlet Air Humidification, dated July 10, 2012, (v) the Change Order CO-0005 Replace Natural Gas Generators with Diesel Generators, dated July 10, 2012, (vi) the Change Order CO-0006 Flange Reduction and Valve Positioners, dated July 12, 2012, and (vii) the Change Order CO-0007 Relocation of Temporary Facilities, Power Poles Relocation Reimbursement, and Duck Blind Road Improvement Reimbursement, dated July 13, 2012. (Incorporated by reference to Exhibit 10.1 to Cheniere Partners’ Quarterly Report on Form 10-Q (SEC File No. 001-33366), filed on August 3, 2012)
|
|
|
10.25*
|
Change orders to the Lump Sum Turnkey Agreement for the Engineering, Procurement and Construction of the Sabine Pass LNG Liquefaction Facility, dated as of November 11, 2011, between Sabine Pass Liquefaction, LLC and Bechtel Oil, Gas and Chemicals, Inc.: (i) the Change Order CO-0008 Delay in Full Placement of Insurance, dated July 27, 2012, (ii) the Change Order CO-0009 HAZOP Action Items, dated July 31, 2012, (iii) the Change Order CO-0010 Fuel Provisional Sum, dated August 8, 2012, (iv) the Change Order CO-0011 Currency Provisional Sum, dated August 8, 2012, (v) the Change Order CO-0012 Delay in NTP, dated August 8, 2012, and (vi) the Change Order CO-0013 Early EPC Work Credit, dated August 29, 2012. (Incorporated by reference to Exhibit 10.2 to Cheniere Partners’ Quarterly Report on Form 10-Q (SEC File No. 001-33366), filed on November 2, 2012)
|
|
104
|
10.26*
|
Change orders to the Lump Sum Turnkey Agreement for the Engineering, Procurement and Construction of the Sabine Pass LNG Liquefaction Facility, dated as of November 11, 2011, between Sabine Pass Liquefaction, LLC and Bechtel Oil, Gas and Chemicals, Inc.: (i) the Change Order CO-0014 Bundle of Changes, dated September 5, 2012, (ii) the Change Order CO-0015 Static Mixer, Air Cooler Walkways, etc., dated November 8, 2012, (iii) the Change Order CO-0016 Delay in Full Placement of Insurance, dated October 29, 2012, (iv) the Change Order CO-0017 Condensate Header, dated December 3, 2012 and (v) the Change Order CO-0018 Increase in Power Requirements, dated January 17, 2013. (Portions of this exhibit have been omitted and filed separately with the SEC pursuant to a request for confidential treatment.) (Incorporated by reference to Exhibit 10.26 to Cheniere Partners’ Annual Report on Form 10-K (SEC File No. 001-33366), filed on February 22, 2013)
|
|
|
10.27*
|
Change orders to the Lump Sum Turnkey Agreement for the Engineering, Procurement and Construction of the Sabine Pass LNG Liquefaction Facility, dated as of November 11, 2011, between Sabine Pass Liquefaction, LLC and Bechtel Oil, Gas and Chemicals, Inc.: (i) the Change Order CO-0014 Bundle of Changes, dated September 5, 2012, (ii) the Change Order CO-0015 Static Mixer, Air Cooler Walkways, etc., dated November 8, 2012, (iii) the Change Order CO-0016 Delay in Full Placement of Insurance, dated October 29, 2012 and (iv) the Change Order CO-0017 Condensate Header, dated December 3, 2012.(Portions of this exhibit have been omitted and filed separately with the SEC pursuant to a request for confidential treatment.) (Incorporated by reference to Exhibit 10.1 to Cheniere Partners’ Annual Report on Form 10-K (SEC File No. 001-33366), filed on February 22, 2013)
|
|
|
10.28*
|
Lump Sum Turnkey Agreement for the Engineering, Procurement and Construction of the Sabine Pass LNG Stage 2 Liquefaction Facility, dated December 20, 2012, by and between Sabine Pass Liquefaction, LLC and Bechtel Oil, Gas and Chemicals, Inc. (Portions of this exhibit have been omitted and filed separately with the SEC pursuant to the SEC’s grant of a confidential treatment request.) (Incorporated by reference to Exhibit 10.1 to Cheniere Partners’ Current Report on Form 8-K (SEC File No. 001-33366), filed on December 27, 2012)
|
|
|
10.29*
|
LNG Lease Agreement, dated June 24, 2008, between Cheniere Marketing, Inc. and Sabine Pass LNG, L.P. (Incorporated by reference to Exhibit 10.7 to the Company's Quarterly Report on Form 10-Q (SEC File No. 001-16383), filed on August 11, 2008)
|
|
|
10.30*
|
LNG Lease Agreement, dated September 30, 2011, by and between Cheniere Marketing, LLC and Cheniere Energy Investments, LLC. (Incorporated by reference to Exhibit 10.3 to the Company's Quarterly Report on Form 10-Q (SEC File No. 001-16383), filed on November 7, 2011)
|
|
|
10.31*
|
Collateral Trust Agreement, dated November 9, 2006, by and among Sabine Pass LNG, L.P., The Bank of New York, as collateral trustee, Sabine Pass LNG-GP, Inc. and Sabine Pass LNG-LP, LLC. (Incorporated by reference to Exhibit 10.1 to the Company's Current Report on Form 8-K (SEC File No. 001-16383), filed on November 16, 2006)
|
|
|
10.32*
|
Amended and Restated Parity Lien Security Agreement, dated November 9, 2006, by and between Sabine Pass LNG, L.P. and The Bank of New York, as collateral trustee. (Incorporated by reference to Exhibit 10.2 to the Company's Current Report on Form 8-K (SEC File No. 001-16383), filed on November 16, 2006)
|
|
|
10.33*
|
Third Amended and Restated Multiple Indebtedness Mortgage, Assignment of Rents and Leases and Security Agreement, dated November 9, 2006, between Sabine Pass LNG, L.P. and The Bank of New York, as collateral trustee. (Incorporated by reference to Exhibit 10.3 to the Company's Current Report on Form 8-K (SEC File No. 001-16383), filed on November 16, 2006)
|
|
|
10.34*
|
Amended and Restated Parity Lien Pledge Agreement, dated November 9, 2006, by and among Sabine Pass LNG, L.P., Sabine Pass LNG-GP, Inc., Sabine Pass LNG-LP, LLC and The Bank of New York, as collateral trustee. (Incorporated by reference to Exhibit 10.4 to the Company's Current Report on Form 8-K (SEC File No. 001-16383), filed on November 16, 2006)
|
|
|
10.35*
|
Security Deposit Agreement, dated November 9, 2006, by and among Sabine Pass LNG, L.P., The Bank of New York, as collateral trustee, and The Bank of New York, as depositary agent. (Incorporated by reference to Exhibit 10.5 to the Company's Current Report on Form 8-K (SEC File No. 001-16383), filed on November 16, 2006)
|
|
|
10.36*
|
Amended and Restated Investors' Agreement, dated September 13, 2011, by and among Cheniere Energy, Inc., Cheniere Common Units Holding, LLC, and Scorpion Capital Partners, LP. (Incorporated by reference to Exhibit 10.1 to the Company's Quarterly Report on Form 10-Q (SEC File No. 001-16383), filed November 7, 2011)
|
|
|
10.37*
|
Master Ex-Ship LNG Sales Agreement, dated April 26, 2007, between Cheniere Marketing, Inc. and Gaz de France International Trading S.A.S., including Letter Agreement, dated April 26, 2007, and Specific Order No. 1, dated April 26, 2007. (Incorporated by reference to Exhibit 10.2 to the Company's Quarterly Report on Form 10-Q (SEC File No. 001-16383), filed on May 8, 2007)
|
|
105
|
10.38*
|
GDF Transatlantic Option Agreement, dated April 26, 2007, between Cheniere Marketing, Inc. and Gaz de France International Trading S.A.S. (Incorporated by reference to Exhibit 10.3 to the Company's Quarterly Report on Form 10-Q (SEC File No. 001-16383), filed on May 8, 2007)
|
|
|
10.39*
|
Unit Purchase Agreement, dated May 14, 2012, by and among Cheniere Energy Partners, L.P., Cheniere Energy, Inc. and Blackstone CQP Holdco LP. (Incorporated by reference to Exhibit 10.1 to Cheniere Partners’ Current Report on Form 8-K (SEC File No. 001-33366), filed on May 15, 2012)
|
|
|
10.40*
|
Letter Agreement, dated as of August 9, 2012, among Cheniere Energy, Inc., Cheniere Energy Partners, L.P. and Blackstone CQP Holdco LP. (Incorporated by reference to Exhibit 10.1 to Cheniere Partners' Current Report on Form 8-K (SEC File No. 001-33366), filed on August 9, 2012)
|
|
|
10.41*
|
Class B Unit Purchase Agreement, dated as of May 14, 2012, by and between Cheniere Energy Partners, L.P. and Cheniere LNG Terminals, Inc. (Incorporated by reference to Exhibit 10.2 to Cheniere Partners’ Current Report on Form 8-K (SEC File No. 001-33366), filed on May 15, 2012)
|
|
|
10.42*
|
First Amendment to Class B Unit Purchase Agreement, dated as of August 9, 2012, by and between Cheniere Energy Partners, L.P. and Cheniere Class B Units Holdings, LLC. (Incorporated by reference to Exhibit 10.3 to Cheniere Partners' Current Report on Form 8-K (SEC File No. 001-33366), filed on August 9, 2012)
|
|
|
10.43*
|
Investors’ and Registration Rights Agreement, dated as of July 31, 2012, by and among Cheniere Energy, Inc., Cheniere Energy Partners, L.P., Cheniere Energy Partners GP, LLC, Cheniere Class B Units Holdings, LLC, Blackstone CQP Holdco LP and the other investors party thereto from time to time. (Incorporated by reference to Exhibit 10.1 to Cheniere Partners’ Current Report on 8-K (SEC File No. 001-33366), filed on August 6, 2012)
|
|
|
10.44*
|
Amended and Restated Purchase and Sale Agreement, dated as of August 9, 2012, by and among Cheniere Energy Partners, L.P., Cheniere Pipeline Company, Grand Cheniere Pipeline, LLC and Cheniere Energy, Inc. (Incorporated by reference to Exhibit 10.2 to Cheniere Partners' Current Report on Form 8-K (SEC File No. 001-33366), filed on August 9, 2012)
|
|
|
10.45*
|
Subscription Agreement, dated May 14, 2012, by and between Cheniere Energy Partners, L.P. and Cheniere LNG Terminals, Inc. (Incorporated by reference to Exhibit 10.4 to Cheniere Partners’ Current Report on Form 8-K (SEC File No. 001-33366), filed on May 15, 2012)
|
|
|
10.46*
|
Credit Agreement (Term Loan A), dated as of July 31, 2012, among Sabine Pass Liquefaction, LLC, Société Générale, as Term Loan A Administrative Agent and Common Security Trustee, and the lenders party thereto from time to time. (Incorporated by reference to Exhibit 10.4 to Cheniere Partners’ Current Report on 8-K (SEC File No. 001-33366), filed on August 6, 2012)
|
|
|
10.47*
|
Common Terms Agreement, dated as of July 31, 2012, among Sabine Pass Liquefaction, LLC, the Secured Debt Holder Group Representatives, the Secured Hedge Representatives, the Secured Gas Hedge Representatives, the Intercreditor Agent and Société Générale, as Common Security Trustee. (Incorporated by reference to Exhibit 10.5 to Cheniere Partners’ Current Report on 8-K (SEC File No. 001-33366), filed on August 6, 2012)
|
|
|
10.48*†
|
Cheniere Energy, Inc. Amended and Restated 1997 Stock Option Plan. (Incorporated by reference to Exhibit 10.14 to the Company's Quarterly on Form 10-Q (SEC File No. 000-16383), filed on November 4, 2005)
|
|
|
10.49*†
|
Form of Amendment to Nonqualified Stock Option Agreement under the Cheniere Energy, Inc. Amended and Restated 1997 Stock Option Plan pursuant to the Nonqualified Stock Option Agreement. (Incorporated by reference to Exhibit 10.6 to the Company's Quarterly Report on Form 10-Q (SEC File No. 001-16383), filed on November 7, 2008)
|
|
|
10.50*†
|
Cheniere Energy, Inc. Amended and Restated 2003 Stock Incentive Plan. (Incorporated by reference to Exhibit 10.14 to the Company's Quarterly Report on Form 10-Q (SEC File No. 001-16383), filed on November 4, 2005)
|
|
|
10.51*†
|
Addendum to Cheniere Energy, Inc. Amended and Restated 2003 Stock Incentive Plan (Incorporated by reference to Exhibit 10.3 to the Company's Annual Report on Form 10-K for the year ended December 31, 2005 (SEC File No. 001-16383), filed on March 13, 2006)
|
|
|
10.52*†
|
Amendment No. 1 to Cheniere Energy, Inc. Amended and Restated 2003 Stock Incentive Plan. (Incorporated by reference to Exhibit 4.10 to the Company's Registration Statement on Form S-8 (SEC File No. 333-134886), filed on June 9, 2006)
|
|
106
|
10.53*†
|
Amendment No. 2 to Cheniere Energy, Inc. Amended and Restated 2003 Stock Incentive Plan. (Incorporated by reference to Exhibit 10.84 to the Company's Annual Report on Form 10-K (SEC File No. 001-16383), filed on February 27, 2007)
|
|
|
10.54*†
|
Amendment No. 3 to Cheniere Energy, Inc. Amended and Restated 2003 Stock Incentive Plan. (Incorporated by reference to Exhibit A to the Company's Proxy Statement (SEC File No. 001-16383), filed on April 23, 2008)
|
|
|
10.55*†
|
Amendment No. 4 to the Cheniere Energy, Inc. Amended and Restated 2003 Stock Incentive Plan. (Incorporated by reference to Exhibit 10.2 to the Company' Current Report on Form 8-K (SEC File No. 001-16383), filed on June 15, 2009)
|
|
|
10.56*†
|
Form of Non-Qualified Stock Option Grant for Employees and Consultants (three-year vesting) under the Cheniere Energy, Inc. Amended and Restated 2003 Stock Incentive Plan. (Incorporated by reference to Exhibit 10.2 to the Company' Current Report on Form 8-K (SEC File No. 001-16383), filed on January 11, 2007)
|
|
|
10.57*†
|
Form of Non-Qualified Stock Option Grant for Employees and Consultants (four-year vesting) under the Cheniere Energy, Inc. Amended and Restated 2003 Stock Incentive Plan. (Incorporated by reference to Exhibit 10.3 to the Company' Current Report on Form 8-K (SEC File No. 001-16383), filed on January 11, 2007)
|
|
|
10.58*†
|
Form of Non-Qualified Stock Option Grant for Non-Employee Directors under the Cheniere Energy, Inc. Amended and Restated 2003 Stock Incentive Plan. (Incorporated by reference to Exhibit 10.4 to the Company' Current Report on Form 8-K (SEC File No. 001-16383), filed on January 11, 2007)
|
|
|
10.59*†
|
Form of Amendment to Non-Qualified Stock Option Grant under the Cheniere Energy, Inc. Amended and Restated 2003 Stock Incentive Plan. (Incorporated by reference to Exhibit 10.7 to the Company' Quarterly Report on Form 10-Q (SEC File No. 001-16383), filed on November 7, 2008)
|
|
|
10.60*†
|
Form of Restricted Stock Grant (three-year vesting) under the Cheniere Energy, Inc. Amended and Restated 2003 Stock Incentive Plan. (Incorporated by reference to Exhibit 10.5 to the Company' Current Report on Form 8-K (SEC File No. 001-16383), filed on January 11, 2007)
|
|
|
10.61*†
|
Form of Restricted Stock Grant (four-year vesting) under the Cheniere Energy, Inc. Amended and Restated 2003 Stock Incentive Plan. (Incorporated by reference to Exhibit 10.6 to the Company' Current Report on Form 8-K (SEC File No. 001-16383), filed on January 11, 2007)
|
|
|
10.62*†
|
Form of Restricted Stock Agreement for Non-Employee Directors. (Incorporated by reference to Exhibit 10.2 to the Company's Current Report on Form 8-K (SEC File No. 001-16383), filed on June 1, 2007)
|
|
|
10.63*†
|
Form of Cancellation and Grant of Non-Qualified Stock Options (three-year vesting) under the Cheniere Energy, Inc. 2003 Stock Incentive Plan. (Incorporated by reference to Exhibit 10.1 to the Company's Current Report on Form 8-K (SEC File No. 001-16383), filed on August 2, 2005)
|
|
|
10.64*†
|
Form of Amendment to Non-Qualified Stock Option Agreement. (Incorporated by reference to Exhibit 10.1 to the Company's Current Report on Form 8-K (SEC File No. 001-16383), filed on April 3, 2007)
|
|
|
10.65*†
|
Form of French Stock Option Grant for Employees and Consultants (four-year vesting) under the Cheniere Energy, Inc. Amended and Restated 2003 Stock Incentive Plan. (Incorporated by reference to Exhibit 10.91 to the Company's Annual Report on Form 10-K (SEC File No. 001-16383), filed on February 27, 2007)
|
|
|
10.66*†
|
Form of French Restricted Shares Grant for Employees, Consultants and Non-Employee Directors (three-year vesting) under the Cheniere Energy, Inc. Amended and Restated 2003 Stock Incentive Plan. (Incorporated by reference to Exhibit 10.92 to the Company's Annual Report on Form 10-K (SEC File No. 001-16383), filed on February 27, 2007)
|
|
|
10.67*†
|
Form of French Restricted Shares Grant for Employees, Consultants and Non-Employee Directors (four-year vesting) under the Cheniere Energy, Inc. Amended and Restated 2003 Stock Incentive Plan. (Incorporated by reference to Exhibit 10.93 to the Company's Annual Report on Form 10-K (SEC File No. 001-16383), filed on February 27, 2007)
|
|
|
10.68*†
|
Indefinite Term Employment Agreement, dated February 20, 2006, between Cheniere International, Inc. and Jean Abiteboul; Letter Agreement, dated February 23, 2006, between Cheniere Energy, Inc. and Jean Abiteboul; Amendment to a Contract of Employment, dated March 20, 2007, between Cheniere LNG Services SARL and Jean Abiteboul; and Amendment to Indefinite Term Contract of Employment, dated January 18, 2008, between Cheniere LNG Services and Jean Abiteboul. (Incorporated by reference to Exhibit 10.94 to the Company's Annual Report on Form 10-K (SEC File No. 001-16383), filed on February 27, 2009)
|
|
107
|
10.69*†
|
Second Amendment to Contract of Employment dated effective April 30, 2012 by and between Jean Abiteboul and Cheniere Supply & Marketing, Inc. (Incorporated by reference to Exhibit 99.1 to the Company’s Current Report on Form 8-K (SEC File No. 001-16383), filed on April 27, 2012)
|
|
|
10.70†
|
Summary of Compensation for Executive Officers.
|
|
|
10.71†
|
Summary of Compensation for Non-Employee Directors.
|
|
|
10.72*†
|
Cheniere Energy, Inc. 2008 Change of Control Cash Payment Plan. (Incorporated by reference to Exhibit 10.5 to the Company's Current Report on Form 8-K (SEC File No. 001-16383), filed on May 14, 2008)
|
|
|
10.73*†
|
Form of Change of Control Agreement. (Incorporated by reference to Exhibit 10.6 to the Company's Current Report on Form 8-K (SEC File No. 001-16383), filed on May 14, 2008)
|
|
|
10.74*†
|
Form of Release and Separation Agreement. (Incorporated by reference to Exhibit 10.7 to the Company's Current Report on Form 8-K (SEC File No. 001-16383), filed on May 14, 2008)
|
|
|
10.75*†
|
Form of 2009 Phantom Stock Grant (Incorporated by reference to Exhibit 10.1 to the Company's Current Report on Form 8-K (SEC File No. 001-16383), filed on February 27, 2009)
|
|
|
10.76*†
|
Form of Indemnification Agreement for directors of Cheniere Energy, Inc. (Incorporated by reference to Exhibit 10.1 to the Company's Current Report on Form 8-K (SEC File No. 001-16383), filed on December 19, 2008)
|
|
|
10.77*†
|
Form of Indemnification Agreement for officers of Cheniere Energy, Inc. (Incorporated by reference to Exhibit 10.1 to the Company's Current Report on Form 8-K (SEC File No. 001-16383), filed on April 6, 2009)
|
|
|
10.78*†
|
Form of Long-Term Incentive Award - Restricted Stock Grant. (Incorporated by reference to Exhibit 10.1 to the Company's Current Report on Form 8-K (SEC File No. 001-16383), filed on January 10, 2011)
|
|
|
10.79*†
|
Cheniere Energy, Inc. 2011 Incentive Plan. (Incorporated by reference to Exhibit 10.1 to the Company's Current Report on Form 8-K (SEC File No. 001-16383), filed on June 22, 2011)
|
|
|
10.80*†
|
Amendment No. 1 to the Cheniere Energy, Inc. 2011 Incentive Plan. (Incorporated by reference to Exhibit 10.1 to the Company’s Current Report on Form 8-K (SEC File No. 001-16383), filed on February 5, 2013)
|
|
|
10.81*†
|
Cheniere Energy, Inc. 2011 - 2013 Bonus Plan. (Incorporated by reference to Exhibit 10.1 to the Company's Current Report on Form 8-K (SEC File No. 001-16383), filed March 8, 2011)
|
|
|
10.82*†
|
Form of 2011 - 2013 Bonus Plan Long-Term Commercial Cash Award (US - Executive Form). (Incorporated by reference to Exhibit 10.1 to the Company’s Current Report on Form 8-K (SEC File No. 001-16383), filed on August 10, 2012)
|
|
|
10.83*†
|
Form of 2011 - 2013 Bonus Plan Restricted Stock Grant under the 2011 Incentive Plan (US - Executive Form). (Incorporated by reference to Exhibit 10.2 to the Company’s Current Report on Form 8-K (SEC File No. 001-16383), filed on August 10, 2012)
|
|
|
10.84*†
|
Form of 2011 - 2013 Bonus Plan Long-Term Commercial Cash Award (US Form). (Incorporated by reference to Exhibit 10.3 to the Company’s Current Report on Form 8-K (SEC File No. 001-16383), filed on August 10, 2012)
|
|
|
10.85*†
|
Form of 2011 - 2013 Bonus Plan Restricted Stock Grant under the 2011 Incentive Plan (US Form). (Incorporated by reference to Exhibit 10.4 to the Company’s Current Report on Form 8-K (SEC File No. 001-16383), filed on August 10, 2012)
|
|
|
10.86*†
|
Form of 2011 - 2013 Bonus Plan Long-Term Commercial Cash Award (UK - Executive Form). (Incorporated by reference to Exhibit 10.5 to the Company’s Current Report on Form 8-K (SEC File No. 001-16383), filed on August 10, 2012)
|
|
|
10.87*†
|
Form of 2011 - 2013 Bonus Plan Restricted Stock Grant under the 2011 Incentive Plan (UK - Executive). (Incorporated by reference to Exhibit 10.6 to the Company’s Current Report on Form 8-K (SEC File No. 001-16383), filed on August 10, 2012)
|
|
|
10.88*†
|
Form of 2011 - 2013 Bonus Plan Long-Term Commercial Cash Award (UK Form). (Incorporated by reference to Exhibit 10.7 to the Company’s Current Report on Form 8-K (SEC File No. 001-16383), filed on August 10, 2012)
|
|
108
|
10.89*†
|
Form of 2011 - 2013 Bonus Plan Restricted Stock Grant under the 2011 Incentive Plan (UK Form). (Incorporated by reference to Exhibit 10.8 to the Company’s Current Report on Form 8-K (SEC File No. 001-16383), filed on August 10, 2012)
|
|
|
10.90*†
|
Form of 2011 - 2013 Bonus Plan Long-Term Commercial Cash Award (US - Consultant/Independent Contractor). (Incorporated by reference to Exhibit 10.9 to the Company’s Current Report on Form 8-K (SEC File No. 001-16383), filed on August 10, 2012)
|
|
|
10.91*†
|
Form of 2011 - 2013 Bonus Plan Restricted Stock Grant under the 2011 Incentive Plan (US - Consultant/Independent Contractor). (Incorporated by reference to Exhibit 10.10 to the Company’s Current Report on Form 8-K (SEC File No. 001-16383), filed on August 10, 2012)
|
|
|
10.92*†
|
Form of Restricted Stock Grant under the Cheniere Energy, Inc. Amended and Restated 2003 Stock Incentive Plan (US - New Hire). (Incorporated by reference to Exhibit 10.11 to the Company’s Current Report on Form 8-K (SEC File No. 001-16383), filed on August 10, 2012)
|
|
|
10.93*†
|
Form of Restricted Stock Grant under the Cheniere Energy, Inc. Amended and Restated 2003 Stock Incentive Plan (UK - New Hire). (Incorporated by reference to Exhibit 10.12 to the Company’s Current Report on Form 8-K (SEC File No. 001-16383), filed on August 10, 2012)
|
|
|
10.94*†
|
Form of Restricted Stock Grant under the Cheniere Energy, Inc. 2011 Incentive Plan (US - New Hire). (Incorporated by reference to Exhibit 10.13 to the Company’s Current Report on Form 8-K (SEC File No. 001-16383), filed on August 10, 2012)
|
|
|
10.95*†
|
Form of Restricted Stock Grant under the Cheniere Energy, Inc. 2011 Incentive Plan (UK - New Hire). (Incorporated by reference to Exhibit 10.14 to the Company’s Current Report on Form 8-K (SEC File No. 001-16383), filed on August 10, 2012)
|
|
|
10.96†
|
Form of 2011 – 2013 Bonus Plan Restricted Stock Grant (Train 3 and Train 4) under the 2011 Incentive Plan (US Executive Form)
|
|
|
10.97†
|
Form of 2011 – 2013 Bonus Plan Restricted Stock Grant (Train 3 and Train 4) under the 2003 Stock Incentive Plan (US Executive Form)
|
|
|
10.98†
|
Form of 2011 – 2013 Bonus Plan Restricted Stock Grant (Train 3 and Train 4) under the 2011 Incentive Plan (US Non-Executive Form)
|
|
|
10.99†
|
Form of 2011 – 2013 Bonus Plan Restricted Stock Grant (Train 3 and Train 4) under the 2003 Stock Incentive Plan (US Non-Executive Form)
|
|
|
10.100†
|
Form of 2011 – 2013 Bonus Plan Restricted Stock Grant (Train 3 and Train 4) under the 2011 Incentive Plan (UK Executive Form)
|
|
|
10.101†
|
Form of 2011 – 2013 Bonus Plan Restricted Stock Grant (Train 3 and Train 4) under the 2011 Incentive Plan (UK Non-Executive Form)
|
|
|
10.102†
|
Form of 2011 – 2013 Bonus Plan Restricted Stock Grant (Train 3 and Train 4) under the 2011 Incentive Plan (US Consultant Form)
|
|
|
21.1
|
Subsidiaries of Cheniere Energy, Inc.
|
|
|
23.1
|
Consent of Ernst & Young LLP
|
|
|
31.1
|
Certification by Chief Executive Officer required by Rule 13a-14(a) and 15d-14(a) under the Exchange Act
|
|
|
31.2
|
Certification by Chief Financial Officer required by Rule 13a-14(a) and 15d-14(a) under the Exchange Act
|
|
|
32.1
|
Certification by Chief Executive Officer pursuant to 18 U.S.C. Section 1350, as adopted pursuant to Section 906 of the Sarbanes-Oxley Act of 2002
|
|
|
32.2
|
Certification of Chief Financial Officer pursuant to 18 U.S.C. Section 1350, as adopted pursuant to Section 906 of the Sarbanes-Oxley Act of 2002
|
|
|
101.INS+
|
XBRL Instance Document
|
|
|
101.SCH+
|
XBRL Taxonomy Extension Schema Document
|
|
109
|
101.CAL+
|
XBRL Taxonomy Extension Calculation Linkbase Document
|
|
|
101.DEF+
|
XBRL Taxonomy Extension Definition Linkbase Document
|
|
|
101.LAB+
|
XBRL Taxonomy Extension Labels Linkbase Document
|
|
|
101.PRE+
|
XBRL Taxonomy Extension Presentation Linkbase Document
|
|
|
*
|
Incorporated by reference
|
|
†
|
Management contract or compensatory plan or arrangement
|
|
+
|
Pursuant to Rule 406T of Regulation S-T, the interactive data files on Exhibit 101 hereto are deemed not filed or part of a registration statement or prospectus for purposes of Section 11 or 12 of the Securities Act of 1933, as amended, are deemed not filed for purposes of Section 18 of the Securities Exchange Act of 1934, as amended, and otherwise are not subject to liability under those sections.
|
110
SCHEDULE I—CONDENSED FINANCIAL INFORMATION OF REGISTRANT—
CHENIERE ENERGY, INC.
CONDENSED BALANCE SHEET
(in thousands)
|
|
December 31,
|
||||||
|
|
2012
|
2011
|
|||||
|
ASSETS
|
|
|
|
||||
|
Debt receivable—affiliates
|
$
|
740,989
|
|
$
|
706,776
|
|
|
|
Investment in affiliates
|
1,636,787
|
|
—
|
|
|||
|
Other
|
—
|
|
293
|
|
|||
|
Total assets
|
$
|
2,377,776
|
|
$
|
707,069
|
|
|
|
LIABILITIES AND STOCKHOLDERS’ DEFICIT
|
|
|
|||||
|
Current accrued liabilities
|
$
|
—
|
|
$
|
1,920
|
|
|
|
Current debt
|
—
|
|
194,724
|
|
|||
|
Current debt—affiliate
|
116,171
|
|
443,227
|
|
|||
|
Investment in and equity in losses of affiliates
|
—
|
|
240,190
|
|
|||
|
Commitments and contingencies
|
|
|
|
|
|||
|
Stockholders' equity (deficit)
|
2,261,605
|
|
(172,992
|
)
|
|||
|
Total liabilities and stockholders’ equity (deficit)
|
$
|
2,377,776
|
|
$
|
707,069
|
|
|
See accompanying notes to condensed financial statements.
111
SCHEDULE I—CONDENSED FINANCIAL INFORMATION OF REGISTRANT—
CHENIERE ENERGY, INC.
CONDENSED STATEMENT OF OPERATIONS
(in thousands)
|
|
Year Ended December 31,
|
||||||||||
|
|
2012
|
2011
|
2010
|
||||||||
|
Revenues
|
$
|
—
|
|
$
|
—
|
|
$
|
—
|
|
||
|
Operating costs and expenses
|
36
|
|
(133
|
)
|
135
|
|
|||||
|
Gain (loss) from operations
|
(36
|
)
|
133
|
|
(135
|
)
|
|||||
|
Interest expense, net
|
(12,883
|
)
|
(20,709
|
)
|
(19,112
|
)
|
|||||
|
Interest income—affiliates
|
34,213
|
|
34,213
|
|
22,778
|
|
|||||
|
Interest expense—affiliates
|
(9,137
|
)
|
(38,192
|
)
|
(25,426
|
)
|
|||||
|
Equity losses of affiliates
|
(344,937
|
)
|
(174,201
|
)
|
(54,308
|
)
|
|||||
|
Net loss
|
$
|
(332,780
|
)
|
$
|
(198,756
|
)
|
$
|
(76,203
|
)
|
||
See accompanying notes to condensed financial statements.
112
SCHEDULE I—CONDENSED FINANCIAL INFORMATION OF REGISTRANT—
CHENIERE ENERGY, INC.
CONDENSED STATEMENT OF CASH FLOWS
(in thousands)
|
|
Year Ended December 31,
|
|||||||||||
|
|
2012
|
2011
|
2010
|
|||||||||
|
Net cash used in operating activities
|
$
|
(6,699
|
)
|
$
|
(4,479
|
)
|
$
|
(27,531
|
)
|
|||
|
Cash flows from investing activities
|
|
|
|
|
|
|
||||||
|
Return of capital from (investments in) affiliates
|
(968,962
|
)
|
(449,756
|
)
|
(18,934
|
)
|
||||||
|
Net cash used in investing activities
|
(968,962
|
)
|
(449,756
|
)
|
(18,934
|
)
|
||||||
|
Cash flows from financing activities
|
|
|
|
|
|
|
||||||
|
Purchase of treasury shares
|
(20,414
|
)
|
(14,363
|
)
|
(2,844
|
)
|
||||||
|
Repurchase of long-term debt
|
(204,630
|
)
|
—
|
|
—
|
|
||||||
|
Sale of common stock
|
1,200,705
|
|
468,598
|
|
49,308
|
|
||||||
|
Issuance of restricted stock
|
—
|
|
—
|
|
1
|
|
||||||
|
Net cash provided by financing activities
|
975,661
|
|
454,235
|
|
46,465
|
|
||||||
|
Net decrease in cash and cash equivalents
|
—
|
|
—
|
|
—
|
|
||||||
|
Cash and cash equivalents—beginning of year
|
—
|
|
—
|
|
—
|
|
||||||
|
Cash and cash equivalents—end of year
|
$
|
—
|
|
$
|
—
|
|
$
|
—
|
|
|||
See accompanying notes to condensed financial statements
113
SCHEDULE I—CONDENSED FINANCIAL INFORMATION OF REGISTRANT—
CHENIERE ENERGY, INC.
NOTES TO CONDENSED FINANCIAL STATEMENTS
The condensed financial statements represent the financial information required by Securities and Exchange Commission Regulation S-X 5-04 for Cheniere Energy, Inc. ("Cheniere").
In the condensed financial statements, Cheniere’s investments in affiliates are presented under the equity method of accounting. Under this method, the assets and liabilities of affiliates are not consolidated. The investments in net assets of the affiliates are recorded in the balance sheet. The loss from operations of the affiliates is reported on a net basis as investment in affiliates (investment in and equity in net losses of affiliates).
A substantial amount of Cheniere’s operating, investing, and financing activities are conducted by its affiliates. The condensed financial statements should be read in conjunction with Cheniere’s consolidated financial statements.
As of December 31,
2012
and
2011
, our debt consisted of the following (in thousands):
|
|
December 31,
|
|||||||
|
|
2012
|
2011
|
||||||
|
Current debt (including affiliate)
|
||||||||
|
Note—Affiliate
|
$
|
116,171
|
|
$
|
443,227
|
|
||
|
Convertible Senior Unsecured Notes
|
—
|
|
204,630
|
|
||||
|
Total current debt
|
116,171
|
|
647,857
|
|
||||
|
Current debt discount
|
|
|
||||||
|
Convertible Senior Unsecured Notes
|
—
|
|
(9,906
|
)
|
||||
|
Total current debt, net of discount
|
$
|
116,171
|
|
$
|
637,951
|
|
||
Below is a schedule of future principal payments that we are obligated to make on our outstanding debt at December 31,
2012
(in thousands):
|
|
Payments Due for Years Ended December 31,
|
|||||||||||||||||||
|
|
Total
|
2013
|
2014 to 2015
|
2016 to 2017
|
Thereafter
|
|||||||||||||||
|
Note—Affiliate
|
$
|
116,171
|
|
$
|
116,171
|
|
$
|
—
|
|
$
|
—
|
|
$
|
—
|
|
|||||
|
(1)
|
Based on the total debt balance, scheduled maturities and interest rates in effect at December 31,
2012
, our cash payments for interest would be
zero
because the only debt relates to a global intercompany note entered into by all subsidiaries of Cheniere, as discussed below.
|
Note
—
Affiliate
In May 2007, we entered into a
$391.7 million
long-term note ("Note—Affiliate") with Cheniere Subsidiary Holdings, LLC ("Cheniere Subsidiary"), a wholly owned subsidiary of Cheniere. Cheniere Subsidiary received the
$391.7 million
net proceeds from a
$400 million
credit agreement entered into in May 2007. Borrowings under the Note—Affiliate bear interest equal to the terms of Cheniere Subsidiary's credit agreement at a fixed rate of
9¾%
per annum. Interest is calculated on the unpaid principal amount of the Note—Affiliate outstanding and is payable quarterly in arrears on March 31, June 30, September 30 and December 31 of each year. In August 2008, the Note—Affiliate was replaced with a global intercompany note entered into by all Cheniere subsidiaries that were parties to the 2008 Loans. Each subsidiary is both a maker and a payee under the global intercompany note, and balances between subsidiaries are as recorded on Cheniere's books and records. The
$391.7 million
of proceeds from the Note—Affiliate were used for general corporate purposes, including our repurchase, completed during 2007, of approximately
9.2 million
shares of our outstanding common stock pursuant to the exercise of the call options acquired in the issuer call spread purchased by us in connection with the issuance of the Convertible Senior Unsecured Notes. In January 2012, we decreased a
114
SCHEDULE I—CONDENSED FINANCIAL INFORMATION OF REGISTRANT—
CHENIERE ENERGY, INC.
NOTES TO CONDENSED FINANCIAL STATEMENTS
portion of the Note—Affiliate principal balance with offsetting intercompany receivables that resulted in a new principal balance of
$93.7 million
.
Guarantees on Behalf of Cheniere Marketing, LLC
Marketing and Trading Guarantees
Our LNG and natural gas marketing business segment is pursuing a two-front commercial strategy focused on producing long-term recurring cash flow by capitalizing on
2.0
Bcf/d of regasification capacity at the Sabine Pass LNG terminal reserved by Cheniere Energy Investments, LLC ("Cheniere Investments"). Our strategy is to remain engaged in the LNG spot market as opportunities arise, and to maintain relationships with key suppliers and market participants that we believe are candidates for entering into long-term LNG cargo sales and/or the purchase of TUA capacity currently reserved by Cheniere Investments. Many of Cheniere Marketing, LLC’s natural gas purchase, sale, transportation and shipping agreements have been guaranteed by Cheniere. As of December 31,
2012
, these contracts have been guaranteed by Cheniere and have
zero
amount of exposure to the potential of future payments. There was
zero
carrying amount of liability related to these guaranteed contracts as of December 31,
2012
.
Guarantee on behalf of Sabine Pass Tug Services, LLC
Sabine Pass Tug Services, LLC ("Tug Services"), a wholly owned subsidiary of Cheniere Energy Partners, L.P., entered into a Marine Services Agreement ("Tug Agreement") for three tugs with Alpha Marine Services, LLC. The initial term of the Tug Agreement ends on the tenth anniversary of the service date, with Tug Services having the option for
two
additional extension terms of
five
years each. This contract has been guaranteed by Cheniere for up to
$5.0 million
.
|
|
Year Ended December 31,
|
|||||||||||
|
|
2012
|
2011
|
2010
|
|||||||||
|
|
(in thousands)
|
|||||||||||
|
Non-cash capital contributions (1)
|
$
|
(344,937
|
)
|
$
|
(174,201
|
)
|
$
|
(54,308
|
)
|
|||
|
(1)
|
Amounts represent equity losses of affiliates not funded by Cheniere.
|
115
SIGNATURES
Pursuant to the requirements of Section 13 or 15(d) of the Securities Exchange Act of 1934, the registrant has duly caused this report to be signed on its behalf by the undersigned, thereunto duly authorized.
|
|
||
|
CHENIERE ENERGY, INC.
|
||
|
(Registrant)
|
||
|
|
||
|
By:
|
/s/ CHARIF SOUKI
|
|
|
Charif Souki
Chief Executive Officer, President and
Chairman of the Board
|
||
|
Date:
|
February 22, 2013
|
|
Pursuant to the requirements of the Securities Exchange Act of 1934, this report has been signed below by the following persons on behalf of the registrant and in the capacities and on the dates indicated.
|
Signature
|
Title
|
Date
|
|
|
|
|
|
/s/ CHARIF SOUKI
|
Chief Executive Officer, President &
Chairman of the Board (Principal Executive Officer)
|
February 22, 2013
|
|
Charif Souki
|
||
|
|
|
|
|
/s/ MEG A. GENTLE
|
Senior Vice President & Chief Financial Officer (Principal Financial Officer)
|
February 22, 2013
|
|
Meg A. Gentle
|
||
|
|
|
|
|
/s/ JERRY D. SMITH
|
Vice President and Chief Accounting Officer
(Principal Accounting Officer)
|
February 22, 2013
|
|
Jerry D. Smith
|
||
|
|
||
|
/s/ VICKY A. BAILEY
|
Director
|
February 22, 2013
|
|
Vicky A. Bailey
|
||
|
/s/ G. ANDREA BOTTA
|
Director
|
February 22, 2013
|
|
G. Andrea Botta
|
||
|
/s/ NUNO BRANDOLINI
|
Director
|
February 22, 2013
|
|
Nuno Brandolini
|
||
|
|
|
|
|
/s/ KEITH F. CARNEY
|
Director
|
February 22, 2013
|
|
Keith F. Carney
|
||
|
|
|
|
|
/s/ JOHN M. DEUTCH
|
Director
|
February 22, 2013
|
|
John M. Deutch
|
||
|
/s/ DAVID I. FOLEY
|
Director
|
February 22, 2013
|
|
David I. Foley
|
||
|
/s/ PAUL J. HOENMANS
|
Director
|
February 22, 2013
|
|
Paul J. Hoenmans
|
||
|
|
|
|
|
/s/ DAVID B. KILPATRICK
|
Director
|
February 22, 2013
|
|
David B. Kilpatrick
|
||
|
|
|
|
|
/s/ WALTER L. WILLIAMS
|
Director
|
February 22, 2013
|
|
Walter L. Williams
|
||
116
TABLE OF CONTENTS
Part IItem 1A. Risk FactorsItem 1B. Unresolved Staff CommentsItem 3. Legal ProceedingsItem 4. Mine Safety DisclosurePart IIItem 5. Market For Registrant S Common Equity, Related Stockholder Matters and IssuerItem 6. Selected Financial DataItem 7. Management S Discussion and Analysis Of Financial Condition and Results OfItem 7A. Quantitative and Qualitative Disclosures About Market RiskItem 8. Financial Statements and Supplementary DataNote 1 Organization and Nature Of OperationsNote 2 Summary Of Significant Accounting PoliciesNote 3 Restricted Cash and Cash EquivalentsNote 4 Lng InventoryNote 5 Property, Plant and EquipmentNote 6 Non-controlling InterestNote 7 Variable Interest EntitiesNote 8 Accrued LiabilitiesNote 9 Debt and Debt Related PartiesNote 10 Debt Issuance CostsNote 11 Financial InstrumentsNote 12 Deferred RevenueNote 13 Income TaxesNote 14 Share-based CompensationNote 15 LeasesNote 16 Commitments and ContingenciesNote 17 Business Segment InformationNote 18 Supplemental Cash Flow Information and Disclosures Of Non-cash TransactionsNote 19 Subsequent EventsItem 9. Changes in and Disagreements with Accountants on Accounting and FinancialItem 9A. Controls and ProceduresItem 9B. Other InformationPart IIIPart IVItem 15. Exhibits and Financial Statement SchedulesNote 1 Summary Of Significant Accounting PoliciesNote 2 DebtNote 3 GuaranteesNote 4 Supplemental Cash Flow Information and Disclosures Of Non-cash Transactions