CHENIERE ENERGY, INC.
10-Ks and 10-Qs
|
|
|
|
|
|
|
|
|
|
|
|
|
|
|
|
|
|
|
|
|
|
|
|
|
|
|
|
|
|
|
|
|
|
|
|
|
|
|
|
|
|
|
|
|
|
|
|
|
|
|
|
|
|
|
|
|
|
|
|
|
|
|
|
|
|
|
|
UNITED STATES
SECURITIES AND EXCHANGE COMMISSION
Washington, D.C. 20549
FORM 10-K
x
ANNUAL REPORT PURSUANT TO SECTION 13 OR 15(d) OF THE SECURITIES EXCHANGE ACT OF 1934
For the fiscal year ended
December 31, 2018
or
¨
TRANSITION REPORT PURSUANT TO SECTION 13 OR 15(d) OF THE SECURITIES EXCHANGE ACT OF 1934
For the transition period from
to
Commission file number 001-16383

CHENIERE ENERGY, INC.
(Exact name of registrant as specified in its charter)
|
Delaware
|
95-4352386
|
|
(State or other jurisdiction of incorporation or organization)
|
(I.R.S. Employer Identification No.)
|
|
|
|
|
700 Milam Street, Suite 1900
|
|
|
Houston, Texas
|
77002
|
|
(Address of principal executive offices)
|
(Zip code)
|
Registrant’s telephone number, including area code:
(713) 375-5000
Securities registered pursuant to Section 12(b) of the Act:
|
Common Stock, $ 0.003 par value
|
NYSE American
|
|
(Title of each class)
|
(Name of each exchange on which registered)
|
Securities registered pursuant to Section 12(g) of the Act:
None
Indicate by check mark if the registrant is a well-known seasoned issuer, as defined in Rule 405 of the Securities Act. Yes
x
No
o
Indicate by check mark if the registrant is not required to file reports pursuant to Section 13 or Section 15(d) of the Act. Yes
o
No
x
Indicate by check mark whether the registrant (1) has filed all reports required to be filed by Section 13 or 15(d) of the Securities Exchange Act of 1934 during the preceding 12 months (or for such shorter period that the registrant was required to file such reports), and (2) has been subject to such filing requirements for the past 90 days. Yes
x
No
o
Indicate by check mark whether the registrant has submitted electronically every Interactive Data File required to be submitted pursuant to Rule 405 of Regulation S-T (§232.405 of this chapter) during the preceding 12 months (or for such shorter period that the registrant was required to submit such files). Yes
x
No
o
Indicate by check mark if disclosure of delinquent filers pursuant to Item 405 of Regulation S-K (§229.405 of this chapter) is not contained herein, and will not be contained, to the best of the registrant’s knowledge, in definitive proxy or information statements incorporated by reference in Part III of this Form 10-K or any amendment to this Form 10-K.
o
Indicate by check mark whether the registrant is a large accelerated filer, an accelerated filer, a non-accelerated filer, a smaller reporting company, or an emerging growth company. See the definitions of “large accelerated filer,” “accelerated filer,” “smaller reporting company” and “emerging growth company” in Rule 12b-2 of the Act.
|
Large accelerated filer
x
|
Accelerated filer
o
|
|
Non-accelerated filer
o
|
Smaller reporting company
o
|
|
Emerging growth company
o
|
|
If an emerging growth company, indicate by check mark if the registrant has elected not to use the extended transition period for complying with any new or revised financial accounting standards provided pursuant to Section 13(a) of the Act.
o
Indicate by check mark whether the registrant is a shell company (as defined in Rule 12b-2 of the Act). Yes
o
No
x
The aggregate market value of the registrant’s Common Stock held by non-affiliates of the registrant was approximately
$16.0 billion
as of June 30,
2018
.
257,415,723
shares of the registrant’s Common Stock, $0.003 par value, were outstanding as of
February 20, 2019
.
Documents incorporated by reference: The definitive proxy statement for the registrant’s Annual Meeting of Stockholders (to be filed within 120 days of the close of the registrant’s fiscal year) is incorporated by reference into Part III.
CHENIERE ENERGY, INC.
TABLE OF CONTENTS
i
DEFINITIONS
As used in this
annual
report, the terms listed below have the following meanings:
Common Industry and Other Terms
|
Bcf
|
billion cubic feet
|
|
|
Bcf/d
|
billion cubic feet per day
|
|
|
Bcf/yr
|
billion cubic feet per year
|
|
|
Bcfe
|
billion cubic feet equivalent
|
|
|
DOE
|
U.S. Department of Energy
|
|
|
EPC
|
engineering, procurement and construction
|
|
|
FERC
|
Federal Energy Regulatory Commission
|
|
|
FTA countries
|
countries with which the United States has a free trade agreement providing for national treatment for trade in natural gas
|
|
|
GAAP
|
generally accepted accounting principles in the United States
|
|
|
Henry Hub
|
the final settlement price (in USD per MMBtu) for the New York Mercantile Exchange’s Henry Hub natural gas futures contract for the month in which a relevant cargo’s delivery window is scheduled to begin
|
|
|
LIBOR
|
London Interbank Offered Rate
|
|
|
LNG
|
liquefied natural gas, a product of natural gas that, through a refrigeration process, has been cooled to a liquid state, which occupies a volume that is approximately 1/600th of its gaseous state
|
|
|
MMBtu
|
million British thermal units, an energy unit
|
|
|
mtpa
|
million tonnes per annum
|
|
|
non-FTA countries
|
countries with which the United States does not have a free trade agreement providing for national treatment for trade in natural gas and with which trade is permitted
|
|
|
SEC
|
U.S. Securities and Exchange Commission
|
|
|
SPA
|
LNG sale and purchase agreement
|
|
|
TBtu
|
trillion British thermal units, an energy unit
|
|
|
Train
|
an industrial facility comprised of a series of refrigerant compressor loops used to cool natural gas into LNG
|
|
|
TUA
|
terminal use agreement
|
|
ii
Abbreviated Legal Entity Structure
The following diagram depicts our abbreviated legal entity structure as of
December 31, 2018
, including our ownership of certain subsidiaries, and the references to these entities used in this
annual
report:
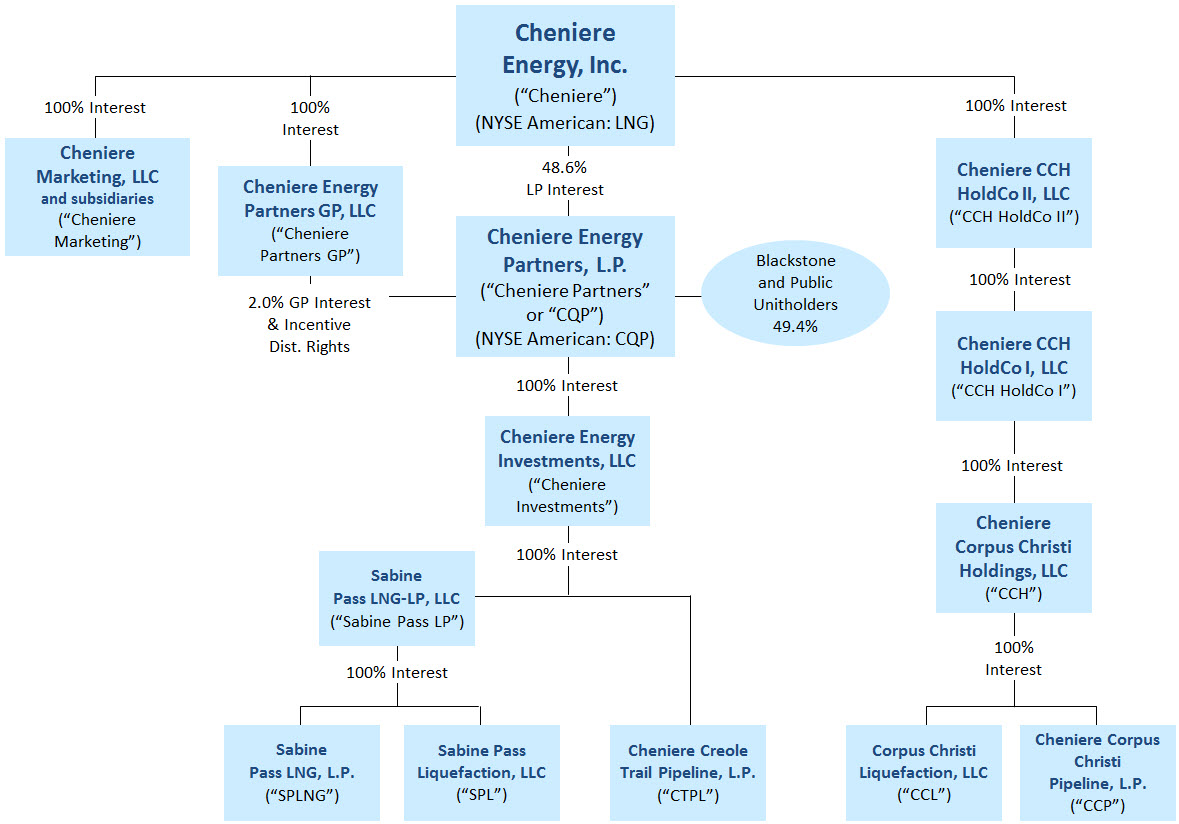
Unless the context requires otherwise, references to “
Cheniere
,” the “Company,” “we,” “us” and “our” refer to
Cheniere Energy, Inc.
and its consolidated subsidiaries, including our publicly traded subsidiary,
Cheniere Partners
.
During the
year ended December 31, 2018
, we closed the merger of Cheniere Energy Partners LP Holdings, LLC (“Cheniere Holdings”) with and into our wholly owned subsidiary. As a result of the merger, Cheniere Holdings is no longer a publicly-traded company.
Unless the context requires otherwise, references to the “CCH Group” refer to
CCH HoldCo II
,
CCH HoldCo I
,
CCH
,
CCL
and
CCP
, collectively.
iii
CAUTIONARY STATEMENT
REGARDING FORWARD-LOOKING STATEMENTS
This
annual
report contains certain statements that are, or may be deemed to be, “forward-looking statements” within the meaning of Section 27A of the Securities Act of 1933, as amended
(the “Securities Act”)
, and Section 21E of the Securities Exchange Act of 1934, as amended
(the “Exchange Act”)
. All statements, other than statements of historical or present facts or conditions, included herein or incorporated herein by reference are “forward-looking statements.” Included among “forward-looking statements” are, among other things:
|
•
|
statements that we expect to commence or complete construction of our proposed LNG terminals, liquefaction facilities, pipeline facilities or other projects, or any expansions or portions thereof, by certain dates, or at all;
|
|
•
|
statements regarding future levels of domestic and international natural gas production, supply or consumption or future levels of LNG imports into or exports from North America and other countries worldwide or purchases of natural gas, regardless of the source of such information, or the transportation or other infrastructure or demand for and prices related to natural gas, LNG or other hydrocarbon products;
|
|
•
|
statements regarding any financing transactions or arrangements, or our ability to enter into such transactions;
|
|
•
|
statements relating to the construction of our Trains and pipelines, including statements concerning the engagement of any
EPC
contractor or other contractor and the anticipated terms and provisions of any agreement with any
EPC
or other contractor, and anticipated costs related thereto;
|
|
•
|
statements regarding any
SPA
or other agreement to be entered into or performed substantially in the future, including any revenues anticipated to be received and the anticipated timing thereof, and statements regarding the amounts of total LNG regasification, natural gas liquefaction or storage capacities that are, or may become, subject to contracts;
|
|
•
|
statements regarding counterparties to our commercial contracts, construction contracts, and other contracts;
|
|
•
|
statements regarding our planned development and construction of additional Trains and pipelines, including the financing of such Trains or pipelines;
|
|
•
|
statements that our Trains, when completed, will have certain characteristics, including amounts of liquefaction capacities;
|
|
•
|
statements regarding our business strategy, our strengths, our business and operation plans or any other plans, forecasts, projections, or objectives, including anticipated revenues, capital expenditures, maintenance and operating costs and cash flows, any or all of which are subject to change;
|
|
•
|
statements regarding legislative, governmental, regulatory, administrative or other public body actions, approvals, requirements, permits, applications, filings, investigations, proceedings or decisions;
|
|
•
|
statements regarding marketing of volumes expected to be made available to our integrated marketing function; and
|
|
•
|
any other statements that relate to non-historica
l or future information.
|
All of these types of statements, other than statements of historical or present facts or conditions, are forward-looking statements. In some cases, forward-looking statements can be identified by terminology such as “may,” “will,” “could,” “should,” “achieve,” “anticipate,” “believe,” “contemplate,” “continue,” “estimate,” “expect,” “intend,” “plan,” “potential,” “predict,” “project,” “pursue,” “target,” the negative of such terms or other comparable terminology. The forward-looking statements contained in this
annual
report are largely based on our expectations, which reflect estimates and assumptions made by our management. These estimates and assumptions reflect our best judgment based on currently known market conditions and other factors. Although we believe that such estimates are reasonable, they are inherently uncertain and involve a number of risks and uncertainties beyond our control. In addition, assumptions may prove to be inaccurate. We caution that the forward-looking statements contained in this
annual
report are not guarantees of future performance and that such statements may not be realized or the forward-looking statements or events may not occur. Actual results may differ materially from those anticipated or implied in forward-looking statements as a result of a variety of factors described in this
annual
report and in the other reports and other information that we file with the SEC. All forward-looking statements attributable to us or persons acting on our behalf are expressly qualified in their entirety by these risk factors. These forward-looking statements speak only as of the date made, and other than as required by law, we undertake no obligation to update or revise any forward-looking statement or provide reasons why actual results may differ, whether as a result of new information, future events or otherwise.
iv
PART I
|
ITEMS 1. AND 2.
|
BUSINESS AND PROPERTIES
|
General
Cheniere, a Delaware corporation, was organized in 1983 and is a Houston-based energy company primarily engaged in LNG-related businesses. Our vision is to provide clean, secure and affordable energy to the world, while responsibly delivering a reliable, competitive and integrated source of LNG, in a safe and rewarding work environment. We own and operate the Sabine Pass LNG terminal in Louisiana through our ownership interest in and management agreements with Cheniere Partners, which is a publicly traded limited partnership that we created in 2007. As of
December 31, 2018
, we owned
100%
of the general partner interest and
48.6%
of the limited partner interest in Cheniere Partners. We are currently developing and constructing two natural gas liquefaction and export facilities. The liquefaction of natural gas into LNG allows it to be shipped economically from areas of the world where natural gas is abundant and inexpensive to produce to other areas where natural gas demand and infrastructure exist to economically justify the use of LNG.
The Sabine Pass LNG terminal is located in Cameron Parish, Louisiana, on the Sabine-Neches Waterway less than four miles from the Gulf Coast. Cheniere Partners is developing, constructing and operating natural gas liquefaction facilities
(the “SPL Project”)
at the Sabine Pass LNG terminal adjacent to the existing regasification facilities through a wholly owned subsidiary, SPL. Cheniere Partners plans to construct up to six Trains, which are in various stages of development, construction and operations. Trains 1 through 4 are operational, Train 5 is undergoing commissioning and Train 6 is being commercialized and has all necessary regulatory approvals in place. Each Train is expected to have a nominal production capacity, which is prior to adjusting for planned maintenance, production reliability, potential overdesign and debottlenecking opportunities, of approximately
4.5
mtpa of LNG per Train, and run rate adjusted nominal production capacity of approximately
4.5
to
4.9
mtpa of LNG per Train. The Sabine Pass LNG terminal has operational regasification facilities owned by Cheniere Partners’ wholly owned subsidiary, SPLNG, that include pre-existing infrastructure of five LNG storage tanks with aggregate capacity of approximately 16.9
Bcfe
, two marine berths that can each accommodate vessels with nominal capacity of up to 266,000 cubic meters and vaporizers with regasification capacity of approximately 4.0
Bcf/d
. Cheniere Partners also owns a 94-mile pipeline that interconnects the Sabine Pass LNG terminal with a number of large interstate pipelines
(the “Creole Trail Pipeline”)
through a wholly owned subsidiary, CTPL.
We are developing and constructing a second natural gas liquefaction and export facility at the Corpus Christi LNG terminal near Corpus Christi, Texas and operate a 23-mile natural gas supply pipeline that interconnects the Corpus Christi LNG terminal with several interstate and intrastate natural gas pipelines
(the “Corpus Christi Pipeline” and together with the liquefaction facilities, the “CCL Project”)
through our wholly owned subsidiaries CCL and CCP, respectively. The
CCL Project
is being developed in stages with the first phase being
three
Trains (“Phase 1”), with expected aggregate nominal production capacity, which is prior to adjusting for planned maintenance, production reliability, potential overdesign and debottlenecking opportunities, of approximately 13.5
mtpa
of LNG, three LNG storage tanks with aggregate capacity of approximately 10.1
Bcfe
and two marine berths that can each accommodate vessels with nominal capacity of up to 266,000 cubic meters. The first stage
(“Stage 1”)
includes Trains 1 and 2, two LNG storage tanks, one complete marine berth and a second partial berth and all of the
CCL Project
’s necessary infrastructure facilities. The second stage
(“Stage 2”)
includes Train 3, one LNG storage tank and the completion of the second partial berth. Trains 1 and 2 are undergoing commissioning and Train 3 is under construction.
Additionally, separate from the CCH Group, we are developing an expansion of the Corpus Christi LNG terminal adjacent to the
CCL Project
(“Corpus Christi Stage 3”)
and filed an application with FERC in June 2018 for
seven
midscale Trains with an expected aggregate nominal production capacity of approximately
9.5
mtpa and one LNG storage tank.
We remain focused on expansion of our existing sites by leveraging existing infrastructure. We are also in various stages of developing other projects, including infrastructure projects in support of natural gas supply and LNG demand, which, among other things, will require acceptable commercial and financing arrangements before we make a final investment decision (“
FID
”). We have made an equity investment in Midship Holdings, LLC (“Midship Holdings”), which manages the business and affairs of Midship Pipeline Company, LLC (“Midship Pipeline”). Midship Pipeline is developing a pipeline (the “Midship Project”) with expected capacity of up to 1.44 million Dekatherms per day that will connect new gas production in the Anadarko Basin to Gulf Coast markets, including markets serving the
SPL Project
and the
CCL Project
. Construction of the Midship Project will commence based upon, among other things, obtaining the required authorization from the FERC and adequate financing to construct the proposed project.
1
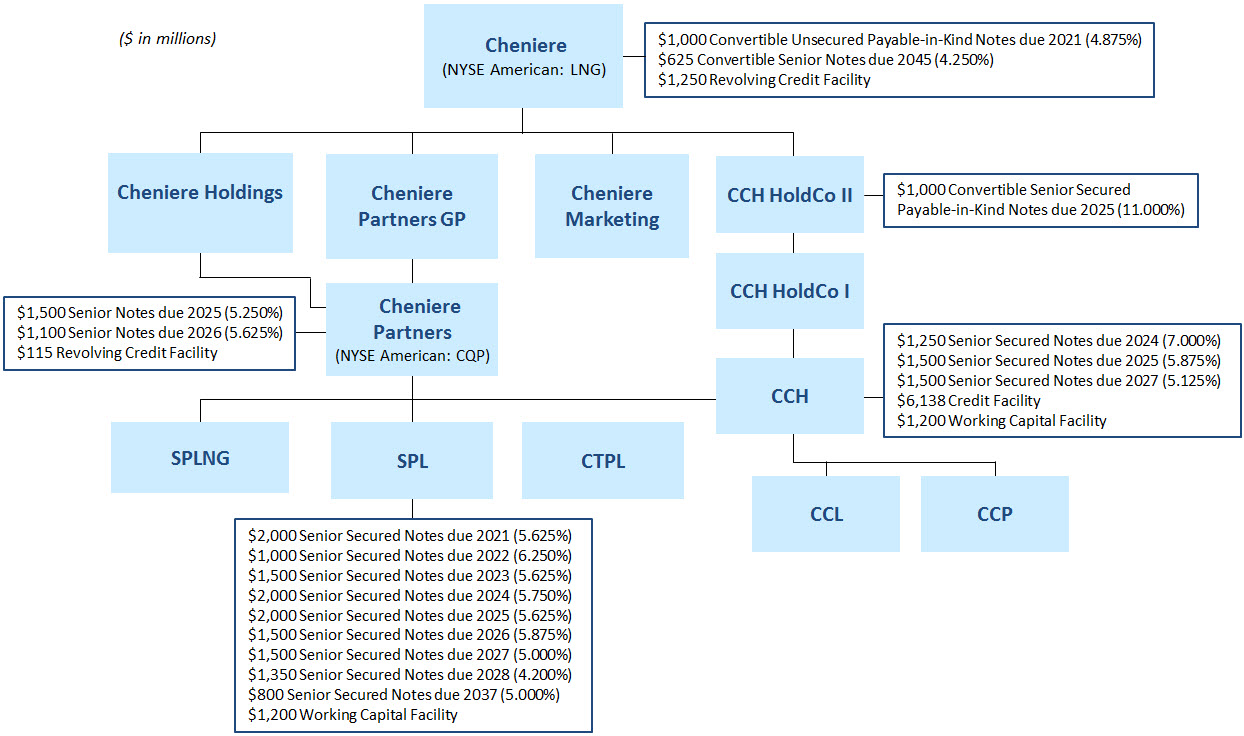
Although results are consolidated for financial reporting, Cheniere, Cheniere Partners, SPL and the CCH Group operate with independent capital structures. The following diagram depicts our abbreviated capital structure as of
December 31, 2018
:
Our Business Strategy
Our primary business strategy is to be a full service LNG provider to worldwide end-use customers. We accomplish this objective by developing LNG and natural gas infrastructure facilities and:
|
•
|
achieving the date of first commercial delivery for our SPA customers;
|
|
•
|
safely, efficiently and reliably maintaining and operating our assets;
|
|
•
|
completing construction and commencing operation of Train 5 of the SPL Project and the first three Trains of the CCL Project;
|
|
•
|
making LNG available to our SPA customers to generate steady and reliable revenues and operating cash flows;
|
|
•
|
obtaining the requisite long-term commercial contracts and financing to reach an
FID
regarding Train 6 of the SPL Project;
|
|
•
|
further expanding and optimizing the SPL Project and the CCL Project by leveraging existing infrastructure;
|
|
•
|
developing business relationships for the marketing of LNG volumes expected to be made available to our integrated marketing function and additional LNG liquefaction projects or expansions;
|
|
•
|
expanding our existing asset base through acquisitions or development of complementary businesses or assets across the LNG value chain; and
|
|
•
|
maintaining a flexible capital structure to finance the acquisition, development, construction and operation of the energy assets needed to supply our customers.
|
LNG Terminals
We began developing our first LNG terminal in 1999 and were among the first companies to secure sites and commence development of new LNG terminals in North America. We are currently focusing our development efforts on two LNG terminal
2
projects currently under construction: the Sabine Pass LNG terminal and the Corpus Christi LNG terminal. Through Cheniere Partners, we are developing, constructing and operating the
SPL Project
and have constructed and are operating regasification facilities at the Sabine Pass LNG terminal. As of
December 31, 2018
, we owned
100%
of the general partner interest and
48.6%
of the limited partner interest in Cheniere Partners. We currently own a 100% interest in the
CCL Project
.
Sabine Pass LNG Terminal
Liquefaction Facilities
We are developing, constructing and operating the
SPL Project
at the Sabine Pass LNG terminal adjacent to the existing regasification facilities. We have received authorization from the FERC to site, construct and operate Trains 1 through 6. We have achieved substantial completion of Trains 1, 2, 3 and 4 of the
SPL Project
and commenced operating activities in May 2016, September 2016, March 2017 and October 2017, respectively. Train 5 of the
SPL Project
is undergoing commissioning and the following table summarizes the status as of
December 31, 2018
:
|
SPL Train 5
|
|||
|
Overall project completion percentage
|
99.7%
|
||
|
Completion percentage of:
|
|||
|
Engineering
|
100%
|
||
|
Procurement
|
100%
|
||
|
Subcontract work
|
98.0%
|
||
|
Construction
|
99.6%
|
||
|
Date of expected substantial completion
|
1Q 2019
|
||
The following orders have been issued by the DOE authorizing the export of domestically produced LNG by vessel from the Sabine Pass LNG terminal:
|
•
|
Trains 1 through 4—
FTA countries
for a 30-year term, which commenced on May 15, 2016, and
non-FTA countries
for a 20-year term, which commenced on June 3, 2016, in an amount up to a combined total of the equivalent of 16
mtpa
(approximately 803
Bcf/yr
of natural gas).
|
|
•
|
Trains 1 through 4—
FTA countries
for a 25-year term and non-FTA countries for a 20-year term in an amount up to a combined total of the equivalent of approximately 203
Bcf/yr
of natural gas (approximately 4 mtpa).
|
|
•
|
Trains 5 and 6—
FTA countries
and
non-FTA countries
for a 20-year term, in an amount up to a combined total of 503.3
Bcf/yr
of natural gas (approximately 10 mtpa).
|
In each case, the terms of these authorizations begin on the earlier of the date of first export thereunder or the date specified in the particular order, which ranges from five to 10 years from the date the order was issued. In addition, SPL received an order providing for a three-year makeup period with respect to each of the non-FTA orders for LNG volumes SPL was authorized but unable to export during any portion of the initial 20-year export period of such order.
In January 2018, the DOE issued orders authorizing SPL to export domestically produced LNG by vessel from the Sabine Pass LNG terminal to
FTA countries
and
non-FTA countries
over a two-year period commencing January 2018, in an aggregate amount up to the equivalent of 600
Bcf
of natural gas (however, exports under this order, when combined with exports under the orders above, may not exceed 1,509
Bcf/yr
).
Customers
SPL has entered into fixed price
SPA
s with terms of at least 20 years (plus extension rights) with
six
third parties for Trains 1 through 5 of the
SPL Project
, to make available an aggregate amount of LNG that is between approximately
80%
to
95%
of the expected aggregate adjusted nominal production capacity from these Trains. Under these
SPA
s, the customers will purchase LNG from SPL for a price consisting of a fixed fee per MMBtu of LNG (a portion of which is subject to annual adjustment for inflation) plus a variable fee per
MMBtu
of LNG equal to approximately 115% of
Henry Hub
. In certain circumstances, the customers may elect to cancel or suspend deliveries of LNG cargoes, in which case the customers would still be required to pay the fixed fee with respect to the contracted volumes that are not delivered as a result of such cancellation or suspension. We refer to the fee component that is applicable regardless of a cancellation or suspension of LNG cargo deliveries under the SPAs as the fixed fee component of the price under SPL’s SPAs. We refer to the fee component that is applicable only in connection with LNG cargo deliveries as
3
the variable fee component of the price under SPL’s SPAs. The variable fees under SPL’s SPAs were sized at the time of entry into each SPA with the intent to cover the costs of gas purchases and transportation related to, and operating and maintenance costs to produce, the LNG to be sold under each such SPA. The
SPA
s and contracted volumes to be made available under the
SPA
s are not tied to a specific Train; however, the term of each
SPA
generally commences upon the date of first commercial delivery of a specified Train. Under SPL’s SPA with
BG Gulf Coast LNG, LLC
(“BG”)
,
BG
has contracted for volumes related to Trains 3 and 4, for which the obligation to make volumes related to Train 3 available to
BG
has commenced and the obligation to make volumes related to Train 4 available to
BG
is expected to commence approximately one year after the date of first commercial delivery under SPL’s SPA with GAIL (India) Limited
(“GAIL”)
for Train 4.
In aggregate, the annual fixed fee portion to be paid by the third-party SPA customers is approximately $2.2 billion for Trains 1 through 3 and the SPA with GAIL for Train 4, increasing to $2.3 billion upon the date of first commercial delivery of Train 4 under the SPA with BG and to $2.9 billion upon the date of first commercial delivery of Train 5, with the applicable fixed fees starting from the date of first commercial delivery from the applicable Train, as specified in each SPA.
The annual contracted cash flows from fixed fees of each buyer of LNG under SPL’s third-party SPAs that constitute more than 10% of SPL’s aggregate fixed fees under all its SPAs are:
|
•
|
approximately $720 million from
BG
, which is guaranteed by BG Energy Holdings Limited;
|
|
•
|
approximately $550 million from Korea Gas Corporation
(“KOGAS”)
;
|
|
•
|
approximately $550 million from
GAIL
; and
|
|
•
|
approximately $450 million from Naturgy LNG GOM, Limited (formerly known as Gas Natural Fenosa LNG GOM, Limited)
(“Naturgy”)
, which is guaranteed by
Naturgy Energy Group, S.A.
(formerly known as Gas Natural SDG S.A.).
|
SPL also has SPAs with Total Gas & Power North America, Inc.
(“Total”)
, which is guaranteed by Total S.A., and Centrica plc with annual aggregate fixed fees of approximately $590 million. In addition, Cheniere Marketing has entered into an SPA with SPL to purchase, at Cheniere Marketing’s option, any LNG produced by SPL in excess of that required for other customers.
During the year ended
December 31, 2018
, four customers,
BG
and its affiliates,
Naturgy
,
KOGAS
and
GAIL
, individually accounted for more than 10% of our total revenues from external customers at
18%
,
14%
,
19%
and
13%
, respectively. During the year ended December 31, 2017, four customers, BG and its affiliates,
Naturgy
, KOGAS and JERA Co., Inc., individually accounted for more than 10% of our total revenues from external customers at 24%, 14%, 14% and 17%, respectively. During the year ended December 31, 2016, two customers, BG and its affiliates and Kansai Electric Power Co., Inc. and its affiliates, individually accounted for more than 10% of our total revenues from external customers at 39% and 13%, respectively.
Natural Gas Transportation, Storage and Supply
To ensure SPL is able to transport adequate natural gas feedstock to the Sabine Pass LNG terminal, it has entered into transportation precedent and other agreements to secure firm pipeline transportation capacity with CTPL and third-party pipeline companies. SPL has entered into firm storage services agreements with third parties to assist in managing variability in natural gas needs for the
SPL Project
. SPL has also entered into enabling agreements and long-term natural gas supply contracts with third parties in order to secure natural gas feedstock for the
SPL Project
. As of
December 31, 2018
, SPL had secured up to approximately
3,464
TBtu
of natural gas feedstock through long-term and short-term natural gas supply contracts.
Construction
SPL entered into lump sum turnkey contracts with Bechtel Oil, Gas and Chemicals, Inc.
(“Bechtel”)
for the engineering, procurement and construction of Trains 1 through 6 of the
SPL Project
, under which
Bechtel
charges a lump sum for all work performed and generally bears project cost risk unless certain specified events occur, in which case
Bechtel
may cause SPL to enter into a change order, or SPL agrees with
Bechtel
to a change order.
The total contract price of the EPC contract for Train 5 of the
SPL Project
is approximately
$3.1 billion
reflecting amounts incurred under change orders through
December 31, 2018
. Total expected capital costs for Trains 1 through 5 are estimated to be between
$12.5 billion
and
$13.5 billion
before financing costs and between
$17.5 billion
and
$18.5 billion
after financing costs including, in each case, estimated owner’s costs and contingencies. The total contract price of the EPC contract for Train 6 of the
SPL Project
is approximately
$2.5 billion
, including estimated costs for an optional third marine berth.
4
Final Investment Decision on Train 6
SPL has issued limited notices to proceed to Bechtel for the commencement of certain engineering, procurement and site works for Train 6 of the
SPL Project
and a schedule for completion has been established.
FID
and full notice to proceed for Train 6 of the
SPL Project
will be contingent upon, among other things, entering into acceptable commercial arrangements and obtaining adequate financing to construct Train 6.
Regasification Facilities
The Sabine Pass LNG terminal has operational regasification capacity of approximately 4.0
Bcf/d
and aggregate LNG storage capacity of approximately 16.9
Bcfe
. Approximately 2.0
Bcf/d
of the regasification capacity at the Sabine Pass LNG terminal has been reserved under two long-term third-party
TUA
s, under which SPLNG’s customers are required to pay fixed monthly fees, whether or not they use the LNG terminal. Each of
Total
and Chevron U.S.A. Inc.
(“Chevron”)
has reserved approximately 1.0
Bcf/d
of regasification capacity and is obligated to make monthly capacity payments to SPLNG aggregating approximately $125 million annually for 20 years that commenced in 2009. Total S.A. has guaranteed
Total
’s obligations under its
TUA
up to $2.5 billion, subject to certain exceptions, and Chevron Corporation has guaranteed
Chevron
’s obligations under its
TUA
up to 80% of the fees payable by
Chevron
.
The remaining approximately 2.0
Bcf/d
of capacity has been reserved under a
TUA
by SPL. SPL is obligated to make monthly capacity payments to SPLNG aggregating approximately $250 million annually, continuing until at least May 2036. SPL entered into a partial TUA assignment agreement with
Total
, whereby upon substantial completion of Train 3 of the
SPL Project
, SPL gained access to a portion of
Total
’s capacity and other services provided under
Total
’s TUA with SPLNG. Upon substantial completion of Train 5, SPL will gain access to substantially all of
Total
’s capacity. This agreement provides SPL with additional berthing and storage capacity at the Sabine Pass LNG terminal that may be used to provide increased flexibility in managing LNG cargo loading and unloading activity, permit SPL to more flexibly manage its LNG storage capacity and accommodate the development of Trains 5 and 6. Notwithstanding any arrangements between
Total
and SPL, payments required to be made by
Total
to SPLNG will continue to be made by
Total
to SPLNG in accordance with its TUA. During the
years ended December 31, 2018 and 2017
, SPL recorded
$30 million
and
$23 million
, respectively, as operating and maintenance expense under this partial TUA assignment agreement.
Under each of these
TUA
s, SPLNG is entitled to retain 2% of the LNG delivered to the Sabine Pass LNG terminal.
Corpus Christi LNG Terminal
Liquefaction Facilities
The
CCL Project
is being developed and constructed at the Corpus Christi LNG terminal. We have received authorization from the
FERC
to site, construct and operate Stages 1 and 2 of the
CCL Project
. The following table summarizes the overall project status of the
CCL Project
as of
December 31, 2018
:
|
CCL Stage 1
|
CCL Stage 2
|
||||
|
Overall project completion percentage
|
96.7%
|
42.0%
|
|||
|
Completion percentage of:
|
|||||
|
Engineering
|
100%
|
87.0%
|
|||
|
Procurement
|
100%
|
63.0%
|
|||
|
Subcontract work
|
89.5%
|
8.5%
|
|||
|
Construction
|
93.1%
|
11.7%
|
|||
|
Expected date of substantial completion
|
Train 1
|
1Q 2019
|
Train 3
|
2H 2021
|
|
|
Train 2
|
2H 2019
|
||||
Separate from the CCH Group, we are also developing
Corpus Christi Stage 3
, adjacent to the
CCL Project
. We filed an application with FERC in June 2018 for
seven
midscale Trains with an expected aggregate nominal production capacity of approximately
9.5
mtpa and one LNG storage tank.
5
The following orders have been issued by the DOE authorizing the export of domestically produced LNG by vessel from the Corpus Christi LNG terminal:
|
•
|
CCL Project—
FTA countries
for a 25-year term and to
non-FTA countries
for a 20-year term up to a combined total of the equivalent of 767
Bcf/yr
(approximately 15 mtpa) of natural gas.
|
|
•
|
Corpus Christi Stage 3
—FTA countries for a 20-year term in an amount equivalent to 514 Bcf/yr (approximately 10 mtpa) of natural gas (the “Stage 3 FTA”). The application for authorization to export that same 514 Bcf/yr of domestically produced LNG by vessel to non-FTA countries is currently pending before the DOE (the “Stage 3 Non-FTA”).
|
In each case, the terms of these authorizations begin on the earlier of the date of first export thereunder or the date specified in the particular order, which ranges from seven to 10 years from the date the order was issued.
In June 2018, we requested that DOE vacate the Stage 3 FTA and permit us to withdraw the pending Stage 3 Non-FTA. These requests were made due to certain changes to Corpus Christi Stage 3.
In conjunction with the submission in June 2018 of our FERC application for
Corpus Christi Stage 3
, we submitted a new application for long-term multi-contract authorization to export up to a combined total of 582.14 Bcf/yr (approximately 11.45 mtpa) of natural gas to FTA countries for a 25-year term and to non-FTA countries for a 20-year term. The term of each authorization is expected to begin on the earlier of the date of first commercial export of LNG produced by
Corpus Christi Stage 3
or the date which is seven years from the issuance of such authorizations.
Customers
CCL has entered into fixed price
SPA
s generally with terms of 20 years (plus extension rights) with
nine
third parties for Trains 1 through 3 of the
CCL Project
, to make available an aggregate amount of LNG that is between approximately
75%
to
85%
of the expected aggregate adjusted nominal production capacity from these Trains. Under these SPAs, the customers will purchase LNG from CCL for a price consisting of a fixed fee per MMBtu of LNG (a portion of which is subject to annual adjustment for inflation) plus a variable fee per
MMBtu
of LNG equal to approximately 115% of Henry Hub. In certain circumstances, the customers may elect to cancel or suspend deliveries of LNG cargoes, in which case the customers would still be required to pay the fixed fee with respect to the contracted volumes that are not delivered as a result of such cancellation or suspension. We refer to the fee component that is applicable regardless of a cancellation or suspension of LNG cargo deliveries under the SPAs as the fixed fee component of the price under our SPAs. We refer to the fee component that is applicable only in connection with LNG cargo deliveries as the variable fee component of the price under our SPAs
.
The variable fee under CCL’s SPAs entered into in connection with the development of the
CCL Project
was sized at the time of entry into each SPA with the intent to cover the costs of gas purchases and transportation related to, and operating and maintenance costs to produce, the LNG to be sold under each such SPA. The SPAs and contracted volumes to be made available under the SPAs are not tied to a specific Train; however, the term of each SPA generally commences upon the date of first commercial delivery for the applicable Train, as specified in each SPA.
In aggregate, the minimum fixed fee portion to be paid by the third-party SPA customers is approximately $550 million for Train 1 and increasing to approximately $1.4 billion for Train 2, in each case upon the date of first commercial delivery for the respective Train, and further increasing to approximately $1.8 billion following the substantial completion of Train 3 of the CCL Project.
The annual contracted cash flows from fixed fees of each buyer of LNG under CCL’s third-party SPAs that constitute more than 10% of CCL’s aggregate fixed fees under all its SPAs for Trains 1 through 3 of the CCL Project are:
|
•
|
approximately $410 million from Endesa S.A.;
|
|
•
|
approximately $280 million from PT Pertamina (Persero); and
|
|
•
|
approximately $270 million from
Naturgy
, which is guaranteed by
Naturgy Energy Group, S.A.
|
The average annual contracted cash flow from fixed fees from buyers under all of our other third-party SPAs for Trains 1 through 3 of the
CCL Project
is approximately $790 million.
In addition, Cheniere Marketing has entered into SPAs with CCL to purchase
15
TBtu per annum of LNG and any LNG produced by CCL in excess of that required for other customers at Cheniere Marketing’s option.
6
Natural Gas Transportation, Storage and Supply
To ensure CCL is able to transport adequate natural gas feedstock to the Corpus Christi LNG terminal, it has entered into transportation precedent agreements to secure firm pipeline transportation capacity with CCP and certain third-party pipeline companies. CCL has entered into a firm storage services agreement with a third party to assist in managing variability in natural gas needs for the
CCL Project
. CCL has also entered into enabling agreements and long-term natural gas supply contracts with third parties, and will continue to enter into such agreements, in order to secure natural gas feedstock for the
CCL Project
. As of
December 31, 2018
, CCL had secured up to approximately
2,801
TBtu
of natural gas feedstock through long-term natural gas supply contracts, a portion of which is subject to the achievement of certain project milestones and other conditions precedent.
Construction
CCL entered into separate lump sum turnkey contracts with
Bechtel
for the engineering, procurement and construction of Stages 1 and 2 of the
CCL Project
under which
Bechtel
charges a lump sum for all work performed and generally bears project cost risk unless certain specified events occur, in which case
Bechtel
may cause CCL to enter into a change order, or CCL agrees with
Bechtel
to a change order.
The total contract prices of the EPC contract for Stage 1 and the EPC contract for Stage 2, which do not include the
Corpus Christi Pipeline
, are approximately
$7.8 billion
and
$2.4 billion
, respectively, reflecting amounts incurred under change orders through
December 31, 2018
. Total expected capital costs for Trains 1 through 3 are estimated to be between
$11.0 billion
and
$12.0 billion
before financing costs and between
$15.0 billion
and
$16.0 billion
after financing costs including, in each case, estimated owner’s costs and contingencies.
Pipeline Facilities
In December 2014, the FERC issued a certificate of public convenience and necessity under Section 7(c) of the Natural Gas Act of 1938, as amended (the “NGA”), authorizing CCP to construct and operate the Corpus Christi Pipeline. The Corpus Christi Pipeline is designed to transport 2.25 Bcf/d of natural gas feedstock required by the CCL Project from the existing regional natural gas pipeline grid. The construction of the Corpus Christi Pipeline commenced in January 2017 and was completed in the second quarter of 2018.
Competition
SPL has entered into fixed price
SPA
s with terms of at least 20 years (plus extension rights) with
six
third parties for Trains 1 through 5 of the
SPL Project
, to make available an aggregate amount of LNG that is between approximately
80%
to
95%
of the expected aggregate adjusted nominal production capacity from these Trains. CCL has entered into fixed price
SPA
s generally with terms of 20 years (plus extension rights) with
nine
third parties for Trains 1 through 3 of the
CCL Project
, to make available an aggregate amount of LNG that is between approximately
75%
to
85%
of the expected aggregate adjusted nominal production capacity from these Trains. Each customer will be required to pay an escalating fixed fee for its annual contract quantity even if it elects not to purchase any LNG from us.
If and when SPL or CCL need to replace any existing SPA or enter into new SPAs, they will compete on the basis of price per contracted volume of LNG with each other and other natural gas liquefaction projects throughout the world. Revenues associated with any incremental volumes, including those sold by our integrated marketing function discussed above, will also be subject to market-based price competition. Many of the companies with which we compete are major energy corporations with longer operating histories, more development experience, greater name recognition, greater financial, technical and marketing resources and greater access to markets than us.
SPLNG currently does not experience competition for its terminal capacity because the entire approximately 4.0 Bcf/d of regasification capacity that is available at the Sabine Pass LNG terminal has been fully contracted. If and when SPLNG has to replace any TUAs, it will compete with other then-existing LNG terminals for customers.
7
Governmental Regulation
Our LNG terminals are subject to extensive regulation under federal, state and local statutes, rules, regulations and laws. These laws require that we engage in consultations with appropriate federal and state agencies and that we obtain and maintain applicable permits and other authorizations. This regulatory requirement increases the cost of construction and operation, and failure to comply with such laws could result in substantial penalties and/or loss of necessary authorizations.
Federal Energy Regulatory Commission
The design, construction and operation of our liquefaction facilities, the export of LNG and the transportation of natural gas through the Creole Trail Pipeline and the Corpus Christi Pipeline are highly regulated activities. Under the NGA, the FERC’s jurisdiction generally extends to the transportation of natural gas in interstate commerce, to the sale in interstate commerce of natural gas for resale for ultimate consumption for domestic, commercial, industrial or any other use and to natural gas companies engaged in such transportation or sale. However, the FERC’s jurisdiction does not extend to the production, gathering, local distribution or export of natural gas.
In general, the FERC’s authority to regulate interstate natural gas pipelines and the services that they provide includes:
|
•
|
rates and charges, and terms and conditions for natural gas transportation and related services;
|
|
•
|
the certification and construction of new facilities;
|
|
•
|
the extension and abandonment of services and facilities;
|
|
•
|
the administration of accounting and financial reporting regulations, including the maintenance of accounts and records;
|
|
•
|
the acquisition and disposition of facilities;
|
|
•
|
the initiation and discontinuation of services; and
|
|
•
|
various other matters.
|
In addition, under the NGA, our pipelines are not permitted to unduly discriminate or grant undue preference as to rates or the terms and conditions of service to any shipper, including its own marketing affiliate. The FERC has the authority to grant certificates allowing construction and operation of facilities used in interstate gas transportation and authorizing the provision of services.
In order to site, construct and operate our LNG terminals, we received and are required to maintain authorizations from the FERC under Section 3 of the NGA as well as several other material governmental and regulatory approvals and permits. The Energy Policy Act of 2005 (the “EPAct”) amended Section 3 of the NGA to establish or clarify the FERC’s exclusive authority to approve or deny an application for the siting, construction, expansion or operation of LNG terminals, although except as specifically provided in the EPAct, nothing in the EPAct is intended to affect otherwise applicable law related to any other federal or state agency’s authorities or responsibilities related to LNG terminals. The FERC issued final orders in April and July 2012 approving our application for an order under Section 3 of the NGA authorizing the siting, construction and operation of Trains 1 through 4 of the SPL Project (and related facilities). Subsequently, the FERC issued written approval to commence site preparation work for Trains 1 through 4. In October 2012, we applied to amend the FERC approval to reflect certain modifications to the SPL Project, and in August 2013, the FERC issued an order approving the modifications. In October 2013, we applied to further amend the FERC approval, requesting authorization to increase the total permitted LNG production capacity of Trains 1 through 4 from the then authorized 803 Bcf/yr to 1,006 Bcf/yr so as to more accurately reflect the estimated maximum LNG production capacity of Trains 1 through 4. In February 2014, the FERC issued an order approving the October 2013 application (the “February 2014 Order”). A party to the proceeding requested a rehearing of the February 2014 Order, and in September 2014, the FERC issued an order denying the rehearing request (the “FERC Order Denying Rehearing”). The party petitioned the U.S. Court of Appeals for the District of Columbia Circuit
(the “Court of Appeals”)
to review the February 2014 Order and the FERC Order Denying Rehearing. The court denied the petition in June 2016. In September 2013, we filed an application with the FERC for authorization to add Trains 5 and 6 to the SPL Project, which was granted by the FERC in an order issued in April 2015 and an order denying rehearing issued in June 2015. These orders are not subject to appellate court review.
In December 2014, the FERC issued an order granting CCL authorization under Section 3 of the NGA to site, construct and operate Stage 1 and Stage 2 of the CCL Project and issued a certificate of public convenience and necessity under Section 7(c) of
8
the NGA authorizing CCP to construct and operate the Corpus Christi Pipeline (the “December 2014 Order”). A party to the proceeding requested a rehearing of the December 2014 Order, and in May 2015, the FERC denied rehearing (the “Order Denying Rehearing”). The party petitioned the
Court of Appeals
to review the December 2014 Order and the Order Denying Rehearing, and that petition was denied on November 4, 2016.
In 2002, the FERC concluded that it would apply light-handed regulation over the rates, terms and conditions agreed to by parties for LNG terminalling services, such that LNG terminal owners would not be required to provide open-access service at non-discriminatory rates or maintain a tariff or rate schedule on file with the FERC, as distinguished from the requirements applied to our FERC-regulated natural gas pipeline. The EPAct codified the FERC’s policy, but those provisions expired on January 1, 2015. Nonetheless, we see no indication that the FERC intends to modify its longstanding policy of light-handed regulation of LNG terminals.
In order to construct, own, operate and maintain the Creole Trail Pipeline, CTPL received a certificate of public convenience and necessity from the FERC under Section 7 of the NGA. The FERC’s approval under Section 7 of the NGA, as well as several other material governmental and regulatory approvals and permits, may be required prior to making any modifications to the Creole Trail Pipeline as it is a regulated, interstate natural gas pipeline. In 2013, the FERC also approved CTPL’s application for authorization to construct, own, operate and maintain certain new facilities in order to enable bi-directional natural gas flow on the Creole Trail Pipeline system to allow for the delivery of up to 1,530,000 dekatherms per day of feed gas to the SPL Project. In November 2013, CTPL received approval from the Louisiana Department of Environmental Quality (“LDEQ”) for the proposed modifications and, with subsequent final FERC clearance, construction was completed in 2015. In September 2013, we filed an application with the FERC for authorization to construct and operate an extension and expansion of the Creole Trail Pipeline and related facilities in order to deliver additional domestic natural gas supplies to the SPL Project, which was granted by the FERC in an order issued in April 2015 and an order denying rehearing issued in June 2015. These orders are not subject to appellate court review.
The FERC’s Standards of Conduct apply to interstate pipelines that conduct transmission transactions with an affiliate that engages in marketing functions. Interstate pipelines must treat all transmission customers on a not unduly discriminatory basis. The general principles of the Standards of Conduct are: (1) independent functioning, which requires transmission function employees to function independently of marketing function employees; (2) no-conduit rule, which prohibits passing transmission function information to marketing function employees; and (3) transparency, which imposes posting requirements to detect undue preference due to the improper disclosure of non-public transmission function information. Our pipelines have established the required policies and procedures to comply with the FERC’s Standards of Conduct and are subject to audit by the FERC to review compliance, policies and their training programs.
Several other material governmental and regulatory approvals and permits will be required throughout the life of our liquefaction projects. In addition, the FERC orders require us to comply with certain ongoing conditions and obtain certain additional FERC and other regulatory agency approvals as construction progresses. To date, we have been able to obtain these approvals as needed and the need for these approvals has not materially affected our construction progress. Throughout the life of our LNG terminals and our pipelines, we will be subject to regular reporting requirements to the FERC, the U.S. Department of Transportation’s (“DOT”) Pipeline and Hazardous Materials Safety Administration (“PHMSA”) and applicable federal and state regulatory agencies regarding the operation and maintenance of our facilities.
The FERC’s jurisdiction under the NGA allows it to impose civil and criminal penalties for any violations of the NGA and any rules, regulations or orders of the FERC up to approximately $1.3 million per day per violation, including any conduct that violates the NGA’s prohibition against market manipulation. We are permitted to make sales of natural gas for resale in interstate commerce pursuant to a blanket marketing certificate automatically granted by the FERC to our marketing affiliates. Our sales of natural gas will be affected by the availability, terms and cost of pipeline transportation. As noted above, the price and terms of access to pipeline transportation are subject to extensive federal and state regulation.
DOE Export License
The DOE has authorized the export of domestically produced LNG by vessel from the Sabine Pass LNG terminal as discussed in
Sabine Pass LNG Terminal
—
Liquefaction Facilities
and the Corpus Christi LNG terminal as discussed in
Corpus Christi LNG Terminal
—
Liquefaction Facilities.
Although it is not expected to occur, the loss of an export authorization could be a force majeure event under our SPAs.
9
Exports of natural gas to FTA countries are “deemed to be consistent with the public interest” and authorization to export LNG to FTA countries shall be granted by the DOE without “modification or delay.” FTA countries which currently import LNG include Canada, Chile, Colombia, Dominican Republic, Israel, Jordan, Mexico, Panama, Singapore and South Korea. Exports of natural gas to non-FTA countries are considered by the DOE in the context of a comment period whereby interveners are provided the opportunity to assert that such authorization would not be consistent with the public interest.
Pipelines
The Creole Trail Pipeline and the Corpus Christi Pipeline are also subject to regulation by the PHMSA, pursuant to which the PHMSA has established requirements relating to the design, installation, testing, construction, operation, replacement and management of pipeline facilities.
The Pipeline Safety Improvement Act of 2002, as amended (“PSIA”), which is administered by the PHMSA Office of Pipeline Safety, governs the areas of testing, education, training and communication. The PSIA requires pipeline companies to perform extensive integrity tests on natural gas transportation pipelines that exist in high population density areas designated as “high consequence areas.” Pipeline companies are required to perform the integrity tests on a seven-year cycle. The risk ratings are based on numerous factors, including the population density in the geographic regions served by a particular pipeline, as well as the age and condition of the pipeline and its protective coating. Testing consists of hydrostatic testing, internal electronic testing, or direct assessment of the piping. In addition to the pipeline integrity tests, pipeline companies must implement a qualification program to make certain that employees are properly trained. Pipeline operators also must develop integrity management programs for gas transportation pipelines, which requires pipeline operators to perform ongoing assessments of pipeline integrity; identify and characterize applicable threats to pipeline segments that could impact a high consequence area; improve data collection, integration and analysis; repair and remediate the pipeline, as necessary; and implement preventive and mitigation actions.
In 2009, the PHMSA issued a final rule (known as “Control Room Management/Human Factors Rule”) that became effective in 2010 requiring pipeline operators to write and institute certain control room procedures that address human factors and fatigue management.
In March 2015, PHMSA issued a final rule amending the pipeline safety regulations to update and clarify certain regulatory requirements, including who can perform post-construction inspections on transmission pipelines. In September 2015, PHMSA issued a rule indefinitely delaying the effective date for the amendment to the regulation regarding post-construction inspections.
In May 2015, PHMSA issued a notice of proposed rulemaking proposing to amend gas pipeline safety regulations regarding plastic piping systems used in gas services, including the installation of plastic pipe used for gas transmission lines. The PHMSA has not finalized any of the regulations proposed in this notice.
In July 2015, PHMSA issued a notice of proposed rulemaking proposing to add a specific timeframe for operators’ notification of accidents or incidents, as well as amending the safety regulations regarding operator qualification requirements by expanding the requirements to include new construction and certain previously excluded operation and maintenance tasks, requiring a program effectiveness review and adding new recordkeeping requirements. In January 2017, PHMSA issued a final rule (effective as of March 24, 2017) adding a specific time frame for operators’ notification of accidents or incidents but delayed final action on the proposed operator qualification requirements until a later date.
In April 2016, the PHMSA issued a notice of proposed rulemaking addressing changes to the regulations governing the safety of gas transmission pipelines. Specifically, PHMSA is considering certain integrity management requirements for “moderate consequence areas,” requiring an integrity verification process for specific categories of pipelines, and mandating more explicit requirements for the integration of data from integrity assessments to an operator’s compliance procedures. The PHMSA is also considering whether to revise requirements for corrosion control and expanding the definition of regulated gathering lines. These notices of proposed rulemaking are still pending at the PHMSA. The PHMSA has not finalized any of the regulations proposed in this notice.
Natural Gas Pipeline Safety Act of 1968 (“NGPSA”)
Louisiana and Texas administer federal pipeline safety standards under the NGPSA, which requires certain pipelines to comply with safety standards in constructing and operating the pipelines and subjects the pipelines to regular inspections. Failure to comply with the NGPSA may result in the imposition of administrative, civil and criminal sanctions.
10
Pipeline Safety, Regulatory Certainty and Job Creation Act of 2011
The Creole Trail Pipeline and Corpus Christi Pipeline are also subject to the Pipeline Safety, Regulatory Certainty and Job Creation Act of 2011, which regulates safety requirements in the design, construction, operation and maintenance of interstate natural gas transmission facilities. Under the Pipeline Safety, Regulatory Certainty and Job Creation Act of 2011, PHMSA has civil penalty authority up to approximately $200,000 per day per violation (increased from the prior $100,000), with a maximum of approximately $2 million in civil penalties for any related series of violations (increased from the prior $1 million).
Other Governmental Permits, Approvals and Authorizations
The construction and operation of the Sabine Pass LNG terminal and the CCL Project require additional federal permits, orders, approvals and consultations required by federal agencies, including the DOT, Advisory Council on Historic Preservation, U.S. Army Corps of Engineers (“USACE”), U.S. Department of Commerce, National Marine Fisheries Services, U.S. Department of the Interior, U.S. Fish and Wildlife Service, Environmental Protection Agency (the “EPA”) and U.S. Department of Homeland Security.
Three significant permits are the USACE Section 404 of the Clean Water Act/Section 10 of the Rivers and Harbors Act Permit (the “Section 10/404 Permit”), the Clean Air Act Title V Operating Permit (the “Title V Permit”) and the Prevention of Significant Deterioration Permit (the “PSD Permit”), of which the latter two permits are issued by the LDEQ for the Sabine Pass LNG terminal and CTPL and by the Texas Commission on Environmental Quality (“TCEQ”) for the CCL Project.
The Sabine Pass LNG terminal’s Section 10/404 Permit authorizing construction of Trains 1 through 4 was received from the USACE in March 2012. A modification to the Section 10/404 Permit, to address wetlands impacted by the construction of Trains 5 and 6, was issued by the USACE in June 2015. The USACE acted in the capacity as a cooperating agency in the review process under the National Environmental Policy Act of 1969. The LDEQ issued amended PSD and Title V Permits in September 2017 to reflect certain facility modifications, updated emissions and as-built capacity factors. In October 2018, Sabine Pass LNG Terminal applied to the LDEQ for another amendment to its PSD and Title V Permits to reflect certain facility modifications and as-built reconciliation revisions.
An application for an amendment to CCL’s Section 10/404 Permit to authorize construction of the CCL Project was issued by the USACE in July 2014 and subsequently modified in October 2014. The TCEQ issued amended PSD permits for criteria pollutants and
greenhouse gas (“GHG”)
in July 2018 to reflect updates related to refined operational direction and changes that were made during the design and procurement process.
The LDEQ issued an administrative amendment to the Title V Permit for CTPL in February 2017 to correct permit representations. In April 2018, CTPL applied to the LDEQ for another amendment to the Title V Permit to update permit representations.
The TCEQ issued an amended Air Standard Permit for the Corpus Christi Pipeline compressor station at Sinton, Texas in November 2018 for modifications to the facility and to update permit representations.
LDEQ issued a modification of the wastewater discharge permit to Sabine Pass LNG Terminal in December 2017 to include wastewaters generated with respect to the anticipated operations of Trains 5 and 6 of the SPL Project. CCL was issued a waste water discharge permit in October 2017 authorizing discharges from the CCL Project.
Commodity
Futures Trading Commission
(“CFTC”)
The Dodd-Frank Wall Street Reform and Consumer Protection Act
(the “Dodd-Frank Act”)
amended the Commodity Exchange Act to provide for federal regulation of the over-the-counter derivatives market and entities, such as us, that participate in that market. The regulatory regime created by the Dodd-Frank Act is designed primarily to (1) regulate certain participants in the swaps markets, including entities falling within the categories of “Swap Dealer” and “Major Swap Participant,” (2) require clearing and exchange trading of standardized swaps of certain classes as designated by the CFTC, (3) increase swap market transparency through robust reporting and recordkeeping requirements, (4) reduce financial risks in the derivatives market by imposing margin or collateral requirements on both cleared and, in certain cases, uncleared swaps, (5) provide the CFTC with expanded authority to establish position limits on certain physical commodity futures and options contracts and their economically
11
equivalent swaps as it finds necessary and appropriate and (6) otherwise enhance the rulemaking and enforcement authority of the CFTC and the SEC regarding the derivatives markets. Most of the regulations are already in effect, while other rules and regulations, including the proposed margin rules, position limits, and commodity clearing requirements, remain to be finalized or effectuated. Therefore, the impact of those rules and regulations on our business continues to be uncertain.
A provision of the Dodd-Frank Act requires the CFTC, in order to diminish or prevent excessive speculation in commodity markets, to adopt rules, as it finds necessary and appropriate, imposing new position limits on certain physical commodity futures contracts and options thereon, as well as economically equivalent swaps traded on registered swap trading platforms and on over-the-counter swaps that perform a significant price discovery function with respect to certain markets. In that regard, the CFTC has re-proposed position limits rules that would modify and expand the applicability of limits on speculative positions in certain physical commodity futures contracts, and economically equivalent futures, options and swaps for or linked to certain physical commodities, including Henry Hub natural gas, that market participants may hold, subject to limited exemptions for certain bona fide hedging and other types of transactions. It is uncertain at this time whether, when and in what form the CFTC’s proposed new position limits rules may become final and effective.
Pursuant to rules adopted by the CFTC, certain interest rate swaps and index credit default swaps must be cleared through a derivatives clearing organization and executed on an exchange or swap execution facility. The CFTC has not yet proposed to designate swaps in any other asset classes, including swaps relating to physical commodities, for mandatory clearing and trade execution, but could do so in the future. Although we expect to qualify for the end-user exception from the mandatory clearing and exchange-trading requirements applicable to any swaps that we enter into to hedge our commercial risks, the mandatory clearing and exchange-trading requirements may apply to other market participants, including our counterparties (who may be registered as Swap Dealers), with respect to other swaps, and the application of such rules may change the market cost and general availability in the market of swaps of the type we enter into to hedge our commercial risks and, thus, the cost and availability of the swaps that we use for hedging.
As required by provisions of the Dodd-Frank Act, the CFTC and federal banking regulators have adopted rules to require Swap Dealers and Major Swap Participants, including those that are regulated financial institutions, to collect initial and/or variation margin with respect to uncleared swaps from their counterparties that are financial end users, registered swap dealers or major swap participants. These rules, which, as to the collection of initial margin, are being phased in, do not require collection of margin from non-financial-entity end users who qualify for the end user exception from the mandatory clearing requirement or from non-financial end users or certain other counterparties in certain instances. We expect to qualify as such a non-financial-entity end user with respect to the swaps that we enter into to hedge our commercial risks.
Any new rules or changes to existing rules promulgated under the Dodd-Frank Act could (1) impair the availability of derivatives, (2) materially increase the cost of, or decrease the liquidity of, the derivatives we use to hedge, (3) significantly alter the terms and conditions of derivatives and (4) potentially increase our exposure to less creditworthy counterparties. Further, any resulting reduction in the use of derivatives could make cash flow more volatile and less predictable, which in turn could adversely affect our ability to plan for and fund capital expenditures.
Pursuant to the Dodd-Frank Act, the CFTC has adopted additional anti-manipulation and anti-disruptive trading practices regulations that prohibit, among other things, manipulative, deceptive or fraudulent schemes or material misrepresentation in the futures, options, swaps and cash markets. In addition, separate from the Dodd-Frank Act, our use of futures and options on commodities is subject to the Commodity Exchange Act and CFTC regulations, as well as the rules of futures exchanges on which any of these instruments are executed. Should we violate any of these laws and regulations, we could be subject to a CFTC or an exchange enforcement action and material penalties, possibly resulting in changes in the rates we can charge.
Federal Energy Regulatory Commission (FERC)
As referenced above, the FERC also enforces any market manipulation concerns under the EPAct 2005.
United Kingdom (UK)/European Regulations
Our EU trading activities, which are primarily established in the UK, are subject to a number of EU-wide and UK specific laws and regulations. These are described further below:
12
European Market Infrastructure Regulation (“EMIR”)
EMIR is an EU regulation (with text that is relevant across the European Economic Area (“EEA”)) designed to increase the transparency and stability of the EEA derivatives markets, including by: (1) imposing requirements on market participants trading derivatives, including relating to reporting, clearing and risk mitigation; and (2) imposing rules and standards that apply to central counterparties (i.e. clearing houses) and trade repositories. The precise impact of these rules will depend on a number of factors, including the regulatory status of the counterparty that is trading derivative instruments, as well as the volume and types of instruments it is trading. We currently are categorized under EMIR as a non-financial counterparty below the clearing threshold, which is a type of market participant subject to a lower regulatory burden. However, were we to engage in activities that resulted in a change to our status, we could be subject to more onerous regulations (including clearing and margining) which could significantly increase the cost of our derivatives trading activity, and materially alter the terms of the derivatives contracts we enter into.
Regulation on Wholesale Energy Market Integrity and Transparency (“REMIT”)
REMIT is an EU regulation (with EEA relevance) that prohibits market manipulation and insider trading in European wholesale energy markets and imposes various obligations on participants in these markets. Market participants, such as us, cannot use inside information (i.e., non-public information that would likely have a significant effect on the price of wholesale energy products if it were made public) to (1) buy or sell wholesale energy products for their own account or on behalf of a third party, directly or indirectly; (2) induce others to buy or sell wholesale energy products based on inside information; or (3) disclose such inside information to any other person except in the normal course of employment. A market participant is also prohibited from manipulating or attempting to manipulate any wholesale energy market, and is required to publicly disclose inside information which it possesses in respect of business or facilities which it or its affiliates either owns or controls, or for whose operational matters it or they are responsible, either in whole or in part.
Markets in Financial Instruments Directive and Regulation (“MiFID II”)
MiFID II consists of an EU directive regulation, and a number of delegated acts, rules, and guidance, that replaced the original 2004 Markets in Financial Instruments Directive (“MiFID”). MiFID II (with relevance throughout the EEA), sets forth an EEA-wide financial services framework, including rules for firms engaging in investment services and activities in connection with certain financial instruments in the EEA. Firms engaging in such activities must be authorized unless an exemption applies.
We are eligible to trade on our own account in commodity derivatives as a result of the “ancillary activity” exemption under MiFID II. To avail ourselves of this exemption, amongst other things, we must be able to demonstrate, on the basis of a methodology set out in certain delegated MiFID II text, that our activities in commodity derivatives are ancillary to the main business of our group. Provided we meet the requirements, we must notify the UK regulator that we are availing ourselves of this exemption on an annual basis. If, in the future, we are no longer able to meet the requirements of the “ancillary activity” exemption, and no other exemption is available to us, we would be required to become authorized as an investment firm under MiFID II. This may result in us being subject to the regulatory capital requirements under the EU’s Capital Requirements Directive IV.
Market Abuse Regulation (“MAR”)
MAR is intended to update and strengthen the existing EU market abuse framework and applies to all financial instruments listed or traded on EU trading venues as well as other over-the-counter (“OTC”) financial instruments priced on, or impacting, the trading venue contract. Generally, MAR applies to entities trading on, or in a manner that impacts EU markets. MAR contains a number of “insider dealing” and “market manipulation” (including “attempted manipulation”) based offences. Under MAR, any person professionally arranging or executing transactions in financial instruments is required to establish and maintain effective arrangements, systems and procedures to detect and report suspicious orders and transactions.
UK-Specific Rules
In addition to the various EU/EEA rules described above, other UK-specific laws, such as the UK’s Financial Services and Markets Act of 200 (“FSMA”) and Financial Services and Markets Act 2000 (Regulated Activities) Order 2001 (“RAO”), also apply to our trading activities.
13
Any violation of the foregoing laws and regulations could result in investigations, and possible fine and penalties, and in some scenarios, criminal offenses.
Environmental Regulation
Our LNG terminals are subject to various federal, state and local laws and regulations relating to the protection of the environment and natural resources. These environmental laws and regulations require significant expenditures for compliance, can affect the cost and output of operations and may impose substantial penalties for non-compliance and substantial liabilities for pollution. Many of these laws and regulations, such as those noted below, restrict or prohibit impacts to the environment or the types, quantities and concentration of substances that can be released into the environment and can lead to substantial administrative, civil and criminal fines and penalties for non-compliance.
Clean Air Act (“CAA”)
Our LNG terminals are subject to the federal CAA and comparable state and local laws. We may be required to incur certain capital expenditures over the next several years for air pollution control equipment in connection with maintaining or obtaining permits and approvals addressing air emission-related issues. We do not believe, however, that our operations, or the construction and operations of our liquefaction facilities, will be materially and adversely affected by any such requirements.
In 2009, the EPA promulgated and finalized the Mandatory Greenhouse Gas Reporting Rule for multiple sections of the economy. This rule requires mandatory reporting of GHG emissions from stationary sources, including fuel combustion sources. In 2010, the EPA expanded the rule to include reporting obligations for LNG terminals. In addition, the EPA has defined GHG emissions thresholds that would subject GHG emissions from new and modified industrial sources to regulation if the source is subject to PSD Permit requirements due to its emissions of non-GHG criteria pollutants. The Obama Administration took several actions intended to limit GHG emissions, including regulating emissions from new and existing Electricity Generating Units and from new and modified oil and gas operations. The timing, extent and impact of these rules and other Obama Administration initiatives remain uncertain as the Trump Administration has undertaken steps to delay their implementation, and to review, repeal and potentially replace them. On October 10, 2017, EPA issued a proposal to repeal the Clean Power Plan after concluding the October 2015 final rule exceeds EPA’s statutory authority under the CAA. In August 2018, the EPA proposed the Affordable Clean Energy rule as a replacement for the Clean Power Plan, which requires states to develop plans to implement certain performance standards
within three years after the Final Rule is published in the Federal Register
. Many of the Trump Administration’s efforts to rollback Obama Administration actions have been challenged in court.
From time to time, Congress has considered proposed legislation directed at reducing GHG emissions. In addition, many states have already taken regulatory action to monitor and/or reduce emissions of GHGs, primarily through the development of GHG emission inventories or regional GHG cap and trade programs. It is not possible at this time to predict how future regulations or legislation may address GHG emissions and impact our business. However, future regulations and laws could result in increased compliance costs or additional operating restrictions and could have a material adverse effect on our business, contracts, financial condition, operating results, cash flow, liquidity and prospects.
Coastal Zone Management Act (“CZMA”)
The siting and construction of our LNG terminals within the coastal zone is
subject to the requirements of the CZMA. The CZMA is administered by the states (in Louisiana, by the Department of Natural Resources, and in Texas, by the General Land Office). This program is implemented to ensure that impacts to coastal areas are consistent with the intent of the CZMA to manage the coastal areas.
Clean Water Act (“CWA”)
Our LNG terminals are
subject to the federal CWA and analogous state and local laws. The CWA imposes strict controls on the discharge of pollutants into the navigable waters of the United States, including discharges of wastewater and storm water runoff and fill/discharges into waters of the United States. Permits must be obtained prior to discharging pollutants into state and federal waters. The CWA is administered by the EPA, the USACE and by the states (in Louisiana, by the LDEQ, and in Texas, by the TCEQ and the
Railroad Commission of Texas
).
14
Resource Conservation and Recovery Act (“RCRA”)
The federal RCRA and comparable state statutes govern the generation, handling and disposal of solid and hazardous wastes and require corrective action for releases into the environment. In the event such wastes are generated in connection with our facilities, we will be subject to regulatory requirements affecting the handling, transportation, treatment, storage and disposal of such wastes.
Protection of Species, Habitats and Wetlands
Various federal and state statutes, such as the Endangered Species Act (the “ESA”), the Migratory Bird Treaty Act, the CWA and the Oil Pollution Act, prohibit certain activities that may adversely affect endangered or threatened animal, fish and plant species and/or their designated habitats, wetlands, or other natural resources. If one of our LNG terminals or pipelines adversely affects a protected species or its habitat, we may be required to develop and follow a plan to avoid those impacts. In that case, siting, construction or operation may be delayed or restricted and cause us to incur increased costs.
In July 2018, the U.S. Fish and Wildlife Service (the “FWS”) announced a series of proposed changes to the rules implementing the ESA, including proposed revisions to the regulations governing interagency cooperation, listing species and delisting critical habitat, and prohibitions related to threatened wildlife and plants. The proposed revisions are intended to streamline these processes and create more flexibility for the FWS when making ESA-related decisions. It is not possible at this time to predict how such changes, if adopted, would impact our business.
In addition, in December 2017, the Department of Interior’s (“DOI’s”) Solicitor’s Office issued an official opinion that the Migratory Bird Treaty Act’s broad prohibition on “taking” migratory birds applies only to affirmative actions and does not include incidental taking. In April 2018 the FWS issued guidance consistent with the DOI’s opinion. The opinion has been challenged in court.
Market Factors
Our ability to enter into additional long-term SPAs to underpin the development of additional Trains, sell any quantities of LNG available under the SPAs with Cheniere Marketing, or develop new projects is subject to market factors. These factors include changes in worldwide supply and demand for natural gas, LNG and substitute products, the relative prices for natural gas, crude oil and substitute products in North America and international markets, the rate of fuel switching for power generation from coal, nuclear or oil to natural gas and economic growth in developing countries. In addition, our ability to obtain additional funding to execute our business strategy is subject to the investment community’s appetite for investment in LNG and natural gas infrastructure and our ability to access capital markets.
We expect that global demand for natural gas and LNG will continue to increase as nations seek more abundant, reliable and environmentally cleaner fuel alternatives to oil and coal. Global demand for natural gas is projected by the International Energy Agency to grow by approximately 19 trillion cubic feet (“Tcf”) between 2017 and 2025, with LNG’s share growing from about 10% in 2017 to about 15% of the global gas market in 2025. Wood Mackenzie Limited forecasts that global demand for LNG will increase by approximately 60%, from approximately 287 mtpa, or 13.8 Tcf in 2017, to approximately 461 mtpa, or 22.1 Tcf, in 2025, and that LNG production from existing operational facilities and new facilities already under construction will be able to supply the market with approximately 413 mtpa in 2025, resulting in a market need for construction of an additional approximately 48 mtpa of LNG production. We believe the capital and operating costs of the uncommitted capacity of our SPL Project, CCL Project and
Corpus Christi Stage 3
are competitive with new proposed projects globally and we are well-positioned to capture a portion of this incremental market need.
We have limited exposure to the decline in oil prices as we have contracted a significant portion of our LNG production capacity under long-term sale and purchase agreements. These agreements contain fixed fees that are required to be paid even if the customers elect to cancel or suspend delivery of LNG cargoes. We have contracted an aggregate amount of LNG that is between approximately
80%
to
95%
of the expected aggregate adjusted nominal production capacity for Trains 1 through 5 of the SPL Project with third-party customers. We have contracted an aggregate amount of LNG that is between approximately
75%
to
85%
of the expected aggregate adjusted nominal production capacity of Trains 1 through 3 of the CCL Project with third-party customers. As of January 31, 2019, U.S. natural gas prices indicate that LNG exported from the U.S. continues to be competitively priced, supporting the opportunity for U.S. LNG to fill uncontracted future demand through the execution of long-term, medium-term and short-term contracting of LNG from our terminals.
15
Subsidiaries
Our assets are generally held by or under our subsidiaries. We conduct most of our business through these subsidiaries, including the development, construction and operation of our LNG terminal business and the development and operation of our LNG and natural gas marketing business.
Employees
We had
1,372
full-time employees at January 31,
2019
.
Available Information
Our common stock has been publicly traded since March 24, 2003 and is traded on the NYSE American under the symbol “LNG.” Our principal executive offices are located at 700 Milam Street, Suite 1900, Houston, Texas 77002, and our telephone number is (713) 375-5000. Our internet address is www.cheniere.com. We provide public access to our annual reports on Form 10-K, quarterly reports on Form 10-Q, current reports on Form 8-K and amendments to these reports as soon as reasonably practicable after we electronically file those materials with, or furnish those materials to, the SEC under the
Exchange Act
. These reports may be accessed free of charge through our internet website. We make our website content available for informational purposes only. The website should not be relied upon for investment purposes and is not incorporated by reference into this Form 10-K.
We will also make available to any stockholder, without charge, copies of our annual report on Form 10-K as filed with the SEC. For copies of this, or any other filing, please contact: Cheniere Energy, Inc., Investor Relations Department, 700 Milam Street Suite 1900, Houston, Texas 77002 or call (713) 375-5000. The SEC maintains an internet site (www.sec.gov) that contains reports, proxy and information statements and other information regarding issuers.
|
ITEM 1A.
|
RISK FACTORS
|
The following are some of the important factors that could affect our financial performance or could cause actual results to differ materially from estimates or expectations contained in our forward-looking statements. We may encounter risks in addition to those described below. Additional risks and uncertainties not currently known to us, or that we currently deem to be immaterial, may also impair or adversely affect our business, contracts, financial condition, operating results, cash flows, liquidity and prospects.
The risk factors in this report are grouped into the following categories:
|
•
|
Risks Relating to Our Financial Matters;
|
|
•
|
Risks Relating to Our LNG Terminal Operations and Commercialization;
|
|
•
|
Risks Relating to Our LNG Business in General; and
|
|
•
|
Risks Relating to Our Business in General.
|
Risks Relating to Our Financial Matters
Our existing level of cash resources and significant debt could cause us to have inadequate liquidity and could materially and adversely affect our business, contracts, financial condition, operating results, cash flow, liquidity and prospects.
As of December 31,
2018
, we had
$981 million
of cash and cash equivalents,
$2.2 billion
of current restricted cash and
$29.2 billion
of total debt outstanding on a consolidated basis (before unamortized premium, discount and debt issuance costs), excluding
$741 million
aggregate outstanding letters of credit. We incur, and will incur, significant interest expense relating to the assets at the Sabine Pass and Corpus Christi LNG terminals, and we anticipate needing to incur additional debt to finance the construction of Train 6 of the SPL Project. Our ability to fund our capital expenditures and refinance our indebtedness will depend on our ability to access additional project financing as well as the debt and equity capital markets. A variety of factors beyond our control could impact the availability or cost of capital, including domestic or international economic conditions, increases in key benchmark interest rates and/or credit spreads, the adoption of new or amended banking or capital market laws or regulations and the repricing of market risks and volatility in capital and financial markets. Our financing costs could increase or future
16
borrowings or equity offerings may be unavailable to us or unsuccessful, which could cause us to be unable to pay or refinance our indebtedness or to fund our other liquidity needs. We also rely on borrowings under our credit facilities to fund our capital expenditures. If any of the lenders in the syndicates backing these facilities was unable to perform on its commitments, we may need to seek replacement financing, which may not be available as needed, or may be available in more limited amounts or on more expensive or otherwise unfavorable terms.
We have not been profitable historically. We may not achieve profitability or generate positive operating cash flow in the future.
We had net losses attributable to common stockholders of $393 million and $610 million for the years ended December 31, 2017 and 2016, respectively.
In the future, we may incur operating losses and experience negative operating cash flow. We may not be able to reduce costs, increase revenues or reduce our debt service obligations sufficiently to maintain our cash resources, which could cause us to have inadequate liquidity to continue our business.
We will continue to incur significant capital and operating expenditures while we develop and construct the SPL Project, the CCL Project and other projects. Any delays beyond the expected development period for these projects could cause, and could increase the level of, our operating losses and negative operating cash flows. Our future liquidity may also be affected by the timing of construction financing availability in relation to the incurrence of construction costs and other outflows and by the timing of receipt of cash flows under third-party agreements in relation to the incurrence of project and operating expenses. Moreover, many factors (including factors beyond our control) could result in a disparity between liquidity sources and cash needs, including factors such as construction delays and breaches of agreements. Our ability to generate any significant positive operating cash flow and achieve profitability in the future is dependent on our ability to successfully and timely complete and operate the applicable project.
We may sell equity or equity-related securities or assets, including equity interests in Cheniere Partners. Such sales could dilute our stockholders’ proportionate indirect interests in our assets, business operations and proposed liquefaction and other projects of Cheniere Partners or other subsidiaries, and could adversely affect the market price of our common stock.
We have pursued and are pursuing a number of alternatives in order to finance the construction of Train 6 of the SPL Project, including potential issuances and sales of additional equity or equity-related securities by us or Cheniere Partners. Such sales, in one or more transactions, could dilute our stockholders’ proportionate indirect interests in our assets, business operations and proposed projects of Cheniere Partners, including the SPL Project, or in other subsidiaries or projects, including the CCL Project. In addition, such sales, or the anticipation of such sales, could adversely affect the market price of our common stock.
Our stockholders may experience dilution upon the conversion of our convertible notes.
In November 2014, we issued an aggregate principal amount of $1.0 billion Convertible Unsecured Notes due 2021
(the “2021 Cheniere Convertible Unsecured Notes”)
to RRJ Capital II Ltd, Baytree Investments (Mauritius) Pte Ltd and Seatown Lionfish Pte. Ltd. In March 2015, we issued $625 million aggregate principal amount of 4.25% Convertible Senior Notes due 2045
(the “2045 Cheniere Convertible Senior Notes”)
to certain investors through a registered direct offering. In May 2015, CCH HoldCo II issued $1.0 billion aggregate principal amount of 11.0% Convertible Senior Secured Notes due 2025 (the “2025 CCH HoldCo II Convertible Senior Notes” and together with the
2021 Cheniere Convertible Unsecured Notes
and the
2045 Cheniere Convertible Senior Notes
,
the “Convertible Notes”
) to EIG Management Company, LLC.
We have the option to satisfy the
2021 Cheniere Convertible Unsecured Notes
and the
2045 Cheniere Convertible Senior Notes
conversion obligations with cash, common stock or a combination thereof. The
2025 CCH HoldCo II Convertible Senior Notes
conversion obligations must be satisfied with common stock. The
2021 Cheniere Convertible Unsecured Notes
are convertible at an initial conversion price of $93.64. Prior to December 15, 2044, the
2045 Cheniere Convertible Senior Notes
will be convertible upon the occurrence of certain conditions, and on and after such date they will become freely convertible. The
2045 Cheniere Convertible Senior Notes
will become convertible into the common stock of Cheniere at an initial conversion price of $138.38 per share. Provided the total market capitalization of Cheniere at that time is not less than $10.0 billion, the
2025 CCH HoldCo II Convertible Senior Notes
will be convertible at CCH HoldCo II’s option on or after the later of (1) March 1, 2020 and (2) the substantial completion of Train 2 of the CCL Project
(the “Eligible Conversion Date”)
. The conversion price for
2025 CCH HoldCo II Convertible Senior Notes
converted at CCH HoldCo II’s option is the lower of (1) a 10% discount to the average of the daily volume-weighted average price
(“VWAP”)
of our common stock for the 90 trading day period prior to the date on which notice of conversion is provided and (2) a 10% discount to the closing price of our common stock on the trading day preceding the date on which notice of conversion is provided. At the option of the holders, the
2025 CCH HoldCo II Convertible
17
Senior Notes
are convertible on or after the six-month anniversary of the
Eligible Conversion Date
, provided the total market capitalization of Cheniere at that time is not less than $10.0 billion, at a conversion price equal to the average of the daily
VWAP
of our common stock for the 90 trading day period prior to the date on which notice of conversion is provided.
The conversion of some or all of the
Convertible Notes
into shares of our common stock will dilute the ownership percentages and voting power of our existing stockholders. Based on the initial conversion price, if we elect to satisfy the entire conversion obligations of the
2021 Cheniere Convertible Unsecured Notes
and the
2045 Cheniere Convertible Senior Notes
with common stock, an aggregate of approximately 19.1 million shares of our common stock would be issued upon the conversion, assuming the notes are converted at maturity and all interest on the notes is paid in kind for the
2021 Cheniere Convertible Unsecured Notes
. Because the conversion rate for the
2025 CCH HoldCo II Convertible Senior Notes
will depend on the price of our common stock at the time of conversion, we cannot meaningfully estimate the number of shares of our common stock, if any, that would be issued upon the conversion of such notes; however, under these convertible notes, a maximum of 47,108,466 shares of our common stock (subject to adjustment in the event of a stock split) may be issued in the aggregate upon the conversion of all of the
2025 CCH HoldCo II Convertible Senior Notes
. Any sales in the public market of the shares issuable upon conversion of the
Convertible Notes
could adversely affect the prevailing market prices of our common stock. In addition, the existence of the
Convertible Notes
may encourage short selling by market participants because the conversion of the
Convertible Notes
could be used to satisfy short positions, or the anticipated conversion of the
Convertible Notes
into shares of our common stock could depress the price of our common stock.
Our ability to generate cash is substantially dependent upon the performance by customers under long-term contracts that we have entered into, and we could be materially and adversely affected if any customer fails to perform its contractual obligations for any reason.
Our future results and liquidity are substantially dependent upon performance by our customers to make payments under long-term contracts. As of December 31,
2018
, SPL had SPAs with
seven
third-party customers, CCL had SPAs with
nine
third-party customers and our integrated marketing function had a limited number of SPAs with third-party customers. In addition, SPLNG had TUAs with two third-party customers. We are dependent on each customer’s continued willingness and ability to perform its obligations under its SPA or TUA. We are exposed to the credit risk of any guarantor of these customers’ obligations under their respective agreements in the event that we must seek recourse under a guaranty. If any customer fails to perform its obligations under its SPA or TUA, our business, contracts, financial condition, operating results, cash flow, liquidity and prospects could be materially and adversely affected, even if we were ultimately successful in seeking damages from that customer or its guarantor for a breach of the agreement.
Each of our customer contracts is subject to termination under certain circumstances.
Each of the SPAs contains various termination rights allowing our customers to terminate their SPAs, including, without limitation: (1) upon the occurrence of certain events of force majeure; (2) if we fail to make available specified scheduled cargo quantities; and (3) delays in the commencement of commercial operations. We may not be able to replace these SPAs on desirable terms, or at all, if they are terminated.
Each of SPLNG’s long-term TUAs contains various termination rights. For example, each customer may terminate its TUA if the Sabine Pass LNG terminal experiences a force majeure delay for longer than 18 months, fails to redeliver a specified amount of natural gas in accordance with the customer’s redelivery nominations or fails to accept and unload a specified number of the customer’s proposed LNG cargoes. SPLNG may not be able to replace these TUAs on desirable terms, or at all, if they are terminated.
Our subsidiaries may be restricted under the terms of their indebtedness from making distributions under certain circumstances, which may limit Cheniere Partners’ ability to pay or increase distributions to us or inhibit our access to cash flows from the CCL Project and could materially and adversely affect us.
The agreements governing our subsidiaries’ indebtedness restrict payments that our subsidiaries can make to Cheniere Partners or us in certain events and limit the indebtedness that our subsidiaries can incur. For example, SPL is restricted from making distributions under agreements governing its indebtedness generally until, among other requirements, deposits are made into debt service reserve accounts and a debt service coverage ratio of 1.25:1.00 is satisfied.
18
CCH is generally restricted from making distributions under agreements governing its indebtedness until, among other requirements, the completion of the construction of Trains 1 through 3 of the CCL Project, funding of a debt service reserve account equal to six months of debt service and achieving a historical debt service coverage ratio and fixed projected debt service coverage ratio of at least 1.25:1.00.
CCH HoldCo II is restricted from making distributions to Cheniere under agreements governing its indebtedness generally until, among other requirements, Trains 1 and 2 of the CCL Project are in commercial operation and a historical debt service coverage ratio and a projected fixed debt services coverage ratio of 1.20:1.00 are achieved.
Our subsidiaries’ inability to pay distributions to Cheniere Partners or us to incur additional indebtedness as a result of the foregoing restrictions in the agreements governing their indebtedness may inhibit Cheniere Partners’ ability to pay or increase distributions to us and its other unitholders or inhibit our access to cash flows from the CCL Project, which could have a material adverse effect on our business, contracts, financial condition, operating results, cash flow, liquidity and prospects.
Restrictions in agreements governing us and our subsidiaries’ indebtedness may prevent us and our subsidiaries from engaging in certain beneficial transactions.
In addition to restrictions on the ability of us, Cheniere Partners, SPL, CCH and CCH HoldCo II to make distributions or incur additional indebtedness, the agreements governing our indebtedness also contain various other covenants that may prevent us from engaging in beneficial transactions, including limitations on our ability to:
|
•
|
make certain investments;
|
|
•
|
purchase, redeem or retire equity interests;
|
|
•
|
issue preferred stock;
|
|
•
|
sell or transfer assets;
|
|
•
|
incur liens;
|
|
•
|
enter into transactions with affiliates;
|
|
•
|
consolidate, merge, sell or lease all or substantially all of our assets; and
|
|
•
|
enter into sale and leaseback transactions.
|
Our use of hedging arrangements may adversely affect our future operating results or liquidity.
To reduce our exposure to fluctuations in the price, volume and timing risk associated with the purchase of natural gas, we use futures, swaps and option contracts traded or cleared on the Intercontinental Exchange and the New York Mercantile Exchange or over-the-counter options and swaps with other natural gas merchants and financial institutions. Hedging arrangements could expose us to risk of financial loss in some circumstances, including when:
|
•
|
expected supply is less than the amount hedged;
|
|
•
|
the counterparty to the hedging contract defaults on its contractual obligations; or
|
|
•
|
there is a change in the expected differential between the underlying price in the hedging agreement and actual prices received.
|
The use of derivatives also may require the posting of cash collateral with counterparties, which can impact working capital when commodity prices change.
The swaps regulatory and other provisions of the Dodd-Frank Act and the rules adopted thereunder and other regulations, including EMIR and REMIT, could adversely affect our ability to hedge risks associated with our business and our operating results and cash flows.
The provisions of the
Dodd-Frank Act
and the rules adopted and to be adopted by the
CFTC
, the SEC and other federal regulators establishing federal regulation of the OTC derivatives market and entities like us that participate in that market may adversely affect our ability to manage certain of our risks on a cost effective basis. Such laws and regulations may also adversely affect our ability to execute our strategies with respect to hedging our exposure to variability in expected future cash flows
19
attributable to the future sale of our LNG inventory and to price risk attributable to future purchases of natural gas to be utilized as fuel to operate our LNG terminals and to secure natural gas feedstock for our liquefaction facilities.
The CFTC has re-proposed position limits rules that would modify and expand the applicability of position limits on the amounts of certain speculative futures contracts, as well as economically equivalent options, futures and swaps for or linked to certain physical commodities, including Henry Hub natural gas, that market participants may hold, subject to limited exemptions for certain bona fide hedging positions and other types of transactions. To the extent the revised CFTC position limits proposal becomes final, our ability to execute our hedging strategies described above could be limited. It is uncertain at this time whether, when and in what form the CFTC’s proposed new position limits rules may become final and effective.
Under the Dodd-Frank Act and the rules adopted thereunder, we may be required to clear through a derivatives clearing organization any swaps into which we enter that fall within a class of swaps designated by the CFTC for mandatory clearing and we could have to execute trades in such swaps on certain trading platforms or exchanges. The CFTC has designated certain interest rate swaps and index credit default swaps for mandatory clearing, but has not yet finalized rules designating any physical commodity swaps, for mandatory clearing or mandatory exchange trading. Although we expect to qualify for the end-user exception from the mandatory clearing and trade execution requirements for our swaps entered into to hedge our commercial risks, if we fail to qualify for that exception as to any swap we enter into and have to clear that swap through a derivatives clearing organization, we could be required to post margin with respect to such swap, our cost of entering into and maintaining such swap could increase and we would not enjoy the same flexibility with the cleared swaps that we enjoy with the uncleared OTC swaps we enter into. Moreover, the application of the mandatory clearing and trade execution requirements to other market participants, such as swap dealers, may change the market cost and general availability in the market of swaps of the type we enter into to hedge our commercial risks and, thus, the cost and availability of the swaps that we use for hedging.
As required by the Dodd-Frank Act, the CFTC and federal banking regulators have adopted rules to require certain market participants to collect and post initial and/or variation margin with respect to uncleared swaps from their counterparties that are financial end users and certain registered swap dealers and major swap participants. Although we believe we will not be required to post margin with respect to any uncleared swaps we enter into in the future, were we required to post margin as to our uncleared swaps in the future, our cost of entering into and maintaining swaps would be increased. Our counterparties that are subject to the regulations imposing the Basel III capital requirements on them may increase the cost to us of entering into swaps with them or, although not required to collect margin from us under the margin rules, contractually require us to post collateral with them in connection with such swaps in order to offset their increased capital costs or to reduce their capital costs to maintain those swaps on their balance sheets.
The Dodd-Frank Act also imposes other regulatory requirements on swaps market participants, including end users of swaps, such as regulations relating to swap documentation, reporting and recordkeeping, and certain business conduct rules applicable to swap dealers and major swap participants. Together with the Basel III capital requirements on certain swaps market participants, the regulatory requirements of the Dodd-Frank Act and the rules thereunder relating to swaps and derivatives market participants could significantly increase the cost of derivative contracts (including through requirements to post margin or collateral), materially alter the terms of derivative contracts, reduce the availability of derivatives to protect against certain risks that we encounter and reduce our ability to monetize or restructure our existing derivative contracts and to execute our hedging strategies. If, as a result of the swaps regulatory regime discussed above, we were to reduce our use of swaps to hedge our risks, such as commodity price risks that we encounter in our operations, our operating results and cash flows may become more volatile and could be otherwise adversely affected.
The Federal Reserve Board also has proposed rules that would limit certain physical commodity activities of financial holding companies. Such rules, if adopted, may adversely affect our ability to execute our strategies by restricting our available counterparties for certain types of transactions, limiting our ability to obtain certain services, and reducing liquidity in physical and financial markets. It is uncertain at this time whether, when and in what form the Federal Reserve’s proposed rules regarding financial holding companies may become final and effective.
European and UK-specific regulations, including but not limited to EMIR, MiFID II, REMIT, MAR, FSMA and RAO, govern our trading activities and our compliance with such laws may result in increased costs and risks to the business similar to the impacts stated above with respect to Dodd-Frank. The increased costs may also have an adverse impact on our business, contracts, financial condition, operating results, cash flow, liquidity and prospects. Further, any violation of the foregoing laws and regulations could result in investigations, and possible fines and penalties, and in some scenarios, criminal offenses.
20
Further, given the current lack of clarity relating to the terms on which the United Kingdom will exit the European Union (“Brexit”), including the impact such withdrawal will have on parties subject to the referenced regulations, additional regulatory risks may result. However, until the terms of a final agreement between the United Kingdom and European Union have been agreed, it is impossible at this point to address with certainty the impact of Brexit on our operations.
We
expect that our hedging activities will remain subject to significant and developing regulations and regulatory oversight. However, the full impact of the various U.S. (and non-U.S.) regulatory developments in connection with these activities will not be known with certainty until such derivatives market regulations are fully implemented and related market practices and structures are fully developed.
Risks Relating to Our LNG Terminal Operations and Commercialization
Operation of the Sabine Pass LNG terminal, the SPL Project and the CCL Project, our pipelines and other facilities that we may construct involves significant risks.
As more fully discussed in these Risk Factors, the Sabine Pass LNG terminal, the SPL Project and the CCL Project, our pipelines and our other existing and proposed LNG facilities face operational risks, including the following:
|
•
|
the facilities’ performing below expected levels of efficiency;
|
|
•
|
breakdown or failures of equipment;
|
|
•
|
operational errors by vessel or tug operators;
|
|
•
|
operational errors by us or any contracted facility operator;
|
|
•
|
labor disputes; and
|
|
•
|
weather-related interruptions of operations.
|
Cost overruns and delays in the completion of one or more Trains, as well as difficulties in obtaining sufficient financing to pay for such costs and delays, could have a material adverse effect on our business, contracts, financial condition, operating results, cash flow, liquidity and prospects.
The actual construction costs of the Trains may be significantly higher than our current estimates as a result of many factors, including change orders under existing or future EPC contracts resulting from the occurrence of certain specified events that may give Bechtel the right to cause us to enter into change orders or resulting from changes with which we otherwise agree. We have already experienced increased costs due to change orders. As construction progresses, we may decide or be forced to submit change orders to our contractor that could result in longer construction periods, higher construction costs or both, including change orders to comply with existing or future environmental or other regulations.
Delays in the construction of one or more Trains beyond the estimated development periods, as well as change orders to the EPC contracts with Bechtel or any future EPC contract related to additional Trains, could increase the cost of completion beyond the amounts that we estimate, which could require us to obtain additional sources of financing to fund our operations until the applicable liquefaction project is fully constructed (which could cause further delays). Our ability to obtain financing that may be needed to provide additional funding to cover increased costs will depend, in part, on factors beyond our control. Accordingly, we may not be able to obtain financing on terms that are acceptable to us, or at all. Even if we are able to obtain financing, we may have to accept terms that are disadvantageous to us or that may have a material adverse effect on our current or future business, contracts, financial condition, operating results, cash flow, liquidity and prospects.
Delays in the completion of one or more Trains could lead to reduced revenues or termination of one or more of the SPAs by our customers.
Any delay in completion of a Train could cause a delay in the receipt of revenues projected therefrom or cause a loss of one or more customers in the event of significant delays.
In particular, each of our SPAs provides that the customer may terminate that SPA if the relevant Train does not timely commence commercial operations.
As a result, any significant construction delay, whatever the cause, could have a material adverse effect on our business, contracts, financial condition, operating results, cash flow, liquidity and prospects.
21
Our ability to complete development of additional Trains will be contingent on our ability to obtain additional funding. If we are unable to obtain sufficient funding, we may be unable to fully execute our business strategy.
We will require significant additional funding to be able to commence construction of Train 6 of the SPL Project, which we may not be able to obtain at a cost that results in positive economics, or at all. The inability to achieve acceptable funding may cause a delay in the development of additional Trains, and we may not be able to complete our business plan. Even if we are able to obtain funding, the funding may be inadequate to cover any increases in costs or delays in completion of Train 6 of the SPL Project, which may cause a delay in the receipt of revenues projected therefrom or cause a loss of one or more future customers in the event of significant delays. As a result, any significant construction delay, whatever the cause, could have a material adverse effect on our business, contracts, financial condition, operating results, cash flow, liquidity and prospects.
Hurricanes or other disasters could result in an interruption of our operations, a delay in the completion of our liquefaction projects, higher construction costs and the deferral of the dates on which payments are due to us under the SPAs, all of which could adversely affect us.
In August and September of 2005, Hurricanes Katrina and Rita, respectively, damaged coastal and inland areas located in Texas, Louisiana, Mississippi and Alabama, resulting in the temporary suspension of construction of the Sabine Pass LNG terminal. In September 2008, Hurricane Ike struck the Texas and Louisiana coasts, and the Sabine Pass LNG terminal experienced minor damage. In August 2017, Hurricane Harvey struck the Texas and Louisiana coasts, and the Sabine Pass LNG terminal experienced a temporary suspension in construction and LNG loading operations. Construction on the Corpus Christi LNG terminal was also suspended.
Future storms and related storm activity and collateral effects, or other disasters such as explosions, fires, floods or accidents, could result in damage to, or interruption of operations at, the Sabine Pass LNG terminal or related infrastructure, as well as delays or cost increases in the construction and the development of the SPL Project, the CCL Project or our other facilities. Changes in the global climate may have significant physical effects, such as increased frequency and severity of storms, floods and rising sea levels; if any such effects were to occur, they could have an adverse effect on our coastal operations.
Failure to obtain and maintain approvals and permits from governmental and regulatory agencies with respect to the design, construction and operation of our facilities and the development and operation of our pipelines could impede operations and construction and could have a material adverse effect on us.
The design, construction and operation of interstate natural gas pipelines, LNG terminals, including the SPL Project and the CCL Project and other facilities, and the import and export of LNG and the transportation of natural gas, are highly regulated activities. Approvals of the FERC and DOE under Section 3 and Section 7 of the NGA, as well as several other material governmental and regulatory approvals and permits, including several under the CAA and the CWA, are required in order to construct and operate an LNG facility and an interstate natural gas pipeline and export LNG. Although the FERC has issued orders under Section 3 of the NGA authorizing the siting, construction and operation of six Trains and related facilities of the SPL Project and three Trains and related facilities of the CCL Project and Section 7 of the NGA authorizing the construction and operation of the Creole Trail Pipeline and the Corpus Christi Pipeline, the FERC orders require us to comply with certain ongoing conditions and obtain certain additional approvals in conjunction with ongoing construction and operations of our liquefaction and pipeline facilities. We will be required to obtain similar approvals and permits with respect to any expansion or modification of our liquefaction and pipeline facilities. We cannot control the outcome of the FERC’s or the DOE’s review and approval processes. Certain of these governmental permits, approvals and authorizations are or may be subject to rehearing requests, appeals and other challenges.
Authorizations obtained from the FERC, DOE and other federal and state regulatory agencies also contain ongoing conditions, and additional approval and permit requirements may be imposed. We do not know whether or when any such approvals or permits can be obtained, or whether any existing or potential interventions or other actions by third parties will interfere with our ability to obtain and maintain such permits or approvals. If we are unable to obtain and maintain the necessary approvals and permits, including as a result of untimely notices or filings, we may not be able to recover our investment in our projects. Additionally, government disruptions, such as a U.S. government shutdown, may delay or halt our ability to obtain and maintain necessary approvals and permits. There is no assurance that we will obtain and maintain these governmental permits, approvals and authorizations, or that we will be able to obtain them on a timely basis, and failure to obtain and maintain any of these permits, approvals or authorizations could have a material adverse effect on our business, contracts, financial condition, operating results, cash flow, liquidity and prospects.
22
We are dependent on Bechtel and other contractors for the successful completion of the SPL Project and the CCL Project.
Timely and cost-effective completion of the SPL Project and the CCL Project in compliance with agreed specifications is central to our business strategy and is highly dependent on the performance of Bechtel and our other contractors under their agreements. The ability of Bechtel and our other contractors to perform successfully under their agreements is dependent on a number of factors, including their ability to:
|
•
|
design and engineer each Train to operate in accordance with specifications;
|
|
•
|
engage and retain third-party subcontractors and procure equipment and supplies;
|
|
•
|
respond to difficulties such as equipment failure, delivery delays, schedule changes and failure to perform by subcontractors, some of which are beyond their control;
|
|
•
|
attract, develop and retain skilled personnel, including engineers;
|
|
•
|
post required construction bonds and comply with the terms thereof;
|
|
•
|
manage the construction process generally, including coordinating with other contractors and regulatory agencies; and
|
|
•
|
maintain their own financial condition, including adequate working capital.
|
Although some agreements may provide for liquidated damages if the contractor fails to perform in the manner required with respect to certain of its obligations, the events that trigger a requirement to pay liquidated damages may delay or impair the operation of the SPL Project and the CCL Project, and any liquidated damages that we receive may not be sufficient to cover the damages that we suffer as a result of any such delay or impairment. The obligations of Bechtel and our other contractors to pay liquidated damages under their agreements are subject to caps on liability, as set forth therein.
Furthermore, we may have disagreements with our contractors about different elements of the construction process, which could lead to the assertion of rights and remedies under their contracts and increase the cost of the SPL Project and the CCL Project or result in a contractor’s unwillingness to perform further work on the SPL Project and the CCL Project. If any contractor is unable or unwilling to perform according to the negotiated terms and timetable of its respective agreement for any reason or terminates its agreement, we would be required to engage a substitute contractor. This would likely result in significant project delays and increased costs, which could have a material adverse effect on our business, contracts, financial condition, operating results, cash flow, liquidity and prospects.
We are relying on third-party engineers to estimate the future capacity ratings and performance capabilities of the SPL Project and the CCL Project, and these estimates may prove to be inaccurate.
We are relying on third parties, principally Bechtel, for the design and engineering services underlying our estimates of the future capacity ratings and performance capabilities of the SPL Project and the CCL Project. If any Train, when actually constructed, fails to have the capacity ratings and performance capabilities that we intend, our estimates may not be accurate. Failure of any of our Trains to achieve our intended capacity ratings and performance capabilities could prevent us from achieving the commercial start dates under our SPAs and could have a material adverse effect on our business, contracts, financial condition, operating results, cash flow, liquidity and prospects.
If third-party pipelines and other facilities interconnected to our pipelines and facilities are or become unavailable to transport natural gas, this could have a material adverse effect on our business, contracts, financial condition, operating results, cash flow, liquidity and prospects.
We depend upon third-party pipelines and other facilities that provide gas delivery options to our liquefaction facilities and pipelines. If the construction of new or modified pipeline connections is not completed on schedule or any pipeline connection were to become unavailable for current or future volumes of natural gas due to repairs, damage to the facility, lack of capacity or any other reason, our ability to meet our SPA obligations and continue shipping natural gas from producing regions or to end markets could be restricted, thereby reducing our revenues which could have a material adverse effect on our business, contracts, financial condition, operating results, cash flow, liquidity and prospects.
23
We may not be able to purchase or receive physical delivery of sufficient natural gas to satisfy our delivery obligations under the SPAs, which could have a material adverse effect on us.
Under the SPAs with our customers, we are required to make available to them a specified amount of LNG at specified times. However, we may not be able to purchase or receive physical delivery of sufficient quantities of natural gas to satisfy those obligations, which may provide affected SPA customers with the right to terminate their SPAs. Our failure to purchase or receive physical delivery of sufficient quantities of natural gas could have a material adverse effect on our business, contracts, financial condition, operating results, cash flow, liquidity and prospects.
Our interstate natural gas pipelines and their FERC gas tariffs are subject to FERC regulation.
Our interstate natural gas pipelines are subject to regulation by the FERC under the NGA and the Natural Gas Policy Act of 1978 (the “NGPA”). The FERC regulates the transportation of natural gas in interstate commerce, including the construction and operation of pipelines, the rates, terms and conditions of service and abandonment of facilities. Under the NGA, the rates charged by our interstate natural gas pipelines must be just and reasonable, and we are prohibited from unduly preferring or unreasonably discriminating against any person with respect to pipeline rates or terms and conditions of service. If we fail to comply with all applicable statutes, rules, regulations and orders, our interstate pipelines could be subject to substantial penalties and fines.
In addition, as a natural gas market participant, should we fail to comply with all applicable FERC-administered statutes, rules, regulations and orders, we could be subject to substantial penalties and fines. Under the EPAct, the FERC has civil penalty authority under the NGA and the NGPA to impose penalties for current violations of up to $1.3 million per day for each violation.
Pipeline safety integrity programs and repairs may impose significant costs and liabilities on us.
The PHMSA requires pipeline operators to develop integrity management programs to comprehensively evaluate certain areas along their pipelines and to take additional measures to protect pipeline segments located in “high consequence areas” where a leak or rupture could potentially do the most harm. As an operator, we are required to:
|
•
|
perform ongoing assessments of pipeline integrity;
|
|
•
|
identify and characterize applicable threats to pipeline segments that could impact a “high consequence area”;
|
|
•
|
improve data collection, integration and analysis;
|
|
•
|
repair and remediate the pipeline as necessary; and
|
|
•
|
implement preventative and mitigating actions.
|
We are required to maintain pipeline integrity testing programs that are intended to assess pipeline integrity. Any repair, remediation, preventative or mitigating actions may require significant capital and operating expenditures. Should we fail to comply with applicable statutes and the Office of Pipeline Safety’s rules and related regulations and orders, we could be subject to significant penalties and fines.
Any reduction in the capacity of, or the allocations to, interconnecting, third-party pipelines could cause a reduction of volumes transported in our pipelines, which would adversely affect our revenues and cash flow.
We are dependent upon third-party pipelines and other facilities to provide delivery options to and from our pipelines. If any pipeline connection were to become unavailable for volumes of natural gas due to repairs, damage to the facility, lack of capacity or any other reason, our ability to continue shipping natural gas to end markets could be restricted, thereby reducing our revenues. Any permanent interruption at any key pipeline interconnect which causes a material reduction in volumes transported on our pipelines could have a material adverse effect on our business, financial condition, operating results, cash flow, liquidity and prospects.
24
Our business could be materially and adversely affected if we lose the right to situate our pipelines on property owned by third parties.
We do not own the land on which our pipelines are situated, and we are subject to the possibility of increased costs to retain necessary land use rights. If we were to lose these rights or be required to relocate our pipelines, our business could be materially and adversely affected.
Any failure to perform by our counterparties under agreements may adversely affect our operating results, liquidity and access to financing.
Our integrated marketing function involves our entering into various purchase and sale, hedging and other transactions with numerous third parties (commonly referred to as “counterparties”). In such arrangements, we are exposed to the performance and credit risks of our counterparties, including the risk that one or more counterparties fails to perform its obligation to make deliveries of commodities and/or to make payments. These risks may increase during periods of commodity price volatility. Defaults by suppliers and other counterparties may adversely affect our operating results, liquidity and access to financing.
We may not be able to contract with customers to sell LNG produced in excess of the aggregate annual contract quantities
committed to SPL’s and CCL’s third-party SPAs.
We expect to sell any LNG produced in excess of the aggregate annual contract quantity committed to SPL’s and CCL’s third-party SPAs through our integrated marketing function. We are developing a portfolio of long-, medium- and short-term SPAs to transport and unload commercial LNG cargoes to locations worldwide, which is primarily sourced by LNG produced by the SPL Project and the CCL Project in excess of the contract quantities committed to SPL’s and CCL’s third party SPAs, supplemented by volume procured from other locations worldwide, as needed. Failure to secure buyers for a sufficient amount of LNG could materially and adversely affect our operating results, cash flows and liquidity.
Risks Relating to Our LNG Businesses in General
We may not construct or operate all of our proposed LNG facilities or Trains or any additional LNG facilities or Trains beyond those currently planned, which could limit our growth prospects.
We may not construct some of our proposed LNG facilities or Trains, whether due to lack of commercial interest or inability to obtain financing or otherwise. Our ability to develop additional liquefaction facilities will also depend on the availability and pricing of LNG and natural gas in North America and other places around the world. Competitors may have longer operating histories, more development experience, greater name recognition, larger staffs and substantially greater financial, technical and marketing resources and access to sources of natural gas and LNG than we do. If we are unable or unwilling to construct and operate additional LNG facilities, our prospects for growth will be limited.
Our cost estimates for Trains are subject to change as a result of cost overruns, change orders under existing or future construction contracts, changes in commodity prices (particularly nickel and steel), escalating labor costs and the potential need for additional funds to be expended to maintain construction schedules. In the event we experience cost overruns, delays or both, the amount of funding needed to complete a Train could exceed our available funds and result in our failure to complete such Train and thereby negatively impact our business and limit our growth prospects.
Cyclical or other changes in the demand for and price of LNG and natural gas may adversely affect our LNG business and the performance of our customers and could have a material adverse effect on our business, contracts, financial condition, operating results, cash flows, liquidity and prospects.
Our LNG business and the development of domestic LNG facilities and projects generally is based on assumptions about the future availability and price of natural gas and LNG and the prospects for international natural gas and LNG markets. Natural gas and LNG prices have been, and are likely to continue to be, volatile and subject to wide fluctuations in response to one or more of the following factors:
|
•
|
additions to competitive regasification capacity in North America, Europe, Asia and other markets, which could divert LNG from the Sabine Pass LNG terminal and the Corpus Christi LNG terminal;
|
|
•
|
competitive liquefaction capacity in North America;
|
25
|
•
|
insufficient or oversupply of natural gas liquefaction or receiving capacity worldwide;
|
|
•
|
insufficient LNG tanker capacity;
|
|
•
|
weather conditions;
|
|
•
|
reduced demand and lower prices for natural gas;
|
|
•
|
increased natural gas production deliverable by pipelines, which could suppress demand for LNG;
|
|
•
|
decreased oil and natural gas exploration activities, which may decrease the production of natural gas;
|
|
•
|
cost improvements that allow competitors to offer LNG regasification services or provide natural gas liquefaction capabilities at reduced prices;
|
|
•
|
changes in supplies of, and prices for, alternative energy sources such as coal, oil, nuclear, hydroelectric, wind and solar energy, which may reduce the demand for natural gas;
|
|
•
|
changes in regulatory, tax or other governmental policies regarding imported or exported LNG, natural gas or alternative energy sources, which may reduce the demand for imported or exported LNG and/or natural gas;
|
|
•
|
political conditions in natural gas producing regions;
|
|
•
|
adverse relative demand for LNG compared to other markets, which may decrease LNG imports into or exports from North America; and
|
|
•
|
cyclical trends in general business and economic conditions that cause changes in the demand for natural gas.
|
Adverse trends or developments affecting any of these factors could result in decreases in the price of LNG and/or natural gas, which could materially and adversely affect the performance of our customers, and could have a material adverse effect on our business, contracts, financial condition, operating results, cash flows, liquidity and prospects.
Failure of imported or exported LNG to be a competitive source of energy for international markets could adversely affect our customers and could materially and adversely affect our business, contracts, financial condition, operating results, cash flow, liquidity and prospects.
Operations of the SPL Project are, and operations at the CCL Project will be, dependent upon the ability of our SPA customers to deliver LNG supplies from the United States, which is primarily dependent upon LNG being a competitive source of energy internationally. The success of our business plan is dependent, in part, on the extent to which LNG can, for significant periods and in significant volumes, be supplied from North America and delivered to international markets at a lower cost than the cost of alternative energy sources. Through the use of improved exploration technologies, additional sources of natural gas may be discovered outside the United States, which could increase the available supply of natural gas outside the United States and could result in natural gas in those markets being available at a lower cost than LNG exported to those markets.
Although SPL has entered into arrangements to utilize up to approximately three-quarters of the regasification capacity at the Sabine Pass LNG terminal in connection with operations of the SPL Project, operations at the Sabine Pass LNG terminal are dependent, in part, upon the ability of our TUA customers to import LNG supplies into the United States, which is primarily dependent upon LNG being a competitive source of energy in North America. In North America, due mainly to a historically abundant supply of natural gas and discoveries of substantial quantities of unconventional, or shale, natural gas, imported LNG has not developed into a significant energy source. The success of the regasification services component of our business plan is dependent, in part, on the extent to which LNG can, for significant periods and in significant volumes, be produced internationally and delivered to North America at a lower cost than the cost to produce some domestic supplies of natural gas, or other alternative energy sources. Through the use of improved exploration technologies, additional sources of natural gas have recently been and may continue to be discovered in North America, which could further increase the available supply of natural gas and could result in natural gas being available at a lower cost than imported LNG.
Political instability in foreign countries that import or export natural gas, or strained relations between such countries and the United States, may also impede the willingness or ability of LNG purchasers or suppliers and merchants in such countries to import or export LNG from or to the United States. Furthermore, some foreign purchasers or suppliers of LNG may have economic or other reasons to obtain their LNG from, or direct their LNG to, non-U.S. markets or from or to our competitors’ liquefaction or regasification facilities in the United States.
26
In addition to natural gas, LNG also competes with other sources of energy, including coal, oil, nuclear, hydroelectric, wind and solar energy.
LNG from the SPL Project
and the CCL Project
also competes with other sources of LNG, including LNG that is priced to indices other than Henry Hub. Some of these sources of energy may be available at a lower cost than LNG from the SPL Project
and the CCL Project
in certain markets. The cost of LNG supplies from the United States, including the SPL Project
and the CCL Project
, may also be impacted by an increase in natural gas prices in the United States.
As a result of these and other factors, LNG may not be a competitive source of energy in the United States or internationally. The failure of LNG to be a competitive supply alternative to local natural gas, oil and other alternative energy sources in markets accessible to our customers could adversely affect the ability of our customers to deliver LNG from the United States or to the United States on a commercial basis. Any significant impediment to the ability to deliver LNG to or from the United States generally, or to the Sabine Pass LNG terminal or from the SPL Project and the CCL Project specifically, could have a material adverse effect on our customers and on our business, contracts, financial condition, operating results, cash flow, liquidity and prospects.
Various economic and political factors could negatively affect the development, construction and operation of LNG facilities, including the SPL Project, the CCL Project and expansion projects, which could have a material adverse effect on our business, contracts, financial condition, operating results, cash flow, liquidity and prospects.
Commercial development of an LNG facility takes a number of years, requires a substantial capital investment and may be delayed by factors such as:
|
•
|
increased construction costs;
|
|
•
|
economic downturns, increases in interest rates or other events that may affect the availability of sufficient financing for LNG projects on commercially reasonable terms;
|
|
•
|
decreases in the price of LNG, which might decrease the expected returns relating to investments in LNG projects;
|
|
•
|
the inability of project owners or operators to obtain governmental approvals to construct or operate LNG facilities;
|
|
•
|
political unrest or local community resistance to the siting of LNG facilities due to safety, environmental or security concerns; and
|
|
•
|
any significant explosion, spill or similar incident involving an LNG facility or LNG vessel.
|
There may be shortages of LNG vessels worldwide, which could have a material adverse effect on our business, contracts, financial condition, operating results, cash flow, liquidity and prospects.
The construction and delivery of LNG vessels require significant capital and long construction lead times, and the availability of the vessels could be delayed to the detriment of our business and our customers because of:
|
•
|
an inadequate number of shipyards constructing LNG vessels and a backlog of orders at these shipyards;
|
|
•
|
political or economic disturbances in the countries where the vessels are being constructed;
|
|
•
|
changes in governmental regulations or maritime self-regulatory organizations;
|
|
•
|
work stoppages or other labor disturbances at the shipyards;
|
|
•
|
bankruptcy or other financial crisis of shipbuilders;
|
|
•
|
quality or engineering problems;
|
|
•
|
weather interference or a catastrophic event, such as a major earthquake, tsunami or fire; and
|
|
•
|
shortages of or delays in the receipt of necessary construction materials.
|
We may not be able to secure firm pipeline transportation capacity on economic terms that is sufficient to meet our feed gas transportation requirements, which could have a material adverse effect on us.
We have contracted for firm capacity for our natural gas feedstock transportation requirements for Trains 1 through 5 of the SPL Project and Trains 1 through 3 of the CCL Project. We cannot control the regulatory and permitting approvals or third parties’ construction times. If and when we need to replace one or more of our agreements with these interconnecting pipelines, we may
27
not be able to do so on commercially reasonable terms or at all, which could impair our ability to fulfill our obligations under certain of our SPAs and could have a material adverse effect on our business, contracts, financial condition, operating results, cash flow, liquidity and prospects.
We face competition based upon the international market price for LNG.
Our liquefaction projects are subject to the risk of LNG price competition at times when we need to replace any existing SPA, whether due to natural expiration, default or otherwise, or enter into new SPAs. Factors relating to competition may prevent us from entering into a new or replacement SPA on economically comparable terms as existing SPAs, or at all. Such an event could have a material adverse effect on our business, contracts, financial condition, operating results, cash flow, liquidity and prospects. Factors which may negatively affect potential demand for LNG from our liquefaction projects are diverse and include, among others:
|
•
|
increases in worldwide LNG production capacity and availability of LNG for market supply;
|
|
•
|
increases in demand for LNG but at levels below those required to maintain current price equilibrium with respect to supply;
|
|
•
|
increases in the cost to supply natural gas feedstock to our liquefaction projects;
|
|
•
|
decreases in the cost of competing sources of natural gas or alternate fuels such as coal, heavy fuel oil and diesel;
|
|
•
|
decreases in the price of non-U.S. LNG, including decreases in price as a result of contracts indexed to lower oil prices;
|
|
•
|
increases in capacity and utilization of nuclear power and related facilities; and
|
|
•
|
displacement of LNG by pipeline natural gas or alternate fuels in locations where access to these energy sources is not currently available.
|
Terrorist attacks, cyber incidents or military campaigns may adversely impact our business.
A terrorist attack, cyber incident or military incident involving an LNG facility, our infrastructure or an LNG vessel may result in delays in, or cancellation of, construction of new LNG facilities, including one or more of the Trains, which would increase our costs and decrease our cash flows. A terrorist incident or cyber incident may also result in temporary or permanent closure of our existing facilities, which could increase our costs and decrease our cash flows, depending on the duration and timing of the closure. Our operations could also become subject to increased governmental scrutiny that may result in additional security measures at a significant incremental cost to us. In addition, the threat of terrorism and the impact of military campaigns may lead to continued volatility in prices for natural gas that could adversely affect our business and our customers, including their ability to satisfy their obligations to us under our commercial agreements. Instability in the financial markets as a result of terrorism, cyber incidents or war could also materially adversely affect our ability to raise capital. The continuation of these developments may subject our construction and our operations to increased risks, as well as increased costs, and, depending on their ultimate magnitude, could have a material adverse effect on our business, contracts, financial condition, operating results, cash flow, liquidity and prospects.
Risks Relating to Our Business in General
We are subject to significant operating hazards and uninsured risks, one or more of which may create significant liabilities and losses for us.
The construction and operation of our LNG terminals and our pipelines are, and will be, subject to the inherent risks associated with these types of operations, including explosions, pollution, release of toxic substances, fires, hurricanes and adverse weather conditions and other hazards, each of which could result in significant delays in commencement or interruptions of operations and/or in damage to or destruction of our facilities or damage to persons and property. In addition, our operations and the facilities and vessels of third parties on which our operations are dependent face possible risks associated with acts of aggression or terrorism.
We do not, nor do we intend to, maintain insurance against all of these risks and losses. We may not be able to maintain desired or required insurance in the future at rates that we consider reasonable. The occurrence of a significant event not fully insured or indemnified against could have a material adverse effect on our business, contracts, financial condition, operating results, cash flow, liquidity and prospects.
28
Existing and future environmental and similar laws and governmental regulations could result in increased compliance costs or additional operating costs or construction costs and restrictions.
Our business is and will be subject to extensive federal, state and local laws, rules and regulations applicable to our construction and operation activities relating to, among other things, air quality, water quality, waste management, natural resources, and health and safety. Many of these laws and regulations, such as the CAA, the Oil Pollution Act, the CWA and the RCRA, and analogous state laws and regulations, restrict or prohibit the types, quantities and concentration of substances that can be released into the environment in connection with the construction and operation of our facilities, and require us to maintain permits and provide governmental authorities with access to our facilities for inspection and reports related to our compliance. In addition, certain laws and regulations authorize regulators having jurisdiction over our LNG terminals and pipelines, including FERC and PHMSA, to issue compliance orders, which may restrict or limit operations or increase compliance or operating costs. Violation of these laws and regulations could lead to substantial liabilities, fines and penalties or to capital expenditures that could have a material adverse effect on our business, contracts, financial condition, operating results, cash flow, liquidity and prospects. Federal and state laws impose liability, without regard to fault or the lawfulness of the original conduct, for the release of certain types or quantities of hazardous substances into the environment. As the owner and operator of our facilities, we could be liable for the costs of cleaning up hazardous substances released into the environment at or from our facilities and for resulting damage to natural resources.
In October 2015, the EPA promulgated a final rule to implement the Obama Administration’s Clean Power Plan, which is designed to reduce GHG emissions from power plants in the United States.
In February 2016, the U.S. Supreme Court stayed the final rule, effectively suspending the duty to comply with the rule until certain legal challenges
are resolved. On October 10, 2017, EPA issued a proposal to repeal the Clean Power Plan after concluding the October 2015 final rule exceeds EPA’s statutory authority under the CAA. In August 2018, the EPA proposed the Affordable Clean Energy rule as a replacement for the Clean Power Plan, which requires states to develop plans to implement certain performance standards within three years after the Final Rule is published in the Federal Register. The Trump Administration announced in June 2017 that the United States would withdraw from the Paris Accord, an international agreement within the United Nations Framework Convention on Climate Change under which the Obama Administration committed the United States to reducing its economy-wide GHG emission by 26-28% below 2005 levels by 2025. Other federal and state initiatives may be considered in the future to address GHG emissions through, for example, United States treaty commitments, direct regulation, a carbon emissions tax, or cap-and-trade programs. Such initiatives could affect the demand for or cost of natural gas, which we consume at our terminals, or could increase compliance costs for our operations.
Other future legislation and regulations, such as those relating to the transportation and security of LNG imported to or exported from our terminals, could cause additional expenditures, restrictions and delays in our business and to our proposed construction, the extent of which cannot be predicted and which may require us to limit substantially, delay or cease operations in some circumstances. Revised, reinterpreted or additional laws and regulations that result in increased compliance costs or additional operating or construction costs and restrictions could have a material adverse effect on our business, contracts, financial condition, operating results, cash flow, liquidity and prospects.
A major health and safety incident relating to our business could be costly in terms of potential liabilities and reputational damages.
Health and safety performance is critical to the success of all areas of our business. Any failure in health and safety performance may result in personal harm or injury, penalties for non-compliance with relevant regulatory requirements or litigation, and a failure that results in a significant health and safety incident is likely to be costly in terms of potential liabilities. Such a failure could generate public concern and have a corresponding impact on our reputation and our relationships with relevant regulatory agencies and local communities, which in turn could have a material adverse effect on our business, contracts, financial condition, operating results, cash flow, liquidity and prospects.
We may experience increased labor costs, and the unavailability of skilled workers or our failure to attract and retain qualified personnel could adversely affect us. In addition, changes in our senior management or other key personnel could affect our business results.
We are dependent upon the available labor pool of skilled employees. We compete with other energy companies and other employers to attract and retain qualified personnel with the technical skills and experience required to construct and operate our
29
facilities and pipelines and to provide our customers with the highest quality service. Our affiliates who hire personnel on our behalf are also subject to the Fair Labor Standards Act, which governs such matters as minimum wage, overtime and other working conditions. A shortage in the labor pool of skilled workers or other general inflationary pressures or changes in applicable laws and regulations could make it more difficult for us to attract and retain qualified personnel and could require an increase in the wage and benefits packages that we offer, thereby increasing our operating costs. Any increase in our operating costs could materially and adversely affect our business, contracts, financial condition, operating results, cash flow, liquidity and prospects.
We depend on our executive officers for various activities. We do not maintain key person life insurance policies on any of our personnel. Although we have arrangements relating to compensation and benefits with certain of our executive officers, we do not have any employment contracts or other agreements with key personnel other than our employment agreement with our President and Chief Executive Officer binding them to provide services for any particular term. The loss of the services of any of these individuals could have a material adverse effect on our business.
Our lack of diversification could have an adverse effect on our business, contracts, financial condition, operating results, cash flow, liquidity and prospects.
Substantially all of our anticipated revenue in
2019
will be dependent upon our two facilities, the Sabine Pass LNG terminal located in southern Louisiana and the Corpus Christi LNG terminal in Texas. Due to our lack of asset and geographic diversification, an adverse development at the Sabine Pass LNG terminal or the Corpus Christi LNG terminal, including the related pipelines, or in the LNG industry, would have a significantly greater impact on our financial condition and operating results than if we maintained more diverse assets and operating areas.
We may incur impairments to goodwill or long-lived assets.
We test our long-lived assets for impairment whenever events or changes in circumstances indicate that the carrying amount of these assets may not be recoverable. We test goodwill for impairment annually during the fourth quarter, or more frequently as circumstances dictate. Significant negative industry or economic trends, including a significant decline in the market price of our common stock, reduced estimates of future cash flows for our business or disruptions to our business could lead to an impairment charge of our long-lived assets, including goodwill. Our valuation methodology for assessing impairment requires management to make judgments and assumptions based on historical experience and to rely heavily on projections of future operating performance. Projections of future operating results and cash flows may vary significantly from results. In addition, if our analysis results in an impairment to our goodwill or long-lived assets, we may be required to record a charge to earnings in our Consolidated Financial Statements during a period in which such impairment is determined to exist, which may negatively impact our operating results.
The market price of our common stock has fluctuated significantly in the past and is likely to fluctuate in the future. Our stockholders could lose all or part of their investment.
The market price of our common stock has historically experienced and may continue to experience volatility. For example, during the three-year period ended December 31,
2018
, the market price of our common stock ranged between $22.80 and $71.03. Such fluctuations may continue as a result of a variety of factors, some of which are beyond our control, including:
|
•
|
domestic and worldwide supply of and demand for natural gas and corresponding fluctuations in the price of natural gas;
|
|
•
|
fluctuations in our quarterly or annual financial results or those of other companies in our industry;
|
|
•
|
issuance of additional equity securities which causes further dilution to stockholders;
|
|
•
|
sales of a high volume of shares of our common stock by our stockholders;
|
|
•
|
operating and stock price performance of companies that investors deem comparable to us;
|
|
•
|
events affecting other companies that the market deems comparable to us;
|
|
•
|
changes in government regulation or proposals applicable to us;
|
|
•
|
actual or potential non-performance by any customer or a counterparty under any agreement;
|
|
•
|
announcements made by us or our competitors of significant contracts;
|
30
|
•
|
changes in accounting standards, policies, guidance, interpretations or principles;
|
|
•
|
general conditions in the industries in which we operate;
|
|
•
|
general economic conditions;
|
|
•
|
the failure of securities analysts to cover our common stock or changes in financial or other estimates by analysts; and
|
|
•
|
other factors described in these “Risk Factors.”
|
In addition, the United States securities markets have experienced significant price and volume fluctuations. These fluctuations have often been unrelated to the operating performance of companies in these markets. Market fluctuations and broad market, economic and industry factors may negatively affect the price of our common stock, regardless of our operating performance. If we were to be the object of securities class litigation as a result of volatility in our common stock price or for other reasons, it could result in substantial diversion of our management’s attention and resources, which could negatively affect our financial results.
|
ITEM 1B.
|
UNRESOLVED STAFF COMMENTS
|
None.
ITEM 3. LEGAL PROCEEDINGS
We may in the future be involved as a party to various legal proceedings, which are incidental to the ordinary course of business. We regularly analyze current information and, as necessary, provide accruals for probable liabilities on the eventual disposition of these matters.
LDEQ Matter
Certain of our subsidiaries are in discussions with the LDEQ to resolve self-reported deviations arising from operation of the Sabine Pass LNG terminal and the commissioning of the SPL Project, and relating to certain requirements under its Title V Permit. The matter involves deviations self-reported to LDEQ pursuant to the Title V Permit and covering the time period from January 1, 2012 through March 25, 2016. On April 11, 2016, certain of our subsidiaries received a Consolidated Compliance Order and Notice of Potential Penalty (the “Compliance Order”) from LDEQ covering deviations self-reported during that time period. Certain of our subsidiaries continue to work with LDEQ to resolve the matters identified in the Compliance Order. We do not expect that any ultimate sanction will have a material adverse impact on our financial results.
PHMSA Matters
In February 2018, PHMSA issued a Corrective Action Order (the “CAO”) to SPL in connection with a minor LNG leak from one tank and minor vapor release from a second tank at the Sabine Pass LNG terminal. These two tanks have been taken out of operational service while we conduct analysis, repair and remediation. On April 20, 2018, SPL and PHMSA executed a Consent Agreement and Order (the “Consent Order”) that replaces and supersedes the CAO. We continue to work with PHMSA and other appropriate regulatory authorities to address the matters identified in the Consent Order. We do not expect that the Consent Order and related analysis, repair and remediation will have a material adverse impact on our financial results or operations.
In February 2018, PHMSA issued a Notice of Probable Violation, Proposed Civil Penalty and Proposed Compliance Order (“the NOPV”) to CCP alleging probable violations of federal pipeline safety regulations relating to welding during the construction of the pipeline and proposes civil penalties totaling $0.2 million. We worked with PHMSA to address the matters in the NOPV. In September 2018, PHMSA withdrew the proposed civil penalty and NOPV and closed the case citing no further safety concern regarding the welds at CCP.
Parallax Litigation
In 2015, our wholly owned subsidiary, Cheniere LNG Terminals, LLC (“CLNGT”), entered into discussions with Parallax Enterprises, LLC (“Parallax Enterprises”) regarding the potential joint development of two liquefaction plants in Louisiana (the “Potential Liquefaction Transactions”). While the parties negotiated regarding the Potential Liquefaction Transactions, CLNGT
31
loaned Parallax Enterprises approximately
$46 million
, as reflected in a secured note dated April 23, 2015, as amended on June 30, 2015, September 30, 2015 and November 4, 2015 (the “Secured Note”). The Secured Note was secured by all assets of Parallax Enterprises and its subsidiary entities. On June 30, 2015, Parallax Enterprises’ parent entity, Parallax Energy LLC (“Parallax Energy”), executed a Pledge and Guarantee Agreement further securing repayment of the Secured Note by providing a parent guaranty and a pledge of all of the equity of Parallax Enterprises in satisfaction of the Secured Note (the “Pledge Agreement”). CLNGT and Parallax Enterprises never executed a definitive agreement to pursue the Potential Liquefaction Transactions. The Secured Note matured on December 11, 2015, and Parallax Enterprises failed to make payment. On February 3, 2016, CLNGT filed an action against Parallax Energy, Parallax Enterprises and certain of Parallax Enterprises’ subsidiary entities, styled Cause No. 4:16-cv-00286, Cheniere LNG Terminals, LLC v. Parallax Energy LLC, et al., in the United States District Court for the Southern District of Texas (the “Texas Federal Suit”). CLNGT asserted claims in the Texas Federal Suit for (1) recovery of all amounts due under the Secured Note and (2) declaratory relief establishing that CLNGT is entitled to enforce its rights under the Secured Note and Pledge Agreement in accordance with each instrument’s terms and that CLNGT has no obligations of any sort to Parallax Enterprises concerning the Potential Liquefaction Transactions. On March 11, 2016, Parallax Enterprises and the other defendants in the Texas Federal Suit moved to dismiss the suit for lack of subject matter jurisdiction. On August 2, 2016, the court denied the defendants’ motion to dismiss without prejudice and permitted the parties to pursue jurisdictional discovery.
On March 11, 2016, Parallax Enterprises filed a suit against us and CLNGT styled Civil Action No. 62-810, Parallax Enterprises LLP v. Cheniere Energy, Inc. and Cheniere LNG Terminals, LLC, in the 25th Judicial District Court of Plaquemines Parish, Louisiana (the “Louisiana Suit”), wherein Parallax Enterprises asserted claims for breach of contract, fraudulent inducement, negligent misrepresentation, detrimental reliance, unjust enrichment and violation of the Louisiana Unfair Trade Practices Act. Parallax Enterprises predicated its claims in the Louisiana Suit on an allegation that we and CLNGT breached a purported agreement to jointly develop the Potential Liquefaction Transactions. Parallax Enterprises sought
$400 million
in alleged economic damages and rescission of the Secured Note. On April 15, 2016, we and CLNGT removed the Louisiana Suit to the United States District Court for the Eastern District of Louisiana, which subsequently transferred the Louisiana Suit to the United States District Court for the Southern District of Texas, where it was assigned Civil Action No. 4:16-cv-01628 and transferred to the same judge presiding over the Texas Federal Suit for coordinated handling. On August 22, 2016, Parallax Enterprises voluntarily dismissed all claims asserted against CLNGT and us in the Louisiana Suit without prejudice to refiling.
On July 27, 2017, the Parallax entities named as defendants in the Texas Federal Suit reurged their motion to dismiss and simultaneously filed counterclaims against CLNGT and third party claims against us for breach of contract, breach of fiduciary duty, promissory estoppel, quantum meruit and fraudulent inducement of the Secured Note and Pledge Agreement, based on substantially the same factual allegations Parallax Enterprises made in the Louisiana Suit. These Parallax entities also simultaneously filed an action styled Cause No. 2017-49685, Parallax Enterprises, LLC, et al. v. Cheniere Energy, Inc., et al., in the 61st District Court of Harris County, Texas (the “Texas State Suit”), which asserts substantially the same claims these entities asserted in the Texas Federal Suit. On July 31, 2017, CLNGT withdrew its opposition to the dismissal of the Texas Federal Suit without prejudice on jurisdictional grounds and the federal court subsequently dismissed the Texas Federal Suit without prejudice. We and CLNGT simultaneously filed an answer and counterclaims in the Texas State Suit, asserting the same claims CLNGT had previously asserted in the Texas Federal Suit. Additionally, CLNGT filed third party claims against Parallax principals Martin Houston, Christopher Bowen Daniels, Howard Candelet and Mark Evans, as well as Tellurian Investments, Inc., Driftwood LNG, LLC, Driftwood LNG Pipeline LLC and Tellurian Services LLC, formerly known as Parallax Services LLC, including claims for tortious interference with CLNGT’s collateral rights under the Secured Note and Pledge Agreement, fraudulent transfer, conspiracy/aiding and abetting. Discovery in the Texas State Suit is ongoing. Trial is currently set for June 2019.
On February 15, 2019, we filed an action with CLNGT against Charif Souki, our former Chairman of the Board and Chief Executive Officer, styled, Cause No. 2019-11529,
Cheniere Energy, Inc. and Cheniere LNG Terminals, LLC v. Charif Souki
, in the 55th District Court of Harris County, Texas, which asserts claims of breach of fiduciary duties, fraudulent transfer, tortious interference with CLNGT’s collateral rights under the Secured Note and Pledge Agreement, and conspiracy/aiding and abetting.
We do not expect that the resolution of any of the foregoing litigation will have a material adverse impact on our financial results.
|
ITEM 4.
|
MINE SAFETY DISCLOSURE
|
Not applicable.
32
PART II
|
ITEM 5.
|
MARKET FOR REGISTRANT’S COMMON EQUITY, RELATED STOCKHOLDER MATTERS AND ISSUER
|
Market Information, Holders and Dividends
Our common stock has traded on the NYSE American under the symbol “LNG” since March 24, 2003. As of
February 20, 2019
, we had
257.4 million
shares of common stock outstanding held by 109 record owners.
We have never paid a cash dividend on our common stock. We currently intend to retain earnings to finance the growth and development of our business and plan to communicate capital allocation policy decisions during 2019. Any future change in our dividend policy will be made at the discretion of our Board of Directors
(our “Board”)
in light of our financial condition, capital requirements, earnings, prospects and any restrictions under any financing agreements, as well as other factors our
Board
deems relevant.
Purchase of Equity Securities by the Issuer and Affiliated Purchasers
The following table summarizes stock repurchases for the three months ended
December 31, 2018
:
|
Period
|
Total Number of Shares Purchased (1)
|
Average Price Paid Per Share (2)
|
Total Number of Shares Purchased as a Part of Publicly Announced Plans
|
Maximum Number of Units That May Yet Be Purchased Under the Plans
|
||||
|
October 1 - 31, 2018
|
133,205
|
$65.85
|
—
|
—
|
||||
|
November 1 - 30, 2018
|
14,623
|
$61.65
|
—
|
—
|
||||
|
December 1 - 31, 2018
|
1,108
|
$61.37
|
—
|
—
|
||||
|
(1)
|
Represents shares surrendered to us by participants in our share-based compensation plans to settle the participants’ personal tax liabilities that resulted from the lapsing of restrictions on shares awarded to the participants under these plans.
|
|
(2)
|
The price paid per share was based on the closing trading price of our common stock on the dates on which we repurchased shares from the participants under our share-based compensation plans.
|
For additional information, see
Note 15—Share-Based Compensation
of our Notes to Consolidated Financial Statements under Item 8 of this Form 10-K.
33
Total Stockholder Return
The following is a customized peer group consisting of 29 companies (the “New Peer Group”) that were selected because they are publicly traded companies that have: (1) comparable Global Industries Classification Standards, (2) similar market capitalization, (3) similar enterprise values and (4) similar operating characteristics and capital intensity:
|
New Peer Group
|
||
|
Air Products and Chemicals, Inc. (APD)
|
Kinder Morgan, Inc. (KMI)
|
|
|
Anadarko Petroleum Corporation (APC)
|
LyondellBasell Industries N.V. (LYB)
|
|
|
Andeavor (ANDV)
|
Marathon Oil Corporation (MRO)
|
|
|
Apache Corporation (APA)
|
Marathon Petroleum Corporation (MPC)
|
|
|
Baker Hughes, a GE company (BHGE)
|
Noble Energy, Inc. (NBL)
|
|
|
Concho Resources Inc. (CXO)
|
Occidental Petroleum Corporation (OXY)
|
|
|
ConocoPhillips (COP)
|
ONEOK, Inc. (OKE)
|
|
|
Continental Resources, Inc. (CLR)
|
Phillips 66 (PSX)
|
|
|
Devon Energy Corporation (DVN)
|
Pioneer Natural Resources Company (PXD)
|
|
|
Enterprise Products Partners L.P. (EPD)
|
Praxair, Inc. (PX)
|
|
|
EOG Resources, Inc. (EOG)
|
Schlumberger Limited (SLB)
|
|
|
EQT Corporation (EQT)
|
Suncor Energy Inc. (SU)
|
|
|
Freeport-McMoRan Inc. (FCX)
|
Valero Energy Corporation (VLO)
|
|
|
Halliburton Company (HAL)
|
The Williams Companies, Inc. (WMB)
|
|
|
Hess Corporation (HES)
|
||
The New Peer Group companies were revised during 2018. Our previous peer group consisted of the following 17 companies (the “Old Peer Group”):
|
Old Peer Group
|
||
|
Ameren Corporation (AEE)
|
PG&E Corporation (PCG)
|
|
|
Calpine Corp. (CPN)
|
Public Service Enterprise Group Inc. (PEG)
|
|
|
CMS Energy Corp. (CMS)
|
Sempra Energy (SRE)
|
|
|
Dominion Resources, Inc. (D)
|
Targa Resources Corp. (TRGP)
|
|
|
DTE Energy Company (DTE)
|
TransCanada Corporation (TRP)
|
|
|
Dynegy Inc. (DYN)
|
MarkWest Energy Partners, L.P. (MWE)
|
|
|
Enterprise Products Partners L.P. (EPD)
|
Spectra Energy Corp (SE)
|
|
|
Magellan Midstream Partners, L.P. (MMP)
|
Enbridge (ENB)
|
|
|
ONEOK, Inc. (OKE)
|
||
The following graph compares the five-year total return on our common stock, the S&P 500 Index, the New Peer Group and the Old Peer Group. The graph was constructed on the assumption that $100 was invested in our common stock, the S&P 500 Index, the New Peer Group and the Old Peer Group on December 31,
2013
and that any dividends were fully reinvested.
|
Company / Index
|
2013
|
2014
|
2015
|
2016
|
2017
|
2018
|
||||||||||||
|
Cheniere Energy, Inc.
|
100.00
|
|
163.27
|
|
86.39
|
|
96.08
|
|
124.86
|
|
137.27
|
|
||||||
|
S&P 500 Index
|
100.00
|
|
113.69
|
|
115.26
|
|
129.05
|
|
157.22
|
|
150.33
|
|
||||||
|
New Peer Group
|
100.00
|
|
96.50
|
|
77.10
|
|
105.03
|
|
109.89
|
|
86.74
|
|
||||||
|
Old Peer Group
|
100.00
|
|
121.50
|
|
98.35
|
|
120.50
|
|
126.61
|
|
116.16
|
|
||||||
34
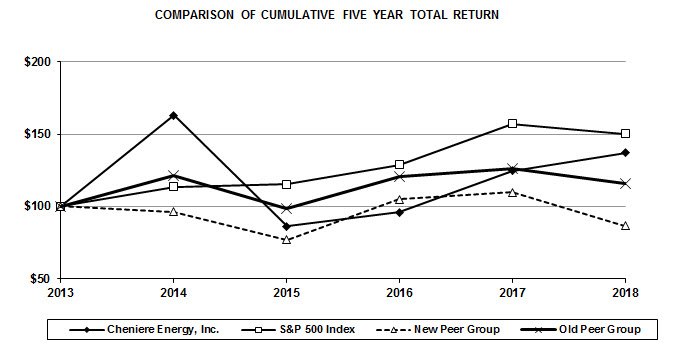
|
ITEM 6.
|
SELECTED FINANCIAL DATA
|
Selected financial data set forth below are derived from our audited Consolidated Financial Statements for the periods indicated (in millions, except per share data). The financial data should be read in conjunction with Management’s Discussion and Analysis of Financial Condition and Results of Operations and our Consolidated Financial Statements and the accompanying notes thereto included elsewhere in this report.
|
|
Year Ended December 31,
|
|||||||||||||||||||
|
|
2018
|
2017
|
2016
|
2015
|
2014
|
|||||||||||||||
|
Revenues
|
$
|
7,987
|
|
$
|
5,601
|
|
$
|
1,283
|
|
$
|
271
|
|
$
|
268
|
|
|||||
|
Income (loss) from operations
|
2,024
|
|
1,388
|
|
(30
|
)
|
(449
|
)
|
(272
|
)
|
||||||||||
|
Interest expense, net of capitalized interest
|
(875
|
)
|
(747
|
)
|
(488
|
)
|
(322
|
)
|
(181
|
)
|
||||||||||
|
Net income (loss) attributable to common stockholders
|
471
|
|
(393
|
)
|
(610
|
)
|
(975
|
)
|
(548
|
)
|
||||||||||
|
Net income (loss) per share attributable to common stockholders—basic
|
$
|
1.92
|
|
$
|
(1.68
|
)
|
$
|
(2.67
|
)
|
$
|
(4.30
|
)
|
$
|
(2.44
|
)
|
|||||
|
Net income (loss) per share attributable to common stockholders—diluted
|
$
|
1.90
|
|
$
|
(1.68
|
)
|
$
|
(2.67
|
)
|
$
|
(4.30
|
)
|
$
|
(2.44
|
)
|
|||||
|
Weighted average number of common shares outstanding—basic
|
245.6
|
|
233.1
|
|
228.8
|
|
226.9
|
|
224.3
|
|
||||||||||
|
Weighted average number of common shares outstanding—diluted
|
248.0
|
|
233.1
|
|
228.8
|
|
226.9
|
|
224.3
|
|
||||||||||
|
|
December 31,
|
|||||||||||||||||||
|
|
2018
|
2017
|
2016
|
2015
|
2014
|
|||||||||||||||
|
Property, plant and equipment, net
|
$
|
27,245
|
|
$
|
23,978
|
|
$
|
20,635
|
|
$
|
16,194
|
|
$
|
9,247
|
|
|||||
|
Total assets
|
31,987
|
|
27,906
|
|
23,703
|
|
18,809
|
|
12,433
|
|
||||||||||
|
Current debt, net
|
239
|
|
—
|
|
247
|
|
1,673
|
|
—
|
|
||||||||||
|
Long-term debt, net
|
28,179
|
|
25,336
|
|
21,688
|
|
14,920
|
|
9,665
|
|
||||||||||
35
|
ITEM 7.
|
MANAGEMENT’S DISCUSSION AND ANALYSIS OF FINANCIAL CONDITION AND RESULTS OF OPERATIONS
|
Introduction
The following discussion and analysis presents management’s view of our business, financial condition and overall performance and should be read in conjunction with our Consolidated Financial Statements and the accompanying notes. This information is intended to provide investors with an understanding of our past performance, current financial condition and outlook for the future. Our discussion and analysis includes the following subjects:
|
•
|
Overview of Business
|
|
•
|
Overview of Significant Events
|
|
•
|
Liquidity and Capital Resources
|
|
•
|
Contractual Obligations
|
|
•
|
Results of Operations
|
|
•
|
Off-Balance Sheet Arrangements
|
|
•
|
Summary of Critical Accounting Estimates
|
|
•
|
Recent Accounting Standards
|
Overview of Business
Cheniere, a Delaware corporation, is a Houston-based energy company primarily engaged in LNG-related businesses. Our vision is to provide clean, secure and affordable energy to the world, while responsibly delivering a reliable, competitive and integrated source of LNG, in a safe and rewarding work environment. We own and operate the Sabine Pass LNG terminal in Louisiana through our ownership interest in and management agreements with Cheniere Partners, which is a publicly traded limited partnership that we created in 2007. As of
December 31, 2018
, we owned
100%
of the general partner interest and
48.6%
of the limited partner interest in Cheniere Partners. We are currently developing and constructing two natural gas liquefaction and export facilities. The liquefaction of natural gas into LNG allows it to be shipped economically from areas of the world where natural gas is abundant and inexpensive to produce to other areas where natural gas demand and infrastructure exist to economically justify the use of LNG.
The Sabine Pass LNG terminal is located in Cameron Parish, Louisiana, on the Sabine-Neches Waterway less than four miles from the Gulf Coast. Cheniere Partners is developing, constructing and operating natural gas liquefaction facilities
(the “SPL Project”)
at the Sabine Pass LNG terminal adjacent to the existing regasification facilities through a wholly owned subsidiary, SPL. Cheniere Partners plans to construct up to six Trains, which are in various stages of development, construction and operations. Trains 1 through 4 are operational, Train 5 is undergoing commissioning and Train 6 is being commercialized and has all necessary regulatory approvals in place. Each Train is expected to have a nominal production capacity, which is prior to adjusting for planned maintenance, production reliability, potential overdesign and debottlenecking opportunities, of approximately
4.5
mtpa of LNG per Train, and run rate adjusted nominal production capacity of approximately
4.5
to
4.9
mtpa of LNG per Train. The Sabine Pass LNG terminal has operational regasification facilities owned by Cheniere Partners’ wholly owned subsidiary, SPLNG, that include pre-existing infrastructure of five LNG storage tanks with aggregate capacity of approximately 16.9
Bcfe
, two marine berths that can each accommodate vessels with nominal capacity of up to 266,000 cubic meters and vaporizers with regasification capacity of approximately 4.0
Bcf/d
. Cheniere Partners also owns a 94-mile pipeline that interconnects the Sabine Pass LNG terminal with a number of large interstate pipelines
(the “Creole Trail Pipeline”)
through a wholly owned subsidiary, CTPL.
We are developing and constructing a second natural gas liquefaction and export facility at the Corpus Christi LNG terminal near Corpus Christi, Texas, and operate a 23-mile natural gas supply pipeline that interconnects the Corpus Christi LNG terminal with several interstate and intrastate natural gas pipelines
(the “Corpus Christi Pipeline” and together with the liquefaction facilities, the “CCL Project”)
through our wholly owned subsidiaries CCL and CCP, respectively. The
CCL Project
is being developed in stages with the first phase being
three
Trains (“Phase 1”), with expected aggregate nominal production capacity, which is prior to adjusting for planned maintenance, production reliability, potential overdesign and debottlenecking opportunities, of approximately 13.5
mtpa
of LNG, three LNG storage tanks with aggregate capacity of approximately 10.1
Bcfe
and two marine berths that can each accommodate vessels with nominal capacity of up to 266,000 cubic meters. The first stage
(“Stage 1”)
includes Trains 1 and
36
2, two LNG storage tanks, one complete marine berth and a second partial berth and all of the
CCL Project
’s necessary infrastructure facilities. The second stage
(“Stage 2”)
includes Train 3, one LNG storage tank and the completion of the second partial berth. Trains 1 and 2 are undergoing commissioning and Train 3 is under construction.
Additionally, separate from the CCH Group, we are developing an expansion of the Corpus Christi LNG terminal adjacent to the
CCL Project
(“Corpus Christi Stage 3”)
and filed an application with FERC in June 2018 for
seven
midscale Trains with an expected aggregate nominal production capacity of approximately
9.5
mtpa and one LNG storage tank.
We remain focused on expansion of our existing sites by leveraging existing infrastructure. We are also in various stages of developing other projects, including infrastructure projects in support of natural gas supply and LNG demand, which, among other things, will require acceptable commercial and financing arrangements before we make a final investment decision (“
FID
”). We have made an equity investment in Midship Holdings, LLC (“Midship Holdings”), which manages the business and affairs of Midship Pipeline Company, LLC (“Midship Pipeline”). Midship Pipeline is developing a pipeline (the “Midship Project”) with expected capacity of up to 1.44 million Dekatherms per day that will connect new gas production in the Anadarko Basin to Gulf Coast markets, including markets serving the
SPL Project
and the
CCL Project
. Construction of the Midship Project will commence based upon, among other things, obtaining the required authorization from the FERC and adequate financing to construct the proposed project.
Overview of Significant Events
Our significant accomplishments since January 1,
2018
and through the filing date of this Form 10-K include the following:
Strategic
|
•
|
In November 2018, SPL entered into an EPC contract with Bechtel Oil, Gas and Chemicals, Inc.
(“Bechtel”)
for Train 6 of the SPL Project. SPL also issued limited notices to proceed to Bechtel to commence early engineering, procurement and site works.
|
|
•
|
In May 2018, our board of directors made a positive
FID
with respect to
Stage 2
of the CCL Project and issued a full notice to proceed to Bechtel under the EPC contract for Stage 2.
|
|
•
|
In June 2018, we filed an application with the FERC with respect to
Corpus Christi Stage 3
, consisting of seven midscale liquefaction Trains with an expected aggregate nominal production capacity of approximately 9.5 mtpa and one LNG storage tank.
|
|
•
|
We entered into the following agreements:
|
|
◦
|
In December 2018, SPL entered into a 20-year SPA with PETRONAS LNG Ltd., subject to conditions precedent including FID of Train 6 of the
SPL Project
, for the sale of approximately 1.1 mtpa of LNG on a free on board (“FOB”) basis, with deliveries commencing following date of first commercial delivery for Train 6 of the
SPL Project
.
|
|
◦
|
In November 2018, we entered into a 24-year SPA with Polish state-owned oil and gas company Polskie Gornictwo Naftowe i Gazownictwo S.A. for the sale of approximately 1.45 mtpa of LNG on a delivered ex-ship (“DES”) basis. Deliveries will commence in 2019, with the full annual quantity commencing in 2023.
|
|
◦
|
In September 2018, we entered into a 15-year SPA with Vitol Inc. for the sale of approximately 0.7 mtpa of LNG beginning in 2018 on a FOB basis.
|
|
◦
|
In August 2018, we entered into a 25-year SPA with CPC Corporation, Taiwan for the sale of approximately 2.0 mtpa of LNG beginning in 2021 on a DES basis.
|
|
◦
|
In February 2018, we entered into two SPAs with PetroChina International Company Limited, a subsidiary of China National Petroleum Corporation, for the sale of approximately 1.2 mtpa of LNG through 2043 on both FOB and DES bases, with a portion of the supply beginning in 2018 and the balance beginning in 2023.
|
|
◦
|
In January 2018, we entered into a 15-year SPA with Trafigura Pte Ltd for the sale of approximately 1.0 mtpa of LNG beginning in 2019 on a FOB basis.
|
37
Operational
|
•
|
As of February 20, 2019, over
575
cumulative LNG cargoes have been produced, loaded and exported from the
SPL Project
and the
CCL Project
, with more than
270
cargoes in 2018 alone from the
SPL Project
, with deliveries to
32
countries and regions worldwide.
|
|
•
|
In November 2018 and December 2018, SPL and CCL commenced production and shipment of LNG commissioning cargoes from Train 5 of the
SPL Project
and Train 1 of the
CCL Project
, respectively.
|
Financial
|
•
|
We completed the following debt transactions:
|
|
◦
|
In December 2018, we amended and restated our existing revolving credit facility (“
Cheniere Revolving Credit Facility
”) to, among other changes, increase total commitments under the
Cheniere Revolving Credit Facility
to $1.25 billion, reduce the interest rate and extend the maturity date to December 2022. Borrowings will be used to fund the development of the
CCL Project
and, provided that certain conditions are met, for our general corporate purposes.
|
|
◦
|
In September 2018, Cheniere Partners issued an aggregate principal amount of $1.1 billion of 5.625% Senior Notes due 2026
(the “2026 CQP Senior Notes”)
. Net proceeds of the offering of approximately $1.1 billion, after deducting commissions, fees and expenses, were used to prepay all of the outstanding indebtedness under Cheniere Partners’ credit facilities
(the “CQP Credit Facilities”)
. As of
December 31, 2018
, only a $115 million revolving credit facility, which is currently undrawn, remains as part of the
CQP Credit Facilities
.
|
|
◦
|
In June 2018, CCH amended and restated its working capital facility
(“CCH Working Capital Facility”)
to increase total commitments under the
CCH Working Capital Facility
to
$1.2 billion
. Borrowings will be used for certain working capital requirements related to developing and placing the
CCL Project
into operations and for related business purposes.
|
|
◦
|
In May 2018, CCH amended and restated its existing credit facilities
(the “CCH Credit Facility”)
to increase total commitments under the
CCH Credit Facility
to $6.1 billion. Borrowings will be used to fund a portion of the costs of developing, constructing and placing into service the three Trains and the related facilities of the
CCL Project
and for related business purposes.
|
|
•
|
In September 2018, we closed the previously announced merger of Cheniere Holdings with our wholly owned subsidiary. As a result of the merger, all of the publicly-held shares of Cheniere Holdings not owned by us were canceled and shareholders received 0.4750 shares of our common stock for each publicly-held share of Cheniere Holdings.
|
|
•
|
We reached the following contractual milestones:
|
|
◦
|
In June 2018, the date of first commercial delivery was reached under the 20-year SPA with BG Gulf Coast LNG, LLC
(“BG”)
relating to Train 3 of the
SPL Project
.
|
|
◦
|
In March 2018, the date of first commercial delivery was reached under the 20-year SPA with GAIL (India) Limited
(“GAIL”)
relating to Train 4 of the
SPL Project
.
|
Liquidity and Capital Resources
Although results are consolidated for financial reporting, Cheniere, Cheniere Partners, SPL and the CCH Group operate with independent capital structures. We expect the cash needs for at least the next twelve months will be met for each of these independent capital structures as follows:
|
•
|
SPL through project debt and borrowings and operating cash flows;
|
|
•
|
Cheniere Partners through operating cash flows from SPLNG, SPL and CTPL and debt or equity offerings;
|
|
•
|
CCH Group through project debt and borrowings and equity contributions from Cheniere; and
|
|
•
|
Cheniere through project financing, existing unrestricted cash, debt and equity offerings by us or our subsidiaries, operating cash flows, services fees from Cheniere Partners and our other subsidiaries and distributions from our investment in Cheniere Partners.
|
38
The following table provides a summary of our liquidity position at
December 31, 2018
and
2017
(in millions):
|
December 31,
|
|||||||
|
|
2018
|
2017
|
|||||
|
Cash and cash equivalents
|
$
|
981
|
|
$
|
722
|
|
|
|
Restricted cash designated for the following purposes:
|
|||||||
|
SPL Project
|
756
|
|
544
|
|
|||
|
Cheniere Partners and cash held by guarantor subsidiaries
|
785
|
|
1,045
|
|
|||
|
CCL Project
|
289
|
|
227
|
|
|||
|
Other
|
345
|
|
75
|
|
|||
|
Available commitments under the following credit facilities:
|
|||||||
|
$1.2 billion SPL Working Capital Facility (“SPL Working Capital Facility”)
|
775
|
|
470
|
|
|||
|
CQP Credit Facilities
|
115
|
|
220
|
|
|||
|
CCH Credit Facility
|
982
|
|
2,087
|
|
|||
|
CCH Working Capital Facility
|
716
|
|
186
|
|
|||
|
$1.25 billion Cheniere Revolving Credit Facility
|
1,250
|
|
750
|
|
|||
For additional information regarding our debt agreements, see
Note 12—Debt
of our Notes to Consolidated Financial Statements.
Cheniere
Convertible Notes
In November 2014, we issued an aggregate principal amount of $1.0 billion of Convertible Unsecured Notes due 2021
(the “2021 Cheniere Convertible Unsecured Notes”)
. The
2021 Cheniere Convertible Unsecured Notes
are convertible at the option of the holder into our common stock at the then applicable conversion rate, provided that the closing price of our common stock is greater than or equal to the conversion price on the date of conversion. In March 2015, we issued $625 million aggregate principal amount of 4.25% Convertible Senior Notes due 2045
(the “2045 Cheniere Convertible Senior Notes”)
. We have the right, at our option, at any time after March 15, 2020, to redeem all or any part of the
2045 Cheniere Convertible Senior Notes
at a redemption price equal to the accreted amount of the
2045 Cheniere Convertible Senior Notes
to be redeemed, plus accrued and unpaid interest, if any, to such redemption date. We have the option to satisfy the conversion obligation for the
2021 Cheniere Convertible Unsecured Notes
and the
2045 Cheniere Convertible Senior Notes
with cash, common stock or a combination thereof.
Cheniere Revolving Credit Facility
In December 2018, we amended and restated the
Cheniere Revolving Credit Facility
to increase total commitments under the
Cheniere Revolving Credit Facility
from $750 million to
$1.25 billion
. The
Cheniere Revolving Credit Facility
is intended to fund, through loans and letters of credit, equity capital contributions to CCH HoldCo II and its subsidiaries for the development of the CCL Project and, provided that certain conditions are met, for general corporate purposes.
The
Cheniere Revolving Credit Facility
matures on December 13, 2022 and contains representations, warranties and affirmative and negative covenants customary for companies like us with lenders of the type participating in the
Cheniere Revolving Credit Facility
that limit our ability to make restricted payments, including distributions, unless certain conditions are satisfied, as well as limitations on indebtedness, guarantees, hedging, liens, investments and affiliate transactions. Under the
Cheniere Revolving Credit Facility
, we are required to ensure that the sum of our unrestricted cash and the amount of undrawn commitments under the
Cheniere Revolving Credit Facility
is at least equal to the lesser of (1) 20% of the commitments under the
Cheniere Revolving Credit Facility
and (2) $200 million (the “Liquidity Covenant”).
From and after the time at which certain specified conditions are met (the “Trigger Point”), we will have increased flexibility under the
Cheniere Revolving Credit Facility
to, among other things, (1) make restricted payments and (2) raise incremental commitments. The Trigger Point will occur once (1) completion has occurred for each of Train 1 of the CCL Project (as defined in the CCH Indenture) and Train 5 of the SPL Project (as defined in SPL’s common terms agreement), (2) the aggregate principal amount of outstanding loans plus drawn and unreimbursed letters of credit under the
Cheniere Revolving Credit Facility
is less than or equal to
10%
of aggregate commitments under the
Cheniere Revolving Credit Facility
and (3) we elect on a go-forward basis to be governed by a non-consolidated leverage ratio covenant not to exceed
5.75
:1.00 (the “Springing Leverage Covenant”), which following such election will apply at any time that the aggregate principal amount of outstanding loans plus drawn and
39
unreimbursed letters of credit under the
Cheniere Revolving Credit Facility
is greater than
30%
of aggregate commitments under the
Cheniere Revolving Credit Facility
. Following the Trigger Point, at any time that the Springing Leverage Covenant is in effect, the Liquidity Covenant will not apply.
The
Cheniere Revolving Credit Facility
is secured by a first priority security interest (subject to permitted liens and other customary exceptions) in substantially all of our assets, including our interests in our direct subsidiaries (excluding CCH HoldCo II and certain other subsidiaries).
Cash Receipts from Subsidiaries
Our ownership interest in the Sabine Pass LNG terminal is held through Cheniere Partners. As of
December 31, 2018
, we owned a
48.6%
limited partner interest in Cheniere Partners in the form of
104.5
million common units and
135.4
million subordinated units. We also own
100%
of the general partner interest and the incentive distribution rights in Cheniere Partners. We are eligible to receive quarterly equity distributions from Cheniere Partners related to our ownership interests and our incentive distribution rights.
We also receive fees for providing management services to some of our subsidiaries. We received
$76 million
,
$106 million
and
$119 million
in total service fees from these subsidiaries during the
years ended December 31, 2018, 2017 and 2016
, respectively.
Cheniere Partners
CQP Senior Notes
In September 2018, Cheniere Partners issued an aggregate principal amount of $1.1 billion of the
2026 CQP Senior Notes
. The $1.5 billion of 5.250% Senior Notes due 2025
(the “2025 CQP Senior Notes”)
and the
2026 CQP Senior Notes
(collectively, the “CQP Senior Notes”)
are jointly and severally guaranteed by each of Cheniere Partners’ subsidiaries other than SPL
(the “CQP Guarantors”)
and, subject to certain conditions governing its guarantee, Sabine Pass LP. The
CQP Senior Notes
are governed by the same base indenture
(the “CQP Base Indenture”)
. The
2025 CQP Senior Notes
are further governed by the First Supplemental Indenture (together with the CQP Base Indenture, the “2025 CQP Notes Indenture”) and the
2026 CQP Senior Notes
are further governed by the Second Supplemental Indenture (together with the CQP Base Indenture, the “2026 CQP Notes Indenture”). The 2025 CQP Notes Indenture and the 2026 CQP Notes Indenture contain customary terms and events of default and certain covenants that, among other things, limit the ability of Cheniere Partners and the
CQP Guarantors
to incur liens and sell assets, enter into transactions with affiliates, enter into sale-leaseback transactions and consolidate, merge or sell, lease or otherwise dispose of all or substantially all of the applicable entity’s properties or assets.
At any time prior to October 1, 2020 for the
2025 CQP Senior Notes
and October 1, 2021 for the
2026 CQP Senior Notes
, Cheniere Partners may redeem all or a part of the applicable
CQP Senior Notes
at a redemption price equal to 100% of the aggregate principal amount of the
CQP Senior Notes
redeemed, plus the “applicable premium” set forth in the respective indentures governing the
CQP Senior Notes
, plus accrued and unpaid interest, if any, to the date of redemption. In addition, at any time prior to October 1, 2020 for the
2025 CQP Senior Notes
and October 1, 2021 for the
2026 CQP Senior Notes
, Cheniere Partners may redeem up to 35% of the aggregate principal amount of the
CQP Senior Notes
with an amount of cash not greater than the net cash proceeds from certain equity offerings at a redemption price equal to 105.250% of the aggregate principal amount of the
2025 CQP Senior Notes
and 105.625% of the aggregate principal amount of the
2026 CQP Senior Notes
redeemed, plus accrued and unpaid interest, if any, to the date of redemption. Cheniere Partners also may at any time on or after October 1, 2020 through the maturity date of October 1, 2025 for the
2025 CQP Senior Notes
and October 1, 2021 through the maturity date of October 1, 2026 for the
2026 CQP Senior Notes
, redeem the
CQP Senior Notes
, in whole or in part, at the redemption prices set forth in the respective indentures governing the
CQP Senior Notes
.
The
CQP Senior Notes
are Cheniere Partners’ senior obligations, ranking equally in right of payment with Cheniere Partners’ other existing and future unsubordinated debt and senior to any of its future subordinated debt. After applying the proceeds from the
2026 CQP Senior Notes
, the
CQP Senior Notes
became unsecured. In the event that the aggregate amount of Cheniere Partners’ secured indebtedness and the secured indebtedness of the
CQP Guarantors
(other than the
CQP Senior Notes
or any other series of notes issued under the
CQP Base Indenture
) outstanding at any one time exceeds the greater of (1)
$1.5 billion
and (2)
10%
of net tangible assets, the
CQP Senior Notes
will be secured to the same extent as such obligations under the
CQP Credit Facilities
. The obligations under the CQP Credit Facilities are secured on a first-priority basis (subject to permitted encumbrances) with liens on (1) substantially all the existing and future tangible and intangible assets and rights of Cheniere Partners and the
CQP Guarantors
40
and equity interests in the
CQP Guarantors
(except, in each case, for certain excluded properties set forth in the CQP Credit Facilities) and (2) substantially all of the real property of SPLNG (except for excluded properties referenced in the CQP Credit Facilities). The liens securing the
CQP Senior Notes
, if applicable, will be shared equally and ratably (subject to permitted liens) with the holders of other senior secured obligations, which include the CQP Credit Facilities obligations and any future additional senior secured debt obligations.
CQP Credit Facilities
In February 2016, Cheniere Partners entered into the
CQP Credit Facilities
. The
CQP Credit Facilities
originally consisted of: (1) a $450 million CTPL tranche term loan that was used to prepay the $400 million term loan facility in February 2016, (2) an approximately $2.1 billion SPLNG tranche term loan that was used to repay and redeem in November 2016 the approximately $2.1 billion of the senior notes previously issued by SPLNG, (3) a $125 million facility that could be used to satisfy a six-month debt service reserve requirement and (4) a $115 million revolving credit facility that may be used for general business purposes. In September 2017 and September 2018, Cheniere Partners issued the
2025 CQP Senior Notes
and the
2026 CQP Senior Notes
, respectively, and the net proceeds were used to prepay the outstanding term loans under the
CQP Credit Facilities
. As of
December 31, 2018
, only a $115 million revolving credit facility, which is currently undrawn, remains as part of the
CQP Credit Facilities
.
The
CQP Credit Facilities
mature on February 25, 2020. Any outstanding balance may be repaid, in whole or in part, at any time without premium or penalty, except for interest hedging and interest rate breakage costs. The
CQP Credit Facilities
contain conditions precedent for extensions of credit, as well as customary affirmative and negative covenants and limit Cheniere Partners’ ability to make restricted payments, including distributions, to once per fiscal quarter as long as certain conditions are satisfied. Under the
CQP Credit Facilities
, Cheniere Partners is required to hedge not less than 50% of the variable interest rate exposure on its projected aggregate outstanding balance, maintain a minimum debt service coverage ratio of at least 1.15x at the end of each fiscal quarter beginning March 31, 2019 and have a projected debt service coverage ratio of 1.55x in order to incur additional indebtedness to refinance a portion of the existing obligations.
The
CQP Credit Facilities
are unconditionally guaranteed by each subsidiary of Cheniere Partners other than (1) SPL and (2) certain subsidiaries of Cheniere Partners owning other development projects, as well as certain other specified subsidiaries and members of the foregoing entities.
Sabine Pass LNG Terminal
Liquefaction Facilities
We are developing, constructing and operating the
SPL Project
at the Sabine Pass LNG terminal adjacent to the existing regasification facilities. We have received authorization from the FERC to site, construct and operate Trains 1 through 6. We have achieved substantial completion of Trains 1, 2, 3 and 4 of the
SPL Project
and commenced operating activities in May 2016, September 2016, March 2017 and October 2017, respectively. Train 5 of the
SPL Project
is undergoing commissioning and the following table summarizes the status as of
December 31, 2018
:
|
SPL Train 5
|
|||
|
Overall project completion percentage
|
99.7%
|
||
|
Completion percentage of:
|
|||
|
Engineering
|
100%
|
||
|
Procurement
|
100%
|
||
|
Subcontract work
|
98.0%
|
||
|
Construction
|
99.6%
|
||
|
Date of expected substantial completion
|
1Q 2019
|
||
The following orders have been issued by the DOE authorizing the export of domestically produced LNG by vessel from the Sabine Pass LNG terminal:
|
•
|
Trains 1 through 4—
FTA countries
for a 30-year term, which commenced on May 15, 2016, and
non-FTA countries
for a 20-year term, which commenced on June 3, 2016, in an amount up to a combined total of the equivalent of 16
mtpa
(approximately 803
Bcf/yr
of natural gas).
|
41
|
•
|
Trains 1 through 4—
FTA countries
for a 25-year term and non-FTA countries for a 20-year term in an amount up to a combined total of the equivalent of approximately 203
Bcf/yr
of natural gas (approximately 4 mtpa).
|
|
•
|
Trains 5 and 6—
FTA countries
and
non-FTA countries
for a 20-year term, in an amount up to a combined total of 503.3
Bcf/yr
of natural gas (approximately 10 mtpa).
|
In each case, the terms of these authorizations begin on the earlier of the date of first export thereunder or the date specified in the particular order, which ranges from five to 10 years from the date the order was issued. In addition, SPL received an order providing for a three-year makeup period with respect to each of the non-FTA orders for LNG volumes SPL was authorized but unable to export during any portion of the initial 20-year export period of such order.
In January 2018, the DOE issued orders authorizing SPL to export domestically produced LNG by vessel from the Sabine Pass LNG terminal to
FTA countries
and
non-FTA countries
over a two-year period commencing January 2018, in an aggregate amount up to the equivalent of 600
Bcf
of natural gas (however, exports under this order, when combined with exports under the orders above, may not exceed 1,509
Bcf/yr
).
Customers
SPL has entered into fixed price
SPA
s with terms of at least 20 years (plus extension rights) with
six
third parties for Trains 1 through 5 of the
SPL Project
, to make available an aggregate amount of LNG that is between approximately
80%
to
95%
of the expected aggregate adjusted nominal production capacity from these Trains. Under these
SPA
s, the customers will purchase LNG from SPL for a price consisting of a fixed fee per MMBtu of LNG (a portion of which is subject to annual adjustment for inflation) plus a variable fee per
MMBtu
of LNG equal to approximately 115% of
Henry Hub
. In certain circumstances, the customers may elect to cancel or suspend deliveries of LNG cargoes, in which case the customers would still be required to pay the fixed fee with respect to the contracted volumes that are not delivered as a result of such cancellation or suspension. We refer to the fee component that is applicable regardless of a cancellation or suspension of LNG cargo deliveries under the SPAs as the fixed fee component of the price under SPL’s SPAs. We refer to the fee component that is applicable only in connection with LNG cargo deliveries as the variable fee component of the price under SPL’s SPAs. The variable fees under SPL’s SPAs were sized at the time of entry into each SPA with the intent to cover the costs of gas purchases and transportation related to, and operating and maintenance costs to produce, the LNG to be sold under each such SPA. The
SPA
s and contracted volumes to be made available under the
SPA
s are not tied to a specific Train; however, the term of each
SPA
generally commences upon the date of first commercial delivery of a specified Train. Under SPL’s SPA with
BG
,
BG
has contracted for volumes related to Trains 3 and 4, for which the obligation to make volumes related to Train 3 available to
BG
has commenced and the obligation to make volumes related to Train 4 available to
BG
is expected to commence approximately one year after the date of first commercial delivery under SPL’s SPA with
GAIL
for Train 4.
In aggregate, the annual fixed fee portion to be paid by the third-party SPA customers is approximately $2.2 billion for Trains 1 through 3 and the SPA with GAIL for Train 4, increasing to $2.3 billion upon the date of first commercial delivery of Train 4 under the SPA with BG and to $2.9 billion upon the date of first commercial delivery of Train 5, with the applicable fixed fees starting from the date of first commercial delivery from the applicable Train, as specified in each SPA.
In addition, Cheniere Marketing has entered into an SPA with SPL to purchase, at Cheniere Marketing’s option, any LNG produced by SPL in excess of that required for other customers.
Natural Gas Transportation, Storage and Supply
To ensure SPL is able to transport adequate natural gas feedstock to the Sabine Pass LNG terminal, it has entered into transportation precedent and other agreements to secure firm pipeline transportation capacity with CTPL and third-party pipeline companies. SPL has entered into firm storage services agreements with third parties to assist in managing variability in natural gas needs for the
SPL Project
. SPL has also entered into enabling agreements and long-term natural gas supply contracts with third parties in order to secure natural gas feedstock for the
SPL Project
. As of
December 31, 2018
, SPL had secured up to approximately
3,464
TBtu
of natural gas feedstock through long-term and short-term natural gas supply contracts.
Construction
SPL entered into lump sum turnkey contracts with
Bechtel
for the engineering, procurement and construction of Trains 1 through 6 of the
SPL Project
, under which
Bechtel
charges a lump sum for all work performed and generally bears project cost
42
risk unless certain specified events occur, in which case
Bechtel
may cause SPL to enter into a change order, or SPL agrees with
Bechtel
to a change order.
The total contract price of the EPC contract for Train 5 of the
SPL Project
is approximately
$3.1 billion
reflecting amounts incurred under change orders through
December 31, 2018
. Total expected capital costs for Trains 1 through 5 are estimated to be between
$12.5 billion
and
$13.5 billion
before financing costs and between
$17.5 billion
and
$18.5 billion
after financing costs including, in each case, estimated owner’s costs and contingencies. The total contract price of the EPC contract for Train 6 of the SPL Project is approximately
$2.5 billion
, including estimated costs for an optional third marine berth.
Final Investment Decision on Train 6
SPL has issued limited notices to proceed to Bechtel for the commencement of certain engineering, procurement and site works for Train 6 of the
SPL Project
and a schedule for completion has been established.
FID
and full notice to proceed for Train 6 of the
SPL Project
will be contingent upon, among other things, entering into acceptable commercial arrangements and obtaining adequate financing to construct Train 6.
Regasification Facilities
The Sabine Pass LNG terminal has operational regasification capacity of approximately 4.0
Bcf/d
and aggregate LNG storage capacity of approximately 16.9
Bcfe
. Approximately 2.0
Bcf/d
of the regasification capacity at the Sabine Pass LNG terminal has been reserved under two long-term third-party
TUA
s, under which SPLNG’s customers are required to pay fixed monthly fees, whether or not they use the LNG terminal. Each of Total Gas & Power North America, Inc.
(“Total”)
and Chevron U.S.A. Inc.
(“Chevron”)
has reserved approximately 1.0
Bcf/d
of regasification capacity and is obligated to make monthly capacity payments to SPLNG aggregating approximately $125 million annually for 20 years that commenced in 2009. Total S.A. has guaranteed
Total
’s obligations under its
TUA
up to $2.5 billion, subject to certain exceptions, and Chevron Corporation has guaranteed
Chevron
’s obligations under its
TUA
up to 80% of the fees payable by
Chevron
.
The remaining approximately 2.0
Bcf/d
of capacity has been reserved under a
TUA
by SPL. SPL is obligated to make monthly capacity payments to SPLNG aggregating approximately $250 million annually, continuing until at least May 2036. SPL entered into a partial TUA assignment agreement with
Total
, whereby upon substantial completion of Train 3 of the
SPL Project
, SPL gained access to a portion of
Total
’s capacity and other services provided under
Total
’s TUA with SPLNG. Upon substantial completion of Train 5, SPL will gain access to substantially all of
Total
’s capacity. This agreement provides SPL with additional berthing and storage capacity at the Sabine Pass LNG terminal that may be used to provide increased flexibility in managing LNG cargo loading and unloading activity, permit SPL to more flexibly manage its LNG storage capacity and accommodate the development of Trains 5 and 6. Notwithstanding any arrangements between
Total
and SPL, payments required to be made by
Total
to SPLNG will continue to be made by
Total
to SPLNG in accordance with its TUA. During the
years ended December 31, 2018 and 2017
, SPL recorded
$30 million
and
$23 million
, respectively, as operating and maintenance expense under this partial TUA assignment agreement.
Under each of these
TUA
s, SPLNG is entitled to retain 2% of the LNG delivered to the Sabine Pass LNG terminal.
Capital Resources
We currently expect that SPL’s capital resources requirements with respect to the
SPL Project
will be financed through project debt and borrowings and cash flows under the
SPA
s. We believe that with the net proceeds of borrowings, available commitments under the
SPL Working Capital Facility
and cash flows from operations
,
we will have adequate financial resources available to complete Train 5 of the
SPL Project
and to meet our currently anticipated capital, operating and debt service requirements. SPL began generating cash flows from operations from the
SPL Project
in May 2016, when Train 1 achieved substantial completion and initiated operating activities. Trains 2, 3 and 4 subsequently achieved substantial completion in September 2016, March 2017 and October 2017, respectively. We realized offsets to LNG terminal costs of $107 million,
$320 million
and
$214 million
in the
years ended December 31, 2018, 2017 and 2016
, respectively, that were related to the sale of commissioning cargoes because these amounts were earned or loaded prior to the start of commercial operations of the respective Train during the testing phase for its construction. Additionally, SPLNG generates cash flows from the TUAs, as discussed above.
43
The following table provides a summary of our capital resources from borrowings and available commitments for the Sabine Pass LNG Terminal, excluding equity contributions to our subsidiaries and cash flows from operations (as described in
Sources and Uses of Cash
), at
December 31, 2018
and
2017
(in millions):
|
December 31,
|
||||||||
|
|
2018
|
2017
|
||||||
|
Senior notes (1)
|
$
|
16,250
|
|
$
|
15,150
|
|
||
|
Credit facilities outstanding balance (2)
|
—
|
|
1,090
|
|
||||
|
Letters of credit issued (3)
|
425
|
|
730
|
|
||||
|
Available commitments under credit facilities (3)
|
775
|
|
470
|
|
||||
|
Total capital resources from borrowings and available commitments (4)
|
$
|
17,450
|
|
$
|
17,440
|
|
||
|
(1)
|
Includes SPL’s 5.625% Senior Secured Notes due 2021, 6.25% Senior Secured Notes due 2022, 5.625% Senior Secured Notes due 2023, 5.75% Senior Secured Notes due 2024, 5.625% Senior Secured Notes due 2025, 5.875% Senior Secured Notes due 2026
(the “2026 SPL Senior Notes”)
, 5.00% Senior Secured Notes due 2027
(the “2027 SPL Senior Notes”)
, 4.200% Senior Secured Notes due 2028
(the “2028 SPL Senior Notes”)
and 5.00% Senior Secured Notes due 2037
(the “2037 SPL Senior Notes”)
(collectively, the “SPL Senior Notes”)
and Cheniere Partners’
2025 CQP Senior Notes
and
2026 CQP Senior Notes
.
|
|
(2)
|
Includes outstanding balance under the
SPL Working Capital Facility
and CTPL and SPLNG tranche term loans outstanding under the CQP Credit Facilities.
|
|
(3)
|
Consists of
SPL Working Capital Facility
. Does not include the letters of credit issued or available commitments under the
CQP Credit Facilities
, which are not specifically for the Sabine Pass LNG Terminal.
|
|
(4)
|
Does not include Cheniere’s additional borrowings from the
2021 Cheniere Convertible Unsecured Notes
and the
2045 Cheniere Convertible Senior Notes
, which may be used for the Sabine Pass LNG Terminal.
|
For additional information regarding our debt agreements related to the Sabine Pass LNG Terminal, see
Note 12—Debt
of our Notes to Consolidated Financial Statements.
SPL Senior Notes
The
SPL Senior Notes
are secured on a
pari passu
first-priority basis by a security interest in all of the membership interests in SPL and substantially all of SPL’s assets.
At any time prior to three months before the respective dates of maturity for each series of the
SPL Senior Notes
(except for the
2026 SPL Senior Notes
,
2027 SPL Senior Notes
,
2028 SPL Senior Notes
and
2037 SPL Senior Notes
, in which case the time period is six months before the respective dates of maturity), SPL may redeem all or part of such series of the
SPL Senior Notes
at a redemption price equal to the “make-whole” price (except for the
2037 SPL Senior Notes
, in which case the redemption price is equal to the “optional redemption” price) set forth in the respective indentures governing the
SPL Senior Notes
, plus accrued and unpaid interest, if any, to the date of redemption. SPL may also, at any time within three months of the respective maturity dates for each series of the
SPL Senior Notes
(except for the
2026 SPL Senior Notes
,
2027 SPL Senior Notes
,
2028 SPL Senior Notes
and
2037 SPL Senior Notes
, in which case the time period is within six months of the respective dates of maturity), redeem all or part of such series of the
SPL Senior Notes
at a redemption price equal to 100% of the principal amount of such series of the
SPL Senior Notes
to be redeemed, plus accrued and unpaid interest, if any, to the date of redemption.
Both the indenture governing the
2037 SPL Senior Notes
(the “
2037 SPL Senior Notes
Indenture”) and the common indenture governing the remainder of the
SPL Senior Notes
(the “SPL Indenture”)
include restrictive covenants. SPL may incur additional indebtedness in the future, including by issuing additional notes, and such indebtedness could be at higher interest rates and have different maturity dates and more restrictive covenants than the current outstanding indebtedness of SPL, including the
SPL Senior Notes
and the
SPL Working Capital Facility
. Under the
2037 SPL Senior Notes
Indenture and the
SPL Indenture
, SPL may not make any distributions until, among other requirements, deposits are made into debt service reserve accounts as required and a debt service coverage ratio test of 1.25:1.00 is satisfied. Semi-annual principal payments for the
2037 SPL Senior Notes
are due on March 15 and September 15 of each year beginning September 15, 2025.
44
SPL Working Capital Facility
In September 2015, SPL entered into the
SPL Working Capital Facility
, which is intended to be used for loans to SPL
(“SPL Working Capital Loans”)
, the issuance of letters of credit on behalf of SPL, as well as for swing line loans to SPL
(“SPL Swing Line Loans”)
, primarily for certain working capital requirements related to developing and placing into operation the
SPL Project
. SPL may, from time to time, request increases in the commitments under the
SPL Working Capital Facility
of up to $760 million and, upon the completion of the debt financing of Train 6 of the
SPL Project
, request an incremental increase in commitments of up to an additional $390 million. As of
December 31, 2018
and
2017
, SPL had
$775 million
and
$470 million
of available commitments and
$425 million
and
$730 million
aggregate amount of issued letters of credit under the
SPL Working Capital Facility
, respectively. SPL did
no
t have any amounts outstanding under the
SPL Working Capital Facility
as of both
December 31, 2018
and
2017
.
The
SPL Working Capital Facility
matures on December 31, 2020, and the outstanding balance may be repaid, in whole or in part, at any time without premium or penalty upon three business days’ notice. Loans deemed made in connection with a draw upon a letter of credit have a term of up to one year.
SPL Swing Line Loans
terminate upon the earliest of (1) the maturity date or earlier termination of the
SPL Working Capital Facility
, (2) the date 15 days after such SPL Swing Line Loan is made and (3) the first borrowing date for a SPL Working Capital Loan or SPL Swing Line Loan occurring at least three business days following the date the SPL Swing Line Loan is made. SPL is required to reduce the aggregate outstanding principal amount of all
SPL Working Capital Loans
to zero for a period of five consecutive business days at least once each year.
The
SPL Working Capital Facility
contains conditions precedent for extensions of credit, as well as customary affirmative and negative covenants. The obligations of SPL under the
SPL Working Capital Facility
are secured by substantially all of the assets of SPL as well as all of the membership interests in SPL on a
pari passu
basis with the
SPL Senior Notes
.
Corpus Christi LNG Terminal
Liquefaction Facilities
The
CCL Project
is being developed and constructed at the Corpus Christi LNG terminal. We have received authorization from the
FERC
to site, construct and operate Stages 1 and 2 of the
CCL Project
. The following table summarizes the overall project status of the
CCL Project
as of
December 31, 2018
:
|
CCL Stage 1
|
CCL Stage 2
|
||||
|
Overall project completion percentage
|
96.7%
|
42.0%
|
|||
|
Completion percentage of:
|
|||||
|
Engineering
|
100%
|
87.0%
|
|||
|
Procurement
|
100%
|
63.0%
|
|||
|
Subcontract work
|
89.5%
|
8.5%
|
|||
|
Construction
|
93.1%
|
11.7%
|
|||
|
Expected date of substantial completion
|
Train 1
|
1Q 2019
|
Train 3
|
2H 2021
|
|
|
Train 2
|
2H 2019
|
||||
Separate from the CCH Group, we are also developing
Corpus Christi Stage 3
, adjacent to the
CCL Project
. We filed an application with FERC in June 2018 for
seven
midscale Trains with an expected aggregate nominal production capacity of approximately
9.5
mtpa and one LNG storage tank.
The following orders have been issued by the DOE authorizing the export of domestically produced LNG by vessel from the Corpus Christi LNG terminal:
|
•
|
CCL Project—
FTA countries
for a 25-year term and to
non-FTA countries
for a 20-year term up to a combined total of the equivalent of 767
Bcf/yr
(approximately 15 mtpa) of natural gas.
|
|
•
|
Corpus Christi Stage 3
—FTA countries for a 20-year term in an amount equivalent to 514 Bcf/yr (approximately 10 mtpa) of natural gas (the “Stage 3 FTA”). The application for authorization to export that same 514 Bcf/yr of domestically produced LNG by vessel to non-FTA countries is currently pending before the DOE (the “Stage 3 Non-FTA”).
|
In each case, the terms of these authorizations begin on the earlier of the date of first export thereunder or the date specified in the particular order, which ranges from seven to 10 years from the date the order was issued.
45
In June 2018, we requested that DOE vacate the Stage 3 FTA and permit us to withdraw the pending Stage 3 Non-FTA. These requests were made due to certain changes to Corpus Christi Stage 3.
In conjunction with the submission in June 2018 of our FERC application for
Corpus Christi Stage 3
, we submitted a new application for long-term multi-contract authorization to export up to a combined total of 582.14 Bcf/yr (approximately 11.45 mtpa) of natural gas to FTA countries for a 25-year term and to non-FTA countries for a 20-year term. The term of each authorization is expected to begin on the earlier of the date of first commercial export of LNG produced by
Corpus Christi Stage 3
or the date which is seven years from the issuance of such authorizations.
Customers
CCL has entered into fixed price
SPA
s generally with terms of 20 years (plus extension rights) with
nine
third parties for Trains 1 through 3 of the
CCL Project
, to make available an aggregate amount of LNG that is between approximately
75%
to
85%
of the expected aggregate adjusted nominal production capacity from these Trains. Under these SPAs, the customers will purchase LNG from CCL for a price consisting of a fixed fee per MMBtu of LNG (a portion of which is subject to annual adjustment for inflation) plus a variable fee per
MMBtu
of LNG equal to approximately 115% of Henry Hub. In certain circumstances, the customers may elect to cancel or suspend deliveries of LNG cargoes, in which case the customers would still be required to pay the fixed fee with respect to the contracted volumes that are not delivered as a result of such cancellation or suspension. We refer to the fee component that is applicable regardless of a cancellation or suspension of LNG cargo deliveries under the SPAs as the fixed fee component of the price under our SPAs. We refer to the fee component that is applicable only in connection with LNG cargo deliveries as the variable fee component of the price under our SPAs
.
The variable fee under CCL’s SPAs entered into in connection with the development of the
CCL Project
was sized at the time of entry into each SPA with the intent to cover the costs of gas purchases and transportation related to, and operating and maintenance costs to produce, the LNG to be sold under each such SPA. The SPAs and contracted volumes to be made available under the SPAs are not tied to a specific Train; however, the term of each SPA generally commences upon the date of first commercial delivery for the applicable Train, as specified in each SPA.
In aggregate, the minimum fixed fee portion to be paid by the third-party SPA customers is approximately $550 million for Train 1 and increasing to approximately $1.4 billion for Train 2, in each case upon the date of first commercial delivery for the respective Train, and further increasing to approximately $1.8 billion following the substantial completion of Train 3 of the CCL Project.
In addition, Cheniere Marketing has entered into SPAs with CCL to purchase
15
TBtu per annum of LNG and any LNG produced by CCL in excess of that required for other customers at Cheniere Marketing’s option.
Natural Gas Transportation, Storage and Supply
To ensure CCL is able to transport adequate natural gas feedstock to the Corpus Christi LNG terminal, it has entered into transportation precedent agreements to secure firm pipeline transportation capacity with CCP and certain third-party pipeline companies. CCL has entered into a firm storage services agreement with a third party to assist in managing variability in natural gas needs for the
CCL Project
. CCL has also entered into enabling agreements and long-term natural gas supply contracts with third parties, and will continue to enter into such agreements, in order to secure natural gas feedstock for the
CCL Project
. As of
December 31, 2018
, CCL had secured up to approximately
2,801
TBtu
of natural gas feedstock through long-term natural gas supply contracts, a portion of which is subject to the achievement of certain project milestones and other conditions precedent.
Construction
CCL entered into separate lump sum turnkey contracts with
Bechtel
for the engineering, procurement and construction of Stages 1 and 2 of the
CCL Project
under which
Bechtel
charges a lump sum for all work performed and generally bears project cost risk unless certain specified events occur, in which case
Bechtel
may cause CCL to enter into a change order, or CCL agrees with
Bechtel
to a change order.
The total contract prices of the EPC contract for Stage 1 and the EPC contract for Stage 2, which do not include the
Corpus Christi Pipeline
, are approximately
$7.8 billion
and
$2.4 billion
, respectively, reflecting amounts incurred under change orders through
December 31, 2018
. Total expected capital costs for Trains 1 through 3 are estimated to be between
$11.0 billion
and
$12.0
46
billion
before financing costs and between
$15.0 billion
and
$16.0 billion
after financing costs including, in each case, estimated owner’s costs and contingencies.
Pipeline Facilities
In December 2014, the FERC issued a certificate of public convenience and necessity under Section 7(c) of the Natural Gas Act of 1938, as amended, authorizing CCP to construct and operate the Corpus Christi Pipeline. The Corpus Christi Pipeline is designed to transport 2.25 Bcf/d of natural gas feedstock required by the CCL Project from the existing regional natural gas pipeline grid. The construction of the Corpus Christi Pipeline commenced in January 2017 and was completed in the second quarter of 2018.
Capital Resources
We expect to finance the construction costs of the
CCL Project
from one or more of the following: project financing, operating cash flows from CCL and CCP and equity contributions to our subsidiaries. We realized offsets to LNG terminal costs of $33 million in the
year ended December 31, 2018
that were related to the sale of commissioning cargoes because these amounts were earned or loaded prior to the start of commercial operations of Train 1 during the testing phase for its construction. The following table provides a summary of our capital resources from borrowings and available commitments for the CCL Project, excluding equity contributions to our subsidiaries, at
December 31, 2018
and
2017
(in millions):
|
December 31,
|
||||||||
|
|
2018
|
2017
|
||||||
|
Senior notes (1)
|
$
|
4,250
|
|
$
|
4,250
|
|
||
|
11.0% Convertible Senior Secured Notes due 2025 (2)
|
1,000
|
|
1,000
|
|
||||
|
Credit facilities outstanding balance (3)
|
5,324
|
|
2,485
|
|
||||
|
Letters of credit issued (3)
|
316
|
|
164
|
|
||||
|
Available commitments under credit facilities (3)
|
1,698
|
|
2,273
|
|
||||
|
Total capital resources from borrowings and available commitments (4)
|
$
|
12,588
|
|
$
|
10,172
|
|
||
|
(1)
|
Includes CCH’s 7.000% Senior Secured Notes due 2024
(the “2024 CCH Senior Notes”)
, 5.875% Senior Secured Notes due 2025
(the “2025 CCH Senior Notes”)
and 5.125% Senior Secured Notes due 2027
(the “2027 CCH Senior Notes”)
(collectively, the “CCH Senior Notes”)
.
|
|
(2)
|
Aggregate original principal amount before debt discount and debt issuance costs.
|
|
(3)
|
Includes
CCH Credit Facility
and
CCH Working Capital Facility
.
|
|
(4)
|
Does not include Cheniere’s additional borrowings from
2021 Cheniere Convertible Unsecured Notes
,
2045 Cheniere Convertible Senior Notes
and
Cheniere Revolving Credit Facility
, which may be used for the
CCL Project
.
|
For additional information regarding our debt agreements related to the
CCL Project
, see
Note 12—Debt
of our Notes to Consolidated Financial Statements.
2025 CCH HoldCo II Convertible Senior Notes
In May 2015, CCH HoldCo II issued $1.0 billion aggregate principal amount of 11.0% Convertible Senior Secured Notes due 2025
(the “2025 CCH HoldCo II Convertible Senior Notes”)
on a private placement basis. The
2025 CCH HoldCo II Convertible Senior Notes
are convertible at the option of
CCH HoldCo II
or the holders, provided that various conditions are met. CCH HoldCo II is restricted from making distributions to Cheniere under agreements governing its indebtedness generally until, among other requirements, Trains 1 and 2 of the
CCL Project
are in commercial operation and a historical debt service coverage ratio and a projected fixed debt service coverage ratio of 1.20:1.00 are achieved.
In May 2018, the amended and restated note purchase agreement under which the
2025 CCH HoldCo II Convertible Senior Notes
were issued was subsequently amended in connection with commercialization and financing of Train 3 of the
CCL Project
and to provide the note holders with certain prepayment rights related thereto consistent with those under the CCH Credit Facility. All terms of the
2025 CCH HoldCo II Convertible Senior Notes
substantially remained unchanged.
47
CCH Senior Notes
The
CCH Senior Notes
are jointly and severally guaranteed by CCH’s subsidiaries, CCL, CCP and Corpus Christi Pipeline GP, LLC
(the “CCH Guarantors”)
. The indenture governing the
CCH Senior Notes
(the “CCH Indenture”)
contains customary terms and events of default and certain covenants that, among other things, limit CCH’s ability and the ability of CCH’s restricted subsidiaries to: incur additional indebtedness or issue preferred stock; make certain investments or pay dividends or distributions on membership interests or subordinated indebtedness or purchase, redeem or retire membership interests; sell or transfer assets, including membership or partnership interests of CCH’s restricted subsidiaries; restrict dividends or other payments by restricted subsidiaries to CCH or any of CCH’s restricted subsidiaries; incur liens; enter into transactions with affiliates; dissolve, liquidate, consolidate, merge, sell or lease all or substantially all of the properties or assets of CCH and its restricted subsidiaries taken as a whole; or permit any
CCH Guarantor
to dissolve, liquidate, consolidate, merge, sell or lease all or substantially all of its properties and assets.
At any time prior to six months before the respective dates of maturity for each series of the
CCH Senior Notes
, CCH may redeem all or part of such series of the
CCH Senior Notes
at a redemption price equal to the “make-whole” price set forth in the
CCH Indenture
, plus accrued and unpaid interest, if any, to the date of redemption. CCH also may at any time within six months of the respective dates of maturity for each series of the
CCH Senior Notes
, redeem all or part of such series of the
CCH Senior Notes
, in whole or in part, at a redemption price equal to 100% of the principal amount of the
CCH Senior Notes
to be redeemed, plus accrued and unpaid interest, if any, to the date of redemption.
CCH Credit Facility
In May 2018, CCH amended and restated the
CCH Credit Facility
to increase total commitments under the
CCH Credit Facility
from $4.6 billion to $6.1 billion. The obligations of CCH under the
CCH Credit Facility
are secured by a first priority lien on substantially all of the assets of CCH and its subsidiaries and by a pledge by CCH HoldCo I of its limited liability company interests in CCH. As of
December 31, 2018
and
2017
, CCH had
$1.0 billion
and
$2.1 billion
of available commitments and
$5.2 billion
and
$2.5 billion
of loans outstanding under the
CCH Credit Facility
, respectively.
The
CCH Credit Facility
matures on June 30, 2024, with principal payments due quarterly commencing on the earlier of (1) the first quarterly payment date occurring more than
three
calendar months following the completion of the
CCL Project
as defined in the common terms agreement and (2) a set date determined by reference to the date under which a certain LNG buyer linked to the last Train of the
CCL Project
to become operational is entitled to terminate its SPA for failure to achieve the date of first commercial delivery for that agreement. Scheduled repayments will be based upon a
19
-year tailored amortization, commencing the first full quarter after the completion of Trains 1 through 3 and designed to achieve a minimum projected fixed debt service coverage ratio of
1.50
:1.
Under the
CCH Credit Facility
, CCH is required to hedge not less than 65% of the variable interest rate exposure of its senior secured debt. CCH is restricted from making certain distributions under agreements governing its indebtedness generally until, among other requirements, the completion of the construction of Trains 1 through 3 of the
CCL Project
, funding of a debt service reserve account equal to six months of debt service and achieving a historical debt service coverage ratio and fixed projected debt service coverage ratio of at least 1.25:1.00.
CCH Working Capital Facility
In June 2018, CCH amended and restated the
CCH Working Capital Facility
to increase total commitments under the
CCH Working Capital Facility
from $350 million to $1.2 billion. The
CCH Working Capital Facility
is intended to be used for loans to CCH
(“CCH Working Capital Loans”)
and the issuance of letters of credit on behalf of CCH for certain working capital requirements related to developing and placing into operations the
CCL Project
and for related business purposes. Loans under the
CCH Working Capital Facility
are guaranteed by the
CCH Guarantors
. CCH may, from time to time, request increases in the commitments under the
CCH Working Capital Facility
of up to the maximum allowed for working capital under the Common Terms Agreement that was entered into concurrently with the
CCH Credit Facility
. As of
December 31, 2018
and
2017
, CCH had
$716 million
and
$186 million
of available commitments,
$316 million
and
$164 million
aggregate amount of issued letters of credit and
$168 million
and no loans outstanding under the
CCH Working Capital Facility
, respectively.
The
CCH Working Capital Facility
matures on June 29, 2023, and CCH may prepay the
CCH Working Capital Loans
and loans made in connection with a draw upon any letter of credit
(“CCH LC Loans”)
at any time without premium or penalty upon
48
three business days’ notice and may re-borrow at any time.
CCH LC Loans
have a term of up to one year. CCH is required to reduce the aggregate outstanding principal amount of all
CCH Working Capital Loans
to zero for a period of five consecutive business days at least once each year.
The
CCH Working Capital Facility
contains conditions precedent for extensions of credit, as well as customary affirmative and negative covenants. The obligations of CCH under the
CCH Working Capital Facility
are secured by substantially all of the assets of CCH and the
CCH Guarantors
as well as all of the membership interests in CCH and each of the
CCH Guarantors
on a
pari passu
basis with the
CCH Senior Notes
and the
CCH Credit Facility
.
Restrictive Debt Covenants
As of
December 31, 2018
, each of our issuers was in compliance with all covenants related to their respective debt agreements.
Marketing
We market and sell LNG produced by the
SPL Project
and the
CCL Project
that is not required for other customers through our integrated marketing function. We are developing a portfolio of long-, medium- and short-term SPAs to transport and unload commercial LNG cargoes to locations worldwide, which is primarily sourced by LNG produced by the
SPL Project
and the
CCL Project
but supplemented by volume procured from other locations worldwide, as needed. As of
December 31, 2018
, we have sold or have options to sell approximately
5,582
TBtu of LNG to be delivered to customers between 2019 and 2045. The cargoes have been sold either on a free on board (“FOB”) basis (delivered to the customer at the Sabine Pass LNG terminal or the Corpus Christi LNG terminal) or a delivered at terminal
(“DAT”)
basis (delivered to the customer at their LNG receiving terminal). We have chartered LNG vessels to be utilized in
DAT
transactions. In addition, we have entered into a long-term agreement to sell LNG cargoes on a
DAT
basis that is conditioned upon the buyer achieving certain milestones.
Cheniere Marketing entered into uncommitted trade finance facilities with available commitments of
$370 million
as of
December 31, 2018
, primarily to be used for the purchase and sale of LNG for ultimate resale in the course of its operations. The finance facilities are intended to be used for advances, guarantees or the issuance of letters of credit or standby letters of credit on behalf of Cheniere Marketing. As of
December 31, 2018
and
2017
, Cheniere Marketing had
$31 million
and
$2 million
, respectively, in standby letters of credit and guarantees outstanding under the finance facilities. As of
December 31, 2018
and
2017
, Cheniere Marketing had
$71 million
and
zero
, respectively, in loans outstanding under the finance facilities. Cheniere Marketing pays interest or fees on utilized commitments.
Corporate and Other Activities
We are required to maintain corporate and general and administrative functions to serve our business activities described above. We are also in various stages of developing other projects, including infrastructure projects in support of natural gas supply and LNG demand, which, among other things, will require acceptable commercial and financing arrangements before we make an
FID
. We have made an equity investment in Midship Pipeline, which is developing a pipeline with expected capacity of up to 1.44 million Dekatherms per day that will connect new gas production in the Anadarko Basin to Gulf Coast markets, including markets serving the
SPL Project
and the
CCL Project
.
49
Sources and Uses of Cash
The following table summarizes the sources and uses of our cash, cash equivalents and restricted cash for the
years ended December 31, 2018, 2017 and 2016
(in millions). The table presents capital expenditures on a cash basis; therefore, these amounts differ from the amounts of capital expenditures, including accruals, which are referred to elsewhere in this report. Additional discussion of these items follows the table.
|
Year Ended December 31,
|
|||||||||||
|
|
2018
|
2017
|
2016
|
||||||||
|
Operating cash flows
|
$
|
1,990
|
|
$
|
1,231
|
|
$
|
(404
|
)
|
||
|
Investing cash flows
|
(3,654
|
)
|
(3,381
|
)
|
(4,413
|
)
|
|||||
|
Financing cash flows
|
2,207
|
|
2,936
|
|
4,908
|
|
|||||
|
Net increase in cash, cash equivalents and restricted cash
|
543
|
|
|
786
|
|
91
|
|
||||
|
Cash, cash equivalents and restricted cash—beginning of period
|
2,613
|
|
1,827
|
|
1,736
|
|
|||||
|
Cash, cash equivalents and restricted cash—end of period
|
$
|
3,156
|
|
$
|
2,613
|
|
$
|
1,827
|
|
||
Operating Cash Flows
Our operating cash flows during the
years ended December 31, 2018, 2017 and 2016
were net inflows of
$1,990 million
and
$1,231 million
and a net outflow of
$404 million
, respectively. The
$759 million
increase in operating cash inflows in 2018 compared to 2017 was primarily related to increased cash receipts from the sale of LNG cargoes, partially offset by increased operating costs and expenses as a result of the additional Trains that were operating at the
SPL Project
in 2018. We had four Trains operational for the entire year during the
year ended December 31, 2018
, we had two Trains operational for the entire year and two Trains operational partially during the
year ended December 31, 2017
and two Trains operational partially during the year ended December 31, 2016. The $1.6 billion increase in operating cash inflows in 2017 compared to 2016 was primarily related to increased cash receipts from the sale of LNG cargoes, partially offset by increased operating costs and expenses as a result of the of additional Trains that were operating at the
SPL Project
in 2017. During the year ended December 31, 2016, Train 1 was operating for seven months and Train 2 was operating for less than four months.
Investing Cash Flows
Investing cash net outflows during the
years ended December 31, 2018, 2017 and 2016
were
$3,654 million
,
$3,381 million
and
$4,413 million
, respectively, and were primarily used to fund the construction costs for the
SPL Project
and the
CCL Project
. These costs are capitalized as construction-in-process until achievement of substantial completion. Additionally, during the year ended December 31, 2018, we invested an additional $25 million in our equity method investment Midship Holdings, offset primarily by proceeds of $12 million from the sale of our cost method investments. During the year ended December 31, 2017, we invested an additional $41 million in Midship Holdings and made payments of $19 million, primarily for infrastructure to support the CCL Project and other capital projects. Partially offsetting these cash outflows during the year ended December 31, 2017, was a $36 million receipt from the return of collateral payments previously paid for the CCL Project. Partially offsetting these cash outflows was a $36 million receipt during the year ended December 31, 2017 from the return of collateral payments previously paid for the CCL Project. During the years ended December 31, 2016, we used $57 million primarily for collateral payments for the CCL Project, payments to municipal water districts for water system enhancements to increase potable water supply to our export terminals, payments made for capital assets purchased pursuant to information technology services agreements and for investments made in unconsolidated entities.
Financing Cash Flows
Financing cash net inflows during the
year ended December 31, 2018
were
$2,207 million
, primarily as a result of:
|
•
|
issuance of an aggregate principal amount of $1.1 billion of the
2026 CQP Senior Notes
, which was used to prepay $1.1 billion of the outstanding borrowings under the
CQP Credit Facilities
;
|
|
•
|
$2.9 billion
of borrowings and
$281 million
in repayments under the
CCH Credit Facility
;
|
|
•
|
$188 million
of borrowings and
$20 million
in repayments under the
CCH Working Capital Facility
;
|
|
•
|
$71 million
of net borrowings related to our Cheniere Marketing trade financing facilities;
|
50
|
•
|
$66 million
of debt issuance costs related to up-front fees paid upon the closing of these transactions;
|
|
•
|
$17 million
in debt extinguishment costs related to the prepayments of the
CQP Credit Facilities
and the
CCH Credit Facility
;
|
|
•
|
$576 million
of distributions and dividends to non-controlling interest by Cheniere Partners and Cheniere Holdings;
|
|
•
|
$20 million
paid for tax withholdings for share-based compensation; and
|
|
•
|
$7 million of transaction costs to acquire additional interest of Cheniere Holdings.
|
Financing cash net inflows during the
year ended December 31, 2017
were
$2,936 million
, primarily as a result of:
|
•
|
issuances of SPL’s senior notes for an aggregate principal amount $2.15 billion;
|
|
•
|
$55 million of borrowings and $369 million of repayments made under the credit facilities SPL entered into in June 2015
(the “SPL Credit Facilities”)
;
|
|
•
|
$110 million of borrowings and $334 million of repayments made under the
SPL Working Capital Facility
;
|
|
•
|
$1.5 billion of borrowings under the
CCH Credit Facility
;
|
|
•
|
issuance of an aggregate principal amount of
$1.5 billion
of the
2027 CCH Senior Notes
, which was used to prepay $1.4 billion of outstanding borrowings under the
CCH Credit Facility
;
|
|
•
|
$24 million of borrowings and $24 million of repayments made under the
CCH Working Capital Facility
;
|
|
•
|
issuance of an aggregate principal amount of $1.5 billion of the
2025 CQP Senior Notes
, which was used to prepay $1.5 billion of the outstanding borrowings under the
CQP Credit Facilities
;
|
|
•
|
$24 million in net repayments made under the Cheniere Marketing trade finance facilities;
|
|
•
|
$89 million
of debt issuance and deferred financing costs related to up-front fees paid upon the closing of these transactions;
|
|
•
|
$185 million
of distributions and dividends to non-controlling interest by Cheniere Partners and Cheniere Holdings; and
|
|
•
|
$12 million
paid for tax withholdings for share-based compensation.
|
Financing cash net inflows during the year ended December 31, 2016 were
$4,908 million
, primarily as a result of:
|
•
|
$2.6 billion of borrowings under the
CQP Credit Facilities
used to prepay the $400 million CTPL term loan facility and redeem and repay $2.1 billion of the senior notes previously issued by SPLNG;
|
|
•
|
$2.0 billion of borrowings under the
SPL Credit Facilities
;
|
|
•
|
issuance of an aggregate principal amount of $1.5 billion of the 2026 SPL Senior Notes in June 2016, which was used to prepay $1.3 billion of the outstanding borrowings under the
SPL Credit Facilities
;
|
|
•
|
issuance of an aggregate principal amount of $1.5 billion of the 2027 SPL Senior Notes in September 2016, which was used to prepay $1.2 billion of the outstanding borrowings under the
SPL Credit Facilities
and pay a portion of the capital costs in connection with the construction of Trains 1 through 5 of the SPL Project;
|
|
•
|
$474 million of borrowings and $265 million of repayments made under the SPL Working Capital Facility;
|
|
•
|
$2.1 billion of borrowings under the
CCH Credit Facility
;
|
|
•
|
issuances of aggregate principal amounts of $1.25 billion of the 2024 CCH Senior Notes and $1.5 billion of the 2025 CCH Senior Notes in December 2016, which were used to prepay $2.4 billion of the outstanding borrowings under the
CCH Credit Facility
;
|
|
•
|
$24 million in net borrowings under the Cheniere Marketing trade finance facilities;
|
|
•
|
$172 million of debt issuance costs related to up-front fees paid upon the closing of these transactions;
|
|
•
|
$14 million of debt extinguishment costs paid in connection with redemptions and prepayments of outstanding borrowings;
|
51
|
•
|
$80 million of distributions and dividends to non-controlling interest by Cheniere Partners and Cheniere Holdings; and
|
|
•
|
$20 million paid for tax withholdings for share-based compensation.
|
Contractual Obligations
We are committed to make cash payments in the future pursuant to certain of our contracts. The following table summarizes certain contractual obligations in place as of
December 31, 2018
(in millions):
|
|
Payments Due By Period (1)
|
|||||||||||||||||||
|
|
Total
|
2019
|
2020 - 2021
|
2022 - 2023
|
Thereafter
|
|||||||||||||||
|
Debt (2)
|
$
|
29,395
|
|
$
|
168
|
|
$
|
3,368
|
|
$
|
2,500
|
|
$
|
23,359
|
|
|||||
|
Interest payments (2)
|
10,258
|
|
1,480
|
|
3,102
|
|
2,776
|
|
2,900
|
|
||||||||||
|
Construction obligations (3)
|
1,525
|
|
980
|
|
545
|
|
—
|
|
—
|
|
||||||||||
|
Purchase obligations (4)
|
11,848
|
|
3,218
|
|
3,444
|
|
1,828
|
|
3,358
|
|
||||||||||
|
Capital lease obligations (5)
|
98
|
|
5
|
|
10
|
|
10
|
|
73
|
|
||||||||||
|
Operating lease obligations (6)
|
2,329
|
|
380
|
|
422
|
|
528
|
|
999
|
|
||||||||||
|
Obligations to related parties (7)
|
96
|
|
2
|
|
19
|
|
19
|
|
56
|
|
||||||||||
|
Other obligations (8)
|
286
|
|
20
|
|
63
|
|
74
|
|
129
|
|
||||||||||
|
Total
|
$
|
55,835
|
|
|
$
|
6,253
|
|
|
$
|
10,973
|
|
|
$
|
7,735
|
|
|
$
|
30,874
|
|
|
|
(1)
|
Agreements in force as of
December 31, 2018
that have terms dependent on project milestone dates are based on the estimated dates as of
December 31, 2018
.
|
|
(2)
|
Based on the total debt balance, scheduled maturities and interest rates in effect at
December 31, 2018
. See
Note 12—Debt
of our Notes to Consolidated Financial Statements.
|
|
(3)
|
Construction obligations primarily relate to the EPC contracts for the
SPL Project
and the
CCL Project
. The estimated remaining cost pursuant to our EPC contracts as of
December 31, 2018
is included for Trains with respect to which we have made an FID to commence construction; the EPC contract termination amount is included for Trains with respect to which we have not made an FID. A discussion of these obligations can be found at
Note 19—Commitments and Contingencies
of our Notes to Consolidated Financial Statements.
|
|
(4)
|
Purchase obligations consist of contracts for which conditions precedent have been met, and primarily relate to natural gas supply, transportation and storage services for the
SPL Project
and the
CCL Project
. As project milestones and other conditions precedent are achieved, our obligations are expected to increase accordingly.
|
|
(5)
|
Capital lease obligations consist of tug leases related to the
CCL Project
, as further discussed in
Note 18—Leases
of our Notes to Consolidated Financial Statements.
|
|
(6)
|
Operating lease obligations primarily relate to LNG vessel time charters, land sites related to the
SPL Project
and the
CCL Project
and corporate office leases, and includes payments for certain non-lease components. A discussion of these obligations can be found in
Note 18—Leases
of our Notes to Consolidated Financial Statements.
|
|
(7)
|
Obligations to Midship Pipeline Company, LLC under CCL’s transportation precedent agreement to secure firm pipeline transportation capacity for the
CCL Project
.
|
|
(8)
|
Other obligations primarily relate to agreements with certain local taxing jurisdictions, and are based on estimated tax obligations as of
December 31, 2018
. Also included are payments for non-lease components related to our capital lease obligations.
|
In addition, in the ordinary course of business, we maintain letters of credit and have certain cash restricted in support of certain performance obligations of our subsidiaries. As of
December 31, 2018
, we had
$741 million
aggregate amount of issued letters of credit under our credit facilities and
$2.2 billion
of current restricted cash. For more information, see
Note 3—Restricted Cash
of our Notes to Consolidated Financial Statements.
52
Results of Operations
The following table summarizes the volumes of operational and commissioning LNG cargoes that were loaded from the
SPL Project
and the
CCL Project
recognized on our Consolidated Financial Statements during the
year ended December 31, 2018
:
|
Year Ended December 31, 2018
|
|||||
|
(in TBtu)
|
Operational
|
Commissioning
|
|||
|
Volumes loaded during the current period
|
955
|
|
20
|
|
|
|
Volumes loaded during the prior period but recognized during the current period
|
43
|
|
—
|
|
|
|
Less: volumes loaded during the current period and in transit at the end of the period
|
(25
|
)
|
(3
|
)
|
|
|
Total volumes recognized in the current period
|
973
|
|
17
|
|
|
Our consolidated net income attributable to common stockholders was
$471 million
, or
$1.92
per share—basic and
$1.90
per share—diluted, in the
year ended December 31, 2018
, compared to net loss attributable to common stockholders of
$393 million
, or
$1.68
per share (basic and diluted), in the
year ended December 31, 2017
. This
$864 million
increase in net income attributable to common stockholders in 2018 is primarily attributable to increased income from operations due to additional Trains operating between the periods, decreased loss on modification or extinguishment of debt and increased derivative gain, net, which were partially offset by decreased net income attributable to non-controlling interest and increased interest expense, net of amounts capitalized.
Our consolidated net loss attributable to common stockholders was $610 million, or $2.67 per share (basic and diluted), in the year ended December 31, 2016. The $217 million decrease in net loss in 2017 compared to 2016 was primarily a result of increased income from operations, which was partially offset by increased allocation of net income to non-controlling interest and increased interest expense, net of amounts capitalized.
Revenues
|
Year Ended December 31,
|
|||||||||||||||||||
|
(in millions)
|
2018
|
2017
|
Change
|
2016
|
Change
|
||||||||||||||
|
LNG revenues
|
$
|
7,572
|
|
$
|
5,317
|
|
$
|
2,255
|
|
$
|
1,016
|
|
$
|
4,301
|
|
||||
|
Regasification revenues
|
261
|
|
260
|
|
1
|
|
259
|
|
1
|
|
|||||||||
|
Other revenues
|
142
|
|
21
|
|
121
|
|
8
|
|
13
|
|
|||||||||
|
Other—related party
|
12
|
|
3
|
|
9
|
|
—
|
|
3
|
|
|||||||||
|
Total revenues
|
$
|
7,987
|
|
|
$
|
5,601
|
|
|
$
|
2,386
|
|
$
|
1,283
|
|
$
|
4,318
|
|
||
2018 vs. 2017 and 2017 vs. 2016
We begin recognizing LNG revenues from the
SPL Project
following the substantial completion and the commencement of operating activities of the respective Trains.
We had four Trains operational for the entire year during the
year ended December 31, 2018
, we had two Trains operational for the entire year and two Trains operational partially during the
year ended December 31, 2017
and two Trains operational partially during the year ended December 31, 2016. The increase in revenues during each of the years was primarily attributable to the increased volume of LNG sold following the achievement of substantial completion of these Trains. There was an additional increase during the
year ended December 31, 2018
from the comparable period in 2017 due to an increase in sub-chartering revenues, which is included in other revenues. There was an additional increase during the year ended
year ended December 31, 2017
from the comparable period in 2016 due to increased revenues per MMBtu as a result of shift in sales made at current market prices by our integrated marketing function to sales made under our long-term SPA. We expect our LNG revenues to increase in the future upon Train 5 of the SPL Project and Trains 1 through 3 of the CCL Project becoming operational.
Prior to substantial completion of a Train, amounts received from the sale of commissioning cargoes from that Train are offset against LNG terminal construction-in-process, because these amounts are earned or loaded during the testing phase for the construction of that Train. During the
years ended December 31, 2018, 2017 and 2016
, we realized offsets to LNG terminal costs of
$140 million
corresponding to 17
TBtu
of LNG,
$320 million
corresponding to 51 TBtu of LNG and
$214 million
corresponding to 45 TBtu of LNG that were related to the sale of commissioning cargoes from the
SPL Project
and the
CCL Project
.
53
The following table presents the components of LNG revenues and the corresponding LNG volumes sold.
|
Year Ended December 31,
|
|||||||||||
|
|
2018
|
2017
|
2016
|
||||||||
|
LNG revenues
(in millions)
:
|
|||||||||||
|
LNG from the SPL Project sold under SPL’s third party long-term SPAs
|
$
|
4,677
|
|
$
|
2,588
|
|
$
|
458
|
|
||
|
LNG from the SPL Project sold by our integrated marketing function
|
1,987
|
|
1,756
|
|
319
|
|
|||||
|
LNG procured from third parties
|
745
|
|
981
|
|
236
|
|
|||||
|
Other revenues and derivative gains (losses)
|
163
|
|
(8
|
)
|
3
|
|
|||||
|
Total LNG revenues
|
$
|
7,572
|
|
$
|
5,317
|
|
$
|
1,016
|
|
||
|
Volumes sold as LNG revenues
(in TBtu)
:
|
|||||||||||
|
LNG from the SPL Project sold under SPL’s third party long-term SPAs
|
750
|
|
427
|
|
85
|
|
|||||
|
LNG from the SPL Project sold by our integrated marketing function
|
223
|
|
233
|
|
47
|
|
|||||
|
LNG procured from third parties
|
84
|
|
98
|
|
26
|
|
|||||
|
Total volumes sold as LNG revenues
|
1,057
|
|
758
|
|
158
|
|
|||||
Operating costs and expenses
|
Year Ended December 31,
|
|||||||||||||||||||
|
(in millions)
|
2018
|
2017
|
Change
|
2016
|
Change
|
||||||||||||||
|
Cost of sales
|
$
|
4,597
|
|
$
|
3,120
|
|
$
|
1,477
|
|
$
|
582
|
|
$
|
2,538
|
|
||||
|
Operating and maintenance expense
|
613
|
|
446
|
|
167
|
|
216
|
|
230
|
|
|||||||||
|
Development expense
|
7
|
|
10
|
|
(3
|
)
|
7
|
|
3
|
|
|||||||||
|
Selling, general and administrative expense
|
289
|
|
256
|
|
33
|
|
260
|
|
(4
|
)
|
|||||||||
|
Depreciation and amortization expense
|
449
|
|
356
|
|
93
|
|
174
|
|
182
|
|
|||||||||
|
Restructuring expense
|
—
|
|
6
|
|
(6
|
)
|
61
|
|
(55
|
)
|
|||||||||
|
Impairment expense and loss on disposal of assets
|
8
|
|
19
|
|
(11
|
)
|
13
|
|
6
|
|
|||||||||
|
Total operating costs and expenses
|
$
|
5,963
|
|
$
|
4,213
|
|
$
|
1,750
|
|
$
|
1,313
|
|
$
|
2,900
|
|
||||
2018 vs. 2017 and 2017 vs. 2016
Our total operating costs and expenses increased during the
year ended December 31, 2018
from the years ended December 31, 2017 and 2016, primarily as a result of additional Trains that were operating between each of the periods.
Cost of sales increased during the
year ended December 31, 2018
from the comparable periods in 2017 and 2016, primarily as a result of the increase in operating Trains between each of the periods. Cost of sales includes costs incurred directly for the production and delivery of LNG from the
SPL Project
, to the extent those costs are not utilized for the commissioning process. The increase during the
year ended December 31, 2018
from the comparable period in 2017 was primarily related to the increase in the volume of natural gas feedstock related to our LNG sales. The increase during the year ended December 31, 2017 from the comparable period in 2016 was primarily related to the increase in both the volume and pricing of natural gas feedstock related to our LNG sales and cost of LNG procured from third parties. Cost of sales also includes gains and losses from derivatives associated with economic hedges to secure natural gas feedstock for the
SPL Project
and
CCL Project
, vessel charter costs, port and canal fees, variable transportation and storage costs and other costs to convert natural gas into LNG.
Operating and maintenance expense increased during the
year ended December 31, 2018
from the comparable periods in 2017 and 2016, as a result of the increase in operating Trains between each of the periods. Operating and maintenance expense primarily includes costs associated with operating and maintaining the
SPL Project
and
CCL Project
. The increase during the
year ended December 31, 2018
from the comparable periods in 2017 and 2016 was primarily related to third-party service and maintenance contract costs, payroll and benefit costs of operations personnel, and natural gas transportation and storage capacity demand charges. Operating and maintenance expense also includes TUA reservation charges as a result of payments under the partial TUA assignment agreement with Total, insurance and regulatory costs and other operating costs.
Depreciation and amortization expense increased during the
year ended December 31, 2018
from the comparable periods in 2017 and 2016 as a result of an increased number of operational Trains, as the assets related to the Trains of the
SPL Project
54
began depreciating upon reaching substantial completion and the assets related to Corpus Christi Pipeline began depreciating upon completion of the construction.
Impairment expense and loss on disposal of assets decreased during the
year ended December 31, 2018
compared to the years ended December 31, 2017 and 2016. The impairment expense and loss on disposal of assets recognized during the
year ended December 31, 2018
related to the write down of prepaid assets. The impairment expense and loss on disposal of assets recognized during the years ended December 31, 2017 and 2016 related to write down of assets used in non-core operations outside of our liquefaction activities. The impairment expense and loss on disposal of assets recognized during the
year ended December 31, 2017
also included $6 million related to damaged infrastructure as an effect of Hurricane Harvey.
We expect our operating costs and expenses to generally increase in the future upon Train 5 of the
SPL Project
achieving substantial completion, although certain costs will not proportionally increase with the number of operational Trains as cost efficiencies will be realized, as well as upon Trains 1 through 3 of the
CCL Project
becoming operational.
Other expense (income)
|
Year Ended December 31,
|
|||||||||||||||||||
|
(in millions)
|
2018
|
2017
|
Change
|
2016
|
Change
|
||||||||||||||
|
Interest expense, net of capitalized interest
|
$
|
875
|
|
$
|
747
|
|
$
|
128
|
|
$
|
488
|
|
$
|
259
|
|
||||
|
Loss on modification or extinguishment of debt
|
27
|
|
100
|
|
(73
|
)
|
135
|
|
(35
|
)
|
|||||||||
|
Derivative loss (gain), net
|
(57
|
)
|
(7
|
)
|
(50
|
)
|
10
|
|
(17
|
)
|
|||||||||
|
Other income
|
(48
|
)
|
(18
|
)
|
(30
|
)
|
—
|
|
(18
|
)
|
|||||||||
|
Total other expense
|
$
|
797
|
|
$
|
822
|
|
$
|
(25
|
)
|
$
|
633
|
|
$
|
189
|
|
||||
2018 vs. 2017
Interest expense, net of capitalized interest, increased during the
year ended December 31, 2018
compared to the
year ended December 31, 2017
, as a result of increased outstanding debt (before unamortized premium, discount and debt issuance costs, net) from $26.1 billion as of
December 31, 2017
to
$29.2 billion
as of
December 31, 2018
primarily due to increased borrowings under the
CCH Credit Facility
, as well as a decrease in the portion of total interest costs that could be capitalized as additional Trains of the
SPL Project
completed construction between the periods. For the
years ended December 31, 2018 and 2017
, we incurred
$1.7 billion
and
$1.5 billion
of total interest cost, respectively, of which we capitalized
$803 million
and
$779 million
, respectively, which was primarily related to the construction of the SPL Project and the CCL Project.
Loss on modification or extinguishment of debt decreased during the
year ended December 31, 2018
, as compared to the
year ended December 31, 2017
. Loss on modification or extinguishment of debt recognized in 2018 was attributable to the incurrence of third party fees and write off of unamortized debt issuance costs of (1)
$15 million
recognized in June 2018 upon amendment and restatement of the
CCH Credit Facility
and (2)
$12 million
recognized in September 2018 upon termination of approximately
$1.2 billion
of commitments under the
CQP Credit Facilities
in connection with the issuance of the 2026 CQP Senior Notes. Loss on modification or extinguishment of debt recognized in 2017 was attributable to the write-offs of debt issuance costs of (1) $42 million in March 2017 upon termination of the remaining available balance of $1.6 billion under the
SPL Credit Facilities
in connection with the issuance of the
2028 SPL Senior Notes
and the
2037 SPL Senior Notes
; (2) $33 million in May 2017 upon the prepayment of approximately $1.4 billion of outstanding borrowings under the CCH Credit Facility in connection with the issuance of the 2027 CCH Senior Notes; and (3) $25 million in September 2017 related to the prepayment of $1.5 billion of the outstanding indebtedness under the CQP Credit Facilities in connection with the issuance of the 2025 CQP Senior Notes.
Derivative gain, net increased during the
year ended December 31, 2018
compared to the
year ended December 31, 2017
, primarily due to a favorable shift in the long-term forward LIBOR curve between the periods. During the
year ended December 31, 2018
, we also received
$5 million
of proceeds in June 2018 upon the termination of interest rate swaps associated with the amendment and restatement of the
CCH Credit Facility
and
$28 million
of proceeds in October 2018 upon the termination of the interest rate swaps
(“CQP Interest Rate Derivatives”)
previously held to hedge a portion of the variable interest payments on its
CQP Credit Facilities
. During the
year ended December 31, 2017
, we paid
$7 million
upon the termination of interest rate swaps associated with the termination of the
SPL Credit Facilities
and a
$13 million
in May 2017 in conjunction with the termination of approximately $1.4 billion of commitments under the
CCH Credit Facility
.
55
Other income increased during the
year ended December 31, 2018
as compared to the
year ended December 31, 2017
, primarily due to an increase in interest income earned on our cash and cash equivalents.
2017 vs. 2016
Interest expense, net of capitalized interest, increased during the year ended December 31, 2017 compared to the year ended December 31, 2016, primarily as a result of an increase in our indebtedness outstanding (before unamortized premium, discount and debt issuance costs, net), from $22.7 billion as of December 31, 2016 to $26.1 billion as of December 31, 2017, and a decrease in the portion of total interest costs that could be capitalized as Trains 1 through 4 of the SPL Project completed construction. For the year ended December 31, 2016, we incurred $1.3 billion of total interest cost, of which we capitalized $813 million which was primarily related to the construction of the SPL Project and the CCL Project.
Loss on modification or extinguishment of debt decreased during the year ended December 31, 2017, as compared to the year ended December 31, 2016. Loss on modification or extinguishment of debt during the year ended December 31, 2016 was attributable to (1) $63 million write-off of debt issuance costs related to the $2.4 billion prepayment of outstanding borrowings under the CCH Credit Facility in connection with the issuance of the 2024 CCH Senior Notes and the 2025 CCH Senior Notes, (2) $52 million write-off of debt issuance costs and payment of fees related to the $2.6 billion prepayment of outstanding borrowings and termination of commitments under the SPL Credit Facilities in connection with the issuance of the 2026 SPL Senior Notes and the 2027 SPL Senior Notes and (3) $20 million write-off of debt issuance costs and unamortized discount in connection with the prepayment of the CTPL term loan facility and the redemption of the senior notes due 2020 previously issued by SPLNG.
Derivative gain, net increased from a loss during year ended December 31, 2016 to a gain during the year ended December 31, 2017, primarily due to a favorable shift in the long-term forward LIBOR curve between the periods.
Income tax provision
|
Year Ended December 31,
|
|||||||||||||||||||
|
(in millions)
|
2018
|
2017
|
Change
|
2016
|
Change
|
||||||||||||||
|
Income (loss) before income taxes and non-controlling interest
|
$
|
1,227
|
|
$
|
566
|
|
$
|
661
|
|
$
|
(663
|
)
|
$
|
1,229
|
|
||||
|
Income tax provision
|
27
|
|
3
|
|
24
|
|
2
|
|
1
|
|
|||||||||
|
Effective tax rate
|
2.2
|
%
|
0.5
|
%
|
(0.3
|
)%
|
|||||||||||||
2018 vs. 2017 and 2017 vs. 2016
Changes in the income tax recorded between comparative periods are primarily attributable to fluctuations in the profitability of our U.K. integrated marketing function. The effective tax rates during each of the
years ended December 31, 2018, 2017 and 2016
were lower than the 21%, 35% and 35% federal statutory rates during the
years ended December 31, 2018, 2017 and 2016
, respectively, primarily as a result of maintaining a valuation allowance against our federal and state net deferred tax assets. Given our current and anticipated future earnings, we believe that there is a reasonable possibility that within the next 12 to 24 months, sufficient positive evidence may become available to allow us to conclude that a significant portion of the valuation allowance will no longer be needed. The release of the valuation allowance would result in the recognition of certain deferred tax assets and an income tax benefit in the period the release is recorded. However, the precise timing and amount of the valuation allowance release are subject to change on the basis of the level of profitability that we are able to achieve.
Net income (loss) attributable to non-controlling interest
|
Year Ended December 31,
|
|||||||||||||||||||
|
(in millions)
|
2018
|
2017
|
Change
|
2016
|
Change
|
||||||||||||||
|
Net income (loss) attributable to non-controlling interest
|
$
|
729
|
|
$
|
956
|
|
$
|
(227
|
)
|
$
|
(55
|
)
|
$
|
1,011
|
|
||||
2018 vs. 2017
Net income attributable to non-controlling interest decreased during the
year ended December 31, 2018
from the
year ended December 31, 2017
due to the nonrecurrence of non-cash amortization of the beneficial conversion feature on Cheniere Partners’
56
Class B units that occurred during the comparable period in 2017, which was partially offset by the increase in consolidated net income recognized by Cheniere Partners in which the non-controlling interests are held, adjusting for the increase in the share of Cheniere Partners’ net income that is attributed to non-controlling interest holders as a result of changes in ownership percentages between years. Net income attributable to non-controlling interest during the
year ended December 31, 2017
included approximately $748 million due to amortization of the beneficial conversion feature on Cheniere Partners’ Class B units, which ceased upon the conversion of Cheniere Partners’ Class B units into common units. The consolidated net income recognized by Cheniere Partners increased from
$490 million
in the
year ended December 31, 2017
to
$1.3 billion
in the
year ended December 31, 2018
, primarily as a result of the additional Trains that were operating at the
SPL Project
between the periods. Partially offsetting the decrease in net income attributable to non-controlling interest was an increase in ownership percentage by non-controlling interest holders between the periods as a result of the conversion of Cheniere Partners’ Class B units into common units on August 2, 2017.
We expect the portion of our net income attributable to non-controlling interest to generally decrease in the future as a result of our merger with Cheniere Holdings, in which all publicly-held shares of Cheniere Holdings were canceled and the non-controlling interest in Cheniere Holdings was reduced to zero.
2017 vs. 2016
Net income attributable to non-controlling interest increased during the year ended December 31, 2017 from the year ended 2016 was primarily due to the amortization of the beneficial conversion feature on Cheniere Partners’ Class B units and the increase in consolidated net income recognized by Cheniere Partners in which the non-controlling interest is held. Net income attributable to non-controlling interest was increased by $714 million for non-cash amortization of the beneficial conversion feature on Cheniere Partners’ Class B units during the year ended December 31, 2017. Although the amortization of the beneficial conversion feature on Cheniere Partners’ Class B units ceased upon the conversion of these units into common units on August 2, 2017, the share of Cheniere Partners’ net income (loss) that is attributed to non-controlling interest holders increased from that date to December 31, 2017 as a result of the increased ownership percentage by non-controlling interest holders. The consolidated net income recognized by Cheniere Partners increased from a net loss of $171 million in the year ended December 31, 2016 to net income of $490 million in the year ended December 31, 2017, primarily due to the increase in income from operations as a result of the additional Trains that were operating at the SPL Project between the periods, which was partially offset by increased interest expense, net of amounts capitalized.
Off-Balance Sheet Arrangements
We have interests in an unconsolidated variable interest entity (“VIE”) as discussed in
Note 8—Other Non-Current Assets
of our Notes to Consolidated Financial Statements in this
annual
report, which we consider to be an off-balance sheet arrangement. We believe that this VIE does not have a current or future material effect on our consolidated financial position or operating results.
Summary of Critical Accounting Estimates
The preparation of Consolidated Financial Statements in conformity with GAAP requires management to make certain estimates and assumptions that affect the amounts reported in the Consolidated Financial Statements and the accompanying notes. Management evaluates its estimates and related assumptions regularly, including those related to the valuation of derivative instruments, properties, plant and equipment and income taxes. Changes in facts and circumstances or additional information may result in revised estimates, and actual results may differ from these estimates. Management considers the following to be its most critical accounting estimates that involve significant judgment.
Derivative Instruments
All derivative instruments, other than those that satisfy specific exceptions, are recorded at fair value. We record changes in the fair value of our derivative positions based on the value for which the derivative instrument could be exchanged between willing parties. If market quotes are not available to estimate fair value, management’s best estimate of fair value is based on the quoted market price of derivatives with similar characteristics or determined through industry-standard valuation approaches. Such evaluations may involve significant judgment and the results are based on expected future events or conditions, particularly for those valuations using inputs unobservable in the market.
Our derivative instruments consist of interest rate swaps, financial commodity derivative contracts transacted in an over-the-counter market, index-based physical commodity contracts and foreign currency exchange
(“FX”)
contracts. We value
57
our interest rate swaps using observable inputs including interest rate curves, risk adjusted discount rates, credit spreads and other relevant data. Valuation of our financial commodity derivative contracts is determined using observable commodity price curves and other relevant data. Valuation of our index-based physical commodity contracts is developed through the use of internal models which are impacted by inputs that may be unobservable in the marketplace, market transactions and other relevant data. We estimate the fair values of our FX derivative instruments using observable FX rates and other relevant data.
Gains and losses on derivative instruments are recognized in earnings. The ultimate fair value of our derivative instruments is uncertain, and we believe that it is reasonably possible that a change in the estimated fair value could occur in the near future as interest rates, commodity prices and FX rates change.
Income Taxes
Deferred income tax assets and liabilities are recognized for temporary differences between the basis of assets and liabilities for financial reporting and tax purposes. Deferred tax assets are reduced by a valuation allowance if, based on all available evidence, it is more likely than not that some portion or all of the deferred tax asset will not be realized. In determining the need for a valuation allowance we consider current and historical financial results, expectations for future taxable income and the availability of tax planning strategies that can be implemented, if necessary, to realize deferred tax assets. We have recorded a full valuation allowance on our net federal and state deferred tax assets as of both
December 31, 2018
and
2017
. We intend to maintain a valuation allowance on our net federal and state deferred tax assets until there is sufficient evidence to support the reversal of these allowances.
We recognize the financial statement effects of a tax position when it is more likely than not, based on the technical merits, that the position will be sustained upon examination. The largest amount of the tax benefit that is greater than 50 percent likely of being effectively settled is recorded. Changes in these unrecognized tax benefits may result from remeasurement of amounts expected to be realized, settlements with tax authorities and expiration of statutes of limitations.
See
Note 14—Income Taxes
of our Notes to Consolidated Financial Statements for further discussion of our accounting for income taxes.
Recent Accounting Standards
For descriptions of recently issued accounting standards, see
Note 22—Recent Accounting Standards
of our Notes to Consolidated Financial Statements.
ITEM 7A. QUANTITATIVE AND QUALITATIVE DISCLOSURES ABOUT MARKET RISK
Cash Investments
We have cash investments that we manage based on internal investment guidelines that emphasize liquidity and preservation of capital. Such cash investments are stated at historical cost, which approximates fair market value on our Consolidated Balance Sheets.
Marketing and Trading Commodity Price Risk
We have entered into commodity derivatives consisting of natural gas supply contracts for the commissioning and operation of the
SPL Project
and the
CCL Project
(“Liquefaction Supply Derivatives”)
. We have also entered into financial derivatives to hedge the exposure to the commodity markets in which we have contractual arrangements to purchase or sell physical LNG
(“LNG Trading Derivatives”)
. In order to test the sensitivity of the fair value of the
Liquefaction Supply Derivatives
and the
LNG Trading Derivatives
to changes in underlying commodity prices, management modeled a 10% change in the commodity price for natural gas for each delivery location and a 10% change in the commodity price for LNG, respectively, as follows (in millions):
|
December 31, 2018
|
December 31, 2017
|
||||||||||||||
|
Fair Value
|
Change in Fair Value
|
Fair Value
|
Change in Fair Value
|
||||||||||||
|
Liquefaction Supply Derivatives
|
$
|
(42
|
)
|
$
|
6
|
|
$
|
55
|
|
$
|
5
|
|
|||
|
LNG Trading Derivatives
|
(24
|
)
|
9
|
|
(8
|
)
|
2
|
|
|||||||
58
Interest Rate Risk
We are exposed to interest rate risk primarily when we incur debt related to project financing. Interest rate risk is managed in part by replacing outstanding floating-rate debt with fixed-rate debt with varying maturities. CCH has also entered into interest rate swaps to hedge the exposure to volatility in a portion of the floating-rate interest payments under the
CCH Credit Facility
(“CCH Interest Rate Derivatives”). CQP previously had the
CQP Interest Rate Derivatives
to hedge the exposure to volatility in a portion of the floating-rate interest payments under the
CQP Credit Facilities
. In order to test the sensitivity of the fair value of the CCH Interest Rate Derivatives to changes in interest rates, management modeled a 10% change in the forward 1-month
LIBOR
curve across the remaining terms of the CCH Interest Rate Derivatives as follows (in millions):
|
December 31, 2018
|
December 31, 2017
|
||||||||||||||
|
Fair Value
|
Change in Fair Value
|
Fair Value
|
Change in Fair Value
|
||||||||||||
|
CCH Interest Rate Derivatives
|
$
|
18
|
|
$
|
37
|
|
$
|
(32
|
)
|
$
|
44
|
|
|||
Foreign Currency Exchange Risk
We have entered into
FX
contracts to hedge exposure to currency risk associated with operations in countries outside of the United States
(“FX Derivatives”)
. In order to test the sensitivity of the fair value of the
FX Derivatives
to changes in
FX
rates, management modeled a 10% change in
FX
rate between the U.S. dollar and the applicable foreign currencies as follows (in millions):
|
December 31, 2018
|
December 31, 2017
|
||||||||||||||
|
Fair Value
|
Change in Fair Value
|
Fair Value
|
Change in Fair Value
|
||||||||||||
|
FX Derivatives
|
$
|
15
|
|
$
|
1
|
|
$
|
(1
|
)
|
$
|
—
|
|
|||
See
Note 7—Derivative Instruments
for additional details about our derivative instruments.
59
|
ITEM 8.
|
FINANCIAL STATEMENTS AND SUPPLEMENTARY DATA
|
INDEX TO CONSOLIDATED FINANCIAL STATEMENTS
CHENIERE ENERGY, INC. AND SUBSIDIARIES
|
|
|
60
MANAGEMENT’S REPORT TO THE STOCKHOLDERS OF CHENIERE ENERGY, INC.
Management’s Report on Internal Control Over Financial Reporting
As management, we are responsible for establishing and maintaining adequate internal control over financial reporting for Cheniere Energy, Inc. and its subsidiaries (“Cheniere”). In order to evaluate the effectiveness of internal control over financial reporting, as required by Section 404 of the Sarbanes-Oxley Act of 2002, we have conducted an assessment, including testing using the criteria in
Internal Control—Integrated Framework (2013)
issued by the Committee of Sponsoring Organizations of the Treadway Commission (“COSO”). Cheniere’s system of internal control over financial reporting is designed to provide reasonable assurance regarding the reliability of financial reporting and the preparation of financial statements for external purposes in accordance with accounting principles generally accepted in the United States of America. Because of its inherent limitations, internal control over financial reporting may not prevent or detect misstatements and, even when determined to be effective, can only provide reasonable assurance with respect to financial statement preparation and presentation.
Based on our assessment, we have concluded that Cheniere maintained effective internal control over financial reporting as of December 31,
2018
, based on criteria in
Internal Control—Integrated Framework (2013)
issued by the COSO.
Cheniere’s independent registered public accounting firm, KPMG LLP, has issued an audit report on Cheniere’s internal control over financial reporting as of December 31,
2018
, which is contained in this Form 10-K.
Management’s Certifications
The certifications of Cheniere’s Chief Executive Officer and Chief Financial Officer required by the Sarbanes-Oxley Act of 2002 have been included as Exhibits 31 and 32 in Cheniere’s Form 10-K.
CHENIERE ENERGY, INC.
|
|
|
|
|
|
|
By:
|
/s/ Jack A. Fusco
|
|
By:
|
/s/ Michael J. Wortley
|
|
Jack A. Fusco
|
Michael J. Wortley
|
|||
|
|
President and Chief Executive Officer
(Principal Executive Officer) |
|
|
Executive Vice President and Chief Financial Officer
(Principal Financial Officer) |
61
REPORT OF INDEPENDENT REGISTERED PUBLIC ACCOUNTING FIRM
To the Stockholders and Board of Directors
Cheniere Energy, Inc.:
Opinion on the Consolidated Financial Statements
We have audited the accompanying consolidated balance sheets of Cheniere Energy, Inc. and subsidiaries (the Company) as of December 31, 2018 and 2017, the related consolidated statements of operations, stockholders’ equity, and cash flows for each of the years in the three-year period ended December 31, 2018, and the related notes and financial statement schedule I (collectively, the consolidated financial statements). In our opinion, the consolidated financial statements present fairly, in all material respects, the financial position of the Company as of December 31, 2018 and 2017, and the results of its operations and its cash flows for each of the years in the three-year period ended December 31, 2018, in conformity with U.S. generally accepted accounting principles.
We also have audited, in accordance with the standards of the Public Company Accounting Oversight Board (United States) (PCAOB), the Company’s internal control over financial reporting as of December 31, 2018, based on criteria established in
Internal Control—Integrated Framework (2013)
issued by the Committee of Sponsoring Organizations of the Treadway Commission, and our report dated
February 25, 2019
expressed an unqualified opinion on the effectiveness of the Company’s internal control over financial reporting.
Change in Accounting Principle
As discussed in Note 2 to the consolidated financial statements, the Company has changed its method of accounting for revenue recognition in 2018, 2017 and 2016 due to the adoption of
ASU 2014-09, Revenue from Contracts with Customers (Topic 606)
, and subsequent amendments thereto.
Basis for Opinion
These consolidated financial statements are the responsibility of the Company’s management. Our responsibility is to express an opinion on these consolidated financial statements based on our audits. We are a public accounting firm registered with the PCAOB and are required to be independent with respect to the Company in accordance with the U.S. federal securities laws and the applicable rules and regulations of the Securities and Exchange Commission and the PCAOB.
We conducted our audits in accordance with the standards of the PCAOB. Those standards require that we plan and perform the audit to obtain reasonable assurance about whether the consolidated financial statements are free of material misstatement, whether due to error or fraud. Our audits included performing procedures to assess the risks of material misstatement of the consolidated financial statements, whether due to error or fraud, and performing procedures that respond to those risks. Such procedures included examining, on a test basis, evidence regarding the amounts and disclosures in the consolidated financial statements. Our audits also included evaluating the accounting principles used and significant estimates made by management, as well as evaluating the overall presentation of the consolidated financial statements. We believe that our audits provide a reasonable basis for our opinion.
|
/s/ KPMG LLP
|
|
KPMG LLP
|
|
|
We have served as the Company’s auditor since 2014.
Houston, Texas
February 25, 2019
62
REPORT OF INDEPENDENT REGISTERED PUBLIC ACCOUNTING FIRM
To the Stockholders and Board of Directors
Cheniere Energy, Inc.:
Opinion on Internal Control Over Financial Reporting
We have audited Cheniere Energy, Inc.’s and subsidiaries’ (the Company) internal control over financial reporting as of December 31, 2018, based on criteria established in
Internal Control—Integrated Framework (2013)
issued by the Committee of Sponsoring Organizations of the Treadway Commission. In our opinion, the Company maintained, in all material respects, effective internal control over financial reporting as of December 31, 2018, based on criteria established in
Internal Control—Integrated Framework (2013)
issued by the Committee of Sponsoring Organizations of the Treadway Commission.
We also have audited, in accordance with the standards of the Public Company Accounting Oversight Board (United States) (PCAOB), the consolidated balance sheets of the Company as of December 31, 2018 and 2017, the related consolidated statements of operations, stockholders’ equity, and cash flows for each of the years in the three-year period ended December 31, 2018, and the related notes and financial statement schedule I
(collectively, the consolidated financial statements), and our report dated
February 25, 2019
expressed an unqualified opinion on those consolidated financial statements.
Basis for Opinion
The Company’s management is responsible for maintaining effective internal control over financial reporting and for its assessment of the effectiveness of internal control over financial reporting, included in the accompanying Management’s Report on Internal Control Over Financial Reporting. Our responsibility is to express an opinion on the Company’s internal control over financial reporting based on our audit. We are a public accounting firm registered with the PCAOB and are required to be independent with respect to the Company in accordance with the U.S. federal securities laws and the applicable rules and regulations of the Securities and Exchange Commission and the PCAOB.
We conducted our audit in accordance with the standards of the PCAOB. Those standards require that we plan and perform the audit to obtain reasonable assurance about whether effective internal control over financial reporting was maintained in all material respects. Our audit of internal control over financial reporting included obtaining an understanding of internal control over financial reporting, assessing the risk that a material weakness exists, and testing and evaluating the design and operating effectiveness of internal control based on the assessed risk. Our audit also included performing such other procedures as we considered necessary in the circumstances. We believe that our audit provides a reasonable basis for our opinion.
Definition and Limitations of Internal Control Over Financial Reporting
A company’s internal control over financial reporting is a process designed to provide reasonable assurance regarding the reliability of financial reporting and the preparation of financial statements for external purposes in accordance with generally accepted accounting principles. A company’s internal control over financial reporting includes those policies and procedures that (1) pertain to the maintenance of records that, in reasonable detail, accurately and fairly reflect the transactions and dispositions of the assets of the company; (2) provide reasonable assurance that transactions are recorded as necessary to permit preparation of financial statements in accordance with generally accepted accounting principles, and that receipts and expenditures of the company are being made only in accordance with authorizations of management and directors of the company; and (3) provide reasonable assurance regarding prevention or timely detection of unauthorized acquisition, use, or disposition of the company’s assets that could have a material effect on the financial statements.
Because of its inherent limitations, internal control over financial reporting may not prevent or detect misstatements. Also, projections of any evaluation of effectiveness to future periods are subject to the risk that controls may become inadequate because of changes in conditions, or that the degree of compliance with the policies or procedures may deteriorate.
|
/s/ KPMG LLP
|
|
KPMG LLP
|
|
|
Houston, Texas
February 25, 2019
63
CHENIERE ENERGY, INC. AND SUBSIDIARIES
CONSOLIDATED BALANCE SHEETS
(in millions, except share data)
|
|
December 31,
|
||||||
|
|
2018
|
2017
|
|||||
|
ASSETS
|
|
|
|||||
|
Current assets
|
|
|
|||||
|
Cash and cash equivalents
|
$
|
981
|
|
$
|
722
|
|
|
|
Restricted cash
|
2,175
|
|
1,880
|
|
|||
|
Accounts and other receivables
|
581
|
|
369
|
|
|||
|
Accounts receivable—related party
|
4
|
|
2
|
|
|||
|
Inventory
|
316
|
|
243
|
|
|||
|
Derivative assets
|
63
|
|
57
|
|
|||
|
Other current assets
|
114
|
|
96
|
|
|||
|
Total current assets
|
4,234
|
|
3,369
|
|
|||
|
Non-current restricted cash
|
—
|
|
11
|
|
|||
|
Property, plant and equipment, net
|
27,245
|
|
23,978
|
|
|||
|
Debt issuance costs, net
|
72
|
|
149
|
|
|||
|
Non-current derivative assets
|
54
|
|
34
|
|
|||
|
Goodwill
|
77
|
|
77
|
|
|||
|
Other non-current assets, net
|
305
|
|
288
|
|
|||
|
Total assets
|
$
|
31,987
|
|
$
|
27,906
|
|
|
|
LIABILITIES AND STOCKHOLDERS’ EQUITY
|
|
|
|
|
|||
|
Current liabilities
|
|
|
|
|
|||
|
Accounts payable
|
$
|
58
|
|
$
|
25
|
|
|
|
Accrued liabilities
|
1,169
|
|
1,078
|
|
|||
|
Current debt
|
239
|
|
—
|
|
|||
|
Deferred revenue
|
139
|
|
111
|
|
|||
|
Derivative liabilities
|
128
|
|
37
|
|
|||
|
Other current liabilities
|
9
|
|
—
|
|
|||
|
Total current liabilities
|
1,742
|
|
1,251
|
|
|||
|
Long-term debt, net
|
28,179
|
|
25,336
|
|
|||
|
Non-current capital lease obligations
|
57
|
|
—
|
|
|||
|
Non-current derivative liabilities
|
22
|
|
19
|
|
|||
|
Other non-current liabilities
|
58
|
|
60
|
|
|||
|
Commitments and contingencies (see Note 19)
|
|
|
|
|
|||
|
Stockholders’ equity
|
|
|
|
|
|||
|
Preferred stock, $0.0001 par value, 5.0 million shares authorized, none issued
|
—
|
|
—
|
|
|||
|
Common stock, $0.003 par value
|
|
|
|||||
|
Authorized: 480.0 million shares at December 31, 2018 and 2017
|
|||||||
|
Issued: 269.8 million shares and 250.1 million shares at December 31, 2018 and 2017, respectively
|
|
|
|
|
|||
|
Outstanding: 257.0 million shares and 237.6 million shares at December 31, 2018 and 2017, respectively
|
1
|
|
1
|
|
|||
|
Treasury stock: 12.8 million shares and 12.5 million shares at December 31, 2018 and 2017, respectively, at cost
|
(406
|
)
|
(386
|
)
|
|||
|
Additional paid-in-capital
|
4,035
|
|
3,248
|
|
|||
|
Accumulated deficit
|
(4,156
|
)
|
(4,627
|
)
|
|||
|
Total stockholders’ deficit
|
(526
|
)
|
(1,764
|
)
|
|||
|
Non-controlling interest
|
2,455
|
|
3,004
|
|
|||
|
Total equity
|
1,929
|
|
1,240
|
|
|||
|
Total liabilities and equity
|
$
|
31,987
|
|
$
|
27,906
|
|
|
The accompanying notes are an integral part of these consolidated financial statements.
64
CHENIERE ENERGY, INC. AND SUBSIDIARIES
CONSOLIDATED
STATEMENTS OF OPERATIONS
(in millions, except per share data)
|
Year Ended December 31,
|
|||||||||||
|
|
2018
|
2017
|
2016
|
||||||||
|
Revenues
|
|||||||||||
|
LNG revenues
|
$
|
7,572
|
|
$
|
5,317
|
|
$
|
1,016
|
|
||
|
Regasification revenues
|
261
|
|
260
|
|
259
|
|
|||||
|
Other revenues
|
142
|
|
21
|
|
8
|
|
|||||
|
Other—related party
|
12
|
|
3
|
|
—
|
|
|||||
|
Total revenues
|
7,987
|
|
5,601
|
|
1,283
|
|
|||||
|
Operating costs and expenses
|
|||||||||||
|
Cost of sales (excluding depreciation and amortization expense shown separately below)
|
4,597
|
|
3,120
|
|
582
|
|
|||||
|
Operating and maintenance expense
|
613
|
|
446
|
|
216
|
|
|||||
|
Development expense
|
7
|
|
10
|
|
7
|
|
|||||
|
Selling, general and administrative expense
|
289
|
|
256
|
|
260
|
|
|||||
|
Depreciation and amortization expense
|
449
|
|
356
|
|
174
|
|
|||||
|
Restructuring expense
|
—
|
|
6
|
|
61
|
|
|||||
|
Impairment expense and loss on disposal of assets
|
8
|
|
19
|
|
13
|
|
|||||
|
Total operating costs and expenses
|
5,963
|
|
4,213
|
|
1,313
|
|
|||||
|
Income (loss) from operations
|
2,024
|
|
1,388
|
|
(30
|
)
|
|||||
|
Other income (expense)
|
|||||||||||
|
Interest expense, net of capitalized interest
|
(875
|
)
|
(747
|
)
|
(488
|
)
|
|||||
|
Loss on modification or extinguishment of debt
|
(27
|
)
|
(100
|
)
|
(135
|
)
|
|||||
|
Derivative gain (loss), net
|
57
|
|
7
|
|
(10
|
)
|
|||||
|
Other income
|
48
|
|
18
|
|
—
|
|
|||||
|
Total other expense
|
(797
|
)
|
(822
|
)
|
(633
|
)
|
|||||
|
Income (loss) before income taxes and non-controlling interest
|
1,227
|
|
|
566
|
|
(663
|
)
|
||||
|
Income tax provision
|
(27
|
)
|
|
(3
|
)
|
(2
|
)
|
||||
|
Net income (loss)
|
1,200
|
|
|
563
|
|
(665
|
)
|
||||
|
Less: net income (loss) attributable to non-controlling interest
|
729
|
|
|
956
|
|
(55
|
)
|
||||
|
Net income (loss) attributable to common stockholders
|
$
|
471
|
|
|
$
|
(393
|
)
|
$
|
(610
|
)
|
|
|
|
|
|
|
|
|
||||||
|
Net income (loss) per share attributable to common stockholders—basic (1)
|
$
|
1.92
|
|
|
$
|
(1.68
|
)
|
$
|
(2.67
|
)
|
|
|
Net income (loss) per share attributable to common stockholders—diluted (1)
|
$
|
1.90
|
|
$
|
(1.68
|
)
|
$
|
(2.67
|
)
|
||
|
|
|
|
|
|
|||||||
|
Weighted average number of common shares outstanding—basic
|
245.6
|
|
233.1
|
|
228.8
|
|
|||||
|
Weighted average number of common shares outstanding—diluted
|
248.0
|
|
233.1
|
|
228.8
|
|
|||||
|
(1)
|
Earnings per share in the table may not recalculate exactly due to rounding because it is calculated based on whole numbers, not the rounded numbers presented.
|
The accompanying notes are an integral part of these consolidated financial statements.
65
CHENIERE ENERGY, INC. AND SUBSIDIARIES
CONSOLIDATED STATEMENTS OF STOCKHOLDERS’ EQUITY
(in millions)
|
Total Stockholders’ Equity
|
|||||||||||||||||||||||||||||
|
|
Common Stock
|
Treasury Stock
|
Additional Paid-in Capital
|
Accumulated Deficit
|
Non-controlling Interest
|
Total
Equity
|
|||||||||||||||||||||||
|
|
Shares
|
Par Value Amount
|
Shares
|
Amount
|
|||||||||||||||||||||||||
|
Balance at December 31, 2015
|
235.6
|
|
$
|
1
|
|
11.6
|
|
$
|
(354
|
)
|
$
|
3,076
|
|
$
|
(3,624
|
)
|
$
|
2,464
|
|
$
|
1,563
|
|
|||||||
|
Issuances of restricted stock
|
0.4
|
|
—
|
|
—
|
|
—
|
|
—
|
|
—
|
|
—
|
|
—
|
|
|||||||||||||
|
Issuance of stock to acquire additional interest in Cheniere Holdings
|
3.0
|
|
—
|
|
—
|
|
—
|
|
94
|
|
—
|
|
(94
|
)
|
—
|
|
|||||||||||||
|
Forfeitures of restricted stock
|
(0.4
|
)
|
—
|
|
—
|
|
—
|
|
—
|
|
—
|
|
—
|
|
—
|
|
|||||||||||||
|
Share-based compensation
|
—
|
|
—
|
|
—
|
|
—
|
|
40
|
|
—
|
|
—
|
|
40
|
|
|||||||||||||
|
Shares repurchased related to share-based compensation
|
(0.6
|
)
|
—
|
|
0.6
|
|
(20
|
)
|
—
|
|
—
|
|
—
|
|
(20
|
)
|
|||||||||||||
|
Loss attributable to non-controlling interest
|
—
|
|
—
|
|
—
|
|
—
|
|
—
|
|
—
|
|
(55
|
)
|
(55
|
)
|
|||||||||||||
|
Equity portion of convertible notes, net
|
—
|
|
—
|
|
—
|
|
—
|
|
1
|
|
—
|
|
—
|
|
1
|
|
|||||||||||||
|
Distributions and dividends to non-controlling interest
|
—
|
|
—
|
|
—
|
|
—
|
|
—
|
|
—
|
|
(80
|
)
|
(80
|
)
|
|||||||||||||
|
Net loss
|
—
|
|
—
|
|
—
|
|
—
|
|
—
|
|
(610
|
)
|
—
|
|
(610
|
)
|
|||||||||||||
|
Balance at December 31, 2016
|
238.0
|
|
1
|
|
12.2
|
|
(374
|
)
|
3,211
|
|
(4,234
|
)
|
2,235
|
|
839
|
|
|||||||||||||
|
Issuances of restricted stock
|
0.1
|
|
—
|
|
—
|
|
—
|
|
—
|
|
—
|
|
—
|
|
—
|
|
|||||||||||||
|
Issuance of stock to acquire additional interest in Cheniere Holdings
|
—
|
|
—
|
|
—
|
|
—
|
|
2
|
|
—
|
|
(2
|
)
|
—
|
|
|||||||||||||
|
Forfeitures of restricted stock
|
(0.2
|
)
|
—
|
|
—
|
|
—
|
|
—
|
|
—
|
|
—
|
|
—
|
|
|||||||||||||
|
Share-based compensation
|
—
|
|
—
|
|
—
|
|
—
|
|
34
|
|
—
|
|
—
|
|
34
|
|
|||||||||||||
|
Shares repurchased related to share-based compensation
|
(0.3
|
)
|
—
|
|
0.3
|
|
(12
|
)
|
—
|
|
—
|
|
—
|
|
(12
|
)
|
|||||||||||||
|
Net income attributable to non-controlling interest
|
—
|
|
—
|
|
—
|
|
—
|
|
—
|
|
—
|
|
956
|
|
956
|
|
|||||||||||||
|
Equity portion of convertible notes, net
|
—
|
|
—
|
|
—
|
|
—
|
|
1
|
|
—
|
|
—
|
|
1
|
|
|||||||||||||
|
Distributions and dividends to non-controlling interest
|
—
|
|
—
|
|
—
|
|
—
|
|
—
|
|
—
|
|
(185
|
)
|
(185
|
)
|
|||||||||||||
|
Net loss
|
—
|
|
—
|
|
—
|
|
—
|
|
—
|
|
(393
|
)
|
—
|
|
(393
|
)
|
|||||||||||||
|
Balance at December 31, 2017
|
237.6
|
|
|
1
|
|
|
12.5
|
|
|
(386
|
)
|
|
3,248
|
|
|
(4,627
|
)
|
|
3,004
|
|
|
1,240
|
|
||||||
|
Vesting of restricted stock units
|
0.5
|
|
—
|
|
—
|
|
—
|
|
—
|
|
—
|
|
—
|
|
—
|
|
|||||||||||||
|
Issuance of stock to acquire additional interest in Cheniere Holdings and other merger related adjustments
|
19.2
|
|
—
|
|
—
|
|
—
|
|
694
|
|
—
|
|
(702
|
)
|
(8
|
)
|
|||||||||||||
|
Share-based compensation
|
—
|
|
—
|
|
—
|
|
—
|
|
90
|
|
—
|
|
—
|
|
90
|
|
|||||||||||||
|
Shares repurchased related to share-based compensation
|
(0.3
|
)
|
—
|
|
0.3
|
|
(20
|
)
|
—
|
|
—
|
|
—
|
|
(20
|
)
|
|||||||||||||
|
Net income attributable to non-controlling interest
|
—
|
|
—
|
|
—
|
|
—
|
|
—
|
|
—
|
|
729
|
|
729
|
|
|||||||||||||
|
Equity portion of convertible notes, net
|
—
|
|
—
|
|
—
|
|
—
|
|
3
|
|
—
|
|
—
|
|
3
|
|
|||||||||||||
|
Distributions and dividends to non-controlling interest
|
—
|
|
—
|
|
—
|
|
—
|
|
—
|
|
—
|
|
(576
|
)
|
(576
|
)
|
|||||||||||||
|
Net income
|
—
|
|
—
|
|
—
|
|
—
|
|
—
|
|
471
|
|
—
|
|
471
|
|
|||||||||||||
|
Balance at December 31, 2018
|
257.0
|
|
$
|
1
|
|
12.8
|
|
$
|
(406
|
)
|
$
|
4,035
|
|
$
|
(4,156
|
)
|
$
|
2,455
|
|
$
|
1,929
|
|
|||||||
The accompanying notes are an integral part of these consolidated financial statements.
66
CHENIERE ENERGY, INC. AND SUBSIDIARIES
CONSOLIDATED STATEMENTS OF CASH FLOWS
(in millions)
|
|
Year Ended December 31,
|
||||||||||
|
|
2018
|
2017
|
2016
|
||||||||
|
Cash flows from operating activities
|
|||||||||||
|
Net income (loss)
|
$
|
1,200
|
|
$
|
563
|
|
$
|
(665
|
)
|
||
|
Adjustments to reconcile net income (loss) to net cash provided by (used in) operating activities:
|
|||||||||||
|
Depreciation and amortization expense
|
449
|
|
356
|
|
174
|
|
|||||
|
Share-based compensation expense
|
113
|
|
91
|
|
101
|
|
|||||
|
Non-cash interest expense
|
74
|
|
75
|
|
77
|
|
|||||
|
Amortization of debt issuance costs, deferred commitment fees, premium and discount
|
69
|
|
69
|
|
62
|
|
|||||
|
Loss on modification or extinguishment of debt
|
27
|
|
100
|
|
135
|
|
|||||
|
Total losses (gains) on derivatives, net
|
51
|
|
62
|
|
(28
|
)
|
|||||
|
Net cash provided by (used for) settlement of derivative instruments
|
17
|
|
(106
|
)
|
(45
|
)
|
|||||
|
Impairment expense and loss on disposal of assets
|
8
|
|
19
|
|
13
|
|
|||||
|
Other
|
(10
|
)
|
(4
|
)
|
4
|
|
|||||
|
Changes in operating assets and liabilities:
|
|||||||||||
|
Accounts and other receivables
|
(131
|
)
|
(139
|
)
|
(207
|
)
|
|||||
|
Accounts receivable—related party
|
(2
|
)
|
(2
|
)
|
—
|
|
|||||
|
Inventory
|
(73
|
)
|
(73
|
)
|
(119
|
)
|
|||||
|
Accounts payable and accrued liabilities
|
188
|
|
225
|
|
64
|
|
|||||
|
Deferred revenue
|
26
|
|
34
|
|
42
|
|
|||||
|
Other, net
|
(16
|
)
|
(39
|
)
|
(12
|
)
|
|||||
|
Net cash provided by (used in) operating activities
|
1,990
|
|
1,231
|
|
(404
|
)
|
|||||
|
Cash flows from investing activities
|
|||||||||||
|
Property, plant and equipment, net
|
(3,643
|
)
|
(3,357
|
)
|
(4,356
|
)
|
|||||
|
Investment in equity method investment
|
(25
|
)
|
(41
|
)
|
—
|
|
|||||
|
Other
|
14
|
|
17
|
|
(57
|
)
|
|||||
|
Net cash used in investing activities
|
(3,654
|
)
|
(3,381
|
)
|
(4,413
|
)
|
|||||
|
Cash flows from financing activities
|
|||||||||||
|
Proceeds from issuances of debt
|
4,285
|
|
6,854
|
|
12,865
|
|
|||||
|
Repayments of debt
|
(1,391
|
)
|
(3,632
|
)
|
(7,671
|
)
|
|||||
|
Debt issuance and deferred financing costs
|
(66
|
)
|
(89
|
)
|
(172
|
)
|
|||||
|
Debt extinguishment costs
|
(17
|
)
|
—
|
|
(14
|
)
|
|||||
|
Distributions and dividends to non-controlling interest
|
(576
|
)
|
(185
|
)
|
(80
|
)
|
|||||
|
Payments related to tax withholdings for share-based compensation
|
(20
|
)
|
(12
|
)
|
(20
|
)
|
|||||
|
Other
|
(8
|
)
|
—
|
|
—
|
|
|||||
|
Net cash provided by financing activities
|
2,207
|
|
2,936
|
|
4,908
|
|
|||||
|
Net increase in cash, cash equivalents and restricted cash
|
543
|
|
786
|
|
91
|
|
|||||
|
Cash, cash equivalents and restricted cash—beginning of period
|
2,613
|
|
1,827
|
|
1,736
|
|
|||||
|
Cash, cash equivalents and restricted cash—end of period
|
$
|
3,156
|
|
$
|
2,613
|
|
$
|
1,827
|
|
||
Balances per Consolidated Balance Sheets:
|
December 31,
|
|||||||
|
2018
|
2017
|
||||||
|
Cash and cash equivalents
|
$
|
981
|
|
$
|
722
|
|
|
|
Restricted cash
|
2,175
|
|
1,880
|
|
|||
|
Non-current restricted cash
|
—
|
|
11
|
|
|||
|
Total cash, cash equivalents and restricted cash
|
$
|
3,156
|
|
$
|
2,613
|
|
|
The accompanying notes are an integral part of these consolidated financial statements.
67
CHENIERE ENERGY, INC. AND SUBSIDIARIES
NOTES TO CONSOLIDATED FINANCIAL STATEMENTS
NOTE 1—ORGANIZATION AND NATURE OF OPERATIONS
Cheniere, a Delaware corporation, is a Houston-based energy company primarily engaged in LNG-related businesses. We own and operate the Sabine Pass LNG terminal in Louisiana through our ownership interest in and management agreements with Cheniere Partners, which is a publicly traded limited partnership that we created in 2007. As of
December 31, 2018
, we owned
100%
of the general partner interest and
48.6%
of the limited partner interest in Cheniere Partners. We are currently developing and constructing
two
natural gas liquefaction and export facilities.
The Sabine Pass LNG terminal is located in Cameron Parish, Louisiana, on the Sabine-Neches Waterway less than four miles from the Gulf Coast. Cheniere Partners is developing, constructing and operating natural gas liquefaction facilities
(the “SPL Project”)
at the Sabine Pass LNG terminal adjacent to the existing regasification facilities (described below) through a wholly owned subsidiary, SPL. Cheniere Partners plans to construct up to
six
Trains, which are in various stages of development, construction and operations. Trains 1 through 4 are operational, Train 5 is undergoing commissioning and Train 6 is being commercialized and has all necessary regulatory approvals in place. Each Train is expected to have a nominal production capacity, which is prior to adjusting for planned maintenance, production reliability, potential overdesign and debottlenecking opportunities, of approximately
4.5
mtpa of LNG per Train, and run rate adjusted nominal production capacity of approximately
4.5
to
4.9
mtpa of LNG per Train. The Sabine Pass LNG terminal has operational regasification facilities owned by Cheniere Partners’ wholly owned subsidiary, SPLNG, that include pre-existing infrastructure of
five
LNG storage tanks with aggregate capacity of approximately
16.9
Bcfe
,
two
marine berths that can each accommodate vessels with nominal capacity of up to
266,000
cubic meters and vaporizers with regasification capacity of approximately
4.0
Bcf/d
. Cheniere Partners also owns a
94
-mile pipeline that interconnects the Sabine Pass LNG terminal with a number of large interstate pipelines
(the “Creole Trail Pipeline”)
through a wholly owned subsidiary, CTPL.
We are developing and constructing a second natural gas liquefaction and export facility at the Corpus Christi LNG terminal near Corpus Christi, Texas, and operate a
23
-mile natural gas supply pipeline that interconnects the Corpus Christi LNG terminal with several interstate and intrastate natural gas pipelines
(the “Corpus Christi Pipeline” and together with the liquefaction facilities, the “CCL Project”)
through our wholly owned subsidiaries CCL and CCP, respectively. The
CCL Project
is being developed in stages with the first phase being
three
Trains (“Phase 1”), with expected aggregate nominal production capacity, which is prior to adjusting for planned maintenance, production reliability, potential overdesign and debottlenecking opportunities, of approximately
13.5
mtpa
of LNG,
three
LNG storage tanks with aggregate capacity of approximately
10.1
Bcfe
and
two
marine berths that can each accommodate vessels with nominal capacity of up to
266,000
cubic meters. The first stage includes Trains 1 and
2
,
two
LNG storage tanks,
one
complete marine berth and a second partial berth and all of the
CCL Project
’s necessary infrastructure facilities
(“Stage 1”)
. The second stage includes Train 3,
one
LNG storage tank and the completion of the second partial berth
(“Stage 2”)
. Trains 1 and 2 are undergoing commissioning and Train 3 is under construction.
Additionally, separate from the CCH Group, we are developing an expansion of the Corpus Christi LNG terminal adjacent to the
CCL Project
and filed an application with FERC in June 2018 for
seven
midscale Trains with an expected aggregate nominal production capacity of approximately
9.5
mtpa and
one
LNG storage tank.
We remain focused on expansion of our existing sites by leveraging existing infrastructure. We are also in various stages of developing other projects, including infrastructure projects in support of natural gas supply and LNG demand, which, among other things, will require acceptable commercial and financing arrangements before we make a final investment decision
(“FID”)
.
NOTE 2—SUMMARY OF SIGNIFICANT ACCOUNTING POLICIES
Basis of Presentation
Our Consolidated Financial Statements have been prepared in accordance with
GAAP
. The Consolidated Financial Statements include the accounts of Cheniere, its majority owned subsidiaries and entities in which it holds a controlling interest, including the accounts of Cheniere Partners and its wholly owned subsidiaries. All significant intercompany accounts and transactions have been eliminated in consolidation. Investments in non-controlled entities, over which Cheniere has the ability to exercise significant influence over operating and financial policies, are accounted for using the equity method. In applying the equity method of accounting, the investments are initially recognized at cost, and subsequently adjusted for our proportionate share of earnings, losses and distributions. Investments in non-controlled entities, over which Cheniere does not have the ability to
68
CHENIERE ENERGY, INC. AND SUBSIDIARIES
NOTES TO CONSOLIDATED FINANCIAL STATEMENTS—CONTINUED
exercise significant influence, are accounted for using the cost method. Under the cost method the investments are initially recognized at cost and dividends received from the accumulated earnings of an investee are recorded as income. Dividends received in excess of the accumulated earnings of an investee are recorded as a reduction in the investment. We periodically assess our cost method investments for indicators of impairment. An impairment is recorded if an indicator is identified, the carrying value of our investment exceeds its fair value, and the impairment is considered to be other than temporary. Investments accounted for using the equity method and cost method are reported as a component of other assets.
We make a determination at the inception of each arrangement whether an entity in which we have made an investment or in which we have other variable interests is considered a variable interest entity (“VIE”). Generally, a VIE is an entity that does not have sufficient equity at risk to finance its activities without additional subordinated financial support from other parties, whose equity investors lack any characteristics of a controlling financial interest or which was established with non-substantive voting. We consolidate VIEs when we are deemed to be the primary beneficiary. The primary beneficiary of a VIE is the party that both: (1) has the power to make decisions that most significantly affect the economic performance of the VIE and (2) has the obligation to absorb losses or the right to receive benefits that in either case could potentially be significant to the VIE. If we are not deemed to be the primary beneficiary of a VIE, we account for the investment or other variable interests in a VIE in accordance with applicable
GAAP
.
Certain reclassifications have been made to conform prior period information to the current presentation. The reclassifications did not have a material effect on our consolidated financial position, results of operations or cash flows.
On January 1, 2018, we adopted ASU 2014-09,
Revenue from Contracts with Customers (Topic 606)
, and subsequent amendments thereto (“ASC 606”) using the full retrospective method. We have elected to adopt the new accounting standard retrospectively and have recast the accompanying Consolidated Financial Statements to reflect the adoption of ASC 606 for all periods presented. The adoption of ASC 606 did not impact our previously reported Consolidated Financial Statements in any prior period nor did it result in a cumulative effect adjustment to retained earnings.
Use of Estimates
The preparation of Consolidated Financial Statements in conformity with
GAAP
requires management to make certain estimates and assumptions that affect the amounts reported in the Consolidated Financial Statements and the accompanying notes. Management evaluates its estimates and related assumptions regularly, including those related to the recoverability of property, plant and equipment, goodwill, derivative instruments, asset retirement obligations
(“AROs”)
, income taxes including valuation allowances for deferred tax assets, share-based compensation and fair value measurements. Changes in facts and circumstances or additional information may result in revised estimates, and actual results may differ from these estimates.
Fair Value
Fair value is the price that would be received to sell an asset or paid to transfer a liability in an orderly transaction between market participants. Hierarchy Levels 1, 2 and 3 are terms for the priority of inputs to valuation approaches used to measure fair value. Hierarchy Level 1 inputs are quoted prices in active markets for identical assets or liabilities. Hierarchy Level 2 inputs are inputs other than quoted prices included within Level 1 that are directly or indirectly observable for the asset or liability. Hierarchy Level 3 inputs are inputs that are not observable in the market.
In determining fair value, we use observable market data when available, or models that incorporate observable market data. In addition to market information, we incorporate transaction-specific details that, in management’s judgment, market participants would take into account in measuring fair value. We maximize the use of observable inputs and minimize our use of unobservable inputs in arriving at fair value estimates.
Recurring fair-value measurements are performed for derivative instruments as disclosed in
Note 7—Derivative Instruments
. The carrying amount of cash and cash equivalents, restricted cash, accounts receivable and accounts payable reported on the Consolidated Balance Sheets approximates fair value. The fair value of debt is the estimated amount we would have to pay to repurchase our debt in the open market, including any premium or discount attributable to the difference between the stated interest rate and market interest rate at each balance sheet date. Debt fair values, as disclosed in
Note 12—Debt
, are based on quoted market prices for identical instruments, if available, or based on valuations of similar debt instruments using observable or unobservable inputs. Non-financial assets and liabilities initially measured at fair value include certain assets and liabilities acquired in a business combination, intangible assets, goodwill and AROs.
69
CHENIERE ENERGY, INC. AND SUBSIDIARIES
NOTES TO CONSOLIDATED FINANCIAL STATEMENTS—CONTINUED
Revenue Recognition
We recognize revenues when we transfer control of promised goods or services to our customers in an amount that reflects the consideration to which we expect to be entitled to in exchange for those goods or services. Revenues from the sale of LNG are recognized as LNG revenues, including LNG revenues generated by our integrated marketing function which are reported on a gross or net basis based on an assessment of whether it is acting as the principal or the agent in the transaction. LNG regasification capacity payments are recognized as regasification revenues. See
Note 13—Revenues from Contracts with Customers
for further discussion of revenues.
Cash and Cash Equivalents
We consider all highly liquid investments with an original maturity of three months or less to be cash equivalents.
Restricted Cash
Restricted cash consists of funds that are contractually restricted as to usage or withdrawal and have been presented separately from cash and cash equivalents on our Consolidated Balance Sheets.
Accounts and Notes Receivable
Accounts and notes receivable are reported net of allowances for doubtful accounts. Notes receivable that are not classified as trade receivables are recorded within other current assets in our Consolidated Balance Sheets. Impaired receivables are specifically identified and evaluated for expected losses. The expected loss on impaired receivables is primarily determined based on the debtor’s ability to pay and the estimated value of any collateral. We did
no
t recognize any impairment expense related to accounts and notes receivable during the
years ended December 31, 2018, 2017 and 2016
.
Inventory
LNG and natural gas inventory are recorded at the lower of weighted average cost and net realizable value. Materials and other inventory are recorded at the lower of cost and net realizable value and subsequently charged to expense when issued.
Accounting for LNG Activities
Generally, we begin capitalizing the costs of our LNG terminals once the individual project meets the following criteria: (1) regulatory approval has been received, (2) financing for the project is available and (3) management has committed to commence construction. Prior to meeting these criteria, most of the costs associated with a project are expensed as incurred. These costs primarily include professional fees associated with front-end engineering and design work, costs of securing necessary regulatory approvals and other preliminary investigation and development activities related to our LNG terminals.
Generally, costs that are capitalized prior to a project meeting the criteria otherwise necessary for capitalization include: land and lease option costs that are capitalized as property, plant and equipment and certain permits that are capitalized as other non-current assets. The costs of lease options are amortized over the life of the lease once obtained. If no land or lease is obtained, the costs are expensed.
Property, Plant and Equipment
Property, plant and equipment are recorded at cost. Expenditures for construction and commissioning activities, major renewals and betterments that extend the useful life of an asset are capitalized, while expenditures for maintenance and repairs (including those for planned major maintenance projects) to maintain property, plant and equipment in operating condition are generally expensed as incurred. We realize offsets to LNG terminal costs for sales of commissioning cargoes that were earned or loaded prior to the start of commercial operations of the respective Train during the testing phase for its construction. We depreciate our property, plant and equipment using the straight-line depreciation method. Upon retirement or other disposition of property, plant and equipment, the cost and related accumulated depreciation are removed from the account, and the resulting gains or losses are recorded in impairment expense and loss (gain) on disposal of assets.
70
CHENIERE ENERGY, INC. AND SUBSIDIARIES
NOTES TO CONSOLIDATED FINANCIAL STATEMENTS—CONTINUED
Management tests property, plant and equipment for impairment whenever events or changes in circumstances have indicated that the carrying amount of property, plant and equipment might not be recoverable. Assets are grouped at the lowest level for which there are identifiable cash flows that are largely independent of the cash flows of other groups of assets for purposes of assessing recoverability. Recoverability generally is determined by comparing the carrying value of the asset to the expected undiscounted future cash flows of the asset. If the carrying value of the asset is not recoverable, the amount of impairment loss is measured as the excess, if any, of the carrying value of the asset over its estimated fair value. We did
no
t recognize any impairment expense related to property, plant and equipment during the year ended December 31, 2018.
During the year ended December 31, 2017, we recognized
$6 million
of impairment expense related to damaged infrastructure as an effect of Hurricane Harvey and
$6 million
of impairment expense related to write down of assets used in non-core operations outside of our liquefaction activities.
During the year ended December 31, 2016, we recorded
$10 million
of impairment expense related to a corporate airplane that was written down to fair value based on market-based appraisals, which was ultimately sold by the end of the year. The impairment was recognized due to the potential disposition of the airplane in connection with the Company having initiated organizational changes and the associated operational focus for financially disciplined investment.
Interest Capitalization
We capitalize interest and other related debt costs during the construction period of our LNG terminals and related pipelines as construction-in-process. Upon commencement of operations, these costs are transferred out of construction-in-process into terminal and interconnecting pipeline facilities assets and are amortized over the estimated useful life of the asset.
Regulated Natural Gas Pipelines
The Creole Trail Pipeline and Corpus Christi Pipeline are subject to the jurisdiction of the FERC in accordance with the Natural Gas Act of 1938 and the Natural Gas Policy Act of 1978. The economic effects of regulation can result in a regulated company recording as assets those costs that have been or are expected to be approved for recovery from customers, or recording as liabilities those amounts that are expected to be required to be returned to customers, in a rate-setting process in a period different from the period in which the amounts would be recorded by an unregulated enterprise. Accordingly, we record assets and liabilities that result from the regulated rate-making process that may not be recorded under GAAP for non-regulated entities. We continually assess whether regulatory assets are probable of future recovery by considering factors such as applicable regulatory changes and recent rate orders applicable to other regulated entities. Based on this continual assessment, we believe the existing regulatory assets are probable of recovery. These regulatory assets and liabilities are primarily classified in our Consolidated Balance Sheets as other assets and other liabilities. We periodically evaluate their applicability under GAAP and consider factors such as regulatory changes and the effect of competition. If cost-based regulation ends or competition increases, we may have to reduce our asset balances to reflect a market basis less than cost and write off the associated regulatory assets and liabilities.
Items that may influence our assessment are:
|
•
|
inability to recover cost increases due to rate caps and rate case moratoriums;
|
|
•
|
inability to recover capitalized costs, including an adequate return on those costs through the rate-making process and the FERC proceedings;
|
|
•
|
excess capacity;
|
|
•
|
increased competition and discounting in the markets we serve; and
|
|
•
|
impacts of ongoing regulatory initiatives in the natural gas industry.
|
Natural gas pipeline costs include amounts capitalized as an Allowance for Funds Used During Construction (“AFUDC”). The rates used in the calculation of AFUDC are determined in accordance with guidelines established by the FERC. AFUDC represents the cost of debt and equity funds used to finance our natural gas pipeline additions during construction. AFUDC is capitalized as a part of the cost of our natural gas pipelines. Under regulatory rate practices, we generally are permitted to recover AFUDC, and a fair return thereon, through our rate base after our natural gas pipelines are placed in service.
71
CHENIERE ENERGY, INC. AND SUBSIDIARIES
NOTES TO CONSOLIDATED FINANCIAL STATEMENTS—CONTINUED
Derivative Instruments
We use derivative instruments to hedge our exposure to cash flow variability from interest rate, commodity price and foreign currency exchange
(“FX”)
rate risk. Derivative instruments are recorded at fair value and included in our Consolidated Balance Sheets as assets or liabilities depending on the derivative position and the expected timing of settlement, unless they satisfy criteria for and we elect the normal purchases and sales exception. When we have the contractual right and intend to net settle, derivative assets and liabilities are reported on a net basis.
Changes in the fair value of our derivative instruments are recorded in earnings, unless we elect to apply hedge accounting and meet specified criteria, including completing contemporaneous hedge documentation. We did
no
t have any derivative instruments designated as cash flow hedges during the
years ended December 31, 2018, 2017 and 2016
. See
Note 7—Derivative Instruments
for additional details about our derivative instruments.
Concentration of Credit Risk
Financial instruments that potentially subject us to a concentration of credit risk consist principally of cash and cash equivalents and restricted cash. We maintain cash balances at financial institutions, which may at times be in excess of federally insured levels. We have not incurred losses related to these balances to date.
The use of derivative instruments exposes us to counterparty credit risk, or the risk that a counterparty will be unable to meet its commitments. Certain of our commodity derivative transactions are executed through over-the-counter contracts which are subject to nominal credit risk as these transactions are settled on a daily margin basis with investment grade financial institutions. Collateral deposited for such contracts is recorded within other current assets. Our interest rate and FX derivative instruments are placed with investment grade financial institutions whom we believe are acceptable credit risks. We monitor counterparty creditworthiness on an ongoing basis; however, we cannot predict sudden changes in counterparties’ creditworthiness. In addition, even if such changes are not sudden, we may be limited in our ability to mitigate an increase in counterparty credit risk. Should one of these counterparties not perform, we may not realize the benefit of some of our derivative instruments.
SPL has entered into fixed price SPAs with terms of at least
20
years with
seven
unaffiliated third parties, CCL has entered into fixed price SPAs generally with terms of
20
years with
nine
unaffiliated third parties and our integrated marketing function has entered into a limited number of long-term SPAs with unaffiliated third parties. We are dependent on the respective customers’ creditworthiness and their willingness to perform under their respective SPAs. See
Note 20—Customer Concentration
for additional details about our customer concentration.
SPLNG has entered into
two
long-term TUAs with unaffiliated third parties for regasification capacity at the Sabine Pass LNG terminal. SPLNG is dependent on the respective customers’ creditworthiness and their willingness to perform under their respective TUAs. SPLNG has mitigated this credit risk by securing TUAs for a significant portion of its regasification capacity with creditworthy third-party customers with a minimum Standard & Poor’s rating of A.
Goodwill
Goodwill is the excess of acquisition cost of a business over the estimated fair value of net assets acquired. Goodwill is not amortized but is tested for impairment at least annually or more frequently if events or circumstances indicate goodwill is more likely than not impaired. Goodwill impairment evaluation requires a comparison of the estimated fair value of a reporting unit to its carrying value. Cheniere tests goodwill for impairment by either performing a qualitative assessment or a quantitative test. The qualitative assessment is an assessment of historical information and relevant events and circumstances to determine whether it is more likely than not that the fair value of a reporting unit is less than its carrying amount, including goodwill. Cheniere may elect not to perform the qualitative assessment and instead perform a quantitative impairment test. Significant judgment is required in estimating the fair value of the reporting unit and performing goodwill impairment tests.
As a result of finalization of organizational changes to simplify our corporate structure, improve our operational efficiencies and implement a strategy for sustainable, long-term stockholder value creation through financially disciplined development, construction, operation and investment, we revised the way we manage our business, which resulted in a change in our reporting units. Accordingly, Cheniere reallocated goodwill to our single reporting unit following finalization of organizational changes. We performed our annual goodwill impairment test on October 1st using a quantitative assessment and concluded that the estimated fair value of our reporting unit substantially exceeded its carrying value and, therefore, goodwill was not impaired. Judgments and assumptions are inherent in our estimate of future cash flows used to determine the estimate of the reporting unit’s fair value.
72
CHENIERE ENERGY, INC. AND SUBSIDIARIES
NOTES TO CONSOLIDATED FINANCIAL STATEMENTS—CONTINUED
The use of alternate judgments and/or assumptions could result in the recognition of impairment charges in the Consolidated Financial Statements. A lower fair value estimate in the future for our reporting unit could result in an impairment of goodwill. Factors that could trigger a lower fair value estimate include significant negative industry or economic trends, cost increases, disruptions to our business, regulatory or political environment changes or other unanticipated events. There were
no
changes in the carrying value of goodwill during the year ended
December 31, 2018
.
Debt
Our debt consists of current and long-term secured debt securities, convertible debt securities and credit facilities with banks and other lenders. Debt issuances are placed directly by us or through securities dealers or underwriters and are held by institutional and retail investors.
Debt is recorded on our Consolidated Balance Sheets at par value adjusted for unamortized discount or premium and net of unamortized debt issuance costs related to term notes. Discounts, premiums and debt issuance costs directly related to the issuance of debt are amortized over the life of the debt and are recorded in interest expense, net of capitalized interest using the effective interest method. Gains and losses on the extinguishment of debt are recorded in gain (loss) on modification or extinguishment of debt on our Consolidated Statements of Operations.
Debt issuance costs consist primarily of arrangement fees, professional fees, legal fees and printing costs. These costs are recorded as a direct deduction from the debt liability unless incurred in connection with a line of credit arrangement, in which case they are presented as an asset on our Consolidated Balance Sheets. Debt issuance costs are amortized to interest expense or property, plant and equipment over the term of the related debt facility. Upon early retirement of debt or amendment to a debt agreement, certain fees are written off to loss on modification or extinguishment of debt.
Asset Retirement Obligations
We recognize AROs for legal obligations associated with the retirement of long-lived assets that result from the acquisition, construction, development and/or normal use of the asset and for conditional AROs in which the timing or method of settlement are conditional on a future event that may or may not be within our control. The fair value of a liability for an ARO is recognized in the period in which it is incurred, if a reasonable estimate of fair value can be made. The fair value of the liability is added to the carrying amount of the associated asset. This additional carrying amount is depreciated over the estimated useful life of the asset.
We have
no
t recorded an ARO associated with the Sabine Pass LNG terminal. Based on the real property lease agreements at the Sabine Pass LNG terminal, at the expiration of the term of the leases we are required to surrender the LNG terminal in good working order and repair, with normal wear and tear and casualty expected. Our property lease agreements at the Sabine Pass LNG terminal have terms of up to
90 years
including renewal options. We have determined that the cost to surrender the Sabine Pass LNG terminal in good order and repair, with normal wear and tear and casualty expected, is immaterial.
We have
no
t recorded an ARO associated with the Creole Trail Pipeline or the Corpus Christi Pipeline. We believe that it is not feasible to predict when the natural gas transportation services provided by the Creole Trail Pipeline or the Corpus Christi Pipeline will no longer be utilized. In addition, our right-of-way agreements associated with the Creole Trail Pipeline and the Corpus Christi Pipeline have no stipulated termination dates. We intend to operate the Creole Trail Pipeline and the Corpus Christi Pipeline as long as supply and demand for natural gas exists in the United States and intend to maintain it regularly.
Share-based Compensation
We have awarded share-based compensation in the form of stock, restricted stock, restricted stock units, performance stock units and phantom units that are more fully described in
Note 15—Share-based Compensation
. We recognize share-based compensation based upon the estimated fair value of awards. The recognition period for these costs begins at either the applicable service inception date or grant date and continues throughout the requisite service period. For equity-classified share-based compensation awards (which include stock, restricted stock, restricted stock units and performance stock units to employees and non-employee directors), compensation cost is recognized based on the grant-date fair value reduced by the present value of dividends expected to be paid on the underlying shares during the requisite service period, discounted at the appropriate risk-free interest rate and not subsequently remeasured. The fair value is recognized as expense (net of any capitalization) using the straight-line basis for awards that vest based solely on service conditions and using the accelerated recognition method for awards that
73
CHENIERE ENERGY, INC. AND SUBSIDIARIES
NOTES TO CONSOLIDATED FINANCIAL STATEMENTS—CONTINUED
vest based on performance conditions. For awards with both time and performance-based conditions, we generally recognize compensation cost based on the probable outcome of the performance condition at each reporting period. For liability-classified share-based compensation awards (which include phantom units), compensation cost is initially recognized on the grant date using estimated payout levels, and subsequently adjusted quarterly to reflect the updated estimated payout levels based on the changes in the our stock price. We account for forfeitures as they occur.
Non-controlling Interests
When we consolidate a subsidiary, we include 100% of the assets, liabilities, revenues and expenses of the subsidiary in our Consolidated Financial Statements, even if we own less than 100% of the subsidiary. Non-controlling interests represent third-party ownership in the net assets of our consolidated subsidiaries and are presented as a component of equity. Changes in our ownership interests in subsidiaries that do not result in deconsolidation are generally recognized within equity. See
Note 9—Non-controlling Interest
for additional details about our non-controlling interest.
Income Taxes
Provisions for income taxes are based on taxes payable or refundable for the current year and deferred taxes on temporary differences between the tax basis of assets and liabilities and their reported amounts in the Consolidated Financial Statements. Deferred tax assets and liabilities are included in the Consolidated Financial Statements at currently enacted income tax rates applicable to the period in which the deferred tax assets and liabilities are expected to be realized or settled. As changes in tax laws or rates are enacted, deferred tax assets and liabilities are adjusted through the current period’s provision for income taxes. A valuation allowance is recorded to reduce the carrying value of our deferred tax assets when it is more likely than not that a portion or all of the deferred tax assets will expire before realization of the benefit or future deductibility is not probable.
We recognize the tax benefit from an uncertain tax position only if it is more likely than not that the tax position will be sustained on examination by the taxing authorities, based on the technical merits of the tax position.
Net Income (Loss) Per Share
Net income (loss) per share
(“EPS”)
is computed in accordance with GAAP. Basic
EPS
excludes dilution and is computed by dividing net income (loss) by the weighted average number of common shares outstanding during the period. Diluted
EPS
reflects potential dilution and is computed by dividing net income (loss) by the weighted average number of common shares outstanding during the period increased by the number of additional common shares that would have been outstanding if the potential common shares had been issued and were dilutive. The dilutive effect of unvested stock is calculated using the treasury-stock method and the dilutive effect of convertible securities is calculated using the if-converted method.
Business Segment
We have determined that we operate as a single operating and reportable segment. Our chief operating decision maker makes resource allocation decisions and assesses performance based on financial information presented on a consolidated basis in the delivery of an integrated source of LNG to our customers.
74
CHENIERE ENERGY, INC. AND SUBSIDIARIES
NOTES TO CONSOLIDATED FINANCIAL STATEMENTS—CONTINUED
NOTE 3—RESTRICTED CASH
Restricted cash consists of funds that are contractually restricted as to usage or withdrawal and have been presented separately from cash and cash equivalents on our Consolidated Balance Sheets. As of
December 31, 2018
and
2017
, restricted cash consisted of the following (in millions):
|
December 31,
|
||||||||
|
2018
|
2017
|
|||||||
|
Current restricted cash
|
||||||||
|
SPL Project
|
$
|
756
|
|
$
|
544
|
|
||
|
Cheniere Partners and cash held by guarantor subsidiaries
|
785
|
|
1,045
|
|
||||
|
CCL Project
|
289
|
|
227
|
|
||||
|
Cash held by our subsidiaries restricted to Cheniere
|
345
|
|
64
|
|
||||
|
Total current restricted cash
|
$
|
2,175
|
|
$
|
1,880
|
|
||
|
Non-current restricted cash
|
||||||||
|
Other
|
$
|
—
|
|
$
|
11
|
|
||
Pursuant to the accounts agreements entered into with the collateral trustees for the benefit of SPL’s debt holders and CCH’s debt holders, SPL and CCH are required to deposit all cash received into reserve accounts controlled by the collateral trustees. The usage or withdrawal of such cash is restricted to the payment of liabilities related to the
SPL Project
and the CCL Project and other restricted payments.
Under Cheniere Partners’ credit facilities
(the “CQP Credit Facilities”)
, Cheniere Partners and each of its subsidiaries other than SPL, as guarantor subsidiaries, are subject to limitations on the use of cash under the terms of the
CQP Credit Facilities
and the related depositary agreement governing the extension of credit to Cheniere Partners. Specifically, Cheniere Partners may only withdraw funds from collateral accounts held at a designated depositary bank on a limited basis and for specific purposes, including for the payment of operating expenses of Cheniere Partners and its guarantor subsidiaries. In addition, distributions and capital expenditures may only be made quarterly and are subject to certain restrictions.
NOTE 4—ACCOUNTS AND OTHER RECEIVABLES
As of
December 31, 2018
and
2017
, accounts and other receivables consisted of the following (in millions):
|
|
December 31,
|
|||||||
|
|
2018
|
2017
|
||||||
|
Trade receivables
|
||||||||
|
SPL
|
$
|
330
|
|
$
|
185
|
|
||
|
Cheniere Marketing
|
205
|
|
163
|
|
||||
|
Other accounts receivable
|
46
|
|
21
|
|
||||
|
Total accounts and other receivables
|
$
|
581
|
|
$
|
369
|
|
||
NOTE 5—INVENTORY
As of
December 31, 2018
and
2017
, inventory consisted of the following (in millions):
|
|
December 31,
|
|||||||
|
|
2018
|
2017
|
||||||
|
Natural gas
|
$
|
30
|
|
$
|
17
|
|
||
|
LNG
|
24
|
|
44
|
|
||||
|
LNG in-transit
|
173
|
|
130
|
|
||||
|
Materials and other
|
89
|
|
52
|
|
||||
|
Total inventory
|
$
|
316
|
|
$
|
243
|
|
||
75
CHENIERE ENERGY, INC. AND SUBSIDIARIES
NOTES TO CONSOLIDATED FINANCIAL STATEMENTS—CONTINUED
NOTE 6—PROPERTY, PLANT AND EQUIPMENT
As of
December 31, 2018
and
2017
, property, plant and equipment, net consisted of the following (in millions):
|
|
December 31,
|
|||||||
|
|
2018
|
2017
|
||||||
|
LNG terminal costs
|
|
|
||||||
|
LNG terminal and interconnecting pipeline facilities
|
$
|
13,386
|
|
$
|
12,687
|
|
||
|
LNG site and related costs
|
86
|
|
86
|
|
||||
|
LNG terminal construction-in-process
|
14,864
|
|
11,932
|
|
||||
|
Accumulated depreciation
|
(1,299
|
)
|
(882
|
)
|
||||
|
Total LNG terminal costs, net
|
27,037
|
|
23,823
|
|
||||
|
Fixed assets and other
|
|
|
|
|
||||
|
Computer and office equipment
|
17
|
|
14
|
|
||||
|
Furniture and fixtures
|
22
|
|
19
|
|
||||
|
Computer software
|
100
|
|
92
|
|
||||
|
Leasehold improvements
|
41
|
|
41
|
|
||||
|
Land
|
59
|
|
59
|
|
||||
|
Other
|
21
|
|
16
|
|
||||
|
Accumulated depreciation
|
(111
|
)
|
(86
|
)
|
||||
|
Total fixed assets and other, net
|
149
|
|
155
|
|
||||
|
Assets under capital lease
|
||||||||
|
Tug vessels
|
60
|
|
—
|
|
||||
|
Accumulated depreciation
|
(1
|
)
|
—
|
|
||||
|
Total assets under capital lease, net
|
59
|
|
—
|
|
||||
|
Property, plant and equipment, net
|
$
|
27,245
|
|
$
|
23,978
|
|
||
Depreciation expense was
$445 million
,
$354 million
and
$173 million
during the
years ended December 31, 2018, 2017 and 2016
, respectively.
We realize offsets to LNG terminal costs for sales of commissioning cargoes that were earned or loaded prior to the start of commercial operations of the respective Train during the testing phase for its construction. We realized offsets to LNG terminal costs of
$140 million
,
$320 million
and
$214 million
in the
years ended December 31, 2018, 2017 and 2016
, respectively, for sales of commissioning cargoes from the
SPL Project
and the
CCL Project
.
LNG Terminal Costs
Our LNG terminals are depreciated using the straight-line depreciation method applied to groups of LNG terminal assets with varying useful lives. The identifiable components of our LNG terminals with similar estimated useful lives have a depreciable range between
6
and
50
years, as follows:
|
Components
|
Useful life (yrs)
|
|
|
LNG storage tanks
|
50
|
|
|
Natural gas pipeline facilities
|
40
|
|
|
Marine berth, electrical, facility and roads
|
35
|
|
|
Water pipelines
|
30
|
|
|
Regasification processing equipment
|
30
|
|
|
Sendout pumps
|
20
|
|
|
Liquefaction processing equipment
|
6-50
|
|
|
Other
|
15-30
|
|
Fixed Assets and Other
Our fixed assets and other are recorded at cost and are depreciated on a straight-line method based on estimated lives of the individual assets or groups of assets.
76
CHENIERE ENERGY, INC. AND SUBSIDIARIES
NOTES TO CONSOLIDATED FINANCIAL STATEMENTS—CONTINUED
NOTE 7—DERIVATIVE INSTRUMENTS
We have entered into the following derivative instruments that are reported at fair value:
|
•
|
interest rate swaps to hedge the exposure to volatility in a portion of the floating-rate interest payments under certain credit facilities
(“Interest Rate Derivatives”)
;
|
|
•
|
commodity derivatives consisting of natural gas supply contracts for the commissioning and operation of the
SPL Project
and the
CCL Project
(“Physical Liquefaction Supply Derivatives”)
and associated economic hedges
(“Financial Liquefaction Supply Derivatives,” and collectively with the Physical Liquefaction Supply Derivatives, the “Liquefaction Supply Derivatives”)
;
|
|
•
|
financial derivatives to hedge the exposure to the commodity markets in which we have contractual arrangements to purchase or sell physical LNG
(“LNG Trading Derivatives”)
; and
|
|
•
|
FX contracts to hedge exposure to currency risk associated with both LNG Trading Derivatives and operations in countries outside of the United States
(“FX Derivatives”)
.
|
We recognize our derivative instruments as either assets or liabilities and measure those instruments at fair value. None of our derivative instruments are designated as cash flow hedging instruments, and changes in fair value are recorded within our Consolidated
Statements of Operations
to the extent not utilized for the commissioning process.
The following table shows the fair value of our derivative instruments that are required to be measured at fair value on a recurring basis as of
December 31, 2018
and
2017
, which are classified as
derivative assets
,
non-current derivative assets
,
derivative liabilities
or
non-current derivative liabilities
in our Consolidated Balance Sheets (in millions).
|
Fair Value Measurements as of
|
|||||||||||||||||||||||||||||||
|
December 31, 2018
|
December 31, 2017
|
||||||||||||||||||||||||||||||
|
Quoted Prices in Active Markets
(Level 1) |
Significant Other Observable Inputs
(Level 2) |
Significant Unobservable Inputs
(Level 3) |
Total
|
Quoted Prices in Active Markets
(Level 1) |
Significant Other Observable Inputs
(Level 2) |
Significant Unobservable Inputs
(Level 3) |
Total
|
||||||||||||||||||||||||
|
CCH Interest Rate Derivatives asset (liability)
|
$
|
—
|
|
$
|
18
|
|
$
|
—
|
|
$
|
18
|
|
$
|
—
|
|
$
|
(32
|
)
|
$
|
—
|
|
$
|
(32
|
)
|
|||||||
|
CQP Interest Rate Derivatives asset
|
—
|
|
—
|
|
—
|
|
—
|
|
—
|
|
21
|
|
—
|
|
21
|
|
|||||||||||||||
|
Liquefaction Supply Derivatives asset (liability)
|
6
|
|
(19
|
)
|
(29
|
)
|
(42
|
)
|
2
|
|
10
|
|
43
|
|
55
|
|
|||||||||||||||
|
LNG Trading Derivatives asset (liability)
|
1
|
|
(25
|
)
|
—
|
|
(24
|
)
|
(13
|
)
|
5
|
|
—
|
|
(8
|
)
|
|||||||||||||||
|
FX Derivatives asset (liability)
|
—
|
|
15
|
|
—
|
|
15
|
|
—
|
|
(1
|
)
|
—
|
|
(1
|
)
|
|||||||||||||||
We value our
Interest Rate Derivatives
using an income-based approach utilizing observable inputs to the valuation model including interest rate curves, risk adjusted discount rates, credit spreads and other relevant data. We value our
LNG Trading Derivatives
and our Liquefaction Supply Derivatives using a market based approach incorporating present value techniques, as needed, using observable commodity price curves, when available, and other relevant data. We value our
FX Derivatives
with a market approach using observable FX rates and other relevant data.
The fair value of our
Physical Liquefaction Supply Derivatives
is predominantly driven by market commodity basis prices and, as applicable to our natural gas supply contracts, our assessment of the associated conditions precedent, including evaluating whether the respective market is available as pipeline infrastructure is developed. Upon the satisfaction of conditions precedent, including completion and placement into service of relevant pipeline infrastructure to accommodate marketable physical gas flow, we recognize a gain or loss based on the fair value of the respective natural gas supply contracts.
We include a portion of our Physical Liquefaction Supply Derivatives as Level 3 within the valuation hierarchy as the fair value is developed through the use of internal models which may be impacted by inputs that are unobservable in the marketplace. The curves used to generate the fair value of our
Physical Liquefaction Supply Derivatives
are based on basis adjustments applied to forward curves for a liquid trading point. In addition, there may be observable liquid market basis information in the near term,
77
CHENIERE ENERGY, INC. AND SUBSIDIARIES
NOTES TO CONSOLIDATED FINANCIAL STATEMENTS—CONTINUED
but terms of a
Physical Liquefaction Supply Derivatives
contract may exceed the period for which such information is available, resulting in a Level 3 classification. In these instances, the fair value of the contract incorporates extrapolation assumptions made in the determination of the market basis price for future delivery periods in which applicable commodity basis prices were either not observable or lacked corroborative market data. As of
December 31, 2018
and
2017
, some of our
Physical Liquefaction Supply Derivatives
existed within markets for which the pipeline infrastructure is under development to accommodate marketable physical gas flow.
The Level 3 fair value measurements of natural gas positions within our
Physical Liquefaction Supply Derivatives
could be materially impacted by a significant change in certain natural gas market basis spreads due to the contractual notional amount represented by our Level 3 positions, which is a substantial portion of our overall
Physical Liquefaction Supply Derivatives
portfolio. The following table includes quantitative information for the unobservable inputs for our Level 3
Physical Liquefaction Supply Derivatives
as of
December 31, 2018
:
|
Net Fair Value Liability
(in millions)
|
Valuation Approach
|
Significant Unobservable Input
|
Significant Unobservable Inputs Range
|
|||||
|
Physical Liquefaction Supply Derivatives
|
$(29)
|
Market approach incorporating present value techniques
|
Basis Spread
|
$(0.980) - $0.085
|
||||
The following table shows the changes in the fair value of our Level 3
Physical Liquefaction Supply Derivatives
during the
years ended December 31, 2018, 2017 and 2016
(in millions):
|
Year Ended December 31,
|
||||||||||||
|
2018
|
2017
|
2016
|
||||||||||
|
Balance, beginning of period
|
$
|
43
|
|
$
|
79
|
|
$
|
32
|
|
|||
|
Realized and mark-to-market gains (losses):
|
||||||||||||
|
Included in cost of sales (1)
|
(13
|
)
|
(37
|
)
|
48
|
|
||||||
|
Purchases and settlements:
|
||||||||||||
|
Purchases
|
(31
|
)
|
14
|
|
1
|
|
||||||
|
Settlements (1)
|
(29
|
)
|
(12
|
)
|
(2
|
)
|
||||||
|
Transfers out of Level 3 (2)
|
1
|
|
(1
|
)
|
—
|
|
||||||
|
Balance, end of period
|
$
|
(29
|
)
|
$
|
43
|
|
$
|
79
|
|
|||
|
Change in unrealized gains (losses) relating to instruments still held at end of period
|
$
|
(13
|
)
|
$
|
(37
|
)
|
$
|
49
|
|
|||
|
(1)
|
Does not include the decrease in fair value of
$1 million
related to the realized gains capitalized during the year ended December 31, 2016.
|
|
(2)
|
Transferred to Level 2 as a result of observable market for the underlying natural gas purchase agreements.
|
Derivative assets and liabilities arising from our derivative contracts with the same counterparty are reported on a net basis, as all counterparty derivative contracts provide for net settlement. The use of derivative instruments exposes us to counterparty credit risk, or the risk that a counterparty will be unable to meet its commitments in instances when our derivative instruments are in an asset position. Additionally, we evaluate our own ability to meet our commitments in instances where our derivative instruments are in a liability position. Our derivative instruments are subject to contractual provisions which provide for the unconditional right of set-off for all derivative assets and liabilities with a given counterparty in the event of default.
Interest Rate Derivatives
CCH has entered into interest rate swaps
(“CCH Interest Rate Derivatives”)
to hedge a portion of the variable interest payments on its credit facility
(the “CCH Credit Facility”)
. In June 2018, CCH settled a portion of the
CCH Interest Rate Derivatives
and received proceeds of
$5 million
upon the termination of interest rate swaps associated with the amendment of the
CCH Credit Facility
, as discussed in
Note 12—Debt
. In May 2017, CCH settled a portion of the
CCH Interest Rate Derivatives
and paid
$13 million
in conjunction with the termination of approximately
$1.4 billion
of commitments under the
CCH Credit Facility
.
78
CHENIERE ENERGY, INC. AND SUBSIDIARIES
NOTES TO CONSOLIDATED FINANCIAL STATEMENTS—CONTINUED
Cheniere Partners previously had interest rate swaps
(“CQP Interest Rate Derivatives”)
to hedge a portion of the variable interest payments on its
CQP Credit Facilities
, based on a portion of the expected outstanding borrowings over the term of the
CQP Credit Facilities
. In September 2018, Cheniere Partners terminated approximately
$1.2 billion
of commitments under the
CQP Credit Facilities
, as discussed in
Note 12—Debt
. In October 2018, Cheniere Partners terminated the
CQP Interest Rate Derivatives
related to the
CQP Credit Facilities
, which resulted in proceeds of
$28 million
.
SPL previously had interest rate swaps (“SPL Interest Rate Derivatives”) to protect against volatility of future cash flows and hedge a portion of the variable interest payments on the credit facilities it entered into in June 2015 (the “SPL Credit Facilities”), based on a portion of the expected outstanding borrowings over the term of the SPL Credit Facilities. In March 2017, SPL settled the SPL Interest Rate Derivatives and paid
$7 million
in conjunction with the termination of approximately
$1.6 billion
of commitments under the
SPL Credit Facilities
.
As of
December 31, 2018
, we had the following Interest Rate Derivatives outstanding:
|
Initial Notional Amount
|
Maximum Notional Amount
|
Effective Date
|
Maturity Date
|
Weighted Average Fixed Interest Rate Paid
|
Variable Interest Rate Received
|
|||||||
|
CCH Interest Rate Derivatives
|
$29 million
|
$4.7 billion
|
May 20, 2015
|
May 31, 2022
|
2.30%
|
One-month LIBOR
|
||||||
The following table shows the fair value and location of our Interest Rate Derivatives on our Consolidated Balance Sheets (in millions):
|
December 31, 2018
|
December 31, 2017
|
|||||||||||||||||||||||
|
CCH Interest Rate Derivatives
|
CQP Interest Rate Derivatives
|
Total
|
CCH Interest Rate Derivatives
|
CQP Interest Rate Derivatives
|
Total
|
|||||||||||||||||||
|
Consolidated Balance Sheet Location
|
||||||||||||||||||||||||
|
Derivative assets
|
$
|
10
|
|
$
|
—
|
|
$
|
10
|
|
$
|
—
|
|
$
|
7
|
|
$
|
7
|
|
||||||
|
Non-current derivative assets
|
8
|
|
—
|
|
8
|
|
3
|
|
14
|
|
17
|
|
||||||||||||
|
Total derivative assets
|
18
|
|
—
|
|
18
|
|
3
|
|
21
|
|
24
|
|
||||||||||||
|
Derivative liabilities
|
—
|
|
—
|
|
—
|
|
(20
|
)
|
—
|
|
(20
|
)
|
||||||||||||
|
Non-current derivative liabilities
|
—
|
|
—
|
|
—
|
|
(15
|
)
|
—
|
|
(15
|
)
|
||||||||||||
|
Total derivative liabilities
|
—
|
|
—
|
|
—
|
|
(35
|
)
|
—
|
|
(35
|
)
|
||||||||||||
|
Derivative asset (liability), net
|
$
|
18
|
|
$
|
—
|
|
$
|
18
|
|
$
|
(32
|
)
|
$
|
21
|
|
$
|
(11
|
)
|
||||||
The following table shows the changes in the fair value and settlements of our
Interest Rate Derivatives
recorded in
derivative gain (loss), net
on our Consolidated
Statements of Operations
during the
years ended December 31, 2018, 2017 and 2016
(in millions):
|
Year Ended December 31,
|
||||||||||||
|
2018
|
2017
|
2016
|
||||||||||
|
CCH Interest Rate Derivatives gain (loss)
|
$
|
43
|
|
$
|
3
|
|
$
|
(16
|
)
|
|||
|
CQP Interest Rate Derivatives gain
|
14
|
|
6
|
|
12
|
|
||||||
|
SPL Interest Rate Derivatives loss
|
—
|
|
(2
|
)
|
(6
|
)
|
||||||
Commodity Derivatives
Liquefaction Supply Derivatives
SPL and CCL have entered into primarily index-based physical natural gas supply contracts and associated economic hedges to purchase natural gas for the commissioning and operation of the SPL Project and the CCL Project. The terms of the physical natural gas supply contracts range up to
eight
years, some of which commence upon the satisfaction of certain conditions precedent.
79
CHENIERE ENERGY, INC. AND SUBSIDIARIES
NOTES TO CONSOLIDATED FINANCIAL STATEMENTS—CONTINUED
Our Financial Liquefaction Supply Derivatives are executed through over-the-counter contracts which are subject to nominal credit risk as these transactions are settled on a daily margin basis with investment grade financial institutions. We are required by these financial institutions to use margin deposits as credit support for our Financial Liquefaction Supply Derivatives activities.
LNG Trading Derivatives
We have entered into, and may from time to time enter into, financial LNG Trading Derivatives in the form of swaps, forwards, options or futures to economically hedge exposure to the commodity markets in which we have contractual arrangements to purchase or sell physical LNG. We have entered into LNG Trading Derivatives to secure a fixed price position to minimize future cash flow variability associated with LNG purchase and sale transactions.
The following table shows the fair value and location of our
Liquefaction Supply Derivatives
and
LNG Trading Derivatives
(collectively, “Commodity Derivatives”)
on our Consolidated Balance Sheets (in millions, except notional amount):
|
December 31, 2018
|
December 31, 2017
|
||||||||||||||||||||||
|
Liquefaction Supply Derivatives (1)
|
LNG Trading Derivatives (2)
|
Total
|
Liquefaction Supply Derivatives (1)
|
LNG Trading Derivatives (2)
|
Total
|
||||||||||||||||||
|
Consolidated Balance Sheet Location
|
|||||||||||||||||||||||
|
Derivative assets
|
$
|
13
|
|
$
|
24
|
|
$
|
37
|
|
$
|
41
|
|
$
|
9
|
|
$
|
50
|
|
|||||
|
Non-current derivative assets
|
46
|
|
—
|
|
46
|
|
17
|
|
—
|
|
17
|
|
|||||||||||
|
Total derivative assets
|
59
|
|
24
|
|
83
|
|
58
|
|
9
|
|
67
|
|
|||||||||||
|
Derivative liabilities
|
(79
|
)
|
(48
|
)
|
(127
|
)
|
—
|
|
(17
|
)
|
(17
|
)
|
|||||||||||
|
Non-current derivative liabilities
|
(22
|
)
|
—
|
|
(22
|
)
|
(3
|
)
|
—
|
|
(3
|
)
|
|||||||||||
|
Total derivative liabilities
|
(101
|
)
|
(48
|
)
|
(149
|
)
|
(3
|
)
|
(17
|
)
|
(20
|
)
|
|||||||||||
|
Derivative asset (liability), net
|
$
|
(42
|
)
|
$
|
(24
|
)
|
$
|
(66
|
)
|
$
|
55
|
|
$
|
(8
|
)
|
$
|
47
|
|
|||||
|
Notional amount, net (in TBtu) (3)
|
5,832
|
|
12
|
|
2,539
|
|
25
|
|
|||||||||||||||
|
(1)
|
Does not include collateral calls of
$5 million
and
$1 million
for such contracts, which are included in
other current assets
in our Consolidated Balance Sheets as of
December 31, 2018
and
2017
, respectively.
|
|
(2)
|
Does not include collateral of
$9 million
and
$28 million
deposited for such contracts, which are included in
other current assets
in our Consolidated Balance Sheets as of
December 31, 2018
and
2017
, respectively.
|
|
(3)
|
SPL had secured up to approximately
3,464
TBtu and
2,214
TBtu and CCL had secured up to approximately
2,801
TBtu and
2,024
TBtu of natural gas feedstock through natural gas supply contracts as of
December 31, 2018
and
2017
, respectively.
|
The following table shows the changes in the fair value, settlements and location of our
Commodity Derivatives
recorded on our Consolidated
Statements of Operations
during the
years ended December 31, 2018, 2017 and 2016
(in millions):
|
Consolidated Statements of Operations Location (1)
|
Year Ended December 31,
|
||||||||||||
|
2018
|
2017
|
2016
|
|||||||||||
|
LNG Trading Derivatives loss
|
LNG revenues
|
$
|
(25
|
)
|
$
|
(44
|
)
|
$
|
(4
|
)
|
|||
|
Liquefaction Supply Derivatives loss (2)
|
LNG revenues
|
(1
|
)
|
—
|
|
—
|
|
||||||
|
Liquefaction Supply Derivatives gain (loss) (2)
|
Cost of sales
|
(100
|
)
|
(24
|
)
|
42
|
|
||||||
|
(1)
|
Fair value fluctuations associated with commodity derivative activities are classified and presented consistently with the item economically hedged and the nature and intent of the derivative instrument.
|
|
(2)
|
Does not include the realized value associated with derivative instruments that settle through physical delivery.
|
80
CHENIERE ENERGY, INC. AND SUBSIDIARIES
NOTES TO CONSOLIDATED FINANCIAL STATEMENTS—CONTINUED
FX Derivatives
Cheniere Marketing has entered into
FX Derivatives
to protect against the volatility in future cash flows attributable to changes in international currency exchange rates. The
FX Derivatives
economically hedge the foreign currency exposure arising from cash flows expended for both physical and financial LNG transactions and selling, general and administrative expenses related to operations in countries outside of the United States.
The following table shows the fair value and location of our
FX Derivatives
on our Consolidated Balance Sheets (in millions):
|
Fair Value Measurements as of
|
|||||||||
|
Consolidated Balance Sheet Location
|
December 31, 2018
|
December 31, 2017
|
|||||||
|
FX Derivatives
|
Derivative assets
|
$
|
16
|
|
$
|
—
|
|
||
|
FX Derivatives
|
Derivative liabilities
|
(1
|
)
|
—
|
|
||||
|
FX Derivatives
|
Non-current derivative liabilities
|
—
|
|
(1
|
)
|
||||
The total notional amount of our
FX Derivatives
was
$379 million
and
$27 million
as of
December 31, 2018
and
2017
, respectively.
The following table shows the changes in the fair value of our
FX Derivatives
recorded on our Consolidated
Statements of Operations
during the
years ended December 31, 2018, 2017 and 2016
(in millions):
|
Year Ended December 31,
|
|||||||||||||
|
Statement of Operations Location
|
2018
|
2017
|
2016
|
||||||||||
|
FX Derivatives gain (loss)
|
LNG revenues
|
$
|
18
|
|
$
|
(1
|
)
|
$
|
—
|
|
|||
|
FX Derivatives loss
|
Other income
|
—
|
|
—
|
|
(1
|
)
|
||||||
Consolidated Balance Sheet Presentation
Our derivative instruments are presented on a net basis on our Consolidated Balance Sheets as described above. The following table shows the fair value of our derivatives outstanding on a gross and net basis (in millions):
|
Gross Amounts Recognized
|
Gross Amounts Offset in the Consolidated Balance Sheets
|
Net Amounts Presented in the Consolidated Balance Sheets
|
||||||||||
|
Offsetting Derivative Assets (Liabilities)
|
||||||||||||
|
As of December 31, 2018
|
||||||||||||
|
CCH Interest Rate Derivatives
|
$
|
19
|
|
$
|
(1
|
)
|
$
|
18
|
|
|||
|
Liquefaction Supply Derivatives
|
95
|
|
(36
|
)
|
59
|
|
||||||
|
Liquefaction Supply Derivatives
|
(121
|
)
|
20
|
|
(101
|
)
|
||||||
|
LNG Trading Derivatives
|
112
|
|
(88
|
)
|
24
|
|
||||||
|
LNG Trading Derivatives
|
(92
|
)
|
44
|
|
(48
|
)
|
||||||
|
FX Derivatives
|
30
|
|
(14
|
)
|
16
|
|
||||||
|
FX Derivatives
|
(2
|
)
|
1
|
|
(1
|
)
|
||||||
|
As of December 31, 2017
|
|
|
||||||||||
|
CCH Interest Rate Derivatives
|
$
|
3
|
|
$
|
—
|
|
$
|
3
|
|
|||
|
CCH Interest Rate Derivatives
|
(35
|
)
|
—
|
|
(35
|
)
|
||||||
|
CQP Interest Rate Derivatives
|
21
|
|
—
|
|
21
|
|
||||||
|
Liquefaction Supply Derivatives
|
64
|
|
(6
|
)
|
58
|
|
||||||
|
Liquefaction Supply Derivatives
|
(3
|
)
|
—
|
|
(3
|
)
|
||||||
|
LNG Trading Derivatives
|
9
|
|
—
|
|
9
|
|
||||||
|
LNG Trading Derivatives
|
(37
|
)
|
20
|
|
(17
|
)
|
||||||
|
FX Derivatives
|
(1
|
)
|
—
|
|
(1
|
)
|
||||||
81
CHENIERE ENERGY, INC. AND SUBSIDIARIES
NOTES TO CONSOLIDATED FINANCIAL STATEMENTS—CONTINUED
NOTE 8—OTHER NON-CURRENT ASSETS
As of
December 31, 2018
and
2017
, other non-current assets, net consisted of the following (in millions):
|
|
December 31,
|
|||||||
|
|
2018
|
2017
|
||||||
|
Advances made under EPC and non-EPC contracts
|
$
|
14
|
|
$
|
26
|
|
||
|
Advances made to municipalities for water system enhancements
|
90
|
|
97
|
|
||||
|
Advances and other asset conveyances to third parties to support LNG terminals
|
54
|
|
48
|
|
||||
|
Tax-related payments and receivables
|
21
|
|
29
|
|
||||
|
Equity method investments
|
94
|
|
64
|
|
||||
|
Other
|
32
|
|
24
|
|
||||
|
Total other non-current assets, net
|
$
|
305
|
|
$
|
288
|
|
||
Equity Method Investments
Our equity method investments consist of interests in privately-held companies. In 2017, we acquired an equity interest in Midship Holdings, LLC (“Midship Holdings”), which manages the business and affairs of Midship Pipeline Company, LLC (“Midship Pipeline”). Midship Pipeline is pursuing the development, construction, operation and maintenance of an approximately
200
-mile natural gas pipeline project (the “Midship Project”) that connects new production in the Anadarko Basin to Gulf Coast markets. Midship Holdings entered into agreements with investment funds managed by EIG Global Energy Partners (“EIG”) under which EIG-managed funds committed to make an investment of up to
$500 million
(the “EIG Investment”) in the Midship Project, subject to the terms and conditions contained in the applicable agreements. The EIG Investment, when combined with equity contributed by us, is intended to ensure the Midship Project has the equity funding expected to be required to develop and construct the project. Construction of the Midship Project will commence based upon, among other things, obtaining the required authorization from the FERC and adequate financing to construct the proposed project.
We have determined that Midship Holdings is a VIE because it is thinly capitalized at formation such that the total equity investment at risk is not sufficient to permit the entity to finance its activities without additional subordinated financial support. We do not consolidate Midship Holdings because we do not have power to direct the activities that most significantly impact its economic performance. We continually monitor both consolidated and unconsolidated VIEs to determine if any events have occurred that could cause a change in our identification of a VIE or determination of the primary beneficiary to a VIE. We account for our investment in Midship Holdings under the equity method as we have the ability to exercise significant influence over the operating and financial policies of Midship Holdings through our non-controlling voting rights on its board of managers. Our investment in Midship Holdings was
$85 million
and
$55 million
at
December 31, 2018
and
2017
, respectively. Our obligations to make additional investments in Midship Holdings are not significant.
Cheniere LNG O&M Services, LLC (“O&M Services”), our wholly owned subsidiary, provides the development, construction, operation and maintenance services associated with the Midship Project pursuant to agreements in which O&M Services receives an agreed upon fee and reimbursement of costs incurred. O&M Services recorded
$12 million
and
$3 million
in the
years ended December 31, 2018 and 2017
, respectively, of revenues in other—related party and
$4 million
and
$2 million
of accounts receivable—related party as of
December 31, 2018
and
2017
, respectively, for services provided to Midship Pipeline under these agreements. CCL has entered into a transportation precedent agreement and a negotiated rate agreement with Midship Pipeline to secure firm pipeline transportation capacity for a period of
10 years
following commencement of the Midship Project. In May 2018, CCL issued a letter of credit to Midship Pipeline for drawings up to an aggregate maximum amount of
$16 million
. Midship Pipeline had
no
t made any drawings on this letter of credit as of
December 31, 2018
.
NOTE 9—NON-CONTROLLING INTEREST
As of
December 31, 2018
and
2017
, we and Cheniere Holdings, respectively, owned a
48.6%
limited partner interest in Cheniere Partners in the form of
104.5 million
common units and
135.4 million
subordinated units, with the remaining non-controlling interest held by Blackstone CQP Holdco (
“Blackstone CQP Holdco”
) and the public. As of
December 31, 2017
, we owned
82.7%
of Cheniere Holdings. Prior to the mandatory conversion of Cheniere Partners’ Class B units
(“Class B units”)
on August 2, 2017, Cheniere Holdings owned a
55.9%
limited partner interest in Cheniere Partners in the form of
12.0 million
common units,
45.3 million
Class B units and
135.4 million
subordinated units, with the remaining non-controlling interest held by
Blackstone
82
CHENIERE ENERGY, INC. AND SUBSIDIARIES
NOTES TO CONSOLIDATED FINANCIAL STATEMENTS—CONTINUED
CQP Holdco
and the public. We also own
100%
of the general partner interest and the incentive distribution rights in Cheniere Partners.
During the
year ended December 31, 2018
, we acquired
17.3%
of additional interest in Cheniere Holdings previously held by the public, and closed the merger of Cheniere Holdings with and into our wholly owned subsidiary. As a result of the merger, all of the publicly-held shares of Cheniere Holdings not owned by us were canceled and shareholders other than Cheniere received shares of our common stock in a stock-for-share exchange. Because the transactions represented a combination of ownership interests under common control, changes in Cheniere’s ownership interest in Cheniere Holdings were accounted for as an equity transaction and
no
gain or loss was recognized.
NOTE 10—VARIABLE INTEREST ENTITIES
Cheniere Partners is a limited partnership formed by us in 2006 to own and operate the Sabine Pass LNG terminal and related assets. Cheniere Partners GP, our wholly owned subsidiary, is the general partner of Cheniere Partners. In 2012, Cheniere Partners, Cheniere and
Blackstone CQP Holdco
entered into a unit purchase agreement whereby Cheniere Partners sold
100.0 million
Class B units to
Blackstone CQP Holdco
in a private placement. The board of directors of Cheniere Partners GP was modified to include
three
directors appointed by Blackstone CQP Holdco,
four
directors appointed by us and
four
independent directors mutually agreed upon by
Blackstone CQP Holdco
and us and appointed by us. In addition, we provided Blackstone CQP Holdco with a right to maintain
one
board seat on our Board of Directors
(our “Board”)
. A quorum of Cheniere Partners GP directors consists of a majority of all directors, including at least
two
directors appointed by
Blackstone CQP Holdco
,
two
directors appointed by us and
two
independent directors.
Blackstone CQP Holdco
will no longer be entitled to appoint Cheniere Partners GP directors in the event that Blackstone CQP Holdco’s ownership in Cheniere Partners is less than: (1)
20%
of outstanding common units, subordinated units and Class B units and (2)
50.0 million
Class B units.
We have determined that Cheniere Partners GP is a VIE and that we, as the holder of the equity at risk, do not have a controlling financial interest due to the rights held by Blackstone CQP Holdco. However, we continue to consolidate Cheniere Partners as a result of Blackstone CQP Holdco’s right to maintain one board seat on our Board which creates a de facto agency relationship between Blackstone CQP Holdco and us. GAAP requires that when a de facto agency relationship exists, one of the members of the de facto agency relationship must consolidate the VIE based on certain criteria. As a result, we consolidate Cheniere Partners in our Consolidated Financial Statements.
In addition, we have an equity method investment in Midship Holdings, which we have determined to be a VIE but do not consolidate in our Consolidated Financial Statements. See
Note 8—Other Non-current Assets
for further discussion of our determination of Midship Holdings as an unconsolidated VIE.
NOTE 11—ACCRUED LIABILITIES
As of
December 31, 2018
and
2017
, accrued liabilities consisted of the following (in millions):
|
|
December 31,
|
|||||||
|
|
2018
|
2017
|
||||||
|
Interest costs and related debt fees
|
$
|
233
|
|
$
|
397
|
|
||
|
Accrued natural gas purchases
|
610
|
|
298
|
|
||||
|
LNG terminals and related pipeline costs
|
125
|
|
192
|
|
||||
|
Compensation and benefits
|
117
|
|
141
|
|
||||
|
Accrued LNG inventory
|
14
|
|
1
|
|
||||
|
Other accrued liabilities
|
70
|
|
49
|
|
||||
|
Total accrued liabilities
|
$
|
1,169
|
|
$
|
1,078
|
|
||
83
CHENIERE ENERGY, INC. AND SUBSIDIARIES
NOTES TO CONSOLIDATED FINANCIAL STATEMENTS—CONTINUED
NOTE 12—DEBT
As of
December 31, 2018
and
2017
, our debt consisted of the following (in millions):
|
|
December 31,
|
|||||||
|
|
2018
|
2017
|
||||||
|
Long-term debt:
|
||||||||
|
SPL
|
|
|
||||||
|
5.625% Senior Secured Notes due 2021 (“2021 SPL Senior Notes”)
|
$
|
2,000
|
|
$
|
2,000
|
|
||
|
6.25% Senior Secured Notes due 2022 (“2022 SPL Senior Notes”)
|
1,000
|
|
1,000
|
|
||||
|
5.625% Senior Secured Notes due 2023 (“2023 SPL Senior Notes”)
|
1,500
|
|
1,500
|
|
||||
|
5.75% Senior Secured Notes due 2024 (“2024 SPL Senior Notes”)
|
2,000
|
|
2,000
|
|
||||
|
5.625% Senior Secured Notes due 2025 (“2025 SPL Senior Notes”)
|
2,000
|
|
2,000
|
|
||||
|
5.875% Senior Secured Notes due 2026 (“2026 SPL Senior Notes”)
|
1,500
|
|
1,500
|
|
||||
|
5.00% Senior Secured Notes due 2027 (“2027 SPL Senior Notes”)
|
1,500
|
|
1,500
|
|
||||
|
4.200% Senior Secured Notes due 2028 (“2028 SPL Senior Notes”)
|
1,350
|
|
1,350
|
|
||||
|
5.00% Senior Secured Notes due 2037 (“2037 SPL Senior Notes”)
|
800
|
|
800
|
|
||||
|
Cheniere Partners
|
||||||||
|
5.250% Senior Notes due 2025 (“2025 CQP Senior Notes”)
|
1,500
|
|
1,500
|
|
||||
|
5.625% Senior Notes due 2026 (“2026 CQP Senior Notes”)
|
1,100
|
|
—
|
|
||||
|
CQP Credit Facilities
|
—
|
|
1,090
|
|
||||
|
CCH
|
||||||||
|
7.000% Senior Secured Notes due 2024 (“2024 CCH Senior Notes”)
|
1,250
|
|
1,250
|
|
||||
|
5.875% Senior Secured Notes due 2025 (“2025 CCH Senior Notes”)
|
1,500
|
|
1,500
|
|
||||
|
5.125% Senior Secured Notes due 2027 (“2027 CCH Senior Notes”)
|
1,500
|
|
1,500
|
|
||||
|
CCH Credit Facility
|
5,156
|
|
2,485
|
|
||||
|
CCH HoldCo II
|
||||||||
|
11.0% Convertible Senior Secured Notes due 2025 (“2025 CCH HoldCo II Convertible Senior Notes”)
|
1,455
|
|
1,305
|
|
||||
|
Cheniere
|
||||||||
|
4.875% Convertible Unsecured Notes due 2021 (“2021 Cheniere Convertible Unsecured Notes”)
|
1,218
|
|
1,161
|
|
||||
|
4.25% Convertible Senior Notes due 2045 (“2045 Cheniere Convertible Senior Notes”)
|
625
|
|
625
|
|
||||
|
$1.25 billion Cheniere Revolving Credit Facility (“Cheniere Revolving Credit Facility”)
|
—
|
|
—
|
|
||||
|
Unamortized premium, discount and debt issuance costs, net
|
(775
|
)
|
(730
|
)
|
||||
|
Total long-term debt, net
|
28,179
|
|
25,336
|
|
||||
|
Current debt:
|
||||||||
|
$1.2 billion SPL Working Capital Facility (“SPL Working Capital Facility”)
|
—
|
|
—
|
|
||||
|
$1.2 billion CCH Working Capital Facility (“CCH Working Capital Facility”)
|
168
|
|
—
|
|
||||
|
Cheniere Marketing trade finance facilities
|
71
|
|
—
|
|
||||
|
Total current debt
|
239
|
|
—
|
|
||||
|
Total debt, net
|
$
|
28,418
|
|
$
|
25,336
|
|
||
Below is a schedule of future principal payments that we are obligated to make, based on current construction schedules, on our outstanding debt at
December 31, 2018
(in millions):
|
Years Ending December 31,
|
Principal Payments
|
|||
|
2019
|
$
|
239
|
|
|
|
2020
|
—
|
|
||
|
2021
|
3,218
|
|
||
|
2022
|
1,000
|
|
||
|
2023
|
1,500
|
|
||
|
Thereafter
|
23,236
|
|
||
|
Total
|
$
|
29,193
|
|
|
84
CHENIERE ENERGY, INC. AND SUBSIDIARIES
NOTES TO CONSOLIDATED FINANCIAL STATEMENTS—CONTINUED
Senior Notes
SPL Senior Notes
The terms of the 2021 SPL Senior Notes, 2022 SPL Senior Notes, 2023 SPL Senior Notes, 2024 SPL Senior Notes, 2025 SPL Senior Notes, 2026 SPL Senior Notes, 2027 SPL Senior Notes and 2028 SPL Senior Notes (collectively with the 2037 SPL Senior Notes, the “SPL Senior Notes”) are governed by a common indenture (the “SPL Indenture”) and the terms of the 2037 SPL Senior Notes are governed by a separate indenture (the “2037 SPL Senior Notes Indenture”). Both the SPL Indenture and the 2037 SPL Senior Notes Indenture contain customary terms and events of default and certain covenants that, among other things, limit SPL’s ability and the ability of SPL’s restricted subsidiaries to incur additional indebtedness or issue preferred stock, make certain investments or pay dividends or distributions on capital stock or subordinated indebtedness or purchase, redeem or retire capital stock, sell or transfer assets, including capital stock of SPL’s restricted subsidiaries, restrict dividends or other payments by restricted subsidiaries, incur liens, enter into transactions with affiliates, dissolve, liquidate, consolidate, merge, sell or lease all or substantially all of SPL’s assets and enter into certain LNG sales contracts. Subject to permitted liens, the SPL Senior Notes are secured on a
pari passu
first-priority basis by a security interest in all of the membership interests in SPL and substantially all of SPL’s assets. SPL may not make any distributions until, among other requirements, deposits are made into debt service reserve accounts as required and a debt service coverage ratio test of
1.25
:1.00 is satisfied. Semi-annual principal payments for the 2037 SPL Senior Notes are due on March 15 and September 15 of each year beginning September 15, 2025. Interest on the SPL Senior Notes is payable semi-annually in arrears.
At any time prior to
three
months before the respective dates of maturity for each series of the SPL Senior Notes (except for the 2026 SPL Senior Notes, 2027 SPL Senior Notes, 2028 SPL Senior Notes and 2037 SPL Senior Notes, in which case the time period is
six
months before the respective dates of maturity), SPL may redeem all or part of such series of the SPL Senior Notes at a redemption price equal to the “make-whole” price (except for the 2037 SPL Senior Notes, in which case the redemption price is equal to the “optional redemption” price) set forth in the respective indentures governing the SPL Senior Notes, plus accrued and unpaid interest, if any, to the date of redemption. SPL may also, at any time within
three
months of the respective maturity dates for each series of the SPL Senior Notes (except for the 2026 SPL Senior Notes, 2027 SPL Senior Notes, 2028 SPL Senior Notes and 2037 SPL Senior Notes, in which case the time period is within
six
months of the respective dates of maturity), redeem all or part of such series of the SPL Senior Notes at a redemption price equal to
100%
of the principal amount of such series of the SPL Senior Notes to be redeemed, plus accrued and unpaid interest, if any, to the date of redemption.
CQP Senior Notes
In September 2018, Cheniere Partners issued an aggregate principal amount of
$1.1 billion
of the
2026 CQP Senior Notes
. Net proceeds of the offering of approximately
$1.1 billion
, after deducting the initial purchasers’ commissions and estimated fees and expenses, were used to prepay all of the outstanding indebtedness under the
CQP Credit Facilities
, resulting in the recognition of debt modification and extinguishment costs of
$12 million
for the
year ended December 31, 2018
relating to the incurrence of third party fees and write off of unamortized debt issuance costs. Borrowings under the
2026 CQP Senior Notes
accrue interest at a fixed rate of
5.625%
.
The
2025 CQP Senior Notes
and the
2026 CQP Senior Notes
(collectively, the “CQP Senior Notes”)
are jointly and severally guaranteed by each of Cheniere Partners’ subsidiaries other than SPL
(the “CQP Guarantors”)
and, subject to certain conditions governing its guarantee, Sabine Pass LP. The
CQP Senior Notes
are governed by the same base indenture
(the “CQP Base Indenture”)
. The
2025 CQP Senior Notes
are further governed by the First Supplemental Indenture (together with the CQP Base Indenture, the “2025 CQP Notes Indenture”) and the
2026 CQP Senior Notes
are further governed by the Second Supplemental Indenture (together with the CQP Base Indenture, the “2026 CQP Notes Indenture”). The 2025 CQP Notes Indenture and the 2026 CQP Notes Indenture contain customary terms and events of default and certain covenants that, among other things, limit the ability of Cheniere Partners and the
CQP Guarantors
to incur liens and sell assets, enter into transactions with affiliates, enter into sale-leaseback transactions and consolidate, merge or sell, lease or otherwise dispose of all or substantially all of the applicable entity’s properties or assets. Interest on the
CQP Senior Notes
is payable semi-annually in arrears.
At any time prior to October 1, 2020 for the
2025 CQP Senior Notes
and October 1, 2021 for the
2026 CQP Senior Notes
, Cheniere Partners may redeem all or a part of the applicable
CQP Senior Notes
at a redemption price equal to
100%
of the aggregate principal amount of the
CQP Senior Notes
redeemed, plus the “applicable premium” set forth in the respective indentures governing
85
CHENIERE ENERGY, INC. AND SUBSIDIARIES
NOTES TO CONSOLIDATED FINANCIAL STATEMENTS—CONTINUED
the
CQP Senior Notes
, plus accrued and unpaid interest, if any, to the date of redemption. In addition, at any time prior to October 1, 2020 for the
2025 CQP Senior Notes
and October 1, 2021 for the
2026 CQP Senior Notes
, Cheniere Partners may redeem up to
35%
of the aggregate principal amount of the
CQP Senior Notes
with an amount of cash not greater than the net cash proceeds from certain equity offerings at a redemption price equal to
105.250%
of the aggregate principal amount of the
2025 CQP Senior Notes
and
105.625%
of the aggregate principal amount of the
2026 CQP Senior Notes
redeemed, plus accrued and unpaid interest, if any, to the date of redemption. Cheniere Partners also may at any time on or after October 1, 2020 through the maturity date of October 1, 2025 for the
2025 CQP Senior Notes
and October 1, 2021 through the maturity date of October 1, 2026 for the
2026 CQP Senior Notes
, redeem the
CQP Senior Notes
, in whole or in part, at the redemption prices set forth in the respective indentures governing the
CQP Senior Notes
.
The
CQP Senior Notes
are Cheniere Partners’ senior obligations, ranking equally in right of payment with Cheniere Partners’ other existing and future unsubordinated debt and senior to any of its future subordinated debt. After applying the proceeds from the
2026 CQP Senior Notes
, the
CQP Senior Notes
became unsecured. In the event that the aggregate amount of Cheniere Partners’ secured indebtedness and the secured indebtedness of the
CQP Guarantors
(other than the
CQP Senior Notes
or any other series of notes issued under the
CQP Base Indenture
) outstanding at any one time exceeds the greater of (1)
$1.5 billion
and (2)
10%
of net tangible assets, the
CQP Senior Notes
will be secured to the same extent as such obligations under the
CQP Credit Facilities
. The obligations under the CQP Credit Facilities are secured on a first-priority basis (subject to permitted encumbrances) with liens on (1) substantially all the existing and future tangible and intangible assets and rights of Cheniere Partners and the
CQP Guarantors
and equity interests in the
CQP Guarantors
(except, in each case, for certain excluded properties set forth in the CQP Credit Facilities) and (2) substantially all of the real property of SPLNG (except for excluded properties referenced in the CQP Credit Facilities). The liens securing the
CQP Senior Notes
, if applicable, will be shared equally and ratably (subject to permitted liens) with the holders of other senior secured obligations, which include the CQP Credit Facilities obligations and any future additional senior secured debt obligations.
In connection with the closing of the
2026 CQP Senior Notes
offering, Cheniere Partners and the
CQP Guarantors
entered into a registration rights agreement
(the “CQP Registration Rights Agreement”)
. Under the
CQP Registration Rights Agreement
, Cheniere Partners and the
CQP Guarantors
have agreed to file with the SEC and cause to become effective a registration statement relating to an offer to exchange any and all of the
2026 CQP Senior Notes
for a like aggregate principal amount of debt securities of Cheniere Partners with terms identical in all material respects to the
2026 CQP Senior Notes
sought to be exchanged (other than with respect to restrictions on transfer or to any increase in annual interest rate), within
360 days
after the notes issuance date of September 11, 2018. Under specified circumstances, Cheniere Partners and the
CQP Guarantors
have also agreed to cause to become effective a shelf registration statement relating to resales of the
2026 CQP Senior Notes
. Cheniere Partners will be obligated to pay additional interest on the
2026 CQP Senior Notes
if it fails to comply with its obligation to register the
2026 CQP Senior Notes
within the specified time period.
CCH Senior Notes
The 2024 CCH Senior Notes, 2025 CCH Senior Notes and 2027 CCH Senior Notes (collectively, the “CCH Senior Notes”) are jointly and severally guaranteed by CCH’s subsidiaries, CCL, CCP and Corpus Christi Pipeline GP, LLC (the “CCH Guarantors”). The indenture governing the CCH Senior Notes (the “CCH Indenture”) contains customary terms and events of default and certain covenants that, among other things, limit CCH’s ability and the ability of CCH’s restricted subsidiaries to: incur additional indebtedness or issue preferred stock; make certain investments or pay dividends or distributions on membership interests or subordinated indebtedness or purchase, redeem or retire membership interests; sell or transfer assets, including membership or partnership interests of CCH’s restricted subsidiaries; restrict dividends or other payments by restricted subsidiaries to CCH or any of CCH’s restricted subsidiaries; incur liens; enter into transactions with affiliates; dissolve, liquidate, consolidate, merge, sell or lease all or substantially all of the properties or assets of CCH and its restricted subsidiaries taken as a whole; or permit any CCH Guarantor to dissolve, liquidate, consolidate, merge, sell or lease all or substantially all of its properties and assets. Interest on the CCH Senior Notes is payable semi-annually in arrears.
At any time prior to
six
months before the respective dates of maturity for each series of the CCH Senior Notes, CCH may redeem all or part of such series of the CCH Senior Notes at a redemption price equal to the “make-whole” price set forth in the CCH Indenture, plus accrued and unpaid interest, if any, to the date of redemption. CCH also may at any time within
six
months of the respective dates of maturity for each series of the CCH Senior Notes, redeem all or part of such series of the CCH Senior Notes, in whole or in part, at a redemption price equal to
100%
of the principal amount of the CCH Senior Notes to be redeemed, plus accrued and unpaid interest, if any, to the date of redemption.
86
CHENIERE ENERGY, INC. AND SUBSIDIARIES
NOTES TO CONSOLIDATED FINANCIAL STATEMENTS—CONTINUED
Credit Facilities
Below is a summary of our credit facilities outstanding as of
December 31, 2018
(in millions):
|
SPL Working Capital Facility
|
CQP Credit Facilities
|
CCH Credit Facility
|
CCH Working Capital Facility
|
Cheniere Revolving Credit Facility
|
||||||||||||||||
|
Original facility size
|
$
|
1,200
|
|
$
|
2,800
|
|
$
|
8,404
|
|
$
|
350
|
|
$
|
750
|
|
|||||
|
Incremental commitments
|
—
|
|
—
|
|
1,566
|
|
850
|
|
500
|
|
||||||||||
|
Less:
|
||||||||||||||||||||
|
Outstanding balance
|
—
|
|
—
|
|
5,156
|
|
168
|
|
—
|
|
||||||||||
|
Commitments prepaid or terminated
|
—
|
|
2,685
|
|
3,832
|
|
—
|
|
—
|
|
||||||||||
|
Letters of credit issued
|
425
|
|
—
|
|
—
|
|
316
|
|
—
|
|
||||||||||
|
Available commitment
|
$
|
775
|
|
|
$
|
115
|
|
|
$
|
982
|
|
|
$
|
716
|
|
|
$
|
1,250
|
|
|
|
Interest rate
|
LIBOR plus 1.75% or base rate plus 0.75%
|
2.25% of the undrawn portion with a 0.50% step-up beginning on February 25, 2019
|
LIBOR plus 1.75% or base rate plus 0.75%
|
LIBOR plus 1.25% - 1.75% or base rate plus 0.25% - 0.75%
|
LIBOR plus 1.75% - 2.50% or base rate plus 0.75% - 1.50%
|
|||||||||||||||
|
Maturity date
|
December 31, 2020, with various terms for underlying loans
|
February 25, 2020
|
June 30, 2024
|
June 29, 2023
|
December 13, 2022
|
|||||||||||||||
As of
December 31, 2018
, the weighted average interest rate on our current debt was
5.47%
.
SPL Working Capital Facility
In September 2015, SPL entered into the SPL Working Capital Facility, which is intended to be used for loans to SPL (“SPL Working Capital Loans”), the issuance of letters of credit on behalf of SPL, as well as for swing line loans to SPL (“SPL Swing Line Loans”), primarily for certain working capital requirements related to developing and placing into operation the SPL Project. SPL may, from time to time, request increases in the commitments under the SPL Working Capital Facility of up to
$760 million
and, upon the completion of the debt financing of Train 6 of the SPL Project, request an incremental increase in commitments of up to an additional
$390 million
.
Loans under the SPL Working Capital Facility accrue interest at a variable rate per annum equal to
LIBOR or the base rate
(equal to the highest of the senior facility agent’s published prime rate, the federal funds effective rate, as published by the Federal Reserve Bank of New York, plus
0.50%
and one month LIBOR plus
0.50%
), plus the applicable margin. The applicable margin for LIBOR loans under the SPL Working Capital Facility is
1.75%
per annum, and the applicable margin for base rate loans under the SPL Working Capital Facility is
0.75%
per annum. Interest on SPL Swing Line Loans and loans deemed made in connection with a draw upon a letter of credit (“SPL LC Loans”) is due and payable on the date the loan becomes due. Interest on LIBOR loans is due and payable at the end of each applicable LIBOR period, and interest on base rate loans is due and payable at the end of each fiscal quarter. However, if such base rate loan is converted into a LIBOR loan, interest is due and payable on that date. Additionally, if the loans become due prior to such periods, the interest also becomes due on that date.
SPL pays (1) a commitment fee equal to an annual rate of
0.70%
on the average daily amount of the excess of the total commitment amount over the principal amount outstanding without giving effect to any outstanding SPL Swing Line Loans and (2) a letter of credit fee equal to an annual rate of
1.75%
of the undrawn portion of all letters of credit issued under the SPL Working Capital Facility. If draws are made upon a letter of credit issued under the SPL Working Capital Facility and SPL does not elect for such draw (an “SPL LC Draw”) to be deemed an SPL LC Loan, SPL is required to pay the full amount of the SPL LC Draw on or prior to the business day following the notice of the SPL LC Draw. An SPL LC Draw accrues interest at an annual rate of
2.0%
plus the base rate. As of
December 31, 2018
,
no
SPL LC Draws had been made upon any letters of credit issued under the SPL Working Capital Facility.
The SPL Working Capital Facility matures on December 31, 2020, and the outstanding balance may be repaid, in whole or in part, at any time without premium or penalty upon
three
business days’ notice. SPL LC Loans have a term of up to
one
year. SPL Swing Line Loans terminate upon the earliest of (1) the maturity date or earlier termination of the SPL Working Capital Facility, (2) the date
15
days after such SPL Swing Line Loan is made and (3) the first borrowing date for a SPL Working Capital
87
CHENIERE ENERGY, INC. AND SUBSIDIARIES
NOTES TO CONSOLIDATED FINANCIAL STATEMENTS—CONTINUED
Loan or SPL Swing Line Loan occurring at least
three
business days following the date the SPL Swing Line Loan is made. SPL is required to reduce the aggregate outstanding principal amount of all SPL Working Capital Loans to
zero
for a period of
five
consecutive business days at least once each year.
The SPL Working Capital Facility contains conditions precedent for extensions of credit, as well as customary affirmative and negative covenants. The obligations of SPL under the SPL Working Capital Facility are secured by substantially all of the assets of SPL as well as all of the membership interests in SPL on a
pari passu
basis with the SPL Senior Notes.
CQP Credit Facilities
In February 2016, Cheniere Partners entered into the
CQP Credit Facilities
. The
CQP Credit Facilities
originally consisted of: (1) a
$450 million
CTPL tranche term loan that was used to prepay the
$400 million
term loan facility in February 2016, (2) an approximately
$2.1 billion
SPLNG tranche term loan that was used to repay and redeem in November 2016 the approximately
$2.1 billion
of the senior notes previously issued by SPLNG, (3) a
$125 million
facility that could be used to satisfy a
six
-month debt service reserve requirement and (4) a
$115 million
revolving credit facility that may be used for general business purposes. In September 2017 and September 2018, Cheniere Partners issued the
2025 CQP Senior Notes
and the
2026 CQP Senior Notes
, respectively, and the net proceeds were used to prepay the outstanding term loans under the
CQP Credit Facilities
. As of
December 31, 2018
, only a
$115 million
revolving credit facility, which is currently undrawn, remains as part of the
CQP Credit Facilities
. Cheniere Partners pays a commitment fee equal to an annual rate of
40%
of the margin for LIBOR loans multiplied by the average daily amount of the undrawn commitment, payable quarterly in arrears. The revolving credit facility is available for the issuance of letters of credit, which incurs a fee equal to an annual rate of
2.25%
of the undrawn portion with a
0.50%
step-up beginning on February 25, 2019.
The
CQP Credit Facilities
mature on February 25, 2020. Any outstanding balance may be repaid, in whole or in part, at any time without premium or penalty, except for interest hedging and interest rate breakage costs. The
CQP Credit Facilities
contain conditions precedent for extensions of credit, as well as customary affirmative and negative covenants and limit Cheniere Partners’ ability to make restricted payments, including distributions, to once per fiscal quarter as long as certain conditions are satisfied. Under the
CQP Credit Facilities
, Cheniere Partners is required to hedge not less than
50%
of the variable interest rate exposure on its projected aggregate outstanding balance, maintain a minimum debt service coverage ratio of at least
1.15
x at the end of each fiscal quarter beginning March 31, 2019 and have a projected debt service coverage ratio of
1.55
x in order to incur additional indebtedness to refinance a portion of the existing obligations.
The
CQP Credit Facilities
are unconditionally guaranteed by each subsidiary of Cheniere Partners other than (1) SPL and (2) certain subsidiaries of Cheniere Partners owning other development projects, as well as certain other specified subsidiaries and members of the foregoing entities.
CCH Credit Facility
In May 2018, CCH amended and restated the
CCH Credit Facility
to increase total commitments under the
CCH Credit Facility
from
$4.6 billion
to
$6.1 billion
. Borrowings are used to fund a portion of the costs of developing, constructing and placing into service the
three
Trains and the related facilities of the
CCL Project
and for related business purposes.
The
CCH Credit Facility
matures on
June 30, 2024
, with principal payments due quarterly commencing on the earlier of (1) the first quarterly payment date occurring more than
three
calendar months following the completion of the
CCL Project
as defined in the common terms agreement and (2) a set date determined by reference to the date under which a certain LNG buyer linked to the last Train of the
CCL Project
to become operational is entitled to terminate its SPA for failure to achieve the date of first commercial delivery for that agreement. Scheduled repayments will be based upon a
19
-year tailored amortization, commencing the first full quarter after the completion of Trains 1 through 3 and designed to achieve a minimum projected fixed debt service coverage ratio of
1.50
:1.
Loans under the
CCH Credit Facility
accrue interest at a variable rate per annum equal to, at CCH’s election,
LIBOR or the base rate
(determined by reference to the applicable agent’s prime rate), plus the applicable margin. The applicable margin for LIBOR loans is
1.75%
and for base rate loans is
0.75%
. Interest on LIBOR loans is due and payable at the end of each applicable interest period and interest on base rate loans is due and payable at the end of each quarter. The CCH Credit Facility also requires
88
CHENIERE ENERGY, INC. AND SUBSIDIARIES
NOTES TO CONSOLIDATED FINANCIAL STATEMENTS—CONTINUED
CCH to pay a commitment fee at a rate per annum equal to
40%
of the margin for LIBOR loans, multiplied by the outstanding undrawn debt commitments.
The obligations of CCH under the CCH Credit Facility are secured by a first priority lien on substantially all of the assets of CCH and its subsidiaries and by a pledge by CCH HoldCo I of its limited liability company interests in CCH, on a
pari passu
basis with the CCH Senior Notes and the CCH Credit Facility.
Under the
CCH Credit Facility
, CCH is required to hedge not less than
65%
of the variable interest rate exposure of its senior secured debt. CCH is restricted from making certain distributions under agreements governing its indebtedness generally until, among other requirements, the completion of the construction of Trains 1 through 3 of the CCL Project, funding of a debt service reserve account equal to
six
months of debt service and achieving a historical debt service coverage ratio and fixed projected debt service coverage ratio of at least
1.25
:1.00.
The amendment and restatement of the
CCH Credit Facility
resulted in the recognition of
$15 million
of debt modification and extinguishment costs during the
year ended December 31, 2018
relating to the incurrence of third party fees and write off of unamortized debt issuance costs. CCH was required to pay certain upfront fees to the agents and lenders under the
CCH Credit Facility
together with additional transaction fees and expenses in the aggregate amount of
$53 million
during the
year ended December 31, 2018
.
CCH Working Capital Facility
In June 2018, CCH amended and restated the
CCH Working Capital Facility
to increase total commitments under the
CCH Working Capital Facility
from
$350 million
to
$1.2 billion
. The
CCH Working Capital Facility
is intended to be used for loans to CCH
(“CCH Working Capital Loans”)
and the issuance of letters of credit on behalf of CCH for certain working capital requirements related to developing and placing into operations the
CCL Project
and for related business purposes. Loans under the
CCH Working Capital Facility
are guaranteed by the
CCH Guarantors
. CCH may, from time to time, request increases in the commitments under the
CCH Working Capital Facility
of up to the maximum allowed for working capital under the Common Terms Agreement that was entered into concurrently with the
CCH Credit Facility
.
Loans under the
CCH Working Capital Facility
, including CCH Working Capital Loans and loans made in connection with a draw upon any letter of credit (“CCH LC Loans” and collectively, the “Revolving Loans”) accrue interest at a variable rate per annum equal to
LIBOR or the base rate
(equal to the highest of (1) the prime rate, (2) the federal funds rate plus
0.50%
and (3) one month LIBOR plus
0.50%
) plus the applicable margin. The applicable margin for LIBOR Revolving Loans ranges from
1.25%
to
1.75%
per annum, and the applicable margin for base rate Revolving Loans ranges from
0.25%
to
0.75%
per annum. Interest on Revolving Loans is due and payable on the date the loan becomes due. Interest on LIBOR Revolving Loans is due and payable at the end of each LIBOR period, and interest on base rate Revolving Loans is due and payable at the end of each quarter.
CCH pays (1) a commitment fee equal to an annual rate of
40%
of the applicable margin for LIBOR Revolving Loans on the average daily amount of the excess of the total commitment amount over the principal amount outstanding, (2) a letter of credit fee equal to an annual rate equal to the applicable margin for LIBOR Revolving Loans on the undrawn portion of all letters of credit issued under the
CCH Working Capital Facility
and (3) a letter of credit fronting fee equal to an annual rate of
0.20%
of the undrawn portion of all fronted letters of credit. Each of these fees is payable quarterly in arrears.
If draws are made upon a letter of credit issued under the
CCH Working Capital Facility
and CCH does not elect for such draw (a “CCH LC Draw”) to be deemed a CCH LC Loan, CCH is required to pay the full amount of the CCH LC Draw on or prior to the business day following the notice of the CCH LC Draw. A CCH LC Draw accrues interest at an annual rate of
2.00%
plus the base rate.
CCH was required to pay certain upfront fees to the agents and lenders under the
CCH Working Capital Facility
together with additional transaction fees and expenses in the aggregate amount of
$14 million
during the
year ended December 31, 2018
.
The
CCH Working Capital Facility
matures on
June 29, 2023
and CCH may prepay the Revolving Loans at any time without premium or penalty upon
three
business days’ notice and may re-borrow at any time.
CCH LC Loans
have a term of up to
one
year. CCH is required to reduce the aggregate outstanding principal amount of all
CCH Working Capital Loans
to
zero
for a period of
five
consecutive business days at least once each year.
89
CHENIERE ENERGY, INC. AND SUBSIDIARIES
NOTES TO CONSOLIDATED FINANCIAL STATEMENTS—CONTINUED
The
CCH Working Capital Facility
contains conditions precedent for extensions of credit, as well as customary affirmative and negative covenants. The obligations of CCH under the
CCH Working Capital Facility
are secured by substantially all of the assets of CCH and the
CCH Guarantors
as well as all of the membership interests in CCH and each of the
CCH Guarantors
on a
pari passu
basis with the
CCH Senior Notes
and the
CCH Credit Facility
.
Cheniere Revolving Credit Facility
In December 2018, we amended and restated the
Cheniere Revolving Credit Facility
to increase total commitments under the
Cheniere Revolving Credit Facility
from
$750 million
to
$1.25 billion
. The
Cheniere Revolving Credit Facility
is intended to fund, through loans and letters of credit, equity capital contributions to CCH HoldCo II and its subsidiaries for the development of the
CCL Project
and, provided that certain conditions are met, for general corporate purposes.
The
Cheniere Revolving Credit Facility
matures on December 13, 2022 and contains representations, warranties and affirmative and negative covenants customary for companies like us with lenders of the type participating in the
Cheniere Revolving Credit Facility
that limit our ability to make restricted payments, including distributions, unless certain conditions are satisfied, as well as limitations on indebtedness, guarantees, hedging, liens, investments and affiliate transactions. Under the
Cheniere Revolving Credit Facility
, we are required to ensure that the sum of our unrestricted cash and the amount of undrawn commitments under the
Cheniere Revolving Credit Facility
is at least equal to the lesser of (1)
20%
of the commitments under the
Cheniere Revolving Credit Facility
and (2)
$200 million
(the “Liquidity Covenant”).
From and after the time at which certain specified conditions are met (the “Trigger Point”), we will have increased flexibility under the
Cheniere Revolving Credit Facility
to, among other things, (1) make restricted payments and (2) raise incremental commitments. The Trigger Point will occur once (1) completion has occurred for each of Train 1 of the CCL Project (as defined in the CCH Indenture) and Train 5 of the SPL Project (as defined in SPL’s common terms agreement), (2) the aggregate principal amount of outstanding loans plus drawn and unreimbursed letters of credit under the
Cheniere Revolving Credit Facility
is less than or equal to
10%
of aggregate commitments under the
Cheniere Revolving Credit Facility
and (3) we elect on a go-forward basis to be governed by a non-consolidated leverage ratio covenant not to exceed
5.75
:1.00 (the “Springing Leverage Covenant”), which following such election will apply at any time that the aggregate principal amount of outstanding loans plus drawn and unreimbursed letters of credit under the
Cheniere Revolving Credit Facility
is greater than
30%
of aggregate commitments under the
Cheniere Revolving Credit Facility
. Following the Trigger Point, at any time that the Springing Leverage Covenant is in effect, the Liquidity Covenant will not apply.
Loans under the
Cheniere Revolving Credit Facility
accrue interest at a variable rate per annum equal to
LIBOR or the base rate
(equal to the highest of (1) the prime rate, (2) the federal funds rate plus
0.50%
and (3) one month LIBOR plus
1.00%
), plus the applicable margin. The applicable margin for LIBOR loans ranges from
1.75%
to
2.50%
per annum, and the applicable margin for base rate loans ranges from
0.75%
to
1.50%
per annum, in each case, based on the credit ratings then in effect assigned to loans under the
Cheniere Revolving Credit Facility
. Interest on LIBOR loans is due and payable at the end of each LIBOR period, and interest on base rate loans is due and payable at the end of each calendar quarter. We will also pay (1) prior to the Trigger Point, a commitment fee on the average daily amount of undrawn commitments at an annual rate of
0.75%
, payable quarterly in arrears and (2) from and after the Trigger Point, a commitment fee on the average daily amount of undrawn commitments at a rate equal to
30%
multiplied by the applicable margin for LIBOR loans then in effect. We will also pay a letter of credit fee at an annual rate equal to the applicable margin for LIBOR loans on the undrawn portion of all letters of credit issued under the
Cheniere Revolving Credit Facility
. Draws on any letters of credit will accrue interest at an annual rate equal to the base rate plus
2.0%
.
The
Cheniere Revolving Credit Facility
is secured by a first priority security interest (subject to permitted liens and other customary exceptions) in substantially all of our assets, including our interests in our direct subsidiaries (excluding CCH HoldCo II and certain other subsidiaries).
90
CHENIERE ENERGY, INC. AND SUBSIDIARIES
NOTES TO CONSOLIDATED FINANCIAL STATEMENTS—CONTINUED
Convertible Notes
Below is a summary of our convertible notes outstanding as of
December 31, 2018
(in millions):
|
2021 Cheniere Convertible Unsecured Notes
|
2025 CCH HoldCo II Convertible Senior Notes
|
2045 Cheniere Convertible Senior Notes
|
||||||||||
|
Aggregate original principal
|
$
|
1,000
|
|
$
|
1,000
|
|
$
|
625
|
|
|||
|
Debt component, net of discount and debt issuance costs
|
$
|
1,126
|
|
$
|
1,432
|
|
$
|
310
|
|
|||
|
Equity component
|
$
|
209
|
|
$
|
—
|
|
$
|
194
|
|
|||
|
Maturity date
|
May 28, 2021
|
|
May 13, 2025
|
|
March 15, 2045
|
|
||||||
|
Contractual interest rate
|
4.875
|
%
|
11.0
|
%
|
4.25
|
%
|
||||||
|
Effective interest rate (1)
|
8.4
|
%
|
11.9
|
%
|
9.4
|
%
|
||||||
|
Remaining debt discount and debt issuance costs amortization period (2)
|
2.4 years
|
|
1.8 years
|
|
26.2 years
|
|
||||||
|
(1)
|
Rate to accrete the discounted carrying value of the convertible notes to the face value over the remaining amortization period.
|
|
(2)
|
We amortize any debt discount and debt issuance costs using the effective interest over the period through contractual maturity except for the
2025 CCH HoldCo II Convertible Senior Notes
, which are amortized through the date they are first convertible by holders into our common stock.
|
2021 Cheniere Convertible Unsecured Notes
In November 2014, we issued the 2021 Cheniere Convertible Unsecured Notes on a private placement basis in reliance on the exemption from registration provided for under section 4(a)(2) of the
Securities Act
and Regulation S promulgated thereunder. The 2021 Cheniere Convertible Unsecured Notes accrue interest at a rate of
4.875%
per annum, which is payable in kind semi-annually in arrears by increasing the principal amount of the 2021 Cheniere Convertible Unsecured Notes outstanding. Beginning
one year
after the closing date, the 2021 Cheniere Convertible Unsecured Notes will be convertible at the option of the holder into our common stock at the then applicable conversion rate, provided that the closing price of our common stock is greater than or equal to the conversion price on the conversion date. The initial conversion price was
$93.64
and is subject to adjustment upon the occurrence of certain specified events. We have the option to satisfy the conversion obligation with cash, common stock or a combination thereof.
Under GAAP, certain convertible debt instruments that may be settled in cash upon conversion are required to be separately accounted for as liability (debt) and equity (conversion option) components of the instrument in a manner that reflects the issuer’s non-convertible debt borrowing rate. We determined that the fair value of the debt component was
$809 million
and the residual value of the equity component was
$191 million
as of the issuance date. As of
December 31, 2018
and
2017
, the carrying value of the equity component was
$209 million
and
$206 million
, respectively. The debt component is accreted to the total principal amount due at maturity by amortizing the debt discount. The effective rate of interest to amortize the debt discount and debt issuance costs was approximately
8.4%
and
8.3%
as of
December 31, 2018
and
2017
, respectively. As of
December 31, 2018
, the if-converted value of the 2021 Cheniere Convertible Unsecured Notes did not exceed the principal balance.
2025 CCH HoldCo II Convertible Senior Notes
In May 2015, CCH HoldCo II issued the 2025 CCH HoldCo II Convertible Senior Notes on a private placement basis in reliance on the exemption from registration provided for under section 4(a)(2) of the
Securities Act
. The 2025 CCH HoldCo II Convertible Senior Notes were issued pursuant to the amended and restated note purchase agreement entered into among CCH HoldCo II, EIG Management Company, LLC, The Bank of New York Mellon, us and the note purchasers. The
$1.0 billion
principal of the 2025 CCH HoldCo II Convertible Senior Notes are being used to partially fund costs associated with Stage 1 and Stage 2 of the CCL Project. The 2025 CCH HoldCo II Convertible Senior Notes bear interest at a rate of
11.0%
per annum, which is payable quarterly in arrears. Prior to the substantial completion of Train 2 of the CCL Project, interest on the 2025 CCH HoldCo II Convertible Senior Notes will be paid entirely in kind. Following this date, the interest generally must be paid in cash; however, a portion of the interest may be paid in kind under certain specified circumstances. The 2025 CCH HoldCo II Convertible Senior
91
CHENIERE ENERGY, INC. AND SUBSIDIARIES
NOTES TO CONSOLIDATED FINANCIAL STATEMENTS—CONTINUED
Notes are secured by a pledge by us of
100%
of the equity interests in CCH HoldCo II, and a pledge by CCH HoldCo II of
100%
of the equity interests in CCH HoldCo I.
At CCH HoldCo II’s option, the outstanding 2025 CCH HoldCo II Convertible Senior Notes are convertible into our common stock, provided the total market capitalization of Cheniere at that time is not less than
$10.0 billion
, on or after the later of (1) March 1, 2020 and (2) the substantial completion of Train 2 of the CCL Project (the “Eligible Conversion Date”). The conversion price for 2025 CCH HoldCo II Convertible Senior Notes converted at CCH HoldCo II’s option is the lower of (1) a
10%
discount to the average of the daily volume-weighted average price (“VWAP”) of our common stock for the
90
trading day period prior to the date on which notice of conversion is provided and (2) a
10%
discount to the closing price of our common stock on the trading day preceding the date on which notice of conversion is provided. At the option of the holders, the 2025 CCH HoldCo II Convertible Senior Notes are convertible on or after the
six
-month anniversary of the Eligible Conversion Date, provided the total market capitalization of Cheniere at that time is not less than
$10.0 billion
, at a conversion price equal to the average of the daily VWAP of our common stock for the
90
trading day period prior to the date on which notice of conversion is provided. Conversions are also subject to various limitations and conditions.
CCH HoldCo II is restricted from making distributions to Cheniere under agreements governing its indebtedness generally until, among other requirements, Trains 1 and 2 of the CCL Project are in commercial operation and a historical debt service coverage ratio and a projected fixed debt services coverage ratio of
1.20
:1.00 are achieved.
In May 2018, the amended and restated note purchase agreement under which the 2025 CCH HoldCo II Convertible Senior Notes were issued was subsequently amended in connection with commercialization and financing of Train 3 of the CCL Project and to provide the note holders with certain prepayment rights related thereto.
2045 Cheniere Convertible Senior Notes
In March 2015, we issued the 2045 Cheniere Convertible Senior Notes to certain investors through a registered direct offering. The 2045 Cheniere Convertible Senior Notes were issued with an original issue discount of
20%
and accrue interest at a rate of
4.25%
per annum, which is payable semi-annually in arrears. We have the right, at our option, at any time after March 15, 2020, to redeem all or any part of the 2045 Cheniere Convertible Senior Notes at a redemption price payable in cash equal to the accreted amount of the 2045 Cheniere Convertible Senior Notes to be redeemed, plus accrued and unpaid interest, if any, to such redemption date. The conversion rate will initially equal
7.2265
shares of our common stock per $1,000 principal amount of the 2045 Cheniere Convertible Senior Notes, which corresponds to an initial conversion price of approximately
$138.38
per share of our common stock. The conversion rate is subject to adjustment upon the occurrence of certain specified events. We have the option to satisfy the conversion obligation with cash, common stock or a combination thereof.
We determined that the fair value of the debt component of the 2045 Cheniere Convertible Senior Notes was
$304 million
and the residual value of the equity component was
$196 million
as of the issuance date, excluding debt issuance costs and original issue discount. As of both
December 31, 2018
and
2017
, the carrying value of the equity component was
$194 million
. The debt component is accreted to the total principal amount due at maturity by amortizing the debt discount and debt issuance costs. The effective rate of interest to amortize the debt discount and debt issuance costs was approximately
9.4%
as of both
December 31, 2018
and
2017
. As of
December 31, 2018
, the if-converted value of the 2045 Cheniere Convertible Senior Notes did not exceed the principal balance.
Restrictive Debt Covenants
As of
December 31, 2018
, each of our issuers was in compliance with all covenants related to their respective debt agreements.
92
CHENIERE ENERGY, INC. AND SUBSIDIARIES
NOTES TO CONSOLIDATED FINANCIAL STATEMENTS—CONTINUED
Interest Expense
Total interest expense, including interest expense related to our convertible notes, consisted of the following (in millions):
|
|
Year Ended December 31,
|
||||||||||
|
|
2018
|
2017
|
2016
|
||||||||
|
Interest cost on convertible notes:
|
|||||||||||
|
Interest per contractual rate
|
$
|
237
|
|
$
|
219
|
|
$
|
202
|
|
||
|
Amortization of debt discount
|
35
|
|
29
|
|
31
|
|
|||||
|
Amortization of debt issuance costs
|
9
|
|
7
|
|
5
|
|
|||||
|
Total interest cost related to convertible notes
|
281
|
|
255
|
|
238
|
|
|||||
|
Interest cost on capital lease
|
1
|
|
—
|
|
—
|
|
|||||
|
Interest cost on debt excluding capital lease and convertible notes
|
1,396
|
|
|
1,271
|
|
|
1,063
|
|
|||
|
Total interest cost
|
1,678
|
|
1,526
|
|
1,301
|
|
|||||
|
Capitalized interest
|
(803
|
)
|
(779
|
)
|
(813
|
)
|
|||||
|
Total interest expense, net
|
$
|
875
|
|
$
|
747
|
|
$
|
488
|
|
||
Fair Value Disclosures
The following table shows the carrying amount, which is net of unamortized premium, discount and debt issuance costs, and estimated fair value of our debt (in millions):
|
|
December 31, 2018
|
December 31, 2017
|
||||||||||||||
|
|
Carrying
Amount |
Estimated
Fair Value |
Carrying
Amount |
Estimated
Fair Value |
||||||||||||
|
Senior notes (1)
|
$
|
19,466
|
|
$
|
19,901
|
|
$
|
18,350
|
|
$
|
20,075
|
|
||||
|
2037 SPL Senior Notes (2)
|
791
|
|
817
|
|
790
|
|
871
|
|
||||||||
|
Credit facilities (3)
|
5,294
|
|
5,294
|
|
3,574
|
|
3,574
|
|
||||||||
|
2021 Cheniere Convertible Unsecured Notes (2)
|
1,126
|
|
1,236
|
|
1,040
|
|
1,136
|
|
||||||||
|
2025 CCH HoldCo II Convertible Senior Notes (2)
|
1,432
|
|
1,612
|
|
1,273
|
|
1,535
|
|
||||||||
|
2045 Cheniere Convertible Senior Notes (4)
|
310
|
|
431
|
|
309
|
|
447
|
|
||||||||
|
(1)
|
Includes
2021 SPL Senior Notes
,
2022 SPL Senior Notes
,
2023 SPL Senior Notes
,
2024 SPL Senior Notes
,
2025 SPL Senior Notes
,
2026 SPL Senior Notes
,
2027 SPL Senior Notes
,
2028 SPL Senior Notes
,
2025 CQP Senior Notes
,
2026 CQP Senior Notes
,
2024 CCH Senior Notes
,
2025 CCH Senior Notes
and
2027 CCH Senior Notes
. The Level 2 estimated fair value was based on quotes obtained from broker-dealers or market makers of these senior notes and other similar instruments.
|
|
(2)
|
The Level 3 estimated fair value was calculated based on inputs that are observable in the market or that could be derived from, or corroborated with, observable market data, including our stock price and interest rates based on debt issued by parties with comparable credit ratings to us and inputs that are not observable in the market.
|
|
(3)
|
Includes
SPL Working Capital Facility
,
CQP Credit Facilities
,
CCH Credit Facility
,
CCH Working Capital Facility
,
Cheniere Revolving Credit Facility
and
Cheniere Marketing trade finance facilities
. The Level 3 estimated fair value approximates the principal amount because the interest rates are variable and reflective of market rates and the debt may be repaid, in full or in part, at any time without penalty.
|
|
(4)
|
The Level 1 estimated fair value was based on unadjusted quoted prices in active markets for identical liabilities that we had the ability to access at the measurement date.
|
93
CHENIERE ENERGY, INC. AND SUBSIDIARIES
NOTES TO CONSOLIDATED FINANCIAL STATEMENTS—CONTINUED
NOTE 13—REVENUES FROM CONTRACTS WITH CUSTOMERS
The following table represents a disaggregation of revenue earned from contracts with customers during the
years ended December 31, 2018, 2017 and 2016
(in millions):
|
Year Ended December 31,
|
|||||||||||
|
2018
|
2017
|
2016
|
|||||||||
|
LNG revenues
|
$
|
7,440
|
|
$
|
5,342
|
|
$
|
1,015
|
|
||
|
Regasification revenues
|
261
|
|
260
|
|
259
|
|
|||||
|
Other revenues (1)
|
142
|
|
21
|
|
8
|
|
|||||
|
Other—related party
|
12
|
|
3
|
|
—
|
|
|||||
|
Total revenues from customers
|
7,855
|
|
5,626
|
|
1,282
|
|
|||||
|
Gains (losses) from derivative instruments (2)
|
132
|
|
(25
|
)
|
1
|
|
|||||
|
Total revenues
|
$
|
7,987
|
|
$
|
5,601
|
|
$
|
1,283
|
|
||
|
(1)
|
Includes
$101 million
in sub-chartering revenues for the year ended December 31, 2018.
|
|
(2)
|
Includes the realized value associated with a portion of derivative instruments that settle through physical delivery.
|
LNG Revenues
We have entered into numerous SPAs with third party customers for the sale of LNG on a free on board (“FOB”) (delivered to the customer at either the Sabine Pass or Corpus Christi LNG terminal) or delivered at terminal (“DAT”) (delivered to the customer at their LNG receiving terminal) basis. Our customers generally purchase LNG for a price consisting of a fixed fee per MMBtu of LNG (a portion of which is subject to annual adjustment for inflation) plus a variable fee per MMBtu of LNG equal to approximately
115%
of Henry Hub. The fixed fee component is the amount payable to us regardless of a cancellation or suspension of LNG cargo deliveries by the customers. The variable fee component is the amount generally payable to us only upon delivery of LNG plus all future adjustments to the fixed fee for inflation. The SPAs and contracted volumes to be made available under the SPAs are not tied to a specific Train; however, the term of each SPA generally commences upon the date of first commercial delivery of a specified Train.
We intend to primarily use LNG sourced from our Sabine Pass or Corpus Christi terminals to provide contracted volumes to our customers. However, we supplement this LNG with volumes procured from third parties. LNG revenues recognized from LNG that was procured from third parties was
$745 million
,
$981 million
and
$236 million
for the
years ended December 31, 2018, 2017 and 2016
, respectively.
Revenues from the sale of LNG are recognized at a point in time when the LNG is delivered to the customer, either at the Sabine Pass or Corpus Christi LNG terminal or at the customer’s LNG receiving terminal, based on the terms of the contract, which is the point legal title, physical possession and the risks and rewards of ownership transfer to the customer. Each individual molecule of LNG is viewed as a separate performance obligation. The stated contract price (including both fixed and variable fees) per MMBtu in each LNG sales arrangement is representative of the stand-alone selling price for LNG at the time the sale was negotiated. We have concluded that the variable fees meet the exception for allocating variable consideration to specific parts of the contract. As such, the variable consideration for these contracts is allocated to each distinct molecule of LNG and recognized when that distinct molecule of LNG is delivered to the customer. Because of the use of the exception, variable consideration related to the sale of LNG is also not included in the transaction price.
When we sell LNG on a DAT basis, we consider all transportation costs, including vessel chartering, loading/unloading and canal fees, as fulfillment costs and not as separate services provided to the customer within the arrangement, regardless of whether or not such activities occur prior to or after the customer obtains control of the LNG. We expense fulfillment costs as incurred unless otherwise dictated by GAAP.
Fees received pursuant to SPAs are recognized as LNG revenues only after substantial completion of the respective Train. Prior to substantial completion, sales generated during the commissioning phase are offset against the cost of construction for the respective Train, as the production and removal of LNG from storage is necessary to test the facility and bring the asset to the condition necessary for its intended use.
94
CHENIERE ENERGY, INC. AND SUBSIDIARIES
NOTES TO CONSOLIDATED FINANCIAL STATEMENTS—CONTINUED
Regasification Revenues
The Sabine Pass LNG terminal has operational regasification capacity of approximately
4.0
Bcf/d. Approximately
2.0
Bcf/d of the regasification capacity at the Sabine Pass LNG terminal has been reserved under
two
long-term TUAs with unaffiliated third-party customers, under which they are required to pay fixed monthly fees regardless of their use of the LNG terminal. Each of the customers has reserved approximately
1.0
Bcf/d of regasification capacity. The customers are each obligated to make monthly capacity payments to SPLNG aggregating approximately
$125 million
annually for
20
years that commenced in 2009, which is representative of fixed consideration in the contract. A portion of this fee is adjusted annually for inflation which is considered variable consideration. The remaining capacity of the Sabine Pass LNG terminal has been reserved by SPL, for which the associated revenues are eliminated in consolidation.
Because SPLNG is continuously available to provide regasification service on a daily basis with the same pattern of transfer, we have concluded that SPLNG provides a single performance obligation to its customers on a continuous basis over time. We have determined that an output method of recognition based on elapsed time best reflects the benefits of this service to the customer and accordingly, LNG regasification capacity reservation fees are recognized as regasification revenues on a straight-line basis over the term of the respective TUAs. We have concluded that the inflation element within the contract meets the exception for allocating variable consideration to specific parts of the contract and accordingly the inflation adjustment is not included in the transaction price and will be recognized over the year in which the inflation adjustment relates on a straight-line basis.
In 2012, SPL entered into a partial TUA assignment agreement with Total Gas & Power North America, Inc.
(“Total”)
, whereby SPL would progressively gain access to
Total
’s capacity and other services provided under its TUA with SPLNG. This agreement provides SPL with additional berthing and storage capacity at the Sabine Pass LNG terminal that may be used to provide increased flexibility in managing LNG cargo loading and unloading activity, permit SPL to more flexibly manage its LNG storage capacity and accommodate the development of Trains 5 and 6.
Upon substantial completion of Train 3 of the
SPL Project
, which was in March 2017, SPL gained access to a portion of
Total
’s capacity and other services provided under
Total
’s TUA with SPLNG. Upon substantial completion of Train 5, SPL will gain access to substantially all of
Total
’s capacity. Notwithstanding any arrangements between Total and SPL, payments required to be made by
Total
to SPLNG will continue to be made by Total to SPLNG in accordance with its TUA and we continue to recognize the payments received from
Total
as revenue. During the
years ended December 31, 2018 and 2017
, SPL recorded
$30 million
and
$23 million
, respectively, as operating and maintenance expense under this partial TUA assignment agreement.
Deferred Revenue Reconciliation
The following table reflects the changes in our contract liabilities, which we classify as deferred revenue on our Consolidated Balance Sheets (in millions):
|
Year Ended December 31,
|
|||||||
|
2018
|
2017
|
||||||
|
Deferred revenues, beginning of period
|
$
|
111
|
|
$
|
78
|
|
|
|
Cash received but not yet recognized
|
139
|
|
111
|
|
|||
|
Revenue recognized from prior period deferral
|
(111
|
)
|
(78
|
)
|
|||
|
Deferred revenues, end of period
|
$
|
139
|
|
$
|
111
|
|
|
We record deferred revenue when we receive consideration, or such consideration is unconditionally due from a customer, prior to transferring goods or services to the customer under the terms of a sales contract. Changes in deferred revenue during the
years ended December 31, 2018 and 2017
are primarily attributable to differences between the timing of revenue recognition and the receipt of advance payments related to delivery of LNG under certain SPAs.
95
CHENIERE ENERGY, INC. AND SUBSIDIARIES
NOTES TO CONSOLIDATED FINANCIAL STATEMENTS—CONTINUED
Transaction Price Allocated to Future Performance Obligations
Because many of our sales contracts have long-term durations, we are contractually entitled to significant future consideration which we have not yet recognized as revenue. The following table discloses the aggregate amount of the transaction price that is allocated to performance obligations that have not yet been satisfied as of
December 31, 2018
and
2017
:
|
December 31, 2018
|
December 31, 2017
|
|||||||||||
|
Unsatisfied Transaction Price (in billions)
|
Weighted Average Recognition Timing (years) (1)
|
Unsatisfied Transaction Price (in billions)
|
Weighted Average Recognition Timing (years) (1)
|
|||||||||
|
LNG revenues
|
$
|
106.6
|
|
11
|
$
|
83.7
|
|
11
|
||||
|
Regasification revenues
|
2.6
|
|
6
|
2.9
|
|
6
|
||||||
|
Total revenues
|
$
|
109.2
|
|
|
$
|
86.6
|
|
|||||
|
(1)
|
The weighted average recognition timing represents an estimate of the number of years during which we shall have recognized half of the unsatisfied transaction price.
|
We have elected the following exemptions which omit certain potential future sources of revenue from the table above:
|
(1)
|
We omit from the table above all performance obligations that are part of a contract that has an original expected duration of one year or less.
|
|
(2)
|
We omit from the table above all variable consideration that is allocated entirely to a wholly unsatisfied performance obligation or to a wholly unsatisfied promise to transfer a distinct good or service that forms part of a single performance obligation when that performance obligation qualifies as a series. The table above excludes all variable consideration under our SPAs and TUAs. The amount of revenue from variable fees that is not included in the transaction price will vary based on the future prices of Henry Hub throughout the contract terms, to the extent customers elect to take delivery of their LNG, and adjustments to the consumer price index. Certain of our contracts contain additional variable consideration based on the outcome of contingent events and the movement of various indexes. We have not included such variable consideration in the transaction price to the extent the consideration is considered constrained due to the uncertainty of ultimate pricing and receipt. Approximately
56%
of our LNG revenues from contracts with a duration of over one year during each of the
years ended December 31, 2018 and 2017
and approximately
3%
and
2%
of our regasification revenues were related to variable consideration received from customers during the
years ended December 31, 2018 and 2017
, respectively.
|
We have entered into contracts to sell LNG that are conditioned upon one or both of the parties achieving certain milestones such as reaching
FID
on a certain liquefaction Train, obtaining financing or achieving substantial completion of a Train and any related facilities. These contracts are considered completed contracts for revenue recognition purposes and are included in the transaction price above when the conditions are considered probable of being met.
NOTE 14—INCOME TAXES
Components of income (loss) before income taxes and non-controlling interest on our Consolidated Statements of Operations for the
years ended December 31, 2018, 2017 and 2016
are as follows (in millions):
|
|
Year Ended December 31,
|
|||||||||||
|
|
2018
|
2017
|
2016
|
|||||||||
|
U.S.
|
$
|
997
|
|
$
|
30
|
|
$
|
(611
|
)
|
|||
|
International
|
230
|
|
536
|
|
(52
|
)
|
||||||
|
Total income (loss) before income taxes and non-controlling interest
|
$
|
1,227
|
|
$
|
566
|
|
$
|
(663
|
)
|
|||
96
CHENIERE ENERGY, INC. AND SUBSIDIARIES
NOTES TO CONSOLIDATED FINANCIAL STATEMENTS—CONTINUED
Income tax provision included in our reported net income (loss) consisted of the following (in millions):
|
|
Year Ended December 31,
|
|||||||||||
|
|
2018
|
2017
|
2016
|
|||||||||
|
Current:
|
||||||||||||
|
Federal
|
$
|
—
|
|
$
|
—
|
|
$
|
—
|
|
|||
|
State
|
2
|
|
—
|
|
—
|
|
||||||
|
Foreign
|
30
|
|
6
|
|
—
|
|
||||||
|
Total current
|
32
|
|
6
|
|
—
|
|
||||||
|
Deferred:
|
||||||||||||
|
Federal
|
—
|
|
—
|
|
—
|
|
||||||
|
State
|
—
|
|
—
|
|
—
|
|
||||||
|
Foreign
|
(5
|
)
|
(3
|
)
|
2
|
|
||||||
|
Total deferred
|
(5
|
)
|
(3
|
)
|
2
|
|
||||||
|
Total income tax provision
|
$
|
27
|
|
$
|
3
|
|
$
|
2
|
|
|||
The reconciliation of the federal statutory income tax rate to our effective income tax rate is as follows:
|
|
Year Ended December 31,
|
||||||||
|
|
2018
|
2017
|
2016
|
||||||
|
U.S. federal statutory tax rate
|
21.0
|
%
|
35.0
|
%
|
35.0
|
%
|
|||
|
Non-controlling interest
|
(11.4
|
)%
|
2.9
|
%
|
(2.1
|
)%
|
|||
|
State tax rate
|
(0.4
|
)%
|
(0.2
|
)%
|
1.8
|
%
|
|||
|
U.S. tax reform rate change
|
—
|
%
|
71.4
|
%
|
—
|
%
|
|||
|
Share-based compensation
|
(0.5
|
)%
|
(6.2
|
)%
|
—
|
%
|
|||
|
Nondeductible interest expense
|
2.6
|
%
|
8.5
|
%
|
(6.6
|
)%
|
|||
|
Foreign earnings taxed in the U.S.
|
1.4
|
%
|
—
|
%
|
—
|
%
|
|||
|
Foreign rate differential
|
(1.1
|
)%
|
(0.7
|
)%
|
(1.2
|
)%
|
|||
|
Other
|
0.4
|
%
|
(0.5
|
)%
|
0.3
|
%
|
|||
|
Valuation allowance
|
(9.8
|
)%
|
(109.7
|
)%
|
(27.5
|
)%
|
|||
|
Effective tax rate
|
2.2
|
%
|
0.5
|
%
|
(0.3
|
)%
|
|||
97
CHENIERE ENERGY, INC. AND SUBSIDIARIES
NOTES TO CONSOLIDATED FINANCIAL STATEMENTS—CONTINUED
Significant components of our deferred tax assets and liabilities at
December 31, 2018
and
2017
are as follows (millions):
|
|
December 31,
|
|||||||
|
|
2018
|
2017
|
||||||
|
Deferred tax assets
|
|
|
||||||
|
Net operating loss carryforwards and credits
|
||||||||
|
Federal
|
$
|
848
|
|
$
|
936
|
|
||
|
Foreign
|
7
|
|
6
|
|
||||
|
State
|
189
|
|
184
|
|
||||
|
Federal and state tax credits
|
28
|
|
22
|
|
||||
|
Disallowed business interest expense carryforward
|
19
|
|
—
|
|
||||
|
Deferred gain
|
46
|
|
46
|
|
||||
|
Other
|
50
|
|
77
|
|
||||
|
Less: valuation allowance
|
(686
|
)
|
(806
|
)
|
||||
|
Total deferred tax assets
|
501
|
|
465
|
|
||||
|
Deferred tax liabilities
|
|
|
|
|
||||
|
Investment in limited partnership
|
(375
|
)
|
(391
|
)
|
||||
|
Convertible debt
|
(59
|
)
|
(65
|
)
|
||||
|
Property, plant and equipment
|
(48
|
)
|
(6
|
)
|
||||
|
Other
|
(11
|
)
|
—
|
|
||||
|
Total deferred tax liabilities
|
(493
|
)
|
(462
|
)
|
||||
|
Net deferred tax assets
|
$
|
8
|
|
$
|
3
|
|
||
The federal deferred tax assets presented above do not include the state tax benefits as our net deferred state tax assets are offset with a full valuation allowance.
At
December 31, 2018
, we had federal and state net operating loss (“NOL”) carryforwards of approximately
$4.3 billion
and
$2.4 billion
, respectively. These NOL carryforwards will expire between 2021 and 2038. At
December 31, 2018
, we had federal and state tax credit carryforwards of
$25 million
and
$3 million
, respectively. The federal tax credit carryforwards include investment tax credit carryforwards of
$14 million
related to capital equipment placed in service by Cheniere Partners. We account for our federal investment tax credits under the flow-through method. The federal and state tax credit carryforwards will expire between 2027 and 2037.
Under the Tax Cuts and Jobs Act, for taxable years beginning after December 31, 2017, our deduction for business interest is limited to the sum of our business interest income plus
30%
of our adjusted taxable income. For the purposes of this limitation, adjusted taxable income is computed without regard to any business interest expense or business interest income, and in the case of taxable years beginning before January 1, 2022, any deduction allowable for depreciation, amortization, or depletion. However, recently issued proposed Treasury Regulations provide that depreciation, amortization, or depletion expense that is capitalized to inventory, is not treated as depreciation, amortization, or depletion deduction for purposes of computing adjusted taxable income. Although the regulations are not final, we have elected to adopt the proposed Treasury Regulations for the tax year ended December 31, 2018. As a result, at December 31, 2018, we had disallowed business interest expense of
$92 million
that can be carried forward indefinitely.
Due to historical losses and other available evidence related to our ability to generate taxable income, we have maintained a valuation allowance against our net federal and state deferred tax assets as of
December 31, 2018
and
2017
. We will continue to evaluate the realizability of our deferred tax assets in the future. Release of the U.K. NOL valuation allowance resulted in a
$5 million
deferred tax benefit for the tax year ended
December 31, 2018
. The decrease in the valuation allowance was
$120 million
for the year ended
December 31, 2018
.
98
CHENIERE ENERGY, INC. AND SUBSIDIARIES
NOTES TO CONSOLIDATED FINANCIAL STATEMENTS—CONTINUED
Changes in the balance of unrecognized tax benefits are as follows (in millions):
|
Year Ended December 31,
|
|||||||
|
2018
|
2017
|
||||||
|
Balance at beginning of the year
|
$
|
62
|
|
$
|
103
|
|
|
|
Additions based on tax positions related to current year
|
—
|
|
—
|
|
|||
|
Additions for tax positions of prior years
|
—
|
|
—
|
|
|||
|
Reductions for tax positions of prior years
|
(1
|
)
|
(1
|
)
|
|||
|
Settlements
|
—
|
|
—
|
|
|||
|
U.S. tax reform rate change
|
—
|
|
(40
|
)
|
|||
|
Balance at end of the year
|
$
|
61
|
|
$
|
62
|
|
|
Any settlement of uncertain tax positions would result in an adjustment to our NOL carryforward which, if utilized, will reduce taxable income in a future year. As a result, the tabular rollforward reflects the unrecognized tax benefits at the reduced corporate income tax rate of
21%
.
Our effective tax rate will not be affected if the unrecognized federal income tax benefits provided above were recognized. Currently, we do not recognize any accrued liabilities, interest and penalties associated with the unrecognized tax benefits provided above in our Consolidated Statements of Operations or our Consolidated Balance Sheets because any settlement of uncertain tax positions would result in an adjustment to our NOL carryforward. We recognize interest and penalties related to income tax matters as part of income tax expense.
We experienced an ownership change within the provisions of U.S. Internal Revenue Code (“IRC”) Section 382 in 2008, 2010 and 2012. An analysis of the annual limitation on the utilization of our NOLs was performed in accordance with IRC Section 382. It was determined that IRC Section 382 will not limit the use of our NOLs over the carryover period. We will continue to monitor trading activity in our shares which may cause an additional ownership change which could ultimately affect our ability to fully utilize our existing NOL carryforwards.
We are subject to tax in the U.S. and various state and foreign jurisdictions. We remain subject to periodic audits and reviews by taxing authorities; however, we did not have any open income tax audits as of
December 31, 2018
. Federal and state tax returns for the years after 2014 remain open for examination. Tax authorities may have the ability to review and adjust carryover attributes that were generated prior to these periods if utilized in an open tax year.
NOTE 15—SHARE-BASED COMPENSATION
We have granted restricted stock shares, restricted stock units, performance stock units and phantom units to employees and non-employee directors under the Amended and Restated 2003 Stock Incentive Plan, as amended
(the “2003 Plan”)
, the 2011 Incentive Plan, as amended
(the “2011 Plan”)
, the 2015 Employee Inducement Incentive Plan
(the “Inducement Plan”)
and the 2015 Long-Term Cash Incentive Plan.
Total share-based compensation consisted of the following (in millions):
|
Year Ended December 31,
|
|||||||||||
|
2018
|
2017
|
2016
|
|||||||||
|
Share-based compensation costs, pre-tax:
|
|||||||||||
|
Equity awards
|
$
|
89
|
|
$
|
34
|
|
$
|
41
|
|
||
|
Liability awards
|
48
|
|
80
|
|
76
|
|
|||||
|
Total share-based compensation
|
137
|
|
|
114
|
|
117
|
|
||||
|
Capitalized share-based compensation
|
(24
|
)
|
(23
|
)
|
(16
|
)
|
|||||
|
Total share-based compensation expense
|
$
|
113
|
|
|
$
|
91
|
|
$
|
101
|
|
|
|
Tax benefit associated with share-based compensation expense
|
$
|
6
|
|
$
|
5
|
|
$
|
—
|
|
||
99
CHENIERE ENERGY, INC. AND SUBSIDIARIES
NOTES TO CONSOLIDATED FINANCIAL STATEMENTS—CONTINUED
The total unrecognized compensation cost at
December 31, 2018
relating to non-vested share-based compensation arrangements consisted of the following:
|
Unrecognized Compensation Cost
(in millions)
|
Recognized over a weighted average period
(years)
|
|||
|
Restricted Stock Share Awards
|
$
|
2
|
|
0.3
|
|
Restricted Share Unit and Performance Stock Unit Awards
|
$
|
136
|
|
1.7
|
|
Phantom Units Awards
|
$
|
11
|
|
1.4
|
Restricted Stock Share Awards
Restricted stock share awards are awards of common stock that are subject to restrictions on transfer and to a risk of forfeiture if the recipient terminates employment with us prior to the lapse of the restrictions. These awards vest based on service conditions (
one
,
two
,
three
or
four
-year service periods) and performance conditions. All performance conditions of the awards have been achieved as of
December 31, 2018
.
The 2003 Plan and 2011 Plan provide for the issuance of
21.0 million
shares and
35.0 million
shares, respectively, of our common stock that may be in the form of various share-based performance awards deemed by the Compensation Committee of our Board (the “Compensation Committee”).
The Inducement Plan initially provided for the issuance of up to
1.0 million
shares of our common stock in the form of stock-based awards deemed by the Compensation Committee to provide us with an opportunity to attract employees. As of
December 31, 2018
,
0.2 million
shares of restricted stock have been granted under the Inducement Plan. In December 2016, the Compensation Committee recommended, and our Board approved, reducing the remaining shares available for issuance under the Inducement Plan to
zero
.
The table below provides a summary of our restricted stock outstanding (in millions, except for per share information):
|
|
Shares
|
Weighted Average Grant Date Fair Value Per Share
|
|||||
|
Non-vested at January 1, 2018
|
2.2
|
|
$
|
24.29
|
|
||
|
Granted
|
—
|
|
—
|
|
|||
|
Vested
|
(2.1
|
)
|
24.03
|
|
|||
|
Forfeited
|
—
|
|
—
|
|
|||
|
Non-vested at December 31, 2018
|
0.1
|
|
$
|
45.77
|
|
||
The fair value of restricted stock share awards vested for the
years ended December 31, 2018, 2017 and 2016
were
$53 million
,
$78 million
and
$36 million
, respectively.
Restricted Share Unit and Performance Stock Unit Awards
Restricted stock units are stock awards that vest over a
two
- to
three
-year service period and entitle the holder to receive shares of our common stock upon vesting, subject to restrictions on transfer and to a risk of forfeiture if the recipient terminates employment with us prior to the lapse of the restrictions. Performance stock units provide for
three
-year cliff vesting with payouts based on our cumulative distributable cash flow per share from January 1, 2018 through December 31, 2020 compared to a pre-established performance target. The number of shares that may be earned at the end of the vesting period ranges from
50
to
200
percent of the target award amount if the threshold performance is met. Both restricted stock units and performance stock units will be settled in Cheniere common stock (on a one-for-one basis) and are classified as equity awards.
In January 2017, the issuance of awards with respect to
7.8 million
shares of common stock available for issuance under the 2011 Plan was approved at a special meeting of our shareholders.
100
CHENIERE ENERGY, INC. AND SUBSIDIARIES
NOTES TO CONSOLIDATED FINANCIAL STATEMENTS—CONTINUED
The table below provides a summary of our restricted share unit and performance stock unit awards outstanding assuming payout at target for awards containing performance conditions (in millions, except for per unit information):
|
|
Units
|
Weighted Average Grant Date Fair Value Per Unit
|
|||||
|
Non-vested at January 1, 2018
|
1.3
|
|
$
|
47.18
|
|
||
|
Granted (1)
|
2.6
|
|
59.50
|
|
|||
|
Vested
|
(0.4
|
)
|
48.40
|
|
|||
|
Forfeited
|
(0.1
|
)
|
53.92
|
|
|||
|
Non-vested at December 31, 2018
|
3.4
|
|
$
|
56.29
|
|
||
|
(1)
|
This number excludes
0.2 million
performance stock units, which represent the maximum number of common units that would be issued if the maximum level of performance under the target awards amount is achieved.
|
The table below provides a summary of restricted share unit and performance stock unit awards issued:
|
Year Ended December 31,
|
||||||||||||
|
2018
|
2017
|
2016
|
||||||||||
|
Units issued (in millions)
|
2.6
|
|
1.4
|
|
—
|
|
||||||
|
Weighted average grant date fair value per unit
|
$
|
59.50
|
|
$
|
47.16
|
|
$
|
—
|
|
|||
|
Fair value of units vested (in millions)
|
$
|
22
|
|
$
|
1
|
|
$
|
—
|
|
|||
Phantom Units Awards
Phantom units are share-based awards granted to employees over a vesting period that entitle the grantee to receive the cash equivalent to the value of a share of our common stock upon each vesting. We did
no
t issue any phantom units to our employees and non-employee directors during the
years ended December 31, 2018 and 2017
. During the year ended December 31, 2016, we issued
1.8 million
phantom units to our employees and non-employee directors. Phantom units are not eligible to receive quarterly distributions. These awards vest based on service conditions (
two
,
three
or
four
-year service periods).
The table below provides a summary of our phantom units outstanding (in millions):
|
|
Units
|
||
|
Non-vested at January 1, 2018
|
1.8
|
|
|
|
Granted
|
—
|
|
|
|
Vested
|
(1.5
|
)
|
|
|
Forfeited
|
—
|
|
|
|
Non-vested at December 31, 2018
|
0.3
|
|
|
The value of phantom units vested during the
years ended December 31, 2018, 2017 and 2016
was
$91 million
,
$86 million
and
$78 million
, respectively.
NOTE 16—EMPLOYEE BENEFIT PLAN
We have a defined contribution plan
(“401(k) Plan”)
which allows eligible employees to contribute up to
75%
of their compensation up to the IRS maximum. We match each employee’s deferrals (contributions) up to
6%
of compensation and may make additional contributions at our discretion. Employees are immediately vested in the contributions made by us. Our contributions to the
401(k) Plan
were
$9 million
,
$7 million
and
$6 million
for the
years ended December 31, 2018, 2017 and 2016
, respectively. We have made
no
discretionary contributions to the
401(k) Plan
to date.
101
CHENIERE ENERGY, INC. AND SUBSIDIARIES
NOTES TO CONSOLIDATED FINANCIAL STATEMENTS—CONTINUED
NOTE 17—
NET INCOME (LOSS)
PER SHARE ATTRIBUTABLE TO COMMON STOCKHOLDERS
The following table reconciles basic and diluted weighted average common shares outstanding for the
years ended December 31, 2018, 2017 and 2016
(in millions, except per share data):
|
Year Ended December 31,
|
||||||||||||
|
|
2018
|
2017
|
2016
|
|||||||||
|
Weighted average common shares outstanding:
|
||||||||||||
|
Basic
|
245.6
|
|
233.1
|
|
228.8
|
|
||||||
|
Dilutive unvested stock
|
2.4
|
|
—
|
|
—
|
|
||||||
|
Diluted
|
248.0
|
|
233.1
|
|
228.8
|
|
||||||
|
Basic net income (loss) per share attributable to common stockholders
|
$
|
1.92
|
|
$
|
(1.68
|
)
|
$
|
(2.67
|
)
|
|||
|
Diluted net income (loss) per share attributable to common stockholders
|
$
|
1.90
|
|
$
|
(1.68
|
)
|
$
|
(2.67
|
)
|
|||
Potentially dilutive securities that were not included in the diluted
net income (loss)
per share computations because their effects would have been anti-dilutive were as follows (in millions):
|
Year Ended December 31,
|
||||||||
|
|
2018
|
2017
|
2016
|
|||||
|
Unvested stock (1)
|
0.8
|
|
3.4
|
|
0.6
|
|
||
|
Convertible notes (2)
|
17.5
|
|
16.9
|
|
16.3
|
|
||
|
Total potentially dilutive common shares
|
18.3
|
|
20.3
|
|
16.9
|
|
||
|
(1)
|
Does not include
0.4 million
shares,
0.2 million
shares and
5.0 million
shares for each of the
years ended December 31, 2018, 2017 and 2016
, of unvested stock because the performance conditions had not yet been satisfied as of
December 31, 2018
,
2017
and 2016, respectively.
|
|
(2)
|
Includes number of shares in aggregate issuable upon conversion of the
2021 Cheniere Convertible Unsecured Notes
and the
2045 Cheniere Convertible Senior Notes
. There were
no
shares included in the computation of diluted
net income (loss)
per share for the
2025 CCH HoldCo II Convertible Senior Notes
because substantive non-market-based contingencies underlying the eligible conversion date have not been met as of
December 31, 2018
.
|
NOTE 18—LEASES
During the
years ended December 31, 2018, 2017 and 2016
, we recognized rental expense for all operating leases of
$335 million
,
$199 million
and
$86 million
, respectively, related primarily to LNG vessel time charters, office space and land sites. Our land site leases for the Sabine Pass LNG terminal have initial terms varying up to
30
years with multiple options to renew up to an additional
60
years.
Future annual minimum lease payments, excluding inflationary adjustments, for operating leases are as follows (in millions):
|
Years Ending December 31,
|
Operating Leases (1)
|
||
|
2019 (2)
|
$
|
380
|
|
|
2020
|
184
|
|
|
|
2021
|
238
|
|
|
|
2022
|
264
|
|
|
|
2023
|
264
|
|
|
|
Thereafter
|
999
|
|
|
|
Total
|
$
|
2,329
|
|
|
(1)
|
Includes certain lease option renewals that are reasonably assured and payments for certain non-lease components
.
|
|
(2)
|
Does not include
$43 million
in aggregate payments we will receive from our LNG vessel time charter subleases.
|
102
CHENIERE ENERGY, INC. AND SUBSIDIARIES
NOTES TO CONSOLIDATED FINANCIAL STATEMENTS—CONTINUED
Capital Leases
In December 2015, we entered into a lease agreement for marine services related to the CCL Project that was classified as a capital lease. The service term of this lease commenced at various times during the
year ended December 31, 2018
, and the tug vessels received under the agreement are recorded within property, plant and equipment, net on our Consolidated Balance Sheets.
Future annual minimum lease payments, excluding inflationary adjustments, for capital leases are as follows (in millions):
|
Years Ending December 31,
|
Capital Leases
|
||
|
2019
|
$
|
5
|
|
|
2020
|
5
|
|
|
|
2021
|
5
|
|
|
|
2022
|
5
|
|
|
|
2023
|
5
|
|
|
|
Thereafter
|
73
|
|
|
|
Total minimum lease payments (1)
|
98
|
|
|
|
Less: amount representing imputed interest
|
(39
|
)
|
|
|
Present value of minimum lease payment
|
59
|
|
|
|
Less: current portion of capital lease obligations
|
(2
|
)
|
|
|
Non-current portion of capital lease obligations
|
$
|
57
|
|
|
(1)
|
Does not include payments for non-lease components of
$98 million
.
|
NOTE 19—COMMITMENTS AND CONTINGENCIES
We have various contractual obligations which are recorded as liabilities in our Consolidated Financial Statements. Other items, such as certain purchase commitments and other executed contracts which do not meet the definition of a liability as of
December 31, 2018
, are not recognized as liabilities but require disclosures in our Consolidated Financial Statements.
LNG Terminal Commitments and Contingencies
Obligations under EPC Contracts
SPL has lump sum turnkey contracts with Bechtel Oil, Gas and Chemicals, Inc. (“Bechtel”) for the engineering, procurement and construction of Train 5 and Train 6 of the SPL Project. The EPC contract prices for Train 5 of the SPL Project and Train 6 of the SPL Project are approximately
$3.1 billion
and
$2.5 billion
, respectively, reflecting amounts incurred under change orders through
December 31, 2018
, and including estimated costs for an optional third marine berth.
CCL has lump sum turnkey contracts with Bechtel for the engineering, procurement and construction of Stage 1 and Stage 2 of the CCL Project. The EPC contract prices for Stage 1 of the CCL Project and Stage 2 of the CCL Project are approximately
$7.8 billion
and
$2.4 billion
, respectively, reflecting amounts incurred under change orders through
December 31, 2018
.
SPL and CCL have the right to terminate each of its respective EPC contracts for its convenience, in which case Bechtel will be paid (1) the portion of the contract price for the work performed, (2) costs reasonably incurred by Bechtel on account of such termination and demobilization and (3) a lump sum of up to
$30 million
depending on the termination date.
Obligations under SPAs
SPL and CCL have third-party SPAs which obligate SPL and CCL, respectively, to purchase and liquefy sufficient quantities of natural gas to deliver contracted volumes of LNG to the customers’ vessels, subject to completion of construction of applicable specified Trains of the SPL Project or the CCL Project. In addition, our integrated marketing function has third-party SPAs which obligate us to deliver contracted volumes of LNG to the customers’ vessels or to the customers at their LNG receiving terminals.
103
CHENIERE ENERGY, INC. AND SUBSIDIARIES
NOTES TO CONSOLIDATED FINANCIAL STATEMENTS—CONTINUED
Obligations under LNG TUAs
SPLNG has third-party TUAs with
Total
and Chevron U.S.A. Inc. to provide berthing for LNG vessels and for the unloading, storage and regasification of LNG at the Sabine Pass LNG terminal.
Obligations under Natural Gas Supply, Transportation and Storage Service Agreements
SPL and CCL primarily have index-based physical natural gas supply contracts to secure natural gas feedstock for the SPL Project and the CCL Project, respectively. The terms of these contracts range up to
eight
years, some of which commence upon the satisfaction of certain conditions precedent. As of
December 31, 2018
, SPL and CCL have secured up to approximately
3,464
TBtu and
2,801
TBtu, respectively, of natural gas feedstock through natural gas supply contracts, a portion of which are considered purchase obligations if the conditions precedent are met.
Additionally, SPL and CCL have transportation and storage service agreements for the SPL Project and the CCL Project, respectively. The initial terms of the transportation agreements range up to
20
years for the SPL Project the CCL Project, with renewal options for certain contracts, and commence upon the occurrence of conditions precedent. The term of the storage service agreements for the SPL Project ranges up to
ten
years and the term of the storage service agreements for the CCL Project ranges up to
five
years.
As of
December 31, 2018
, the obligations of SPL and CCL under natural gas supply, transportation and storage service agreements for contracts in which conditions precedent were met were as follows (in millions):
|
Years Ending December 31,
|
Payments Due (1)
|
||
|
2019
|
$
|
3,148
|
|
|
2020
|
1,991
|
|
|
|
2021
|
1,452
|
|
|
|
2022
|
1,010
|
|
|
|
2023
|
818
|
|
|
|
Thereafter
|
3,355
|
|
|
|
Total
|
$
|
11,774
|
|
|
(1)
|
Pricing of natural gas supply contracts are variable based on market commodity basis prices adjusted for basis spread
.
Amounts included are based on prices and basis spreads as of
December 31, 2018
.
|
Restricted Net Assets
At
December 31, 2018
, our restricted net assets of consolidated subsidiaries were approximately
$1.6 billion
.
Other Commitments
In the ordinary course of business, we have entered into certain multi-year licensing and service agreements, none of which are considered material to our financial position. Additionally, we have various lease commitments, as disclosed in
Note 18—Leases
.
Legal Proceedings
We may in the future be involved as a party to various legal proceedings, which are incidental to the ordinary course of business. We regularly analyze current information and, as necessary, provide accruals for probable liabilities on the eventual disposition of these matters.
Parallax Litigation
In 2015, our wholly owned subsidiary, Cheniere LNG Terminals, LLC (“CLNGT”), entered into discussions with Parallax Enterprises, LLC (“Parallax Enterprises”) regarding the potential joint development of two liquefaction plants in Louisiana (the
104
CHENIERE ENERGY, INC. AND SUBSIDIARIES
NOTES TO CONSOLIDATED FINANCIAL STATEMENTS—CONTINUED
“Potential Liquefaction Transactions”). While the parties negotiated regarding the Potential Liquefaction Transactions, CLNGT loaned Parallax Enterprises approximately
$46 million
, as reflected in a secured note dated April 23, 2015, as amended on June 30, 2015, September 30, 2015 and November 4, 2015 (the “Secured Note”). The Secured Note was secured by all assets of Parallax Enterprises and its subsidiary entities. On June 30, 2015, Parallax Enterprises’ parent entity, Parallax Energy LLC (“Parallax Energy”), executed a Pledge and Guarantee Agreement further securing repayment of the Secured Note by providing a parent guaranty and a pledge of all of the equity of Parallax Enterprises in satisfaction of the Secured Note (the “Pledge Agreement”). CLNGT and Parallax Enterprises never executed a definitive agreement to pursue the Potential Liquefaction Transactions. The Secured Note matured on December 11, 2015, and Parallax Enterprises failed to make payment. On February 3, 2016, CLNGT filed an action against Parallax Energy, Parallax Enterprises and certain of Parallax Enterprises’ subsidiary entities, styled Cause No. 4:16-cv-00286, Cheniere LNG Terminals, LLC v. Parallax Energy LLC, et al., in the United States District Court for the Southern District of Texas (the “Texas Federal Suit”). CLNGT asserted claims in the Texas Federal Suit for (1) recovery of all amounts due under the Secured Note and (2) declaratory relief establishing that CLNGT is entitled to enforce its rights under the Secured Note and Pledge Agreement in accordance with each instrument’s terms and that CLNGT has no obligations of any sort to Parallax Enterprises concerning the Potential Liquefaction Transactions. On March 11, 2016, Parallax Enterprises and the other defendants in the Texas Federal Suit moved to dismiss the suit for lack of subject matter jurisdiction. On August 2, 2016, the court denied the defendants’ motion to dismiss without prejudice and permitted the parties to pursue jurisdictional discovery.
On March 11, 2016, Parallax Enterprises filed a suit against us and CLNGT styled Civil Action No. 62-810, Parallax Enterprises LLP v. Cheniere Energy, Inc. and Cheniere LNG Terminals, LLC, in the 25th Judicial District Court of Plaquemines Parish, Louisiana (the “Louisiana Suit”), wherein Parallax Enterprises asserted claims for breach of contract, fraudulent inducement, negligent misrepresentation, detrimental reliance, unjust enrichment and violation of the Louisiana Unfair Trade Practices Act. Parallax Enterprises predicated its claims in the Louisiana Suit on an allegation that we and CLNGT breached a purported agreement to jointly develop the Potential Liquefaction Transactions. Parallax Enterprises sought
$400 million
in alleged economic damages and rescission of the Secured Note. On April 15, 2016, we and CLNGT removed the Louisiana Suit to the United States District Court for the Eastern District of Louisiana, which subsequently transferred the Louisiana Suit to the United States District Court for the Southern District of Texas, where it was assigned Civil Action No. 4:16-cv-01628 and transferred to the same judge presiding over the Texas Federal Suit for coordinated handling. On August 22, 2016, Parallax Enterprises voluntarily dismissed all claims asserted against CLNGT and us in the Louisiana Suit without prejudice to refiling.
On July 27, 2017, the Parallax entities named as defendants in the Texas Federal Suit reurged their motion to dismiss and simultaneously filed counterclaims against CLNGT and third party claims against us for breach of contract, breach of fiduciary duty, promissory estoppel, quantum meruit and fraudulent inducement of the Secured Note and Pledge Agreement, based on substantially the same factual allegations Parallax Enterprises made in the Louisiana Suit. These Parallax entities also simultaneously filed an action styled Cause No. 2017-49685, Parallax Enterprises, LLC, et al. v. Cheniere Energy, Inc., et al., in the 61st District Court of Harris County, Texas (the “Texas State Suit”), which asserts substantially the same claims these entities asserted in the Texas Federal Suit. On July 31, 2017, CLNGT withdrew its opposition to the dismissal of the Texas Federal Suit without prejudice on jurisdictional grounds and the federal court subsequently dismissed the Texas Federal Suit without prejudice. We and CLNGT simultaneously filed an answer and counterclaims in the Texas State Suit, asserting the same claims CLNGT had previously asserted in the Texas Federal Suit. Additionally, CLNGT filed third party claims against Parallax principals Martin Houston, Christopher Bowen Daniels, Howard Candelet and Mark Evans, as well as Tellurian Investments, Inc., Driftwood LNG, LLC, Driftwood LNG Pipeline LLC and Tellurian Services LLC, formerly known as Parallax Services LLC, including claims for tortious interference with CLNGT’s collateral rights under the Secured Note and Pledge Agreement, fraudulent transfer, conspiracy/aiding and abetting. Discovery in the Texas State Suit is ongoing. Trial is currently set for June 2019.
On February 15, 2019, we filed an action with CLNGT against Charif Souki, our former Chairman of the Board and Chief Executive Officer, styled, Cause No. 2019-11529,
Cheniere Energy, Inc. and Cheniere LNG Terminals, LLC v. Charif Souki
, in the 55th District Court of Harris County, Texas, which asserts claims of breach of fiduciary duties, fraudulent transfer, tortious interference with CLNGT’s collateral rights under the Secured Note and Pledge Agreement, and conspiracy/aiding and abetting.
We do not expect that the resolution of any of the foregoing litigation will have a material adverse impact on our financial results.
105
CHENIERE ENERGY, INC. AND SUBSIDIARIES
NOTES TO CONSOLIDATED FINANCIAL STATEMENTS—CONTINUED
NOTE 20—CUSTOMER CONCENTRATION
The following table shows customers with revenues of 10% or greater of total revenues from external customers and customers with accounts receivable balances of 10% or greater of total accounts receivable from external customers:
|
Percentage of Total Revenues from External Customers
|
Percentage of Accounts Receivable from External Customers
|
|||||||||
|
Year Ended December 31,
|
December 31,
|
|||||||||
|
2018
|
2017
|
2016
|
2018
|
2017
|
||||||
|
Customer A
|
18%
|
24%
|
39%
|
21%
|
28%
|
|||||
|
Customer B
|
14%
|
14%
|
*
|
14%
|
16%
|
|||||
|
Customer C
|
19%
|
14%
|
—%
|
18%
|
14%
|
|||||
|
Customer D
|
13%
|
*
|
*
|
*
|
—%
|
|||||
|
Customer E
|
*
|
17%
|
—%
|
—%
|
—%
|
|||||
|
Customer F
|
*
|
*
|
*
|
*
|
15%
|
|||||
|
Customer G
|
*
|
*
|
*
|
10%
|
—%
|
|||||
|
Customer H
|
*
|
*
|
13%
|
—%
|
—%
|
|||||
* Less than 10%
The following table shows revenues from external customers attributable to the country in which the revenues were derived (in millions). We attribute revenues from external customers to the country in which the party to the applicable agreement has its principal place of business. Substantially all of our long-lived assets are located in the United States.
|
Revenues from External Customers
|
|||||||||||
|
Year Ended December 31,
|
|||||||||||
|
2018
|
2017
|
2016
|
|||||||||
|
United States
|
$
|
1,911
|
|
$
|
1,592
|
|
$
|
769
|
|
||
|
South Korea
|
1,517
|
|
762
|
|
—
|
|
|||||
|
Ireland
|
1,098
|
|
787
|
|
63
|
|
|||||
|
India
|
1,048
|
|
48
|
|
23
|
|
|||||
|
Japan
|
193
|
|
1,246
|
|
162
|
|
|||||
|
Other countries
|
2,220
|
|
1,166
|
|
266
|
|
|||||
|
Total
|
$
|
7,987
|
|
$
|
5,601
|
|
$
|
1,283
|
|
||
NOTE 21—SUPPLEMENTAL CASH FLOW INFORMATION
The following table provides supplemental disclosure of cash flow information (in millions):
|
|
Year Ended December 31,
|
|||||||||||
|
|
2018
|
2017
|
2016
|
|||||||||
|
Cash paid during the period for interest, net of amounts capitalized
|
$
|
707
|
|
$
|
305
|
|
$
|
66
|
|
|||
|
Non-cash investing and financing activities:
|
||||||||||||
|
Issuance of stock to acquire additional interest in Cheniere Holdings
|
702
|
|
2
|
|
94
|
|
||||||
|
Contribution of assets to equity method investee
|
—
|
|
14
|
|
—
|
|
||||||
|
Acquisition of assets under capital lease
|
60
|
|
—
|
|
—
|
|
||||||
The balance in property, plant and equipment, net funded with accounts payable and accrued liabilities was
$420 million
,
$521 million
and
$395 million
as of
December 31, 2018
,
2017
and 2016, respectively.
106
CHENIERE ENERGY, INC. AND SUBSIDIARIES
NOTES TO CONSOLIDATED FINANCIAL STATEMENTS—CONTINUED
NOTE 22—RECENT ACCOUNTING STANDARDS
The following table provides a brief description of a recent accounting standard that had not been adopted by us as of
December 31, 2018
:
|
Standard
|
Description
|
Expected Date of Adoption
|
Effect on our Consolidated Financial Statements or Other Significant Matters
|
|||
|
ASU 2016-02,
Leases (Topic 842)
, and subsequent amendments thereto
|
This standard requires a lessee to recognize leases on its balance sheet by recording a lease liability representing the obligation to make future lease payments and a right-of-use asset representing the right to use the underlying asset for the lease term. A lessee is permitted to make an election not to recognize lease assets and liabilities for leases with a term of 12 months or less. The standard also modifies the definition of a lease and requires expanded disclosures. This guidance may be early adopted, and may be adopted using either a modified retrospective approach to apply the standard at the beginning of the earliest period presented in the financial statements or an optional transition approach to apply the standard at the date of adoption with no retrospective adjustments to prior periods. Certain additional practical expedients are also available.
|
January 1, 2019
|
We will adopt this standard on January 1, 2019 using the optional transition approach to apply the standard at the beginning of the first quarter of 2019 with no retrospective adjustments to prior periods. The adoption of the standard will result in the recognition of right-of-use assets and lease liabilities for operating leases of approximately $550 million on our Consolidated Balance Sheets, with no material impact on our Consolidated Statements of Operations or Consolidated Statements of Cash Flows. The adoption of this standard will also result in additional disclosures including the significant judgments and assumptions used in applying the standard. When we adopt this standard we will elect the practical expedients to (1) carryforward prior conclusions related to lease identification and classification for existing leases, (2) combine lease and non-lease components of an arrangement for all classes of leased assets, (3) omit short-term leases with a term of 12 months or less from recognition on the balance sheet and (4) carryforward our existing accounting for land easements not previously accounted for as leases.
|
|||
107
CHENIERE ENERGY, INC. AND SUBSIDIARIES
NOTES TO CONSOLIDATED FINANCIAL STATEMENTS—CONTINUED
Additionally, the following table provides a brief description of recent accounting standards that were adopted by us during the reporting period:
|
Standard
|
Description
|
Date of Adoption
|
Effect on our Consolidated Financial Statements or Other Significant Matters
|
|||
|
ASU 2014-09,
Revenue from Contracts with Customers (Topic 606)
, and subsequent amendments thereto
|
This standard provides a single, comprehensive revenue recognition model which replaces and supersedes most existing revenue recognition guidance and requires an entity to recognize revenue to depict the transfer of promised goods or services to customers in an amount that reflects the consideration to which the entity expects to be entitled in exchange for those goods or services. The standard requires that the costs to obtain and fulfill contracts with customers should be recognized as assets and amortized to match the pattern of transfer of goods or services to the customer if expected to be recoverable. The standard also requires enhanced disclosures. This guidance may be adopted either retrospectively to each prior reporting period presented subject to allowable practical expedients (“full retrospective approach”) or as a cumulative-effect adjustment as of the date of adoption (“modified retrospective approach”).
|
January 1, 2018
|
We adopted this guidance on January 1, 2018, using the full retrospective method. The adoption of this guidance represents a change in accounting principle that will provide financial statement readers with enhanced disclosures regarding the nature, amount, timing and uncertainty of revenue and cash flows arising from contracts with customers. The adoption of this guidance did not impact our previously reported Consolidated Financial Statements in any prior period nor did it result in a cumulative effect adjustment to retained earnings. See
Note 13—Revenues from Contracts with Customers
for additional disclosures.
|
|||
|
ASU 2016-16,
Income Taxes (Topic 740): Intra-Entity Transfers of Assets Other Than Inventory
|
This standard requires the immediate recognition of the tax consequences of intercompany asset transfers other than inventory. This guidance may be early adopted, but only at the beginning of an annual period, and must be adopted using a modified retrospective approach.
|
January 1, 2018
|
The adoption of this guidance did not have an impact on our Consolidated Financial Statements or related disclosures.
|
|||
108
CHENIERE ENERGY, INC. AND SUBSIDIARIES
SUPPLEMENTAL INFORMATION TO CONSOLIDATED FINANCIAL STATEMENTS
SUMMARIZED QUARTERLY FINANCIAL DATA
(unaudited)
Summarized Quarterly Financial Data—(in millions, except per share amounts)
|
|
First
Quarter
|
Second
Quarter
|
Third
Quarter
|
Fourth
Quarter
|
||||||||||||
|
Year ended December 31, 2018:
|
||||||||||||||||
|
Revenues
|
$
|
2,242
|
|
$
|
1,543
|
|
$
|
1,819
|
|
$
|
2,383
|
|
||||
|
Income from operations
|
747
|
|
336
|
|
425
|
|
516
|
|
||||||||
|
Net income
|
600
|
|
150
|
|
227
|
|
223
|
|
||||||||
|
Net income (loss) attributable to common stockholders
|
357
|
|
(18
|
)
|
65
|
|
67
|
|
||||||||
|
Net income (loss) per share attributable to common stockholders—basic (1)
|
1.52
|
|
(0.07
|
)
|
0.26
|
|
0.26
|
|
||||||||
|
Net income (loss) per share attributable to common stockholders—diluted (1)
|
1.50
|
|
(0.07
|
)
|
0.26
|
|
0.26
|
|
||||||||
|
Year ended December 31, 2017:
|
|
|
|
|
|
|
|
|
||||||||
|
Revenues
|
$
|
1,211
|
|
$
|
1,241
|
|
$
|
1,403
|
|
$
|
1,746
|
|
||||
|
Income from operations
|
376
|
|
274
|
|
297
|
|
441
|
|
||||||||
|
Net income
|
172
|
|
21
|
|
90
|
|
280
|
|
||||||||
|
Net income (loss) attributable to common stockholders
|
54
|
|
(285
|
)
|
(289
|
)
|
127
|
|
||||||||
|
Net income (loss) per share attributable to common stockholders—basic and diluted (1)
|
0.23
|
|
(1.23
|
)
|
(1.24
|
)
|
0.54
|
|
||||||||
|
(1)
|
The sum of the quarterly net income (loss) per share—basic and diluted may not equal the full year amount as the computations of the weighted average common shares outstanding for basic and diluted shares outstanding for each quarter and the full year are performed independently.
|
109
|
ITEM 9.
|
CHANGES IN AND DISAGREEMENTS WITH ACCOUNTANTS ON ACCOUNTING AND FINANCIAL DISCLOSURE
|
None.
|
ITEM 9A.
|
CONTROLS AND PROCEDURES
|
Evaluation of Disclosure Controls and Procedures
Disclosure controls and procedures include, without limitation, controls and procedures designed to ensure that information required to be disclosed by us in reports we file or submit under the
Exchange Act
is recorded, processed, summarized and reported within the time periods specified in the SEC’s rules and forms, and that such information is accumulated and communicated to our management, including our principal executive officer and principal financial officer, as appropriate, to allow timely decisions regarding required disclosure.
Based on their evaluation as of the end of the fiscal year ended
December 31, 2018
, our principal executive officer and principal financial officer have concluded that our disclosure controls and procedures (as defined in Rules 13a-15(e) and 15d-15(e) under the
Exchange Act
) are effective to ensure that information required to be disclosed in reports that we file or submit under the
Exchange Act
are (1) accumulated and communicated to our management, including our principal executive officer and principal financial officer, as appropriate, to allow timely decisions regarding required disclosure and (2) recorded, processed, summarized and reported within the time periods specified in the SEC’s rules and forms.
During the most recent fiscal quarter, there have been no changes in our internal control over financial reporting that have materially affected, or are reasonably likely to materially affect, our internal control over financial reporting.
Management’s Report on Internal Control Over Financial Reporting
Our Management’s Report on Internal Control Over Financial Reporting is included in our Consolidated Financial Statements on page
61
and is incorporated herein by reference.
|
ITEM 9B.
|
OTHER INFORMATION
|
None.
PART III
Pursuant to paragraph 3 of General Instruction G to Form 10-K, the information required by Items 10 through 14 of Part III of this Report is incorporated by reference from Cheniere’s definitive proxy statement, which is to be filed pursuant to Regulation 14A within 120 days after the end of Cheniere’s fiscal year ended
December 31, 2018
.
110
PART IV
|
ITEM 15.
|
EXHIBITS AND FINANCIAL STATEMENT SCHEDULES
|
|
(a)
|
Financial Statements, Schedules and Exhibits
|
|
(1)
|
Financial Statements—Cheniere Energy, Inc. and Subsidiaries:
|
|
(2)
|
Financial Statement Schedules:
|
|
(3)
|
Exhibits:
|
Certain of the agreements filed as exhibits to this Form 10-K contain representations, warranties, covenants and conditions by the parties to the agreements that have been made solely for the benefit of the parties to the agreement. These representations, warranties, covenants and conditions:
|
•
|
should not in all instances be treated as categorical statements of fact, but rather as a way of allocating the risk to one of the parties if those statements prove to be inaccurate;
|
|
•
|
may have been qualified by disclosures that were made to the other parties in connection with the negotiation of the agreements, which disclosures are not necessarily reflected in the agreements;
|
|
•
|
may apply standards of materiality that differ from those of a reasonable investor; and
|
|
•
|
were made only as of specified dates contained in the agreements and are subject to subsequent developments and changed circumstances.
|
Accordingly, these representations and warranties may not describe the actual state of affairs as of the date they were made or at any other time. These agreements are included to provide you with information regarding their terms and are not intended to provide any other factual or disclosure information about the Company or the other parties to the agreements. Investors should not rely on them as statements of fact.
|
Exhibit No.
|
Description
|
|
|
2.1
|
||
|
3.1
|
||
|
3.2
|
||
111
|
Exhibit No.
|
Description
|
|
|
3.3
|
||
|
3.4
|
||
|
3.5
|
||
|
3.6
|
||
|
3.7
|
||
|
4.1
|
||
|
4.2
|
||
|
4.3
|
||
|
4.4
|
||
|
4.5
|
||
|
4.6
|
||
|
4.7
|
||
|
4.8
|
||
|
4.9
|
||
|
4.10
|
||
|
4.11
|
||
|
4.12
|
||
|
4.13
|
||
|
4.14
|
||
|
4.15
|
||
|
4.16
|
||
|
4.17
|
||
|
4.18
|
||
|
4.19
|
||
112
|
Exhibit No.
|
Description
|
|
|
4.20
|
||
|
4.21
|
||
|
4.22
|
||
|
4.23
|
||
|
4.24
|
||
|
4.25
|
||
|
4.26
|
||
|
4.27
|
||
|
4.28
|
||
|
4.29
|
||
|
4.30
|
||
|
4.31
|
||
|
4.32
|
||
|
4.33
|
||
|
4.34
|
||
|
4.35
|
||
|
4.36
|
||
|
4.37
|
||
|
4.38
|
||
|
4.39
|
||
|
10.1
|
||
|
10.2
|
||
113
|
Exhibit No.
|
Description
|
|
|
10.3
|
||
|
10.4
|
||
|
10.5
|
||
|
10.6
|
||
|
10.7
|
||
|
10.8
|
||
|
10.9
|
||
|
10.10
|
||
|
10.11
|
||
|
10.12
|
||
|
10.13
|
||
|
10.14
|
||
|
10.15†
|
||
|
10.16†
|
||
|
10.17†
|
||
|
10.18†
|
||
|
10.19†
|
||
|
10.20†
|
||
|
10.21†
|
||
114
|
Exhibit No.
|
Description
|
|
|
10.22†
|
||
|
10.23†
|
||
|
10.24†
|
||
|
10.25†
|
||
|
10.26†
|
||
|
10.27†
|
||
|
10.28†
|
||
|
10.29†
|
||
|
10.30†
|
||
|
10.31†
|
||
|
10.32†
|
||
|
10.33†
|
||
|
10.34†
|
||
|
10.35*†
|
||
|
10.36†
|
||
|
10.37†
|
||
|
10.38†
|
||
|
10.39†
|
||
|
10.40†
|
||
115
|
Exhibit No.
|
Description
|
|
|
10.41†
|
||
|
10.42†
|
||
|
10.43†
|
||
|
10.44†
|
||
|
10.45†
|
||
|
10.46†
|
||
|
10.47†
|
||
|
10.48†
|
||
|
10.49†
|
||
|
10.50†
|
||
|
10.51
|
||
|
10.52
|
||
|
10.53
|
||
|
10.54
|
||
|
10.55
|
||
116
|
Exhibit No.
|
Description
|
|
|
10.56
|
||
|
10.57
|
||
|
10.58
|
||
|
10.59
|
||
|
10.60*
|
||
|
10.61
|
||
|
10.62*
|
||
|
10.63
|
||
|
10.64
|
||
|
10.65
|
||
|
10.66
|
||
|
10.67
|
||
117
|
Exhibit No.
|
Description
|
|
|
10.68
|
||
|
10.69
|
||
|
10.70
|
||
|
10.71
|
||
|
10.72
|
||
|
10.73
|
||
|
10.74
|
||
|
10.75
|
||
|
10.76
|
||
|
10.77
|
||
|
10.78
|
||
|
10.79
|
||
118
|
Exhibit No.
|
Description
|
|
|
10.80
|
||
|
10.81
|
||
|
10.82
|
||
|
10.83
|
||
|
10.84
|
||
|
10.85
|
||
|
10.86
|
||
|
10.87
|
||
|
10.88
|
||
119
|
Exhibit No.
|
Description
|
|
|
10.89
|
||
|
10.90
|
||
|
10.91
|
||
|
10.92
|
||
|
10.93
|
||
|
10.94
|
||
|
10.95
|
||
|
10.96*
|
||
120
|
Exhibit No.
|
Description
|
|
|
10.97
|
||
|
10.98
|
||
|
10.99
|
||
|
10.100
|
||
|
10.101
|
||
|
10.102
|
||
121
|
Exhibit No.
|
Description
|
|
|
10.103
|
||
|
10.104
|
||
|
10.105
|
||
|
10.106
|
||
|
10.107
|
||
|
10.108
|
||
|
10.109
|
||
122
|
Exhibit No.
|
Description
|
|
|
10.110
|
||
|
10.111
|
||
|
10.112
|
||
|
10.113
|
||
|
10.114*
|
||
|
10.115
|
||
|
10.116
|
||
123
|
Exhibit No.
|
Description
|
|
|
10.117*
|
||
|
10.118
|
||
|
10.119
|
||
|
10.120
|
||
|
10.121
|
||
|
10.122
|
||
|
10.123
|
||
|
10.124
|
||
|
10.125
|
||
|
10.126
|
||
|
10.127
|
||
|
10.128
|
||
|
10.129
|
||
|
10.130
|
||
|
10.131
|
||
124
|
Exhibit No.
|
Description
|
|
|
10.132
|
||
|
10.133
|
||
|
10.134
|
||
|
10.135
|
||
|
10.136
|
||
|
10.137
|
||
|
10.138
|
||
|
10.139
|
||
|
10.140
|
||
|
10.141
|
||
|
10.142
|
||
|
10.143
|
||
|
10.144
|
||
|
10.145
|
||
|
21.1*
|
||
|
23.1*
|
||
|
31.1*
|
||
|
31.2*
|
||
|
32.1**
|
||
125
|
Exhibit No.
|
Description
|
|
|
32.2**
|
||
|
101.INS*
|
XBRL Instance Document
|
|
|
101.SCH*
|
XBRL Taxonomy Extension Schema Document
|
|
|
101.CAL*
|
XBRL Taxonomy Extension Calculation Linkbase Document
|
|
|
101.DEF*
|
XBRL Taxonomy Extension Definition Linkbase Document
|
|
|
101.LAB*
|
XBRL Taxonomy Extension Labels Linkbase Document
|
|
|
101.PRE*
|
XBRL Taxonomy Extension Presentation Linkbase Document
|
|
|
*
|
Filed herewith.
|
|
**
|
Furnished herewith.
|
|
†
|
Management contract or compensatory plan or arrangement.
|
126
SCHEDULE I—CONDENSED FINANCIAL INFORMATION OF REGISTRANT
CHENIERE ENERGY, INC.
CONDENSED BALANCE SHEETS
(in millions)
|
|
December 31,
|
||||||
|
|
2018
|
2017
|
|||||
|
ASSETS
|
|
|
|
||||
|
Cash and cash equivalents
|
$
|
—
|
|
$
|
—
|
|
|
|
Restricted cash
|
—
|
|
—
|
|
|||
|
Other current assets
|
1
|
|
—
|
|
|||
|
Property, plant and equipment, net
|
14
|
|
15
|
|
|||
|
Debt issuance and deferred financing costs, net
|
21
|
|
12
|
|
|||
|
Investments in affiliates
|
883
|
|
(435
|
)
|
|||
|
Total assets
|
$
|
919
|
|
$
|
(408
|
)
|
|
|
LIABILITIES AND STOCKHOLDERS’ DEFICIT
|
|||||||
|
Current liabilities
|
$
|
9
|
|
$
|
8
|
|
|
|
Long-term debt, net
|
1,436
|
|
1,348
|
|
|||
|
Stockholders’ deficit
|
(526
|
)
|
(1,764
|
)
|
|||
|
Total liabilities and stockholders’ deficit
|
$
|
919
|
|
$
|
(408
|
)
|
|
The accompanying notes are an integral part of these condensed financial statements.
127
SCHEDULE I—CONDENSED FINANCIAL INFORMATION OF REGISTRANT
CHENIERE ENERGY, INC.
CONDENSED STATEMENTS OF OPERATIONS
(in millions)
|
|
Year Ended December 31,
|
||||||||||
|
|
2018
|
2017
|
2016
|
||||||||
|
General and administrative expense
|
$
|
8
|
|
$
|
7
|
|
$
|
6
|
|
||
|
Other income (expense)
|
|||||||||||
|
Interest expense, net
|
(128
|
)
|
(118
|
)
|
(104
|
)
|
|||||
|
Interest expense, net—affiliates
|
—
|
|
—
|
|
(7
|
)
|
|||||
|
Interest income—affiliates
|
—
|
|
—
|
|
24
|
|
|||||
|
Equity income (loss) of affiliates
|
607
|
|
(268
|
)
|
(517
|
)
|
|||||
|
Total other income (expense)
|
479
|
|
(386
|
)
|
(604
|
)
|
|||||
|
Net income (loss) attributable to common stockholders
|
$
|
471
|
|
$
|
(393
|
)
|
$
|
(610
|
)
|
||
The accompanying notes are an integral part of these condensed financial statements.
128
SCHEDULE I—CONDENSED FINANCIAL INFORMATION OF REGISTRANT
CHENIERE ENERGY, INC.
CONDENSED STATEMENTS OF CASH FLOWS
(in millions)
|
|
Year Ended December 31,
|
||||||||||
|
|
2018
|
2017
|
2016
|
||||||||
|
Net cash provided by (used in) operating activities
|
$
|
48
|
|
$
|
(4
|
)
|
$
|
(102
|
)
|
||
|
Cash flows from investing activities
|
|
|
|
|
|
|
|||||
|
Investments in affiliates
|
568
|
|
209
|
|
202
|
|
|||||
|
Net cash provided by investing activities
|
568
|
|
|
209
|
|
|
202
|
|
|||
|
Cash flows from financing activities
|
|
|
|
|
|
|
|||||
|
Debt issuance and deferred financing costs
|
(13
|
)
|
(15
|
)
|
—
|
|
|||||
|
Distribution and dividends to non-controlling interest
|
(576
|
)
|
(185
|
)
|
(80
|
)
|
|||||
|
Payments related to tax withholdings for share-based compensation
|
(20
|
)
|
(12
|
)
|
(20
|
)
|
|||||
|
Other
|
(7
|
)
|
—
|
|
—
|
|
|||||
|
Net cash used in financing activities
|
(616
|
)
|
(212
|
)
|
(100
|
)
|
|||||
|
Net decrease in cash, cash equivalents and restricted cash
|
—
|
|
(7
|
)
|
—
|
|
|||||
|
Cash, cash equivalents and restricted cash—beginning of period
|
—
|
|
7
|
|
7
|
|
|||||
|
Cash, cash equivalents and restricted cash—end of period
|
$
|
—
|
|
$
|
—
|
|
$
|
7
|
|
||
Balances per Condensed Balance Sheets:
|
December 31
|
|||||||
|
2018
|
2017
|
||||||
|
Cash and cash equivalents
|
$
|
—
|
|
$
|
—
|
|
|
|
Restricted cash
|
—
|
|
—
|
|
|||
|
Total cash, cash equivalents and restricted cash
|
$
|
—
|
|
$
|
—
|
|
|
The accompanying notes are an integral part of these condensed financial statements.
129
SCHEDULE I—CONDENSED FINANCIAL INFORMATION OF REGISTRANT
CHENIERE ENERGY, INC.
NOTES TO CONDENSED FINANCIAL STATEMENTS
NOTE 1—SUMMARY OF SIGNIFICANT ACCOUNTING POLICIES
The Condensed Financial Statements represent the financial information required by Securities and Exchange Commission Regulation S-X 5-04 for Cheniere.
In the Condensed Financial Statements, Cheniere’s investments in affiliates are presented under the equity method of accounting. Under this method, the assets and liabilities of affiliates are not consolidated. The investments in net assets of the affiliates are recorded on the Condensed Balance Sheets. The loss from operations of the affiliates is reported on a net basis as investment in affiliates (investment in and equity in net income (loss) of affiliates).
A substantial amount of Cheniere’s operating, investing and financing activities are conducted by its affiliates. The Condensed Financial Statements should be read in conjunction with Cheniere’s Consolidated Financial Statements.
NOTE 2—DEBT
As of
December 31, 2018
and 2017, our debt consisted of the following (in millions):
|
|
December 31,
|
|||||||
|
|
2018
|
2017
|
||||||
|
Long-term debt:
|
||||||||
|
4.875% Convertible Unsecured Notes due 2021
|
$
|
1,218
|
|
$
|
1,161
|
|
||
|
4.25% Convertible Senior Notes due 2045
|
625
|
|
625
|
|
||||
|
$1.25 billion Cheniere Revolving Credit Facility
|
—
|
|
—
|
|
||||
|
Unamortized premium, discount and debt issuance costs, net
|
(407
|
)
|
(438
|
)
|
||||
|
Total long-term debt, net
|
$
|
1,436
|
|
|
$
|
1,348
|
|
|
In December 2018, we amended and restated the
Cheniere Revolving Credit Facility
to increase total commitments under the
Cheniere Revolving Credit Facility
from
$750 million
to
$1.25 billion
.
Below is a schedule of future principal payments that we are obligated to make on our outstanding debt at
December 31, 2018
(in millions):
|
Years Ending December 31,
|
Principal Payments
|
|||
|
2019
|
$
|
—
|
|
|
|
2020
|
—
|
|
||
|
2021
|
1,218
|
|
||
|
2022
|
—
|
|
||
|
2023
|
—
|
|
||
|
Thereafter
|
625
|
|
||
|
Total
|
$
|
1,843
|
|
|
In October 2016, Cheniere LNG Terminals, LLC (“Cheniere Terminals”), a wholly owned subsidiary of Cheniere, forgave Cheniere’s total previously outstanding current debt—affiliate balance, which was composed of a
$94 million
note and
$57 million
in related accumulated interest payable to Cheniere Terminals. This
$151 million
forgiveness of debt during the year ended December 31, 2016 was recorded as a non-cash equity contribution to our subsidiaries on our Condensed Balance Sheet.
130
SCHEDULE I—CONDENSED FINANCIAL INFORMATION OF REGISTRANT
CHENIERE ENERGY, INC.
NOTES TO CONDENSED FINANCIAL STATEMENTS—CONTINUED
NOTE 3—GUARANTEES
Obligations under Certain Guarantee Contracts
Cheniere has various financial and performance guarantees and indemnifications which are issued in the normal course of business. These contracts include performance guarantees and stand-by letters of credit. Cheniere enters into these arrangements to facilitate commercial transactions with third parties by enhancing the value of the transaction to the third party. As of
December 31, 2018
, outstanding guarantees and other assurances aggregated approximately
$494 million
of varying duration, consisting of parental guarantees.
No
liabilities were recognized under these guarantee arrangements as of
December 31, 2018
.
NOTE 4 —SUPPLEMENTAL CASH FLOW INFORMATION
The following table provides supplemental disclosure of cash flow information (in millions):
|
|
Year Ended December 31,
|
|||||||||||
|
|
2018
|
2017
|
2016
|
|||||||||
|
Cash paid during the period for interest, net of amounts capitalized
|
$
|
32
|
|
$
|
31
|
|
$
|
20
|
|
|||
|
Non-cash investing and financing activities:
|
||||||||||||
|
Non-cash capital distribution (contributions) (1)
|
607
|
|
(268
|
)
|
(517
|
)
|
||||||
|
Issuance of stock to acquire additional interest in Cheniere Holdings
|
702
|
|
2
|
|
94
|
|
||||||
|
Non-cash capital contribution from subsidiaries for forgiveness of debt
|
—
|
|
—
|
|
151
|
|
||||||
|
Non-cash capital distribution to subsidiaries for forgiveness of debt
|
—
|
|
—
|
|
(868
|
)
|
||||||
|
(1)
|
Amounts represent equity income (losses) of affiliates.
|
131
|
ITEM 16.
|
FORM 10-K SUMMARY
|
None.
132
SIGNATURES
Pursuant to the requirements of Section 13 or 15(d) of the Securities Exchange Act of 1934, the registrant has duly caused this report to be signed on its behalf by the undersigned, thereunto duly authorized.
|
CHENIERE ENERGY, INC.
|
||
|
(Registrant)
|
||
|
|
||
|
By:
|
/s/ Jack A. Fusco
|
|
|
Jack A. Fusco
|
||
|
President and Chief Executive Officer
(Principal Executive Officer) |
||
|
Date:
|
February 25, 2019
|
|
Pursuant to the requirements of the Securities Exchange Act of 1934, this report has been signed below by the following persons on behalf of the registrant and in the capacities and on the dates indicated.
|
Signature
|
Title
|
Date
|
|
|
|
|
|
/s/ Jack A. Fusco
|
President and Chief Executive Officer and Director
(Principal Executive Officer) |
February 25, 2019
|
|
Jack A. Fusco
|
||
|
|
|
|
|
/s/ Michael J. Wortley
|
Executive Vice President and Chief Financial Officer
(Principal Financial Officer) |
February 25, 2019
|
|
Michael J. Wortley
|
||
|
|
|
|
|
/s/ Leonard E. Travis
|
Vice President and Chief Accounting Officer
(Principal Accounting Officer) |
February 25, 2019
|
|
Leonard E. Travis
|
||
|
|
||
|
/s/ G. Andrea Botta
|
Chairman of the Board
|
February 25, 2019
|
|
G. Andrea Botta
|
||
|
/s/ Vicky A. Bailey
|
Director
|
February 25, 2019
|
|
Vicky A. Bailey
|
||
|
/s/ Nuno Brandolini
|
Director
|
February 25, 2019
|
|
Nuno Brandolini
|
||
|
|
|
|
|
/s/ Andrew Langham
|
Director
|
February 25, 2019
|
|
Andrew Langham
|
||
|
|
|
|
|
/s/ David I. Foley
|
Director
|
February 25, 2019
|
|
David I. Foley
|
||
|
/s/ David B. Kilpatrick
|
Director
|
February 25, 2019
|
|
David B. Kilpatrick
|
||
|
/s/ Courtney R. Mather
|
Director
|
February 25, 2019
|
|
Courtney R. Mather
|
||
|
/s/ Donald F. Robillard, Jr.
|
Director
|
February 25, 2019
|
|
Donald F. Robillard, Jr.
|
||
|
|
|
|
|
/s/ Neal A. Shear
|
Director
|
February 25, 2019
|
|
Neal A. Shear
|
||
133
TABLE OF CONTENTS
Part IItem 1A. Risk FactorsItem 1B. Unresolved Staff CommentsItem 3. Legal ProceedingsItem 4. Mine Safety DisclosurePart IIItem 5. Market For Registrant S Common Equity, Related Stockholder Matters and IssuerItem 6. Selected Financial DataItem 7. Management S Discussion and Analysis Of Financial Condition and Results Of OperationsItem 7A. Quantitative and Qualitative Disclosures About Market RiskItem 8. Financial Statements and Supplementary DataNote 1 Organization and Nature Of OperationsNote 2 Summary Of Significant Accounting PoliciesNote 3 Restricted CashNote 4 Accounts and Other ReceivablesNote 5 InventoryNote 6 Property, Plant and EquipmentNote 7 Derivative InstrumentsNote 8 Other Non-current AssetsNote 9 Non-controlling InterestNote 10 Variable Interest EntitiesNote 11 Accrued LiabilitiesNote 12 DebtNote 13 Revenues From Contracts with CustomersNote 14 Income TaxesNote 15 Share-based CompensationNote 16 Employee Benefit PlanNote 17 Net Income (loss) Per Share Attributable To Common StockholdersNote 18 LeasesNote 19 Commitments and ContingenciesNote 20 Customer ConcentrationNote 21 Supplemental Cash Flow InformationNote 22 Recent Accounting StandardsItem 9. Changes in and Disagreements with Accountants on Accounting and Financial DisclosureItem 9A. Controls and ProceduresItem 9B. Other InformationPart IIIPart IVItem 15. Exhibits and Financial Statement SchedulesNote 1 Summary Of Significant Accounting PoliciesNote 2 DebtNote 3 GuaranteesNote 4 Supplemental Cash Flow InformationItem 16. Form 10-k Summary