CHENIERE ENERGY, INC.
10-Ks and 10-Qs
|
|
|
|
|
|
|
|
|
|
|
|
|
|
|
|
|
|
|
|
|
|
|
|
|
|
|
|
|
|
|
|
|
|
|
|
|
|
|
|
|
|
|
|
|
|
|
|
|
|
|
|
|
|
|
|
|
|
|
|
|
|
|
|
|
|
|
|
UNITED STATES
SECURITIES AND EXCHANGE COMMISSION
Washington, D.C. 20549
FORM 10-Q
x
QUARTERLY REPORT PURSUANT TO SECTION 13 OR 15(d) OF THE SECURITIES EXCHANGE ACT OF 1934
For the quarterly period ended
September 30, 2015
OR
¨
TRANSITION REPORT PURSUANT TO SECTION 13 OR 15(d) OF THE SECURITIES EXCHANGE ACT OF 1934
For the transition period from
to

CHENIERE ENERGY, INC.
(Exact name of registrant as specified in its charter)
|
Delaware
|
001-16383
|
95-4352386
|
|
(State or other jurisdiction of incorporation or organization)
|
(Commission File Number)
|
(I.R.S. Employer Identification No.)
|
|
|
|
|
|
700 Milam Street, Suite 1900
|
|
|
|
Houston, Texas
|
77002
|
|
|
(Address of principal executive offices)
|
(Zip code)
|
|
(713) 375-5000
(Registrant’s telephone number, including area code)
Indicate by check mark whether the registrant (1) has filed all reports required to be filed by Section 13 or 15(d) of the Securities Exchange Act of 1934 during the preceding 12 months (or for such shorter period that the registrant was required to file such reports), and (2) has been subject to such filing requirements for the past 90 days. Yes
x
No
¨
Indicate by check mark whether the registrant has submitted electronically and posted on its corporate Web site, if any, every Interactive Data File required to be submitted and posted pursuant to Rule 405 of Regulation S-T (§232.405 of this chapter) during the preceding 12 months (or for such shorter period that the registrant was required to submit and post such files). Yes
x
No
¨
Indicate by check mark whether the registrant is a large accelerated filer, an accelerated filer, a non-accelerated filer, or a smaller reporting company. See the definitions of “large accelerated filer,” “accelerated filer” and “smaller reporting company” in Rule 12b-2 of the Exchange Act. (Check one):
|
Large accelerated filer
x
|
Accelerated filer
¨
|
|||||
|
Non-accelerated filer
¨
|
Smaller reporting company
¨
|
|||||
|
(Do not check if a smaller reporting company)
|
||||||
Indicate by check mark whether the registrant is a shell company (as defined in Rule 12b-2 of the Exchange Act). Yes
¨
No
x
As of
October 20, 2015
, the issuer had
236,032,655
shares of Common Stock outstanding.
CHENIERE ENERGY, INC.
TABLE OF CONTENTS
|
|
||
|
|
||
|
|
||
|
|
||
|
|
|
|
|
|
|
|
|
|
|
|
|
|
|
|
|
|
|
|
i
DEFINITIONS
As commonly used in the liquefied natural gas industry, to the extent applicable, and as used in this quarterly report, the terms listed below have the following meanings:
Common Industry and Other Terms
|
Bcf/d
|
billion cubic feet per day
|
|
|
Bcf/yr
|
billion cubic feet per year
|
|
|
Bcfe
|
billion cubic feet equivalent
|
|
|
DOE
|
U.S. Department of Energy
|
|
|
EPC
|
engineering, procurement and construction
|
|
|
FERC
|
Federal Energy Regulatory Commission
|
|
|
FTA countries
|
countries with which the United States has a free trade agreement providing for national treatment for trade in natural gas
|
|
|
GAAP
|
generally accepted accounting principles in the United States
|
|
|
Henry Hub
|
the final settlement price (in USD per MMBtu) for the New York Mercantile Exchange’s Henry Hub natural gas futures contract for the month in which a relevant cargo’s delivery window is scheduled to begin
|
|
|
LIBOR
|
London Interbank Offered Rate
|
|
|
LNG
|
liquefied natural gas, a product of natural gas consisting primarily of methane (CH4) that is in liquid form at near atmospheric pressure
|
|
|
MMBtu
|
million British thermal units, an energy unit
|
|
|
mtpa
|
million tonnes per annum
|
|
|
non-FTA countries
|
countries without a free trade agreement providing for national treatment for trade in natural gas and with which trade is permitted
|
|
|
SEC
|
Securities and Exchange Commission
|
|
|
SPA
|
LNG sale and purchase agreement
|
|
|
Train
|
a refrigerant compressor train used in the industrial process to convert natural gas into LNG
|
|
|
TUA
|
terminal use agreement
|
|
1
Abbreviated Organizational Structure
The following diagram depicts our abbreviated organizational structure as of
September 30, 2015
, including our ownership of certain subsidiaries, and the references to these entities used in this quarterly report:
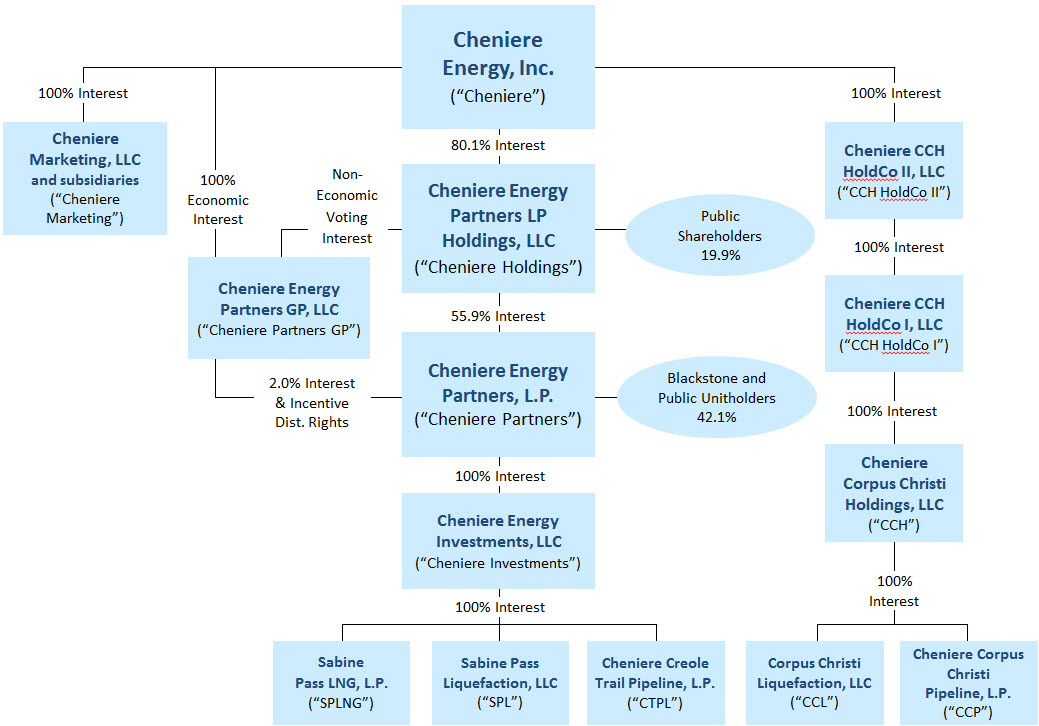
Unless the context requires otherwise, references to “
Cheniere
,” the “Company,” “we,” “us” and “our” refer to
Cheniere Energy, Inc.
(NYSE MKT: LNG) and its consolidated subsidiaries, including our publicly traded subsidiaries,
Cheniere Partners
(NYSE MKT: CQP) and
Cheniere Holdings
(NYSE MKT: CQH).
2
CHENIERE ENERGY, INC. AND SUBSIDIARIES
(in thousands, except share data)
|
|
September 30,
|
December 31,
|
|||||
|
|
2015
|
2014
|
|||||
|
ASSETS
|
(unaudited)
|
|
|||||
|
Current assets
|
|
|
|||||
|
Cash and cash equivalents
|
$
|
1,340,262
|
|
$
|
1,747,583
|
|
|
|
Restricted cash
|
652,225
|
|
481,737
|
|
|||
|
Accounts and interest receivable
|
6,645
|
|
4,419
|
|
|||
|
LNG inventory
|
9,032
|
|
4,294
|
|
|||
|
Other current assets
|
78,108
|
|
20,844
|
|
|||
|
Total current assets
|
2,086,272
|
|
2,258,877
|
|
|||
|
Non-current restricted cash
|
118,909
|
|
550,811
|
|
|||
|
Property, plant and equipment, net
|
15,225,250
|
|
9,246,753
|
|
|||
|
Debt issuance costs, net
|
640,399
|
|
242,323
|
|
|||
|
Non-current derivative assets
|
30,770
|
|
11,744
|
|
|||
|
Goodwill
|
76,819
|
|
76,819
|
|
|||
|
Other non-current assets
|
273,840
|
|
186,356
|
|
|||
|
Total assets
|
$
|
18,452,259
|
|
$
|
12,573,683
|
|
|
|
LIABILITIES AND STOCKHOLDERS’ EQUITY
|
|
|
|||||
|
Current liabilities
|
|
|
|||||
|
Accounts payable
|
$
|
11,558
|
|
$
|
13,426
|
|
|
|
Accrued liabilities
|
457,901
|
|
169,129
|
|
|||
|
Deferred revenue
|
26,653
|
|
26,655
|
|
|||
|
Derivative liabilities
|
33,839
|
|
23,247
|
|
|||
|
Other current liabilities
|
268
|
|
18
|
|
|||
|
Total current liabilities
|
530,219
|
|
232,475
|
|
|||
|
Long-term debt, net
|
15,835,910
|
|
9,806,084
|
|
|||
|
Non-current deferred revenue
|
10,500
|
|
13,500
|
|
|||
|
Non-current derivative liabilities
|
125,473
|
|
267
|
|
|||
|
Other non-current liabilities
|
85,226
|
|
19,840
|
|
|||
|
Commitments and contingencies (see Note 11)
|
|
|
|
|
|||
|
Stockholders’ equity
|
|
|
|
|
|||
|
Preferred stock, $0.0001 par value, 5.0 million shares authorized, none issued
|
—
|
|
—
|
|
|||
|
Common stock, $0.003 par value
|
|
|
|||||
|
Authorized: 480.0 million shares at September 30, 2015 and December 31, 2014
|
|||||||
|
Issued and outstanding: 236.0 million shares and 236.7 million shares at September 30, 2015 and December 31, 2014, respectively
|
708
|
|
712
|
|
|||
|
Treasury stock: 11.2 million shares and 10.6 million shares at September 30, 2015 and December 31, 2014, respectively, at cost
|
(337,057
|
)
|
(292,752
|
)
|
|||
|
Additional paid-in-capital
|
3,029,317
|
|
2,776,702
|
|
|||
|
Accumulated deficit
|
(3,332,851
|
)
|
(2,648,839
|
)
|
|||
|
Total stockholders’ deficit
|
(639,883
|
)
|
(164,177
|
)
|
|||
|
Non-controlling interest
|
2,504,814
|
|
2,665,694
|
|
|||
|
Total equity
|
1,864,931
|
|
2,501,517
|
|
|||
|
Total liabilities and equity
|
$
|
18,452,259
|
|
$
|
12,573,683
|
|
|
The accompanying notes are an integral part of these consolidated financial statements.
3
CHENIERE ENERGY, INC. AND SUBSIDIARIES
CONSOLIDATED
STATEMENTS OF OPERATIONS
(in thousands, except per share data)
(unaudited)
|
Three Months Ended
|
Nine Months Ended
|
||||||||||||||
|
September 30,
|
September 30,
|
||||||||||||||
|
|
2015
|
2014
|
2015
|
2014
|
|||||||||||
|
Revenues
|
|||||||||||||||
|
LNG terminal revenues
|
$
|
67,212
|
|
$
|
66,983
|
|
$
|
202,698
|
|
$
|
200,243
|
|
|||
|
Marketing and trading revenues (losses)
|
(1,557
|
)
|
(499
|
)
|
(1,601
|
)
|
482
|
|
|||||||
|
Other
|
404
|
|
323
|
|
1,356
|
|
1,277
|
|
|||||||
|
Total revenues
|
66,059
|
|
66,807
|
|
202,453
|
|
202,002
|
|
|||||||
|
Operating costs and expenses
|
|||||||||||||||
|
Operating and maintenance expense (income)
|
(6,251
|
)
|
25,908
|
|
49,319
|
|
69,262
|
|
|||||||
|
Depreciation expense
|
21,638
|
|
16,189
|
|
59,561
|
|
48,962
|
|
|||||||
|
Development expense
|
4,935
|
|
11,544
|
|
37,640
|
|
38,919
|
|
|||||||
|
General and administrative expense
|
97,332
|
|
74,255
|
|
263,205
|
|
215,783
|
|
|||||||
|
Other
|
479
|
|
75
|
|
920
|
|
245
|
|
|||||||
|
Total operating costs and expenses
|
118,133
|
|
127,971
|
|
410,645
|
|
373,171
|
|
|||||||
|
Loss from operations
|
(52,074
|
)
|
(61,164
|
)
|
(208,192
|
)
|
(171,169
|
)
|
|||||||
|
Other income (expense)
|
|||||||||||||||
|
Interest expense, net of capitalized interest
|
(93,566
|
)
|
(46,884
|
)
|
(238,664
|
)
|
(130,943
|
)
|
|||||||
|
Loss on early extinguishment of debt
|
—
|
|
—
|
|
(96,273
|
)
|
(114,335
|
)
|
|||||||
|
Derivative gain (loss), net
|
(161,482
|
)
|
5,379
|
|
(242,123
|
)
|
(89,222
|
)
|
|||||||
|
Other income (expense)
|
(39
|
)
|
(160
|
)
|
616
|
|
(39
|
)
|
|||||||
|
Total other expense
|
(255,087
|
)
|
(41,665
|
)
|
(576,444
|
)
|
(334,539
|
)
|
|||||||
|
Loss before income taxes and non-controlling interest
|
(307,161
|
)
|
|
(102,829
|
)
|
|
(784,636
|
)
|
|
(505,708
|
)
|
||||
|
Income tax benefit (expense)
|
69
|
|
|
(1,971
|
)
|
|
(102
|
)
|
|
(2,147
|
)
|
||||
|
Net loss
|
(307,092
|
)
|
|
(104,800
|
)
|
|
(784,738
|
)
|
|
(507,855
|
)
|
||||
|
Less: net loss attributable to non-controlling interest
|
(9,284
|
)
|
|
(15,219
|
)
|
|
(100,726
|
)
|
|
(118,536
|
)
|
||||
|
Net loss attributable to common stockholders
|
$
|
(297,808
|
)
|
|
$
|
(89,581
|
)
|
|
$
|
(684,012
|
)
|
|
$
|
(389,319
|
)
|
|
|
|
|
|
|
|
|
|
|
|
|
|
||||
|
Net loss per share attributable to common stockholders—basic and diluted
|
$
|
(1.31
|
)
|
|
$
|
(0.40
|
)
|
|
$
|
(3.02
|
)
|
|
$
|
(1.74
|
)
|
|
|
|
|
|
|
|
|
|
|
|
|
|||||
|
Weighted average number of common shares outstanding—basic and diluted
|
227,126
|
|
|
224,309
|
|
|
226,648
|
|
|
223,710
|
|
||||
The accompanying notes are an integral part of these consolidated financial statements.
4
CHENIERE ENERGY, INC. AND SUBSIDIARIES
CONSOLIDATED STATEMENT OF STOCKHOLDERS’ EQUITY
(in thousands)
(unaudited)
|
Total Stockholders’ Equity
|
|||||||||||||||||||||||||||||
|
|
Common Stock
|
Treasury Stock
|
Additional Paid-in Capital
|
Accumulated Deficit
|
Non-controlling Interest
|
Total
Equity
|
|||||||||||||||||||||||
|
|
Shares
|
Amount
|
Shares
|
Amount
|
|||||||||||||||||||||||||
|
Balance at December 31, 2014
|
236,745
|
|
$
|
712
|
|
10,596
|
|
$
|
(292,752
|
)
|
$
|
2,776,702
|
|
$
|
(2,648,839
|
)
|
$
|
2,665,694
|
|
$
|
2,501,517
|
|
|||||||
|
Exercise of stock options
|
67
|
|
—
|
|
—
|
|
—
|
|
2,279
|
|
—
|
|
—
|
|
2,279
|
|
|||||||||||||
|
Issuances of restricted stock
|
19
|
|
—
|
|
—
|
|
—
|
|
—
|
|
—
|
|
—
|
|
—
|
|
|||||||||||||
|
Forfeitures of restricted stock
|
(152
|
)
|
(1
|
)
|
17
|
|
—
|
|
1
|
|
—
|
|
—
|
|
—
|
|
|||||||||||||
|
Share-based compensation
|
—
|
|
—
|
|
—
|
|
—
|
|
50,582
|
|
—
|
|
—
|
|
50,582
|
|
|||||||||||||
|
Shares repurchased related to share-based compensation
|
(635
|
)
|
(3
|
)
|
635
|
|
(44,305
|
)
|
3
|
|
—
|
|
—
|
|
(44,305
|
)
|
|||||||||||||
|
Excess tax benefit from share-based compensation
|
—
|
|
—
|
|
—
|
|
—
|
|
1,424
|
|
—
|
|
—
|
|
1,424
|
|
|||||||||||||
|
Equity portion of issuance of convertible notes, net
|
—
|
|
—
|
|
—
|
|
—
|
|
198,326
|
|
—
|
|
—
|
|
198,326
|
|
|||||||||||||
|
Loss attributable to non-controlling interest
|
—
|
|
—
|
|
—
|
|
—
|
|
—
|
|
—
|
|
(100,726
|
)
|
(100,726
|
)
|
|||||||||||||
|
Distributions to non-controlling interest
|
—
|
|
—
|
|
—
|
|
—
|
|
—
|
|
—
|
|
(60,154
|
)
|
(60,154
|
)
|
|||||||||||||
|
Net loss
|
—
|
|
—
|
|
—
|
|
—
|
|
—
|
|
(684,012
|
)
|
—
|
|
(684,012
|
)
|
|||||||||||||
|
Balance at September 30, 2015
|
236,044
|
|
$
|
708
|
|
11,248
|
|
$
|
(337,057
|
)
|
$
|
3,029,317
|
|
$
|
(3,332,851
|
)
|
$
|
2,504,814
|
|
$
|
1,864,931
|
|
|||||||
The accompanying notes are an integral part of these consolidated financial statements.
5
CHENIERE ENERGY, INC. AND SUBSIDIARIES
(in thousands)
(unaudited)
|
|
Nine Months Ended
|
||||||
|
September 30,
|
|||||||
|
|
2015
|
2014
|
|||||
|
Cash flows from operating activities
|
|||||||
|
Net loss
|
$
|
(784,738
|
)
|
$
|
(507,855
|
)
|
|
|
Adjustments to reconcile net loss to net cash used in operating activities:
|
|||||||
|
Non-cash LNG inventory write-downs
|
17,826
|
|
23,505
|
|
|||
|
Depreciation expense
|
59,561
|
|
48,962
|
|
|||
|
Share-based compensation
|
90,412
|
|
84,449
|
|
|||
|
Amortization of debt issuance costs and discount (premium)
|
36,782
|
|
10,971
|
|
|||
|
Loss on early extinguishment of debt
|
96,273
|
|
114,335
|
|
|||
|
Total losses on derivatives, net
|
208,769
|
|
89,286
|
|
|||
|
Net cash used for settlement of derivative instruments
|
(94,170
|
)
|
(19,745
|
)
|
|||
|
Other
|
1,406
|
|
(1,975
|
)
|
|||
|
Changes in restricted cash for certain operating activities
|
92,589
|
|
102,851
|
|
|||
|
Changes in operating assets and liabilities:
|
|||||||
|
Accounts and interest receivable
|
(2,226
|
)
|
(18,899
|
)
|
|||
|
LNG inventory
|
(22,564
|
)
|
(26,908
|
)
|
|||
|
Accounts payable and accrued liabilities
|
10,656
|
|
62,797
|
|
|||
|
Deferred revenue
|
(3,003
|
)
|
(2,955
|
)
|
|||
|
Other, net
|
17,850
|
|
131
|
|
|||
|
Net cash used in operating activities
|
(274,577
|
)
|
(41,050
|
)
|
|||
|
Cash flows from investing activities
|
|||||||
|
Property, plant and equipment, net
|
(5,747,596
|
)
|
(2,047,957
|
)
|
|||
|
Use of restricted cash for the acquisition of property, plant and equipment
|
5,330,526
|
|
1,980,436
|
|
|||
|
Other
|
(111,518
|
)
|
(24,113
|
)
|
|||
|
Net cash used in investing activities
|
(528,588
|
)
|
(91,634
|
)
|
|||
|
Cash flows from financing activities
|
|||||||
|
Proceeds from issuances of long-term debt
|
6,178,000
|
|
2,584,500
|
|
|||
|
Repayments of long-term debt
|
—
|
|
(177,000
|
)
|
|||
|
Debt issuance and deferred financing costs
|
(519,699
|
)
|
(94,220
|
)
|
|||
|
Investment in restricted cash
|
(5,161,701
|
)
|
(2,254,733
|
)
|
|||
|
Distributions and dividends to non-controlling interest
|
(60,154
|
)
|
(59,478
|
)
|
|||
|
Proceeds from exercise of stock options
|
2,279
|
|
9,502
|
|
|||
|
Payments related to tax withholdings for share-based compensation
|
(44,305
|
)
|
(44,516
|
)
|
|||
|
Other
|
1,424
|
|
(557
|
)
|
|||
|
Net cash provided by (used in) financing activities
|
395,844
|
|
(36,502
|
)
|
|||
|
Net decrease in cash and cash equivalents
|
(407,321
|
)
|
(169,186
|
)
|
|||
|
Cash and cash equivalents—beginning of period
|
1,747,583
|
|
960,842
|
|
|||
|
Cash and cash equivalents—end of period
|
$
|
1,340,262
|
|
$
|
791,656
|
|
|
The accompanying notes are an integral part of these consolidated financial statements.
6
CHENIERE ENERGY, INC. AND SUBSIDIARIES
NOTES TO CONSOLIDATED FINANCIAL STATEMENTS
(unaudited)
The accompanying unaudited Consolidated Financial Statements of Cheniere have been prepared in accordance with
GAAP
for interim financial information and with Rule 10-01 of Regulation S-X. Accordingly, they do not include all of the information and footnotes required by
GAAP
for complete financial statements. In our opinion, all adjustments, consisting only of normal recurring adjustments necessary for a fair presentation, have been included. Certain reclassifications have been made to conform prior period information to the current presentation. The reclassifications had no effect on our overall consolidated financial position, results of operations or cash flows.
Results of operations for the
three and nine months ended September 30, 2015
are not necessarily indicative of the results of operations that will be realized for the year ending December 31,
2015
.
For further information, refer to the Consolidated Financial Statements and accompanying notes included in our Annual Report on Form 10-K for the year ended
December 31, 2014
.
Restricted cash consists of funds that are contractually restricted as to usage or withdrawal and have been presented separately from cash and cash equivalents on our Consolidated Balance Sheets. Restricted cash includes the following:
SPLNG Senior Notes Debt Service Reserve
SPLNG has consummated private offerings of an aggregate principal amount of
$1,665.5 million
, before discount, of
7.50%
Senior Secured Notes due 2016
(the “2016 SPLNG Senior Notes”)
and
$420.0 million
of
6.50%
Senior Secured Notes due 2020
(the “2020 SPLNG Senior Notes” and collectively with the 2016 SPLNG Senior Notes, the “SPLNG Senior Notes”)
. Under the indentures governing the SPLNG Senior Notes
(the “SPLNG Indentures”)
, except for permitted tax distributions, SPLNG may not make distributions until certain conditions are satisfied, including: (1) there must be on deposit in an interest payment account an amount equal to one-sixth of the semi-annual interest payment multiplied by the number of elapsed months since the last semi-annual interest payment, and (2) there must be on deposit in a permanent debt service reserve fund an amount equal to one semi-annual interest payment. Distributions are permitted only after satisfying the foregoing funding requirements, a fixed charge coverage ratio test of
2
:1 and other conditions specified in the
SPLNG Indentures
.
As of
September 30, 2015
and
December 31, 2014
, we classified
$53.0 million
and
$15.0 million
, respectively, as current restricted cash for the payment of current interest due. As of both
September 30, 2015
and
December 31, 2014
, we classified the permanent debt service reserve fund of
$76.1 million
as non-current restricted cash. These cash accounts are controlled by a collateral trustee; therefore, these amounts are shown as restricted cash on our Consolidated Balance Sheets.
SPL Reserve
During 2013, SPL entered into four credit facilities aggregating
$5.9 billion
(collectively, the “2013 SPL Credit Facilities”)
. In June 2015, SPL entered into four credit facilities aggregating
$4.6 billion
(collectively, the “2015 SPL Credit Facilities”)
, which replaced the
2013 SPL Credit Facilities
. Under the terms and conditions of the
2015 SPL Credit Facilities
(and previously the
2013 SPL Credit Facilities
), SPL is required to deposit all cash received into reserve accounts controlled by a collateral trustee. The usage or withdrawal of such cash is restricted to the payment of liabilities related to the natural gas liquefaction facilities that are being developed and constructed in Cameron Parish, Louisiana
(the “SPL Project”)
; therefore, these amounts are shown as restricted cash on our Consolidated Balance Sheets.
During 2013, SPL issued an aggregate principal amount of
$2.0 billion
, before premium, of
5.625%
Senior Secured Notes due 2021
(the “2021 SPL Senior Notes”)
,
$1.0 billion
of
6.25%
Senior Secured Notes due 2022
(the “2022 SPL Senior Notes”)
and
$1.0 billion
of
5.625%
Senior Secured Notes due 2023
(the “Initial 2023 SPL Senior Notes”)
. During 2014, SPL issued an aggregate principal amount of
$2.0 billion
of
5.75%
Senior Secured Notes due 2024
(the “2024 SPL Senior Notes”)
and additional
5.625%
Senior Secured Notes due 2023 in an aggregate principal amount of
$0.5 billion
, before premium
(the “Additional 2023 SPL Senior Notes” and collectively with the Initial 2023 SPL Senior Notes, the “2023 SPL Senior Notes”)
. In March 2015, SPL issued an aggregate principal amount of
$2.0 billion
of
5.625%
Senior Secured Notes due 2025
(the “2025 SPL Senior Notes” and
7
CHENIERE ENERGY, INC. AND SUBSIDIARIES
NOTES TO CONSOLIDATED FINANCIAL STATEMENTS—CONTINUED
(unaudited)
collectively with the 2021 SPL Senior Notes, the 2022 SPL Senior Notes, the 2023 SPL Senior Notes and the 2024 SPL Senior Notes, the “SPL Senior Notes”)
. The use of cash proceeds from the
SPL Senior Notes
is restricted to the payment of liabilities related to the
SPL Project
; therefore, these amounts are shown as restricted cash on our Consolidated Balance Sheets. See
Note 7—Long-Term Debt
for additional details about our long-term debt.
As of
September 30, 2015
and
December 31, 2014
, we classified
$327.2 million
and
$155.8 million
, respectively, as current restricted cash held by SPL for the payment of current liabilities, including interest payments, related to the
SPL Project
and
zero
and
$457.1 million
, respectively, as non-current restricted cash held by SPL for future
SPL Project
construction costs.
CTPL Reserve
In May 2013, CTPL entered into a
$400.0 million
term loan facility
(the “CTPL Term Loan”)
. As of
September 30, 2015
and
December 31, 2014
, we classified
$11.3 million
and
$24.9 million
, respectively, as current restricted cash held by CTPL for the payment of current liabilities and
zero
and
$11.3 million
, respectively, as non-current restricted cash held by CTPL, because the usage and withdrawal of such funds is primarily restricted to the payment of liabilities related to modifications of the
94
-mile pipeline which interconnects the Sabine Pass LNG terminal with a number of large interstate pipelines
(the “Creole Trail Pipeline”)
in order to enable bi-directional natural gas flow, and for the payment of interest during construction of such modifications. The restricted cash reserved to pay interest during construction is controlled by a collateral agent, and can only be released by the collateral agent upon satisfaction of certain terms and conditions. CTPL is required to pay annual fees to the administrative and collateral agents.
CCH Reserve
In May 2015, CCH entered into a credit facility agreement for an aggregate commitment of approximately
$11.5 billion
(the “2015 CCH Credit Facility”)
, comprising approximately
$8.4 billion
linked to the first stage
(“Stage 1”)
of the natural gas liquefaction and export facility and pipeline facility near Corpus Christi, Texas
(the “CCL Project”)
and approximately
$3.1 billion
linked to the second stage
(“Stage 2”)
of the
CCL Project
.
Stage 1
includes Trains 1 and 2,
two
LNG storage tanks,
one
complete marine berth and second partial berth and all of the project’s necessary infrastructure facilities. The pipeline facility is a
23
-mile,
48
” natural gas pipeline that will interconnect the Corpus Christi LNG terminal with several interstate and intrastate natural gas pipelines
(the “Corpus Christi Pipeline”)
.
Stage 2
includes Train 3,
one
LNG storage tank and the completion of the second partial berth. Under the terms and conditions of the 2015 CCH Credit Facility, all cash reserved to pay interest during construction is controlled by a collateral agent. These funds can only be released by the collateral agent upon satisfaction of certain terms and conditions and are classified as restricted on our Consolidated Balance Sheets. CCH is required to pay annual fees to the administrative and collateral agents. As of
September 30, 2015
, we classified
$35.6 million
and
$35.7 million
as current restricted cash and non-current restricted cash, respectively, held by CCH.
Other Restricted Cash
As of
September 30, 2015
and
December 31, 2014
,
$171.4 million
and
$250.1 million
, respectively, of cash was held by SPLNG, Cheniere Partners and Cheniere Holdings that was restricted to Cheniere. In addition, as of
September 30, 2015
and
December 31, 2014
,
$53.7 million
and
$35.9 million
, respectively, had been classified as current restricted cash, and as of
September 30, 2015
and
December 31, 2014
,
$7.1 million
and
$6.3 million
, respectively, had been classified as non-current restricted cash on our Consolidated Balance Sheets due to various other contractual restrictions.
8
CHENIERE ENERGY, INC. AND SUBSIDIARIES
NOTES TO CONSOLIDATED FINANCIAL STATEMENTS—CONTINUED
(unaudited)
Property, plant and equipment consists of LNG terminal costs and fixed assets and other, as follows (in thousands):
|
|
September 30,
|
December 31,
|
|||||
|
|
2015
|
2014
|
|||||
|
LNG terminal costs
|
|
|
|||||
|
LNG terminal
|
$
|
2,478,167
|
|
$
|
2,269,429
|
|
|
|
LNG terminal construction-in-process
|
12,887,040
|
|
7,155,046
|
|
|||
|
LNG site and related costs, net
|
32,823
|
|
9,395
|
|
|||
|
Accumulated depreciation
|
(397,758
|
)
|
(350,497
|
)
|
|||
|
Total LNG terminal costs, net
|
15,000,272
|
|
9,083,373
|
|
|||
|
Fixed assets and other
|
|
|
|
|
|||
|
Computer and office equipment
|
11,197
|
|
7,464
|
|
|||
|
Furniture and fixtures
|
16,737
|
|
10,733
|
|
|||
|
Computer software
|
64,432
|
|
46,882
|
|
|||
|
Leasehold improvements
|
38,573
|
|
36,067
|
|
|||
|
Land
|
60,984
|
|
55,522
|
|
|||
|
Other
|
65,138
|
|
36,881
|
|
|||
|
Accumulated depreciation
|
(32,083
|
)
|
(30,169
|
)
|
|||
|
Total fixed assets and other, net
|
224,978
|
|
163,380
|
|
|||
|
Property, plant and equipment, net
|
$
|
15,225,250
|
|
$
|
9,246,753
|
|
|
We have entered into the following derivative instruments that are reported at fair value:
|
•
|
commodity derivatives to hedge the exposure to price risk attributable to future: (1) sales of our LNG inventory and (2) purchases of natural gas to operate the Sabine Pass LNG terminal
(“Natural Gas Derivatives”)
;
|
|
•
|
commodity derivatives consisting of natural gas purchase agreements and associated economic hedges to secure natural gas feedstock for the
SPL Project
(“Liquefaction Supply Derivatives”)
;
|
|
•
|
financial derivatives to hedge the exposure to the commodity markets in which we have contractual arrangements to purchase or sell physical LNG
(“LNG Trading Derivatives”)
;
|
|
•
|
interest rate swaps to hedge the exposure to volatility in a portion of the floating-rate interest payments under the
2015 SPL Credit Facilities
(and previously the
2013 SPL Credit Facilities
)
(“SPL Interest Rate Derivatives”)
; and
|
|
•
|
interest rate swaps to hedge the exposure to volatility in a portion of the floating-rate interest payments under the
2015 CCH Credit Facility
(“CCH Interest Rate Derivatives” and, collectively with the SPL Interest Rate Derivatives, the “Interest Rate Derivatives”)
.
|
None of our derivative instruments are designated as cash flow hedging instruments, and changes in fair value are recorded within our Consolidated
Statements of Operations
.
9
CHENIERE ENERGY, INC. AND SUBSIDIARIES
NOTES TO CONSOLIDATED FINANCIAL STATEMENTS—CONTINUED
(unaudited)
The following table (in thousands) shows the fair value of our derivative instruments that are required to be measured at fair value on a recurring basis as of
September 30, 2015
and
December 31, 2014
, which are classified as
other current assets
,
non-current derivative assets
,
derivative liabilities
or
non-current derivative liabilities
in our Consolidated Balance Sheets.
|
Fair Value Measurements as of
|
|||||||||||||||||||||||||||||||
|
September 30, 2015
|
December 31, 2014
|
||||||||||||||||||||||||||||||
|
Quoted Prices in Active Markets
(Level 1)
|
Significant Other Observable Inputs (Level 2)
|
Significant Unobservable Inputs (Level 3)
|
Total
|
Quoted Prices in Active Markets
(Level 1)
|
Significant Other Observable Inputs (Level 2)
|
Significant Unobservable Inputs (Level 3)
|
Total
|
||||||||||||||||||||||||
|
Natural Gas Derivatives asset
|
$
|
—
|
|
$
|
97
|
|
$
|
—
|
|
$
|
97
|
|
$
|
—
|
|
$
|
219
|
|
$
|
—
|
|
$
|
219
|
|
|||||||
|
Liquefaction Supply Derivatives asset
|
—
|
|
—
|
|
32,546
|
|
32,546
|
|
—
|
|
—
|
|
342
|
|
342
|
|
|||||||||||||||
|
LNG Trading Derivatives asset
|
—
|
|
113
|
|
—
|
|
113
|
|
—
|
|
—
|
|
—
|
|
—
|
|
|||||||||||||||
|
SPL Interest Rate Derivatives liability
|
—
|
|
(15,738
|
)
|
—
|
|
(15,738
|
)
|
—
|
|
(12,036
|
)
|
—
|
|
(12,036
|
)
|
|||||||||||||||
|
CCH Interest Rate Derivatives liability
|
—
|
|
(143,092
|
)
|
—
|
|
(143,092
|
)
|
—
|
|
—
|
|
—
|
|
—
|
|
|||||||||||||||
The estimated fair values of our
Natural Gas Derivatives
and the economic hedges related to the
LNG Trading Derivatives
are the amounts at which the instruments could be exchanged currently between willing parties. We value these derivatives using observable commodity price curves and other relevant data. We value the
Interest Rate Derivatives
using valuations based on the initial trade prices. Using an income-based approach, subsequent valuations are based on observable inputs to the valuation model including interest rate curves, risk adjusted discount rates, credit spreads and other relevant data.
The fair value of substantially all of the
Liquefaction Supply Derivatives
is developed through the use of internal models which are impacted by inputs that are unobservable in the marketplace. As a result, the fair value of the
Liquefaction Supply Derivatives
is designated as Level 3 within the valuation hierarchy. The curves used to generate the fair value of the
Liquefaction Supply Derivatives
are based on basis adjustments applied to forward curves for a liquid trading point. In addition, there may be observable liquid market basis information in the near term, but terms of a particular
Liquefaction Supply Derivatives
contract may exceed the period for which such information is available, resulting in a Level 3 classification. In these instances, the fair value of the contract incorporates extrapolation assumptions made in the determination of the market basis price for future delivery periods in which applicable commodity basis prices were either not observable or lacked corroborative market data. Internal fair value models that include contractual pricing with a fixed basis include fixed basis amounts for delivery at locations for which no market currently exists. Internal fair value models also include conditions precedent to the respective long-term natural gas purchase agreements. As of
September 30, 2015
and
December 31, 2014
, some of the
Liquefaction Supply Derivatives
existed within markets for which the pipeline infrastructure has not been developed to accommodate marketable physical gas flow. In the absence of infrastructure to accommodate marketable physical gas flow, our internal fair value models are based on a market price that equates to our own contractual pricing due to: (1) the inactive and unobservable market and (2) conditions precedent and their impact on the uncertainty in the timing of our actual receipt of the physical volumes associated with each forward. The fair value of the
Liquefaction Supply Derivatives
is predominantly driven by market commodity basis prices and our assessment of the associated conditions precedent, including evaluating whether the respective market is available as pipeline infrastructure is developed. Upon the completion and placement into service of relevant pipeline infrastructure to accommodate marketable physical gas flow, we recognize a gain or loss based on the fair value of the respective natural gas purchase agreements as of the reporting date.
10
CHENIERE ENERGY, INC. AND SUBSIDIARIES
NOTES TO CONSOLIDATED FINANCIAL STATEMENTS—CONTINUED
(unaudited)
There were
no
transfers into or out of Level 3
Liquefaction Supply Derivatives
for the
three and nine months ended September 30, 2015 and 2014
. As all of the physical
Liquefaction Supply Derivatives
are either purely index-priced or index-priced with a fixed basis, we do not believe that a significant change in market commodity prices would have a material impact on our Level 3 fair value measurements. The following table includes quantitative information for the unobservable inputs for the Level 3
Liquefaction Supply Derivatives
as of
September 30, 2015
:
|
Net Fair Value Asset (in thousands)
|
Valuation Technique
|
Significant Unobservable Input
|
Significant Unobservable Inputs Range
|
|||||
|
Liquefaction Supply Derivatives
|
$32,546
|
Income Approach
|
Basis Spread
|
$ (0.350) - $0.050
|
||||
Derivative assets and liabilities arising from our derivative contracts with the same counterparty are reported on a net basis, as all counterparty derivative contracts provide for net settlement. The use of derivative instruments exposes us to counterparty credit risk, or the risk that a counterparty will be unable to meet its commitments in instances when our derivative instruments are in an asset position.
Commodity Derivatives
We recognize all commodity derivative instruments, including our
Natural Gas Derivatives
,
Liquefaction Supply Derivatives
and
LNG Trading Derivatives
(collectively, “Commodity Derivatives”)
, as either assets or liabilities and measure those instruments at fair value. Changes in the fair value of our
Commodity Derivatives
are reported in earnings.
The following table (in thousands) shows the fair value and location of our
Commodity Derivatives
on our Consolidated Balance Sheets:
|
September 30, 2015
|
December 31, 2014
|
|||||||||||||||||||||||||||||||
|
Natural Gas Derivatives (1)
|
Liquefaction Supply Derivatives
|
LNG Trading Derivatives
|
Total
|
Natural Gas Derivatives (1)
|
Liquefaction Supply Derivatives
|
LNG Trading Derivatives
|
Total
|
|||||||||||||||||||||||||
|
Balance Sheet Location
|
||||||||||||||||||||||||||||||||
|
Other current assets
|
$
|
97
|
|
$
|
2,371
|
|
$
|
—
|
|
$
|
2,468
|
|
$
|
219
|
|
$
|
76
|
|
$
|
—
|
|
$
|
295
|
|
||||||||
|
Non-current derivative assets
|
—
|
|
30,657
|
|
113
|
|
30,770
|
|
—
|
|
586
|
|
—
|
|
586
|
|
||||||||||||||||
|
Total derivative assets
|
97
|
|
33,028
|
|
113
|
|
33,238
|
|
219
|
|
662
|
|
—
|
|
881
|
|
||||||||||||||||
|
Derivative liabilities
|
—
|
|
(349
|
)
|
—
|
|
(349
|
)
|
—
|
|
(53
|
)
|
—
|
|
(53
|
)
|
||||||||||||||||
|
Non-current derivative liabilities
|
—
|
|
(133
|
)
|
—
|
|
(133
|
)
|
—
|
|
(267
|
)
|
—
|
|
(267
|
)
|
||||||||||||||||
|
Total derivative liabilities
|
—
|
|
(482
|
)
|
—
|
|
(482
|
)
|
—
|
|
(320
|
)
|
—
|
|
(320
|
)
|
||||||||||||||||
|
Derivative asset, net
|
$
|
97
|
|
$
|
32,546
|
|
$
|
113
|
|
$
|
32,756
|
|
$
|
219
|
|
$
|
342
|
|
$
|
—
|
|
$
|
561
|
|
||||||||
|
(1)
|
Does not include collateral of
$5.6 million
and
$5.7 million
deposited for such contracts, which is included in
other current assets
in our Consolidated Balance Sheets as of
September 30, 2015
and
December 31, 2014
, respectively.
|
11
CHENIERE ENERGY, INC. AND SUBSIDIARIES
NOTES TO CONSOLIDATED FINANCIAL STATEMENTS—CONTINUED
(unaudited)
The following table (in thousands) shows the changes in the fair value and settlements and location of our
Commodity Derivatives
recorded on our Consolidated
Statements of Operations
during the
three and nine months ended September 30, 2015 and 2014
:
|
Three Months Ended September 30,
|
Nine Months Ended September 30,
|
||||||||||||||||
|
Statement of Operations Location
|
2015
|
2014
|
2015
|
2014
|
|||||||||||||
|
Natural Gas Derivatives loss
|
Marketing and trading revenues (losses)
|
$
|
(152
|
)
|
$
|
(525
|
)
|
$
|
(260
|
)
|
$
|
(155
|
)
|
||||
|
Natural Gas Derivatives gain (loss)
|
Operating and maintenance expense (income)
|
857
|
|
194
|
|
1,317
|
|
(64
|
)
|
||||||||
|
Liquefaction Supply Derivatives gain (1)
|
Operating and maintenance expense (income)
|
32,103
|
|
—
|
|
32,184
|
|
—
|
|
||||||||
|
LNG Trading Derivatives gain
|
Marketing and trading revenues (losses)
|
113
|
|
—
|
|
113
|
|
—
|
|
||||||||
|
(1)
|
There were
no
physical settlements during the reporting period.
|
Natural Gas Derivatives
Our
Natural Gas Derivatives
are executed through over-the-counter contracts which are subject to nominal credit risk as these transactions are settled on a daily margin basis with investment grade financial institutions. We are required by these financial institutions to use margin deposits as credit support for our
Natural Gas Derivatives
activities.
Liquefaction Supply Derivatives
SPL has entered into index-based physical natural gas supply contracts and associated economic hedges to secure natural gas feedstock for the
SPL Project
. The terms of the physical contracts range from approximately
one
to
seven
years and commence upon the occurrence of conditions precedent, including the date of first commercial operation of specified Trains of the
SPL Project
. We recognize the
Liquefaction Supply Derivatives
as either assets or liabilities and measure those instruments at fair value. Changes in the fair value of the
Liquefaction Supply Derivatives
are reported in earnings. As of
September 30, 2015
, SPL has secured up to approximately
2,156.6 million
MMBtu
of natural gas feedstock through long-term natural gas purchase agreements, of which the forward notional natural gas buy position of the
Liquefaction Supply Derivatives
was approximately
1,244.1 million
MMBtu
, which were recorded as derivatives due to minimum purchase requirements.
LNG Trading Derivatives
As of
September 30, 2015
, we have entered into certain
LNG Trading Derivatives
representing a short position of
1.5 million MMBtu
, and we may from time to time enter into certain financial derivatives in the form of swaps, forwards, options or futures to economically hedge exposure to the commodity markets in which we have contractual arrangements to purchase or sell physical LNG. We have entered into
LNG Trading Derivatives
to secure a fixed price position to minimize future cash flow variability associated with such LNG transactions.
Interest Rate Derivatives
SPL Interest Rate Derivatives
SPL has entered into
SPL Interest Rate Derivatives
to protect against volatility of future cash flows and hedge a portion of the variable interest payments on the
2015 SPL Credit Facilities
. The
SPL Interest Rate Derivatives
hedge a portion of the expected outstanding borrowings over the term of the
2015 SPL Credit Facilities
.
In March 2015, SPL settled a portion of the
SPL Interest Rate Derivatives
and recognized a derivative loss of
$34.7 million
within our Consolidated
Statements of Operations
in conjunction with the termination of approximately
$1.8 billion
of commitments under the
2013 SPL Credit Facilities
as discussed in
Note 7—Long-Term Debt
. In May 2014, SPL settled a portion of the
SPL Interest Rate Derivatives
and recognized a derivative loss of
$9.3 million
within our Consolidated
Statements of Operations
in conjunction with the early termination of approximately
$2.1 billion
of commitments under the
2013 SPL Credit Facilities
.
12
CHENIERE ENERGY, INC. AND SUBSIDIARIES
NOTES TO CONSOLIDATED FINANCIAL STATEMENTS—CONTINUED
(unaudited)
CCH Interest Rate Derivatives
In February 2015, CCH entered into
CCH Interest Rate Derivatives
to protect against volatility of future cash flows and hedge a portion of the variable interest payments on the 2015 CCH Credit Facility. The
CCH Interest Rate Derivatives
hedge a portion of the expected outstanding borrowings over the term of the 2015 CCH Credit Facility. The
CCH Interest Rate Derivatives
have a
seven
-year term and were contingent upon reaching a final investment decision with respect to the
CCL Project
, which was reached in May 2015. Upon meeting the contingency related to the
CCH Interest Rate Derivatives
in May 2015, we paid
$50.1 million
related to contingency and syndication premiums, which is included in
derivative gain (loss), net
on our Consolidated
Statements of Operations
.
As of
September 30, 2015
, we had the following
Interest Rate Derivatives
outstanding:
|
Initial Notional Amount
|
Maximum Notional Amount
|
Effective Date
|
Maturity Date
|
Weighted Average Fixed Interest Rate Paid
|
Variable Interest Rate Received
|
|||||||
|
SPL Interest Rate Derivatives
|
$20.0 million
|
$628.8 million
|
August 14, 2012
|
July 31, 2019
|
1.98%
|
One-month LIBOR
|
||||||
|
CCH Interest Rate Derivatives
|
$28.8 million
|
$5.5 billion
|
May 20, 2015
|
May 31, 2022
|
2.29%
|
One-month LIBOR
|
||||||
The following table (in thousands) shows the fair value and location of the
Interest Rate Derivatives
on our Consolidated Balance Sheets:
|
September 30, 2015
|
December 31, 2014
|
|||||||||||||||||||||||
|
SPL Interest Rate Derivatives
|
CCH Interest Rate Derivatives
|
Total
|
SPL Interest Rate Derivatives
|
CCH Interest Rate Derivatives
|
Total
|
|||||||||||||||||||
|
Balance Sheet Location
|
||||||||||||||||||||||||
|
Non-current derivative assets
|
$
|
—
|
|
$
|
—
|
|
$
|
—
|
|
$
|
11,158
|
|
$
|
—
|
|
$
|
11,158
|
|
||||||
|
Derivative liabilities
|
(7,039
|
)
|
(26,451
|
)
|
(33,490
|
)
|
(23,194
|
)
|
—
|
|
(23,194
|
)
|
||||||||||||
|
Non-current derivative liabilities
|
(8,699
|
)
|
(116,641
|
)
|
(125,340
|
)
|
—
|
|
—
|
|
—
|
|
||||||||||||
|
Total derivative liabilities
|
(15,738
|
)
|
(143,092
|
)
|
(158,830
|
)
|
(23,194
|
)
|
—
|
|
(23,194
|
)
|
||||||||||||
|
Derivative liability, net
|
$
|
(15,738
|
)
|
$
|
(143,092
|
)
|
$
|
(158,830
|
)
|
$
|
(12,036
|
)
|
$
|
—
|
|
$
|
(12,036
|
)
|
||||||
The following table (in thousands) shows the changes in the fair value and settlements of the
Interest Rate Derivatives
, including contingency and syndication premiums related to the
CCH Interest Rate Derivatives
, recorded in
derivative gain (loss), net
on our Consolidated
Statements of Operations
during the
three and nine months ended September 30, 2015 and 2014
:
|
Three Months Ended September 30,
|
Nine Months Ended September 30,
|
|||||||||||||||
|
2015
|
2014
|
2015
|
2014
|
|||||||||||||
|
SPL Interest Rate Derivatives gain (loss)
|
$
|
(10,872
|
)
|
$
|
5,379
|
|
$
|
(46,541
|
)
|
$
|
(89,222
|
)
|
||||
|
CCH Interest Rate Derivatives loss
|
(150,610
|
)
|
—
|
|
(195,582
|
)
|
—
|
|
||||||||
13
CHENIERE ENERGY, INC. AND SUBSIDIARIES
NOTES TO CONSOLIDATED FINANCIAL STATEMENTS—CONTINUED
(unaudited)
Balance Sheet Presentation
Our
Commodity Derivatives
and
Interest Rate Derivatives
are presented on a net basis on our Consolidated Balance Sheets as described above. The following table (in thousands) shows the fair value of our derivatives outstanding on a gross and net basis:
|
Gross Amounts Recognized
|
Gross Amounts Offset in the Consolidated Balance Sheets
|
Net Amounts Presented in the Consolidated Balance Sheets
|
||||||||||
|
Offsetting Derivative Assets (Liabilities)
|
||||||||||||
|
As of September 30, 2015
|
||||||||||||
|
Natural Gas Derivatives
|
$
|
513
|
|
$
|
(416
|
)
|
$
|
97
|
|
|||
|
Liquefaction Supply Derivatives
|
33,028
|
|
—
|
|
33,028
|
|
||||||
|
Liquefaction Supply Derivatives
|
(482
|
)
|
—
|
|
(482
|
)
|
||||||
|
LNG Trading Derivatives
|
113
|
|
—
|
|
113
|
|
||||||
|
SPL Interest Rate Derivatives
|
(15,738
|
)
|
—
|
|
(15,738
|
)
|
||||||
|
CCH Interest Rate Derivatives
|
(143,092
|
)
|
—
|
|
(143,092
|
)
|
||||||
|
As of December 31, 2014
|
||||||||||||
|
Natural Gas Derivatives
|
223
|
|
(4
|
)
|
219
|
|
||||||
|
Liquefaction Supply Derivatives
|
662
|
|
—
|
|
662
|
|
||||||
|
Liquefaction Supply Derivatives
|
(320
|
)
|
—
|
|
(320
|
)
|
||||||
|
SPL Interest Rate Derivatives
|
11,158
|
|
—
|
|
11,158
|
|
||||||
|
SPL Interest Rate Derivatives
|
(23,194
|
)
|
—
|
|
(23,194
|
)
|
||||||
Cheniere Holdings was formed by us to hold our limited partner interest in Cheniere Partners and in December 2013, completed its initial public offering. Additionally, in November 2014, Cheniere Holdings sold
10.1 million
common shares at
$22.76
per common share to redeem from us the same number of common shares. As of both
September 30, 2015
and
December 31, 2014
, our ownership interest in Cheniere Holdings was
80.1%
, with the remaining non-controlling interest held by the public. Cheniere Holdings owns a
55.9%
limited partner interest in Cheniere Partners in the form of
12.0 million
common units,
45.3 million
Class B units and
135.4 million
subordinated units, with the remaining non-controlling interest held by Blackstone CQP Holdco LP and the public. We also own
100%
of the general partner interest and the incentive distribution rights in Cheniere Partners.
As of
September 30, 2015
and
December 31, 2014
, accrued liabilities consisted of the following (in thousands):
|
|
September 30,
|
December 31,
|
||||||
|
|
2015
|
2014
|
||||||
|
Interest expense and related debt fees
|
$
|
170,254
|
|
$
|
112,858
|
|
||
|
Compensation and benefits
|
83,581
|
|
6,425
|
|
||||
|
Liquefaction Project costs
|
181,219
|
|
22,014
|
|
||||
|
LNG terminal costs
|
5,987
|
|
1,077
|
|
||||
|
Other accrued liabilities
|
16,860
|
|
26,755
|
|
||||
|
Total accrued liabilities
|
$
|
457,901
|
|
$
|
169,129
|
|
||
14
CHENIERE ENERGY, INC. AND SUBSIDIARIES
NOTES TO CONSOLIDATED FINANCIAL STATEMENTS—CONTINUED
(unaudited)
As of
September 30, 2015
and
December 31, 2014
, our long-term debt consisted of the following (in thousands):
|
|
Interest
|
September 30,
|
December 31,
|
|||||||
|
|
Rate
|
2015
|
2014
|
|||||||
|
Long-term debt
|
||||||||||
|
2016 SPLNG Senior Notes
|
7.500%
|
$
|
1,665,500
|
|
$
|
1,665,500
|
|
|||
|
2020 SPLNG Senior Notes
|
6.500%
|
420,000
|
|
420,000
|
|
|||||
|
2021 SPL Senior Notes
|
5.625%
|
2,000,000
|
|
2,000,000
|
|
|||||
|
2022 SPL Senior Notes
|
6.250%
|
1,000,000
|
|
1,000,000
|
|
|||||
|
2023 SPL Senior Notes
|
5.625%
|
1,500,000
|
|
1,500,000
|
|
|||||
|
2024 SPL Senior Notes
|
5.750%
|
2,000,000
|
|
2,000,000
|
|
|||||
|
2025 SPL Senior Notes
|
5.625%
|
2,000,000
|
|
—
|
|
|||||
|
2015 SPL Credit Facilities (1)
|
(2)
|
250,000
|
|
—
|
|
|||||
|
2021 Cheniere Convertible Unsecured Notes
|
4.875%
|
1,028,953
|
|
1,004,469
|
|
|||||
|
2025 CCH HoldCo II Convertible Senior Notes
|
11.000%
|
1,003,667
|
|
—
|
|
|||||
|
2045 Cheniere Convertible Senior Notes
|
4.250%
|
625,000
|
|
—
|
|
|||||
|
CTPL Term Loan (3)
|
(4)
|
400,000
|
|
400,000
|
|
|||||
|
2015 CCH Credit Facility (5)
|
(6)
|
2,428,000
|
|
—
|
|
|||||
|
SPL Working Capital Facility (7)
|
(8)
|
—
|
|
—
|
|
|||||
|
Total long-term debt
|
16,321,120
|
|
9,989,969
|
|
||||||
|
Long-term debt premium (discount)
|
|
|
|
|
||||||
|
2016 SPLNG Senior Notes
|
(5,477
|
)
|
(8,998
|
)
|
||||||
|
2021 SPL Senior Notes
|
9,090
|
|
10,177
|
|
||||||
|
2023 SPL Senior Notes
|
6,570
|
|
7,088
|
|
||||||
|
2021 Cheniere Convertible Unsecured Notes
|
(174,133
|
)
|
(189,717
|
)
|
||||||
|
2045 Cheniere Convertible Senior Notes
|
(319,579
|
)
|
—
|
|
||||||
|
CTPL Term Loan
|
(1,681
|
)
|
(2,435
|
)
|
||||||
|
Total long-term debt, net
|
$
|
15,835,910
|
|
$
|
9,806,084
|
|
||||
|
(1)
|
Matures on the earlier of December 31, 2020 or the second anniversary of the completion date of Trains 1 through 5 of the
SPL Project
.
|
|
(2)
|
Variable interest rate, at SPL’s election, is
LIBOR
or the base rate plus the applicable margin. The applicable margins for
LIBOR
loans range from
1.30%
to
1.75%
, depending on the applicable 2015 SPL Credit Facility, and the applicable margin for base rate loans is
1.75%
. Interest on
LIBOR
loans is due and payable at the end of each
LIBOR
period, and interest on base rate loans is due and payable at the end of each quarter.
|
|
(3)
|
Matures on May 28, 2017 when the full amount of the outstanding principal obligations must be repaid.
|
|
(4)
|
Variable interest rate, at CTPL’s election, is
LIBOR
or the base rate plus the applicable margin. CTPL has historically elected
LIBOR
loans, for which the applicable margin is
3.25%
and is due and payable at the end of each LIBOR period.
|
|
(5)
|
Matures on the earlier of May 13, 2022 or the second anniversary of the completion date of the first two Trains of the
CCL Project
.
|
|
(6)
|
Variable interest rate, at CCH’s election, is LIBOR or the base rate plus the applicable margin. The applicable margins for
LIBOR
loans are
2.25%
prior to completion of the first two Trains of the
CCL Project
and
2.50%
on completion and thereafter. The applicable margins for base rate loans are
1.25%
prior to completion of the first two Trains of the
CCL Project
and
1.50%
on completion and thereafter. Interest on
LIBOR
loans is due and payable at the end of each applicable interest period, and interest on base rate loans is due and payable at the end of each quarter.
|
|
(7)
|
Matures on December 31, 2020, with various terms for underlying loans, as further described below under
SPL Working Capital Facility
. As of
September 30, 2015
and
December 31, 2014
, no loans were outstanding under the
SPL Working Capital Facility
or the
SPL LC Agreement
it replaced.
|
|
(8)
|
Variable interest rates, based on LIBOR or the base rate, as further described below under
SPL Working Capital Facility
.
|
For the
three months ended September 30, 2015 and 2014
, we incurred
$286.0 million
and
$154.8 million
of total interest cost, respectively, of which we capitalized and deferred
$192.4 million
and
$107.9 million
, respectively, including amortization
15
CHENIERE ENERGY, INC. AND SUBSIDIARIES
NOTES TO CONSOLIDATED FINANCIAL STATEMENTS—CONTINUED
(unaudited)
of debt issuance costs, primarily related to the construction of the
SPL Project
in both periods and additionally the
CCL Project
in 2015. For the
nine months ended September 30, 2015 and 2014
, we incurred
$707.8 million
and
$423.8 million
of total interest cost, respectively, of which we capitalized and deferred
$469.2 million
and
$292.8 million
, respectively, including amortization of debt issuance costs, primarily related to this construction.
SPLNG Senior Notes
Under the
SPLNG Indentures
, except for permitted tax distributions, SPLNG may not make distributions until certain conditions are satisfied as described in
Note 2—Restricted Cash
. During the
nine months ended September 30, 2015 and 2014
, SPLNG made distributions of
$267.9 million
and
$237.7 million
, respectively, after satisfying all the applicable conditions in the
SPLNG Indentures
.
SPL Senior Notes
In March 2015, SPL issued an aggregate principal amount of
$2.0 billion
of the
2025 SPL Senior Notes
, for which borrowings accrue interest at a fixed rate of
5.625%
. The terms of the
2025 SPL Senior Notes
are governed by the same common indenture with the other
SPL Senior Notes
. In connection with the closing of the sale of the
2025 SPL Senior Notes
, SPL entered into a Registration Rights Agreement dated March 3, 2015
(the “2025 SPL Registration Rights Agreement”)
. Under the terms of the
2025 SPL Registration Rights Agreement
, SPL has agreed, and any future guarantors of the
2025 SPL Senior Notes
will agree, to use commercially reasonable efforts to file with the
SEC
and cause to become effective a registration statement within
360 days
after March 3, 2015 with respect to an offer to exchange any and all of the
2025 SPL Senior Notes
for a like aggregate principal amount of debt securities of SPL with terms identical in all material respects to the respective
2025 SPL Senior Notes
sought to be exchanged (other than with respect to restrictions on transfer or to any increase in annual interest rate), and that are registered under the Securities Act of 1933, as amended
(the “Securities Act”)
. Under specified circumstances, SPL has also agreed, and any future guarantors will also agree, to use commercially reasonable efforts to cause to become effective a shelf registration statement relating to resales of the
2025 SPL Senior Notes
. SPL will be obligated to pay additional interest if it fails to comply with its obligations to register the
2025 SPL Senior Notes
within the specified time period.
2015 SPL Credit Facilities
In June 2015, SPL entered into the
2015 SPL Credit Facilities
with commitments aggregating
$4.6 billion
. The
2015 SPL Credit Facilities
are being used to fund a portion of the costs of developing, constructing and placing into operation Trains 1 through 5 of the
SPL Project
. Borrowings under the
2015 SPL Credit Facilities
may be refinanced, in whole or in part, at any time without premium or penalty; however, interest rate hedging and interest rate breakage costs may be incurred. As of
September 30, 2015
, SPL had
$4.3 billion
of available commitments and
$250.0 million
of outstanding borrowings under the
2015 SPL Credit Facilities
.
SPL incurred
$88.2 million
of debt issuance costs in connection with the
2015 SPL Credit Facilities
. In addition to interest, SPL is required to pay insurance/guarantee premiums of
0.45%
per annum on any drawn amounts under the covered tranches of the
2015 SPL Credit Facilities
. The
2015 SPL Credit Facilities
also require SPL to pay a quarterly commitment fee calculated at a rate per annum equal to either: (1)
40%
of the applicable margin, multiplied by the average daily amount of the undrawn commitment, or (2)
0.70%
of the undrawn commitment, depending on the applicable 2015 SPL Credit Facility. The principal of the loans made under the
2015 SPL Credit Facilities
must be repaid in quarterly installments, commencing with the earlier of June 30, 2020 and the last day of the first full calendar quarter after the completion date of Trains 1 through 5 of the
SPL Project
. Scheduled repayments are based upon an
18
-year amortization profile, with the remaining balance due upon the maturity of the
2015 SPL Credit Facilities
.
The
2015 SPL Credit Facilities
contain conditions precedent for borrowings, as well as customary affirmative and negative covenants. The obligations of SPL under the
2015 SPL Credit Facilities
are secured by substantially all of the assets of SPL as well as all of the membership interests in SPL on a
pari passu
basis with the
SPL Senior Notes
and the Amended and Restated Senior Working Capital Revolving Credit and Letter of Credit Reimbursement Agreement
(the “SPL Working Capital Facility”)
described below.
Under the terms of the
2015 SPL Credit Facilities
, SPL is required to hedge not less than
65%
of the variable interest rate exposure of its projected outstanding borrowings, calculated on a weighted average basis in comparison to its anticipated draw of principal.
16
CHENIERE ENERGY, INC. AND SUBSIDIARIES
NOTES TO CONSOLIDATED FINANCIAL STATEMENTS—CONTINUED
(unaudited)
2013 SPL Credit Facilities
In May 2013, SPL entered into the
2013 SPL Credit Facilities
to fund a portion of the costs of developing, constructing and placing into operation Trains 1 through 4 of the
SPL Project
. As of December 31, 2014, SPL had
no
outstanding borrowings under the
2013 SPL Credit Facilities
. In June 2015, the
2013 SPL Credit Facilities
were replaced with the
2015 SPL Credit Facilities
.
In March 2015, in conjunction with SPL’s issuance of the
2025 SPL Senior Notes
, SPL terminated approximately
$1.8 billion
of commitments under the
2013 SPL Credit Facilities
. This termination and the replacement of the
2013 SPL Credit Facilities
with the
2015 SPL Credit Facilities
in June 2015 resulted in a write-off of debt issuance costs and deferred commitment fees associated with the
2013 SPL Credit Facilities
of
$96.3 million
for the
nine months ended September 30, 2015
.
Convertible Notes
2021 Cheniere Convertible Unsecured Notes
In November 2014, we issued an aggregate principal amount of
$1.0 billion
Convertible Unsecured Notes due 2021
(the “2021 Cheniere Convertible Unsecured Notes”)
on a private placement basis in reliance on the exemption from registration provided for under section 4(a)(2) of the
Securities Act
and Regulation S promulgated thereunder. The
2021 Cheniere Convertible Unsecured Notes
accrue interest at a rate of
4.875%
per annum, which is payable in kind semi-annually in arrears by increasing the principal amount of the
2021 Cheniere Convertible Unsecured Notes
outstanding.
One year
after the closing date, the
2021 Cheniere Convertible Unsecured Notes
will be convertible at the option of the holder into our common stock at the then-applicable conversion rate, provided that the closing price of our common stock is greater than or equal to the conversion price on the conversion date. The initial conversion price was
$93.64
and is subject to adjustment upon the occurrence of certain specified events. We have the option to satisfy the conversion obligation with cash, common stock or a combination thereof.
Under
GAAP
, certain convertible debt instruments that may be settled in cash upon conversion are required to be separately accounted for as liability (debt) and equity (conversion option) components of the instrument in a manner that reflects the issuer’s non-convertible debt borrowing rate. We determined that the fair value of the debt component was
$808.8 million
and the residual value of the equity component was
$191.2 million
as of the issuance date. As of
September 30, 2015
and
December 31, 2014
, the carrying value of the equity component was
$196.1 million
and
$191.9 million
, respectively. The debt component is accreted to the total principal amount due at maturity by amortizing the debt discount. The effective rate of interest to amortize the debt discount was approximately
9.1%
and
9.2%
as of
September 30, 2015
and
December 31, 2014
, respectively, and the remaining period over which the debt discount will be amortized was
5.7
years as of
September 30, 2015
. As of
September 30, 2015
, the if-converted value of the
2021 Cheniere Convertible Unsecured Notes
did not exceed the principal balance.
2025 CCH HoldCo II Convertible Senior Notes
In May 2015, CCH HoldCo II issued
$1.0 billion
aggregate principal amount of 11% Senior Secured Notes due 2025
(the “2025 CCH HoldCo II Convertible Senior Notes”)
on a private placement basis in reliance on the exemption from registration provided for under section 4(a)(2) of the
Securities Act
. The
2025 CCH HoldCo II Convertible Senior Notes
were issued pursuant to the amended and restated note purchase agreement entered into among CCH HoldCo II, EIG Management Company, LLC, The Bank of New York Mellon, the Company and the note purchasers. The
$1.0 billion
principal of the
2025 CCH HoldCo II Convertible Senior Notes
will be used to partially fund costs associated with
Stage 1
of the
CCL Project
and the
Corpus Christi Pipeline
. The purchasers have made commitments, which will expire on May 1, 2016, to acquire an additional
$500 million
of
2025 CCH HoldCo II Convertible Senior Notes
(the “Second Phase Funding”)
upon satisfaction of incremental customary conditions precedent related to the construction of
Stage 2
of the
CCL Project
. The
2025 CCH HoldCo II Convertible Senior Notes
bear interest at a rate of
11.0%
per annum, which is payable quarterly in arrears. Prior to the substantial completion of
Train
2 of the
CCL Project
, if the
Second Phase Funding
has not occurred, and to the substantial completion of Train 3 of the
CCL Project
following the occurrence of the
Second Phase Funding
, interest on the
2025 CCH HoldCo II Convertible Senior Notes
will be paid entirely in kind. Following this date, the interest generally must be paid in cash; however, a portion of the interest may be paid in kind under certain specified circumstances. The
2025 CCH HoldCo II Convertible Senior Notes
are secured by a pledge by us of
100%
of the equity interests in CCH HoldCo II, and a pledge by CCH HoldCo II of
100%
of the equity interests in CCH HoldCo I.
17
CHENIERE ENERGY, INC. AND SUBSIDIARIES
NOTES TO CONSOLIDATED FINANCIAL STATEMENTS—CONTINUED
(unaudited)
At CCH HoldCo II’s option, the outstanding
2025 CCH HoldCo II Convertible Senior Notes
are convertible into our common stock on or after the later of (1)
58 months
from May 1, 2015, and (2) the substantial completion of Train 2 of the
CCL Project
and any
2025 CCH HoldCo II Convertible Senior Notes
issued in connection with the
Second Phase Funding
will be convertible on or after the substantial completion of Train 3 of the
CCL Project
(in each case, the “Eligible Conversion Date”)
. The conversion price for
2025 CCH HoldCo II Convertible Senior Notes
converted at CCH HoldCo II’s option is the lower of (1) a
10%
discount to the average of the daily volume-weighted average price
(“VWAP”)
of our common stock for the
90
trading day period prior to the date on which notice of conversion is provided, and (2) a
10%
discount to the closing price of our common stock on the trading day preceding the date on which notice of conversion is provided. At the option of the holders, the
2025 CCH HoldCo II Convertible Senior Notes
are convertible on or after the
six
-month anniversary of the applicable
Eligible Conversion Date
at a conversion price equal to the average of the daily
VWAP
of our common stock for the
90
trading day period prior to the date on which notice of conversion is provided. Conversions are also subject to various limitations and conditions. As of
September 30, 2015
, the value of the
2025 CCH HoldCo II Convertible Senior Notes
if converted at the holders’ option did not exceed the principal balance.
2045 Cheniere Convertible Senior Notes
In March 2015, we issued
$625.0 million
aggregate principal amount of
4.25%
Convertible Senior Notes due 2045
(the “2045 Cheniere Convertible Senior Notes”)
to certain investors through a registered direct offering. The
2045 Cheniere Convertible Senior Notes
were issued with an original issue discount of
20%
and accrue interest at a rate of
4.25%
per annum, which is payable semi-annually in arrears. We have the right, at our option, at any time after March 15, 2020, to redeem all or any part of the
2045 Cheniere Convertible Senior Notes
at a redemption price payable in cash equal to the accreted amount of the
2045 Cheniere Convertible Senior Notes
to be redeemed, plus accrued and unpaid interest, if any, to such redemption date. The conversion rate will initially equal
7.2265
shares of our common stock per $1,000 principal amount of the
2045 Cheniere Convertible Senior Notes
, which corresponds to an initial conversion price of approximately
$138.38
per share of our common stock. The conversion rate is subject to adjustment upon the occurrence of certain specified events. We have the option to satisfy the conversion obligation with cash, common stock or a combination thereof.
We determined that the fair value of the debt component of the
2045 Cheniere Convertible Senior Notes
was
$304.3 million
and the residual value of the equity component was
$195.7 million
as of the issuance date, excluding debt issuance costs. As of
September 30, 2015
, the carrying value of the equity component was
$194.1 million
. The debt component is accreted to the total principal amount due at maturity by amortizing the debt discount. The effective rate of interest to amortize the debt discount was approximately
9.4%
as of
September 30, 2015
, and the remaining period over which the debt discount will be amortized was
29.5
years. As of
September 30, 2015
, the if-converted value of the
2045 Cheniere Convertible Senior Notes
did not exceed the principal balance.
Interest expense, before capitalization, related to the
2021 Cheniere Convertible Unsecured Notes
, the
2025 CCH HoldCo II Convertible Senior Notes
and the
2045 Cheniere Convertible Senior Notes
(together, the “Convertible Notes”)
consisted of the following (in thousands):
|
|
Three Months Ended September 30,
|
Nine Months Ended September 30,
|
||||||||||||||
|
|
2015
|
2014
|
2015
|
2014
|
||||||||||||
|
Interest per contractual rate
|
$
|
46,782
|
|
$
|
—
|
|
$
|
97,991
|
|
$
|
—
|
|
||||
|
Amortization of debt discount
|
7,233
|
|
—
|
|
20,948
|
|
—
|
|
||||||||
|
Amortization of debt issuance costs
|
1,133
|
|
—
|
|
1,748
|
|
—
|
|
||||||||
|
Total interest expense related to the Convertible Notes
|
$
|
55,148
|
|
$
|
—
|
|
$
|
120,687
|
|
$
|
—
|
|
||||
CTPL Term Loan
As of
September 30, 2015
, CTPL had borrowed the full amount of
$400.0 million
available under the
CTPL Term Loan
. The outstanding balance may be repaid, in whole or in part, at any time without premium or penalty.
2015 CCH Credit Facility
In May 2015, CCH entered into the
2015 CCH Credit Facility
, which is being used to fund a portion of the costs associated with the development, construction, operation and maintenance of the
CCL Project
. The total commitment under the
2015 CCH Credit Facility
is approximately
$11.5 billion
, comprising approximately
$8.4 billion
linked to
Stage 1
of the
CCL Project
and the
18
CHENIERE ENERGY, INC. AND SUBSIDIARIES
NOTES TO CONSOLIDATED FINANCIAL STATEMENTS—CONTINUED
(unaudited)
Corpus Christi Pipeline
and approximately
$3.1 billion
linked to
Stage 2
of the
CCL Project
. Borrowings under the
2015 CCH Credit Facility
may be refinanced, in whole or in part, at any time without premium or penalty; however, interest rate hedging and interest rate breakage costs may be incurred. As of
September 30, 2015
, CCH had
$6.0 billion
of available commitments and
$2.4 billion
of outstanding borrowings under the
2015 CCH Credit Facility
.
CCH incurred
$289.8 million
of debt issuance costs in connection with the
2015 CCH Credit Facility
. In addition to interest, CCH will incur a commitment fee at a rate per annum equal to
40%
of the margin for
LIBOR
loans, multiplied by the outstanding undrawn debt commitments. The principal of the loans made under the
2015 CCH Credit Facility
must be repaid in quarterly installments, commencing on the earlier of (1) the first quarterly payment date occurring more than three calendar months following project completion and (2) a set date determined by reference to the date under which a certain LNG buyer linked to the last Train to become operational is entitled to terminate its
SPA
for failure to achieve the date of first commercial delivery for that agreement. Scheduled repayments will be based upon a
19
-year tailored amortization, commencing the first full quarter after the project completion and designed to achieve a minimum projected fixed debt service coverage ratio of
1.55
:1.
The
2015 CCH Credit Facility
contains conditions precedent for borrowings, as well as customary affirmative and negative covenants. The obligations of CCH under the
2015 CCH Credit Facility
are secured by a first priority lien on substantially all of the assets of CCH and its subsidiaries and by a pledge by CCH HoldCo I of its limited liability company interests in CCH.
Under the terms of the
2015 CCH Credit Facility
, CCH is required to hedge not less than
65%
of the variable interest rate exposure of its senior secured debt.
SPL Working Capital Facility
In September 2015, SPL entered into a
$1.2 billion
SPL Working Capital Facility
, which replaced the
$325.0 million
Senior Letter of Credit and Reimbursement Agreement that was entered into in April 2014
(the “SPL LC Agreement”)
. The
SPL Working Capital Facility
is intended to be used for loans to SPL
(“Working Capital Loans”)
, the issuance of letters of credit on behalf of SPL
(“Letters of Credit”)
, as well as for swing line loans to SPL
(“Swing Line Loans”)
, primarily for certain working capital requirements related to developing and placing into operation the
SPL Project
. SPL may, from time to time, request increases in the commitments under the
SPL Working Capital Facility
of up to
$760 million
and, upon the completion of the debt financing of Train 6 of the
SPL Project
, request an incremental increase in commitments of up to an additional
$390 million
. As of
September 30, 2015
, SPL had
$1.1 billion
of available commitments,
$127.6 million
aggregate amount of issued Letters of Credit and
no
Working Capital Loans
,
Swing Line Loans
or loans deemed made in connection with a draw upon a Letter of Credit
(“LC Loans” and collectively with Working Capital Loans and Swing Line Loans, the “SPL Working Capital Facility Loans”)
outstanding under the
SPL Working Capital Facility
. As of
December 31, 2014
, SPL had issued letters of credit in an aggregate amount of
$9.5 million
, and
no
draws had been made upon any letters of credit issued under the
SPL LC Agreement
.
SPL Working Capital Facility Loans
accrue interest at a variable rate per annum equal to LIBOR or the base rate (equal to the highest of the senior facility agent’s published prime rate, the federal funds effective rate, as published by the Federal Reserve Bank of New York, plus
0.50%
and one month LIBOR plus
0.50%
), plus the applicable margin. The applicable margin for LIBOR
SPL Working Capital Facility Loans
is
1.75%
per annum, and the applicable margin for base rate
SPL Working Capital Facility Loans
is
0.75%
per annum. Interest on
Swing Line Loans
and
LC Loans
is due and payable on the date the loan becomes due. Interest on LIBOR
Working Capital Loans
is due and payable at the end of each applicable LIBOR period, and interest on base rate
Working Capital Loans
is due and payable at the end of each fiscal quarter. However, if such base rate Working Capital Loan is converted into a LIBOR Working Capital Loan, interest is due and payable on that date. Additionally, if the loans become due prior to such periods, the interest also becomes due on that date.
SPL incurred
$27.5 million
of debt issuance costs in connection with the
SPL Working Capital Facility
. SPL pays (1) a commitment fee on the average daily amount of the excess of the total commitment amount over the principal amount outstanding without giving effect to any outstanding
Swing Line Loans
in an amount equal to an annual rate of
0.70%
and (2) a Letter of Credit fee equal to an annual rate of
1.75%
of the undrawn portion of all
Letters of Credit
issued under the
SPL Working Capital Facility
. If draws are made upon a Letter of Credit issued under the
SPL Working Capital Facility
and SPL does not elect for such draw
(an “LC Draw”)
to be deemed an LC Loan, SPL is required to pay the full amount of the
LC Draw
on or prior to the business day following the notice of the
LC Draw
. An
LC Draw
accrues interest at an annual rate of
2.0%
plus the base rate. As of
September 30, 2015
,
no
LC Draw
s had been made upon any
Letters of Credit
issued under the
SPL Working Capital Facility
.
19
CHENIERE ENERGY, INC. AND SUBSIDIARIES
NOTES TO CONSOLIDATED FINANCIAL STATEMENTS—CONTINUED
(unaudited)
The
SPL Working Capital Facility
matures on December 31, 2020, and the outstanding balance may be repaid, in whole or in part, at any time without premium or penalty upon
three
business days’ notice.
LC Loans
have a term of up to
one year
.
Swing Line Loans
terminate upon the earliest of (1) the maturity date or earlier termination of the
SPL Working Capital Facility
, (2) the date
15 days
after such Swing Line Loan is made and (3) the first borrowing date for a Working Capital Loan or Swing Line Loan occurring at least
three
business days following the date the Swing Line Loan is made. SPL is required to reduce the aggregate outstanding principal amount of all
Working Capital Loans
to
zero
for a period of
five
consecutive business days at least once each year.
The
SPL Working Capital Facility
contains conditions precedent for extensions of credit, as well as customary affirmative and negative covenants. The obligations of SPL under the
SPL Working Capital Facility
are secured by substantially all of the assets of SPL as well as all of the membership interests in SPL on a
pari passu
basis with the
SPL Senior Notes
and
2015 SPL Credit Facilities
.
Fair Value Disclosures
The following table (in thousands) shows the carrying amount and estimated fair value of our long-term debt:
|
|
September 30, 2015
|
December 31, 2014
|
||||||||||||||
|
|
Carrying
Amount
|
Estimated
Fair Value
|
Carrying
Amount
|
Estimated
Fair Value
|
||||||||||||
|
2016 SPLNG Senior Notes, net of discount (1)
|
$
|
1,660,023
|
|
$
|
1,684,923
|
|
$
|
1,656,502
|
|
$
|
1,718,621
|
|
||||
|
2020 SPLNG Senior Notes (1)
|
420,000
|
|
410,550
|
|
420,000
|
|
428,400
|
|
||||||||
|
2021 SPL Senior Notes, net of premium (1)
|
2,009,090
|
|
1,853,386
|
|
2,010,177
|
|
1,985,050
|
|
||||||||
|
2022 SPL Senior Notes (1)
|
1,000,000
|
|
930,000
|
|
1,000,000
|
|
1,020,000
|
|
||||||||
|
2023 SPL Senior Notes, net of premium (1)
|
1,506,570
|
|
1,344,614
|
|
1,507,089
|
|
1,476,947
|
|
||||||||
|
2024 SPL Senior Notes (1)
|
2,000,000
|
|
1,765,000
|
|
2,000,000
|
|
1,970,000
|
|
||||||||
|
2025 SPL Senior Notes (1)
|
2,000,000
|
|
1,755,000
|
|
—
|
|
—
|
|
||||||||
|
2015 SPL Credit Facilities (2)
|
250,000
|
|
250,000
|
|
—
|
|
—
|
|
||||||||
|
2021 Cheniere Convertible Unsecured Notes, net of discount (3)
|
854,820
|
|
894,160
|
|
814,751
|
|
1,025,563
|
|
||||||||
|
2025 CCH HoldCo II Convertible Senior Notes (3)
|
1,003,667
|
|
900,490
|
|
—
|
|
—
|
|
||||||||
|
2045 Cheniere Convertible Senior Notes, net of discount (4)
|
305,421
|
|
390,263
|
|
—
|
|
—
|
|
||||||||
|
CTPL Term Loan, net of discount (2)
|
398,319
|
|
400,000
|
|
397,565
|
|
400,000
|
|
||||||||
|
2015 CCH Credit Facility (2)
|
2,428,000
|
|
2,428,000
|
|
—
|
|
—
|
|
||||||||
|
SPL Working Capital Facility (2)
|
—
|
|
—
|
|
—
|
|
—
|
|
||||||||
|
(1)
|
The Level 2 estimated fair value was based on quotations obtained from broker-dealers who make markets in these and similar instruments based on the closing trading prices on
September 30, 2015
and
December 31, 2014
, as applicable.
|
|
(2)
|
The Level 3 estimated fair value approximates the principal amount because the interest rates are variable and reflective of market rates and the debt may be repaid, in full or in part, at any time without penalty.
|
|
(3)
|
The Level 3 estimated fair value was calculated based on inputs that are observable in the market or that could be derived from, or corroborated with, observable market data, including our stock price and interest rates based on debt issued by parties with comparable credit ratings to us and inputs that are not observable in the market.
|
|
(4)
|
The Level 1 estimated fair value was based on unadjusted quoted prices in active markets for identical liabilities that we had the ability to access at the measurement date.
|
We are not presently a taxpayer for federal or state income tax purposes and have not recorded a net liability for federal or state income taxes in any of the periods included in the accompanying Consolidated Financial Statements. However, we are presently an international taxpayer and have recorded a net (benefit) of
$(0.1) million
and a net expense of
$2.0 million
for the
three months ended September 30, 2015 and 2014
, respectively, and a net expense of
$0.1 million
and
$2.1 million
for the
nine months ended September 30, 2015 and 2014
, respectively, for international income taxes.
20
CHENIERE ENERGY, INC. AND SUBSIDIARIES
NOTES TO CONSOLIDATED FINANCIAL STATEMENTS—CONTINUED
(unaudited)
We experienced an ownership change within the provisions of Internal Revenue Code (“IRC”) Section 382 in 2008, 2010 and 2012. An analysis of the annual limitation on the utilization of our net operating losses (“NOLs”) was performed in accordance with IRC Section 382. It was determined that IRC Section 382 will not limit the use of our NOLs in full over the carryover period. We will continue to monitor trading activity in our shares which may cause an additional ownership change which could ultimately affect our ability to fully utilize our existing tax NOL carryforwards.
We have granted stock, restricted stock, phantom units and options to purchase common stock to employees, outside directors and a consultant under the Cheniere Energy, Inc. Amended and Restated 1997 Stock Option Plan
(the “1997 Plan”)
, Amended and Restated 2003 Stock Incentive Plan, as amended
(the “2003 Plan”)
, 2011 Incentive Plan, as amended
(the “2011 Plan”)
, and the 2014-2018 Long-Term Cash Incentive Program
(the “2014-2018 LTIP”)
.
The
1997 Plan
provides for the issuance of stock options to purchase up to
5.0 million
shares of our common stock, all of which have been granted. Non-qualified stock options were granted to employees, contract service providers and outside directors. The
2003 Plan
and
2011 Plan
provide for the issuance of
21.0 million
shares and
35.0 million
shares, respectively, of our common stock that may be in the form of non-qualified stock options, incentive stock options, purchased stock, restricted (non-vested) stock, bonus (unrestricted) stock, stock appreciation rights, phantom units and other share-based performance awards deemed by the compensation committee of our board of directors
(the “Compensation Committee”)
to be consistent with the purposes of the
2003 Plan
and the
2011 Plan
. As of
September 30, 2015
, all of the shares under the
2003 Plan
have been granted and
26.9 million
shares, net of cancellations, have been granted under the
2011 Plan
.
In April 2015, the
Compensation Committee
recommended and our board of directors approved the Company’s 2015 Long-Term Cash Incentive Plan, including its sub-plan, the
2014-2018 LTIP
. The
2014-2018 LTIP
consists of phantom units settled in cash with
five
consecutive annual performance periods commencing on November 1 and ending on October 31 of each year through October 31, 2018. Awards under the
2014-2018 LTIP
will be subject to a
three
-year vesting schedule, with one third of the phantom units vesting and becoming payable on each of the first, second and third anniversaries of the date of the grant (with the exception of the initial grant for the 2014 performance period, which will vest and become payable on each of February 1, 2016, February 1, 2017 and February 1, 2018). The
2014-2018 LTIP
is
100%
performance-based and will reward long-term performance measured against growth in the Company’s market capitalization, referred to in the plan documents as total shareholder value
(“TSV”)
, above certain thresholds. Under the
2014-2018 LTIP
, the general pool is targeted to be awarded between
2%
and
4%
of the growth in
TSV
and the senior executive pool is capped at
2%
of the growth in
TSV
, with the Chief Executive Officer’s compensation targeted at
50%
of the senior executive pool, subject to adjustment at the discretion of the
Compensation Committee
. The number of phantom units comprising the senior executive pool has also been capped, and cannot exceed an amount equal to
1.5%
of the shares of our common stock outstanding in any one year.
Phantom units are share-based awards granted to employees over a vesting period that entitle the grantee to receive the cash equivalent to the value of a share of our common stock upon each vesting. Phantom units are not eligible to receive quarterly distributions. The Company initially measures compensation cost based on the Company’s stock price on the grant date, which is included in accrued liabilities on our Consolidated Balance Sheets, and is adjusted quarterly for any changes in the Company’s stock price and period of service rendered. During the
three and nine months ended September 30, 2015
, we granted
0.1 million
and
5.7 million
phantom units, respectively, to employees, including units awarded under the
2014-2018 LTIP
. We did not grant any phantom units to employees during the
three and nine months ended September 30, 2014
.
For the
three months ended September 30, 2015 and 2014
, the total share-based compensation expense, net of capitalization, recognized in our net loss was
$26.2 million
and
$22.5 million
, respectively, and for the same periods we capitalized as part of the cost of capital assets
$1.3 million
and
$2.2 million
, respectively. For the
nine months ended September 30, 2015 and 2014
, the total share-based compensation expense, net of capitalization, recognized in our net loss was
$92.6 million
and
$84.4 million
, respectively, and for the same periods we capitalized as part of the cost of capital assets
$21.5 million
and
$6.6 million
, respectively.
The total unrecognized compensation cost at
September 30, 2015
relating to non-vested share-based compensation arrangements was
$316.2 million
, which is expected to be recognized over a weighted average period of
2.3 years
.
21
CHENIERE ENERGY, INC. AND SUBSIDIARIES
NOTES TO CONSOLIDATED FINANCIAL STATEMENTS—CONTINUED
(unaudited)
We received
$0.4 million
and
$3.1 million
in the
three months ended September 30, 2015 and 2014
, respectively, and
$2.3 million
and
$9.5 million
in the
nine months ended September 30, 2015 and 2014
, respectively, of proceeds from the exercise of stock options.
During the
three and nine months ended September 30, 2014
, we recognized
zero
and
$10.8 million
, respectively, of share-based compensation expense related to the modification of long-term commercial bonus awards resulting from an employee termination. We did not recognize any share-based compensation expense related to such modifications in the
three and nine months ended September 30, 2015
.
Basic net loss per share attributable to common stockholders
(“EPS”)
excludes dilution and is computed by dividing net loss attributable to common stockholders by the weighted average number of common shares outstanding during the period. Diluted
EPS
reflects potential dilution and is computed by dividing net loss attributable to common stockholders by the weighted average number of common shares outstanding during the period increased by the number of additional common shares that would have been outstanding if the potential common shares had been issued.
The following table (in thousands, except for loss per share) reconciles basic and diluted weighted average common shares outstanding for the
three and nine months ended September 30, 2015 and 2014
:
|
Three Months Ended
|
Nine Months Ended
|
||||||||||||||
|
|
September 30,
|
September 30,
|
|||||||||||||
|
|
2015
|
2014
|
2015
|
2014
|
|||||||||||
|
Weighted average common shares outstanding:
|
|
|
|||||||||||||
|
Basic
|
227,126
|
|
224,309
|
|
226,648
|
|
223,710
|
|
|||||||
|
Dilutive common stock options (1)
|
—
|
|
—
|
|
—
|
|
—
|
|
|||||||
|
Diluted
|
227,126
|
|
224,309
|
|
226,648
|
|
223,710
|
|
|||||||
|
Basic and diluted net loss per share attributable to common stockholders
|
$
|
(1.31
|
)
|
$
|
(0.40
|
)
|
$
|
(3.02
|
)
|
$
|
(1.74
|
)
|
|||
|
(1)
|
Stock options and unvested stock of
8.6 million
shares and
13.0 million
shares for the
three months ended September 30, 2015 and 2014
, respectively, and
8.6 million
shares and
12.8 million
shares for the
nine months ended September 30, 2015 and 2014
, respectively, representing securities that could potentially dilute basic
EPS
in the future, were not included in the diluted net loss per share computations because their effect would have been anti-dilutive. In addition,
56.2 million
shares in aggregate, issuable upon conversion of the
2021 Cheniere Convertible Unsecured Notes
, the
2025 CCH HoldCo II Convertible Senior Notes
and the
2045 Cheniere Convertible Senior Notes
, as described in
Note 7—Long-Term Debt
, were not included in the computation of diluted net loss per share for the
three and nine months ended September 30, 2015
because the computation of diluted net loss per share utilizing the “if-converted” method would be anti-dilutive.
|
Legal Proceedings
During the second quarter of 2014,
four
lawsuits were filed in the Court of Chancery of the State of Delaware
(the “Court”)
against us and/or certain of our present and former officers and directors that challenged the manner in which abstentions were treated in connection with the stockholder vote on Amendment No. 1 to the
2011 Plan
(“Amendment No. 1”)
, pursuant to which, among other things, the number of shares of common stock available for issuance under the
2011 Plan
was increased from
10.0 million
to
35.0 million
shares. The lawsuits contended that abstentions should have been counted as “no” votes in tabulating the outcome of the vote and that the stockholders did not approve
Amendment No. 1
when abstentions are counted as such. The lawsuits further contended that portions of the Amended and Restated Bylaws of Cheniere Energy, Inc. adopted on April 3, 2014 were invalid and that certain disclosures relating to these matters made by us were misleading. The lawsuits asserted claims for breach of contract and breach of fiduciary duty (both on a class and a derivative basis) and claims for unjust enrichment (on a derivative basis). The lawsuits sought, among other things, a declaration that the February 1, 2013 stockholder vote on
Amendment No. 1
was void, disgorgement of all compensation distributed as a result of
Amendment No. 1
, voiding the awards made from the shares reserved pursuant to
Amendment No. 1
and monetary damages. On June 16, 2014, we filed a verified application with the
Court
pursuant to 8 Del. C. § 205
(the “Section 205 Action”)
in which we asked the
Court
to declare valid the issuance, pursuant
22
CHENIERE ENERGY, INC. AND SUBSIDIARIES
NOTES TO CONSOLIDATED FINANCIAL STATEMENTS—CONTINUED
(unaudited)
to the
2011 Plan
, of the
25.0 million
additional shares of our common stock covered by
Amendment No. 1
, whether occurring in the past or the future.
The parties to the above-referenced lawsuits and the
Section 205 Action
entered into a Stipulation and Agreement of Compromise, Settlement and Release dated December 12, 2014, subject to its terms and conditions, including receipt, among other things, of
Court
approval, to resolve the litigation. On March 16, 2015, the
Court
approved the settlement of the litigation and awarded plaintiffs’ counsel fees, which were paid by our insurers in April 2015.
Obligations under Certain Guarantee Contracts
Cheniere and certain of its subsidiaries enter into guarantee arrangements in the normal course of business to facilitate transactions with third parties. These arrangements include financial guarantees, letters of credit and debt guarantees. As of
September 30, 2015
and
December 31, 2014
, there were
no
liabilities recognized under these guarantee arrangements.
We have
two
reportable segments: LNG terminal segment and LNG and natural gas marketing segment. We determine our reportable segments by identifying each segment that engaged in business activities from which it may earn revenues and incur expenses, had operating results regularly reviewed by the entities’ chief operating decision maker for purposes of resource allocation and performance assessment, and had discrete financial information. Substantially all of our revenues from external customers are attributed to the United States. Substantially all of our long-lived assets are located in the United States.
Our LNG terminal segment consists of the Sabine Pass and Corpus Christi LNG terminals. We own and operate the Sabine Pass LNG terminal located on the Sabine Pass shipping channel in Louisiana through our ownership interest in and management agreements with Cheniere Partners. We own
100%
of the general partner interest in Cheniere Partners and
80.1%
of the common shares of Cheniere Holdings, which owns a
55.9%
limited partner interest in Cheniere Partners. We are also developing and constructing a natural gas liquefaction facility near Corpus Christi, Texas.
Our LNG and natural gas marketing segment consists of LNG and natural gas marketing activities by Cheniere Marketing. Cheniere Marketing is developing a platform for LNG sales to international markets with professional staff based in the United States, United Kingdom, Singapore and Chile.
23
CHENIERE ENERGY, INC. AND SUBSIDIARIES
NOTES TO CONSOLIDATED FINANCIAL STATEMENTS—CONTINUED
(unaudited)
The following table (in thousands) summarizes revenues (losses), loss from operations and total assets for each of our reporting segments:
|
|
Segments
|
||||||||||||||
|
|
LNG Terminal
|
LNG & Natural Gas Marketing
|
Corporate and Other (1)
|
Total
Consolidation
|
|||||||||||
|
As of or for the Three Months Ended September 30, 2015
|
|||||||||||||||
|
Revenues (losses) from external customers (2)
|
$
|
67,212
|
|
$
|
(1,557
|
)
|
$
|
404
|
|
$
|
66,059
|
|
|||
|
Intersegment revenues (losses) (3)
|
233
|
|
11,354
|
|
(11,587
|
)
|
—
|
|
|||||||
|
Depreciation expense
|
16,775
|
|
320
|
|
4,543
|
|
21,638
|
|
|||||||
|
Income (loss) from operations
|
27,072
|
|
(27,117
|
)
|
(52,029
|
)
|
(52,074
|
)
|
|||||||
|
Interest expense, net of capitalized interest
|
(67,589
|
)
|
(14
|
)
|
(25,963
|
)
|
(93,566
|
)
|
|||||||
|
Loss before income taxes and non-controlling interest (4)
|
(196,693
|
)
|
(27,665
|
)
|
(82,803
|
)
|
(307,161
|
)
|
|||||||
|
Share-based compensation
|
1,316
|
|
2,051
|
|
24,084
|
|
27,451
|
|
|||||||
|
Goodwill
|
76,819
|
|
—
|
|
—
|
|
76,819
|
|
|||||||
|
Total assets
|
16,784,317
|
|
552,752
|
|
1,115,190
|
|
18,452,259
|
|
|||||||
|
Expenditures for additions to long-lived assets
|
1,429,808
|
|
403
|
|
21,258
|
|
1,451,469
|
|
|||||||
|
As of or for the Three Months Ended September 30, 2014
|
|
|
|
|
|||||||||||
|
Revenues (losses) from external customers (2)
|
$
|
66,983
|
|
$
|
(500
|
)
|
|
$
|
324
|
|
$
|
66,807
|
|
||
|
Intersegment revenues (losses) (3)
|
607
|
|
17,262
|
|
(17,869
|
)
|
—
|
|
|||||||
|
Depreciation expense
|
14,817
|
|
103
|
|
1,269
|
|
16,189
|
|
|||||||
|
Loss from operations
|
(28,482
|
)
|
(6,652
|
)
|
(26,030
|
)
|
(61,164
|
)
|
|||||||
|
Interest expense, net of capitalized interest
|
(46,996
|
)
|
—
|
|
112
|
|
(46,884
|
)
|
|||||||
|
Loss before income taxes and non-controlling interest (4)
|
(64,886
|
)
|
(7,130
|
)
|
(30,813
|
)
|
(102,829
|
)
|
|||||||
|
Share-based compensation
|
3,278
|
|
8,281
|
|
13,096
|
|
24,655
|
|
|||||||
|
Goodwill
|
76,819
|
|
—
|
|
—
|
|
76,819
|
|
|||||||
|
Total assets
|
10,847,861
|
|
65,536
|
|
871,919
|
|
11,785,316
|
|
|||||||
|
Expenditures for additions to long-lived assets
|
695,159
|
|
486
|
|
21,895
|
|
717,540
|
|
|||||||
|
For the Nine Months Ended September 30, 2015
|
|
||||||||||||||
|
Revenues (losses) from external customers (2)
|
$
|
203,324
|
|
$
|
(1,601
|
)
|
$
|
730
|
|
$
|
202,453
|
|
|||
|
Intersegment revenues (losses) (3)
|
827
|
|
24,725
|
|
(25,552
|
)
|
—
|
|
|||||||
|
Depreciation expense
|
47,787
|
|
764
|
|
11,010
|
|
59,561
|
|
|||||||
|
Loss from operations
|
(15,324
|
)
|
(58,667
|
)
|
(134,201
|
)
|
(208,192
|
)
|
|||||||
|
Interest expense, net of capitalized interest
|
(169,899
|
)
|
(14
|
)
|
(68,751
|
)
|
(238,664
|
)
|
|||||||
|
Loss before income taxes and non-controlling interest (4)
|
(507,751
|
)
|
(59,871
|
)
|
(217,014
|
)
|
(784,636
|
)
|
|||||||
|
Share-based compensation
|
30,233
|
|
12,138
|
|
71,736
|
|
114,107
|
|
|||||||
|
Expenditures for additions to long-lived assets
|
5,964,244
|
|
2,517
|
|
70,913
|
|
6,037,674
|
|
|||||||
|
|
|||||||||||||||
|
For the Nine Months Ended September 30, 2014
|
|||||||||||||||
|
Revenues from external customers (2)
|
$
|
200,243
|
|
$
|
482
|
|
$
|
1,277
|
|
$
|
202,002
|
|
|||
|
Intersegment revenues (losses) (3)
|
2,113
|
|
21,336
|
|
(23,449
|
)
|
—
|
|
|||||||
|
Depreciation expense
|
44,033
|
|
364
|
|
4,565
|
|
48,962
|
|
|||||||
|
Loss from operations
|
(56,863
|
)
|
(33,153
|
)
|
(81,153
|
)
|
(171,169
|
)
|
|||||||
|
Interest expense, net of capitalized interest
|
(131,264
|
)
|
—
|
|
321
|
|
(130,943
|
)
|
|||||||
|
Loss before income taxes and non-controlling interest (4)
|
(376,363
|
)
|
(34,046
|
)
|
(95,299
|
)
|
(505,708
|
)
|
|||||||
|
Share-based compensation
|
9,840
|
|
17,212
|
|
63,920
|
|
90,972
|
|
|||||||
|
Expenditures for additions to long-lived assets
|
2,164,596
|
|
1,271
|
|
54,120
|
|
2,219,987
|
|
|||||||
|
(1)
|
Includes corporate activities, business development, oil and gas exploration, development and exploitation, strategic activities and certain intercompany eliminations. These activities have been included in the corporate and other column due to the lack of a material impact that these activities have on our Consolidated Financial Statements.
|
24
CHENIERE ENERGY, INC. AND SUBSIDIARIES
NOTES TO CONSOLIDATED FINANCIAL STATEMENTS—CONTINUED
(unaudited)
|
(2)
|
Substantially all of the LNG terminal revenues relate to regasification capacity reservation fee payments made by Total Gas & Power North America, Inc. and Chevron U.S.A. Inc. LNG and natural gas marketing and trading revenue consists primarily of the domestic marketing of natural gas imported into the Sabine Pass LNG terminal.
|
|
(3)
|
Intersegment revenues (losses) related to our LNG and natural gas marketing segment are primarily a result of international revenue allocations using a cost plus transfer pricing methodology. These LNG and natural gas marketing segment intersegment revenues (losses) are eliminated with intersegment revenues (losses) in our Consolidated
Statements of Operations
.
|
|
(4)
|
Items to reconcile loss from operations and loss before income taxes and non-controlling interest include consolidated other income (expense) amounts as presented on our Consolidated
Statements of Operations
primarily related to our LNG terminal segment.
|
The following table (in thousands) provides supplemental disclosure of cash flow information:
|
|
Nine Months Ended September 30,
|
|||||||
|
|
2015
|
2014
|
||||||
|
Cash paid during the year for interest, net of amounts capitalized and deferred
|
$
|
48,271
|
|
$
|
47,152
|
|
||
|
Balance in property, plant and equipment, net funded with accounts payable and accrued liabilities
|
356,306
|
|
287,330
|
|
||||
|
Non-cash conveyance of assets
|
13,169
|
|
—
|
|
||||
In May 2014, the Financial Accounting Standards Board
(the “FASB”)
amended its guidance on revenue recognition. The core principle of this amendment is that an entity should recognize revenue to depict the transfer of promised goods or services to customers in an amount that reflects the consideration to which the entity expects to be entitled in exchange for those goods or services. This guidance is effective for annual reporting periods beginning after December 15, 2017, including interim periods within that reporting period. Earlier adoption is permitted as of annual reporting periods beginning after December 15, 2016. This guidance may be adopted either retrospectively to each prior reporting period presented or as a cumulative-effect adjustment as of the date of adoption. We are currently evaluating the impact of the provisions of this guidance on our Consolidated Financial Statements and related disclosures.
In August 2014, the
FASB
issued authoritative guidance that requires an entity’s management to evaluate, for each reporting period, whether there are conditions and events that raise substantial doubt about the entity’s ability to continue as a going concern within one year after the financial statements are issued. Additional disclosures are required if management concludes that conditions or events raise substantial doubt about the entity’s ability to continue as a going concern. This guidance is effective for annual reporting periods ending after December 15, 2016, and for annual periods and interim periods thereafter, with earlier adoption permitted. The adoption of this guidance is not expected to have an impact on our Consolidated Financial Statements or related disclosures.
In February 2015, the
FASB
amended its guidance on consolidation analysis. This amendment primarily affects asset managers and reporting entities involved with limited partnerships or similar entities, but the analysis is relevant in the evaluation of any reporting organization’s requirement to consolidate a legal entity. This guidance changes (1) the identification of variable interests, (2) the variable interest entity characteristics for a limited partnership or similar entity and (3) the primary beneficiary determination. This guidance is effective for annual reporting periods beginning after December 15, 2015, including interim periods within that reporting period, with earlier adoption permitted. This guidance may be adopted either retrospectively to each prior reporting period presented or as a cumulative-effect adjustment as of the date of adoption. We are currently evaluating the impact of the provisions of this guidance on our Consolidated Financial Statements and related disclosures.
25
CHENIERE ENERGY, INC. AND SUBSIDIARIES
NOTES TO CONSOLIDATED FINANCIAL STATEMENTS—CONTINUED
(unaudited)
In April 2015, the
FASB
issued authoritative guidance that requires debt issuance costs related to a recognized debt liability to be presented in the balance sheet as a direct deduction from the debt liability rather than as an asset. In August 2015, the FASB further issued guidance clarifying the SEC staff’s position on presentation and subsequent measurement of debt issuance costs incurred in connection with line of credit arrangements. This guidance is effective for annual reporting periods beginning after December 15, 2015, including interim periods within that reporting period, with earlier adoption permitted. This guidance must be adopted retrospectively to each prior reporting period presented and disclosures will be required for a change in accounting principles. We are currently evaluating the impact of the provisions of this guidance on our Consolidated Balance Sheets.
In April 2015, the
FASB
issued authoritative guidance that clarifies the circumstances under which a cloud computing customer would account for the arrangement as a license of internal-use software. This guidance is effective for annual reporting periods beginning after December 15, 2015, including interim periods within that reporting period, with earlier adoption permitted. This guidance may be adopted either retrospectively or prospectively to arrangements entered into, or materially modified, after the effective date. The adoption of this guidance is not expected to have an impact on our Consolidated Financial Statements or related disclosures.
In July 2015, the
FASB
issued revised guidance related to the measurement of inventory. Inventory would be measured at the lower of cost and net realizable value. Net realizable value is the estimated selling prices in the ordinary course of business, less reasonably predictable costs of completion, disposal and transportation. This guidance is effective for annual reporting periods beginning after December 15, 2016, including interim periods within that reporting period, with earlier adoption permitted. This guidance should be adopted prospectively. We are currently evaluating the impact of the provisions of this guidance on our Consolidated Financial Statements and related disclosures.
26
|
ITEM 2.
|
MANAGEMENT’S DISCUSSION AND ANALYSIS OF FINANCIAL CONDITION AND RESULTS OF OPERATIONS
|
Information Regarding Forward-Looking Statements
This quarterly report contains certain statements that are, or may be deemed to be, “forward-looking statements” within the meaning of Section 27A of the Securities Act of 1933, as amended, and Section 21E of the Securities Exchange Act of 1934, as amended
(the “Exchange Act”)
. All statements, other than statements of historical facts, included herein or incorporated herein by reference are “forward-looking statements.” Included among “forward-looking statements” are, among other things:
|
•
|
statements that we expect to commence or complete construction of our proposed LNG terminals, liquefaction facilities, pipeline facilities or other projects, or any expansions thereof, by certain dates, or at all;
|
|
•
|
statements regarding future levels of domestic and international natural gas production, supply or consumption or future levels of LNG imports into or exports from North America and other countries worldwide or purchases of natural gas, regardless of the source of such information, or the transportation or other infrastructure or demand for and prices related to natural gas, LNG or other hydrocarbon products;
|
|
•
|
statements regarding any financing transactions or arrangements, or ability to enter into such transactions;
|
|
•
|
statements relating to the construction of our Trains, including statements concerning the engagement of any
EPC
contractor or other contractor and the anticipated terms and provisions of any agreement with any
EPC
or other contractor, and anticipated costs related thereto;
|
|
•
|
statements regarding any
SPA
or other agreement to be entered into or performed substantially in the future, including any revenues anticipated to be received and the anticipated timing thereof, and statements regarding the amounts of total LNG regasification, liquefaction or storage capacities that are, or may become, subject to contracts;
|
|
•
|
statements regarding counterparties to our commercial contracts, construction contracts and other contracts;
|
|
•
|
statements regarding our planned development and construction of additional Trains, including the financing of such Trains;
|
|
•
|
statements that our Trains, when completed, will have certain characteristics, including amounts of liquefaction capacities;
|
|
•
|
statements regarding our business strategy, our strengths, our business and operation plans or any other plans, forecasts, projections, or objectives, including anticipated revenues and capital expenditures, any or all of which are subject to change;
|
|
•
|
statements regarding legislative, governmental, regulatory, administrative or other public body actions, approvals, requirements, permits, applications, filings, investigations, proceedings or decisions;
|
|
•
|
statements regarding our anticipated LNG and natural gas marketing activities; and
|
|
•
|
any other statements that relate to non-historica
l or future information.
|
All of these types of statements, other than statements of historical fact, are forward-looking statements. In some cases, forward-looking statements can be identified by terminology such as “may,” “will,” “could,” “should,” “expect,” “plan,” “project,” “intend,” “anticipate,” “believe,” “estimate,” “predict,” “potential,” “pursue,” “target,” “continue,” the negative of such terms or other comparable terminology. The forward-looking statements contained in this quarterly report are largely based on our expectations, which reflect estimates and assumptions made by our management. These estimates and assumptions reflect our best judgment based on currently known market conditions and other factors. Although we believe that such estimates are reasonable, they are inherently uncertain and involve a number of risks and uncertainties beyond our control. In addition, assumptions may prove to be inaccurate. We caution that the forward-looking statements contained in this quarterly report are not guarantees of future performance and that such statements may not be realized or the forward-looking statements or events may not occur. Actual results may differ materially from those anticipated or implied in forward-looking statements due to factors described in this quarterly report and in the other reports and other information that we file with the
SEC
. These forward-looking statements speak only as of the date made, and other than as required by law, we undertake no obligation to publicly update or revise any forward-looking statement, whether as a result of new information, future events or otherwise.
Our actual results could differ materially from those anticipated in these forward-looking statements as a result of a variety of factors, including those discussed under “Risk Factors” in our Annual Report on Form 10-K for the year ended
December 31,
27
2014
. All forward-looking statements attributable to us or persons acting on our behalf are expressly qualified in their entirety by these risk factors. Other than as required under the securities laws, we assume no obligation to update or revise these forward-looking statements or provide reasons why actual results may differ.
Introduction
The following discussion and analysis presents management’s view of our business, financial condition and overall performance and should be read in conjunction with our Consolidated Financial Statements and the accompanying notes. This information is intended to provide investors with an understanding of our past performance, current financial condition and outlook for the future. Our discussion and analysis include the following subjects:
|
•
|
Overview of Business
|
|
•
|
Overview of Significant Events
|
|
•
|
Liquidity and Capital Resources
|
|
•
|
Results of Operations
|
|
•
|
Off-Balance Sheet Arrangements
|
|
•
|
Summary of Critical Accounting Estimates
|
|
•
|
Recent Accounting Standards
|
Overview of Business
Cheniere, a Delaware corporation, is a Houston-based energy company primarily engaged in LNG-related businesses. We own and operate the Sabine Pass LNG terminal in Louisiana through our ownership interest in and management agreements with Cheniere Partners, which is a publicly traded limited partnership that we created in 2007. We own
100%
of the general partner interest in Cheniere Partners and
80.1%
of Cheniere Holdings, which is a publicly traded limited liability company formed in 2013 that owns a
55.9%
limited partner interest in Cheniere Partners. We are currently developing and constructing two natural gas liquefaction and export facilities.
The Sabine Pass LNG terminal is located on the Sabine Pass deepwater shipping channel less than four miles from the Gulf Coast. The Sabine Pass LNG terminal has operational regasification facilities owned by Cheniere Partners’ wholly owned subsidiary, SPLNG, that includes existing infrastructure of five LNG storage tanks with capacity of approximately 16.9
Bcfe
, two docks that can accommodate vessels with nominal capacity of up to 266,000 cubic meters and vaporizers with regasification capacity of approximately 4.0
Bcf/d
. Cheniere Partners is developing and constructing natural gas liquefaction facilities
(the “SPL Project”)
at the Sabine Pass LNG terminal adjacent to the existing regasification facilities through a wholly owned subsidiary, SPL. Cheniere Partners plans to construct up to six Trains, which are in various stages of development. Each Train is expected to have a nominal production capacity of approximately 4.5
mtpa
of LNG. Cheniere Partners also owns a 94-mile pipeline that interconnects the Sabine Pass LNG terminal with a number of large interstate pipelines
(the “Creole Trail Pipeline”)
through a wholly owned subsidiary, CTPL.
We are developing and constructing a second natural gas liquefaction and export facility and pipeline facility on over 1,500 acres of land that we own or control near Corpus Christi, Texas
(the “CCL Project”)
through wholly owned subsidiaries CCL and CCP, respectively. The Corpus Christi LNG terminal is being developed for up to five Trains, with expected aggregate nominal production capacity of approximately 22.5
mtpa
of LNG, four LNG storage tanks with capacity of approximately 13.5
Bcfe
and two docks that can accommodate vessels with nominal capacity of up to 266,000 cubic meters. The CCL Project is being developed in stages. The first stage
(“Stage 1”)
includes Trains 1 and 2, two LNG storage tanks, one complete marine berth and a second partial berth and all of the CCL Project’s necessary infrastructure facilities. The second stage
(“Stage 2”)
includes Train 3, one LNG storage tank and the completion of the second partial berth and the third stage
(“Stage 3”)
includes Trains 4 and 5 and one LNG storage tank. The
CCL Project
also includes a 23-mile, 48” natural gas supply pipeline that will interconnect the Corpus Christi LNG terminal with several interstate and intrastate natural gas pipelines
(the “Corpus Christi Pipeline”)
.
Cheniere Marketing is engaged in the LNG and natural gas marketing business and is seeking to develop a portfolio of long-term, short-term and spot
SPA
s. Cheniere Marketing has entered into
SPA
s with SPL and CCL to purchase LNG produced by the
SPL Project
and the
CCL Project
.
28
We are also in various stages of developing other projects, including a liquid hydrocarbon export project in Texas along the Gulf Coast.
Overview of Significant Events
Our significant accomplishments since January 1,
2015
and through the filing date of this Form 10-Q include the following:
Cheniere
|
•
|
We issued an aggregate principal amount of $625.0 million Convertible Senior Notes due 2045
(the “2045 Cheniere Convertible Senior Notes”)
through a registered direct offering. The
2045 Cheniere Convertible Senior Notes
were issued with an original issue discount of 20% and accrue interest at a rate of 4.25% per annum, which is payable semi-annually in arrears. The net proceeds of the
2045 Cheniere Convertible Senior Notes
are being used for general corporate purposes.
|
|
•
|
Cheniere Marketing and CCL received authorization from the
DOE
to export up to a combined total of the equivalent of 767
Bcf/yr
of domestically produced LNG by vessel from the
CCL Project
to
non-FTA countries
for a 20-year term.
|
|
•
|
CCH entered into a credit facility
(the “2015 CCH Credit Facility”)
to be used for costs associated with the development, construction, operation and maintenance of the
CCL Project
, with commitments of $8.4 billion linked to
Stage 1
of the
CCL Project
and the
Corpus Christi Pipeline
and an additional $3.1 billion linked to
Stage 2
of the
CCL Project
.
|
|
•
|
CCH HoldCo II issued $1.0 billion aggregate principal amount of 11% Senior Secured Notes due 2025
(the “2025 CCH HoldCo II Convertible Senior Notes”)
, which will be used to pay a portion of the capital costs associated with
Stage 1
of the
CCL Project
and the Corpus Christi Pipeline.
|
|
•
|
CCL issued a notice to proceed
(“NTP”)
to Bechtel Oil, Gas and Chemicals, Inc.
(“Bechtel”)
under the lump sum turnkey contract for the engineering, procurement and construction of
Stage 1
of the
CCL Project
(the “EPC Contract (CCL Stage 1)”)
.
|
|
•
|
We have agreed in principle to partner with Parallax Enterprises, LLC
(“Parallax”)
to develop up to 11
mtpa
of LNG production capacity through
Parallax
’s two mid-scale natural gas liquefaction projects in Louisiana along the Gulf Coast.
|
Cheniere Partners
|
•
|
SPL issued an aggregate principal amount of $2.0 billion of 5.625% Senior Secured Notes due 2025
(the “2025 SPL Senior Notes”)
. Net proceeds from the offering will be used to pay a portion of the capital costs associated with the construction of the first four Trains of the
SPL Project
.
|
|
•
|
We received authorization from the
FERC
to site, construct and operate Trains 5 and 6 of the
SPL Project
.
|
|
•
|
SPL received authorization from the
DOE
to export up to a combined total of the equivalent of 503.3
Bcf/yr
of domestically produced LNG by vessel from Trains 5 and 6 of the
SPL Project
to
non-FTA countries
for a 20-year term.
|
|
•
|
SPL entered into a lump sum turnkey contract for the engineering, procurement and construction of Train 5 of the
SPL Project
(the “EPC Contract (Train 5)”)
.
|
|
•
|
SPL entered into four credit facilities
(collectively, the “2015 SPL Credit Facilities”)
totaling $4.6 billion, which replaced its existing credit facilities. The
2015 SPL Credit Facilities
will be used to fund a portion of the costs of developing, constructing and placing into operation Trains 1 through 5 of the
SPL Project
.
|
|
•
|
SPL issued an
NTP
to
Bechtel
under the
EPC Contract (Train 5)
.
|
|
•
|
SPL entered into a
$1.2 billion
Amended and Restated Senior Working Capital Revolving Credit and Letter of Credit Reimbursement Agreement
(the “SPL Working Capital Facility”)
, which replaced the existing Senior Letter of Credit and Reimbursement Agreement that was entered into in April 2014
(the “SPL LC Agreement”)
. The
SPL Working Capital Facility
will be used primarily for certain working capital requirements related to developing and placing into operation the
SPL Project
.
|
29
Liquidity and Capital Resources
Although results are consolidated for financial reporting, Cheniere, Cheniere Holdings, Cheniere Partners, SPL and SPLNG operate with independent capital structures. We expect the cash needs for at least the next twelve months will be met for each of these independent capital structures as follows:
•
SPLNG through operating cash flows, existing unrestricted cash and debt offerings or equity contributions;
•
SPL through project debt and equity financings and operating cash flows;
|
•
|
Cheniere Partners through operating cash flows from SPLNG, SPL and CTPL, existing unrestricted cash and debt or equity offerings;
|
•
Cheniere Holdings through distributions from Cheniere Partners; and
|
•
|
Cheniere through project financing, existing unrestricted cash, debt and equity offerings by us or our subsidiaries, operating cash flows, services fees from Cheniere Holdings, Cheniere Partners and its other subsidiaries and distributions from our investments in Cheniere Holdings and Cheniere Partners.
|
As of
September 30, 2015
, we had cash and cash equivalents of
$1,340.3 million
available to Cheniere. In addition, we had current and non-current restricted cash of
$771.1 million
(which included current and non-current restricted cash available to CCH HoldCo II, Cheniere Holdings, Cheniere Partners, SPL and SPLNG) designated for the following purposes:
$71.3 million
for the
CCL Project
;
$327.2 million
for the
SPL Project
;
$11.3 million
for CTPL;
$129.1 million
for interest payments related to the
SPLNG Senior Notes
described below; and
$232.2 million
for other restricted purposes.
In November 2014, we issued an aggregate principal amount of $1.0 billion Convertible Unsecured Notes due 2021
(the “2021 Cheniere Convertible Unsecured Notes”)
. Beginning one year after the closing date, the
2021 Cheniere Convertible Unsecured Notes
will be convertible at the option of the holder into our common stock at the then applicable conversion rate, provided that the closing price of our common stock is greater than or equal to the conversion price on the conversion date. The initial conversion price was $93.64 and is subject to adjustment upon the occurrence of certain specified events. We have the option to satisfy the conversion obligation with cash, common stock or a combination thereof.
In March 2015, we issued the
2045 Cheniere Convertible Senior Notes
. We have the right, at our option, at any time after March 15, 2020, to redeem all or any part of the
2045 Cheniere Convertible Senior Notes
at a redemption price equal to the accreted amount of the
2045 Cheniere Convertible Senior Notes
to be redeemed, plus accrued and unpaid interest, if any, to such redemption date. The conversion rate will initially equal 7.2265 shares of our common stock per $1,000 principal amount of the
2045 Cheniere Convertible Senior Notes
, which corresponds to an initial conversion price of approximately $138.38 per share of our common stock. The conversion rate is subject to adjustment upon the occurrence of certain specified events. We have the option to satisfy the conversion obligation with cash, common stock or a combination thereof.
We receive management fees from CCL and CCP for managing the construction and operation of the CCL Project. For the
nine months ended September 30, 2015
, we received $1.4 million of management fees from CCL and CCP.
Substantially all of our revenues from external customers and long-lived assets are attributed to or located in the United States.
Cheniere Holdings
Cheniere Holdings was formed by us to hold our Cheniere Partners limited partner interests, thereby allowing us to segregate our lower risk, stable, cash flow generating assets from our higher risk, early stage development projects and marketing activities. As of
September 30, 2015
, we had an
80.1%
direct ownership interest in Cheniere Holdings. We receive dividends on our Cheniere Holdings shares from the distributions that Cheniere Holdings receives from Cheniere Partners, and we receive management fees for managing Cheniere Holdings. For the
nine months ended September 30, 2015
, we received
$11.0 million
in dividends on our Cheniere Holdings common shares and
$0.8 million
of management fees from Cheniere Holdings.
Cheniere Partners
Our ownership interest in the Sabine Pass LNG terminal is held through Cheniere Partners. As of
September 30, 2015
, we own
80.1%
of Cheniere Holdings, which owns a 55.9% limited partner interest in Cheniere Partners in the form of
11,963,488
30
common units,
45,333,334
Class B units and
135,383,831
subordinated units. We also own 100% of the general partner interest and the incentive distribution rights in Cheniere Partners.
Prior to the initial public offering by Cheniere Holdings, we received quarterly equity distributions from Cheniere Partners related to our limited partner and 2% general partner interests. We will continue to receive quarterly equity distributions from Cheniere Partners related to our 2% general partner interest, and we receive fees for providing services to Cheniere Partners, SPLNG, SPL and CTPL. During the
nine months ended September 30, 2015
, we received
$1.5 million
in distributions on our general partner interest and
$66.4 million
in total service fees from Cheniere Partners, SPLNG, SPL and CTPL.
Cheniere Partners’ common unit and general partner distributions are being funded from accumulated operating surplus. We have not received distributions on our subordinated units with respect to the quarters ended on or after June 30, 2010. Cheniere Partners will not make distributions on our subordinated units until it generates additional cash flow from the
SPL Project
, SPLNG’s excess capacity or other new business, which would be used to make quarterly distributions on our subordinated units before any increase in distributions to the common unitholders.
Cheniere Partners’ Class B units are subject to conversion, mandatorily or at the option of the Class B unitholders under specified circumstances, into a number of common units based on the then-applicable conversion value of the Class B units. The Cheniere Partners Class B units are not entitled to cash distributions except in the event of a liquidation of Cheniere Partners, a merger, consolidation or other combination of Cheniere Partners with another person or the sale of all or substantially all of the assets of Cheniere Partners. On a quarterly basis beginning on the initial purchase of the Class B units and ending on the conversion date of the Class B units, the conversion value of the Class B units increases at a compounded rate of 3.5% per quarter, subject to an additional upward adjustment for certain equity and debt financings. The accreted conversion ratio of the Class B units owned by Cheniere Holdings and Blackstone CQP Holdco LP
(“Blackstone”)
was
1.57
and
1.54
, respectively, as of
September 30, 2015
. We expect the Class B units to mandatorily convert into common units within 90 days of the substantial completion date of Train 3 of the
SPL Project
, which Cheniere Partners currently expects to occur before April 30, 2017. If the Class B units are not mandatorily converted by July 2019, the holders of the Class B units have the option to convert the Class B units into common units at that time.
LNG Terminal Business
Sabine Pass LNG Terminal
Regasification Facilities
The Sabine Pass LNG terminal has operational regasification capacity of approximately 4.0
Bcf/d
and aggregate LNG storage capacity of approximately 16.9
Bcfe
. Approximately 2.0
Bcf/d
of the regasification capacity at the Sabine Pass LNG terminal has been reserved under two long-term third-party
TUA
s, under which SPLNG’s customers are required to pay fixed monthly fees, whether or not they use the LNG terminal. Each of Total Gas & Power North America, Inc.
(“Total”)
and Chevron U.S.A. Inc.
(“Chevron”)
has reserved approximately 1.0
Bcf/d
of regasification capacity and is obligated to make monthly capacity payments to SPLNG aggregating approximately $125 million annually for 20 years that commenced in 2009. Total S.A. has guaranteed
Total
’s obligations under its
TUA
up to $2.5 billion, subject to certain exceptions, and Chevron Corporation has guaranteed
Chevron
’s obligations under its
TUA
up to 80% of the fees payable by
Chevron
.
The remaining approximately 2.0
Bcf/d
of capacity has been reserved under a
TUA
by SPL. SPL is obligated to make monthly capacity payments to SPLNG aggregating approximately $250 million annually, continuing until at least 20 years after SPL delivers its first commercial cargo at the
SPL Project
.
Under each of these
TUA
s, SPLNG is entitled to retain 2% of the LNG delivered to the Sabine Pass LNG terminal.
31
Liquefaction Facilities
The
SPL Project
is being developed and constructed at the Sabine Pass LNG terminal adjacent to the existing regasification facilities. We commenced construction of Trains 1 and 2 and the related new facilities needed to treat, liquefy, store and export natural gas in August 2012. Construction of Trains 3 and 4 and the related facilities commenced in May 2013. In April 2015, we received authorization from the
FERC
to site, construct and operate Trains 5 and 6. In June 2015, we commenced construction of Train 5 and the related facilities.
The
DOE
has authorized the export of up to a combined total of the equivalent of 16
mtpa
(approximately 803
Bcf/yr
) of domestically produced LNG by vessel from the Sabine Pass LNG terminal to
FTA countries
for a 30-year term and to
non-FTA countries
for a 20-year term. The
DOE
further issued an order authorizing SPL to export up to the equivalent of approximately 203
Bcf/yr
of domestically produced LNG from the Sabine Pass LNG terminal to
FTA countries
for a 25-year period. SPL’s application for authorization to export that same 203
Bcf/yr
of domestically produced LNG from the Sabine Pass LNG terminal to
non-FTA countries
is currently pending at the
DOE
. Additionally, the
DOE
issued orders authorizing SPL to export up to a combined total of 503.3
Bcf/yr
of domestically produced LNG from the Sabine Pass LNG terminal to
FTA countries
and
non-FTA countries
for a 20-year term. The Sierra Club has requested a rehearing of the non-FTA order pertaining to the 503.3
Bcf/yr
, and the
DOE
has not yet ruled on this request. In each case, the terms of these authorizations begin on the earlier of the date of first export thereunder or the date specified in the particular order, which ranges from 5 to 10 years from the date the order was issued.
As of
September 30, 2015
, the overall project completion percentage for Trains 1 and 2 of the
SPL Project
was approximately
95.2%
, which is ahead of the contractual schedule. As of
September 30, 2015
, the overall project completion percentage for Trains 3 and 4 of the
SPL Project
was approximately
73.6%
, which is also ahead of the contractual schedule. Based on our current construction schedule, we anticipate that Train 1 will produce LNG as early as late 2015, and Trains 2 through 5 are expected to commence operations on a staggered basis thereafter.
Customers
SPL has entered into six fixed price, 20-year
SPA
s with third parties that in the aggregate equate to approximately 19.75
mtpa
of LNG that commence with the date of first commercial delivery for Trains 1 through 5, which are fully permitted. Under these
SPA
s, the customers will purchase LNG from SPL for a price consisting of a fixed fee plus 115% of
Henry Hub
per
MMBtu
of LNG. In certain circumstances, the customers may elect to cancel or suspend deliveries of LNG cargoes, in which case the customers would still be required to pay the fixed fee with respect to cargoes that are not delivered. A portion of the fixed fee will be subject to annual adjustment for inflation. The
SPA
s and contracted volumes to be made available under the
SPA
s are not tied to a specific Train; however, the term of each
SPA
commences upon the start of operations of the specified Train.
In aggregate, the fixed fee portion to be paid by these customers is approximately $2.9 billion annually for Trains 1 through 5, with the applicable fixed fees starting from the commencement of commercial operations of the applicable Train. These fixed fees equal approximately $411 million, $564 million, $650 million, $648 million and $588 million for each of Trains 1 through 5, respectively.
In addition, Cheniere Marketing has entered into an amended and restated
SPA
with SPL to purchase, at Cheniere Marketing’s option, any LNG produced by SPL in excess of that required for other customers at a price of 115% of
Henry Hub
plus $3.00 per
MMBtu
of LNG.
Natural Gas Transportation and Supply
For SPL’s natural gas feedstock transportation requirements, it has entered into transportation precedent agreements to secure firm pipeline transportation capacity with CTPL and third-party pipeline companies. SPL has also entered into enabling agreements and long-term natural gas purchase agreements with third parties in order to secure natural gas feedstock for the
SPL Project
. As of
September 30, 2015
, SPL has secured up to approximately
2,156.6 million
MMBtu
of natural gas feedstock through long-term natural gas purchase agreements.
Construction
SPL entered into lump sum turnkey contracts with
Bechtel
for the engineering, procurement and construction of Trains 1 through 5, under which
Bechtel
charges a lump sum for all work performed and generally bears project cost risk unless certain
32
specified events occur, in which case
Bechtel
may cause SPL to enter into a change order, or SPL agrees with
Bechtel
to a change order.
The total contract prices of the
EPC
contract for Trains 1 and 2,
EPC
contract for Trains 3 and 4 and
EPC Contract (Train 5)
are approximately
$4.1 billion
,
$3.8 billion
and
$2.9 billion
, respectively, reflecting amounts incurred under change orders through
September 30, 2015
. Total expected capital costs for Trains 1 through 5 are estimated to be between
$12.5 billion
and
$13.5 billion
before financing costs and between
$17.0 billion
and
$18.0 billion
after financing costs including, in each case, estimated owner’s costs and contingencies.
Pipeline Facilities
During the third quarter of 2015, CTPL completed construction of certain modifications to allow the
Creole Trail Pipeline
to be able to transport natural gas to the Sabine Pass LNG terminal.
Final Investment Decision on Train 6
We will contemplate making a final investment decision
(“FID”)
to commence construction of Train 6 of the
SPL Project
based upon, among other things, entering into an
EPC
contract, entering into acceptable commercial arrangements and obtaining adequate financing to construct the Train.
Capital Resources
We currently expect that SPL’s capital resources requirements with respect to Trains 1 through 5 of the
SPL Project
will be financed through one or more of the following: borrowings, equity contributions from Cheniere Partners and cash flows under the
SPA
s. We believe that with the net proceeds of borrowings, unfunded commitments under the
2015 SPL Credit Facilities
, available commitments under the
SPL Working Capital Facility
and cash flows from operations, we will have adequate financial resources available to complete Trains 1 through 5 of the
SPL Project
and to meet its currently anticipated capital, operating and debt service requirements. We currently project that SPL will generate cash flow from the
SPL Project
by early 2016.
Senior Secured Notes
As of
September 30, 2015
, Cheniere Partners’ subsidiaries had seven series of senior secured notes outstanding
(collectively, the “Senior Notes”)
:
|
•
|
$1.7 billion
of 7.50% Senior Secured Notes due 2016 issued by SPLNG
(the “2016 SPLNG Senior Notes”)
;
|
|
•
|
$0.4 billion
of 6.50% Senior Secured Notes due 2020 issued by SPLNG
(the “2020 SPLNG Senior Notes” and collectively with the 2016 SPLNG Senior Notes, the “SPLNG Senior Notes”)
;
|
|
•
|
$2.0 billion
of 5.625% Senior Secured Notes due 2021 issued by SPL
(the “2021 SPL Senior Notes”)
;
|
|
•
|
$1.0 billion
of 6.25% Senior Secured Notes due 2022 issued by SPL
(the “2022 SPL Senior Notes”)
;
|
|
•
|
$1.5 billion
of 5.625% Senior Secured Notes due 2023 issued by SPL
(the “2023 SPL Senior Notes”)
;
|
|
•
|
$2.0 billion
of 5.75% Senior Secured Notes due 2024 issued by SPL
(the “2024 SPL Senior Notes” and collectively with the 2021 SPL Senior Notes, the 2022 SPL Senior Notes, the 2023 SPL Senior Notes and the 2025 SPL Senior Notes, the “SPL Senior Notes”)
; and
|
|
•
|
$2.0 billion
of the
2025 SPL Senior Notes
.
|
Interest on the
Senior Notes
is payable semi-annually in arrears. Subject to permitted liens, the
SPLNG Senior Notes
are secured on a
pari passu
first-priority basis by a security interest in all of SPLNG’s equity interests and substantially all of SPLNG’s operating assets. The
SPL Senior Notes
are secured on a first-priority basis by a security interest in all of the membership interests in SPL and substantially all of SPL’s assets.
SPLNG may redeem all or part of its
2016 SPLNG Senior Notes
at any time at a redemption price equal to 100% of the principal plus any accrued and unpaid interest plus the greater of:
|
•
|
1.0% of the principal amount of the
2016 SPLNG Senior Notes
; or
|
33
|
•
|
the excess of: (1) the present value at such redemption date of (a) the redemption price of the
2016 SPLNG Senior Notes
plus (b) all required interest payments due on the
2016 SPLNG Senior Notes
(excluding accrued but unpaid interest to the redemption date), computed using a discount rate equal to the treasury rate as of such redemption date plus 50 basis points; over (2) the principal amount of the
2016 SPLNG Senior Notes
, if greater.
|
SPLNG may redeem all or part of the
2020 SPLNG Senior Notes
at any time on or after November 1, 2016 at fixed redemption prices specified in the indenture governing the
2020 SPLNG Senior Notes
, plus accrued and unpaid interest, if any, to the date of redemption. SPLNG may also, at its option, redeem all or part of the
2020 SPLNG Senior Notes
at any time prior to November 1, 2016, at a “make-whole” price set forth in the indenture governing the
2020 SPLNG Senior Notes
, plus accrued and unpaid interest, if any, to the date of redemption. At any time before November 1, 2015, SPLNG may redeem up to 35% of the aggregate principal amount of the
2020 SPLNG Senior Notes
at a redemption price of 106.5% of the principal amount of the
2020 SPLNG Senior Notes
to be redeemed, plus accrued and unpaid interest, if any, to the redemption date, in an amount not to exceed the net proceeds of one or more completed equity offerings as long as SPLNG redeems the
2020 SPLNG Senior Notes
within 180 days of the closing date for such equity offering and at least 65% of the aggregate principal amount of the
2020 SPLNG Senior Notes
originally issued remains outstanding after the redemption.
At any time prior to three months before the respective dates of maturity for each series of the
SPL Senior Notes
, SPL may redeem all or part of such series of the
SPL Senior Notes
at a redemption price equal to the “make-whole” price set forth in the common indenture governing the
SPL Senior Notes
, plus accrued and unpaid interest, if any, to the date of redemption. SPL may also, at any time within three months of the respective maturity dates for each series of the
SPL Senior Notes
, redeem all or part of such series of the
SPL Senior Notes
at a redemption price equal to 100% of the principal amount of such series of the
SPL Senior Notes
to be redeemed, plus accrued and unpaid interest, if any, to the date of redemption.
Under the indentures governing the
SPLNG Senior Notes
(the “SPLNG Indentures”)
, except for permitted tax distributions, SPLNG may not make distributions until, among other requirements, deposits are made into debt service reserve accounts and a fixed charge coverage ratio test of 2:1 is satisfied. Under the common indenture governing the
SPL Senior Notes
, SPL may not make any distributions until, among other requirements, substantial completion of Trains 1 and 2 has occurred, deposits are made into debt service reserve accounts and a debt service coverage ratio test of 1.25:1.00 is satisfied. During the
nine months ended September 30, 2015 and 2014
, SPLNG made distributions of
$267.9 million
and
$237.7 million
, respectively, after satisfying all the applicable conditions in the
SPLNG Indentures
.
The
SPL Senior Notes
are governed by a common indenture with restrictive covenants. SPL may incur additional indebtedness in the future, including by issuing additional notes, and such indebtedness could be at higher interest rates and have different maturity dates and more restrictive covenants than the current outstanding indebtedness of SPL, including the
SPL Senior Notes
, the
2015 SPL Credit Facilities
and the
SPL Working Capital Facility
.
2015 SPL Credit Facilities
In June 2015, SPL entered into the
2015 SPL Credit Facilities
with commitments aggregating $4.6 billion. The
2015 SPL Credit Facilities
are being used to fund a portion of the costs of developing, constructing and placing into operation Trains 1 through 5 of the
SPL Project
. Borrowings under the
2015 SPL Credit Facilities
may be refinanced, in whole or in part, at any time without premium or penalty; however, interest rate hedging and interest rate breakage costs may be incurred. As of
September 30, 2015
, SPL had
$4.3 billion
of available commitments and
$250.0 million
of outstanding borrowings under the
2015 SPL Credit Facilities
.
Loans under the
2015 SPL Credit Facilities
accrue interest at a variable rate per annum equal to, at SPL’s election,
LIBOR
or the base rate plus the applicable margin. The applicable margin for
LIBOR
loans ranges from 1.30% to 1.75%, depending on the applicable 2015 SPL Credit Facility, and the applicable margin for base rate loans is 1.75%. Interest on
LIBOR
loans is due and payable at the end of each
LIBOR
period and interest on base rate loans is due and payable at the end of each quarter. In addition, SPL is required to pay insurance/guarantee premiums of 0.45% per annum on any drawn amounts under the covered tranches of the
2015 SPL Credit Facilities
. The
2015 SPL Credit Facilities
also require SPL to pay a quarterly commitment fee calculated at a rate per annum equal to either: (1) 40% of the applicable margin, multiplied by the average daily amount of the undrawn commitment, or (2) 0.70% of the undrawn commitment, depending on the applicable 2015 SPL Credit Facility. The principal of the loans made under the
2015 SPL Credit Facilities
must be repaid in quarterly installments, commencing with the earlier of June 30, 2020 and the last day of the first full calendar quarter after the completion date of Trains 1 through 5 of the
SPL Project
. Scheduled repayments are based upon an 18-year amortization profile, with the remaining balance due upon the maturity of the
2015 SPL Credit Facilities
.
34
The obligations of SPL under the
2015 SPL Credit Facilities
are secured by substantially all of the assets of SPL as well as all of the membership interests in SPL on a
pari passu
basis with the
SPL Senior Notes
and
SPL Working Capital Facility
.
Under the terms of the
2015 SPL Credit Facilities
, SPL is required to hedge not less than 65% of the variable interest rate exposure of its projected outstanding borrowings, calculated on a weighted average basis in comparison to its anticipated draw of principal.
2013 SPL Credit Facilities
In May 2013, SPL entered into four credit facilities aggregating $5.9 billion
(collectively, the “2013 SPL Credit Facilities”)
to fund a portion of the costs of developing, constructing and placing into operation Trains 1 through 4 of the
SPL Project
. In June 2015, the
2013 SPL Credit Facilities
were replaced with the
2015 SPL Credit Facilities
.
In March 2015, in conjunction with SPL’s issuance of the
2025 SPL Senior Notes
, SPL terminated approximately
$1.8 billion
of commitments under the
2013 SPL Credit Facilities
. This termination and the replacement of the
2013 SPL Credit Facilities
with the
2015 SPL Credit Facilities
in June 2015 resulted in a write-off of debt issuance costs and deferred commitment fees associated with the
2013 SPL Credit Facilities
of
$96.3 million
for the
nine months ended September 30, 2015
.
CTPL Term Loan
CTPL has a $400.0 million term loan facility
(the “CTPL Term Loan”)
, which was used to fund modifications to the
Creole Trail Pipeline
and for general business purposes. The
CTPL Term Loan
matures in 2017 when the full amount of the outstanding principal obligations must be repaid. CTPL’s loan may be repaid, in whole or in part, at any time without premium or penalty. As of
September 30, 2015
, CTPL had borrowed the full amount of $400.0 million available under the
CTPL Term Loan
. Borrowings under the
CTPL Term Loan
accrue interest at a variable rate per annum equal to, at CTPL’s election,
LIBOR
or the base rate, plus the applicable margin. The applicable margin for
LIBOR
loans is 3.25%. Interest on
LIBOR
loans is due and payable at the end of each
LIBOR
period.
SPL Working Capital Facility
In September 2015, SPL entered into a $1.2 billion
SPL Working Capital Facility
, which replaced the $325.0 million
SPL LC Agreement
. The
SPL Working Capital Facility
is intended to be used for loans to SPL
(“Working Capital Loans”)
, the issuance of letters of credit on behalf of SPL
(“Letters of Credit”)
, as well as for swing line loans to SPL
(“Swing Line Loans”)
, primarily for certain working capital requirements related to developing and placing into operation the
SPL Project
. SPL may, from time to time, request increases in the commitments under the
SPL Working Capital Facility
of up to $760 million and, upon the completion of the debt financing of Train 6 of the
SPL Project
, request an incremental increase in commitments of up to an additional $390 million. As of
September 30, 2015
, SPL had
$1.1 billion
of available commitments,
$127.6 million
aggregate amount of issued Letters of Credit and
no
Working Capital Loans
,
Swing Line Loans
or loans deemed made in connection with a draw upon a Letter of Credit
(“LC Loans” and collectively with Working Capital Loans and Swing Line Loans, the “SPL Working Capital Facility Loans”)
outstanding under the
SPL Working Capital Facility
. As of
December 31, 2014
, SPL had issued letters of credit in an aggregate amount of
$9.5 million
, and
no
draws had been made upon any letters of credit issued under the
SPL LC Agreement
.
SPL Working Capital Facility Loans
accrue interest at a variable rate per annum equal to LIBOR or the base rate (equal to the highest of the senior facility agent’s published prime rate, the federal funds effective rate, as published by the Federal Reserve Bank of New York, plus
0.50%
and one month LIBOR plus
0.50%
), plus the applicable margin. The applicable margin for LIBOR
SPL Working Capital Facility Loans
is 1.75% per annum, and the applicable margin for base rate
SPL Working Capital Facility Loans
is 0.75% per annum. Interest on
Swing Line Loans
and
LC Loans
is due and payable on the date the loan becomes due. Interest on LIBOR
Working Capital Loans
is due and payable at the end of each applicable LIBOR period, and interest on base rate
Working Capital Loans
is due and payable at the end of each fiscal quarter. However, if such base rate Working Capital Loan is converted into a LIBOR Working Capital Loan, interest is due and payable on that date. Additionally, if the loans become due prior to such periods, the interest also becomes due on that date.
SPL incurred
$27.5 million
of debt issuance costs in connection with the
SPL Working Capital Facility
. SPL pays (1) a commitment fee on the average daily amount of the excess of the total commitment amount over the principal amount outstanding without giving effect to any outstanding
Swing Line Loans
in an amount equal to an annual rate of
0.70%
and (2) a Letter of Credit
35
fee equal to an annual rate of
1.75%
of the undrawn portion of all
Letters of Credit
issued under the
SPL Working Capital Facility
. If draws are made upon a Letter of Credit issued under the
SPL Working Capital Facility
and SPL does not elect for such draw
(an “LC Draw”)
to be deemed an LC Loan, SPL is required to pay the full amount of the
LC Draw
on or prior to the business day following the notice of the
LC Draw
. An
LC Draw
accrues interest at an annual rate of
2.0%
plus the base rate. As of
September 30, 2015
, no
LC Draw
s had been made upon any
Letters of Credit
issued under the
SPL Working Capital Facility
.
The
SPL Working Capital Facility
matures on December 31, 2020, and the outstanding balance may be repaid, in whole or in part, at any time without premium or penalty upon three business days’ notice.
LC Loans
have a term of up to one year.
Swing Line Loans
terminate upon the earliest of (1) the maturity date or earlier termination of the
SPL Working Capital Facility
, (2) the date 15 days after such Swing Line Loan is made and (3) the first borrowing date for a Working Capital Loan or Swing Line Loan occurring at least three business days following the date the Swing Line Loan is made. SPL is required to reduce the aggregate outstanding principal amount of all
Working Capital Loans
to zero for a period of five consecutive business days at least once each year.
The
SPL Working Capital Facility
contains conditions precedent for extensions of credit, as well as customary affirmative and negative covenants. The obligations of SPL under the
SPL Working Capital Facility
are secured by substantially all of the assets of SPL as well as all of the membership interests in SPL on a
pari passu
basis with the
SPL Senior Notes
and
2015 SPL Credit Facilities
.
Corpus Christi LNG Terminal
Liquefaction Facilities
The
CCL Project
is being developed and constructed on over 1,500 acres of land that we own or control near Corpus Christi, Texas. In December 2014, we received authorization from the
FERC
to site, construct and operate Stages 1 and 2 of the
CCL Project
. In May 2015, we made a positive
FID
with respect to
Stage 1
of the
CCL Project
and issued an
NTP
to
Bechtel
under the
EPC Contract (CCL Stage 1)
. We recently began the development of
Stage 3
of the
CCL Project
and commenced the regulatory approval process in June 2015.
The
DOE
has authorized the export of up to a combined total of the equivalent of 767
Bcf/yr
of domestically produced LNG by vessel from the
CCL Project
to
FTA countries
for a 25-year term and to
non-FTA countries
for a 20-year term. The Sierra Club has requested a rehearing of the non-FTA order, and the
DOE
has not yet ruled on this request. Additionally, the
DOE
has authorized the export of up to a combined total of the equivalent of 514
Bcf/yr
of domestically produced LNG by vessel from Stage 3 of the
CCL Project
to
FTA countries
for a 20-year term. In each case, the terms of these authorizations begin on the earlier of the date of first export thereunder or the date specified in the particular order, which ranges from 7 to 10 years from the date the order was issued.
As of
September 30, 2015
, the overall project completion percentage for Stage 1 of the
CCL Project
was approximately
22.8%
, with engineering, procurement and construction approximately
82.0%
,
32.0%
and
less than 1%
complete, respectively. The construction of the
Corpus Christi Pipeline
is planned to commence in 2016.
Customers
CCL has entered into eight fixed price, 20-year
SPA
s with seven third parties that in the aggregate equate to approximately 8.4
mtpa
of LNG that commence with the date of first commercial delivery for Trains 1 through 3, which are fully permitted. Under these eight
SPA
s, the customers will purchase LNG from CCL for a price consisting of a fixed fee of $3.50 plus 115% of
Henry Hub
per
MMBtu
of LNG. In certain circumstances, the customers may elect to cancel or suspend deliveries of LNG cargoes, in which case the customers would still be required to pay the fixed fee with respect to cargoes that are not delivered. A portion of the fixed fee will be subject to annual adjustment for inflation. The
SPA
s and contracted volumes to be made available under the
SPA
s are not tied to a specific Train; however, the term of each
SPA
commences upon the start of operations of a specified Train.
In aggregate, the fixed fee portion to be paid by these customers is approximately $1.4 billion annually for Trains 1 and 2, and $1.5 billion if we make a positive
FID
with respect to
Stage 2
of the
CCL Project
, with the applicable fixed fees starting from the commencement of commercial operations of the applicable Train. These fixed fees equal approximately $619 million, $776 million and $140 million for each of Trains 1 through 3, respectively.
36
Natural Gas Transportation and Supply
For its natural gas feedstock transportation requirements, CCL has entered into transportation precedent agreements to secure firm pipeline transportation capacity with third party pipeline companies and CCP. CCL has also entered into enabling agreements with third parties and will continue to enter into such agreements in order to secure natural gas feedstock for the
CCL Project
.
Construction
CCL entered into separate lump sum turnkey contracts with
Bechtel
for the engineering, procurement and construction of Stages 1 and 2 of the
CCL Project
under which
Bechtel
charges a lump sum for all work performed and generally bears project cost risk unless certain specified events occur, in which case
Bechtel
may cause CCL to enter into a change order, or CCL agrees with
Bechtel
to a change order. The total contract prices of the
EPC
contracts for Stages 1 and 2, which do not include the
Corpus Christi Pipeline
, are approximately $7.5 billion and $2.4 billion, respectively, reflecting amounts incurred under change orders through
September 30, 2015
. Total expected capital costs for Stages 1 and 2 are estimated between $12.0 billion and $13.0 billion, before financing costs, and between $15.0 billion and $16.0 billion after financing costs including, in each case, estimated owner’s costs and contingencies. Total expected capital costs for Stage 1 only are estimated to be between $9.0 billion and $10.0 billion, before financing costs, and between $11.0 billion and $12.0 billion after financing costs including, in each case, estimated owner’s costs and contingencies.
Pipeline Facilities
On December 30, 2014, the
FERC
issued a certificate of public convenience and necessity under Section 7(c) of the Natural Gas Act of 1938, as amended, authorizing CCP to construct and operate the
Corpus Christi Pipeline
. The
Corpus Christi Pipeline
is designed to transport 2.25
Bcf/d
of feed and fuel gas required by the
CCL Project
from the existing regional natural gas pipeline grid.
Final Investment Decision on
Stage 2
We will contemplate making an
FID
to commence construction of
Stage 2
of the
CCL Project
based upon, among other things, entering into acceptable commercial arrangements.
Capital Resources
We expect to finance the construction costs of the
CCL Project
from one or more of the following: project financing, existing unrestricted cash, offerings by us or our subsidiaries of debt or equity and operating cash flow.
2025 CCH HoldCo II Convertible Senior Notes
In May 2015, CCH HoldCo II issued $1.0 billion aggregate principal amount of the
2025 CCH HoldCo II Convertible Senior Notes
on a private placement basis. The
$1.0 billion
principal of the
2025 CCH HoldCo II Convertible Senior Notes
will be used to partially fund costs associated with
Stage 1
of the
CCL Project
and the
Corpus Christi Pipeline
. The purchasers have made commitments, which will expire on May 1, 2016, to acquire an additional
$500 million
of
2025 CCH HoldCo II Convertible Senior Notes
(the “Second Phase Funding”)
upon satisfaction of incremental customary conditions precedent related to the construction of
Stage 2
of the
CCL Project
. The
2025 CCH HoldCo II Convertible Senior Notes
bear interest at a rate of
11.0%
per annum, which is payable quarterly in arrears. Prior to the substantial completion of Train 2 of the
CCL Project
if the
Second Phase Funding
has not occurred, and to the substantial completion of Train 3 of the
CCL Project
following the occurrence of the
Second Phase Funding
, interest on the
2025 CCH HoldCo II Convertible Senior Notes
will be paid entirely in kind. Following this date, the interest generally must be paid in cash; however, a portion of the interest may be paid in kind under certain specified circumstances. The
2025 CCH HoldCo II Convertible Senior Notes
are secured by a pledge by us of 100% of the equity interests in CCH HoldCo II, and a pledge by CCH HoldCo II of 100% of the equity interests in CCH HoldCo I.
At CCH HoldCo II’s option, the outstanding
2025 CCH HoldCo II Convertible Senior Notes
are convertible into our common stock on or after the later of (1) 58 months from May 1, 2015, and (2) the substantial completion of Train 2 of the
CCL Project
and any
2025 CCH HoldCo II Convertible Senior Notes
issued in connection with the
Second Phase Funding
will be convertible
37
on or after the substantial completion of Train 3 of the
CCL Project
(in each case, the “Eligible Conversion Date”)
. The conversion price for
2025 CCH HoldCo II Convertible Senior Notes
converted at CCH HoldCo II’s option is the lower of (1) a 10% discount to the average of the daily volume-weighted average price
(“VWAP”)
of our common stock for the 90 trading day period prior to the date on which notice of conversion is provided, and (2) a 10% discount to the closing price of our common stock on the trading day preceding the date on which notice of conversion is provided. At the option of the holders, the
2025 CCH HoldCo II Convertible Senior Notes
are convertible on or after the six-month anniversary of the applicable
Eligible Conversion Date
at a conversion price equal to the average of the daily
VWAP
of our common stock for the 90 trading day period prior to the date on which notice of conversion is provided. Conversions are also subject to various limitations and conditions.
2015 CCH Credit Facility
In May 2015, CCH entered into the
2015 CCH Credit Facility
, which is being used to fund a portion of the costs associated with the development, construction, operation and maintenance of the
CCL Project
. The total commitment under the
2015 CCH Credit Facility
is approximately $11.5 billion, comprising approximately $8.4 billion linked to
Stage 1
of the
CCL Project
and the
Corpus Christi Pipeline
and approximately $3.1 billion linked to
Stage 2
of the
CCL Project
. Borrowings under the
2015 CCH Credit Facility
may be refinanced, in whole or in part, at any time without premium or penalty; however, interest rate hedging and interest rate breakage costs may be incurred. As of
September 30, 2015
, CCH had
$6.0 billion
of available commitments and
$2.4 billion
of outstanding borrowings under the
2015 CCH Credit Facility
.
The principal of the loans made under the
2015 CCH Credit Facility
must be repaid in quarterly installments, commencing on the earlier of (1) the first quarterly payment date occurring more than three calendar months following project completion and (2) a set date determined by reference to the date under which a certain LNG buyer linked to the last Train to become operational is entitled to terminate its
SPA
for failure to achieve the date of first commercial delivery for that agreement. Scheduled repayments will be based upon a
19
-year tailored amortization, commencing the first full quarter after the project completion and designed to achieve a minimum projected fixed debt service coverage ratio of
1.55
:1. Loans under the
2015 CCH Credit Facility
accrue interest at a variable rate per annum equal to, at CCH’s election,
LIBOR
or the base rate, plus the applicable margin. The applicable margins for
LIBOR
loans are 2.25% prior to completion and 2.50% on completion and thereafter. The applicable margins for base rate loans are 1.25% prior to completion and 1.50% on completion and thereafter. Interest on
LIBOR
loans is due and payable at the end of each applicable interest period and interest on base rate loans is due and payable at the end of each quarter. The
2015 CCH Credit Facility
also requires CCH to pay a commitment fee at a rate per annum equal to 40% of the margin for
LIBOR
loans, multiplied by the outstanding undrawn debt commitments.
The obligations of CCH under the
2015 CCH Credit Facility
are secured by a first priority lien on substantially all of the assets of CCH and its subsidiaries and by a pledge by CCH HoldCo I of its limited liability company interests in CCH.
Under the terms of the
2015 CCH Credit Facility
, CCH is required to hedge not less than
65%
of the variable interest rate exposure of its senior secured debt.
LNG and Natural Gas Marketing Business
Cheniere Marketing is engaged in the LNG and natural gas marketing business and is seeking to develop a portfolio of long-term, short-term and spot LNG purchase and sale agreements. Cheniere Marketing has purchased, transported and unloaded commercial LNG cargoes into the Sabine Pass LNG terminal and has used trading strategies intended to maximize margins on these cargoes. Cheniere Marketing has secured the following rights and obligations to support its business:
|
•
|
the right to deliver cargoes to the Sabine Pass LNG terminal during the construction of the
SPL Project
in exchange for payment of 80% of the expected gross margin from each cargo to Cheniere Investments, a wholly owned subsidiary of Cheniere Partners;
|
|
•
|
pursuant to an amended and restated
SPA
with SPL, the right to purchase, at Cheniere Marketing’s option, any LNG produced by SPL in excess of that required for other customers at a price of 115% of
Henry Hub
plus $3.00 per
MMBtu
of LNG;
|
|
•
|
pursuant to
SPA
s with CCL, the right to purchase, at Cheniere Marketing’s option, any LNG produced by CCL not required for other customers; and
|
|
•
|
a portfolio of LNG vessel time charters.
|
38
In addition, Cheniere Marketing has sold LNG cargoes to be delivered to multiple counterparties between 2016 and 2018, with delivery obligations conditioned on the performance of the
SPL Project
. The cargoes have been sold with a portfolio of delivery points, either on a Free on Board basis, delivered to the counterparty at the Sabine Pass LNG terminal, or a Delivered at Terminal
(“DAT”)
basis, delivered to the counterparty’s LNG receiving terminal. Cheniere Marketing has chartered LNG vessels, as described above, to be utilized in
DAT
transactions. In addition, Cheniere Marketing has also entered into a long-term agreement to sell LNG cargoes on a
DAT
basis. The agreement is conditioned upon the buyer achieving certain milestones, including reaching an
FID
related to certain projects and obtaining related financing.
Corporate and Other Activities
We are required to maintain corporate and general and administrative functions to serve our business activities described above. We are also in various stages of developing other projects, including a liquid hydrocarbon export project in Texas along the Gulf Coast. In addition, we have agreed in principle to partner with
Parallax
to develop up to 11
mtpa
of LNG production capacity through
Parallax
’s two mid-scale natural gas liquefaction projects in Louisiana along the Gulf Coast.
Sources and Uses of Cash
The following table (in thousands) summarizes the sources and uses of our cash and cash equivalents for the
nine months ended September 30, 2015 and 2014
. The table presents capital expenditures on a cash basis; therefore, these amounts differ from the amounts of capital expenditures, including accruals, which are referred to elsewhere in this report. Additional discussion of these items follows the table.
|
Nine Months Ended September 30,
|
|||||||
|
|
2015
|
2014
|
|||||
|
Sources of cash and cash equivalents
|
|
|
|||||
|
Proceeds from issuances of long-term debt
|
$
|
6,178,000
|
|
$
|
2,584,500
|
|
|
|
Use of restricted cash for the acquisition of property, plant and equipment
|
5,330,526
|
|
1,980,436
|
|
|||
|
Proceeds from exercise of stock options
|
2,279
|
|
9,502
|
|
|||
|
Other
|
1,424
|
|
—
|
|
|||
|
Total sources of cash and cash equivalents
|
11,512,229
|
|
4,574,438
|
|
|||
|
Uses of cash and cash equivalents
|
|
|
|
|
|||
|
Investment in restricted cash
|
(5,161,701
|
)
|
(2,254,733
|
)
|
|||
|
Property, plant and equipment, net
|
(5,747,596
|
)
|
(2,047,957
|
)
|
|||
|
Debt issuance and deferred financing costs
|
(519,699
|
)
|
(94,220
|
)
|
|||
|
Repayments of long-term debt
|
—
|
|
(177,000
|
)
|
|||
|
Distributions and dividends to non-controlling interest
|
(60,154
|
)
|
(59,478
|
)
|
|||
|
Payments related to tax withholdings for share-based compensation
|
(44,305
|
)
|
(44,516
|
)
|
|||
|
Operating cash flow
|
(274,577
|
)
|
(41,050
|
)
|
|||
|
Other
|
(111,518
|
)
|
(24,670
|
)
|
|||
|
Total uses of cash and cash equivalents
|
(11,919,550
|
)
|
(4,743,624
|
)
|
|||
|
Net decrease in cash and cash equivalents
|
(407,321
|
)
|
(169,186
|
)
|
|||
|
Cash and cash equivalents—beginning of period
|
1,747,583
|
|
960,842
|
|
|||
|
Cash and cash equivalents—end of period
|
$
|
1,340,262
|
|
$
|
791,656
|
|
|
39
Proceeds from Issuances of Long-Term Debt, Debt Issuance and Deferred Financing Costs and Repayments of Long-Term Debt
In March 2015, SPL issued an aggregate principal amount of $2.0 billion of the
2025 SPL Senior Notes
. Also in March 2015, we issued an aggregate principal amount of $625.0 million of the
2045 Cheniere Convertible Senior Notes
, with an original issue discount of 20%, for net proceeds of $495.7 million. In May 2015, CCH HoldCo II issued an aggregate principal amount of $1.0 billion of the
2025 CCH HoldCo II Convertible Senior Notes
. Also in May 2015, CCH entered into the
2015 CCH Credit Facility
and borrowed $2.4 billion under this facility during the
nine months ended September 30, 2015
. In June 2015, SPL entered into the
2015 SPL Credit Facilities
aggregating
$4.6 billion
, which terminated and replaced the
2013 SPL Credit Facilities
, and borrowed $250.0 million under this facility during the
nine months ended September 30, 2015
. Debt issuance and deferred financing costs in the
nine months ended September 30, 2015
primarily relate to up-front fees paid upon the closing of these transactions.
In May 2014, SPL issued the
2024 SPL Senior Notes
and additional
5.625%
Senior Secured Notes due 2023 in an aggregate principal amount of $0.5 billion
(the “Additional 2023 SPL Senior Notes”)
for total net proceeds of approximately $2.5 billion. Debt issuance and deferred financing costs in the
nine months ended September 30, 2014
primarily relate to up-front fees paid upon the closing of this offering in May 2014.
During the nine months ended September 30, 2014, SPL repaid its $177.0 million of borrowings under the
2013 SPL Credit Facilities
upon the issuance of the
Additional 2023 SPL Senior Notes
and the
2024 SPL Senior Notes
.
Use of Restricted Cash for the Acquisition of Property, Plant and Equipment and Property, Plant and Equipment, net
During the
nine months ended September 30, 2015 and 2014
, we used
$5,330.5 million
and
$1,980.4 million
, respectively, of restricted cash for investing activities to partially fund
$5,747.6 million
and
$2,048.0 million
used for the acquisition of property, plant and equipment during the
nine months ended September 30, 2015 and 2014
, respectively. These costs primarily related to the construction costs for Trains 1 through 5 of the
SPL Project
and
Stage 1
of the
CCL Project
and are capitalized as construction-in-process.
Investment in Restricted Cash
In the
nine months ended September 30, 2015
, we invested
$5,161.7 million
in restricted cash primarily related to the net proceeds from the
2025 SPL Senior Notes
,
2045 Cheniere Convertible Senior Notes
,
2025 CCH HoldCo II Convertible Senior Notes
and the borrowings under the
2015 SPL Credit Facilities
and
2015 CCH Credit Facility
, net of deferred financing costs. These proceeds were partially offset by the payment of distributions to non-controlling interest. In the
nine months ended September 30, 2014
, we invested
$2,254.7 million
in restricted cash primarily related to the net proceeds from the
2024 SPL Senior Notes
and the
Additional 2023 SPL Senior Notes
issued in May 2014.
Distributions and Dividends to Non-controlling Interest
During the
nine months ended September 30, 2015 and 2014
, Cheniere Partners and Cheniere Holdings, collectively, made distributions and paid dividends of
$60.2 million
and
$59.5 million
, respectively, to non-affiliated common unitholders and common shareholders.
Payments Related to Tax Withholdings for Share-based Compensation
During the
nine months ended September 30, 2015 and 2014
, we used
$44.3 million
and
$44.5 million
, respectively, of cash and cash equivalents to purchase restricted stock that was returned to us by employees to cover taxes related to their restricted stock that vested during such periods.
Operating Cash Flow
We had a cash outflow from operating activities of
$274.6 million
during the
nine months ended September 30, 2015
, compared to a cash outflow of
$41.1 million
during the
nine months ended September 30, 2014
. This increase in operating cash outflows primarily related to amounts paid upon meeting the contingency related to the interest rate swaps we entered into to hedge the exposure to volatility in a portion of the floating-rate interest payments under the
2015 CCH Credit Facility
(“CCH Interest Rate Derivatives”)
and settlement of other derivative instruments, the timing of amounts paid to third parties for the construction of the
SPL Project
and the
CCL Project
and increased payments made for general and administrative costs.
40
Other
Other cash outflows increased from
$24.7 million
during the
nine months ended September 30, 2014
to
$111.5 million
during the
nine months ended September 30, 2015
, primarily for payments made to a municipal water district for water system enhancements that will increase potable water supply to our Sabine Pass LNG terminal, advances made under our EPC contracts and investments made in connection with the mid-scale natural gas liquefaction projects being developed with
Parallax
.
Issuance of Common Stock
During the
nine months ended September 30, 2015 and 2014
, we issued
19,000
and
0.5 million
shares, respectively, of restricted stock to new and existing employees and members of our board of directors.
Results of Operations
Three Months Ended
September 30, 2015
vs.
Three Months Ended
September 30, 2014
Our consolidated net loss attributable to common stockholders was
$297.8 million
, or
$1.31
per share (basic and diluted), in the
three months ended September 30, 2015
compared to a net loss attributable to common stockholders of
$89.6 million
, or
$0.40
per share (basic and diluted), in the
three months ended September 30, 2014
. This
$208.2 million
increase in net loss was primarily a result of increased derivative loss, net, increased interest expense, net of amounts capitalized and increased general and administrative expense (“G&A Expense”), which was partially offset by decreased operating and maintenance expense (income).
Derivative loss, net increased
$166.9 million
from a gain of
$5.4 million
in the
three months ended September 30, 2014
to a loss of
$161.5 million
in the
three months ended September 30, 2015
, primarily as a result of a decrease in long-term LIBOR during the
three months ended September 30, 2015
, as compared to an increase in long-term LIBOR during the
three months ended September 30, 2014
, as well as an increased notional amount of interest rate derivatives outstanding. Interest expense, net of amounts capitalized increased
$46.7 million
in the
three months ended September 30, 2015
, as compared to the
three months ended September 30, 2014
, primarily as a result of an increase in our indebtedness outstanding as of
September 30, 2015
compared to
September 30, 2014
. For the
three months ended September 30, 2015 and 2014
, we incurred
$286.0 million
and
$154.8 million
of total interest cost, respectively, of which we capitalized and deferred
$192.4 million
and
$107.9 million
, respectively, which were directly related to the construction of the
SPL Project
and
CCL Project
. G&A Expense increased
$23.1 million
in the
three months ended September 30, 2015
, as compared to the
three months ended September 30, 2014
, primarily due to increased compensation expense as a result of increased headcount.
Partially offsetting the above increase in expenses, operating and maintenance expense (income) decreased
$32.2 million
due to a
$32.2 million
increase in fair value for our natural gas purchase agreements recorded for the period, which we recognized following the completion and placement into service of certain modifications to the
Creole Trail Pipeline
and the resulting development of a market for physical gas delivery at locations specified in a portion of our natural gas purchase agreements. Excluding this amount, operating and maintenance expense would have been
$25.9 million
during the
three months ended September 30, 2015
and 2014, which was a result of the expenses incurred to purchase LNG to maintain the cryogenic readiness of the regasification facilities at the Sabine Pass LNG terminal, which we did not incur during the
three months ended September 30, 2015
, offset primarily by the increase in expenses related to LNG vessel time charters by Cheniere Marketing during the
three months ended September 30, 2015
.
Nine Months Ended
September 30, 2015
vs.
Nine Months Ended
September 30, 2014
Our consolidated net loss attributable to common stockholders was
$684.0 million
, or
$3.02
per share (basic and diluted), in the
nine months ended September 30, 2015
compared to a net loss attributable to common stockholders of
$389.3 million
, or
$1.74
per share (basic and diluted), in the
nine months ended September 30, 2014
. This
$294.7 million
increase in net loss was primarily a result of increased derivative loss, net, increased interest expense, net of amounts capitalized and increased G&A Expense, which was partially offset by decreased operating and maintenance expense.
Derivative loss, net increased
$152.9 million
during the
nine months ended September 30, 2015
, as compared to the
nine months ended September 30, 2014
. The derivative loss recognized during the
nine months ended September 30, 2015
was primarily
41
attributable to the loss recognized upon meeting the contingency related to the CCH Interest Rate Derivatives, as well as the loss recognized in March 2015 upon the termination of interest rate swaps associated with approximately $1.8 billion of commitments that were terminated under the 2013 SPL Credit Facilities. Additionally, both the increase to the notional amount of interest rate derivatives outstanding and the decrease in long-term LIBOR during the
nine months ended September 30, 2015
that was more significant than the decrease in long-term LIBOR during the
nine months ended September 30, 2014
contributed to the increase in derivative loss, net.
Interest expense, net of amounts capitalized increased
$107.7 million
in the
nine months ended September 30, 2015
, as compared to the
nine months ended September 30, 2014
, primarily as a result of an increase in our indebtedness outstanding as of
September 30, 2015
compared to
September 30, 2014
. For the
nine months ended September 30, 2015 and 2014
, we incurred
$707.8 million
and
$423.8 million
of total interest cost, respectively, of which we capitalized and deferred
$469.2 million
and
$292.8 million
, respectively, which were directly related to the construction of the
SPL Project
and
CCL Project
. G&A Expense increased
$47.4 million
in the
nine months ended September 30, 2015
, as compared to the
nine months ended September 30, 2014
, primarily due to increased professional fees and increased compensation expense as a result of increased headcount.
Partially offsetting the above increase in expenses, operating and maintenance expense decreased
$19.9 million
due to a
$32.2 million
increase in fair value for our natural gas purchase agreements recorded for the period, which we recognized following the completion and placement into service of certain modifications to the
Creole Trail Pipeline
and the resulting development of a market for physical gas delivery at locations specified in a portion of our natural gas purchase agreements. Excluding this amount, operating and maintenance expense would have been
$81.5 million
during the
nine months ended September 30, 2015
. The increase of
$12.2 million
compared to
$69.3 million
incurred during the
nine months ended September 30, 2014
was primarily a result of the increase in expenses related to LNG vessel time charters by Cheniere Marketing in the
nine months ended September 30, 2015
.
Off-Balance Sheet Arrangements
As of
September 30, 2015
, we had no transactions that met the definition of off-balance sheet arrangements that may have a current or future material effect on our consolidated financial position or results of operations.
Summary of Critical Accounting Estimates
The preparation of our Consolidated Financial Statements in conformity with
GAAP
requires management to make certain estimates and assumptions that affect the amounts reported in the Consolidated Financial Statements and the accompanying notes. There have been no significant changes to our critical accounting estimates from those disclosed in our Annual Report on Form 10-K for the year ended
December 31, 2014
.
Recent Accounting Standards
For descriptions of recently issued accounting standards, see
Part 1. Financial Information, Item 1. Notes to Consolidated Financial Statements, Note 14—Recent Accounting Standards
.
Cash Investments
We have cash investments that we manage based on internal investment guidelines that emphasize liquidity and preservation of capital. Such cash investments are stated at historical cost, which approximates fair market value on our Consolidated Balance Sheets.
Marketing and Trading Commodity Price Risk
We have entered into:
|
•
|
commodity derivatives to hedge the exposure to price risk attributable to future: (1) sales of our LNG inventory and (2) purchases of natural gas to operate the Sabine Pass LNG terminal
(“Natural Gas Derivatives”)
;
|
42
|
•
|
commodity derivatives consisting of natural gas purchase agreements to secure natural gas feedstock for the
SPL Project
(“Liquefaction Supply Derivatives”)
; and
|
|
•
|
financial derivatives to hedge the exposure to the commodity markets in which we have contractual arrangements to purchase or sell physical LNG
(“LNG Trading Derivatives”)
.
|
We use one-day value at risk
(“VaR”)
with a 95% confidence interval and other methodologies for market risk measurement and control purposes of our
Natural Gas Derivatives
. The
VaR
is calculated using the Monte Carlo simulation method. The
VaR
related to our
Natural Gas Derivatives
was
$0.2 million
as of
September 30, 2015
.
In order to test the sensitivity of the fair value of the
Liquefaction Supply Derivatives
to changes in underlying commodity prices, management modeled a 10% change in the basis price for natural gas for each delivery location. As of
September 30, 2015
, we estimated the fair value of the
Liquefaction Supply Derivatives
to be
$33.8 million
. Based on actual derivative contractual volumes, a 10% increase or decrease in underlying basis price would have resulted in a change in the fair value of the
Liquefaction Supply Derivatives
of
$0.9 million
as of
September 30, 2015
.
In order to test the sensitivity of the fair value of the
LNG Trading Derivatives
to changes in underlying commodity prices, management modeled a 10% change in the basis price for natural gas for each delivery point. As of
September 30, 2015
, we estimated the fair value of the LNG Trading Derivatives to be
$0.1 million
. Based on actual derivative contractual volumes, a 10% increase or decrease in underlying basis price would have resulted in a change in the fair value of the
LNG Trading Derivatives
of
$1.0 million
as of
September 30, 2015
.
Interest Rate Risk
SPL has entered into interest rate swaps to hedge the exposure to volatility in a portion of the floating-rate interest payments under the
2015 SPL Credit Facilities
(“SPL Interest Rate Derivatives”)
. In order to test the sensitivity of the fair value of the
SPL Interest Rate Derivatives
to changes in interest rates, management modeled a 10% change in the forward 1-month
LIBOR
curve across the remaining term of the
SPL Interest Rate Derivatives
. This 10% change in interest rates would have resulted in a change in the fair value of the
SPL Interest Rate Derivatives
of
$2.6 million
as of
September 30, 2015
.
CCH has entered into the
CCH Interest Rate Derivatives
to hedge the exposure to volatility in a portion of the floating-rate interest payments under the
2015 CCH Credit Facility
. In order to test the sensitivity of the fair value of the
CCH Interest Rate Derivatives
to changes in interest rates, management modeled a 10% change in the forward 1-month
LIBOR
curve across the remaining term of the
CCH Interest Rate Derivatives
. This 10% change in interest rates would have resulted in a change in the fair value of the
CCH Interest Rate Derivatives
of
$52.3 million
as of
September 30, 2015
.
We maintain a set of disclosure controls and procedures that are designed to ensure that information required to be disclosed by us in the reports filed by us under the
Exchange Act
, is recorded, processed, summarized and reported within the time periods specified in the
SEC
’s rules and forms. As of the end of the period covered by this report, we evaluated, under the supervision and with the participation of our management, including our Chief Executive Officer and our Chief Financial Officer, the effectiveness of our disclosure controls and procedures pursuant to Rule 13a-15 of the
Exchange Act
. Based on that evaluation, our Chief Executive Officer and our Chief Financial Officer concluded that our disclosure controls and procedures are effective.
During the most recent fiscal quarter, there have been no changes in our internal control over financial reporting that have materially affected, or are reasonably likely to materially affect, our internal control over financial reporting.
43
Cheniere may in the future be involved as a party to various legal proceedings, which are incidental to the ordinary course of business. Cheniere regularly analyzes current information and, as necessary, provide accruals for probable liabilities on the eventual disposition of these matters.
Please see Part II, Item 1, “Legal Proceedings” in the Company’s Quarterly Report on Form 10-Q for the period ended March 31, 2015.
There have been no material changes from the risk factors disclosed in our Annual Report on Form 10-K for the year ended December 31,
2014
.
Purchase of Equity Securities by the Issuer and Affiliated Purchasers
The following table summarizes stock repurchases for the
three months ended September 30, 2015
:
|
Period
|
Total Number of Shares Purchased (1)
|
Average Price Paid Per Share (2)
|
Total Number of Shares Purchased as a Part of Publicly Announced Plans
|
Maximum Number of Units That May Yet Be Purchased Under the Plans
|
||||||
|
July 1 - 31, 2015
|
88,283
|
|
$68.26
|
—
|
—
|
|||||
|
August 1 - 31, 2015
|
465,004
|
|
$68.46
|
—
|
—
|
|||||
|
September 1 - 30, 2015
|
842
|
|
$43.30
|
—
|
—
|
|||||
|
Total
|
554,129
|
|
$68.40
|
—
|
—
|
|||||
|
(1)
|
Represents shares surrendered to us by participants in our share-based compensation plans to settle the participants’ personal tax liabilities that resulted from the lapsing of restrictions on shares awarded to the participants under these plans.
|
|
(2)
|
The price paid per share was based on the closing trading price of our common stock on the dates on which we repurchased shares from the participants under our share-based compensation plans.
|
Compliance Disclosure
Pursuant to Section 13(r) of the
Exchange Act
, if during the quarter ended
September 30, 2015
, we or any of our affiliates had engaged in certain transactions with Iran or with persons or entities designated under certain executive orders, we would be required to disclose information regarding such transactions in our Quarterly Report on Form 10-Q as required under Section 219 of the Iran Threat Reduction and Syria Human Rights Act of 2012
(“ITRA”)
. During the quarter ended
September 30, 2015
, we did not engage in any transactions with Iran or with persons or entities related to Iran.
44
|
Exhibit No.
|
Description
|
|
|
10.1
|
Change order to the Lump Sum Turnkey Agreement for the Engineering, Procurement and Construction of the Sabine Pass LNG Stage 2 Liquefaction Facility, dated as of December 20, 2012, between Sabine Pass Liquefaction, LLC and Bechtel Oil, Gas and Chemicals, Inc.: the Change Order CO-00019 East Meter Piping Tie-ins, dated August 26, 2015 (Incorporated by reference to Exhibit 10.1 to Sabine Pass Liquefaction, LLC’s Quarterly Report on Form 10-Q (SEC File No. 333-192373), filed on October 30, 2015)
|
|
|
10.2
|
Change order to the Lump Sum Turnkey Agreement for the Engineering, Procurement and Construction of the Sabine Pass LNG Stage 3 Liquefaction Facility, dated as of May 4, 2015, between Sabine Pass Liquefaction, LLC and Bechtel Oil, Gas and Chemicals, Inc.: the Change Order CO-00002 Credit to EPC Contract Value for TSA Work, dated September 17, 2015 (Incorporated by reference to Exhibit 10.2 to Sabine Pass Liquefaction, LLC’s Quarterly Report on Form 10-Q (SEC File No. 333-192373), filed on October 30, 2015)
|
|
|
10.3
|
Amended and Restated Senior Working Capital Revolving Credit and Letter of Credit Reimbursement Agreement, dated as of September 4, 2015, among Sabine Pass Liquefaction, LLC, as Borrower, The Bank of Nova Scotia, as Senior Issuing Bank and Senior Facility Agent, ABN Amro Capital USA LLC, HSBC Bank USA, National Association and ING Capital LLC, as Senior Issuing Banks, Société Générale, as Swing Line Lender, Société Générale, as the Common Security Trustee, and the senior lenders party thereto from time to time and for the benefit of HSBC Bank USA, National Association, ING Capital LLC, Morgan Stanley Bank, N.A. and Sumitomo Mitsui Banking Corporation, as Joint Lead Arrangers, Joint Lead Bookrunners, and Co-Documentation Agents, ABN Amro Capital USA LLC, The Bank of Nova Scotia, The Bank of Tokyo-Mitsubishi UFJ, LTD. and Société Générale, as Joint Lead Arrangers, Joint Lead Bookrunners, and Co-Syndication Agents, Industrial and Commercial Bank of China Limited, New York Branch and Lloyds Bank PLC, as Mandated Lead Arrangers, and Landesbank Baden-Württemberg, New York Branch, as Manager (Incorporated by reference to Exhibit 10.1 to the Cheniere Energy Partners, L.P.’s Current Report on Form 8-K (SEC File No. 001-33366), filed on September 11, 2015)
|
|
|
10.4*
|
Change orders to the Fixed Price Separated Turnkey Agreement for the Engineering, Procurement and Construction of the Corpus Christi Stage 1 Liquefaction Facility, dated as of December 6, 2013, between Corpus Christi Liquefaction, LLC and Bechtel Oil, Gas and Chemicals, Inc.: (1) the Change Order CO-00005 Revised Buildings to Include Jetty and Geo-Tech Impact to Buildings, dated June 4, 2015, (2) the Change Order CO-00006 Marine and Dredging Execution Change, dated June 16, 2015, (3) the Change Order CO-00007 Temporary Laydown Areas, AEP Substation Relocation, Power Monitoring System for Substation, Bollards for Power Line Poles, Multiplex Interface for AEP Hecker Station, dated June 30, 2015, (4) the Change Order CO-00008 West Jetty Shroud and Fencing, Temporary Strainers on Loading Arms, Breasting and Mooring Analysis, Addition of Crossbar from Platform at Ethylene Bullets to Platform for PSV Deck, Reduction of Vapor Fence at Bed 22, Relocation of Gangway Tower, Changes in Dolphin Size, dated July 28, 2015, (5) the Change Order CO-00009 Post FEED Studies, dated July 1, 2015, (6) the Change Order CO-00010 Additional Post FEED Studies, Feed Gas ESD Valve Bypass, Flow Meter on Bog Line, Additional Simulations, FERC #43, dated July 1, 2015, (7) the Change Order CO-00011 Credit to EPC Contract Value for TSA Work, dated July 7, 2015, and (8) the Change Order CO-00012 Reduction of Provisional Sum for Operating Spares, Liquid Condensate Tie-In, Automatic Shut-Off Valve in Condensate Truck Fill Line, Firewater Monitor and Hydrant Coverage Test, dated August 11, 2015 (Portions of this exhibit have been omitted and filed separately with the SEC pursuant to a request for confidential treatment)
|
|
|
10.5*†
+
|
Cheniere Energy, Inc. Retirement Policy
|
|
|
10.6†
|
Cheniere Energy, Inc. 2015 Employee Inducement Incentive Plan (Incorporated by reference to Exhibit 4.8 to the Company’s Registration Statement on Form S-8 (SEC File No. 333-207651), filed on October 29, 2015)
|
|
|
10.7*†
|
Form of Cheniere Energy, Inc. 2015 Employee Inducement Incentive Plan Restricted Stock Grant - US Form
|
|
|
10.8*†
|
Form of Cheniere Energy, Inc. 2015 Employee Inducement Incentive Plan Restricted Stock Grant - UK Form
|
|
|
10.9*
|
Amendment No. 1 of LNG Sale and Purchase Agreement (FOB), dated July 23, 2015, between Endesa S.A. (Buyer) and Corpus Christi Liquefaction, LLC (Seller)
|
|
|
10.10*
|
Amendment No. 2 of LNG Sale and Purchase Agreement (FOB), dated July 23, 2015, between Endesa S.A. (Buyer) and Corpus Christi Liquefaction, LLC (Seller)
|
|
|
10.11*
|
Amendment No. 1 of LNG Sale and Purchase Agreement (FOB), dated July 24, 2015, between Woodside Energy Trading Singapore PTE Ltd (Buyer) and Corpus Christi Liquefaction, LLC (Seller)
|
|
|
10.12*
|
Amendment No. 2 of LNG Sale and Purchase Agreement, dated July 15, 2015, between Électricité de France, S.A. and Corpus Christi Liquefaction, LLC (Seller)
|
|
|
10.13
|
Amendment No. 1 of LNG Sale and Purchase Agreement (FOB), dated August 28, 2015, between Sabine Pass Liquefaction, LLC (Seller) and Total Gas & Power North America, Inc. (Buyer) (Incorporated by reference to Exhibit 10.4 to Cheniere Energy Partner, L.P.’s Quarterly Report on Form 10-Q (SEC File No. 001-33366), filed on October 30, 2015)
|
|
45
|
Exhibit No.
|
Description
|
|
|
10.14
|
Amendment No. 1 of LNG Sale and Purchase Agreement (FOB), dated September 11, 2015, between Sabine Pass Liquefaction, LLC (Seller) and Centrica plc (Buyer) (Incorporated by reference to Exhibit 10.5 to Cheniere Energy Partner, L.P.’s Quarterly Report on Form 10-Q (SEC File No. 001-33366), filed on October 30, 2015)
|
|
|
10.15
|
Nomination and Standstill Agreement, dated August 21, 2015, by and between Cheniere Energy, Inc., Icahn Partners Master Fund LP, Icahn Partners LP, Icahn Onshore LP, Icahn Offshore LP, Icahn Capital LP, IPH GP LLC, Icahn Enterprises Holdings LP, Icahn Enterprises G.P. Inc., Beckton Corp., High River Limited Partnership, Hopper Investments LLC, Barberry Corp., Carl C. Icahn, Jonathan Christodoro and Samuel Merksamer (Incorporated by reference to Exhibit 99.1 to the Company’s Current Report on Form 8-K (SEC File No. 001-16383), filed on August 24, 2015)
|
|
|
10.16
|
Omnibus Amendment, dated as of September 24, 2015, to the Second Amended and Restated Common Terms Agreement among Sabine Pass Liquefaction, LLC, as Borrower, the representatives and agents from time to time parties thereto, and Société Générale, as the Common Security Trustee and Intercreditor Agent (Incorporated by reference to Exhibit 10.6 to Cheniere Energy Partner, L.P.’s Quarterly Report on Form 10-Q (SEC File No. 001-33366), filed on October 30, 2015)
|
|
|
31.1*
|
Certification by Chief Executive Officer required by Rule 13a-14(a) and 15d-14(a) under the Exchange Act
|
|
|
31.2*
|
Certification by Chief Financial Officer required by Rule 13a-14(a) and 15d-14(a) under the Exchange Act
|
|
|
32.1**
|
Certification by Chief Executive Officer pursuant to 18 U.S.C. Section 1350, as adopted pursuant to Section 906 of the Sarbanes-Oxley Act of 2002
|
|
|
32.2**
|
Certification of Chief Financial Officer pursuant to 18 U.S.C. Section 1350, as adopted pursuant to Section 906 of the Sarbanes-Oxley Act of 2002
|
|
|
101.INS*
|
XBRL Instance Document
|
|
|
101.SCH*
|
XBRL Taxonomy Extension Schema Document
|
|
|
101.CAL*
|
XBRL Taxonomy Extension Calculation Linkbase Document
|
|
|
101.DEF*
|
XBRL Taxonomy Extension Definition Linkbase Document
|
|
|
101.LAB*
|
XBRL Taxonomy Extension Labels Linkbase Document
|
|
|
101.PRE*
|
XBRL Taxonomy Extension Presentation Linkbase Document
|
|
|
*
|
Filed herewith.
|
|
**
|
Furnished herewith.
|
|
†
|
Management contract or compensatory plan or arrangement.
|
|
+
|
This exhibit corrects the exhibit previously filed as Exhibit 10.1 to the Company’s Current Report on Form 8-K, filed on June 17, 2015.
|
46
SIGNATURES
Pursuant to the requirements of the Securities Exchange Act of 1934, the registrant has duly caused this report to be signed on its behalf by the undersigned, thereunto duly authorized.
|
CHENIERE ENERGY, INC.
|
|||
|
|
|
||
|
Date:
|
October 29, 2015
|
By:
|
/s/ Michael J. Wortley
|
|
Michael J. Wortley
|
|||
|
Senior Vice President and Chief Financial Officer
|
|||
|
|
(on behalf of the registrant and
as principal financial officer)
|
||
|
Date:
|
October 29, 2015
|
By:
|
/s/ Leonard Travis
|
|
Leonard Travis
|
|||
|
Vice President and Chief Accounting Officer
|
|||
|
|
(on behalf of the registrant and
as principal accounting officer)
|
||
47
TABLE OF CONTENTS
Part I. Financial InformationItem 1. Consolidated Financial StatementsNote 1 Basis Of PresentationNote 2 Restricted CashNote 3 Property, Plant and EquipmentNote 4 Derivative InstrumentsNote 5 Non-controlling InterestNote 6 Accrued LiabilitiesNote 7 Long-term DebtNote 8 Income TaxesNote 9 Share-based CompensationNote 10 Net Loss Per Share Attributable To Common StockholdersNote 11 Commitments and ContingenciesNote 12 Business Segment InformationNote 13 Supplemental Cash Flow InformationNote 14 Recent Accounting StandardsItem 2. Management S Discussion and Analysis Of Financial Condition and Results Of OperationsItem 3. Quantitative and Qualitative Disclosures About Market RiskItem 4. Controls and ProceduresPart II. Other InformationItem 1. Legal ProceedingsItem 1A. Risk FactorsItem 2. Unregistered Sales Of Equity Securities and Use Of ProceedsItem 5. Other InformationItem 6. Exhibits