ALLIANT ENERGY CORP
10-Ks and 10-Qs
|
|
|
|
|
|
|
|
|
|
|
|
|
|
|
|
|
|
|
|
|
|
|
|
|
|
|
|
|
|
|
|
|
|
|
|
|
|
|
|
|
|
|
|
|
|
|
|
|
|
|
|
|
|
|
|
|
|
|
UNITED STATES
SECURITIES AND EXCHANGE COMMISSION
WASHINGTON, D.C. 20549
FORM 10-K
|
☒
|
ANNUAL REPORT PURSUANT TO SECTION 13 OR 15(d) OF THE SECURITIES EXCHANGE ACT OF 1934
|
For the fiscal year ended
December 31, 2016
or
|
☐
|
TRANSITION REPORT PURSUANT TO SECTION 13 OR 15(d) OF THE SECURITIES EXCHANGE ACT OF 1934
|
For the transition period from to

|
Commission
File Number
|
Name of Registrant, State of Incorporation,
Address of Principal Executive Offices and Telephone Number
|
IRS Employer
Identification Number
|
||
|
1-9894
|
ALLIANT ENERGY CORPORATION
|
39-1380265
|
||
|
(a Wisconsin corporation)
|
||||
|
4902 N. Biltmore Lane
|
||||
|
Madison, Wisconsin 53718
|
||||
|
Telephone (608) 458-3311
|
||||
|
1-4117
|
INTERSTATE POWER AND LIGHT COMPANY
|
42-0331370
|
||
|
(an Iowa corporation)
|
||||
|
Alliant Energy Tower
|
||||
|
Cedar Rapids, Iowa 52401
|
||||
|
Telephone (319) 786-4411
|
||||
|
0-337
|
WISCONSIN POWER AND LIGHT COMPANY
|
39-0714890
|
||
|
(a Wisconsin corporation)
|
||||
|
4902 N. Biltmore Lane
|
||||
|
Madison, Wisconsin 53718
|
||||
|
Telephone (608) 458-3311
|
||||
This combined Form 10-K is separately filed by Alliant Energy Corporation, Interstate Power and Light Company and Wisconsin Power and Light Company. Information contained in the Form 10-K relating to Interstate Power and Light Company and Wisconsin Power and Light Company is filed by each such registrant on its own behalf. Each of Interstate Power and Light Company and Wisconsin Power and Light Company makes no representation as to information relating to registrants other than itself.
Securities registered pursuant to Section 12(b) of the Act:
|
Title of Class
|
Name of Each Exchange on Which Registered
|
|
|
Alliant Energy Corporation
|
Common Stock, $0.01 Par Value
|
New York Stock Exchange
|
|
Alliant Energy Corporation
|
Common Share Purchase Rights
|
New York Stock Exchange
|
|
Interstate Power and Light Company
|
5.100% Series D Cumulative Perpetual Preferred Stock, $0.01 Par Value
|
New York Stock Exchange
|
Securities registered pursuant to Section 12(g) of the Act: None
Indicate by check mark if the registrants are well-known seasoned issuers, as defined in Rule 405 of the Securities Act.
Yes
☒
No
☐
Indicate by check mark if the registrants are not required to file reports pursuant to Section 13 or Section 15(d) of the Act.
Yes
☐
No
☒
Indicate by check mark whether the registrants (1) have filed all reports required to be filed by Section 13 or 15(d) of the Securities Exchange Act of 1934 during the preceding 12 months (or for such shorter period that the registrants were required to file such reports) and (2) have been subject to such filing requirements for the past 90 days. Yes
☒
No
☐
Indicate by check mark whether the registrants have submitted electronically and posted on their corporate Web site, if any, every Interactive Data File required to be submitted and posted pursuant to Rule 405 of Regulation S-T (§232.405 of this chapter) during the preceding 12 months (or for such shorter period that the registrants were required to submit and post such files). Yes
☒
No
☐
Indicate by check mark if disclosure of delinquent filers pursuant to Item 405 of Regulation S-K is not contained herein, and will not be contained, to the best of the registrants’ knowledge, in definitive proxy or information statements incorporated by reference in Part III of this Form 10-K or any amendment to this Form 10-K.
☒
Indicate by check mark whether the registrants are large accelerated filers, accelerated filers, non-accelerated filers, or smaller reporting companies. See the definitions of “large accelerated filer,” “accelerated filer” and “smaller reporting company” in Rule 12b-2 of the Exchange Act.
|
Large Accelerated Filer
|
Accelerated Filer
|
Non-accelerated Filer
|
Smaller Reporting Company Filer
|
||||
|
Alliant Energy Corporation
|
☒
|
||||||
|
Interstate Power and Light Company
|
☒
|
||||||
|
Wisconsin Power and Light Company
|
☒
|
||||||
Indicate by check mark whether the registrants are shell companies (as defined in Rule 12b-2 of the Exchange Act). Yes
☐
No
☒
The aggregate market value of the voting and non-voting common equity held by nonaffiliates as of June 30,
2016
:
|
Alliant Energy Corporation
|
$9.0 billion
|
|
Interstate Power and Light Company
|
$—
|
|
Wisconsin Power and Light Company
|
$—
|
Number of shares outstanding of each class of common stock as of
January 31, 2017
:
|
Alliant Energy Corporation
|
Common stock, $0.01 par value, 227,687,330 shares outstanding
|
|
Interstate Power and Light Company
|
Common stock, $2.50 par value, 13,370,788 shares outstanding (all of which are owned beneficially and of record by Alliant Energy Corporation)
|
|
Wisconsin Power and Light Company
|
Common stock, $5 par value, 13,236,601 shares outstanding (all of which are owned beneficially and of record by Alliant Energy Corporation)
|
DOCUMENTS INCORPORATED BY REFERENCE
Portions of the Proxy Statement relating to Alliant Energy Corporation’s
2017
Annual Meeting of Shareowners are, or will be upon filing with the Securities and Exchange Commission, incorporated by reference into Part III hereof.
TABLE OF CONTENTS
|
Page Number
|
||||||
DEFINITIONS
The following abbreviations or acronyms used in this Form 10-K are defined below:
|
Abbreviation or Acronym
|
Definition
|
Abbreviation or Acronym
|
Definition
|
|
2017 Alliant Energy Proxy Statement
|
Alliant Energy’s Proxy Statement for the 2017 Annual Meeting of Shareowners
|
HDD
|
Heating degree days
|
|
AEF
|
Alliant Energy Finance, LLC
|
IPL
|
Interstate Power and Light Company
|
|
AFUDC
|
Allowance for funds used during construction
|
IRS
|
Internal Revenue Service
|
|
Alliant Energy
|
Alliant Energy Corporation
|
ITC
|
ITC Midwest LLC
|
|
AOCL
|
Accumulated other comprehensive loss
|
IUB
|
Iowa Utilities Board
|
|
ARO
|
Asset retirement obligation
|
KWh
|
Kilowatt-hour
|
|
ATC
|
American Transmission Company LLC
|
Marshalltown
|
Marshalltown Generating Station
|
|
ATI
|
AE Transco Investments, LLC
|
MDA
|
Management’s Discussion and Analysis of Financial Condition and Results of Operations
|
|
CA
|
Certificate of authority
|
MGP
|
Manufactured gas plant
|
|
CAA
|
Clean Air Act
|
MISO
|
Midcontinent Independent System Operator, Inc.
|
|
CAIR
|
Clean Air Interstate Rule
|
MW
|
Megawatt
|
|
CCR
|
Coal combustion residuals
|
MWh
|
Megawatt-hour
|
|
CDD
|
Cooling degree days
|
N/A
|
Not applicable
|
|
CO2
|
Carbon dioxide
|
NAAQS
|
National Ambient Air Quality Standards
|
|
Corporate Services
|
Alliant Energy Corporate Services, Inc.
|
Note(s)
|
Combined Notes to Consolidated Financial Statements
|
|
CPCN
|
Certificate of Public Convenience and Necessity
|
NOx
|
Nitrogen oxide
|
|
CRANDIC
|
Cedar Rapids and Iowa City Railway Company
|
OIP
|
Alliant Energy 2010 Omnibus Incentive Plan
|
|
CSAPR
|
Cross-State Air Pollution Rule
|
OPEB
|
Other postretirement benefits
|
|
CWIP
|
Construction work in progress
|
PATH Act
|
Protecting Americans from Tax Hikes Act
|
|
DAEC
|
Duane Arnold Energy Center
|
PPA
|
Purchased power agreement
|
|
DATC
|
Duke-American Transmission Company, LLC
|
PSCW
|
Public Service Commission of Wisconsin
|
|
DCP
|
Alliant Energy Deferred Compensation Plan
|
Receivables Agreement
|
Receivables Purchase and Sale Agreement
|
|
DLIP
|
Alliant Energy Director Long Term Incentive Plan
|
RES
|
Renewable energy standards
|
|
Dth
|
Dekatherm
|
Riverside
|
Riverside Energy Center
|
|
EEP
|
Energy efficiency plan
|
RMT
|
RMT, Inc.
|
|
EGU
|
Electric generating unit
|
SCR
|
Selective catalytic reduction
|
|
EPA
|
U.S. Environmental Protection Agency
|
SEC
|
Securities and Exchange Commission
|
|
EPB
|
Emissions plan and budget
|
SO2
|
Sulfur dioxide
|
|
EPS
|
Earnings per weighted average common share
|
U.S.
|
United States of America
|
|
FERC
|
Federal Energy Regulatory Commission
|
VEBA
|
Voluntary Employees’ Beneficiary Association
|
|
Financial Statements
|
Consolidated Financial Statements
|
VIE
|
Variable interest entity
|
|
FTR
|
Financial transmission right
|
WACC
|
Weighted-average cost of capital
|
|
Fuel-related
|
Electric production fuel and purchased power
|
Whiting Petroleum
|
Whiting Petroleum Corporation
|
|
GAAP
|
U.S. generally accepted accounting principles
|
WPL
|
Wisconsin Power and Light Company
|
|
GHG
|
Greenhouse gases
|
WPL Transco
|
WPL Transco, LLC
|
1
FORWARD-LOOKING STATEMENTS
Statements contained in this Annual Report on Form 10-K that are not of historical fact are forward-looking statements intended to qualify for the safe harbors from liability established by the Private Securities Litigation Reform Act of 1995. These forward-looking statements can be identified as such because the statements include words such as “may,” “believe,” “expect,” “anticipate,” “plan,” “project, “will,” “projections,” “estimate,” or other words of similar import. Similarly, statements that describe future financial performance or plans or strategies are forward-looking statements. Such forward-looking statements are subject to certain risks and uncertainties that could cause actual results to differ materially from those expressed in, or implied by, such statements. Some, but not all, of the risks and uncertainties of Alliant Energy, IPL and WPL that could materially affect actual results include:
|
•
|
federal and state regulatory or governmental actions, including the impact of energy, tax (including potential tax reform), financial and health care legislation, and of regulatory agency orders;
|
|
•
|
IPL’s and WPL’s ability to obtain adequate and timely rate relief to allow for, among other things, the recovery of fuel costs, operating costs, transmission costs, environmental compliance and remediation costs, deferred expenditures, capital expenditures, and remaining costs related to EGUs that may be permanently closed, earning their authorized rates of return, and the payments to their parent of expected levels of dividends;
|
|
•
|
the ability to continue cost controls and operational efficiencies;
|
|
•
|
the impact of IPL’s pending retail electric base rate filing, which is currently expected to be filed in the second quarter of 2017;
|
|
•
|
weather effects on results of utility operations;
|
|
•
|
the impact of the economy in IPL’s and WPL’s service territories and the resulting impacts on sales volumes, margins and the ability to collect unpaid bills;
|
|
•
|
the impact of customer- and third party-owned generation, including alternative electric suppliers, in IPL’s and WPL’s service territories on system reliability, operating expenses and customers’ demand for electricity;
|
|
•
|
the impact of energy efficiency, franchise retention and customer disconnects on sales volumes and margins;
|
|
•
|
the impact that price changes may have on IPL’s and WPL’s customers’ demand for electric, gas and steam services and their ability to pay their bills;
|
|
•
|
developments that adversely impact the ability to implement the strategic plan;
|
|
•
|
the ability to qualify for the full level of production tax credits on planned and potential new wind farms and the impact of changes to production tax credits for wind farms;
|
|
•
|
issues related to the availability and operations of EGUs, including start-up risks, breakdown or failure of equipment, performance below expected or contracted levels of output or efficiency, operator error, employee safety, transmission constraints, compliance with mandatory reliability standards and risks related to recovery of resulting incremental costs through rates;
|
|
•
|
disruptions in the supply and delivery of natural gas, purchased electricity and coal;
|
|
•
|
changes in the price of delivered natural gas, purchased electricity and coal due to shifts in supply and demand caused by market conditions and regulations;
|
|
•
|
impacts on equity income from unconsolidated investments due to further potential changes to ATC’s authorized return on equity;
|
|
•
|
issues associated with environmental remediation and environmental compliance, including compliance with the Consent Decree between WPL, the EPA and the Sierra Club, the Consent Decree between IPL, the EPA, the Sierra Club, the State of Iowa and Linn County in Iowa, the CCR rule, the Clean Power Plan, future changes in environmental laws and regulations, including the EPA’s regulations for CO2 emissions reductions from new and existing fossil-fueled EGUs, and litigation associated with environmental requirements;
|
|
•
|
the ability to defend against environmental claims brought by state and federal agencies, such as the EPA, state natural resources agencies or third parties, such as the Sierra Club, and the impact on operating expenses of defending and resolving such claims;
|
|
•
|
impacts that storms or natural disasters in IPL’s and WPL’s service territories may have on their operations and recovery of costs associated with restoration activities;
|
|
•
|
the direct or indirect effects resulting from terrorist incidents, including physical attacks and cyber attacks, or responses to such incidents;
|
|
•
|
the impact of penalties or third-party claims related to, or in connection with, a failure to maintain the security of personally identifiable information, including associated costs to notify affected persons and to mitigate their information security concerns;
|
|
•
|
the direct or indirect effects resulting from breakdown or failure of equipment in the operation of gas distribution systems, such as leaks, explosions and mechanical problems, and compliance with gas transmission and distribution safety regulations, such as proposed rules issued by the Pipeline and Hazardous Materials Safety Administration;
|
|
•
|
risks associated with integration of a new customer billing and information system, which was completed in 2016;
|
2
|
•
|
impacts of IPL’s future tax benefits from Iowa rate-making practices, including deductions for repairs expenditures and allocation of mixed service costs, and recoverability of the associated regulatory assets from customers, when the differences reverse in future periods;
|
|
•
|
any material post-closing adjustments related to any past asset divestitures, including the sales of IPL’s Minnesota electric and natural gas assets, RMT and Whiting Petroleum, which could result from, among other things, warranties, parental guarantees or litigation;
|
|
•
|
continued access to the capital markets on competitive terms and rates, and the actions of credit rating agencies;
|
|
•
|
inflation and interest rates;
|
|
•
|
changes to the creditworthiness of counterparties with which Alliant Energy, IPL and WPL have contractual arrangements, including participants in the energy markets and fuel suppliers and transporters;
|
|
•
|
current or future litigation, regulatory investigations, proceedings or inquiries;
|
|
•
|
reputational damage from negative publicity, protests, fines, penalties and other negative consequences resulting in regulatory and/or legal actions;
|
|
•
|
Alliant Energy’s ability to sustain its dividend payout ratio goal;
|
|
•
|
employee workforce factors, including changes in key executives, collective bargaining agreements and negotiations, work stoppages or restructurings;
|
|
•
|
inability to access technological developments, including those related to wind turbines, solar generation, smart technology, battery storage and other future technologies;
|
|
•
|
changes in technology that alter the channels through which electric customers buy or utilize electricity;
|
|
•
|
material changes in employee-related benefit and compensation costs;
|
|
•
|
the effect of accounting standards issued periodically by standard-setting bodies;
|
|
•
|
the impact of adjustments made to deferred tax assets and liabilities from state apportionment assumptions;
|
|
•
|
the ability to utilize tax credits and net operating losses generated to date, and those that may be generated in the future, before they expire;
|
|
•
|
impacts of the extension of bonus depreciation deductions;
|
|
•
|
the ability to successfully complete tax audits and changes in tax accounting methods with no material impact on earnings and cash flows; and
|
|
•
|
factors listed in
MDA
and
Item 1A Risk Factors
.
|
Alliant Energy, IPL and WPL each assume no obligation, and disclaim any duty, to update the forward-looking statements in this Annual Report on Form 10-K, except as required by law.
WEBSITE ACCESS TO REPORTS
Alliant Energy, IPL and WPL make their periodic and current reports, and amendments to those reports, available, free of charge, on Alliant Energy’s website at
www.alliantenergy.com/investors
on the same day as such material is electronically filed with, or furnished to, the SEC. Alliant Energy, IPL and WPL are not including the information contained on Alliant Energy’s website as a part of, or incorporating it by reference into, this Annual Report on Form 10-K.
This Annual Report on Form 10-K includes information relating to Alliant Energy, IPL and WPL (as well as AEF and Corporate Services). Where appropriate, information relating to a specific entity has been segregated and labeled as such. Unless otherwise noted, the information herein excludes discontinued operations for all periods presented.
A. GENERAL
Alliant Energy was incorporated in Wisconsin in 1981 and maintains its principal executive offices in Madison, Wisconsin. Alliant Energy operates as a regulated investor-owned public utility holding company. Alliant Energy’s primary focus is to provide regulated electric and natural gas service to approximately
960,000
electric and approximately
410,000
natural gas customers in the Midwest through its two public utility subsidiaries, IPL and WPL. The primary first tier wholly-owned subsidiaries of Alliant Energy are as follows:
1) IPL -
was incorporated in 1925 in Iowa as Iowa Railway and Light Corporation. IPL is a public utility engaged principally in the generation and distribution of electricity and the distribution and transportation of natural gas to retail customers in select markets in Iowa. IPL provides utility services to incorporated communities as directed by the IUB and utilizes non-exclusive franchises, which cover the use of public right-of-ways for utility facilities in incorporated communities for a maximum term of 25 years. At
December 31, 2016
, IPL supplied electric and natural gas service to
3
approximately 490,000 and 220,000 retail customers, respectively, in Iowa. IPL also sells electricity to wholesale customers in Minnesota, Illinois and Iowa. IPL is also engaged in the generation and distribution of steam for two customers in Cedar Rapids, Iowa. In
2016
,
2015
and
2014
, IPL had no single customer for which electric, gas, steam and/or other sales accounted for 10% or more of IPL’s consolidated revenues.
2) WPL -
was incorporated in 1917 in Wisconsin as Eastern Wisconsin Electric Company. WPL is a public utility engaged principally in the generation and distribution of electricity and the distribution and transportation of natural gas to retail customers in select markets in Wisconsin. WPL operates in municipalities pursuant to permits of indefinite duration and state statutes authorizing utility operation in areas annexed by a municipality. At
December 31, 2016
, WPL supplied electric and natural gas service to approximately 470,000 and 190,000 retail customers, respectively. WPL also sells electricity to wholesale customers in Wisconsin. In
2016
,
2015
and
2014
, WPL had no single customer for which electric, gas and/or other sales accounted for 10% or more of WPL’s consolidated revenues. WPL’s consolidated subsidiary, WPL Transco, held Alliant Energy’s investment in ATC until December 31, 2016. Refer to
Note 6(a)
for discussion of WPL’s transfer of its investment in ATC to ATI on December 31, 2016.
3) AEF -
was created in 2016 in Wisconsin as a limited liability company. Alliant Energy’s non-regulated investments are organized under AEF. Refer to “
Information Relating to Non-regulated Operations
” for additional details.
4) CORPORATE SERVICES -
was incorporated in 1997 in Iowa. Corporate Services provides administrative services to Alliant Energy, IPL, WPL and AEF.
Refer to
Note 17
for further discussion of business segments, which information is incorporated herein by reference.
B. INFORMATION RELATING TO ALLIANT ENERGY ON A CONSOLIDATED BASIS
1) EMPLOYEES -
At
December 31, 2016
, Alliant Energy, IPL and WPL had the following full- and part-time employees:
|
Total
|
Number of
|
Percentage of Employees
|
|||
|
Number of
|
Bargaining Unit
|
Covered by Collective
|
|||
|
Employees
|
Employees
|
Bargaining Agreements
|
|||
|
Alliant Energy
|
3,978
|
2,244
|
56%
|
||
|
IPL
|
1,679
|
1,095
|
65%
|
||
|
WPL
|
1,286
|
1,044
|
81%
|
||
The majority of IPL’s bargaining unit employees are covered by the International Brotherhood of Electrical Workers Local 204 (Cedar Rapids) collective bargaining agreement, which expires on August 31, 2017. All of WPL’s bargaining unit employees are covered by the International Brotherhood of Electrical Workers Local 965 collective bargaining agreement, which expires on May 31, 2019.
2) CAPITAL EXPENDITURE AND INVESTMENT PLANS -
Refer to “
Liquidity and Capital Resources
” in MDA for discussion of anticipated construction and acquisition expenditures for
2017
through
2020
.
3) REGULATION -
Alliant Energy, IPL and WPL are subject to regulation by various federal, state and local agencies. The following includes the primary regulations impacting Alliant Energy’s, IPL’s and WPL’s businesses.
FERC
-
Public Utility Holding Company Act of 2005 -
Alliant Energy is registered with FERC as a public utility holding company, pursuant to the Public Utility Holding Company Act of 2005, and is required to maintain certain records and to report certain transactions involving its public utilities, service company and other entities regulated by FERC. Corporate Services, IPL and WPL are subject to regulation by FERC under the Public Utility Holding Company Act of 2005 for various matters including, but not limited to, affiliate transactions, public utility mergers, acquisitions and dispositions, and books, records and accounting requirements.
Energy Policy Act -
The Energy Policy Act requires creation of an Electric Reliability Organization to provide oversight by FERC. FERC designated North American Electric Reliability Corporation as the overarching Electric Reliability Organization. Midwest Reliability Organization, which is a regional member of North American Electric Reliability Corporation, has direct responsibility for mandatory electric reliability standards for IPL and WPL.
4
Federal Power Act -
FERC also has jurisdiction, under the Federal Power Act, over certain electric utility facilities and operations, electric wholesale and transmission rates, dividend payments, issuance of IPL’s securities, and accounting practices of Corporate Services, IPL and WPL.
Electric Wholesale Rates
- IPL and WPL receive wholesale electric market-based rate authority from FERC. Market-based rate authorization allows for wholesale sales of electricity within the MISO market and in transactions directly with third parties, based on the market value of the transactions. IPL and WPL also have FERC-approved cost of service formula based rates related to the provision of firm full- and partial-requirement wholesale electric sales, which allow for true-ups to actual costs, including fuel costs.
Electric Transmission Rates
- FERC regulates the rates charged for electric transmission facilities used in interstate commerce. Neither IPL nor WPL own or operate electric transmission facilities; however, both IPL and WPL pay for the use of the interstate electric transmission system based upon FERC-regulated rates. IPL and WPL rely primarily on the use of the ITC and ATC transmission systems, respectively. Due to the formula rates used by ITC and ATC to charge their customers and possible future changes to these rates, there is uncertainty regarding IPL’s and WPL’s future electric transmission service expense. Refer to “
Other Future Considerations
” in MDA for further discussion of electric transmission service expense.
Natural Gas Act
- FERC regulates the transportation and sale for resale of natural gas in interstate commerce under the Natural Gas Act. Under the Natural Gas Act, FERC has authority over certain natural gas facilities and operations of IPL and WPL.
IUB
-
IPL is subject to regulation by the IUB for various matters including, but not limited to, retail utility rates and standards of service, accounting requirements, sales of assets with values that exceed 3% of IPL’s revenues, and approval of the location and construction of EGUs.
Retail Utility Base Rates -
IPL files periodic requests with the IUB for retail rate changes, which are based on historical test periods. The historical test periods may be adjusted for certain known and measurable changes to capital investments, cost of capital and operating and maintenance expenses consistent with IUB rules and regulations. Interim retail rates can be placed in effect 10 days after the rate application filing, subject to refund, and must be based on previously established regulatory principles. The IUB must decide on requests for retail rate changes within 10 months of the date of the application for which changes are filed, or the interim rates granted become permanent.
Retail Commodity Cost Recovery Mechanisms -
Refer to
Note 1(g)
for discussion of IPL’s retail electric and natural gas tariffs, which contain automatic adjustment clauses for changes in prudently incurred commodity costs required to serve its retail customers.
Retail Electric Transmission Cost Recovery Mechanism -
Refer to
Note 1(g)
for discussion of a transmission cost recovery rider utilized by IPL for recovery of its electric transmission service expense from its retail electric customers.
Energy Efficiency Cost Recovery Mechanism -
In accordance with Iowa law, IPL is required to file an EEP every five years with the IUB. An EEP provides a utility’s plan and related budget to achieve specified levels of electric and gas energy savings. IUB approval demonstrates that IPL’s EEP is reasonably expected to achieve cost-effective delivery of the energy efficiency programs. Refer to
Note 1(g)
for discussion of the recovery of IPL’s energy efficiency costs from its retail electric and gas customers.
Electric Generating Units -
IPL must obtain a certificate of public convenience, use and necessity (GCU Certificate) from the IUB in order to construct a new, or significantly alter (including fuel switching) an existing, EGU located in Iowa with 25 MW or more of capacity. IPL’s ownership and operation of EGUs (including those located outside the state of Iowa) to serve Iowa customers is subject to retail utility rate regulation by the IUB.
Gas Pipeline Projects -
IPL must obtain a pipeline permit from the IUB related to the siting of utility gas pipelines in Iowa that will be operated at a pressure over 150 pounds per square inch and will transport gas from a gathering or storage facility to a distribution system or single, large volume customer.
Advance Rate-making Principles -
Iowa law provides Iowa utilities with rate-making principles prior to making certain generation investments in Iowa. As a result, IPL may file for, and the IUB must render a decision on, rate-making principles for EGUs located in Iowa, including any new combined-cycle natural gas-fired EGU, any renewable generating resource such as a wind facility, and base-load (nuclear or coal-fired generation) EGUs with a nameplate generating capacity of 300
5
MW or more. Upon approval of rate-making principles by the IUB, IPL must either build the EGU under the approved rate-making principles, or not at all.
Electric Generating Unit Environmental Controls Projects
- IPL is required to submit an updated EPB biennially to the IUB setting out a multi-year plan and budget for managing regulated emissions from its coal-fired EGUs in a cost-effective manner. IPL must simultaneously submit this plan and budget to the Iowa Department of Natural Resources for a determination of whether the plan and budget meet state environmental requirements for regulated emissions. The reasonable costs associated with implementing the approved plan are expected to be included in IPL’s future retail electric rates.
PSCW
-
Alliant Energy is subject to regulation by the PSCW for the type and amount of Alliant Energy’s investments in non-utility businesses and other affiliated interest activities, among other matters. WPL is also subject to regulation by the PSCW related to its operations in Wisconsin for various matters including, but not limited to, retail utility rates and standards of service, accounting requirements, issuance and use of proceeds of securities, affiliate transactions, approval of the location and construction of EGUs and certain other additions and extensions to facilities.
Retail Utility Base Rates -
WPL files periodic requests with the PSCW for retail rate changes. These filings are required to be based on forward-looking test periods. There is no statutory time limit for the PSCW to decide retail base rate requests. However, the PSCW attempts to process retail base rate cases in approximately 10 months and has the ability to approve interim retail rate relief, subject to refund, if necessary. Currently, WPL is required to defer a portion of its earnings if its annual regulatory return on common equity exceeds certain levels and is allowed to request a change in retail base rates if its annual return on common equity falls below a certain level.
Retail Commodity Cost Recovery Mechanisms -
WPL’s retail electric base rates include estimates of annual fuel-related costs anticipated during the forward-looking test period. WPL’s retail natural gas tariffs contain an automatic adjustment clause for changes in prudently incurred natural gas costs required to serve its retail gas customers. Refer to
Note 1(g)
for discussion of the recovery of these costs from WPL’s retail electric and gas customers.
Retail Electric Transmission Cost Recovery -
WPL’s retail electric base rates include estimates of electric transmission service expense anticipated during the forward-looking test period. Refer to
Note 1(g)
for discussion of the recovery of WPL’s electric transmission service expense from its retail electric customers.
Energy Efficiency Cost Recovery -
WPL contributes 1.2% of its annual retail utility revenues to help fund Focus on Energy, Wisconsin’s state-wide energy efficiency and renewable energy resource program. Refer to
Note 1(g)
for discussion of the recovery of WPL’s energy efficiency costs from its retail electric and gas customers.
New Electric Generating Units -
A CA application is required to be filed with the PSCW for construction approval of any new EGU with a capacity of less than 100 MW and a project cost of $10.7 million or more. WPL must obtain a CPCN from the PSCW in order to construct a new EGU in Wisconsin with a capacity of 100 MW or more. In addition, WPL’s ownership and operation of EGUs (including those located outside the state of Wisconsin) to serve Wisconsin customers is subject to retail utility rate regulation by the PSCW.
Electric Generating Unit Upgrades and Electric Distribution Projects-
A CA application is required to be filed with the PSCW for construction approval of any additions to EGUs, including environmental controls projects, as well as electric distribution projects, with estimated project costs of $10.7 million or more.
Gas Distribution Projects -
A CA application is required to be filed with the PSCW for construction approval of gas projects with an estimated project cost of $2.5 million or more and at any time that WPL requests to extend gas service to a new portion of its service territory.
Advance Rate-making Principles -
Wisconsin law provides Wisconsin utilities with the opportunity to request rate-making principles prior to the purchase or construction of any EGU utilized to serve Wisconsin customers. WPL is not obligated to file for or accept authorized rate-making principles under Wisconsin law. WPL can proceed with an approved project under traditional rate-making terms or accept authorized rate-making principles under Wisconsin law.
Environmental
-
Extensive environmental laws and regulations are applicable as a result of current and past operations. The environmental laws and regulations relate to the protection of the environment and health and safety matters, including those governing air emissions; water discharges; protection of habitat for potentially threatened and endangered species; the
6
management, storage and disposal of hazardous materials; and the clean-up of contaminated sites, including former MGP sites.
The EPA administers certain federal regulatory programs and has delegated the administration of other environmental regulatory programs to the applicable state environmental agencies. State agencies generally have jurisdiction over air and water quality, hazardous substances management, transportation and clean-up, and solid waste management requirements. In certain cases, the state environmental agencies have delegated the administration of environmental programs to local agencies.
Federal, state and local permits are regularly obtained to assure compliance with environmental laws and regulations. Costs associated with such compliance are expected to continue in the future. Prudently incurred compliance and remediation costs for IPL and WPL are anticipated to be recoverable, in whole or part, through future rate case proceedings. Refer to “
Environmental Matters
” in MDA and
Note 16(e)
for further discussion of electric and gas environmental matters, including current or proposed environmental regulations. Refer to “
Strategic Overview
” in MDA for details of future environmental compliance plans to adhere to applicable environmental requirements.
4) STRATEGIC OVERVIEW -
Refer to “
Strategic Overview
” in MDA for discussion of various strategic actions by Alliant Energy, IPL and WPL.
C. INFORMATION RELATING TO UTILITY OPERATIONS
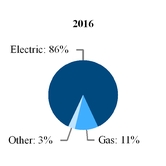
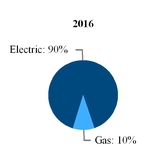
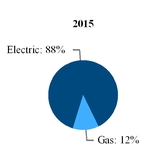
Alliant Energy’s utility business (IPL and WPL) has three segments: a) electric operations; b) gas operations; and c) other, which includes IPL’s steam operations and the unallocated portions of the utility business. IPL’s and WPL’s operating revenues as a percentage of total revenues for these utility business segments were as follows:
|
IPL
|
WPL
|
|

1) ELECTRIC UTILITY OPERATIONS
General
-
Electric utility operations represent the largest operating segment for Alliant Energy, IPL and WPL. Alliant Energy’s electric utility operations are located in the Midwest with IPL providing retail electric service in Iowa and WPL providing retail and wholesale electric service in Wisconsin. IPL also sells electricity to wholesale customers in Minnesota, Illinois and Iowa. Refer to the “
Electric Operating Information
” tables for additional details regarding electric utility operations.
Customers
- IPL and WPL provide electric utility service to a diversified base of retail customers in several industries, with the largest concentrations in the food and industrial manufacturing, chemical (including ethanol) and paper industries. IPL and WPL also sell electricity to wholesale customers, which primarily consist of municipalities and rural electric cooperatives. Refer to “
Strategic Overview
” in MDA for discussion of recent agreements with certain of WPL’s electric wholesale customers related to WPL’s Riverside expansion. Refer to “
Other Future Considerations
” in MDA for discussion of notifications provided to each of IPL and WPL to terminate certain of their wholesale power supply agreements.
Seasonality
-
Electric sales are seasonal to some extent with the annual peak normally occurring in the summer months due to air conditioning requirements. Electric sales are also impacted to a certain extent in the winter months due to heating requirements. Refer to the “
Electric Operating Information
” tables for additional details regarding maximum summer and winter peak hour demands.
Competition
-
Retail electric customers in Iowa and Wisconsin currently do not have the ability to choose their electric supplier, and IPL and WPL have obligations to serve all their retail electric customers. Although electric service in Iowa and Wisconsin is regulated, IPL and WPL still face competition from self-generation by large industrial customers, customer- and third party-owned generation (e.g. solar panels), alternative energy sources, and petitions to municipalize (Iowa) as well as
7
service territory expansions by municipal utilities through annexations (Wisconsin). In addition, IPL’s and WPL’s wholesale customers may choose to purchase their electric energy and capacity needs from the MISO market, independent power producers or other utilities. Alliant Energy’s strategic plan includes actions to retain current customers and attract new customers into IPL’s and WPL’s service territories in an effort to keep energy rates low for all of their customers. Refer to “
Strategic Overview
” in MDA for discussion of the growth element of the strategic plan, which includes accelerating the growth of customers’ electric usage.
Renewable Energy Standards
-
Iowa and Wisconsin have RES, which establish the minimum amount of energy IPL and WPL must supply from renewable resources. IPL primarily relies upon renewable energy generated from the wind projects it owns and renewable energy acquired under PPAs to meet these requirements. WPL utilizes its current renewable portfolio, which primarily consists of wind and hydro, to meet these requirements. IPL and WPL currently meet or exceed their respective RES requirements.
Energy Efficiency Programs
-
Several energy efficiency programs and initiatives help customers reduce their energy usage and related costs through the use of new energy efficient equipment, products and practices. The following are current key energy efficiency programs:
IPL EEP -
In 2013, IPL received an order from the IUB approving IPL’s EEP for 2014 through 2018. The EEP includes IPL spending approximately $400 million for electric and natural gas energy efficiency programs in Iowa from 2014 through 2018, and is expected to conserve electric and natural gas usage equal to that of more than 100,000 homes.
Focus on Energy Program -
In
2016
, WPL contributed 1.2% of its annual retail utility revenues to help fund Focus on Energy, Wisconsin’s state-wide energy efficiency and renewable energy resource program.
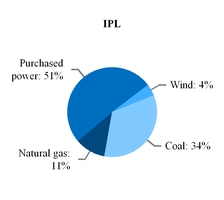
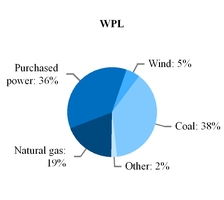
Electric Supply
-
Alliant Energy, IPL and WPL have met, and expect to continue meeting, customer demand of electricity through a mix of electric supply including owned EGUs, PPAs and additional purchases from wholesale energy markets. Alliant Energy expects its mix of electric supply to change in the next several years with IPL’s construction of Marshalltown, WPL’s construction of the Riverside expansion, IPL’s approved 500 MW of additional wind generation and the proposed retirement of various EGUs. Long-term generation plans are intended to meet customer demand, reduce carbon emissions, reduce reliance on wholesale market purchases and mitigate the impacts of future EGU retirements while maintaining compliance with long-term electric demand planning reserve margins, environmental requirements and RES established by regulators. Alliant Energy, IPL and WPL currently expect to meet utility customer demand in the future. However, unanticipated regional or local reliability issues could still arise in the event of outages or unexpected delays in the construction of new generating and/or transmission facilities, retirement of EGUs, EGU outages, transmission system outages or extended periods of extreme weather conditions. Refer to the “
Electric Operating Information
” tables for a profile of the sources of electric supply used to meet customer demand from
2014 to 2016
. Refer to “
Strategic Overview
” in MDA for details of future generation plans.
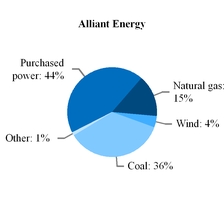
Sources of Electric Energy -
In 2016, sources of electric energy were approximately as follows:
Electric Demand Planning Reserve Margin -
IPL and WPL are required to maintain a planning reserve margin above their load at the time of the MISO-wide peak to ensure reliability of electric service to their customers. The required installed capacity reserve margin is 15.8% and the required unforced capacity reserve margin is 7.8% for the June 1,
2017
through May 31,
2018
MISO planning year. IPL and WPL currently have adequate capacity to meet such MISO planning reserve margin requirements.
8
Generation -
IPL and WPL own a portfolio of EGUs located in Iowa, Wisconsin and Minnesota with a diversified fuel mix including natural gas, renewable resources and coal. Refer to “
Properties
” in Item 2 for details of IPL’s and WPL’s EGUs. Refer to
Note 1(g)
for discussion of IPL’s and WPL’s rate recovery of fuel-related costs and
Note 16(b)
for details on IPL’s and WPL’s natural gas, coal and purchased power commitments.
Fuel Costs
- The average cost of delivered fuel per million British Thermal Units used for electric generation was as follows:
|
IPL
|
WPL
|
||||||||||||||||||||||
|
2016
|
2015
|
2014
|
2016
|
2015
|
2014
|
||||||||||||||||||
|
All fuels
|
|
$2.17
|
|
|
$2.21
|
|
|
$2.50
|
|
|
$2.61
|
|
|
$2.67
|
|
|
$2.82
|
|
|||||
|
Natural gas (a)
|
2.86
|
|
3.37
|
|
6.05
|
|
3.25
|
|
3.68
|
|
5.51
|
|
|||||||||||
|
Coal
|
1.98
|
|
1.94
|
|
2.05
|
|
2.47
|
|
2.49
|
|
2.22
|
|
|||||||||||
|
(a)
|
The average cost of natural gas includes commodity and transportation costs as well as realized gains and losses from swap and option contracts used to hedge the price of natural gas volumes expected to be used by IPL’s and WPL’s natural gas-fired EGUs.
|
Natural Gas
- As discussed in “
Properties
” in Item 2, Alliant Energy, IPL and WPL own several natural gas-fired EGUs. WPL also has exclusive rights to the output of AEF’s Sheboygan Falls facility under an affiliated lease agreement. These facilities help meet customer demand for electricity generally during peak hour demands and when natural gas prices are low enough to make natural gas-fired generation economical compared to other fuel sources, such as occurred in 2016 and 2015. Alliant Energy manages the gas supply to these gas-fired EGUs and helps ensure an adequate supply is available at known prices through a combination of gas commodity, pipeline transportation and storage agreements held by IPL and WPL for 2017 through 2028. Alliant Energy, IPL and WPL believe they are reasonably insulated against gas price volatility for these EGUs given their use of forward contracts and hedging practices, as well as their regulatory cost-recovery mechanisms. Refer to “
Strategic Overview
” in MDA for discussion of IPL’s construction of Marshalltown and WPL’s construction of the Riverside expansion, both of which are natural gas-fired combined-cycle EGUs.
Wind
- As discussed in “
Properties
” in Item 2, IPL owns the Whispering Willow - East wind farm and WPL owns the Cedar Ridge and Bent Tree wind farms. All or some of the renewable energy attributes associated with generation from these sources may be used in future years to comply with RES or other regulatory requirements, or sold to third parties in the form of renewable energy credits or other environmental commodities. Refer to “
Strategic Overview
” in MDA for discussion of IPL’s and WPL’s planned and potential addition of wind generation to Alliant Energy’s resources portfolio.
Coal
- Coal is one of the fuel sources for owned EGUs. Coal contracts entered into with different suppliers help ensure that a specified supply of coal is available, and delivered, at known prices for IPL’s and WPL’s coal-fired EGUs for
2017
through 2019. Alliant Energy, IPL and WPL believe their coal supply portfolio represents a reasonable balance between the risks of insufficient supplies and those associated with being unable to respond to future coal market changes. Remaining coal requirements are expected to be met from either future term contracts or purchases in the spot market. Nearly all of the coal utilized by IPL and WPL is from the Wyoming Powder River Basin. Coal inventory levels have been impacted by continued lower natural gas prices, which can make natural gas-fired generation more economical compared to other fuel sources, such as coal. Coal inventory levels have also been impacted by lower electric demand due to milder temperatures during portions of 2015 and 2016. In 2015 and 2016, three of Alliant Energy’s coal suppliers filed for restructuring under Chapter 11 of the U.S. Bankruptcy Code. Two coal suppliers have emerged from Chapter 11 restructuring. There has been no significant impact to Alliant Energy, IPL and WPL as a result of these bankruptcy filings.
Alliant Energy, IPL and WPL believe they are reasonably insulated against coal price volatility given their current coal procurement process, the specific coal market in their primary purchase region and regulatory cost-recovery mechanisms. The coal procurement process supports periodic purchases, staggering of contract terms, stair-stepped levels of supply going forward and supplier diversity. Similarly, given the term lengths of their transportation agreements and, as appropriate, strategic alignment of agreement expirations for negotiation purposes, Alliant Energy, IPL and WPL believe they are reasonably insulated against future higher coal transportation rates from the major railroads.
Purchased Power -
IPL and WPL periodically enter into PPAs and purchase electricity from wholesale energy markets to meet a portion of their customer demand for electricity. IPL’s most significant PPA is for the purchase of up to 431 MWs of capacity and the resulting energy from DAEC for a term from February 2014 through December 2025. WPL’s most significant PPA is for the purchase of 150 MWs of energy for a term from January 2014 through December 2018.
9
IPL’s DAEC PPA
-
In 2013, the IUB issued an order allowing IPL to proceed with a PPA for the purchase of capacity and energy generated by DAEC located near Palo, Iowa. The IUB also authorized IPL to recover the Iowa retail portion of the cost of the DAEC PPA from Iowa retail electric customers through the energy adjustment clause. The terms of the PPA provide IPL the right to the counterparty’s entire output quantities (70% of the total plant output) in exchange for payment from IPL to the counterparty based on the amount of MWhs received by IPL. Among the terms and conditions of the PPA are guarantees by the counterparty to provide minimum amounts of capacity and energy. The PPA also contains provisions for the replacement of energy from alternative sources under certain conditions as well as provisions that convey to IPL the potential environmental attributes associated with its portion of the output from DAEC.
Electric Transmission
-
IPL and WPL do not own electric transmission assets and currently receive substantially all their electric transmission services from ITC and ATC, respectively. ITC and ATC are independent for-profit, transmission-only companies and are transmission-owning members of the MISO Regional Transmission Organization, Midwest Reliability Organization and Reliability First Corporation Regional Entities. The annual transmission service rates that ITC or ATC charges their customers are calculated each calendar year using a FERC-approved cost of service formula rate referred to as Attachment “O.” Because Attachment “O” is a FERC-approved formula rate, ITC and ATC can implement new rates each calendar year without filing a request with FERC. However, new rates are subject to challenge by either FERC or customers. If the rates proposed by ITC or ATC are determined by FERC to be unjust or unreasonable or another mechanism is determined by FERC to be just and reasonable, ITC’s or ATC’s rates would change accordingly.
Refer to “
Other Future Considerations
” in MDA for additional information regarding transmission service charges from ITC and ATC, as well as discussion of a complaint pending with FERC regarding the level of return on equity that MISO transmission owners (including ITC and ATC) should be allowed to utilize in calculating the rates they charge their customers. Refer to
Note 1(g)
for discussion of a transmission cost rider utilized by IPL for recovery of its electric transmission service expense, and discussion of WPL’s electric transmission service expense, which is recovered from its retail electric customers through changes in base rates determined during periodic rate proceedings.
Note 1(g)
also discusses escrow accounting treatment for electric transmission service expense through 2018 pursuant to PSCW orders. Refer to
Note 18
for details of agreements between ATC and WPL.
ATC -
As of December 31, 2016, ATI holds all of Alliant Energy’s investment in ATC and funds capital contributions to ATC, which are included in “Other” in the construction and acquisition expenditures table in “
Liquidity and Capital Resources
” in MDA. Alliant Energy currently anticipates that ATI will fund capital contributions of approximately $23 million, $14 million, $6 million and $8 million to ATC in
2017
,
2018
,
2019
and
2020
, respectively, to help fund future proposed transmission projects. These future proposed transmission projects require approval from various regulatory agencies to construct. In addition, refer to “
Other Future Considerations
” in MDA for discussion of potential changes to ATC’s return on equity, which may result in changes to equity income and dividends from ATC in the future.
In 2011, Duke Energy Corporation and ATC announced the creation of DATC, a joint venture that is expected to acquire, build, own and operate new electric transmission infrastructure in North America. DATC continues to evaluate new projects and opportunities, and participates in a competitive bidding process on projects it considers to be viable. The expenditures in the construction and acquisition expenditures table in “
Liquidity and Capital Resources
” in MDA do not include any capital contributions for potential DATC projects.
MISO Markets
- IPL and WPL are members of MISO, a FERC-approved Regional Transmission Organization, which is responsible for monitoring and ensuring equal access to the transmission system in their footprint. IPL and WPL participate in the wholesale energy and ancillary services markets operated by MISO, which are discussed in more detail below. As agent for IPL and WPL, Corporate Services enters into energy, capacity, ancillary services, and transmission sale and purchase transactions within MISO. Corporate Services assigns such sales and purchases between IPL and WPL based on statements received from MISO. Refer to
Note 18
for additional discussion of these assigned amounts.
Wholesale Energy Market -
IPL and WPL participate in the wholesale energy market operated by MISO. The market dictates the process by which IPL and WPL buy and sell wholesale electricity, obtain transmission services, schedule generation and ensure resource adequacy to reliably serve load. MISO generally dispatches the lowest cost generators, while recognizing current system constraints, to reduce costs for purchasers in the wholesale energy market. The market is intended to send price signals to stakeholders about where generation or transmission system expansion is needed. In addition, MISO may dispatch generators that support reliability needs, but that would not have operated based on economic needs. In these cases, MISO’s settlement assures that these generators are made whole financially for their variable costs.
10
Ancillary Services Market -
IPL and WPL also participate in MISO’s ancillary services market, which integrates the procurement and use of regulation and contingency reserves with the existing wholesale energy market to ensure reliability of electricity supply. Regulation reserves refer to generation available to meet the moment-to-moment changes in generation that are necessary to meet changes in electricity demand. Contingency reserves refer to additional generation or demand response resources, either on-line or that can be brought on-line within 10 minutes, to meet certain major events such as the loss of a large EGU or transmission line.
Financial Transmission Rights and Auction Revenue Rights
- In areas of constrained transmission capacity, costs could be higher due to congestion and its impact on locational marginal prices. FTRs provide a hedge for certain congestion costs that occur in the MISO energy market. MISO allocates auction revenue rights to IPL and WPL annually based on a fiscal year from June 1 through May 31 and historical use of the transmission system. The revenue rights associated with the allocated auction revenue rights are used by IPL and WPL to acquire FTRs through the FTR auctions operated by MISO.
Multi-value Projects -
The MISO tariffs billed to IPL and WPL include costs related to various shared transmission projects, including multi-value projects. Such projects include new large scale transmission projects that enable the reliable and economic delivery of energy or provide economic value across the MISO footprint. Multi-value project costs are socialized across the entire MISO footprint based on energy usage. The MISO tariffs billed to IPL and WPL also include a portion of the costs related to other shared transmission projects, including projects designed to reduce market congestion, and to ensure compliance with applicable reliability standards. The MISO tariffs billed to IPL and WPL are expected to increase in the future due to the increased number of shared transmission projects occurring in the MISO region.
Resource Adequacy
- MISO conducts various studies regarding reliability of electric service to ensure its market participants have adequate resources to meet MISO’s forecasted peak load obligations plus a reserve margin. Only accredited capacity assigned to EGUs is available to meet these requirements. To connect to the transmission system, MISO requires an EGU to obtain an interconnection agreement. In order for an EGU to receive accredited capacity, it must meet MISO capacity accreditation requirements, which can include satisfying transmission requirements identified in its interconnection agreement prior to the MISO planning year. New EGUs like Marshalltown and the Riverside expansion, or IPL’s and WPL’s planned additional wind generation, may not initially receive full accredited capacity based on the inability to satisfy all identified transmission requirements. Therefore, full accredited capacity may not be granted to such EGUs until all identified transmission requirements are resolved.
Attachment Y Notices -
MISO requires its market participants who own EGUs to submit an Attachment Y Notice if they plan to retire an EGU, reduce EGU capacity or suspend all or a portion of EGU operations for a period longer than two months. Refer to “
Properties
” in Item 2 for discussion of EGUs that IPL and WPL currently plan to retire or modify, such as changing from coal-fired to an alternative fuel source, in the next few years.
Electric Environmental Matters
-
Refer to
Note 16(e)
and “
Environmental Matters
” in MDA for discussion of electric environmental matters, including current or proposed environmental regulations.
11
|
Electric Operating Information - Alliant Energy
|
2016
|
2015
|
2014
|
||||||||
|
Operating Revenues (in millions):
|
|||||||||||
|
Residential (a)
|
|
$1,001.1
|
|
|
$983.0
|
|
|
$994.5
|
|
||
|
Commercial (a)
|
712.6
|
|
667.8
|
|
658.0
|
|
|||||
|
Industrial (a)
|
787.1
|
|
763.4
|
|
735.1
|
|
|||||
|
Industrial - co-generation
|
64.0
|
|
59.9
|
|
63.9
|
|
|||||
|
Retail subtotal
|
2,564.8
|
|
2,474.1
|
|
2,451.5
|
|
|||||
|
Sales for resale:
|
|||||||||||
|
Wholesale (a)
|
256.6
|
|
221.0
|
|
206.6
|
|
|||||
|
Bulk power and other
|
10.1
|
|
28.5
|
|
2.9
|
|
|||||
|
Other
|
44.0
|
|
46.9
|
|
52.6
|
|
|||||
|
Total
|
|
$2,875.5
|
|
|
$2,770.5
|
|
|
$2,713.6
|
|
||
|
Electric Sales (000s MWh):
|
|||||||||||
|
Residential (a)
|
7,152
|
|
7,271
|
|
7,697
|
|
|||||
|
Commercial (a)
|
6,545
|
|
6,374
|
|
6,449
|
|
|||||
|
Industrial (a)
|
10,702
|
|
10,820
|
|
10,813
|
|
|||||
|
Industrial - co-generation
|
940
|
|
915
|
|
1,008
|
|
|||||
|
Retail subtotal
|
25,339
|
|
25,380
|
|
25,967
|
|
|||||
|
Sales for resale:
|
|||||||||||
|
Wholesale (a)
|
4,039
|
|
3,614
|
|
3,586
|
|
|||||
|
Bulk power and other
|
360
|
|
1,228
|
|
335
|
|
|||||
|
Other
|
100
|
|
129
|
|
155
|
|
|||||
|
Total
|
29,838
|
|
30,351
|
|
30,043
|
|
|||||
|
Customers (End of Period):
|
|||||||||||
|
Residential (a)
|
811,459
|
|
809,634
|
|
850,322
|
|
|||||
|
Commercial (a)
|
141,528
|
|
137,870
|
|
139,138
|
|
|||||
|
Industrial (a)
|
2,546
|
|
2,544
|
|
2,871
|
|
|||||
|
Other
|
2,785
|
|
2,930
|
|
3,662
|
|
|||||
|
Total
|
958,318
|
|
952,978
|
|
995,993
|
|
|||||
|
Other Selected Electric Data:
|
|||||||||||
|
Maximum summer peak hour demand (MW)
|
5,615
|
|
5,385
|
|
5,426
|
|
|||||
|
Maximum winter peak hour demand (MW)
|
4,559
|
|
4,668
|
|
4,803
|
|
|||||
|
Cooling degree days (b):
|
|||||||||||
|
Cedar Rapids, Iowa (IPL) (normal - 766)
|
971
|
|
732
|
|
670
|
|
|||||
|
Madison, Wisconsin (WPL) (normal - 662)
|
780
|
|
665
|
|
620
|
|
|||||
|
Sources of electric energy (000s MWh):
|
|||||||||||
|
Gas
|
4,505
|
|
4,738
|
|
2,971
|
|
|||||
|
Purchased power:
|
|||||||||||
|
Nuclear
|
3,444
|
|
3,741
|
|
3,133
|
|
|||||
|
Wind (c)
|
1,079
|
|
1,190
|
|
1,252
|
|
|||||
|
Other (c)
|
8,912
|
|
6,675
|
|
8,074
|
|
|||||
|
Wind (c)
|
1,382
|
|
1,441
|
|
1,390
|
|
|||||
|
Coal
|
11,019
|
|
13,040
|
|
13,818
|
|
|||||
|
Other (c)
|
228
|
|
189
|
|
212
|
|
|||||
|
Total
|
30,569
|
|
31,014
|
|
30,850
|
|
|||||
|
Revenue per KWh sold to retail customers (cents)
|
10.12
|
|
9.75
|
|
9.44
|
|
|||||
|
(a)
|
In 2015, Alliant Energy sold its electric distribution assets in Minnesota to Southern Minnesota Energy Cooperative. At the date of the sale, Alliant Energy had approximately 42,000 retail electric customers in Minnesota. Prior to the asset sale, the electric sales to these retail customers are included in residential, commercial and industrial retail sales. Subsequent to the asset sale, the related electric sales are included in wholesale electric sales pursuant to a wholesale power supply agreement between IPL and Southern Minnesota Energy Cooperative, which is discussed in
Note 3
.
|
|
(b)
|
Cooling degree days are calculated using a simple average of the high and low temperatures each day compared to a 65 degree base. Normal degree days are calculated using a rolling 20-year average of historical cooling degree days. Refer to “
Gas Utility Operations
” below for details of heating degree days.
|
|
(c)
|
All or some of the renewable energy attributes associated with generation from these sources may be used in future years to comply with renewable energy standards or other regulatory requirements, or sold to third parties in the form of renewable energy credits or other environmental commodities.
|
12
|
Electric Operating Information
|
IPL
|
WPL
|
|||||||||||||||||||||
|
2016
|
2015
|
2014
|
2016
|
2015
|
2014
|
||||||||||||||||||
|
Operating Revenues (in millions):
|
|||||||||||||||||||||||
|
Residential (a)
|
|
$536.7
|
|
|
$540.3
|
|
|
$556.4
|
|
|
$464.4
|
|
|
$442.7
|
|
|
$438.1
|
|
|||||
|
Commercial (a)
|
445.4
|
|
416.3
|
|
410.2
|
|
267.2
|
|
251.5
|
|
247.8
|
|
|||||||||||
|
Industrial (a)
|
396.4
|
|
393.7
|
|
394.6
|
|
390.7
|
|
369.7
|
|
340.5
|
|
|||||||||||
|
Industrial - co-generation
|
64.0
|
|
59.9
|
|
63.9
|
|
N/A
|
|
N/A
|
|
N/A
|
|
|||||||||||
|
Retail subtotal
|
1,442.5
|
|
1,410.2
|
|
1,425.1
|
|
1,122.3
|
|
1,063.9
|
|
1,026.4
|
|
|||||||||||
|
Sales for resale:
|
|||||||||||||||||||||||
|
Wholesale (a)
|
94.2
|
|
56.4
|
|
32.2
|
|
162.4
|
|
164.6
|
|
174.4
|
|
|||||||||||
|
Bulk power and other
|
3.6
|
|
5.1
|
|
2.1
|
|
6.5
|
|
23.4
|
|
0.8
|
|
|||||||||||
|
Other
|
29.4
|
|
32.1
|
|
33.9
|
|
14.6
|
|
14.8
|
|
18.7
|
|
|||||||||||
|
Total
|
|
$1,569.7
|
|
|
$1,503.8
|
|
|
$1,493.3
|
|
|
$1,305.8
|
|
|
$1,266.7
|
|
|
$1,220.3
|
|
|||||
|
Electric Sales (000s MWh):
|
|||||||||||||||||||||||
|
Residential (a)
|
3,633
|
|
3,843
|
|
4,164
|
|
3,519
|
|
3,428
|
|
3,533
|
|
|||||||||||
|
Commercial (a)
|
4,159
|
|
4,059
|
|
4,099
|
|
2,386
|
|
2,315
|
|
2,350
|
|
|||||||||||
|
Industrial (a)
|
5,791
|
|
6,007
|
|
6,124
|
|
4,911
|
|
4,813
|
|
4,689
|
|
|||||||||||
|
Industrial - co-generation
|
940
|
|
915
|
|
1,008
|
|
N/A
|
|
N/A
|
|
N/A
|
|
|||||||||||
|
Retail subtotal
|
14,523
|
|
14,824
|
|
15,395
|
|
10,816
|
|
10,556
|
|
10,572
|
|
|||||||||||
|
Sales for resale:
|
|||||||||||||||||||||||
|
Wholesale (a)
|
1,360
|
|
845
|
|
485
|
|
2,679
|
|
2,769
|
|
3,101
|
|
|||||||||||
|
Bulk power and other
|
46
|
|
178
|
|
59
|
|
314
|
|
1,050
|
|
276
|
|
|||||||||||
|
Other
|
41
|
|
67
|
|
81
|
|
59
|
|
62
|
|
74
|
|
|||||||||||
|
Total
|
15,970
|
|
15,914
|
|
16,020
|
|
13,868
|
|
14,437
|
|
14,023
|
|
|||||||||||
|
Customers (End of Period):
|
|||||||||||||||||||||||
|
Residential (a)
|
403,558
|
|
406,028
|
|
445,483
|
|
407,901
|
|
403,606
|
|
404,839
|
|
|||||||||||
|
Commercial (a)
|
83,936
|
|
80,982
|
|
81,853
|
|
57,592
|
|
56,888
|
|
57,285
|
|
|||||||||||
|
Industrial (a)
|
1,511
|
|
1,572
|
|
1,856
|
|
1,035
|
|
972
|
|
1,015
|
|
|||||||||||
|
Other
|
862
|
|
1,050
|
|
1,385
|
|
1,923
|
|
1,880
|
|
2,277
|
|
|||||||||||
|
Total
|
489,867
|
|
489,632
|
|
530,577
|
|
468,451
|
|
463,346
|
|
465,416
|
|
|||||||||||
|
Other Selected Electric Data:
|
|||||||||||||||||||||||
|
Maximum summer peak hour demand (MW)
|
2,996
|
|
3,005
|
|
2,840
|
|
2,681
|
|
2,564
|
|
2,594
|
|
|||||||||||
|
Maximum winter peak hour demand (MW)
|
2,479
|
|
2,531
|
|
2,601
|
|
2,131
|
|
2,153
|
|
2,202
|
|
|||||||||||
|
Cooling degree days (b):
|
|||||||||||||||||||||||
|
Cedar Rapids, Iowa (IPL) (normal - 766)
|
971
|
|
732
|
|
670
|
|
N/A
|
|
N/A
|
|
N/A
|
|
|||||||||||
|
Madison, Wisconsin (WPL) (normal - 662)
|
N/A
|
|
N/A
|
|
N/A
|
|
780
|
|
665
|
|
620
|
|
|||||||||||
|
Sources of electric energy (000s MWh):
|
|||||||||||||||||||||||
|
Gas
|
1,838
|
|
1,874
|
|
1,069
|
|
2,667
|
|
2,864
|
|
1,902
|
|
|||||||||||
|
Purchased power:
|
|||||||||||||||||||||||
|
Nuclear
|
3,444
|
|
3,741
|
|
3,133
|
|
N/A
|
|
N/A
|
|
N/A
|
|
|||||||||||
|
Wind (c)
|
635
|
|
757
|
|
798
|
|
444
|
|
433
|
|
454
|
|
|||||||||||
|
Other (c)
|
4,267
|
|
3,015
|
|
3,802
|
|
4,645
|
|
3,660
|
|
4,272
|
|
|||||||||||
|
Wind (c)
|
630
|
|
653
|
|
622
|
|
752
|
|
788
|
|
768
|
|
|||||||||||
|
Coal
|
5,598
|
|
6,263
|
|
7,092
|
|
5,421
|
|
6,777
|
|
6,726
|
|
|||||||||||
|
Other (c)
|
6
|
|
5
|
|
12
|
|
222
|
|
184
|
|
200
|
|
|||||||||||
|
Total
|
16,418
|
|
16,308
|
|
16,528
|
|
14,151
|
|
14,706
|
|
14,322
|
|
|||||||||||
|
Revenue per KWh sold to retail customers (cents)
|
9.93
|
|
9.51
|
|
9.26
|
|
10.38
|
|
10.08
|
|
9.71
|
|
|||||||||||
|
(a)
|
In 2015, IPL sold its electric distribution assets in Minnesota to Southern Minnesota Energy Cooperative. At the date of the sale, IPL had approximately 42,000 retail electric customers in Minnesota. Prior to the asset sale, the electric sales to these retail customers are included in IPL’s residential, commercial and industrial retail sales. Subsequent to the asset sale, the related electric sales are included in IPL’s wholesale electric sales pursuant to a wholesale power supply agreement between IPL and Southern Minnesota Energy Cooperative, which is discussed in
Note 3
.
|
|
(b)
|
Cooling degree days are calculated using a simple average of the high and low temperatures each day compared to a 65 degree base. Normal degree days are calculated using a rolling 20-year average of historical cooling degree days. Refer to “
Gas Utility Operations
” below for details of heating degree days.
|
|
(c)
|
All or some of the renewable energy attributes associated with generation from these sources may be used in future years to comply with renewable energy standards or other regulatory requirements, or sold to third parties in the form of renewable energy credits or other environmental commodities.
|
13
2) GAS UTILITY OPERATIONS
General
-
Gas utility operations represent the second largest operating segment for Alliant Energy, IPL and WPL. Alliant Energy’s gas utility operations are located in the Midwest with IPL providing gas service in Iowa and WPL providing gas service in Wisconsin. Refer to the “
Gas Operating Information
” tables for additional details regarding gas utility operations. Refer to
Note 1(g)
for information relating to utility natural gas cost recovery mechanisms and
Note 16(b)
for discussion of natural gas commitments.
Customers
-
IPL and WPL provide gas utility service to a diversified base of retail customers and industries, including research, education, hospitality, manufacturing and chemicals (including ethanol). In addition, IPL and WPL provide transportation service to commercial and industrial customers by moving customer-owned gas through Alliant Energy’s distribution systems to the customers’ meters.
Seasonality
-
Gas sales follow a seasonal pattern with an annual base-load of gas and a large heating peak occurring during the winter season. Natural gas obtained from producers, marketers and brokers, as well as gas in storage, is utilized to meet the peak heating season requirements. Storage contracts generally allow IPL and WPL to purchase gas in the summer and inject it into underground storage fields, and remove it from storage fields in the winter to deliver to customers. Refer to the “
Gas Operating Information
” tables for details regarding maximum daily winter peak demands.
Competition
-
Gas customers in Iowa and Wisconsin currently do not have the ability to choose their gas distributor, and IPL and WPL have obligations to serve all their gas customers. While the gas utility distribution function is expected to remain a regulated function, sales of the natural gas commodity and related services are subject to competition from third-parties who provide alternative fuel sources (e.g. propane). However, when natural gas service is available for a given area, customers in such area have generally selected natural gas over propane as a more cost competitive solution for their fuel needs. Alliant Energy, IPL and WPL are also currently extending various gas distribution systems in their existing Iowa and Wisconsin service territories to serve new customer demand. Refer to “
Strategic Overview
” in MDA for further discussion of gas distribution systems, as well as discussion of the growth element of Alliant Energy’s strategic plan, which includes accelerating the growth of customers’ gas usage.
Gas Supply
-
IPL and WPL maintain purchase agreements with over 70 suppliers of natural gas from various gas producing regions of the U.S. and Canada. In providing gas commodity service to retail customers, Corporate Services administers a diversified portfolio of transportation and storage contracts on behalf of IPL and WPL. The tariffs for IPL’s and WPL’s retail gas customers provide for subsequent adjustments to their rates for the cost of gas sold to these customers. As a result, natural gas prices do not have a material impact on IPL’s or WPL’s gas margins.
Gas Demand Planning Reserve Margin -
IPL and WPL are required to maintain adequate pipeline capacity to ensure they meet their customers’ maximum daily system demand requirements. IPL and WPL currently have planning reserve margins of 4% and 5%, respectively, above their forecasted maximum daily system demand requirements from November 2016 through March 2017.
Gas Environmental Matters
-
Refer to
Note 16(e)
and “
Environmental Matters
” in MDA for discussion of gas environmental matters.
14
|
Gas Operating Information - Alliant Energy
|
2016
|
2015
|
2014
|
||||||||
|
Operating Revenues (in millions):
|
|||||||||||
|
Residential (a)
|
|
$197.6
|
|
|
$215.1
|
|
|
$287.5
|
|
||
|
Commercial (a)
|
109.6
|
|
120.5
|
|
172.8
|
|
|||||
|
Industrial (a)
|
15.2
|
|
14.3
|
|
23.4
|
|
|||||
|
Retail subtotal (a)
|
322.4
|
|
349.9
|
|
483.7
|
|
|||||
|
Transportation/other
|
33.0
|
|
31.3
|
|
33.8
|
|
|||||
|
Total
|
|
$355.4
|
|
|
$381.2
|
|
|
$517.5
|
|
||
|
Gas Sales (000s Dths):
|
|||||||||||
|
Residential (a)
|
25,571
|
|
26,672
|
|
31,718
|
|
|||||
|
Commercial (a)
|
18,820
|
|
18,966
|
|
23,301
|
|
|||||
|
Industrial (a)
|
3,352
|
|
2,997
|
|
3,710
|
|
|||||
|
Retail subtotal (a)
|
47,743
|
|
48,635
|
|
58,729
|
|
|||||
|
Transportation/other
|
77,485
|
|
74,162
|
|
64,717
|
|
|||||
|
Total
|
125,228
|
|
122,797
|
|
123,446
|
|
|||||
|
Retail Customers at End of Period (a):
|
|||||||||||
|
Residential
|
366,786
|
|
364,415
|
|
373,319
|
|
|||||
|
Commercial
|
44,587
|
|
44,613
|
|
46,180
|
|
|||||
|
Industrial
|
385
|
|
377
|
|
428
|
|
|||||
|
Total
|
411,758
|
|
409,405
|
|
419,927
|
|
|||||
|
Other Selected Gas Data:
|
|||||||||||
|
Heating degree days (b):
|
|||||||||||
|
Cedar Rapids, Iowa (IPL) (normal - 6,798)
|
5,933
|
|
6,300
|
|
7,657
|
|
|||||
|
Madison, Wisconsin (WPL) (normal - 7,082)
|
6,420
|
|
6,667
|
|
7,884
|
|
|||||
|
Revenue per Dth sold to retail customers
|
|
$6.75
|
|
|
$7.19
|
|
|
$8.24
|
|
||
|
Purchased gas costs per Dth sold to retail customers
|
|
$3.99
|
|
|
$4.40
|
|
|
$5.52
|
|
||
|
Gas Operating Information
|
IPL
|
WPL
|
|||||||||||||||||||||
|
2016
|
2015
|
2014
|
2016
|
2015
|
2014
|
||||||||||||||||||
|
Operating Revenues (in millions):
|
|||||||||||||||||||||||
|
Residential (a)
|
|
$110.6
|
|
|
$120.0
|
|
|
$162.5
|
|
|
$87.0
|
|
|
$95.1
|
|
|
$125.0
|
|
|||||
|
Commercial (a)
|
61.9
|
|
67.9
|
|
96.1
|
|
47.7
|
|
52.6
|
|
76.7
|
|
|||||||||||
|
Industrial (a)
|
10.6
|
|
10.5
|
|
17.4
|
|
4.6
|
|
3.8
|
|
6.0
|
|
|||||||||||
|
Retail subtotal (a)
|
183.1
|
|
198.4
|
|
276.0
|
|
139.3
|
|
151.5
|
|
207.7
|
|
|||||||||||
|
Transportation/other
|
20.9
|
|
18.9
|
|
20.5
|
|
12.1
|
|
12.4
|
|
13.3
|
|
|||||||||||
|
Total
|
|
$204.0
|
|
|
$217.3
|
|
|
$296.5
|
|
|
$151.4
|
|
|
$163.9
|
|
|
$221.0
|
|
|||||
|
Gas Sales (000s Dths):
|
|||||||||||||||||||||||
|
Residential (a)
|
13,788
|
|
14,472
|
|
17,839
|
|
11,783
|
|
12,200
|
|
13,879
|
|
|||||||||||
|
Commercial (a)
|
10,143
|
|
10,166
|
|
12,641
|
|
8,677
|
|
8,800
|
|
10,660
|
|
|||||||||||
|
Industrial (a)
|
2,299
|
|
2,239
|
|
2,804
|
|
1,053
|
|
758
|
|
906
|
|
|||||||||||
|
Retail subtotal (a)
|
26,230
|
|
26,877
|
|
33,284
|
|
21,513
|
|
21,758
|
|
25,445
|
|
|||||||||||
|
Transportation/other
|
37,158
|
|
34,129
|
|
31,377
|
|
40,327
|
|
40,033
|
|
33,340
|
|
|||||||||||
|
Total
|
63,388
|
|
61,006
|
|
64,661
|
|
61,840
|
|
61,791
|
|
58,785
|
|
|||||||||||
|
Retail Customers at End of Period (a):
|
|||||||||||||||||||||||
|
Residential
|
199,326
|
|
199,408
|
|
208,240
|
|
167,460
|
|
165,007
|
|
165,079
|
|
|||||||||||
|
Commercial
|
24,882
|
|
25,289
|
|
26,530
|
|
19,705
|
|
19,324
|
|
19,650
|
|
|||||||||||
|
Industrial
|
212
|
|
217
|
|
244
|
|
173
|
|
160
|
|
184
|
|
|||||||||||
|
Total
|
224,420
|
|
224,914
|
|
235,014
|
|
187,338
|
|
184,491
|
|
184,913
|
|
|||||||||||
|
Other Selected Gas Data:
|
|||||||||||||||||||||||
|
Maximum daily winter peak demand (Dth)
|
262,409
|
|
267,314
|
|
296,190
|
|
203,655
|
|
209,289
|
|
234,837
|
|
|||||||||||
|
Heating degree days (b):
|
|||||||||||||||||||||||
|
Cedar Rapids, Iowa (IPL) (normal - 6,798)
|
5,933
|
|
6,300
|
|
7,657
|
|
N/A
|
|
N/A
|
|
N/A
|
|
|||||||||||
|
Madison, Wisconsin (WPL) (normal - 7,082)
|
N/A
|
|
N/A
|
|
N/A
|
|
6,420
|
|
6,667
|
|
7,884
|
|
|||||||||||
|
Revenue per Dth sold to retail customers
|
|
$6.98
|
|
|
$7.38
|
|
|
$8.29
|
|
|
$6.48
|
|
|
$6.96
|
|
|
$8.16
|
|
|||||
|
Purchased gas cost per Dth sold to retail customers
|
|
$4.21
|
|
|
$4.53
|
|
|
$5.54
|
|
|
$3.72
|
|
|
$4.25
|
|
|
$5.48
|
|
|||||
|
(a)
|
In April 2015, IPL sold its natural gas distribution assets in Minnesota. At the date of the sale, IPL had approximately 11,000 retail gas customers in Minnesota.
|
|
(b)
|
Heating degree days are calculated using a simple average of the high and low temperatures each day compared to a 65 degree base. Normal degree days are calculated using a rolling 20-year average of historical heating degree days.
|
15
3) OTHER UTILITY OPERATIONS - STEAM -
IPL’s Prairie Creek facility is the primary source of steam for IPL’s two high-pressure steam customers. These customers are each under contract through 2025 for minimum quantities of annual steam usage, with certain conditions.
D. INFORMATION RELATING TO NON-REGULATED OPERATIONS
AEF
manages a portfolio of wholly-owned subsidiaries and additional investments through the following distinct platforms:
Non-regulated Generation -
owns Sheboygan Falls, a
347
MW, simple-cycle, natural gas-fired EGU near Sheboygan Falls, Wisconsin, which is leased to WPL for an initial period of 20 years ending in 2025, and the
99
MW Franklin County wind farm in Franklin County, Iowa. In February 2017, FERC issued an order approving the transfer of the Franklin County wind farm from AEF to IPL. Alliant Energy and IPL currently expect to complete this transfer in 2017.
Transportation -
includes a short-line railway that provides freight service between Cedar Rapids, Iowa and Iowa City, Iowa; a barge terminal and hauling services on the Mississippi River; and other transfer and storage services.
Other non-regulated investments -
includes ATI, which currently holds all of Alliant Energy’s investment in ATC, and several other modest investments.
You should carefully consider each of the risks described below relating to Alliant Energy, IPL and WPL, together with all of the other information contained in this combined Annual Report on Form 10-K, before making an investment decision with respect to our securities. If any of the following risks develop into actual events, our business, financial condition or results of operations could be materially and adversely affected and you may lose all or part of your investment.
Our business is significantly impacted by government legislation, regulation and oversight
-
We are subject to extensive regulation by federal and state regulatory authorities, which significantly influences our operations and our ability to timely recover costs from customers and earn appropriate rates of return. Regulatory authorities with jurisdiction over public utilities, including the IUB, the PSCW and FERC, regulate many aspects of our operations. We are also subject to oversight and monitoring by organizations such as the North American Electric Reliability Corporation, the Pipeline and Hazardous Materials Safety Administration, and the Midcontinent Independent System Operator, Inc. The impacts on our operations include: the amount and timing of changes to rates charged to our customers; authorized rates of return of IPL, WPL and ATC; our ability to site and construct new generating facilities and recover such costs, such as the natural gas-fired generating facilities in Marshalltown, Iowa and Beloit, Wisconsin, and renewable energy projects; the installation of environmental controls and the recovery of associated costs; our ability to decommission generating facilities and recover such costs and the remaining carrying value of these facilities; our ability to site, construct and recover costs for new natural gas pipelines; our ability to recover costs to upgrade our gas transmission and distribution systems to comply with the anticipated Pipeline and Hazardous Materials Safety Administration requirements that have not yet been finalized; the amount of certain sources of energy we must use, such as renewable sources; our ability to purchase generating facilities and recover the costs associated therewith; our ability to sell utility assets and any conditions placed upon the sale of such assets; the rates paid to transmission operators and how those costs are recovered from customers; our ability to enter into purchased power agreements and recover the costs associated therewith; resource adequacy requirements, energy capacity standards, what forms of energy are considered when determining whether we meet those standards, and when new facilities such as IPL’s Marshalltown Generating Station, WPL’s Riverside Energy Center expansion and IPL’s and WPL’s planned additional wind generation may be fully accredited with energy capacity; the allocation of expenditures by transmission companies on transmission network upgrades and our ability to recover costs associated therewith; reliability; safety; the issuance of securities; accounting matters; and transactions between affiliates. Failure to obtain approvals for any of these matters in a timely manner, or receiving approvals with uneconomical conditions may adversely impact our ability to achieve our strategic plan, cause us to record an impairment of our assets, and/or have a material adverse impact on our financial condition and results of operations.
These regulatory authorities and organizations are also empowered to impose financial penalties and other sanctions, including requirements to implement new compliance programs, which could increase our costs of compliance and may adversely impact our financial condition and results of operations.
Our utility financial condition is influenced by how regulatory authorities establish the rates we can charge our customers, our authorized rates of return and common equity levels, and the amount of deferred costs that may be recovered from customers. Our ability to timely obtain rate adjustments to earn authorized rates of return depends upon timely regulatory
16
action under applicable statutes and regulations, and cannot be guaranteed. In future rate cases, IPL and WPL may not receive an adequate amount of rate relief to recover all costs and earn their authorized rates of return, rates may be reduced, rate refunds may be required, rate adjustments may not be approved on a timely basis, costs may not be otherwise recovered through rates, future rates may be temporarily frozen, and authorized rates of return on capital may be reduced. As a result, we may experience adverse impacts on our financial condition and results of operations.
We are subject to a wide variety of periodically changing statutes, regulations and rules for energy market operations, grid management and reliability. State and federal election results may serve as a catalyst for legislative and regulatory changes. Changes in statutes, regulations and rules or the imposition of additional regulations and rules may increase our costs or change our business operations or plans, which may have an adverse impact on our financial condition and results of operations.
Provisions of the Wisconsin Utility Holding Company Act limit our ability to invest in non-utility activities. Takeover attempts by potential purchasers who might be willing to pay a premium for our stock are also limited by certain provisions of the Wisconsin Utility Holding Company Act and the delays and conditions that generally result from the requirement that regulatory authorities approve such a transaction. Change driven by technology and evolving customer expectations, intentional or inadvertent policy changes could impact all of our business model competitiveness and accordingly our financial results.
Construction projects are subject to delays and cost increases that may not be recovered from customers -
Our strategic plan includes constructing natural gas-fired generating facilities, constructing renewable generating facilities, installing environmental control equipment at our newer and more efficient coal-fired generating facilities, and making other large-scale improvements to such generating facilities, and large-scale additions and upgrades to our electric and gas distribution systems. These construction projects are subject to various risks that could cause costs to increase or cause delays in completion. These risks include changes in costs of materials, equipment, commodities, fuel or labor; shortages in materials, equipment and qualified labor; changes to the scope or timing of the projects; general contractors or subcontractors not performing as required under their contracts; the inability to agree to contract terms or disputes in contract terms; poor initial cost estimates; work stoppages; adverse weather conditions; the inability to obtain necessary permits in a timely manner; adverse interpretation or enforcement of permit conditions; changes in applicable laws or regulations; governmental actions; legal action; unforeseen engineering or technology issues; limited access to capital; and other adverse economic conditions. We may not be able to recover all costs for the projects in rates and face increased risk of potential impairment of our project investment if a construction project is not completed or is delayed, or final costs exceed expectations or the costs approved by our regulators, for example, if IPL’s Marshalltown Generating Station or expansion of wind generation exceeds the respective cost cap approved by the IUB. Inability to recover costs, or inability to complete the project in a timely manner, could adversely impact our financial condition and results of operations.
Demand for energy may decrease -
Our results of operations are affected by the demand for energy in our service territories. We could lose customers, and therefore see lower demand for energy, due to economic conditions, customers constructing their own generation facilities, higher costs and rates charged to customers, or loss of service territory or franchises. Communities in our service territory have considered municipalization of both electric and gas systems, which, if successful, could reduce the number of customers we serve, reducing the demand for our energy. Further, the energy conservation and technological advances that increase energy efficiency may temporarily or permanently reduce the demand for energy products. In addition, state and/or federal regulations require mandatory conservation measures, which would reduce the demand for energy. We may lose wholesale customers in addition to Jo-Carroll Energy, Inc., WPPI Energy and Great Lakes Utilities who have provided us notice of their intent to terminate their wholesale power supply agreements. Continuing technology improvements, tax incentives, regulatory developments and customer concern regarding their environmental and carbon footprint are making customer- and third party-owned generation technologies such as solar systems, wind turbines, microturbines and battery storage systems more cost effective, attractive and feasible for more of our customers. As more customers utilize their own generation, demand for energy from us may decline and negatively impact the affordability of our services for remaining customers. Future economic growth may not create enough growth for us to replace the lost energy demand from these customers. The loss of sales due to lower demand for energy may cause our rates to increase for remaining customers, as our rates must cover our fixed costs. The loss of customers, the inability to replace those customers with new customers, and the decrease in demand for energy could negatively impact our financial condition and results of operations.
Regional and national economic conditions could have an unfavorable impact on us -
Our utility and non-regulated businesses follow the economic cycles of the customers we serve and credit risk of counterparties we do business with. Adverse economic conditions in our service territories can adversely affect the financial condition of our customers and
17
reduce their demand for electricity and natural gas. Reduced volumes of electricity and natural gas sold, or the inability to collect unpaid bills from our customers due to deterioration in national or regional economic conditions, could adversely impact our financial condition and results of operations.
Our operating results may fluctuate on a seasonal and quarterly basis and can be adversely affected by the impacts of weather -
Our electric and gas utilities are seasonal businesses and temperature patterns can have a material impact on their operating performance. Demand for electricity is greater in the summer months associated with higher air conditioning needs. In addition, market prices for electricity generally peak in the summer due to the higher demand. Conversely, demand for natural gas depends significantly upon temperature patterns in winter months due to heavy use in residential and commercial heating. As a result, our overall operating results in the future may fluctuate substantially on a seasonal basis. In addition, we have historically generated less revenues and income when temperatures are warmer in the winter and/or cooler in the summer. Thus, unusually mild winters and/or summers could have an adverse effect on our financial condition and results of operations.
We are subject to numerous environmental laws and regulations, compliance with which could be difficult and costly, and pursuant to which we could incur material liabilities -
We are subject to environmental laws and regulations that affect many aspects of our past, present and future operations. The environmental laws and regulations govern air emissions, ambient air quality standards, water quality, cooling water intake structures, wastewater discharges, the generation, transport and disposal of coal combustion residuals and other solid wastes and hazardous substances, clean-up of contaminated sites, and protection of natural resources and wildlife. These laws and regulations require us to obtain and comply with a wide variety of environmental registrations, licenses, permits, inspections and other approvals, which are subject to renewal proceedings and legal challenges. Environmental laws and regulations can also require us to restrict or limit the output of certain facilities or to combust certain fuels, to install environmental controls and implement operational practices at our facilities, manage generation system dispatch within emissions limitations and constraints, clean up spills and correct environmental hazards and other contamination. We may be required to pay all or a portion of the costs to remediate (i.e., clean-up) sites where our past activities, or the activities of certain other parties, caused environmental contamination, including lakebeds, sites of manufactured gas plants operated by our predecessors and sites where asbestos was used in the past. Compliance with these regulations can significantly increase capital spending, operating costs and plant down-times, and can negatively affect the affordability of our services for customers. We cannot predict with certainty the amount and timing of all future expenditures (including the potential or magnitude of any fines or penalties, as well as the severity of any restriction on our operations) necessary to comply with, or as a result of liabilities under, these environmental laws and regulations, although we expect the expenditures to be material.
We are subject to Consent Decrees between each of IPL and WPL and various environmental agencies and organizations, which resolved environmental claims related to air emissions at certain coal-fired generating facilities. The Consent Decrees require construction of specific environmental controls equipment, establish emission rate limits, require retirement or fuel switching of certain facilities, and require IPL and WPL to complete certain environmental mitigation projects.
Although we believe we comply in all material respects with currently applicable environmental laws, regulations, and the Consent Decrees, we may be subject to regulatory enforcement action by state or federal agencies should we operate out of compliance. In some instances, complying with certain environmental regulations may not be sufficient to satisfy the obligations of the Consent Decrees or other operating regulations discussed earlier. In addition, citizen groups and private individuals may bring legal action against regulatory agencies or bring citizen enforcement actions against us claiming that the environmental requirements are not being sufficiently enforced by regulatory agencies. For example, the Consent Decrees resulted from allegations originally raised by the Sierra Club that IPL and WPL violated various provisions of the Clean Air Act. If we are unsuccessful defending or settling such litigation by governmental agencies, citizen groups, or individuals, we could be subject to restrictions or prohibitions on operating our generating facilities, costly upgrades to our generating facilities, payment of damages or fines, requirements to complete other beneficial environmental projects, and litigation costs, all of which could be material. An adverse result in such legal actions could have a material adverse impact on our financial condition and results of operations. In addition, we may also be subject to third party environmental claims relating to property damage or personal injury that arise from our operations.
We are subject to existing and potential future governmental mandates to provide customers with renewable energy and energy conservation offerings. These mandates are designed in part to mitigate the potential environmental impacts of utility operations. Failure to meet the requirements of these mandates may result in fines or penalties, which could have a material adverse effect on our results of operations. If our regulators do not allow us to recover all or a part of the costs incurred to comply with the mandates, it could have a material adverse effect on our results of operations.
18
Existing environmental laws or regulations may be revised and new laws or regulations seeking to protect the environment and natural resources may be adopted or become applicable to us. Areas in our service territories that are currently attainment areas under National Ambient Air Quality Standards could be designated as non-attainment areas due to new air monitoring results or more stringent air quality standards. These revised and new laws or regulations and any areas in our service territories designated as non-attainment may require regulation of hazardous air pollutants including mercury, nitrogen oxide, sulfur dioxide, carbon dioxide (CO2) and other greenhouse gases (GHG) emissions, particulate matter, coal ash and other coal combustion products, wastewater discharges, cooling water intake structures, and threatened, endangered or invasive species. Federal and state election results, such as the election of a new President of the U.S., may serve as a catalyst for regulatory changes. Such changes could materially increase our cost of compliance. Revision of existing environmental laws or regulations may cause: (1) state utility commissions to not approve our plans to install environmental controls at our existing generating facilities or not allow us to recover costs of such projects; (2) state utility commissions to not approve costs of emission allowances purchased to comply with environmental regulations that are no longer applicable to our operations; (3) co-owners in our jointly-owned facilities to not agree with our decision to move forward with and the timing of these projects; or (4) our current plans and/or past actions to not meet new requirements. These outcomes could have a material adverse effect on our financial condition and results of operations.
Actions related to global climate change and reducing GHG emissions could negatively impact us -
The primary GHG emitted from our utility operations is CO2 from combustion of fossil fuels at our electric generating facilities, which are primarily fossil-fueled facilities. We could incur costs or other obligations to comply with any GHG regulations that are adopted in the future, and could become the target of legal claims or challenges, because generating electricity using fossil fuels emits CO2 and other GHGs. Further, investors may determine that we are too reliant on fossil fuels and not buy shares of our common stock, or sell shares of our common stock, which may cause our stock price to decrease. In 2013, a series of actions were announced to reduce carbon emissions, prepare the U.S. for the impacts of climate change, and lead international efforts to address climate change. In 2015, the U.S. joined the Paris Agreement, a global agreement that commits participating countries to setting nationally determined climate targets to reduce GHG emissions and establishes a framework for reporting progress towards achieving these goals.
The EPA has proposed and adopted regulations governing GHG emissions that are expected to impact our operations. In 2015, the EPA published regulations governing GHG emissions from new generating facilities, which would impact IPL’s Marshalltown Generating Station in Iowa and WPL’s Riverside Energy Center expansion in Wisconsin. In 2015, the EPA published regulations under Clean Air Act Section 111(d) to reduce CO2 emissions from existing fossil-fueled electric generating facilities, otherwise known as the Clean Power Plan. These EPA regulations are based on broad measures to lower CO2 emissions, which could impact the dispatch of existing fossil-fueled generating facilities and the fuel mix used to generate electricity, and require other actions in order to achieve CO2 emission reduction goals including fossil-fueled generating unit heat rate improvements, expansion of renewable energy resources and demand-side energy efficiency measures. The EPA’s GHG regulations are currently subject to litigation, and the new presidential administration may change or repeal the regulations, making the final form of the GHG emissions regulations uncertain. As a result of this uncertainty, strategies to comply with the regulations, including available control technologies or other allowed compliance measures, are unpredictable and we cannot provide any assurance regarding the potential impacts these regulations would have on our operations. The impacts of these regulations could have a material adverse impact on our financial condition and results of operations.
Threats of terrorism and catastrophic events that could result from terrorism may impact our operations in unpredictable ways -
We are subject to direct and indirect effects of terrorist threats and activities. Generation, transmission and distribution facilities, in general, have been identified as potential targets of physical or cyber attacks. Physical attacks on transmission and distribution facilities that appeared to be terrorist-style attacks have occurred. The risks posed by such attacks could include, among other things, the inability to generate, purchase or distribute electric energy or obtain fuel sources, the increased cost of security and insurance, the disruption of, volatility in, or other effects on capital markets, and a decline in the economy within our service territories, all of which could adversely impact our financial condition and results of operations. In addition, the cost of repairing damage to our facilities and infrastructure due to acts of terrorism, and the loss of revenue if such events prevent us from providing utility service to our customers, could adversely impact our financial condition and results of operations.
A cyber attack may disrupt our operations or lead to a loss or misuse of confidential and proprietary information or potential liability -
We operate in an industry that requires the continuous use and operation of sophisticated information technology systems and network infrastructure. Cyber attacks targeting our electronic control systems used at our generating facilities and for electric and gas distribution systems, such as allegedly occurred in Ukraine, could result in a full or partial disruption of our electric and/or gas operations. Any disruption of these operations could result in a loss of service to
19
customers and a significant decrease in revenues, as well as significant expense to repair system damage and remedy security breaches. We have instituted certain safeguards to protect our operational systems and information technology assets, which may not always be effective due to the evolving nature of cyber attacks and cyber security. We cannot guarantee that such protections will be completely successful in the event of a cyber attack. If the technology systems were to fail or be breached by a cyber attack or a computer virus, and not be recovered in a timely fashion, we may be unable to fulfill critical business functions and confidential data could be compromised, adversely impacting our financial condition and results of operation.
In addition, in the ordinary course of business, we collect and retain sensitive information including personal information about our customers, shareowners and employees. In some cases, we outsource administration of certain functions to vendors that could be targets of cyber attacks. For example, we outsource administration of our employee health insurance to Anthem. Anthem was the target of a cyber attack in 2014. Any theft, loss and/or fraudulent use of customer, shareowner, employee or proprietary data as a result of a cyber attack could subject us to significant litigation, liability and costs, as well as adversely impact our reputation with customers and regulators, among others.
We may not be able to fully recover costs related to commodity prices -
The prices that we may obtain for electric sales may not compensate for changes in delivered natural gas, coal or electric energy spot-market costs, or changes in the relationship between such costs and the market prices of electric energy. As a result, we may be unable to pass on the changes in costs to our customers, especially at WPL where we do not have a retail electric automatic fuel cost adjustment clause, which would allow for more consistent and timely cost recovery.
We are exposed to changes in the price and availability of natural gas. In addition to supplying natural gas to our natural gas customers, we also have responsibility to supply natural gas to certain natural gas-fired electric generating facilities that we own. Our strategic plan includes increasing our reliance on natural-gas fired electric generating facilities, particularly the new facilities planned in Marshalltown, Iowa and Beloit, Wisconsin, and coal-fired facilities expected to switch from coal to natural gas as the primary fuel type. This increases our exposure to market prices of natural gas, which have remained low recently, but have been volatile in the past. We have natural gas supply contracts in place, which are either fixed price in nature or market-based. As some of the contracts are market-based, and some of the contracts are short-term, we may not be able to purchase natural gas with terms and prices as favorable as the current contracts. Natural gas prices may increase due to disruption of production or transportation of natural gas, failure to drill new wells and reduced supply generally, or regulatory developments that increase the cost of natural gas extraction methods, including fracking. Price increases may cause us to incur additional costs to purchase natural gas, which may not be fully recovered through rates and may adversely impact our financial condition and results of operations.
We are exposed to changes in the price and availability of coal. We have contracts of varying durations for the supply and transportation of coal for most of our generating capability, but as these contracts end or otherwise are not honored, we may not be able to purchase coal on terms as favorable as the current contracts. Further, we currently rely on coal primarily from the Powder River Basin in Wyoming and any disruption of coal production in, or transportation from, that region, including due to bankruptcy of coal mining companies, may cause us to incur additional costs which may not be fully recovered through rates. Increases in prices and costs due to disruptions that are not fully and timely recovered in rates may adversely affect our financial condition and results of operations.
We may not be able to fully recover higher transmission costs related to changing transmission reliability requirements -
Both IPL and WPL pay for the use of the interstate electric transmission system that they do not own or control. Rates charged to IPL and WPL for such transmission service are regulated by FERC. FERC also regulates transmission owners’ operations in order to support the reliability of the transmission network. Changes are occurring in the transmission network, which are necessary to, among other things, accommodate renewable energy and the decommissioning of older coal-fired generating facilities and prepare for potential compliance with future GHG regulations. These changes include socializing certain transmission network upgrades and system support resource payments, which may increase transmission costs to IPL and WPL. The prices that IPL and WPL charge for electric energy may not totally compensate for the increase in such transmission costs. We may not be able to fully or timely pass on the increases in such transmission costs to our customers. In addition, if the transmission cost rider at IPL or escrow accounting treatment of transmission costs at WPL are amended or removed, we may not be able to fully recover transmission costs. Inability to fully recover transmission costs in a timely manner may adversely impact our financial condition and results of operations.
We are dependent on the capital markets and could be negatively impacted by disruptions in the capital markets -
Successful implementation of our strategic plan is dependent upon our ability to access the capital markets under competitive terms and rates. We have forecasted capital expenditures of approximately $6 billion over the next four years. Disruption, uncertainty or volatility in those markets could increase our cost of capital or limit the availability of capital. Disruptions
20
could be caused by Federal Reserve policies and actions, currency concerns, economic downturn or uncertainty, monetary policies, a negative view of the utility industry or our company, failures of financial institutions, U.S. debt management concerns, U.S. debt limit and budget debates including government shutdowns, European and worldwide sovereign debt concerns, other global or geopolitical events, or other factors. Any disruptions could adversely impact our ability to implement our strategic plan.
We rely on our strong credit ratings to access the credit markets. If our credit ratings are downgraded for any reason, we could pay higher interest rates in future financings, the pool of potential lenders could be reduced, borrowing costs under existing credit facilities could increase, our access to the commercial paper market could be limited, or we could be required to provide additional credit assurance, including cash collateral, to contract counterparties. If our access to capital were to become significantly constrained or costs of capital increased significantly due to lowered credit ratings, prevailing industry conditions, regulatory constraints, the volatility of the capital markets or other factors, our financial condition and results of operations could be adversely affected.
We are subject to employee workforce factors that could affect our businesses -
We operate in an industry that requires many of our employees to possess specialized technical skills. Many of our employees with these specialized skills are nearing retirement. It may be difficult to hire and retain replacements due to labor market conditions, the length of time needed to acquire the skills, and general competition for talent. We are also subject to collective bargaining agreements with approximately 2,200 employees. Any work stoppage experienced in connection with negotiations of collective bargaining agreements could adversely affect our financial condition and results of operations as well as our ability to implement our strategic plan.
We face risks associated with operating electric and natural gas infrastructure -
The operation of electric generating facilities involves many risks, including start-up risks, breakdown or failure of equipment, failure of generating facilities including wind turbines, the dependence on a specific fuel source, including the supply and transportation of fuel, the risk of performance below expected or contracted levels of output or efficiency, employee safety, operator error and compliance with mandatory reliability standards. The operation of our energy delivery infrastructure involves many risks, including breakdown or failure of equipment and fires developing from our power lines. In addition, the North American transmission grid is highly interconnected and, in extraordinary circumstances, disruptions at particular points within the grid could cause an extensive power outage in our delivery systems. Increased utilization of customer- and third party-owned generation technologies could disrupt the reliability and balance of the electricity grid. Further, the transmission system in our utilities’ service territories is constrained, limiting the ability to transmit electric energy within our service territories. The transmission constraints could result in an inability to deliver energy from generating facilities, particularly wind generating facilities, to the national grid, or to access lower cost sources of electric energy. We also have obligations to provide electric service under regulatory requirements and contractual commitments. Failure to meet our service obligations could adversely impact our financial condition and results of operations.
The operation of our gas transmission and distribution infrastructure also involves many risks, such as leaks, explosions, mechanical problems and employee safety, which could cause substantial financial losses. These risks could result in loss of human life, significant damage to property, environmental emissions, impairment of our operations and substantial losses to us. We are also responsible for compliance with new and changing mandatory reliability and safety standards, including anticipated new regulations under the Pipeline and Hazardous Materials Safety Administration. Our infrastructure is aging, which could impact safety and compliance with possible new regulations. Failure to meet these standards could result in substantial fines. Electric and gas infrastructure operations could be impacted by future compliance with the Clean Power Plan. We also have obligations to provide service under regulatory requirements and contractual commitments. Failure to meet our service obligations could adversely impact our financial condition and results of operations.
We face risks associated with integration of a new customer billing and information system -
We implemented a new customer billing and information system for IPL and WPL, which was completed in 2016. This new customer billing and information system houses all customer records, and processes metering, billing and payment transactions. Integrating a new customer system is complex, costly and time consuming. If the system and related processes do not operate as intended, it could result in substantial disruptions to our business, including customer billings and collections, which could have a material adverse effect on our financial condition and results of operations.
Storms or other natural disasters may impact our operations in unpredictable ways -
Storms and other natural disasters, including events such as floods, tornadoes, blizzards, ice storms, droughts, solar flares or pandemics may adversely impact our ability to generate, purchase or distribute electric energy or obtain fuel or other critical supplies. We incur costs for preventive measures to replace, reinforce and modernize operating infrastructure that will provide for further grid resiliency.
21
In addition, we could incur large costs to repair damage to our generating facilities and infrastructure, or costs related to environmental remediation, due to storms or natural disasters. Severe storms may also impact our natural gas infrastructure. The restoration costs may not be fully covered by insurance policies. Some costs may not be recovered in rates or through insurance, including damaged assets, or there could be significant delays in cost recovery. Storms and natural disasters may prevent our customers from being able to operate or may significantly slow growth or cause a decline in the economy within our service territories. The reduced demand for energy could cause lower sales and revenues, which may not be replaced or recovered in rates. Any of these items could adversely affect our financial condition and results of operations.
We may incur material post-closing adjustments related to past asset and business divestitures -
We have sold certain non-regulated subsidiaries such as RMT, Inc. (RMT) and Whiting Petroleum Corporation (Whiting Petroleum), as well as regulated assets such as our Minnesota electric and natural gas distribution assets. We may continue to incur liabilities relating to our previous ownership of, or the transactions pursuant to which we disposed of, these subsidiaries and assets. For example, Alliant Energy continues to guarantee RMT’s performance obligations related to certain of RMT’s projects that were commenced prior to Alliant Energy’s sale of RMT. In addition, Alliant Energy Resources, LLC, as the successor to a predecessor entity that owned Whiting Petroleum and a wholly-owned subsidiary of Alliant Energy Finance, LLC, continues to guarantee the partnership obligations of an affiliate of Whiting Petroleum under general partnership agreements in the oil and gas industry, including liabilities with respect to the future abandonment of certain platforms off the coast of California and related onshore plant and equipment owned by the partnerships. Any potential liability under these guarantees may depend on a number of factors outside of our control, including the financial condition of RMT, Whiting Petroleum and/or their respective assignees. Any required payments on retained liabilities, guarantees or indemnification obligations with respect to RMT, Whiting Petroleum, the sales of our Minnesota electric and natural gas distribution assets, or other future asset or business divestitures, could have an adverse effect on our financial condition and results of operations.
We are subject to limitations on our ability to pay dividends -
Alliant Energy is a holding company with no significant operations of its own. Accordingly, the primary sources of funds for Alliant Energy to pay dividends to its shareowners are dividends and distributions from its subsidiaries, primarily its utility subsidiaries. Our subsidiaries are separate and distinct legal entities and have no obligation to pay any amounts to us, whether by dividends, distributions, loans or other payments. The ability of our subsidiaries to pay dividends or make distributions to us and, accordingly, our ability to pay dividends on Alliant Energy common stock will depend on regulatory limitations, earnings, cash flows, capital requirements and general financial condition of our subsidiaries. Our utilities have dividend payment restrictions based on the terms of any outstanding preferred stock and regulatory limitations applicable to them. If we do not receive adequate dividends and distributions from our subsidiaries, then we may not be able to make, or may have to reduce, dividend payments on Alliant Energy common stock.
Changes to certain tax elections, tax regulations and future taxable income could negatively impact our financial condition and results of operations -
We have significantly reduced our federal and state income tax obligations over the past few years through tax planning strategies and the extension of bonus depreciation deductions for certain expenditures for property. These tax planning strategies and extensions of bonus depreciation deductions have generated large annual taxable losses and tax credits over the past few years that have resulted in significant federal net operating losses and tax credit carryforwards. We plan to utilize these net operating losses and tax credit carryforwards in the future to reduce our income tax obligations. If we cannot generate enough taxable income in the future to utilize all of the net operating losses and tax credit carryforwards before they expire due to lower than expected financial performance or changes to tax regulations, we may incur material charges to earnings. If the IRS does not agree with the deductions resulting from our tax planning strategies or our position on the qualification of production tax credits from planned and potential wind generating facilities, our financial condition and results of operations may be adversely impacted.
Our utility business currently operates wind generating facilities, which generate production tax credits for us to use to reduce our federal tax obligations. The amount of production tax credits we earn is dependent on the level of electricity output generated by our wind farms and the applicable tax credit rate. A variety of operating and economic parameters, including significant transmission constraints, adverse weather conditions and breakdown or failure of equipment, could significantly reduce the production tax credits generated by our wind farms resulting in a material adverse impact on our financial condition and results of operations.
In addition, we have tax benefit riders in place in Iowa that provide billing credits to our customers. We have made certain assumptions regarding the timing of the tax benefit riders for accounting purposes. If those assumptions are not accurate, our results of operations and financial condition may be adversely impacted.
22
Also, if corporate tax rates or policies are changed with future federal or state legislation, we may be required to take material charges against earnings. For example, the new presidential administration has called for substantial change to fiscal and tax policies, which may include comprehensive tax reform. We are currently unable to determine what impacts these changes will have on our future financial condition or results of operations, including related impacts to IPL’s and WPL’s retail and wholesale electric and gas rates charged to their customers. However, it is possible that these changes could reduce corporate income tax rates, alter tax depreciation lives and methods, disallow deductions for net interest expense, and impede our ability to fully utilize our net operating loss and credit carryforwards.
Finally, FERC regulates utility income tax policies, including partnership tax policies, which impact our investment in ATC. FERC is currently investigating these income tax policies in addition to rate of return policies as a result of a recent court decision. The results of this investigation may lead to changes in FERC’s income tax policies, which would impact partnership entities, particularly our investment in ATC. We are currently unable to determine what impacts these potential changes will have on our future financial condition or results of operations, however, it is possible that a change could reduce Alliant Energy’s equity earnings and distributions from ATC.
Our pension and other postretirement benefits plans are subject to investment and interest rate risk that could negatively impact our financial condition -
We have pension and other postretirement benefits plans that provide benefits to many of our employees and retirees. Costs of providing benefits and related funding requirements of these plans are subject to changes in the market value of the assets that fund the plans. The funded status of the plans and the related costs reflected in our financial statements are affected by various factors, which are subject to an inherent degree of uncertainty, including economic conditions, financial market performance, interest rates, life expectancies and demographics. Recessions and volatility in the domestic and international financial markets have negatively affected the asset values of our pension plans at various times in the past. Poor investment returns or lower interest rates may necessitate accelerated funding of the plans to meet minimum federal government requirements, which could have an adverse impact on our financial condition and results of operations.
We face risks related to non-regulated operations -
We rely on our non-regulated operations for a portion of our earnings. If our non-regulated investments do not perform at expected levels, we could experience a material adverse impact on our financial condition and results of operations.
Energy industry changes could have a negative effect on our businesses -
We operate in a highly regulated business environment. The advent of new and unregulated markets has the potential to significantly impact our financial condition and results of operations. Competitive pressures, including advances in technology that reduce the costs of alternative methods of producing electric energy to a level that is competitive with that of current electric production methods, could result in our utilities losing market share and customers and incurring stranded costs (i.e., assets and other costs rendered unrecoverable through customer rates), which could be borne by our shareowners. Further, competitors may not be subject to the same operating, regulatory and financial requirements that we are, potentially causing a substantial competitive disadvantage for us. Changes in technology could also alter the channels through which electric customers buy or utilize power, which could reduce the revenues or increase the expenses of our utility companies. Increased competition from any restructuring efforts in our primary retail electric service territories may have a significant adverse impact on our financial condition and results of operations.
None.
Alliant Energy -
As a holding company, Alliant Energy doesn’t directly own any significant properties other than the stock of its subsidiaries. The principal properties of those subsidiaries are as follows:
23
IPL and WPL
Electric
- At
December 31, 2016
, IPL’s and WPL’s EGUs by primary fuel type were as follows:
|
IPL
|
Expected
|
Primary
|
Nameplate
|
Generating
|
||||||||
|
Retirement or
|
In-service
|
Dispatch
|
Capacity
|
Capacity
|
||||||||
|
Name of EGU and Location
|
Fuel Switch (a)
|
Dates
|
Type (b)
|
in MW
|
in MW (c)
|
|||||||
|
Emery Generating Station (Units 1-3); Mason City, IA
|
N/A
|
2004
|
IN
|
603
|
|
527
|
|
|||||
|
M.L. Kapp Generating Station (Unit 2); Clinton, IA
|
N/A
|
1967
|
IN
|
218
|
|
92
|
|
|||||
|
Sutherland Generating Station (Units 1,3); Marshalltown, IA
|
Retire by 6/30/17 (d)
|
1955-1961
|
IN
|
119
|
|
99
|
|
|||||
|
Fox Lake Generating Station (Units 1,3); Sherburn, MN
|
Retire by 12/31/17
|
1950-1962
|
IN
|
93
|
|
83
|
|
|||||
|
Burlington Combustion Turbines (Units 1-4); Burlington, IA
|
Retire by 12/31/17
|
1994-1996
|
PK
|
79
|
|
51
|
|
|||||
|
Dubuque Generating Station (Units 3-4); Dubuque, IA
|
Retire by 6/30/17 (d)
|
1952-1959
|
IN
|
66
|
|
59
|
|
|||||
|
Grinnell Combustion Turbines (Units 1-2); Grinnell, IA
|
Retire by 12/31/17
|
1990-1991
|
PK
|
48
|
|
36
|
|
|||||
|
Red Cedar Combustion Turbine (Unit 1); Cedar Rapids, IA
|
Retire by 12/31/18
|
1996
|
PK
|
23
|
|
11
|
|
|||||
|
Total Gas
|
1,249
|
|
958
|
|
||||||||
|
Ottumwa Generating Station (Unit 1); Ottumwa, IA (e)
|
N/A
|
1981
|
BL
|
348
|
|
326
|
|
|||||
|
Lansing Generating Station (Unit 4); Lansing, IA
|
N/A
|
1977
|
BL
|
275
|
|
235
|
|
|||||
|
Prairie Creek Generating Station (Units 1,3,4); Cedar Rapids, IA
|
Units 1 and 3 - fuel switch or retire by 12/31/25; Unit 4 - fuel switch by 12/31/17 (d)
|
1958-1997
|
BL
|
213
|
|
147
|
|
|||||
|
Burlington Generating Station (Unit 1); Burlington, IA
|
Fuel switch by 12/31/21 (d)
|
1968
|
BL
|
212
|
|
203
|
|
|||||
|
George Neal Generating Station (Unit 4); Sioux City, IA (f)
|
N/A
|
1979
|
BL
|
179
|
|
160
|
|
|||||
|
George Neal Generating Station (Unit 3); Sioux City, IA (g)
|
N/A
|
1975
|
BL
|
164
|
|
131
|
|
|||||
|
Louisa Generating Station (Unit 1); Louisa, IA (h)
|
N/A
|
1983
|
BL
|
32
|
|
29
|
|
|||||
|
Total Coal
|
1,423
|
|
1,231
|
|
||||||||
|
Marshalltown Combustion Turbines (Units 1-3); Marshalltown, IA
|
Fuel switch by 12/31/17
|
1978
|
PK
|
189
|
|
139
|
|
|||||
|
Lime Creek Combustion Turbines (Units 1-2); Mason City, IA
|
N/A
|
1991
|
PK
|
90
|
|
69
|
|
|||||
|
Centerville Combustion Turbines (Units 1-2); Centerville, IA
|
Retire by 12/31/17
|
1990
|
PK
|
54
|
|
47
|
|
|||||
|
Diesel Stations (5 Units); Iowa (i)
|
Retire by 12/31/17
|
1963-1966
|
PK
|
10
|
|
—
|
|
|||||
|
Total Oil
|
343
|
|
255
|
|
||||||||
|
Whispering Willow - East (121 Units); Franklin Co., IA
|
N/A
|
2009
|
IN
|
200
|
|
33
|
|
|||||
|
Total Wind
|
200
|
|
33
|
|
||||||||
|
Total capacity
|
3,215
|
|
2,477
|
|
||||||||
|
WPL
|
Primary
|
Nameplate
|
Generating
|
|||||||||
|
In-service
|
Dispatch
|
Capacity
|
Capacity
|
|||||||||
|
Name of EGU and Location
|
Expected Retirement (a)
|
Dates
|
Type (b)
|
in MW
|
in MW (c)
|
|||||||
|
Riverside Energy Center (Units 1-3); Beloit, WI
|
N/A
|
2004
|
IN
|
675
|
|
539
|
|
|||||
|
Neenah Energy Facility (Units 1-2); Neenah, WI
|
N/A
|
2000
|
PK
|
371
|
|
283
|
|
|||||
|
South Fond du Lac Combustion Turbines (2 Units); Fond du Lac, WI (j)
|
N/A
|
1994
|
PK
|
191
|
|
146
|
|
|||||
|
Rock River Combustion Turbines (Units 3-6); Beloit, WI
|
Retire by 12/31/20
|
1967-1972
|
PK
|
169
|
|
122
|
|
|||||
|
Sheepskin Combustion Turbine (Unit 1); Edgerton, WI
|
Retire by 12/31/20
|
1971
|
PK
|
42
|
|
35
|
|
|||||
|
Total Gas
|
1,448
|
|
1,125
|
|
||||||||
|
Columbia Energy Center (Units 1-2); Portage, WI (k)
|
N/A
|
1975-1978
|
BL
|
514
|
|
495
|
|
|||||
|
Edgewater Generating Station (Unit 5); Sheboygan, WI
|
N/A
|
1985
|
BL
|
414
|
|
399
|
|
|||||
|
Edgewater Generating Station (Unit 4); Sheboygan, WI (l)
|
Retire by 12/31/18 (d)
|
1969
|
BL
|
239
|
|
191
|
|
|||||
|
Total Coal
|
1,167
|
|
1,085
|
|
||||||||
|
Bent Tree (122 Units); Freeborn Co., MN
|
N/A
|
2010-2011
|
IN
|
201
|
|
32
|
|
|||||
|
Cedar Ridge (41 Units); Fond du Lac Co., WI
|
N/A
|
2008
|
IN
|
68
|
|
9
|
|
|||||
|
Total Wind
|
269
|
|
41
|
|
||||||||
|
Prairie du Sac Hydro Plant (8 Units); Prairie due Sac, WI
|
N/A
|
1914-1940
|
IN
|
32
|
|
12
|
|
|||||
|
Kilbourn Hydro Plant (4 Units); Wisconsin Dells, WI
|
N/A
|
1926-1939
|
IN
|
10
|
|
6
|
|
|||||
|
Total Hydro
|
42
|
|
18
|
|
||||||||
|
Total capacity
|
2,926
|
|
2,269
|
|
||||||||
24
|
(a)
|
Expected dates for the retirement and fuel switching of these EGUs are subject to change depending on operational, regulatory, market and other factors. The potential retirement of other EGUs within the generation fleet continues to be evaluated. IPL and WPL are working with MISO, state regulatory commissions and other regulatory agencies, as required, to determine the final timing of certain of these actions. Final MISO studies could indicate that the retirement of an individual EGU may result in reliability issues and that transmission network upgrades for system reliability are necessary to enable such retirement. Under the current MISO tariff, the specific timing for the retirement of these EGUs could depend on the timing of the required transmission network upgrades as well as various operational, market and other factors.
|
|
(b)
|
Base load EGUs (BL) are designed for nearly continuous operation at or near full capacity to provide the system base load. Intermediate EGUs (IN) follow system load changes with frequent starts and curtailments of output during low demand. Peak load EGUs (PK) are generally low efficiency, quick response units that run primarily when there is high demand.
|
|
(c)
|
Based on the accredited generating capacity of the EGUs included in MISO’s resource adequacy process for the planning period from
June 2016 through May 2017
.
|
|
(d)
|
Actions and plans for retirement or fuel switch meet requirements specified in IPL’s and WPL’s respective Consent Decree, which are discussed in
|
|
(e)
|
Represents IPL’s 48% ownership interest in this 726 MW (nameplate capacity) / 680 MW (generating capacity) EGU, which is operated by IPL.
|
|
(f)
|
Represents IPL’s 25.695% ownership interest in this 696 MW (nameplate capacity) / 622 MW (generating capacity) EGU, which is operated by MidAmerican Energy Company.
|
|
(g)
|
Represents IPL’s 28% ownership interest in this 584 MW (nameplate capacity) / 466 MW (generating capacity) EGU, which is operated by MidAmerican Energy Company.
|
|
(h)
|
Represents IPL’s 4% ownership interest in this 812 MW (nameplate capacity) / 725 MW (generating capacity) EGU, which is operated by MidAmerican Energy Company.
|
|
(i)
|
These EGUs did not receive any accredited generating capacity for the planning period from
June 2016 through May 2017
.
|
|
(j)
|
Represents Units 2 and 3, which WPL owns. WPL also operates, but does not own, South Fond du Lac Combustion Turbines Units 1 and 4.
|
|
(k)
|
Represents WPL’s 46.2% ownership interest in this 1,112 MW (nameplate capacity) / 1,072 MW (generating capacity) EGU, which is operated by WPL.
|
|
(l)
|
Represents WPL’s 68.2% ownership interest in this 351 MW (nameplate capacity) / 280 MW (generating capacity) EGU, which is operated by WPL.
|
At
December 31, 2016
, IPL owned approximately 17,485 miles of overhead electric distribution line and 2,977 miles of underground electric distribution cable, as well as 564 substation distribution transformers, substantially all of which are located in Iowa. At
December 31, 2016
, WPL owned approximately 16,222 miles of overhead electric distribution line and 5,481 miles of underground electric distribution cable, as well as 302 substation distribution transformers, substantially all of which are located in Wisconsin.
Gas
- IPL’s and WPL’s gas properties consist primarily of mains and services, meters, regulating and gate stations and other related transmission and distribution equipment. At
December 31, 2016
, IPL’s gas distribution facilities included approximately 5,116 miles of gas mains located in Iowa and WPL’s included approximately 4,430 miles of gas mains located in Wisconsin.
Other
- IPL’s and WPL’s other property consists primarily of operating and storeroom facilities, vehicles, computer hardware and software, communication equipment and other miscellaneous tools and equipment. IPL’s other property also includes steam service assets. Refer to
Note 10(b)
for information regarding WPL’s lease of Sheboygan Falls from AEF’s Non-regulated Generation business.
AEF
- AEF’s principal properties included in “Property, plant and equipment, net” on Alliant Energy’s balance sheet at
December 31, 2016
were as follows:
Non-regulated Generation
- Includes Sheboygan Falls, a
347
MW, simple-cycle, natural gas-fired facility near Sheboygan Falls, Wisconsin that was placed in service in 2005 and is leased to WPL, and the
99
MW (60 Units) Franklin County wind farm in Franklin County, Iowa that was placed in service in 2012. Sheboygan Falls and Franklin County wind farm were accredited with 281 MW and 17 MW, respectively, of generating capacity for MISO’s resource adequacy process for the planning period from
June 2016 through May 2017
.
25
Transportation
- Includes a short-line railway in Iowa with 114 miles of railroad track, 10 active locomotives and 12 rail-cars; and a barge terminal on the Mississippi River.
Corporate Services -
Corporate Services’ property included in “Property, plant and equipment, net” on Alliant Energy’s balance sheet at
December 31, 2016
consisted primarily of a customer billing and information system for IPL and WPL and other computer software, and the corporate headquarters building located in Madison, Wisconsin.
Alliant Energy -
None.
IPL -
None.
WPL -
None.
Other
-
Alliant Energy, IPL and WPL are involved in legal and administrative proceedings before various courts and agencies with respect to matters arising in the ordinary course of business. Although unable to predict the outcome of these matters, Alliant Energy, IPL and WPL believe that final disposition of these actions will not have a material effect on their financial condition or results of operations.
None.
EXECUTIVE OFFICERS OF THE REGISTRANTS
None of the executive officers for Alliant Energy, IPL or WPL listed below are related to any member of the Board of Directors or nominee for director or any other executive officer. All of the executive officers have no definite terms of office and serve at the pleasure of the Board of Directors. The executive officers of Alliant Energy, IPL and WPL as of the date of this filing are as follows (numbers following the names represent the officer’s age as of the date of this filing):
Executive Officers of Alliant Energy
|
Patricia L. Kampling
|
57
|
Ms. Kampling has served as a director since January 2012, and as Chairman of the Board, President and Chief Executive Officer (CEO) since April 2012. She previously served as President and Chief Operating Officer since February 2011.
|
|
James H. Gallegos
|
56
|
Mr. Gallegos has served as Senior Vice President (VP), General Counsel and Corporate Secretary since February 2015. He previously served as Senior VP and General Counsel since February 2014 and as VP and General Counsel from November 2010 to February 2014.
|
|
Douglas R. Kopp
|
63
|
Mr. Kopp has served as Senior VP since March 2014. He previously served as VP-Environmental Affairs since January 2013 and as Director-Environmental Affairs from January 2011 to January 2013.
|
|
John O. Larsen
|
53
|
Mr. Larsen has served as Senior VP since February 2014. He previously served as Senior VP-Generation since January 2010.
|
|
Wayne A. Reschke
|
61
|
Mr. Reschke has served as Senior VP since February 2016. He previously served as VP since February 2014 and as VP-Human Resources from September 2009 to February 2014.
|
|
Robert J. Durian
|
46
|
Mr. Durian has served as VP, Chief Financial Officer (CFO) and Treasurer since December 2016. He previously served as VP, Chief Accounting Officer (CAO) and Treasurer since July 2016; VP, CAO and Controller from July 2015 to July 2016; and as Controller and CAO from February 2011 to July 2015.
|
|
Benjamin M. Bilitz
|
42
|
Mr. Bilitz has served as CAO and Controller since December 2016. He previously served as Controller since July 2016 and as Assistant Controller from March 2011 to July 2016.
|
26
Executive Officers of IPL
|
Patricia L. Kampling
|
57
|
Ms. Kampling has served as a director since January 2012, and as Chairman of the Board and CEO since April 2012.
|
|
Douglas R. Kopp
|
63
|
Mr. Kopp has served as President since April 2014.
|
|
James H. Gallegos
|
56
|
Mr. Gallegos has served as Senior VP, General Counsel and Corporate Secretary since February 2015.
|
|
John O. Larsen
|
53
|
Mr. Larsen has served as Senior VP since February 2014.
|
|
Wayne A. Reschke
|
61
|
Mr. Reschke has served as Senior VP since February 2016.
|
|
Robert J. Durian
|
46
|
Mr. Durian has served as VP, CFO and Treasurer since December 2016.
|
|
Benjamin M. Bilitz
|
42
|
Mr. Bilitz has served as CAO and Controller since December 2016.
|
Executive Officers of WPL
|
Patricia L. Kampling
|
57
|
Ms. Kampling has served as a director since January 2012, and as Chairman of the Board and CEO since April 2012.
|
|
John O. Larsen
|
53
|
Mr. Larsen has served as President since December 2010.
|
|
James H. Gallegos
|
56
|
Mr. Gallegos has served as Senior VP, General Counsel and Corporate Secretary since February 2015.
|
|
Douglas R. Kopp
|
63
|
Mr. Kopp has served as Senior VP since March 2014.
|
|
Wayne A. Reschke
|
61
|
Mr. Reschke has served as Senior VP since February 2016.
|
|
Robert J. Durian
|
46
|
Mr. Durian has served as VP, CFO and Treasurer since December 2016.
|
|
Benjamin M. Bilitz
|
42
|
Mr. Bilitz has served as CAO and Controller since December 2016.
|
Stock Price
- Alliant Energy’s common stock trades on the New York Stock Exchange under the symbol “LNT.” Quarterly sales price high and low ranges and dividends with respect to Alliant Energy’s common stock were as follows. Amounts reflect the effects of a two-for-one common stock split distributed in May 2016
.
Refer to
Note 7
for additional details.
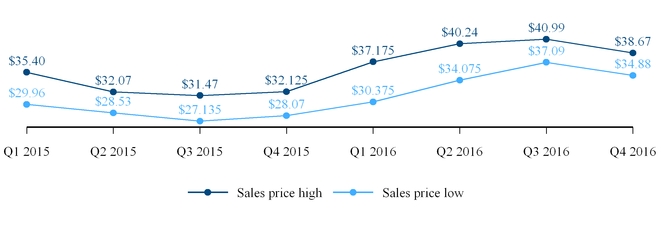
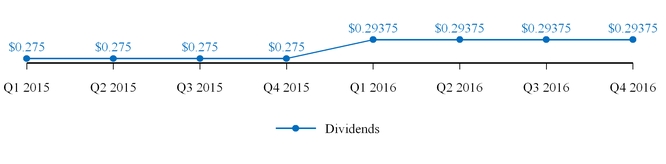
Closing sales price at
December 31, 2016
:
$37.89
27
Shareowners
- At
December 31, 2016
, there were 27,287 holders of record of Alliant Energy’s common stock, including holders through Alliant Energy’s Shareowner Direct Plan. Alliant Energy is the sole common shareowner of all 13,370,788 and 13,236,601 shares of IPL and WPL common stock, respectively, currently outstanding. As a result, there is no established public trading market for the common stock of either IPL or WPL.
Dividends
- In November 2016, Alliant Energy announced an increase in its targeted 2017 annual common stock dividend to $1.26 per share, which is equivalent to a quarterly rate of $0.315 per share, beginning with the February 2017 dividend payment. The timing and amount of future dividends is subject to an approved dividend declaration from Alliant Energy’s Board of Directors, and is dependent upon earnings expectations, capital requirements, and general financial business conditions, among other factors.
Alliant Energy does not have any significant common stock dividend restrictions. Refer to
Note 7
for information about IPL’s and WPL’s dividend restrictions and limitations on distributions to their parent company.
Common Stock Repurchases
- A summary of Alliant Energy common stock repurchases for the quarter ended
December 31, 2016
was as follows:
|
Total Number
|
Average Price
|
Total Number of Shares
|
Maximum Number (or Approximate
|
||||||||
|
of Shares
|
Paid Per
|
Purchased as Part of
|
Dollar Value) of Shares That May
|
||||||||
|
Period
|
Purchased (a)
|
Share
|
Publicly Announced Plan
|
Yet Be Purchased Under the Plan (a)
|
|||||||
|
October 1 to October 31
|
3,919
|
|
|
$37.22
|
|
—
|
N/A
|
||||
|
November 1 to November 30
|
3,684
|
|
35.76
|
|
—
|
N/A
|
|||||
|
December 1 to December 31
|
144
|
|
37.14
|
|
—
|
N/A
|
|||||
|
7,747
|
|
36.52
|
|
—
|
|||||||
|
(a)
|
All shares were purchased on the open market and held in a rabbi trust under the DCP. There is no limit on the number of shares of Alliant Energy common stock that may be held under the DCP, which currently does not have an expiration date.
|
Other
- Refer to “
Security Ownership of Certain Beneficial Owners and Management and Related Stockholder Matters
” in Item 12 for details of securities authorized for issuance under equity compensation plans.
28
Financial Information
|
Alliant Energy
|
2016 (a)
|
2015 (a)
|
2014 (a)
|
2013
|
2012
|
||||||||||||||
|
(dollars in millions, except per share data)
|
|||||||||||||||||||
|
|
|||||||||||||||||||
|
Operating revenues
|
|
$3,320.0
|
|
|
$3,253.6
|
|
|
$3,350.3
|
|
|
$3,276.8
|
|
|
$3,094.5
|
|
||||
|
Amounts attributable to Alliant Energy common shareowners:
|
|||||||||||||||||||
|
Income from continuing operations, net of tax
|
373.8
|
|
380.7
|
|
385.5
|
|
364.2
|
|
324.9
|
|
|||||||||
|
Loss from discontinued operations, net of tax
|
(2.3
|
)
|
(2.5
|
)
|
(2.4
|
)
|
(5.9
|
)
|
(5.1
|
)
|
|||||||||
|
Net income
|
371.5
|
|
378.2
|
|
383.1
|
|
358.3
|
|
319.8
|
|
|||||||||
|
Common Stock Data:
|
|||||||||||||||||||
|
Earnings per weighted average common share attributable to Alliant Energy common shareowners (basic and diluted) (b):
|
|||||||||||||||||||
|
Income from continuing operations, net of tax
|
|
$1.65
|
|
|
$1.69
|
|
|
$1.74
|
|
|
$1.64
|
|
|
$1.47
|
|
||||
|
Loss from discontinued operations, net of tax
|
|
($0.01
|
)
|
|
($0.01
|
)
|
|
($0.01
|
)
|
|
($0.02
|
)
|
|
($0.03
|
)
|
||||
|
Net income
|
|
$1.64
|
|
|
$1.68
|
|
|
$1.73
|
|
|
$1.62
|
|
|
$1.44
|
|
||||
|
Common shares outstanding at year-end (000s) (b)
|
227,674
|
|
226,918
|
|
221,871
|
|
221,887
|
|
221,975
|
|
|||||||||
|
Dividends declared per common share (b)
|
|
$1.175
|
|
|
$1.10
|
|
|
$1.02
|
|
|
$0.94
|
|
|
$0.90
|
|
||||
|
Market value per share at year-end (b)
|
|
$37.89
|
|
|
$31.225
|
|
|
$33.21
|
|
|
$25.80
|
|
|
$21.955
|
|
||||
|
Book value per share at year-end (b)
|
|
$16.96
|
|
|
$16.41
|
|
|
$15.50
|
|
|
$14.79
|
|
|
$14.12
|
|
||||
|
Market capitalization at year-end
|
|
$8,626.6
|
|
|
$7,085.5
|
|
|
$7,368.3
|
|
|
$5,724.7
|
|
|
$4,873.5
|
|
||||
|
Other Selected Financial Data:
|
|||||||||||||||||||
|
Cash flows from operating activities
|
|
$859.6
|
|
|
$871.2
|
|
|
$891.6
|
|
|
$731.0
|
|
|
$841.1
|
|
||||
|
Construction and acquisition expenditures
|
|
$1,196.8
|
|
|
$1,034.3
|
|
|
$902.8
|
|
|
$798.3
|
|
|
$1,158.1
|
|
||||
|
Total assets at year-end
|
|
$13,373.8
|
|
|
$12,495.2
|
|
|
$12,063.5
|
|
|
$11,092.5
|
|
|
$10,766.0
|
|
||||
|
Long-term obligations, net
|
|
$4,325.1
|
|
|
$3,837.0
|
|
|
$3,768.7
|
|
|
$3,318.2
|
|
|
$3,122.0
|
|
||||
|
IPL
|
|||||||||||||||||||
|
Operating revenues
|
|
$1,820.4
|
|
|
$1,774.5
|
|
|
$1,848.1
|
|
|
$1,818.8
|
|
|
$1,650.3
|
|
||||
|
Earnings available for common stock
|
215.6
|
|
186.0
|
|
181.6
|
|
172.0
|
|
145.7
|
|
|||||||||
|
Cash dividends declared on common stock
|
151.9
|
|
140.0
|
|
140.0
|
|
128.1
|
|
122.9
|
|
|||||||||
|
Cash flows from operating activities
|
361.9
|
|
385.0
|
|
406.1
|
|
232.6
|
|
291.0
|
|
|||||||||
|
Total assets
|
7,304.7
|
|
6,709.1
|
|
6,450.2
|
|
5,793.9
|
|
5,446.8
|
|
|||||||||
|
Long-term obligations, net
|
2,154.0
|
|
1,857.4
|
|
1,758.6
|
|
1,549.5
|
|
1,353.7
|
|
|||||||||
|
WPL
|
|||||||||||||||||||
|
Operating revenues
|
|
$1,459.1
|
|
|
$1,435.1
|
|
|
$1,449.1
|
|
|
$1,406.3
|
|
|
$1,392.0
|
|
||||
|
Earnings available for common stock
|
190.4
|
|
176.3
|
|
180.4
|
|
177.5
|
|
169.4
|
|
|||||||||
|
Cash dividends declared on common stock
|
135.0
|
|
126.9
|
|
118.7
|
|
116.3
|
|
112.0
|
|
|||||||||
|
Cash flows from operating activities
|
521.4
|
|
449.8
|
|
424.4
|
|
423.3
|
|
427.4
|
|
|||||||||
|
Total assets
|
5,290.3
|
|
5,270.4
|
|
5,117.6
|
|
4,796.2
|
|
4,754.4
|
|
|||||||||
|
Long-term obligations, net
|
1,623.2
|
|
1,624.2
|
|
1,658.3
|
|
1,423.2
|
|
1,426.3
|
|
|||||||||
|
(a)
|
Refer to “
Results of Operations
” in MDA for discussion of the
2016
,
2015
and
2014
results of operations.
|
|
(b)
|
Amounts reflect the effects of a two-for-one common stock split distributed in May 2016. Refer to
Note 7
for additional details.
|
Alliant Energy is the sole common shareowner of all 13,370,788 and 13,236,601 shares of IPL’s and WPL’s common stock outstanding, respectively. As such, earnings per share data is not disclosed herein for IPL and WPL.
29
This MDA includes information relating to Alliant Energy, IPL and WPL, as well as AEF and Corporate Services. Where appropriate, information relating to a specific entity has been segregated and labeled as such. The following discussion and analysis should be read in conjunction with the Financial Statements and Notes included in this report. Unless otherwise noted, all “per share” references in MDA refer to earnings per diluted share.
EXECUTIVE OVERVIEW
Description of Business
General -
Alliant Energy is an investor-owned public utility holding company whose primary subsidiaries are IPL, WPL, AEF and Corporate Services. IPL and WPL are public utilities, and AEF is the parent company for Alliant Energy’s non-regulated businesses and holds all of Alliant Energy’s investment in ATC. Corporate Services provides administrative services to Alliant Energy and its subsidiaries. An illustration of Alliant Energy’s primary businesses is shown below.
|
Alliant Energy
|
|||||
|
Utilities, ATC and Corporate Services
|
Non-regulated and Parent
|
||||
|
- Retail electric and gas services in IA (IPL)
|
- Transportation (AEF)
|
||||
|
- Retail electric and gas services in WI (WPL)
|
- Non-regulated Generation (AEF)
|
||||
|
- 16% interest in ATC (ATI) (a)
|
- Parent Company
|
||||
|
- Wholesale electric service in MN, IL & IA (IPL)
|
|||||
|
- Wholesale electric service in WI (WPL)
|
|||||
|
- Corporate Services
|
|
||||
|
(a)
|
At
December 31, 2016
, ATI, a wholly-owned subsidiary of AEF, holds all of Alliant Energy’s investment in ATC, a transmission-only utility operating primarily in the Midwest.
|
Utilities, ATC and Corporate Services
- IPL and WPL own a portfolio of EGUs located in Iowa, Wisconsin and Minnesota with a diversified fuel mix including natural gas, renewable resources and coal. The output from these EGUs, supplemented with purchased power, is used to provide electric service to approximately
960,000
electric customers in the upper Midwest. The utility business also procures natural gas from various suppliers to provide service to approximately
410,000
retail gas customers in the upper Midwest. Alliant Energy’s utility business is its primary source of earnings and cash flows. The earnings and cash flows from the utilities, ATC and Corporate Services business are sensitive to various external factors including, but not limited to, the amount and timing of rates approved by regulatory authorities, the impact of weather and economic conditions on electric and gas sales volumes and other factors listed in “
Risk Factors
” in Item 1A and “
Forward-looking Statements
.”
Non-regulated Business and Parent -
AEF manages various businesses including Non-regulated Generation (Sheboygan Falls and the Franklin County wind farm), Transportation (short-line railway and barge transportation services) and several other modest investments.
Financial Results
-
Alliant Energy’s net income and EPS attributable to Alliant Energy common shareowners were as follows (dollars in millions, except per share amounts):
|
2016
|
2015
|
||||||||||||||
|
Income (Loss)
|
EPS (a)
|
Income (Loss)
|
EPS (a)
|
||||||||||||
|
Continuing operations:
|
|||||||||||||||
|
Utilities, ATC and Corporate Services
|
|
$420.4
|
|
|
$1.85
|
|
|
$374.5
|
|
|
$1.66
|
|
|||
|
Non-regulated and Parent
|
(46.6
|
)
|
(0.20
|
)
|
6.2
|
|
0.03
|
|
|||||||
|
Income from continuing operations
|
373.8
|
|
1.65
|
|
380.7
|
|
1.69
|
|
|||||||
|
Loss from discontinued operations
|
(2.3
|
)
|
(0.01
|
)
|
(2.5
|
)
|
(0.01
|
)
|
|||||||
|
Net income
|
|
$371.5
|
|
|
$1.64
|
|
|
$378.2
|
|
|
$1.68
|
|
|||
(a) Amounts reflect the effects of a two-for-one stock split distributed in May 2016. Refer to
Note 7
for additional details.
The table above includes EPS from continuing operations for utilities, ATC and Corporate Services, and non-regulated and parent, which are non-GAAP financial measures. Alliant Energy believes EPS from continuing operations for utilities, ATC
30
and Corporate Services, and non-regulated and parent are useful to investors because they facilitate an understanding of segment performance and trends and provide additional information about Alliant Energy’s operations on a basis consistent with the measures that management uses to manage its operations and evaluate its performance.
Lower net income and EPS from continuing operations in 2016 compared to 2015 was primarily due to asset valuation charges related to the Franklin County wind farm in 2016, partially offset by higher electric and gas margins, higher AFUDC (primarily related to Marshalltown) and losses on sales of IPL’s Minnesota electric and gas distribution assets in 2015.
Refer to “
Results of Operations
” for additional details regarding the various factors impacting earnings during
2016
,
2015
and
2014
.
2016
Overview
- In
2016
, Alliant Energy, IPL and WPL focused on achieving financial objectives and executing their strategic plan. Key developments in
2016
include the following:
|
•
|
IPL’s Expansion of Wind Generation -
In October 2016, IPL and the Iowa Office of Consumer Advocate, among other customer groups, filed a settlement agreement with the IUB regarding the appropriate rate-making principles for up to 500 MW of additional wind generation at IPL. In October 2016, the IUB issued an order approving the settlement agreement, with limited modifications, and establishing rate-making principles, which IPL accepted, with key terms as follows. Refer to “
Strategic Overview
” for further discussion.
|
|
▪
|
Up to 500 MW of additional wind generation that qualifies for the full level of production tax credits, regardless of the location in Iowa, with a cost cap of $1,830/kilowatt, including AFUDC and transmission costs. Any costs incurred in excess of this $1,830/kilowatt cost cap are expected to be incorporated into rates if determined to be reasonable and prudent.
|
|
▪
|
A depreciable life of the wind generation of 40 years, unless changed as a result of a contested case before the IUB.
|
|
▪
|
An 11.0% return on common equity, with the exception of certain transmission facilities classified as intangible assets, which would earn the rate of return on common equity the IUB finds reasonable during a future rate case.
|
|
•
|
Franklin County Wind Farm -
In addition to IPL’s expansion of wind generation discussed above, in February 2017, FERC issued an order approving the transfer of the 99 MW Franklin County wind farm from AEF to IPL. Alliant Energy and IPL currently expect to complete this transfer in 2017.
|
|
•
|
IPL’s and WPL’s Potential Expansion of Wind Generation -
In addition to IPL’s 500 MW expansion of wind generation and transfer of the 99 MW Franklin County wind farm to IPL in 2017 discussed above, IPL and WPL are each exploring options to own and operate up to 200 MW of additional new wind generation.
|
|
•
|
WPL’s Construction of the Riverside Expansion
- In May 2016, WPL received an order from the PSCW authorizing WPL to construct an approximate 730 MW natural gas-fired combined-cycle EGU in Beloit, Wisconsin, referred to as the Riverside expansion. After receiving the final necessary regulatory approvals and permits in the third quarter of 2016, WPL began constructing the Riverside expansion. WPL currently expects to place the Riverside expansion in service by early 2020. In November 2016, various electric cooperatives notified WPL of their intent to exercise their options to acquire approximately 65 MW of the Riverside expansion while the EGU is being constructed. As a result of the various electric cooperatives funding a portion of the capital expenditures during construction, WPL’s estimated portion of capital expenditures is expected to be approximately $640 million.
|
|
•
|
WPL’s Wisconsin Retail Electric and Gas Rate Case (2017/2018 Test Period) -
In December 2016,
WPL received an order from the PSCW authorizing WPL to implement an increase in annual retail electric rates of $9 million, or approximately 1%, and an increase in annual retail gas rates of $9 million, or approximately 13%. These increases are effective January 1, 2017 and extend through the end of 2018. The order included a return on common equity of 10.0% and continues a regulatory return on common equity sharing mechanism, whereby WPL must defer a portion of its earnings if its annual regulatory return on common equity exceeds 10.25% during the 2017 and 2018 Test Period. WPL must defer 50% of its excess earnings between 10.25% and 11.00%, and 100% of any excess earnings above 11.00%.
|
|
•
|
MISO Transmission Owner Return on Equity Complaints -
A group of MISO cooperative and municipal utilities previously filed two complaints with FERC requesting a reduction to the base return on equity used by MISO transmission owners, including ITC and ATC. In September 2016, FERC issued an order on the first complaint and established a base return on equity of 10.32%, excluding any incentive adders granted by FERC, effective September 28, 2016, and for the refund period from November 12, 2013 through February 11, 2015. In October 2016, in response to MISO’s and the MISO transmission owners’ request, FERC ordered the related refunds to be issued no later than July 2017. In June 2016, a FERC administrative law judge issued an initial decision regarding the second complaint and recommended a base return on equity of 9.70%, excluding any incentive adders granted by FERC, for the refund period from February 12, 2015 through May 11, 2016. A final decision from FERC on the second complaint is currently expected in the first half of 2017. As a result of the two MISO complaints, Alliant Energy and WPL have realized a cumulative $24 million of reductions in the amounts of equity income from ATC through December 31, 2016, including $9 million realized in 2016.
|
31
|
•
|
Transfer of ATC Investment -
In June 2016, WPL received an order from the PSCW requiring WPL to transfer its investment in ATC to Alliant Energy or an Alliant Energy subsidiary by December 31, 2022. On December 31, 2016, pursuant to the PSCW order, the investment in ATC was transferred to ATI. Refer to
Note 6(a)
for further discussion.
|
|
•
|
Common Stock Split
-
In April 2016, Alliant Energy’s Board of Directors approved a two
-for-one
common stock split and a proportionate increase in the number of authorized shares of common stock of Alliant Energy from 240 million shares to 480 million shares to implement the stock split. Alliant Energy shareowners of record at the close of business on May 4, 2016 received one additional share of Alliant Energy common stock for each share held on that date. The proportionate interest that a shareowner owns in Alliant Energy did not change as a result of the stock split. The additional shares were distributed on May 19, 2016 and post-split trading began on May 20, 2016. All Alliant Energy share and per share amounts in this report have been reflected on a post-split basis.
|
Future Developments
-
In
2017
and beyond, the following includes key items expected to impact Alliant Energy, IPL and WPL:
|
•
|
Planned Utility Rate Case -
IPL currently expects to make a retail electric rate filing in the second quarter of 2017 based on a 2016 historical Test Year. Refer to “
Rate Matters
” for further discussion.
|
2017
Forecast -
In
2017
, the following financing activities, and impacts to results of operations, are currently anticipated to occur:
|
•
|
Financing Plans -
Alliant Energy currently expects to issue up to $150 million of common stock in 2017 through one or more offerings and its Shareowner Direct Plan. Both IPL and WPL currently expect to receive capital contributions of approximately $150 million from their parent company, Alliant Energy, in 2017. IPL and WPL currently expect to issue up to $250 million and $300 million, respectively, of long-term debt securities in 2017.
|
|
•
|
Common Stock Dividends -
Alliant Energy announced an increase in its targeted 2017 annual common stock dividend to $1.26 per share, which is equivalent to a quarterly rate of $0.315 per share, beginning with the February 2017 dividend payment. The timing and amount of future dividends is subject to an approved dividend declaration from Alliant Energy’s Board of Directors, and is dependent upon earnings expectations, capital requirements, and general financial business conditions, among other factors. In addition, IPL and WPL currently expect to pay common stock dividends of approximately $156 million and $126 million, respectively, to their parent company in 2017.
|
|
•
|
Utility Electric Margins -
Alliant Energy, IPL and WPL currently expect an increase in electric margins in 2017 compared to 2016 as a result of base rate increases in effect from WPL’s recent retail electric rate case and IPL’s planned retail electric rate case. Refer to “
Rate Matters
” for further discussion of these rate cases.
|
|
•
|
Other Operation and Maintenance Expenses
- Alliant Energy currently expects its other operation and maintenance expenses to increase in 2017 compared to 2016 primarily due to IPL’s Marshalltown facility, which is expected to be placed in service in April 2017, as well as higher energy delivery infrastructure maintenance expenditures. Also contributing to the increase are energy efficiency regulatory amortizations at WPL, which will be offset by increases in WPL’s base rates as discussed in “
Rate Matters
.”
|
|
•
|
Depreciation and Amortization Expenses
- Alliant Energy currently expects its depreciation and amortization expenses to increase in 2017 compared to 2016 due to property additions, including various environmental controls projects at IPL and WPL placed in service in 2016 and IPL’s Marshalltown facility, which is expected to be placed in service in April 2017. Refer to “
Rate Matters
” for discussion of updated depreciation rates for WPL effective January 1, 2017 as a result of a recently completed depreciation study.
|
|
•
|
Interest Expense
- Alliant Energy currently expects its interest expense to increase in 2017 compared to 2016 due to financings completed in 2016 and planned in 2017 as discussed above.
|
RESULTS OF OPERATIONS
Overview
Alliant Energy -
“
Executive Overview
” provides an overview of Alliant Energy’s
2016
and
2015
earnings and the various components of its business.
IPL
- Earnings available for common stock increased $30 million in
2016
and $4 million in
2015
. The 2016 increase was due to higher AFUDC in 2016 related to Marshalltown, lower retail electric customer billing credits, losses recorded in 2015 related to IPL’s sales of its Minnesota electric and natural gas distribution assets and higher income tax benefits. These items were partially offset by higher depreciation and interest expenses. The 2015 increase was the result of lower retail electric customer billing credits and lower purchased electric capacity expense related to the previous DAEC PPA. These items were substantially offset by lower retail electric and gas sales due to changes in temperatures in IPL’s service territory, losses recorded in 2015 related to IPL’s sales of its Minnesota electric and natural gas distribution assets, higher depreciation expense and lower income tax benefits.
32
WPL
- Earnings available for common stock increased $14 million in
2016
and decreased $4 million in
2015
. The 2016 increase was due to higher retail electric sales, partially offset by higher depreciation expense. The 2015 decrease was the result of lower retail electric and gas sales due to changes in temperatures in WPL’s service territory. This was partially offset by changes in electric fuel-related costs, net of recoveries in 2015 compared to 2014.
Additional details of Alliant Energy’s, IPL’s and WPL’s
2016
,
2015
and
2014
earnings are discussed below.
Utility Electric Margins
-
Electric margins are defined as electric operating revenues less electric production fuel, purchased power and electric transmission service expenses. Management believes that electric margins provide a more meaningful basis for evaluating utility operations than electric operating revenues since electric production fuel, purchased power and electric transmission service expenses are generally passed through to customers, and therefore, result in changes to electric operating revenues that are comparable to changes in such expenses. These electric margins may not be comparable to how other entities define utility margin. Electric margins and MWh sales were as follows:
|
Alliant Energy
|
Revenues and Costs (dollars in millions)
|
MWhs Sold (MWhs in thousands)
|
||||||||||||||||||||||||||
|
2016
|
2015
|
(a)
|
2014
|
(b)
|
2016
|
2015
|
(a)
|
2014
|
(b)
|
|||||||||||||||||||
|
Residential (c)
|
|
$1,001.1
|
|
|
$983.0
|
|
2%
|
|
$994.5
|
|
(1%)
|
7,152
|
|
7,271
|
|
(2%)
|
7,697
|
|
(6%)
|
|||||||||
|
Commercial (c)
|
712.6
|
|
667.8
|
|
7%
|
658.0
|
|
1%
|
6,545
|
|
6,374
|
|
3%
|
6,449
|
|
(1%)
|
||||||||||||
|
Industrial (c)
|
787.1
|
|
763.4
|
|
3%
|
735.1
|
|
4%
|
10,702
|
|
10,820
|
|
(1%)
|
10,813
|
|
—%
|
||||||||||||
|
Industrial - co-generation
|
64.0
|
|
59.9
|
|
7%
|
63.9
|
|
(6%)
|
940
|
|
915
|
|
3%
|
1,008
|
|
(9%)
|
||||||||||||
|
Retail subtotal (c)
|
2,564.8
|
|
2,474.1
|
|
4%
|
2,451.5
|
|
1%
|
25,339
|
|
25,380
|
|
—%
|
25,967
|
|
(2%)
|
||||||||||||
|
Sales for resale:
|
||||||||||||||||||||||||||||
|
Wholesale (c)
|
256.6
|
|
221.0
|
|
16%
|
206.6
|
|
7%
|
4,039
|
|
3,614
|
|
12%
|
3,586
|
|
1%
|
||||||||||||
|
Bulk power and other
|
10.1
|
|
28.5
|
|
(65%)
|
2.9
|
|
883%
|
360
|
|
1,228
|
|
(71%)
|
335
|
|
267%
|
||||||||||||
|
Other
|
44.0
|
|
46.9
|
|
(6%)
|
52.6
|
|
(11%)
|
100
|
|
129
|
|
(22%)
|
155
|
|
(17%)
|
||||||||||||
|
Total revenues/sales
|
2,875.5
|
|
2,770.5
|
|
4%
|
2,713.6
|
|
2%
|
29,838
|
|
30,351
|
|
(2%)
|
30,043
|
|
1%
|
||||||||||||
|
Electric production fuel expense
|
408.1
|
|
463.6
|
|
(12%)
|
443.9
|
|
4%
|
||||||||||||||||||||
|
Purchased power expense
|
445.9
|
|
374.1
|
|
19%
|
433.3
|
|
(14%)
|
||||||||||||||||||||
|
Electric transmission service expense
|
527.9
|
|
485.3
|
|
9%
|
447.5
|
|
8%
|
||||||||||||||||||||
|
Electric margins (d)
|
|
$1,493.6
|
|
|
$1,447.5
|
|
3%
|
|
$1,388.9
|
|
4%
|
|||||||||||||||||
|
IPL
|
Revenues and Costs (dollars in millions)
|
MWhs Sold (MWhs in thousands)
|
||||||||||||||||||||||||||
|
2016
|
2015
|
(a)
|
2014
|
(b)
|
2016
|
2015
|
(a)
|
2014
|
(b)
|
|||||||||||||||||||
|
Residential (c)
|
|
$536.7
|
|
|
$540.3
|
|
(1%)
|
|
$556.4
|
|
(3%)
|
3,633
|
|
3,843
|
|
(5%)
|
4,164
|
|
(8%)
|
|||||||||
|
Commercial (c)
|
445.4
|
|
416.3
|
|
7%
|
410.2
|
|
1%
|
4,159
|
|
4,059
|
|
2%
|
4,099
|
|
(1%)
|
||||||||||||
|
Industrial (c)
|
396.4
|
|
393.7
|
|
1%
|
394.6
|
|
—%
|
5,791
|
|
6,007
|
|
(4%)
|
6,124
|
|
(2%)
|
||||||||||||
|
Industrial - co-generation
|
64.0
|
|
59.9
|
|
7%
|
63.9
|
|
(6%)
|
940
|
|
915
|
|
3%
|
1,008
|
|
(9%)
|
||||||||||||
|
Retail subtotal (c)
|
1,442.5
|
|
1,410.2
|
|
2%
|
1,425.1
|
|
(1%)
|
14,523
|
|
14,824
|
|
(2%)
|
15,395
|
|
(4%)
|
||||||||||||
|
Sales for resale:
|
||||||||||||||||||||||||||||
|
Wholesale (c)
|
94.2
|
|
56.4
|
|
67%
|
32.2
|
|
75%
|
1,360
|
|
845
|
|
61%
|
485
|
|
74%
|
||||||||||||
|
Bulk power and other
|
3.6
|
|
5.1
|
|
(29%)
|
2.1
|
|
143%
|
46
|
|
178
|
|
(74%)
|
59
|
|
202%
|
||||||||||||
|
Other
|
29.4
|
|
32.1
|
|
(8%)
|
33.9
|
|
(5%)
|
41
|
|
67
|
|
(39%)
|
81
|
|
(17%)
|
||||||||||||
|
Total revenues/sales
|
1,569.7
|
|
1,503.8
|
|
4%
|
1,493.3
|
|
1%
|
15,970
|
|
15,914
|
|
—%
|
16,020
|
|
(1%)
|
||||||||||||
|
Electric production fuel expense
|
159.1
|
|
194.5
|
|
(18%)
|
231.5
|
|
(16%)
|
||||||||||||||||||||
|
Purchased power expense
|
271.4
|
|
233.9
|
|
16%
|
265.8
|
|
(12%)
|
||||||||||||||||||||
|
Electric transmission service expense
|
359.7
|
|
328.2
|
|
10%
|
323.4
|
|
1%
|
||||||||||||||||||||
|
Electric margins (d)
|
|
$779.5
|
|
|
$747.2
|
|
4%
|
|
$672.6
|
|
11%
|
|||||||||||||||||
33
|
WPL
|
Revenues and Costs (dollars in millions)
|
MWhs Sold (MWhs in thousands)
|
||||||||||||||||||||||||
|
2016
|
2015
|
(a)
|
2014
|
(b)
|
2016
|
2015
|
(a)
|
2014
|
(b)
|
|||||||||||||||||
|
Residential
|
|
$464.4
|
|
$442.7
|
5%
|
$438.1
|
1%
|
3,519
|
|
3,428
|
|
3%
|
3,533
|
|
(3%)
|
|||||||||||
|
Commercial
|
267.2
|
|
251.5
|
|
6%
|
247.8
|
|
1%
|
2,386
|
|
2,315
|
|
3%
|
2,350
|
|
(1%)
|
||||||||||
|
Industrial
|
390.7
|
|
369.7
|
|
6%
|
340.5
|
|
9%
|
4,911
|
|
4,813
|
|
2%
|
4,689
|
|
3%
|
||||||||||
|
Retail subtotal
|
1,122.3
|
|
1,063.9
|
|
5%
|
1,026.4
|
|
4%
|
10,816
|
|
10,556
|
|
2%
|
10,572
|
|
—%
|
||||||||||
|
Sales for resale:
|
||||||||||||||||||||||||||
|
Wholesale
|
162.4
|
|
164.6
|
|
(1%)
|
174.4
|
|
(6%)
|
2,679
|
|
2,769
|
|
(3%)
|
3,101
|
|
(11%)
|
||||||||||
|
Bulk power and other
|
6.5
|
|
23.4
|
|
(72%)
|
0.8
|
|
2,825%
|
314
|
|
1,050
|
|
(70%)
|
276
|
|
280%
|
||||||||||
|
Other
|
14.6
|
|
14.8
|
|
(1%)
|
18.7
|
|
(21%)
|
59
|
|
62
|
|
(5%)
|
74
|
|
(16%)
|
||||||||||
|
Total revenues/sales
|
1,305.8
|
|
1,266.7
|
|
3%
|
1,220.3
|
|
4%
|
13,868
|
|
14,437
|
|
(4%)
|
14,023
|
|
3%
|
||||||||||
|
Electric production fuel expense
|
249.0
|
|
269.1
|
|
(7%)
|
212.4
|
|
27%
|
||||||||||||||||||
|
Purchased power expense
|
174.5
|
|
140.2
|
|
24%
|
167.5
|
|
(16%)
|
||||||||||||||||||
|
Electric transmission service expense
|
168.2
|
|
157.1
|
|
7%
|
124.1
|
|
27%
|
||||||||||||||||||
|
Electric margins
|
$714.1
|
$700.3
|
2%
|
$716.3
|
(2%)
|
|||||||||||||||||||||
|
(a)
|
Reflects the % change from
2015
to
2016
. (b) Reflects the % change from
2014
to
2015
.
|
|
(c)
|
On July 31, 2015, IPL sold its electric distribution assets in Minnesota. Prior to the asset sale, the related electric sales are included in residential, commercial and industrial retail sales. Subsequent to the asset sale, the related electric sales are included in wholesale electric sales pursuant to a wholesale power supply agreement between IPL and Southern Minnesota Energy Cooperative.
|
|
(d)
|
Includes $64 million, $72 million and $85 million of electric tax benefit rider credits on IPL’s Iowa retail electric customers’ bills for
2016
,
2015
and
2014
, respectively. The electric tax benefit rider resulted in reductions in electric revenues that were offset by reductions in income tax expense for
2016
,
2015
and
2014
.
|
Variances
- Variances between periods in electric margins were as follows (in millions):
|
2016 vs. 2015 Summary:
|
Alliant Energy
|
IPL
|
WPL
|
||||||||
|
Higher revenues at IPL due to lower retail electric customer billing credits related to the approved retail electric base rate freeze through 2016 (Refer to
Note 2
for details)
|
|
$15
|
|
|
$15
|
|
|
$—
|
|
||
|
Estimated changes in sales caused by temperatures (Refer to “Temperatures” below for details)
|
15
|
|
10
|
|
5
|
|
|||||
|
Higher revenues at IPL due to fewer electric tax benefit rider credits on customers’ bills (Refer to
Note 2
for details)
|
8
|
|
8
|
|
—
|
|
|||||
|
Higher electric transmission service expense at WPL (Refer to “Electric Transmission Service Expense” below for details)
|
(11
|
)
|
—
|
|
(11
|
)
|
|||||
|
Other (a)
|
19
|
|
(1
|
)
|
20
|
|
|||||
|
|
$46
|
|
|
$32
|
|
|
$14
|
|
|||
|
2015 vs. 2014 Summary:
|
Alliant Energy
|
IPL
|
WPL
|
||||||||
|
Higher revenues at IPL due to lower retail electric customer billing credits related to the approved retail electric base rate freeze (Refer to
Note 2
for details)
|
|
$48
|
|
|
$48
|
|
|
$—
|
|
||
|
Lower purchased electric capacity expense at IPL attributed to the previous DAEC PPA, which ended in February 2014
|
25
|
|
25
|
|
—
|
|
|||||
|
Higher revenues at IPL due to fewer electric tax benefit rider credits on customers’ bills (Refer to
Note 2
for details)
|
13
|
|
13
|
|
—
|
|
|||||
|
Changes in electric fuel-related costs, net of recoveries at WPL (Refer to “Electric Production Fuel and Purchased Power (Fuel-related) Expenses” below for details)
|
11
|
|
—
|
|
11
|
|
|||||
|
Higher revenues at WPL from the impact of increased sales volumes approved in its retail electric base rate case for 2015 (b)
|
9
|
|
—
|
|
9
|
|
|||||
|
Higher electric transmission service expense at WPL (Refer to “Electric Transmission Service Expense” below for details)
|
(33
|
)
|
—
|
|
(33
|
)
|
|||||
|
Estimated changes in sales caused by temperatures (Refer to “Temperatures” below for details)
|
(19
|
)
|
(10
|
)
|
(9
|
)
|
|||||
|
Other (a)
|
5
|
|
(1
|
)
|
6
|
|
|||||
|
|
$59
|
|
|
$75
|
|
|
($16
|
)
|
|||
34
|
(a)
|
Includes increases in temperature-normalized retail sales volumes at WPL in 2016 and 2015. Refer to “Sales Trends” below for more information.
|
|
(b)
|
The PSCW order received for WPL’s retail fuel-related rate filing (2015 Test Year) contained an increase in retail electric fuel-related revenues in 2015. A portion of the approved increase was attributable to the impact of increased sales volumes approved in WPL’s retail electric base rate case for 2015 resulting in higher electric margin in 2015.
|
Temperatures -
Electric sales demand is seasonal to some extent with the annual peak normally occurring in the summer months due to air conditioning usage by residential, commercial and wholesale customers. Electric sales are also impacted to a certain extent in the winter months due to heating requirement usage. HDD data is used to measure the variability of temperatures during winter months and is correlated with both electric and gas sales demand. CDD data is used to measure the variability of temperatures during summer months and is correlated with electric sales demand. HDD and CDD are calculated using a simple average of the high and low temperatures each day compared to a 65 degree base. Normal degree days are calculated using a rolling 20-year average of historical HDD and CDD. HDD and CDD in Alliant Energy’s service territories were as follows:
|
Actual
|
|||||||||||
|
2016
|
2015
|
2014
|
Normal
|
||||||||
|
HDD:
|
|||||||||||
|
Cedar Rapids, Iowa (IPL)
|
5,933
|
|
6,300
|
|
7,657
|
|
6,798
|
|
|||
|
Madison, Wisconsin (WPL)
|
6,420
|
|
6,667
|
|
7,884
|
|
7,082
|
|
|||
|
CDD:
|
|||||||||||
|
Cedar Rapids, Iowa (IPL)
|
971
|
|
732
|
|
670
|
|
766
|
|
|||
|
Madison, Wisconsin (WPL)
|
780
|
|
665
|
|
620
|
|
662
|
|
|||
Estimated increases (decreases) to electric margins from the impacts of temperatures were as follows (in millions):
|
2016
|
2015
|
2014
|
|||||||||
|
IPL
|
|
$3
|
|
|
($7
|
)
|
|
$3
|
|
||
|
WPL
|
1
|
|
(4
|
)
|
5
|
|
|||||
|
Total Alliant Energy
|
|
$4
|
|
|
($11
|
)
|
|
$8
|
|
||
Sales Trends -
Alliant Energy’s retail sales volumes remained unchanged in 2016 and decreased 2% in 2015. During 2016, WPL’s retail sales volumes increased due to the impact of temperatures on residential and commercial sales resulting in higher cooling demand in 2016, an extra day of retail sales during the first quarter of 2016 due to the leap year and higher commercial and industrial sales driven by customer expansions. This increase was offset by a decrease in IPL’s retail sales volumes primarily related to IPL’s sale of its Minnesota electric distribution assets in 2015. The decrease in IPL’s retail sales was partially offset by the impact of temperatures on residential and commercial sales resulting in higher cooling demand in 2016, an extra day of retail sales during the first quarter of 2016 due to the leap year and an increase in commercial sales driven by customer expansion.
The 2015 decrease was primarily due to the impact of temperatures on residential and commercial sales resulting in lower heating demand in 2015 compared to 2014 and decreased retail sales related to IPL’s sale of its Minnesota electric distribution assets in 2015. WPL’s industrial sales volumes increased 3% in 2015 primarily due to production expansion at one of its industrial customers.
Alliant Energy’s wholesale sales volumes increased 12% in
2016
and 1% in
2015
. The increases were primarily due to additional sales from IPL’s wholesale power supply agreement with Southern Minnesota Energy Cooperative effective August 1, 2015. The increases were partially offset by decreased sales to WPL’s partial-requirement wholesale customers that have contractual options to be served by WPL, other power supply sources or the MISO market. Refer to “
Other Future Considerations
” for discussion of notifications provided to each of IPL and WPL to terminate certain of their wholesale power supply agreements.
Alliant Energy’s bulk power and other sales volume changes were largely due to changes in sales in the wholesale energy markets operated by MISO. These changes are impacted by several factors including the availability and dispatch of Alliant Energy’s EGUs and electricity demand within these wholesale energy markets. Changes in bulk power and other sales revenues were largely offset by changes in fuel-related costs, and therefore, did not have a significant impact on electric margins.
35
Electric Production Fuel and Purchased Power (Fuel-related) Expenses -
Fossil fuels, such as natural gas and coal, are burned to produce electricity at EGUs. The cost of fossil fuels used during each period is included in electric production fuel expense. Electricity is also purchased to meet customer demand and these costs are charged to purchased power expense.
Due to IPL’s cost recovery mechanisms for fuel-related expenses, changes in fuel-related expenses resulted in comparable changes in electric revenues, and therefore, did not have a significant impact on Alliant Energy’s and IPL’s electric margins. WPL’s cost recovery mechanism for wholesale fuel-related expenses also provides for adjustments to its wholesale electric rates for changes in commodity costs, thereby mitigating impacts of changes to commodity costs on Alliant Energy’s and WPL’s electric margins.
WPL’s cost recovery mechanism for retail fuel-related expenses supports deferrals of amounts that fall outside an approved bandwidth of plus or minus 2% of forecasted fuel-related expenses determined by the PSCW each year. The difference between revenue collected and actual fuel-related expenses incurred within the bandwidth increases or decreases Alliant Energy’s and WPL’s electric margins. WPL estimates the increase (decrease) to electric margins from amounts within the bandwidth were approximately $6 million, $6 million and ($5) million in 2016, 2015, and 2014, respectively. Refer to
Note 2
for discussion of deferred fuel-related costs that were outside the approved bandwidth incurred in 2016, 2015 and 2014.
Refer to “Other Matters -
Market Risk Sensitive Instruments and Positions
” for further discussion of risks associated with increased fuel-related expenses on WPL’s electric margins. Refer to “
Rate Matters
” and
Note 1(g)
for additional information relating to recovery mechanisms for fuel-related expenses.
2016 vs. 2015 Summary
- Alliant Energy’s electric production fuel expense decreased $56 million in 2016 primarily due to lower dispatch of IPL’s and WPL’s coal-fired EGUs during 2016 due to lower wholesale energy market prices and WPL’s retirement of Nelson Dewey Units 1 and 2 in December 2015. The decrease was also due to changes in the under-/over-collection of fuel-related expenses at IPL and lower natural gas prices. These items were partially offset by changes in the under-/over-collection of fuel-related expenses that were outside the approved bandwidth at WPL.
Alliant Energy’s purchased power expense increased $72 million in 2016 primarily due to increased volumes purchased resulting from lower dispatch of IPL’s and WPL’s coal-fired EGUs during 2016.
2015 vs. 2014 Summary
- Alliant Energy’s electric production fuel expense increased $20 million in 2015 primarily due to changes in the under-/over-collection of fuel-related expenses that were outside the approved bandwidth at WPL. These items were partially offset by lower dispatch of IPL’s coal-fired EGUs during 2015 and changes in the under-/over-collection of fuel-related expenses at IPL.
Alliant Energy’s purchased power expense decreased $59 million in 2015 primarily due to lower prices for electricity purchased by IPL and WPL from MISO wholesale energy markets and decreased volumes purchased due to lower electric sales. The decrease was also due to purchased electric capacity expense at IPL attributed to the previous DAEC PPA, which expired in February 2014.
Electric Transmission Service Expense
- Variances between periods in electric transmission service expense were as follows (in millions):
|
2016 vs. 2015 Summary:
|
Alliant Energy
|
IPL
|
WPL
|
||||||||
|
Higher electric transmission service costs billed from ITC, ATC and MISO primarily due to increased electric transmission service rates
|
|
$35
|
|
|
$18
|
|
|
$17
|
|
||
|
Changes at IPL in the under-/over-collection of electric transmission service expense through the transmission cost rider (a)
|
12
|
|
12
|
|
—
|
|
|||||
|
Changes in WPL’s costs deferred pursuant to escrow treatment for the difference between actual electric transmission service costs and those costs used to determine rates (a)
|
(7
|
)
|
—
|
|
(7
|
)
|
|||||
|
Other
|
3
|
|
2
|
|
1
|
|
|||||
|
|
$43
|
|
|
$32
|
|
|
$11
|
|
|||
36
|
2015 vs. 2014 Summary:
|
Alliant Energy
|
IPL
|
WPL
|
||||||||
|
Higher electric transmission service costs billed from ITC, ATC and MISO primarily due to increased electric transmission service rates
|
|
$18
|
|
|
$6
|
|
|
$12
|
|
||
|
WPL escrow treatment for the difference between actual electric transmission service costs and those costs used to determine rates (a)
|
21
|
|
—
|
|
21
|
|
|||||
|
Other
|
(1
|
)
|
(1
|
)
|
—
|
|
|||||
|
|
$38
|
|
|
$5
|
|
|
$33
|
|
|||
|
(a)
|
Refer to “
Other Future Considerations
” for additional information on sales trends and electric transmission service expense. Refer to “
Rate Matters
” and
Note 2
for information on electric rate increases in 2017.
Utility Gas Margins
-
Gas margins are defined as gas operating revenues less cost of gas sold. Management believes that gas margins provide a more meaningful basis for evaluating utility operations than gas operating revenues since cost of gas sold is generally passed through to customers, and therefore, results in changes to gas operating revenues that are comparable to changes in cost of gas sold. These gas margins may not be comparable to how other entities define utility margin. Gas margins and Dth sales were as follows:
|
Alliant Energy
|
Revenues and Costs (dollars in millions)
|
Dths Sold (Dths in thousands)
|
||||||||||||||||||||||||||
|
2016
|
2015
|
(a)
|
2014
|
(b)
|
2016
|
2015
|
(a)
|
2014
|
(b)
|
|||||||||||||||||||
|
Residential
|
|
$197.6
|
|
|
$215.1
|
|
(8%)
|
|
$287.5
|
|
(25%)
|
25,571
|
|
26,672
|
|
(4%)
|
31,718
|
|
(16%)
|
|||||||||
|
Commercial
|
109.6
|
|
120.5
|
|
(9%)
|
172.8
|
|
(30%)
|
18,820
|
|
18,966
|
|
(1%)
|
23,301
|
|
(19%)
|
||||||||||||
|
Industrial
|
15.2
|
|
14.3
|
|
6%
|
23.4
|
|
(39%)
|
3,352
|
|
2,997
|
|
12%
|
3,710
|
|
(19%)
|
||||||||||||
|
Retail subtotal
|
322.4
|
|
349.9
|
|
(8%)
|
483.7
|
|
(28%)
|
47,743
|
|
48,635
|
|
(2%)
|
58,729
|
|
(17%)
|
||||||||||||
|
Transportation/other
|
33.0
|
|
31.3
|
|
5%
|
33.8
|
|
(7%)
|
77,485
|
|
74,162
|
|
4%
|
64,717
|
|
15%
|
||||||||||||
|
Total revenues/sales
|
355.4
|
|
381.2
|
|
(7%)
|
517.5
|
|
(26%)
|
125,228
|
|
122,797
|
|
2%
|
123,446
|
|
(1%)
|
||||||||||||
|
Cost of gas sold
|
194.3
|
|
219.1
|
|
(11%)
|
327.8
|
|
(33%)
|
||||||||||||||||||||
|
Gas margins (c)
|
|
$161.1
|
|
|
$162.1
|
|
(1%)
|
|
$189.7
|
|
(15%)
|
|||||||||||||||||
|
IPL
|
Revenues and Costs (dollars in millions)
|
Dths Sold (Dths in thousands)
|
||||||||||||||||||||||||||
|
2016
|
2015
|
(a)
|
2014
|
(b)
|
2016
|
2015
|
(a)
|
2014
|
(b)
|
|||||||||||||||||||
|
Residential
|
|
$110.6
|
|
|
$120.0
|
|
(8%)
|
|
$162.5
|
|
(26%)
|
13,788
|
|
14,472
|
|
(5%)
|
17,839
|
|
(19%)
|
|||||||||
|
Commercial
|
61.9
|
|
67.9
|
|
(9%)
|
96.1
|
|
(29%)
|
10,143
|
|
10,166
|
|
—%
|
12,641
|
|
(20%)
|
||||||||||||
|
Industrial
|
10.6
|
|
10.5
|
|
1%
|
17.4
|
|
(40%)
|
2,299
|
|
2,239
|
|
3%
|
2,804
|
|
(20%)
|
||||||||||||
|
Retail subtotal
|
183.1
|
|
198.4
|
|
(8%)
|
276.0
|
|
(28%)
|
26,230
|
|
26,877
|
|
(2%)
|
33,284
|
|
(19%)
|
||||||||||||
|
Transportation/other
|
20.9
|
|
18.9
|
|
11%
|
20.5
|
|
(8%)
|
37,158
|
|
34,129
|
|
9%
|
31,377
|
|
9%
|
||||||||||||
|
Total revenues/sales
|
204.0
|
|
217.3
|
|
(6%)
|
296.5
|
|
(27%)
|
63,388
|
|
61,006
|
|
4%
|
64,661
|
|
(6%)
|
||||||||||||
|
Cost of gas sold
|
111.0
|
|
123.3
|
|
(10%)
|
185.5
|
|
(34%)
|
||||||||||||||||||||
|
Gas margins (c)
|
|
$93.0
|
|
|
$94.0
|
|
(1%)
|
|
$111.0
|
|
(15%)
|
|||||||||||||||||
|
WPL
|
Revenues and Costs (dollars in millions)
|
Dths Sold (Dths in thousands)
|
||||||||||||||||||||||||||
|
2016
|
2015
|
(a)
|
2014
|
(b)
|
2016
|
2015
|
(a)
|
2014
|
(b)
|
|||||||||||||||||||
|
Residential
|
|
$87.0
|
|
|
$95.1
|
|
(9%)
|
|
$125.0
|
|
(24%)
|
11,783
|
|
12,200
|
|
(3%)
|
13,879
|
|
(12%)
|
|||||||||
|
Commercial
|
47.7
|
|
52.6
|
|
(9%)
|
76.7
|
|
(31%)
|
8,677
|
|
8,800
|
|
(1%)
|
10,660
|
|
(17%)
|
||||||||||||
|
Industrial
|
4.6
|
|
3.8
|
|
21%
|
6.0
|
|
(37%)
|
1,053
|
|
758
|
|
39%
|
906
|
|
(16%)
|
||||||||||||
|
Retail subtotal
|
139.3
|
|
151.5
|
|
(8%)
|
207.7
|
|
(27%)
|
21,513
|
|
21,758
|
|
(1%)
|
25,445
|
|
(14%)
|
||||||||||||
|
Transportation/other
|
12.1
|
|
12.4
|
|
(2%)
|
13.3
|
|
(7%)
|
40,327
|
|
40,033
|
|
1%
|
33,340
|
|
20%
|
||||||||||||
|
Total revenues/sales
|
151.4
|
|
163.9
|
|
(8%)
|
221.0
|
|
(26%)
|
61,840
|
|
61,791
|
|
—%
|
58,785
|
|
5%
|
||||||||||||
|
Cost of gas sold
|
83.3
|
|
95.8
|
|
(13%)
|
142.3
|
|
(33%)
|
||||||||||||||||||||
|
Gas margins
|
|
$68.1
|
|
|
$68.1
|
|
—%
|
|
$78.7
|
|
(13%)
|
|||||||||||||||||
|
(a)
|
Reflects the % change from
2015
to
2016
. (b) Reflects the % change from
2014
to
2015
.
|
|
(c)
|
Includes $12 million of gas tax benefit rider credits on IPL’s Iowa retail gas customers’ bills for each of
2016
,
2015
and
2014
. The gas tax benefit rider resulted in reductions in gas revenues that were offset by reductions in income tax expense for
2016
,
2015
and
2014
.
|
37
Variances
- Variances between periods in gas margins were as follows (in millions):
|
2016 vs. 2015 Summary:
|
Alliant Energy
|
IPL
|
WPL
|
||||||||
|
Estimated changes in sales caused by temperatures (Refer to “Temperatures” below for details)
|
|
($3
|
)
|
|
($2
|
)
|
|
($1
|
)
|
||
|
Other
|
2
|
|
1
|
|
1
|
|
|||||
|
|
($1
|
)
|
|
($1
|
)
|
|
$—
|
|
|||
|
2015 vs. 2014 Summary:
|
Alliant Energy
|
IPL
|
WPL
|
||||||||
|
Estimated changes in sales caused by temperatures (Refer to “Temperatures” below for details)
|
|
($14
|
)
|
|
($7
|
)
|
|
($7
|
)
|
||
|
Lower revenues at IPL related to changes in recovery amounts for energy efficiency costs through the energy efficiency rider (a)
|
(9
|
)
|
(9
|
)
|
—
|
|
|||||
|
Lower revenues at WPL due to the impact of changes in retail gas base rates effective January 2015
|
(4
|
)
|
—
|
|
(4
|
)
|
|||||
|
Other
|
(1
|
)
|
(1
|
)
|
—
|
|
|||||
|
|
($28
|
)
|
|
($17
|
)
|
|
($11
|
)
|
|||
|
(a)
|
Changes in gas energy efficiency revenues were mostly offset by changes in energy efficiency expense included in other operation and maintenance expenses.
|
Temperatures -
Gas sales demand follows a seasonal pattern with an annual base load of gas and a large heating peak occurring during the winter season. HDD data is used to measure the variability of temperatures during winter months and is correlated with gas sales demand. Refer to “Utility Electric Margins” for HDD data details. Estimated increases (decreases) to gas margins from the impacts of temperatures were as follows (in millions):
|
2016
|
2015
|
2014
|
|||||||||
|
IPL
|
|
($4
|
)
|
|
($2
|
)
|
|
$5
|
|
||
|
WPL
|
(3
|
)
|
(2
|
)
|
5
|
|
|||||
|
Total Alliant Energy
|
|
($7
|
)
|
|
($4
|
)
|
|
$10
|
|
||
Cost of Gas Sold -
Alliant Energy’s cost of gas sold decreased $25 million in
2016
and $109 million in
2015
. The decrease in 2016 was primarily due to lower natural gas prices. The decrease in 2015 was primarily due to lower retail gas volumes at IPL and WPL caused by temperatures discussed above and lower natural gas prices. Refer to
Note 1(g)
for additional information relating to natural gas cost recoveries.
Refer to
Note 2
for information on gas rate increases in 2017.
Other Utility Revenues
-
Variances between periods in utility other revenues were as follows (in millions):
|
2016 vs. 2015 Summary:
|
Alliant Energy
|
IPL
|
WPL
|
||||||||
|
Lower steam sales
|
|
($3
|
)
|
|
($3
|
)
|
|
$—
|
|
||
|
Other
|
(6
|
)
|
(4
|
)
|
(3
|
)
|
|||||
|
|
($9
|
)
|
|
($7
|
)
|
|
($3
|
)
|
|||
|
2015 vs. 2014 Summary:
|
Alliant Energy
|
IPL
|
WPL
|
||||||||
|
Lower margins from IPL’s sharing mechanism related to optimizing gas capacity contracts (a)
|
|
($5
|
)
|
|
($5
|
)
|
|
$—
|
|
||
|
Other
|
(3
|
)
|
—
|
|
(3
|
)
|
|||||
|
|
($8
|
)
|
|
($5
|
)
|
|
($3
|
)
|
|||
|
(a)
|
Approximately 50% of all margins earned from IPL’s sharing mechanism relating to optimizing gas capacity contracts flow through the gas adjustment clause to reduce retail gas customer bills in Iowa. The remaining margins are retained by IPL and recorded in utility other revenues. Due to the extreme cold temperatures causing natural gas price fluctuations in the first quarter of 2014, margins were higher than normal in 2014.
|
Non-regulated Revenues
-
Alliant Energy’s non-regulated revenues decreased $9 million in 2015, primarily due to decreased revenues at Transportation resulting from decreased demand for freight, barge and transfer services.
38
Asset Valuation Charges for Franklin County Wind Farm
-
Refer to
Note 3
for details of asset valuation charges recorded in 2016 by Alliant Energy for the Franklin County wind farm.
Other Operation and Maintenance Expenses
- Variances between periods in other operation and maintenance expenses were as follows (in millions):
|
2016 vs. 2015 Summary:
|
Alliant Energy
|
IPL
|
WPL
|
||||||||
|
Lower energy efficiency cost recovery amortizations at WPL (a)
|
|
($15
|
)
|
|
$—
|
|
|
($15
|
)
|
||
|
Losses on sales of IPL’s Minnesota distribution assets recorded in 2015 (Refer to
Note 3
for details)
|
(14
|
)
|
(14
|
)
|
—
|
|
|||||
|
Voluntary employee separation charges in 2015 (Refer to
Note 12(a)
for details)
|
(8
|
)
|
(5
|
)
|
(3
|
)
|
|||||
|
Higher bad debt expense at IPL (b)
|
9
|
|
9
|
|
—
|
|
|||||
|
Higher stock-based performance compensation expense (Refer to
Note 12(b)
for details)
|
7
|
|
4
|
|
3
|
|
|||||
|
Higher employee benefits-related expense (c)
|
7
|
|
5
|
|
2
|
|
|||||
|
Other (includes lower costs due to cost controls and operational efficiencies)
|
(9
|
)
|
(5
|
)
|
(3
|
)
|
|||||
|
|
($23
|
)
|
|
($6
|
)
|
|
($16
|
)
|
|||
|
2015 vs. 2014 Summary:
|
Alliant Energy
|
IPL
|
WPL
|
||||||||
|
Lower energy efficiency cost recovery amortizations at WPL (a)
|
|
($38
|
)
|
|
$—
|
|
|
($38
|
)
|
||
|
Lower generation expense (d)
|
(13
|
)
|
(2
|
)
|
(11
|
)
|
|||||
|
Changes in energy efficiency expense at IPL (e)
|
(5
|
)
|
(5
|
)
|
—
|
|
|||||
|
Losses on sales of IPL’s Minnesota distribution assets recorded in 2015 (Refer to
Note 3
for details)
|
14
|
|
14
|
|
—
|
|
|||||
|
Higher employee benefits-related expense (c)
|
14
|
|
7
|
|
7
|
|
|||||
|
Voluntary employee separation charges in 2015 (Refer to
Note 12(a)
for details)
|
8
|
|
5
|
|
3
|
|
|||||
|
Other (includes lower costs due to cost controls and operational efficiencies)
|
(16
|
)
|
(10
|
)
|
(3
|
)
|
|||||
|
|
($36
|
)
|
|
$9
|
|
|
($42
|
)
|
|||
|
(a)
|
The July 2014 PSCW order for WPL’s 2015/2016 Test Period electric and gas base rate case authorized lower energy efficiency cost recovery amortizations for 2015 and 2016. The July 2012 PSCW order for WPL’s 2013/2014 Test Period electric and gas base rate case authorized changes in energy efficiency cost recovery amortizations for 2014. Regulatory amortizations at WPL related to energy efficiency costs were ($11) million, $4 million and $42 million in 2016, 2015 and 2014, respectively.
|
|
(b)
|
Primarily due to an increase in IPL’s allowance for doubtful accounts as a result of increases in past due accounts receivable.
|
|
(c)
|
Primarily due to an increase in retirement plans costs and other employee benefits-related costs. The increased retirement plan costs in 2016 were largely due to lower than expected returns on plan assets in 2015. The increased retirement plan costs in 2015 were largely due to decreases in discount rates and a change to life expectancy assumptions in 2014.
|
|
(d)
|
Primarily due to the timing and extent of maintenance projects at IPL’s and WPL’s EGUs.
|
|
(e)
|
Changes in IPL’s energy efficiency expense were offset by changes in electric and gas energy efficiency revenues.
|
Depreciation and Amortization Expenses
-
Variances between periods in depreciation and amortization expenses were as follows (in millions):
|
2016 vs. 2015 Summary:
|
Alliant Energy
|
IPL
|
WPL
|
||||||||
|
Higher amortization expense from the new customer billing and information system placed in service in 2015
|
|
$8
|
|
|
$4
|
|
|
$4
|
|
||
|
Lower depreciation expense from the sale of IPL’s Minnesota distribution assets in 2015
|
(3
|
)
|
(3
|
)
|
—
|
|
|||||
|
Other (includes the impact of property additions)
|
5
|
|
3
|
|
4
|
|
|||||
|
|
$10
|
|
|
$4
|
|
|
$8
|
|
|||
|
2015 vs. 2014 Summary:
|
Alliant Energy
|
IPL
|
WPL
|
||||||||
|
Higher depreciation expense for IPL’s Ottumwa Unit 1 scrubber and baghouse placed in service in 2014
|
|
$5
|
|
|
$5
|
|
|
$—
|
|
||
|
Other (includes the impact of other property additions)
|
8
|
|
5
|
|
3
|
|
|||||
|
|
$13
|
|
|
$10
|
|
|
$3
|
|
|||
39
Interest Expense
- Variances between periods in interest expense were as follows (in millions):
|
2016 vs. 2015 Summary:
|
Alliant Energy
|
IPL
|
WPL
|
||||||||
|
Higher interest expense from the issuance of IPL’s $250 million, 3.4% senior debentures in August 2015
|
|
$5
|
|
|
$5
|
|
|
$—
|
|
||
|
Other
|
4
|
|
1
|
|
(1
|
)
|
|||||
|
|
$9
|
|
|
$6
|
|
|
($1
|
)
|
|||
|
2015 vs. 2014 Summary:
|
Alliant Energy
|
IPL
|
WPL
|
||||||||
|
Higher interest expense from the issuance of WPL’s $250 million, 4.1% debentures in October 2014
|
|
$8
|
|
|
$—
|
|
|
$8
|
|
||
|
Higher interest expense from the issuance of IPL’s $250 million, 3.25% senior debentures in November 2014
|
8
|
|
8
|
|
—
|
|
|||||
|
Lower interest expense from the retirement of Alliant Energy’s $250 million, 4% senior notes in October 2014
|
(8
|
)
|
—
|
|
—
|
|
|||||
|
Other
|
(1
|
)
|
(1
|
)
|
(2
|
)
|
|||||
|
|
$7
|
|
|
$7
|
|
|
$6
|
|
|||
Refer to
Note 9
for additional details of debt.
Equity Income from Unconsolidated Investments, Net
-
In 2016, Alliant Energy’s and WPL’s equity income from unconsolidated investments increased $6 million and $5 million, respectively, primarily due to higher ATC income and lower reserves for rate refunds recorded at ATC in 2016 compared to 2015. In 2015, Alliant Energy’s and WPL’s equity income from unconsolidated investments decreased $7 million and $8 million, respectively, primarily due to reserves for rate refunds recorded at ATC in 2015. Refer to “
Other Future Considerations
” for discussion of a complaint pending with FERC regarding the level of return on equity that MISO transmission owners (including ATC) should be allowed to utilize in calculating the rates they charge their customers. Refer to
Note 6(a)
for discussion of WPL’s transfer of its investment in ATC to ATI.
AFUDC
-
Refer to
Note 3
for details of AFUDC recognized in
2016
,
2015
and
2014
.
Income Taxes
-
Refer to
Note 11
for details of effective income tax rates for continuing operations.
Loss from Discontinued Operations, Net of Tax
-
Refer to
Note 19
for discussion of discontinued operations.
STRATEGIC OVERVIEW
Strategic Plan
- The strategic plan focuses on creating customer growth and value across IPL’s and WPL’s service territories. Customers have evolving expectations and access to increasingly competitive alternatives for energy. As a result, providing customized energy solutions while aggressively managing customer prices remains at the center of the strategic plan. Successful implementation of the strategic plan will result in increased earnings for Alliant Energy, IPL and WPL while limiting cost increases for IPL’s and WPL’s customers. The strategic plan is built upon two key elements: Growth and Optimization.
Growth
- The growth element of the strategic plan includes accelerating the growth of customers’ electric and gas usage and expanding the portfolio of energy resources with additional clean and renewable energy. Increasing electric and gas usage in IPL’s and WPL’s service territories is expected to help minimize individual customer prices, and expanding clean and renewable energy will help customers meet sustainability objectives and reduce Alliant Energy’s carbon emissions.
Accelerate Electric and Gas Growth
- Actions to accelerate the growth of customers’ electric and gas usage include: retention of current customers and growth of new customers, economic development opportunities designed to attract new customers, and efforts to promote additional markets for electricity and gas, such as the electrification of the transportation sector (e.g. electric vehicles).
To help support retention and growth of current customers, the strategic plan focuses on promoting energy efficiency and using new and existing technologies and customized energy solutions, which are expected to help reduce energy costs, provide flexibility, increase productivity and help customers achieve sustainability objectives.
Economic development across Iowa and Wisconsin is focused on attracting new businesses by providing planning resources and energy solutions that encourage companies to invest in IPL’s and WPL’s service territories. For example, the Big Cedar
40
Industrial Center announced in November 2016 is a 1,300 acre rail-served manufacturing and industrial site in Iowa. This ready-to-build site is in close proximity to regional airport and interstate freeways and offers access to IPL’s electric and gas services. In addition, investments are expected to be made to extend various gas transmission and distribution systems in IPL’s and WPL’s service territories to serve new customer demand for natural gas.
Expand Clean and Renewable Energy
- The expansion of clean and renewable energy contributes to a more diverse energy portfolio and reduces emissions from EGUs. Alliant Energy is currently constructing two highly efficient natural gas-fired combined-cycle EGUs and is also focused on expanding its renewable generation portfolio with wind and solar. These new generation projects are expected to increase customer access to low-cost energy resources, and also support the retirement of various older, smaller and less efficient coal-fired EGUs, resulting in Alliant Energy reducing its carbon emissions and helping customers meet sustainability initiatives.
Optimization
- The second key element of the strategic plan focuses resources on providing reliable electric and natural gas service to customers in IPL’s and WPL’s service territories through continued modernization of the power grid and gas distribution system and optimization of the generation fleet. Modernizing and optimizing the distribution and generation assets is expected to maximize the value of Alliant Energy’s existing infrastructure, expand customer options, and be more price-competitive and market-responsive for customers. For example, customer engagement initiatives include new pricing options and enhanced communication through mobile devices for customers.
Alliant Energy is modernizing the power grid to accommodate a growing two-way flow of electricity and information. This includes targeting investments in replacing and upgrading aging infrastructure in the electric distribution system. This also includes making investments in advanced metering infrastructure and a customer billing and information system, which support the integration of new technologies, as well as improving the security, reliability and resiliency of the power grid.
Since 2010, Alliant Energy has retired or fuel-switched approximately one-third of its older, smaller, less efficient and more costly coal-fired EGUs, and has made investments in its newer, more efficient coal-fired EGUs. Alliant Energy is also investing in responsive and cost-effective natural gas-fired generation, which complements its growing investments in renewable energy. These investments are expected to help reduce cost and provide competitively-priced electricity for customers.
Generation Plans
-
A diversified fuel mix for EGUs is important to meeting the energy needs of customers and also recognizes the importance of using resources in efficient and environmentally responsible ways for the benefit of future generations. The current strategic plan includes the following portfolio of energy resources:
|
•
|
Natural gas
- constructing and/or converting to natural gas-fired EGUs.
|
|
•
|
Renewables
- operating wind farms, solar projects and hydroelectric generators, as well as developing future wind sites and solar projects.
|
|
•
|
PPAs
- purchasing electricity to meet a portion of customers’ demand for electricity, including wind, solar power and nuclear generation PPAs.
|
|
•
|
Coal
- implementing environmental controls and generation performance and reliability improvements at newer, larger and more efficient coal-fired EGUs, and fuel switching at, and retirement of, certain older, smaller and less efficient coal-fired EGUs.
|
Increasing levels of energy produced by natural gas-fired EGUs, wind farms and other renewable energy resources, and installing environmental controls at the more efficient coal-fired EGUs, result in significant environmental benefits. As a result of these efforts, SO2 and NOx emissions are currently expected to be reduced by approximately 90% and 80%, respectively, from 2005 levels by 2020. Mercury emissions are currently expected to be reduced by approximately 90% from 2009 levels by 2020. CO2 emissions have been reduced by approximately 22% from 2005 levels and are currently expected to be reduced by 40% from 2005 levels by 2030.
Generation plans are reviewed and updated as deemed necessary and in accordance with regulatory requirements. Alliant Energy, IPL and WPL are currently evaluating the types of capacity and energy additions they will pursue to meet their customers’ long-term energy needs and are monitoring several related external factors that could influence those evaluations. Environmental compliance plans have also been developed to ensure cost effective compliance with current and proposed environmental laws and regulations impacting existing EGUs. Some of the external factors impacting these plans include regulatory policies and decisions; changes in long-term projections of customer demand; availability and cost effectiveness of different generation and emission reduction technologies; developments related to environmental regulations; settlements reached with environmental agencies and citizens groups; forward market prices for fossil fuels and electricity; market conditions for obtaining financing; developments related to federal and state renewable portfolio standards; environmental
41
requirements, such as any future requirements relating to GHG emissions or renewable energy sources; and federal and state tax incentives. Refer to “
Environmental Matters
” for details of current and proposed environmental regulations and requirements.
Natural Gas-Fired Generation -
IPL’s Construction of Marshalltown
- In 2013, the IUB issued an order approving a siting certificate and establishing rate-making principles for IPL’s construction of an approximate
650
MW natural gas-fired combined-cycle EGU in Marshalltown, Iowa, referred to as Marshalltown. In 2013, IPL accepted the IUB’s rate-making principles, which include the following:
|
•
|
An 11% return on common equity for the 35-year depreciable life of Marshalltown and a 10.3% return on common equity for the calculation of AFUDC related to the construction of Marshalltown.
|
|
•
|
The application of double leverage is deferred until IPL’s next retail electric base rate case, which is expected to be filed in the second quarter of 2017 based on a 2016 historical Test Year.
|
IPL began constructing Marshalltown in 2014 after receiving the final necessary regulatory approvals and permits, and expects to place the EGU in service in April 2017. Capital expenditures are currently estimated to be approximately $670 million to construct the EGU and a pipeline to supply natural gas to the EGU, excluding transmission network upgrades and AFUDC.
Marshalltown will replace energy and capacity being eliminated with the planned 2017 retirements of Sutherland Units 1 and 3, Fox Lake Units 1 and 3, Burlington Combustion Turbines Units 1-4, Dubuque Units 3 and 4, Centerville Combustion Turbines Units 1 and 2, and Grinnell Combustion Turbines Units 1 and 2, which in aggregate have a nameplate capacity of approximately 460 MW.
IPL executed an engineering, procurement and construction contract for Marshalltown after a competitive bidding process. In September 2016, Marshalltown’s engineering, procurement and construction contractor announced that costs to construct Marshalltown will exceed its expectations and that it expects to seek compensation from vendors performing work on Marshalltown. IPL does not currently anticipate it will be responsible for these increased costs.
ITC is constructing the majority of the required transmission network upgrades for Marshalltown and has elected to pursue an option under the terms of MISO’s Attachment “X” tariff to self-fund these transmission network upgrades. As a result, ITC will incur the capital expenditures to construct the transmission network upgrades and include a direct charge for such transmission network upgrade costs as part of its electric transmission service costs billed to IPL as the owner of Marshalltown.
Refer to
Note 3
for further discussion of Marshalltown.
WPL’s Construction of the Riverside Expansion
- In 2016, WPL received an order from the PSCW authorizing WPL to construct an approximate 730 MW natural gas-fired combined-cycle EGU in Beloit, Wisconsin, referred to as the Riverside expansion. In 2016, WPL executed a design, engineering, procurement and construction contract for the Riverside expansion. After receiving the final necessary regulatory approvals and permits in the third quarter of 2016, WPL began constructing the Riverside expansion. WPL currently expects to place the EGU in service by early 2020. WPL’s estimated portion of capital expenditures is expected to be approximately $640 million. The capital expenditures include costs to construct the EGU and a pipeline to supply natural gas to the EGU, and exclude transmission network upgrades and AFUDC.
The Riverside expansion will replace energy and capacity being eliminated with the 2015 retirements of Nelson Dewey Units 1 and 2 and Edgewater Unit 3, and the planned retirements of Edgewater Unit 4 and the Rock River and Sheepskin Combustion Turbine Units, which in aggregate have a nameplate capacity of approximately 700 MW.
WPL entered into agreements with neighboring utilities and electric cooperatives that provide each of the neighboring utilities and electric cooperatives options to purchase a partial ownership interest in the Riverside expansion. The purchase price for such options is based on the ownership interest acquired and the net book value of the Riverside expansion on the date of the purchase. The exercise of each option is subject to PSCW approval, and the timing and ownership amounts of the options are as follows:
42
|
Counterparty
|
Option Amount
|
Option Timing
|
||
|
Wisconsin Public Service Corporation (WPSC)
|
up to 200 MW (no more than 100 MW to be acquired in first two years) (a)
|
2020-2024 (b)
|
||
|
Madison Gas and Electric Company (MGE)
|
up to 50 MW (no more than 25 MW to be acquired in first two years)
|
2020-2025 (b)
|
||
|
Electric cooperatives
|
approximately 65 MW
|
During construction of the EGU
|
||
|
(a)
|
If WPSC exercises its options, WPL may exercise reciprocal options, subject to approval by the PSCW, to purchase up to 200 MW of any natural-gas combined-cycle EGU that either WPSC or its affiliated utility, Wisconsin Electric Power Company (Wisconsin Electric), places in service within 10 years of the date the Riverside expansion is placed in service.
|
|
(b)
|
Assumes an in-service date in early 2020.
|
WPSC and MGE Options
- In conjunction with the agreements WPL entered into with WPSC and MGE associated with the Riverside expansion, WPL also entered into amendments to the Columbia joint operating agreement. In November 2016, WPL received an order from the PSCW approving amendments to the Columbia joint operating agreement, which allow WPSC and MGE to forgo certain capital expenditures at Columbia. Based on the additional capital expenditures WPL currently expects to incur through June 1, 2020, WPL’s ownership interest in Columbia is expected to increase from 46.2% to 53.4%. Refer to
Note 4
for further discussion of these amendments.
In addition to the provisions described above, the agreement WPL entered into with Wisconsin Electric and WPSC provided for the following:
|
•
|
Riverside Expansion Market Participation Date
- WPL agreed that the Riverside expansion would not enter the MISO capacity market prior to the date set by MISO for qualifying generation as a capacity asset for the MISO planning year beginning June 1, 2020.
|
|
•
|
WPL and Wisconsin Electric Capacity Agreement
- In the second quarter of 2016, WPL and Wisconsin Electric executed a capacity agreement whereby WPL would purchase specified levels of capacity from Wisconsin Electric from June 1, 2017 through May 31, 2020.
|
|
•
|
Renewable Generation Joint Development Agreement
- In June 2016, WPL, Wisconsin Electric and WPSC executed a separate joint development agreement for the purpose of cooperatively developing any renewable resources greater than 50 MW in Wisconsin for the benefit of their respective customers. The agreement has a 10-year term beginning June 1, 2016, and the utility that originates such renewable resource would hold a majority ownership and operational control of the renewable resource. The other two utilities would have the right to acquire a minority interest in the other utility’s renewable resource.
|
Electric Cooperatives’ Options
- In November 2016, various electric cooperatives, which currently have wholesale power supply agreements with WPL, notified WPL of their intent to exercise options to acquire approximately 65 MW of the Riverside expansion while the EGU is being constructed. Upon exercise of such options, the current wholesale power supply agreements with the various electric cooperatives will be extended by at least four years until 2026 with automatic continuation of such agreements unless terminated by either party, with a five-year notice requirement.
Wind Generation -
The strategic plan includes the planned and potential addition of wind generation as follows (in MW). Estimated capital expenditures for the planned and potential wind generation projects for 2017 through 2020 are included in the “Renewable projects” line in the construction and acquisition expenditures table in “
Liquidity and Capital Resources
.”
|
Status
|
IPL
|
WPL
|
||||||
|
Expansion of wind generation
|
Approved by IUB
|
500
|
|
N/A
|
|
|||
|
Expansion of wind generation
|
Planned
|
200
|
|
200
|
|
|||
|
Transfer of Franklin County wind farm assets from AEF to IPL
|
Approved by FERC
|
99
|
|
N/A
|
|
|||
IPL’s Expansion of Wind Generation
- In October 2016, IPL and the Iowa Office of Consumer Advocate, among other customer groups, filed a settlement agreement with the IUB regarding the appropriate rate-making principles for up to 500 MW of additional wind generation at IPL. In October 2016, the IUB issued an order approving the settlement agreement, with limited modifications, and establishing rate-making principles, which IPL accepted, as follows:
43
|
•
|
Up to 500 MW of additional wind generation that qualifies for the full level of production tax credits, regardless of the location in Iowa, with a cost cap of $1,830/kilowatt, including AFUDC and transmission costs. Any costs incurred in excess of this $1,830/kilowatt cost cap are expected to be incorporated into rates if determined to be reasonable and prudent.
|
|
•
|
A depreciable life of the wind generation of 40 years, unless changed as a result of a contested case before the IUB.
|
|
•
|
An 11.0% return on common equity, with the exception of certain transmission facilities classified as intangible assets, which would earn the rate of return on common equity the IUB finds reasonable during a future rate case.
|
|
•
|
A return on common equity for the calculation of AFUDC during the construction period that is the greater of 10.0% or the percentage the IUB finds reasonable during IPL’s next rate case.
|
|
•
|
The application of double leverage is deferred until IPL’s next retail electric base rate case or other future proceeding.
|
|
•
|
Amortization over a 10-year period of IPL’s prudently incurred and unreimbursed costs, effective with IPL’s next retail electric base rate case, if IPL cancels the construction of the wind generation.
|
IPL anticipates placing the 500 MW of additional wind generation in service in 2019 and 2020.
Franklin County Wind Farm
- In addition to IPL’s expansion of wind generation discussed above, refer to
Note 3
for discussion of a February 2017 FERC order approving the transfer of the 99 MW Franklin County wind farm from AEF to IPL. The Franklin County wind farm began generating electricity in 2012. AEF is currently selling the electricity output from the wind farm into the MISO market as a merchant generator.
IPL’s and WPL’s Potential Expansion of Wind Generation
- In addition to IPL’s 500 MW expansion of wind generation and transfer of the 99 MW Franklin County wind farm to IPL in 2017 discussed above, IPL and WPL are each exploring options to own and operate up to 200 MW of additional new wind generation. IPL and WPL currently plan to file the necessary applications for the new wind generation with the IUB and the PSCW, respectively, in the third quarter of 2017. Alliant Energy continues to review and evaluate the final amount and timing of this potential additional expansion of wind generation for IPL and WPL, which is subject to change pending further evaluation.
In 2016, IPL and WPL entered into wind turbine supply agreements and made progress payments for a portion of the wind turbines in such agreements in order to be eligible for the full level of production tax credits from the electricity generated during the first 10 years of operation of future wind projects. IPL and WPL believe the progress payments in 2016 are sufficient to be eligible for the full level of production tax credits for all 900 MW of new wind generation in its current plan.
IPL has on-going project development associated with approximately 400 MW of wind site capacity in Franklin County, Iowa. Approximately 200 MW of this additional site capacity is expected to be included in the future wind expansion. WPL has on-going project development associated with approximately 120 MW of wind capacity in Freeborn County, Minnesota, which may be further expanded to 200 MW.
Solar Generation -
In 2016, WPL began providing customers with energy from the 2.3 MW Rock River solar project through a 10-year PPA. The solar field is located at WPL’s Rock River landfill site in Beloit, Wisconsin. In 2017, IPL expects to install approximately 6 MW of solar arrays in Dubuque, Iowa.
Coal-Fired Generation -
Environmental Controls Projects
- The strategic plan includes adding environmental controls at newer, larger and more efficient coal-fired EGUs to continue producing affordable energy for customers and to benefit the environment. Current projects include installing SCRs at IPL’s Ottumwa Unit 1 and WPL’s Columbia Unit 2 to achieve compliance obligations under CSAPR and the Consent Decrees. SCR is a post-combustion process that injects ammonia or urea into the stream of gases leaving the EGU boiler to convert NOx emissions into nitrogen and water. The use of a catalyst enhances the effectiveness of the conversion, enabling NOx emissions reductions of up to 90%. Refer to
Note 16(e)
for discussion of the Consent Decrees.
IPL
- Under Iowa law, IPL is required to file an EPB biennially. Filing of periodic reports regarding the implementation of IPL’s compliance plan and related budget identified in an EPB is also currently required under a settlement agreement between IPL and the Iowa Office of Consumer Advocate, among others. An EPB provides a utility’s compliance plan and related budget for managing regulated emissions from its coal-fired EGUs in a cost-effective manner. IUB approval of an EPB demonstrates that the EPB is reasonably expected to achieve cost-effective compliance with applicable state environmental requirements. In April 2016, IPL filed its most recent EPB with the IUB, which includes the SCR for Ottumwa Unit 1. A decision from the IUB is currently expected in 2017. The SCR at Ottumwa Unit 1 is currently expected to be placed in service in 2018, with an estimated total project cost of $65 million to $80 million.
44
WPL
- WPL must file a CA application and receive authorization from the PSCW to proceed with any individual environmental controls project with an estimated project cost of $10.7 million or more. WPL is currently constructing the SCR at Columbia Unit 2 pursuant to a 2015 PSCW order and expects to place it in service in 2018, with an estimated total (past and future) project cost of $40 million to $60 million. Refer to
Note 3
for discussion of a scrubber and baghouse project at WPL’s Edgewater Unit 5, which was completed in July 2016.
Generation Improvement Projects
- The strategic plan includes investments in generation maintenance and performance improvements at newer, larger and more efficient coal-fired EGUs, including WPL’s Columbia Units 1 and 2.
Columbia Units 1 and 2
- In 2015, WPL began constructing generation maintenance and performance improvements at Columbia Units 1 and 2, pursuant to PSCW orders. WPL’s portion of the total capital expenditures for the projects, excluding AFUDC, is currently estimated to be between $70 million and $80 million. WPL currently expects to place the various projects in service by the end of 2017.
Estimated capital expenditures for the environmental controls and generation improvement projects for 2017 through 2020 are included in the “Generation - Other” line in the construction and acquisition expenditures table in “
Liquidity and Capital Resources
.” Such estimates represent IPL’s or WPL’s respective portion of the total escalated capital expenditures and exclude AFUDC, if applicable. Capital expenditure estimates are subject to change based on future changes to plant-specific costs of environmental controls technologies and environmental requirements.
Plant Retirements and Fuel Switching
- The current strategic plan includes the retirement, or fuel switch from coal to natural gas, of several older, smaller and less efficient EGUs in the next several years. The plan includes the following EGUs, with net book values as of
December 31, 2016
(dollars in millions; Combustion Turbine (CT)). Refer to “Properties” in
Item 2
for additional details, including nameplate capacity.
|
IPL
|
WPL
|
|||||||||||||
|
Expected
|
Net Book
|
Expected
|
Net Book
|
|||||||||||
|
EGU
|
Action
|
Value
|
EGU
|
Action
|
Value
|
|||||||||
|
Sutherland Units 1 and 3
|
Retire by 6/30/17
|
|
$43
|
|
Edgewater Unit 4
|
Retire by 12/31/18
|
|
$37
|
|
|||||
|
Dubuque Units 3 and 4
|
Retire by 6/30/17
|
5
|
|
Rock River CT Units 3-6
|
Retire by 12/31/20
|
2
|
|
|||||||
|
Prairie Creek Unit 4
|
Fuel switch by 12/31/17
|
52
|
|
Sheepskin CT Unit 1
|
Retire by 12/31/20
|
—
|
|
|||||||
|
Marshalltown CT Units 1-3
|
Fuel switch by 12/31/17
|
4
|
|
|||||||||||
|
Fox Lake Unit 1 and 3
|
Retire by 12/31/17
|
2
|
|
|||||||||||
|
Other units
|
Retire by 12/31/17
|
1
|
|
|||||||||||
|
Red Cedar CT Unit 1
|
Retire by 12/31/18
|
4
|
|
|||||||||||
|
Burlington Unit 1
|
Fuel switch by 12/31/21
|
62
|
|
|||||||||||
|
Prairie Creek Units 1 and 3
|
Fuel switch or retire by 12/31/25
|
94
|
|
|||||||||||
Alliant Energy, IPL and WPL are working with MISO, state regulatory commissions and other regulatory agencies, as required, to determine the final timing of these actions. The expected dates for the retirement and fuel switching of these EGUs are subject to change depending on operational, regulatory, market and other factors. The potential retirement of other EGUs within the generation fleet continues to be evaluated.
Electric and Gas Distribution Systems
- The strategic plan includes investments targeted at replacing, modernizing and upgrading aging infrastructure in the electric and gas distribution systems. Estimated capital expenditures for expected and current electric and gas distribution infrastructure projects for 2017 through 2020 are included in the “Electric and gas distributions systems” lines in the construction and acquisition expenditures table in “
Liquidity and Capital Resources
.”
Gas Pipeline Expansion -
IPL currently expects to place the Clinton natural gas pipeline, located in Scott and Clinton Counties in Iowa, which provides capacity for anticipated customer growth in Clinton County, into service in March 2017.
Pipeline and Hazardous Materials Safety Administration -
In April 2016, the Pipeline and Hazardous Materials Safety Administration published proposed regulations to update safety requirements for gas transmission pipelines, which would add new assessment and repair criteria for gas pipelines, and require a systematic approach to verify a pipeline’s maximum allowable operating pressure. Alliant Energy, IPL and WPL currently anticipate final regulations will be issued in 2017. Given that the Pipeline and Hazardous Materials Safety Administration has not finalized these gas transmission regulations, Alliant Energy, IPL and WPL are currently unable to predict with certainty the impact of these regulations on their financial condition and results of operations. In anticipation of these pending rule changes, Alliant Energy, IPL and WPL have started proactively replacing certain of IPL’s transmission pipelines and making modifications to certain of WPL’s transmission pipelines.
45
Advanced Metering Infrastructure (AMI) -
IPL currently plans to install AMI in its electric and gas service territories in Iowa through a phased approach from 2017 through 2019. AMI is a system of meters, communications networks and data management systems that enables two-way communication between utilities and its customers. AMI allows for remote meter reading, automatic outage notification, and remote disconnects and reconnects. AMI technology is expected to improve customer service, enhance energy management initiatives and provide operational savings through increased efficiencies.
Non-regulated Operations
-
The strategic plan for Alliant Energy’s non-regulated operations involves maintaining a modest portfolio of businesses that are accretive to earnings and cash flows but not significant users of capital.
RATE MATTERS
Overview
-
IPL and WPL are subject to federal regulation by FERC, which has jurisdiction over wholesale electric rates and certain natural gas facilities, and state regulation in Iowa and Wisconsin for retail utility rates and standards of service. Such regulatory oversight also covers IPL’s and WPL’s plans for construction and financing of new EGUs and related activities.
Retail Base Rate Filings
-
Base rate changes reflect both returns on additions to infrastructure and recovery of changes in costs incurred or expected to be incurred. Given that a portion of the rate changes will offset changes in costs, revenues from rate changes should not be expected to result in an equal change in net income for either IPL or WPL.
WPL’s Wisconsin Retail Electric and Gas Rate Case (2017/2018 Test Period) -
In December 2016,
WPL received an order from the PSCW authorizing WPL to implement an increase in annual retail electric rates of $9 million, or approximately 1%, and an increase in annual retail gas rates of $9 million, or approximately 13%. The $9 million net annual retail electric rate increase reflects a $60 million increase in base rates, partially offset by a $51 million reduction in fuel-related costs, using an estimate for 2017 fuel-related costs. These increases are effective January 1, 2017 and extend through the end of 2018. The increases reflect recovery of the costs for environmental controls projects at Edgewater and Columbia, and investments in electric and gas distribution systems, including expansion of natural gas pipeline infrastructure. These rate increases were partially offset by utilization of amounts that WPL previously over-recovered from its customers for energy efficiency cost recovery and electric transmission cost recovery, as well as amounts deferred under the return on common equity sharing mechanism for the 2013/2014 Test Period. The order included a return on common equity of 10.0% and continues a regulatory return on common equity sharing mechanism, whereby WPL must defer a portion of its earnings if its annual regulatory return on common equity exceeds 10.25% during the 2017 and 2018 Test Period. WPL must defer 50% of its excess earnings between 10.25% and 11.00%, and 100% of any excess earnings above 11.00%. Refer to
Note 7
for details of WPL’s regulatory limitation on distributions of common stock dividends to its parent company in 2017 and 2018.
The order reflected the impact of the transfer of WPL’s investment in ATC to ATI on December 31, 2016 as discussed in
Note 6(a)
, approved changes to depreciation rates pursuant to a September 2016 PSCW order, continued escrow treatment of transmission and energy conservation charges, and application of AFUDC rates to 100% of the retail portion of the CWIP balances for the Riverside expansion. The order also requires deferral of any potential changes in revenue requirement due to anticipated increases in WPL’s ownership share of Columbia resulting from the Riverside expansion agreements WPL previously entered into with neighboring utilities. The order also approved changes to retail rates, which result in a higher percentage of costs being recovered from customers through fixed and demand charges.
The fuel-related cost component of WPL’s retail electric rates for 2018 will be addressed in a separate filing, which is currently expected to be filed in the second or third quarter of 2017.
WPL’s Wisconsin Retail Electric and Gas Rate Case (2015/2016 Test Period) -
Refer to
Note 2
for details of a July 2014 PSCW order, which included a provision that required WPL to defer a portion of its earnings if its annual regulatory return on common equity exceeded 10.65% during 2015 and 2016. As of
December 31, 2016
, Alliant Energy and WPL deferred
$6 million
of WPL’s 2016 earnings for this provision, which WPL currently expects will be refunded to its customers in a future rate case or other proceeding.
WPL
’
s Wisconsin Retail Electric and Gas Rate Case (2013/2014 Test Period) -
Refer to
Note 2
for details of a July 2012 PSCW order, which included a provision that required WPL to defer a portion of its earnings if its annual regulatory return on common equity exceeded 10.65% during 2013 and 2014. As of
December 31, 2016
, Alliant Energy and WPL deferred
$6 million
of WPL’s 2013 and 2014 earnings for this provision, which is being returned to customers as an offset to revenue requirements in the 2017/2018 Test Period retail rate case discussed above.
46
IPL’s Iowa Retail Electric Rate Settlement Agreement -
The IUB approved a settlement agreement in 2014 related to rates charged to IPL’s Iowa retail electric customers. The settlement agreement extended IPL’s Iowa retail electric base rates authorized in its 2009 Test Year rate case through 2016 and provided targeted retail electric customer billing credits of $105 million in aggregate. In 2016, 2015 and 2014, IPL recorded
$9 million
,
$24 million
and
$72 million
of such credits, respectively. The settlement agreement included the continuation of the energy adjustment clause, transmission cost rider and electric tax benefit rider credits; the ability for IPL to seek rate relief if a significant event occurs; and the ability for parties to the DAEC PPA proceeding to request show cause action if IPL’s Iowa retail electric return on common equity exceeded 11% for 2014, 2015 or 2016.
Items considered in settlement discussions included costs for environmental controls at Ottumwa Unit 1, George Neal Units 3 and 4, Burlington Unit 1 and Prairie Creek Units 3 and 4, generation performance and reliability improvements at Ottumwa Unit 1, and other ongoing capital expenditures; the elimination of purchased electric capacity payments from the previous DAEC PPA that ended in February 2014; and costs of the new DAEC PPA. IPL assumed no change to its current authorized return on common equity and common equity component of the regulatory capital structure authorized in its 2009 Test Year case.
WPL’s Retail Fuel-related Rate Filings
-
Refer to
Note 2
for discussion of WPL’s retail fuel-related rate filings for Test Years 2014 through 2016.
WPL’s Depreciation Study
-
In September 2016, the PSCW issued an order approving the implementation of updated depreciation rates for WPL effective January 1, 2017 as a result of a recently completed depreciation study. The September 2016 PSCW order also authorized WPL to recover the remaining net book value of Edgewater Unit 4 over a 10-year period beginning the later of the retirement date of the EGU or January 1, 2019. In December 2016, FERC issued an order approving the implementation and inclusion of the updated depreciation rates in WPL’s wholesale formula rates effective January 1, 2017.
IPL’s Tax Benefit Riders
-
The IUB has approved electric and gas tax benefit riders proposed by IPL, which utilize regulatory liabilities generated from tax benefits to credit bills of IPL’s Iowa retail electric customers (beginning in 2011) and gas customers (beginning in 2013) to help offset the impact of rate increases on such customers. IPL’s tax benefit riders regulatory liability account has been, and plans to be, utilized to credit bills of Iowa retail electric and gas customers as follows:
|
Electric
|
Gas
|
Total
|
|||||||||
|
Regulatory liability account balance approved by IUB
|
|
$520
|
|
|
$55
|
|
|
$575
|
|
||
|
2011 through 2016 customer billing credits
|
(444
|
)
|
(47
|
)
|
(491
|
)
|
|||||
|
2017 customer billing credits (estimate)
|
(76
|
)
|
(8
|
)
|
(84
|
)
|
|||||
|
Remaining balance available for future periods
|
|
$—
|
|
|
$—
|
|
|
$—
|
|
||
Refer to Notes
2
and
11
for additional discussion of the impacts of the electric and gas tax benefit riders on Alliant Energy’s and IPL’s regulatory assets and regulatory liabilities, income tax expense and effective income tax rates.
Planned Utility Rate Case
-
IPL’s Iowa Retail Electric Rate Case (2016 Test Year) -
IPL currently expects to make a retail electric rate filing in the second quarter of 2017 based on a 2016 historical Test Year. The key drivers for the anticipated filing include recovery of capital projects, including Marshalltown, power grid modernization and investments that advance clean energy. Any rate changes are expected to be implemented in two phases with interim rates effective approximately 10 days after the filing and final rates effective after IUB approval. The IUB must decide on requests for retail rate changes within 10 months of the date of the application for which changes are filed, or the interim rates granted become permanent.
47
Rate Case Details
-
Details of the currently effective rate orders in IPL’s and WPL’s key jurisdictions were as follows (Common Equity (CE); Preferred Equity (PE); Long-term Debt (LD); Short-term Debt (SD)):
|
Authorized Return
|
Average
|
||||||||||||||||
|
Test
|
on Common
|
Regulatory Capital Structure
|
After-tax
|
Rate Base
|
|||||||||||||
|
Jurisdictions
|
Period/Year
|
Equity (a)
|
CE
|
PE
|
LD
|
SD
|
WACC
|
(in millions)
|
|||||||||
|
IPL:
|
|||||||||||||||||
|
Iowa retail (IUB):
|
|||||||||||||||||
|
Electric:
|
|||||||||||||||||
|
- Emery (b)
|
2009
|
11.58
|
%
|
48.2%
|
6.5%
|
45.3%
|
N/A
|
8.85%
|
$281 (c)
|
||||||||
|
- Whispering Willow - East (b)
|
2009
|
11.09
|
%
|
48.2%
|
6.5%
|
45.3%
|
N/A
|
8.61%
|
266 (c)
|
||||||||
|
- Other (b)
|
2009
|
9.53
|
%
|
48.2%
|
6.5%
|
45.3%
|
N/A
|
7.86%
|
1,843 (c)
|
||||||||
|
Gas (d)
|
2011
|
9.56
|
%
|
48.8%
|
5.0%
|
46.2%
|
N/A
|
7.76%
|
255 (c)
|
||||||||
|
Wholesale electric (FERC) (e)
|
2016
|
10.97
|
%
|
47.8%
|
5.0%
|
47.2%
|
N/A
|
7.90%
|
119 (f)
|
||||||||
|
WPL:
|
|||||||||||||||||
|
Wisconsin retail (PSCW):
|
|||||||||||||||||
|
Electric
|
2017
|
10.00
|
%
|
52.2%
|
N/A
|
43.9%
|
3.9%
|
7.57%
|
2,699 (g)
|
||||||||
|
Electric
|
2018
|
10.00
|
%
|
52.2%
|
N/A
|
45.2%
|
2.6%
|
7.59%
|
2,851 (g)
|
||||||||
|
Gas
|
2017
|
10.00
|
%
|
52.2%
|
N/A
|
43.9%
|
3.9%
|
7.57%
|
259 (g)
|
||||||||
|
Gas
|
2018
|
10.00
|
%
|
52.2%
|
N/A
|
45.2%
|
2.6%
|
7.59%
|
284 (g)
|
||||||||
|
Wholesale electric (FERC) (h)
|
2016
|
10.90
|
%
|
55.0%
|
N/A
|
45.0%
|
N/A
|
8.39%
|
299 (f)
|
||||||||
|
(a)
|
Authorized returns on common equity may not be indicative of actual returns earned or projections of future returns.
|
|
(b)
|
Authorized returns on common equity and after-tax WACC reflect application of double leverage pursuant to a January 2011 IUB order. Prior to the application of double leverage, authorized returns on common equity were: Emery-12.23%, Whispering Willow-East-11.7% and Other-10.0%, and after-tax WACC were: Emery-9.16%, Whispering Willow-East-8.91% and Other-8.09%.
|
|
(c)
|
Average rate base was calculated using balances as of the end of the test year, adjusted for post-test year capital additions placed in service by September 30 following the end of the test year.
|
|
(d)
|
Authorized returns on common equity and after-tax WACC reflect application of double leverage pursuant to the unanimous settlement agreement approved in the IUB’s November 2012 order. Prior to the application of double leverage, authorized return on common equity was 10.0% and after-tax WACC was 8.0%.
|
|
(e)
|
IPL’s wholesale formula rates reflect annual changes in CE, PE, LD, WACC and rate base.
|
|
(f)
|
Wholesale average rate base reflects production-related rate base calculated as the simple average of the beginning of the test year and end of the test year balances in accordance with the respectively approved formula rates.
|
|
(g)
|
Average rate base amounts do not include CWIP or a cash working capital allowance and were calculated using a forecasted 13-month average for the test period. The PSCW provides a return on selected CWIP and a cash working capital allowance by adjusting the percentage return on rate base.
|
|
(h)
|
WPL’s wholesale formula rates reflect annual changes in WACC and rate base.
|
ENVIRONMENTAL MATTERS
Overview
-
Alliant Energy, IPL and WPL are subject to regulation of environmental matters by federal, state and local authorities as a result of their current and past operations. Alliant Energy, IPL and WPL monitor these environmental matters and address them by installing controls that reduce emissions and by implementing operational modifications or other measures to address compliance obligations. There is currently significant regulatory uncertainty with respect to a number of environmental rules and regulations discussed below. Given the dynamic nature of environmental regulations and other related regulatory requirements, Alliant Energy, IPL and WPL have compliance plans to address these environmental obligations. Future expenditures for environmental compliance are expected to be material, including significant capital investments. Prudent expenditures incurred by IPL and WPL to comply with environmental requirements would likely be recovered in rates from their customers. Refer to “
Strategic Overview
” for details of environmental compliance plans, including discussion of specific projects and the associated estimated capital expenditures. The following are major environmental matters that could potentially have a significant impact on financial condition and results of operations.
Air Quality
-
The CAA and its amendments mandate preservation or enhancement of air quality through existing regulations and periodic reviews to ensure adequacy of the CAA provisions based on scientific data. As part of the basic framework under the CAA, the EPA is required to establish NAAQS, which serve to protect public health and welfare. These standards address six “criteria” pollutants, four of which (NOx, SO2, particulate matter and ozone) are particularly relevant to electric utility operations. Ozone is not directly emitted from EGUs; however, NOx emissions may contribute to its formation in the atmosphere. Fine particulate matter may also be formed in the atmosphere from SO2 and NOx emissions. Additional
48
emissions standards may also be applied under the CAA regulatory framework beyond NAAQS. The specific federal and state air quality rules that may affect operations are listed in the table below. Refer to the sections below the following table for detailed discussion of these air quality rules.
|
Environmental Rule
|
Emissions Regulated
|
Alliant Energy’s Primary Facilities Potentially Affected
|
Actual/Anticipated Compliance Deadline
|
|||
|
CSAPR
|
SO2, NOx
|
Fossil-fueled EGUs over 25 MW capacity in IA, WI and MN
|
Phase I - 2015; Phase II - 2017
|
|||
|
CAA Section 111(d)
|
CO2
|
Existing fossil-fueled EGUs over 25 MW capacity
|
Phase I - 2022-2029; Phase II - 2030
|
|||
|
CAA Section 111(b)
|
CO2
|
IPL’s Marshalltown facility and WPL’s Riverside expansion
|
Upon startup of EGU
|
|||
Refer to “
Properties
” in Item 2 for a list of IPL’s and WPL’s EGUs by primary fuel type that they currently own or operate, as well as discussion of various generating facilities that may be retired or changed from coal-fired to an alternative fuel source in the future.
CSAPR
- CSAPR is a regional SO2 and NOx cap-and-trade program, where compliance with emission limits may be achieved by purchasing emission allowances and/or reducing emissions through changes in operations or the additions of environmental controls. CSAPR establishes state-specific annual SO2 and NOx emission caps and ozone season NOx emission caps. Compliance with CSAPR emission limits began in 2015, with additional emission limits reductions beginning in 2017. Alliant Energy, IPL and WPL are currently in compliance with the Phase I CSAPR emission limits. CSAPR emission allowances may be banked for future year compliance. In September 2016, the EPA issued a final rule to further reduce the CSAPR ozone season NOx emission caps in 2017 for several states, including Iowa and Wisconsin. Alliant Energy, IPL and WPL will continue to monitor legal and regulatory developments related to CSAPR and currently expect to meet the existing CSAPR compliance requirements based on planned and completed environmental controls projects for various EGUs.
GHG Emissions
-
Climate change continues to be assessed by policymakers, including consideration of the appropriate actions to mitigate climate change. There is continued debate regarding the public policy response that the U.S. should adopt, involving both domestic actions and international efforts. The primary GHG emitted from Alliant Energy’s, IPL’s and WPL’s utility operations is CO2 from the combustion of fossil fuels at their larger EGUs. In 2009, the EPA issued a finding that GHG emissions contribute to climate change, and therefore, threaten public health and welfare. This enabled the EPA to issue rules to report and regulate GHG emissions under the authority of the CAA.
Clean Air Act Section 111(d)
- In 2015, the EPA published final standards under Section 111(d) of the CAA, referred to as the Clean Power Plan, which establish guidelines for states to follow in developing plans to reduce CO2 emissions from existing fossil-fueled EGUs. The final standards include an interim compliance period from 2022 through 2029 and a final compliance requirement beginning in 2030. In February 2016, the Supreme Court issued a stay of the Clean Power Plan until pending legal challenges are resolved, which places implementation of the final standards on hold indefinitely. Alliant Energy, IPL and WPL are currently unable to predict with certainty the outcome of the legal challenges to the Clean Power Plan or the impact of the final compliance requirements on their financial condition and results of operations, but expect that expenditures to comply with such requirements could be significant.
Clean Air Act Section 111(b)
- In 2015, the EPA published final standards under Section 111(b) of the CAA, which establish CO2 emissions limits for certain new fossil-fueled EGUs. Marshalltown and the Riverside expansion are expected to be impacted by, and are being constructed to achieve compliance with, these standards. Given the EPA’s 111(b) rulemaking remains subject to legal challenges, Alliant Energy, IPL and WPL are currently unable to predict with certainty the impact of these standards.
In addition, in order for the EPA to regulate existing fossil-fueled EGUs under Section 111(d) of the CAA, the EPA must have valid regulation of new fossil-fueled EGUs under Section 111(b) of the CAA. If the Section 111(b) legal challenges result in Section 111(b) being vacated, this could limit the EPA’s ability to implement the Clean Power Plan.
WPL Consent Decree -
Refer to
Note 16(e)
for discussion of a Consent Decree approved by the U.S. District Court for the Western District of Wisconsin in 2013 and WPL’s obligations thereunder. The Consent Decree resolves a notice of violation issued by the EPA in 2009 and complaints filed by the Sierra Club in 2010 regarding alleged air permitting violations at Columbia, Edgewater and Nelson Dewey.
IPL Consent Decree -
Refer to
Note 16(e)
for discussion of a Consent Decree approved by the U.S. District Court for the Northern District of Iowa in 2015 and IPL’s obligations thereunder. The Consent Decree resolves potential CAA issues associated with emissions from IPL’s coal-fired generating facilities in Iowa.
49
Water Quality
-
Effluent Limitation Guidelines -
In 2015, the EPA published final effluent limitation guidelines, which are expected to require changes to discharge limits for wastewater from certain IPL and WPL steam generating facilities. Compliance with the final guidelines for existing steam generating facilities will be required after November 1, 2018 but before December 31, 2023, depending on each facility’s wastewater permit renewal cycle. Effective January 2016, compliance for new steam generating facilities is required immediately upon operation. Projects required for compliance with these guidelines will be facility specific. Alliant Energy, IPL and WPL currently believe the expenditures to comply with these guidelines could be significant.
Land and Solid Waste
-
Coal Combustion Residuals Rule -
Refer to
Note 13
for discussion of the final CCR Rule, including additional AROs that were recognized by Alliant Energy, IPL and WPL in 2015 related to such rule.
MGP Sites -
Refer to
Note 16(e)
for discussion of IPL’s and WPL’s MGP sites.
Other
-
Refer to
Note 16(e)
,
Item 1 Business
, “
Strategic Overview
” and “
Liquidity and Capital Resources
” for further discussion of environmental matters, including discussion of specific projects and the associated estimated capital expenditures.
LEGISLATIVE MATTERS
Overview
-
Various legislative developments are monitored, including those relating to energy, tax, financial and other matters. Key legislative developments include the following:
Protecting Americans from Tax Hikes Act
- In December 2015, the PATH Act was enacted. The most significant provisions of the PATH Act for Alliant Energy, IPL and WPL relate to the extension of bonus depreciation deductions for certain capital expenditures for property incurred through December 31, 2019 and placed in service prior to December 31, 2020, as well as incentives for individuals and businesses to construct renewable generation. These estimated bonus depreciation deductions are expected to create additional deferred tax liabilities for IPL and WPL. Any decreases in IPL’s and WPL’s rate base amounts in the rate setting process caused by the expected increase in deferred tax liabilities are expected to be partially offset by increases in IPL’s and WPL’s rate base amounts due to the additional deferred tax assets expected from additional net operating losses. These bonus depreciation estimates could change based on various factors, including regulatory approvals, changes in capital expenditures incurred, additional clarifications in the PATH Act, or the timing of when property is placed in service. Refer to “
Liquidity and Capital Resources
” for discussion of the impact of these estimated bonus depreciation deductions on net operating loss carryforwards and the expected amount and timing of future federal income tax payments.
LIQUIDITY AND CAPITAL RESOURCES
Overview
-
Alliant Energy, IPL and WPL expect to maintain adequate liquidity to operate their businesses and implement their strategic plan as a result of operating cash flows generated by their utility business, and available capacity under their revolving credit facilities and IPL’s sales of accounts receivable program, supplemented by periodic issuances of long-term debt and Alliant Energy equity securities.
Liquidity Position
-
At
December 31, 2016
, Alliant Energy had
$8 million
of cash and cash equivalents,
$756 million
(
$108 million
at the parent company,
$300 million
at IPL and
$348 million
at WPL) of available capacity under the revolving credit facilities and
$129 million
of available capacity at IPL under its sales of accounts receivable program. Refer to “Short-term Debt” below and
Note 9(a)
for further discussion of the credit facilities. Refer to
Note 5(b)
for additional information on IPL’s sales of accounts receivable program.
50
Capital Structure
-
Alliant Energy, IPL and WPL plan to maintain debt-to-total capitalization ratios that are consistent with their investment-grade credit ratings. Alliant Energy, IPL and WPL currently expect to maintain capital structures in which debt would not exceed 55% of total capital and preferred stock would not exceed 10% of total capital. These targets may be adjusted depending on subsequent developments and the impact on their respective WACC and investment-grade credit ratings. Capital structures as of
December 31, 2016
were as follows (Common Equity (CE); IPL’s Preferred Stock (PS); Long-term Debt (including current maturities) (LD); Short-term Debt (SD)):
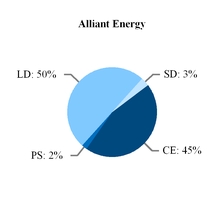

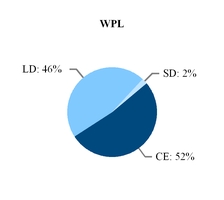
Alliant Energy, IPL and WPL intend to manage their capital structures and liquidity positions in such a way that facilitates their ability to raise the necessary funds reliably and on reasonable terms and conditions, while maintaining capital structures consistent with those approved by regulators and necessary to maintain appropriate credit quality. In addition to capital structures, other important factors used to determine the characteristics of future financings include anticipated proceeds from asset sales, financial coverage ratios, capital spending plans, regulatory orders and rate-making considerations, levels of debt imputed by rating agencies, market conditions and the impact of tax initiatives and legislation. The PSCW factors certain imputed debt adjustments in establishing a regulatory capital structure as part of WPL’s retail rate cases. The IUB does not make any explicit adjustments for imputed debt in establishing capital ratios used in determining customer rates, although such adjustments are considered by IPL in recommending an appropriate capital structure. The most significant debt imputations relate to the DAEC PPA, pension and OPEB obligations and the sales of accounts receivable program.
Credit and Capital Markets
-
Alliant Energy, IPL and WPL are aware of the potential implications that credit and capital market disruptions might have on their ability to raise external funding required for their respective operations and capital expenditure plans. Alliant Energy, IPL and WPL maintain revolving credit facilities to provide backstop liquidity to their commercial paper programs, and ensure a committed source of liquidity in the event the commercial paper market becomes disrupted. In addition, IPL maintains a sales of accounts receivable program as an alternative financing source.
Primary Sources and Uses of Cash
-
Alliant Energy’s most significant source of cash is from electric and gas sales to IPL’s and WPL’s customers. Cash from these sales reimburses IPL and WPL for prudently-incurred expenses to provide service to their utility customers and provides IPL and WPL a return of and a return on the assets used to provide such services. Utility operating cash flows are expected to cover IPL’s and WPL’s capital expenditures required to maintain their current infrastructure and dividends paid to Alliant Energy’s shareowners. Capital needed to retire debt and fund capital expenditures related to large strategic projects is expected to be met primarily through external financings.
Cash Flows
-
Selected information from the cash flows statements was as follows (in millions):
|
Alliant Energy
|
IPL
|
WPL
|
|||||||||||||||||||||||||||
|
2016
|
2015
|
2014
|
2016
|
2015
|
2014
|
2016
|
2015
|
2014
|
|||||||||||||||||||||
|
Cash and cash equivalents, January 1
|
|
$5.8
|
|
|
$56.9
|
|
|
$9.8
|
|
|
$4.5
|
|
|
$5.3
|
|
|
$4.4
|
|
|
$0.4
|
|
|
$46.7
|
|
|
$0.5
|
|
||
|
Cash flows from (used for):
|
|||||||||||||||||||||||||||||
|
Operating activities
|
859.6
|
|
871.2
|
|
891.6
|
|
361.9
|
|
385.0
|
|
406.1
|
|
521.4
|
|
449.8
|
|
424.4
|
|
|||||||||||
|
Investing activities
|
(1,186.5
|
)
|
(919.2
|
)
|
(917.7
|
)
|
(693.6
|
)
|
(511.9
|
)
|
(552.7
|
)
|
(478.9
|
)
|
(358.2
|
)
|
(320.1
|
)
|
|||||||||||
|
Financing activities
|
329.3
|
|
(3.1
|
)
|
73.2
|
|
330.5
|
|
126.1
|
|
147.5
|
|
(38.7
|
)
|
(137.9
|
)
|
(58.1
|
)
|
|||||||||||
|
Net increase (decrease)
|
2.4
|
|
(51.1
|
)
|
47.1
|
|
(1.2
|
)
|
(0.8
|
)
|
0.9
|
|
3.8
|
|
(46.3
|
)
|
46.2
|
|
|||||||||||
|
Cash and cash equivalents, December 31
|
|
$8.2
|
|
|
$5.8
|
|
|
$56.9
|
|
|
$3.3
|
|
|
$4.5
|
|
|
$5.3
|
|
|
$4.2
|
|
|
$0.4
|
|
|
$46.7
|
|
||
51
Operating Activities -
2016 vs. 2015
- The following items contributed to increased (decreased) operating activity cash flows in 2016 compared to 2015 (in millions):
|
Alliant Energy
|
IPL
|
WPL
|
|||||||||
|
Decreased collections from IPL’s retail customers due to increased past due amounts
|
|
($33
|
)
|
|
($33
|
)
|
|
$—
|
|
||
|
Changes in cash collateral balances
|
(27
|
)
|
—
|
|
—
|
|
|||||
|
Changes in income taxes (paid) refunded
|
(10
|
)
|
(30
|
)
|
35
|
|
|||||
|
Changes in the level of cash proceeds from IPL’s sales of accounts receivable
|
33
|
|
33
|
|
—
|
|
|||||
|
Timing of WPL’s fuel-related cost recoveries from customers (Refer to
Note 2
for details)
|
17
|
|
—
|
|
17
|
|
|||||
|
Changes in collections at IPL from higher revenues from retail electric customer billing credits related to the approved retail electric base rate freeze through 2016 (Refer to
Note 2
for details)
|
15
|
|
15
|
|
—
|
|
|||||
|
Other (includes other changes in working capital largely related to changes in inventory levels)
|
(7
|
)
|
(8
|
)
|
20
|
|
|||||
|
|
($12
|
)
|
|
($23
|
)
|
|
$72
|
|
|||
2015 vs. 2014
- The following items contributed to increased (decreased) operating activity cash flows in 2015 compared to 2014 (in millions):
|
Alliant Energy
|
IPL
|
WPL
|
|||||||||
|
Decreased collections from IPL’s and WPL’s retail customers caused by temperature impacts on electric and gas sales
|
|
($33
|
)
|
|
($17
|
)
|
|
($16
|
)
|
||
|
Final receipt related to Alliant Energy’s tax separation and indemnification agreement with Whiting Petroleum in 2014 (Refer to
Note 5(c)
for details)
|
(26
|
)
|
—
|
|
—
|
|
|||||
|
Timing of WPL’s fuel-related cost recoveries from customers
|
50
|
|
—
|
|
50
|
|
|||||
|
Changes in collections at IPL from higher revenues from retail electric customer billing credits related to the approved retail electric base rate freeze (Refer to
Note 2
for details)
|
48
|
|
48
|
|
—
|
|
|||||
|
Other (includes other changes in working capital largely related to changes in inventory levels)
|
(59
|
)
|
(52
|
)
|
(9
|
)
|
|||||
|
|
($20
|
)
|
|
($21
|
)
|
|
$25
|
|
|||
Income Tax Payments and Refunds
- Income tax (payments) refunds were as follows (in millions):
|
2016
|
2015
|
2014
|
|||||||||
|
IPL
|
|
($11
|
)
|
|
$19
|
|
|
$20
|
|
||
|
WPL
|
28
|
|
(7
|
)
|
(12
|
)
|
|||||
|
Other subsidiaries
|
(27
|
)
|
(12
|
)
|
(3
|
)
|
|||||
|
Alliant Energy
|
|
($10
|
)
|
|
$—
|
|
|
$5
|
|
||
Alliant Energy, IPL and WPL currently do not expect to make any significant federal income tax payments through 2021 based on their current federal net operating loss and credit carryforward positions and future amounts of bonus depreciation expected to be claimed on Alliant Energy’s U.S. federal income tax returns for calendar years 2016 through 2020. While no significant federal income tax payments through 2021 are expected to occur, some tax payments and refunds may occur for state taxes and between consolidated group members (including IPL and WPL) under the tax sharing agreement between Alliant Energy and its subsidiaries. Refer to
Note 11
for discussion of the carryforward positions.
Pension Plan Contributions
- Alliant Energy, IPL and WPL currently do not expect to make any significant pension plan contributions in 2017 and 2018 based on the funded status and assumed return on assets for each plan as of the
December 31, 2016
measurement date. Refer to
Note 12(a)
for discussion of the current funded levels of pension plans.
Transfer of ATC Investment
- On December 31, 2016, pursuant to a PSCW order, WPL’s investment in ATC was transferred to ATI. The transfer will result in a reduction of WPL’s cash flows from operations related to WPL’s distributions from unconsolidated investments in 2017, as well as a reduction in WPL’s equity income from unconsolidated investments in 2017. The transfer is not expected to impact Alliant Energy’s cash flows from operations or income statement. Refer to
Note 6(a)
for further discussion of the transfer.
52
Investing Activities -
2016 vs. 2015
- The following items contributed to increased (decreased) investing activity cash flows in 2016 compared to 2015 (in millions):
|
Alliant Energy
|
IPL
|
WPL
|
|||||||||
|
Higher utility construction expenditures (largely due to higher expenditures for IPL’s expansion of wind generation, IPL’s and WPL’s electric and gas distribution systems and WPL’s Riverside expansion in 2016, partially offset by lower expenditures for IPL’s Marshalltown facility and environmental controls projects at WPL’s Edgewater Unit 5 in 2016)
|
|
($179
|
)
|
|
($70
|
)
|
|
($109
|
)
|
||
|
Proceeds from IPL’s Minnesota distribution asset sales in 2015 (Refer to
Note 3
for details)
|
(140
|
)
|
(140
|
)
|
—
|
|
|||||
|
Proceeds from the liquidation of company-owned life insurance policies in 2016
|
31
|
|
19
|
|
—
|
|
|||||
|
Other
|
21
|
|
9
|
|
(12
|
)
|
|||||
|
|
($267
|
)
|
|
($182
|
)
|
|
($121
|
)
|
|||
2015 vs. 2014
- The following items contributed to increased (decreased) investing activity cash flows in 2015 compared to 2014 (in millions):
|
Alliant Energy
|
IPL
|
WPL
|
|||||||||
|
Proceeds from IPL’s Minnesota distribution asset sales in 2015 (Refer to
Note 3
for details)
|
|
$140
|
|
|
$140
|
|
|
$—
|
|
||
|
Higher utility construction expenditures (largely due to higher expenditures for IPL’s Marshalltown facility and environmental controls projects at WPL’s Edgewater Unit 5 in 2015, partially offset by lower expenditures for environmental controls projects at IPL’s Ottumwa Unit 1 and WPL’s Columbia Units 1 and 2 in 2015)
|
(125
|
)
|
(93
|
)
|
(31
|
)
|
|||||
|
Other
|
(17
|
)
|
(6
|
)
|
(7
|
)
|
|||||
|
|
($2
|
)
|
|
$41
|
|
|
($38
|
)
|
|||
Construction and Acquisition Expenditures
- Construction and acquisition expenditures and financing plans are reviewed, approved and updated as part of the financial planning processes. Changes may result from a number of reasons including economic conditions, regulatory requirements, changing legislation, ability to obtain adequate and timely rate relief, improvements in technology, failure of generating facilities, improvements to ensure reliability of the electric and gas distribution systems, changing market conditions, customer and sales growth, funding of pension and OPEB plans, tax reform and new opportunities. Alliant Energy, IPL and WPL have not yet entered into contractual commitments relating to the majority of their anticipated future construction and acquisition expenditures. As a result, they have some discretion with regard to the level and timing of these expenditures. The table below summarizes anticipated construction and acquisition expenditures (in millions). Cost estimates represent Alliant Energy’s, IPL’s and WPL’s portion of total escalated construction expenditures and exclude AFUDC and capitalized interest, if applicable. Such estimates reflect impacts to Alliant Energy’s and WPL’s capital expenditures resulting from the intent to exercise purchase options by certain electric cooperatives for a partial ownership interest in the Riverside expansion, as well as additional capital expenditures related to Columbia that WPL is expected to incur related to agreements entered into with WPSC and MGE. Refer to “
Strategic Overview
” for further discussion of certain key projects impacting construction and acquisition plans related to the utility business.
|
Alliant Energy
|
IPL
|
WPL
|
||||||||||||||||||||||||||||||||||||
|
2017
|
2018
|
2019
|
2020
|
2017
|
2018
|
2019
|
2020
|
2017
|
2018
|
2019
|
2020
|
|||||||||||||||||||||||||||
|
Generation:
|
||||||||||||||||||||||||||||||||||||||
|
Renewable projects
|
|
$105
|
|
|
$310
|
|
|
$690
|
|
|
$260
|
|
|
$140
|
|
|
$290
|
|
|
$500
|
|
|
$150
|
|
|
$—
|
|
|
$20
|
|
|
$190
|
|
|
$110
|
|
||
|
Riverside expansion
|
255
|
|
230
|
|
75
|
|
5
|
|
—
|
|
—
|
|
—
|
|
—
|
|
255
|
|
230
|
|
75
|
|
5
|
|
||||||||||||||
|
Marshalltown
|
50
|
|
—
|
|
—
|
|
—
|
|
50
|
|
—
|
|
—
|
|
—
|
|
—
|
|
—
|
|
—
|
|
—
|
|
||||||||||||||
|
Other
|
240
|
|
180
|
|
170
|
|
160
|
|
85
|
|
85
|
|
85
|
|
85
|
|
155
|
|
95
|
|
85
|
|
75
|
|
||||||||||||||
|
Distribution:
|
||||||||||||||||||||||||||||||||||||||
|
Electric systems
|
465
|
|
485
|
|
420
|
|
405
|
|
280
|
|
310
|
|
240
|
|
235
|
|
185
|
|
175
|
|
180
|
|
170
|
|
||||||||||||||
|
Gas systems
|
130
|
|
125
|
|
95
|
|
220
|
|
90
|
|
55
|
|
55
|
|
165
|
|
40
|
|
70
|
|
40
|
|
55
|
|
||||||||||||||
|
Other
|
155
|
|
115
|
|
110
|
|
105
|
|
40
|
|
25
|
|
25
|
|
20
|
|
20
|
|
15
|
|
15
|
|
15
|
|
||||||||||||||
|
|
$1,400
|
|
|
$1,445
|
|
|
$1,560
|
|
|
$1,155
|
|
|
$685
|
|
|
$765
|
|
|
$905
|
|
|
$655
|
|
|
$655
|
|
|
$605
|
|
|
$585
|
|
|
$430
|
|
|||
53
Financing Activities -
2016 vs. 2015
- The following items contributed to increased (decreased) financing activity cash flows in 2016 compared to 2015 (in millions):
|
Alliant Energy
|
IPL
|
WPL
|
|||||||||
|
Proceeds from long-term debt issued in 2016 (Refer to “Long-term Debt” below)
|
|
$800
|
|
|
$300
|
|
|
$—
|
|
||
|
Payments to retire long-term debt in 2015 (Refer to “Long-term Debt” below)
|
181
|
|
150
|
|
31
|
|
|||||
|
Net changes in the amount of commercial paper outstanding
|
66
|
|
—
|
|
13
|
|
|||||
|
Payments to retire long-term debt in 2016 (Refer to “Long-term Debt” below)
|
(310
|
)
|
—
|
|
—
|
|
|||||
|
Proceeds from long-term debt issued in 2015 (Refer to “Long-term Debt” below)
|
(250
|
)
|
(250
|
)
|
—
|
|
|||||
|
Lower net proceeds from common stock issuances
|
(125
|
)
|
—
|
|
—
|
|
|||||
|
Higher capital contributions from IPL’s and WPL’s parent company, Alliant Energy
|
—
|
|
25
|
|
60
|
|
|||||
|
Other (includes higher dividend payments in 2016)
|
(30
|
)
|
(21
|
)
|
(5
|
)
|
|||||
|
|
$332
|
|
|
$204
|
|
|
$99
|
|
|||
2015 vs. 2014
- The following items contributed to increased (decreased) financing activity cash flows in 2015 compared to 2014 (in millions):
|
Alliant Energy
|
IPL
|
WPL
|
|||||||||
|
Proceeds from long-term debt issued in 2014 (Refer to “Long-term Debt” below)
|
|
($810
|
)
|
|
($250
|
)
|
|
($250
|
)
|
||
|
Payments to retire long-term debt in 2015 (Refer to “Long-term Debt” below)
|
(181
|
)
|
(150
|
)
|
(31
|
)
|
|||||
|
Payments to retire long-term debt in 2014 (Refer to “Long-term Debt” below)
|
348
|
|
38
|
|
—
|
|
|||||
|
Proceeds from long-term debt issued in 2015 (Refer to “Long-term Debt” below)
|
250
|
|
250
|
|
—
|
|
|||||
|
Net changes in the amount of commercial paper outstanding
|
157
|
|
—
|
|
204
|
|
|||||
|
Net proceeds from common stock issuances in 2015
|
151
|
|
—
|
|
—
|
|
|||||
|
Higher capital contributions from IPL’s parent company, Alliant Energy
|
—
|
|
75
|
|
—
|
|
|||||
|
Other
|
9
|
|
16
|
|
(3
|
)
|
|||||
|
|
($76
|
)
|
|
($21
|
)
|
|
($80
|
)
|
|||
FERC and Public Utility Holding Company Act Financing Authorizations
- Under the Public Utility Holding Company Act of 2005, FERC has authority over the issuance of utility securities, except to the extent that a public utility’s primary state regulatory commission has retained jurisdiction over such matters. FERC currently has authority over the issuance of securities by IPL. FERC does not have authority over the issuance of securities by Alliant Energy, WPL, AEF or Corporate Services.
In 2015, IPL received authorization from FERC through December 31, 2017 for the following (in millions):
|
Initial
|
Current
|
||||||
|
Authorization
|
Remaining Authority
|
||||||
|
Long-term debt securities issuances in aggregate
|
|
$550
|
|
|
$250
|
|
|
|
Short-term debt securities outstanding at any time (including borrowings from its parent)
|
300
|
|
300
|
|
|||
|
Preferred stock issuances in aggregate
|
300
|
|
300
|
|
|||
State Regulatory Financing Authorizations
- In September 2016, WPL received authorization from the PSCW to have up to $400 million of short-term borrowings and/or letters of credit outstanding at any time through the earlier of the expiration date of WPL’s credit facility agreement (including extensions) or December 2024. In December 2016, WPL received authorization from the PSCW to issue up to $1 billion of long-term debt securities in aggregate during 2017 through 2019, with no more than $650 million to be issued in any year.
Shelf Registrations
- Alliant Energy, IPL and WPL have current shelf registration statements on file with the SEC for availability to issue unspecified amounts of securities through December 2017. Alliant Energy’s shelf registration statement may be used to issue common stock, debt and other securities. IPL’s and WPL’s shelf registration statements may be used to issue preferred stock and debt securities.
Common Stock Split
-
As discussed in
Note 7
, Alliant Energy’s Board of Directors approved a two-for-one common stock split, which was distributed in May 2016.
Common Stock Dividends
- Payment of common stock dividends is subject to dividend declaration by Alliant Energy’s Board of Directors. Alliant Energy’s general long-term goal is to maintain a dividend payout ratio that is competitive with
54
the industry average. Based on that, Alliant Energy’s goal is to maintain a dividend payout ratio of approximately 60% to 70% of consolidated earnings from continuing operations. IPL’s and WPL’s goal is to maintain dividend payout ratios of approximately 65% to 75%. Alliant Energy’s, IPL’s and WPL’s dividend payout ratios were
71%
,
70%
and
71%
of their consolidated earnings from continuing operations in
2016
, respectively. Refer to “
Executive Overview
” for discussion of expected common stock dividends in
2017
. Refer to
Note 7
for discussion of IPL’s and WPL’s dividend payment restrictions based on the terms of applicable regulatory limitations and IPL’s outstanding preferred stock.
Common Stock Issuances and Capital Contributions
- Refer to
Note 7
for discussion of common stock issuances by Alliant Energy in 2014 through 2016. Refer to “
Executive Overview
” for discussion of expected issuances of common stock and capital contributions in
2017
.
Short-term Debt
- Alliant Energy, IPL and WPL maintain committed revolving credit facilities to provide short-term borrowing flexibility and backstop liquidity for commercial paper outstanding. At
December 31, 2016
, Alliant Energy’s short-term borrowing arrangements included three revolving credit facilities totaling
$1 billion
(
$300 million
for Alliant Energy at the parent company level,
$300 million
for IPL and
$400 million
for WPL). There are currently 13 lenders that participate in the three credit facilities, with aggregate respective commitments ranging from $10 million to $135 million. Each of the credit facilities expire in December 2018 and there are currently no extension renewal provisions remaining for the credit facilities. Each of the credit facilities has a provision to expand the facility size up to $100 million, subject to lender approval for Alliant Energy and subject to lender and regulatory approvals for IPL and WPL. During
2016
, the Alliant Energy parent company, IPL and WPL issued commercial paper to meet short-term financing requirements and did not borrow directly under their respective credit facilities.
The credit agreements contain provisions that prohibit placing liens on any of Alliant Energy’s, IPL’s or WPL’s property or their respective subsidiaries with certain exceptions. Exceptions include among others, liens to secure obligations of up to 5% of the consolidated assets of the applicable borrower (valued at carrying value), liens imposed by government entities, materialmens’ and similar liens, judgment liens, and liens to secure additional non-recourse debt not to exceed $100 million outstanding at any one time at each of IPL and WPL, and $100 million at Alliant Energy’s non-utility subsidiaries, and purchase money liens.
The credit agreements contain provisions that require, during their term, any proceeds from asset sales, with certain exclusions, in excess of 20% of Alliant Energy’s, IPL’s and WPL’s respective consolidated assets be used to reduce commitments under their respective facilities. Exclusions include, among others, certain sale and lease-back transactions and sales of non-regulated assets and accounts receivable.
The credit agreements contain customary events of default. Alliant Energy’s credit agreement contains a cross-default provision that would be triggered if Alliant Energy or any domestic, majority-owned subsidiary of Alliant Energy defaults on debt (other than non-recourse debt) totaling $50 million or more. A default by a minority-owned subsidiary would not trigger a cross-default. A default by Alliant Energy, Corporate Services or AEF and its subsidiaries would not trigger a cross-default under either the IPL or WPL credit agreements, nor would a default by either of IPL or WPL constitute a cross-default event for the other. If an event of default under any of the credit agreements occurs and is continuing, then the lenders may declare any outstanding obligations under the credit agreements immediately due and payable. In addition, if any order for relief is entered under bankruptcy laws with respect to Alliant Energy, IPL or WPL, then any outstanding obligations under the respective credit agreements would be immediately due and payable. In addition, IPL’s sales of accounts receivable program agreement contains a cross-default provision that is triggered if IPL or Alliant Energy incurs an event of default on debt totaling $50 million or more. If an event of default under IPL’s sales of accounts receivable program agreement occurs, then the counterparty could terminate such agreement. Refer to
Note 5(b)
for additional information on amounts outstanding under IPL’s sales of accounts receivable program.
A material adverse change representation is not required for borrowings under the credit agreements.
Refer to
Note 9(a)
for discussion of financial covenants required under the credit agreements, as well as additional information on the credit facilities and commercial paper outstanding. At
December 31, 2016
, Alliant Energy, IPL and WPL were in compliance with all material covenants and other provisions of the credit agreements.
55
Long-term Debt
- Significant issuances of long-term debt in
2016
,
2015
and
2014
were as follows (dollars in millions):
|
Company
|
Principal Amount
|
Type
|
Interest Rate
|
Maturity Date
|
Use of Proceeds
|
|||||||
|
2016:
|
||||||||||||
|
AEF
|
|
$500
|
|
Variable-rate term loan credit agreement
|
1% at December 31, 2016
|
Oct-2018
|
Retire borrowings under Alliant Energy’s and Franklin County Holdings LLC’s variable-rate term loan credit agreements that matured in 2016, reduce outstanding commercial paper and for general corporate purposes
|
|||||
|
IPL
|
300
|
|
Senior debentures
|
3.7%
|
Sep-2046
|
Reduce cash amounts received from its sales of accounts receivable program, reduce commercial paper classified as long-term debt and for general corporate purposes
|
||||||
|
2015:
|
||||||||||||
|
IPL
|
250
|
|
Senior debentures
|
3.4%
|
Aug-2025
|
Reduce commercial paper classified as long-term debt, reduce cash amounts received from its sales of accounts receivable program and for general corporate purposes
|
||||||
|
2014:
|
||||||||||||
|
Alliant Energy
|
250
|
|
Variable-rate term loan credit agreement
|
1% at December 31, 2015
|
Oct-2016
|
Retire its $250 million, 4% senior notes due 2014
|
||||||
|
IPL
|
250
|
|
Senior debentures
|
3.25%
|
Dec-2024
|
Reduce cash amounts received from its sales of accounts receivable program, reduce commercial paper classified as long-term debt and for general corporate purposes
|
||||||
|
WPL
|
250
|
|
Debentures
|
4.1%
|
Oct-2044
|
Reduce commercial paper and for general corporate purposes
|
||||||
|
Franklin County Holdings LLC
|
60
|
|
Variable-rate term loan credit agreement
|
1% at December 31, 2015
|
Dec-2016
|
Retire borrowings under a term loan credit agreement that matured in December 2014
|
||||||
AEF’s $500 million term loan credit agreement (with Alliant Energy as guarantor) includes substantially the same covenants, including Alliant Energy maintaining a debt-to-capital ratio not to exceed 65% on a consolidated basis and events of default (except for a cross-default provision triggered at $100 million), that are included in Alliant Energy’s revolving credit facility financial covenant discussed in
Note 9(a)
. At
December 31, 2016
, Alliant Energy was in compliance with all material covenants and other provisions of the term loan credit agreement.
Significant retirements of long-term debt in
2016
,
2015
and
2014
were as follows (dollars in millions):
|
Company
|
Principal Amount
|
Type
|
Interest Rate
|
Retirement Date
|
||||||
|
2016:
|
||||||||||
|
Alliant Energy
|
|
$250
|
|
Variable-rate term loan credit agreement
|
1% at December 31, 2015
|
Oct-2016
|
||||
|
Franklin County Holdings LLC
|
60
|
|
Variable-rate term loan credit agreement
|
1% at December 31, 2015
|
Oct-2016
|
|||||
|
2015:
|
||||||||||
|
IPL
|
150
|
|
Senior debentures
|
3.3%
|
Jun-2015
|
|||||
|
WPL
|
16
|
|
Pollution control revenue bonds
|
5%
|
Sep-2015
|
|||||
|
WPL
|
15
|
|
Pollution control revenue bonds
|
5.375%
|
Aug-2015
|
|||||
|
2014:
|
||||||||||
|
Alliant Energy
|
250
|
|
Senior notes
|
4%
|
Oct-2014
|
|||||
|
Franklin County Holdings LLC
|
60
|
|
Variable-rate term loan credit agreement
|
1% at December 31, 2013
|
Dec-2014
|
|||||
|
IPL
|
38
|
|
Pollution control revenue bonds
|
5%
|
Jul-2014
|
|||||
Refer to
Note 9(b)
for further discussion of long-term debt.
Impact of Credit Ratings on Liquidity and Collateral Obligations
-
Ratings Triggers -
The long-term debt of Alliant Energy and its subsidiaries is not subject to any repayment requirements as a result of explicit credit rating downgrades or so-called “ratings triggers.” However, Alliant Energy and its subsidiaries are parties to various agreements that contain provisions dependent on credit ratings. In the event of a significant downgrade, Alliant Energy or its subsidiaries may need to provide credit support, such as letters of credit or cash collateral equal to the amount of the exposure, or may need to unwind the contract or pay the underlying obligation. In the event of a significant downgrade, management believes Alliant Energy, IPL and WPL have sufficient liquidity to cover counterparty credit support or collateral requirements under these various agreements. In addition, a downgrade in the credit ratings of Alliant Energy,
56
IPL or WPL could also result in them paying higher interest rates in future financings, reduce their pool of potential lenders, increase their borrowing costs under existing credit facilities or limit their access to the commercial paper market. Alliant Energy, IPL and WPL are committed to taking the necessary steps required to maintain investment-grade credit ratings. Credit ratings and outlooks as of the date of this report are as follows:
|
Standard & Poor’s Ratings Services
|
Moody’s Investors Service
|
|||
|
Alliant Energy:
|
Corporate/issuer
|
A-
|
Baa1
|
|
|
Commercial paper
|
A-2
|
P-2
|
||
|
Senior unsecured long-term debt
|
N/A
|
Baa1
|
||
|
Outlook
|
Stable
|
Stable
|
||
|
IPL:
|
Corporate/issuer
|
A-
|
Baa1
|
|
|
Commercial paper
|
A-2
|
P-2
|
||
|
Senior unsecured long-term debt
|
A-
|
Baa1
|
||
|
Preferred stock
|
BBB
|
Baa3
|
||
|
Outlook
|
Stable
|
Stable
|
||
|
WPL:
|
Corporate/issuer
|
A
|
A2
|
|
|
Commercial paper
|
A-1
|
P-1
|
||
|
Senior unsecured long-term debt
|
A
|
A2
|
||
|
Outlook
|
Stable
|
Stable
|
||
Credit ratings are not recommendations to buy or sell securities and are subject to change, and each rating should be evaluated independently of any other rating. Each of Alliant Energy, IPL or WPL assumes no obligation to update their respective credit ratings. Refer to
Note 15
for additional information on ratings triggers for commodity contracts accounted for as derivatives.
Off-Balance Sheet Arrangements
-
Special Purpose Entities -
IPL maintains a Receivables Agreement whereby it may sell its customer accounts receivables, unbilled revenues and certain other accounts receivables to a third party through wholly-owned and consolidated special purpose entities. In March 2016, IPL extended through March 2018 the purchase commitment from the third party to which it sells its receivables. In
2016
,
2015
and
2014
, IPL evaluated the third party that purchases IPL’s receivable assets under the Receivables Agreement and believes that the third party is a VIE. However, IPL concluded consolidation of the third party was not required. Refer to
Note 5(b)
for information regarding IPL’s sales of accounts receivable program.
Guarantees and Indemnifications -
Alliant Energy and IPL have guarantees and indemnifications outstanding at
December 31, 2016
related to prior divestiture activities. Refer to
Note 16(d)
for additional information.
Certain Financial Commitments
-
Contractual Obligations -
Consolidated long-term contractual obligations as of
December 31, 2016
were as follows (in millions):
|
Alliant Energy
|
2017
|
2018
|
2019
|
2020
|
2021
|
Thereafter
|
Total
|
||||||||||||||||||||
|
Operating expense purchase obligations (
Note 16(b)
)
|
|
$529
|
|
|
$389
|
|
|
$297
|
|
|
$237
|
|
|
$220
|
|
|
$728
|
|
|
$2,400
|
|
||||||
|
Long-term debt maturities (
Note 9(b)
)
|
5
|
|
856
|
|
256
|
|
357
|
|
8
|
|
2,875
|
|
4,357
|
|
|||||||||||||
|
Interest - long-term debt obligations
|
199
|
|
197
|
|
167
|
|
151
|
|
140
|
|
2,074
|
|
2,928
|
|
|||||||||||||
|
Capital purchase obligations (
Note 16(a)
)
|
58
|
|
—
|
|
—
|
|
—
|
|
—
|
|
—
|
|
58
|
|
|||||||||||||
|
Operating leases (
Note 10(a)
)
|
6
|
|
6
|
|
2
|
|
2
|
|
1
|
|
15
|
|
32
|
|
|||||||||||||
|
Capital leases
|
2
|
|
1
|
|
1
|
|
1
|
|
1
|
|
—
|
|
6
|
|
|||||||||||||
|
|
$799
|
|
|
$1,449
|
|
|
$723
|
|
|
$748
|
|
|
$370
|
|
|
$5,692
|
|
|
$9,781
|
|
|||||||
|
IPL
|
2017
|
2018
|
2019
|
2020
|
2021
|
Thereafter
|
Total
|
||||||||||||||||||||
|
Operating expense purchase obligations (
Note 16(b)
)
|
|
$322
|
|
|
$225
|
|
|
$209
|
|
|
$176
|
|
|
$172
|
|
|
$670
|
|
|
$1,774
|
|
||||||
|
Long-term debt maturities (
Note 9(b)
)
|
—
|
|
350
|
|
—
|
|
200
|
|
—
|
|
1,625
|
|
2,175
|
|
|||||||||||||
|
Interest - long-term debt obligations
|
107
|
|
107
|
|
83
|
|
83
|
|
75
|
|
1,117
|
|
1,572
|
|
|||||||||||||
|
Capital purchase obligations (
Note 16(a)
)
|
3
|
|
—
|
|
—
|
|
—
|
|
—
|
|
—
|
|
3
|
|
|||||||||||||
|
Operating leases (
Note 10(a)
)
|
3
|
|
2
|
|
1
|
|
1
|
|
1
|
|
10
|
|
18
|
|
|||||||||||||
|
Capital leases
|
1
|
|
—
|
|
—
|
|
—
|
|
—
|
|
—
|
|
1
|
|
|||||||||||||
|
|
$436
|
|
|
$684
|
|
|
$293
|
|
|
$460
|
|
|
$248
|
|
|
$3,422
|
|
|
$5,543
|
|
|||||||
57
|
WPL
|
2017
|
2018
|
2019
|
2020
|
2021
|
Thereafter
|
Total
|
||||||||||||||||||||
|
Operating expense purchase obligations (
Note 16(b)
)
|
|
$206
|
|
|
$162
|
|
|
$85
|
|
|
$59
|
|
|
$46
|
|
|
$53
|
|
|
$611
|
|
||||||
|
Long-term debt maturities (
Note 9(b)
)
|
—
|
|
—
|
|
250
|
|
150
|
|
—
|
|
1,150
|
|
1,550
|
|
|||||||||||||
|
Interest - long-term debt obligations
|
80
|
|
80
|
|
80
|
|
64
|
|
60
|
|
951
|
|
1,315
|
|
|||||||||||||
|
Capital purchase obligations (
Note 16(a)
)
|
55
|
|
—
|
|
—
|
|
—
|
|
—
|
|
—
|
|
55
|
|
|||||||||||||
|
Operating leases (
Note 10(a)
)
|
3
|
|
4
|
|
—
|
|
—
|
|
—
|
|
—
|
|
7
|
|
|||||||||||||
|
Capital lease - Sheboygan Falls (
Note 10(b)
)
|
15
|
|
15
|
|
15
|
|
15
|
|
15
|
|
53
|
|
128
|
|
|||||||||||||
|
Capital leases - other
|
1
|
|
1
|
|
1
|
|
1
|
|
1
|
|
—
|
|
5
|
|
|||||||||||||
|
|
$360
|
|
|
$262
|
|
|
$431
|
|
|
$289
|
|
|
$122
|
|
|
$2,207
|
|
|
$3,671
|
|
|||||||
At
December 31, 2016
, Alliant Energy, IPL and WPL had no uncertain tax positions recorded as liabilities. Refer to
Note 12(a)
for anticipated pension and OPEB funding amounts, which are not included in the above tables. Refer to “Construction and Acquisition Expenditures” above for additional information on construction and acquisition programs. In addition, at
December 31, 2016
, there were various other liabilities included on the balance sheets that, due to the nature of the liabilities, the timing of payments cannot be estimated and are therefore excluded from the above tables.
OTHER MATTERS
Market Risk Sensitive Instruments and Positions
-
Primary market risk exposures are associated with commodity prices, investment prices and interest rates. Risk management policies are used to monitor and assist in mitigating these market risks and derivative instruments are used to manage some of the exposures related to commodity prices. Refer to Notes
1(h)
and
15
for further discussion of derivative instruments.
Commodity Price -
Alliant Energy, IPL and WPL are exposed to the impact of market fluctuations in the price and transportation costs of commodities they procure and market. Established policies and procedures mitigate risks associated with these market fluctuations, including the use of various commodity derivatives and contracts of various durations for the forward sale and purchase of these commodities. Exposure to commodity price risks in the utility businesses is also significantly mitigated by current rate-making structures in place for recovery of fuel-related costs as well as the cost of natural gas purchased for resale. IPL’s electric and gas tariffs and WPL’s wholesale electric and gas tariffs provide for subsequent monthly adjustments to their tariff rates for material changes in prudently incurred commodity costs. IPL’s and WPL’s rate mechanisms, combined with commodity derivatives, significantly reduce commodity risk associated with their electric and gas margins.
WPL’s retail electric margins have exposure to the impact of changes in commodity prices due largely to the current retail recovery mechanism in place in Wisconsin for fuel-related costs. In December 2016, the PSCW approved annual forecasted fuel-related costs per MWh of $26.15 based on $361 million of variable fuel-related costs applicable for retail and wholesale customers for WPL’s 2017 Test Period. The retail portion of the 2017 fuel-related costs will be monitored using an annual bandwidth of plus or minus 2%. Based on the cost recovery mechanism in Wisconsin, the annual forecasted fuel-related costs approved by the PSCW in December 2016 and an annual bandwidth of plus or minus 2%, Alliant Energy and WPL currently estimate the commodity risk exposure to their retail electric margins in 2017 is approximately $6 million. However, if WPL’s return on common equity in 2017 exceeds the most recently authorized return on common equity, the commodity risk exposure to WPL’s electric margins in 2017 could increase.
Refer to
Note 2
for discussion of WPL’s retail fuel-related rate filings for Test Years 2014 through 2016, and
Note 1(g)
for additional details of utility cost recovery mechanisms that significantly reduce commodity risk.
Investment Price -
Alliant Energy, IPL and WPL are exposed to investment price risk as a result of their investments in securities, largely related to securities held by their pension and OPEB plans. Refer to
Note 12(a)
for details of the securities held by their pension and OPEB plans. Refer to “
Critical Accounting Policies and Estimates
” for the impact on retirement plan costs of changes in the rate of returns earned by plan assets.
Interest Rate -
Alliant Energy, IPL and WPL are exposed to risk resulting from changes in interest rates associated with variable-rate borrowings. In addition, Alliant Energy and IPL are exposed to risk resulting from changes in interest rates as a result of cash amounts outstanding under IPL’s sales of accounts receivable program. Assuming the impact of a hypothetical 100 basis point increase in interest rates on variable-rate borrowings and cash proceeds outstanding under IPL’s sales of accounts receivable program at
December 31, 2016
, Alliant Energy’s, IPL’s and WPL’s annual pre-tax expense would increase by approximately $8 million, $0 and $1 million, respectively. Refer to Notes
5(b)
and
9
for additional information on cash proceeds outstanding under IPL’s sales of accounts receivable program, and short- and long-term variable-rate
58
borrowings, respectively. Refer to “
Critical Accounting Policies and Estimates
” for the impacts of changes in discount rates on retirement plan obligations and costs.
New Accounting Standards
-
Refer to
Note 1(o)
for discussion of new accounting standards impacting Alliant Energy, IPL and WPL.
Critical Accounting Policies and Estimates
-
The preparation of financial statements in conformity with GAAP requires management to apply accounting policies and make estimates that affect results of operations and the amounts of assets and liabilities reported in the financial statements. The following accounting policies and estimates are critical to the business and the understanding of financial results as they require critical assumptions and judgments by management. The results of these assumptions and judgments form the basis for making estimates regarding the results of operations and the amounts of assets and liabilities that are not readily apparent from other sources. Actual financial results may differ materially from these estimates. Management has discussed these critical accounting policies and estimates with the Audit Committee of the Board of Directors. Refer to
Note 1
for additional discussion of accounting policies and the estimates used in the preparation of the financial statements.
Contingencies -
Assumptions and judgments are made each reporting period regarding the future outcome of contingent events. Loss contingency amounts are recorded for any contingent events for which the likelihood of loss is probable and able to be reasonably estimated based upon current available information. The amounts recorded may differ from actuals when the uncertainty is resolved. The estimates made in accounting for contingencies, and the gains and losses that are recorded upon the ultimate resolution of these uncertainties, could have a significant effect on results of operations and the amount of assets and liabilities in the financial statements.
Note 16
provides discussion of contingencies assessed at
December 31, 2016
, including various pending legal proceedings, guarantees and indemnifications that may have a material impact on financial condition and results of operations.
Regulatory Assets and Regulatory Liabilities -
IPL and WPL are regulated by various federal and state regulatory agencies. As a result, they are subject to GAAP for regulated operations, which recognizes that the actions of a regulator can provide reasonable assurance of the existence of an asset or liability. Regulatory assets or regulatory liabilities arise as a result of a difference between GAAP and actions imposed by the regulatory agencies in the rate-making process. Regulatory assets generally represent incurred costs that have been deferred as such costs are probable of recovery in future customer rates. Regulatory liabilities generally represent obligations to make refunds to customers or amounts collected in rates for which the related costs have not yet been incurred. Regulatory assets and regulatory liabilities are recognized in accordance with the rulings of applicable federal and state regulators, and future regulatory rulings may impact the carrying value and accounting treatment of regulatory assets and regulatory liabilities.
Assumptions and judgments are made each reporting period regarding whether regulatory assets are probable of future recovery and regulatory liabilities are probable future obligations by considering factors such as regulatory environment changes, rate orders issued by the applicable regulatory agencies, historical decisions by such regulatory agencies regarding similar regulatory assets and regulatory liabilities, and subsequent events of such regulatory agencies. The decisions made by regulatory authorities have an impact on the recovery of costs, the rate of return on invested capital and the timing and amount of assets to be recovered by rates. A change in these decisions may result in a material impact on results of operations and the amount of assets and liabilities in the financial statements.
Note 2
provides details of the nature and amounts of regulatory assets and regulatory liabilities assessed at
December 31, 2016
.
Long-Lived Assets
-
Periodic assessments regarding the recoverability of certain long-lived assets are completed when factors indicate the carrying value of such assets may be impaired or such assets are planned to be sold. These assessments require significant assumptions and judgments by management. The long-lived assets assessed for impairment generally include certain assets within regulated operations that may not be fully recovered from IPL’s and WPL’s customers as a result of regulatory decisions in the future, and assets within non-regulated operations that are proposed to be sold or are currently generating operating losses.
Regulated Operations
- Certain long-lived assets within regulated operations are reviewed for possible impairment whenever events or changes in circumstances indicate all or a portion of the carrying value of the assets may be disallowed for rate-making purposes. If IPL or WPL is disallowed recovery of any portion of the carrying value of its regulated property, plant and equipment that is under construction, has been recently completed or is probable of being retired early, an impairment charge is recognized equal to the amount of the carrying value that was disallowed recovery. If IPL or WPL is disallowed a full or partial return on the carrying value of its regulated property, plant and equipment that is under construction, has been recently completed or is probable of being retired early, an impairment charge is recognized equal to the difference between
59
the carrying amount of the asset and the present value of the future revenues expected from its regulated property, plant and equipment. Alliant Energy’s, IPL’s and WPL’s long-lived assets within their regulated operations that were assessed for impairment and plant abandonment in
2016
included IPL’s and WPL’s generating units subject to early retirement.
Generating Units Subject to Early Retirement
- Alliant Energy, IPL and WPL evaluate future plans for their electric generation fleet and have announced the early retirement of certain older and less-efficient EGUs. When it becomes probable that an EGU will be retired before the end of its useful life, Alliant Energy, IPL and WPL must assess whether the EGU meets the criteria to be considered probable of abandonment. EGUs that are considered probable of abandonment generally have material remaining net book values and are expected to cease operations in the near term significantly before the end of their original estimated useful lives. If an EGU meets such criteria to be considered probable of abandonment, Alliant Energy, IPL and WPL must assess the probability of full recovery of the remaining carrying value of such EGU. If it is probable that regulators will not allow full recovery of and a full return on the remaining net book value of the abandoned EGU, an impairment charge is recognized equal to the difference between the remaining carrying value and the present value of the future revenues expected from the abandoned EGU.
Alliant Energy and IPL concluded that Sutherland Unit 3 met the criteria to be considered probable of abandonment as of December 31, 2016. IPL is currently allowed a full recovery of and a full return on this EGU from both its retail and wholesale customers, and as a result, Alliant Energy and IPL concluded that no impairment was required as of
December 31, 2016
.
Alliant Energy, IPL and WPL evaluated their other EGUs that are subject to early retirement and determined that no other EGUs met the criteria to be considered probable of abandonment as of
December 31, 2016
. Refer to “
Strategic Overview
” for discussion of additional EGUs that may be retired early and could be considered probable of abandonment in future periods, along with the net book value of such EGUs.
Non-regulated Operations
- Factors considered in determining if an impairment review is necessary for long-lived assets within non-regulated operations include a significant underperformance of the assets relative to historical or projected future operating results, a significant change in the use of the acquired assets or business strategy related to such assets, and significant negative industry, regulatory or economic trends. When an impairment review is deemed necessary, a comparison is made between the expected undiscounted future cash flows and the carrying amount of the asset. If the carrying amount of the asset exceeds the expected undiscounted future cash flows, an impairment loss is recognized equal to the amount by which the carrying amount of the asset exceeds the fair value of the asset. The fair value is determined by the use of quoted market prices, appraisals, or the use of valuation techniques such as expected discounted future cash flows. Long-lived assets within non-regulated operations assessed for impairment indicators in
2016
included Alliant Energy’s Franklin County wind farm.
Franklin County Wind Farm
- Based on an evaluation of the strategic options for the Franklin County wind farm performed in 2016, Alliant Energy concluded it was probable the Franklin County wind farm will be transferred to IPL. As a result, Alliant Energy performed an impairment analysis of such assets in 2016. Refer to
Note 3
for discussion of the impairment analysis, which resulted in non-cash, pre-tax asset valuation charges of $86 million recorded by Alliant Energy in 2016. Going forward, the Franklin County wind farm will be reviewed for possible impairment whenever events or changes in circumstances indicate all or a portion of the carrying value of the assets may be disallowed for rate-making purposes.
Unbilled Revenues -
Unbilled revenues are primarily associated with utility operations. Energy sales to individual customers are based on the reading of customers’ meters, which occurs on a systematic basis throughout the month. Amounts of energy delivered to customers since the date of the last meter reading are estimated at the end of each reporting period and the corresponding estimated unbilled revenue is recorded. The unbilled revenue estimate is based on daily system demand volumes, estimated customer usage by class, temperature impacts, line losses and the most recent customer rates. Such process involves the use of various judgments and assumptions and significant changes in these judgments and assumptions could have a material impact on results of operations. As of
December 31, 2016
, unbilled revenues related to Alliant Energy’s utility operations were $180 million ($90 million at IPL and $90 million at WPL).
Note 5(b)
provides discussion of IPL’s unbilled revenues as of
December 31, 2016
sold to a third party related to its sales of accounts receivable program.
Pensions and Other Postretirement Benefits -
Alliant Energy, IPL and WPL sponsor various defined benefit pension and OPEB plans that provide benefits to a significant portion of their employees and retirees. Assumptions and judgments are made periodically to estimate the obligations and costs related to their retirement plans. There are many judgments and assumptions involved in determining an entity’s pension and other postretirement liabilities and costs each period including employee demographics (including life expectancies and compensation levels), discount rates, assumed rates of return and
60
funding. Changes made to plan provisions may also impact current and future benefits costs. Judgments and assumptions are supported by historical data and reasonable projections and are reviewed at least annually. The following table shows the impacts of changing certain key actuarial assumptions discussed above (in millions):
|
Defined Benefit Pension Plans
|
OPEB Plans
|
|||||||||||||||
|
Change in Actuarial Assumption
|
Impact on Projected Benefit Obligation at December 31, 2016
|
Impact on 2017 Net Periodic Benefit Costs
|
Impact on Projected Benefit Obligation at December 31, 2016
|
Impact on 2017 Net Periodic Benefit Costs
|
||||||||||||
|
Alliant Energy
|
||||||||||||||||
|
1% change in discount rate
|
|
$162
|
|
|
$11
|
|
|
$21
|
|
|
$2
|
|
||||
|
1% change in expected rate of return
|
N/A
|
|
9
|
|
N/A
|
|
1
|
|
||||||||
|
IPL
|
||||||||||||||||
|
1% change in discount rate
|
75
|
|
5
|
|
8
|
|
1
|
|
||||||||
|
1% change in expected rate of return
|
N/A
|
|
4
|
|
N/A
|
|
1
|
|
||||||||
|
WPL
|
||||||||||||||||
|
1% change in discount rate
|
71
|
|
6
|
|
8
|
|
1
|
|
||||||||
|
1% change in expected rate of return
|
N/A
|
|
4
|
|
N/A
|
|
—
|
|
||||||||
Note 12(a)
provides additional details of pension and OPEB plans.
Income Taxes -
Alliant Energy, IPL and WPL are subject to income taxes in various jurisdictions. Assumptions and judgments are made each reporting period to estimate income tax assets, liabilities, benefits and expenses. Judgments and assumptions are supported by historical data and reasonable projections. Significant changes in these judgments and assumptions could have a material impact on financial condition and results of operations. Alliant Energy’s and IPL’s critical assumptions and judgments for
2016
include estimates of qualifying deductions for repairs expenditures and allocation of mixed service costs due to the impact of Iowa rate-making principles on such property-related differences. Critical assumptions and judgments also include projections of future taxable income used to determine the ability to utilize net operating losses and credit carryforwards prior to their expiration.
Effect of Rate-making on Property-related Differences
- Alliant Energy’s and IPL’s effective income tax rates are normally impacted by certain property-related differences at IPL for which deferred tax is not recorded in the income statement pursuant to Iowa rate-making principles. Changes in methods or assumptions regarding the amount of IPL’s qualifying repairs expenditures, allocation of mixed service costs, and costs related to retirement or removal of depreciable property could result in a material impact on Alliant Energy’s and IPL’s financial condition and results of operations. Refer to
Note 1(c)
for further discussion of regulatory accounting for taxes. Refer to
Note 11
for details of how the effect of rate-making on property-related differences impacted Alliant Energy’s and IPL’s effective income tax rates for
2016
,
2015
and
2014
.
Carryforward Utilization
- Significant federal tax credit carryforwards and federal and state net operating loss carryforwards have been generated. Based on projections of current and future taxable income, Alliant Energy, IPL and WPL plan to utilize substantially all of these carryforwards prior to their expiration. Changes in tax regulations or assumptions regarding current and future taxable income could require valuation allowances in the future resulting in a material impact on financial condition and results of operations. Refer to
Note 11
for further discussion of federal tax credit carryforwards, and federal and state net operating loss carryforwards.
Other Future Considerations
-
In addition to items discussed earlier in MDA, the
Notes
in Item 8 and “
Risk Factors
” in Item 1A, the following items could impact future financial condition or results of operations:
Electric Transmission Service Expense -
IPL and WPL currently receive substantially all their transmission services from ITC and ATC, respectively. Due to the use of formula rates that allow ITC and ATC to change the amount they charge to their customers based upon changes to the costs they incur, there is uncertainty regarding the long-term trends of IPL’s and WPL’s future electric transmission service expense. Based on IPL’s and WPL’s electric transmission cost recovery mechanisms discussed in
Note 1(g)
, IPL and WPL currently do not expect that any changes to electric transmission service costs billed by ITC and ATC will have a material impact on their financial condition and results of operations.
2017 Electric Transmission Service Expense
- Alliant Energy and IPL currently estimate their total electric transmission service expense in 2017 will be lower than the comparable expense in 2016 by approximately $45 million, primarily due to an expected lower return on equity for ITC in 2017 and refunds anticipated to be received in 2017 from ITC resulting from the MISO transmission owner return on equity complaints discussed below, partially offset by increased rate base at ITC. WPL’s total electric transmission service expense in 2017 is expected to be consistent with 2016 due to the escrow
61
accounting treatment for its electric transmission service expense, as well as cost estimates included in WPL’s approved retail electric rate case (2017/2018 Test Period), which exclude the impacts of an expected lower return on equity in 2017 and associated refunds resulting from the MISO transmission owner return on equity complaints.
MISO Transmission Owner Return on Equity Complaints
- A group of MISO cooperative and municipal utilities previously filed two complaints with FERC requesting a reduction to the base return on equity used by MISO transmission owners, including ITC and ATC. In September 2016, FERC issued an order on the first complaint and established a base return on equity of 10.32%, excluding any incentive adders granted by FERC, effective September 28, 2016, and for the refund period from November 12, 2013 through February 11, 2015. In October 2016, in response to MISO’s and the MISO transmission owners’ request, FERC ordered the related refunds to be issued no later than July 2017. IPL anticipates the retail portion of the refund from ITC will be refunded to its customers in 2017 through the transmission cost rider, pending IUB approval. WPL will defer the refund from ATC to a regulatory liability and refunds to its retail customers are expected to be addressed in a future rate proceeding. WPL’s and IPL’s wholesale customers will receive their share of the refunds through normal monthly billing practices as the refunds are received. Alliant Energy, IPL and WPL currently expect to receive refunds of $51 million, $40 million and $11 million, respectively, in the first quarter of 2017, subject to final true-up by the end of July 2017.
In June 2016, a FERC administrative law judge issued an initial decision regarding the second complaint and recommended a base return on equity of 9.70%, excluding any incentive adders granted by FERC, for the refund period from February 12, 2015 through May 11, 2016. A final decision from FERC on the second complaint is currently expected in the first half of 2017.
The total return on equity for ITC and ATC includes a base return on equity, as determined by FERC pursuant to the two MISO complaints, and incentive adders to the return on equity requested by the transmission owners and granted by FERC. In January 2015, FERC issued an order granting incentive adders of 0.50% to both ITC and ATC based on their participation in MISO effective January 6, 2015. In March 2015, FERC issued an order granting an additional incentive adder of 0.50% to ITC for being an independent transmission company effective April 1, 2015.
As a result of the two MISO complaints, Alliant Energy and WPL have realized a cumulative
$24 million
of reductions in the amount of equity income from ATC through December 31, 2016.
Sales Trends -
Jo-Carroll Energy, Inc.
- In 2014, Jo-Carroll Energy, Inc. provided notice of termination of its wholesale power supply agreement with IPL effective April 1, 2018. Sales to Jo-Carroll Energy, Inc. represented 3% of IPL’s total electric sales in
2016
.
WPPI Energy
- In 2014, WPPI Energy provided notice of termination of its wholesale power supply agreement with WPL effective May 31, 2017. Sales to WPPI Energy represented 5% of WPL’s total electric sales in
2016
.
Great Lakes Utilities
- In 2014, Great Lakes Utilities provided notice of termination of its wholesale power supply agreement with WPL effective December 31, 2017. Sales to Great Lakes Utilities represented approximately 2% of WPL’s total electric sales in
2016
.
Quantitative and Qualitative Disclosures About Market Risk are reported in “
Other Matters - Market Risk Sensitive Instruments and Positions
” in MDA.
62
REPORT OF INDEPENDENT REGISTERED PUBLIC ACCOUNTING FIRM
To the Board of Directors and Shareowners of
Alliant Energy Corporation
Madison, Wisconsin
We have audited the accompanying consolidated balance sheets of Alliant Energy Corporation and subsidiaries (the “Company”) as of
December 31, 2016
and
2015
, and the related consolidated statements of income, common equity, and cash flows for each of the three years in the period ended
December 31, 2016
. Our audits also included the Company’s financial statement schedules listed in the Index at Item 15. These financial statements and financial statement schedules are the responsibility of the Company’s management. Our responsibility is to express an opinion on the financial statements and financial statement schedules based on our audits.
We conducted our audits in accordance with the standards of the Public Company Accounting Oversight Board (United States). Those standards require that we plan and perform the audit to obtain reasonable assurance about whether the financial statements are free of material misstatement. An audit includes examining, on a test basis, evidence supporting the amounts and disclosures in the financial statements. An audit also includes assessing the accounting principles used and significant estimates made by management, as well as evaluating the overall financial statement presentation. We believe that our audits provide a reasonable basis for our opinion.
In our opinion, such consolidated financial statements present fairly, in all material respects, the financial position of the Company as of
December 31, 2016
and
2015
, and the results of its operations and its cash flows for each of the three years in the period ended
December 31, 2016
, in conformity with accounting principles generally accepted in the United States of America. Also, in our opinion, such financial statement schedules, when considered in relation to the basic consolidated financial statements taken as a whole, present fairly, in all material respects, the information set forth therein.
We have also audited, in accordance with the standards of the Public Company Accounting Oversight Board (United States), the Company’s internal control over financial reporting as of
December 31, 2016
, based on the criteria established in
Internal Control-Integrated Framework (2013)
issued by the Committee of Sponsoring Organizations of the Treadway Commission and our report dated
February 24, 2017
expressed an unqualified opinion on the Company’s internal control over financial reporting.
/s/ DELOITTE & TOUCHE LLP
DELOITTE & TOUCHE LLP
Milwaukee, Wisconsin
February 24, 2017
63
ALLIANT ENERGY CORPORATION
CONSOLIDATED STATEMENTS OF INCOME
|
Year Ended December 31,
|
|||||||||||
|
2016
|
2015
|
2014
|
|||||||||
|
(in millions, except per share amounts)
|
|||||||||||
|
Operating revenues:
|
|||||||||||
|
Electric utility
|
|
$2,875.5
|
|
|
$2,770.5
|
|
|
$2,713.6
|
|
||
|
Gas utility
|
355.4
|
|
381.2
|
|
517.5
|
|
|||||
|
Other utility
|
48.6
|
|
57.9
|
|
66.1
|
|
|||||
|
Non-regulated
|
40.5
|
|
44.0
|
|
53.1
|
|
|||||
|
Total operating revenues
|
3,320.0
|
|
3,253.6
|
|
3,350.3
|
|
|||||
|
Operating expenses:
|
|||||||||||
|
Electric production fuel and purchased power
|
854.0
|
|
837.7
|
|
877.2
|
|
|||||
|
Electric transmission service
|
527.9
|
|
485.3
|
|
447.5
|
|
|||||
|
Cost of gas sold
|
194.3
|
|
219.1
|
|
327.8
|
|
|||||
|
Asset valuation charges for Franklin County wind farm
|
86.4
|
|
—
|
|
—
|
|
|||||
|
Other operation and maintenance
|
606.5
|
|
629.5
|
|
665.0
|
|
|||||
|
Depreciation and amortization
|
411.6
|
|
401.3
|
|
388.1
|
|
|||||
|
Taxes other than income taxes
|
102.3
|
|
103.7
|
|
101.1
|
|
|||||
|
Total operating expenses
|
2,783.0
|
|
2,676.6
|
|
2,806.7
|
|
|||||
|
Operating income
|
537.0
|
|
577.0
|
|
543.6
|
|
|||||
|
Interest expense and other:
|
|||||||||||
|
Interest expense
|
196.2
|
|
187.1
|
|
180.6
|
|
|||||
|
Equity income from unconsolidated investments, net
|
(39.6
|
)
|
(33.8
|
)
|
(40.4
|
)
|
|||||
|
Allowance for funds used during construction
|
(62.5
|
)
|
(36.9
|
)
|
(34.8
|
)
|
|||||
|
Interest income and other
|
(0.5
|
)
|
(0.7
|
)
|
(1.8
|
)
|
|||||
|
Total interest expense and other
|
93.6
|
|
115.7
|
|
103.6
|
|
|||||
|
Income from continuing operations before income taxes
|
443.4
|
|
461.3
|
|
440.0
|
|
|||||
|
Income taxes
|
59.4
|
|
70.4
|
|
44.3
|
|
|||||
|
Income from continuing operations, net of tax
|
384.0
|
|
390.9
|
|
395.7
|
|
|||||
|
Loss from discontinued operations, net of tax
|
(2.3
|
)
|
(2.5
|
)
|
(2.4
|
)
|
|||||
|
Net income
|
381.7
|
|
388.4
|
|
393.3
|
|
|||||
|
Preferred dividend requirements of Interstate Power and Light Company
|
10.2
|
|
10.2
|
|
10.2
|
|
|||||
|
Net income attributable to Alliant Energy common shareowners
|
|
$371.5
|
|
|
$378.2
|
|
|
$383.1
|
|
||
|
Weighted average number of common shares outstanding (basic and diluted) (a)
|
227.1
|
|
225.4
|
|
221.7
|
|
|||||
|
Earnings per weighted average common share attributable to Alliant Energy common shareowners (basic and diluted) (a):
|
|||||||||||
|
Income from continuing operations, net of tax
|
|
$1.65
|
|
|
$1.69
|
|
|
$1.74
|
|
||
|
Loss from discontinued operations, net of tax
|
(0.01
|
)
|
(0.01
|
)
|
(0.01
|
)
|
|||||
|
Net income
|
|
$1.64
|
|
|
$1.68
|
|
|
$1.73
|
|
||
|
Amounts attributable to Alliant Energy common shareowners:
|
|||||||||||
|
Income from continuing operations, net of tax
|
|
$373.8
|
|
|
$380.7
|
|
|
$385.5
|
|
||
|
Loss from discontinued operations, net of tax
|
(2.3
|
)
|
(2.5
|
)
|
(2.4
|
)
|
|||||
|
Net income
|
|
$371.5
|
|
|
$378.2
|
|
|
$383.1
|
|
||
|
(a)
|
Amounts reflect the effects of a two-for-one common stock split distributed in May 2016
.
Refer to
Note 7
for additional details.
|
The accompanying Combined Notes to Consolidated Financial Statements are an integral part of these statements.
64
ALLIANT ENERGY CORPORATION
|
December 31,
|
|||||||
|
2016
|
2015
|
||||||
|
(in millions, except per
share and share amounts)
|
|||||||
|
ASSETS
|
|||||||
|
Current assets:
|
|||||||
|
Cash and cash equivalents
|
|
$8.2
|
|
|
$5.8
|
|
|
|
Accounts receivable, less allowance for doubtful accounts
|
493.3
|
|
397.6
|
|
|||
|
Production fuel, at weighted average cost
|
98.1
|
|
98.8
|
|
|||
|
Gas stored underground, at weighted average cost
|
37.6
|
|
43.3
|
|
|||
|
Materials and supplies, at weighted average cost
|
86.6
|
|
81.4
|
|
|||
|
Regulatory assets
|
57.8
|
|
120.2
|
|
|||
|
Other
|
95.5
|
|
79.7
|
|
|||
|
Total current assets
|
877.1
|
|
826.8
|
|
|||
|
Property, plant and equipment, net
|
10,279.2
|
|
9,519.1
|
|
|||
|
Investments:
|
|||||||
|
Investment in American Transmission Company LLC
|
317.6
|
|
293.3
|
|
|||
|
Other
|
20.0
|
|
53.0
|
|
|||
|
Total investments
|
337.6
|
|
346.3
|
|
|||
|
Other assets:
|
|||||||
|
Regulatory assets
|
1,857.3
|
|
1,788.4
|
|
|||
|
Deferred charges and other
|
22.6
|
|
14.6
|
|
|||
|
Total other assets
|
1,879.9
|
|
1,803.0
|
|
|||
|
Total assets
|
|
$13,373.8
|
|
|
$12,495.2
|
|
|
|
LIABILITIES AND EQUITY
|
|||||||
|
Current liabilities:
|
|||||||
|
Current maturities of long-term debt
|
|
$4.6
|
|
|
$313.4
|
|
|
|
Commercial paper
|
244.1
|
|
159.8
|
|
|||
|
Accounts payable
|
445.3
|
|
402.4
|
|
|||
|
Regulatory liabilities
|
186.2
|
|
187.1
|
|
|||
|
Accrued taxes
|
59.5
|
|
53.2
|
|
|||
|
Other
|
222.3
|
|
243.4
|
|
|||
|
Total current liabilities
|
1,162.0
|
|
1,359.3
|
|
|||
|
Long-term debt, net (excluding current portion)
|
4,315.6
|
|
3,522.2
|
|
|||
|
Other liabilities:
|
|||||||
|
Deferred tax liabilities
|
2,570.2
|
|
2,381.2
|
|
|||
|
Regulatory liabilities
|
494.8
|
|
550.6
|
|
|||
|
Pension and other benefit obligations
|
489.9
|
|
451.8
|
|
|||
|
Other
|
279.3
|
|
306.0
|
|
|||
|
Total other liabilities
|
3,834.2
|
|
3,689.6
|
|
|||
|
Commitments and contingencies (
Note 16
)
|
|
|
|||||
|
Equity:
|
|||||||
|
Alliant Energy Corporation common equity:
|
|||||||
|
Common stock - $0.01 par value - 480,000,000 shares authorized; 227,673,654 and 226,918,432 shares outstanding (a)
|
2.3
|
|
2.3
|
|
|||
|
Additional paid-in capital (a)
|
1,693.1
|
|
1,661.8
|
|
|||
|
Retained earnings
|
2,177.0
|
|
2,068.9
|
|
|||
|
Accumulated other comprehensive loss
|
(0.4
|
)
|
(0.4
|
)
|
|||
|
Shares in deferred compensation trust - 441,695 and 430,186 shares at a weighted average cost of $22.71 and $19.84 per share (a)
|
(10.0
|
)
|
(8.5
|
)
|
|||
|
Total Alliant Energy Corporation common equity
|
3,862.0
|
|
3,724.1
|
|
|||
|
Cumulative preferred stock of Interstate Power and Light Company
|
200.0
|
|
200.0
|
|
|||
|
Total equity
|
4,062.0
|
|
3,924.1
|
|
|||
|
Total liabilities and equity
|
|
$13,373.8
|
|
|
$12,495.2
|
|
|
|
(a)
|
Amounts reflect the effects of a two-for-one common stock split distributed in May 2016. Refer to
Note 7
for additional details.
|
The accompanying Combined Notes to Consolidated Financial Statements are an integral part of these statements.
65
ALLIANT ENERGY CORPORATION
|
Year Ended December 31,
|
|||||||||||
|
2016
|
2015
|
2014
|
|||||||||
|
(in millions)
|
|||||||||||
|
Cash flows from operating activities:
|
|||||||||||
|
Net income
|
|
$381.7
|
|
|
$388.4
|
|
|
$393.3
|
|
||
|
Adjustments to reconcile net income to net cash flows from operating activities:
|
|||||||||||
|
Depreciation and amortization
|
411.6
|
|
401.3
|
|
388.1
|
|
|||||
|
Other amortizations
|
(4.8
|
)
|
12.4
|
|
54.2
|
|
|||||
|
Deferred tax expense and tax credits
|
84.6
|
|
114.2
|
|
55.2
|
|
|||||
|
Equity income from unconsolidated investments, net
|
(39.6
|
)
|
(33.8
|
)
|
(40.4
|
)
|
|||||
|
Distributions from equity method investments
|
28.3
|
|
30.6
|
|
36.4
|
|
|||||
|
Equity component of allowance for funds used during construction
|
(42.3
|
)
|
(24.4
|
)
|
(23.1
|
)
|
|||||
|
Asset valuation charges for Franklin County wind farm
|
86.4
|
|
—
|
|
—
|
|
|||||
|
Other
|
0.8
|
|
15.7
|
|
2.0
|
|
|||||
|
Other changes in assets and liabilities:
|
|||||||||||
|
Accounts receivable
|
(121.4
|
)
|
36.8
|
|
48.7
|
|
|||||
|
Sales of accounts receivable
|
16.0
|
|
(17.0
|
)
|
(7.0
|
)
|
|||||
|
Regulatory assets
|
(3.6
|
)
|
(104.5
|
)
|
(439.8
|
)
|
|||||
|
Regulatory liabilities
|
(63.0
|
)
|
(67.8
|
)
|
10.8
|
|
|||||
|
Deferred income taxes
|
102.4
|
|
94.6
|
|
138.4
|
|
|||||
|
Pension and other benefit obligations
|
38.1
|
|
30.1
|
|
215.1
|
|
|||||
|
Other
|
(15.6
|
)
|
(5.4
|
)
|
59.7
|
|
|||||
|
Net cash flows from operating activities
|
859.6
|
|
871.2
|
|
891.6
|
|
|||||
|
Cash flows used for investing activities:
|
|||||||||||
|
Construction and acquisition expenditures:
|
|||||||||||
|
Utility business
|
(1,142.7
|
)
|
(963.6
|
)
|
(838.9
|
)
|
|||||
|
Alliant Energy Corporate Services, Inc. and non-regulated businesses
|
(54.1
|
)
|
(70.7
|
)
|
(63.9
|
)
|
|||||
|
Proceeds from Minnesota electric and natural gas distribution asset sales
|
—
|
|
139.9
|
|
—
|
|
|||||
|
Other
|
10.3
|
|
(24.8
|
)
|
(14.9
|
)
|
|||||
|
Net cash flows used for investing activities
|
(1,186.5
|
)
|
(919.2
|
)
|
(917.7
|
)
|
|||||
|
Cash flows from (used for) financing activities:
|
|||||||||||
|
Common stock dividends
|
(266.5
|
)
|
(247.3
|
)
|
(225.8
|
)
|
|||||
|
Proceeds from issuance of common stock, net
|
26.6
|
|
151.2
|
|
—
|
|
|||||
|
Proceeds from issuance of long-term debt
|
800.0
|
|
250.7
|
|
812.9
|
|
|||||
|
Payments to retire long-term debt
|
(313.4
|
)
|
(183.0
|
)
|
(358.5
|
)
|
|||||
|
Net change in commercial paper
|
84.3
|
|
18.5
|
|
(138.1
|
)
|
|||||
|
Other
|
(1.7
|
)
|
6.8
|
|
(17.3
|
)
|
|||||
|
Net cash flows from (used for) financing activities
|
329.3
|
|
(3.1
|
)
|
73.2
|
|
|||||
|
Net increase (decrease) in cash and cash equivalents
|
2.4
|
|
(51.1
|
)
|
47.1
|
|
|||||
|
Cash and cash equivalents at beginning of period
|
5.8
|
|
56.9
|
|
9.8
|
|
|||||
|
Cash and cash equivalents at end of period
|
|
$8.2
|
|
|
$5.8
|
|
|
$56.9
|
|
||
|
Supplemental cash flows information:
|
|||||||||||
|
Cash (paid) refunded during the period for:
|
|||||||||||
|
Interest, net of capitalized interest
|
|
($192.4
|
)
|
|
($184.8
|
)
|
|
($180.8
|
)
|
||
|
Income taxes, net
|
|
($9.8
|
)
|
|
$—
|
|
|
$5.3
|
|
||
|
Significant non-cash investing and financing activities:
|
|||||||||||
|
Accrued capital expenditures
|
|
$154.4
|
|
|
$148.3
|
|
|
$160.3
|
|
||
The accompanying Combined Notes to Consolidated Financial Statements are an integral part of these statements.
66
ALLIANT ENERGY CORPORATION
CONSOLIDATED STATEMENTS OF COMMON EQUITY
|
Total
|
|||||||||||||||||||||||
|
Accumulated
|
Shares in
|
Alliant
|
|||||||||||||||||||||
|
Additional
|
Other
|
Deferred
|
Energy
|
||||||||||||||||||||
|
Common
|
Paid-In
|
Retained
|
Comprehensive
|
Compensation
|
Common
|
||||||||||||||||||
|
Stock
|
Capital
|
Earnings
|
Income (Loss)
|
Trust
|
Equity
|
||||||||||||||||||
|
(in millions)
|
|||||||||||||||||||||||
|
2014:
|
|||||||||||||||||||||||
|
Beginning balance (a)
|
|
$2.2
|
|
|
$1,506.7
|
|
|
$1,780.7
|
|
|
($0.2
|
)
|
|
($8.0
|
)
|
|
$3,281.4
|
|
|||||
|
Net income attributable to Alliant Energy common shareowners
|
383.1
|
|
383.1
|
|
|||||||||||||||||||
|
Common stock dividends ($1.02 per share) (a)
|
(225.8
|
)
|
(225.8
|
)
|
|||||||||||||||||||
|
Other
|
1.3
|
|
(0.9
|
)
|
0.4
|
|
|||||||||||||||||
|
Other comprehensive loss, net of tax
|
(0.4
|
)
|
(0.4
|
)
|
|||||||||||||||||||
|
Ending balance (a)
|
2.2
|
|
1,508.0
|
|
1,938.0
|
|
(0.6
|
)
|
(8.9
|
)
|
3,438.7
|
|
|||||||||||
|
2015:
|
|||||||||||||||||||||||
|
Net income attributable to Alliant Energy common shareowners
|
378.2
|
|
378.2
|
|
|||||||||||||||||||
|
Common stock dividends ($1.10 per share) (a)
|
(247.3
|
)
|
(247.3
|
)
|
|||||||||||||||||||
|
Common stock issued, net (a)
|
0.1
|
|
151.1
|
|
151.2
|
|
|||||||||||||||||
|
Other
|
2.7
|
|
0.4
|
|
3.1
|
|
|||||||||||||||||
|
Other comprehensive income, net of tax
|
0.2
|
|
0.2
|
|
|||||||||||||||||||
|
Ending balance (a)
|
2.3
|
|
1,661.8
|
|
2,068.9
|
|
(0.4
|
)
|
(8.5
|
)
|
3,724.1
|
|
|||||||||||
|
2016:
|
|||||||||||||||||||||||
|
Net income attributable to Alliant Energy common shareowners
|
371.5
|
|
371.5
|
|
|||||||||||||||||||
|
Common stock dividends ($1.175 per share) (a)
|
(266.5
|
)
|
(266.5
|
)
|
|||||||||||||||||||
|
Common stock issued, net
|
26.6
|
|
26.6
|
|
|||||||||||||||||||
|
Other
|
4.7
|
|
3.1
|
|
(1.5
|
)
|
6.3
|
|
|||||||||||||||
|
Ending balance
|
|
$2.3
|
|
|
$1,693.1
|
|
|
$2,177.0
|
|
|
($0.4
|
)
|
|
($10.0
|
)
|
|
$3,862.0
|
|
|||||
|
(a)
|
Amounts reflect the effects of a two-for-one common stock split distributed in May 2016
.
Refer to
Note 7
for additional details.
|
The accompanying Combined Notes to Consolidated Financial Statements are an integral part of these statements.
67
REPORT OF INDEPENDENT REGISTERED PUBLIC ACCOUNTING FIRM
To the Board of Directors and Shareowners of
Interstate Power and Light Company
Cedar Rapids, Iowa
We have audited the accompanying consolidated balance sheets of Interstate Power and Light Company and subsidiary (the “Company”) as of
December 31, 2016
and
2015
, and the related consolidated statements of income, common equity, and cash flows for each of the three years in the period ended
December 31, 2016
. Our audits also included the Company’s financial statement schedule listed in the Index at Item 15. These financial statements and the financial statement schedule are the responsibility of the Company’s management. Our responsibility is to express an opinion on the financial statements and the financial statement schedule based on our audits.
We conducted our audits in accordance with the standards of the Public Company Accounting Oversight Board (United States). Those standards require that we plan and perform the audit to obtain reasonable assurance about whether the financial statements are free of material misstatement. The Company is not required to have, nor were we engaged to perform, an audit of its internal control over financial reporting. Our audits included consideration of internal control over financial reporting as a basis for designing audit procedures that are appropriate in the circumstances, but not for the purpose of expressing an opinion on the effectiveness of the Company’s internal control over financial reporting. Accordingly, we express no such opinion. An audit also includes examining, on a test basis, evidence supporting the amounts and disclosures in the financial statements, assessing the accounting principles used and significant estimates made by management, as well as evaluating the overall financial statement presentation. We believe that our audits provide a reasonable basis for our opinion.
In our opinion, such consolidated financial statements present fairly, in all material respects, the financial position of the Company as of
December 31, 2016
and
2015
, and the results of its operations and its cash flows for each of the three years in the period ended
December 31, 2016
, in conformity with accounting principles generally accepted in the United States of America. Also, in our opinion, the financial statement schedule, when considered in relation to the basic consolidated financial statements taken as a whole, presents fairly, in all material respects, the information set forth therein.
/s/ DELOITTE & TOUCHE LLP
DELOITTE & TOUCHE LLP
Milwaukee, Wisconsin
February 24, 2017
68
INTERSTATE POWER AND LIGHT COMPANY
CONSOLIDATED STATEMENTS OF INCOME
|
Year Ended December 31,
|
|||||||||||
|
2016
|
2015
|
2014
|
|||||||||
|
(in millions)
|
|||||||||||
|
Operating revenues:
|
|||||||||||
|
Electric utility
|
|
$1,569.7
|
|
|
$1,503.8
|
|
|
$1,493.3
|
|
||
|
Gas utility
|
204.0
|
|
217.3
|
|
296.5
|
|
|||||
|
Steam and other
|
46.7
|
|
53.4
|
|
58.3
|
|
|||||
|
Total operating revenues
|
1,820.4
|
|
1,774.5
|
|
1,848.1
|
|
|||||
|
Operating expenses:
|
|||||||||||
|
Electric production fuel and purchased power
|
430.5
|
|
428.4
|
|
497.3
|
|
|||||
|
Electric transmission service
|
359.7
|
|
328.2
|
|
323.4
|
|
|||||
|
Cost of gas sold
|
111.0
|
|
123.3
|
|
185.5
|
|
|||||
|
Other operation and maintenance
|
383.7
|
|
389.9
|
|
381.1
|
|
|||||
|
Depreciation and amortization
|
210.8
|
|
207.2
|
|
197.5
|
|
|||||
|
Taxes other than income taxes
|
53.9
|
|
55.6
|
|
54.1
|
|
|||||
|
Total operating expenses
|
1,549.6
|
|
1,532.6
|
|
1,638.9
|
|
|||||
|
Operating income
|
270.8
|
|
241.9
|
|
209.2
|
|
|||||
|
Interest expense and other:
|
|||||||||||
|
Interest expense
|
103.2
|
|
96.8
|
|
89.9
|
|
|||||
|
Allowance for funds used during construction
|
(52.0
|
)
|
(28.2
|
)
|
(25.9
|
)
|
|||||
|
Interest income and other
|
(0.3
|
)
|
(0.2
|
)
|
2.3
|
|
|||||
|
Total interest expense and other
|
50.9
|
|
68.4
|
|
66.3
|
|
|||||
|
Income before income taxes
|
219.9
|
|
173.5
|
|
142.9
|
|
|||||
|
Income tax benefit
|
(5.9
|
)
|
(22.7
|
)
|
(48.9
|
)
|
|||||
|
Net income
|
225.8
|
|
196.2
|
|
191.8
|
|
|||||
|
Preferred dividend requirements
|
10.2
|
|
10.2
|
|
10.2
|
|
|||||
|
Earnings available for common stock
|
|
$215.6
|
|
|
$186.0
|
|
|
$181.6
|
|
||
Earnings per share data is not disclosed given Alliant Energy Corporation is the sole shareowner of all shares of IPL’s common stock outstanding during the periods presented.
The accompanying Combined Notes to Consolidated Financial Statements are an integral part of these statements.
69
INTERSTATE POWER AND LIGHT COMPANY
CONSOLIDATED BALANCE SHEETS
|
December 31,
|
|||||||
|
2016
|
2015
|
||||||
|
(in millions, except per
share and share amounts)
|
|||||||
|
ASSETS
|
|||||||
|
Current assets:
|
|||||||
|
Cash and cash equivalents
|
|
$3.3
|
|
|
$4.5
|
|
|
|
Accounts receivable, less allowance for doubtful accounts
|
240.7
|
|
200.0
|
|
|||
|
Production fuel, at weighted average cost
|
70.3
|
|
60.2
|
|
|||
|
Gas stored underground, at weighted average cost
|
16.3
|
|
18.2
|
|
|||
|
Materials and supplies, at weighted average cost
|
46.5
|
|
45.7
|
|
|||
|
Regulatory assets
|
17.7
|
|
39.6
|
|
|||
|
Other
|
27.7
|
|
28.2
|
|
|||
|
Total current assets
|
422.5
|
|
396.4
|
|
|||
|
Property, plant and equipment, net
|
5,435.6
|
|
4,925.1
|
|
|||
|
Investments
|
0.8
|
|
19.6
|
|
|||
|
Other assets:
|
|||||||
|
Regulatory assets
|
1,441.1
|
|
1,363.0
|
|
|||
|
Deferred charges and other
|
4.7
|
|
5.0
|
|
|||
|
Total other assets
|
1,445.8
|
|
1,368.0
|
|
|||
|
Total assets
|
|
$7,304.7
|
|
|
$6,709.1
|
|
|
|
LIABILITIES AND EQUITY
|
|||||||
|
Current liabilities:
|
|||||||
|
Accounts payable
|
|
$186.3
|
|
|
$197.2
|
|
|
|
Accounts payable to associated companies
|
43.3
|
|
37.7
|
|
|||
|
Regulatory liabilities
|
149.6
|
|
130.9
|
|
|||
|
Accrued taxes
|
53.8
|
|
67.6
|
|
|||
|
Accrued interest
|
31.6
|
|
28.2
|
|
|||
|
Other
|
57.2
|
|
69.5
|
|
|||
|
Total current liabilities
|
521.8
|
|
531.1
|
|
|||
|
Long-term debt, net
|
2,153.5
|
|
1,856.9
|
|
|||
|
Other liabilities:
|
|||||||
|
Deferred tax liabilities
|
1,511.8
|
|
1,378.0
|
|
|||
|
Regulatory liabilities
|
281.2
|
|
358.3
|
|
|||
|
Pension and other benefit obligations
|
173.2
|
|
160.2
|
|
|||
|
Other
|
214.2
|
|
229.3
|
|
|||
|
Total other liabilities
|
2,180.4
|
|
2,125.8
|
|
|||
|
Commitments and contingencies (
Note 16
)
|
|
|
|||||
|
Equity:
|
|||||||
|
Interstate Power and Light Company common equity:
|
|||||||
|
Common stock - $2.50 par value - 24,000,000 shares authorized; 13,370,788 shares outstanding
|
33.4
|
|
33.4
|
|
|||
|
Additional paid-in capital
|
1,597.8
|
|
1,407.8
|
|
|||
|
Retained earnings
|
617.8
|
|
554.1
|
|
|||
|
Total Interstate Power and Light Company common equity
|
2,249.0
|
|
1,995.3
|
|
|||
|
Cumulative preferred stock
|
200.0
|
|
200.0
|
|
|||
|
Total equity
|
2,449.0
|
|
2,195.3
|
|
|||
|
Total liabilities and equity
|
|
$7,304.7
|
|
|
$6,709.1
|
|
|
The accompanying Combined Notes to Consolidated Financial Statements are an
integral part of these statements.
70
INTERSTATE POWER AND LIGHT COMPANY
CONSOLIDATED STATEMENTS OF CASH FLOWS
|
Year Ended December 31,
|
|||||||||||
|
2016
|
2015
|
2014
|
|||||||||
|
(in millions)
|
|||||||||||
|
Cash flows from operating activities:
|
|||||||||||
|
Net income
|
|
$225.8
|
|
|
$196.2
|
|
|
$191.8
|
|
||
|
Adjustments to reconcile net income to net cash flows from operating activities:
|
|||||||||||
|
Depreciation and amortization
|
210.8
|
|
207.2
|
|
197.5
|
|
|||||
|
Deferred tax expense (benefit) and tax credits
|
35.6
|
|
28.9
|
|
(11.5
|
)
|
|||||
|
Equity component of allowance for funds used during construction
|
(35.2
|
)
|
(18.6
|
)
|
(17.1
|
)
|
|||||
|
Other
|
2.9
|
|
19.5
|
|
11.3
|
|
|||||
|
Other changes in assets and liabilities:
|
|||||||||||
|
Accounts receivable
|
(59.7
|
)
|
20.4
|
|
43.3
|
|
|||||
|
Sales of accounts receivable
|
16.0
|
|
(17.0
|
)
|
(7.0
|
)
|
|||||
|
Regulatory assets
|
(54.7
|
)
|
(76.3
|
)
|
(272.9
|
)
|
|||||
|
Accounts payable
|
8.0
|
|
(42.7
|
)
|
18.8
|
|
|||||
|
Regulatory liabilities
|
(67.3
|
)
|
(75.5
|
)
|
(18.9
|
)
|
|||||
|
Deferred income taxes
|
97.7
|
|
82.1
|
|
140.4
|
|
|||||
|
Pension and other benefit obligations
|
13.1
|
|
17.8
|
|
93.8
|
|
|||||
|
Other
|
(31.1
|
)
|
43.0
|
|
36.6
|
|
|||||
|
Net cash flows from operating activities
|
361.9
|
|
385.0
|
|
406.1
|
|
|||||
|
Cash flows used for investing activities:
|
|||||||||||
|
Utility construction and acquisition expenditures
|
(689.7
|
)
|
(619.3
|
)
|
(526.0
|
)
|
|||||
|
Proceeds from Minnesota electric and natural gas distribution asset sales
|
—
|
|
139.9
|
|
—
|
|
|||||
|
Other
|
(3.9
|
)
|
(32.5
|
)
|
(26.7
|
)
|
|||||
|
Net cash flows used for investing activities
|
(693.6
|
)
|
(511.9
|
)
|
(552.7
|
)
|
|||||
|
Cash flows from financing activities:
|
|||||||||||
|
Common stock dividends
|
(151.9
|
)
|
(140.0
|
)
|
(140.0
|
)
|
|||||
|
Capital contributions from parent
|
190.0
|
|
165.0
|
|
90.0
|
|
|||||
|
Proceeds from issuance of long-term debt
|
300.0
|
|
250.0
|
|
250.0
|
|
|||||
|
Payments to retire long-term debt
|
—
|
|
(150.0
|
)
|
(38.4
|
)
|
|||||
|
Other
|
(7.6
|
)
|
1.1
|
|
(14.1
|
)
|
|||||
|
Net cash flows from financing activities
|
330.5
|
|
126.1
|
|
147.5
|
|
|||||
|
Net increase (decrease) in cash and cash equivalents
|
(1.2
|
)
|
(0.8
|
)
|
0.9
|
|
|||||
|
Cash and cash equivalents at beginning of period
|
4.5
|
|
5.3
|
|
4.4
|
|
|||||
|
Cash and cash equivalents at end of period
|
|
$3.3
|
|
|
$4.5
|
|
|
$5.3
|
|
||
|
Supplemental cash flows information:
|
|||||||||||
|
Cash (paid) refunded during the period for:
|
|||||||||||
|
Interest
|
|
($99.7
|
)
|
|
($93.9
|
)
|
|
($89.8
|
)
|
||
|
Income taxes, net
|
|
($11.1
|
)
|
|
$19.3
|
|
|
$20.1
|
|
||
|
Significant non-cash investing and financing activities:
|
|||||||||||
|
Accrued capital expenditures
|
|
$53.8
|
|
|
$77.0
|
|
|
$113.2
|
|
||
The accompanying Combined Notes to Consolidated Financial Statements are an integral part of these statements.
71
INTERSTATE POWER AND LIGHT COMPANY
CONSOLIDATED STATEMENTS OF COMMON EQUITY
|
Total
|
|||||||||||||||
|
Additional
|
IPL
|
||||||||||||||
|
Common
|
Paid-In
|
Retained
|
Common
|
||||||||||||
|
Stock
|
Capital
|
Earnings
|
Equity
|
||||||||||||
|
(in millions)
|
|||||||||||||||
|
2014:
|
|||||||||||||||
|
Beginning balance
|
|
$33.4
|
|
|
$1,152.8
|
|
|
$461.9
|
|
|
$1,648.1
|
|
|||
|
Earnings available for common stock
|
181.6
|
|
181.6
|
|
|||||||||||
|
Common stock dividends
|
(140.0
|
)
|
(140.0
|
)
|
|||||||||||
|
Capital contribution from parent
|
90.0
|
|
90.0
|
|
|||||||||||
|
Other
|
|
4.6
|
|
4.6
|
|
||||||||||
|
Ending balance
|
33.4
|
|
1,242.8
|
|
508.1
|
|
1,784.3
|
|
|||||||
|
2015:
|
|||||||||||||||
|
Earnings available for common stock
|
186.0
|
|
186.0
|
|
|||||||||||
|
Common stock dividends
|
(140.0
|
)
|
(140.0
|
)
|
|||||||||||
|
Capital contribution from parent
|
165.0
|
|
165.0
|
|
|||||||||||
|
Ending balance
|
33.4
|
|
1,407.8
|
|
554.1
|
|
1,995.3
|
|
|||||||
|
2016:
|
|||||||||||||||
|
Earnings available for common stock
|
215.6
|
|
215.6
|
|
|||||||||||
|
Common stock dividends
|
(151.9
|
)
|
(151.9
|
)
|
|||||||||||
|
Capital contribution from parent
|
190.0
|
|
190.0
|
|
|||||||||||
|
Ending balance
|
|
$33.4
|
|
|
$1,597.8
|
|
|
$617.8
|
|
|
$2,249.0
|
|
|||
The accompanying Combined Notes to Consolidated Financial Statements are an integral part of these statements.
72
REPORT OF INDEPENDENT REGISTERED PUBLIC ACCOUNTING FIRM
To the Board of Directors and Shareowner of
Wisconsin Power and Light Company
Madison, Wisconsin
We have audited the accompanying consolidated balance sheets of Wisconsin Power and Light Company and subsidiary (the “Company”) as of
December 31, 2016
and
2015
, and the related consolidated statements of income, equity, and cash flows for each of the three years in the period ended
December 31, 2016
. Our audits also included the Company’s financial statement schedule listed in the Index at Item 15. These financial statements and the financial statement schedule are the responsibility of the Company’s management. Our responsibility is to express an opinion on the financial statements and the financial statement schedule based on our audits.
We conducted our audits in accordance with the standards of the Public Company Accounting Oversight Board (United States). Those standards require that we plan and perform the audit to obtain reasonable assurance about whether the financial statements are free of material misstatement. The Company is not required to have, nor were we engaged to perform, an audit of its internal control over financial reporting. Our audits included consideration of internal control over financial reporting as a basis for designing audit procedures that are appropriate in the circumstances, but not for the purpose of expressing an opinion on the effectiveness of the Company’s internal control over financial reporting. Accordingly, we express no such opinion. An audit also includes examining, on a test basis, evidence supporting the amounts and disclosures in the financial statements, assessing the accounting principles used and significant estimates made by management, as well as evaluating the overall financial statement presentation. We believe that our audits provide a reasonable basis for our opinion.
In our opinion, such consolidated financial statements present fairly, in all material respects, the financial position of the Company as of
December 31, 2016
and
2015
, and the results of its operations and its cash flows for each of the three years in the period ended
December 31, 2016
, in conformity with accounting principles generally accepted in the United States of America. Also, in our opinion, the financial statement schedule, when considered in relation to the basic consolidated financial statements taken as a whole, presents fairly, in all material respects, the information set forth therein.
/s/ DELOITTE & TOUCHE LLP
DELOITTE & TOUCHE LLP
Milwaukee, Wisconsin
February 24, 2017
73
WISCONSIN POWER AND LIGHT COMPANY
CONSOLIDATED STATEMENTS OF INCOME
|
Year Ended December 31,
|
|||||||||||
|
2016
|
2015
|
2014
|
|||||||||
|
(in millions)
|
|||||||||||
|
Operating revenues:
|
|||||||||||
|
Electric utility
|
|
$1,305.8
|
|
|
$1,266.7
|
|
|
$1,220.3
|
|
||
|
Gas utility
|
151.4
|
|
163.9
|
|
221.0
|
|
|||||
|
Other
|
1.9
|
|
4.5
|
|
7.8
|
|
|||||
|
Total operating revenues
|
1,459.1
|
|
1,435.1
|
|
1,449.1
|
|
|||||
|
Operating expenses:
|
|||||||||||
|
Electric production fuel and purchased power
|
423.5
|
|
409.3
|
|
379.9
|
|
|||||
|
Electric transmission service
|
168.2
|
|
157.1
|
|
124.1
|
|
|||||
|
Cost of gas sold
|
83.3
|
|
95.8
|
|
142.3
|
|
|||||
|
Other operation and maintenance
|
219.8
|
|
235.4
|
|
277.2
|
|
|||||
|
Depreciation and amortization
|
192.5
|
|
184.3
|
|
181.2
|
|
|||||
|
Taxes other than income taxes
|
44.8
|
|
44.5
|
|
43.4
|
|
|||||
|
Total operating expenses
|
1,132.1
|
|
1,126.4
|
|
1,148.1
|
|
|||||
|
Operating income
|
327.0
|
|
308.7
|
|
301.0
|
|
|||||
|
Interest expense and other:
|
|||||||||||
|
Interest expense
|
91.4
|
|
92.4
|
|
86.4
|
|
|||||
|
Equity income from unconsolidated investments
|
(39.8
|
)
|
(35.1
|
)
|
(42.8
|
)
|
|||||
|
Allowance for funds used during construction
|
(10.5
|
)
|
(8.7
|
)
|
(8.9
|
)
|
|||||
|
Interest income and other
|
(0.2
|
)
|
(0.4
|
)
|
(0.1
|
)
|
|||||
|
Total interest expense and other
|
40.9
|
|
48.2
|
|
34.6
|
|
|||||
|
Income before income taxes
|
286.1
|
|
260.5
|
|
266.4
|
|
|||||
|
Income taxes
|
93.3
|
|
82.9
|
|
85.3
|
|
|||||
|
Net income
|
192.8
|
|
177.6
|
|
181.1
|
|
|||||
|
Net income attributable to noncontrolling interest
|
2.4
|
|
1.3
|
|
0.7
|
|
|||||
|
Earnings available for common stock
|
|
$190.4
|
|
|
$176.3
|
|
|
$180.4
|
|
||
Earnings per share data is not disclosed given Alliant Energy Corporation is the sole shareowner of all shares of WPL’s common stock outstanding during the periods presented.
The accompanying Combined Notes to Consolidated Financial Statements are an integral part of these statements.
74
WISCONSIN POWER AND LIGHT COMPANY
CONSOLIDATED BALANCE SHEETS
|
December 31,
|
|||||||
|
2016
|
2015
|
||||||
|
(in millions, except per
share and share amounts)
|
|||||||
|
ASSETS
|
|||||||
|
Current assets:
|
|||||||
|
Cash and cash equivalents
|
|
$4.2
|
|
|
$0.4
|
|
|
|
Accounts receivable, less allowance for doubtful accounts
|
226.3
|
|
185.4
|
|
|||
|
Production fuel, at weighted average cost
|
27.8
|
|
38.6
|
|
|||
|
Gas stored underground, at weighted average cost
|
21.3
|
|
25.1
|
|
|||
|
Materials and supplies, at weighted average cost
|
36.3
|
|
33.5
|
|
|||
|
Regulatory assets
|
40.1
|
|
80.6
|
|
|||
|
Prepaid gross receipts tax
|
39.8
|
|
39.2
|
|
|||
|
Other
|
20.7
|
|
20.7
|
|
|||
|
Total current assets
|
416.5
|
|
423.5
|
|
|||
|
Property, plant and equipment, net
|
4,426.7
|
|
4,103.7
|
|
|||
|
Investments:
|
|||||||
|
Investment in American Transmission Company LLC
|
—
|
|
293.3
|
|
|||
|
Other
|
13.7
|
|
15.4
|
|
|||
|
Total investments
|
13.7
|
|
308.7
|
|
|||
|
Other assets:
|
|||||||
|
Regulatory assets
|
416.2
|
|
425.4
|
|
|||
|
Deferred charges and other
|
17.2
|
|
9.1
|
|
|||
|
Total other assets
|
433.4
|
|
434.5
|
|
|||
|
Total assets
|
|
$5,290.3
|
|
|
$5,270.4
|
|
|
|
LIABILITIES AND EQUITY
|
|||||||
|
Current liabilities:
|
|||||||
|
Commercial paper
|
|
$52.3
|
|
|
$19.9
|
|
|
|
Accounts payable
|
192.9
|
|
136.0
|
|
|||
|
Accounts payable to associated companies
|
34.6
|
|
21.6
|
|
|||
|
Regulatory liabilities
|
36.6
|
|
56.2
|
|
|||
|
Accrued interest
|
23.6
|
|
23.7
|
|
|||
|
Other
|
54.7
|
|
79.5
|
|
|||
|
Total current liabilities
|
394.7
|
|
336.9
|
|
|||
|
Long-term debt, net
|
1,535.2
|
|
1,533.9
|
|
|||
|
Other liabilities:
|
|||||||
|
Deferred tax liabilities
|
971.6
|
|
1,005.4
|
|
|||
|
Regulatory liabilities
|
213.6
|
|
192.3
|
|
|||
|
Capital lease obligations - Sheboygan Falls Energy Facility
|
77.2
|
|
83.6
|
|
|||
|
Pension and other benefit obligations
|
207.8
|
|
188.7
|
|
|||
|
Other
|
159.4
|
|
162.0
|
|
|||
|
Total other liabilities
|
1,629.6
|
|
1,632.0
|
|
|||
|
Commitments and contingencies (
Note 16
)
|
|
|
|||||
|
Equity:
|
|||||||
|
Wisconsin Power and Light Company common equity:
|
|||||||
|
Common stock - $5 par value - 18,000,000 shares authorized; 13,236,601 shares outstanding
|
66.2
|
|
66.2
|
|
|||
|
Additional paid-in capital
|
1,019.0
|
|
959.0
|
|
|||
|
Retained earnings
|
645.6
|
|
731.1
|
|
|||
|
Total Wisconsin Power and Light Company common equity
|
1,730.8
|
|
1,756.3
|
|
|||
|
Noncontrolling interest
|
—
|
|
11.3
|
|
|||
|
Total equity
|
1,730.8
|
|
1,767.6
|
|
|||
|
Total liabilities and equity
|
|
$5,290.3
|
|
|
$5,270.4
|
|
|
The accompanying Combined Notes to Consolidated Financial Statements are an integral part of these statements.
75
WISCONSIN POWER AND LIGHT COMPANY
CONSOLIDATED STATEMENTS OF CASH FLOWS
|
Year Ended December 31,
|
|||||||||||
|
2016
|
2015
|
2014
|
|||||||||
|
(in millions)
|
|||||||||||
|
Cash flows from operating activities:
|
|||||||||||
|
Net income
|
|
$192.8
|
|
|
$177.6
|
|
|
$181.1
|
|
||
|
Adjustments to reconcile net income to net cash flows from operating activities:
|
|||||||||||
|
Depreciation and amortization
|
192.5
|
|
184.3
|
|
181.2
|
|
|||||
|
Other amortizations
|
(8.7
|
)
|
5.3
|
|
47.3
|
|
|||||
|
Deferred tax expense and tax credits
|
114.5
|
|
77.6
|
|
82.6
|
|
|||||
|
Equity income from unconsolidated investments
|
(39.8
|
)
|
(35.1
|
)
|
(42.8
|
)
|
|||||
|
Distributions from equity method investments
|
28.3
|
|
30.6
|
|
36.4
|
|
|||||
|
Other
|
(6.3
|
)
|
(5.7
|
)
|
(7.2
|
)
|
|||||
|
Other changes in assets and liabilities:
|
|||||||||||
|
Accounts receivable
|
(47.6
|
)
|
3.7
|
|
2.2
|
|
|||||
|
Regulatory assets
|
51.1
|
|
(28.2
|
)
|
(166.9
|
)
|
|||||
|
Pension and other benefit obligations
|
19.1
|
|
8.3
|
|
92.0
|
|
|||||
|
Other
|
25.5
|
|
31.4
|
|
18.5
|
|
|||||
|
Net cash flows from operating activities
|
521.4
|
|
449.8
|
|
424.4
|
|
|||||
|
Cash flows used for investing activities:
|
|||||||||||
|
Utility construction and acquisition expenditures
|
(453.0
|
)
|
(344.3
|
)
|
(312.9
|
)
|
|||||
|
Other
|
(25.9
|
)
|
(13.9
|
)
|
(7.2
|
)
|
|||||
|
Net cash flows used for investing activities
|
(478.9
|
)
|
(358.2
|
)
|
(320.1
|
)
|
|||||
|
Cash flows used for financing activities:
|
|||||||||||
|
Common stock dividends
|
(135.0
|
)
|
(126.9
|
)
|
(118.7
|
)
|
|||||
|
Capital contribution from parent
|
60.0
|
|
—
|
|
—
|
|
|||||
|
Proceeds from issuance of long-term debt
|
—
|
|
—
|
|
250.0
|
|
|||||
|
Net change in commercial paper
|
32.4
|
|
19.9
|
|
(183.7
|
)
|
|||||
|
Other
|
3.9
|
|
(30.9
|
)
|
(5.7
|
)
|
|||||
|
Net cash flows used for financing activities
|
(38.7
|
)
|
(137.9
|
)
|
(58.1
|
)
|
|||||
|
Net increase (decrease) in cash and cash equivalents
|
3.8
|
|
(46.3
|
)
|
46.2
|
|
|||||
|
Cash and cash equivalents at beginning of period
|
0.4
|
|
46.7
|
|
0.5
|
|
|||||
|
Cash and cash equivalents at end of period
|
|
$4.2
|
|
|
$0.4
|
|
|
$46.7
|
|
||
|
Supplemental cash flows information:
|
|||||||||||
|
Cash (paid) refunded during the period for:
|
|||||||||||
|
Interest
|
|
($91.5
|
)
|
|
($93.1
|
)
|
|
($84.6
|
)
|
||
|
Income taxes, net
|
|
$27.8
|
|
|
($7.4
|
)
|
|
($12.2
|
)
|
||
|
Significant non-cash investing and financing activities:
|
|||||||||||
|
Accrued capital expenditures
|
|
$93.1
|
|
|
$55.2
|
|
|
$38.4
|
|
||
|
Transfer of investment in ATC and tax liability to ATI
|
|
($163.6
|
)
|
|
$—
|
|
|
$—
|
|
||
The accompanying Combined Notes to Consolidated Financial Statements are an integral part of these statements.
76
WISCONSIN POWER AND LIGHT COMPANY
CONSOLIDATED STATEMENTS OF EQUITY
|
Total WPL Common Equity
|
|||||||||||||||||||
|
Additional
|
|||||||||||||||||||
|
Common
|
Paid-In
|
Retained
|
Noncontrolling
|
Total
|
|||||||||||||||
|
Stock
|
Capital
|
Earnings
|
Interest
|
Equity
|
|||||||||||||||
|
(in millions)
|
|||||||||||||||||||
|
2014:
|
|||||||||||||||||||
|
Beginning balance
|
|
$66.2
|
|
|
$959.0
|
|
|
$622.2
|
|
|
$—
|
|
|
$1,647.4
|
|
||||
|
Net income
|
180.4
|
|
0.7
|
|
181.1
|
|
|||||||||||||
|
Common stock dividends
|
(118.7
|
)
|
(118.7
|
)
|
|||||||||||||||
|
Contributions from noncontrolling interest
|
8.6
|
|
8.6
|
|
|||||||||||||||
|
Distributions to noncontrolling interest
|
(0.8
|
)
|
(0.8
|
)
|
|||||||||||||||
|
Other
|
(2.2
|
)
|
(2.2
|
)
|
|||||||||||||||
|
Ending balance
|
66.2
|
|
959.0
|
|
681.7
|
|
8.5
|
|
1,715.4
|
|
|||||||||
|
2015:
|
|||||||||||||||||||
|
Net income
|
176.3
|
|
1.3
|
|
177.6
|
|
|||||||||||||
|
Common stock dividends
|
(126.9
|
)
|
(126.9
|
)
|
|||||||||||||||
|
Contributions from noncontrolling interest
|
3.4
|
|
3.4
|
|
|||||||||||||||
|
Distributions to noncontrolling interest
|
(1.9
|
)
|
(1.9
|
)
|
|||||||||||||||
|
Ending balance
|
66.2
|
|
959.0
|
|
731.1
|
|
11.3
|
|
1,767.6
|
|
|||||||||
|
2016:
|
|||||||||||||||||||
|
Net income
|
190.4
|
|
2.4
|
|
192.8
|
|
|||||||||||||
|
Common stock dividends
|
(135.0
|
)
|
(135.0
|
)
|
|||||||||||||||
|
Capital contribution from parent
|
60.0
|
|
60.0
|
|
|||||||||||||||
|
Contributions from noncontrolling interest
|
11.5
|
|
11.5
|
|
|||||||||||||||
|
Distributions to noncontrolling interest
|
(2.5
|
)
|
(2.5
|
)
|
|||||||||||||||
|
Transfer of investment in ATC to ATI
|
(140.9
|
)
|
(22.7
|
)
|
(163.6
|
)
|
|||||||||||||
|
Ending balance
|
|
$66.2
|
|
|
$1,019.0
|
|
|
$645.6
|
|
|
$—
|
|
|
$1,730.8
|
|
||||
The accompanying Combined Notes to Consolidated Financial Statements are an integral part of these statements.
77
ALLIANT ENERGY CORPORATION
INTERSTATE POWER AND LIGHT COMPANY
WISCONSIN POWER AND LIGHT COMPANY
COMBINED NOTES TO CONSOLIDATED FINANCIAL STATEMENTS
Description of Business
- Alliant Energy’s financial statements include the accounts of Alliant Energy and its consolidated subsidiaries. Alliant Energy is an investor-owned public utility holding company, whose primary wholly-owned subsidiaries are IPL, WPL, AEF and Corporate Services.
IPL’s financial statements include the accounts of IPL and its consolidated subsidiary, IPL SPE LLC, which is used for IPL’s sales of accounts receivable program. IPL is a direct subsidiary of Alliant Energy and is a public utility engaged principally in the generation and distribution of electricity and the distribution and transportation of natural gas to retail customers in select markets in Iowa. IPL also sells electricity to wholesale customers in Minnesota, Illinois and Iowa, and is engaged in the generation and distribution of steam for
two
customers in Cedar Rapids, Iowa.
WPL’s financial statements include the accounts of WPL and its consolidated subsidiary, WPL Transco, which held Alliant Energy’s investment in ATC until December 31, 2016. Refer to
Note 6(a)
for discussion of WPL’s transfer of its investment in ATC to ATI on December 31, 2016. WPL is a direct subsidiary of Alliant Energy and is a public utility engaged principally in the generation and distribution of electricity and the distribution and transportation of natural gas to retail customers in select markets in Wisconsin. WPL also sells electricity to wholesale customers in Wisconsin.
AEF is comprised of Transportation, Non-regulated Generation, ATI and other non-regulated investments. Transportation includes a short-line railway that provides freight service between Cedar Rapids, Iowa and Iowa City, Iowa; barge terminal and hauling services on the Mississippi River; and other transfer and storage services. Non-regulated Generation owns Sheboygan Falls, a
347
MW, simple-cycle, natural gas-fired EGU near Sheboygan Falls, Wisconsin, which is leased to WPL for an initial period of
20
years ending in 2025. In addition, Non-regulated Generation currently owns the non-regulated
99
MW Franklin County wind farm located in Franklin County, Iowa. In February 2017, FERC issued an order approving the transfer of the Franklin County wind farm from AEF to IPL. Alliant Energy and IPL currently expect to complete this transfer in 2017. ATI, a wholly-owned subsidiary of AEF, held a partial interest in WPL Transco until December 31, 2016. As of December 31, 2016, ATI holds all of Alliant Energy’s investment in ATC. Refer to
Note 6(a)
for further discussion of the transfer of WPL’s ATC investment to ATI.
Corporate Services is the subsidiary formed to provide administrative services to Alliant Energy and its subsidiaries.
Basis of Presentation
- The financial statements reflect investments in controlled subsidiaries on a consolidated basis and Alliant Energy’s, IPL’s and WPL’s proportionate shares of jointly-owned utility EGUs. Unconsolidated investments, which Alliant Energy and WPL do not control, but have the ability to exercise significant influence over operating and financial policies, are accounted for under the equity method of accounting. Under the equity method of accounting, Alliant Energy and WPL initially record the investment at cost, and adjust the carrying amount of the investment to recognize their respective share of the earnings or losses of the investee. Dividends received from an investee reduce the carrying amount of the equity investment. Investments that do not meet the criteria for consolidation or the equity method of accounting are accounted for under the cost method. Refer to Notes
1(m)
and
6(a)
for further discussion of VIEs and equity method investments, respectively.
All intercompany balances and transactions, other than certain transactions affecting the rate-making process at IPL and WPL, have been eliminated from the financial statements. Such transactions not eliminated include costs that are recoverable from customers through rate-making processes. The financial statements are prepared in conformity with GAAP, which give recognition to the rate-making and accounting practices of FERC and state commissions having regulatory jurisdiction. Certain prior period amounts in the Financial Statements and Notes have been reclassified to conform to the current period presentation for comparative purposes. Unless otherwise noted, the notes herein exclude discontinued operations for all periods presented. As discussed in
Note 7
, all Alliant Energy share and per share amounts have been adjusted to reflect a
two
-for-one common stock split distributed in May 2016. As required by GAAP, all prior period financial statements and disclosures presented herein have been restated to reflect the common stock split.
78
Use of Estimates
- The preparation of the financial statements requires management to make estimates and assumptions that affect: (a) the reported amounts of assets and liabilities and the disclosure of contingent assets and liabilities at the date of the financial statements; and (b) the reported amounts of revenues and expenses during the reporting period. Actual results could differ from those estimates.
Investment tax credits are deferred and amortized to income over the average lives of the related property. Other tax credits reduce income tax expense in the year claimed.
Alliant Energy files a consolidated federal income tax return and a combined return in Wisconsin, which include Alliant Energy and its subsidiaries. Alliant Energy subsidiaries with a presence in Iowa file as part of a consolidated return in Iowa.
Alliant Energy allocates consolidated income tax expense to its subsidiaries that are members of the group that file a consolidated or combined income tax return. IPL and WPL use the modified separate return approach for calculating their income tax provisions and related deferred tax assets and liabilities. IPL and WPL are assumed to file separate tax returns with the federal and state taxing authorities, except that net operating losses (and other current or deferred tax attributes) are characterized as realized (or realizable) by IPL and WPL when those tax attributes are realized (or realizable) by the consolidated tax return group of Alliant Energy (even if IPL and WPL would not otherwise have realized the attributes on a stand-alone basis). The difference in the income taxes recorded for IPL and WPL under the modified separate return method compared to the income taxes recorded on a separate return basis was not material in
2016
,
2015
and
2014
.
Utility Plant
-
General -
Utility plant is recorded at the original cost of acquisition or construction, which includes material, labor, contractor services, AFUDC and allocable overheads, such as supervision, engineering, benefits, certain taxes and transportation. Repairs, replacements and renewals of items of property determined to be less than a unit of property or that do not increase the property’s life or functionality are charged to maintenance expense. Generally, ordinary retirements of utility plant and salvage value are netted and charged to accumulated depreciation upon removal from utility plant accounts and no gain or loss is recognized consistent with rate-making policies. However, if regulators have approved recovery of the remaining net book value of property, plant and equipment that is retired early, the remaining net book value is reclassified from property, plant and equipment to regulatory assets upon retirement. Property, plant and equipment that is probable of being retired early is classified as plant anticipated to be retired early.
Depreciation -
IPL and WPL use a combination of remaining life and straight-line depreciation methods as approved by their respective regulatory commissions. The composite or group method of depreciation is used, in which a single depreciation
79
rate is applied to the gross investment in a particular class of property. This method pools similar assets and then depreciates each group as a whole. Periodic depreciation studies are performed to determine the appropriate group lives, net salvage, estimated cost of removal and group depreciation rates. These depreciation studies are subject to review and approval by IPL’s and WPL’s respective regulatory commissions. Depreciation expense is included within the recoverable cost of service component of rates charged to customers. The average rates of depreciation for electric, gas and other properties, consistent with current rate-making practices, were as follows:
|
IPL
|
WPL
|
||||||||||
|
2016
|
2015
|
2014
|
2016
|
2015
|
2014
|
||||||
|
Electric - generation
|
3.5%
|
3.6%
|
3.6%
|
3.1%
|
3.2%
|
3.2%
|
|||||
|
Electric - distribution
|
2.4%
|
2.4%
|
2.5%
|
2.6%
|
2.7%
|
2.7%
|
|||||
|
Electric - other
|
4.2%
|
4.0%
|
4.0%
|
4.7%
|
4.5%
|
5.9%
|
|||||
|
Gas
|
3.3%
|
3.2%
|
3.3%
|
2.5%
|
2.5%
|
2.5%
|
|||||
|
Other
|
3.9%
|
3.9%
|
4.3%
|
5.9%
|
6.0%
|
6.0%
|
|||||
In September 2016, the PSCW issued an order approving the implementation of updated depreciation rates for WPL effective January 1, 2017 as a result of a recently completed depreciation study. WPL estimates the new average rates of depreciation for its electric generation, electric distribution and gas properties will be approximately
3.2%
,
2.6%
and
2.3%
, respectively, during 2017.
AFUDC -
AFUDC represents costs to finance construction additions, including a return on equity component and cost of debt component as required by regulatory accounting. AFUDC for IPL’s construction projects is calculated in accordance with FERC guidelines. AFUDC for WPL’s retail and wholesale jurisdiction construction projects is calculated in accordance with PSCW and FERC guidelines, respectively. The AFUDC rates, computed in accordance with the prescribed regulatory formula, were as follows:
|
2016
|
2015
|
2014
|
|||
|
IPL (Marshalltown CWIP) (a)
|
7.9%
|
7.9%
|
8.0%
|
||
|
IPL (other CWIP)
|
7.7%
|
7.7%
|
7.8%
|
||
|
WPL (retail jurisdiction)
|
8.2%
|
8.2%
|
8.2%
|
||
|
WPL (wholesale jurisdiction)
|
6.7%
|
7.9%
|
4.1%
|
||
|
(a)
|
In 2013, the IUB issued an order establishing rate-making principles for Marshalltown that requires a
10.3%
return on common equity for the calculation of AFUDC related to the construction of such facility.
|
In accordance with their most recent rate orders, IPL applies its AFUDC rates to
100%
of applicable CWIP balances and WPL generally applies its AFUDC rates to
50%
of applicable CWIP balances. WPL may apply its AFUDC rates to
100%
of the retail portion of the CWIP balances for construction projects requiring a CA or CPCN that were approved by the PSCW after its most recent rate order, including the Riverside expansion.
Non-utility Property
-
General -
Non-utility property is recorded at the original cost of acquisition or construction, which includes material, labor and contractor services. Repairs, replacements and renewals of items of property determined to be less than a unit of property or that do not increase the property’s life or functionality are charged to maintenance expense. Upon retirement or sale of non-utility property, the original cost and related accumulated depreciation are removed from the accounts and any gain or loss is included in the income statements.
Costs related to software developed or obtained for internal use are capitalized and amortized on a straight-line basis over the estimated useful life of the related software. If software is retired prior to being fully amortized, the difference is recorded as a loss in the income statements.
Utility
-
Revenues from Alliant Energy’s utility business are primarily from electricity and natural gas sales and are recognized on an accrual basis as services are rendered or commodities are delivered to customers. Energy sales to individual customers are based on the reading of customers’ meters, which occurs on a systematic basis throughout each reporting period. Amounts of energy delivered to customers since the date of the last meter reading are estimated at the end of each reporting period and the corresponding estimated unbilled revenue is recorded in such reporting period. The unbilled revenue estimate is based on daily system demand volumes, estimated customer usage by class, temperature impacts, line losses and the most recent customer rates.
80
IPL and WPL accrue revenues from their wholesale customers to the extent that the actual net revenue requirements calculated in accordance with FERC-approved formula rates for the reporting period are higher or lower than the amounts billed to wholesale customers during such period. Regulatory assets or regulatory liabilities are recorded as the offset for these accrued revenues under formulaic rate-making programs. IPL’s estimated recovery amount is recorded in the current period of service and is reflected in customer bills within
two
years under the provisions of approved formula rates. WPL’s estimated recovery amount is recorded in the current period of service and subject to final adjustments after a customer audit period in the subsequent year. Final settled recovery amounts are reflected in WPL’s customer bills within
two
years under the provisions of approved formula rates.
IPL and WPL participate in bid/offer-based wholesale energy and ancillary services markets operated by MISO. MISO requires that all load serving entities and generation owners, including IPL and WPL, submit hourly day-ahead and/or real-time bids and offers for energy and ancillary services. The MISO day-ahead and real-time transactions are grouped together, resulting in a net supply to or net purchase from MISO for each hour of each day. The net supply to MISO is recorded in “Electric utility operating revenues” and the net purchase from MISO is recorded in “Electric production fuel and purchased power” in the income statements.
Non-regulated
-
Revenues from Alliant Energy’s non-regulated businesses are primarily from its Transportation business and are recognized on an accrual basis as services are rendered or goods are delivered to customers.
Taxes Collected from Customers
-
Sales or various other taxes collected by certain of Alliant Energy’s subsidiaries on behalf of other agencies are recorded on a net basis and are not included in operating revenues.
Revenue Recognition
- Refer to
Note 1(o)
for discussion of a new accounting standard issued by the Financial Accounting Standards Board in 2014, which provides principles for recognizing revenue.
Electric Production Fuel and Purchased Power (Fuel-related Costs)
-
Fuel-related costs are incurred to generate and purchase electricity to meet the demand of IPL’s and WPL’s electric customers. These fuel-related costs include the cost of fossil fuels (primarily natural gas and coal) used to produce electricity at their EGUs, electricity purchased from MISO wholesale energy markets and under PPAs, costs for allowances acquired to allow certain emissions (primarily SO2 and NOx) from their EGUs and costs for chemicals utilized to control emissions from their EGUs. These fuel-related costs are recorded in “Electric production fuel and purchased power” in the income statements.
IPL Retail -
The cost recovery mechanisms for IPL’s retail electric customers provide for monthly adjustments to their electric rates for changes in fuel-related costs. Fuel adjustment clause rules applicable to IPL’s retail jurisdiction also allow recovery of prudently incurred costs for emission allowances required to comply with EPA regulations through the fuel adjustment clause. Changes in the under-/over-collection of these costs are recognized in “Electric production fuel and purchased power” in Alliant Energy’s and IPL’s income statements. The cumulative effects of the under-/over-collection of these costs are recorded in regulatory assets or regulatory liabilities on Alliant Energy’s and IPL’s balance sheets until they are reflected in future billings to customers.
WPL Retail -
The cost recovery mechanism for WPL’s retail electric customers is based on forecasts of certain fuel-related costs expected to be incurred during forward-looking test year periods and fuel monitoring ranges determined by the PSCW during each retail electric rate proceeding or in a separate fuel cost plan approval proceeding. If WPL’s actual fuel-related costs fall outside these fuel monitoring ranges, WPL is authorized to defer the incremental under-/over-collection of fuel-related costs that are outside the approved ranges. Deferral of under-collections are reduced to the extent actual return on common equity earned by WPL during the fuel cost plan year exceeds the most recently authorized return on common equity. Deferred amounts for fuel-related costs outside the approved fuel monitoring ranges are recognized in “Electric production fuel and purchased power” in Alliant Energy’s and WPL’s income statements. The cumulative effects of these deferred amounts are recorded in regulatory assets or regulatory liabilities on Alliant Energy’s and WPL’s balance sheets until they are reflected in future billings to customers.
IPL and WPL Wholesale -
The cost recovery mechanisms for IPL’s and WPL’s wholesale electric customers provide for subsequent adjustments to their electric rates for changes in fuel-related costs. Changes in the under-/over-collection of these costs are recognized in “Electric production fuel and purchased power” in the income statements. The cumulative effects of the under-/over-collection of these costs are recorded in regulatory assets or regulatory liabilities on the balance sheets until they are reflected in future billings to customers. IPL’s and WPL’s costs for emission allowances are excluded from the fuel-
81
related cost recovery mechanisms and are recovered from their wholesale electric customers through annual changes in base rates determined by a formula rate structure.
Purchased Electric Capacity
-
PPAs help meet the electricity demand of IPL’s and WPL’s customers. Certain of these PPAs include minimum payments for IPL’s and WPL’s rights to electric generating capacity, which are charged each period to “Electric production fuel and purchased power” in the income statements. Purchased electric capacity expenses are recovered from IPL’s and WPL’s retail electric customers through changes in base rates determined during periodic rate proceedings. Purchased electric capacity expenses are recovered from IPL’s and WPL’s wholesale electric customers through annual changes in base rates determined by a formula rate structure.
Electric Transmission Service
-
Costs incurred for the transmission of electricity to meet the demands of IPL’s and WPL’s customers are charged to “Electric transmission service” in the income statements.
IPL Retail -
Electric transmission service expense is recovered from IPL’s retail electric customers through a transmission cost rider. This cost recovery mechanism provides for annual adjustments to electric rates charged to retail electric customers for changes in electric transmission service expense. Changes in the under-/over-collection of these costs are recognized in “Electric transmission service” in Alliant Energy’s and IPL’s income statements. The cumulative effects of the under-/over-collection of these costs are recorded in regulatory assets or regulatory liabilities on Alliant Energy’s and IPL’s balance sheets until they are reflected in future billings to customers. The transmission cost rider will remain in effect until the IUB’s final decision in IPL’s next retail electric base rate case, at which time the rider will continue in its current form, continue in a modified form or be terminated.
WPL Retail -
Electric transmission service expense is recovered from WPL’s retail electric customers through changes in base rates determined during periodic rate proceedings.
Pursuant to the escrow accounting treatment WPL received as part of its approved retail electric rate case (2015/2016 Test Period) in 2014 from the PSCW, the difference between actual electric transmission service expense incurred and the amount of electric transmission service costs collected from customers as electric revenues in 2015 and 2016 is recognized in “Electric transmission service” in Alliant Energy’s and WPL’s income statements. An offsetting amount is recorded in regulatory assets or regulatory liabilities on Alliant Energy’s and WPL’s balance sheets until reflected in future billings to customers. The PSCW’s December 2016 order for WPL’s retail electric rate case (2017/2018 Test Period) extends this escrow accounting treatment through 2018.
IPL and WPL Wholesale -
IPL and WPL arrange transmission service for the majority of their respective wholesale electric customers. Electric transmission service expense is allocated to and recovered from these customers based on a load ratio share computation.
Cost of Gas Sold
-
Costs are incurred for the purchase, transportation and storage of natural gas to serve IPL’s and WPL’s gas customers and the costs associated with the natural gas delivered to customers are charged to “Cost of gas sold” in the income statements. The tariffs for IPL’s and WPL’s retail gas customers provide for subsequent adjustments to their rates each month for changes in the cost of gas sold. Changes in the under-/over-collection of these costs are also recognized in “Cost of gas sold” in the income statements. The cumulative effects of the under-/over-collection of these costs are recorded in regulatory assets or regulatory liabilities on the balance sheets until they are reflected in future billings to customers.
Energy Efficiency Costs
-
Costs are incurred to fund energy efficiency programs and initiatives that help customers reduce their energy usage. The costs incurred for these programs and initiatives are charged to “Other operation and maintenance” in the income statements. Energy efficiency costs incurred by IPL are recovered from its retail electric and gas customers through an additional tariff called an energy efficiency cost recovery factor, which is revised annually and includes a reconciliation to eliminate any under-/over-collection of energy efficiency costs from prior periods. Energy efficiency costs incurred by WPL are recovered from retail electric and gas customers through changes in base rates determined during periodic rate proceedings. Reconciliations of any under-/over-collection of energy efficiency costs from prior periods are also addressed in WPL’s periodic rate proceedings. Changes in the under-/over-collection of energy efficiency costs for IPL and WPL are recognized in “Other operation and maintenance” in the income statements. The cumulative effects of the under-/over-collection of these costs for IPL and WPL are recorded in regulatory assets or regulatory liabilities on the balance sheets until they are reflected in future billings to customers.
Refer to
Note 2
for additional information regarding these utility cost recovery mechanisms.
82
Property, Plant and Equipment of Regulated Operations
-
Property, plant and equipment of regulated operations are reviewed for possible impairment whenever events or changes in circumstances indicate all or a portion of the carrying value of the assets may be disallowed for rate-making purposes. If IPL or WPL are disallowed recovery of any portion of the carrying value of their regulated property, plant and equipment that is under construction, has been recently completed or is probable of abandonment, or conclude it is probable recovery will be disallowed, an impairment charge is recognized equal to the amount of the carrying value that was disallowed or is probable of being disallowed. If IPL or WPL are only allowed a partial return on the carrying value of their regulated property, plant and equipment that is under construction, has been recently completed or is probable of abandonment, or conclude it is probable a full return will not be allowed, an impairment charge is recognized equal to the difference between the carrying value and the present value of the future revenues expected from their regulated property, plant and equipment.
Property, Plant and Equipment of Non-regulated Operations
-
Property, plant and equipment of non-regulated operations are reviewed for possible impairment whenever events or changes in circumstances indicate the carrying value of the assets may not be recoverable. Impairment is indicated if the carrying value of an asset exceeds its undiscounted future cash flows. If an impairment is indicated, a charge is recognized equal to the amount the carrying value exceeds the asset’s fair value. Refer to
Note 3
for discussion of Alliant Energy’s impairment analysis of the Franklin County wind farm assets in 2016 and resulting asset valuation charges recorded by Alliant Energy in 2016.
Unconsolidated Equity Investments
-
If events or circumstances indicate the carrying value of investments accounted for under the equity method of accounting exceeds fair value and the decline in value is other than temporary, potential impairment is assessed. If an impairment is indicated, a charge is recognized equal to the amount the carrying value exceeds the investment’s fair value. Refer to
Note 6(a)
for additional discussion of investments accounted for under the equity method of accounting.
83
Revenue Recognition
-
In May 2014, the Financial Accounting Standards Board issued an accounting standard providing principles for recognizing revenue for the transfer of promised goods or services to customers with the consideration to which the entity expects to be entitled in exchange for those goods or services. This standard also requires disclosures about the nature, amount, timing and uncertainty of revenue and cash flows arising from contracts with customers. Alliant Energy, IPL and WPL currently expect to adopt this standard on January 1, 2018. Upon adoption, the standard can be applied retrospectively to all prior reporting periods presented, or retrospectively with a cumulative effect
to the opening retained earnings balance on January 1, 2018
. Alliant Energy, IPL and WPL are currently evaluating the impact of this standard on their financial condition and results of operations and do not anticipate a significant change in revenue recognition for retail electric and gas sales, which represent the majority of Alliant Energy’s, IPL’s and WPL’s revenues. Alliant Energy, IPL and WPL continue to evaluate additional impacts of this standard, as well as which transition method will be utilized.
Leases
-
In February 2016, the Financial Accounting Standards Board issued an accounting standard requiring lease assets and lease liabilities, including operating leases, to be recognized on the balance sheet for all leases with terms longer than 12 months. The standard also requires disclosure of key information about leasing arrangements. Alliant Energy, IPL and WPL currently expect to adopt this standard on January 1, 2019 and are evaluating the impact of this standard on their financial condition and results of operations and expect an increase in assets and liabilities from recognizing operating leases on their balance sheets.
Share-based Compensation Award Payments
-
In March 2016, the Financial Accounting Standards Board issued an accounting standard intended to simplify certain aspects of the accounting for share-based compensation award payments and the associated income taxes. This standard changes the accounting for excess tax benefits, whereby such benefits are recognized in the income statement instead of additional paid-in capital on the balance sheet. Alliant Energy adopted this standard on January 1, 2016, which resulted in a cumulative effect of a decrease to its deferred tax liabilities and an increase to its January 1, 2016 retained earnings balance of
$3.1 million
, which is included in “Other” in
Alliant Energy’s common equity statement
in 2016.
84
Regulatory Assets
-
At December 31, regulatory assets were comprised of the following items (in millions):
|
Alliant Energy
|
IPL
|
WPL
|
|||||||||||||||||||||
|
2016
|
2015
|
2016
|
2015
|
2016
|
2015
|
||||||||||||||||||
|
Tax-related
|
|
$1,055.6
|
|
|
$987.7
|
|
|
$1,022.4
|
|
|
$958.2
|
|
|
$33.2
|
|
|
$29.5
|
|
|||||
|
Pension and OPEB costs
|
578.7
|
|
579.5
|
|
294.0
|
|
298.1
|
|
284.7
|
|
281.4
|
|
|||||||||||
|
AROs
|
105.9
|
|
92.4
|
|
64.3
|
|
50.8
|
|
41.6
|
|
41.6
|
|
|||||||||||
|
WPL’s EGUs retired early
|
41.4
|
|
45.0
|
|
—
|
|
—
|
|
41.4
|
|
45.0
|
|
|||||||||||
|
Derivatives
|
30.7
|
|
70.6
|
|
10.0
|
|
28.2
|
|
20.7
|
|
42.4
|
|
|||||||||||
|
Emission allowances
|
26.2
|
|
26.9
|
|
26.2
|
|
26.9
|
|
—
|
|
—
|
|
|||||||||||
|
Commodity cost recovery
|
6.0
|
|
35.9
|
|
0.3
|
|
2.8
|
|
5.7
|
|
33.1
|
|
|||||||||||
|
Other
|
70.6
|
|
70.6
|
|
41.6
|
|
37.6
|
|
29.0
|
|
33.0
|
|
|||||||||||
|
|
$1,915.1
|
|
|
$1,908.6
|
|
|
$1,458.8
|
|
|
$1,402.6
|
|
|
$456.3
|
|
|
$506.0
|
|
||||||
A portion of the regulatory assets in the above table are not earning a return. These regulatory assets, but not the respective carrying costs of these regulatory assets, are expected to be recovered from customers in future rates. At
December 31, 2016
, IPL and WPL had
$44 million
and
$9 million
, respectively, of regulatory assets representing past expenditures that were not earning a return. IPL’s regulatory assets that were not earning a return consisted primarily of emission allowances, debt redemption costs, and costs for clean air compliance and wind generation expansion projects. WPL’s regulatory assets that were not earning a return consisted primarily of amounts related to the wholesale portion of under-collected fuel-related costs, which is discussed in
Note 1(g)
, and environmental-related costs. The other regulatory assets reported in the above table either earn a return or the cash has not yet been expended, in which case the assets are offset by liabilities that also do not incur a carrying cost.
Tax-related
-
IPL and WPL record regulatory assets for certain temporary differences (primarily related to utility property, plant and equipment at IPL) that result in a decrease in current rates charged to customers and an increase in future rates charged to customers based on the timing of income tax expense that is used to determine such rates. These temporary differences for IPL include the impacts of qualifying deductions for repairs expenditures, allocation of mixed service costs, and Iowa accelerated tax depreciation, which all contribute to lower current income tax expense during the first part of an asset’s useful life and higher current tax expense during the last part of an asset’s useful life. These regulatory assets will be recovered from customers in the future when these temporary differences reverse resulting in additional current income tax expense used to determine customers’ rates.
During
2016
, Alliant Energy’s and IPL’s tax-related regulatory assets increased primarily due to property-related differences for qualifying repair expenditures.
Pension and other postretirement benefits costs -
The IUB and the PSCW have authorized IPL and WPL to record the retail portion of their respective previously unrecognized net actuarial gains and losses, and prior service costs and credits, as regulatory assets in lieu of AOCL on the balance sheets, as these amounts are expected to be recovered in future rates. IPL and WPL also recognize the wholesale portion of their previously unrecognized net actuarial gains and losses, and prior service costs and credits, as regulatory assets on the balance sheets because these amounts are expected to be recovered in rates in future periods under the formula rate structure. These regulatory assets will be increased or decreased as the net actuarial gains or losses, and prior service costs or credits, are subsequently amortized and recognized as a component of net periodic benefit costs. Regulatory assets are also increased or decreased as a result of the annual defined benefit plan measurement process.
Pension and OPEB costs are included within the recoverable cost of service component of rates charged to IPL’s and WPL’s customers. The recoverable costs included in customers’ rates are based upon pension and OPEB costs determined in accordance with GAAP and are calculated using different methods for IPL’s and WPL’s respective regulatory jurisdictions. The IUB authorized IPL in its 2009 Test Year Iowa retail electric rate case order to recover from its retail electric customers in Iowa an allocated portion of annual costs equal to a
two
-year simple average of actual costs incurred during its 2009 Test Year and an estimate of costs for its forward-looking post-Test Year (2010). The PSCW has authorized WPL to recover from its retail electric and gas customers an estimated allocated portion of annual costs equal to the costs expected to be incurred during each test period. IPL and WPL are authorized to recover from their wholesale customers an allocated portion of actual pension costs incurred each year through FERC-approved formula rates. Refer to
Note 12(a)
for additional details regarding pension and OPEB costs.
AROs -
Alliant Energy, IPL and WPL believe it is probable that any differences between expenses accrued for legal AROs related to their regulated operations and expenses recovered currently in rates will be recoverable in future rates, and are deferring the differences as regulatory assets. Refer to
Note 13
for additional details of AROs.
85
WPL’s electric generating units retired early -
In December 2015, WPL retired Nelson Dewey Units 1 and 2 and Edgewater Unit 3. WPL received approval from the PSCW and FERC to reclassify the remaining net book value of these EGUs from property, plant and equipment to a regulatory asset on Alliant Energy’s and WPL’s balance sheets. The remaining net book value is included in WPL’s rate base and WPL is earning a return on the outstanding balance. WPL is currently recovering the remaining net book value of these EGUs from both its retail and wholesale customers over a
10
-year period beginning January 1, 2013 pursuant to PSCW and FERC orders.
Derivatives -
In accordance with IPL’s and WPL’s fuel and natural gas recovery mechanisms, prudently incurred costs from derivative instruments are recoverable from customers in the future after any losses are realized, and gains from derivative instruments are refundable to customers in the future after any gains are realized. Based on these recovery mechanisms, the changes in the fair value of derivative liabilities/assets resulted in comparable changes to regulatory assets/liabilities on the balance sheets. Refer to
Note 15
for additional details of derivative assets and derivative liabilities.
Emission allowances -
IPL entered into forward contracts in 2007 to purchase SO2 emission allowances with vintage years of 2014 through 2017 from various counterparties to meet future CAIR emission reduction standards. Any SO2 emission allowances acquired under these forward contracts could be used to meet requirements under the existing Acid Rain program regulations or the more stringent CAIR emission reduction standards but are not eligible to be used for compliance requirements under CSAPR. In 2011, the EPA issued CSAPR to replace CAIR with an anticipated effective date in 2012. As a result of the issuance of CSAPR, Alliant Energy and IPL concluded in 2011 that the allowances to be acquired under these forward contracts would not be needed by IPL to comply with expected environmental regulations in the future. Alliant Energy and IPL have recorded a regulatory asset for amounts paid under the forward contracts, as well as for the remaining obligation under the forward contracts as a result of concluding the amount is probable of recovery from IPL’s customers.
Commodity cost recovery -
Refer to
Note 1(g)
for additional details of IPL’s and WPL’s cost recovery mechanisms.
Other -
Alliant Energy, IPL and WPL assess whether IPL’s and WPL’s regulatory assets are probable of future recovery by considering factors such as applicable regulations, recent orders by the applicable regulatory agencies, historical treatment of similar costs by the applicable regulatory agencies and regulatory environment changes. Based on these assessments, Alliant Energy, IPL and WPL believe the regulatory assets recognized as of
December 31, 2016
in the above table are probable of future recovery. However, no assurance can be made that IPL and WPL will recover all of these regulatory assets in future rates. If future recovery of a regulatory asset ceases to be probable, the regulatory asset will be charged to expense in the period the likelihood of future recovery is less than probable.
Regulatory Liabilities
-
At December 31, regulatory liabilities were comprised of the following items (in millions):
|
Alliant Energy
|
IPL
|
WPL
|
|||||||||||||||||||||
|
2016
|
2015
|
2016
|
2015
|
2016
|
2015
|
||||||||||||||||||
|
Cost of removal obligations
|
|
$411.6
|
|
|
$406.0
|
|
|
$269.4
|
|
|
$260.4
|
|
|
$142.2
|
|
|
$145.6
|
|
|||||
|
IPL’s tax benefit riders
|
83.5
|
|
159.2
|
|
83.5
|
|
159.2
|
|
—
|
|
—
|
|
|||||||||||
|
Electric transmission cost recovery
|
72.0
|
|
43.5
|
|
35.7
|
|
21.9
|
|
36.3
|
|
21.6
|
|
|||||||||||
|
Derivatives
|
31.5
|
|
8.5
|
|
12.1
|
|
6.7
|
|
19.4
|
|
1.8
|
|
|||||||||||
|
Commodity cost recovery
|
30.8
|
|
37.6
|
|
17.8
|
|
23.5
|
|
13.0
|
|
14.1
|
|
|||||||||||
|
Energy efficiency cost recovery
|
20.5
|
|
48.3
|
|
—
|
|
—
|
|
20.5
|
|
48.3
|
|
|||||||||||
|
Other
|
31.1
|
|
34.6
|
|
12.3
|
|
17.5
|
|
18.8
|
|
17.1
|
|
|||||||||||
|
|
$681.0
|
|
|
$737.7
|
|
|
$430.8
|
|
|
$489.2
|
|
|
$250.2
|
|
|
$248.5
|
|
||||||
Regulatory liabilities related to cost of removal obligations, to the extent expensed through depreciation rates, reduce rate base. A significant portion of the remaining regulatory liabilities are not used to reduce rate base in the revenue requirement calculations utilized in IPL’s and WPL’s respective rate proceedings.
Cost of removal obligations -
Alliant Energy, IPL and WPL collect in rates future removal costs for many assets that do not have associated legal AROs. Alliant Energy, IPL and WPL record a regulatory liability for the estimated amounts they have collected in rates for these future removal costs and reduce the regulatory liability for amounts spent on removal activities.
86
IPL’s tax benefit riders -
The IUB has approved electric and gas tax benefit riders proposed by IPL, which utilize regulatory liabilities to credit bills of IPL’s Iowa retail electric and gas customers to help offset the impact of rate increases on such customers. Alliant Energy and IPL recognize an offsetting reduction to income tax expense for the after-tax amounts credited to such customers, resulting in no impact to their net income from the electric and gas tax benefit riders. The tax benefit riders regulatory liabilities are related to tax benefits from tax accounting method changes for repairs expenditures, allocation of mixed service costs, allocation of insurance proceeds from floods in 2008, and cost of removal expenditures. In
2016
, Alliant Energy’s and IPL’s “IPL’s tax benefit riders” regulatory liabilities decreased by
$76 million
as follows (in millions):
|
Electric tax benefit rider credits
|
|
$64
|
|
|
Gas tax benefit rider credits
|
12
|
|
|
|
|
$76
|
|
|
In December 2016, the IUB authorized
$68 million
and
$7 million
of regulatory liabilities from tax benefits to be credited to IPL’s retail electric and gas customers’ bills in 2017 through the electric and gas tax benefit riders, respectively. Any remaining tax benefit rider regulatory liabilities are currently expected to be credited to IPL’s retail electric and gas customers’ bills in the future, subject to final review by the IUB.
Electric tax benefit rider
- Details for IPL’s electric tax benefit rider are as follows (in millions):
|
2016
|
2015
|
2014
|
|||||||||
|
Credit to IPL’s Iowa retail electric customers’ bills with reduction to electric revenues (based on customers’ KWh usage)
|
|
$64
|
|
|
$72
|
|
|
$85
|
|
||
|
Income tax benefit resulting from decreased taxable income caused by credits
|
27
|
|
30
|
|
35
|
|
|||||
|
Income tax benefit representing tax benefits realized from electric tax benefit rider
|
37
|
|
42
|
|
50
|
|
|||||
The IUB authorized IPL to reduce the electric tax benefit rider billing credits on customers’ bills for 2013 through 2016 to recognize the revenue requirement impact of the changes in tax accounting methods related to tangible property and mixed service costs. The revenue requirement adjustment resulted in increases to electric revenues in Alliant Energy’s and IPL’s income statements and was recognized through the energy adjustment clause as a reduction of the credits on IPL’s Iowa retail electric customers’ bills from the electric tax benefit rider as follows (in millions):
|
2016
|
2015
|
2014
|
|||||||||
|
Revenue requirement adjustment
|
|
$14
|
|
|
$14
|
|
|
$15
|
|
||
Gas tax benefit rider
- Details for IPL’s gas tax benefit rider are as follows (in millions):
|
2016
|
2015
|
2014
|
|||||||||
|
Credit to IPL’s Iowa retail gas customers’ bills with reduction to gas revenues (based on a fixed amount per day)
|
|
$12
|
|
|
$12
|
|
|
$12
|
|
||
|
Income tax benefit resulting from decreased taxable income caused by credits
|
5
|
|
5
|
|
5
|
|
|||||
|
Income tax benefit representing tax benefits realized from gas tax benefit rider
|
7
|
|
7
|
|
7
|
|
|||||
Electric transmission cost recovery -
Refer to
Note 1(g)
for additional details of IPL’s and WPL’s electric transmission service cost recovery mechanisms.
Commodity cost recovery -
Refer to
Note 1(g)
for additional details of IPL’s and WPL’s commodity cost recovery mechanisms.
Energy efficiency cost recovery -
WPL and IPL collect revenues from their customers to offset certain expenditures they each incur for energy efficiency programs, including state mandated programs and Shared Savings programs. Differences between forecasted costs used to set rates and actual costs for these programs are deferred as a regulatory asset or regulatory liability. The PSCW’s order for WPL’s 2015/2016 Test Period electric and gas base rate case authorized energy efficiency cost recovery amortizations for 2016, which contributed to the decrease in Alliant Energy’s and WPL’s “Energy efficiency cost recovery” regulatory liabilities.
Utility Rate Cases
-
WPL’s Wisconsin Retail Electric and Gas Rate Case (2017/2018 Test Period) -
In December 2016, WPL received an order from the PSCW authorizing WPL to implement increases in annual retail electric and gas base rates of
$9 million
and
$9 million
, respectively, effective January 1, 2017 followed by a freeze of such rates through the end of 2018. The key drivers for the electric and gas base rate increases are recovery of the costs for environmental controls projects at Edgewater
87
and Columbia, and investments in electric and gas distribution systems, including expansion of natural gas pipeline infrastructure. The filing also included utilization of amounts that WPL previously over-recovered from its customers for energy efficiency cost recovery and electric transmission cost recovery, as well as amounts deferred under the return on common equity sharing mechanism for the 2013/2014 Test Period to reduce the requested base rate increases. The order included provisions that require WPL to defer a portion of its earnings if its annual regulatory return on common equity exceeds certain levels in 2017 or 2018.
WPL’s Wisconsin Retail Electric and Gas Rate Case (2015/2016 Test Period) -
In July 2014, WPL received an order from the PSCW authorizing WPL to maintain retail electric base rates at their then current levels through the end of 2016. The retail electric base rate case included a return of and return of costs for environmental controls projects, generation performance and reliability improvements, other ongoing capital expenditures and an increase in electric transmission service expense. The additional revenue requirement for these cost increases was offset by the impact of changes in the amortization of regulatory liabilities associated with energy efficiency recoveries and increased sales volumes. The order also authorized WPL to implement a
$5 million
decrease in annual base rates for its retail gas customers effective January 1, 2015 followed by a freeze of such gas base rates through the end of 2016. The order included provisions that required WPL to defer a portion of its earnings if its annual regulatory return on common equity exceeded certain levels in 2015 or 2016. As of
December 31, 2016
, Alliant Energy and WPL deferred
$6 million
of WPL’s 2016 earnings for these provisions, which is included in “Other” in Alliant Energy’s and WPL’s regulatory liabilities tables above.
WPL’s Wisconsin Retail Electric and Gas Rate Case (2013/2014 Test Period) -
The PSCW’s order for WPL’s 2013/2014 Test Period electric and gas base rate case included provisions that required WPL to defer a portion of its earnings if its annual regulatory return on common equity exceeded certain levels during 2013 or 2014. As of
December 31, 2016
, Alliant Energy and WPL deferred
$6 million
of WPL’s 2013 and 2014 earnings for these provisions, which is included in “Other” in Alliant Energy’s and WPL’s regulatory liabilities tables above. These deferred earnings will be returned to customers as an offset to revenue requirements in 2017 and 2018 as authorized by the PSCW.
IPL’s Iowa Retail Electric Rate Settlement Agreement -
The IUB approved a settlement agreement in 2014 related to rates charged to IPL’s Iowa retail electric customers. The settlement agreement extended IPL’s Iowa retail electric base rates authorized in its 2009 Test Year rate case through 2016 and provided targeted retail electric customer billing credits of
$105 million
in aggregate. IPL recorded such billing credits as follows (in millions):
|
2016
|
2015
|
2014
|
|||||||||
|
Billing credits to reduce retail electric customers’ bills
|
|
$9
|
|
|
$24
|
|
|
$72
|
|
||
WPL’s Retail Fuel-related Rate Filings -
The PSCW authorized annual retail electric rate increases for WPL in 2014, 2015 and 2016, resulting from anticipated increases in retail electric fuel-related costs during such periods. Retail fuel-related costs incurred by WPL in 2015 and 2016 were lower than fuel-related costs used to determine rates for such period resulting in an over-collection of fuel-related costs, and retail fuel-related costs incurred by WPL in 2014 were higher than fuel-related costs used to determine rates for such period resulting in an under-collection of fuel-related costs. These fuel-related costs were subject to deferral since they were outside an annual bandwidth of plus or minus
2%
of the approved respective annual forecasted fuel-related costs. Details on these rate increases, as well as amounts WPL deferred for the over-collected (included in “Commodity cost recovery” regulatory liabilities) or under-collected (included in “Commodity cost recovery” regulatory assets) fuel-related costs from its retail electric customers are as follows (dollars in millions):
|
Retail Electric
|
Deferral of Over (Under)
|
Timing of Refunds To or
|
||||||||||
|
Year
|
Rate Increase
|
Collected Fuel-related Costs
|
Collections From Customers
|
|||||||||
|
2016
|
|
$7
|
|
1%
|
|
$9
|
|
Pending
|
||||
|
2015
|
39
|
|
4%
|
10
|
|
2016
|
||||||
|
2014
|
19
|
|
2%
|
(28
|
)
|
2016
|
||||||
88
At December 31, details of property, plant and equipment on the balance sheets were as follows (in millions):
|
Alliant Energy
|
IPL
|
WPL
|
|||||||||||||||||||||
|
2016
|
2015
|
2016
|
2015
|
2016
|
2015
|
||||||||||||||||||
|
Utility:
|
|||||||||||||||||||||||
|
Electric plant:
|
|||||||||||||||||||||||
|
Generation in service
|
|
$5,866.9
|
|
|
$5,643.7
|
|
|
$2,916.8
|
|
|
$3,011.6
|
|
|
$2,950.1
|
|
|
$2,632.1
|
|
|||||
|
Distribution in service
|
4,739.2
|
|
4,489.9
|
|
2,589.3
|
|
2,447.9
|
|
2,149.9
|
|
2,042.0
|
|
|||||||||||
|
Other in service
|
329.1
|
|
311.3
|
|
223.5
|
|
212.2
|
|
105.6
|
|
99.1
|
|
|||||||||||
|
Anticipated to be retired early (a)
|
108.3
|
|
—
|
|
108.3
|
|
—
|
|
—
|
|
—
|
|
|||||||||||
|
Total electric plant
|
11,043.5
|
|
10,444.9
|
|
5,837.9
|
|
5,671.7
|
|
5,205.6
|
|
4,773.2
|
|
|||||||||||
|
Gas plant in service
|
1,107.6
|
|
1,018.3
|
|
556.7
|
|
513.6
|
|
550.9
|
|
504.7
|
|
|||||||||||
|
Other plant in service
|
549.3
|
|
530.6
|
|
313.0
|
|
296.0
|
|
236.3
|
|
234.6
|
|
|||||||||||
|
Accumulated depreciation
|
(4,135.7
|
)
|
(3,939.6
|
)
|
(2,258.3
|
)
|
(2,152.8
|
)
|
(1,877.4
|
)
|
(1,786.8
|
)
|
|||||||||||
|
Net plant
|
8,564.7
|
|
8,054.2
|
|
4,449.3
|
|
4,328.5
|
|
4,115.4
|
|
3,725.7
|
|
|||||||||||
|
Leased Sheboygan Falls Energy Facility, net (b)
|
—
|
|
—
|
|
—
|
|
—
|
|
52.4
|
|
58.6
|
|
|||||||||||
|
Construction work in progress
|
1,226.8
|
|
897.5
|
|
968.1
|
|
578.2
|
|
258.7
|
|
319.3
|
|
|||||||||||
|
Other, net
|
18.4
|
|
18.5
|
|
18.2
|
|
18.4
|
|
0.2
|
|
0.1
|
|
|||||||||||
|
Total utility
|
9,809.9
|
|
8,970.2
|
|
5,435.6
|
|
4,925.1
|
|
4,426.7
|
|
4,103.7
|
|
|||||||||||
|
Non-regulated and other:
|
|||||||||||||||||||||||
|
Non-regulated Generation, net (c)
|
135.0
|
|
229.3
|
|
—
|
|
—
|
|
—
|
|
—
|
|
|||||||||||
|
Corporate Services and other, net (d)
|
334.3
|
|
319.6
|
|
—
|
|
—
|
|
—
|
|
—
|
|
|||||||||||
|
Total non-regulated and other
|
469.3
|
|
548.9
|
|
—
|
|
—
|
|
—
|
|
—
|
|
|||||||||||
|
Total property, plant and equipment
|
|
$10,279.2
|
|
|
$9,519.1
|
|
|
$5,435.6
|
|
|
$4,925.1
|
|
|
$4,426.7
|
|
|
$4,103.7
|
|
|||||
|
(a)
|
In 2016, IPL received approval from MISO to retire Sutherland Unit 3 and currently anticipates retiring this EGU by June 30, 2017. The recovery of the remaining net book value of this EGU is expected to be addressed in IPL’s next retail electric base rate case, which is currently expected to be filed in the second quarter of 2017.
|
|
(b)
|
Less accumulated amortization of
$71.4 million
and
$65.2 million
for WPL as of
December 31, 2016
and
2015
, respectively. The Sheboygan Falls Energy Facility is eliminated from WPL upon consolidation and is included in the “Non-regulated Generation, net” line within Alliant Energy’s consolidated property, plant and equipment.
|
|
(c)
|
Less accumulated depreciation of
$46.5 million
and
$59.0 million
for Alliant Energy as of
December 31, 2016
and
2015
, respectively.
|
|
(d)
|
Less accumulated depreciation of
$272.0 million
and
$252.9 million
for Alliant Energy as of
December 31, 2016
and
2015
, respectively.
|
Utility
-
Environmental Controls Project -
WPL’s Edgewater Unit 5
- Construction of a scrubber and baghouse at Edgewater Unit 5 began in 2014 and was completed in 2016, which resulted in a transfer of the capitalized project costs from “Construction work in progress” to “Electric plant - Generation in service” in the above table for Alliant Energy and WPL in 2016. As of
December 31, 2016
and
2015
, the capitalized project costs for the scrubber and baghouse consisted of capitalized expenditures of
$225 million
and CWIP of
$190 million
, and AFUDC of
$12 million
and
$8 million
, respectively, for the scrubber and baghouse. The scrubber and baghouse reduce SO2 and mercury emissions at the EGU and are expected to help meet requirements under CSAPR.
Natural Gas-Fired Generation Projects -
IPL’s Marshalltown Generating Station
- IPL is currently constructing Marshalltown, an approximate
650
MW natural gas-fired combined-cycle EGU. Construction began in 2014 and is expected to be completed in April 2017. As of
December 31, 2016
and
2015
, Alliant Energy and IPL recorded capitalized expenditures for CWIP of
$612 million
and
$453 million
, and AFUDC of
$68 million
and
$24 million
, respectively, for Marshalltown in “Construction work in progress” in the above table for Alliant Energy and IPL.
WPL’s Riverside Expansion
- WPL is currently constructing the Riverside expansion, an approximate
730
MW natural gas-fired combined-cycle EGU. Construction began in 2016 and is expected to be completed in early 2020. As of
December 31, 2016
and
2015
, Alliant Energy and WPL recorded capitalized expenditures for CWIP of
$81 million
and
$2 million
, and AFUDC of
$2 million
and
$0
, respectively, for the Riverside expansion in “Construction work in progress” in the above table for Alliant Energy and WPL. These capital expenditures exclude any potential impacts from the intent to exercise purchase options by certain WPL electric cooperatives for a partial ownership interest in the Riverside expansion.
89
Wind Generation -
IPL’s Expansion of Wind Generation
- IPL currently plans to add wind generation to its resources portfolio. In 2016, IPL entered into a turbine supply agreement and made progress payments for a portion of the wind turbines in such agreement in order to qualify for the full level of production tax credits for this new wind generation. IPL anticipates placing certain of the additional wind generation in service in 2019 and 2020. As of
December 31, 2016
, Alliant Energy and IPL recorded capitalized expenditures for CWIP of
$102 million
and AFUDC of
$1 million
for this expansion of wind generation in “Construction work in progress” in the above table for Alliant Energy and IPL.
Sales of IPL’s Minnesota Electric and Natural Gas Distribution Assets -
In 2015, IPL completed the sale of its Minnesota natural gas distribution assets (primarily related to property, plant and equipment) and received proceeds of
$11 million
and a promissory note of
$2 million
. In 2015, IPL completed the sale of its Minnesota electric distribution assets (primarily related to property, plant and equipment) to Southern Minnesota Energy Cooperative, a combined group of various neighboring electric cooperatives, and received proceeds of
$129 million
. The proceeds from the natural gas distribution assets were used for general corporate purposes and the proceeds from the electric distribution assets were used to reduce cash amounts received from IPL’s sales of accounts receivable program. The premium received over the book value of the property, plant and equipment sold was more than offset by a reduction in tax-related regulatory assets associated with the distribution assets. As a result, Alliant Energy and IPL recorded pre-tax charges of
$11 million
and
$3 million
for the Minnesota electric and natural gas distribution asset transactions, respectively, in “Other operation and maintenance” in their income statements in 2015.
The electric distribution asset sales agreement includes a wholesale power supply agreement between IPL and Southern Minnesota Energy Cooperative, which was approved by FERC in 2015 and became effective upon the sale of IPL’s Minnesota electric distribution assets. The wholesale power supply agreement contains a
five
-year termination notice, which may not be given until the fifth anniversary of the effective date of the agreement, resulting in a minimum term of
10 years
. The agreement remains in effect indefinitely, unless notice to terminate is provided by either party. This wholesale power supply agreement includes standardized pricing mechanisms that are detailed in IPL’s current tariffs accepted by FERC through wholesale rate case proceedings. IPL’s current return on common equity authorized by FERC related to its wholesale electric rates is
10.97%
. As a result of IPL’s requirement to supply electricity to Southern Minnesota Energy Cooperative under the wholesale power supply agreement, the sale of the electric distribution assets did not have a significant impact on IPL’s generation plans or operating results.
AFUDC
- AFUDC represents costs to finance construction additions including a return on equity component and cost of debt component as required by regulatory accounting. The concurrent credit for the amount of AFUDC capitalized is recorded as “Allowance for funds used during construction” in the income statements. The amount of AFUDC generated by equity and debt components was as follows (in millions):
|
Alliant Energy
|
IPL
|
WPL
|
|||||||||||||||||||||||||||||||||
|
2016
|
2015
|
2014
|
2016
|
2015
|
2014
|
2016
|
2015
|
2014
|
|||||||||||||||||||||||||||
|
Equity
|
|
$42.3
|
|
|
$24.4
|
|
|
$23.1
|
|
|
$35.2
|
|
|
$18.6
|
|
|
$17.1
|
|
|
$7.1
|
|
|
$5.8
|
|
|
$6.0
|
|
||||||||
|
Debt
|
20.2
|
|
12.5
|
|
11.7
|
|
16.8
|
|
9.6
|
|
8.8
|
|
3.4
|
|
2.9
|
|
2.9
|
|
|||||||||||||||||
|
|
$62.5
|
|
|
$36.9
|
|
|
$34.8
|
|
|
$52.0
|
|
|
$28.2
|
|
|
$25.9
|
|
|
$10.5
|
|
|
$8.7
|
|
|
$8.9
|
|
|||||||||
AFUDC related to various construction projects was recognized in the income statements as follows (in millions):
|
2016
|
2015
|
2014
|
|||||||||
|
IPL:
|
|||||||||||
|
Marshalltown
|
|
$43.8
|
|
|
$20.7
|
|
|
$3.7
|
|
||
|
Environmental controls - Ottumwa Unit 1
|
—
|
|
—
|
|
10.6
|
|
|||||
|
Other
|
8.2
|
|
7.5
|
|
11.6
|
|
|||||
|
52.0
|
|
28.2
|
|
25.9
|
|
||||||
|
WPL:
|
|||||||||||
|
Environmental controls - Edgewater Unit 5
|
4.3
|
|
5.1
|
|
2.7
|
|
|||||
|
Other
|
6.2
|
|
3.6
|
|
6.2
|
|
|||||
|
10.5
|
|
8.7
|
|
8.9
|
|
||||||
|
Alliant Energy
|
|
$62.5
|
|
|
$36.9
|
|
|
$34.8
|
|
||
90
Non-regulated and Other
-
The non-regulated and other property, plant and equipment recorded on Alliant Energy’s balance sheets includes the following:
Non-regulated Generation -
Franklin County Wind Farm
- The Franklin County wind farm was placed into service in 2012 and is depreciated using the straight-line method over a
30
-year period. Based on an evaluation of the strategic options for the Franklin County wind farm performed in 2016, Alliant Energy concluded it was probable the Franklin County wind farm will be transferred to IPL. As a result, Alliant Energy performed an impairment analysis of such assets in 2016. The impairment analysis evaluated the value of the assets and a reasonable estimate of the amount of costs associated with the Franklin County wind farm that would be allowed for recovery for IPL’s electric rate-making purposes. Based on various analyses, including discounted cash flows projected from the Franklin County wind farm, recently executed PPAs associated with wind generating facilities located near the Franklin County wind farm, and the cost of new wind farms identified through IPL’s planned wind expansion, the value of the Franklin County wind farm assets was determined to be approximately
$33 million
, subject to working capital adjustments. Alliant Energy concluded such value represents a reasonable estimate of the amount IPL will be allowed for recovery for IPL’s electric rate-making purposes. As a result, in 2016, the carrying amount of the Franklin County wind farm was reduced to such value, resulting in non-cash, pre-tax asset valuation charges of
$86 million
(after-tax charges of
$51 million
, or
$0.23
per share). In 2016, Alliant Energy recorded such charges as a reduction to “Non-regulated Generation, net” in the above table and charges to “Asset valuation charges for Franklin County wind farm” in its income statement.
In February 2017, FERC issued an order approving the transfer of the Franklin County wind farm from AEF to IPL. Alliant Energy and IPL currently expect to complete this transfer in 2017. The final amount to be recovered for IPL’s electric rate-making purposes is expected to be determined by the IUB as part of IPL’s retail electric rate case for the 2016 Test Year, currently anticipated to be filed in the second quarter of 2017, and therefore the final asset valuation charges are subject to change.
Sheboygan Falls
- Sheboygan Falls was placed into service in 2005 and is depreciated using the straight-line method over a
35
-year period. As of
December 31, 2016
, Alliant Energy recorded
$95 million
on its balance sheet related to Sheboygan Falls.
Corporate Services and Other -
Property, plant and equipment related to Corporate Services includes a customer billing and information system for IPL and WPL and other computer software, and the corporate headquarters building located in Madison, Wisconsin. The customer billing and information system is amortized using the straight-line method over a
12
-year period. The majority of the remaining software is amortized over a
5
-year period. Property, plant and equipment related to Transportation includes a short-line railway in Iowa and a barge terminal on the Mississippi River. The Corporate Services and Other property, plant and equipment is depreciated using the straight-line method over periods ranging from
5
to
30
years.
91
Under joint ownership agreements with other utilities, IPL and WPL have undivided ownership interests in jointly-owned coal-fired EGUs. Each of the respective owners is responsible for the financing of its portion of the construction costs. KWh generation and operating expenses are primarily divided between the joint owners on the same basis as ownership. IPL’s and WPL’s shares of expenses from jointly-owned coal-fired EGUs are included in the corresponding operating expenses (e.g., electric production fuel, other operation and maintenance, etc.) in their income statements. Information relative to IPL’s and WPL’s ownership interest in these jointly-owned coal-fired EGUs at
December 31, 2016
was as follows (dollars in millions):
|
Accumulated
|
Construction
|
|||||||||||||
|
Ownership
|
Electric
|
Provision for
|
Work in
|
|||||||||||
|
Interest %
|
Plant
|
Depreciation
|
Progress
|
|||||||||||
|
IPL
|
||||||||||||||
|
Ottumwa Unit 1
|
48.0
|
%
|
|
$489.4
|
|
|
$137.3
|
|
|
$11.1
|
|
|||
|
George Neal Unit 4
|
25.7
|
%
|
185.2
|
|
80.8
|
|
1.6
|
|
||||||
|
George Neal Unit 3
|
28.0
|
%
|
150.7
|
|
49.1
|
|
0.3
|
|
||||||
|
Louisa Unit 1
|
4.0
|
%
|
36.5
|
|
21.8
|
|
0.6
|
|
||||||
|
861.8
|
|
289.0
|
|
13.6
|
|
|||||||||
|
WPL
|
||||||||||||||
|
Columbia Units 1-2
|
46.2
|
%
|
640.2
|
|
185.0
|
|
51.0
|
|
||||||
|
Edgewater Unit 4
|
68.2
|
%
|
99.4
|
|
58.4
|
|
0.2
|
|
||||||
|
739.6
|
|
243.4
|
|
51.2
|
|
|||||||||
|
Alliant Energy
|
|
$1,601.4
|
|
|
$532.4
|
|
|
$64.8
|
|
|||||
In November 2016, WPL received an order from the PSCW approving amendments to the Columbia joint operating agreement, which allow the co-owners to forgo certain capital expenditures at Columbia (excluding capital expenditures related to the Columbia Unit 2 SCR currently being constructed), resulting in WPL incurring these additional capital expenditures in exchange for a proportional increase in its ownership share of Columbia. Based on the additional capital expenditures WPL currently expects to incur through June 1, 2020, WPL’s ownership interest in Columbia is expected to increase in the future. In December 2016, WPL filed a request with FERC for approval of these amendments to the Columbia joint operating agreement, effective January 1, 2017. WPL currently expects to receive FERC’s decision on these amendments in 2017.
In November 2016, various electric cooperatives, which currently have wholesale power supply agreements with WPL, notified WPL of their intent to exercise purchase options for a partial ownership interest in the Riverside expansion. WPL currently expects the exercise of the purchase options to be effective in 2017.
|
Alliant Energy
|
IPL
|
WPL
|
|||||||||||||||||||||
|
2016
|
2015
|
2016
|
2015
|
2016
|
2015
|
||||||||||||||||||
|
Customer
|
|
$111.7
|
|
|
$93.8
|
|
|
$—
|
|
|
$4.6
|
|
|
$104.4
|
|
|
$81.5
|
|
|||||
|
Unbilled utility revenues
|
90.2
|
|
83.1
|
|
—
|
|
1.2
|
|
90.2
|
|
81.9
|
|
|||||||||||
|
Deferred proceeds
|
211.1
|
|
172.0
|
|
211.1
|
|
172.0
|
|
—
|
|
—
|
|
|||||||||||
|
Other
|
89.0
|
|
53.5
|
|
30.7
|
|
22.8
|
|
38.8
|
|
25.7
|
|
|||||||||||
|
Allowance for doubtful accounts
|
(8.7
|
)
|
(4.8
|
)
|
(1.1
|
)
|
(0.6
|
)
|
(7.1
|
)
|
(3.7
|
)
|
|||||||||||
|
|
$493.3
|
|
|
$397.6
|
|
|
$240.7
|
|
|
$200.0
|
|
|
$226.3
|
|
|
$185.4
|
|
||||||
92
proceeds is
$125 million
. The Receivables Agreement can be terminated by the third party if arrears or write-offs exceed certain levels. IPL was in compliance with all related covenants as of December 31, 2016.
As of
December 31, 2016
, IPL sold
$248.1 million
of receivables to the third party, received
$21.0 million
in cash proceeds and recorded deferred proceeds of
$211.1 million
. Deferred proceeds represent IPL’s interest in the receivables sold to the third party. At IPL’s request, deferred proceeds are paid to IPL from collections of receivables, after paying any required expenses incurred by the third party and the collection agent. Corporate Services acts as collection agent for the third party and receives a fee for collection services. IPL believes that the allowance for doubtful accounts related to its sales of receivables is a reasonable approximation of credit risk of the customers that generated the receivables. In
2016
,
2015
and
2014
, IPL’s costs incurred related to the sales of accounts receivable program were not material. Refer to
Note 14
for discussion of the fair value of deferred proceeds.
IPL’s maximum and average outstanding aggregate cash proceeds (based on daily outstanding balances) related to the sales of accounts receivable program were as follows (in millions):
|
Maximum
|
Average
|
||||||||||
|
2016
|
2015
|
2014
|
2016
|
2015
|
2014
|
||||||
|
Outstanding aggregate cash proceeds
|
$172.0
|
$137.0
|
$150.0
|
$73.2
|
$46.7
|
$46.4
|
|||||
As of December 31, the attributes of IPL’s receivables sold under the Receivables Agreement were as follows (in millions):
|
2016
|
2015
|
||
|
Customer accounts receivable
|
$157.6
|
$109.7
|
|
|
Unbilled utility revenues
|
90.4
|
71.3
|
|
|
Other receivables
|
0.1
|
0.1
|
|
|
Receivables sold to third party
|
248.1
|
181.1
|
|
|
Less: cash proceeds (a)
|
21.0
|
5.0
|
|
|
Deferred proceeds
|
227.1
|
176.1
|
|
|
Less: allowance for doubtful accounts
|
16.0
|
4.1
|
|
|
Fair value of deferred proceeds
|
$211.1
|
$172.0
|
|
|
Outstanding receivables past due
|
$68.0
|
$18.0
|
|
|
(a)
|
Changes in cash proceeds are presented in “Sales of accounts receivable” in operating activities in Alliant Energy’s and IPL’s cash flows statements.
|
Additional attributes of IPL’s receivables sold under the Receivables Agreement were as follows (in millions):
|
2016
|
2015
|
2014
|
|||
|
Collections reinvested in receivables
|
$1,818.1
|
$1,812.9
|
$1,997.9
|
||
|
Write-offs, net of recoveries
|
4.8
|
8.8
|
11.4
|
||
In connection with the implementation of IPL’s new customer billing and information system in 2016, IPL postponed the write-off of customer bills for a portion of 2016, resulting in lower write-offs in 2016 and higher outstanding receivables past due as of December 31, 2016.
93
|
Ownership Interest at
|
Carrying Value at December 31,
|
Equity (Income) / Loss
|
|||||||||||||||||||
|
December 31, 2016
|
2016
|
2015
|
2016
|
2015
|
2014
|
||||||||||||||||
|
Alliant Energy
|
|||||||||||||||||||||
|
ATC (a)
|
16%
|
|
$317.6
|
|
|
$293.3
|
|
|
($39.1
|
)
|
|
($34.2
|
)
|
|
($41.9
|
)
|
|||||
|
Other
|
Various
|
8.4
|
|
9.6
|
|
(0.5
|
)
|
0.4
|
|
1.5
|
|
||||||||||
|
|
$326.0
|
|
|
$302.9
|
|
|
($39.6
|
)
|
|
($33.8
|
)
|
|
($40.4
|
)
|
|||||||
|
WPL
|
|||||||||||||||||||||
|
ATC
|
—%
|
|
$—
|
|
|
$293.3
|
|
|
($39.1
|
)
|
|
($34.2
|
)
|
|
($41.9
|
)
|
|||||
|
Wisconsin River Power Company
|
50%
|
7.7
|
|
8.7
|
|
(0.7
|
)
|
(0.9
|
)
|
(0.9
|
)
|
||||||||||
|
|
$7.7
|
|
|
$302.0
|
|
|
($39.8
|
)
|
|
($35.1
|
)
|
|
($42.8
|
)
|
|||||||
|
(a)
|
Alliant Energy currently has the ability to exercise significant influence over ATC’s financial and operating policies through its participation on ATC’s Board of Directors. Refer to
Note 18
for information regarding related party transactions with ATC.
|
Summary aggregate financial information from the financial statements of these investments is as follows (in millions):
|
Alliant Energy
|
WPL
|
||||||||||||||||||||||
|
2016
|
2015
|
2014
|
2016
|
2015
|
2014
|
||||||||||||||||||
|
Operating revenues
|
|
$658
|
|
|
$624
|
|
|
$643
|
|
|
$658
|
|
|
$624
|
|
|
$643
|
|
|||||
|
Operating income
|
331
|
|
299
|
|
330
|
|
331
|
|
299
|
|
330
|
|
|||||||||||
|
Net income
|
232
|
|
186
|
|
240
|
|
234
|
|
202
|
|
240
|
|
|||||||||||
|
As of December 31:
|
|||||||||||||||||||||||
|
Current assets
|
82
|
|
88
|
|
6
|
|
87
|
|
|||||||||||||||
|
Non-current assets
|
4,340
|
|
3,987
|
|
19
|
|
3,977
|
|
|||||||||||||||
|
Current liabilities
|
498
|
|
332
|
|
3
|
|
332
|
|
|||||||||||||||
|
Non-current liabilities
|
2,144
|
|
2,052
|
|
7
|
|
2,052
|
|
|||||||||||||||
MISO Transmission Owner Return on Equity Complaints
-
A group of MISO cooperative and municipal utilities previously filed
two
complaints with FERC requesting a reduction of the base return on equity used by MISO transmission owners, including ATC. In September 2016, FERC issued an order on the first complaint to reduce the base return on equity for the refund period from November 12, 2013 through February 11, 2015. In June 2016, a FERC administrative law judge issued an initial decision regarding the second complaint recommending a reduction of the base return on equity for the refund period from February 12, 2015 through May 11, 2016. A final decision on the second complaint from FERC is currently expected in the first half of 2017. Alliant Energy and WPL have realized a cumulative
$24 million
of reductions in the amount of equity income from ATC as a result of the two complaints through
December 31, 2016
, including
$9 million
,
$12 million
and
$3 million
realized in 2016, 2015 and 2014, respectively.
WPL’s Noncontrolling Interest and Investment in ATC
-
Prior to 2014, WPL owned
100%
of WPL Transco, which held Alliant Energy’s investment in ATC. In 2014, WPL Transco’s operating agreement was amended to allow ATI, a wholly-owned subsidiary of AEF, to become a member of WPL Transco in addition to WPL. In 2014, ATI began funding capital contributions that WPL Transco made to ATC. WPL Transco’s equity income from ATC and ATC dividends received by WPL Transco were allocated between WPL and ATI based on their respective ownership interests at the time the equity income was generated and at the time of the dividend payments. Prior to the transfer of the investment in ATC to ATI discussed below, WPL consolidated WPL Transco, and ATI’s ownership in WPL Transco was recorded as a noncontrolling interest in total equity on WPL’s balance sheets.
In June 2016, WPL received an order from the PSCW requiring WPL to transfer its investment in ATC to Alliant Energy or an Alliant Energy subsidiary by December 31, 2022. On December 31, 2016, pursuant to the PSCW order, WPL Transco was liquidated and WPL transferred its investment in ATC to ATI. In conjunction with the transfer of the investment in ATC, a deferred intercompany tax gain recognized by WPL was assumed by ATI. The impact of WPL’s transfer of the ATC investment, including the assumption of such intercompany tax gain by ATI, was recorded as a net reduction in total equity of
$163.6 million
on WPL’s balance sheet. WPL’s income statement includes all of the equity earnings from ATC through December 31, 2016, the date of transfer. There were no impacts of this transfer to Alliant Energy’s consolidated financial statements. As of December 31, 2016, ATI owns Alliant Energy’s entire investment in ATC.
94
|
Alliant Energy
|
IPL
|
WPL
|
|||||||||
|
2016
|
2015
|
2016
|
2015
|
2016
|
2015
|
||||||
|
Cash surrender value
|
$10.6
|
$42.3
|
$—
|
$18.9
|
$5.8
|
$6.4
|
|||||
Common Stock Split
-
On April 20, 2016, Alliant Energy’s Board of Directors approved a
two
-for-one
common stock split and a proportionate increase in the number of authorized shares of common stock of Alliant Energy from
240 million
shares to
480 million
shares to implement the stock split. Alliant Energy shareowners of record at the close of business on May 4, 2016 received one additional share of Alliant Energy common stock for each share held on that date. The proportionate interest that a shareowner owns in Alliant Energy did not change as a result of the stock split. The additional shares were distributed on May 19, 2016 and post-split trading began on May 20, 2016. All Alliant Energy share and per share amounts in this report have been reflected on a post-split basis.
Common Share Activity
-
A summary of Alliant Energy’s common stock activity was as follows:
|
2016
|
2015
|
2014
|
||||||
|
Shares outstanding, January 1
|
226,918,432
|
|
221,871,360
|
|
221,887,338
|
|
||
|
At-the-market offering program
|
—
|
|
4,373,234
|
|
—
|
|
||
|
Shareowner Direct Plan issuances
|
732,814
|
|
606,010
|
|
—
|
|
||
|
Equity-based compensation plans (
Note 12(b)
)
|
22,408
|
|
112,756
|
|
71,094
|
|
||
|
Other
|
—
|
|
(44,928
|
)
|
(87,072
|
)
|
||
|
Shares outstanding, December 31
|
227,673,654
|
|
226,918,432
|
|
221,871,360
|
|
||
At
December 31, 2016
, Alliant Energy had a total of
11.3 million
shares available for issuance in the aggregate, pursuant to its Amended and Restated OIP, Shareowner Direct Plan and 401(k) Savings Plan.
At-the-Market Offering Program -
In 2015, Alliant Energy filed a prospectus supplement under which it may sell up to
$150 million
of its common stock through an at-the-market offering program. In 2015, Alliant Energy issued
4,373,234
shares of common stock through this program and received cash proceeds of
$133 million
, net of
$2 million
in fees and commissions. The proceeds from the issuances of common stock were used for general corporate purposes. This at-the-market offering program expired in 2016.
Shareowner Direct Plan -
Beginning in 2015, Alliant Energy satisfied its requirements under the Shareowner Direct Plan (dividend reinvestment and stock purchase plan) by acquiring Alliant Energy common stock through original issue, rather than on the open market.
Shareowner Rights Agreement
-
Alliant Energy has established an amended and restated Shareowner Rights Agreement. The rights under this agreement will only become exercisable if a person or group has acquired, or announced an intention to acquire,
15%
or more of Alliant Energy’s outstanding common stock. Each right will initially entitle registered shareowners to purchase from Alliant Energy one-quarter of one share of Alliant Energy’s common stock. The rights will be exercisable at an initial price of
$55.00
per full share, subject to adjustment. If any shareowner acquires
15%
or more of the outstanding common stock of Alliant Energy, each right (subject to limitations) will entitle its holder to purchase, at the right’s then current exercise price, a number of common shares of Alliant Energy or of the acquirer having a market value at the time of twice the right’s per full share exercise price. Alliant Energy’s Board of Directors is authorized to reduce the
15%
ownership threshold to not less than
10%
. The amended and restated Shareowner Rights Agreement expires in December 2018. Alliant Energy currently has no intention to redeem the Shareowner Rights Agreement and plans to allow it to naturally expire at the end of the term.
Dividend Restrictions
-
Alliant Energy does not have any significant common stock dividend restrictions. IPL and WPL each have common stock dividend restrictions based on applicable regulatory limitations. IPL also has common stock dividend restrictions based on the terms of its outstanding preferred stock. As of
December 31, 2016
, IPL and WPL were in compliance with all such dividend restrictions.
95
IPL is restricted from paying common stock dividends to its parent company, Alliant Energy, if for any past or current dividend period, dividends on its preferred stock have not been paid, or declared and set apart for payment. IPL has paid all dividends on its preferred stock through
2016
. Under the Federal Power Act, IPL may not pay dividends to its parent company in excess of the current amount of its retained earnings. As of
December 31, 2016
, IPL’s amount of retained earnings that were free of dividend restrictions was
$618 million
. If IPL’s actual
13
-month average common equity ratio (calculated on a financial basis consistent with IPL’s rate cases) falls below
42%
of total capitalization, IPL is required to notify the IUB.
Pursuant to a December 2016 PSCW order, WPL has a regulatory limitation on distributions to its parent company. WPL is prohibited from paying annual common stock dividends to its parent company in excess of forecasted dividend levels of
$126 million
in 2017 and
$140 million
in 2018 if WPL’s actual
13
-month average common equity ratio (calculated on a financial basis consistent with WPL’s rate cases) would fall below
51.00%
for 2017 or 2018. As of
December 31, 2016
, WPL’s amount of retained earnings that were free of dividend restrictions was
$126 million
for
2017
.
Restricted Net Assets of Subsidiaries
-
IPL and WPL do not have regulatory authority to lend or advance any amounts to their parent company. As of
December 31, 2016
, the amount of net assets of IPL and WPL that were not available to be transferred to their parent company, Alliant Energy, in the form of loans, advances or cash dividends without the consent of IPL’s and WPL’s regulatory authorities was
$1.6 billion
for each.
Comprehensive Income
-
In
2016
,
2015
and
2014
, Alliant Energy’s other comprehensive income (loss) was
$0
,
$0.2 million
and
($0.4) million
, respectively; therefore, its comprehensive income was substantially equal to its net income and its comprehensive income attributable to Alliant Energy common shareowners was substantially equal to its net income attributable to Alliant Energy common shareowners for such periods. In
2016
,
2015
and
2014
, IPL and WPL had no other comprehensive income; therefore their comprehensive income was equal to their net income and their comprehensive income available for common stock was equal to their earnings available for common stock for such periods.
IPL is authorized to issue up to
16,000,000
shares of cumulative preferred stock in aggregate. Information related to the carrying value of IPL’s cumulative preferred stock at December 31 was as follows:
|
Series
|
Liquidation Preference/Stated Value
|
Shares Authorized
|
Shares Outstanding
|
2016
|
2015
|
|||||||||
|
(in millions)
|
||||||||||||||
|
5.1%
|
$25
|
8,000,000
|
8,000,000
|
|
$200.0
|
|
|
$200.0
|
|
|||||
On or after March 15, 2018, IPL may, at its option, redeem the
5.1%
cumulative preferred stock for cash at a redemption price of
$25
per share plus accrued and unpaid dividends up to the redemption date.
The current articles of incorporation of IPL contain a provision that grants the holders of its cumulative preferred stock voting rights to elect
two
members of IPL’s Board of Directors if preferred dividends equal to
six
or more quarterly dividend requirements (whether or not consecutive) are in arrears. Such voting rights would not provide the holders of IPL’s preferred stock control of the decision on redemption of IPL’s preferred stock and could not force IPL to exercise its call option. Therefore, IPL’s cumulative preferred stock is presented in total equity on Alliant Energy’s and IPL’s balance sheets in a manner consistent with noncontrolling interests.
Refer to
Note 14
for information on the fair value of cumulative preferred stock.
96
|
Alliant Energy
|
IPL
|
WPL
|
|||||||||
|
December 31
|
2016
|
2015
|
2016
|
2015
|
2016
|
2015
|
|||||
|
Commercial paper outstanding
|
$244.1
|
$159.8
|
$—
|
$—
|
$52.3
|
$19.9
|
|||||
|
Commercial paper weighted average interest rates
|
0.9%
|
0.7%
|
N/A
|
N/A
|
0.7%
|
0.4%
|
|||||
|
Available credit facility capacity
|
$755.9
|
$840.2
|
$300.0
|
$300.0
|
$347.7
|
$380.1
|
|||||
|
Alliant Energy
|
IPL
|
WPL
|
|||||||||
|
For the year ended
|
2016
|
2015
|
2016
|
2015
|
2016
|
2015
|
|||||
|
Maximum amount outstanding (based on daily outstanding balances)
|
$251.8
|
$181.2
|
$3.1
|
$18.4
|
$118.3
|
$24.7
|
|||||
|
Average amount outstanding (based on daily outstanding balances)
|
$179.0
|
$119.2
|
$—
|
$0.2
|
$38.1
|
$2.2
|
|||||
|
Weighted average interest rates
|
0.6%
|
0.4%
|
0.7%
|
0.4%
|
0.4%
|
0.3%
|
|||||
Financial Covenants
-
The credit facility agreements and AEF’s term loan credit agreement each contain a financial covenant, which requires Alliant Energy, IPL and WPL to maintain certain debt-to-capital ratios in order to borrow under the credit facilities and term loan credit agreement. The required debt-to-capital ratios compared to the actual debt-to-capital ratios at
December 31, 2016
were as follows:
|
Alliant Energy
|
IPL
|
WPL
|
|||
|
Requirement, not to exceed
|
65%
|
58%
|
58%
|
||
|
Actual
|
53%
|
47%
|
49%
|
||
The debt component of the capital ratios includes long- and short-term debt (excluding non-recourse debt and hybrid securities to the extent the total carrying value of such hybrid securities does not exceed
15%
of consolidated capital of the applicable borrower), capital lease obligations, certain letters of credit, guarantees of the foregoing and new synthetic leases. Unfunded vested benefits under qualified pension plans and sales of accounts receivable are not included in the debt-to-capital ratios. The equity component of the capital ratios excludes accumulated other comprehensive income (loss).
97
|
2016
|
2015
|
||||||||||||||||||||||
|
Alliant Energy
|
IPL
|
WPL
|
Alliant Energy
|
IPL
|
WPL
|
||||||||||||||||||
|
Senior Debentures (a):
|
|||||||||||||||||||||||
|
5.875%, due 2018
|
|
$100.0
|
|
|
$100.0
|
|
|
$—
|
|
|
$100.0
|
|
|
$100.0
|
|
|
$—
|
|
|||||
|
7.25%, due 2018
|
250.0
|
|
250.0
|
|
—
|
|
250.0
|
|
250.0
|
|
—
|
|
|||||||||||
|
3.65%, due 2020
|
200.0
|
|
200.0
|
|
—
|
|
200.0
|
|
200.0
|
|
—
|
|
|||||||||||
|
3.25%, due 2024
|
250.0
|
|
250.0
|
|
—
|
|
250.0
|
|
250.0
|
|
—
|
|
|||||||||||
|
3.4%, due 2025
|
250.0
|
|
250.0
|
|
—
|
|
250.0
|
|
250.0
|
|
—
|
|
|||||||||||
|
5.5%, due 2025
|
50.0
|
|
50.0
|
|
—
|
|
50.0
|
|
50.0
|
|
—
|
|
|||||||||||
|
6.45%, due 2033
|
100.0
|
|
100.0
|
|
—
|
|
100.0
|
|
100.0
|
|
—
|
|
|||||||||||
|
6.3%, due 2034
|
125.0
|
|
125.0
|
|
—
|
|
125.0
|
|
125.0
|
|
—
|
|
|||||||||||
|
6.25%, due 2039
|
300.0
|
|
300.0
|
|
—
|
|
300.0
|
|
300.0
|
|
—
|
|
|||||||||||
|
4.7%, due 2043
|
250.0
|
|
250.0
|
|
—
|
|
250.0
|
|
250.0
|
|
—
|
|
|||||||||||
|
3.7%, due 2046 (b)
|
300.0
|
|
300.0
|
|
—
|
|
—
|
|
—
|
|
—
|
|
|||||||||||
|
2,175.0
|
|
2,175.0
|
|
—
|
|
1,875.0
|
|
1,875.0
|
|
—
|
|
||||||||||||
|
Debentures (a):
|
|||||||||||||||||||||||
|
5%, due 2019
|
250.0
|
|
—
|
|
250.0
|
|
250.0
|
|
—
|
|
250.0
|
|
|||||||||||
|
4.6%, due 2020
|
150.0
|
|
—
|
|
150.0
|
|
150.0
|
|
—
|
|
150.0
|
|
|||||||||||
|
2.25%, due 2022
|
250.0
|
|
—
|
|
250.0
|
|
250.0
|
|
—
|
|
250.0
|
|
|||||||||||
|
6.25%, due 2034
|
100.0
|
|
—
|
|
100.0
|
|
100.0
|
|
—
|
|
100.0
|
|
|||||||||||
|
6.375%, due 2037
|
300.0
|
|
—
|
|
300.0
|
|
300.0
|
|
—
|
|
300.0
|
|
|||||||||||
|
7.6%, due 2038
|
250.0
|
|
—
|
|
250.0
|
|
250.0
|
|
—
|
|
250.0
|
|
|||||||||||
|
4.1%, due 2044
|
250.0
|
|
—
|
|
250.0
|
|
250.0
|
|
—
|
|
250.0
|
|
|||||||||||
|
1,550.0
|
|
—
|
|
1,550.0
|
|
1,550.0
|
|
—
|
|
1,550.0
|
|
||||||||||||
|
Other:
|
|||||||||||||||||||||||
|
AEF term loan credit agreement through 2018, 1% at December 31, 2016 (c)(d)
|
500.0
|
|
—
|
|
—
|
|
—
|
|
—
|
|
—
|
|
|||||||||||
|
Corporate Services 3.45% senior notes, due 2022 (a)
|
75.0
|
|
—
|
|
—
|
|
75.0
|
|
—
|
|
—
|
|
|||||||||||
|
Sheboygan Power, LLC 5.06% senior secured notes, due 2017 to 2024 (secured by Sheboygan Falls and related assets) (a)
|
53.8
|
|
—
|
|
—
|
|
56.8
|
|
—
|
|
—
|
|
|||||||||||
|
Alliant Energy term loan credit agreement, 1% at December 31, 2015 (Retired in 2016) (c)
|
—
|
|
—
|
|
—
|
|
250.0
|
|
—
|
|
—
|
|
|||||||||||
|
Franklin County Holdings LLC term loan credit agreement, 1% at December 31, 2015 (Retired in 2016) (c)
|
—
|
|
—
|
|
—
|
|
60.0
|
|
—
|
|
—
|
|
|||||||||||
|
Other, 1% at December 31, 2016, due 2017 to 2025
|
3.3
|
|
—
|
|
—
|
|
3.7
|
|
—
|
|
—
|
|
|||||||||||
|
632.1
|
|
—
|
|
—
|
|
445.5
|
|
—
|
|
—
|
|
||||||||||||
|
Subtotal
|
4,357.1
|
|
2,175.0
|
|
1,550.0
|
|
3,870.5
|
|
1,875.0
|
|
1,550.0
|
|
|||||||||||
|
Current maturities
|
(4.6
|
)
|
—
|
|
—
|
|
(313.4
|
)
|
—
|
|
—
|
|
|||||||||||
|
Unamortized debt issuance costs
|
(23.4
|
)
|
(13.7
|
)
|
(9.1
|
)
|
(22.3
|
)
|
(11.8
|
)
|
(9.9
|
)
|
|||||||||||
|
Unamortized debt (discount) and premium, net
|
(13.5
|
)
|
(7.8
|
)
|
(5.7
|
)
|
(12.6
|
)
|
(6.3
|
)
|
(6.2
|
)
|
|||||||||||
|
Long-term debt, net (e)
|
|
$4,315.6
|
|
|
$2,153.5
|
|
|
$1,535.2
|
|
|
$3,522.2
|
|
|
$1,856.9
|
|
|
$1,533.9
|
|
|||||
|
(a)
|
Contains optional redemption provisions which, if elected by the issuer at its sole discretion, could require material redemption premium payments by the issuer. The redemption premium payments under these optional redemption provisions are variable and dependent on applicable U.S. Treasury rates at the time of redemption.
|
|
(b)
|
In 2016, IPL issued
$300 million
of
3.7%
senior debentures due 2046. The proceeds from the issuance were used by IPL to reduce cash amounts received from its sales of accounts receivable program, reduce commercial paper classified as long-term debt by
$100 million
and for general corporate purposes.
|
|
(c)
|
In 2016, AEF entered into a
$500 million
variable-rate term loan credit agreement and used the proceeds from borrowings under this agreement to retire Alliant Energy’s and Franklin County Holdings LLC’s variable-rate term loan credit agreements that matured in 2016, reduce outstanding commercial paper at Alliant Energy and for general corporate purposes.
|
|
(d)
|
Refer to
Note 9(a)
for discussion of a financial covenant contained in AEF’s term loan credit agreement.
|
|
(e)
|
There were no significant sinking fund requirements related to the outstanding long-term debt.
|
Five-Year Schedule of Debt Maturities
- At
December 31, 2016
, debt maturities for
2017
through
2021
were as follows (in millions):
|
2017
|
2018
|
2019
|
2020
|
2021
|
|||||||||||||||
|
IPL
|
|
$—
|
|
|
$350
|
|
|
$—
|
|
|
$200
|
|
|
$—
|
|
||||
|
WPL
|
—
|
|
—
|
|
250
|
|
150
|
|
—
|
|
|||||||||
|
AEF
|
5
|
|
506
|
|
6
|
|
7
|
|
8
|
|
|||||||||
|
Alliant Energy
|
|
$5
|
|
|
$856
|
|
|
$256
|
|
|
$357
|
|
|
$8
|
|
||||
98
Fair Value of Long-term Debt
- Refer to
Note 14
for information on the fair value of long-term debt outstanding.
|
2017
|
2018
|
2019
|
2020
|
2021
|
Thereafter
|
Total
|
|||||||||||||||||||||
|
Alliant Energy
|
|
$6
|
|
|
$6
|
|
|
$2
|
|
|
$2
|
|
|
$1
|
|
|
$15
|
|
|
$32
|
|
||||||
|
IPL
|
3
|
|
2
|
|
1
|
|
1
|
|
1
|
|
10
|
|
18
|
|
|||||||||||||
|
WPL
|
3
|
|
4
|
|
—
|
|
—
|
|
—
|
|
—
|
|
7
|
|
|||||||||||||
WPL
-
In 2005, WPL entered into a
20
-year agreement with AEF’s Non-regulated Generation business to lease Sheboygan Falls, with an option for
two
lease renewal periods thereafter. The lease became effective in 2005 when Sheboygan Falls began commercial operation. WPL is responsible for the operation of Sheboygan Falls and has exclusive rights to its output, and the PSCW approved this affiliated lease agreement in 2005. The capital lease asset is amortized using the straight-line method over the
20
-year lease term. WPL’s retail and wholesale rates include recovery of the Sheboygan Falls lease payments. Sheboygan Falls lease expenses were included in WPL’s income statements as follows (in millions):
|
2016
|
2015
|
2014
|
|||||||||
|
Interest expense
|
|
$9.3
|
|
|
$9.9
|
|
|
$10.4
|
|
||
|
Depreciation and amortization
|
6.2
|
|
6.2
|
|
6.2
|
|
|||||
|
|
$15.5
|
|
|
$16.1
|
|
|
$16.6
|
|
|||
At
December 31, 2016
, WPL’s estimated future minimum capital lease payments for Sheboygan Falls were as follows (in millions):
|
2017
|
2018
|
2019
|
2020
|
2021
|
Thereafter
|
Total
|
Less: amount representing interest
|
Present value of minimum capital lease payments
|
|||||||||
|
Sheboygan Falls
|
$15
|
$15
|
$15
|
$15
|
$15
|
$53
|
$128
|
$44
|
$84
|
||||||||
Income Tax Expense (Benefit)
-
The components of “Income tax expense (benefit)” in the income statements were as follows (in millions):
|
Alliant Energy
|
IPL
|
WPL
|
|||||||||||||||||||||||||||||||||
|
2016
|
2015
|
2014
|
2016
|
2015
|
2014
|
2016
|
2015
|
2014
|
|||||||||||||||||||||||||||
|
Current tax expense (benefit):
|
|||||||||||||||||||||||||||||||||||
|
Federal
|
|
$1.8
|
|
|
$2.0
|
|
|
$36.6
|
|
|
($12.8
|
)
|
|
($14.1
|
)
|
|
$8.9
|
|
|
($22.3
|
)
|
|
$4.7
|
|
|
$2.0
|
|
||||||||
|
State
|
17.2
|
|
3.2
|
|
9.3
|
|
15.5
|
|
11.5
|
|
10.4
|
|
1.1
|
|
0.6
|
|
0.8
|
|
|||||||||||||||||
|
IPL’s tax benefit riders
|
(44.2
|
)
|
(49.0
|
)
|
(56.7
|
)
|
(44.2
|
)
|
(49.0
|
)
|
(56.7
|
)
|
—
|
|
—
|
|
—
|
|
|||||||||||||||||
|
Deferred tax expense (benefit):
|
|||||||||||||||||||||||||||||||||||
|
Federal
|
112.8
|
|
120.8
|
|
83.5
|
|
59.1
|
|
40.7
|
|
10.8
|
|
112.3
|
|
76.8
|
|
81.1
|
|
|||||||||||||||||
|
State
|
4.9
|
|
27.9
|
|
4.6
|
|
(9.0
|
)
|
3.3
|
|
(7.9
|
)
|
20.8
|
|
20.2
|
|
20.0
|
|
|||||||||||||||||
|
Production tax credits
|
(31.8
|
)
|
(33.1
|
)
|
(31.3
|
)
|
(14.0
|
)
|
(14.5
|
)
|
(13.8
|
)
|
(17.8
|
)
|
(18.6
|
)
|
(17.5
|
)
|
|||||||||||||||||
|
Investment tax credits
|
(1.3
|
)
|
(1.4
|
)
|
(1.6
|
)
|
(0.5
|
)
|
(0.6
|
)
|
(0.6
|
)
|
(0.8
|
)
|
(0.8
|
)
|
(1.0
|
)
|
|||||||||||||||||
|
Provision recorded as a change in accrued interest
|
—
|
|
—
|
|
(0.1
|
)
|
—
|
|
—
|
|
—
|
|
—
|
|
—
|
|
(0.1
|
)
|
|||||||||||||||||
|
|
$59.4
|
|
|
$70.4
|
|
|
$44.3
|
|
|
($5.9
|
)
|
|
($22.7
|
)
|
|
($48.9
|
)
|
|
$93.3
|
|
|
$82.9
|
|
|
$85.3
|
|
|||||||||
99
Income Tax Rates
-
The overall income tax rates shown in the following table were computed by dividing income tax expense (benefit) by income from continuing operations before income taxes.
|
Alliant Energy
|
IPL
|
WPL
|
||||||||||||||||||||||||
|
2016
|
2015
|
2014
|
2016
|
2015
|
2014
|
2016
|
2015
|
2014
|
||||||||||||||||||
|
Statutory federal income tax rate
|
35.0
|
%
|
35.0
|
%
|
35.0
|
%
|
35.0
|
%
|
35.0
|
%
|
35.0
|
%
|
35.0
|
%
|
35.0
|
%
|
35.0
|
%
|
||||||||
|
State income taxes, net of federal benefits
|
5.4
|
|
5.2
|
|
5.4
|
|
6.4
|
|
6.2
|
|
6.1
|
|
5.1
|
|
5.1
|
|
5.1
|
|
||||||||
|
IPL’s tax benefit riders
|
(10.0
|
)
|
(10.6
|
)
|
(12.9
|
)
|
(20.1
|
)
|
(28.3
|
)
|
(39.6
|
)
|
—
|
|
—
|
|
—
|
|
||||||||
|
Effect of rate-making on property-related differences
|
(8.5
|
)
|
(6.8
|
)
|
(7.5
|
)
|
(16.2
|
)
|
(17.2
|
)
|
(21.9
|
)
|
(0.7
|
)
|
(0.5
|
)
|
(0.7
|
)
|
||||||||
|
Production tax credits
|
(7.2
|
)
|
(7.2
|
)
|
(7.1
|
)
|
(6.3
|
)
|
(8.3
|
)
|
(9.6
|
)
|
(6.2
|
)
|
(7.1
|
)
|
(6.6
|
)
|
||||||||
|
Adjustment of prior period taxes
|
(0.8
|
)
|
0.8
|
|
(1.3
|
)
|
(1.2
|
)
|
0.7
|
|
(3.0
|
)
|
(0.1
|
)
|
0.1
|
|
—
|
|
||||||||
|
Other items, net
|
(0.5
|
)
|
(1.1
|
)
|
(1.5
|
)
|
(0.3
|
)
|
(1.2
|
)
|
(1.2
|
)
|
(0.5
|
)
|
(0.8
|
)
|
(0.8
|
)
|
||||||||
|
Overall income tax rate
|
13.4
|
%
|
15.3
|
%
|
10.1
|
%
|
(2.7
|
%)
|
(13.1
|
%)
|
(34.2
|
%)
|
32.6
|
%
|
31.8
|
%
|
32.0
|
%
|
||||||||
Deferred Tax Assets and Liabilities
-
The deferred tax assets and liabilities included on the balance sheets at December 31 arise from the following temporary differences (in millions):
|
Alliant Energy
|
IPL
|
WPL
|
|||||||||||||||||||||
|
2016
|
2015
|
2016
|
2015
|
2016
|
2015
|
||||||||||||||||||
|
Deferred tax liabilities:
|
|||||||||||||||||||||||
|
Property
|
|
$2,919.0
|
|
|
$2,762.9
|
|
|
$1,677.0
|
|
|
$1,587.8
|
|
|
$1,124.5
|
|
|
$1,027.0
|
|
|||||
|
Investment in ATC
|
153.1
|
|
138.1
|
|
—
|
|
—
|
|
—
|
|
138.9
|
|
|||||||||||
|
Other
|
95.3
|
|
157.3
|
|
71.4
|
|
87.8
|
|
59.1
|
|
67.9
|
|
|||||||||||
|
Total deferred tax liabilities
|
3,167.4
|
|
3,058.3
|
|
1,748.4
|
|
1,675.6
|
|
1,183.6
|
|
1,233.8
|
|
|||||||||||
|
Deferred tax assets:
|
|||||||||||||||||||||||
|
Federal credit carryforwards
|
268.4
|
|
236.4
|
|
95.9
|
|
81.7
|
|
112.9
|
|
95.5
|
|
|||||||||||
|
Net operating losses carryforwards - federal
|
173.3
|
|
250.9
|
|
69.6
|
|
113.1
|
|
75.4
|
|
105.1
|
|
|||||||||||
|
Regulatory liability - IPL’s tax benefit riders
|
34.7
|
|
66.1
|
|
34.7
|
|
66.1
|
|
—
|
|
—
|
|
|||||||||||
|
Net operating losses carryforwards - state
|
32.9
|
|
38.3
|
|
0.6
|
|
1.1
|
|
0.1
|
|
3.6
|
|
|||||||||||
|
Other
|
87.9
|
|
85.4
|
|
35.8
|
|
35.6
|
|
23.6
|
|
24.2
|
|
|||||||||||
|
Total deferred tax assets
|
597.2
|
|
677.1
|
|
236.6
|
|
297.6
|
|
212.0
|
|
228.4
|
|
|||||||||||
|
Total deferred tax liabilities, net
|
|
$2,570.2
|
|
|
$2,381.2
|
|
|
$1,511.8
|
|
|
$1,378.0
|
|
|
$971.6
|
|
|
$1,005.4
|
|
|||||
Property -
Property-related differences were primarily related to accelerated depreciation, including bonus depreciation. In 2015, the PATH Act was enacted. The most significant provisions of the PATH Act for Alliant Energy, IPL and WPL relate to the extension of bonus depreciation deductions for certain expenditures for property incurred through December 31, 2019 and placed in service prior to December 31, 2020. Alliant Energy currently estimates its total bonus depreciation deductions to be claimed on its U.S. federal income tax return for calendar year 2016 will be approximately
$350 million
(
$100 million
for IPL and
$200 million
for WPL).
Carryforwards -
At
December 31, 2016
, carryforwards and expiration dates were estimated as follows (in millions):
|
Range of Expiration Dates
|
Alliant Energy
|
IPL
|
WPL
|
||||||||||
|
Federal net operating losses
|
2030-2034
|
|
$506
|
|
|
$206
|
|
|
$215
|
|
|||
|
State net operating losses
|
2018-2034
|
673
|
|
12
|
|
2
|
|
||||||
|
Federal tax credits
|
2022-2036
|
274
|
|
100
|
|
113
|
|
||||||
Uncertain Tax Positions
-
At
December 31, 2016
,
2015
and
2014
, there were no uncertain tax positions or penalties accrued related to uncertain tax positions, and interest accrued and tax positions favorably impacting future effective tax rates for continuing operations were not material. As of
December 31, 2016
, no material changes to unrecognized tax benefits are expected during the next 12 months.
Open tax years -
Tax years that remain subject to the statute of limitations in the major jurisdictions for each of Alliant Energy, IPL and WPL are as follows:
|
Consolidated federal income tax returns (a)
|
2013
|
-
|
2015
|
|
Consolidated Iowa income tax returns (b)
|
2013
|
-
|
2015
|
|
Wisconsin combined tax returns (c)
|
2012
|
-
|
2015
|
100
|
(a)
|
The federal tax returns for 2013 and 2014 are effectively settled as a result of participation in the IRS Compliance Assurance Program, which allows Alliant Energy and the IRS to work together to resolve issues related to Alliant Energy’s current tax year before filing its federal income tax return. The statute of limitations for these federal tax returns expires
three
years from each filing date.
|
|
(b)
|
The statute of limitations for these Iowa tax returns expires
three
years from each filing date.
|
|
(c)
|
The statute of limitations for these Wisconsin combined tax returns expires
four
years from each filing date.
|
IPL and WPL account for their participation in Alliant Energy and Corporate Services sponsored plans as multiple-employer plans. In IPL’s and WPL’s tables below, the defined benefit pension plans amounts represent those respective amounts for their bargaining unit employees covered under the qualified plans that they sponsor, as well as amounts directly assigned to them related to their current and former non-bargaining employees who are participants in the Alliant Energy and Corporate Services sponsored qualified and non-qualified defined benefit pension plans. In IPL’s and WPL’s tables below, the OPEB plans amounts represent respective amounts for their employees, as well as amounts directly assigned to them related to their current and former non-bargaining employees who are participants in the Corporate Services sponsored OPEB plan.
Assumptions
- The assumptions for defined benefit pension and OPEB plans at the measurement date of December 31 were as follows:
|
Defined Benefit Pension Plans
|
OPEB Plans
|
|||||||||||||||||||
|
Alliant Energy
|
2016
|
2015
|
2014
|
2016
|
2015
|
2014
|
||||||||||||||
|
Discount rate for benefit obligations
|
4.19%
|
4.47%
|
4.18%
|
3.98%
|
4.30%
|
3.97%
|
||||||||||||||
|
Discount rate for net periodic cost
|
4.47%
|
4.18%
|
4.97%
|
4.30%
|
3.97%
|
4.59%
|
||||||||||||||
|
Expected rate of return on plan assets
|
7.60%
|
7.60%
|
7.60%
|
6.30%
|
6.20%
|
7.40%
|
||||||||||||||
|
Rate of compensation increase
|
3.65
|
%
|
-
|
4.50%
|
3.65
|
%
|
-
|
4.50%
|
3.50
|
%
|
-
|
4.50%
|
N/A
|
N/A
|
N/A
|
|||||
|
Medical cost trend on covered charges:
|
||||||||||||||||||||
|
Initial trend rate (end of year)
|
N/A
|
N/A
|
N/A
|
7.00%
|
7.25%
|
6.75%
|
||||||||||||||
|
Ultimate trend rate
|
N/A
|
N/A
|
N/A
|
5.00%
|
5.00%
|
5.00%
|
||||||||||||||
|
Qualified Defined Benefit Pension Plan
|
OPEB Plans
|
||||||||||
|
IPL
|
2016
|
2015
|
2014
|
2016
|
2015
|
2014
|
|||||
|
Discount rate for benefit obligations
|
4.22%
|
4.50%
|
4.20%
|
3.95%
|
4.28%
|
3.94%
|
|||||
|
Discount rate for net periodic cost
|
4.50%
|
4.20%
|
5.05%
|
4.28%
|
3.94%
|
4.55%
|
|||||
|
Expected rate of return on plan assets
|
7.60%
|
7.60%
|
7.60%
|
6.60%
|
6.60%
|
7.60%
|
|||||
|
Rate of compensation increase
|
3.65%
|
3.65%
|
3.50%
|
N/A
|
N/A
|
N/A
|
|||||
|
Medical cost trend on covered charges:
|
|||||||||||
|
Initial trend rate (end of year)
|
N/A
|
N/A
|
N/A
|
7.00%
|
7.25%
|
6.75%
|
|||||
|
Ultimate trend rate
|
N/A
|
N/A
|
N/A
|
5.00%
|
5.00%
|
5.00%
|
|||||
|
Qualified Defined Benefit Pension Plan
|
OPEB Plans
|
||||||||||
|
WPL
|
2016
|
2015
|
2014
|
2016
|
2015
|
2014
|
|||||
|
Discount rate for benefit obligations
|
4.23%
|
4.51%
|
4.20%
|
3.96%
|
4.28%
|
3.96%
|
|||||
|
Discount rate for net periodic cost
|
4.51%
|
4.20%
|
5.05%
|
4.28%
|
3.96%
|
4.56%
|
|||||
|
Expected rate of return on plan assets
|
7.60%
|
7.60%
|
7.60%
|
4.70%
|
4.60%
|
7.30%
|
|||||
|
Rate of compensation increase
|
3.65%
|
3.65%
|
3.50%
|
N/A
|
N/A
|
N/A
|
|||||
|
Medical cost trend on covered charges:
|
|||||||||||
|
Initial trend rate (end of year)
|
N/A
|
N/A
|
N/A
|
7.00%
|
7.25%
|
6.75%
|
|||||
|
Ultimate trend rate
|
N/A
|
N/A
|
N/A
|
5.00%
|
5.00%
|
5.00%
|
|||||
101
Expected rate of return on plan assets -
The expected rate of return on plan assets is determined by analysis of projected asset class returns based on the target asset class allocations. A forward-looking building blocks approach is used, and historical returns, survey information and capital market information are reviewed to support the expected rate of return on plan assets assumption. Refer to “Investment Policy and Strategy for Plan Assets” below for additional information related to investment policy, and strategy and mix of assets for the pension and OPEB plans.
Life Expectancy -
The life expectancy assumption is used in determining the benefit obligation and net periodic benefit cost for defined benefit pension and OPEB plans. This assumption was updated to utilize mortality tables that were released in 2014 by the Society of Actuaries and updated in 2015 and 2016.
Net Periodic Benefit Costs (Credits)
-
The components of net periodic benefit costs (credits) for sponsored defined benefit pension and OPEB plans are included in the tables below (in millions). Net periodic benefit costs are primarily included in “Other operation and maintenance” in the income statements.
|
Alliant Energy
|
Defined Benefit Pension Plans
|
OPEB Plans
|
|||||||||||||||||||||
|
2016
|
2015
|
2014
|
2016
|
2015
|
2014
|
||||||||||||||||||
|
Service cost
|
|
$12.6
|
|
|
$15.9
|
|
|
$13.1
|
|
|
$5.3
|
|
|
$5.5
|
|
|
$5.2
|
|
|||||
|
Interest cost
|
53.0
|
|
53.6
|
|
54.1
|
|
9.4
|
|
9.1
|
|
9.5
|
|
|||||||||||
|
Expected return on plan assets (a)
|
(65.5
|
)
|
(75.0
|
)
|
(74.9
|
)
|
(6.1
|
)
|
(8.4
|
)
|
(8.3
|
)
|
|||||||||||
|
Amortization of prior service cost (credit) (b)
|
(0.3
|
)
|
(0.2
|
)
|
—
|
|
(4.1
|
)
|
(11.3
|
)
|
(11.9
|
)
|
|||||||||||
|
Amortization of actuarial loss (c)
|
37.4
|
|
35.4
|
|
19.5
|
|
4.7
|
|
4.8
|
|
2.4
|
|
|||||||||||
|
Additional benefit costs
|
—
|
|
0.5
|
|
—
|
|
—
|
|
—
|
|
—
|
|
|||||||||||
|
|
$37.2
|
|
|
$30.2
|
|
|
$11.8
|
|
|
$9.2
|
|
|
($0.3
|
)
|
|
($3.1
|
)
|
||||||
|
IPL
|
Defined Benefit Pension Plans
|
OPEB Plans
|
|||||||||||||||||||||
|
2016
|
2015
|
2014
|
2016
|
2015
|
2014
|
||||||||||||||||||
|
Service cost
|
|
$7.5
|
|
|
$8.8
|
|
|
$7.2
|
|
|
$2.3
|
|
|
$2.4
|
|
|
$2.4
|
|
|||||
|
Interest cost
|
24.5
|
|
25.0
|
|
25.1
|
|
3.8
|
|
3.8
|
|
3.9
|
|
|||||||||||
|
Expected return on plan assets (a)
|
(30.9
|
)
|
(35.8
|
)
|
(35.7
|
)
|
(4.3
|
)
|
(5.7
|
)
|
(5.8
|
)
|
|||||||||||
|
Amortization of prior service cost (credit) (b)
|
(0.2
|
)
|
(0.1
|
)
|
—
|
|
(2.6
|
)
|
(6.1
|
)
|
(6.3
|
)
|
|||||||||||
|
Amortization of actuarial loss (c)
|
16.5
|
|
15.3
|
|
8.0
|
|
2.6
|
|
2.3
|
|
1.1
|
|
|||||||||||
|
|
$17.4
|
|
|
$13.2
|
|
|
$4.6
|
|
|
$1.8
|
|
|
($3.3
|
)
|
|
($4.7
|
)
|
||||||
|
WPL
|
Defined Benefit Pension Plans
|
OPEB Plans
|
|||||||||||||||||||||
|
2016
|
2015
|
2014
|
2016
|
2015
|
2014
|
||||||||||||||||||
|
Service cost
|
|
$4.9
|
|
|
$5.8
|
|
|
$4.9
|
|
|
$2.0
|
|
|
$2.1
|
|
|
$2.0
|
|
|||||
|
Interest cost
|
22.3
|
|
22.6
|
|
22.6
|
|
3.8
|
|
3.7
|
|
3.8
|
|
|||||||||||
|
Expected return on plan assets (a)
|
(28.3
|
)
|
(32.4
|
)
|
(32.4
|
)
|
(0.8
|
)
|
(1.5
|
)
|
(1.3
|
)
|
|||||||||||
|
Amortization of prior service cost (credit) (b)
|
0.2
|
|
0.2
|
|
0.3
|
|
(0.9
|
)
|
(3.5
|
)
|
(3.9
|
)
|
|||||||||||
|
Amortization of actuarial loss (c)
|
17.6
|
|
16.8
|
|
9.2
|
|
1.8
|
|
2.2
|
|
1.3
|
|
|||||||||||
|
Additional benefit costs
|
—
|
|
0.5
|
|
—
|
|
—
|
|
—
|
|
—
|
|
|||||||||||
|
|
$16.7
|
|
|
$13.5
|
|
|
$4.6
|
|
|
$5.9
|
|
|
$3.0
|
|
|
$1.9
|
|
||||||
|
(a)
|
The expected return on plan assets is based on the expected rate of return on plan assets and the fair value approach to the market-related value of plan assets.
|
|
(b)
|
Unrecognized prior service costs (credits) for the OPEB plans are amortized over the average future service period to full eligibility of the participants of each plan.
|
|
(c)
|
Unrecognized net actuarial gains or losses in excess of 10% of the greater of the plans’ benefit obligations or assets are amortized over the average future service lives of plan participants, except for the Alliant Energy Cash Balance Pension Plan where gains or losses outside the 10% threshold are amortized over the time period the participants are expected to receive benefits.
|
102
The estimated amortization from “Regulatory assets” and “Regulatory liabilities” on the balance sheets and AOCL on Alliant Energy’s balance sheet into net periodic benefit cost in
2017
is as follows (in millions):
|
Alliant Energy
|
IPL
|
WPL
|
|||||||||||||||||||||
|
Defined Benefit
|
Defined Benefit
|
Defined Benefit
|
|||||||||||||||||||||
|
Pension Plans
|
OPEB Plans
|
Pension Plans
|
OPEB Plans
|
Pension Plans
|
OPEB Plans
|
||||||||||||||||||
|
Actuarial loss
|
|
$37.5
|
|
|
$3.8
|
|
|
$16.1
|
|
|
$2.0
|
|
|
$18.5
|
|
|
$1.6
|
|
|||||
|
Prior service cost (credit)
|
(0.4
|
)
|
(0.2
|
)
|
(0.2
|
)
|
—
|
|
0.1
|
|
(0.2
|
)
|
|||||||||||
|
|
$37.1
|
|
|
$3.6
|
|
|
$15.9
|
|
|
$2.0
|
|
|
$18.6
|
|
|
$1.4
|
|
||||||
Benefit Plan Assets and Obligations
- A reconciliation of the funded status of Alliant Energy’s qualified and non-qualified defined benefit pension and OPEB plans to the amounts recognized on Alliant Energy’s balance sheets at December 31 was as follows (in millions):
|
Defined Benefit
|
|||||||||||||||
|
Pension Plans
|
OPEB Plans
|
||||||||||||||
|
Alliant Energy
|
2016
|
2015
|
2016
|
2015
|
|||||||||||
|
Change in benefit obligation:
|
|||||||||||||||
|
Net benefit obligation at January 1
|
|
$1,206.3
|
|
|
$1,301.5
|
|
|
$221.4
|
|
|
$231.1
|
|
|||
|
Service cost
|
12.6
|
|
15.9
|
|
5.3
|
|
5.5
|
|
|||||||
|
Interest cost
|
53.0
|
|
53.6
|
|
9.4
|
|
9.1
|
|
|||||||
|
Plan participants’ contributions
|
—
|
|
—
|
|
2.4
|
|
3.1
|
|
|||||||
|
Plan amendments
|
—
|
|
—
|
|
—
|
|
(0.3
|
)
|
|||||||
|
Additional benefit costs
|
—
|
|
0.5
|
|
—
|
|
—
|
|
|||||||
|
Actuarial (gain) loss
|
48.3
|
|
(70.1
|
)
|
(0.3
|
)
|
(9.4
|
)
|
|||||||
|
Gross benefits paid
|
(75.9
|
)
|
(95.1
|
)
|
(18.1
|
)
|
(17.7
|
)
|
|||||||
|
Net benefit obligation at December 31
|
1,244.3
|
|
1,206.3
|
|
220.1
|
|
221.4
|
|
|||||||
|
Change in plan assets:
|
|||||||||||||||
|
Fair value of plan assets at January 1
|
895.0
|
|
1,018.1
|
|
106.9
|
|
121.6
|
|
|||||||
|
Actual return on plan assets
|
74.3
|
|
(30.2
|
)
|
8.2
|
|
(4.9
|
)
|
|||||||
|
Employer contributions
|
2.3
|
|
2.2
|
|
6.4
|
|
4.8
|
|
|||||||
|
Plan participants’ contributions
|
—
|
|
—
|
|
2.4
|
|
3.1
|
|
|||||||
|
Gross benefits paid
|
(75.9
|
)
|
(95.1
|
)
|
(18.1
|
)
|
(17.7
|
)
|
|||||||
|
Fair value of plan assets at December 31
|
895.7
|
|
895.0
|
|
105.8
|
|
106.9
|
|
|||||||
|
Under funded status at December 31
|
|
($348.6
|
)
|
|
($311.3
|
)
|
|
($114.3
|
)
|
|
($114.5
|
)
|
|||
|
Defined Benefit
|
|||||||||||||||
|
Pension Plans
|
OPEB Plans
|
||||||||||||||
|
Alliant Energy
|
2016
|
2015
|
2016
|
2015
|
|||||||||||
|
Amounts recognized on the balance sheets consist of:
|
|||||||||||||||
|
Non-current assets
|
|
$—
|
|
|
$—
|
|
|
$3.2
|
|
|
$3.0
|
|
|||
|
Other current liabilities
|
(6.5
|
)
|
(2.6
|
)
|
(8.6
|
)
|
(6.2
|
)
|
|||||||
|
Pension and other benefit obligations
|
(342.1
|
)
|
(308.7
|
)
|
(108.9
|
)
|
(111.3
|
)
|
|||||||
|
Net amounts recognized at December 31
|
|
($348.6
|
)
|
|
($311.3
|
)
|
|
($114.3
|
)
|
|
($114.5
|
)
|
|||
|
Amounts recognized in Regulatory Assets (refer to
Note 2
for details) and AOCL (refer to
Alliant Energy’s common equity statements
for details) consist of:
|
|||||||||||||||
|
Net actuarial loss
|
|
$535.1
|
|
|
$533.1
|
|
|
$52.6
|
|
|
$59.8
|
|
|||
|
Prior service credit
|
(6.9
|
)
|
(7.2
|
)
|
(1.5
|
)
|
(5.6
|
)
|
|||||||
|
|
$528.2
|
|
|
$525.9
|
|
|
$51.1
|
|
|
$54.2
|
|
||||
103
A reconciliation of the funded status of IPL’s qualified and non-qualified defined benefit pension and OPEB plans to the amounts recognized on IPL’s balance sheets at December 31 was as follows (in millions):
|
Defined Benefit
|
|||||||||||||||
|
Pension Plans
|
OPEB Plans
|
||||||||||||||
|
IPL
|
2016
|
2015
|
2016
|
2015
|
|||||||||||
|
Change in benefit obligation:
|
|||||||||||||||
|
Net benefit obligation at January 1
|
|
$556.1
|
|
|
$603.1
|
|
|
$91.3
|
|
|
$96.4
|
|
|||
|
Service cost
|
7.5
|
|
8.8
|
|
2.3
|
|
2.4
|
|
|||||||
|
Interest cost
|
24.5
|
|
25.0
|
|
3.8
|
|
3.8
|
|
|||||||
|
Plan participants’ contributions
|
—
|
|
—
|
|
0.9
|
|
1.0
|
|
|||||||
|
Plan amendments
|
—
|
|
—
|
|
—
|
|
(0.1
|
)
|
|||||||
|
Actuarial (gain) loss
|
19.1
|
|
(32.3
|
)
|
(0.7
|
)
|
(4.6
|
)
|
|||||||
|
Gross benefits paid
|
(36.8
|
)
|
(48.5
|
)
|
(7.5
|
)
|
(7.6
|
)
|
|||||||
|
Net benefit obligation at December 31
|
570.4
|
|
556.1
|
|
90.1
|
|
91.3
|
|
|||||||
|
Change in plan assets:
|
|||||||||||||||
|
Fair value of plan assets at January 1
|
422.7
|
|
484.7
|
|
69.2
|
|
78.7
|
|
|||||||
|
Actual return on plan assets
|
35.3
|
|
(14.3
|
)
|
5.3
|
|
(3.1
|
)
|
|||||||
|
Employer contributions
|
0.8
|
|
0.8
|
|
0.3
|
|
0.2
|
|
|||||||
|
Plan participants’ contributions
|
—
|
|
—
|
|
0.9
|
|
1.0
|
|
|||||||
|
Gross benefits paid
|
(36.8
|
)
|
(48.5
|
)
|
(7.5
|
)
|
(7.6
|
)
|
|||||||
|
Fair value of plan assets at December 31
|
422.0
|
|
422.7
|
|
68.2
|
|
69.2
|
|
|||||||
|
Under funded status at December 31
|
|
($148.4
|
)
|
|
($133.4
|
)
|
|
($21.9
|
)
|
|
($22.1
|
)
|
|||
|
Defined Benefit
|
|||||||||||||||
|
Pension Plans
|
OPEB Plans
|
||||||||||||||
|
IPL
|
2016
|
2015
|
2016
|
2015
|
|||||||||||
|
Amounts recognized on the balance sheets consist of:
|
|||||||||||||||
|
Non-current assets
|
|
$—
|
|
|
$—
|
|
|
$0.4
|
|
|
$—
|
|
|||
|
Other current liabilities
|
(0.7
|
)
|
(0.8
|
)
|
(1.9
|
)
|
—
|
|
|||||||
|
Pension and other benefit obligations
|
(147.7
|
)
|
(132.6
|
)
|
(20.4
|
)
|
(22.1
|
)
|
|||||||
|
Net amounts recognized at December 31
|
|
($148.4
|
)
|
|
($133.4
|
)
|
|
($21.9
|
)
|
|
($22.1
|
)
|
|||
|
Amounts recognized in Regulatory Assets consist of (refer to
Note 2
for details):
|
|||||||||||||||
|
Net actuarial loss
|
|
$233.6
|
|
|
$235.5
|
|
|
$25.4
|
|
|
$29.8
|
|
|||
|
Prior service credit
|
(2.3
|
)
|
(2.5
|
)
|
—
|
|
(2.7
|
)
|
|||||||
|
|
$231.3
|
|
|
$233.0
|
|
|
$25.4
|
|
|
$27.1
|
|
||||
104
A reconciliation of the funded status of WPL’s qualified and non-qualified defined benefit pension and OPEB plans to the amounts recognized on WPL’s balance sheets at December 31 was as follows (in millions):
|
Defined Benefit
|
|||||||||||||||
|
Pension Plans
|
OPEB Plans
|
||||||||||||||
|
WPL
|
2016
|
2015
|
2016
|
2015
|
|||||||||||
|
Change in benefit obligation:
|
|||||||||||||||
|
Net benefit obligation at January 1
|
|
$505.9
|
|
|
$547.6
|
|
|
$89.7
|
|
|
$94.0
|
|
|||
|
Service cost
|
4.9
|
|
5.8
|
|
2.0
|
|
2.1
|
|
|||||||
|
Interest cost
|
22.3
|
|
22.6
|
|
3.8
|
|
3.7
|
|
|||||||
|
Plan participants’ contributions
|
—
|
|
—
|
|
1.2
|
|
1.6
|
|
|||||||
|
Plan amendments
|
—
|
|
—
|
|
—
|
|
(0.2
|
)
|
|||||||
|
Additional benefit costs
|
—
|
|
0.5
|
|
—
|
|
—
|
|
|||||||
|
Actuarial (gain) loss
|
25.7
|
|
(30.0
|
)
|
0.5
|
|
(3.5
|
)
|
|||||||
|
Gross benefits paid
|
(29.6
|
)
|
(40.6
|
)
|
(8.3
|
)
|
(8.0
|
)
|
|||||||
|
Net benefit obligation at December 31
|
529.2
|
|
505.9
|
|
88.9
|
|
89.7
|
|
|||||||
|
Change in plan assets:
|
|||||||||||||||
|
Fair value of plan assets at January 1
|
386.8
|
|
440.3
|
|
18.7
|
|
21.8
|
|
|||||||
|
Actual return on plan assets
|
32.4
|
|
(13.0
|
)
|
1.2
|
|
(1.1
|
)
|
|||||||
|
Employer contributions
|
0.1
|
|
0.1
|
|
5.8
|
|
4.4
|
|
|||||||
|
Plan participants’ contributions
|
—
|
|
—
|
|
1.2
|
|
1.6
|
|
|||||||
|
Gross benefits paid
|
(29.6
|
)
|
(40.6
|
)
|
(8.3
|
)
|
(8.0
|
)
|
|||||||
|
Fair value of plan assets at December 31
|
389.7
|
|
386.8
|
|
18.6
|
|
18.7
|
|
|||||||
|
Under funded status at December 31
|
|
($139.5
|
)
|
|
($119.1
|
)
|
|
($70.3
|
)
|
|
($71.0
|
)
|
|||
|
Defined Benefit
|
|||||||||||||||
|
Pension Plans
|
OPEB Plans
|
||||||||||||||
|
WPL
|
2016
|
2015
|
2016
|
2015
|
|||||||||||
|
Amounts recognized on the balance sheets consist of:
|
|||||||||||||||
|
Non-current assets
|
|
$—
|
|
|
$—
|
|
|
$2.7
|
|
|
$3.0
|
|
|||
|
Other current liabilities
|
(0.1
|
)
|
(0.1
|
)
|
(6.4
|
)
|
(6.0
|
)
|
|||||||
|
Pension and other benefit obligations
|
(139.4
|
)
|
(119.0
|
)
|
(66.6
|
)
|
(68.0
|
)
|
|||||||
|
Net amounts recognized at December 31
|
|
($139.5
|
)
|
|
($119.1
|
)
|
|
($70.3
|
)
|
|
($71.0
|
)
|
|||
|
Amounts recognized in Regulatory Assets consist of (refer to
Note 2
for details):
|
|||||||||||||||
|
Net actuarial loss
|
|
$236.1
|
|
|
$232.1
|
|
|
$21.5
|
|
|
$23.3
|
|
|||
|
Prior service credit
|
(1.4
|
)
|
(1.2
|
)
|
(1.5
|
)
|
(2.4
|
)
|
|||||||
|
|
$234.7
|
|
|
$230.9
|
|
|
$20.0
|
|
|
$20.9
|
|
||||
Included in the following tables are accumulated benefit obligations, aggregate amounts applicable to defined benefit pension and OPEB plans with accumulated benefit obligations in excess of plan assets, as well as defined benefit pension plans with projected benefit obligations in excess of plan assets as of the December 31 measurement date (in millions):
|
Defined Benefit
|
|||||||||||||||
|
Pension Plans
|
OPEB Plans
|
||||||||||||||
|
Alliant Energy
|
2016
|
2015
|
2016
|
2015
|
|||||||||||
|
Accumulated benefit obligations
|
|
$1,201.5
|
|
|
$1,166.0
|
|
|
$220.1
|
|
|
$221.4
|
|
|||
|
Plans with accumulated benefit obligations in excess of plan assets:
|
|||||||||||||||
|
Accumulated benefit obligations
|
1,201.5
|
|
1,166.0
|
|
220.1
|
|
221.4
|
|
|||||||
|
Fair value of plan assets
|
895.7
|
|
895.0
|
|
105.8
|
|
106.9
|
|
|||||||
|
Plans with projected benefit obligations in excess of plan assets:
|
|||||||||||||||
|
Projected benefit obligations
|
1,244.3
|
|
1,206.3
|
|
N/A
|
|
N/A
|
|
|||||||
|
Fair value of plan assets
|
895.7
|
|
895.0
|
|
N/A
|
|
N/A
|
|
|||||||
105
|
Defined Benefit
|
|||||||||||||||
|
Pension Plans
|
OPEB Plans
|
||||||||||||||
|
IPL
|
2016
|
2015
|
2016
|
2015
|
|||||||||||
|
Accumulated benefit obligations
|
|
$546.7
|
|
|
$531.0
|
|
|
$90.1
|
|
|
$91.3
|
|
|||
|
Plans with accumulated benefit obligations in excess of plan assets:
|
|||||||||||||||
|
Accumulated benefit obligations
|
546.7
|
|
531.0
|
|
90.1
|
|
91.3
|
|
|||||||
|
Fair value of plan assets
|
422.0
|
|
422.7
|
|
68.2
|
|
69.2
|
|
|||||||
|
Plans with projected benefit obligations in excess of plan assets:
|
|||||||||||||||
|
Projected benefit obligations
|
570.4
|
|
556.1
|
|
N/A
|
|
N/A
|
|
|||||||
|
Fair value of plan assets
|
422.0
|
|
422.7
|
|
N/A
|
|
N/A
|
|
|||||||
|
Defined Benefit
|
|||||||||||||||
|
Pension Plans
|
OPEB Plans
|
||||||||||||||
|
WPL
|
2016
|
2015
|
2016
|
2015
|
|||||||||||
|
Accumulated benefit obligations
|
|
$513.2
|
|
|
$493.8
|
|
|
$88.9
|
|
|
$89.7
|
|
|||
|
Plans with accumulated benefit obligations in excess of plan assets:
|
|||||||||||||||
|
Accumulated benefit obligations
|
513.2
|
|
493.8
|
|
88.9
|
|
89.7
|
|
|||||||
|
Fair value of plan assets
|
389.7
|
|
386.8
|
|
18.6
|
|
18.7
|
|
|||||||
|
Plans with projected benefit obligations in excess of plan assets:
|
|||||||||||||||
|
Projected benefit obligations
|
529.2
|
|
505.9
|
|
N/A
|
|
N/A
|
|
|||||||
|
Fair value of plan assets
|
389.7
|
|
386.8
|
|
N/A
|
|
N/A
|
|
|||||||
In addition to the amounts recognized in regulatory assets in the above tables for IPL and WPL, regulatory assets were recognized for amounts associated with Corporate Services employees participating in other Alliant Energy sponsored benefit plans that were allocated to IPL and WPL at December 31 as follows (in millions):
|
IPL
|
WPL
|
||||||||||||||
|
2016
|
2015
|
2016
|
2015
|
||||||||||||
|
Regulatory assets
|
|
$37.3
|
|
|
$38.0
|
|
|
$30.0
|
|
|
$29.5
|
|
|||
Estimated Future Employer Contributions and Benefit Payments
-
Estimated funding for the qualified and non-qualified defined benefit pension and OPEB plans for
2017
is as follows (in millions):
|
Alliant Energy
|
IPL
|
WPL
|
|||||||||
|
Defined benefit pension plans (a)
|
|
$6.5
|
|
|
$0.7
|
|
|
$0.1
|
|
||
|
OPEB plans
|
8.7
|
|
2.0
|
|
6.4
|
|
|||||
|
(a)
|
Alliant Energy sponsors several non-qualified defined benefit pension plans that cover certain current and former key employees of IPL and WPL. Alliant Energy allocates pension costs to IPL and WPL for these plans. In addition, IPL and WPL amounts reflect funding for their non-bargaining employees who are participants in the Alliant Energy and Corporate Services sponsored qualified and non-qualified defined benefit pension plans.
|
Expected benefit payments for the qualified and non-qualified defined benefit plans, which reflect expected future service, as appropriate, are as follows (in millions):
|
Alliant Energy
|
2017
|
2018
|
2019
|
2020
|
2021
|
2022 - 2026
|
|||||||||||||||||
|
Defined benefit pension benefits
|
|
$74.8
|
|
|
$73.2
|
|
|
$75.5
|
|
|
$77.6
|
|
|
$79.9
|
|
|
$405.9
|
|
|||||
|
OPEB
|
18.6
|
|
18.5
|
|
18.2
|
|
17.8
|
|
17.6
|
|
82.6
|
|
|||||||||||
|
|
$93.4
|
|
|
$91.7
|
|
|
$93.7
|
|
|
$95.4
|
|
|
$97.5
|
|
|
$488.5
|
|
||||||
|
IPL
|
2017
|
2018
|
2019
|
2020
|
2021
|
2022 - 2026
|
|||||||||||||||||
|
Defined benefit pension benefits
|
|
$34.0
|
|
|
$35.1
|
|
|
$35.0
|
|
|
$37.2
|
|
|
$37.9
|
|
|
$192.1
|
|
|||||
|
OPEB
|
7.7
|
|
7.6
|
|
7.4
|
|
7.4
|
|
7.2
|
|
34.0
|
|
|||||||||||
|
|
$41.7
|
|
|
$42.7
|
|
|
$42.4
|
|
|
$44.6
|
|
|
$45.1
|
|
|
$226.1
|
|
||||||
|
WPL
|
2017
|
2018
|
2019
|
2020
|
2021
|
2022 - 2026
|
|||||||||||||||||
|
Defined benefit pension benefits
|
|
$30.2
|
|
|
$30.9
|
|
|
$31.8
|
|
|
$32.5
|
|
|
$32.4
|
|
|
$167.1
|
|
|||||
|
OPEB
|
8.0
|
|
8.0
|
|
7.8
|
|
7.4
|
|
7.3
|
|
32.7
|
|
|||||||||||
|
|
$38.2
|
|
|
$38.9
|
|
|
$39.6
|
|
|
$39.9
|
|
|
$39.7
|
|
|
$199.8
|
|
||||||
106
Investment Policy and Strategy for Plan Assets
-
Investment policies and strategies employed with respect to assets of defined benefit pension and OPEB plans are to combine both preservation of principal and prudent and reasonable risk-taking to protect the integrity of plan assets, in order to meet the obligations to plan participants while minimizing benefit costs over the long term. It is recognized that risk and volatility are present with all types of investments. However, risk is mitigated at the total fund level through diversification by asset class including U.S. and international equity and fixed income exposure, global asset and risk parity strategies, the number of individual investments, and sector and industry limits. Global asset and risk parity strategies include investments in global equity, global debt, commodities and currencies.
Defined Benefit Pension Plan Assets -
For assets of defined benefit pension plans, the mix among asset classes is controlled by asset allocation targets. Historical performance results and future expectations suggest that equity securities will provide higher total investment returns than debt securities over a long-term investment horizon. Consistent with the goals of meeting obligations to plan participants and minimizing benefit costs over the long-term, the defined benefit pension plans have a long-term investment posture more heavily weighted towards equity holdings. The asset allocation is monitored regularly and appropriate steps are taken as needed to rebalance the assets within the prescribed ranges. An overlay management service is also used to help maintain target allocations and meet liquidity needs. The overlay manager is authorized to use derivative financial instruments to facilitate this service. For separately managed accounts, prohibited investment vehicles include, but may not be limited to, direct ownership of real estate, margin trading, oil and gas limited partnerships and securities of the managers’ firms or affiliate firms.
At
December 31, 2016
, the current target ranges and actual allocations for the defined benefit pension plan assets were as follows:
|
Target Range
|
Actual
|
|||||
|
Allocation
|
Allocation
|
|||||
|
Cash and equivalents
|
0
|
%
|
-
|
5%
|
3%
|
|
|
Equity securities - domestic
|
22
|
%
|
-
|
42%
|
30%
|
|
|
Equity securities - international
|
8
|
%
|
-
|
28%
|
17%
|
|
|
Global asset allocation securities
|
5
|
%
|
-
|
15%
|
10%
|
|
|
Risk parity allocation securities
|
5
|
%
|
-
|
15%
|
10%
|
|
|
Fixed income securities
|
20
|
%
|
-
|
40%
|
30%
|
|
Other Postretirement Benefits Plan Assets -
OPEB plan assets are comprised of specific assets within certain defined benefit pension plans (401(h) assets) as well as assets held in VEBA trusts. The investment policy and strategy of the 401(h) assets, except for the WPL 401(h) assets, mirrors those of the defined benefit pension plans, which are discussed above. For VEBA trusts with assets greater than
$5 million
and the WPL 401(h) assets, the mix among asset classes is controlled by allocation targets. The asset allocation is monitored regularly and appropriate steps are taken as needed to rebalance the assets within the prescribed ranges. Mutual funds are used to achieve the desired diversification. At
December 31, 2016
, the current target ranges and actual allocations for VEBA trusts with assets greater than
$5 million
and the WPL 401(h) assets were as follows:
|
Target Range
|
Actual
|
|||||
|
Allocation
|
Allocation
|
|||||
|
Cash and equivalents
|
0
|
%
|
-
|
15%
|
3%
|
|
|
Equity securities - domestic
|
0
|
%
|
-
|
45%
|
22%
|
|
|
Equity securities - international
|
0
|
%
|
-
|
21%
|
13%
|
|
|
Global asset allocation securities
|
5
|
%
|
-
|
40%
|
16%
|
|
|
Fixed income securities
|
10
|
%
|
-
|
70%
|
46%
|
|
Fair Value Measurements
-
Fair value measurement accounting establishes three levels of fair value hierarchy that prioritize the inputs to valuation techniques used to measure fair value. Refer to
Note 14
for discussion of levels within the fair value hierarchy. Level 1 items include investments in securities held in registered investment companies, treasury bills and directly held equity securities, which are valued at the closing price reported in the active market in which the securities are traded. Level 2 items include fixed income securities consisting of corporate and government bonds and agency obligations, which are valued at the closing price reported in the active market for similar assets in which the individual securities are traded or based on yields currently available on comparable securities of issuers with similar credit ratings. Certain investments that are measured at fair value using the net asset value practical expedient have not been classified in the fair value hierarchy. These fair value amounts are included in the tables below to reconcile the fair value hierarchy to the respective total plan assets.
107
At December 31, the fair values of Alliant Energy’s qualified and non-qualified defined benefit pension plan assets were as follows (in millions):
|
2016
|
2015
|
||||||||||||||||||||||||||||||
|
Fair
|
Level
|
Level
|
Level
|
Fair
|
Level
|
Level
|
Level
|
||||||||||||||||||||||||
|
Value
|
1
|
2
|
3
|
Value
|
1
|
2
|
3
|
||||||||||||||||||||||||
|
Cash and equivalents
|
|
$30.4
|
|
|
$5.0
|
|
|
$25.4
|
|
|
$—
|
|
|
$23.1
|
|
|
$—
|
|
|
$23.1
|
|
|
$—
|
|
|||||||
|
Equity securities - domestic
|
183.6
|
|
183.6
|
|
—
|
|
—
|
|
116.4
|
|
116.4
|
|
—
|
|
—
|
|
|||||||||||||||
|
Equity securities - international
|
97.4
|
|
97.4
|
|
—
|
|
—
|
|
93.9
|
|
93.9
|
|
—
|
|
—
|
|
|||||||||||||||
|
Global asset allocation securities
|
53.0
|
|
53.0
|
|
—
|
|
—
|
|
52.9
|
|
52.9
|
|
—
|
|
—
|
|
|||||||||||||||
|
Fixed income securities
|
125.4
|
|
53.6
|
|
71.8
|
|
—
|
|
—
|
|
—
|
|
—
|
|
—
|
|
|||||||||||||||
|
Total assets in fair value hierarchy
|
489.8
|
|
|
$392.6
|
|
|
$97.2
|
|
|
$—
|
|
286.3
|
|
|
$263.2
|
|
|
$23.1
|
|
|
$—
|
|
|||||||||
|
Assets measured at net asset value
|
405.9
|
|
608.5
|
|
|||||||||||||||||||||||||||
|
Accrued investment income
|
1.1
|
|
0.2
|
|
|||||||||||||||||||||||||||
|
Due to brokers, net (pending trades with brokers)
|
(1.1
|
)
|
—
|
|
|||||||||||||||||||||||||||
|
Total pension plan assets
|
|
$895.7
|
|
|
$895.0
|
|
|||||||||||||||||||||||||
At December 31, the fair values of IPL’s qualified and non-qualified defined benefit pension plan assets were as follows (in millions):
|
2016
|
2015
|
||||||||||||||||||||||||||||||
|
Fair
|
Level
|
Level
|
Level
|
Fair
|
Level
|
Level
|
Level
|
||||||||||||||||||||||||
|
Value
|
1
|
2
|
3
|
Value
|
1
|
2
|
3
|
||||||||||||||||||||||||
|
Cash and equivalents
|
|
$14.4
|
|
|
$2.4
|
|
|
$12.0
|
|
|
$—
|
|
|
$10.9
|
|
|
$—
|
|
|
$10.9
|
|
|
$—
|
|
|||||||
|
Equity securities - domestic
|
86.5
|
|
86.5
|
|
—
|
|
—
|
|
54.9
|
|
54.9
|
|
—
|
|
—
|
|
|||||||||||||||
|
Equity securities - international
|
45.9
|
|
45.9
|
|
—
|
|
—
|
|
44.4
|
|
44.4
|
|
—
|
|
—
|
|
|||||||||||||||
|
Global asset allocation securities
|
24.9
|
|
24.9
|
|
—
|
|
—
|
|
25.0
|
|
25.0
|
|
—
|
|
—
|
|
|||||||||||||||
|
Fixed income securities
|
59.1
|
|
25.3
|
|
33.8
|
|
—
|
|
—
|
|
—
|
|
—
|
|
—
|
|
|||||||||||||||
|
Total assets in fair value hierarchy
|
230.8
|
|
|
$185.0
|
|
|
$45.8
|
|
|
$—
|
|
135.2
|
|
|
$124.3
|
|
|
$10.9
|
|
|
$—
|
|
|||||||||
|
Assets measured at net asset value
|
191.2
|
|
287.4
|
|
|||||||||||||||||||||||||||
|
Accrued investment income
|
0.5
|
|
0.1
|
|
|||||||||||||||||||||||||||
|
Due to brokers, net (pending trades with brokers)
|
(0.5
|
)
|
—
|
|
|||||||||||||||||||||||||||
|
Total pension plan assets
|
|
$422.0
|
|
|
$422.7
|
|
|||||||||||||||||||||||||
At December 31, the fair values of WPL’s qualified and non-qualified defined benefit pension plan assets were as follows (in millions):
|
2016
|
2015
|
||||||||||||||||||||||||||||||
|
Fair
|
Level
|
Level
|
Level
|
Fair
|
Level
|
Level
|
Level
|
||||||||||||||||||||||||
|
Value
|
1
|
2
|
3
|
Value
|
1
|
2
|
3
|
||||||||||||||||||||||||
|
Cash and equivalents
|
|
$13.3
|
|
|
$2.2
|
|
|
$11.1
|
|
|
$—
|
|
|
$10.0
|
|
|
$—
|
|
|
$10.0
|
|
|
$—
|
|
|||||||
|
Equity securities - domestic
|
79.9
|
|
79.9
|
|
—
|
|
—
|
|
50.3
|
|
50.3
|
|
—
|
|
—
|
|
|||||||||||||||
|
Equity securities - international
|
42.4
|
|
42.4
|
|
—
|
|
—
|
|
40.6
|
|
40.6
|
|
—
|
|
—
|
|
|||||||||||||||
|
Global asset allocation securities
|
23.0
|
|
23.0
|
|
—
|
|
—
|
|
22.8
|
|
22.8
|
|
—
|
|
—
|
|
|||||||||||||||
|
Fixed income securities
|
54.5
|
|
23.3
|
|
31.2
|
|
—
|
|
—
|
|
—
|
|
—
|
|
—
|
|
|||||||||||||||
|
Total assets in fair value hierarchy
|
213.1
|
|
|
$170.8
|
|
|
$42.3
|
|
|
$—
|
|
123.7
|
|
|
$113.7
|
|
|
$10.0
|
|
|
$—
|
|
|||||||||
|
Assets measured at net asset value
|
176.6
|
|
263.0
|
|
|||||||||||||||||||||||||||
|
Accrued investment income
|
0.5
|
|
0.1
|
|
|||||||||||||||||||||||||||
|
Due to brokers, net (pending trades with brokers)
|
(0.5
|
)
|
—
|
|
|||||||||||||||||||||||||||
|
Total pension plan assets
|
|
$389.7
|
|
|
$386.8
|
|
|||||||||||||||||||||||||
108
At December 31, the fair values of Alliant Energy’s OPEB plan assets were as follows (in millions):
|
2016
|
2015
|
||||||||||||||||||||||||||||||
|
Fair
|
Level
|
Level
|
Level
|
Fair
|
Level
|
Level
|
Level
|
||||||||||||||||||||||||
|
Value
|
1
|
2
|
3
|
Value
|
1
|
2
|
3
|
||||||||||||||||||||||||
|
Cash and equivalents
|
|
$3.5
|
|
|
$2.0
|
|
|
$1.5
|
|
|
$—
|
|
|
$3.6
|
|
|
$—
|
|
|
$3.6
|
|
|
$—
|
|
|||||||
|
Equity securities - domestic
|
22.5
|
|
22.5
|
|
—
|
|
—
|
|
22.1
|
|
22.1
|
|
—
|
|
—
|
|
|||||||||||||||
|
Equity securities - international
|
13.5
|
|
13.5
|
|
—
|
|
—
|
|
13.4
|
|
13.4
|
|
—
|
|
—
|
|
|||||||||||||||
|
Global asset allocation securities
|
16.5
|
|
16.5
|
|
—
|
|
—
|
|
16.0
|
|
16.0
|
|
—
|
|
—
|
|
|||||||||||||||
|
Fixed income securities
|
46.8
|
|
46.2
|
|
0.6
|
|
—
|
|
46.3
|
|
46.3
|
|
—
|
|
—
|
|
|||||||||||||||
|
Total assets in fair value hierarchy
|
102.8
|
|
|
$100.7
|
|
|
$2.1
|
|
|
$—
|
|
101.4
|
|
|
$97.8
|
|
|
$3.6
|
|
|
$—
|
|
|||||||||
|
Assets measured at net asset value
|
3.0
|
|
5.5
|
|
|||||||||||||||||||||||||||
|
Total OPEB plan assets
|
|
$105.8
|
|
|
$106.9
|
|
|||||||||||||||||||||||||
At December 31, the fair values of IPL’s OPEB plan assets were as follows (in millions):
|
2016
|
2015
|
||||||||||||||||||||||||||||||
|
Fair
|
Level
|
Level
|
Level
|
Fair
|
Level
|
Level
|
Level
|
||||||||||||||||||||||||
|
Value
|
1
|
2
|
3
|
Value
|
1
|
2
|
3
|
||||||||||||||||||||||||
|
Cash and equivalents
|
|
$0.8
|
|
|
$0.8
|
|
|
$—
|
|
|
$—
|
|
|
$0.9
|
|
|
$—
|
|
|
$0.9
|
|
|
$—
|
|
|||||||
|
Equity securities - domestic
|
17.0
|
|
17.0
|
|
—
|
|
—
|
|
16.7
|
|
16.7
|
|
—
|
|
—
|
|
|||||||||||||||
|
Equity securities - international
|
11.0
|
|
11.0
|
|
—
|
|
—
|
|
10.8
|
|
10.8
|
|
—
|
|
—
|
|
|||||||||||||||
|
Global asset allocation securities
|
7.0
|
|
7.0
|
|
—
|
|
—
|
|
6.9
|
|
6.9
|
|
—
|
|
—
|
|
|||||||||||||||
|
Fixed income securities
|
32.4
|
|
32.4
|
|
—
|
|
—
|
|
33.3
|
|
33.3
|
|
—
|
|
—
|
|
|||||||||||||||
|
Total assets in fair value hierarchy
|
68.2
|
|
|
$68.2
|
|
|
$—
|
|
|
$—
|
|
68.6
|
|
|
$67.7
|
|
|
$0.9
|
|
|
$—
|
|
|||||||||
|
Assets measured at net asset value
|
—
|
|
0.6
|
|
|||||||||||||||||||||||||||
|
Total OPEB plan assets
|
|
$68.2
|
|
|
$69.2
|
|
|||||||||||||||||||||||||
At December 31, the fair values of WPL’s OPEB plan assets were as follows (in millions):
|
2016
|
2015
|
||||||||||||||||||||||||||||||
|
Fair
|
Level
|
Level
|
Level
|
Fair
|
Level
|
Level
|
Level
|
||||||||||||||||||||||||
|
Value
|
1
|
2
|
3
|
Value
|
1
|
2
|
3
|
||||||||||||||||||||||||
|
Cash and equivalents
|
|
$2.0
|
|
|
$0.7
|
|
|
$1.3
|
|
|
$—
|
|
|
$2.3
|
|
|
$—
|
|
|
$2.3
|
|
|
$—
|
|
|||||||
|
Global asset allocation securities
|
5.5
|
|
5.5
|
|
—
|
|
—
|
|
5.4
|
|
5.4
|
|
—
|
|
—
|
|
|||||||||||||||
|
Fixed income securities
|
11.1
|
|
11.1
|
|
—
|
|
—
|
|
11.0
|
|
11.0
|
|
—
|
|
—
|
|
|||||||||||||||
|
Total OPEB plan assets
|
|
$18.6
|
|
|
$17.3
|
|
|
$1.3
|
|
|
$—
|
|
|
$18.7
|
|
|
$16.4
|
|
|
$2.3
|
|
|
$—
|
|
|||||||
For the various defined benefit pension and OPEB plans, Alliant Energy common stock represented less than
1%
of assets directly held in the plans at
December 31, 2016
and
2015
.
401(k) Savings Plans
-
A significant number of employees participate in defined contribution retirement plans (401(k) savings plans). Alliant Energy common stock directly held by participants represented
12.6%
and
11.6%
of total assets in the 401(k) savings plans at
December 31, 2016
and
2015
, respectively. Costs related to the 401(k) savings plans, which are partially based on the participants’ contributions and include allocated costs associated with Corporate Services employees for IPL and WPL, were as follows (in millions):
|
Alliant Energy
|
IPL
|
WPL
|
|||||||||||||||||||||||||||||||||
|
2016
|
2015
|
2014
|
2016
|
|
2015
|
|
2014
|
|
2016
|
2015
|
2014
|
||||||||||||||||||||||||
|
401(k) costs
|
|
$23.6
|
|
|
$24.9
|
|
|
$22.5
|
|
|
$12.0
|
|
|
$12.7
|
|
|
$11.1
|
|
|
$10.7
|
|
|
$11.2
|
|
|
$10.5
|
|
||||||||
Voluntary Employee Separation Charges
-
In 2015, Alliant Energy offered certain employees a voluntary separation package. Approximately
2%
of total Alliant Energy employees accepted this package, which resulted in Alliant Energy, IPL and WPL recording charges of
$8 million
,
$5 million
and
$3 million
, respectively, in 2015.
In 2015, Alliant Energy’s shareowners approved the Amended and Restated OIP, which permits the grant of shares of Alliant Energy common stock, restricted stock, restricted stock units, performance shares, performance units, and other stock-based
109
or cash-based awards to key employees. At
December 31, 2016
, performance shares, performance-contingent restricted stock and restricted stock units (performance- and time-based) were outstanding under the Amended and Restated OIP, and
7.4 million
shares of Alliant Energy’s common stock remained available for grants under the Amended and Restated OIP. Alliant Energy satisfies share payouts related to equity awards under the Amended and Restated OIP through the issuance of new shares of its common stock. Alliant Energy also has the DLIP, which permits the grant of cash-based long-term performance-based awards, including performance units, restricted cash awards and restricted units, to certain key employees. At
December 31, 2016
, performance units, performance-contingent cash awards and restricted units (performance- and time-based) were outstanding under the DLIP. There is no limit to the number of grants that can be made under the DLIP and Alliant Energy satisfies all payouts under the DLIP through cash payments. Nonvested awards generally do not have non-forfeitable rights to dividends or dividend equivalents when dividends are paid to common shareowners.
A summary of compensation expense, including amounts allocated to IPL and WPL, and the related income tax benefits recognized for share-based compensation awards was as follows (in millions):
|
Alliant Energy
|
IPL
|
WPL
|
|||||||||||||||||||||||||||||||||
|
2016
|
2015
|
2014
|
2016
|
2015
|
2014
|
2016
|
2015
|
2014
|
|||||||||||||||||||||||||||
|
Compensation expense
|
|
$18.0
|
|
|
$10.7
|
|
|
$15.3
|
|
|
$9.5
|
|
|
$5.7
|
|
|
$8.3
|
|
|
$7.9
|
|
|
$4.7
|
|
|
$6.4
|
|
||||||||
|
Income tax benefits
|
7.4
|
|
4.4
|
|
6.2
|
|
4.0
|
|
2.4
|
|
3.4
|
|
3.2
|
|
1.9
|
|
2.6
|
|
|||||||||||||||||
As of
December 31, 2016
, Alliant Energy’s, IPL’s and WPL’s total unrecognized compensation cost related to share-based compensation awards was
$5.0 million
,
$2.7 million
and
$2.2 million
, respectively, which is expected to be recognized over a weighted average period of between
1
and
2
years. Share-based compensation expense is recognized on a straight-line basis over the requisite service periods and is primarily recorded in “Other operation and maintenance” in the income statements.
Performance Shares and Performance Units
-
Payouts of performance shares under the Amended and Restated OIP and performance units under the DLIP to key employees are contingent upon achievement over
three
-year periods of specified performance criteria, which currently include metrics of total shareowner return relative to an investor-owned utility peer group. Performance shares can be paid out in shares of Alliant Energy’s common stock, cash or a combination of cash and stock. Performance units must be paid out in cash. Alliant Energy assumes it will make future payouts of its performance shares and performance units in cash; therefore, performance shares and performance units are accounted for as liability awards. A summary of the performance shares and performance units activity, with amounts representing the target number of awards, was as follows:
|
Performance Shares
|
Performance Units
|
||||||||||||||||
|
2016
|
2015
|
2014
|
2016
|
2015
|
2014
|
||||||||||||
|
Nonvested awards, January 1
|
288,430
|
|
288,848
|
|
279,880
|
|
116,412
|
|
127,330
|
|
131,824
|
|
|||||
|
Granted
|
68,585
|
|
90,806
|
|
102,442
|
|
23,918
|
|
35,674
|
|
40,844
|
|
|||||
|
Vested
|
(98,186
|
)
|
(91,224
|
)
|
(90,470
|
)
|
(42,760
|
)
|
(45,690
|
)
|
(41,502
|
)
|
|||||
|
Forfeited
|
(1,230
|
)
|
—
|
|
(3,004
|
)
|
(4,250
|
)
|
(902
|
)
|
(3,836
|
)
|
|||||
|
Nonvested awards, December 31
|
257,599
|
|
288,430
|
|
288,848
|
|
93,320
|
|
116,412
|
|
127,330
|
|
|||||
Granted Awards
- Each performance share’s value is based on the closing market price of
one
share of Alliant Energy’s common stock at the end of the performance period. For performance units granted in 2016, the value is based on the closing market price of
one
share of Alliant Energy’s common stock at the end of the performance period. For performance units granted in 2015 and 2014, each performance unit’s value is based on the closing market price of
one
share of Alliant Energy’s common stock on the grant date of the award. The actual payout for performance shares and performance units is dependent upon actual performance and may range from
zero
to
200%
of the target number of awards. Compensation expense for performance shares and performance units is recorded ratably over the performance period based on the fair value of the awards at each reporting period.
110
Vested Awards -
Certain performance shares and performance units vested, resulting in payouts (a combination of cash and common stock for the performance shares and cash only for the performance units) as follows:
|
Performance Shares
|
Performance Units
|
||||||||||
|
2016
|
2015
|
2014
|
2016
|
2015
|
2014
|
||||||
|
2013 Grant
|
2012 Grant
|
2011 Grant
|
2013 Grant
|
2012 Grant
|
2011 Grant
|
||||||
|
Performance awards vested
|
98,186
|
91,224
|
90,470
|
42,760
|
45,690
|
41,502
|
|||||
|
Percentage of target number of performance awards
|
165.0%
|
167.5%
|
147.5%
|
165.0%
|
167.5%
|
147.5%
|
|||||
|
Aggregate payout value (in millions)
|
$5.1
|
$5.1
|
$3.4
|
$1.7
|
$1.6
|
$1.2
|
|||||
|
Payout - cash (in millions)
|
$2.9
|
$3.2
|
$2.9
|
$1.7
|
$1.6
|
$1.2
|
|||||
|
Payout - common stock shares issued
|
22,408
|
21,950
|
9,620
|
N/A
|
N/A
|
N/A
|
|||||
Fair Value of Awards -
Information related to fair values of nonvested performance shares and performance units at
December 31, 2016
, by year of grant, were as follows:
|
Performance Shares
|
Performance Units
|
||||||||||||||||||||||
|
2016 Grant
|
2015 Grant
|
2014 Grant
|
2016 Grant
|
2015 Grant
|
2014 Grant
|
||||||||||||||||||
|
Nonvested awards at target
|
67,355
|
|
90,806
|
|
99,438
|
|
22,657
|
|
33,268
|
|
37,395
|
|
|||||||||||
|
Alliant Energy common stock closing price on December 30, 2016
|
|
$37.89
|
|
|
$37.89
|
|
|
$37.89
|
|
|
$37.89
|
|
N/A
|
N/A
|
|||||||||
|
Alliant Energy common stock closing price on grant date
|
N/A
|
N/A
|
N/A
|
N/A
|
|
$32.55
|
|
|
$26.89
|
|
|||||||||||||
|
Estimated payout percentage based on performance criteria
|
135
|
%
|
155
|
%
|
148
|
%
|
135
|
%
|
155
|
%
|
148
|
%
|
|||||||||||
|
Fair values of each nonvested award
|
|
$51.15
|
|
|
$58.73
|
|
|
$56.08
|
|
|
$51.15
|
|
|
$50.45
|
|
|
$39.80
|
|
|||||
Performance-Contingent Restricted Stock
-
Vesting of performance-contingent restricted stock grants is based on the achievement of certain performance targets (currently specified growth of consolidated income from continuing operations). If performance targets are not met within the performance period, which currently ranges from
two
to
four
years, these restricted stock grants are forfeited. The fair value of performance-contingent restricted stock is based on the closing market price on the grant date. A summary of the performance-contingent restricted stock activity was as follows:
|
2016
|
2015
|
2014
|
||||||||||||||||||
|
Weighted Average
|
Weighted Average
|
Weighted Average
|
||||||||||||||||||
|
Shares
|
Grant Date Fair Value
|
Shares
|
Grant Date Fair Value
|
Shares
|
Grant Date Fair Value
|
|||||||||||||||
|
Nonvested shares, January 1
|
190,244
|
|
|
$29.59
|
|
197,624
|
|
|
$25.35
|
|
317,844
|
|
|
$21.36
|
|
|||||
|
Granted
|
—
|
|
—
|
|
90,806
|
|
32.55
|
|
102,442
|
|
26.89
|
|
||||||||
|
Vested (a)
|
—
|
|
—
|
|
(98,186
|
)
|
23.79
|
|
(181,694
|
)
|
20.46
|
|
||||||||
|
Forfeited (b)
|
—
|
|
—
|
|
—
|
|
—
|
|
(40,968
|
)
|
19.93
|
|
||||||||
|
Nonvested shares, December 31
|
190,244
|
|
29.59
|
|
190,244
|
|
29.59
|
|
197,624
|
|
25.35
|
|
||||||||
|
(a)
|
In 2015,
98,186
performance-contingent restricted shares granted in 2013 vested because the specified performance criteria for such shares were met. In 2014,
91,224
and
90,470
performance-contingent restricted shares granted in 2012 and 2011, respectively, vested because the specified performance criteria for such shares were met.
|
|
(b)
|
The forfeitures during 2014 were primarily caused by retirements and terminations of participants.
|
Performance Restricted Stock Units and Performance Restricted Units
-
Alliant Energy granted new types of share-based compensation awards to key employees in 2016 referred to as performance restricted stock units under the Amended and Restated OIP, and performance restricted units and key employee performance restricted units under the DLIP. Payouts of these units are based on the achievement of certain performance targets (currently specified growth of consolidated income from continuing operations) during a
three
-year performance period. The actual number of units that will be paid out upon vesting is dependent upon actual performance and may range from
zero
to
200%
of the target number of units. If performance targets are not met during the performance period, these units are forfeited. As of
December 31, 2016
, the amount of nonvested performance restricted units and key employee performance restricted units was not material.
Performance Restricted Stock Units
- Performance restricted stock units generally must be paid out in shares and are accounted for as equity awards. Each performance restricted stock unit’s value is based on the closing market price of
one
share of Alliant Energy’s common stock on the grant date of the award. Compensation expense is recorded ratably over the performance period based on a probability assessment of payouts for the awards at each reporting period. A summary of the performance restricted stock units activity, with amounts representing the target number of units, was as follows:
111
|
2016
|
||||||
|
Units
|
Weighted Average
Grant Date Fair Value
|
|||||
|
Granted
|
68,585
|
|
|
$33.96
|
|
|
|
Forfeited
|
(1,230
|
)
|
33.90
|
|
||
|
Nonvested units, December 31
|
67,355
|
|
33.96
|
|
||
Restricted Stock Units and Restricted Units
-
Alliant Energy granted new types of share-based compensation awards to key employees in 2016 referred to as restricted stock units under the Amended and Restated OIP and restricted units under the DLIP. Payouts of these units are based on the expiration of a
three
-year time-vesting period. Each restricted stock unit’s value is based on the closing market price of
one
share of Alliant Energy’s common stock at the end of the time-vesting period. Compensation expense is recorded ratably over the performance period based on the fair value of the awards at each reporting period. Restricted stock units can be paid out in shares of Alliant Energy common stock, cash or a combination of cash and stock. Alliant Energy assumes it will make future payouts of its restricted stock units in cash; therefore, restricted stock units are accounted for as liability awards. As of
December 31, 2016
, the amount of nonvested restricted units was not material. A summary of the restricted stock units activity was as follows:
|
2016
|
||
|
Granted
|
58,790
|
|
|
Forfeited
|
(1,054
|
)
|
|
Nonvested units, December 31
|
57,736
|
|
Performance-Contingent Cash Awards
-
Performance-contingent cash award payouts to key employees are based on the achievement of certain performance targets (currently specified growth of consolidated income from continuing operations). If performance targets are not met within the performance period, which currently ranges from
two
to
four
years, there are no payouts for these awards. Each performance-contingent cash award’s value is based on the price of
one
share of Alliant Energy’s common stock at the end of the performance period. Alliant Energy accounts for performance-contingent cash awards as liability awards because payouts will be made in the form of cash. A summary of the performance-contingent cash awards activity was as follows:
|
2016
|
2015
|
2014
|
||||||
|
Nonvested awards, January 1
|
163,752
|
|
157,860
|
|
193,954
|
|
||
|
Granted
|
—
|
|
82,210
|
|
84,892
|
|
||
|
Vested (a)
|
—
|
|
(74,664
|
)
|
(111,034
|
)
|
||
|
Forfeited
|
(3,652
|
)
|
(1,654
|
)
|
(9,952
|
)
|
||
|
Nonvested awards, December 31
|
160,100
|
|
163,752
|
|
157,860
|
|
||
|
(a)
|
In 2015,
74,664
performance-contingent cash awards granted in 2013 vested, resulting in cash payouts valued at
$2.4 million
. In 2014,
69,532
and
41,502
performance-contingent cash awards granted in 2012 and 2011 vested, resulting in cash payouts valued at
$1.9 million
and
$1.1 million
, respectively.
|
Company Stock Accounts
-
The DCP does not permit diversification of deferrals credited to the company stock account and all distributions from participants’ company stock accounts are made in the form of shares of Alliant Energy common stock. The deferred compensation obligations for participants’ company stock accounts are recorded in “Additional paid-in capital” and the shares of Alliant Energy common stock held in a rabbi trust to satisfy this obligation are recorded in “Shares in deferred compensation trust” on Alliant Energy’s balance sheets. At December 31, the carrying value of the deferred compensation obligation for the company stock accounts and the shares in the deferred compensation trust based on the historical value of the shares of Alliant Energy common stock contributed to the rabbi trust, and the fair market value of the shares held in the rabbi trust were as follows (in millions):
|
2016
|
2015
|
||||||
|
Carrying value
|
|
$10.0
|
|
|
$8.5
|
|
|
|
Fair market value
|
16.7
|
|
13.4
|
|
|||
112
Interest and Equity Accounts
-
Distributions from participants’ interest and equity accounts are in the form of cash payments. The deferred compensation obligations for participants’ interest and equity accounts are recorded in “Pension and other benefit obligations” on Alliant Energy’s and IPL’s balance sheets. At December 31, the carrying value of deferred compensation obligations for participants’ interest and equity accounts, which approximates fair market value, was as follows (in millions):
|
Alliant Energy
|
IPL
|
||||||
|
2016
|
2015
|
2016
|
2015
|
||||
|
Carrying value
|
$19.4
|
$18.3
|
$4.6
|
$5.0
|
|||
Recognized AROs relate to legal obligations for the removal, closure or dismantlement of several assets including, but not limited to, ash ponds, wind farms, active ash landfills, certain coal yards and above ground storage tanks. Recognized AROs also include legal obligations for the management and final disposition of asbestos, lead-based paint and polychlorinated biphenyls. AROs are recorded in “Other current liabilities” and “Other liabilities” on the balance sheets. Refer to
Note 2
for information regarding regulatory assets related to AROs. A reconciliation of the changes in AROs associated with long-lived assets is as follows (in millions):
|
Alliant Energy
|
IPL
|
WPL
|
|||||||||||||||||||||
|
2016
|
2015
|
2016
|
2015
|
2016
|
2015
|
||||||||||||||||||
|
Balance, January 1
|
|
$214.0
|
|
|
$114.0
|
|
|
$132.9
|
|
|
$51.8
|
|
|
$71.9
|
|
|
$52.4
|
|
|||||
|
Revisions in estimated cash flows (a)
|
(13.3
|
)
|
17.3
|
|
(5.8
|
)
|
15.1
|
|
(7.5
|
)
|
3.2
|
|
|||||||||||
|
Liabilities settled
|
(14.0
|
)
|
(8.8
|
)
|
(6.8
|
)
|
(4.3
|
)
|
(7.2
|
)
|
(4.5
|
)
|
|||||||||||
|
Liabilities incurred (a)
|
2.6
|
|
86.6
|
|
0.7
|
|
67.8
|
|
1.9
|
|
18.8
|
|
|||||||||||
|
Accretion expense
|
6.4
|
|
4.9
|
|
3.7
|
|
2.5
|
|
2.3
|
|
2.0
|
|
|||||||||||
|
Balance, December 31
|
|
$195.7
|
|
|
$214.0
|
|
|
$124.7
|
|
|
$132.9
|
|
|
$61.4
|
|
|
$71.9
|
|
|||||
|
(a)
|
In April 2015, the EPA published the final CCR Rule, which regulates CCR as a non-hazardous waste and was effective October 2015. IPL and WPL have
nine
and
three
coal-fired EGUs, respectively, with coal ash ponds that are impacted by this rule. In addition, IPL and WPL have
four
and
two
active CCR landfills, respectively, that are impacted by this rule. In 2015, Alliant Energy, IPL and WPL recognized additional AROs of
$87 million
,
$67 million
and
$20 million
, respectively, as a result of the final CCR Rule. These increases in AROs resulted in corresponding increases in property, plant and equipment, net on the respective balance sheets. Actual costs resulting from the CCR Rule may be different than the amounts recorded in 2015 due to potential changes in compliance strategies that will be used, as well as other potential cost estimate changes. Expenditures incurred by IPL and WPL to comply with the CCR Rule are anticipated to be recovered in rates from their customers.
|
In addition, certain AROs related to EGU assets have not been recognized. Due to an indeterminate remediation date, the fair values of the AROs for these assets cannot be currently estimated. A liability for these AROs will be recorded when fair value is determinable. Removal costs of these EGUs are being recovered in rates and are recorded in regulatory liabilities.
Valuation Hierarchy
-
Fair value measurement accounting establishes three levels of fair value hierarchy that prioritize the inputs to valuation techniques used to measure fair value. Level 1 pricing inputs are quoted prices available in active markets for identical assets or liabilities as of the reporting date. Level 2 pricing inputs are quoted prices for similar assets or liabilities in active markets or quoted prices for identical or similar assets or liabilities in markets that are not active as of the reporting date. Level 3 pricing inputs are unobservable inputs for assets or liabilities for which little or no market data exist and require significant management judgment or estimation.
The fair value hierarchy gives the highest priority to quoted prices in active markets (Level 1) and the lowest priority to unobservable data (Level 3). In some cases, the inputs used to measure fair value might fall in different levels of the fair value hierarchy. The lowest level input that is significant to a fair value measurement in its entirety determines the applicable level in the fair value hierarchy. Assessing the significance of a particular input to the fair value measurement in its entirety requires judgment, considering factors specific to the asset or liability.
113
Valuation Techniques
-
Derivative assets and derivative liabilities -
Derivative instruments are used for risk management purposes to mitigate exposures to fluctuations in certain commodity prices, transmission congestion costs and rail transportation costs. Risk policies are maintained that govern the use of such derivative instruments. Derivative instruments were not designated as hedging instruments and included the following:
|
Risk management purpose
|
Type of instrument
|
|
Mitigate pricing volatility for:
|
|
|
Electricity purchased to supply customers
|
Electric swap and physical forward contracts (IPL and WPL)
|
|
Fuel used to supply natural gas-fired EGUs
|
Natural gas swap and physical forward contracts (IPL and WPL)
|
|
Natural gas options (WPL)
|
|
|
Natural gas supplied to retail customers
|
Natural gas options and physical forward contracts (IPL and WPL)
|
|
Natural gas swap contracts (IPL)
|
|
|
Fuel used at coal-fired EGUs
|
Coal physical forward contracts (IPL and WPL)
|
|
Optimize the value of natural gas pipeline capacity
|
Natural gas physical forward contracts (IPL and WPL)
|
|
Natural gas swap contracts (IPL)
|
|
|
Manage transmission congestion costs
|
FTRs (IPL and WPL)
|
|
Manage rail transportation costs
|
Diesel fuel swap contracts (WPL)
|
Swap, option and physical forward commodity contracts were non-exchange-based derivative instruments and were valued using indicative price quotations from a pricing vendor that provides daily exchange forward price settlements, from broker or dealer quotations, from market publications or from on-line exchanges. The indicative price quotations reflected the average of the bid-ask mid-point prices and were obtained from sources believed to provide the most liquid market for the commodity. A portion of these indicative price quotations were corroborated using quoted prices for similar assets or liabilities in active markets and categorized derivative instruments based on such indicative price quotations as Level 2. Commodity contracts that were valued using indicative price quotations based on significant assumptions such as seasonal or monthly shaping and indicative price quotations that could not be readily corroborated were categorized as Level 3. Swap, option and physical forward commodity contracts were predominately at liquid trading points. FTRs were valued using auction prices and were categorized as Level 3. Refer to
Note 15
for additional details of derivative assets and derivative liabilities.
Deferred proceeds (sales of receivables) -
The fair value of IPL’s deferred proceeds related to its sales of accounts receivable program was calculated each reporting date using the cost approach valuation technique. The fair value represents the carrying amount of receivables sold less the allowance for doubtful accounts associated with the receivables sold and cash amounts received from the receivables sold due to the short-term nature of the collection period. These inputs were considered unobservable and deferred proceeds were categorized as Level 3. Deferred proceeds represent IPL’s maximum exposure to loss related to the receivables sold. Refer to
Note 5(b)
for additional information regarding deferred proceeds.
Long-term debt (including current maturities) -
The fair value of long-term debt instruments was based on quoted market prices for similar liabilities at each reporting date or on a discounted cash flow methodology, which utilizes assumptions of current market pricing curves at each reporting date, and was substantially classified as Level 2. Refer to
Note 9(b)
for additional information regarding long-term debt.
Cumulative preferred stock -
The fair value of IPL’s
5.1%
cumulative preferred stock was based on its closing market price quoted by the New York Stock Exchange at each reporting date, and was classified as Level 1. Refer to
Note 8
for additional information regarding cumulative preferred stock.
114
Fair Value of Financial Instruments
-
The carrying amounts of current assets and current liabilities approximate fair value because of the short maturity of such financial instruments. Carrying amounts and the related estimated fair values of other financial instruments at December 31 were as follows (in millions):
|
Alliant Energy
|
2016
|
2015
|
|||||||||||||||||||||||||||||||||||||
|
Fair Value
|
Fair Value
|
||||||||||||||||||||||||||||||||||||||
|
Carrying
|
Level
|
Level
|
Level
|
Carrying
|
Level
|
Level
|
Level
|
||||||||||||||||||||||||||||||||
|
Amount
|
1
|
2
|
3
|
Total
|
Amount
|
1
|
2
|
3
|
Total
|
||||||||||||||||||||||||||||||
|
Assets:
|
|||||||||||||||||||||||||||||||||||||||
|
Derivatives
|
|
$41.4
|
|
|
$—
|
|
|
$4.6
|
|
|
$36.8
|
|
|
$41.4
|
|
|
$18.4
|
|
|
$—
|
|
|
$2.5
|
|
|
$15.9
|
|
|
$18.4
|
|
|||||||||
|
Deferred proceeds
|
211.1
|
|
—
|
|
—
|
|
211.1
|
|
211.1
|
|
172.0
|
|
—
|
|
—
|
|
172.0
|
|
172.0
|
|
|||||||||||||||||||
|
Liabilities and equity:
|
|||||||||||||||||||||||||||||||||||||||
|
Derivatives
|
28.6
|
|
—
|
|
0.5
|
|
28.1
|
|
28.6
|
|
64.6
|
|
—
|
|
16.0
|
|
48.6
|
|
64.6
|
|
|||||||||||||||||||
|
Long-term debt (including current maturities)
|
4,320.2
|
|
—
|
|
4,795.7
|
|
3.3
|
|
4,799.0
|
|
3,835.6
|
|
—
|
|
4,332.4
|
|
3.7
|
|
4,336.1
|
|
|||||||||||||||||||
|
IPL’s cumulative preferred stock
|
200.0
|
|
194.8
|
|
—
|
|
—
|
|
194.8
|
|
200.0
|
|
206.6
|
|
—
|
|
—
|
|
206.6
|
|
|||||||||||||||||||
|
IPL
|
2016
|
2015
|
|||||||||||||||||||||||||||||||||||||
|
Fair Value
|
Fair Value
|
||||||||||||||||||||||||||||||||||||||
|
Carrying
|
Level
|
Level
|
Level
|
Carrying
|
Level
|
Level
|
Level
|
||||||||||||||||||||||||||||||||
|
Amount
|
1
|
2
|
3
|
Total
|
Amount
|
1
|
2
|
3
|
Total
|
||||||||||||||||||||||||||||||
|
Assets:
|
|||||||||||||||||||||||||||||||||||||||
|
Derivatives
|
|
$20.8
|
|
|
$—
|
|
|
$2.8
|
|
|
$18.0
|
|
|
$20.8
|
|
|
$15.5
|
|
|
$—
|
|
|
$2.0
|
|
|
$13.5
|
|
|
$15.5
|
|
|||||||||
|
Deferred proceeds
|
211.1
|
|
—
|
|
—
|
|
211.1
|
|
211.1
|
|
172.0
|
|
—
|
|
—
|
|
172.0
|
|
172.0
|
|
|||||||||||||||||||
|
Liabilities and equity:
|
|||||||||||||||||||||||||||||||||||||||
|
Derivatives
|
8.3
|
|
—
|
|
0.4
|
|
7.9
|
|
8.3
|
|
23.4
|
|
—
|
|
8.0
|
|
15.4
|
|
23.4
|
|
|||||||||||||||||||
|
Long-term debt (including current maturities)
|
2,153.5
|
|
—
|
|
2,352.3
|
|
—
|
|
2,352.3
|
|
1,856.9
|
|
—
|
|
2,092.7
|
|
—
|
|
2,092.7
|
|
|||||||||||||||||||
|
Cumulative preferred stock
|
200.0
|
|
194.8
|
|
—
|
|
—
|
|
194.8
|
|
200.0
|
|
206.6
|
|
—
|
|
—
|
|
206.6
|
|
|||||||||||||||||||
|
WPL
|
2016
|
2015
|
|||||||||||||||||||||||||||||||||||||
|
Fair Value
|
Fair Value
|
||||||||||||||||||||||||||||||||||||||
|
Carrying
|
Level
|
Level
|
Level
|
Carrying
|
Level
|
Level
|
Level
|
||||||||||||||||||||||||||||||||
|
Amount
|
1
|
2
|
3
|
Total
|
Amount
|
1
|
2
|
3
|
Total
|
||||||||||||||||||||||||||||||
|
Assets:
|
|||||||||||||||||||||||||||||||||||||||
|
Derivatives
|
|
$20.6
|
|
|
$—
|
|
|
$1.8
|
|
|
$18.8
|
|
|
$20.6
|
|
|
$2.9
|
|
|
$—
|
|
|
$0.5
|
|
|
$2.4
|
|
|
$2.9
|
|
|||||||||
|
Liabilities and equity:
|
|||||||||||||||||||||||||||||||||||||||
|
Derivatives
|
20.3
|
|
—
|
|
0.1
|
|
20.2
|
|
20.3
|
|
41.2
|
|
—
|
|
8.0
|
|
33.2
|
|
41.2
|
|
|||||||||||||||||||
|
Long-term debt (including current maturities)
|
1,535.2
|
|
—
|
|
1,807.4
|
|
—
|
|
1,807.4
|
|
1,533.9
|
|
—
|
|
1,793.0
|
|
—
|
|
1,793.0
|
|
|||||||||||||||||||
115
Information for fair value measurements using significant unobservable inputs (Level 3 inputs) was as follows (in millions):
|
Alliant Energy
|
Commodity Contract Derivative
|
||||||||||||||
|
Assets and (Liabilities), net
|
Deferred Proceeds
|
||||||||||||||
|
2016
|
2015
|
2016
|
2015
|
||||||||||||
|
Beginning balance, January 1
|
|
($32.7
|
)
|
|
$17.9
|
|
|
$172.0
|
|
|
$177.2
|
|
|||
|
Total net gains (losses) included in changes in net assets (realized/unrealized)
|
30.7
|
|
(63.5
|
)
|
—
|
|
—
|
|
|||||||
|
Transfers into Level 3
|
0.9
|
|
—
|
|
—
|
|
—
|
|
|||||||
|
Transfers out of Level 3
|
1.2
|
|
0.3
|
|
—
|
|
—
|
|
|||||||
|
Purchases
|
22.0
|
|
36.9
|
|
—
|
|
—
|
|
|||||||
|
Sales
|
(1.0
|
)
|
(1.9
|
)
|
—
|
|
—
|
|
|||||||
|
Settlements (a)
|
(12.4
|
)
|
(22.4
|
)
|
39.1
|
|
(5.2
|
)
|
|||||||
|
Ending balance, December 31
|
|
$8.7
|
|
|
($32.7
|
)
|
|
$211.1
|
|
|
$172.0
|
|
|||
|
The amount of total net gains (losses) for the period included in changes in net assets attributable to the change in unrealized gains (losses) relating to assets and liabilities held at December 31
|
|
$32.7
|
|
|
($56.0
|
)
|
|
$—
|
|
|
$—
|
|
|||
|
IPL
|
Commodity Contract Derivative
|
||||||||||||||
|
Assets and (Liabilities), net
|
Deferred Proceeds
|
||||||||||||||
|
2016
|
2015
|
2016
|
2015
|
||||||||||||
|
Beginning balance, January 1
|
|
($1.9
|
)
|
|
$19.4
|
|
|
$172.0
|
|
|
$177.2
|
|
|||
|
Total net gains (losses) included in changes in net assets (realized/unrealized)
|
7.3
|
|
(29.6
|
)
|
—
|
|
—
|
|
|||||||
|
Transfers into Level 3
|
0.5
|
|
—
|
|
—
|
|
—
|
|
|||||||
|
Transfers out of Level 3
|
0.2
|
|
—
|
|
—
|
|
—
|
|
|||||||
|
Purchases
|
20.6
|
|
33.1
|
|
—
|
|
—
|
|
|||||||
|
Sales
|
(1.0
|
)
|
(1.8
|
)
|
—
|
|
—
|
|
|||||||
|
Settlements (a)
|
(15.6
|
)
|
(23.0
|
)
|
39.1
|
|
(5.2
|
)
|
|||||||
|
Ending balance, December 31
|
|
$10.1
|
|
|
($1.9
|
)
|
|
$211.1
|
|
|
$172.0
|
|
|||
|
The amount of total net gains (losses) for the period included in changes in net assets attributable to the change in unrealized gains (losses) relating to assets and liabilities held at December 31
|
|
$8.5
|
|
|
($23.1
|
)
|
|
$—
|
|
|
$—
|
|
|||
|
WPL
|
Commodity Contract Derivative
|
||||||
|
Assets and (Liabilities), net
|
|||||||
|
2016
|
2015
|
||||||
|
Beginning balance, January 1
|
|
($30.8
|
)
|
|
($1.5
|
)
|
|
|
Total net gains (losses) included in changes in net assets (realized/unrealized)
|
23.4
|
|
(33.9
|
)
|
|||
|
Transfers into Level 3
|
0.4
|
|
—
|
|
|||
|
Transfers out of Level 3
|
1.0
|
|
0.3
|
|
|||
|
Purchases
|
1.4
|
|
3.8
|
|
|||
|
Sales
|
—
|
|
(0.1
|
)
|
|||
|
Settlements
|
3.2
|
|
0.6
|
|
|||
|
Ending balance, December 31
|
|
($1.4
|
)
|
|
($30.8
|
)
|
|
|
The amount of total net gains (losses) for the period included in changes in net assets attributable to the change in unrealized gains (losses) relating to assets and liabilities held at December 31
|
|
$24.2
|
|
|
($32.9
|
)
|
|
|
(a)
|
Settlements related to deferred proceeds are due to the change in the carrying amount of receivables sold less the allowance for doubtful accounts associated with the receivables sold and cash amounts received from the receivables sold.
|
Commodity Contracts -
The fair value of electric, natural gas and coal commodity contracts categorized as Level 3 was recognized as net derivative assets (liabilities) at December 31 as follows (in millions):
|
Alliant Energy
|
IPL
|
WPL
|
|||||||||||||||||||||
|
Excluding FTRs
|
FTRs
|
Excluding FTRs
|
FTRs
|
Excluding FTRs
|
FTRs
|
||||||||||||||||||
|
2016
|
|
($2.3
|
)
|
|
$11.0
|
|
|
$0.1
|
|
|
$10.0
|
|
|
($2.4
|
)
|
|
$1.0
|
|
|||||
|
2015
|
(43.1
|
)
|
10.4
|
|
(12.3
|
)
|
10.4
|
|
(30.8
|
)
|
—
|
|
|||||||||||
116
Commodity Derivatives
-
Purpose -
Derivative instruments are used for risk management purposes to mitigate exposures to fluctuations in certain commodity prices and transmission congestion costs. Refer to
Note 14
for detailed discussion of derivative instruments.
Notional Amounts -
As of
December 31, 2016
, gross notional amounts and settlement/delivery years related to outstanding swap contracts, option contracts, physical forward contracts, FTRs, coal contracts and diesel fuel contracts that were accounted for as commodity derivative instruments were as follows (units in thousands):
|
Electricity
|
FTRs
|
Natural Gas
|
Coal
|
Diesel Fuel
|
||||||||||||||||||||
|
MWhs
|
Years
|
MWhs
|
Years
|
Dths
|
Years
|
Tons
|
Years
|
Gallons
|
Years
|
|||||||||||||||
|
Alliant Energy
|
2,628
|
|
2017-2018
|
8,970
|
|
2017
|
139,865
|
|
2017-2023
|
4,239
|
|
2017-2019
|
6,552
|
|
2017-2018
|
|||||||||
|
IPL
|
—
|
|
—
|
5,465
|
|
2017
|
56,265
|
|
2017-2021
|
1,955
|
|
2017-2019
|
—
|
|
—
|
|||||||||
|
WPL
|
2,628
|
|
2017-2018
|
3,505
|
|
2017
|
83,600
|
|
2017-2023
|
2,284
|
|
2017-2018
|
6,552
|
|
2017-2018
|
|||||||||
Financial Statement Presentation -
Derivative instruments are recorded at fair value each reporting date on the balance sheet as assets or liabilities. At December 31, the fair values of current derivative assets are included in “Other current assets,” non-current derivative assets are included in “Deferred charges and other,” current derivative liabilities are included in “Other current liabilities” and non-current derivative liabilities are included in “Other liabilities” on the balance sheets as follows (in millions):
|
Alliant Energy
|
IPL
|
WPL
|
|||||||||||||||||||||
|
Commodity contracts
|
2016
|
2015
|
2016
|
2015
|
2016
|
2015
|
|||||||||||||||||
|
Current derivative assets
|
|
$29.4
|
|
|
$15.1
|
|
|
$19.1
|
|
|
$13.8
|
|
|
$10.3
|
|
|
$1.3
|
|
|||||
|
Non-current derivative assets
|
12.0
|
|
3.3
|
|
1.7
|
|
1.7
|
|
10.3
|
|
1.6
|
|
|||||||||||
|
Current derivative liabilities
|
13.3
|
|
47.3
|
|
2.7
|
|
18.5
|
|
10.6
|
|
28.8
|
|
|||||||||||
|
Non-current derivative liabilities
|
15.3
|
|
17.3
|
|
5.6
|
|
4.9
|
|
9.7
|
|
12.4
|
|
|||||||||||
Unrealized gains and losses from derivative instruments are generally recorded with offsets to regulatory assets or regulatory liabilities, based on fuel and natural gas cost recovery mechanisms, as well as other specific regulatory authorizations. Based on these recovery mechanisms, the changes in the fair value of derivative liabilities resulted in comparable changes to regulatory assets, and the changes in the fair value of derivative assets resulted in comparable changes to regulatory liabilities. Refer to
Note 2
for further discussion.
Credit Risk-related Contingent Features -
Various agreements contain credit risk-related contingent features, including requirements to maintain certain credit ratings and/or limitations on liability positions under the agreements based on credit ratings. Certain of these agreements with credit risk-related contingency features are accounted for as derivative instruments. In the event of a material change in creditworthiness or if liability positions exceed certain contractual limits, credit support may need to be provided in the form of letters of credit or cash collateral up to the amount of exposure under the contracts, or the contracts may need to be unwound and underlying liability positions paid. At
December 31, 2016
and
2015
, the aggregate fair value of all derivative instruments with credit risk-related contingent features in a net liability position was not materially different than amounts that would be required to be posted as credit support to counterparties by Alliant Energy, IPL or WPL if the most restrictive credit risk-related contingent features for derivative agreements in a net liability position were triggered.
Balance Sheet Offsetting
- The fair value amounts of derivative instruments subject to a master netting arrangement are not netted by counterparty on the balance sheets. However, if the fair value amounts of derivative instruments by counterparty were netted, amounts would not be materially different from gross amounts of derivative assets and derivative liabilities at
December 31, 2016
and
2015
. Fair value amounts recognized for the right to reclaim cash collateral (receivable) or the obligation to return cash collateral (payable) are not offset against fair value amounts recognized for derivative instruments executed with the same counterparty under the same master netting arrangement.
117
|
Alliant Energy
|
2017
|
2018
|
2019
|
2020
|
2021
|
Thereafter
|
Total
|
||||||||||||||||||||
|
Purchased power (a)
|
|
$185
|
|
|
$189
|
|
|
$159
|
|
|
$137
|
|
|
$149
|
|
|
$599
|
|
|
$1,418
|
|
||||||
|
Natural gas
|
223
|
|
142
|
|
115
|
|
98
|
|
69
|
|
124
|
|
771
|
|
|||||||||||||
|
Coal (b)
|
105
|
|
54
|
|
18
|
|
—
|
|
—
|
|
—
|
|
177
|
|
|||||||||||||
|
Other (c)
|
16
|
|
4
|
|
5
|
|
2
|
|
2
|
|
5
|
|
34
|
|
|||||||||||||
|
|
$529
|
|
|
$389
|
|
|
$297
|
|
|
$237
|
|
|
$220
|
|
|
$728
|
|
|
$2,400
|
|
|||||||
|
IPL
|
2017
|
2018
|
2019
|
2020
|
2021
|
Thereafter
|
Total
|
||||||||||||||||||||
|
Purchased power (a)
|
|
$138
|
|
|
$131
|
|
|
$144
|
|
|
$137
|
|
|
$149
|
|
|
$599
|
|
|
$1,298
|
|
||||||
|
Natural gas
|
120
|
|
74
|
|
55
|
|
39
|
|
23
|
|
71
|
|
382
|
|
|||||||||||||
|
Coal (b)
|
49
|
|
19
|
|
9
|
|
—
|
|
—
|
|
—
|
|
77
|
|
|||||||||||||
|
Other (c)
|
15
|
|
1
|
|
1
|
|
—
|
|
—
|
|
—
|
|
17
|
|
|||||||||||||
|
|
$322
|
|
|
$225
|
|
|
$209
|
|
|
$176
|
|
|
$172
|
|
|
$670
|
|
|
$1,774
|
|
|||||||
|
WPL
|
2017
|
2018
|
2019
|
2020
|
2021
|
Thereafter
|
Total
|
||||||||||||||||||||
|
Purchased power (a)
|
|
$47
|
|
|
$58
|
|
|
$15
|
|
|
$—
|
|
|
$—
|
|
|
$—
|
|
|
$120
|
|
||||||
|
Natural gas
|
103
|
|
68
|
|
60
|
|
59
|
|
46
|
|
53
|
|
389
|
|
|||||||||||||
|
Coal (b)
|
56
|
|
35
|
|
9
|
|
—
|
|
—
|
|
—
|
|
100
|
|
|||||||||||||
|
Other (c)
|
—
|
|
1
|
|
1
|
|
—
|
|
—
|
|
—
|
|
2
|
|
|||||||||||||
|
|
$206
|
|
|
$162
|
|
|
$85
|
|
|
$59
|
|
|
$46
|
|
|
$53
|
|
|
$611
|
|
|||||||
|
(a)
|
Includes payments required by PPAs for capacity rights and minimum quantities of MWhs required to be purchased.
|
|
(b)
|
Corporate Services entered into system-wide coal contracts on behalf of IPL and WPL that include minimum future commitments. These commitments were assigned to IPL and WPL based on information available as of
December 31, 2016
regarding expected future usage, which is subject to change.
|
|
(c)
|
Includes individual commitments incurred during the normal course of business that exceeded
$1 million
at
December 31, 2016
.
|
Certain contracts are considered leases and are therefore not included here, but are included in
Note 10
.
Flood Damage Claims
-
In 2013, several plaintiffs purporting to represent a class of residential and commercial property owners filed a complaint against CRANDIC, Alliant Energy and various other defendants in the Iowa District Court for Linn County. Plaintiffs assert claims of negligence and strict liability based on their allegations that CRANDIC (along with other defendants) caused or exacerbated flooding of the Cedar River in June 2008. In February 2016, the Iowa District Court for Linn County ruled in favor of Alliant Energy and CRANDIC and dismissed all claims against them, resulting in no loss. In August 2016, the Iowa District Court for Linn County dismissed all claims against the remaining defendants. In September 2016, plaintiffs filed a notice of appeal with the Supreme Court of Iowa. Alliant Energy does not currently believe any material losses for this complaint are both probable and reasonably estimated, and therefore has not recognized any material loss contingency amounts as of
December 31, 2016
.
Other
- Alliant Energy, IPL and WPL are involved in other legal and administrative proceedings before various courts and agencies with respect to matters arising in the ordinary course of business. Although unable to predict the outcome of these matters, Alliant Energy, IPL and WPL believe that appropriate reserves have been established and final disposition of these actions will not have a material effect on their financial condition or results of operations.
RMT
-
In 2013, Alliant Energy sold RMT. RMT provided renewable energy services, including construction and high voltage connection services for wind and solar projects. As part of the sale, Alliant Energy indemnified the buyer for any claims, including claims of warranty under the project obligations that were commenced or are based on actions that occurred prior to the sale, except for liabilities already accounted for through adjustments to the purchase price. In 2016, the indemnification obligations and contractual warranty periods expired; however, limited warranties may be extended in certain cases for warranty work performed.
118
Alliant Energy also continues to guarantee RMT’s performance obligations related to certain of RMT’s projects that were commenced prior to Alliant Energy’s sale of RMT. As of
December 31, 2016
, Alliant Energy had
$75 million
of performance guarantees outstanding, which are currently expected to expire in 2017. The expiration of these performance guarantees may be extended depending on when all valid warranty claims are resolved for the respective projects.
Although Alliant Energy has received warranty claims related to certain of these projects, it does not currently believe that material losses are both probable and reasonably estimated, and therefore, has not recognized any material liabilities related to these matters as of
December 31, 2016
. Alliant Energy does not currently believe that the range of future potential loss from any warranty claims will be material. Refer to
Note 19
for further discussion of RMT, including amounts Alliant Energy recorded to “Operating expenses” in 2016, 2015 and 2014 related to certain warranty claims.
Whiting Petroleum
-
In 2004, Alliant Energy sold its remaining interest in Whiting Petroleum. Whiting Petroleum is an independent oil and gas company. Alliant Energy Resources, LLC, as the successor to a predecessor entity that owned Whiting Petroleum, and a wholly-owned subsidiary of AEF, continues to guarantee the partnership obligations of an affiliate of Whiting Petroleum under general partnership agreements in the oil and gas industry, including with respect to the future abandonment of certain platforms off the coast of California and related onshore plant and equipment owned by the partnerships. The guarantees do not include a maximum limit. As of
December 31, 2016
, the present value of the abandonment obligations is estimated at
$31 million
. Alliant Energy is not aware of any material liabilities related to these guarantees of which it is probable that Alliant Energy Resources, LLC will be obligated to pay and therefore has not recognized any material liabilities related to this guarantee as of
December 31, 2016
.
IPL’s Minnesota Electric Distribution Assets
-
IPL provided indemnifications associated with the July 2015 sale of its Minnesota electric distribution assets for losses resulting from potential breach of IPL’s representations, warranties and obligations under the sale agreement. Alliant Energy and IPL believe the likelihood of having to make any material cash payments under these indemnifications is remote. IPL has not recorded any material liabilities related to these indemnifications as of
December 31, 2016
. The general terms of the indemnifications provided by IPL included a maximum limit of
$17 million
and expire in
October 2020
. Refer to
Note 3
for further discussion of the sale of IPL’s Minnesota electric distribution assets.
MGP Sites
-
IPL and WPL have current or previous ownership interests in various sites that are previously associated with the production of gas for which IPL and WPL have, or may have in the future, liability for investigation, remediation and monitoring costs. IPL and WPL are working pursuant to the requirements of various federal and state agencies to investigate, mitigate, prevent and remediate, where necessary, the environmental impacts to property, including natural resources, at and around these former MGP sites in order to protect public health and the environment.
Environmental liabilities related to these MGP sites are recorded based upon periodic studies. Such amounts are based on the best current estimate of the remaining amount to be incurred for investigation, remediation and monitoring costs for those sites where the investigation process has been or is substantially completed, and the minimum of the estimated cost range for those sites where the investigation is in its earlier stages. There are inherent uncertainties associated with the estimated remaining costs for MGP projects primarily due to unknown site conditions and potential changes in regulatory agency requirements. It is possible that future cost estimates will be greater than current estimates as the investigation process proceeds and as additional facts become known. Costs of future expenditures for environmental remediation obligations are not discounted. At
December 31, 2016
, estimated future costs expected to be incurred for the investigation, remediation and monitoring of the MGP sites, as well as environmental liabilities recorded on the balance sheets for these sites, were as follows (in millions). At
December 31, 2016
, such amounts for WPL were not material.
|
Alliant Energy
|
IPL
|
||||||||||
|
Range of estimated future costs
|
|
$14
|
|
-
|
$27
|
|
$12
|
|
-
|
$24
|
|
|
Current and non-current environmental liabilities
|
16
|
13
|
|||||||||
119
Refer to
Note 2
for discussion of regulatory assets recorded by IPL and WPL, which reflect the probable future rate recovery of MGP expenditures. Considering the current rate treatment, and assuming no material change therein, Alliant Energy, IPL and WPL believe that the clean-up costs incurred for these MGP sites will not have a material effect on their financial condition or results of operations.
WPL Consent Decree
-
In 2013, the U.S. District Court for the Western District of Wisconsin approved a Consent Decree that WPL, along with the other owners of Edgewater and Columbia, entered into with the EPA and the Sierra Club, thereby resolving claims against WPL. Such claims included allegations that the owners of Edgewater, Nelson Dewey and Columbia violated the Prevention of Significant Deterioration program requirements, Title V Operating Permit requirements of the CAA and the Wisconsin State Implementation Plan designed to implement the CAA.
WPL has completed various requirements under the Consent Decree. WPL’s remaining requirements include installing an SCR system at Columbia Unit 2 and fuel switching or retiring Edgewater Unit 4 by December 31, 2018. The Consent Decree also establishes SO2, NOx and particulate matter emission rate limits for Columbia Units 1 and 2, and Edgewater Units 4 and 5. In addition, the Consent Decree includes annual plant-wide SO2 and NOx emission caps for Columbia and Edgewater. WPL is in the process of completing approximately
$7 million
in environmental mitigation projects. Alliant Energy and WPL currently expect to recover material costs incurred by WPL related to compliance with the terms of the Consent Decree from WPL’s electric customers.
IPL Consent Decree
- In 2015, the U.S. District Court for the Northern District of Iowa approved a Consent Decree that IPL entered into with the EPA, the Sierra Club, the State of Iowa and Linn County in Iowa, thereby resolving potential CAA issues associated with emissions from IPL’s coal-fired generating facilities in Iowa. IPL has completed various requirements under the Consent Decree. IPL’s remaining requirements include installing an SCR system or equivalent NOx reduction system at the Ottumwa Generating Station by December 31, 2019; fuel switching or retiring Prairie Creek Unit 4 by June 1, 2018, the Burlington Generating Station by December 31, 2021 and Prairie Creek Units 1 and 3 by December 31, 2025; and either installing combined cycle technology at, or retiring, the Dubuque and Sutherland Generating Stations by June 1, 2019.
The Consent Decree also establishes SO2, NOx and particulate matter emission rate limits with varying averaging times for the Burlington, Lansing, M.L. Kapp, Ottumwa and Prairie Creek Generating Stations. In addition, the Consent Decree includes calendar-year SO2 and NOx emission caps for the Prairie Creek Generating Station, and calendar-year SO2 and NOx emission caps in aggregate for the Burlington, Dubuque, Lansing, M.L. Kapp, Ottumwa, Prairie Creek and Sutherland Generating Stations. IPL is in the process of completing approximately
$6 million
in environmental mitigation projects. Alliant Energy and IPL currently expect to recover material costs incurred by IPL related to the environmental control systems and environmental mitigation projects from IPL’s electric customers.
Other Environmental Contingencies
-
In addition to the environmental liabilities discussed above, various environmental rules are monitored that may have a significant impact on future operations. Several of these environmental rules are subject to legal challenges, reconsideration and/or other uncertainties. Given uncertainties regarding the outcome, timing and compliance plans for these environmental matters, the complete financial impact of each of these rules is not able to be determined; however future capital investments and/or modifications to EGUs to comply with certain of these rules could be significant. Specific current, proposed or potential environmental matters include, among others: CSAPR, Effluent Limitation Guidelines, CCR Rule, and various legislation and EPA regulations to monitor and regulate the emission of GHG, including carbon emissions from new (CAA Section 111(b)) and existing (CAA Section 111(d)) fossil-fueled EGUs.
Alliant Energy, IPL and WPL are subject to credit risk related to the ability of counterparties to meet their contractual payment obligations or the potential non-performance of counterparties to deliver contracted commodities and other goods or services at the contracted price. Credit policies are maintained to mitigate credit risk. These credit policies include evaluation of the financial condition of certain counterparties, use of credit risk-related contingent provisions in certain agreements that require credit support from counterparties not meeting specific criteria, diversification of counterparties to reduce concentrations of credit risk and the use of standardized agreements that facilitate the netting of cash flows associated with certain counterparties. Based on these credit policies and counterparty diversification, as well as utility cost recovery mechanisms, it is unlikely that counterparty non-performance would have a material effect on financial condition or results of
120
operations. However, there is no assurance that these items will protect against all losses from counterparty non-performance.
Refer to Notes
5(a)
and
15
for details of allowances for doubtful accounts and credit risk-related contingent features, respectively.
Alliant Energy
-
Alliant Energy’s principal businesses as of
December 31, 2016
are:
|
•
|
Utility -
includes the operations of IPL and WPL, which primarily serve retail customers in Iowa and Wisconsin. The utility business has
three
reportable segments: a) utility electric operations, which include Alliant Energy’s investment in ATC; b) utility gas operations; and c) utility other, which includes steam operations and the unallocated portions of the utility business. Various line items in the following tables are not allocated to the electric and gas segments for management reporting purposes, and therefore, are included only in “Total Utility.”
|
|
•
|
Non-regulated, Parent and Other -
includes the operations of AEF and its subsidiaries, Corporate Services, the Alliant Energy parent company, and any Alliant Energy parent company consolidating adjustments. AEF’s businesses include Transportation, Non-regulated Generation and other non-regulated investments described in
Note 1(a)
.
|
Alliant Energy’s administrative support services are directly charged to the applicable segment where practicable. In all other cases, administrative support services are allocated to the applicable segment based on services agreements. Intersegment revenues were not material to Alliant Energy’s operations and there was no single customer whose revenues were 10% or more of Alliant Energy’s consolidated revenues. All of Alliant Energy’s operations and assets are located in the U.S.
Certain financial information relating to Alliant Energy’s business segments, which represent the services provided to its customers, was as follows (in millions):
|
Utility
|
Non-Regulated,
|
Alliant Energy
|
|||||||||||||||||||||
|
2016
|
Electric
|
Gas
|
Other
|
Total
|
Parent and Other
|
Consolidated
|
|||||||||||||||||
|
Operating revenues
|
|
$2,875.5
|
|
|
$355.4
|
|
|
$48.6
|
|
|
$3,279.5
|
|
|
$40.5
|
|
|
$3,320.0
|
|
|||||
|
Depreciation and amortization
|
367.0
|
|
34.2
|
|
2.1
|
|
403.3
|
|
8.3
|
|
411.6
|
|
|||||||||||
|
Operating income (loss)
|
571.9
|
|
30.7
|
|
(4.8
|
)
|
597.8
|
|
(60.8
|
)
|
537.0
|
|
|||||||||||
|
Interest expense
|
194.6
|
|
1.6
|
|
196.2
|
|
|||||||||||||||||
|
Equity (income) loss from unconsolidated investments, net
|
(39.8
|
)
|
—
|
|
—
|
|
(39.8
|
)
|
0.2
|
|
(39.6
|
)
|
|||||||||||
|
Income tax expense (benefit)
|
87.4
|
|
(28.0
|
)
|
59.4
|
|
|||||||||||||||||
|
Net income (loss) attributable to Alliant Energy common shareowners
|
406.0
|
|
(34.5
|
)
|
371.5
|
|
|||||||||||||||||
|
Total assets
|
11,040.5
|
|
1,091.1
|
|
781.0
|
|
12,912.6
|
|
461.2
|
|
13,373.8
|
|
|||||||||||
|
Investments in equity method subsidiaries
|
325.3
|
|
—
|
|
—
|
|
325.3
|
|
0.7
|
|
326.0
|
|
|||||||||||
|
Construction and acquisition expenditures
|
1,005.5
|
|
137.1
|
|
0.1
|
|
1,142.7
|
|
54.1
|
|
1,196.8
|
|
|||||||||||
|
Utility
|
Non-Regulated,
|
Alliant Energy
|
|||||||||||||||||||||
|
2015
|
Electric
|
Gas
|
Other
|
Total
|
Parent and Other
|
Consolidated
|
|||||||||||||||||
|
Operating revenues
|
|
$2,770.5
|
|
|
$381.2
|
|
|
$57.9
|
|
|
$3,209.6
|
|
|
$44.0
|
|
|
$3,253.6
|
|
|||||
|
Depreciation and amortization
|
358.6
|
|
31.1
|
|
1.8
|
|
391.5
|
|
9.8
|
|
401.3
|
|
|||||||||||
|
Operating income
|
514.1
|
|
34.6
|
|
1.9
|
|
550.6
|
|
26.4
|
|
577.0
|
|
|||||||||||
|
Interest expense
|
189.2
|
|
(2.1
|
)
|
187.1
|
|
|||||||||||||||||
|
Equity (income) loss from unconsolidated investments, net
|
(35.1
|
)
|
—
|
|
—
|
|
(35.1
|
)
|
1.3
|
|
(33.8
|
)
|
|||||||||||
|
Income taxes
|
60.2
|
|
10.2
|
|
70.4
|
|
|||||||||||||||||
|
Net income attributable to Alliant Energy common shareowners
|
362.3
|
|
15.9
|
|
378.2
|
|
|||||||||||||||||
|
Total assets
|
10,211.3
|
|
939.3
|
|
828.9
|
|
11,979.5
|
|
515.7
|
|
12,495.2
|
|
|||||||||||
|
Investments in equity method subsidiaries
|
302.0
|
|
—
|
|
—
|
|
302.0
|
|
0.9
|
|
302.9
|
|
|||||||||||
|
Construction and acquisition expenditures
|
855.8
|
|
106.4
|
|
1.4
|
|
963.6
|
|
70.7
|
|
1,034.3
|
|
|||||||||||
121
|
Utility
|
Non-Regulated,
|
Alliant Energy
|
|||||||||||||||||||||
|
2014
|
Electric
|
Gas
|
Other
|
Total
|
Parent and Other
|
Consolidated
|
|||||||||||||||||
|
Operating revenues
|
|
$2,713.6
|
|
|
$517.5
|
|
|
$66.1
|
|
|
$3,297.2
|
|
|
$53.1
|
|
|
$3,350.3
|
|
|||||
|
Depreciation and amortization
|
347.0
|
|
29.9
|
|
1.8
|
|
378.7
|
|
9.4
|
|
388.1
|
|
|||||||||||
|
Operating income
|
442.4
|
|
53.8
|
|
14.0
|
|
510.2
|
|
33.4
|
|
543.6
|
|
|||||||||||
|
Interest expense
|
176.3
|
|
4.3
|
|
180.6
|
|
|||||||||||||||||
|
Equity income (loss) from unconsolidated investments, net
|
(42.8
|
)
|
—
|
|
—
|
|
(42.8
|
)
|
2.4
|
|
(40.4
|
)
|
|||||||||||
|
Income taxes
|
36.4
|
|
7.9
|
|
44.3
|
|
|||||||||||||||||
|
Net income attributable to Alliant Energy common shareowners
|
362.0
|
|
21.1
|
|
383.1
|
|
|||||||||||||||||
|
Total assets
|
9,660.4
|
|
913.5
|
|
993.9
|
|
11,567.8
|
|
495.7
|
|
12,063.5
|
|
|||||||||||
|
Investments in equity method subsidiaries
|
294.3
|
|
—
|
|
—
|
|
294.3
|
|
2.3
|
|
296.6
|
|
|||||||||||
|
Construction and acquisition expenditures
|
774.8
|
|
63.2
|
|
0.9
|
|
838.9
|
|
63.9
|
|
902.8
|
|
|||||||||||
IPL
-
IPL is a utility primarily serving retail customers in Iowa and includes
three
reportable segments: a) electric operations; b) gas operations; and c) other, which includes steam operations and the unallocated portions of the utility business. Various line items in the following tables are not allocated to the electric and gas segments for management reporting purposes, and therefore, are included only in “Total.” Intersegment revenues were not material to IPL’s operations and there was no single customer whose revenues were 10% or more of IPL’s consolidated revenues. All of IPL’s operations and assets are located in the U.S. Certain financial information relating to IPL’s business segments, which represent the services provided to its customers, was as follows (in millions):
|
2016
|
Electric
|
Gas
|
Other
|
Total
|
|||||||||||
|
Operating revenues
|
|
$1,569.7
|
|
|
$204.0
|
|
|
$46.7
|
|
|
$1,820.4
|
|
|||
|
Depreciation and amortization
|
189.4
|
|
19.3
|
|
2.1
|
|
210.8
|
|
|||||||
|
Operating income
|
252.0
|
|
15.5
|
|
3.3
|
|
270.8
|
|
|||||||
|
Interest expense
|
103.2
|
|
|||||||||||||
|
Income tax benefit
|
(5.9
|
)
|
|||||||||||||
|
Earnings available for common stock
|
215.6
|
|
|||||||||||||
|
Total assets
|
6,278.2
|
|
653.3
|
|
373.2
|
|
7,304.7
|
|
|||||||
|
Construction and acquisition expenditures
|
598.1
|
|
91.5
|
|
0.1
|
|
689.7
|
|
|||||||
|
2015
|
Electric
|
Gas
|
Other
|
Total
|
|||||||||||
|
Operating revenues
|
|
$1,503.8
|
|
|
$217.3
|
|
|
$53.4
|
|
|
$1,774.5
|
|
|||
|
Depreciation and amortization
|
187.9
|
|
17.5
|
|
1.8
|
|
207.2
|
|
|||||||
|
Operating income
|
218.8
|
|
17.7
|
|
5.4
|
|
241.9
|
|
|||||||
|
Interest expense
|
96.8
|
|
|||||||||||||
|
Income tax benefit
|
(22.7
|
)
|
|||||||||||||
|
Earnings available for common stock
|
186.0
|
|
|||||||||||||
|
Total assets
|
5,754.1
|
|
548.2
|
|
406.8
|
|
6,709.1
|
|
|||||||
|
Construction and acquisition expenditures
|
561.2
|
|
56.7
|
|
1.4
|
|
619.3
|
|
|||||||
|
2014
|
Electric
|
Gas
|
Other
|
Total
|
|||||||||||
|
Operating revenues
|
|
$1,493.3
|
|
|
$296.5
|
|
|
$58.3
|
|
|
$1,848.1
|
|
|||
|
Depreciation and amortization
|
178.7
|
|
17.0
|
|
1.8
|
|
197.5
|
|
|||||||
|
Operating income
|
166.8
|
|
25.7
|
|
16.7
|
|
209.2
|
|
|||||||
|
Interest expense
|
89.9
|
|
|||||||||||||
|
Income tax benefit
|
(48.9
|
)
|
|||||||||||||
|
Earnings available for common stock
|
181.6
|
|
|||||||||||||
|
Total assets
|
5,398.3
|
|
544.1
|
|
507.8
|
|
6,450.2
|
|
|||||||
|
Construction and acquisition expenditures
|
490.0
|
|
35.1
|
|
0.9
|
|
526.0
|
|
|||||||
WPL
-
WPL is a utility serving customers in Wisconsin and includes
three
reportable segments: a) electric operations; b) gas operations; and c) other, which includes the unallocated portions of the utility business. Various line items in the following tables are not allocated to the electric and gas segments for management reporting purposes, and therefore, are included only in “Total.” Intersegment revenues were not material to WPL’s operations and there was no single customer whose revenues were 10% or more of WPL’s consolidated revenues. All of WPL’s operations and assets are located in the U.S. Certain financial information relating to WPL’s business segments, which represent the services provided to its customers, was as follows (in millions):
122
|
2016
|
Electric
|
Gas
|
Other
|
Total
|
|||||||||||
|
Operating revenues
|
|
$1,305.8
|
|
|
$151.4
|
|
|
$1.9
|
|
|
$1,459.1
|
|
|||
|
Depreciation and amortization
|
177.6
|
|
14.9
|
|
—
|
|
192.5
|
|
|||||||
|
Operating income (loss)
|
319.9
|
|
15.2
|
|
(8.1
|
)
|
327.0
|
|
|||||||
|
Interest expense
|
91.4
|
|
|||||||||||||
|
Equity income from unconsolidated investments
|
(39.8
|
)
|
—
|
|
—
|
|
(39.8
|
)
|
|||||||
|
Income taxes
|
93.3
|
|
|||||||||||||
|
Earnings available for common stock
|
190.4
|
|
|||||||||||||
|
Total assets
|
4,444.7
|
|
437.8
|
|
407.8
|
|
5,290.3
|
|
|||||||
|
Investments in equity method subsidiaries
|
7.7
|
|
—
|
|
—
|
|
7.7
|
|
|||||||
|
Construction and acquisition expenditures
|
407.4
|
|
45.6
|
|
—
|
|
453.0
|
|
|||||||
|
2015
|
Electric
|
Gas
|
Other
|
Total
|
|||||||||||
|
Operating revenues
|
|
$1,266.7
|
|
|
$163.9
|
|
|
$4.5
|
|
|
$1,435.1
|
|
|||
|
Depreciation and amortization
|
170.7
|
|
13.6
|
|
—
|
|
184.3
|
|
|||||||
|
Operating income (loss)
|
295.3
|
|
16.9
|
|
(3.5
|
)
|
308.7
|
|
|||||||
|
Interest expense
|
92.4
|
|
|||||||||||||
|
Equity income from unconsolidated investments
|
(35.1
|
)
|
—
|
|
—
|
|
(35.1
|
)
|
|||||||
|
Income taxes
|
82.9
|
|
|||||||||||||
|
Earnings available for common stock
|
176.3
|
|
|||||||||||||
|
Total assets
|
4,457.2
|
|
391.1
|
|
422.1
|
|
5,270.4
|
|
|||||||
|
Investments in equity method subsidiaries
|
302.0
|
|
—
|
|
—
|
|
302.0
|
|
|||||||
|
Construction and acquisition expenditures
|
294.6
|
|
49.7
|
|
—
|
|
344.3
|
|
|||||||
|
2014
|
Electric
|
Gas
|
Other
|
Total
|
|||||||||||
|
Operating revenues
|
|
$1,220.3
|
|
|
$221.0
|
|
|
$7.8
|
|
|
$1,449.1
|
|
|||
|
Depreciation and amortization
|
168.3
|
|
12.9
|
|
—
|
|
181.2
|
|
|||||||
|
Operating income (loss)
|
275.6
|
|
28.1
|
|
(2.7
|
)
|
301.0
|
|
|||||||
|
Interest expense
|
86.4
|
|
|||||||||||||
|
Equity income from unconsolidated investments
|
(42.8
|
)
|
—
|
|
—
|
|
(42.8
|
)
|
|||||||
|
Income taxes
|
85.3
|
|
|||||||||||||
|
Earnings available for common stock
|
180.4
|
|
|||||||||||||
|
Total assets
|
4,262.1
|
|
369.4
|
|
486.1
|
|
5,117.6
|
|
|||||||
|
Investments in equity method subsidiaries
|
294.3
|
|
—
|
|
—
|
|
294.3
|
|
|||||||
|
Construction and acquisition expenditures
|
284.8
|
|
28.1
|
|
—
|
|
312.9
|
|
|||||||
Service Agreements
-
IPL and WPL are parties to service agreements with an affiliate, Corporate Services. Pursuant to these service agreements, IPL and WPL receive various administrative and general services. These services are billed to IPL and WPL at cost based on expenses incurred by Corporate Services for the benefit of IPL and WPL, respectively. These costs consisted primarily of employee compensation and benefits, fees associated with various professional services, depreciation and amortization of property, plant and equipment, and a return on net assets. Corporate Services also acts as agent on behalf of IPL and WPL pursuant to the service agreements. As agent, Corporate Services enters into energy, capacity, ancillary services, and transmission sale and purchase transactions within MISO. Corporate Services assigns such sales and purchases among IPL and WPL based on statements received from MISO. The amounts billed for services provided, sales credited and purchases were as follows (in millions):
|
IPL
|
WPL
|
||||||||||||||||||||||
|
2016
|
2015
|
2014
|
2016
|
2015
|
2014
|
||||||||||||||||||
|
Corporate Services billings
|
|
$161
|
|
|
$150
|
|
|
$148
|
|
|
$133
|
|
|
$121
|
|
|
$116
|
|
|||||
|
Sales credited
|
8
|
|
10
|
8
|
7
|
|
24
|
6
|
|||||||||||||||
|
Purchases billed
|
433
|
|
366
|
422
|
102
|
|
66
|
125
|
|||||||||||||||
As of December 31, net intercompany payables to Corporate Services were as follows (in millions):
|
2016
|
2015
|
||||||
|
IPL
|
|
$104
|
|
|
$93
|
|
|
|
WPL
|
72
|
|
54
|
|
|||
123
ATC
-
Pursuant to various agreements, WPL receives a range of transmission services from ATC. WPL provides operation, maintenance, and construction services to ATC. WPL and ATC also bill each other for use of shared facilities owned by each party. The related amounts billed between the parties were as follows (in millions):
|
2016
|
2015
|
2014
|
|||||||||
|
ATC billings to WPL
|
|
$110
|
|
|
$101
|
|
|
$96
|
|
||
|
WPL billings to ATC
|
13
|
|
13
|
|
9
|
|
|||||
As of December 31,
2016
and
2015
, WPL owed ATC net amounts of
$8 million
and
$8 million
, respectively.
Refer to
Note 6(a)
for discussion of WPL’s transfer of its investment in ATC to ATI on December 31, 2016.
WPL’s Sheboygan Falls Lease
-
Refer to
Note 10(b)
for discussion of WPL’s Sheboygan Falls lease.
Franklin County Wind Farm
-
Refer to
Note 3
for discussion of a February 2017 FERC order approving the transfer of the Franklin County wind farm from AEF to IPL. Alliant Energy and IPL currently expect to complete this transfer in 2017.
In 2013, Alliant Energy sold RMT to narrow its strategic focus and risk profile. The operating results of RMT have been separately classified and reported as discontinued operations in Alliant Energy’s income statements. A summary of the components of discontinued operations in Alliant Energy’s income statements was as follows (in millions):
|
2016
|
2015
|
2014
|
|||||||||
|
Operating expenses
|
|
$3.9
|
|
|
$4.0
|
|
|
$3.7
|
|
||
|
Loss before income taxes
|
(3.9
|
)
|
(4.0
|
)
|
(3.7
|
)
|
|||||
|
Income tax benefit
|
(1.6
|
)
|
(1.5
|
)
|
(1.3
|
)
|
|||||
|
Loss from discontinued operations, net of tax
|
|
($2.3
|
)
|
|
($2.5
|
)
|
|
($2.4
|
)
|
||
Refer to
Note 16(d)
for further discussion of warranty claims associated with RMT that have resulted in operating expenses subsequent to the sale.
Alliant Energy
-
All “per share” references refer to earnings per diluted share. Summation of the individual quarters may not equal annual totals due to rounding. Refer to
Note 19
for additional information on discontinued operations.
|
2016
|
2015
|
||||||||||||||||||||||||||||||
|
March 31
|
June 30
|
Sep. 30
|
Dec. 31
|
March 31
|
June 30
|
Sep. 30
|
Dec. 31
|
||||||||||||||||||||||||
|
(in millions, except per share data)
|
|||||||||||||||||||||||||||||||
|
Operating revenues
|
|
$843.8
|
|
|
$754.6
|
|
|
$924.6
|
|
|
$797.0
|
|
|
$897.4
|
|
|
$717.2
|
|
|
$898.9
|
|
|
$740.1
|
|
|||||||
|
Operating income
|
145.9
|
|
128.6
|
|
162.6
|
|
99.9
|
|
152.9
|
|
109.0
|
|
235.9
|
|
79.2
|
|
|||||||||||||||
|
Amounts attributable to Alliant Energy common shareowners:
|
|||||||||||||||||||||||||||||||
|
Income from continuing operations, net of tax
|
97.6
|
|
84.4
|
|
128.8
|
|
63.0
|
|
96.6
|
|
68.9
|
|
180.0
|
|
35.2
|
|
|||||||||||||||
|
Loss from discontinued operations, net of tax
|
(1.1
|
)
|
(0.5
|
)
|
(0.4
|
)
|
(0.3
|
)
|
—
|
|
(1.3
|
)
|
(0.1
|
)
|
(1.1
|
)
|
|||||||||||||||
|
Net income
|
96.5
|
|
83.9
|
|
128.4
|
|
62.7
|
|
96.6
|
|
67.6
|
|
179.9
|
|
34.1
|
|
|||||||||||||||
|
Earnings per weighted average common share attributable to Alliant Energy common shareowners (a):
|
|||||||||||||||||||||||||||||||
|
Income from continuing operations, net of tax
|
0.43
|
|
0.37
|
|
0.57
|
|
0.28
|
|
0.43
|
|
0.31
|
|
0.79
|
|
0.16
|
|
|||||||||||||||
|
Loss from discontinued operations, net of tax
|
—
|
|
—
|
|
—
|
|
—
|
|
—
|
|
(0.01
|
)
|
—
|
|
(0.01
|
)
|
|||||||||||||||
|
Net income
|
0.43
|
|
0.37
|
|
0.57
|
|
0.28
|
|
0.43
|
|
0.30
|
|
0.79
|
|
0.15
|
|
|||||||||||||||
|
(a)
|
Amounts reflect the effects of a
two
-for-one common stock split distributed in May 2016
.
Refer to
Note 7
for additional details.
|
IPL
-
Earnings per share data is not disclosed for IPL given Alliant Energy is the sole shareowner of all shares of IPL’s common stock outstanding during the periods presented.
124
|
2016
|
2015
|
||||||||||||||||||||||||||||||
|
March 31
|
June 30
|
Sep. 30
|
Dec. 31
|
March 31
|
June 30
|
Sep. 30
|
Dec. 31
|
||||||||||||||||||||||||
|
(in millions)
|
|||||||||||||||||||||||||||||||
|
Operating revenues
|
|
$458.7
|
|
|
$411.0
|
|
|
$516.2
|
|
|
$434.5
|
|
|
$489.0
|
|
|
$382.2
|
|
|
$504.6
|
|
|
$398.7
|
|
|||||||
|
Operating income
|
62.0
|
|
48.0
|
|
125.9
|
|
34.9
|
|
65.5
|
|
33.8
|
|
117.0
|
|
25.6
|
|
|||||||||||||||
|
Net income
|
48.2
|
|
34.4
|
|
116.7
|
|
26.5
|
|
50.1
|
|
19.0
|
|
119.1
|
|
8.0
|
|
|||||||||||||||
|
Earnings available for common stock
|
45.6
|
|
31.9
|
|
114.1
|
|
24.0
|
|
47.5
|
|
16.5
|
|
116.5
|
|
5.5
|
|
|||||||||||||||
WPL
-
Earnings per share data is not disclosed for WPL given Alliant Energy is the sole shareowner of all shares of WPL’s common stock outstanding during the periods presented.
|
2016
|
2015
|
||||||||||||||||||||||||||||||
|
March 31
|
June 30
|
Sep. 30
|
Dec. 31
|
March 31
|
June 30
|
Sep. 30
|
Dec. 31
|
||||||||||||||||||||||||
|
(in millions)
|
|||||||||||||||||||||||||||||||
|
Operating revenues
|
|
$375.6
|
|
|
$334.3
|
|
|
$397.0
|
|
|
$352.2
|
|
|
$397.1
|
|
|
$324.7
|
|
|
$382.6
|
|
|
$330.7
|
|
|||||||
|
Operating income
|
78.8
|
|
75.0
|
|
115.0
|
|
58.2
|
|
80.8
|
|
68.3
|
|
110.3
|
|
49.3
|
|
|||||||||||||||
|
Net income
|
47.0
|
|
43.7
|
|
69.6
|
|
32.5
|
|
45.1
|
|
39.7
|
|
68.4
|
|
24.4
|
|
|||||||||||||||
|
Earnings available for common stock
|
46.5
|
|
43.2
|
|
69.0
|
|
31.7
|
|
44.9
|
|
39.2
|
|
68.0
|
|
24.2
|
|
|||||||||||||||
None.
Alliant Energy’s, IPL’s and WPL’s management evaluated, with the participation of each of Alliant Energy’s, IPL’s and WPL’s Chief Executive Officer, Chief Financial Officer and Disclosure Committee, the effectiveness of the design and operation of Alliant Energy’s, IPL’s and WPL’s disclosure controls and procedures as of the end of the quarter ended
December 31, 2016
pursuant to the requirements of the Securities Exchange Act of 1934, as amended. Based on their evaluation, the Chief Executive Officer and the Chief Financial Officer concluded that Alliant Energy’s, IPL’s and WPL’s disclosure controls and procedures were effective as of the end of the quarter ended
December 31, 2016
.
There was no change in Alliant Energy’s, IPL’s and WPL’s internal control over financial reporting that occurred during the quarter ended
December 31, 2016
that has materially affected, or is reasonably likely to materially affect, Alliant Energy’s, IPL’s and WPL’s internal control over financial reporting.
Management’s Annual Report on Internal Control over Financial Reporting
-
The management of Alliant Energy, IPL and WPL are responsible for establishing and maintaining adequate internal control over financial reporting, as such term is defined in Rules 13a-15(f) and 15d-15(f) under the Securities Exchange Act of 1934. Alliant Energy’s, IPL’s and WPL’s internal control over financial reporting is designed to provide reasonable assurance regarding the reliability of financial reporting and the preparation of financial statements for external purposes in accordance with GAAP.
Because of the inherent limitations of internal control over financial reporting, misstatements may not be prevented or detected on a timely basis. Also, projections of any evaluation of the effectiveness of the internal control over financial reporting to future periods are subject to the risk that the controls may become inadequate because of changes in conditions, or that the degree of compliance with the policies or procedures may deteriorate.
Alliant Energy’s, IPL’s and WPL’s management assessed the effectiveness of their respective internal control over financial reporting as of
December 31, 2016
using the criteria set forth in
Internal Control - Integrated Framework (2013)
issued by the Committee of Sponsoring Organizations of the Treadway Commission. Based on these assessments, Alliant Energy’s, IPL’s and WPL’s management concluded that, as of
December 31, 2016
, their respective internal control over financial reporting was effective.
Deloitte & Touche LLP, Alliant Energy’s independent registered public accounting firm, has audited Alliant Energy’s internal control over financial reporting. That report is included herein. This Annual Report on Form 10-K does not include an attestation report of IPL’s and WPL’s independent registered public accounting firm regarding their respective internal control over financial reporting. Management’s report was not subject to attestation by IPL’s and WPL’s independent registered public accounting firm pursuant to rules of the SEC that permit IPL and WPL to provide only management’s report in this Annual Report on Form 10-K.
125
REPORT OF INDEPENDENT REGISTERED PUBLIC ACCOUNTING FIRM
To the Board of Directors and Shareowners of
Alliant Energy Corporation
Madison, Wisconsin
We have audited the internal control over financial reporting of Alliant Energy Corporation and subsidiaries (the “Company”) as of
December 31, 2016
, based on the
criteria established in
Internal Control - Integrated Framework (2013)
issued by the Committee of Sponsoring Organizations of the Treadway Commission. The Company’s management is responsible for maintaining effective internal control over financial reporting and for its assessment of the effectiveness of internal control over financial reporting, included in the accompanying Management’s Annual Report on Internal Control over Financial Reporting. Our responsibility is to express an opinion on the Company’s internal control over financial reporting based on our audit.
We conducted our audit in accordance with the standards of the Public Company Accounting Oversight Board (United States). Those standards require that we plan and perform the audit to obtain reasonable assurance about whether effective internal control over financial reporting was maintained in all material respects. Our audit included obtaining an understanding of internal control over financial reporting, assessing the risk that a material weakness exists, testing and evaluating the design and operating effectiveness of internal control based on the assessed risk, and performing such other procedures as we considered necessary in the circumstances. We believe that our audit provides a reasonable basis for our opinion.
A company’s internal control over financial reporting is a process designed by, or under the supervision of, the company’s principal executive and principal financial officers, or persons performing similar functions, and effected by the company’s board of directors, management, and other personnel to provide reasonable assurance regarding the reliability of financial reporting and the preparation of financial statements for external purposes in accordance with generally accepted accounting principles. A company’s internal control over financial reporting includes those policies and procedures that (1) pertain to the maintenance of records that, in reasonable detail, accurately and fairly reflect the transactions and dispositions of the assets of the company; (2) provide reasonable assurance that transactions are recorded as necessary to permit preparation of financial statements in accordance with generally accepted accounting principles, and that receipts and expenditures of the company are being made only in accordance with authorizations of management and directors of the company; and (3) provide reasonable assurance regarding prevention or timely detection of unauthorized acquisition, use, or disposition of the company’s assets that could have a material effect on the financial statements.
Because of the inherent limitations of internal control over financial reporting, including the possibility of collusion or improper management override of controls, material misstatements due to error or fraud may not be prevented or detected on a timely basis. Also, projections of any evaluation of the effectiveness of the internal control over financial reporting to future periods are subject to the risk that the controls may become inadequate because of changes in conditions, or that the degree of compliance with the policies or procedures may deteriorate.
In our opinion, the Company maintained, in all material respects, effective internal control over financial reporting as of
December 31, 2016
, based on the criteria established in
Internal Control - Integrated Framework (2013)
issued by the Committee of Sponsoring Organizations of the Treadway Commission.
We have also audited, in accordance with the standards of the Public Company Accounting Oversight Board (United States), the consolidated financial statements and financial statement schedules as of and for the year ended
December 31, 2016
of the Company and our report dated
February 24, 2017
expressed an unqualified opinion on those financial statements and financial statement schedules.
/s/ DELOITTE & TOUCHE LLP
DELOITTE & TOUCHE LLP
Milwaukee, Wisconsin
February 24, 2017
126
None.
The directors of Alliant Energy, IPL and WPL are the same, and therefore, the information required by Item 10 relating to directors and nominees for election of directors is the same for all registrants. The information required by Item 10 relating to directors and nominees for election of directors at the
2017
Annual Meeting of Shareowners, the timely filing of reports under Section 16 of the Securities Exchange Act of 1934, audit committees and audit committee financial experts, and Alliant Energy’s, IPL’s and WPL’s Code of Conduct is incorporated herein by reference to the relevant information in the
2017
Alliant Energy Proxy Statement, which will be filed with the SEC within 120 days after the end of Alliant Energy’s, IPL’s and WPL’s fiscal years. The code of ethics, also referred to as the Code of Conduct, of Alliant Energy, IPL and WPL are the same. Information regarding executive officers of Alliant Energy, IPL and WPL may be found in Part I of this report under the caption “
Executive Officers of the Registrants
.”
The directors and executive officers of Alliant Energy, IPL and WPL for which compensation information must be included are the same. Therefore, the information required by Item 11 for each of Alliant Energy, IPL and WPL is incorporated herein by reference to the relevant information in the
2017
Alliant Energy Proxy Statement, which will be filed with the SEC within 120 days after the end of Alliant Energy’s, IPL’s and WPL’s fiscal years.
ALLIANT ENERGY
Information regarding Alliant Energy’s equity compensation plans as of
December 31, 2016
was as follows:
|
(A)
|
(C)
|
|||||
|
Number of securities to be
|
(B)
|
Number of securities remaining available
|
||||
|
issued upon exercise of
|
Weighted-average exercise
|
for future issuance under equity
|
||||
|
outstanding options,
|
price of outstanding options,
|
compensation plans (excluding
|
||||
|
Plan Category
|
warrants and rights
|
warrants and rights
|
securities reflected in column (A))
|
|||
|
Equity compensation plans approved by shareowners
|
655,936 (a)
|
$31.98
|
7,363,980 (b)
|
|||
|
Equity compensation plans not approved by shareowners (c)
|
N/A
|
N/A
|
N/A (d)
|
|||
|
655,936
|
$31.98
|
7,363,980
|
||||
|
(a)
|
Represents performance shares, performance restricted stock units and restricted stock units granted under the OIP. Performance shares may be paid out in shares of Alliant Energy’s common stock, cash, or a combination of cash and stock and performance restricted stock units are paid out in shares of Alliant Energy’s common stock. The awards are adjusted by a performance multiplier, which ranges from zero to 200%, based on the performance criteria. The performance share and performance restricted stock unit awards included in column (A) of the table reflect an assumed payout in the form of Alliant Energy’s common stock at the maximum performance multiplier of 200% for the
2016
and
2015
grants and at the estimated payout percentage of 148% for the
2014
grants. Also included are restricted stock units granted under the OIP, which may be paid out in shares of Alliant Energy’s common stock, cash, or a combination of cash and stock at the expiration of a three-year time-vesting period.
|
|
(b)
|
All of the available shares under the Amended and Restated OIP may be issued as awards in the form of shares of Alliant Energy’s common stock, restricted stock, restricted stock units, performance shares, performance units and other stock-based or cash-based awards. As of
December 31, 2016
, there were performance shares, restricted stock awards, performance restricted stock units and restricted stock units outstanding under the Amended and Restated OIP. Excludes
190,244
shares of non-vested restricted common stock previously issued and outstanding under the Amended and Restated OIP at
December 31, 2016
.
|
|
(c)
|
As of
December 31, 2016
, there were
441,695
shares of Alliant Energy’s common stock outstanding under the DCP, which is described in
Note 12(c)
.
|
|
(d)
|
There is no limit on the number of shares of Alliant Energy’s common stock that may be held under the DCP.
|
127
The remainder of the information required by Item 12 is incorporated herein by reference to the relevant information in the
2017
Alliant Energy Proxy Statement, which will be filed with the SEC within 120 days after the end of Alliant Energy’s fiscal year.
IPL AND WPL
None of IPL’s directors or executive officers own any shares of preferred stock in IPL. The remainder of the information required by Item 12 is incorporated herein by reference to the relevant information in the
2017
Alliant Energy Proxy Statement, which will be filed with the SEC within 120 days after the end of IPL’s and WPL’s fiscal years.
The information required by Item 13 for each of Alliant Energy, IPL and WPL is incorporated herein by reference to the relevant information in the
2017
Alliant Energy Proxy Statement, which will be filed with the SEC within 120 days after the end of Alliant Energy’s, IPL’s and WPL’s fiscal years.
ALLIANT ENERGY
The information required by Item 14 is incorporated herein by reference to the relevant information in the
2017
Alliant Energy Proxy Statement, which will be filed with the SEC within 120 days after the end of Alliant Energy’s fiscal year.
IPL AND WPL
Each of IPL’s and WPL’s Audit Committee of the Board of Directors has adopted a policy that requires advance approval of all audit, audit-related, tax and other permitted services performed by the independent registered public accounting firm. The policy provides for pre-approval by the Audit Committee of specifically defined audit and non-audit services after the Audit Committee is provided with the appropriate level of details regarding the specific services to be provided. The policy does not permit delegation of the Audit Committee’s authority to management. In the event the need for specific services arises between Audit Committee meetings, the Audit Committee has delegated to the Chairperson of the Audit Committee authority to approve permitted services provided that the Chairperson reports any decisions to the Audit Committee at its next scheduled meeting. The principal accounting fees billed to Alliant Energy by its independent registered public accounting firm, all of which were approved in advance by the Audit Committee, directly related and allocated to IPL and WPL were as follows (in thousands):
|
IPL
|
WPL
|
||||||||||||||||||||||||||
|
2016
|
2015
|
2016
|
2015
|
||||||||||||||||||||||||
|
Fees
|
% of Total
|
Fees
|
% of Total
|
Fees
|
% of Total
|
Fees
|
% of Total
|
||||||||||||||||||||
|
Audit fees
|
|
$1,035
|
|
93
|
%
|
|
$1,036
|
|
91
|
%
|
|
$1,008
|
|
95
|
%
|
|
$969
|
|
95
|
%
|
|||||||
|
Audit-related fees
|
64
|
|
6
|
%
|
90
|
|
8
|
%
|
41
|
|
4
|
%
|
41
|
|
4
|
%
|
|||||||||||
|
All other fees
|
8
|
|
1
|
%
|
7
|
|
1
|
%
|
7
|
|
1
|
%
|
7
|
|
1
|
%
|
|||||||||||
|
|
$1,107
|
|
100
|
%
|
|
$1,133
|
|
100
|
%
|
|
$1,056
|
|
100
|
%
|
|
$1,017
|
|
100
|
%
|
||||||||
IPL’s and WPL’s audit fees for
2016
and
2015
consisted of the respective fees billed for the audits of the financial statements of IPL and its subsidiary and WPL and its subsidiary, for reviews of financial statements included in Form 10-Q filings, and for services normally provided in connection with statutory and regulatory filings, such as financing transactions. IPL’s and
WPL’s audit fees also included their respective portion of fees for the
2016
and
2015
audits of Alliant Energy’s financial statements and effectiveness of internal controls over financial reporting. IPL’s and WPL’s audit-related fees for
2016
and
2015
consisted of the fees billed for services rendered related to employee benefits plan audits and other attest services. All other fees for
2016
and
2015
for IPL and WPL consisted of license fees for accounting research software products and seminars. IPL and WPL did not have any tax fees for
2016
or
2015
. The Audit Committee does not consider the provision of non-audit services by the independent registered public accounting firm described above to be incompatible with maintaining independence of the independent registered public accounting firm.
128
|
(1)
|
Consolidated Financial Statements - Refer to
Item 8
Financial Statements and Supplementary Data.
|
|
(2)
|
Financial Statement Schedules
-
|
Schedule I
. Condensed Parent Company Financial Statements
Schedule II
. Valuation and Qualifying Accounts and Reserves
NOTE: All other schedules are omitted because they are not applicable or not required, or because that required information is shown either in the financial statements or in the notes thereto.
|
(3)
|
Exhibits Required by SEC Regulation S-K
- Exhibits for Alliant Energy, IPL and WPL are listed in the
Exhibit Index
, which is incorporated herein by reference.
|
SCHEDULE I - CONDENSED PARENT COMPANY FINANCIAL STATEMENTS
ALLIANT ENERGY CORPORATION (Parent Company Only)
CONDENSED STATEMENTS OF INCOME
|
Year Ended December 31,
|
|||||||||||
|
2016
|
2015
|
2014
|
|||||||||
|
(in millions)
|
|||||||||||
|
Operating revenues
|
|
$1
|
|
|
$2
|
|
|
$2
|
|
||
|
Operating expenses
|
3
|
|
3
|
|
3
|
|
|||||
|
Operating loss
|
(2
|
)
|
(1
|
)
|
(1
|
)
|
|||||
|
Interest expense and other:
|
|||||||||||
|
Equity earnings from consolidated subsidiaries
|
(374
|
)
|
(379
|
)
|
(388
|
)
|
|||||
|
Interest expense
|
3
|
|
3
|
|
9
|
|
|||||
|
Interest income
|
(2
|
)
|
(3
|
)
|
(2
|
)
|
|||||
|
Total interest expense and other
|
(373
|
)
|
(379
|
)
|
(381
|
)
|
|||||
|
Income before income taxes
|
371
|
|
378
|
|
380
|
|
|||||
|
Income tax benefit
|
(1
|
)
|
(1
|
)
|
(3
|
)
|
|||||
|
Net income
|
|
$372
|
|
|
$379
|
|
|
$383
|
|
||
The accompanying Notes to Condensed Financial Statements are an integral part of these statements.
129
ALLIANT ENERGY CORPORATION (Parent Company Only)
CONDENSED BALANCE SHEETS
|
December 31,
|
|||||||
|
2016
|
2015
|
||||||
|
(in millions)
|
|||||||
|
ASSETS
|
|||||||
|
Current assets:
|
|||||||
|
Notes receivable from affiliated companies
|
|
$74
|
|
|
$93
|
|
|
|
Other
|
5
|
|
9
|
|
|||
|
Total current assets
|
79
|
|
102
|
|
|||
|
Investments:
|
|||||||
|
Investments in consolidated subsidiaries
|
4,211
|
|
3,999
|
|
|||
|
Other
|
2
|
|
14
|
|
|||
|
Total investments
|
4,213
|
|
4,013
|
|
|||
|
Other assets
|
64
|
|
20
|
|
|||
|
Total assets
|
|
$4,356
|
|
|
$4,135
|
|
|
|
LIABILITIES AND EQUITY
|
|||||||
|
Current liabilities:
|
|||||||
|
Current maturities of long-term debt
|
|
$—
|
|
|
$250
|
|
|
|
Commercial paper
|
192
|
|
140
|
|
|||
|
Notes payable to affiliated companies
|
275
|
|
—
|
|
|||
|
Other
|
12
|
|
12
|
|
|||
|
Total current liabilities
|
479
|
|
402
|
|
|||
|
Other liabilities
|
18
|
|
12
|
|
|||
|
Common equity:
|
|||||||
|
Common stock and additional paid-in capital
|
1,695
|
|
1,664
|
|
|||
|
Retained earnings
|
2,174
|
|
2,066
|
|
|||
|
Shares in deferred compensation trust
|
(10
|
)
|
(9
|
)
|
|||
|
Total common equity
|
3,859
|
|
3,721
|
|
|||
|
Total liabilities and equity
|
|
$4,356
|
|
|
$4,135
|
|
|
The accompanying Notes to Condensed Financial Statements are an integral part of these statements.
130
ALLIANT ENERGY CORPORATION (Parent Company Only)
CONDENSED STATEMENTS OF CASH FLOWS
|
|
Year Ended December 31,
|
||||||||||
|
|
2016
|
|
2015
|
|
2014
|
||||||
|
|
(in millions)
|
||||||||||
|
Net cash flows from operating activities
|
|
$254
|
|
|
|
$262
|
|
|
|
$246
|
|
|
Cash flows from (used for) investing activities:
|
|
|
|
|
|
|
|
|
|||
|
Capital contributions to consolidated subsidiaries
|
(250
|
)
|
|
(165
|
)
|
|
(90
|
)
|
|||
|
Capital repayments from consolidated subsidiaries
|
130
|
|
|
—
|
|
|
50
|
|
|||
|
Net change in notes receivable from and payable to affiliates
|
294
|
|
2
|
|
(23
|
)
|
|||||
|
Other
|
10
|
|
|
—
|
|
|
—
|
|
|||
|
Net cash flows from (used for) investing activities
|
184
|
|
|
(163
|
)
|
|
(63
|
)
|
|||
|
Cash flows used for financing activities:
|
|
|
|
|
|
|
|
|
|||
|
Common stock dividends
|
(267
|
)
|
|
(247
|
)
|
|
(226
|
)
|
|||
|
Proceeds from issuance of common stock, net
|
27
|
|
151
|
|
—
|
|
|||||
|
Proceeds from issuance of long-term debt
|
—
|
|
—
|
|
250
|
|
|||||
|
Payments to retire long-term debt
|
(250
|
)
|
—
|
|
(250
|
)
|
|||||
|
Net change in commercial paper
|
52
|
|
|
(1
|
)
|
|
45
|
|
|||
|
Other
|
—
|
|
|
(2
|
)
|
|
(2
|
)
|
|||
|
Net cash flows used for financing activities
|
(438
|
)
|
|
(99
|
)
|
|
(183
|
)
|
|||
|
Net decrease in cash and cash equivalents
|
—
|
|
|
—
|
|
|
—
|
|
|||
|
Cash and cash equivalents at beginning of period
|
—
|
|
|
—
|
|
|
—
|
|
|||
|
Cash and cash equivalents at end of period
|
|
$—
|
|
|
|
$—
|
|
|
|
$—
|
|
|
Supplemental cash flows information:
|
|
|
|
|
|
|
|
|
|||
|
Cash paid during the period for:
|
|
|
|
|
|
|
|
|
|||
|
Interest, net of capitalized interest
|
|
($3
|
)
|
|
|
($3
|
)
|
|
|
($11
|
)
|
|
Income taxes, net
|
(37
|
)
|
|
(9
|
)
|
|
(5
|
)
|
|||
The accompanying Notes to Condensed Financial Statements are an integral part of these statements.
ALLIANT ENERGY CORPORATION
(Parent Company Only)
NOTES TO CONDENSED FINANCIAL STATEMENTS
Pursuant to rules and regulations of the SEC, the Condensed Financial Statements of Alliant Energy Corporation (Parent Company Only) do not reflect all of the information and notes normally included with financial statements prepared in accordance with GAAP. Therefore, these Condensed Financial Statements should be read in conjunction with the Financial Statements and related Notes included in the combined
2016
Form 10-K, Part II,
Item 8
, which is incorporated herein by reference.
In the Condensed Financial Statements of Alliant Energy Corporation (Parent Company Only), investments in subsidiaries are accounted for using the equity method.
131
SCHEDULE II - VALUATION AND QUALIFYING ACCOUNTS AND RESERVES
|
Additions
|
|||||||
|
Balance,
|
Charged to
|
Charged to Other
|
Balance,
|
||||
|
Description
|
January 1
|
Expense
|
Accounts (a)
|
Deductions (b)
|
December 31
|
||
|
(in millions)
|
|||||||
Valuation and Qualifying Accounts Which are Deducted in the Balance Sheet From the Assets to Which They Apply:
|
Accumulated Provision for Uncollectible Accounts:
|
||||||||||||||||||
|
Alliant Energy (c)
|
||||||||||||||||||
|
Year ended December 31, 2016
|
|
$4.8
|
|
|
$17.4
|
|
|
$8.8
|
|
|
$22.3
|
|
|
$8.7
|
|
|||
|
Year ended December 31, 2015
|
5.1
|
|
8.1
|
|
3.0
|
|
11.4
|
|
4.8
|
|
||||||||
|
Year ended December 31, 2014
|
4.8
|
|
11.7
|
|
4.1
|
|
15.5
|
|
5.1
|
|
||||||||
|
IPL (c)
|
||||||||||||||||||
|
Year ended December 31, 2016
|
|
$0.6
|
|
|
$17.2
|
|
|
$—
|
|
|
$16.7
|
|
|
$1.1
|
|
|||
|
Year ended December 31, 2015
|
0.4
|
|
8.1
|
|
—
|
|
7.9
|
|
0.6
|
|
||||||||
|
Year ended December 31, 2014
|
0.7
|
|
11.5
|
|
—
|
|
11.8
|
|
0.4
|
|
||||||||
|
WPL
|
||||||||||||||||||
|
Year ended December 31, 2016
|
|
$3.7
|
|
|
$0.1
|
|
|
$8.8
|
|
|
$5.5
|
|
|
$7.1
|
|
|||
|
Year ended December 31, 2015
|
4.2
|
|
—
|
|
3.0
|
|
3.5
|
|
3.7
|
|
||||||||
|
Year ended December 31, 2014
|
1.7
|
|
—
|
|
4.1
|
|
1.6
|
|
4.2
|
|
||||||||
Note: The above provisions relate to various customer, notes and other receivable balances included in various line items on the respective balance sheets.
Other Reserves:
|
Accumulated Provision for Other Reserves (d):
|
||||||||||||||||||
|
Alliant Energy
|
||||||||||||||||||
|
Year ended December 31, 2016
|
|
$27.1
|
|
|
$6.1
|
|
|
$—
|
|
|
$8.1
|
|
|
$25.1
|
|
|||
|
Year ended December 31, 2015
|
32.6
|
|
6.5
|
|
—
|
|
12.0
|
|
27.1
|
|
||||||||
|
Year ended December 31, 2014
|
38.2
|
|
12.5
|
|
—
|
|
18.1
|
|
32.6
|
|
||||||||
|
IPL
|
||||||||||||||||||
|
Year ended December 31, 2016
|
|
$9.4
|
|
|
$1.0
|
|
|
$—
|
|
|
$1.7
|
|
|
$8.7
|
|
|||
|
Year ended December 31, 2015
|
10.6
|
|
2.1
|
|
—
|
|
3.3
|
|
9.4
|
|
||||||||
|
Year ended December 31, 2014
|
18.1
|
|
3.9
|
|
—
|
|
11.4
|
|
10.6
|
|
||||||||
|
WPL
|
||||||||||||||||||
|
Year ended December 31, 2016
|
|
$11.4
|
|
|
$1.8
|
|
|
$—
|
|
|
$5.1
|
|
|
$8.1
|
|
|||
|
Year ended December 31, 2015
|
16.3
|
|
0.7
|
|
—
|
|
5.6
|
|
11.4
|
|
||||||||
|
Year ended December 31, 2014
|
16.2
|
|
2.5
|
|
—
|
|
2.4
|
|
16.3
|
|
||||||||
|
(a)
|
Accumulated provision for uncollectible accounts: In accordance with its regulatory treatment, certain amounts provided by WPL are recorded in regulatory assets. WPL expenses these amounts when an uncollectible account is written-off.
|
|
(b)
|
Deductions are of the nature for which the reserves were created. In the case of the accumulated provision for uncollectible accounts, deductions from this reserve are reduced by recoveries of amounts previously written off.
|
|
(c)
|
Refer to
Note 5(b)
for discussion of IPL’s sales of accounts receivable program.
|
|
(d)
|
Other reserves are largely related to injury and damage claims arising in the ordinary course of business.
|
132
SIGNATURES
Pursuant to the requirements of Section 13 or 15(d) of the Securities Exchange Act of 1934, the Registrants have duly caused this report to be signed on their behalf by the undersigned, thereunto duly authorized on the
24th day of February 2017
.
|
ALLIANT ENERGY
|
INTERSTATE POWER
|
WISCONSIN POWER
|
||
|
CORPORATION
|
AND LIGHT COMPANY
|
AND LIGHT COMPANY
|
||
|
By:
/s/ Patricia L. Kampling
|
By:
/s/ Patricia L. Kampling
|
By:
/s/ Patricia L. Kampling
|
||
|
Patricia L. Kampling
|
Patricia L. Kampling
|
Patricia L. Kampling
|
||
|
Chairman, President and Chief Executive Officer
|
Chairman and Chief Executive Officer
|
Chairman and Chief Executive Officer
|
||
Pursuant to the requirements of the Securities Exchange Act of 1934, this report has been signed below by the following persons on behalf of the Registrants and in the capacities indicated on the
24th day of February 2017
.
|
ALLIANT ENERGY
|
INTERSTATE POWER
|
WISCONSIN POWER
|
||
|
CORPORATION
|
AND LIGHT COMPANY
|
AND LIGHT COMPANY
|
||
|
By:
/s/ Patricia L. Kampling
|
By:
/s/ Patricia L. Kampling
|
By:
/s/ Patricia L. Kampling
|
||
|
Patricia L. Kampling
|
Patricia L. Kampling
|
Patricia L. Kampling
|
||
|
Chairman, President, Chief Executive Officer and Director (Principal Executive Officer)
|
Chairman, Chief Executive Officer and Director (Principal Executive Officer)
|
Chairman, Chief Executive Officer and Director (Principal Executive Officer)
|
||
|
/s/ Robert J. Durian
|
/s/ Robert J. Durian
|
/s/ Robert J. Durian
|
||
|
Robert J. Durian
|
Robert J. Durian
|
Robert J. Durian
|
||
|
Vice President, Chief Financial Officer and Treasurer (Principal Financial Officer)
|
Vice President, Chief Financial Officer and Treasurer (Principal Financial Officer)
|
Vice President, Chief Financial Officer and Treasurer (Principal Financial Officer)
|
||
|
/s/ Benjamin M. Bilitz
|
/s/ Benjamin M. Bilitz
|
/s/ Benjamin M. Bilitz
|
||
|
Benjamin M. Bilitz
|
Benjamin M. Bilitz
|
Benjamin M. Bilitz
|
||
|
Chief Accounting Officer and Controller (Principal Accounting Officer)
|
Chief Accounting Officer and Controller (Principal Accounting Officer)
|
Chief Accounting Officer and Controller (Principal Accounting Officer)
|
||
|
/s/ Patrick E. Allen
|
/s/ Patrick E. Allen
|
/s/ Patrick E. Allen
|
||
|
Patrick E. Allen, Director
|
Patrick E. Allen, Director
|
Patrick E. Allen, Director
|
||
|
/s/ Michael L. Bennett
|
/s/ Michael L. Bennett
|
/s/ Michael L. Bennett
|
||
|
Michael L. Bennett, Director
|
Michael L. Bennett, Director
|
Michael L. Bennett, Director
|
||
|
/s/ Deborah B. Dunie
|
/s/ Deborah B. Dunie
|
/s/ Deborah B. Dunie
|
||
|
Deborah B. Dunie, Director
|
Deborah B. Dunie, Director
|
Deborah B. Dunie, Director
|
||
|
/s/ Darryl B. Hazel
|
/s/ Darryl B. Hazel
|
/s/ Darryl B. Hazel
|
||
|
Darryl B. Hazel, Director
|
Darryl B. Hazel, Director
|
Darryl B. Hazel, Director
|
||
|
/s/ Singleton B. McAllister
|
/s/ Singleton B. McAllister
|
/s/ Singleton B. McAllister
|
||
|
Singleton B. McAllister, Director
|
Singleton B. McAllister, Director
|
Singleton B. McAllister, Director
|
||
|
/s/ Thomas F. O’Toole
|
/s/ Thomas F. O’Toole
|
/s/ Thomas F. O’Toole
|
||
|
Thomas F. O’Toole, Director
|
Thomas F. O’Toole, Director
|
Thomas F. O’Toole, Director
|
||
|
/s/ Dean C. Oestreich
|
/s/ Dean C. Oestreich
|
/s/ Dean C. Oestreich
|
||
|
Dean C. Oestreich, Director
|
Dean C. Oestreich, Director
|
Dean C. Oestreich, Director
|
||
|
/s/ Carol P. Sanders
|
/s/ Carol P. Sanders
|
/s/ Carol P. Sanders
|
||
|
Carol P. Sanders, Director
|
Carol P. Sanders, Director
|
Carol P. Sanders, Director
|
||
|
/s/ Susan D. Whiting
|
/s/ Susan D. Whiting
|
/s/ Susan D. Whiting
|
||
|
Susan D. Whiting, Director
|
Susan D. Whiting, Director
|
Susan D. Whiting, Director
|
||
133
ALLIANT ENERGY CORPORATION
INTERSTATE POWER AND LIGHT COMPANY
WISCONSIN POWER AND LIGHT COMPANY
EXHIBIT INDEX
The following Exhibits are filed herewith or incorporated herein by reference.
Pursuant to Item 601(b)(4)(iii) of Regulation S-K, the registrants agree to furnish to the Securities and Exchange Commission, upon request, any instrument defining the rights of holders of unregistered long-term debt not filed as an exhibit to this combined Form 10-K. No such instrument authorizes securities in excess of 10% of the total assets of Alliant Energy, IPL or WPL, as the case may be.
|
Exhibit Number
|
Description
|
|
|
3.1
|
Restated Articles of Incorporation of Alliant Energy, as amended (incorporated by reference to Exhibit 4.1 to Alliant Energy’s Registration Statement on Form S-8 (Reg. No. 333-117654))
|
|
|
3.1a
|
Articles of Amendment to Restated Articles of Incorporation of Alliant Energy, as amended, effective May 4, 2016 (incorporated by reference to Exhibit 3.1 to Alliant Energy’s Form 10-Q for the quarter ended March 31, 2016 (File No. 1-9894))
|
|
|
3.2
|
Amended and Restated Bylaws of Alliant Energy, effective May 7, 2015 (incorporated by reference to Exhibit 3.1 to Alliant Energy’s Form 8-K, filed May 13, 2015 (File No. 1-9894))
|
|
|
3.3
|
Amended and Restated Articles of Incorporation of WPL, effective May 9, 2013 (incorporated by reference to Exhibit 3.4 to WPL’s Form 8-K, filed May 13, 2013 (File No. 0-337))
|
|
|
3.4
|
Amended and Restated Bylaws of WPL, effective May 7, 2015 (incorporated by reference to Exhibit 3.3 to WPL’s Form 8-K, filed May 13, 2015 (File No. 0-337))
|
|
|
3.5
|
Amended and Restated Articles of Incorporation of IPL, effective May 10, 2013 (incorporated by reference to Exhibit 3.2 to IPL’s Form 8-K, filed May 13, 2013 (File No. 1-4117))
|
|
|
3.6
|
Amended and Restated Bylaws of IPL, effective May 7, 2015 (incorporated by reference to Exhibit 3.2 to IPL’s Form 8-K, filed May 13, 2015 (File No. 1-4117))
|
|
|
4.1
|
Third Amended and Restated Five Year Credit Agreement, dated December 14, 2011, among Alliant Energy and the Banks set forth therein (incorporated by reference to Exhibit 99.1 to Alliant Energy’s Form 8-K, filed December 19, 2011 (File No. 1-9894))
|
|
|
4.2
|
Senior Note Indenture, dated as of September 30, 2009, between Alliant Energy and Wells Fargo Bank, National Association (N.A.) (incorporated by reference to Exhibit 4.28 to Alliant Energy’s Registration Statement on Form S-3 (Reg. No. 333-162214))
|
|
|
4.3
|
Amended and Restated Rights Agreement, dated as of December 11, 2008, between Alliant Energy and Wells Fargo Bank, N.A. (incorporated by reference to Exhibit 4.1 to Alliant Energy’s Registration Statement on Form 8-A/A, filed December 12, 2008 (File No. 1-9894))
|
|
|
4.4
|
Third Amended and Restated Five Year Credit Agreement, dated December 14, 2011, among WPL and the Banks set forth therein (incorporated by reference to Exhibit 99.3 to WPL’s Form 8-K, filed December 19, 2011 (File No. 0-337))
|
|
|
4.5
|
Indenture, dated as of June 20, 1997, between WPL and Wells Fargo Bank, N.A., Successor, as Trustee (incorporated by reference to Exhibit 4.33 to Amendment No. 2 to WPL’s Registration Statement on Form S-3 (Reg. No. 033-60917))
|
|
|
4.6
|
Officers’ Certificate, dated as of July 28, 2004, creating WPL’s 6.25% Debentures due July 31, 2034 (incorporated by reference to Exhibit 4.1 to WPL’s Form 8-K, filed August 2, 2004 (File No. 0-337))
|
|
|
4.7
|
Officers’ Certificate, dated as of August 8, 2007, creating WPL’s 6.375% Debentures due August 15, 2037 (incorporated by reference to Exhibit 4.1 to WPL’s Form 8-K, filed August 9, 2007 (File No. 0-337))
|
|
|
4.8
|
Officer’s Certificate, dated as of October 1, 2008, creating WPL’s 7.60% Debentures due October 1, 2038 (incorporated by reference to Exhibit 4.2 to WPL’s Form 8-K, filed October 2, 2008 (File No. 0-337))
|
|
|
4.9
|
Officers’ Certificate, dated as of July 7, 2009, creating WPL’s 5.00% Debentures due July 15, 2019 (incorporated by reference to Exhibit 4.2 to WPL’s Form 8-K, filed July 8, 2009 (File No. 0-337))
|
|
|
4.10
|
Officers’ Certificate, dated as of June 10, 2010, creating WPL’s 4.60% Debentures due June 15, 2020 (incorporated by reference to Exhibit 4.2 to WPL’s Form 8-K, filed June 11, 2010 (File No. 0-337))
|
|
|
4.11
|
Officers’ Certificate, dated as of November 19, 2012, creating WPL’s 2.25% Debentures due November 15, 2022 (incorporated by reference to Exhibit 4.1 to WPL’s Form 8-K, filed November 19, 2012 (File No. 0-337))
|
|
|
4.12
|
Officers’ Certificate, dated as of October 14, 2014, creating WPL’s 4.10% Debentures due October 15, 2044 (incorporated by reference to Exhibit 4.1 to WPL’s Form 8-K, filed October 14, 2014 (File No. 0-337))
|
|
|
4.13
|
Third Amended and Restated Five Year Credit Agreement, dated December 14, 2011, among IPL and the Banks set forth therein (incorporated by reference to Exhibit 99.2 to IPL’s Form 8-K, filed December 19, 2011 (File No. 1-4117))
|
|
134
|
Exhibit Number
|
Description
|
|
|
4.14
|
Indenture (For Senior Unsecured Debt Securities), dated as of August 20, 2003, between IPL and The Bank of New York Mellon Trust Co., N.A. (f/k/a The Bank of New York Trust Co., N.A.), as Trustee (incorporated by reference to Exhibit 4.11 to IPL’s Registration Statement on Form S-3 (Reg. No. 333-108199))
|
|
|
4.15
|
Officer’s Certificate, dated as of September 10, 2003, creating IPL’s 5.875% Senior Debentures due September 15, 2018 (incorporated by reference to Exhibit 4.1 to IPL’s Form 8-K, filed September 11, 2003 (File No. 1-4117))
|
|
|
4.16
|
Officer’s Certificate, dated as of October 14, 2003, creating IPL’s 6.45% Senior Debentures due October 15, 2033 (incorporated by reference to Exhibit 4.1 to IPL’s Form 8-K, filed October 15, 2003 (File No. 1-4117))
|
|
|
4.17
|
Officer’s Certificate, dated as of May 3, 2004, creating IPL’s 6.30% Senior Debentures due May 1, 2034 (incorporated by reference to Exhibit 4.1 to IPL’s Form 8-K, filed May 5, 2004 (File No. 1-4117))
|
|
|
4.17a
|
Officer’s Certificate, dated as of August 2, 2004, reopening IPL’s 6.30% Senior Debentures due May 1, 2034 (incorporated by reference to Exhibit 4.1 to IPL’s Form 8-K, filed August 5, 2004 (File No. 1-4117))
|
|
|
4.18
|
Officer’s Certificate, dated as of July 18, 2005, creating IPL’s 5.50% Senior Debentures due July 15, 2025 (incorporated by reference to Exhibit 4 to IPL’s Form 8-K, filed July 19, 2005 (File No. 1-4117))
|
|
|
4.19
|
Officer’s Certificate, dated as of October 1, 2008, creating IPL’s 7.25% Senior Debentures due October 1, 2018 (incorporated by reference to Exhibit 4.1 to IPL’s Form 8-K, filed October 2, 2008 (File No. 1-4117))
|
|
|
4.20
|
Officer’s Certificate, dated as of July 7, 2009, creating IPL’s 6.25% Senior Debentures due July 15, 2039 (incorporated by reference to Exhibit 4.1 to IPL’s Form 8-K, filed July 8, 2009 (File No. 1-4117))
|
|
|
4.21
|
Officer’s Certificate, dated as of August 23, 2010, creating IPL’s 3.65% Senior Debentures due September 1, 2020 (incorporated by reference to Exhibit 4.1 to IPL’s Form 8-K, filed August 24, 2010 (File No. 1-4117))
|
|
|
4.22
|
Officer’s Certificate, dated as of October 8, 2013, creating IPL’s 4.70% Senior Debentures due October 15, 2043 (incorporated by reference to Exhibit 4.1 to IPL’s Form 8-K, filed October 8, 2013 (File No. 1-4117))
|
|
|
4.23
|
Officer’s Certificate, dated as of November 24, 2014, creating IPL’s 3.25% Senior Debentures due December 1, 2024 (incorporated by reference to Exhibit 4.1 to IPL’s Form 8-K, filed November 24, 2014 (File No. 1-4117))
|
|
|
4.24
|
Officer’s Certificate, dated as of August 18, 2015, creating IPL’s 3.40% Senior Debentures due August 15, 2025 (incorporated by reference to Exhibit 4.1 to IPL’s Form 8-K, filed August 18, 2015 (File No. 1-4117))
|
|
|
4.25
|
Officer’s Certificate, dated as of September 15, 2016, creating IPL’s 3.70% Senior Debentures due September 15, 2046 (incorporated by reference to Exhibit 4.1 to IPL’s Form 8-K, filed September 15, 2016 (File No. 1-4117))
|
|
|
4.26
|
Form of Preferred Stock Certificate of IPL (incorporated by reference to Exhibit 4.1 to IPL’s Form 8-K, filed March 20, 2013 (File No. 1-4117))
|
|
|
10.1
|
Operating Agreement of ATC, dated as of January 1, 2001 (incorporated by reference to Exhibit 10.16 to WPL’s Form 10-K for the year 2000 (File No. 0-337))
|
|
|
10.2
|
Term Loan Credit Agreement, dated as of October 7, 2016, among AEF, Alliant Energy, JPMorgan Chase Bank, N.A. and the lender parties set forth therein (incorporated by reference to Exhibit 10.1 to Alliant Energy’s Form 8-K, filed October 7, 2016 (File No. 1-9894))
|
|
|
10.3#
|
OIP (incorporated by reference to Appendix A to Alliant Energy’s definitive proxy statement filed on Schedule 14A on April 1, 2010 (File No. 1-9894))
|
|
|
10.3a#
|
Amendment to the OIP (incorporated by reference to Exhibit 10.1 to Alliant Energy’s Form 8-K, filed December 5, 2011 (File No. 1-9894))
|
|
|
10.3b#
|
Form of Performance Share Agreement pursuant to the OIP, amended in 2012 (incorporated by reference to Exhibit 10.4c to Alliant Energy’s Form 10-K for the year 2011 (File No. 1-9894))
|
|
|
10.3c#
|
Form of Performance Share Agreement amended in 2015, pursuant to the OIP, amended in 2012 (incorporated by reference to Exhibit 10.3c to Alliant Energy’s Form 10-K for the year 2014 (File No. 1-9894))
|
|
|
10.3d#
|
Form of Performance Contingent Restricted Stock Agreement pursuant to the OIP, amended in 2012 (incorporated by reference to Exhibit 10.4e to Alliant Energy’s Form 10-K for the year 2011 (File No. 1-9894))
|
|
|
10.3e#
|
Form of Performance Contingent Restricted Stock Agreement amended in 2015, pursuant to the OIP, amended in 2012 (incorporated by reference to Exhibit 10.3e to Alliant Energy’s Form 10-K for the year 2014 (File No. 1-9894))
|
|
|
10.4#
|
Amended and Restated OIP, amended in 2015 (incorporated by reference to Appendix A to Alliant Energy’s definitive proxy statement filed on Schedule 14A on March 24, 2015 (File No. 1-9894))
|
|
|
10.4a#
|
Form of Performance Share Agreement pursuant to the Amended and Restated OIP, amended in 2015 (incorporated by reference to Exhibit 10.4a to Alliant Energy’s Form 10-K for the year 2015 (File No. 1-9894))
|
|
|
10.4b#
|
Form of Restricted Stock Unit Agreement pursuant to the Amended and Restated OIP, amended in 2015 (incorporated by reference to Exhibit 10.4b to Alliant Energy’s Form 10-K for the year 2015 (File No. 1-9894))
|
|
135
|
Exhibit Number
|
Description
|
|
|
10.4c#
|
Form of Performance Restricted Stock Unit Agreement pursuant to the Amended and Restated OIP, amended in 2015 (incorporated by reference to Exhibit 10.4c to Alliant Energy’s Form 10-K for the year 2015 (File No. 1-9894))
|
|
|
10.5#
|
DLIP, for director-level employees, amended in 2012 (incorporated by reference to Exhibit 10.5c to Alliant Energy’s Form 10-K for the year 2011 (File No. 1-9894))
|
|
|
10.5a#
|
Form of Restricted Cash Agreement pursuant to the DLIP, amended in 2012 (incorporated by reference to Exhibit 10.5d to Alliant Energy’s Form 10-K for the year 2011 (File No. 1-9894))
|
|
|
10.5b#
|
Form of Performance Restricted Award Agreement pursuant to the DLIP, amended in 2012 (incorporated by reference to Exhibit 10.5e to Alliant Energy’s Form 10-K for the year 2011 (File No. 1-9894))
|
|
|
10.6#
|
DLIP, for director-level employees, amended in 2016
|
|
|
10.6a#
|
Form of Performance Unit Agreement pursuant to the DLIP, amended in 2016
|
|
|
10.6b#
|
Form of Performance Restricted Unit Agreement pursuant to the DLIP, amended in 2016
|
|
|
10.6c#
|
Form of Restricted Unit Agreement pursuant to the DLIP, amended in 2016
|
|
|
10.7#
|
DCP, as amended and restated effective January 1, 2011 (incorporated by reference to Exhibit 10.1 to Alliant Energy’s Form 8-K, filed December 14, 2010 (File No. 1-9894))
|
|
|
10.7a#
|
Amendment to the DCP, as amended and restated (incorporated by reference to Exhibit 10.2 to Alliant Energy’s Form 8-K, filed December 5, 2011 (File No. 1-9894))
|
|
|
10.8#
|
IES Industries Inc. Amended and Restated Key Employee Deferred Compensation Agreement, as amended (incorporated by reference to Exhibit 10.7 to Alliant Energy’s Form 10-K for the year 2015 (File No. 1-9894))
|
|
|
10.9#
|
Alliant Energy Rabbi Trust Agreement for DCPs (incorporated by reference to Exhibit 10.19 to Alliant Energy’s Form 10-K for the year 2005 (File No. 1-9894))
|
|
|
10.9a#
|
Amendment to the Alliant Energy Rabbi Trust Agreement for DCPs (incorporated by reference to Exhibit 10.2 to Alliant Energy’s Form 10-Q for the quarter ended June 30, 2015 (File No. 1-9894))
|
|
|
10.9b#
|
Second Amendment to the Alliant Energy Rabbi Trust Agreement for DCPs (incorporated by reference to Exhibit 10.3 to Alliant Energy’s Form 10-Q for the quarter ended June 30, 2015 (File No. 1-9894))
|
|
|
10.10#
|
Alliant Energy Excess Retirement Plan (incorporated by reference to Exhibit 10.1 to Alliant Energy’s Form 10-Q for the quarter ended September 30, 2008 (File No. 1-9894))
|
|
|
10.10a#
|
Amendment to the Alliant Energy Excess Retirement Plan (incorporated by reference to Exhibit 10.4 to Alliant Energy’s Form 8-K, filed December 5, 2011 (File No. 1-9894))
|
|
|
10.11#
|
Form of Supplemental Retirement Plan (SRP) Agreement by and between Alliant Energy and each of T.L. Hanson, P.L. Kampling and J.O. Larsen (incorporated by reference to Exhibit 10.3 to Alliant Energy’s Form 8-K, filed December 12, 2008 (File No. 1-9894))
|
|
|
10.12#
|
Alliant Energy Defined Contribution SRP (incorporated by reference to Exhibit 10.1 to Alliant Energy’s Form 10-Q for the quarter ended September 30, 2010 (File No. 1-9894))
|
|
|
10.12a#
|
Amendment to the Alliant Energy Defined Contribution SRP (incorporated by reference to Exhibit 10.3 to Alliant Energy’s Form 8-K, filed December 5, 2011 (File No. 1-9894))
|
|
|
10.12b#
|
Amendment to the Alliant Energy Defined Contribution SRP (incorporated by reference to Exhibit 10.1 to Alliant Energy’s Form 8-K, filed March 12, 2014 (File No. 1-9894))
|
|
|
10.13#
|
Form of Key Executive Employment and Severance Agreement (KEESA), by and between Alliant Energy and P.L. Kampling (incorporated by reference to Exhibit 10.1 to Alliant Energy’s Form 8-K, filed October 29, 2010 (File No. 1-9894))
|
|
|
10.14#
|
Form of KEESA, by and between Alliant Energy and each of J.H. Gallegos, T.L. Hanson, D.R. Kopp, J.O. Larsen, W.A. Reschke and R.J. Durian (incorporated by reference to Exhibit 10.3 to Alliant Energy’s Form 10-Q for the quarter ended June 30, 2008 (File No. 1-9894))
|
|
|
10.14a#
|
Form of Amendment to KEESA, by and between Alliant Energy and each of J.H. Gallegos, T.L. Hanson, D.R. Kopp, J.O. Larsen, W.A. Reschke and R.J. Durian (incorporated by reference to Exhibit 10.1 to Alliant Energy’s Form 10-Q for the quarter ended September 30, 2015 (File No. 1-9894))
|
|
|
10.15#
|
Form of Amendment Number One to KEESA, by and between Alliant Energy and each of P.L. Kampling, J.H. Gallegos, T.L. Hanson, D.R. Kopp, J.O. Larsen, W.A. Reschke and R.J. Durian (incorporated by reference to Exhibit 10.6 to Alliant Energy’s Form 8-K, filed December 5, 2011 (File No. 1-9894))
|
|
|
10.16#
|
Executive Severance Benefit under the Alliant Energy Severance Plan Summary Plan Description, effective March 19, 2008 (incorporated by reference to Exhibit 10.1 to Alliant Energy’s Form 8-K, filed March 24, 2008 (File No. 1-9894))
|
|
|
10.16a#
|
Amendment to the Executive Severance Benefit under the Alliant Energy Severance Plan Summary Plan Description (incorporated by reference to Exhibit 10.5 to Alliant Energy’s Form 8-K, filed December 5, 2011 (File No. 1-9894))
|
|
|
10.17#
|
Terms of Alliant Energy Executive Performance Pay Plan (incorporated by reference to Exhibit 10.18 to Alliant Energy’s Form 10-K for the year 2015 (File No. 1-9894))
|
|
|
10.18#
|
Summary of Compensation and Benefits for Non-Employee Directors of Alliant Energy, IPL and WPL, effective January 1, 2017
|
|
|
12.1
|
Ratio of Earnings to Fixed Charges for Alliant Energy
|
|
136
|
Exhibit Number
|
Description
|
|
|
12.2
|
Ratio of Earnings to Fixed Charges and Ratio of Earnings to Combined Fixed Charges and Preferred Dividend Requirements for IPL
|
|
|
12.3
|
Ratio of Earnings to Fixed Charges for WPL
|
|
|
21.1
|
Subsidiaries of Alliant Energy
|
|
|
21.2
|
Subsidiaries of WPL
|
|
|
23.1
|
Consent of Independent Registered Public Accounting Firm for Alliant Energy
|
|
|
23.2
|
Consent of Independent Registered Public Accounting Firm for IPL
|
|
|
23.3
|
Consent of Independent Registered Public Accounting Firm for WPL
|
|
|
31.1
|
Certification of the Chairman, President and Chief Executive Officer for Alliant Energy
|
|
|
31.2
|
Certification of the Vice President, Chief Financial Officer and Treasurer for Alliant Energy
|
|
|
31.3
|
Certification of the Chairman and Chief Executive Officer for IPL
|
|
|
31.4
|
Certification of the Vice President, Chief Financial Officer and Treasurer for IPL
|
|
|
31.5
|
Certification of the Chairman and Chief Executive Officer for WPL
|
|
|
31.6
|
Certification of the Vice President, Chief Financial Officer and Treasurer for WPL
|
|
|
32.1
|
Written Statement of the Chief Executive Officer and Chief Financial Officer Pursuant to 18 U.S.C.§1350 for Alliant Energy
|
|
|
32.2
|
Written Statement of the Chief Executive Officer and Chief Financial Officer Pursuant to 18 U.S.C.§1350 for IPL
|
|
|
32.3
|
Written Statement of the Chief Executive Officer and Chief Financial Officer Pursuant to 18 U.S.C.§1350 for WPL
|
|
|
101.INS
|
Extensible Business Reporting Language (XBRL) Instance Document
|
|
|
101.SCH
|
XBRL Taxonomy Extension Schema Document
|
|
|
101.CAL
|
XBRL Taxonomy Extension Calculation Linkbase Document
|
|
|
101.LAB
|
XBRL Taxonomy Extension Label Linkbase Document
|
|
|
101.PRE
|
XBRL Taxonomy Extension Presentation Linkbase Document
|
|
|
101.DEF
|
XBRL Taxonomy Extension Definition Linkbase Document
|
|
# A management contract or compensatory plan or arrangement.
137
TABLE OF CONTENTS
Part IItem 1. BusinessItem 1A. Risk FactorsItem 1B. Unresolved Staff CommentsItem 2. PropertiesNote 16(e)Item 3. Legal ProceedingsItem 4. Mine Safety DisclosuresPart IIItem 5. Market For Registrants Common Equity, Related Stockholder Matters and Issuer Purchases Of Equity SecuritiesItem 6. Selected Financial DataItem 7. Management S Discussion and Analysis Of Financial Condition and Results Of OperationsItem 7A. Quantitative and Qualitative Disclosures About Market RiskItem 8. Financial Statements and Supplementary DataNote 1. Summary Of Significant Accounting PoliciesNote 1(a) General -Note 1(b) Regulatory Assets and Regulatory Liabilities -Note 1(c) Income Taxes -Note 1(d) Cash and Cash Equivalents -Note 1(e) Property, Plant and Equipment -Note 1(f) Operating Revenues -Note 1(g) Utility Cost Recovery Mechanisms -Note 1(h) Financial Instruments -Note 1(i) Asset Impairments -Note 1(j) Asset Retirement Obligations -Note 1(k) Debt Issuance and Retirement Costs -Note 1(l) Allowance For Doubtful Accounts -Note 1(m) Variable Interest Entities -Note 1(n) Cash Flows Presentation -Note 1(o) New Accounting Standards -Note 2. Regulatory MattersNote 3. Property, Plant and EquipmentNote 4. Jointly-owned Electric Utility PlantNote 5. ReceivablesNote 5(a) Accounts Receivable - Details For Accounts Receivable Included on The Balance Sheets As Of December 31 Were As Follows (in Millions):Note 5(a) Accounts Receivable -Note 5(b) Sales Of Accounts Receivable -Note 5(c) Whiting Petroleum Tax Sharing Agreement -Note 6. InvestmentsNote 6(a) Unconsolidated Equity Investments -Note 6(b) Cash Surrender Value Of Life Insurance Policies -Note 7. Common EquityNote 8. Redeemable Preferred StockNote 9. DebtNote 9(a) Short-term Debt -Note 9(b) Long-term Debt - Long-term Debt, Net As Of December 31 Was As Follows (dollars in Millions):Note 9(b) Long-term Debt -Note 10. LeasesNote 10(a) Operating Leases -Note 10(b) Capital Leases -Note 11. Income TaxesNote 12. Benefit PlansNote 12(a) Pension and Other Postretirement Benefits Plans -Note 12(b) Equity-based Compensation Plans -Note 12(c) Deferred Compensation Plan -Note 13. Asset Retirement ObligationsNote 14. Fair Value MeasurementsNote 15. Derivative InstrumentsNote 16. Commitments and ContingenciesNote 16(a) Capital Purchase Obligations -Note 16(b) Operating Expense Purchase Obligations -Note 16(c) Legal Proceedings -Note 16(d) Guarantees and Indemnifications -Note 16(e) Environmental Matters -Note 16(f) Credit Risk -Note 16(g) Collective Bargaining Agreements -Note 17. Segments Of BusinessNote 18. Related PartiesNote 19. Discontinued OperationsNote 20. Selected Consolidated Quarterly Financial Data (unaudited)Item 9. Changes in and Disagreements with Accountants on Accounting and Financial DisclosureItem 9A. Controls and ProceduresItem 9B. Other InformationPart IIIItem 10. Directors, Executive Officers and Corporate GovernanceItem 11. Executive CompensationItem 12. Security Ownership Of Certain Beneficial Owners and Management and Related Stockholder MattersItem 13. Certain Relationships and Related Transactions, and Director IndependenceItem 14. Principal Accounting Fees and ServicesPart IVItem 15. Exhibits, Financial Statement Schedules