ALLIANT ENERGY CORP
10-Ks and 10-Qs
|
|
|
|
|
|
|
|
|
|
|
|
|
|
|
|
|
|
|
|
|
|
|
|
|
|
|
|
|
|
|
|
|
|
|
|
|
|
|
|
|
|
|
|
|
|
|
|
|
|
|
|
|
|
|
|
|
|
|
UNITED STATES
SECURITIES AND EXCHANGE COMMISSION
WASHINGTON, D.C. 20549
FORM 10-K
|
☒
|
ANNUAL REPORT PURSUANT TO SECTION 13 OR 15(d) OF THE SECURITIES EXCHANGE ACT OF 1934
|
For the fiscal year ended
December 31, 2018
or
|
☐
|
TRANSITION REPORT PURSUANT TO SECTION 13 OR 15(d) OF THE SECURITIES EXCHANGE ACT OF 1934
|
For the transition period from to

|
Commission
File Number
|
Name of Registrant, State of Incorporation,
Address of Principal Executive Offices and Telephone Number
|
IRS Employer
Identification Number
|
||
|
1-9894
|
ALLIANT ENERGY CORPORATION
|
39-1380265
|
||
|
(a Wisconsin corporation)
|
||||
|
4902 N. Biltmore Lane
|
||||
|
Madison, Wisconsin 53718
|
||||
|
Telephone (608) 458-3311
|
||||
|
1-4117
|
INTERSTATE POWER AND LIGHT COMPANY
|
42-0331370
|
||
|
(an Iowa corporation)
|
||||
|
Alliant Energy Tower
|
||||
|
Cedar Rapids, Iowa 52401
|
||||
|
Telephone (319) 786-4411
|
||||
|
0-337
|
WISCONSIN POWER AND LIGHT COMPANY
|
39-0714890
|
||
|
(a Wisconsin corporation)
|
||||
|
4902 N. Biltmore Lane
|
||||
|
Madison, Wisconsin 53718
|
||||
|
Telephone (608) 458-3311
|
||||
This combined Form 10-K is separately filed by Alliant Energy Corporation, Interstate Power and Light Company and Wisconsin Power and Light Company. Information contained in the Form 10-K relating to Interstate Power and Light Company and Wisconsin Power and Light Company is filed by each such registrant on its own behalf. Each of Interstate Power and Light Company and Wisconsin Power and Light Company makes no representation as to information relating to registrants other than itself.
Securities registered pursuant to Section 12(b) of the Act:
|
Title of Each Class
|
Name of Each Exchange on Which Registered
|
|
|
Alliant Energy Corporation
|
Common Stock, $0.01 Par Value
|
Nasdaq Global Select Market
|
|
Interstate Power and Light Company
|
5.100% Series D Cumulative Perpetual Preferred Stock, $0.01 Par Value
|
Nasdaq Global Select Market
|
Securities registered pursuant to Section 12(g) of the Act: None
Indicate by check mark if the registrants are well-known seasoned issuers, as defined in Rule 405 of the Securities Act.
Yes
☒
No
☐
Indicate by check mark if the registrants are not required to file reports pursuant to Section 13 or Section 15(d) of the Act.
Yes
☐
No
☒
Indicate by check mark whether the registrants (1) have filed all reports required to be filed by Section 13 or 15(d) of the Securities Exchange Act of 1934 during the preceding 12 months (or for such shorter period that the registrants were required to file such reports) and (2) have been subject to such filing requirements for the past 90 days. Yes
☒
No
☐
Indicate by check mark whether the registrants have submitted electronically every Interactive Data File required to be submitted pursuant to Rule 405 of Regulation S-T (§232.405 of this chapter) during the preceding 12 months (or for such shorter period that the registrants were required to submit such files). Yes
☒
No
☐
Indicate by check mark if disclosure of delinquent filers pursuant to Item 405 of Regulation S-K (§229.405 of this chapter) is not contained herein, and will not be contained, to the best of the registrants’ knowledge, in definitive proxy or information statements incorporated by reference in Part III of this Form 10-K or any amendment to this Form 10-K.
☒
Indicate by check mark whether the registrants are large accelerated filers, accelerated filers, non-accelerated filers, smaller reporting companies, or emerging growth companies. See the definitions of “large accelerated filer,” “accelerated filer,” “smaller reporting company,” and “emerging growth company” in Rule 12b-2 of the Exchange Act.
|
Large Accelerated Filer
|
Accelerated Filer
|
Non-accelerated Filer
|
Smaller Reporting Company
|
Emerging Growth Company
|
|||||
|
Alliant Energy Corporation
|
☒
|
||||||||
|
Interstate Power and Light Company
|
☒
|
||||||||
|
Wisconsin Power and Light Company
|
☒
|
||||||||
If an emerging growth company, indicate by check mark if the registrant has elected not to use the extended transition period for complying with any new or revised financial accounting standards provided pursuant to Section 13(a) of the Exchange Act.
☐
Indicate by check mark whether the registrants are shell companies (as defined in Rule 12b-2 of the Exchange Act). Yes
☐
No
☒
The aggregate market value of the voting and non-voting common equity held by nonaffiliates as of June 30,
2018
:
|
Alliant Energy Corporation
|
$9.9 billion
|
|
Interstate Power and Light Company
|
$—
|
|
Wisconsin Power and Light Company
|
$—
|
Number of shares outstanding of each class of common stock as of
January 31, 2019
:
|
Alliant Energy Corporation
|
Common stock, $0.01 par value, 236,074,475 shares outstanding
|
|
Interstate Power and Light Company
|
Common stock, $2.50 par value, 13,370,788 shares outstanding (all of which are owned beneficially and of record by Alliant Energy Corporation)
|
|
Wisconsin Power and Light Company
|
Common stock, $5 par value, 13,236,601 shares outstanding (all of which are owned beneficially and of record by Alliant Energy Corporation)
|
DOCUMENTS INCORPORATED BY REFERENCE
Portions of the Proxy Statement relating to Alliant Energy Corporation’s
2019
Annual Meeting of Shareowners are, or will be upon filing with the Securities and Exchange Commission, incorporated by reference into Part III hereof.
TABLE OF CONTENTS
|
Page Number
|
||||||
DEFINITIONS
The following abbreviations or acronyms used in this report are defined below:
|
Abbreviation or Acronym
|
Definition
|
Abbreviation or Acronym
|
Definition
|
|
2019 Alliant Energy Proxy Statement
|
Alliant Energy’s Proxy Statement for the 2019 Annual Meeting of Shareowners
|
IPL
|
Interstate Power and Light Company
|
|
AEF
|
Alliant Energy Finance, LLC
|
IRS
|
Internal Revenue Service
|
|
AFUDC
|
Allowance for funds used during construction
|
ITC
|
ITC Midwest LLC
|
|
Alliant Energy
|
Alliant Energy Corporation
|
IUB
|
Iowa Utilities Board
|
|
ARO
|
Asset retirement obligation
|
KWh
|
Kilowatt-hour
|
|
ATC
|
American Transmission Company LLC
|
Marshalltown
|
Marshalltown Generating Station
|
|
ATC Holdings
|
Interest in American Transmission Company LLC and ATC Holdco LLC
|
MDA
|
Management’s Discussion and Analysis of Financial Condition and Results of Operations
|
|
ATI
|
AE Transco Investments, LLC
|
MGP
|
Manufactured gas plant
|
|
CA
|
Certificate of authority
|
MISO
|
Midcontinent Independent System Operator, Inc.
|
|
CAA
|
Clean Air Act
|
MW
|
Megawatt
|
|
CCR
|
Coal combustion residuals
|
MWh
|
Megawatt-hour
|
|
CO2
|
Carbon dioxide
|
N/A
|
Not applicable
|
|
Corporate Services
|
Alliant Energy Corporate Services, Inc.
|
Note(s)
|
Combined Notes to Consolidated Financial Statements
|
|
CPCN
|
Certificate of Public Convenience and Necessity
|
NOx
|
Nitrogen oxide
|
|
CWIP
|
Construction work in progress
|
OIP
|
Alliant Energy 2010 Omnibus Incentive Plan
|
|
DAEC
|
Duane Arnold Energy Center
|
OPEB
|
Other postretirement benefits
|
|
DCP
|
Alliant Energy Deferred Compensation Plan
|
PPA
|
Purchased power agreement
|
|
DLIP
|
Alliant Energy Director Long Term Incentive Plan
|
PSCW
|
Public Service Commission of Wisconsin
|
|
Dth
|
Dekatherm
|
Receivables Agreement
|
Receivables Purchase and Sale Agreement
|
|
EEP
|
Energy efficiency plan
|
RES
|
Renewable energy standards
|
|
EGU
|
Electric generating unit
|
Riverside
|
Riverside Energy Center
|
|
EPA
|
U.S. Environmental Protection Agency
|
SCR
|
Selective catalytic reduction
|
|
EPB
|
Emissions plan and budget
|
SEC
|
Securities and Exchange Commission
|
|
EPS
|
Earnings per weighted average common share
|
SO2
|
Sulfur dioxide
|
|
FASB
|
Financial Accounting Standards Board
|
Federal Tax Reform
|
Tax Cuts and Jobs Act
|
|
FERC
|
Federal Energy Regulatory Commission
|
U.S.
|
United States of America
|
|
Financial Statements
|
Consolidated Financial Statements
|
VEBA
|
Voluntary Employees’ Beneficiary Association
|
|
FTR
|
Financial transmission right
|
VIE
|
Variable interest entity
|
|
Fuel-related
|
Electric production fuel and purchased power
|
Whiting Petroleum
|
Whiting Petroleum Corporation
|
|
FWEC
|
Forward Wind Energy Center
|
WPL
|
Wisconsin Power and Light Company
|
|
GAAP
|
U.S. generally accepted accounting principles
|
WPL Transco
|
WPL Transco, LLC
|
|
GHG
|
Greenhouse gases
|
||
|
1
|
||
FORWARD-LOOKING STATEMENTS
Statements contained in this report that are not of historical fact are forward-looking statements intended to qualify for the safe harbors from liability established by the Private Securities Litigation Reform Act of 1995. These forward-looking statements can be identified as such because the statements include words such as “may,” “believe,” “expect,” “anticipate,” “plan,” “project, “will,” “projections,” “estimate,” or other words of similar import. Similarly, statements that describe future financial performance or plans or strategies are forward-looking statements. Such forward-looking statements are subject to certain risks and uncertainties that could cause actual results to differ materially from those expressed in, or implied by, such statements. Some, but not all, of the risks and uncertainties of Alliant Energy, IPL and WPL that could materially affect actual results include:
|
•
|
IPL’s and WPL’s ability to obtain adequate and timely rate relief to allow for, among other things, earning a return on rate base additions and the recovery of costs, including fuel costs, operating costs, transmission costs, environmental compliance and remediation costs, deferred expenditures, deferred tax assets, capital expenditures, and remaining costs related to EGUs that may be permanently closed, earning their authorized rates of return, and the payments to their parent of expected levels of dividends;
|
|
•
|
federal and state regulatory or governmental actions, including the impact of energy, tax, financial and health care legislation, and regulatory agency orders;
|
|
•
|
the impact of customer- and third party-owned generation, including alternative electric suppliers, in IPL’s and WPL’s service territories on system reliability, operating expenses and customers’ demand for electricity;
|
|
•
|
the impact of energy efficiency, franchise retention and customer disconnects on sales volumes and margins;
|
|
•
|
the impact that price changes may have on IPL’s and WPL’s customers’ demand for electric, gas and steam services and their ability to pay their bills;
|
|
•
|
the ability to utilize tax credits and net operating losses generated to date, and those that may be generated in the future, before they expire;
|
|
•
|
the direct or indirect effects resulting from terrorist incidents, including physical attacks and cyber attacks, or responses to such incidents;
|
|
•
|
the impact of penalties or third-party claims related to, or in connection with, a failure to maintain the security of personally identifiable information, including associated costs to notify affected persons and to mitigate their information security concerns;
|
|
•
|
employee workforce factors, including changes in key executives, ability to hire and retain employees with specialized skills, ability to create desired corporate culture, collective bargaining agreements and negotiations, work stoppages or restructurings;
|
|
•
|
weather effects on results of utility operations;
|
|
•
|
issues associated with environmental remediation and environmental compliance, including compliance with all environmental and emissions permits, the CCR rule, future changes in environmental laws and regulations, including the EPA’s regulations for CO2 emissions reductions from new and existing fossil-fueled EGUs, and litigation associated with environmental requirements;
|
|
•
|
the ability to defend against environmental claims brought by state and federal agencies, such as the EPA, state natural resources agencies or third parties, such as the Sierra Club, and the impact on operating expenses of defending and resolving such claims;
|
|
•
|
continued access to the capital markets on competitive terms and rates, and the actions of credit rating agencies;
|
|
•
|
inflation and interest rates;
|
|
•
|
the impact of the economy in IPL’s and WPL’s service territories and the resulting impacts on sales volumes, margins and the ability to collect unpaid bills;
|
|
•
|
the ability to complete construction of wind projects within the cost caps set by regulators and to meet all requirements to qualify for the full level of production tax credits;
|
|
•
|
changes in the price of delivered natural gas, purchased electricity and coal due to shifts in supply and demand caused by market conditions and regulations;
|
|
•
|
disruptions in the supply and delivery of natural gas, purchased electricity and coal;
|
|
•
|
changes in the price of transmission services and the ability to recover the cost of transmission services in a timely manner;
|
|
•
|
the direct or indirect effects resulting from breakdown or failure of equipment in the operation of electric and gas distribution systems, such as mechanical problems and explosions or fires, and compliance with electric and gas transmission and distribution safety regulations;
|
|
•
|
issues related to the availability and operations of EGUs, including start-up risks, breakdown or failure of equipment, performance below expected or contracted levels of output or efficiency, operator error, employee safety, transmission constraints, compliance with mandatory reliability standards and risks related to recovery of resulting incremental costs through rates;
|
|
2
|
||
|
•
|
impacts that storms or natural disasters in IPL’s and WPL’s service territories may have on their operations and recovery of costs associated with restoration activities;
|
|
•
|
any material post-closing adjustments related to any past asset divestitures, including the sales of IPL’s Minnesota electric and natural gas assets, and Whiting Petroleum, which could result from, among other things, indemnification agreements, warranties, parental guarantees or litigation;
|
|
•
|
Alliant Energy’s ability to sustain its dividend payout ratio goal;
|
|
•
|
changes to costs of providing benefits and related funding requirements of pension and OPEB plans due to the market value of the assets that fund the plans, economic conditions, financial market performance, interest rates, life expectancies and demographics;
|
|
•
|
material changes in employee-related benefit and compensation costs;
|
|
•
|
risks associated with operation and ownership of non-utility holdings;
|
|
•
|
changes in technology that alter the channels through which customers buy or utilize Alliant Energy’s, IPL’s or WPL’s products and services;
|
|
•
|
impacts on equity income from unconsolidated investments due to further potential changes to ATC’s authorized return on equity;
|
|
•
|
impacts of IPL’s future tax benefits from Iowa rate-making practices, including deductions for repairs expenditures, allocation of mixed service costs and state depreciation, and recoverability of the associated regulatory assets from customers, when the differences reverse in future periods;
|
|
•
|
the impacts of adjustments made to deferred tax assets and liabilities from changes in the tax laws;
|
|
•
|
changes to the creditworthiness of counterparties with which Alliant Energy, IPL and WPL have contractual arrangements, including participants in the energy markets and fuel suppliers and transporters;
|
|
•
|
current or future litigation, regulatory investigations, proceedings or inquiries;
|
|
•
|
reputational damage from negative publicity, protests, fines, penalties and other negative consequences resulting in regulatory and/or legal actions;
|
|
•
|
the effect of accounting standards issued periodically by standard-setting bodies;
|
|
•
|
the ability to successfully complete tax audits and changes in tax accounting methods with no material impact on earnings and cash flows; and
|
|
•
|
other factors listed in
MDA
and
Item 1A Risk Factors
.
|
Alliant Energy, IPL and WPL each assume no obligation, and disclaim any duty, to update the forward-looking statements in this report, except as required by law.
WEBSITE ACCESS TO REPORTS
Alliant Energy, IPL and WPL make their periodic and current reports, and amendments to those reports, available, free of charge, on Alliant Energy’s website at
www.alliantenergy.com/investors
on the same day as such material is electronically filed with, or furnished to, the SEC. Alliant Energy, IPL and WPL are not including the information contained on Alliant Energy’s website as a part of, or incorporating it by reference into, this report.
PART I
This report includes information relating to Alliant Energy, IPL and WPL (as well as AEF and Corporate Services). Where appropriate, information relating to a specific entity has been segregated and labeled as such. Unless otherwise noted, the information herein excludes discontinued operations for all periods presented.
ITEM 1. BUSINESS
A. GENERAL
Alliant Energy was incorporated in Wisconsin in 1981 and maintains its principal executive offices in Madison, Wisconsin. Alliant Energy operates as a regulated investor-owned public utility holding company. Alliant Energy’s primary focus is to provide regulated electric and natural gas service to approximately
965,000
electric and approximately
415,000
natural gas customers in the Midwest through its two public utility subsidiaries, IPL and WPL. The primary first tier wholly-owned subsidiaries of Alliant Energy are as follows:
1) IPL -
was incorporated in 1925 in Iowa as Iowa Railway and Light Corporation. IPL is a public utility engaged principally in the generation and distribution of electricity and the distribution and transportation of natural gas to retail customers in select markets in Iowa. IPL provides utility services to incorporated communities as directed by the IUB and utilizes non-exclusive franchises, which cover the use of public right-of-ways for utility facilities in incorporated communities for a maximum term of 25 years. At
December 31, 2018
, IPL supplied electric and natural gas service to
|
3
|
||
approximately 490,000 and 225,000 retail customers, respectively, in Iowa. IPL also sells electricity to wholesale customers in Minnesota, Illinois and Iowa. IPL is also engaged in the generation and distribution of steam for two customers in Cedar Rapids, Iowa. In
2018
,
2017
and
2016
, IPL had no single customer for which electric, gas, steam and/or other sales accounted for 10% or more of IPL’s consolidated revenues.
2) WPL -
was incorporated in 1917 in Wisconsin as Eastern Wisconsin Electric Company. WPL is a public utility engaged principally in the generation and distribution of electricity and the distribution and transportation of natural gas to retail customers in select markets in Wisconsin. WPL operates in municipalities pursuant to permits of indefinite duration and state statutes authorizing utility operation in areas annexed by a municipality. At
December 31, 2018
, WPL supplied electric and natural gas service to approximately 475,000 and 190,000 retail customers, respectively. WPL also sells electricity to wholesale customers in Wisconsin. In
2018
,
2017
and
2016
, WPL had no single customer for which electric, gas and/or other sales accounted for 10% or more of WPL’s consolidated revenues.
3) CORPORATE SERVICES -
was incorporated in 1997 in Iowa. Corporate Services provides administrative services to Alliant Energy, IPL, WPL and AEF.
4) AEF -
was created in 2016 in Wisconsin as a limited liability company. Alliant Energy’s non-utility holdings are organized under AEF, which manages a portfolio of wholly-owned subsidiaries and additional holdings through the following distinct platforms:
ATI
- currently holds all of Alliant Energy’s interest in ATC Holdings. ATC Holdings is comprised of a 16% ownership interest in ATC and a 20% ownership interest in ATC HoldCo LLC. ATC is an independent, for-profit, transmission-only company. ATC HoldCo LLC holds Duke-American Transmission Company, LLC, a joint venture between Duke Energy Corporation and ATC, that is expected to acquire, build, own and operate new electric transmission infrastructure in North America.
Non-utility Wind Farm
- includes a 50% cash equity ownership interest in a 225 MW non-utility wind farm located in Oklahoma.
Sheboygan Falls Energy Facility
- is a
347
MW, simple-cycle, natural gas-fired EGU near Sheboygan Falls, Wisconsin, which is leased to WPL for an initial period of 20 years ending in 2025.
Transportation
- includes a short-line railway that provides freight service between Cedar Rapids, Iowa and Iowa City, Iowa; a barge terminal and hauling services on the Mississippi River; and other transfer and storage services.
B. INFORMATION RELATING TO ALLIANT ENERGY ON A CONSOLIDATED BASIS
1) EMPLOYEES -
At
December 31, 2018
, Alliant Energy, IPL and WPL had the following full- and part-time employees:
|
Total
|
Number of
|
Percentage of Employees
|
|||
|
Number of
|
Bargaining Unit
|
Covered by Collective
|
|||
|
Employees
|
Employees
|
Bargaining Agreements
|
|||
|
Alliant Energy
|
3,885
|
2,151
|
55%
|
||
|
IPL
|
1,628
|
1,031
|
63%
|
||
|
WPL
|
1,234
|
1,012
|
82%
|
||
The majority of IPL’s bargaining unit employees are covered by the International Brotherhood of Electrical Workers Local 204 (Cedar Rapids) collective bargaining agreement, which expires on August 31, 2020. All of WPL’s bargaining unit employees are covered by the International Brotherhood of Electrical Workers Local 965 collective bargaining agreement, which expires on May 31, 2019.
2) REGULATION -
Alliant Energy, IPL and WPL are subject to regulation by various federal, state and local agencies. The following includes the primary regulations impacting Alliant Energy’s, IPL’s and WPL’s businesses.
|
4
|
||
FERC
-
Public Utility Holding Company Act of 2005 -
Alliant Energy is registered with FERC as a public utility holding company, pursuant to the Public Utility Holding Company Act of 2005, and is required to maintain certain records and to report certain transactions involving its public utilities, service company and other entities regulated by FERC. Corporate Services, IPL and WPL are subject to regulation by FERC under the Public Utility Holding Company Act of 2005 for various matters including, but not limited to, affiliate transactions, public utility mergers, acquisitions and dispositions, and books, records and accounting requirements.
Energy Policy Act -
The Energy Policy Act requires creation of an Electric Reliability Organization to provide oversight by FERC. FERC designated North American Electric Reliability Corporation as the overarching Electric Reliability Organization. Midwest Reliability Organization, which is a regional member of North American Electric Reliability Corporation, has direct responsibility for mandatory electric reliability standards for IPL and WPL.
Federal Power Act -
FERC also has jurisdiction, under the Federal Power Act, over certain electric utility facilities and operations, electric wholesale and transmission rates, dividend payments, issuance of IPL’s securities, and accounting practices of Corporate Services, IPL and WPL.
Electric Wholesale Rates
- IPL and WPL receive wholesale electric market-based rate authority from FERC. Market-based rate authorization allows for wholesale sales of electricity within the MISO market and in transactions directly with third parties, based on the market value of the transactions. IPL and WPL also have FERC-approved cost of service formula based rates related to the provision of firm full- and partial-requirement wholesale electric sales, which allow for true-ups to actual costs, including fuel costs.
Electric Transmission Rates
- FERC regulates the rates charged for electric transmission facilities used in interstate commerce. IPL and WPL do not own or operate electric transmission facilities; however, both IPL and WPL pay for the use of the interstate electric transmission system based upon FERC-regulated rates. IPL and WPL rely primarily on the use of the ITC and ATC transmission systems, respectively. Due to the formula rates used by ITC and ATC to charge their customers and possible future changes to these rates, there is uncertainty regarding IPL’s and WPL’s future electric transmission service expense.
Natural Gas Act
- FERC regulates the transportation and sale for resale of natural gas in interstate commerce under the Natural Gas Act. Under the Natural Gas Act, FERC has authority over certain natural gas facilities and operations of IPL and WPL.
IUB
-
IPL is subject to regulation by the IUB for various matters including, but not limited to, retail utility rates and standards of service, accounting requirements, sales of assets with values that exceed 3% of IPL’s revenues, and approval of the location and construction of EGUs. In May 2018, Iowa enacted new energy-related legislation. The most significant provisions of the legislation for Alliant Energy and IPL include the option for energy providers to use a forward-looking test period instead of a historical test year approach for electric and gas rate reviews, and adjustment of electric transmission service costs through a permanent transmission rider.
Retail Utility Base Rates -
IPL files periodic requests with the IUB for retail rate changes and may base those requests on either historical or forward-looking test periods (forward-looking test periods are allowable under Iowa’s new energy-related legislation that was enacted in 2018). The historical test periods may be adjusted for certain known and measurable changes to capital investments, cost of capital and operating and maintenance expenses consistent with IUB rules and regulations. Interim retail rates can be placed in effect as soon as 10 days after the rate application filing, subject to refund, and must be based on previously established regulatory principles. The IUB must decide on requests for retail rate changes within 10 months of the date of the application for which changes are filed, or the interim rates granted become permanent.
Energy Efficiency -
In accordance with Iowa law, IPL is required to file an EEP every five years with the IUB. An EEP provides a utility’s plan and related budget to achieve specified levels of electric and gas energy savings. IUB approval demonstrates that IPL’s EEP is reasonably expected to achieve cost-effective delivery of the energy efficiency programs.
In July 2018, IPL filed an EEP with the IUB, which
includes IPL spending approximately $240 million for electric and natural gas energy efficiency programs in Iowa from 2019 through 2023. The budget requested for the EEP is lower than previous EEPs due to legislative changes that set budget caps, as well as to reflect lower customer participation in the energy efficiency programs. A decision from the IUB on IPL’s EEP for 2019 through 2023 is currently expected in 2019. Refer to
Note 1(g)
for discussion of the recovery of these costs from IPL’s retail electric and gas customers.
|
5
|
||
Electric Generating Units -
IPL must obtain a certificate of public convenience, use and necessity (GCU Certificate) from the IUB in order to construct a new, or significantly alter (including fuel switching) an existing, EGU located in Iowa with 25 MW or more of capacity. IPL’s ownership and operation of EGUs (including those located outside the state of Iowa) to serve Iowa customers is subject to retail utility rate regulation by the IUB.
Gas Pipeline Projects -
IPL must obtain a pipeline permit from the IUB related to the siting of utility gas pipelines in Iowa that will be operated at a pressure over 150 pounds per square inch and will transport gas to a distribution system or single, large volume customer.
Advance Rate-making Principles -
Iowa law provides Iowa utilities with rate-making principles prior to making certain generation investments in Iowa. As a result, IPL may file for, and the IUB must render a decision on, rate-making principles for certain new EGUs located in Iowa, including any alternative energy production facility (such as a wind facility), combined-cycle natural gas-fired EGU, and certain base-load EGUs with a nameplate generating capacity of 300 MW or more (such as nuclear or coal-fired generation). Advance rate-making principles are also available for the repowering of an alternative energy production facility or certain significant alterations of an existing EGU. Upon approval of rate-making principles by the IUB, IPL must either build the EGU or repower the alternative energy production facility under the approved rate-making principles, or not at all.
Electric Generating Unit Environmental Controls Projects
- IPL is required to submit an updated EPB biennially to the IUB setting out a multi-year plan and budget for managing regulated emissions from its coal-fired EGUs in a cost-effective manner. IPL must simultaneously submit this plan and budget to the Iowa Department of Natural Resources for a determination of whether the plan and budget meet state environmental requirements for regulated emissions. The reasonable and prudent costs associated with implementing the approved plan are expected to be included in IPL’s future retail electric rates.
PSCW
-
Alliant Energy is subject to regulation by the PSCW for the type and amount of Alliant Energy’s holdings in non-utility businesses and other affiliated interest activities, among other matters. WPL is also subject to regulation by the PSCW related to its operations in Wisconsin for various matters including, but not limited to, retail utility rates and standards of service, accounting requirements, issuance and use of proceeds of securities, affiliate transactions, approval of the location and construction of EGUs and certain other additions and extensions to facilities.
Retail Utility Base Rates -
WPL files periodic requests with the PSCW for retail rate changes. These filings are required to be based on forward-looking test periods. There is no statutory time limit for the PSCW to decide retail base rate requests. However, the PSCW attempts to process retail base rate reviews in approximately 10 months and has the ability to approve interim retail rate relief, subject to refund, if necessary. Currently, WPL is required to defer a portion of its earnings if its annual regulatory return on common equity exceeds certain levels.
Public Benefits -
WPL contributes 1.2% of its annual retail utility revenues to help fund Focus on Energy, Wisconsin’s state-wide energy efficiency and renewable energy resource program. In addition, WPL contributes to a program that provides assistance to income-eligible residents in Wisconsin. These contributions are recovered from customers through a bill surcharge of up to 3% of customers’ utilities bills. Refer to
Note 1(g)
for discussion of the recovery of these costs from WPL’s retail electric and gas customers.
New Electric Generating Units -
A CA application is required to be filed with the PSCW for construction approval of any new EGU with a capacity of less than 100 MW and a project cost of $11.0 million or more. WPL must obtain a CPCN from the PSCW in order to construct a new EGU in Wisconsin with a capacity of 100 MW or more. In addition, WPL’s ownership and operation of EGUs (including those located outside the state of Wisconsin) to serve Wisconsin customers are subject to retail utility rate regulation by the PSCW.
Electric Generating Unit Upgrades and Electric Distribution Projects -
A CA application is required to be filed with the PSCW for construction approval of any additions to EGUs, including environmental controls projects, as well as electric distribution projects, with estimated project costs of $11.0 million or more.
Gas Distribution Projects -
A CA application is required to be filed with the PSCW for construction approval of gas projects with an estimated project cost of $2.5 million or more and at any time that WPL requests to extend gas service to a new portion of its service territory.
|
6
|
||
Advance Rate-making Principles -
Wisconsin law provides Wisconsin utilities with the opportunity to request rate-making principles prior to the purchase or construction of any EGU utilized to serve Wisconsin customers. WPL is not obligated to file for or accept authorized rate-making principles under Wisconsin law. WPL can proceed with an approved project under traditional rate-making terms or accept authorized rate-making principles under Wisconsin law.
Environmental
-
Alliant Energy, IPL and WPL are subject to regulation of environmental matters by federal, state and local authorities as a result of their current and past operations. Alliant Energy, IPL and WPL monitor these environmental matters and address them by installing controls that reduce emissions and by implementing operational modifications or other measures to address compliance obligations. There is currently significant regulatory uncertainty with respect to a number of environmental rules and regulations discussed below. Given the dynamic nature of environmental regulations and other related regulatory requirements, Alliant Energy, IPL and WPL have compliance plans to address these environmental obligations. Prudent expenditures incurred by IPL and WPL to comply with environmental requirements are eligible to be recovered in rates from their customers. The following are major environmental matters that could potentially have a significant impact on financial condition and results of operations.
Climate Change and Greenhouse Gases Regulations -
There is continued debate regarding the public policy response that the U.S. should adopt to address climate change, involving both domestic actions and international efforts. In 2007, the Supreme Court provided direction on the EPA’s authority to regulate GHG and ruled that these emissions are covered by the CAA. In 2009, the EPA issued a ruling that found GHG emissions contribute to climate change, and therefore, threaten public health and welfare, which was the prerequisite for implementing carbon reduction standards under the CAA. While the EPA’s rules to regulate GHG issued under the authority of the CAA remain subject to further review, growing awareness of climate change is driving efforts to decarbonize the environment through voluntary emissions reductions. The primary GHG emitted from Alliant Energy’s utility operations is CO2 from the combustion of fossil fuels at their larger EGUs.
Clean Air Act Section 111(d)
- In 2015, the EPA published final standards under Section 111(d) of the CAA, referred to as the Clean Power Plan, to reduce CO2 emissions from existing fossil-fueled EGUs. In 2016, the Supreme Court issued a stay of the Clean Power Plan, which placed implementation of the final standards on hold indefinitely. In August 2018, the EPA published the proposed Affordable Clean Energy rule, which is a replacement rule for the Clean Power Plan, and is based on a narrower legal interpretation of regulating CO2 emissions from existing coal-fired EGUs. The EPA is expected to finalize the repeal of the Clean Power Plan and issuance of the Affordable Clean Energy rule in 2019. Litigation related to the Clean Power Plan is suspended while the EPA proceeds with its repeal and replacement rulemaking processes. Alliant Energy, IPL and WPL are currently unable to predict with certainty the final outcome or impact of these matters, but expect that expenditures to comply with such requirements could be significant.
Clean Air Act Section 111(b)
- In 2015, the EPA published final standards under Section 111(b) of the CAA, which establish CO2 emissions limits for certain new fossil-fueled EGUs. Marshalltown and West Riverside are subject to the EPA’s Section 111(b) regulation and have been designed to achieve compliance with these standards. Litigation related to Section 111(b) is suspended while the EPA revises Section 111(b), and Alliant Energy, IPL and WPL are currently unable to predict with certainty the impact of these standards. In addition, in order for the EPA to regulate existing fossil-fueled EGUs under Section 111(d) of the CAA, the EPA must have valid regulation of new fossil-fueled EGUs under Section 111(b) of the CAA. If Section 111(b) is vacated, the EPA’s ability to implement regulations for CO2 emissions at existing fossil-fueled EGUs, as well as any future Clean Power Plan replacement rule, could be limited.
Water Quality -
Effluent Limitation Guidelines
- In 2015, the EPA published final effluent limitation guidelines, which required changes to discharge limits for wastewater from certain IPL and WPL steam generating facilities. Compliance for existing steam generating facilities is determined by each facility’s wastewater discharge permit and will generally be required by December 31, 2023. Projects required for compliance are facility-specific. Compliance for new steam generating facilities, such as West Riverside, is required immediately upon operation. Estimated capital expenditures to comply with these guidelines for
2019
through
2022
are included in the “Other Generation” line in the construction and acquisition expenditures table in “
Liquidity and Capital Resources
” in MDA.
Land and Solid Waste -
Coal Combustion Residuals Rule
- The final CCR Rule, which regulates CCR as a non-hazardous waste, was published and became effective in 2015. IPL and WPL have seven and three coal-fired EGUs, respectively, with coal ash ponds that are impacted by this rule. In addition, IPL and WPL both have two active CCR landfills that are impacted by this rule. Expenditures incurred by IPL and WPL to comply with the CCR Rule are anticipated to be recovered in rates from their customers.
|
7
|
||
MGP Sites
- Refer to
Note 17(e)
for discussion of IPL’s and WPL’s MGP sites.
Renewable Energy Standards
-
Iowa and Wisconsin have RES, which establish the minimum amount of energy IPL and WPL must supply from renewable resources. IPL primarily relies upon renewable energy generated from the wind projects it owns and renewable energy acquired under PPAs to meet these requirements. WPL utilizes its current renewable portfolio, which primarily consists of wind and hydro energy, both owned and acquired under PPAs, to meet these requirements. IPL and WPL currently exceed their respective RES requirements.
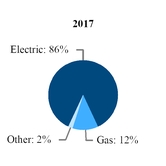
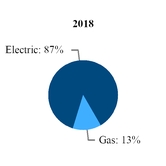
C. INFORMATION RELATING TO UTILITY OPERATIONS
Alliant Energy’s utility business (IPL and WPL) has three segments: a) electric operations; b) gas operations; and c) other, which includes IPL’s steam operations and the unallocated portions of the utility business. IPL’s and WPL’s electric, gas and other revenues as a percentage of total revenues were as follows:
|
IPL
|
WPL
|
|


1) ELECTRIC UTILITY OPERATIONS
General
-
Electric utility operations represent the largest operating segment for Alliant Energy, IPL and WPL. Alliant Energy’s electric utility operations are located in the Midwest with IPL providing retail electric service in Iowa and WPL providing retail and wholesale electric service in Wisconsin. IPL also sells electricity to wholesale customers in Minnesota, Illinois and Iowa. Refer to the “
Electric Operating Information
” tables for additional details regarding electric utility operations.
Customers
-
IPL and WPL provide electric utility service to a diversified base of retail customers in several industries, with the largest concentrations in the farming, agriculture, industrial manufacturing, chemical (including ethanol) and packaging industries. IPL and WPL also sell electricity to wholesale customers, which primarily consist of municipalities and rural electric cooperatives.
Seasonality
-
Electric sales are seasonal to some extent with the annual peak normally occurring in the summer months due to air conditioning requirements. Electric sales are also impacted to a certain extent in the winter months due to heating requirements.
Competition
-
Retail electric customers in Iowa and Wisconsin currently do not have the ability to choose their electric supplier, and IPL and WPL have obligations to serve all their retail electric customers. Although electric service in Iowa and Wisconsin is regulated, IPL and WPL still face competition from self-generation by large industrial customers, customer- and third party-owned generation (e.g. solar panels), alternative energy sources, and petitions to municipalize (Iowa) as well as service territory expansions by municipal utilities through annexations (Wisconsin). In addition, the wholesale power market is competitive and IPL and WPL compete against independent power producers, other utilities and MISO market purchases to serve wholesale customers for their electric energy and capacity needs. Alliant Energy’s strategy includes actions to retain current customers and attract new customers into IPL’s and WPL’s service territories in an effort to keep energy rates low for all of their customers. Refer to “
Overview
” in MDA for discussion of the strategy element focusing on growing customer demand.
Electric Supply
-
Alliant Energy, IPL and WPL have met, and expect to continue meeting, customer demand of electricity through a mix of electric supply, including owned EGUs, PPAs and additional purchases from wholesale energy markets. Alliant Energy expects its mix of electric supply to change in the next several years with WPL’s construction of West Riverside, IPL’s and WPL’s planned additional wind generation and the proposed retirement and/or fuel switching of various EGUs. Long-term generation plans are intended to meet customer demand, reduce CO2 emissions, reduce reliance on wholesale market purchases and mitigate the impacts of future EGU retirements while maintaining compliance with long-
|
8
|
||
term electric demand planning reserve margins, environmental requirements and RES established by regulators. Alliant Energy continues to take voluntary action to reduce CO2 emissions by implementing a strategy to cost-effectively meet the energy needs of customers while recognizing the importance of using resources in efficient and environmentally responsible ways. In August 2018, Alliant Energy announced voluntary goals to guide this transition by targeting to reduce CO2 emissions from its fossil-fueled generation 40% by 2030 and 80% by 2050 from 2005 levels. Coal-fired EGUs are targeted to be eliminated from Alliant Energy’s overall energy mix by 2050. To achieve these long-term goals, Alliant Energy will transition away from coal-fired EGUs and incorporate more renewable energy, energy efficiency, demand response, and highly-efficient natural gas-fired EGUs.
Electric Demand Planning Reserve Margin -
IPL and WPL are required to maintain a planning reserve margin above their load at the time of the MISO-wide peak to ensure reliability of electric service to their customers. The required installed capacity reserve margin is 16.8% and the required unforced capacity reserve margin is 7.9% for the June 1,
2019
through May 31,
2020
MISO planning year. IPL and WPL currently have adequate capacity to meet such MISO planning reserve margin requirements.
Generation -
IPL and WPL own a portfolio of EGUs located in Iowa, Wisconsin and Minnesota with a diversified fuel mix that includes natural gas, renewable resources and coal. Refer to “
Properties
” in Item 2 for details of IPL’s and WPL’s EGUs.
Fuel Costs
- The average cost of delivered fuel per million British Thermal Units used for electric generation was as follows:
|
IPL
|
WPL
|
||||||||||||||||||||||
|
2018
|
2017
|
2016
|
2018
|
2017
|
2016
|
||||||||||||||||||
|
All fuels
|
|
$2.46
|
|
|
$2.22
|
|
|
$2.17
|
|
|
$2.72
|
|
|
$2.53
|
|
|
$2.61
|
|
|||||
|
Natural gas (a)
|
3.12
|
|
2.72
|
|
2.86
|
|
3.30
|
|
3.28
|
|
3.25
|
|
|||||||||||
|
Coal
|
1.97
|
|
2.00
|
|
1.98
|
|
2.45
|
|
2.38
|
|
2.47
|
|
|||||||||||
|
(a)
|
The average cost of natural gas includes commodity and transportation costs, as well as realized gains and losses from swap and option contracts used to hedge the price of natural gas volumes expected to be used by IPL’s and WPL’s natural gas-fired EGUs.
|
Natural Gas
- Alliant Energy, IPL and WPL own several natural gas-fired EGUs, and WPL also has exclusive rights to the output of AEF’s Sheboygan Falls Energy Facility under an affiliated lease agreement. These facilities help meet customer demand for electricity generally during peak hour demands and when natural gas prices are low enough to make natural gas-fired generation economical compared to other fuel sources. Alliant Energy manages the gas supply to these gas-fired EGUs and helps ensure an adequate supply is available at known prices through a combination of gas commodity, pipeline transportation and storage agreements held by IPL and WPL for numerous years. Alliant Energy, IPL and WPL believe they are reasonably insulated against gas price volatility for these EGUs given their use of forward contracts and hedging practices, as well as their regulatory cost-recovery mechanisms.
Wind
- IPL owns the Whispering Willow - East and Franklin County wind farms, and WPL owns the Cedar Ridge and Bent Tree wind farms and has a partial ownership interest in the assets of the FWEC wind farm. All or some of the renewable energy attributes associated with generation from these sources may be used in future years to comply with RES or other regulatory requirements.
Coal
- Coal is one of the fuel sources for owned EGUs. Coal contracts entered into with different suppliers help ensure that a specified supply of coal is available, and delivered, at known prices for IPL’s and WPL’s coal-fired EGUs for several years. Alliant Energy, IPL and WPL believe their coal supply portfolio represents a reasonable balance between the risks of insufficient supplies and those associated with being unable to respond to future coal market changes. Remaining coal requirements are expected to be met from either future term contracts or purchases in the spot market. Currently, all of the coal utilized by IPL and WPL is from the Wyoming Powder River Basin.
Alliant Energy, IPL and WPL believe they are reasonably insulated against coal price volatility given their current coal procurement process, the specific coal market in their primary purchase region and regulatory cost-recovery mechanisms. The coal procurement process supports periodic purchases, staggering of contract terms, stair-stepped levels of supply going forward and supplier diversity. Similarly, given the term lengths of their transportation agreements and strategic alignment of agreement expirations for negotiation purposes, Alliant Energy, IPL and WPL believe they are reasonably insulated against future higher coal transportation rates from the major railroads.
|
9
|
||
Purchased Power -
IPL and WPL periodically enter into PPAs and purchase electricity from wholesale energy markets to meet a portion of their customer demand for electricity. Refer to
Note 17(b)
for discussion of purchased power commitments.
Electric Transmission
-
IPL and WPL do not own electric transmission assets and currently receive electric transmission services from ITC and ATC, respectively. ITC and ATC are independent, for-profit, transmission-only companies and are transmission-owning members of the MISO Regional Transmission Organization, Midwest Reliability Organization and Reliability First Corporation Regional Entities. The annual transmission service rates that ITC or ATC charges their customers are calculated each calendar year using a FERC-approved cost of service formula rate. As a result, ITC and ATC can implement new rates each calendar year without filing a request with FERC. However, new rates are subject to challenge by either FERC or customers. If the rates proposed by ITC or ATC are determined by FERC to be unjust or unreasonable, or another mechanism is determined by FERC to be just and reasonable, ITC’s or ATC’s rates would change accordingly. Refer to
Note 1(g)
for discussion of a transmission cost rider utilized by IPL for recovery of its electric transmission service expense, and discussion of WPL’s electric transmission service expense, which is recovered from its retail electric customers through changes in base rates determined during periodic rate proceedings.
MISO Markets
-
IPL and WPL are members of MISO, a FERC-approved Regional Transmission Organization, which is responsible for monitoring and ensuring equal access to the transmission system in their footprint. IPL and WPL participate in the wholesale energy and ancillary services markets operated by MISO, which are discussed in more detail below. As agent for IPL and WPL, Corporate Services enters into energy, capacity, ancillary services, and transmission sale and purchase transactions within MISO. Corporate Services assigns such sales and purchases between IPL and WPL based on statements received from MISO.
Wholesale Energy Market -
IPL and WPL sell and purchase power in the day-ahead and real-time wholesale energy markets operated by MISO. MISO’s bid/offer-based markets compare the cost of IPL and WPL generation against other generators, which affects IPL and WPL generation operations, energy purchases and energy sales. MISO generally dispatches the lowest cost generators, while recognizing current system constraints, to reduce costs for purchasers in the wholesale energy market. In addition, MISO may dispatch generators that support reliability needs, but that would not have operated based on economic needs. In these cases, MISO’s settlement assures that these generators are made whole financially for their variable costs.
Ancillary Services Market -
IPL and WPL also participate in MISO’s ancillary services market, which integrates the procurement and use of regulation and contingency reserves with the existing wholesale energy market to ensure reliability of electricity supply. MISO’s ancillary services market has had the overall impact of lowering ancillary services costs in the MISO footprint.
Financial Transmission Rights and Auction Revenue Rights
-
In areas of constrained transmission capacity, energy costs could be higher due to congestion and its impact on locational marginal prices. FTRs provide a hedge for certain congestion costs that occur in the MISO energy market. MISO allocates auction revenue rights to IPL and WPL annually based on a fiscal year from June 1 through May 31 and historical use of the transmission system. The allocated auction revenue rights are used by IPL and WPL to acquire FTRs through the FTR auctions operated by MISO.
Resource Adequacy
-
MISO has resource adequacy requirements to help ensure adequate resources to meet MISO’s forecasted peak load obligations plus a reserve margin. Only accredited capacity assigned to EGUs is available to meet these requirements. In order for an EGU to receive accredited capacity, it must meet MISO capacity accreditation requirements, which can include satisfying transmission requirements identified in its interconnection agreement prior to the MISO planning year.
|
10
|
||
|
Electric Operating Information - Alliant Energy
|
2018
|
2017
|
2016
|
||||||||
|
Revenues (in millions):
|
|||||||||||
|
Retail
|
|
$2,687.8
|
|
|
$2,569.6
|
|
|
$2,564.8
|
|
||
|
Sales for resale
|
259.2
|
|
268.8
|
|
266.7
|
|
|||||
|
Other
|
53.3
|
|
56.3
|
|
44.0
|
|
|||||
|
Total
|
|
$3,000.3
|
|
|
$2,894.7
|
|
|
$2,875.5
|
|
||
|
Sales (000s MWh):
|
|||||||||||
|
Retail
|
25,684
|
|
25,095
|
|
25,339
|
|
|||||
|
Sales for resale
|
5,804
|
|
5,003
|
|
4,399
|
|
|||||
|
Other
|
96
|
|
94
|
|
100
|
|
|||||
|
Total
|
31,584
|
|
30,192
|
|
29,838
|
|
|||||
|
Customers (End of Period):
|
|||||||||||
|
Retail
|
962,654
|
|
959,295
|
|
955,533
|
|
|||||
|
Other
|
2,860
|
|
2,826
|
|
2,785
|
|
|||||
|
Total
|
965,514
|
|
962,121
|
|
958,318
|
|
|||||
|
Other Selected Electric Data:
|
|||||||||||
|
Maximum summer peak hour demand (MW)
|
5,459
|
|
5,375
|
|
5,615
|
|
|||||
|
Maximum winter peak hour demand (MW)
|
4,556
|
|
4,504
|
|
4,559
|
|
|||||
|
Cooling degree days (a):
|
|||||||||||
|
Cedar Rapids, Iowa (IPL) (normal - 793)
|
1,032
|
|
747
|
|
971
|
|
|||||
|
Madison, Wisconsin (WPL) (normal - 672)
|
799
|
|
578
|
|
780
|
|
|||||
|
Sources of electric energy (000s MWh):
|
|||||||||||
|
Gas
|
9,731
|
|
5,315
|
|
4,505
|
|
|||||
|
Purchased power:
|
|||||||||||
|
Nuclear
|
3,538
|
|
3,727
|
|
3,444
|
|
|||||
|
Wind (b)
|
1,086
|
|
1,268
|
|
1,079
|
|
|||||
|
Other (b)
|
4,076
|
|
6,242
|
|
8,912
|
|
|||||
|
Wind (b)
|
1,603
|
|
1,591
|
|
1,382
|
|
|||||
|
Coal
|
12,113
|
|
12,380
|
|
11,019
|
|
|||||
|
Other (b)
|
240
|
|
239
|
|
228
|
|
|||||
|
Total
|
32,387
|
|
30,762
|
|
30,569
|
|
|||||
|
Revenue per KWh sold to retail customers (cents)
|
10.46
|
|
10.24
|
|
10.12
|
|
|||||
|
(a)
|
Cooling degree days are calculated using a simple average of the high and low temperatures each day compared to a 65 degree base. Normal degree days are calculated using a rolling 20-year average of historical cooling degree days. Refer to “
Gas Operating Information
” below for details of heating degree days.
|
|
(b)
|
All or some of the renewable energy attributes associated with generation from these sources may be used in future years to comply with renewable energy standards or other regulatory requirements.
|
|
11
|
||
|
Electric Operating Information
|
IPL
|
WPL
|
|||||||||||||||||||||
|
2018
|
2017
|
2016
|
2018
|
2017
|
2016
|
||||||||||||||||||
|
Revenues (in millions):
|
|||||||||||||||||||||||
|
Retail
|
|
$1,578.2
|
|
|
$1,448.0
|
|
|
$1,442.5
|
|
|
$1,109.6
|
|
|
$1,121.6
|
|
|
$1,122.3
|
|
|||||
|
Sales for resale
|
117.3
|
|
114.6
|
|
97.8
|
|
141.9
|
|
154.2
|
|
168.9
|
|
|||||||||||
|
Other
|
35.6
|
|
36.3
|
|
29.4
|
|
17.7
|
|
20.0
|
|
14.6
|
|
|||||||||||
|
Total
|
|
$1,731.1
|
|
|
$1,598.9
|
|
|
$1,569.7
|
|
|
$1,269.2
|
|
|
$1,295.8
|
|
|
$1,305.8
|
|
|||||
|
Sales (000s MWh):
|
|||||||||||||||||||||||
|
Retail
|
14,670
|
|
14,356
|
|
14,523
|
|
11,014
|
|
10,739
|
|
10,816
|
|
|||||||||||
|
Sales for resale
|
2,980
|
|
2,169
|
|
1,406
|
|
2,824
|
|
2,834
|
|
2,993
|
|
|||||||||||
|
Other
|
37
|
|
38
|
|
41
|
|
59
|
|
56
|
|
59
|
|
|||||||||||
|
Total
|
17,687
|
|
16,563
|
|
15,970
|
|
13,897
|
|
13,629
|
|
13,868
|
|
|||||||||||
|
Customers (End of Period):
|
|||||||||||||||||||||||
|
Retail
|
489,831
|
|
489,717
|
|
489,005
|
|
472,823
|
|
469,578
|
|
466,528
|
|
|||||||||||
|
Other
|
900
|
|
878
|
|
862
|
|
1,960
|
|
1,948
|
|
1,923
|
|
|||||||||||
|
Total
|
490,731
|
|
490,595
|
|
489,867
|
|
474,783
|
|
471,526
|
|
468,451
|
|
|||||||||||
|
Other Selected Electric Data:
|
|||||||||||||||||||||||
|
Maximum summer peak hour demand (MW)
|
2,929
|
|
2,968
|
|
2,996
|
|
2,647
|
|
2,476
|
|
2,681
|
|
|||||||||||
|
Maximum winter peak hour demand (MW)
|
2,553
|
|
2,421
|
|
2,479
|
|
2,011
|
|
2,100
|
|
2,131
|
|
|||||||||||
|
Cooling degree days (a):
|
|||||||||||||||||||||||
|
Cedar Rapids, Iowa (IPL) (normal - 793)
|
1,032
|
|
747
|
|
971
|
|
N/A
|
|
N/A
|
|
N/A
|
|
|||||||||||
|
Madison, Wisconsin (WPL) (normal - 672)
|
N/A
|
|
N/A
|
|
N/A
|
|
799
|
|
578
|
|
780
|
|
|||||||||||
|
Sources of electric energy (000s MWh):
|
|||||||||||||||||||||||
|
Gas
|
5,930
|
|
3,342
|
|
1,838
|
|
3,801
|
|
1,973
|
|
2,667
|
|
|||||||||||
|
Purchased power:
|
|||||||||||||||||||||||
|
Nuclear
|
3,538
|
|
3,727
|
|
3,444
|
|
N/A
|
|
N/A
|
|
N/A
|
|
|||||||||||
|
Wind (b)
|
549
|
|
613
|
|
635
|
|
537
|
|
655
|
|
444
|
|
|||||||||||
|
Other (b)
|
1,472
|
|
2,456
|
|
4,267
|
|
2,604
|
|
3,786
|
|
4,645
|
|
|||||||||||
|
Wind (b)
|
890
|
|
851
|
|
630
|
|
713
|
|
740
|
|
752
|
|
|||||||||||
|
Coal
|
5,690
|
|
5,766
|
|
5,598
|
|
6,423
|
|
6,614
|
|
5,421
|
|
|||||||||||
|
Other (b)
|
40
|
|
22
|
|
6
|
|
200
|
|
217
|
|
222
|
|
|||||||||||
|
Total
|
18,109
|
|
16,777
|
|
16,418
|
|
14,278
|
|
13,985
|
|
14,151
|
|
|||||||||||
|
Revenue per KWh sold to retail customers (cents)
|
10.76
|
|
10.09
|
|
9.93
|
|
10.07
|
|
10.44
|
|
10.38
|
|
|||||||||||
|
(a)
|
Cooling degree days are calculated using a simple average of the high and low temperatures each day compared to a 65 degree base. Normal degree days are calculated using a rolling 20-year average of historical cooling degree days. Refer to “
Gas Operating Information
” below for details of heating degree days.
|
|
(b)
|
All or some of the renewable energy attributes associated with generation from these sources may be used in future years to comply with renewable energy standards or other regulatory requirements.
|
2) GAS UTILITY OPERATIONS
General
-
Gas utility operations represent the second largest operating segment for Alliant Energy, IPL and WPL. Alliant Energy’s gas utility operations are located in the Midwest with IPL providing gas service in Iowa and WPL providing gas service in Wisconsin. Refer to the “
Gas Operating Information
” tables for additional details regarding gas utility operations. Refer to
Note 1(g)
for information relating to utility natural gas cost recovery mechanisms and
Note 17(b)
for discussion of natural gas commitments.
Customers
-
IPL and WPL provide gas utility service to a diversified base of retail customers and industries, including research, education, hospitality, manufacturing and chemicals (including ethanol). In addition, IPL and WPL provide transportation service to commercial and industrial customers by moving customer-owned gas through Alliant Energy’s distribution systems to the customers’ meters.
Seasonality
-
Gas sales follow a seasonal pattern with an annual base-load of gas and a large heating peak occurring during the winter season. Natural gas obtained from producers, marketers and brokers, as well as gas in storage, is utilized to meet the peak heating season requirements. Storage contracts generally allow IPL and WPL to purchase gas in the summer and inject it into underground storage fields, and remove it from storage fields in the winter to deliver to customers.
Competition
-
Gas customers in Iowa and Wisconsin currently do not have the ability to choose their gas distributor, and IPL and WPL have obligations to serve all their gas customers. While the gas utility distribution function is expected to remain a
|
12
|
||
regulated function, sales of the natural gas commodity and related services are subject to competition from third-parties who provide alternative fuel sources (e.g. propane). However, when natural gas service is available for a given area, customers in such area have generally selected natural gas over propane as a more cost competitive solution for their fuel needs. Refer to “
Customer Investments
” in MDA for discussion of plans to extend gas distribution systems.
Gas Supply
-
IPL and WPL maintain purchase agreements with numerous suppliers of natural gas from various gas producing regions of the U.S. and Canada. In providing gas commodity service to retail customers, Corporate Services administers a diversified portfolio of transportation and storage contracts on behalf of IPL and WPL. The tariffs for IPL’s and WPL’s retail gas customers provide for subsequent adjustments to their rates for the cost of gas sold to these customers. As a result, natural gas prices do not have a material impact on IPL’s or WPL’s gas margins.
Gas Demand Planning Reserve Margin -
IPL and WPL are required to maintain adequate pipeline capacity to ensure they meet their customers’ maximum daily system demand requirements. IPL and WPL currently have planning reserve margins of 4% and 3%, respectively, above their forecasted maximum daily system demand requirements from November
2018
through March
2019
.
|
Gas Operating Information - Alliant Energy
|
2018
|
2017
|
2016
|
||||||||
|
Revenues (in millions):
|
|||||||||||
|
Retail
|
|
$402.3
|
|
|
$364.6
|
|
|
$322.4
|
|
||
|
Transportation/other
|
44.3
|
|
36.3
|
|
33.0
|
|
|||||
|
Total
|
|
$446.6
|
|
|
$400.9
|
|
|
$355.4
|
|
||
|
Sales (000s Dths):
|
|||||||||||
|
Retail
|
53,389
|
|
49,250
|
|
47,743
|
|
|||||
|
Transportation/other
|
90,357
|
|
76,916
|
|
77,485
|
|
|||||
|
Total
|
143,746
|
|
126,166
|
|
125,228
|
|
|||||
|
Retail Customers at End of Period
|
415,174
|
|
413,054
|
|
411,758
|
|
|||||
|
Other Selected Gas Data:
|
|||||||||||
|
Heating degree days (a):
|
|||||||||||
|
Cedar Rapids, Iowa (IPL) (normal - 6,655)
|
6,868
|
|
6,076
|
|
5,933
|
|
|||||
|
Madison, Wisconsin (WPL) (normal - 6,939)
|
7,303
|
|
6,569
|
|
6,420
|
|
|||||
|
Revenue per Dth sold to retail customers
|
|
$7.54
|
|
|
$7.40
|
|
|
$6.75
|
|
||
|
Purchased gas costs per Dth sold to retail customers
|
|
$4.27
|
|
|
$4.23
|
|
|
$3.99
|
|
||
|
Gas Operating Information
|
IPL
|
WPL
|
|||||||||||||||||||||
|
2018
|
2017
|
2016
|
2018
|
2017
|
2016
|
||||||||||||||||||
|
Revenues (in millions):
|
|||||||||||||||||||||||
|
Retail
|
|
$238.4
|
|
|
$202.2
|
|
|
$183.1
|
|
|
$163.9
|
|
|
$162.4
|
|
|
$139.3
|
|
|||||
|
Transportation/other
|
27.8
|
|
23.8
|
|
20.9
|
|
16.5
|
|
12.5
|
|
12.1
|
|
|||||||||||
|
Total
|
|
$266.2
|
|
|
$226.0
|
|
|
$204.0
|
|
|
$180.4
|
|
|
$174.9
|
|
|
$151.4
|
|
|||||
|
Sales (000s Dths):
|
|||||||||||||||||||||||
|
Retail
|
28,651
|
|
26,580
|
|
26,230
|
|
24,738
|
|
22,670
|
|
21,513
|
|
|||||||||||
|
Transportation/other
|
37,899
|
|
39,365
|
|
37,158
|
|
52,458
|
|
37,551
|
|
40,327
|
|
|||||||||||
|
Total
|
66,550
|
|
65,945
|
|
63,388
|
|
77,196
|
|
60,221
|
|
61,840
|
|
|||||||||||
|
Retail Customers at End of Period
|
224,413
|
|
224,041
|
|
224,420
|
|
190,761
|
|
189,013
|
|
187,338
|
|
|||||||||||
|
Other Selected Gas Data:
|
|||||||||||||||||||||||
|
Maximum daily winter peak demand (Dth)
|
264,787
|
|
237,203
|
|
262,409
|
|
220,784
|
|
201,947
|
|
203,655
|
|
|||||||||||
|
Heating degree days (a):
|
|||||||||||||||||||||||
|
Cedar Rapids, Iowa (IPL) (normal - 6,655)
|
6,868
|
|
6,076
|
|
5,933
|
|
N/A
|
|
N/A
|
|
N/A
|
|
|||||||||||
|
Madison, Wisconsin (WPL) (normal - 6,939)
|
N/A
|
|
N/A
|
|
N/A
|
|
7,303
|
|
6,569
|
|
6,420
|
|
|||||||||||
|
Revenue per Dth sold to retail customers
|
|
$8.32
|
|
|
$7.61
|
|
|
$6.98
|
|
|
$6.63
|
|
|
$7.16
|
|
|
$6.48
|
|
|||||
|
Purchased gas cost per Dth sold to retail customers
|
|
$4.51
|
|
|
$4.34
|
|
|
$4.21
|
|
|
$3.99
|
|
|
$4.11
|
|
|
$3.72
|
|
|||||
|
(a)
|
Heating degree days are calculated using a simple average of the high and low temperatures each day compared to a 65 degree base. Normal degree days are calculated using a rolling 20-year average of historical heating degree days.
|
3) OTHER UTILITY OPERATIONS - STEAM -
IPL’s Prairie Creek facility is the primary source of steam for IPL’s
two
high-pressure steam customers in Iowa. These customers are each under contract through 2025 for taking minimum quantities of annual steam usage, with certain conditions.
|
13
|
||
ITEM 1A. RISK FACTORS
You should carefully consider each of the risks described below relating to Alliant Energy, IPL and WPL, together with all of the other information contained in this combined report, before making an investment decision with respect to our securities. If any of the following risks develop into actual events, our business, financial condition or results of operations could be materially and adversely affected and you may lose all or part of your investment.
Our utility business is significantly impacted by government legislation, regulation and oversight
-
Our utility financial condition is influenced by how regulatory authorities, including the IUB, the PSCW and FERC, establish the rates we can charge our customers, our authorized rates of return and common equity levels, and the costs that may be recovered from customers. Our ability to timely obtain rate adjustments to earn authorized rates of return depends upon timely regulatory action under applicable statutes and regulations, and cannot be guaranteed. In future rate reviews, IPL and WPL may not receive an adequate amount of rate relief to recover all costs and earn their authorized rates of return, rates may be reduced, rate refunds may be required, rate adjustments may not be approved on a timely basis, costs may not be otherwise recovered through rates, future rates may be temporarily frozen, certain rate base items may not receive a full weighted average cost of capital, and authorized rates of return on capital may be reduced. As a result, we may experience adverse impacts on our financial condition and results of operations.
In addition, our operations are subject to extensive regulation primarily by the IUB, the PSCW and FERC. We are also subject to oversight and monitoring by organizations such as the North American Electric Reliability Corporation, the Pipeline and Hazardous Materials Safety Administration, and the Midcontinent Independent System Operator, Inc. The impacts on our operations include: our ability to site and construct new generating facilities and recover associated costs, such as renewable energy projects; the installation of environmental controls and the recovery of associated costs; our ability to decommission generating facilities and recover related costs and the remaining carrying value of these facilities; our ability to site, construct and recover costs for new natural gas pipelines; our ability to recover costs to upgrade our electric and gas distribution systems; the amount of certain sources of energy we must use, such as renewable sources; our ability to purchase generating facilities and recover the costs associated therewith; our ability to sell utility assets and any conditions placed upon the sale of such assets; the rates paid to transmission operators and how those costs are recovered from customers; our ability to enter into purchased power agreements and recover the costs associated therewith; resource adequacy requirements, energy capacity standards, what forms of energy are considered when determining whether we meet those standards, and when new facilities such as IPL’s Marshalltown Generating Station, WPL’s West Riverside Energy Center, and IPL’s and WPL’s planned additional wind generation may be fully accredited with energy capacity; the allocation of expenditures by transmission companies on transmission network upgrades and our ability to recover costs associated therewith; reliability; safety; the issuance of securities; accounting matters; and transactions between affiliates. These regulatory authorities and organizations are also empowered to impose financial penalties and other sanctions, including requirements to implement new compliance programs. Failure to obtain approvals for any of these matters in a timely manner, or receipt of approvals with uneconomical conditions, may cause us not to pursue the construction of such projects or to record an impairment of our assets and may have a material adverse impact on our financial condition and results of operations.
Provisions of the Wisconsin Utility Holding Company Act limit our ability to invest in or grow our non-utility activities and may deter potential purchasers who might be willing to pay a premium for our stock.
Our strategy includes large construction projects, which are subject to risks -
Our strategy includes constructing renewable generating facilities, constructing a natural gas-fired generating facility, making other large-scale improvements to generating facilities, implementing advanced metering infrastructure for IPL customers, and large-scale additions and upgrades to our electric and gas distribution systems. These construction projects are subject to various risks. These risks include: the inability to obtain necessary permits in a timely manner; adverse interpretation or enforcement of permit conditions; changes in applicable laws or regulations; changes in costs of materials, equipment, commodities, fuel or labor; delays caused by construction accidents or injuries; shortages in materials, equipment and qualified labor; changes to the scope or timing of the projects; general contractors or subcontractors not performing as required under their contracts; the inability to agree to contract terms or disputes in contract terms; poor initial cost estimates; work stoppages; adverse weather conditions; government actions; legal action; unforeseen engineering or technology issues; limited access to capital; and other adverse economic conditions. We may not be able to recover all costs for the projects in rates and face increased risk of potential impairment of our project investment if a construction project is not completed or is delayed, or final costs exceed expectations or the costs approved by our regulators, for example, if IPL’s expansion of wind generation exceeds the respective cost cap approved by the IUB. Inability to recover costs, or inability to complete the project in a timely manner, could adversely impact our financial condition and results of operations.
|
14
|
||
Demand for energy may decrease -
Our results of operations are affected by the demand for energy in our service territories. Energy demand may decrease due to many things, including economic conditions, proliferation of customer- and third party-owned generation, loss of service territory or franchises, energy efficiency measures, technological advances that increase energy efficiency, and loss of wholesale customers. The loss of sales due to lower demand for energy may increase our rates for remaining customers, as our rates must cover our fixed costs. Increased customer rates may cause decreased demand for energy as customers move to customer- and third party-owned generation and implement energy efficiency measures to reduce costs. The loss of customers, the inability to replace those customers with new customers, and the decrease in demand for energy could negatively impact our financial condition and results of operations.
Changes to certain tax elections, tax regulations and future taxable income could negatively impact our financial condition and results of operations -
We have significantly reduced our federal and state income tax obligations through tax planning strategies and the extension of bonus depreciation deductions for certain expenditures for property. These tax planning strategies and extensions of bonus depreciation deductions have generated large annual taxable losses and tax credits that have resulted in significant federal and state net operating losses and tax credit carryforwards. We plan to utilize substantially all of these net operating losses and tax credit carryforwards in the future to reduce our income tax obligations. If we cannot generate enough taxable income in the future to utilize all of the net operating losses and tax credit carryforwards before they expire due to lower than expected financial performance or changes to tax regulations, we may incur material charges to earnings. If the IRS does not agree with the deductions resulting from our tax planning strategies or our position on the qualification of production tax credits from wind generating facilities, our financial condition and results of operations may be adversely impacted.
Our utility business currently operates wind generating facilities, which generate production tax credits for us to use to reduce our federal tax obligations. The amount of production tax credits we earn is dependent on the level of electricity output generated by our wind farms and the applicable tax credit rate. A variety of operating and economic parameters, including significant transmission constraints, the imbalance of supply and demand of wind energy resulting in unfavorable pricing for wind energy, adverse weather conditions and breakdown or failure of equipment, could significantly reduce the production tax credits generated by our wind farms resulting in a material adverse impact on our financial condition and results of operations.
Finally, FERC regulates utility income tax policies, including partnership tax policies, which impact our interest in American Transmission Company LLC and ATC Holdco LLC (ATC Holdings). FERC is currently investigating these income tax issues in addition to rate of return policies as a result of a court decision. The results of this investigation may lead to changes in FERC’s income tax policies, which would impact partnership entities, particularly ATC Holdings. We are currently unable to determine what impacts these potential changes will have on our financial condition or results of operations; however, it is possible that a change could reduce Alliant Energy’s equity earnings and distributions from ATC Holdings.
A cyber attack may disrupt our operations or lead to a loss or misuse of confidential and proprietary information or potential liability -
We operate in an industry that requires the continuous use and operation of sophisticated information technology systems and network infrastructure. We face threats from use of malicious code (such as malware, viruses and ransomware), employee theft or misuse, advanced persistent threats, and phishing attacks. Cyber attacks targeting electronic control systems used at our generating facilities and for electric and gas distribution systems could result in a full or partial disruption of our electric and/or gas operations. Any disruption of these operations could result in a loss of service to customers and a significant decrease in revenues, as well as significant expense to repair system damage and remedy security breaches. Due to the evolving nature of cyber attacks and cyber security, our current safeguards to protect our operating systems and information technology assets may not always be effective. We cannot guarantee that such safeguards will be completely successful in the event of a cyber attack. If the technology systems were to fail or be breached by a cyber attack or a computer virus, and not be recovered in a timely fashion, we may be unable to fulfill critical business functions and confidential data could be compromised, adversely impacting our financial condition and results of operation.
In addition, we may collect and retain sensitive information, including personal information about our customers, shareowners and employees. In some cases, we outsource administration of certain functions to vendors that could be targets of cyber attacks. For example, we outsource administration of our employee health insurance to Anthem. Anthem was the target of a cyber attack in 2014. Any theft, loss and/or fraudulent use of customer, shareowner, employee or proprietary data as a result of a cyber attack could subject us to significant litigation, liability and costs, as well as adversely impact our reputation with customers and regulators, among others.
|
15
|
||
We are subject to employee workforce factors that could affect our businesses -
We operate in an industry that requires specialized technical skills. It may be difficult to hire and retain such a skilled workforce due to labor market conditions, the length of time employees need to acquire the skills, and general competition for talent. Further, we must build a work force that is innovative, customer-focused and competitive to thrive in the future in order to successfully implement our strategy. We are also subject to collective bargaining agreements with approximately 2,200 employees. Any work stoppage experienced in connection with negotiations of collective bargaining agreements could adversely affect our financial condition and results of operations as well as our ability to implement our strategy.
Our utility business is seasonal and may be adversely affected by the impacts of weather -
Electric and gas utility businesses are seasonal businesses. Demand for electricity is greater in the summer months associated with higher air conditioning needs. Conversely, demand for natural gas depends significantly upon temperature patterns in winter months due to heavy use in residential and commercial heating. As a result, our overall operating results in the future may fluctuate substantially on a seasonal basis. In addition, we have historically generated less revenues and income when temperatures are warmer in the winter and/or cooler in the summer. Thus, mild winters and/or summers could have an adverse effect on our financial condition and results of operations.
Our utility businesses are subject to numerous environmental laws and regulations -
Our utilities are subject to numerous stringent federal, regional, state and local environmental laws, regulations, court orders, and international treaties. These laws, regulations and court orders generally concern emissions into the air, effluents into the water, use of water, wetlands preservation, remediation of contamination, waste disposal, disposal of coal combustion residuals, hazardous waste disposal, threatened and endangered species, and noise regulation, among others. Failure to comply with such laws, regulations and court orders, or to obtain or comply with any necessary environmental permits pursuant to such laws and regulations, could result in injunctions, fines or other sanctions. Environmental laws and regulations affecting power generation and distribution are complex and subject to continued uncertainty, but have tended to become more stringent over time. These laws and regulations have imposed, and proposed laws and regulations could impose in the future, additional costs on the operation of our generating facilities. We have incurred, and will continue to incur, capital and other expenditures to comply with these and other environmental laws and regulations. Changes in, or new development of, environmental restrictions may force us to incur significant expenses or expenses that may exceed our estimates. There can be no assurance that we would be able to recover all or any increased environmental costs from our customers. Failure to comply with the laws, regulations and court orders, changes in the laws and regulations and failure to recover costs of compliance may adversely impact our financial condition and results of operations.
Actions related to global climate change and reducing greenhouse gases (GHG) emissions could negatively impact us -
Regulators, customers and investors continue to raise concerns about climate change and GHG emissions. National regulatory action is in flux and international regulatory actions continue to evolve. We are focused on executing a long-term strategy to deliver reliable and affordable energy with lower carbon dioxide (CO2) emissions independent of changing policies and political landscape. However, it is unclear how these climate change concerns will ultimately impact us. We could incur costs or other obligations to comply with future GHG regulations, and could become the target of legal claims or challenges, because generating electricity using fossil fuels emits CO2 and other GHG. Further, investors may determine that we are too reliant on fossil fuels and not buy shares of our common stock, or sell their shares of our common stock, which may cause our stock price to decrease, or not buy our debt securities, which may cause our cost of debt to increase. We could face additional pressures from customers or investors to more rapidly reduce CO2 on a voluntary-basis, including faster adoption of lower carbon technologies and management of excess renewable energy credits. The EPA’s approach and timing for implementing rules to regulate carbon emissions at fossil-fueled electric generating units remains undecided and subject to litigation. Regulation of CO2 emissions could materially increase costs, causing some electric generating units to be uneconomical to operate or maintain. We cannot provide any assurance regarding the potential impacts of climate change policy or GHG regulations on our operations and these could have a material adverse impact on our financial condition and results of operations.
We are dependent on the capital markets and could be negatively impacted by disruptions in the capital markets -
Successful implementation of our strategy is dependent upon our ability to access the capital markets. We have forecasted capital expenditures of approximately $5 billion over the next four years. Disruption, uncertainty or volatility in the capital markets could increase our cost of capital or limit our ability to raise funds needed to operate our businesses. Disruptions could be caused by Federal Reserve policies and actions, currency concerns, economic downturn or uncertainty, monetary policies, a negative view of the utility industry or our company, failures of financial institutions, U.S. debt management concerns, U.S. debt limit and budget debates, including government shutdowns, European and worldwide sovereign debt concerns, other global or geopolitical events, or other factors. Increases in interest rates may cause the price of our equity securities to decline. Any disruptions in capital markets could adversely impact our ability to implement our strategy.
|
16
|
||
We rely on our strong credit ratings to access the credit markets. If our credit ratings are downgraded for any reason, such as Federal Tax Reform impacts or general negative outlook for the utility industry, we could pay higher interest rates in future financings, the pool of potential lenders could be reduced, borrowing costs under existing credit facilities could increase, our access to the commercial paper market could be limited, or we could be required to provide additional credit assurance, including cash collateral, to contract counterparties. If our access to capital were to become significantly constrained or costs of capital increased significantly due to lowered credit ratings, prevailing industry conditions, regulatory constraints, volatility of the capital markets or other factors, our financial condition and results of operations could be adversely affected.
Regional and national economic conditions could have an unfavorable impact on us -
Our utility and non-utility businesses follow the economic cycles of the customers we serve and credit risk of counterparties we do business with. Adverse economic conditions in our service territories can adversely affect the financial condition of our customers and reduce their demand for electricity and natural gas. Economic conditions may not create enough growth to replace lost energy demand or to grow energy demand. Reduced volumes of electricity and natural gas sold, or the inability to collect unpaid bills from our customers, could adversely impact our financial condition and results of operations.
Threats of terrorism and catastrophic events that could result from terrorism may impact our operations in unpredictable ways -
We are subject to direct and indirect effects of terrorist threats and activities. Generation, transmission and distribution facilities, in general, have been identified as potential targets of physical or cyber attacks. Physical attacks on transmission and distribution facilities that appeared to be terrorist-style attacks have occurred. The risks posed by such attacks could include, among other things, the inability to generate, purchase or distribute electric energy or obtain fuel sources, the increased cost of security and insurance, the disruption of, volatility in, or other effects on capital markets, and a decline in the economy and/or energy usage within our service territories, all of which could adversely impact our financial condition and results of operations. In addition, the cost of repairing damage to our facilities and infrastructure caused by acts of terrorism, and the loss of revenue if such events prevent us from providing utility service to our customers, could adversely impact our financial condition and results of operations.
We may not be able to fully recover costs related to commodity prices -
We have natural gas and coal supply and transportation contracts in place for some of the natural gas and coal we require to generate electricity. We also have transportation and supply agreements in place to facilitate delivery of natural gas to our customers. Our counterparties to these contracts may not fulfill their obligations to provide natural gas or coal to us due to financial or operational problems caused by natural disasters, severe weather or cyber attacks. If we were unable to obtain enough natural gas or coal for our electric generating facilities under our existing contracts, or to obtain electricity under existing or future purchased power agreements, we could be required to purchase natural gas or coal at higher prices or forced to purchase electricity from higher-cost generating resources in the MISO energy market. If, for natural gas delivery to our customers, we were unable to obtain our natural gas supply requirements under existing or future natural gas supply and transportation contracts, we could be required to purchase natural gas at higher prices from other sources. Natural gas market prices have been volatile in the past, especially during periods of extremely cold temperatures or disruption in supply caused by major storms or pipeline explosions. We may not be able to pass on all of the changes in costs to our customers, especially at WPL where we do not have an automatic retail electric fuel cost adjustment clause to timely recover such costs. Increases in prices and costs due to disruptions that are not recovered in rates fully, in a timely manner, may adversely impact our financial condition and results of operations.
We face risks associated with operating electric and natural gas infrastructure -
The operation of electric generating facilities involves many risks, including start-up risks, breakdown or failure of equipment, failure of generating facilities including wind turbines, the dependence on a specific fuel source, including the supply and transportation of fuel, the risk of performance below expected or contracted levels of output or efficiency, employee safety, operator error and compliance with mandatory reliability standards. Our energy delivery infrastructure is aging, which increases certain risks, including breakdown or failure of equipment and fires developing from our power lines. In addition, the North American transmission grid is highly interconnected and, in extraordinary circumstances, disruptions at particular points within the grid could cause an extensive power outage in our delivery systems. Increased utilization of customer- and third party-owned generation technologies could disrupt the reliability and balance of the electricity grid. Further, the transmission system in our utilities’ service territories can experience constraints limiting the ability to transmit electric energy within our service territories. The transmission constraints could result in an inability to deliver energy from generating facilities, particularly wind generating facilities, to the national grid, or to access lower cost sources of electric energy. We also have obligations to provide electric service under regulatory requirements and contractual commitments. Failure to meet our service obligations could adversely impact our financial condition and results of operations.
|
17
|
||
The operation of our gas transmission and distribution infrastructure also involves many risks, such as leaks, explosions, mechanical problems and employee and public safety, which could cause substantial financial losses. These risks could result in loss of human life, significant damage to property, environmental emissions, impairment of our operations and substantial losses to us. We are also responsible for compliance with new and changing mandatory reliability and safety standards, including anticipated new regulations under the Pipeline and Hazardous Materials Safety Administration. Our infrastructure is aging, which could impact safety and compliance with possible new regulations. Failure to meet these standards could result in substantial fines. We also have obligations to provide service under regulatory requirements and contractual commitments. Failure to meet our service obligations could adversely impact our financial condition and results of operations.
Storms or other natural disasters may impact our operations in unpredictable ways -
Storms and other natural disasters, including events such as floods, tornadoes, blizzards, ice storms, extreme cold temperatures, fires, solar flares or pandemics may adversely impact our ability to generate, purchase or distribute electric energy and gas or obtain fuel or other critical supplies. In addition, we could incur large costs to repair damage to our generating facilities and electric and gas infrastructure, or costs related to environmental remediation, due to storms or other natural disasters. The restoration costs may not be fully covered by insurance policies and may not be fully recovered in rates, or recovery in rates may be delayed. Storms and natural disasters may impact our customers and the resulting reduced demand for energy could cause lower sales and revenues, which may not be replaced or recovered in rates, or rate recovery may be delayed. Any of these items could adversely impact our financial condition and results of operations.
We may incur material post-closing adjustments related to past asset and business divestitures -
We have sold certain non-utility subsidiaries such as Whiting Petroleum Corporation (Whiting Petroleum), as well as regulated assets such as our Minnesota electric and natural gas distribution assets. We may continue to incur liabilities relating to our previous ownership of, or the transactions pursuant to which we disposed of, these subsidiaries and assets. Any potential liability depends on a number of factors outside of our control, including the financial condition of Whiting Petroleum and/or its assignees. Any required payments on retained liabilities, guarantees or indemnification obligations with respect to Whiting Petroleum, the sales of our Minnesota electric and natural gas distribution assets, or other future asset or business divestitures, could adversely impact our financial condition and results of operations.
We are subject to limitations on our ability to pay dividends -
Alliant Energy is a holding company with no significant operations of its own. The primary sources of funds for Alliant Energy to pay dividends to its shareowners are dividends and distributions from its subsidiaries, primarily its utility subsidiaries. Our subsidiaries are separate and distinct legal entities and have no obligation to pay any amounts to us, whether by dividends, distributions, loans or other payments. The ability of our subsidiaries to pay dividends or make distributions to us and, accordingly, our ability to pay dividends on Alliant Energy common stock will depend on regulatory limitations, earnings, cash flows, capital requirements and general financial condition of our subsidiaries. Our utilities have dividend payment restrictions based on the terms of any outstanding preferred stock and regulatory limitations applicable to them. If we do not receive adequate dividends and distributions from our subsidiaries, then we may not be able to make, or may have to reduce, dividend payments on Alliant Energy common stock.
Our pension and other postretirement benefits plans are subject to investment and interest rate risk that could negatively impact our financial condition -
We have pension and other postretirement benefits plans that provide benefits to many of our employees and retirees. Costs of providing benefits and related funding requirements of these plans are subject to changes in the liabilities of the plans and market value of the assets that fund the plans. The funded status of the plans and the related costs reflected in our financial statements are affected by various factors, which are subject to an inherent degree of uncertainty, including economic conditions, financial market performance, interest rates, life expectancies and demographics. Recessions and volatility in the domestic and international financial markets have negatively affected the asset values of our pension plans at various times in the past. Poor investment returns or lower interest rates may necessitate accelerated funding of the plans to meet minimum federal government requirements, which could have an adverse impact on our financial condition and results of operations.
Energy industry changes could have a negative effect on our businesses -
We operate in a highly regulated business environment. The advent of new and unregulated markets has the potential to significantly impact our financial condition and results of operations. Further, competitors may not be subject to the same operating, regulatory and financial requirements that we are, potentially causing a substantial competitive disadvantage for us. Changes in technology could also alter the channels through which electric customers buy or utilize power, which could reduce the revenues or increase the expenses of our utility companies. Increased competition in our primary retail electric service territories may have a significant adverse impact on our financial condition and results of operations.
|
18
|
||
We face risks related to non-utility operations -
We rely on our non-utility operations for a portion of our earnings. If our non-utility holdings do not perform at expected levels, we could experience a material adverse impact on our financial condition and results of operations.
ITEM 1B. UNRESOLVED STAFF COMMENTS
None.
ITEM 2. PROPERTIES
Alliant Energy -
As a holding company, Alliant Energy doesn’t directly own any significant properties other than the stock of its subsidiaries. The principal properties of those subsidiaries are as follows:
IPL and WPL
Electric
- At
December 31, 2018
, IPL’s and WPL’s EGUs by primary fuel type were as follows:
|
IPL
|
Primary
|
Generating
|
|||||
|
In-service
|
Dispatch
|
Capacity
|
|||||
|
Name of EGU and Location
|
Dates
|
Type (a)
|
in MW (b)
|
||||
|
Marshalltown Generating Station (Units 1-3); Marshalltown, IA
|
2017
|
IN
|
630
|
|
|||
|
Emery Generating Station (Units 1-3); Mason City, IA
|
2004
|
IN
|
547
|
|
|||
|
Marshalltown Combustion Turbines (Units 1-3); Marshalltown, IA
|
1978
|
PK
|
143
|
|
|||
|
Prairie Creek Generating Station (Unit 4); Cedar Rapids, IA
|
1967
|
PK
|
109
|
|
|||
|
Burlington Combustion Turbines (Units 1-4); Burlington, IA
|
1994-1996
|
PK
|
46
|
|
|||
|
Total Gas
|
1,475
|
|
|||||
|
Ottumwa Generating Station (Unit 1); Ottumwa, IA (c)
|
1981
|
BL
|
315
|
|
|||
|
Lansing Generating Station (Unit 4); Lansing, IA
|
1977
|
BL
|
223
|
|
|||
|
Burlington Generating Station (Unit 1); Burlington, IA
|
1968
|
BL
|
192
|
|
|||
|
George Neal Generating Station (Unit 4); Sioux City, IA (d)
|
1979
|
BL
|
162
|
|
|||
|
George Neal Generating Station (Unit 3); Sioux City, IA (e)
|
1975
|
BL
|
135
|
|
|||
|
Prairie Creek Generating Station (Units 1 and 3); Cedar Rapids, IA
|
1958-1997
|
BL
|
28
|
|
|||
|
Louisa Generating Station (Unit 1); Louisa, IA (f)
|
1983
|
BL
|
29
|
|
|||
|
Total Coal
|
1,084
|
|
|||||
|
Lime Creek Combustion Turbines (Units 1-2); Mason City, IA
|
1991
|
PK
|
68
|
|
|||
|
Total Oil
|
68
|
|
|||||
|
Whispering Willow - East (121 Units); Franklin Co., IA
|
2009
|
IN
|
30
|
|
|||
|
Franklin County (60 Units); Franklin Co., IA
|
2012
|
IN
|
15
|
|
|||
|
Total Wind
|
45
|
|
|||||
|
Dubuque Solar Garden; Dubuque, IA
|
2017
|
IN
|
3
|
|
|||
|
Total capacity
|
2,675
|
|
|||||
|
19
|
||
|
WPL
|
Primary
|
Generating
|
|||||
|
In-service
|
Dispatch
|
Capacity
|
|||||
|
Name of EGU and Location
|
Dates
|
Type (a)
|
in MW (b)
|
||||
|
Riverside Energy Center (Units 1-3); Beloit, WI
|
2004
|
IN
|
552
|
|
|||
|
Neenah Energy Facility (Units 1-2); Neenah, WI
|
2000
|
PK
|
294
|
|
|||
|
South Fond du Lac Combustion Turbines (2 Units); Fond du Lac, WI (g)
|
1994
|
PK
|
143
|
|
|||
|
Rock River Combustion Turbines (Units 3-6); Beloit, WI
|
1967-1972
|
PK
|
132
|
|
|||
|
Sheepskin Combustion Turbine (Unit 1); Edgerton, WI
|
1971
|
PK
|
34
|
|
|||
|
Total Gas
|
1,155
|
|
|||||
|
Columbia Energy Center (Units 1-2); Portage, WI (h)
|
1975-1978
|
BL
|
554
|
|
|||
|
Edgewater Generating Station (Unit 5); Sheboygan, WI
|
1985
|
BL
|
401
|
|
|||
|
Total Coal
|
955
|
|
|||||
|
Bent Tree (122 Units); Freeborn Co., MN
|
2010-2011
|
IN
|
28
|
|
|||
|
Cedar Ridge (41 Units); Fond du Lac Co., WI
|
2008
|
IN
|
8
|
|
|||
|
Forward Wind Energy Center; Dodge and Fond du Lac Co, WI (i)
|
2008
|
IN
|
6
|
|
|||
|
Total Wind
|
42
|
|
|||||
|
Prairie du Sac Hydro Plant (8 Units); Prairie due Sac, WI
|
1914-1940
|
IN
|
12
|
|
|||
|
Kilbourn Hydro Plant (4 Units); Wisconsin Dells, WI
|
1926-1939
|
IN
|
6
|
|
|||
|
Total Hydro
|
18
|
|
|||||
|
Total capacity
|
2,170
|
|
|||||
|
(a)
|
Base load EGUs (BL) are designed for nearly continuous operation at or near full capacity to provide the system base load. Intermediate EGUs (IN) follow system load changes with frequent starts and curtailments of output during low demand. Peak load EGUs (PK) are generally low efficiency, quick response units that run primarily when there is high demand.
|
|
(b)
|
Based on the accredited generating capacity of the EGUs as of
December 31, 2018
included in MISO’s resource adequacy process for the planning period from
June 2018 through May 2019
.
|
|
(c)
|
Represents IPL’s 48% ownership interest in this 656 MW (generating capacity) EGU, which is operated by IPL.
|
|
(d)
|
Represents IPL’s 25.695% ownership interest in this 629 MW (generating capacity) EGU, which is operated by MidAmerican Energy Company.
|
|
(e)
|
Represents IPL’s 28% ownership interest in this 481 MW (generating capacity) EGU, which is operated by MidAmerican Energy Company.
|
|
(f)
|
Represents IPL’s 4% ownership interest in this 718 MW (generating capacity) EGU, which is operated by MidAmerican Energy Company.
|
|
(g)
|
Represents Units 2 and 3, which WPL owns. WPL also operates, but does not own, South Fond du Lac Combustion Turbines Units 1 and 4.
|
|
(h)
|
Represents WPL’s 52.5% ownership interest in this 1,055 MW (generating capacity) EGU, which is operated by WPL.
|
|
(i)
|
Represents WPL’s 42.64% ownership interest in this 15 MW (generating capacity) EGU, which is operated by Invenergy Services, LLC.
|
At
December 31, 2018
, IPL owned approximately 17,200 miles of overhead electric distribution line and approximately 3,500 miles of underground electric distribution cable, as well as approximately 560 substation distribution transformers, substantially all of which are located in Iowa. At
December 31, 2018
, WPL owned approximately 16,000 miles of overhead electric distribution line and approximately 5,900 miles of underground electric distribution cable, as well as approximately 310 substation distribution transformers, substantially all of which are located in Wisconsin.
Gas
- IPL’s and WPL’s gas properties consist primarily of mains and services, meters, regulating and gate stations and other related transmission and distribution equipment. At
December 31, 2018
, IPL’s gas distribution facilities included approximately 5,100 miles of gas mains located in Iowa and WPL’s included approximately 4,600 miles of gas mains located in Wisconsin.
Other
- IPL’s and WPL’s other property consists primarily of operating and storeroom facilities, vehicles, computer hardware and software, communication equipment and other miscellaneous tools and equipment. IPL’s other property also includes steam service assets. Refer to
Note 10(b)
for information regarding WPL’s lease of the Sheboygan Falls Energy Facility from AEF’s Non-utility Generation business.
AEF
- AEF’s principal properties included in “Property, plant and equipment, net” on Alliant Energy’s balance sheet at
December 31, 2018
were as follows:
|
20
|
||
Non-utility Generation
- Includes the Sheboygan Falls Energy Facility, a
347
MW, simple-cycle, natural gas-fired facility near Sheboygan Falls, Wisconsin that was placed in service in 2005 and is leased to WPL. The Sheboygan Falls Energy Facility was accredited with 291 MW of generating capacity for MISO’s resource adequacy process for the planning period from
June 2018 through May 2019
.
Transportation
- Includes a short-line railway in Iowa with 116 miles of railroad track and 10 active locomotives; and a barge terminal on the Mississippi River.
Corporate Services -
Corporate Services’ property included in “Property, plant and equipment, net” on Alliant Energy’s balance sheet at
December 31, 2018
consisted primarily of a customer billing and information system for IPL and WPL and other computer software, and the corporate headquarters building located in Madison, Wisconsin.
ITEM 3. LEGAL PROCEEDINGS
None. Refer to
Note 17(c)
for discussion of legal and administrative proceedings before various courts and agencies with respect to matters arising in the ordinary course of business.
ITEM 4. MINE SAFETY DISCLOSURES
None.
EXECUTIVE OFFICERS OF THE REGISTRANTS
The executive officers of Alliant Energy, IPL and WPL for which information must be included are the same; however, different positions may be held at the various registrants. None of the executive officers for Alliant Energy, IPL or WPL listed below are related to any member of the Board of Directors or nominee for director or any other executive officer. All of the executive officers have no definite terms of office and serve at the pleasure of the Board of Directors. The executive officers of Alliant Energy, IPL and WPL as of the date of this filing are as follows:
|
Name
|
Age as of Filing Date
|
Registrant
|
Positions
|
|||
|
Patricia L. Kampling
|
59
|
Alliant Energy
|
Ms. Kampling has served as a director since January 2012, as Chairman of the Board and Chief Executive Officer (CEO) since April 2012, and as President from February 2011 to December 2017.
|
|||
|
IPL and WPL
|
Ms. Kampling has served as a director since January 2012, as Chairman of the Board since April 2012, and as CEO from April 2012 to December 2018.
|
|||||
|
John O. Larsen
|
55
|
Alliant Energy
|
Mr. Larsen has served as President and Chief Operating Officer since January 2019 and as a director since February 2019. He previously served as President since January 2018, Senior Vice President (VP) from February 2014 to January 2018, and as Senior VP-Generation from January 2010 to February 2014.
|
|||
|
IPL
|
Mr. Larsen has served as CEO since January 2019 and as a director since February 2019. He previously served as Senior VP since February 2014 and as Senior VP-Generation from January 2010 to February 2014.
|
|||||
|
WPL
|
Mr. Larsen has served as CEO since January 2019 and as a director since February 2019. He previously served as President since December 2010.
|
|||||
|
Robert J. Durian
|
48
|
Alliant Energy, IPL and WPL
|
Mr. Durian has served as Senior VP and Chief Financial Officer (CFO) since February 2019. He previously served as Senior VP, CFO and Treasurer since January 2018; as VP, CFO and Treasurer from December 2016 to January 2018; as VP, Chief Accounting Officer (CAO) and Treasurer from July 2016 to December 2016; as VP, CAO and Controller from July 2015 to July 2016; and as Controller and CAO from February 2011 to July 2015.
|
|||
|
James H. Gallegos
|
58
|
Alliant Energy, IPL and WPL
|
Mr. Gallegos has served as Senior VP, General Counsel and Corporate Secretary since February 2015. He previously served as Senior VP and General Counsel since February 2014; and as VP and General Counsel from November 2010 to February 2014.
|
|||
|
David A. de Leon
|
56
|
Alliant Energy and IPL
|
Mr. de Leon has served as Senior VP since January 2019. He previously served as VP since April 2017, as Director-Generation Construction from February 2014 to April 2017, and as Director-Construction from January 2011 to February 2014.
|
|||
|
WPL
|
Mr. de Leon has served as President since January 2019. He previously served as VP since April 2017, as Director-Generation Construction from February 2014 to April 2017, and as Director-Construction from January 2011 to February 2014.
|
|||||
|
Terry L. Kouba
|
60
|
Alliant Energy and WPL
|
Mr. Kouba has served as Senior VP since January 2019. He previously served as VP since February 2014, and as Director-Generation Operations from January 2011 to February 2014.
|
|||
|
IPL
|
Mr. Kouba has served as President since January 2019. He previously served as VP since February 2014, and as Director-Generation Operations from January 2011 to February 2014.
|
|||||
|
Benjamin M. Bilitz
|
44
|
Alliant Energy, IPL and WPL
|
Mr. Bilitz has served as CAO and Controller since December 2016. He previously served as Controller since July 2016 and as Assistant Controller from March 2011 to July 2016.
|
|||
|
21
|
||
PART II
ITEM 5. MARKET FOR REGISTRANTS’ COMMON EQUITY, RELATED STOCKHOLDER MATTERS AND ISSUER PURCHASES OF EQUITY SECURITIES
Common Stock Data
- Alliant Energy’s common stock trades on the Nasdaq Global Select Market under the symbol “LNT,” and the closing sales price at
December 31, 2018
was
$42.25
.
Shareowners
- At
December 31, 2018
, there were 25,029 holders of record of Alliant Energy’s common stock, including holders through Alliant Energy’s Shareowner Direct Plan. Alliant Energy is the sole common shareowner of all 13,370,788 and 13,236,601 shares of IPL and WPL common stock, respectively, currently outstanding. As a result, there is no established public trading market for the common stock of either IPL or WPL.
Dividends
- In November
2018
, Alliant Energy announced an increase in its targeted
2019
annual common stock dividend to $1.42 per share, which is equivalent to a quarterly rate of $0.355 per share, beginning with the February
2019
dividend payment. The timing and amount of future dividends is subject to an approved dividend declaration from Alliant Energy’s Board of Directors, and is dependent upon earnings expectations, capital requirements, and general financial business conditions, among other factors.
Common Stock Repurchases
- A summary of Alliant Energy common stock repurchases for the quarter ended
December 31, 2018
was as follows:
|
Total Number
|
Average Price
|
Total Number of Shares
|
Maximum Number (or Approximate
|
||||||||
|
of Shares
|
Paid Per
|
Purchased as Part of
|
Dollar Value) of Shares That May
|
||||||||
|
Period
|
Purchased (a)
|
Share
|
Publicly Announced Plan
|
Yet Be Purchased Under the Plan (a)
|
|||||||
|
October 1 to October 31
|
3,591
|
|
|
$42.68
|
|
—
|
N/A
|
||||
|
November 1 to November 30
|
3,090
|
|
45.05
|
|
—
|
N/A
|
|||||
|
December 1 to December 31
|
175
|
|
43.62
|
|
—
|
N/A
|
|||||
|
6,856
|
|
43.77
|
|
—
|
|||||||
|
(a)
|
All shares were purchased on the open market and held in a rabbi trust under the DCP. There is no limit on the number of shares of Alliant Energy common stock that may be held under the DCP, which currently does not have an expiration date.
|
|
22
|
||
ITEM 6. SELECTED FINANCIAL DATA
Financial Information
|
Alliant Energy
|
2018 (a)
|
2017 (a)
|
2016 (a)
|
2015
|
2014
|
||||||||||||||
|
(dollars in millions, except per share data)
|
|||||||||||||||||||
|
Income Statement Data:
|
|||||||||||||||||||
|
Revenues
|
|
$3,534.5
|
|
|
$3,382.2
|
|
|
$3,320.0
|
|
|
$3,253.6
|
|
|
$3,350.3
|
|
||||
|
Amounts attributable to Alliant Energy common shareowners:
|
|||||||||||||||||||
|
Income from continuing operations, net of tax
|
512.1
|
|
455.9
|
|
373.8
|
|
380.7
|
|
385.5
|
|
|||||||||
|
Income (loss) from discontinued operations, net of tax
|
—
|
|
1.4
|
|
(2.3
|
)
|
(2.5
|
)
|
(2.4
|
)
|
|||||||||
|
Net income
|
512.1
|
|
457.3
|
|
371.5
|
|
378.2
|
|
383.1
|
|
|||||||||
|
Common Stock Data:
|
|||||||||||||||||||
|
Earnings per weighted average common share attributable to Alliant Energy common shareowners (basic and diluted):
|
|||||||||||||||||||
|
Income from continuing operations, net of tax
|
|
$2.19
|
|
|
$1.99
|
|
|
$1.65
|
|
|
$1.69
|
|
|
$1.74
|
|
||||
|
Loss from discontinued operations, net of tax
|
|
$—
|
|
|
$—
|
|
|
($0.01
|
)
|
|
($0.01
|
)
|
|
($0.01
|
)
|
||||
|
Net income
|
|
$2.19
|
|
|
$1.99
|
|
|
$1.64
|
|
|
$1.68
|
|
|
$1.73
|
|
||||
|
Common shares outstanding at year-end (000s)
|
236,063
|
|
231,349
|
|
227,674
|
|
226,918
|
|
221,871
|
|
|||||||||
|
Dividends declared per common share
|
|
$1.34
|
|
|
$1.26
|
|
|
$1.175
|
|
|
$1.10
|
|
|
$1.02
|
|
||||
|
Market value per share at year-end
|
|
$42.25
|
|
|
$42.61
|
|
|
$37.89
|
|
|
$31.225
|
|
|
$33.21
|
|
||||
|
Book value per share at year-end
|
|
$19.43
|
|
|
$18.08
|
|
|
$16.96
|
|
|
$16.41
|
|
|
$15.50
|
|
||||
|
Market capitalization at year-end
|
|
$9,973.7
|
|
|
$9,857.8
|
|
|
$8,626.6
|
|
|
$7,085.5
|
|
|
$7,368.3
|
|
||||
|
Other Selected Financial Data:
|
|||||||||||||||||||
|
Cash flows from operating activities (b)
|
|
$527.7
|
|
|
$521.6
|
|
|
$392.8
|
|
|
$871.2
|
|
|
$891.6
|
|
||||
|
Construction and acquisition expenditures
|
|
$1,633.9
|
|
|
$1,466.9
|
|
|
$1,196.8
|
|
|
$1,034.3
|
|
|
$902.8
|
|
||||
|
Total assets at year-end
|
|
$15,426.0
|
|
|
$14,187.8
|
|
|
$13,373.8
|
|
|
$12,495.2
|
|
|
$12,063.5
|
|
||||
|
Long-term obligations, net
|
|
$5,506.1
|
|
|
$4,870.6
|
|
|
$4,325.1
|
|
|
$3,837.0
|
|
|
$3,768.7
|
|
||||
|
IPL
|
|||||||||||||||||||
|
Revenues
|
|
$2,042.3
|
|
|
$1,870.3
|
|
|
$1,820.4
|
|
|
$1,774.5
|
|
|
$1,848.1
|
|
||||
|
Earnings available for common stock
|
264.0
|
|
216.8
|
|
215.6
|
|
186.0
|
|
181.6
|
|
|||||||||
|
Cash dividends declared on common stock
|
168.0
|
|
156.1
|
|
151.9
|
|
140.0
|
|
140.0
|
|
|||||||||
|
Cash flows from (used for) operating activities (b)
|
(5.0
|
)
|
(21.8
|
)
|
(104.9
|
)
|
385.0
|
|
406.1
|
|
|||||||||
|
Total assets
|
8,411.4
|
|
7,606.0
|
|
7,304.7
|
|
6,709.1
|
|
6,450.2
|
|
|||||||||
|
Long-term obligations, net
|
2,552.8
|
|
2,406.6
|
|
2,154.0
|
|
1,857.4
|
|
1,758.6
|
|
|||||||||
|
WPL
|
|||||||||||||||||||
|
Revenues
|
|
$1,452.6
|
|
|
$1,472.8
|
|
|
$1,459.1
|
|
|
$1,435.1
|
|
|
$1,449.1
|
|
||||
|
Earnings available for common stock
|
208.1
|
|
186.6
|
|
190.4
|
|
176.3
|
|
180.4
|
|
|||||||||
|
Cash dividends declared on common stock
|
140.1
|
|
125.9
|
|
135.0
|
|
126.9
|
|
118.7
|
|
|||||||||
|
Cash flows from operating activities
|
457.0
|
|
465.7
|
|
521.4
|
|
449.8
|
|
424.4
|
|
|||||||||
|
Total assets
|
6,152.5
|
|
5,756.5
|
|
5,290.3
|
|
5,270.4
|
|
5,117.6
|
|
|||||||||
|
Long-term obligations, net
|
1,905.4
|
|
1,914.3
|
|
1,623.2
|
|
1,624.2
|
|
1,658.3
|
|
|||||||||
|
(a)
|
Refer to “
Results of Operations
” in MDA for discussion of the
2018
,
2017
and
2016
results of operations.
|
|
(b)
|
Alliant Energy’s and IPL’s cash flows from operating activities were restated for 2017 and 2016 as a result of the adoption of a new cash flows presentation accounting standard as discussed in
Note 1(n)
. Alliant Energy’s and IPL’s cash flows from operating activities for 2015 and 2014 were not retrospectively amended for this new presentation standard as the information was not available due to the implementation of a new customer billing and information system in 2016.
|
Alliant Energy is the sole common shareowner of all 13,370,788 and 13,236,601 shares of IPL’s and WPL’s common stock outstanding, respectively. As such, earnings per share data is not disclosed herein for IPL and WPL.
|
23
|
||
ITEM 7. MANAGEMENT’S DISCUSSION AND ANALYSIS OF FINANCIAL CONDITION AND RESULTS OF OPERATIONS
This MDA includes information relating to Alliant Energy, IPL and WPL, as well as AEF and Corporate Services. Where appropriate, information relating to a specific entity has been segregated and labeled as such. The following discussion and analysis should be read in conjunction with the Financial Statements and Notes included in this report. Unless otherwise noted, all “per share” references in MDA refer to earnings per diluted share.
OVERVIEW
Description of Business
General -
Alliant Energy is a Midwest U.S. energy holding company whose primary subsidiaries are IPL, WPL, AEF and Corporate Services. IPL and WPL are public utilities, and AEF is the parent company for Alliant Energy’s non-utility businesses and holds all of Alliant Energy’s interest in ATC Holdings. Corporate Services provides administrative services to Alliant Energy and its subsidiaries.
Utilities and Corporate Services
- IPL and WPL own a portfolio of EGUs located in Iowa, Wisconsin and Minnesota with a diversified fuel mix including natural gas, renewable resources and coal. The output from these EGUs, supplemented with purchased power, is used to provide electric service to approximately
965,000
electric customers in the upper Midwest. The utility business also procures natural gas from various suppliers to provide service to approximately
415,000
retail gas customers in the upper Midwest. Alliant Energy’s utility business is its primary source of earnings and cash flows. The earnings and cash flows from the utilities and Corporate Services business are sensitive to various external factors including, but not limited to, the amount and timing of rates approved by regulatory authorities, the impact of weather and economic conditions on electric and gas sales volumes, and other factors listed in “
Risk Factors
” in Item 1A and “
Forward-looking Statements
.”
ATC Holdings -
ATI, a wholly-owned subsidiary of AEF, holds all of Alliant Energy’s interest in ATC Holdings.
Non-utility Business and Parent -
AEF also manages various businesses including Transportation (short-line railway and barge transportation services), a non-utility wind farm, the Sheboygan Falls Energy Facility and several other modest holdings.
Strategic Overview
Alliant Energy’s mission is to deliver energy solutions and exceptional service that its customers and communities count on - safely, efficiently and responsibly. Our mission is supported by a strategy focused on meeting the evolving expectations of customers while providing an attractive return for investors. This strategy includes the following key elements:
Providing affordable energy solutions to customers -
Alliant Energy’s strategy focuses on affordable energy solutions that support retention and growth of its existing customers and attract new customers to its service territories.
Key Highlights in
2018
(refer to “
Rate Matters
” for details) -
|
•
|
Federal Tax Reform savings provided to retail electric and gas customers.
|
|
•
|
Amendment to shorten the term of the DAEC nuclear PPA and the execution of four new wind PPAs approved by the IUB in December 2018.
|
|
•
|
Rate settlement approved by the PSCW in December 2018 authorizing electric and gas base rates for WPL retail customers to remain flat until 2020.
|
Making customer-focused investments -
Alliant Energy’s strategy drives a capital allocation process focused on: 1) transitioning its generation portfolio to meet the growing interest of customers for cleaner sources of energy, 2) upgrading its electric and gas distribution systems to strengthen safety and resiliency, as well as enable distributed energy solutions in its service territories, and 3) enhancing its customers’ experience with evolving technology and greater flexibility.
Key Highlights in
2018
(refer to “
Customer Investments
” for details) -
|
•
|
Expansion of renewable generation with the required regulatory approvals and progress with construction of IPL’s new wind projects located in Iowa, as well as WPL’s acquisition of FWEC in April 2018.
|
|
•
|
Expansion of natural gas-fired generation with the construction of WPL’s West Riverside facility.
|
|
•
|
Completion of the remaining major environmental controls at IPL’s and WPL’s newer, larger and more efficient coal-fired generating units with the installation of an SCR at WPL’s Columbia Unit 2.
|
|
•
|
Progress with implementing advanced metering infrastructure for IPL customers.
|
|
24
|
||
Growing customer demand -
Alliant Energy’s strategy supports expanding electric and gas usage in its service territories by promoting electrification initiatives and economic development in the communities it serves.
Key Highlights in
2018
-
|
•
|
Progress with certifying development-ready sites throughout Iowa and Wisconsin, including finalizing certification of the Big Cedar Industrial Center Mega-site, a 1,300-acre rail-served ready-to-build manufacturing and industrial site in Cedar Rapids, Iowa, which is in close proximity to the regional airport and interstate freeways and accesses IPL’s electric services.
|
RESULTS OF OPERATIONS
Results of operations include financial information prepared in accordance with GAAP as well as utility electric margins and utility gas margins, which are not measures of financial performance under GAAP. Utility electric margins are defined as electric revenues less electric production fuel, purchased power and electric transmission service expenses. Utility gas margins are defined as gas revenues less cost of gas sold. Utility electric margins and utility gas margins are non-GAAP financial measures because they exclude other utility and non-utility revenues, other operation and maintenance expenses, depreciation and amortization expenses, and taxes other than income tax expense.
Management believes that utility electric and gas margins provide a meaningful basis for evaluating and managing utility operations since electric production fuel, purchased power and electric transmission service expenses and cost of gas sold are generally passed through to customers, and therefore, result in changes to electric and gas revenues that are comparable to changes in such expenses. The presentation of utility electric and gas margins herein is intended to provide supplemental information for investors regarding operating performance. These utility electric and gas margins may not be comparable to how other entities define utility electric and gas margin. Furthermore, these measures are not intended to replace operating income as determined in accordance with GAAP as an indicator of operating performance.
Additionally, the table below includes EPS from continuing operations for Utilities and Corporate Services, ATC Holdings, and Non-utility and Parent, which are non-GAAP financial measures. Alliant Energy believes these non-GAAP financial measures are useful to investors because they facilitate an understanding of segment performance and trends, and provide additional information about Alliant Energy’s operations on a basis consistent with the measures that management uses to manage its operations and evaluate its performance.
Financial Results Overview
-
Alliant Energy’s net income and EPS attributable to Alliant Energy common shareowners were as follows (dollars in millions, except per share amounts):
|
2018
|
2017
|
||||||||||||||
|
Income
|
EPS
|
Income
|
EPS
|
||||||||||||
|
Continuing operations:
|
|||||||||||||||
|
Utilities and Corporate Services
|
|
$485.7
|
|
|
$2.08
|
|
|
$416.7
|
|
|
$1.82
|
|
|||
|
ATC Holdings
|
28.4
|
|
0.12
|
|
25.4
|
|
0.11
|
|
|||||||
|
Non-utility and Parent
|
(2.0
|
)
|
(0.01
|
)
|
13.8
|
|
0.06
|
|
|||||||
|
Income from continuing operations
|
512.1
|
|
2.19
|
|
455.9
|
|
1.99
|
|
|||||||
|
Income from discontinued operations
|
—
|
|
—
|
|
1.4
|
|
—
|
|
|||||||
|
Net income
|
|
$512.1
|
|
|
$2.19
|
|
|
$457.3
|
|
|
$1.99
|
|
|||
Alliant Energy’s Utilities and Corporate Services income from continuing operations increased $69 million in
2018
compared to
2017
. The increase was primarily due to higher margins resulting from IPL’s and WPL’s increasing rate base, higher retail electric and gas sales due to temperatures in 2018 compared to 2017, and higher AFUDC. These items were partially offset by higher depreciation expense.
|
25
|
||
Operating income and a reconciliation of utility electric and gas margins to the most directly comparable GAAP measure, operating income, was as follows (in millions):
|
Alliant Energy
|
IPL
|
WPL
|
|||||||||||||||||||||||||||||||||
|
2018
|
2017
|
2016
|
2018
|
2017
|
2016
|
2018
|
2017
|
2016
|
|||||||||||||||||||||||||||
|
Operating income
|
|
$694.4
|
|
|
$671.2
|
|
|
$554.1
|
|
|
$350.8
|
|
|
$304.1
|
|
|
$277.6
|
|
|
$312.9
|
|
|
$333.7
|
|
|
$337.2
|
|
||||||||
|
Electric utility revenues
|
|
$3,000.3
|
|
|
$2,894.7
|
|
|
$2,875.5
|
|
|
$1,731.1
|
|
|
$1,598.9
|
|
|
$1,569.7
|
|
|
$1,269.2
|
|
|
$1,295.8
|
|
|
$1,305.8
|
|
||||||||
|
Electric production fuel and purchased power expenses
|
(855.0
|
)
|
(818.1
|
)
|
(854.0
|
)
|
(469.0
|
)
|
(443.6
|
)
|
(430.5
|
)
|
(386.0
|
)
|
(374.5
|
)
|
(423.5
|
)
|
|||||||||||||||||
|
Electric transmission service expense
|
(495.7
|
)
|
(480.9
|
)
|
(527.9
|
)
|
(352.9
|
)
|
(310.4
|
)
|
(359.7
|
)
|
(142.8
|
)
|
(170.5
|
)
|
(168.2
|
)
|
|||||||||||||||||
|
Utility Electric Margin (non-GAAP)
|
1,649.6
|
|
1,595.7
|
|
1,493.6
|
|
909.2
|
|
844.9
|
|
779.5
|
|
740.4
|
|
750.8
|
|
714.1
|
|
|||||||||||||||||
|
Gas utility revenues
|
446.6
|
|
400.9
|
|
355.4
|
|
266.2
|
|
226.0
|
|
204.0
|
|
180.4
|
|
174.9
|
|
151.4
|
|
|||||||||||||||||
|
Cost of gas sold
|
(232.3
|
)
|
(211.4
|
)
|
(194.3
|
)
|
(129.6
|
)
|
(115.6
|
)
|
(111.0
|
)
|
(102.7
|
)
|
(95.8
|
)
|
(83.3
|
)
|
|||||||||||||||||
|
Utility Gas Margin (non-GAAP)
|
214.3
|
|
189.5
|
|
161.1
|
|
136.6
|
|
110.4
|
|
93.0
|
|
77.7
|
|
79.1
|
|
68.1
|
|
|||||||||||||||||
|
Other utility revenues
|
48.0
|
|
47.5
|
|
48.6
|
|
45.0
|
|
45.4
|
|
46.7
|
|
3.0
|
|
2.1
|
|
1.9
|
|
|||||||||||||||||
|
Non-utility revenues
|
39.6
|
|
39.1
|
|
40.5
|
|
—
|
|
—
|
|
—
|
|
—
|
|
—
|
|
—
|
|
|||||||||||||||||
|
Asset valuation charges for Franklin County wind farm
|
—
|
|
—
|
|
(86.4
|
)
|
—
|
|
—
|
|
—
|
|
—
|
|
—
|
|
—
|
|
|||||||||||||||||
|
Other operation and maintenance expenses
|
(645.8
|
)
|
(633.2
|
)
|
(589.4
|
)
|
(402.6
|
)
|
(396.6
|
)
|
(376.9
|
)
|
(241.6
|
)
|
(238.5
|
)
|
(209.6
|
)
|
|||||||||||||||||
|
Depreciation and amortization expenses
|
(506.9
|
)
|
(461.8
|
)
|
(411.6
|
)
|
(283.5
|
)
|
(245.0
|
)
|
(210.8
|
)
|
(219.4
|
)
|
(212.9
|
)
|
(192.5
|
)
|
|||||||||||||||||
|
Taxes other than income tax expense
|
(104.4
|
)
|
(105.6
|
)
|
(102.3
|
)
|
(53.9
|
)
|
(55.0
|
)
|
(53.9
|
)
|
(47.2
|
)
|
(46.9
|
)
|
(44.8
|
)
|
|||||||||||||||||
|
Operating income
|
|
$694.4
|
|
|
$671.2
|
|
|
$554.1
|
|
|
$350.8
|
|
|
$304.1
|
|
|
$277.6
|
|
|
$312.9
|
|
|
$333.7
|
|
|
$337.2
|
|
||||||||
Operating Income Variances
-
Variances between periods in operating income were as follows (in millions):
|
2018 vs. 2017:
|
Alliant Energy
|
IPL
|
WPL
|
||||||||
|
Total higher utility electric margin variance (Refer to details below)
|
|
$54
|
|
|
$64
|
|
|
($10
|
)
|
||
|
Total higher utility gas margin variance (Refer to details below)
|
25
|
|
26
|
|
(1
|
)
|
|||||
|
Total higher other operation and maintenance expenses variance (Refer to details below)
|
(13
|
)
|
(6
|
)
|
(3
|
)
|
|||||
|
Higher depreciation and amortization expense, primarily due to new IPL depreciation rates effective May 2018 and additional plant in service in 2017 and 2018. Depreciation commenced on IPL’s Marshalltown Generating Station in April 2017.
|
(50
|
)
|
(44
|
)
|
(7
|
)
|
|||||
|
Lower depreciation expense at IPL due to write-down of regulatory assets in 2017 resulting from the IPL electric rate review settlement (Refer to
Note 2
for details)
|
5
|
|
5
|
|
—
|
|
|||||
|
Other
|
2
|
|
2
|
|
—
|
|
|||||
|
|
$23
|
|
|
$47
|
|
|
($21
|
)
|
|||
|
2017 vs. 2016:
|
Alliant Energy
|
IPL
|
WPL
|
||||||||
|
Asset valuation charges for Franklin County wind farm in 2016 (Refer to
Note 3
for details)
|
|
$86
|
|
|
$—
|
|
|
$—
|
|
||
|
Total higher utility electric margin variance (Refer to details below)
|
102
|
|
65
|
|
37
|
|
|||||
|
Total higher utility gas margin variance (Refer to details below)
|
28
|
|
17
|
|
11
|
|
|||||
|
Higher other operation and maintenance expenses variance (Refer to details below)
|
(44
|
)
|
(20
|
)
|
(29
|
)
|
|||||
|
Higher depreciation and amortization expense primarily due to additional plant in service in 2017, including impacts from Marshalltown
|
(33
|
)
|
(29
|
)
|
(8
|
)
|
|||||
|
Higher depreciation expense at WPL due to updated depreciation rates effective January 2017 approved by the PSCW and FERC
|
(12
|
)
|
—
|
|
(12
|
)
|
|||||
|
Higher depreciation expense at IPL due to write-down of regulatory assets in 2017 resulting from the IPL electric rate review settlement (Refer to
Note 2
for details)
|
(5
|
)
|
(5
|
)
|
—
|
|
|||||
|
Other
|
(5
|
)
|
(1
|
)
|
(3
|
)
|
|||||
|
|
$117
|
|
|
$27
|
|
|
($4
|
)
|
|||
|
26
|
||
Electric Revenues and Sales Summary
-
Electric revenues (in millions), and MWh sales (in thousands), were as follows:
|
Revenues
|
MWhs Sold
|
|||||||||||||||||||
|
2018
|
2017
|
2016
|
2018
|
2017
|
2016
|
|||||||||||||||
|
Alliant Energy
|
||||||||||||||||||||
|
Retail
|
|
$2,687.8
|
|
|
$2,569.6
|
|
|
$2,564.8
|
|
25,684
|
|
25,095
|
|
25,339
|
|
|||||
|
Sales for resale
|
259.2
|
|
268.8
|
|
266.7
|
|
5,804
|
|
5,003
|
|
4,399
|
|
||||||||
|
Other
|
53.3
|
|
56.3
|
|
44.0
|
|
96
|
|
94
|
|
100
|
|
||||||||
|
|
$3,000.3
|
|
|
$2,894.7
|
|
|
$2,875.5
|
|
31,584
|
|
30,192
|
|
29,838
|
|
||||||
|
IPL
|
||||||||||||||||||||
|
Retail
|
|
$1,578.2
|
|
|
$1,448.0
|
|
|
$1,442.5
|
|
14,670
|
|
14,356
|
|
14,523
|
|
|||||
|
Sales for resale
|
117.3
|
|
114.6
|
|
97.8
|
|
2,980
|
|
2,169
|
|
1,406
|
|
||||||||
|
Other
|
35.6
|
|
36.3
|
|
29.4
|
|
37
|
|
38
|
|
41
|
|
||||||||
|
|
$1,731.1
|
|
|
$1,598.9
|
|
|
$1,569.7
|
|
17,687
|
|
16,563
|
|
15,970
|
|
||||||
|
WPL
|
||||||||||||||||||||
|
Retail
|
|
$1,109.6
|
|
|
$1,121.6
|
|
|
$1,122.3
|
|
11,014
|
|
10,739
|
|
10,816
|
|
|||||
|
Sales for resale
|
141.9
|
|
154.2
|
|
168.9
|
|
2,824
|
|
2,834
|
|
2,993
|
|
||||||||
|
Other
|
17.7
|
|
20.0
|
|
14.6
|
|
59
|
|
56
|
|
59
|
|
||||||||
|
|
$1,269.2
|
|
|
$1,295.8
|
|
|
$1,305.8
|
|
13,897
|
|
13,629
|
|
13,868
|
|
||||||
Gas Revenues and Sales Summary
-
Gas revenues (in millions), and Dth sales (in thousands), were as follows:
|
Revenues
|
Dths Sold
|
|||||||||||||||||||
|
2018
|
2017
|
2016
|
2018
|
2017
|
2016
|
|||||||||||||||
|
Alliant Energy
|
||||||||||||||||||||
|
Retail
|
|
$402.3
|
|
|
$364.6
|
|
|
$322.4
|
|
53,389
|
|
49,250
|
|
47,743
|
|
|||||
|
Transportation/Other
|
44.3
|
|
36.3
|
|
33.0
|
|
90,357
|
|
76,916
|
|
77,485
|
|
||||||||
|
|
$446.6
|
|
|
$400.9
|
|
|
$355.4
|
|
143,746
|
|
126,166
|
|
125,228
|
|
||||||
|
IPL
|
||||||||||||||||||||
|
Retail
|
|
$238.4
|
|
|
$202.2
|
|
|
$183.1
|
|
28,651
|
|
26,580
|
|
26,230
|
|
|||||
|
Transportation/Other
|
27.8
|
|
23.8
|
|
20.9
|
|
37,899
|
|
39,365
|
|
37,158
|
|
||||||||
|
|
$266.2
|
|
|
$226.0
|
|
|
$204.0
|
|
66,550
|
|
65,945
|
|
63,388
|
|
||||||
|
WPL
|
||||||||||||||||||||
|
Retail
|
|
$163.9
|
|
|
$162.4
|
|
|
$139.3
|
|
24,738
|
|
22,670
|
|
21,513
|
|
|||||
|
Transportation/Other
|
16.5
|
|
12.5
|
|
12.1
|
|
52,458
|
|
37,551
|
|
40,327
|
|
||||||||
|
|
$180.4
|
|
|
$174.9
|
|
|
$151.4
|
|
77,196
|
|
60,221
|
|
61,840
|
|
||||||
Temperatures
-
Estimated increases (decreases) to electric and gas margins from the impacts of temperatures were as follows (in millions):
|
Electric Margins
|
Gas Margins
|
||||||||||||||||||||||
|
2018
|
2017
|
2016
|
2018
|
2017
|
2016
|
||||||||||||||||||
|
IPL
|
|
$20
|
|
|
($8
|
)
|
|
$3
|
|
|
$1
|
|
|
($4
|
)
|
|
($4
|
)
|
|||||
|
WPL
|
12
|
|
(8
|
)
|
1
|
|
2
|
|
(2
|
)
|
(3
|
)
|
|||||||||||
|
Total Alliant Energy
|
|
$32
|
|
|
($16
|
)
|
|
$4
|
|
|
$3
|
|
|
($6
|
)
|
|
($7
|
)
|
|||||
|
27
|
||
Utility Electric Margin Variances
-
The following items contributed to increased (decreased) utility electric margins (in millions):
|
2018 vs. 2017:
|
Alliant Energy
|
IPL
|
WPL
|
||||||||
|
Higher revenues at IPL due to changes in electric tax benefit rider credits on customers’ bills (offset by changes in income tax expense)
|
|
$48
|
|
|
$48
|
|
|
$—
|
|
||
|
Estimated changes in sales volumes caused by temperatures (Refer to “Temperatures” above for details)
|
48
|
|
28
|
|
20
|
|
|||||
|
Impact of IPL’s retail electric base rate increases (Refer to
Note 2
for details)
|
45
|
|
45
|
|
—
|
|
|||||
|
Lower transmission cost recovery amortization at WPL (a)
|
26
|
|
—
|
|
26
|
|
|||||
|
Changes in electric fuel-related costs, net of recoveries at WPL (b)
|
12
|
|
—
|
|
12
|
|
|||||
|
Decrease in revenues due to Federal Tax Reform benefits returning to customers (offset by lower tax expense) (Refer to
Note 2
for details)
|
(80
|
)
|
(39
|
)
|
(41
|
)
|
|||||
|
Lower wholesale margins primarily due to the expiration of wholesale power supply agreements in 2017 and 2018
|
(20
|
)
|
(8
|
)
|
(12
|
)
|
|||||
|
Lower revenues at WPL due to its earnings sharing mechanism (Refer to
Note 2
for details)
|
(20
|
)
|
—
|
|
(20
|
)
|
|||||
|
Lower revenues at IPL related to changes in recovery amounts for energy efficiency costs through the energy efficiency rider (c)
|
(8
|
)
|
(8
|
)
|
—
|
|
|||||
|
Other
|
3
|
|
(2
|
)
|
5
|
|
|||||
|
|
$54
|
|
|
$64
|
|
|
($10
|
)
|
|||
|
2017 vs. 2016:
|
Alliant Energy
|
IPL
|
WPL
|
||||||||
|
Impact of IPL’s interim retail electric base rate increase (Refer to
Note 2
for details)
|
|
$77
|
|
|
$77
|
|
|
$—
|
|
||
|
Higher margins at WPL from the impact of its 2017/2018 Test Period retail electric base rate increase (Refer to
Note 2
for details)
|
63
|
|
—
|
|
63
|
|
|||||
|
Higher revenues at IPL due to 2016 retail electric customer billing credits related to the approved retail electric base rate freeze through 2016
|
9
|
|
9
|
|
—
|
|
|||||
|
Estimated changes in sales volumes caused by temperatures (Refer to “Temperatures” above for details)
|
(20
|
)
|
(11
|
)
|
(9
|
)
|
|||||
|
Revenue requirement adjustment in 2016 related to IUB’s authorization to reduce certain tax benefits associated with changes in IPL’s tax accounting methods
|
(14
|
)
|
(14
|
)
|
—
|
|
|||||
|
Changes in electric fuel-related costs, net of recoveries at WPL (b)
|
(12
|
)
|
—
|
|
(12
|
)
|
|||||
|
Lower wholesale margins at WPL primarily due to the expiration of a wholesale power supply agreement on May 31, 2017
|
(8
|
)
|
—
|
|
(8
|
)
|
|||||
|
Other
|
7
|
|
4
|
|
3
|
|
|||||
|
|
$102
|
|
|
$65
|
|
|
$37
|
|
|||
|
(a)
|
The December 2016 PSCW order for WPL’s 2017/2018 Test Period electric and gas base rate review authorized changes in electric transmission cost recovery amortizations for 2018.
|
|
(b)
|
WPL estimates the increase (decrease) to electric margins from amounts within the approved bandwidth of plus or minus 2% of forecasted fuel-related expenses determined by the PSCW each year was approximately $6 million, ($6) million and $6 million in 2018, 2017 and 2016, respectively.
|
|
(c)
|
Changes in electric energy efficiency revenues were mostly offset by changes in energy efficiency expense included in other operation and maintenance expenses.
|
Electric Sales Trends -
Alliant Energy’s retail electric sales volumes increased 2% in 2018 and decreased 1% in 2017 primarily due to the impact of changes in temperatures in its service territories on demand from residential and commercial customers. The 2017 decrease was also caused by an extra day of retail sales during 2016 due to the leap year, partially offset by increases in WPL’s industrial sales from higher customer production and customer expansions.
|
28
|
||
Utility Gas Margin Variances
-
The following items contributed to increased (decreased) utility gas margins (in millions):
|
2018 vs. 2017:
|
Alliant Energy
|
IPL
|
WPL
|
||||||||
|
Higher revenues at IPL related to changes in recovery amounts for energy efficiency costs through the energy efficiency rider (a)
|
|
$12
|
|
|
$12
|
|
|
$—
|
|
||
|
Estimated changes in sales volumes caused by temperatures (Refer to “Temperatures” above for details)
|
9
|
|
5
|
|
4
|
|
|||||
|
Impact of IPL’s interim retail gas base rate increase (Refer to
Note 2
for details)
|
6
|
|
6
|
|
—
|
|
|||||
|
Decrease in revenues due to Federal Tax Reform benefits returning to customers (offset by lower tax expense) (Refer to
Note 2
for details)
|
(6
|
)
|
(1
|
)
|
(5
|
)
|
|||||
|
Higher revenues at IPL due to lower gas tax benefit rider credits on customer’s bills (offset by changes in tax expense)
|
4
|
|
4
|
|
—
|
|
|||||
|
|
$25
|
|
|
$26
|
|
|
($1
|
)
|
|||
|
2017 vs. 2016:
|
Alliant Energy
|
IPL
|
WPL
|
||||||||
|
Impact of WPL’s retail gas base rate increase (Refer to
Note 2
for details)
|
|
$9
|
|
|
$—
|
|
|
$9
|
|
||
|
Higher revenues at IPL related to changes in recovery amounts for energy efficiency costs through the energy efficiency rider (a)
|
8
|
|
8
|
|
—
|
|
|||||
|
Higher revenues at IPL due to lower gas tax benefit rider credits on customer’s bills (offset by changes in tax expense)
|
6
|
|
6
|
|
—
|
|
|||||
|
Estimated changes in sales volumes caused by temperatures (Refer to “Temperatures” above for details)
|
1
|
|
—
|
|
1
|
|
|||||
|
Other
|
4
|
|
3
|
|
1
|
|
|||||
|
|
$28
|
|
|
$17
|
|
|
$11
|
|
|||
|
(a)
|
Changes in gas energy efficiency revenues were mostly offset by changes in energy efficiency expense included in other operation and maintenance expenses.
|
Other Operation and Maintenance Expenses
- The following items contributed to (increased) decreased other operation and maintenance expenses (in millions):
|
2018 vs. 2017:
|
Alliant Energy
|
IPL
|
WPL
|
||||||||
|
Higher performance compensation expense
|
|
($11
|
)
|
|
($7
|
)
|
|
($4
|
)
|
||
|
Higher generation operation and maintenance expenses at WPL primarily attributed to higher facility outages during 2018 compared to 2017
|
(7
|
)
|
—
|
|
(7
|
)
|
|||||
|
Higher energy efficiency expense at IPL (a)
|
(6
|
)
|
(6
|
)
|
—
|
|
|||||
|
Higher bad debt expense
|
(5
|
)
|
(5
|
)
|
—
|
|
|||||
|
Lower energy efficiency cost recovery amortizations at WPL (b)
|
13
|
|
—
|
|
13
|
|
|||||
|
Charges related to cancelled software projects in 2017
|
6
|
|
3
|
|
3
|
|
|||||
|
Write-down of regulatory assets in 2017 due to the IPL electric rate review settlement (Refer to
Note 2
for details)
|
4
|
|
4
|
|
—
|
|
|||||
|
Other
|
(7
|
)
|
5
|
|
(8
|
)
|
|||||
|
|
($13
|
)
|
|
($6
|
)
|
|
($3
|
)
|
|||
|
2017 vs. 2016:
|
Alliant Energy
|
IPL
|
WPL
|
||||||||
|
Higher energy efficiency cost recovery amortizations at WPL (b)
|
|
($27
|
)
|
|
$—
|
|
|
($27
|
)
|
||
|
Charges related to cancelled software projects in 2017
|
(6
|
)
|
(3
|
)
|
(3
|
)
|
|||||
|
Write-down of regulatory assets in 2017 due to the IPL electric rate review settlement (Refer to
Note 2
for details)
|
(4
|
)
|
(4
|
)
|
—
|
|
|||||
|
Higher energy efficiency expense at IPL (a)
|
(3
|
)
|
(3
|
)
|
—
|
|
|||||
|
Other
|
(4
|
)
|
(10
|
)
|
1
|
|
|||||
|
|
($44
|
)
|
|
($20
|
)
|
|
($29
|
)
|
|||
|
(a)
|
Changes in IPL’s energy efficiency expense were offset by changes in electric and gas energy efficiency revenues.
|
|
(b)
|
The December 2016 PSCW order for WPL’s 2017/2018 Test Period electric and gas base rate review authorized changes in energy efficiency cost recovery amortizations for 2017 and 2018.
|
|
29
|
||
Other Income and Deductions Variances
- The following items contributed to (increased) decreased other income and deductions (in millions):
|
2018 vs. 2017:
|
Alliant Energy
|
IPL
|
WPL
|
||||||||
|
Higher interest expense primarily due to higher average outstanding long-term debt balances (Refer to
Note 9(b)
for details)
|
|
($31
|
)
|
|
($7
|
)
|
|
($4
|
)
|
||
|
Higher equity income primarily due to increased earnings from non-utility wind farm (Refer to
Note 6
for details)
|
10
|
|
—
|
|
—
|
|
|||||
|
Higher AFUDC primarily due to increased CWIP balances related to new wind generation and WPL’s West Riverside Energy Center
|
26
|
|
11
|
|
15
|
|
|||||
|
Other
|
9
|
|
4
|
|
6
|
|
|||||
|
|
$14
|
|
|
$8
|
|
|
$17
|
|
|||
|
2017 vs. 2016:
|
Alliant Energy
|
IPL
|
WPL
|
||||||||
|
Higher interest expense primarily due to higher average outstanding long-term debt balances (Refer to
Note 9(b)
for details)
|
|
($19
|
)
|
|
($9
|
)
|
|
($2
|
)
|
||
|
Lower equity income at WPL due to the transfer of its interest in ATC to ATI on December 31, 2016 (Refer to
Note 6
for details)
|
—
|
|
—
|
|
(39
|
)
|
|||||
|
Higher (lower) AFUDC primarily due to increased (decreased) CWIP balances
|
(13
|
)
|
(21
|
)
|
8
|
|
|||||
|
Other
|
4
|
|
—
|
|
(1
|
)
|
|||||
|
|
($28
|
)
|
|
($30
|
)
|
|
($34
|
)
|
|||
Income Taxes
-
Refer to
Note 12
for details of effective income tax rates for continuing operations.
Other Future Considerations
-
In addition to items discussed in MDA, the
Notes
in Item 8 and “
Risk Factors
” in Item 1A, the following key items could impact Alliant Energy’s, IPL’s and WPL’s future financial condition or results of operations:
|
•
|
Financing Plans -
Alliant Energy currently expects to issue up to $400 million of common stock in 2019 through the equity forward agreements that were executed in December 2018 and the Shareowner Direct Plan. IPL and WPL currently expect to issue up to $600 million and $400 million of long-term debt securities in 2019, respectively. WPL has $250 million of long-term debt maturing in July 2019.
|
|
•
|
Common Stock Dividends -
Alliant Energy announced a 6% increase in its targeted 2019 annual common stock dividend to $1.42 per share, which is equivalent to a quarterly rate of $0.355 per share, beginning with the February 2019 dividend payment. The timing and amount of future dividends is subject to an approved dividend declaration from Alliant Energy’s Board of Directors, and is dependent upon earnings expectations, capital requirements, and general financial business conditions, among other factors.
|
|
•
|
Utility Electric and Gas Margins -
Alliant Energy, IPL and WPL currently expect an increase in electric and gas margins in 2019 compared to 2018 from earnings on increasing rate base for WPL’s retail electric and gas rate review (2019/2020 Test Period) and interim rates for IPL’s planned retail rate review. Refer to “
Rate Matters
” for further discussion on these rate reviews.
|
|
•
|
Depreciation and Amortization Expenses -
Alliant Energy, IPL and WPL currently expect an increase in depreciation and amortization expenses in 2019 compared to 2018 due to property additions, including IPL’s expansion of wind generation and WPL’s West Riverside natural gas-fired EGU.
|
|
•
|
Interest Expense -
Alliant Energy currently expects interest expense to increase in 2019 compared to 2018 primarily due to financings completed in 2018 and planned in 2019 as discussed above.
|
CUSTOMER INVESTMENTS
Alliant Energy’s, IPL’s and WPL’s strategic priorities include making significant customer-focused investments toward cleaner energy and sustainable customer solutions. These priorities include:
Natural Gas-Fired Generation
WPL’s Construction of West Riverside Natural Gas-fired Generating Station -
In 2016, WPL received an order from the PSCW authorizing WPL to construct an approximate
730
MW natural gas-fired combined-cycle EGU in Beloit, Wisconsin, referred to as West Riverside. WPL’s construction of West Riverside began in 2016 and the EGU is currently expected to be completed by the end of 2019. WPL’s estimated portion of capital expenditures is currently expected to be approximately $640 million. The capital expenditures include costs to construct the EGU and a pipeline to supply natural gas to the EGU, and exclude transmission network upgrades and AFUDC. Estimated capital expenditures for West Riverside for 2019 and 2020 are included in the “West Riverside” line in the construction and acquisition expenditures table in “
Liquidity and Capital Resources
.” West Riverside will replace energy and capacity being eliminated with the retirements of various EGUs.
|
30
|
||
WPL entered into agreements with neighboring utilities and electric cooperatives that provide each of them options to purchase a partial ownership interest in West Riverside. The purchase price for such options is based on the ownership interest acquired and the net book value of West Riverside on the date of the purchase. The exercise of the WPSC and MGE options is subject to PSCW approval, and the timing and ownership amounts of the options are as follows:
|
Counterparty
|
Option Amount
|
Option Timing
|
||
|
Wisconsin Public Service Corporation (WPSC)
|
Up to 200 MW (no more than 100 MW to be acquired in first two years) (a)
|
2019-2023 (b)
|
||
|
Madison Gas and Electric Company (MGE)
|
Up to 50 MW (no more than 25 MW to be acquired in first two years)
|
2019-2024 (b)
|
||
|
Electric cooperatives
|
Approximately 60 MW
|
Exercised January 2018
|
||
|
(a)
|
If WPSC exercises its options, WPL may exercise reciprocal options, subject to approval by the PSCW, to purchase up to 200 MW of any natural-gas combined-cycle EGU that either WPSC or its affiliated utility, Wisconsin Electric Power Company, places in service within 10 years of the date West Riverside is placed in service.
|
|
(b)
|
Assumes an in-service date by the end of 2019.
|
WPSC and MGE Options
- In conjunction with the agreements WPL entered into with WPSC and MGE associated with West Riverside, WPL also entered into amendments to the Columbia joint operating agreement. In 2016, WPL received an order from the PSCW approving amendments to the Columbia joint operating agreement, which allow WPSC and MGE to forgo certain capital expenditures at Columbia. Based on the additional capital expenditures WPL currently expects to incur through June 1, 2020, WPL’s ownership interest in Columbia is expected to increase from 46.2% (as of December 31, 2016) to 53.4%.
Wind Generation
Alliant Energy’s cleaner energy strategy includes the planned development and acquisition of up to 1,200 MW of wind generation in aggregate (up to 1,000 MW at IPL and up to 200 MW at WPL) during 2018 through 2020. IPL and WPL believe their respective planned development of wind generation will qualify for the full level of production tax credits as a result of progress payments in 2016 for wind turbines, and plan to place these wind projects into service by the end of 2020. Estimated capital expenditures for the planned wind generation projects for 2019 through 2022 are included in the “Renewable projects” line in the construction and acquisition expenditures table in “
Liquidity and Capital Resources
.” Alliant Energy, IPL and WPL continue to evaluate additional opportunities to add more wind generation after 2021. Renewables are currently targeted to be approximately 30% of Alliant Energy’s overall energy mix by 2030.
IPL’s Expansion of Wind Generation -
In April 2018, IPL received approval from the IUB for advance rate-making principles for up to 500 MW of new wind generation, which is in addition to the 500 MW of new wind generation approved by the IUB i
n October 2016. The
advance rate-making principles approved by the IUB in 2016 and 2018 were as follows:
|
•
|
Additional wind generation that qualifies for the full level of production tax credits, as long as the projects are located in Iowa. The 2016 and 2018 IUB decisions have cost caps of $1,830/kilowatt and $1,780/kilowatt, respectively, including AFUDC and transmission costs. Any costs incurred in excess of the respective cost caps are expected to be incorporated into rates if determined to be reasonable and prudent.
|
|
•
|
A depreciable life of the wind generation facilities of 40 years, unless changed as a result of a contested case before the IUB.
|
|
•
|
An 11.0% return on common equity, with the exception of certain transmission facilities classified as intangible assets, which would earn the rate of return on common equity the IUB finds reasonable in each future retail electric rate proceeding.
|
|
•
|
The 2016 IUB decision includes a return on common equity for the calculation of AFUDC during the construction period that is the greater of 10.0% or whatever percentage the IUB finds reasonable during IPL’s most recent retail electric rate proceeding. The 2018 IUB decision includes a 9.6% return on common equity for the calculation of AFUDC during the construction period.
|
|
•
|
The application of double leverage is deferred until a future retail electric rate proceeding.
|
|
•
|
Amortization over a 10-year period of IPL’s prudently incurred and unreimbursed costs, effective with a future retail electric base rate proceeding, if IPL cancels the construction of the wind generation facilities.
|
|
31
|
||
IPL currently has on-going, new wind generation development of up to 1,000 MW utilizing the following sites:
|
Wind Site
|
Nameplate Capacity
|
Expected In-service Date
|
Location
|
|||
|
Upland Prairie
|
Up to 300 MW
|
2019
|
Clay and Dickinson Counties, Iowa
|
|||
|
English Farms
|
Up to 170 MW
|
2019
|
Poweshiek County, Iowa
|
|||
|
Golden Plains
|
Up to 200 MW
|
2020
|
Winnebago and Kossuth Counties, Iowa
|
|||
|
Whispering Willow Expansion
|
Up to 200 MW
|
2020
|
Franklin County, Iowa
|
|||
|
Richland
|
Up to 130 MW
|
2020
|
Sac County, Iowa
|
|||
WPL’s Expansion of Wind Generation -
In January 2019, WPL received final approval from the PSCW to own a 150 MW wind project being developed in Kossuth County, Iowa. WPL has entered into an agreement to purchase the wind farm after development is complete. Construction is currently expected to start in summer 2019 and the wind farm is currently expected to be placed in service in 2020.
Refer to
Note 3
for discussion of WPL’s April 2018 acquisition of 55 MW of the FWEC wind farm.
Coal-Fired Generation
Environmental Controls Projects -
Alliant Energy’s strategy to transition its generation portfolio to cleaner sources of energy includes adding environmental controls at newer, larger and more efficient coal-fired EGUs to continue producing affordable energy for customers and to benefit the environment. SO2 and NOx emissions from Alliant Energy’s generating fleet are targeted to be reduced by approximately 90% and 80%, respectively, from 2005 levels by 2020. In 2018, WPL completed the installation of an SCR at Columbia Unit 2. In addition, IPL expects to complete the installation of an SCR at Ottumwa Unit 1 in 2019 to achieve compliance obligations under the Cross-State Air Pollution Rule and IPL’s Consent Decree. IPL’s portion of capital expenditures (past and future) for the SCR is expected to be $60 million to $70 million.
Plant Retirements and Fuel Switching -
In 2018, IPL retired Red Cedar Combustion Turbine Unit 1 and M.L. Kapp Unit 2, and WPL retired Edgewater Unit 4. The current strategy includes the retirement, or fuel switch from coal to natural gas, of additional older, smaller and less efficient EGUs in the next several years. Coal-fired EGUs are targeted to be eliminated from Alliant Energy’s overall energy mix by 2050. Alliant Energy, IPL and WPL are working with MISO, state regulatory commissions and other regulatory agencies, as required, to determine the timing of these actions, which are subject to change depending on operational, regulatory, market and other factors. Refer to
Note 17(e)
for discussion of IPL’s requirements to fuel switch or retire certain EGUs under a Consent Decree.
Other Customer-focused Investments
Electric and Gas Distribution Systems -
Customer-focused investments include replacing, modernizing and upgrading infrastructure in the electric and gas distribution systems. Electric system investments will focus on areas such as improving resiliency with more underground electric distribution and enabling distributed energy solutions with higher capacity lines. Gas system investments will focus on pipeline replacement to ensure safety and pipeline expansion to support reliability and economic development. Estimated capital expenditures for expected and current electric and gas distribution infrastructure projects for
2019
through
2022
are included in the “Electric and gas distribution systems” lines in the construction and acquisition expenditures table in “
Liquidity and Capital Resources
.”
Gas Pipeline Expansion -
IPL and WPL currently expect to make investments to extend various gas distribution systems to provide natural gas to unserved or underserved areas in their service territories.
Advanced Metering Infrastructure (AMI) -
IPL is currently installing AMI in its electric and gas service territories in Iowa through a phased approach, which is expected to be completed in 2019. AMI is a system of meters, communications networks and data management systems that enables two-way communication between utilities and its customers. AMI allows for remote meter reading, automatic outage notification, and remote disconnects and reconnects. AMI technology is expected to enhance the communication infrastructure in Alliant Energy’s service territories, improve customer service, enhance energy management initiatives and provide operational savings through increased efficiencies.
Non-utility business -
Alliant Energy continues to explore limited scope opportunities for growth outside of, but related to, Alliant Energy’s utility business. This non-utility strategy continues to evolve through exploration of modest opportunities that are accretive to earnings and cash flows within and outside of Alliant Energy’s service territories.
|
32
|
||
RATE MATTERS
Rate Reviews
Retail Base Rate Filings -
Base rate changes reflect both returns on additions to infrastructure and recovery of changes in costs incurred or expected to be incurred. Given that a portion of the rate changes will offset changes in costs, revenues from rate changes should not be expected to result in an equal change in net income for either IPL or WPL.
WPL’s Retail Electric and Gas Rate Review (2019/2020 Test Period)
- In December 2018, WPL received an order from the PSCW approving WPL’s proposed settlement for its retail electric and gas rate review covering the 2019/2020 Test Period, effective January 1, 2019. Under the settlement, WPL’s retail electric and gas base rates will not change from current levels through the end of 2020. Retail electric revenue requirements resulting from increasing investments in rate base (including West Riverside) are offset by lower fuel-related costs and Federal Tax Reform refunds. Retail gas revenue requirements resulting from increasing investments in rate base are offset by Federal Tax Reform refunds. WPL’s settlement maintains the currently authorized return on common equity of 10.0% and extends, with certain modifications, an earnings sharing mechanism through 2020. Under the earnings sharing mechanism, WPL will defer a portion of its earnings if its annual regulatory return on common equity exceeds 10.25% during the 2019/2020 Test Period. WPL must defer 50% of its excess earnings between 10.25% and 10.75%, and 100% of any excess earnings above 10.75%. The fuel-related cost component of WPL’s retail electric rates for 2020 will be addressed in a separate filing, which is currently expected to occur in 2019.
IPL’s Retail Gas Rate Review (2017 Test Year)
- In May 2018, IPL filed a request with the IUB to increase annual gas base rates for its Iowa retail gas customers by $20 million, or approximately 8%. The request was based on a 2017 historical Test Year as adjusted for certain known and measurable changes occurring up to 12 months after the commencement of the proceeding. The key drivers for the filing included recovery of capital projects, partially offset by the benefits of Federal Tax Reform. An interim retail gas rate increase of $11 million, or approximately 5%, on an annual basis, was implemented effective May 14, 2018. In December 2018, the IUB issued an order approving a unanimous settlement agreement between IPL and various parties, resulting in an annual retail gas base rate increase of $14 million, or approximately 6%, which replaced the interim rate increase effective January 17, 2019.
Planned Rate Review
- IPL currently expects to make retail rate filings in the first quarter of 2019 based on a forward-looking test period for electric and gas rates. IPL expects to concurrently file for interim electric rates based on historical data for 2018 and certain known and measurable changes occurring in the first quarter of 2019. Those interim electric rates are expected to be effective by April 2019. The key drivers for the anticipated filings include recovery of capital projects, including new wind generation, and ongoing operational costs.
Rate Review Details
- Details related to IPL’s and WPL’s key jurisdictions were as follows:
|
Average
|
Authorized Return
|
Common Equity
|
|||||||||
|
Regulatory
|
Rate Base
|
on Common
|
Component of Regulatory
|
Effective
|
|||||||
|
Body
|
(in millions)
|
Equity (a)
|
Capital Structure
|
Date
|
|||||||
|
IPL Retail Electric (2016 Test Year)
|
|||||||||||
|
Marshalltown
|
IUB
|
|
$597
|
|
(b)
|
11.00%
|
49.0%
|
5/1/2018
|
|||
|
Emery
|
IUB
|
197
|
|
(b)
|
12.23%
|
49.0%
|
5/1/2018
|
||||
|
Whispering Willow - East
|
IUB
|
213
|
|
(b)
|
11.70%
|
49.0%
|
5/1/2018
|
||||
|
Other
|
IUB
|
3,020
|
|
(b)
|
9.60%
|
49.0%
|
5/1/2018
|
||||
|
IPL Retail Gas (2017 Test Year)
|
IUB
|
491
|
|
(b)
|
9.60%
|
51.0%
|
1/17/2019
|
||||
|
IPL Wholesale Electric
|
FERC
|
113
|
|
10.97%
|
49.7%
|
1/1/2018
|
|||||
|
WPL Retail Electric and Gas
|
|||||||||||
|
Electric (2019 Test Period)
|
PSCW
|
3,507
|
|
(c)
|
10.00%
|
52.6%
|
1/1/2019
|
||||
|
Gas (2019 Test Period)
|
PSCW
|
363
|
|
(c)
|
10.00%
|
52.6%
|
1/1/2019
|
||||
|
Electric (2020 Test Period)
|
PSCW
|
3,955
|
|
(c)
|
10.00%
|
52.5%
|
1/1/2020
|
||||
|
Gas (2020 Test Period)
|
PSCW
|
387
|
|
(c)
|
10.00%
|
52.5%
|
1/1/2020
|
||||
|
WPL Wholesale Electric
|
FERC
|
232
|
|
10.90%
|
55.0%
|
1/1/2018
|
|||||
|
(a)
|
Authorized returns on common equity may not be indicative of actual returns earned or projections of future returns.
|
|
(b)
|
Average rate base was calculated using balances as of the end of the test year, adjusted for post-test year capital additions placed in service by September 30 following the end of the test year.
|
|
(c)
|
Average rate base amounts reflect WPL’s allocated retail share of rate base and do not include CWIP or a cash working capital allowance, and were calculated using a forecasted 13-month average for the test periods. The PSCW provides a return on selected CWIP and a cash working capital allowance by adjusting the percentage return on rate base.
|
|
33
|
||
Other Rate Matters
Federal Tax Reform -
In January 2018, the IUB issued an order requiring IPL and other investor-owned utilities in Iowa to track all calculated differences since January 1, 2018 resulting from Federal Tax Reform. In April 2018, the IUB issued an order on IPL’s electric and gas Federal Tax Reform proposals. IPL estimates the calculated differences in 2018 were approximately $40 million, with $25 million returned to retail electric customers in 2018 and the remaining $15 million expected to be returned in 2019. In addition, the IUB order determined the excess deferred taxes resulting from the remeasurement of accumulated deferred income taxes caused by Federal Tax Reform (approximately $350 million revenue requirement) will be addressed in IPL’s current and future retail electric and gas rate reviews.
In January 2018, the PSCW issued an order directing WPL and other investor-owned utilities in Wisconsin to defer the revenue requirement impacts since January 1, 2018 resulting from Federal Tax Reform. In May 2018, the PSCW issued an order directing WPL to return annual tax benefits for 2018 to WPL’s retail electric and gas customers. In 2018, $41 million of tax benefits were returned to WPL’s retail electric and gas customers. Excess deferred taxes resulting from the remeasurement of accumulated deferred income taxes caused by Federal Tax Reform result in an approximate $460 million revenue requirement impact for WPL. Approximately $85 million of this amount will be used to help maintain base rates from current levels through 2020, and the remainder will be addressed in WPL’s future retail electric and gas rate reviews.
In March 2018, FERC issued an order granting a waiver request filed in February 2018 by a group of MISO transmission owners, including ITC and ATC, allowing transmission rates to be updated to reflect the impacts resulting from Federal Tax Reform. As a result, beginning in March 2018, amounts billed by ITC and ATC decreased due to the impacts from Federal Tax Reform. IPL began providing the benefits of the lower transmission service expense to its electric customers utilizing the transmission cost recovery mechanism effective May 1, 2018. WPL will defer any incremental benefits of the lower transmission service expense from Federal Tax Reform until a future electric rate review. Based on IPL’s and WPL’s electric transmission cost recovery mechanisms, IPL and WPL currently do not expect that any changes to electric transmission service costs billed by ITC and ATC, respectively, will have a material impact on their financial condition and results of operations.
Iowa Tax Reform -
Refer to
Note 2
for discussion of future changes to the Iowa state income tax rate due to Iowa tax reform enacted in May 2018 and the resulting impact on Alliant Energy’s and IPL’s financial statements.
IPL’s Duane Arnold Energy Center Purchased Power Agreement Amendment -
In 2012, IPL entered into a nuclear generation PPA for the purchase of approximately 430 MW of capacity and the resulting energy from DAEC for a term from February 2014 through December 2025. In July 2018, IPL entered into a proposed amendment to shorten the term of the DAEC PPA by five years in exchange for a $110 million buyout payment by IPL in September 2020, which would change Alliant Energy’s and IPL’s future commitments related to the DAEC PPA. To replace some of the energy and capacity from DAEC, IPL entered into four new PPAs with expected 20-year terms beginning in 2020 and 2021 for the purchase of approximately 340 MW of energy in aggregate from existing Iowa wind farms that are expected to be repowered. The amendment to shorten the term of the DAEC PPA and the four new wind PPAs are expected to provide significant energy cost savings to IPL customers. In December 2018, the IUB issued an order, effective in January 2019, approving the settlement agreement and the recovery of the buyout payment from IPL’s retail customers over a five-year period following the payment in 2020 at IPL’s pre-tax weighted-average cost of capital in effect at the time recovery commences.
LIQUIDITY AND CAPITAL RESOURCES
Overview
-
Alliant Energy, IPL and WPL expect to maintain adequate liquidity to operate their businesses and implement their strategy as a result of operating cash flows generated by their utility business, and available capacity under a single revolving credit facility and IPL’s sales of accounts receivable program, supplemented by periodic issuances of long-term debt and Alliant Energy equity securities.
Liquidity Position
-
At
December 31, 2018
, Alliant Energy had
$21 million
of cash and cash equivalents,
$559 million
(
$114 million
at the parent company,
$200 million
at IPL and
$245 million
at WPL) of available capacity under the single revolving credit facility and no available capacity at IPL under its sales of accounts receivable program.
Capital Structure
-
Alliant Energy, IPL and WPL plan to maintain debt-to-total capitalization ratios that are consistent with investment-grade credit ratings. IPL and WPL expect to maintain capital structures consistent with their authorized levels. Alliant Energy expects to maintain consolidated debt at approximately 55% of total capital and consolidated preferred stock at less than 5% of total capital. These targets may be adjusted depending on subsequent developments and the impact on their respective weighted-average cost of capital and investment-grade credit ratings. Capital structures as of
December 31,
|
34
|
||
2018
were as follows (Common Equity (CE); IPL’s Preferred Stock (PS); Long-term Debt (including current maturities) (LD); Short-term Debt (SD)):


Alliant Energy, IPL and WPL intend to manage their capital structures and liquidity positions in such a way that facilitates their ability to raise funds reliably and on reasonable terms and conditions, while maintaining capital structures consistent with those approved by regulators. In addition to capital structures, other important factors used to determine the characteristics of future financings include financial coverage ratios, capital spending plans, regulatory orders and rate-making considerations, levels of debt imputed by rating agencies, market conditions, the impact of tax initiatives and legislation, and anticipated proceeds from asset sales. The PSCW factors certain imputed debt adjustments in establishing a regulatory capital structure as part of WPL’s retail rate reviews. The IUB does not make any explicit adjustments for imputed debt in establishing capital ratios used in determining customer rates, although such adjustments are considered by IPL in recommending an appropriate capital structure. Debt imputations by rating agencies include pension and OPEB obligations and the sales of accounts receivable program.
Credit and Capital Markets
-
Alliant Energy, IPL and WPL maintain a single revolving credit facility to provide backstop liquidity to their commercial paper programs, and ensure a committed source of liquidity in the event the commercial paper market becomes disrupted. In addition, IPL maintains a sales of accounts receivable program as an alternative financing source.
Primary Sources and Uses of Cash
-
Alliant Energy’s most significant source of cash is from electric and gas sales to IPL’s and WPL’s customers. Cash from these sales reimburses IPL and WPL for prudently-incurred expenses to provide service to their utility customers and provides IPL and WPL a return of and a return on the assets used to provide such services. Capital needed to retire debt and fund capital expenditures related to large strategic projects is expected to be met primarily through external financings.
Cash Flows
-
Selected information from the cash flows statements was as follows (in millions):
|
Alliant Energy
|
IPL
|
WPL
|
|||||||||||||||||||||||||||
|
2018
|
2017
|
2016
|
2018
|
2017
|
2016
|
2018
|
2017
|
2016
|
|||||||||||||||||||||
|
Cash, cash equivalents and restricted cash, January 1
|
|
$33.9
|
|
|
$13.1
|
|
|
$11.2
|
|
|
$7.2
|
|
|
$4.2
|
|
|
$7.2
|
|
|
$24.2
|
|
|
$6.9
|
|
|
$3.1
|
|
||
|
Cash flows from (used for):
|
|||||||||||||||||||||||||||||
|
Operating activities
|
527.7
|
|
521.6
|
|
392.8
|
|
(5.0
|
)
|
(21.8
|
)
|
(104.9
|
)
|
457.0
|
|
465.7
|
|
521.4
|
|
|||||||||||
|
Investing activities
|
(1,066.8
|
)
|
(1,033.4
|
)
|
(720.2
|
)
|
(429.4
|
)
|
(241.9
|
)
|
(228.6
|
)
|
(607.5
|
)
|
(667.3
|
)
|
(478.9
|
)
|
|||||||||||
|
Financing activities
|
530.7
|
|
532.6
|
|
329.3
|
|
439.6
|
|
266.7
|
|
330.5
|
|
135.5
|
|
218.9
|
|
(38.7
|
)
|
|||||||||||
|
Net increase (decrease)
|
(8.4
|
)
|
20.8
|
|
1.9
|
|
5.2
|
|
3.0
|
|
(3.0
|
)
|
(15.0
|
)
|
17.3
|
|
3.8
|
|
|||||||||||
|
Cash, cash equivalents and restricted cash, December 31
|
|
$25.5
|
|
|
$33.9
|
|
|
$13.1
|
|
|
$12.4
|
|
|
$7.2
|
|
|
$4.2
|
|
|
$9.2
|
|
|
$24.2
|
|
|
$6.9
|
|
||
|
35
|
||
Operating Activities -
The following items contributed to increased (decreased) operating activity cash flows (in millions):
|
2018 vs. 2017
|
Alliant Energy
|
IPL
|
WPL
|
||||||||
|
Increased collections from IPL’s and WPL’s retail customers caused by temperature impacts on electric and gas sales
|
|
$57
|
|
|
$33
|
|
|
$24
|
|
||
|
Changes in electric and gas tax benefit rider credits on customer bills at IPL
|
52
|
|
52
|
|
—
|
|
|||||
|
Higher collections from IPL's retail electric base rate increases and interim retail gas base rates increases
|
51
|
|
51
|
|
—
|
|
|||||
|
Changes in income taxes paid/refunded
|
6
|
|
(32
|
)
|
22
|
|
|||||
|
Amounts refunded to customers in 2018 related to Federal Tax Reform (Refer to
Note 2
for details)
|
(66
|
)
|
(25
|
)
|
(41
|
)
|
|||||
|
Changes in interest payments
|
(35
|
)
|
(9
|
)
|
(6
|
)
|
|||||
|
Changes in the sales of accounts receivable at IPL
|
(30
|
)
|
(30
|
)
|
—
|
|
|||||
|
Changes in cash collateral and deposit balances
|
(49
|
)
|
—
|
|
(32
|
)
|
|||||
|
Other (primarily due to other changes in working capital)
|
20
|
|
(23
|
)
|
24
|
|
|||||
|
|
$6
|
|
|
$17
|
|
|
($9
|
)
|
|||
|
2017 vs. 2016
|
Alliant Energy
|
IPL
|
WPL
|
||||||||
|
Higher collections at IPL due to interim retail electric base rate increase effective April 13, 2017
|
|
$77
|
|
|
$77
|
|
|
$—
|
|
||
|
Higher collections at WPL due to new retail electric and gas base rates in 2017
|
72
|
|
—
|
|
72
|
|
|||||
|
Changes in the sales of accounts receivable at IPL
|
33
|
|
33
|
|
—
|
|
|||||
|
Changes in cash collateral balances
|
30
|
|
—
|
|
—
|
|
|||||
|
Timing of WPL’s fuel-related cost recoveries from customers
|
(50
|
)
|
—
|
|
(50
|
)
|
|||||
|
Lower distributions received at WPL from its interest in ATC due to the transfer of the interest in ATC to ATI on December 31, 2016
|
—
|
|
—
|
|
(27
|
)
|
|||||
|
Changes in income taxes paid/refunded
|
(1
|
)
|
20
|
|
(36
|
)
|
|||||
|
Other (primarily due to other changes in working capital)
|
(32
|
)
|
(47
|
)
|
(15
|
)
|
|||||
|
|
$129
|
|
|
$83
|
|
|
($56
|
)
|
|||
Income Tax Payments and Refunds
- Income tax (payments) refunds were as follows (in millions):
|
2018
|
2017
|
2016
|
|||||||||
|
IPL
|
|
($24
|
)
|
|
$9
|
|
|
($11
|
)
|
||
|
WPL
|
14
|
|
(8
|
)
|
28
|
|
|||||
|
Other subsidiaries
|
5
|
|
(12
|
)
|
(27
|
)
|
|||||
|
Alliant Energy
|
|
($5
|
)
|
|
($11
|
)
|
|
($10
|
)
|
||
Alliant Energy, IPL and WPL currently do not expect to make any significant federal income tax payments through 2024 based on their current federal net operating loss and credit carryforward positions. While no significant federal income tax payments through 2024 are expected to occur, some tax payments and refunds may occur for state taxes and between consolidated group members (including IPL and WPL) under the tax sharing agreement between Alliant Energy and its subsidiaries. Refer to
Note 12
for discussion of the carryforward positions.
Pension Plan Contributions
- Alliant Energy, IPL and WPL currently expect to make $34 million, $16 million and $16 million of pension plan contributions in
2019
, respectively, based on the funded status and assumed return on assets for each plan as of the
December 31, 2018
measurement date. Refer to
Note 13(a)
for discussion of the current funded levels of pension plans.
Investing Activities -
The following items contributed to increased (decreased) investing activity cash flows (in millions):
|
2018 vs. 2017
|
Alliant Energy
|
IPL
|
WPL
|
||||||||
|
Lower (higher) utility construction expenditures (a)
|
|
($287
|
)
|
|
($315
|
)
|
|
$60
|
|
||
|
Changes in the amount of cash receipts on sold receivables
|
144
|
|
144
|
|
—
|
|
|||||
|
Acquisition expenditures for non-utility wind farm in Oklahoma in 2017 (Refer to
Note 6
for details)
|
98
|
|
—
|
|
—
|
|
|||||
|
Other
|
12
|
|
(17
|
)
|
—
|
|
|||||
|
|
($33
|
)
|
|
($188
|
)
|
|
$60
|
|
|||
|
36
|
||
|
2017 vs. 2016
|
Alliant Energy
|
IPL
|
WPL
|
||||||||
|
Lower (higher) utility construction expenditures (b)
|
|
($151
|
)
|
|
$14
|
|
|
($184
|
)
|
||
|
Acquisition expenditures for non-utility wind farm in Oklahoma in 2017
|
(98
|
)
|
—
|
|
—
|
|
|||||
|
Proceeds from the liquidation of company-owned life insurance policies in 2016
|
(31
|
)
|
(19
|
)
|
—
|
|
|||||
|
Other
|
(33
|
)
|
(8
|
)
|
(4
|
)
|
|||||
|
|
($313
|
)
|
|
($13
|
)
|
|
($188
|
)
|
|||
|
(a)
|
Largely due to higher expenditures for IPL’s and WPL’s expansion of wind generation and IPL’s advanced metering infrastructure, partially offset by lower expenditures for WPL’s West Riverside facility, IPL’s Marshalltown facility, and IPL’s and WPL’s electric and gas distribution systems.
|
|
(b)
|
Largely due to higher expenditures for WPL’s West Riverside facility, IPL’s and WPL’s electric and gas distribution systems and IPL’s expansion of wind generation, partially offset by lower expenditures for IPL’s Marshalltown facility.
|
Construction and Acquisition Expenditures
- Construction and acquisition expenditures and financing plans are reviewed, approved and updated as part of the financial planning process. Changes may result from a number of reasons, including regulatory requirements, changing legislation, not obtaining favorable and acceptable regulatory approval on certain projects, improvements in technology, improvements to ensure reliability of the electric and gas distribution systems, and new opportunities. Alliant Energy, IPL and WPL have not yet entered into contractual commitments relating to the majority of their anticipated future construction and acquisition expenditures. As a result, they have some discretion with regard to the level and timing of these expenditures. The table below summarizes anticipated construction and acquisition expenditures (in millions). Cost estimates represent Alliant Energy’s, IPL’s and WPL’s portion of construction expenditures and exclude AFUDC and capitalized interest, if applicable. Such estimates reflect reductions to Alliant Energy’s and WPL’s capital expenditures resulting from purchase options by certain electric cooperatives for a partial ownership interest in West Riverside. Such amounts do not include IPL’s expected $110 million buyout payment in September 2020 related to the DAEC PPA, nor any potential proceeds if WPSC and/or MGE exercise options for a partial ownership interest in West Riverside. Refer to “
Customer Investments
” for further discussion of certain key projects impacting construction and acquisition plans related to the utility business.
|
Alliant Energy
|
IPL
|
WPL
|
||||||||||||||||||||||||||||||||||||
|
2019
|
2020
|
2021
|
2022
|
2019
|
2020
|
2021
|
2022
|
2019
|
2020
|
2021
|
2022
|
|||||||||||||||||||||||||||
|
Generation:
|
||||||||||||||||||||||||||||||||||||||
|
Renewable projects
|
|
$645
|
|
|
$200
|
|
|
$15
|
|
|
$125
|
|
|
$545
|
|
|
$100
|
|
|
$—
|
|
|
$5
|
|
|
$100
|
|
|
$100
|
|
|
$15
|
|
|
$120
|
|
||
|
West Riverside
|
130
|
|
15
|
|
—
|
|
—
|
|
—
|
|
—
|
|
—
|
|
—
|
|
130
|
|
15
|
|
—
|
|
—
|
|
||||||||||||||
|
Other
|
85
|
|
135
|
|
155
|
|
200
|
|
55
|
|
75
|
|
90
|
|
135
|
|
30
|
|
60
|
|
65
|
|
65
|
|
||||||||||||||
|
Distribution:
|
||||||||||||||||||||||||||||||||||||||
|
Electric systems
|
475
|
|
525
|
|
570
|
|
600
|
|
285
|
|
330
|
|
355
|
|
375
|
|
190
|
|
195
|
|
215
|
|
225
|
|
||||||||||||||
|
Gas systems
|
100
|
|
245
|
|
125
|
|
175
|
|
50
|
|
65
|
|
80
|
|
115
|
|
50
|
|
180
|
|
45
|
|
60
|
|
||||||||||||||
|
Other
|
175
|
|
165
|
|
180
|
|
210
|
|
20
|
|
30
|
|
20
|
|
20
|
|
15
|
|
10
|
|
10
|
|
15
|
|
||||||||||||||
|
|
$1,610
|
|
|
$1,285
|
|
|
$1,045
|
|
|
$1,310
|
|
|
$955
|
|
|
$600
|
|
|
$545
|
|
|
$650
|
|
|
$515
|
|
|
$560
|
|
|
$350
|
|
|
$485
|
|
|||
Financing Activities -
The following items contributed to increased (decreased) financing activity cash flows (in millions):
|
2018 vs. 2017
|
Alliant Energy
|
IPL
|
WPL
|
||||||||
|
Higher payments to retire long-term debt
|
|
($851
|
)
|
|
($350
|
)
|
|
$—
|
|
||
|
Net changes in the amount of commercial paper and other short-term borrowings outstanding
|
(145
|
)
|
50
|
|
108
|
|
|||||
|
Higher (lower) net proceeds from issuance of long-term debt
|
950
|
|
250
|
|
(300
|
)
|
|||||
|
Higher net proceeds from common stock issuances
|
47
|
|
—
|
|
—
|
|
|||||
|
Higher capital contributions from IPL’s and WPL’s parent company, Alliant Energy
|
—
|
|
225
|
|
110
|
|
|||||
|
Other
|
(3
|
)
|
(2
|
)
|
(1
|
)
|
|||||
|
|
($2
|
)
|
|
$173
|
|
|
($83
|
)
|
|||
|
37
|
||
|
2017 vs. 2016
|
Alliant Energy
|
IPL
|
WPL
|
||||||||
|
Lower payments to retire long-term debt
|
|
$309
|
|
|
$—
|
|
|
$—
|
|
||
|
Higher net proceeds from common stock issuances
|
123
|
|
—
|
|
—
|
|
|||||
|
Net changes in the amount of commercial paper and other short-term borrowings outstanding
|
87
|
|
—
|
|
(60
|
)
|
|||||
|
Higher (lower) net proceeds from issuance of long-term debt
|
(250
|
)
|
(50
|
)
|
300
|
|
|||||
|
Higher capital contributions from IPL’s and WPL’s parent company, Alliant Energy
|
—
|
|
10
|
|
30
|
|
|||||
|
Other (includes higher dividend payments in 2017)
|
(66
|
)
|
(24
|
)
|
(12
|
)
|
|||||
|
|
$203
|
|
|
($64
|
)
|
|
$258
|
|
|||
FERC and Public Utility Holding Company Act Financing Authorizations
- Under the Public Utility Holding Company Act of 2005, FERC has authority over the issuance of utility securities, except to the extent that a public utility’s primary state regulatory commission has retained jurisdiction over such matters. FERC currently has authority over the issuance of securities by IPL. FERC does not have authority over the issuance of securities by Alliant Energy, WPL, AEF or Corporate Services.
In 2017, IPL received authorization from FERC to issue securities in 2018 and 2019 as follows (in millions):
|
Initial Authorization
|
Remaining Capacity as of December 31, 2018
|
||||||
|
Long-term debt securities issuances in aggregate
|
|
$1,100
|
|
|
$600
|
|
|
|
Short-term debt securities outstanding at any time (including borrowings from its parent)
|
300
|
|
250
|
|
|||
|
Preferred stock issuances in aggregate
|
300
|
|
300
|
|
|||
State Regulatory Financing Authorizations
- In August 2017, WPL received authorization from the PSCW to have up to $400 million of short-term borrowings and/or letters of credit outstanding at any time through the earlier of the expiration date of WPL’s credit facility agreement (including extensions) or December 2024. As of
December 31, 2018
, WPL also had authority to issue up to $650 million of long-term debt securities in aggregate in 2019 pursuant to a December 2016 PSCW order.
Shelf Registrations
- Alliant Energy, IPL and WPL have current shelf registration statements on file with the SEC for availability to issue unspecified amounts of securities through December 2020. Alliant Energy’s shelf registration statement may be used to issue common stock, debt and other securities. IPL’s and WPL’s shelf registration statements may be used to issue preferred stock and debt securities.
Common Stock Dividends
- Payment of common stock dividends is subject to dividend declaration by Alliant Energy’s Board of Directors. Alliant Energy’s general long-term goal is to maintain a dividend payout ratio that is competitive with the industry average. Based on that, Alliant Energy’s goal is to maintain a dividend payout ratio of approximately 60% to 70% of consolidated earnings from continuing operations. IPL’s and WPL’s goal is to maintain dividend payout ratios of approximately 65% to 75%. Alliant Energy’s, IPL’s and WPL’s dividend payout ratios were
61%
,
64%
and
67%
of their consolidated earnings from continuing operations in
2018
, respectively. Refer to “
Results of Operations
” for discussion of expected common stock dividends in
2019
.
Common Stock Issuances
- Refer to
Note 7
for discussion of common stock issuances by Alliant Energy in
2016
through
2018
and “
Results of Operations
” for discussion of expected issuances of common stock in
2019
.
Short-term Debt
- In 2017, Alliant Energy, IPL and WPL entered into a single revolving credit facility agreement, which expires in August 2022, to provide short-term borrowing flexibility and backstop liquidity for commercial paper outstanding. As of
December 31, 2018
, the short-term borrowing capacity totaled
$1 billion
(
$400 million
for Alliant Energy at the parent company level,
$250 million
for IPL and
$350 million
for WPL). There are currently 13 lenders that participate in the credit facility, with aggregate respective commitments ranging from $20 million to $130 million. The credit facility includes a $100 million letter of credit commitment and $50 million swingline commitment, which are available to each of Alliant Energy, IPL and WPL. Subject to certain conditions, Alliant Energy, IPL and WPL may each reallocate and change its sublimit up to $500 million, $400 million and $500 million, respectively, within the $1 billion total commitment. Subject to certain conditions, Alliant Energy, IPL and WPL may exercise two extension options, each extending the maturity date by one year. The credit facility has a provision to expand the facility size up to an additional $300 million, for a potential total commitment of $1.3 billion, subject to lender approval for Alliant Energy and subject to lender and regulatory approvals for IPL and WPL.
|
38
|
||
The credit agreement contains provisions that prohibit placing liens on any of the property of Alliant Energy, IPL or WPL or their respective subsidiaries with certain exceptions. Exceptions include among others, liens to secure obligations of up to 10% of the consolidated tangible assets of the applicable borrower (valued at carrying value), liens imposed by government entities, materialmen’s and similar liens, judgment liens, liens to secure additional non-recourse debt not to exceed $100 million outstanding at any one time at each of Alliant Energy, IPL and WPL, and purchase money liens.
The credit agreement contains provisions that require, during its term, any proceeds from asset sales, with certain exclusions, in excess of 25% of Alliant Energy’s, IPL’s and WPL’s respective consolidated assets be used to reduce certain of their respective debt commitments. Exclusions include, among others, certain sale and lease-back transactions, sales of non-utility assets, intercompany asset sales and sales of certain contracts and accounts receivable.
The credit agreement contains customary events of default, including a cross-default provision that would be triggered if Alliant Energy or certain of its significant subsidiaries (including IPL and WPL) defaults on debt (other than non-recourse debt) totaling $100 million or more. IPL and WPL are subject to a similar cross-default provision with respect to their own respective consolidated debt. A default by Alliant Energy or its non-utility subsidiaries would not trigger a cross-default at IPL or WPL, nor would a default by either of IPL or WPL constitute a cross-default event for the other. If an event of default under the credit agreement occurs and is continuing, then the lenders may declare any outstanding obligations of the defaulting borrower under the credit agreement immediately due and payable. In addition, if any order for relief is entered under bankruptcy laws with respect to (a) Alliant Energy, IPL or WPL, then any outstanding obligations of Alliant Energy under the credit agreement would be immediately due and payable, or (b) IPL or WPL, then any outstanding obligations of IPL or WPL, respectively, under the credit agreement would be immediately due and payable.
A material adverse change representation is not required for borrowings under the credit agreement. At
December 31, 2018
, Alliant Energy, IPL and WPL were in compliance with financial covenants of the credit agreement. Refer to
Note 9(a)
for additional information regarding short-term debt.
Long-term Debt
- Refer to
Note 9(b)
for discussion of issuances and retirements of long-term debt in
2018
and “
Results of Operations
” for discussion of expected issuances of long-term debt in
2019
. Significant issuances of long-term debt in
2017
and
2016
were as follows (dollars in millions):
|
Company
|
Principal Amount
|
Type
|
Interest Rate
|
Maturity Date
|
Use of Proceeds
|
|||||||
|
2017:
|
||||||||||||
|
IPL
|
|
$250
|
|
Senior debentures
|
3.25%
|
Dec-2024
|
Reduce commercial paper classified as long-term debt, reduce cash amounts received from its sales of accounts receivable program and for general corporate purposes
|
|||||
|
WPL
|
|
$300
|
|
Debentures
|
3.05%
|
Oct-2027
|
Reduce commercial paper and for general corporate purposes
|
|||||
|
2016:
|
||||||||||||
|
AEF
|
|
$500
|
|
Variable-rate term loan credit agreement
|
2% at December 31, 2017
|
Oct-2018
|
Retire borrowings under Alliant Energy’s and Franklin County Holdings LLC’s variable-rate term loan credit agreements that matured in 2016, reduce outstanding commercial paper and for general corporate purposes
|
|||||
|
IPL
|
300
|
|
Senior debentures
|
3.7%
|
Sep-2046
|
Reduce cash amounts received from its sales of accounts receivable program, reduce commercial paper classified as long-term debt and for general corporate purposes
|
||||||
There were no significant retirements of long-term debt in 2017. Significant retirements of long-term debt in
2016
were as follows (dollars in millions):
|
Company
|
Principal Amount
|
Type
|
Interest Rate
|
Retirement Date
|
||||||
|
2016:
|
||||||||||
|
Alliant Energy
|
|
$250
|
|
Variable-rate term loan credit agreement
|
1% at December 31, 2015
|
Oct-2016
|
||||
|
Franklin County Holdings LLC
|
60
|
|
Variable-rate term loan credit agreement
|
1% at December 31, 2015
|
Oct-2016
|
|||||
Impact of Credit Ratings on Liquidity and Collateral Obligations
-
Ratings Triggers -
The long-term debt of Alliant Energy and its subsidiaries is not subject to any repayment requirements as a result of explicit credit rating downgrades or so-called “ratings triggers.” However, Alliant Energy and its subsidiaries are parties to various agreements that contain provisions dependent on credit ratings. In the event of a significant downgrade, Alliant Energy or its subsidiaries may need to provide credit support, such as letters of credit or cash collateral equal to the amount of the exposure, or may need to unwind the contract or pay the underlying obligation. In the event of a significant downgrade, management believes Alliant Energy, IPL and WPL have sufficient liquidity to cover counterparty credit support
|
39
|
||
or collateral requirements under these various agreements. In addition, a downgrade in the credit ratings of Alliant Energy, IPL or WPL, could also result in them paying higher interest rates in future financings, reduce flexibility with future financing plans, reduce their pool of potential lenders, increase their borrowing costs under existing credit facilities or limit their access to the commercial paper market. Credit ratings and outlooks as of the date of this report are as follows:
|
Standard & Poor’s Ratings Services
|
Moody’s Investors Service
|
|||
|
Alliant Energy:
|
Corporate/issuer
|
A-
|
Baa1
|
|
|
Commercial paper
|
A-2
|
P-2
|
||
|
Senior unsecured long-term debt
|
N/A
|
N/A
|
||
|
Outlook
|
Negative
|
Negative
|
||
|
IPL:
|
Corporate/issuer
|
A-
|
Baa1
|
|
|
Commercial paper
|
A-2
|
P-2
|
||
|
Senior unsecured long-term debt
|
A-
|
Baa1
|
||
|
Preferred stock
|
BBB
|
Baa3
|
||
|
Outlook
|
Negative
|
Negative
|
||
|
WPL:
|
Corporate/issuer
|
A
|
A2
|
|
|
Commercial paper
|
A-1
|
P-1
|
||
|
Senior unsecured long-term debt
|
A
|
A2
|
||
|
Outlook
|
Negative
|
Negative
|
||
Standard & Poor’s Ratings Services and Moody’s Investors Service issued credit ratings of BBB+ and Baa1, respectively, for the senior notes issued by AEF (with Alliant Energy as guarantor) in June 2018. Credit ratings are not recommendations to buy or sell securities and are subject to change, and each rating should be evaluated independently of any other rating. Each of Alliant Energy, IPL or WPL assumes no obligation to update their respective credit ratings. Refer to
Note 15
for additional information on ratings triggers for commodity contracts accounted for as derivatives.
Off-Balance Sheet Arrangements
-
Special Purpose Entities -
IPL maintains a Receivables Agreement whereby it may sell its customer accounts receivables, unbilled revenues and certain other accounts receivables to a third party through wholly-owned and consolidated special purpose entities. In March 2018, IPL amended and extended through March 2021 the purchase commitment from the third party to which it sells its receivables. In
2018
,
2017
and
2016
, IPL evaluated the third party that purchases IPL’s receivable assets under the Receivables Agreement and believes that the third party is a VIE. However, IPL concluded consolidation of the third party was not required.
In addition, IPL’s sales of accounts receivable program agreement contains a cross-default provision that is triggered if IPL or Alliant Energy incurs an event of default on debt totaling $100 million or more. If an event of default under IPL’s sales of accounts receivable program agreement occurs, then the counterparty could terminate such agreement. Refer to
Note 5(b)
for additional information regarding IPL’s sales of accounts receivable program.
Guarantees and Indemnifications -
At
December 31, 2018
, various guarantees and indemnifications are outstanding related to Alliant Energy’s cash equity ownership interest in a non-utility wind farm and Alliant Energy’s and IPL’s prior divestiture activities. Refer to
Note 17(d)
for additional information.
Certain Financial Commitments
-
Contractual Obligations -
Consolidated long-term contractual obligations as of
December 31, 2018
were as follows (in millions):
|
Alliant Energy
|
2019
|
2020
|
2021
|
2022
|
2023
|
Thereafter
|
Total
|
||||||||||||||||||||
|
Other purchase obligations (
Note 17(b)
)
|
|
$575
|
|
|
$339
|
|
|
$297
|
|
|
$245
|
|
|
$233
|
|
|
$503
|
|
|
$2,192
|
|
||||||
|
Long-term debt maturities (
Note 9(b)
)
|
256
|
|
657
|
|
8
|
|
333
|
|
408
|
|
3,885
|
|
5,547
|
|
|||||||||||||
|
Interest - long-term debt obligations
|
242
|
|
219
|
|
205
|
|
205
|
|
189
|
|
1,999
|
|
3,059
|
|
|||||||||||||
|
Capital purchase obligations (
Note 17(a)
)
|
40
|
|
—
|
|
—
|
|
—
|
|
—
|
|
—
|
|
40
|
|
|||||||||||||
|
Operating leases (
Note 10(a)
)
|
5
|
|
5
|
|
3
|
|
3
|
|
2
|
|
12
|
|
30
|
|
|||||||||||||
|
|
$1,118
|
|
|
$1,220
|
|
|
$513
|
|
|
$786
|
|
|
$832
|
|
|
$6,399
|
|
|
$10,868
|
|
|||||||
|
40
|
||
|
IPL
|
2019
|
2020
|
2021
|
2022
|
2023
|
Thereafter
|
Total
|
||||||||||||||||||||
|
Other purchase obligations (
Note 17(b)
)
|
|
$344
|
|
|
$222
|
|
|
$214
|
|
|
$184
|
|
|
$192
|
|
|
$390
|
|
|
$1,546
|
|
||||||
|
Long-term debt maturities (
Note 9(b)
)
|
—
|
|
200
|
|
—
|
|
—
|
|
—
|
|
2,375
|
|
2,575
|
|
|||||||||||||
|
Interest - long-term debt obligations
|
111
|
|
111
|
|
104
|
|
104
|
|
104
|
|
1,069
|
|
1,603
|
|
|||||||||||||
|
Capital purchase obligations (
Note 17(a)
)
|
14
|
|
—
|
|
—
|
|
—
|
|
—
|
|
—
|
|
14
|
|
|||||||||||||
|
Operating leases (
Note 10(a)
)
|
3
|
|
2
|
|
2
|
|
2
|
|
2
|
|
12
|
|
23
|
|
|||||||||||||
|
|
$472
|
|
|
$535
|
|
|
$320
|
|
|
$290
|
|
|
$298
|
|
|
$3,846
|
|
|
$5,761
|
|
|||||||
|
WPL
|
2019
|
2020
|
2021
|
2022
|
2023
|
Thereafter
|
Total
|
||||||||||||||||||||
|
Other purchase obligations (
Note 17(b)
)
|
|
$218
|
|
|
$116
|
|
|
$83
|
|
|
$61
|
|
|
$41
|
|
|
$113
|
|
|
$632
|
|
||||||
|
Long-term debt maturities (
Note 9(b)
)
|
250
|
|
150
|
|
—
|
|
250
|
|
—
|
|
1,200
|
|
1,850
|
|
|||||||||||||
|
Interest - long-term debt obligations
|
89
|
|
73
|
|
69
|
|
69
|
|
64
|
|
874
|
|
1,238
|
|
|||||||||||||
|
Capital purchase obligations (
Note 17(a)
)
|
26
|
|
—
|
|
—
|
|
—
|
|
—
|
|
—
|
|
26
|
|
|||||||||||||
|
Operating leases (
Note 10(a)
)
|
2
|
|
3
|
|
1
|
|
—
|
|
—
|
|
—
|
|
6
|
|
|||||||||||||
|
Capital lease - Sheboygan Falls Energy Facility (
Note 10(b)
)
|
15
|
|
15
|
|
15
|
|
15
|
|
15
|
|
19
|
|
94
|
|
|||||||||||||
|
|
$600
|
|
|
$357
|
|
|
$168
|
|
|
$395
|
|
|
$120
|
|
|
$2,206
|
|
|
$3,846
|
|
|||||||
At
December 31, 2018
, Alliant Energy, IPL and WPL had no uncertain tax positions recorded as liabilities. Refer to
Note 13(a)
for anticipated pension and OPEB funding amounts, which are not included in the above tables. Refer to “Construction and Acquisition Expenditures” above for additional information on construction and acquisition programs. In addition, at
December 31, 2018
, there were various other liabilities included on the balance sheets that, due to the nature of the liabilities, the timing of payments cannot be estimated and are therefore excluded from the above tables.
OTHER MATTERS
Market Risk Sensitive Instruments and Positions
-
Primary market risk exposures are associated with commodity prices, investment prices and interest rates. Risk management policies are used to monitor and assist in mitigating these market risks and derivative instruments are used to manage some of the exposures related to commodity prices. Refer to Notes
1(h)
and
15
for further discussion of derivative instruments, and
Note 1(g)
for details of utility cost recovery mechanisms that significantly reduce commodity risk.
Commodity Price -
Alliant Energy, IPL and WPL are exposed to the impact of market fluctuations in the price and transportation costs of commodities they procure and market. Established policies and procedures mitigate risks associated with these market fluctuations, including the use of various commodity derivatives and contracts of various durations for the forward sale and purchase of these commodities. Exposure to commodity price risks in the utility businesses is also significantly mitigated by current rate-making structures in place for recovery of fuel-related costs as well as the cost of natural gas purchased for resale. IPL’s electric and gas tariffs and WPL’s wholesale electric and gas tariffs provide for subsequent monthly adjustments to their tariff rates for material changes in prudently incurred commodity costs. IPL’s and WPL’s rate mechanisms, combined with commodity derivatives, significantly reduce commodity risk associated with their electric and gas margins. WPL’s retail electric margins have modest exposure to the impact of changes in commodity prices due largely to the current retail recovery mechanism in place in Wisconsin for fuel-related costs.
Investment Price -
Alliant Energy, IPL and WPL are exposed to investment price risk as a result of their investments in securities, largely related to securities held by their pension and OPEB plans. Refer to
Note 13(a)
for details of the securities held by their pension and OPEB plans. Refer to “
Critical Accounting Policies and Estimates
” for the impact on retirement plan costs of changes in the rate of returns earned by plan assets.
Interest Rate -
Alliant Energy, IPL and WPL are exposed to risk resulting from changes in interest rates associated with variable-rate borrowings. In addition, Alliant Energy and IPL are exposed to risk resulting from changes in interest rates on cash amounts outstanding under IPL’s sales of accounts receivable program. Assuming the impact of a hypothetical 100 basis point increase in interest rates on variable-rate borrowings and cash proceeds outstanding under IPL’s sales of accounts receivable program at
December 31, 2018
, Alliant Energy’s, IPL’s and WPL’s annual pre-tax expense would increase by approximately $8 million, $2 million and $1 million, respectively. Refer to Notes
5(b)
and
9
for additional information on cash proceeds outstanding under IPL’s sales of accounts receivable program, and short- and long-term variable-rate borrowings, respectively. Refer to “
Critical Accounting Policies and Estimates
” for the impacts of changes in discount rates on retirement plan obligations and costs.
|
41
|
||
New Accounting Standards
-
Refer to
Note 1(n)
for discussion of new accounting standards impacting Alliant Energy, IPL and WPL.
Critical Accounting Policies and Estimates
-
The preparation of financial statements in conformity with GAAP requires management to apply accounting policies and make estimates that affect results of operations and the amounts of assets and liabilities reported in the financial statements. The following accounting policies and estimates are critical to the business and the understanding of financial results as they require critical assumptions and judgments by management. The results of these assumptions and judgments form the basis for making estimates regarding the results of operations and the amounts of assets and liabilities that are not readily apparent from other sources. Actual financial results may differ materially from these estimates. Management has discussed these critical accounting policies and estimates with the Audit Committee of the Board of Directors. Refer to
Note 1
for additional discussion of accounting policies and the estimates used in the preparation of the financial statements.
Contingencies -
Assumptions and judgments are made each reporting period regarding the future outcome of contingent events. Loss contingency amounts are recorded for any contingent events for which the likelihood of loss is probable and able to be reasonably estimated based upon current available information. The amounts recorded may differ from actuals when the uncertainty is resolved. The estimates made in accounting for contingencies, and the gains and losses that are recorded upon the ultimate resolution of these uncertainties, could have a significant effect on results of operations and the amount of assets and liabilities in the financial statements.
Note 17
provides further discussion of contingencies assessed at
December 31, 2018
, including various pending legal proceedings, guarantees and indemnifications that may have a material impact on financial condition and results of operations.
Regulatory Assets and Regulatory Liabilities -
IPL and WPL are regulated by various federal and state regulatory agencies. As a result, they are subject to GAAP for regulated operations, which recognizes that the actions of a regulator can provide reasonable assurance of the existence of an asset or liability. Regulatory assets or regulatory liabilities arise as a result of a difference between GAAP and actions imposed by the regulatory agencies in the rate-making process. Regulatory assets generally represent incurred costs that have been deferred as such costs are probable of recovery in future customer rates. Regulatory liabilities generally represent obligations to make refunds to customers or amounts collected in rates for which the related costs have not yet been incurred. Regulatory assets and regulatory liabilities are recognized in accordance with the rulings of applicable federal and state regulators, and future regulatory rulings may impact the carrying value and accounting treatment of regulatory assets and regulatory liabilities.
Assumptions and judgments are made each reporting period regarding whether regulatory assets are probable of future recovery and regulatory liabilities are probable future obligations by considering factors such as regulatory environment changes, rate orders issued by the applicable regulatory agencies, historical decisions by such regulatory agencies regarding similar regulatory assets and regulatory liabilities, and subsequent events of such regulatory agencies. The decisions made by regulatory authorities have an impact on the recovery of costs, the rate of return on invested capital and the timing and amount of assets to be recovered by rates. A change in these decisions may result in a material impact on results of operations and the amount of assets and liabilities in the financial statements.
Note 2
provides details of the nature and amounts of regulatory assets and regulatory liabilities assessed at
December 31, 2018
.
Long-Lived Assets
-
Periodic assessments regarding the recoverability of certain long-lived assets are completed when factors indicate the carrying value of such assets may be impaired or such assets are planned to be sold. These assessments require significant assumptions and judgments by management. The long-lived assets assessed for impairment generally include certain assets within regulated operations that may not be fully recovered from IPL’s and WPL’s customers as a result of regulatory decisions in the future, and assets within non-utility operations that are proposed to be sold or are currently generating operating losses.
Regulated Operations
- Certain long-lived assets within regulated operations are reviewed for possible impairment whenever events or changes in circumstances indicate all or a portion of the carrying value of the assets may be disallowed for rate-making purposes. If IPL or WPL is disallowed recovery of any portion of the carrying value of its regulated property, plant and equipment that is under construction, has been recently completed or is probable of being retired early, an impairment charge is recognized equal to the amount of the carrying value that was disallowed recovery. If IPL or WPL is disallowed a full or partial return on the carrying value of its regulated property, plant and equipment that is under construction, has been recently completed or is probable of being retired early, an impairment charge is recognized equal to the difference between the carrying amount of the asset and the present value of the future revenues expected from its regulated property, plant and equipment. Alliant Energy’s, IPL’s and WPL’s long-lived assets within their regulated operations that were assessed for impairment and plant abandonment in
2018
included IPL’s and WPL’s generating units subject to early retirement.
|
42
|
||
Generating Units Subject to Early Retirement
- Alliant Energy, IPL and WPL evaluate future plans for their electric generation fleet and have announced the early retirement of certain older and less-efficient EGUs. When it becomes probable that an EGU will be retired before the end of its useful life, Alliant Energy, IPL and WPL must assess whether the EGU meets the criteria to be considered probable of abandonment. EGUs that are considered probable of abandonment generally have material remaining net book values and are expected to cease operations in the near term significantly before the end of their original estimated useful lives. If an EGU meets such criteria to be considered probable of abandonment, Alliant Energy, IPL and WPL must assess the probability of full recovery of the remaining carrying value of such EGU. If it is probable that regulators will not allow full recovery of and a full return on the remaining net book value of the abandoned EGU, an impairment charge is recognized equal to the difference between the remaining carrying value and the present value of the future revenues expected from the abandoned EGU.
In June 2018, IPL retired M.L. Kapp Unit 2. IPL’s current rates include a full recovery of and a full return on this EGU from both its retail and wholesale customers, and as a result, Alliant Energy and IPL concluded that no impairment was required as of
December 31, 2018
. In September 2018, WPL retired Edgewater Unit 4. WPL is currently allowed a full recovery of and a full return on this EGU from both its retail and wholesale customers, and as a result, Alliant Energy and WPL concluded that no impairment was required as of
December 31, 2018
. Alliant Energy, IPL and WPL evaluated their other EGUs that are subject to early retirement and determined that no other EGUs met the criteria to be considered probable of abandonment as of
December 31, 2018
.
Unbilled Revenues -
Unbilled revenues are primarily associated with utility operations. Energy sales to individual customers are based on the reading of customers’ meters, which occurs on a systematic basis throughout the month. Amounts of energy delivered to customers since the date of the last meter reading are estimated at the end of each reporting period and the corresponding estimated unbilled revenue is recorded. The unbilled revenue estimate is based on daily system demand volumes, estimated customer usage by class, temperature impacts, line losses and the most recent customer rates. Such process involves the use of various judgments and assumptions and significant changes in these judgments and assumptions could have a material impact on results of operations. As of
December 31, 2018
, unbilled revenues related to Alliant Energy’s utility operations were $171 million ($97 million at IPL and $74 million at WPL).
Pensions and Other Postretirement Benefits -
Alliant Energy, IPL and WPL sponsor various defined benefit pension and OPEB plans that provide benefits to a significant portion of their employees and retirees. Assumptions and judgments are made periodically to estimate the obligations and costs related to their retirement plans. There are many judgments and assumptions involved in determining an entity’s pension and other postretirement liabilities and costs each period including employee demographics (including life expectancies and compensation levels), discount rates, assumed rates of return and funding. Changes made to plan provisions may also impact current and future benefits costs. Judgments and assumptions are supported by historical data and reasonable projections and are reviewed at least annually. The following table shows the impacts of changing certain key actuarial assumptions discussed above (in millions):
|
Defined Benefit Pension Plans
|
OPEB Plans
|
|||||||||||||||
|
Change in Actuarial Assumption
|
Impact on Projected Benefit Obligation at December 31, 2018
|
Impact on 2019 Net Periodic Benefit Costs
|
Impact on Accumulated Benefit Obligation at December 31, 2018
|
Impact on 2019 Net Periodic Benefit Costs
|
||||||||||||
|
Alliant Energy
|
||||||||||||||||
|
1% change in discount rate
|
|
$144
|
|
|
$9
|
|
|
$18
|
|
|
$2
|
|
||||
|
1% change in expected rate of return
|
N/A
|
|
8
|
|
N/A
|
|
1
|
|
||||||||
|
IPL
|
||||||||||||||||
|
1% change in discount rate
|
67
|
|
5
|
|
7
|
|
1
|
|
||||||||
|
1% change in expected rate of return
|
N/A
|
|
4
|
|
N/A
|
|
1
|
|
||||||||
|
WPL
|
||||||||||||||||
|
1% change in discount rate
|
63
|
|
5
|
|
7
|
|
1
|
|
||||||||
|
1% change in expected rate of return
|
N/A
|
|
3
|
|
N/A
|
|
—
|
|
||||||||
Income Taxes -
Alliant Energy, IPL and WPL are subject to income taxes in various jurisdictions. Assumptions and judgments are made each reporting period to estimate income tax assets, liabilities, benefits and expenses. Judgments and assumptions are supported by historical data and reasonable projections. Significant changes in these judgments and assumptions could have a material impact on financial condition and results of operations. Alliant Energy’s and IPL’s critical assumptions and judgments for
2018
include estimates of qualifying deductions for repairs expenditures and allocation of mixed service costs due to the impact of Iowa rate-making principles on such property-related differences. Critical assumptions and judgments also include projections of future taxable income used to determine the ability to utilize net
|
43
|
||
operating losses and credit carryforwards prior to their expiration, and accounting for the impacts of Federal Tax Reform, including the application of bonus depreciation. Refer to
Note 12
for further discussion of tax matters.
Effect of Rate-making on Property-related Differences
- Alliant Energy’s and IPL’s effective income tax rates are normally impacted by certain property-related differences at IPL for which deferred tax is not recorded in the income statement pursuant to Iowa rate-making principles. Changes in methods or assumptions regarding the amount of IPL’s qualifying repairs expenditures, allocation of mixed service costs, and costs related to retirement or removal of depreciable property could result in a material impact on Alliant Energy’s and IPL’s financial condition and results of operations.
Carryforward Utilization
- Significant federal tax credit carryforwards and federal and state net operating loss carryforwards exist for Alliant Energy, IPL and WPL as of
December 31, 2018
. Based on projections of current and future taxable income, Alliant Energy, IPL and WPL plan to utilize substantially all of these carryforwards prior to their expiration. Due to the anticipated future reductions in revenues from utility customers due to Federal Tax Reform, Alliant Energy expects a reduction in its future consolidated taxable income, which will extend the period to which prior unutilized operating losses will be utilized. Taxable income must be reduced by net operating losses carryforwards prior to utilizing federal tax credit carryforwards. Alliant Energy expects to utilize its net operating losses carryforwards by 2024 and therefore, currently does not expect to utilize 2002 and 2003 vintage federal credit carryforwards prior to their expiration in 2022 and 2023, respectively. This resulted in valuation allowance charges recorded to “Income tax expense (benefit)” on the income statements in 2017. Federal credit carryforwards generated from 2004 through 2008, which amount to $7 million for Alliant Energy, are expected to be utilized within five years of expiration. All other federal credit carryforwards and federal net operating loss carryforwards are expected to be utilized more than five years before expiration. Changes in tax regulations or assumptions regarding current and future taxable income could require changes to valuation allowances in the future resulting in a material impact on financial condition and results of operations.
ITEM 7A. QUANTITATIVE AND QUALITATIVE DISCLOSURES ABOUT MARKET RISK
Quantitative and Qualitative Disclosures About Market Risk are reported in “
Other Matters - Market Risk Sensitive Instruments and Positions
” in MDA.
ITEM 8. FINANCIAL STATEMENTS AND SUPPLEMENTARY DATA
|
44
|
||
REPORT OF INDEPENDENT REGISTERED PUBLIC ACCOUNTING FIRM
To the Shareowners and the Board of Directors of Alliant Energy Corporation:
Opinion on the Financial Statements
We have audited the accompanying consolidated balance sheets of Alliant Energy Corporation and subsidiaries (the “Company”) as of
December 31, 2018
and
2017
, the related consolidated statements of income, equity, and cash flows, for each of the three years in the period ended
December 31, 2018
, and the related notes and the schedules listed in the Index at Item 15 (collectively referred to as the “financial statements”). In our opinion, the financial statements present fairly, in all material respects, the financial position of the Company as of
December 31, 2018
and
2017
, and the results of its operations and its cash flows for each of the three years in the period ended
December 31, 2018
, in conformity with accounting principles generally accepted in the United States of America.
We have also audited, in accordance with the standards of the Public Company Accounting Oversight Board (United States) (PCAOB), the Company’s internal control over financial reporting as of
December 31, 2018
, based on criteria established in
Internal Control - Integrated Framework (2013)
issued by the Committee of Sponsoring Organizations of the Treadway Commission and our report dated
February 22, 2019
, expressed an unqualified opinion on the Company’s internal control over financial reporting.
Change in Accounting Principle
As discussed in Note 1(n) to the financial statements, the Company has changed the presentation of certain cash receipts and payments related to its sales of accounts receivable program in the consolidated statements of cash flows due to adoption of Financial Accounting Standards Board Accounting Standards Update 2016-15,
Classification of Certain Cash Receipts and Cash Payments
. The Company has retrospectively applied the impacts of this new accounting principle to all periods presented in the accompanying financial statements.
Basis for Opinion
These financial statements are the responsibility of the Company’s management. Our responsibility is to express an opinion on the Company’s financial statements based on our audits. We are a public accounting firm registered with the PCAOB and are required to be independent with respect to the Company in accordance with the U.S. federal securities laws and the applicable rules and regulations of the Securities and Exchange Commission and the PCAOB.
We conducted our audits in accordance with the standards of the PCAOB. Those standards require that we plan and perform the audit to obtain reasonable assurance about whether the financial statements are free of material misstatement, whether due to error or fraud. Our audits included performing procedures to assess the risks of material misstatement of the financial statements, whether due to error or fraud, and performing procedures that respond to those risks. Such procedures included examining, on a test basis, evidence regarding the amounts and disclosures in the financial statements. Our audits also included evaluating the accounting principles used and significant estimates made by management, as well as evaluating the overall presentation of the financial statements. We believe that our audits provide a reasonable basis for our opinion.
/s/ DELOITTE & TOUCHE LLP
DELOITTE & TOUCHE LLP
Milwaukee, Wisconsin
February 22, 2019
We have served as the Company’s auditor since 2002.
|
45
|
||
ALLIANT ENERGY CORPORATION
CONSOLIDATED STATEMENTS OF INCOME
|
Year Ended December 31,
|
|||||||||||
|
2018
|
2017
|
2016
|
|||||||||
|
(in millions, except per share amounts)
|
|||||||||||
|
Revenues:
|
|||||||||||
|
Electric utility
|
|
$3,000.3
|
|
|
$2,894.7
|
|
|
$2,875.5
|
|
||
|
Gas utility
|
446.6
|
|
400.9
|
|
355.4
|
|
|||||
|
Other utility
|
48.0
|
|
47.5
|
|
48.6
|
|
|||||
|
Non-utility
|
39.6
|
|
39.1
|
|
40.5
|
|
|||||
|
Total revenues
|
3,534.5
|
|
3,382.2
|
|
3,320.0
|
|
|||||
|
Operating expenses:
|
|||||||||||
|
Electric production fuel and purchased power
|
855.0
|
|
818.1
|
|
854.0
|
|
|||||
|
Electric transmission service
|
495.7
|
|
480.9
|
|
527.9
|
|
|||||
|
Cost of gas sold
|
232.3
|
|
211.4
|
|
194.3
|
|
|||||
|
Asset valuation charges for Franklin County wind farm
|
—
|
|
—
|
|
86.4
|
|
|||||
|
Other operation and maintenance
|
645.8
|
|
633.2
|
|
589.4
|
|
|||||
|
Depreciation and amortization
|
506.9
|
|
461.8
|
|
411.6
|
|
|||||
|
Taxes other than income taxes
|
104.4
|
|
105.6
|
|
102.3
|
|
|||||
|
Total operating expenses
|
2,840.1
|
|
2,711.0
|
|
2,765.9
|
|
|||||
|
Operating income
|
694.4
|
|
671.2
|
|
554.1
|
|
|||||
|
Other (income) and deductions:
|
|||||||||||
|
Interest expense
|
247.0
|
|
215.6
|
|
196.2
|
|
|||||
|
Equity income from unconsolidated investments, net
|
(54.6
|
)
|
(44.8
|
)
|
(39.6
|
)
|
|||||
|
Allowance for funds used during construction
|
(75.6
|
)
|
(49.7
|
)
|
(62.5
|
)
|
|||||
|
Other
|
7.6
|
|
17.3
|
|
16.6
|
|
|||||
|
Total other (income) and deductions
|
124.4
|
|
138.4
|
|
110.7
|
|
|||||
|
Income from continuing operations before income taxes
|
570.0
|
|
532.8
|
|
443.4
|
|
|||||
|
Income taxes
|
47.7
|
|
66.7
|
|
59.4
|
|
|||||
|
Income from continuing operations, net of tax
|
522.3
|
|
466.1
|
|
384.0
|
|
|||||
|
Income (loss) from discontinued operations, net of tax
|
—
|
|
1.4
|
|
(2.3
|
)
|
|||||
|
Net income
|
522.3
|
|
467.5
|
|
381.7
|
|
|||||
|
Preferred dividend requirements of Interstate Power and Light Company
|
10.2
|
|
10.2
|
|
10.2
|
|
|||||
|
Net income attributable to Alliant Energy common shareowners
|
|
$512.1
|
|
|
$457.3
|
|
|
$371.5
|
|
||
|
Weighted average number of common shares outstanding (basic and diluted)
|
233.6
|
|
229.7
|
|
227.1
|
|
|||||
|
Earnings per weighted average common share attributable to Alliant Energy common shareowners (basic and diluted):
|
|||||||||||
|
Income from continuing operations, net of tax
|
|
$2.19
|
|
|
$1.99
|
|
|
$1.65
|
|
||
|
Loss from discontinued operations, net of tax
|
—
|
|
—
|
|
(0.01
|
)
|
|||||
|
Net income
|
|
$2.19
|
|
|
$1.99
|
|
|
$1.64
|
|
||
|
Amounts attributable to Alliant Energy common shareowners:
|
|||||||||||
|
Income from continuing operations, net of tax
|
|
$512.1
|
|
|
$455.9
|
|
|
$373.8
|
|
||
|
Income (loss) from discontinued operations, net of tax
|
—
|
|
1.4
|
|
(2.3
|
)
|
|||||
|
Net income
|
|
$512.1
|
|
|
$457.3
|
|
|
$371.5
|
|
||
Refer to accompanying Combined Notes to Consolidated Financial Statements.
|
46
|
||
ALLIANT ENERGY CORPORATION
CONSOLIDATED BALANCE SHEETS
|
December 31,
|
|||||||
|
2018
|
2017
|
||||||
|
(in millions, except per
share and share amounts)
|
|||||||
|
ASSETS
|
|||||||
|
Current assets:
|
|||||||
|
Cash and cash equivalents
|
|
$20.9
|
|
|
$27.9
|
|
|
|
Accounts receivable, less allowance for doubtful accounts
|
350.4
|
|
482.8
|
|
|||
|
Production fuel, at weighted average cost
|
61.4
|
|
72.3
|
|
|||
|
Gas stored underground, at weighted average cost
|
49.0
|
|
44.5
|
|
|||
|
Materials and supplies, at weighted average cost
|
101.4
|
|
105.6
|
|
|||
|
Regulatory assets
|
79.8
|
|
84.3
|
|
|||
|
Prepaid gross receipts tax
|
42.2
|
|
41.3
|
|
|||
|
Other
|
80.0
|
|
46.4
|
|
|||
|
Total current assets
|
785.1
|
|
905.1
|
|
|||
|
Property, plant and equipment, net
|
12,462.4
|
|
11,234.5
|
|
|||
|
Investments:
|
|||||||
|
ATC Holdings
|
293.6
|
|
274.2
|
|
|||
|
Other
|
137.7
|
|
121.9
|
|
|||
|
Total investments
|
431.3
|
|
396.1
|
|
|||
|
Other assets:
|
|||||||
|
Regulatory assets
|
1,657.5
|
|
1,582.4
|
|
|||
|
Deferred charges and other
|
89.7
|
|
69.7
|
|
|||
|
Total other assets
|
1,747.2
|
|
1,652.1
|
|
|||
|
Total assets
|
|
$15,426.0
|
|
|
$14,187.8
|
|
|
|
LIABILITIES AND EQUITY
|
|||||||
|
Current liabilities:
|
|||||||
|
Current maturities of long-term debt
|
|
$256.5
|
|
|
$855.7
|
|
|
|
Commercial paper
|
441.2
|
|
320.2
|
|
|||
|
Other short-term borrowings
|
—
|
|
95.0
|
|
|||
|
Accounts payable
|
543.3
|
|
477.3
|
|
|||
|
Regulatory liabilities
|
142.7
|
|
140.0
|
|
|||
|
Other
|
260.4
|
|
260.8
|
|
|||
|
Total current liabilities
|
1,644.1
|
|
2,149.0
|
|
|||
|
Long-term debt, net (excluding current portion)
|
5,246.3
|
|
4,010.6
|
|
|||
|
Other liabilities:
|
|||||||
|
Deferred tax liabilities
|
1,603.1
|
|
1,478.4
|
|
|||
|
Regulatory liabilities
|
1,350.5
|
|
1,357.2
|
|
|||
|
Pension and other benefit obligations
|
509.1
|
|
504.0
|
|
|||
|
Other
|
287.2
|
|
306.4
|
|
|||
|
Total other liabilities
|
3,749.9
|
|
3,646.0
|
|
|||
|
Commitments and contingencies (
Note 17
)
|
|
|
|||||
|
Equity:
|
|||||||
|
Alliant Energy Corporation common equity:
|
|||||||
|
Common stock - $0.01 par value - 480,000,000 shares authorized; 236,063,279 and 231,348,646 shares outstanding
|
2.4
|
|
2.3
|
|
|||
|
Additional paid-in capital
|
2,045.5
|
|
1,845.5
|
|
|||
|
Retained earnings
|
2,545.9
|
|
2,346.0
|
|
|||
|
Accumulated other comprehensive income (loss)
|
1.7
|
|
(0.5
|
)
|
|||
|
Shares in deferred compensation trust - 384,580 and 463,365 shares at a weighted average cost of $25.60 and $23.91 per share
|
(9.8
|
)
|
(11.1
|
)
|
|||
|
Total Alliant Energy Corporation common equity
|
4,585.7
|
|
4,182.2
|
|
|||
|
Cumulative preferred stock of Interstate Power and Light Company
|
200.0
|
|
200.0
|
|
|||
|
Total equity
|
4,785.7
|
|
4,382.2
|
|
|||
|
Total liabilities and equity
|
|
$15,426.0
|
|
|
$14,187.8
|
|
|
Refer to accompanying Combined Notes to Consolidated Financial Statements.
|
47
|
||
ALLIANT ENERGY CORPORATION
CONSOLIDATED STATEMENTS OF CASH FLOWS
|
Year Ended December 31,
|
|||||||||||
|
2018
|
2017
|
2016
|
|||||||||
|
(in millions)
|
|||||||||||
|
Cash flows from operating activities:
|
|||||||||||
|
Net income
|
|
$522.3
|
|
|
$467.5
|
|
|
$381.7
|
|
||
|
Adjustments to reconcile net income to net cash flows from operating activities:
|
|||||||||||
|
Depreciation and amortization
|
506.9
|
|
461.8
|
|
411.6
|
|
|||||
|
Other amortizations
|
10.6
|
|
21.7
|
|
(4.8
|
)
|
|||||
|
Deferred tax expense and tax credits
|
67.0
|
|
139.6
|
|
84.6
|
|
|||||
|
Equity income from unconsolidated investments, net
|
(54.6
|
)
|
(44.8
|
)
|
(39.6
|
)
|
|||||
|
Distributions from equity method investments
|
43.9
|
|
38.1
|
|
28.3
|
|
|||||
|
Equity component of allowance for funds used during construction
|
(51.4
|
)
|
(33.6
|
)
|
(42.3
|
)
|
|||||
|
Asset valuation charges for Franklin County wind farm
|
—
|
|
—
|
|
86.4
|
|
|||||
|
Other
|
7.8
|
|
6.7
|
|
0.8
|
|
|||||
|
Other changes in assets and liabilities:
|
|||||||||||
|
Accounts receivable
|
(475.4
|
)
|
(441.2
|
)
|
(572.2
|
)
|
|||||
|
Regulatory assets
|
(16.2
|
)
|
(130.8
|
)
|
(3.6
|
)
|
|||||
|
Regulatory liabilities
|
1.3
|
|
(83.8
|
)
|
(63.0
|
)
|
|||||
|
Deferred income taxes
|
55.9
|
|
81.7
|
|
102.4
|
|
|||||
|
Other
|
(90.4
|
)
|
38.7
|
|
22.5
|
|
|||||
|
Net cash flows from operating activities
|
527.7
|
|
521.6
|
|
392.8
|
|
|||||
|
Cash flows used for investing activities:
|
|||||||||||
|
Construction and acquisition expenditures:
|
|||||||||||
|
Utility business
|
(1,568.3
|
)
|
(1,281.8
|
)
|
(1,131.2
|
)
|
|||||
|
Other
|
(65.6
|
)
|
(185.1
|
)
|
(65.6
|
)
|
|||||
|
Cash receipts on sold receivables
|
605.3
|
|
461.8
|
|
466.8
|
|
|||||
|
Other
|
(38.2
|
)
|
(28.3
|
)
|
9.8
|
|
|||||
|
Net cash flows used for investing activities
|
(1,066.8
|
)
|
(1,033.4
|
)
|
(720.2
|
)
|
|||||
|
Cash flows from financing activities:
|
|||||||||||
|
Common stock dividends
|
(312.2
|
)
|
(288.3
|
)
|
(266.5
|
)
|
|||||
|
Proceeds from issuance of common stock, net
|
196.6
|
|
149.6
|
|
26.6
|
|
|||||
|
Proceeds from issuance of long-term debt
|
1,500.0
|
|
550.0
|
|
800.0
|
|
|||||
|
Payments to retire long-term debt
|
(855.7
|
)
|
(4.6
|
)
|
(313.4
|
)
|
|||||
|
Net change in commercial paper and other short-term borrowings
|
26.0
|
|
171.1
|
|
84.3
|
|
|||||
|
Other
|
(24.0
|
)
|
(45.2
|
)
|
(1.7
|
)
|
|||||
|
Net cash flows from financing activities
|
530.7
|
|
532.6
|
|
329.3
|
|
|||||
|
Net increase (decrease) in cash, cash equivalents and restricted cash
|
(8.4
|
)
|
20.8
|
|
1.9
|
|
|||||
|
Cash, cash equivalents and restricted cash at beginning of period
|
33.9
|
|
13.1
|
|
11.2
|
|
|||||
|
Cash, cash equivalents and restricted cash at end of period
|
|
$25.5
|
|
|
$33.9
|
|
|
$13.1
|
|
||
|
Supplemental cash flows information:
|
|||||||||||
|
Cash paid during the period for:
|
|||||||||||
|
Interest, net of capitalized interest
|
|
($247.5
|
)
|
|
($212.6
|
)
|
|
($192.4
|
)
|
||
|
Income taxes, net
|
|
($5.0
|
)
|
|
($11.3
|
)
|
|
($9.8
|
)
|
||
|
Significant non-cash investing and financing activities:
|
|||||||||||
|
Accrued capital expenditures
|
|
$299.5
|
|
|
$196.5
|
|
|
$154.4
|
|
||
|
Beneficial interest obtained in exchange for securitized accounts receivable
|
|
$119.4
|
|
|
$222.1
|
|
|
$211.1
|
|
||
Refer to accompanying Combined Notes to Consolidated Financial Statements.
|
48
|
||
ALLIANT ENERGY CORPORATION
CONSOLIDATED STATEMENTS OF EQUITY
|
Total Alliant Energy Common Equity
|
|||||||||||||||||||||||||||
|
Accumulated
|
Shares in
|
Cumulative
|
|||||||||||||||||||||||||
|
Additional
|
Other
|
Deferred
|
Preferred
|
||||||||||||||||||||||||
|
Common
|
Paid-In
|
Retained
|
Comprehensive
|
Compensation
|
Stock
|
Total
|
|||||||||||||||||||||
|
Stock
|
Capital
|
Earnings
|
Income (Loss)
|
Trust
|
of IPL
|
Equity
|
|||||||||||||||||||||
|
(in millions)
|
|||||||||||||||||||||||||||
|
2016:
|
|||||||||||||||||||||||||||
|
Beginning balance
|
|
$2.3
|
|
|
$1,661.8
|
|
|
$2,068.9
|
|
|
($0.4
|
)
|
|
($8.5
|
)
|
|
$200.0
|
|
|
$3,924.1
|
|
||||||
|
Net income attributable to Alliant Energy common shareowners
|
371.5
|
|
371.5
|
|
|||||||||||||||||||||||
|
Common stock dividends ($1.175 per share)
|
(266.5
|
)
|
(266.5
|
)
|
|||||||||||||||||||||||
|
Common stock issued, net
|
|
|
26.6
|
|
26.6
|
|
|||||||||||||||||||||
|
Other
|
4.7
|
|
3.1
|
|
(1.5
|
)
|
6.3
|
|
|||||||||||||||||||
|
Ending balance
|
2.3
|
|
1,693.1
|
|
2,177.0
|
|
(0.4
|
)
|
(10.0
|
)
|
200.0
|
|
4,062.0
|
|
|||||||||||||
|
2017:
|
|||||||||||||||||||||||||||
|
Net income attributable to Alliant Energy common shareowners
|
457.3
|
|
457.3
|
|
|||||||||||||||||||||||
|
Common stock dividends ($1.26 per share)
|
(288.3
|
)
|
(288.3
|
)
|
|||||||||||||||||||||||
|
Common stock issued, net
|
149.6
|
|
149.6
|
|
|||||||||||||||||||||||
|
Other
|
2.8
|
|
|
(1.1
|
)
|
1.7
|
|
||||||||||||||||||||
|
Other comprehensive loss, net of tax
|
(0.1
|
)
|
(0.1
|
)
|
|||||||||||||||||||||||
|
Ending balance
|
2.3
|
|
1,845.5
|
|
2,346.0
|
|
(0.5
|
)
|
(11.1
|
)
|
200.0
|
|
4,382.2
|
|
|||||||||||||
|
2018:
|
|||||||||||||||||||||||||||
|
Net income attributable to Alliant Energy common shareowners
|
512.1
|
|
512.1
|
|
|||||||||||||||||||||||
|
Common stock dividends ($1.34 per share)
|
(312.2
|
)
|
(312.2
|
)
|
|||||||||||||||||||||||
|
Common stock issued, net
|
0.1
|
|
196.5
|
|
196.6
|
|
|||||||||||||||||||||
|
Other
|
3.5
|
|
|
1.3
|
|
4.8
|
|
||||||||||||||||||||
|
Other comprehensive income, net of tax
|
2.2
|
|
2.2
|
|
|||||||||||||||||||||||
|
Ending balance
|
|
$2.4
|
|
|
$2,045.5
|
|
|
$2,545.9
|
|
|
$1.7
|
|
|
($9.8
|
)
|
|
$200.0
|
|
|
$4,785.7
|
|
||||||
Refer to accompanying Combined Notes to Consolidated Financial Statements.
|
49
|
||
REPORT OF INDEPENDENT REGISTERED PUBLIC ACCOUNTING FIRM
To the Shareowners and the Board of Directors of Interstate Power and Light Company:
Opinion on the Financial Statements
We have audited the accompanying consolidated balance sheets of Interstate Power and Light Company and subsidiary (the “Company”) as of
December 31, 2018
and
2017
, the related consolidated statements of income, equity, and cash flows, for each of the three years in the period ended
December 31, 2018
, and the related notes and the schedule listed in the Index at Item 15 (collectively referred to as the “financial statements”). In our opinion, the financial statements present fairly, in all material respects, the financial position of the Company as of
December 31, 2018
and
2017
, and the results of its operations and its cash flows for each of the three years in the period ended
December 31, 2018
, in conformity with accounting principles generally accepted in the United States of America.
Change in Accounting Principle
As discussed in Note 1(n) to the financial statements, the Company has changed the presentation of certain cash receipts and payments related to its sales of accounts receivable program in the consolidated statements of cash flows due to adoption of Financial Accounting Standards Board Accounting Standards Update 2016-15,
Classification of Certain Cash Receipts and Cash Payments
. The Company has retrospectively applied the impacts of this new accounting principle to all periods presented in the accompanying financial statements.
Basis for Opinion
These financial statements are the responsibility of the Company’s management. Our responsibility is to express an opinion on the Company’s financial statements based on our audits. We are a public accounting firm registered with the Public Company Accounting Oversight Board (United States) (PCAOB) and are required to be independent with respect to the Company in accordance with the U.S. federal securities laws and the applicable rules and regulations of the Securities and Exchange Commission and the PCAOB.
We conducted our audits in accordance with the standards of the PCAOB. Those standards require that we plan and perform the audit to obtain reasonable assurance about whether the financial statements are free of material misstatement, whether due to error or fraud. The Company is not required to have, nor were we engaged to perform, an audit of its internal control over financial reporting. As part of our audits, we are required to obtain an understanding of internal control over financial reporting but not for the purpose of expressing an opinion on the effectiveness of the Company’s internal control over financial reporting. Accordingly, we express no such opinion.
Our audits included performing procedures to assess the risks of material misstatement of the financial statements, whether due to error or fraud, and performing procedures that respond to those risks. Such procedures included examining, on a test basis, evidence regarding the amounts and disclosures in the financial statements. Our audits also included evaluating the accounting principles used and significant estimates made by management, as well as evaluating the overall presentation of the financial statements. We believe that our audits provide a reasonable basis for our opinion.
/s/ DELOITTE & TOUCHE LLP
DELOITTE & TOUCHE LLP
Milwaukee, Wisconsin
February 22, 2019
We have served as the Company’s auditor since 2002.
|
50
|
||
INTERSTATE POWER AND LIGHT COMPANY
CONSOLIDATED STATEMENTS OF INCOME
|
Year Ended December 31,
|
|||||||||||
|
2018
|
2017
|
2016
|
|||||||||
|
(in millions)
|
|||||||||||
|
Revenues:
|
|||||||||||
|
Electric utility
|
|
$1,731.1
|
|
|
$1,598.9
|
|
|
$1,569.7
|
|
||
|
Gas utility
|
266.2
|
|
226.0
|
|
204.0
|
|
|||||
|
Steam and other
|
45.0
|
|
45.4
|
|
46.7
|
|
|||||
|
Total revenues
|
2,042.3
|
|
1,870.3
|
|
1,820.4
|
|
|||||
|
Operating expenses:
|
|||||||||||
|
Electric production fuel and purchased power
|
469.0
|
|
443.6
|
|
430.5
|
|
|||||
|
Electric transmission service
|
352.9
|
|
310.4
|
|
359.7
|
|
|||||
|
Cost of gas sold
|
129.6
|
|
115.6
|
|
111.0
|
|
|||||
|
Other operation and maintenance
|
402.6
|
|
396.6
|
|
376.9
|
|
|||||
|
Depreciation and amortization
|
283.5
|
|
245.0
|
|
210.8
|
|
|||||
|
Taxes other than income taxes
|
53.9
|
|
55.0
|
|
53.9
|
|
|||||
|
Total operating expenses
|
1,691.5
|
|
1,566.2
|
|
1,542.8
|
|
|||||
|
Operating income
|
350.8
|
|
304.1
|
|
277.6
|
|
|||||
|
Other (income) and deductions:
|
|||||||||||
|
Interest expense
|
119.4
|
|
112.4
|
|
103.2
|
|
|||||
|
Allowance for funds used during construction
|
(42.2
|
)
|
(31.4
|
)
|
(52.0
|
)
|
|||||
|
Other
|
2.6
|
|
7.0
|
|
6.5
|
|
|||||
|
Total other (income) and deductions
|
79.8
|
|
88.0
|
|
57.7
|
|
|||||
|
Income before income taxes
|
271.0
|
|
216.1
|
|
219.9
|
|
|||||
|
Income tax benefit
|
(3.2
|
)
|
(10.9
|
)
|
(5.9
|
)
|
|||||
|
Net income
|
274.2
|
|
227.0
|
|
225.8
|
|
|||||
|
Preferred dividend requirements
|
10.2
|
|
10.2
|
|
10.2
|
|
|||||
|
Earnings available for common stock
|
|
$264.0
|
|
|
$216.8
|
|
|
$215.6
|
|
||
Earnings per share data is not disclosed given Alliant Energy Corporation is the sole shareowner of all shares of IPL’s common stock outstanding during the periods presented.
Refer to accompanying Combined Notes to Consolidated Financial Statements.
|
51
|
||
INTERSTATE POWER AND LIGHT COMPANY
CONSOLIDATED BALANCE SHEETS
|
December 31,
|
|||||||
|
2018
|
2017
|
||||||
|
(in millions, except per
share and share amounts)
|
|||||||
|
ASSETS
|
|||||||
|
Current assets:
|
|||||||
|
Cash and cash equivalents
|
|
$9.7
|
|
|
$3.6
|
|
|
|
Accounts receivable, less allowance for doubtful accounts
|
153.5
|
|
264.9
|
|
|||
|
Production fuel, at weighted average cost
|
44.8
|
|
52.4
|
|
|||
|
Gas stored underground, at weighted average cost
|
26.1
|
|
20.3
|
|
|||
|
Materials and supplies, at weighted average cost
|
55.4
|
|
60.6
|
|
|||
|
Regulatory assets
|
39.2
|
|
41.9
|
|
|||
|
Other
|
43.1
|
|
32.3
|
|
|||
|
Total current assets
|
371.8
|
|
476.0
|
|
|||
|
Property, plant and equipment, net
|
6,781.5
|
|
5,926.2
|
|
|||
|
Other assets:
|
|||||||
|
Regulatory assets
|
1,239.8
|
|
1,189.7
|
|
|||
|
Deferred charges and other
|
18.3
|
|
14.1
|
|
|||
|
Total other assets
|
1,258.1
|
|
1,203.8
|
|
|||
|
Total assets
|
|
$8,411.4
|
|
|
$7,606.0
|
|
|
|
LIABILITIES AND EQUITY
|
|||||||
|
Current liabilities:
|
|||||||
|
Current maturities of long-term debt
|
|
$—
|
|
|
$350.0
|
|
|
|
Commercial paper
|
50.4
|
|
—
|
|
|||
|
Accounts payable
|
304.9
|
|
220.3
|
|
|||
|
Accounts payable to associated companies
|
28.8
|
|
50.1
|
|
|||
|
Regulatory liabilities
|
90.0
|
|
69.7
|
|
|||
|
Accrued taxes
|
45.8
|
|
47.1
|
|
|||
|
Accrued interest
|
31.2
|
|
32.1
|
|
|||
|
Other
|
56.0
|
|
58.4
|
|
|||
|
Total current liabilities
|
607.1
|
|
827.7
|
|
|||
|
Long-term debt, net (excluding current portion)
|
2,552.3
|
|
2,056.0
|
|
|||
|
Other liabilities:
|
|||||||
|
Deferred tax liabilities
|
957.3
|
|
910.7
|
|
|||
|
Regulatory liabilities
|
664.9
|
|
685.7
|
|
|||
|
Pension and other benefit obligations
|
178.4
|
|
173.8
|
|
|||
|
Other
|
220.7
|
|
242.4
|
|
|||
|
Total other liabilities
|
2,021.3
|
|
2,012.6
|
|
|||
|
Commitments and contingencies (
Note 17
)
|
|
|
|||||
|
Equity:
|
|||||||
|
Interstate Power and Light Company common equity:
|
|||||||
|
Common stock - $2.50 par value - 24,000,000 shares authorized; 13,370,788 shares outstanding
|
33.4
|
|
33.4
|
|
|||
|
Additional paid-in capital
|
2,222.8
|
|
1,797.8
|
|
|||
|
Retained earnings
|
774.5
|
|
678.5
|
|
|||
|
Total Interstate Power and Light Company common equity
|
3,030.7
|
|
2,509.7
|
|
|||
|
Cumulative preferred stock
|
200.0
|
|
200.0
|
|
|||
|
Total equity
|
3,230.7
|
|
2,709.7
|
|
|||
|
Total liabilities and equity
|
|
$8,411.4
|
|
|
$7,606.0
|
|
|
Refer to accompanying Combined Notes to Consolidated Financial Statements.
|
52
|
||
INTERSTATE POWER AND LIGHT COMPANY
CONSOLIDATED STATEMENTS OF CASH FLOWS
|
Year Ended December 31,
|
|||||||||||
|
2018
|
2017
|
2016
|
|||||||||
|
(in millions)
|
|||||||||||
|
Cash flows used for operating activities:
|
|||||||||||
|
Net income
|
|
$274.2
|
|
|
$227.0
|
|
|
$225.8
|
|
||
|
Adjustments to reconcile net income to net cash flows used for operating activities:
|
|||||||||||
|
Depreciation and amortization
|
283.5
|
|
245.0
|
|
210.8
|
|
|||||
|
Deferred tax expense and tax credits
|
2.2
|
|
55.8
|
|
35.6
|
|
|||||
|
Equity component of allowance for funds used during construction
|
(28.6
|
)
|
(21.1
|
)
|
(35.2
|
)
|
|||||
|
Other
|
3.6
|
|
1.5
|
|
2.9
|
|
|||||
|
Other changes in assets and liabilities:
|
|||||||||||
|
Accounts receivable
|
(494.0
|
)
|
(478.7
|
)
|
(510.5
|
)
|
|||||
|
Regulatory assets
|
(20.2
|
)
|
(126.2
|
)
|
(54.7
|
)
|
|||||
|
Accounts payable
|
(24.9
|
)
|
24.0
|
|
8.0
|
|
|||||
|
Regulatory liabilities
|
0.6
|
|
(71.2
|
)
|
(67.3
|
)
|
|||||
|
Deferred income taxes
|
43.8
|
|
103.7
|
|
97.7
|
|
|||||
|
Other
|
(45.2
|
)
|
18.4
|
|
(18.0
|
)
|
|||||
|
Net cash flows used for operating activities
|
(5.0
|
)
|
(21.8
|
)
|
(104.9
|
)
|
|||||
|
Cash flows used for investing activities:
|
|||||||||||
|
Construction and acquisition expenditures
|
(990.7
|
)
|
(676.0
|
)
|
(689.7
|
)
|
|||||
|
Cash receipts on sold receivables
|
605.3
|
|
461.8
|
|
466.8
|
|
|||||
|
Other
|
(44.0
|
)
|
(27.7
|
)
|
(5.7
|
)
|
|||||
|
Net cash flows used for investing activities
|
(429.4
|
)
|
(241.9
|
)
|
(228.6
|
)
|
|||||
|
Cash flows from financing activities:
|
|||||||||||
|
Common stock dividends
|
(168.0
|
)
|
(156.1
|
)
|
(151.9
|
)
|
|||||
|
Capital contributions from parent
|
425.0
|
|
200.0
|
|
190.0
|
|
|||||
|
Proceeds from issuance of long-term debt
|
500.0
|
|
250.0
|
|
300.0
|
|
|||||
|
Payments to retire long-term debt
|
(350.0
|
)
|
—
|
|
—
|
|
|||||
|
Net change in commercial paper
|
50.4
|
|
—
|
|
—
|
|
|||||
|
Other
|
(17.8
|
)
|
(27.2
|
)
|
(7.6
|
)
|
|||||
|
Net cash flows from financing activities
|
439.6
|
|
266.7
|
|
330.5
|
|
|||||
|
Net increase (decrease) in cash, cash equivalents and restricted cash
|
5.2
|
|
3.0
|
|
(3.0
|
)
|
|||||
|
Cash, cash equivalents and restricted cash at beginning of period
|
7.2
|
|
4.2
|
|
7.2
|
|
|||||
|
Cash, cash equivalents and restricted cash at end of period
|
|
$12.4
|
|
|
$7.2
|
|
|
$4.2
|
|
||
|
Supplemental cash flows information:
|
|||||||||||
|
Cash (paid) refunded during the period for:
|
|||||||||||
|
Interest
|
|
($120.3
|
)
|
|
($111.8
|
)
|
|
($99.7
|
)
|
||
|
Income taxes, net
|
|
($23.8
|
)
|
|
$8.6
|
|
|
($11.1
|
)
|
||
|
Significant non-cash investing and financing activities:
|
|||||||||||
|
Accrued capital expenditures
|
|
$186.6
|
|
|
$76.4
|
|
|
$53.8
|
|
||
|
Beneficial interest obtained in exchange for securitized accounts receivable
|
|
$119.4
|
|
|
$222.1
|
|
|
$211.1
|
|
||
Refer to accompanying Combined Notes to Consolidated Financial Statements.
|
53
|
||
INTERSTATE POWER AND LIGHT COMPANY
CONSOLIDATED STATEMENTS OF EQUITY
|
Total IPL Common Equity
|
|||||||||||||||||||
|
Additional
|
Cumulative
|
||||||||||||||||||
|
Common
|
Paid-In
|
Retained
|
Preferred
|
Total
|
|||||||||||||||
|
Stock
|
Capital
|
Earnings
|
Stock
|
Equity
|
|||||||||||||||
|
(in millions)
|
|||||||||||||||||||
|
2016:
|
|||||||||||||||||||
|
Beginning balance
|
|
$33.4
|
|
|
$1,407.8
|
|
|
$554.1
|
|
|
$200.0
|
|
|
$2,195.3
|
|
||||
|
Earnings available for common stock
|
215.6
|
|
215.6
|
|
|||||||||||||||
|
Common stock dividends
|
(151.9
|
)
|
(151.9
|
)
|
|||||||||||||||
|
Capital contribution from parent
|
190.0
|
|
190.0
|
|
|||||||||||||||
|
Ending balance
|
33.4
|
|
1,597.8
|
|
617.8
|
|
200.0
|
|
2,449.0
|
|
|||||||||
|
2017:
|
|||||||||||||||||||
|
Earnings available for common stock
|
216.8
|
|
216.8
|
|
|||||||||||||||
|
Common stock dividends
|
(156.1
|
)
|
(156.1
|
)
|
|||||||||||||||
|
Capital contribution from parent
|
200.0
|
|
200.0
|
|
|||||||||||||||
|
Ending balance
|
33.4
|
|
1,797.8
|
|
678.5
|
|
200.0
|
|
2,709.7
|
|
|||||||||
|
2018:
|
|||||||||||||||||||
|
Earnings available for common stock
|
264.0
|
|
264.0
|
|
|||||||||||||||
|
Common stock dividends
|
(168.0
|
)
|
(168.0
|
)
|
|||||||||||||||
|
Capital contribution from parent
|
425.0
|
|
425.0
|
|
|||||||||||||||
|
Ending balance
|
|
$33.4
|
|
|
$2,222.8
|
|
|
$774.5
|
|
|
$200.0
|
|
|
$3,230.7
|
|
||||
Refer to accompanying Combined Notes to Consolidated Financial Statements.
|
54
|
||
REPORT OF INDEPENDENT REGISTERED PUBLIC ACCOUNTING FIRM
To the Shareowner and the Board of Directors of Wisconsin Power and Light Company:
Opinion on the Financial Statements
We have audited the accompanying consolidated balance sheets of Wisconsin Power and Light Company and subsidiary (the “Company”) as of
December 31, 2018
and
2017
, the related consolidated statements of income, equity, and cash flows, for each of the three years in the period ended
December 31, 2018
, and the related notes and the schedule listed in the Index at Item 15 (collectively referred to as the “financial statements”). In our opinion, the financial statements present fairly, in all material respects, the financial position of the Company as of
December 31, 2018
and
2017
, and the results of its operations and its cash flows for each of the three years in the period ended
December 31, 2018
, in conformity with accounting principles generally accepted in the United States of America.
Basis for Opinion
These financial statements are the responsibility of the Company’s management. Our responsibility is to express an opinion on the Company’s financial statements based on our audits. We are a public accounting firm registered with the Public Company Accounting Oversight Board (United States) (PCAOB) and are required to be independent with respect to the Company in accordance with the U.S. federal securities laws and the applicable rules and regulations of the Securities and Exchange Commission and the PCAOB.
We conducted our audits in accordance with the standards of the PCAOB. Those standards require that we plan and perform the audit to obtain reasonable assurance about whether the financial statements are free of material misstatement, whether due to error or fraud. The Company is not required to have, nor were we engaged to perform, an audit of its internal control over financial reporting. As part of our audits, we are required to obtain an understanding of internal control over financial reporting but not for the purpose of expressing an opinion on the effectiveness of the Company’s internal control over financial reporting. Accordingly, we express no such opinion.
Our audits included performing procedures to assess the risks of material misstatement of the financial statements, whether due to error or fraud, and performing procedures that respond to those risks. Such procedures included examining, on a test basis, evidence regarding the amounts and disclosures in the financial statements. Our audits also included evaluating the accounting principles used and significant estimates made by management, as well as evaluating the overall presentation of the financial statements. We believe that our audits provide a reasonable basis for our opinion.
/s/ DELOITTE & TOUCHE LLP
DELOITTE & TOUCHE LLP
Milwaukee, Wisconsin
February 22, 2019
We have served as the Company’s auditor since 2002.
|
55
|
||
WISCONSIN POWER AND LIGHT COMPANY
CONSOLIDATED STATEMENTS OF INCOME
|
Year Ended December 31,
|
|||||||||||
|
2018
|
2017
|
2016
|
|||||||||
|
(in millions)
|
|||||||||||
|
Revenues:
|
|||||||||||
|
Electric utility
|
|
$1,269.2
|
|
|
$1,295.8
|
|
|
$1,305.8
|
|
||
|
Gas utility
|
180.4
|
|
174.9
|
|
151.4
|
|
|||||
|
Other
|
3.0
|
|
2.1
|
|
1.9
|
|
|||||
|
Total revenues
|
1,452.6
|
|
1,472.8
|
|
1,459.1
|
|
|||||
|
Operating expenses:
|
|||||||||||
|
Electric production fuel and purchased power
|
386.0
|
|
374.5
|
|
423.5
|
|
|||||
|
Electric transmission service
|
142.8
|
|
170.5
|
|
168.2
|
|
|||||
|
Cost of gas sold
|
102.7
|
|
95.8
|
|
83.3
|
|
|||||
|
Other operation and maintenance
|
241.6
|
|
238.5
|
|
209.6
|
|
|||||
|
Depreciation and amortization
|
219.4
|
|
212.9
|
|
192.5
|
|
|||||
|
Taxes other than income taxes
|
47.2
|
|
46.9
|
|
44.8
|
|
|||||
|
Total operating expenses
|
1,139.7
|
|
1,139.1
|
|
1,121.9
|
|
|||||
|
Operating income
|
312.9
|
|
333.7
|
|
337.2
|
|
|||||
|
Other (income) and deductions:
|
|||||||||||
|
Interest expense
|
97.8
|
|
93.8
|
|
91.4
|
|
|||||
|
Equity income from unconsolidated investments
|
(0.9
|
)
|
(0.7
|
)
|
(39.8
|
)
|
|||||
|
Allowance for funds used during construction
|
(33.4
|
)
|
(18.3
|
)
|
(10.5
|
)
|
|||||
|
Other
|
5.1
|
|
10.4
|
|
10.0
|
|
|||||
|
Total other (income) and deductions
|
68.6
|
|
85.2
|
|
51.1
|
|
|||||
|
Income before income taxes
|
244.3
|
|
248.5
|
|
286.1
|
|
|||||
|
Income taxes
|
36.2
|
|
61.9
|
|
93.3
|
|
|||||
|
Net income
|
208.1
|
|
186.6
|
|
192.8
|
|
|||||
|
Net income attributable to noncontrolling interest
|
—
|
|
—
|
|
2.4
|
|
|||||
|
Earnings available for common stock
|
|
$208.1
|
|
|
$186.6
|
|
|
$190.4
|
|
||
Earnings per share data is not disclosed given Alliant Energy Corporation is the sole shareowner of all shares of WPL’s common stock outstanding during the periods presented.
Refer to accompanying Combined Notes to Consolidated Financial Statements.
|
56
|
||
WISCONSIN POWER AND LIGHT COMPANY
CONSOLIDATED BALANCE SHEETS
|
December 31,
|
|||||||
|
2018
|
2017
|
||||||
|
(in millions, except per
share and share amounts)
|
|||||||
|
ASSETS
|
|||||||
|
Current assets:
|
|||||||
|
Cash and cash equivalents
|
|
$8.7
|
|
|
$23.1
|
|
|
|
Accounts receivable, less allowance for doubtful accounts
|
190.1
|
|
212.2
|
|
|||
|
Production fuel, at weighted average cost
|
16.6
|
|
19.9
|
|
|||
|
Gas stored underground, at weighted average cost
|
22.9
|
|
24.2
|
|
|||
|
Materials and supplies, at weighted average cost
|
42.9
|
|
42.1
|
|
|||
|
Regulatory assets
|
40.6
|
|
42.4
|
|
|||
|
Prepaid gross receipts tax
|
42.2
|
|
41.3
|
|
|||
|
Other
|
20.6
|
|
13.4
|
|
|||
|
Total current assets
|
384.6
|
|
418.6
|
|
|||
|
Property, plant and equipment, net
|
5,287.3
|
|
4,917.9
|
|
|||
|
Other assets:
|
|||||||
|
Regulatory assets
|
417.7
|
|
392.7
|
|
|||
|
Deferred charges and other
|
62.9
|
|
27.3
|
|
|||
|
Total other assets
|
480.6
|
|
420.0
|
|
|||
|
Total assets
|
|
$6,152.5
|
|
|
$5,756.5
|
|
|
|
LIABILITIES AND EQUITY
|
|||||||
|
Current liabilities:
|
|||||||
|
Current maturities of long-term debt
|
|
$250.0
|
|
|
$—
|
|
|
|
Commercial paper
|
105.5
|
|
25.0
|
|
|||
|
Accounts payable
|
180.9
|
|
201.7
|
|
|||
|
Accounts payable to associated companies
|
31.8
|
|
22.2
|
|
|||
|
Regulatory liabilities
|
52.7
|
|
70.3
|
|
|||
|
Accrued interest
|
25.5
|
|
25.6
|
|
|||
|
Other
|
48.2
|
|
51.4
|
|
|||
|
Total current liabilities
|
694.6
|
|
396.2
|
|
|||
|
Long-term debt, net (excluding current portion)
|
1,584.9
|
|
1,833.4
|
|
|||
|
Other liabilities:
|
|||||||
|
Deferred tax liabilities
|
582.0
|
|
522.4
|
|
|||
|
Regulatory liabilities
|
685.6
|
|
671.5
|
|
|||
|
Capital lease obligations - Sheboygan Falls Energy Facility
|
60.0
|
|
70.2
|
|
|||
|
Pension and other benefit obligations
|
217.7
|
|
213.7
|
|
|||
|
Other
|
178.2
|
|
167.6
|
|
|||
|
Total other liabilities
|
1,723.5
|
|
1,645.4
|
|
|||
|
Commitments and contingencies (
Note 17
)
|
|
|
|||||
|
Equity:
|
|||||||
|
Wisconsin Power and Light Company common equity:
|
|||||||
|
Common stock - $5 par value - 18,000,000 shares authorized; 13,236,601 shares outstanding
|
66.2
|
|
66.2
|
|
|||
|
Additional paid-in capital
|
1,309.0
|
|
1,109.0
|
|
|||
|
Retained earnings
|
774.3
|
|
706.3
|
|
|||
|
Total Wisconsin Power and Light Company common equity
|
2,149.5
|
|
1,881.5
|
|
|||
|
Total liabilities and equity
|
|
$6,152.5
|
|
|
$5,756.5
|
|
|
Refer to accompanying Combined Notes to Consolidated Financial Statements.
|
57
|
||
WISCONSIN POWER AND LIGHT COMPANY
CONSOLIDATED STATEMENTS OF CASH FLOWS
|
Year Ended December 31,
|
|||||||||||
|
2018
|
2017
|
2016
|
|||||||||
|
(in millions)
|
|||||||||||
|
Cash flows from operating activities:
|
|||||||||||
|
Net income
|
|
$208.1
|
|
|
$186.6
|
|
|
$192.8
|
|
||
|
Adjustments to reconcile net income to net cash flows from operating activities:
|
|||||||||||
|
Depreciation and amortization
|
219.4
|
|
212.9
|
|
192.5
|
|
|||||
|
Other amortizations
|
5.8
|
|
17.7
|
|
(8.7
|
)
|
|||||
|
Deferred tax expense and tax credits
|
49.8
|
|
53.9
|
|
114.5
|
|
|||||
|
Other
|
(23.3
|
)
|
(13.3
|
)
|
(17.8
|
)
|
|||||
|
Other changes in assets and liabilities:
|
|||||||||||
|
Accounts receivable
|
19.7
|
|
17.7
|
|
(47.6
|
)
|
|||||
|
Regulatory assets
|
4.0
|
|
(4.7
|
)
|
51.1
|
|
|||||
|
Other
|
(26.5
|
)
|
(5.1
|
)
|
44.6
|
|
|||||
|
Net cash flows from operating activities
|
457.0
|
|
465.7
|
|
521.4
|
|
|||||
|
Cash flows used for investing activities:
|
|||||||||||
|
Construction and acquisition expenditures
|
(577.6
|
)
|
(637.4
|
)
|
(453.0
|
)
|
|||||
|
Other
|
(29.9
|
)
|
(29.9
|
)
|
(25.9
|
)
|
|||||
|
Net cash flows used for investing activities
|
(607.5
|
)
|
(667.3
|
)
|
(478.9
|
)
|
|||||
|
Cash flows from (used for) financing activities:
|
|||||||||||
|
Common stock dividends
|
(140.1
|
)
|
(125.9
|
)
|
(135.0
|
)
|
|||||
|
Capital contribution from parent
|
200.0
|
|
90.0
|
|
60.0
|
|
|||||
|
Proceeds from issuance of long-term debt
|
—
|
|
300.0
|
|
—
|
|
|||||
|
Net change in commercial paper
|
80.5
|
|
(27.3
|
)
|
32.4
|
|
|||||
|
Other
|
(4.9
|
)
|
(17.9
|
)
|
3.9
|
|
|||||
|
Net cash flows from (used for) financing activities
|
135.5
|
|
218.9
|
|
(38.7
|
)
|
|||||
|
Net increase (decrease) in cash, cash equivalents and restricted cash
|
(15.0
|
)
|
17.3
|
|
3.8
|
|
|||||
|
Cash, cash equivalents and restricted cash at beginning of period
|
24.2
|
|
6.9
|
|
3.1
|
|
|||||
|
Cash, cash equivalents and restricted cash at end of period
|
|
$9.2
|
|
|
$24.2
|
|
|
$6.9
|
|
||
|
Supplemental cash flows information:
|
|||||||||||
|
Cash (paid) refunded during the period for:
|
|||||||||||
|
Interest
|
|
($98.1
|
)
|
|
($91.7
|
)
|
|
($91.5
|
)
|
||
|
Income taxes, net
|
|
$14.0
|
|
|
($8.4
|
)
|
|
$27.8
|
|
||
|
Significant non-cash investing and financing activities:
|
|||||||||||
|
Accrued capital expenditures
|
|
$102.5
|
|
|
$114.5
|
|
|
$93.1
|
|
||
|
Transfer of interest in ATC and tax liability to ATI
|
|
$—
|
|
|
$—
|
|
|
($163.6
|
)
|
||
Refer to accompanying Combined Notes to Consolidated Financial Statements.
|
58
|
||
WISCONSIN POWER AND LIGHT COMPANY
CONSOLIDATED STATEMENTS OF EQUITY
|
Total WPL Common Equity
|
|||||||||||||||||||
|
Additional
|
|||||||||||||||||||
|
Common
|
Paid-In
|
Retained
|
Noncontrolling
|
Total
|
|||||||||||||||
|
Stock
|
Capital
|
Earnings
|
Interest
|
Equity
|
|||||||||||||||
|
(in millions)
|
|||||||||||||||||||
|
2016:
|
|||||||||||||||||||
|
Beginning balance
|
|
$66.2
|
|
|
$959.0
|
|
|
$731.1
|
|
|
$11.3
|
|
|
$1,767.6
|
|
||||
|
Net income
|
190.4
|
|
2.4
|
|
192.8
|
|
|||||||||||||
|
Common stock dividends
|
(135.0
|
)
|
(135.0
|
)
|
|||||||||||||||
|
Capital contribution from parent
|
60.0
|
|
60.0
|
|
|||||||||||||||
|
Contributions from noncontrolling interest
|
11.5
|
|
11.5
|
|
|||||||||||||||
|
Distributions to noncontrolling interest
|
(2.5
|
)
|
(2.5
|
)
|
|||||||||||||||
|
Transfer of interest in ATC to ATI
|
(140.9
|
)
|
(22.7
|
)
|
(163.6
|
)
|
|||||||||||||
|
Ending balance
|
66.2
|
|
1,019.0
|
|
645.6
|
|
—
|
|
1,730.8
|
|
|||||||||
|
2017:
|
|||||||||||||||||||
|
Net income
|
186.6
|
|
|
|
186.6
|
|
|||||||||||||
|
Common stock dividends
|
(125.9
|
)
|
(125.9
|
)
|
|||||||||||||||
|
Capital contribution from parent
|
90.0
|
|
90.0
|
|
|||||||||||||||
|
Ending balance
|
66.2
|
|
1,109.0
|
|
706.3
|
|
—
|
|
1,881.5
|
|
|||||||||
|
2018:
|
|||||||||||||||||||
|
Net income
|
208.1
|
|
208.1
|
|
|||||||||||||||
|
Common stock dividends
|
(140.1
|
)
|
(140.1
|
)
|
|||||||||||||||
|
Capital contribution from parent
|
200.0
|
|
200.0
|
|
|||||||||||||||
|
Ending balance
|
|
$66.2
|
|
|
$1,309.0
|
|
|
$774.3
|
|
|
$—
|
|
|
$2,149.5
|
|
||||
Refer to accompanying Combined Notes to Consolidated Financial Statements.
|
59
|
||
ALLIANT ENERGY CORPORATION
INTERSTATE POWER AND LIGHT COMPANY
WISCONSIN POWER AND LIGHT COMPANY
COMBINED NOTES TO CONSOLIDATED FINANCIAL STATEMENTS
NOTE 1. SUMMARY OF SIGNIFICANT ACCOUNTING POLICIES
NOTE 1(a) General -
Description of Business
- Alliant Energy’s financial statements include the accounts of Alliant Energy and its consolidated subsidiaries. Alliant Energy is a Midwest U.S. energy holding company, whose primary wholly-owned subsidiaries are IPL, WPL, AEF and Corporate Services.
IPL’s financial statements include the accounts of IPL and its consolidated subsidiary, IPL SPE LLC, which is used for IPL’s sales of accounts receivable program. IPL is a direct subsidiary of Alliant Energy and is a public utility engaged principally in the generation and distribution of electricity and the distribution and transportation of natural gas to retail customers in select markets in Iowa. IPL also sells electricity to wholesale customers in Minnesota, Illinois and Iowa, and is engaged in the generation and distribution of steam for
two
customers in Cedar Rapids, Iowa.
WPL’s financial statements include the accounts of WPL and its consolidated subsidiary, WPL Transco, which previously held Alliant Energy’s interest in ATC. WPL is a direct subsidiary of Alliant Energy and is a public utility engaged principally in the generation and distribution of electricity and the distribution and transportation of natural gas to retail customers in select markets in Wisconsin. WPL also sells electricity to wholesale customers in Wisconsin.
AEF is comprised of Transportation, ATI, a non-utility wind farm, the Sheboygan Falls Energy Facility and other non-utility holdings. Transportation includes a short-line railway that provides freight service between Cedar Rapids, Iowa and Iowa City, Iowa; barge terminal and hauling services on the Mississippi River; and other transfer and storage services. ATI, a wholly-owned subsidiary of AEF, holds all of Alliant Energy’s interest in ATC Holdings. The non-utility wind farm includes a
50%
cash equity ownership interest in a
225
MW wind farm located in Oklahoma. The Sheboygan Falls Energy Facility is a
347
MW, simple-cycle, natural gas-fired EGU near Sheboygan Falls, Wisconsin, which is leased to WPL for an initial period of
20
years ending in 2025.
Corporate Services is the subsidiary formed to provide administrative services to Alliant Energy and its subsidiaries.
Basis of Presentation
- The financial statements reflect investments in controlled subsidiaries on a consolidated basis and Alliant Energy’s, IPL’s and WPL’s proportionate shares of jointly-owned utility EGUs. Unconsolidated investments, which Alliant Energy and WPL do not control, but have the ability to exercise significant influence over operating and financial policies, are accounted for under the equity method of accounting. Under the equity method of accounting, Alliant Energy and WPL initially record the investment at cost, and adjust the carrying amount of the investment to recognize their respective share of the earnings or losses of the investee. Dividends received from an investee reduce the carrying amount of the equity investment. Investments that do not meet the criteria for consolidation or the equity method of accounting are accounted for under the cost method.
All intercompany balances and transactions, other than certain transactions affecting the rate-making process at IPL and WPL, have been eliminated from the financial statements. Such transactions not eliminated include costs that are recoverable from customers through rate-making processes. The financial statements are prepared in conformity with GAAP, which give recognition to the rate-making practices of FERC and state commissions having regulatory jurisdiction.
Certain prior period amounts in the Financial Statements and Notes have been reclassified to conform to the current period presentation for comparative purposes, including modifications to the presentation of the components of net periodic benefit costs for defined benefit pension and other postretirement plans in the income statements, and restricted cash and cash receipts on sold receivables in the cash flows statements, as discussed in
Note 1(n)
.
Discontinued operations reported in Alliant Energy’s income statements are related to various warranty claims associated with the sale of RMT, Inc. in 2013, which has resulted in operating expenses and income subsequent to the sale. Alliant Energy presents cash flows from continuing operations together with cash flows from discontinued operations in its cash flows statements.
|
60
|
||
Use of Estimates
- The preparation of the financial statements requires management to make estimates and assumptions that affect: (a) the reported amounts of assets and liabilities and the disclosure of contingent assets and liabilities at the date of the financial statements; and (b) the reported amounts of revenues and expenses during the reporting period. Actual results could differ from those estimates.
NOTE 1(b) Regulatory Assets and Regulatory Liabilities -
Alliant Energy, IPL and WPL are subject to regulation by FERC and various state regulatory commissions. As a result, Alliant Energy, IPL and WPL are subject to GAAP provisions for regulated operations, which provide that rate-regulated public utilities record certain costs and credits allowed in the rate-making process in different periods than for non-utility entities. Regulatory assets generally represent incurred costs that have been deferred as such costs are probable of recovery in future customer rates. Regulatory liabilities generally represent obligations to make refunds to customers or amounts collected in rates for which the related costs have not yet been incurred. Amounts recorded as regulatory assets or regulatory liabilities are generally recognized in the income statements at the time they are reflected in rates.
NOTE 1(c) Income Taxes -
The liability method of accounting is followed for deferred taxes, which requires the establishment of deferred tax assets and liabilities, as appropriate, for temporary differences between the tax basis of assets and liabilities and the amounts reported in the financial statements. Deferred taxes are recorded using currently enacted tax rates and estimates of state apportionment. Changes in deferred tax assets and liabilities associated with certain property-related differences at IPL are accounted for differently than other subsidiaries of Alliant Energy due to rate-making practices in Iowa. Rate-making practices in Iowa do not include the impact of certain deferred tax expenses (benefits) in the determination of retail rates. Based on these rate-making practices, deferred tax expense (benefit) related to these property-related differences at IPL is not recorded in the income statement but instead recorded to regulatory assets or regulatory liabilities until these temporary differences reverse. In Wisconsin, the PSCW allows rate recovery of deferred tax expense on all temporary differences.
Investment tax credits are deferred and amortized to income over the average lives of the related property. Federal Tax Reform repealed corporate federal AMT and
allows unutilized AMT credits to be refunded
over four tax years beginning with the U.S. federal tax return for calendar year 2018. Other tax credits reduce income tax expense in the year claimed.
Alliant Energy files a consolidated federal income tax return and a combined return in Wisconsin, which include Alliant Energy and its subsidiaries. Alliant Energy subsidiaries with a presence in Iowa file as part of a consolidated return in Iowa.
Alliant Energy allocates consolidated income tax expense to its subsidiaries that are members of the group that file a consolidated or combined income tax return. IPL and WPL use the modified separate return approach for calculating their income tax provisions and related deferred tax assets and liabilities. IPL and WPL are assumed to file separate tax returns with the federal and state taxing authorities, except that net operating losses (and other current or deferred tax attributes) are characterized as realized (or realizable) by IPL and WPL when those tax attributes are realized (or realizable) by the consolidated tax return group of Alliant Energy (even if IPL and WPL would not otherwise have realized the attributes on a stand-alone basis). The difference in the income taxes recorded for IPL and WPL under the modified separate return method compared to the income taxes recorded on a separate return basis was not material in
2018
,
2017
and
2016
.
NOTE 1(d) Cash, Cash Equivalents and Restricted Cash -
Cash and cash equivalents include short-term liquid investments that have original maturities of less than 90 days. At December 31,
2018
and
2017
, restricted cash primarily related to deposits with trustees and requirements in Sheboygan Power, LLC’s debt agreement.
NOTE 1(e) Property, Plant and Equipment -
Utility Plant
-
General -
Utility plant is recorded at the original cost of acquisition or construction, which includes material, labor, contractor services, AFUDC and allocable overheads, such as supervision, engineering, benefits, certain taxes and transportation. Repairs, replacements and renewals of items of property determined to be less than a unit of property or that do not increase the property’s life or functionality are charged to maintenance expense. Property, plant and equipment that is probable of being retired early is classified as plant anticipated to be retired early. Generally, ordinary retirements of utility plant and salvage value are netted and charged to accumulated depreciation upon removal from utility plant accounts and no gain or loss is recognized consistent with rate-making principles. However, if regulators have approved recovery of the remaining net book value of property, plant and equipment that is retired early, or such approval by regulators is probable, the remaining net book value is reclassified from property, plant and equipment to regulatory assets upon retirement.
|
61
|
||
Depreciation -
IPL and WPL use a combination of remaining life and straight-line depreciation methods as approved by their respective regulatory commissions. The composite or group method of depreciation is used, in which a single depreciation rate is applied to the gross investment in a particular class of property. This method pools similar assets and then depreciates each group as a whole. Periodic depreciation studies are performed to determine the appropriate group lives, net salvage, estimated cost of removal and group depreciation rates. These depreciation studies are subject to review and approval by IPL’s and WPL’s respective regulatory commissions. Depreciation expense is included within the recoverable cost of service component of rates collected from customers. The average rates of depreciation for electric, gas and other properties, consistent with current rate-making practices, were as follows:
|
IPL
|
WPL
|
||||||||||
|
2018
|
2017
|
2016
|
2018
|
2017
|
2016
|
||||||
|
Electric - generation
|
3.6%
|
3.5%
|
3.5%
|
3.6%
|
3.5%
|
3.1%
|
|||||
|
Electric - distribution
|
2.8%
|
2.4%
|
2.4%
|
2.6%
|
2.6%
|
2.6%
|
|||||
|
Electric - other
|
4.7%
|
4.5%
|
4.2%
|
5.7%
|
6.9%
|
4.7%
|
|||||
|
Gas
|
3.2%
|
3.4%
|
3.3%
|
2.5%
|
2.5%
|
2.5%
|
|||||
|
Other
|
5.2%
|
4.0%
|
3.9%
|
5.8%
|
6.0%
|
5.9%
|
|||||
AFUDC -
AFUDC represents costs to finance construction additions, including a return on equity component and cost of debt component as required by regulatory accounting. AFUDC for IPL’s construction projects is calculated in accordance with FERC guidelines. AFUDC for WPL’s retail and wholesale jurisdiction construction projects is calculated in accordance with PSCW and FERC guidelines, respectively. The AFUDC rates, computed in accordance with the prescribed regulatory formula, were as follows:
|
2018
|
2017
|
2016
|
|||
|
IPL (Marshalltown CWIP)
|
N/A
|
7.8%
|
7.9%
|
||
|
IPL (Wind generation CWIP)
|
7.5%
|
7.6%
|
N/A
|
||
|
IPL (other CWIP)
|
7.5%
|
7.6%
|
7.7%
|
||
|
WPL (retail jurisdiction)
|
7.7%
|
7.6%
|
8.2%
|
||
|
WPL (wholesale jurisdiction)
|
7.2%
|
6.0%
|
6.7%
|
||
In accordance with their respective regulatory commission decisions, IPL applies its AFUDC rates to
100%
of applicable CWIP balances and WPL generally applies its AFUDC rates to
50%
of applicable CWIP balances. WPL may apply its AFUDC rates to
100%
of the retail portion of the CWIP balances for construction projects requiring a CA or CPCN that were approved by the PSCW after its most recent rate order, including West Riverside.
Non-utility and Other Property
-
General -
Non-utility property is recorded at the original cost of acquisition or construction, which includes material, labor and contractor services. Repairs, replacements and renewals of items of property determined to be less than a unit of property or that do not increase the property’s life or functionality are charged to maintenance expense. Upon retirement or sale of non-utility property, the original cost and related accumulated depreciation are removed from the accounts and any gain or loss is included in the income statements.
Costs related to software developed or obtained for internal use are capitalized and amortized on a straight-line basis over the estimated useful life of the related software. If software is retired prior to being fully amortized, the remaining book value is recorded as a loss in the income statements.
NOTE 1(f) Revenue Recognition -
Utility
-
Revenues from Alliant Energy’s utility business are primarily from electric and gas sales to customers. Utility revenues are recognized over time as services are rendered or commodities are delivered to customers, and include billed and unbilled components. The billed component is based on the reading of customers’ meters, which occurs on a systematic basis throughout each reporting period and represents the fair value of the services provided or commodities delivered. The unbilled component is estimated and recorded at the end of each reporting period based on estimated amounts of energy delivered to customers since the end of each customer’s last billing period. The unbilled revenue is based on estimates of daily system demand volumes, customer usage by class, temperature impacts, line losses and the most recent customer rates.
IPL and WPL accrue revenues from their wholesale customers to the extent that the actual net revenue requirements calculated in accordance with FERC-approved formula rates for the reporting period are higher or lower than the amounts billed to wholesale customers during such period. Regulatory assets or regulatory liabilities are recorded as the offset for
|
62
|
||
these accrued revenues under formulaic rate-making programs. As of
December 31, 2018
, the related amounts accrued for IPL and WPL were not material.
IPL and WPL participate in bid/offer-based wholesale energy and ancillary services markets operated by MISO. The MISO transactions are grouped together, resulting in a net supply to or net purchase from MISO for each hour of each day. The net supply to MISO is recorded as bulk power sales in “Electric utility revenues” and the net purchase from MISO is recorded in “Electric production fuel and purchased power” in the income statements.
Non-utility
-
Revenues from Alliant Energy’s non-utility businesses are primarily from its Transportation business and are recognized over time as services are rendered to customers.
Taxes Collected from Customers
-
Sales or various other taxes collected by certain of Alliant Energy’s subsidiaries on behalf of other agencies are recorded on a net basis and are not included in revenues.
Other
-
Alliant Energy, IPL and WPL do not disclose the value of unsatisfied performance obligations for: (i) contracts with an original expected length of one year or less; and (ii) contracts for which revenue is recognized at the amount to which they have the right to invoice for services performed.
NOTE 1(g) Utility Cost Recovery Mechanisms -
Electric Production Fuel and Purchased Power (Fuel-related Costs)
-
Fuel-related costs are incurred to generate and purchase electricity to meet the demand of IPL’s and WPL’s electric customers. These fuel-related costs include the cost of fossil fuels (primarily natural gas and coal) used to produce electricity at their EGUs, and electricity purchased from MISO wholesale energy markets and under PPAs. These fuel-related costs are recorded in “Electric production fuel and purchased power” in the income statements.
IPL Retail -
The cost recovery mechanisms for IPL’s retail electric customers provide for monthly adjustments to their electric rates for changes in fuel-related costs. Changes in the under-/over-collection of these costs are recognized in “Electric production fuel and purchased power” in Alliant Energy’s and IPL’s income statements. The cumulative effects of the under-/over-collection of these costs are recorded in regulatory assets or regulatory liabilities on Alliant Energy’s and IPL’s balance sheets until they are reflected in future billings to customers.
WPL Retail -
The cost recovery mechanism for WPL’s retail electric customers is based on forecasts of certain fuel-related costs expected to be incurred during forward-looking test periods and fuel monitoring ranges determined by the PSCW during each retail electric rate proceeding or in a separate fuel cost plan approval proceeding. If WPL’s actual fuel-related costs fall outside these fuel monitoring ranges, WPL is authorized to defer the incremental under-/over-collection of fuel-related costs that are outside the approved ranges. Deferral of under-collections are reduced to the extent actual return on common equity earned by WPL during the fuel cost plan year exceeds the most recently authorized return on common equity. Deferred amounts for fuel-related costs outside the approved fuel monitoring ranges are recognized in “Electric production fuel and purchased power” in Alliant Energy’s and WPL’s income statements. The cumulative effects of these deferred amounts are recorded in regulatory assets or regulatory liabilities on Alliant Energy’s and WPL’s balance sheets until they are reflected in future billings to customers.
IPL and WPL Wholesale -
The cost recovery mechanisms for IPL’s and WPL’s wholesale electric customers provide for subsequent adjustments to their electric rates for changes in fuel-related costs. Changes in the under-/over-collection of these costs are recognized in “Electric production fuel and purchased power” in the income statements. The cumulative effects of the under-/over-collection of these costs are recorded in regulatory assets or regulatory liabilities on the balance sheets until they are reflected in future billings to customers.
Purchased Electric Capacity
-
PPAs help meet the electricity demand of IPL’s and WPL’s customers. Certain of these PPAs include minimum payments for IPL’s and WPL’s rights to electric generating capacity, which are charged each period to “Electric production fuel and purchased power” in the income statements. Purchased electric capacity expenses are recovered from IPL’s and WPL’s retail electric customers through changes in base rates determined during periodic rate proceedings. Purchased electric capacity expenses are recovered from IPL’s and WPL’s wholesale electric customers through annual changes in base rates determined by a formula rate structure.
Electric Transmission Service
-
Costs incurred for the transmission of electricity to meet the demands of IPL’s and WPL’s customers are charged to “Electric transmission service” in the income statements.
|
63
|
||
IPL Retail -
Electric transmission service expense is recovered from IPL’s retail electric customers through a transmission cost rider. This cost recovery mechanism provides for annual adjustments to electric rates charged to retail electric customers for changes in electric transmission service expense. Changes in the under-/over-collection of these costs are recognized in “Electric transmission service” in Alliant Energy’s and IPL’s income statements. The cumulative effects of the under-/over-collection of these costs are recorded in regulatory assets or regulatory liabilities on Alliant Energy’s and IPL’s balance sheets until they are reflected in future billings to customers.
WPL Retail -
Electric transmission service expense is recovered from WPL’s retail electric customers through changes in base rates determined during periodic rate proceedings. Pursuant to escrow accounting treatment approved by the PSCW, the difference between actual electric transmission service expense incurred and the amount of electric transmission service costs collected from customers as electric revenues is recognized in “Electric transmission service” in Alliant Energy’s and WPL’s income statements. An offsetting amount is recorded in regulatory assets or regulatory liabilities on Alliant Energy’s and WPL’s balance sheets until reflected in future billings to customers.
IPL and WPL Wholesale -
IPL and WPL arrange transmission service for the majority of their respective wholesale electric customers. Electric transmission service expense is allocated to and recovered from these customers based on a load ratio share computation.
Cost of Gas Sold
-
Costs are incurred for the purchase, transportation and storage of natural gas to serve IPL’s and WPL’s gas customers and the costs associated with the natural gas delivered to customers are charged to “Cost of gas sold” in the income statements. The tariffs for IPL’s and WPL’s retail gas customers provide for subsequent adjustments to their rates each month for changes in the cost of gas sold. Changes in the under-/over-collection of these costs are also recognized in “Cost of gas sold” in the income statements. The cumulative effects of the under-/over-collection of these costs are recorded in regulatory assets or regulatory liabilities on the balance sheets until they are reflected in future billings to customers.
Energy Efficiency Costs
-
Costs incurred to fund energy efficiency programs and initiatives that help customers reduce their energy usage are charged to “Other operation and maintenance” in the income statements. Energy efficiency costs incurred by IPL are recovered from its retail electric and gas customers through an additional tariff called an energy efficiency cost recovery factor, which is revised annually and includes a reconciliation to eliminate any under-/over-collection of energy efficiency costs from prior periods. Energy efficiency costs incurred by WPL are recovered from retail electric and gas customers through changes in base rates determined during periodic rate proceedings. Reconciliations of any under-/over-collection of energy efficiency costs from prior periods are also addressed in WPL’s periodic rate proceedings. Changes in the under-/over-collection of energy efficiency costs for IPL and WPL are recognized in “Other operation and maintenance” in the income statements. The cumulative effects of the under-/over-collection of these costs for IPL and WPL are recorded in regulatory assets or regulatory liabilities on the balance sheets until they are reflected in future billings to customers.
NOTE 1(h) Financial Instruments -
Financial instruments are periodically used for risk management purposes to mitigate exposures to fluctuations in certain commodity prices and transmission congestion costs. The fair value of those financial instruments that are determined to be derivatives are recorded as assets or liabilities on the balance sheets. Certain commodity purchase and sales contracts qualify for and have been designated under the normal purchase and sale exception and are accounted for on the accrual basis of accounting. Alliant Energy, IPL and WPL have elected to not net the fair value amounts of derivatives subject to a master netting arrangement by counterparty. Alliant Energy, IPL and WPL do not offset fair value amounts recognized for the right to reclaim cash collateral (receivable) or the obligation to return cash collateral (payable) against fair value amounts recognized for derivative instruments that are executed with the same counterparty under the same master netting arrangement. Refer to
Note 2
for discussion of the recognition of regulatory assets and regulatory liabilities related to the unrealized losses and gains on derivative instruments. Refer to Notes
15
,
16
and
17(f)
for further discussion of derivatives and related credit risk.
NOTE 1(i) Asset Impairments -
Property, Plant and Equipment of Regulated Operations
-
Property, plant and equipment of regulated operations are reviewed for possible impairment whenever events or changes in circumstances indicate all or a portion of the carrying value of the assets may be disallowed for rate-making purposes. If IPL or WPL are disallowed recovery of any portion of the carrying value of their regulated property, plant and equipment that is under construction, has been recently completed or is probable of abandonment, or conclude it is probable recovery will be disallowed, an impairment charge is recognized equal to the amount of the carrying value that was disallowed or is probable of being disallowed. If IPL or WPL are only allowed a partial return on the carrying value of their regulated property, plant and equipment that is under construction, has been recently completed or is probable of abandonment, or conclude it is probable a full return will not be allowed, an impairment
|
64
|
||
charge is recognized equal to the difference between the carrying value and the present value of the future revenues expected from their regulated property, plant and equipment.
Property, Plant and Equipment of Non-utility Operations
-
Property, plant and equipment of non-utility operations are reviewed for possible impairment whenever events or changes in circumstances indicate the carrying value of the assets may not be recoverable. Impairment is indicated if the carrying value of an asset exceeds its undiscounted future cash flows. If an impairment is indicated, a charge is recognized equal to the amount the carrying value exceeds the asset’s fair value.
Unconsolidated Equity Investments
-
If events or circumstances indicate the carrying value of investments accounted for under the equity method of accounting exceeds fair value and the decline in value is other than temporary, potential impairment is assessed. If an impairment is indicated, a charge is recognized equal to the amount the carrying value exceeds the investment’s fair value.
NOTE 1(j) Asset Retirement Obligations -
The fair value of a legal obligation associated with the retirement of an asset is recorded as a liability when an asset is placed in service, when a legal obligation is subsequently identified and when sufficient information becomes available to determine a reasonable estimate of the fair value of future retirement costs. When an ARO is recorded as a liability, an equivalent amount is added to the asset cost. The fair value of AROs at inception is determined using discounted cash flows analyses. The liability is accreted to its present value and the capitalized cost is depreciated over the useful life of the related asset. Accretion and depreciation expenses related to AROs for IPL’s and WPL’s regulated operations are recorded to regulatory assets on the balance sheets. Upon regulatory approval to recover IPL’s AROs expenditures, its regulatory assets are amortized to depreciation and amortization expenses in Alliant Energy’s and IPL’s income statements over the same time period the ARO expenditures are recovered from IPL’s customers. WPL’s regulatory assets related to AROs are being recovered as a component of depreciation rates pursuant to PSCW and FERC orders. Accretion and depreciation expenses related to AROs for Alliant Energy’s non-utility operations are recorded to depreciation and amortization expenses in Alliant Energy’s income statements. Upon settlement of the ARO liability, an entity settles the obligation for its recorded amount or incurs a gain or loss. Any gains or losses related to AROs for IPL’s and WPL’s regulated operations are recorded to regulatory liabilities or regulatory assets on the balance sheets.
NOTE 1(k) Debt Issuance and Retirement Costs -
Debt issuance costs and debt premiums or discounts are presented on the balance sheet as a direct adjustment to the carrying amount of the related debt liability, and are deferred and amortized over the expected life of each debt issue, considering maturity dates and, if applicable, redemption rights held by others. Alliant Energy’s non-utility businesses and Corporate Services record to interest expense in the period of retirement any unamortized debt issuance costs and debt premiums or discounts on debt retired early.
NOTE 1(l) Allowance for Doubtful Accounts -
Allowances for doubtful accounts are recorded for estimated losses resulting from the inability of customers to make required payments. Allowances for doubtful accounts are estimated based on historical write-offs, customer arrears and other economic factors within IPL’s and WPL’s service territories.
NOTE 1(m) Variable Interest Entities -
An entity is considered a VIE if its equity investors do not have sufficient equity at risk for the entity to finance its activities without additional subordinated financial support from other parties, the entity is structured with disproportionate voting rights and substantially all of the entity’s activities are conducted on behalf of the investor with disproportionately fewer voting rights, or its equity investors lack any of the following characteristics: (1) power, through voting rights or similar rights, to direct the activities of the entity that most significantly impact the entity’s economic performance; (2) the obligation to absorb expected losses of the entity; or (3) the right to receive expected benefits of the entity. The primary beneficiary of a VIE is required to consolidate the VIE. The financial statements do not reflect any consolidation of VIEs.
NOTE 1(n) New Accounting Standards -
Revenue Recognition
-
In May 2014, the FASB issued an accounting standard providing principles for recognizing revenue for the transfer of promised goods or services to customers with the consideration to which the entity expects to be entitled in exchange for those goods or services. Alliant Energy, IPL and WPL adopted this standard on January 1, 2018 using the modified retrospective method of adoption, which was applied to contracts with customers that were completed subsequent to January 1, 2018. Alliant Energy, IPL and WPL utilized a portfolio approach upon adoption, which involved evaluating portfolios of contracts with similar characteristics, where the effects of applying the standard were not expected to be materially different than evaluating on an individual contract basis. Upon adoption, there were no cumulative effect adjustments made to the January 1, 2018 retained earnings balances. In addition, prior period amounts have not been restated to reflect the adoption of this standard and continue to be reported under the accounting standards in effect for those periods.
|
65
|
||
Alliant Energy, IPL and WPL did not have a material change in revenue recognition, including the timing and pattern of revenue recognition, as a result of the adoption of this standard.
Leases
-
In February 2016, the FASB issued an accounting standard requiring lease assets and lease liabilities, including operating leases, to be recognized on the balance sheet for all leases with terms longer than 12 months. The standard also requires disclosure of key information about leasing arrangements. Alliant Energy, IPL and WPL adopted this standard on January 1, 2019 using an optional transition approach and there was no cumulative effect adjustment to their balance sheets as of January 1, 2019. Alliant Energy, IPL and WPL expect to recognize increases in assets and liabilities for certain operating leases of approximately
$18 million
,
$11 million
and
$7 million
, respectively, on January 1, 2019. After adoption, prior period amounts will continue to be reported under the accounting standards in effect for those periods. Alliant Energy, IPL and WPL do not expect a material change to their results of operations or cash flows statements.
Upon transition to the new standard, Alliant Energy, IPL and WPL elected the land easement transition practical expedient, for which existing land easements that were not previously accounted for as leases under the original accounting standards did not need to be evaluated under the new accounting standard. In addition, Alliant Energy, IPL and WPL evaluated land easements that were previously accounted for as leases and determined that the majority of these land easements relate to joint-use land sites, and do not meet the criteria for leases under the new accounting standard. Therefore, these land easement arrangements are no longer reflected as operating leases effective January 1, 2019. Alliant Energy’s, IPL’s and WPL’s operating leases under the new accounting standard are primarily comprised of leases of space on telecommunication towers and leases of property.
Pension and Other Postretirement Benefits Plans
-
In March 2017, the FASB issued an accounting standard amending the income statement presentation of the components of net periodic benefit costs for defined benefit pension and other postretirement plans. The standard requires entities to (1) disaggregate the current service cost component from the other components of net periodic benefit costs and present it with other employee compensation costs in the income statement; and (2) include the other components in the income statement outside of operating income. Only the service cost component of net periodic benefit costs is eligible for capitalization into property, plant and equipment; however, IPL and WPL, as rate-regulated entities, capitalize the other components of net periodic benefit costs into regulatory assets or regulatory liabilities. Alliant Energy, IPL and WPL adopted this standard on January 1, 2018 and used the retrospective method of adoption for the presentation requirements and the prospective method of adoption for the capitalization requirements. Alliant Energy, IPL and WPL used the actual net periodic benefit costs adjusted for approximately
40%
of net periodic benefit costs allocated to capital projects for the retrospective method of adoption for the presentation requirements. The change in presentation resulted in a decrease in “Other operation and maintenance” expenses and an increase in “Other (income) and deductions” in Alliant Energy’s, IPL’s and WPL’s income statements of
$17.8 million
,
$7.2 million
and
$10.5 million
in 2017, and
$17.1 million
,
$6.8 million
and
$10.2 million
in 2016, respectively. Segment operating income (loss) was revised for these presentation requirements.
In August 2018, the FASB issued an accounting standard modifying disclosure requirements for employers that sponsor defined benefit pension or OPEB plans. Alliant Energy, IPL and WPL early adopted this standard in the fourth quarter of 2018, which was applied retrospectively.
Cash Flows Statements
- In August 2016, the FASB issued an accounting standard providing specific guidance on several cash flow classification matters. The accounting standard requires classification of the consideration received for the beneficial interest obtained for transferring accounts receivable from IPL’s sales of accounts receivable program as an investing activity, instead of an operating activity. Alliant Energy, IPL and WPL retrospectively adopted this standard on January 1, 2018, and use a method of presentation that allocates cash flows between operating and investing activities based on daily transactional activity. Alliant Energy and IPL reclassified
$461.8 million
in 2017 and
$466.8 million
in 2016 of the related cash received from IPL’s sales of accounts receivable program from operating activities to investing activities based on daily transactional activity.
In November 2016, the FASB issued an accounting standard requiring restricted cash to be included within beginning-of-period and end-of-period cash and cash equivalents in the cash flows statements. Alliant Energy, IPL and WPL adopted this standard on January 1, 2018, which was applied retrospectively.
NOTE 2. REGULATORY MATTERS
Regulatory Assets
-
Alliant Energy, IPL and WPL assess whether IPL’s and WPL’s regulatory assets are probable of future recovery by considering factors such as applicable regulations, recent orders by the applicable regulatory agencies, historical treatment of similar costs by the applicable regulatory agencies and regulatory environment changes. Based on these
|
66
|
||
assessments, Alliant Energy, IPL and WPL believe the regulatory assets recognized as of
December 31, 2018
are probable of future recovery. However, no assurance can be made that IPL and WPL will recover all of these regulatory assets in future rates. If future recovery of a regulatory asset ceases to be probable, the regulatory asset will be charged to expense. At December 31, regulatory assets were comprised of the following items (in millions):
|
Alliant Energy
|
IPL
|
WPL
|
|||||||||||||||||||||
|
2018
|
2017
|
2018
|
2017
|
2018
|
2017
|
||||||||||||||||||
|
Tax-related
|
|
$820.6
|
|
|
$778.2
|
|
|
$783.1
|
|
|
$750.5
|
|
|
$37.5
|
|
|
$27.7
|
|
|||||
|
Pension and OPEB costs
|
542.3
|
|
548.0
|
|
274.0
|
|
274.4
|
|
268.3
|
|
273.6
|
|
|||||||||||
|
EGUs retired early
|
111.6
|
|
63.8
|
|
55.4
|
|
31.6
|
|
56.2
|
|
32.2
|
|
|||||||||||
|
AROs
|
110.8
|
|
109.3
|
|
76.3
|
|
72.5
|
|
34.5
|
|
36.8
|
|
|||||||||||
|
Derivatives
|
28.0
|
|
45.3
|
|
15.1
|
|
21.8
|
|
12.9
|
|
23.5
|
|
|||||||||||
|
Emission allowances
|
23.6
|
|
25.5
|
|
23.6
|
|
25.5
|
|
—
|
|
—
|
|
|||||||||||
|
Other
|
100.4
|
|
96.6
|
|
51.5
|
|
55.3
|
|
48.9
|
|
41.3
|
|
|||||||||||
|
|
$1,737.3
|
|
|
$1,666.7
|
|
|
$1,279.0
|
|
|
$1,231.6
|
|
|
$458.3
|
|
|
$435.1
|
|
||||||
At
December 31, 2018
, IPL and WPL had
$77 million
and
$6 million
, respectively, of regulatory assets that were not earning a return. IPL’s regulatory assets that were not earning a return consisted primarily of certain EGUs retired early, emission allowances, debt redemption costs, and costs for clean air compliance and wind generation expansion projects. WPL’s regulatory assets that were not earning a return consisted primarily of environmental-related costs and amounts related to the wholesale portion of under-collected fuel-related costs. The other regulatory assets reported in the above table either earn a return or the cash has not yet been expended, in which case the assets are offset by liabilities that also do not incur a carrying cost.
Tax-related
-
IPL and WPL record regulatory assets for certain temporary differences (primarily related to utility property, plant and equipment at IPL) that result in a decrease in current rates charged to customers and an increase in future rates charged to customers based on the timing of income tax expense that is used to determine such rates. These temporary differences for IPL include the impacts of qualifying deductions for repairs expenditures, allocation of mixed service costs, and Iowa accelerated tax depreciation, which all contribute to lower current income tax expense during the first part of an asset’s useful life and higher current tax expense during the latter part of an asset’s useful life. These regulatory assets will be recovered from customers in the future when these temporary differences reverse resulting in additional current income tax expense used to determine customers’ rates. During
2018
, Alliant Energy’s and IPL’s tax-related regulatory assets increased primarily due to property-related differences for qualifying repairs expenditures. Partially offsetting this increase was a decrease due to the impacts of Iowa tax reform as discussed in
Note 12
.
Pension and other postretirement benefits costs -
The IUB, PSCW and FERC have authorized IPL and WPL to record the previously unrecognized net actuarial gains and losses, and prior service costs and credits, as regulatory assets in lieu of accumulated other comprehensive loss on the balance sheets, as these amounts are expected to be recovered in future rates. These regulatory assets will be increased or decreased as the net actuarial gains or losses, and prior service costs or credits, are subsequently amortized and recognized as a component of net periodic benefit costs. Regulatory assets are also increased or decreased as a result of the annual defined benefit plan measurement process. Pension and OPEB costs are included within the recoverable cost of service component of rates charged to IPL’s and WPL’s retail and wholesale customers, which are based upon pension and OPEB costs determined in accordance with GAAP and are calculated in accordance with IPL’s and WPL’s respective regulatory jurisdictions.
Electric generating units retired early -
IPL and WPL have retired various natural gas-fired and coal-fired EGUs and reclassified the remaining net book value of these EGUs from property, plant and equipment to regulatory assets on their respective balance sheets. Details regarding the recovery of the remaining net book value of these EGUs from IPL’s and WPL’s customers are as follows:
|
Entity
|
EGU
|
Retirement Date
|
Regulatory Asset Balance as of Dec. 31, 2018
|
Recovery
|
Regulatory Approval
|
|||||||
|
IPL
|
Sutherland Units 1 and 3
|
June 2017
|
|
$27.6
|
|
Return of remaining net book value over 10 years
|
IUB and FERC
|
|||||
|
IPL
|
M.L. Kapp Unit 2
|
June 2018
|
27.8
|
|
Return of and return on remaining net book value over 10 years
|
Pending with FERC; to be addressed with IUB
|
||||||
|
WPL
|
Nelson Dewey Units 1 and 2 and Edgewater Unit 3
|
December 2015
|
27.4
|
|
Return of and return on remaining net book value over 10 years
|
PSCW and FERC
|
||||||
|
WPL
|
Edgewater Unit 4
|
September 2018
|
28.8
|
|
Return of and return on remaining net book value over 10 years
|
PSCW and pending with FERC
|
||||||
|
67
|
||
AROs -
Alliant Energy, IPL and WPL believe it is probable that certain differences between expenses accrued for legal AROs related to their utility operations and expenses recovered currently in rates will be recoverable in future rates, and are deferring the differences as regulatory assets.
Derivatives -
In accordance with IPL’s and WPL’s fuel and natural gas recovery mechanisms, prudently incurred costs from derivative instruments are recoverable from customers in the future after any losses are realized, and gains from derivative instruments are refundable to customers in the future after any gains are realized. Based on these recovery mechanisms, the changes in the fair value of derivative liabilities/assets resulted in comparable changes to regulatory assets/liabilities on the balance sheets.
Emission allowances -
IPL entered into forward contracts in 2007 to purchase SO2 emission allowances with vintage years of 2014 through 2017 from various counterparties to meet expected future emission reduction standards. Alliant Energy and IPL have recorded a regulatory asset for amounts paid under the forward contracts and are authorized to recover these amounts from its retail customers over a
10
-year period.
Regulatory Liabilities
-
At December 31, regulatory liabilities were comprised of the following items (in millions):
|
Alliant Energy
|
IPL
|
WPL
|
|||||||||||||||||||||
|
2018
|
2017
|
2018
|
2017
|
2018
|
2017
|
||||||||||||||||||
|
Tax-related
|
|
$890.6
|
|
|
$899.4
|
|
|
$390.1
|
|
|
$399.5
|
|
|
$500.5
|
|
|
$499.9
|
|
|||||
|
Cost of removal obligations
|
401.2
|
|
410.0
|
|
273.3
|
|
274.5
|
|
127.9
|
|
135.5
|
|
|||||||||||
|
Electric transmission cost recovery
|
104.0
|
|
90.4
|
|
47.7
|
|
26.4
|
|
56.3
|
|
64.0
|
|
|||||||||||
|
WPL earnings sharing mechanism
|
25.4
|
|
8.0
|
|
—
|
|
—
|
|
25.4
|
|
8.0
|
|
|||||||||||
|
Commodity cost recovery
|
16.8
|
|
21.0
|
|
11.9
|
|
14.6
|
|
4.9
|
|
6.4
|
|
|||||||||||
|
IPL’s tax benefit riders
|
6.4
|
|
25.0
|
|
6.4
|
|
25.0
|
|
—
|
|
—
|
|
|||||||||||
|
Other
|
48.8
|
|
43.4
|
|
25.5
|
|
15.4
|
|
23.3
|
|
28.0
|
|
|||||||||||
|
|
$1,493.2
|
|
|
$1,497.2
|
|
|
$754.9
|
|
|
$755.4
|
|
|
$738.3
|
|
|
$741.8
|
|
||||||
Regulatory liabilities related to cost of removal obligations, to the extent expensed through depreciation rates, reduce rate base. Tax-related regulatory liabilities related to excess deferred taxes also reduce revenue requirement calculations utilized in IPL’s and WPL’s respective rate proceedings. A significant portion of the remaining regulatory liabilities are not used to adjust revenue requirement calculations.
Tax-related -
Alliant Energy’s, IPL’s and WPL’s tax-related regulatory liabilities are primarily related to excess deferred tax benefits resulting from the remeasurement of accumulated deferred income taxes caused by Federal Tax Reform. A portion of these benefits related to accelerated depreciation are subject to tax normalization rules. These rules limit the rate at which these tax benefits are allowed to be passed on to customers.
Cost of removal obligations -
Alliant Energy, IPL and WPL collect in rates future removal costs for many assets that do not have associated legal AROs. Alliant Energy, IPL and WPL record a regulatory liability for the amounts collected in rates for these future removal costs and reduce the regulatory liability for amounts spent on removal activities.
Electric transmission cost recovery -
Refer to
Note 1(g)
for details of IPL’s and WPL’s electric transmission cost recovery mechanisms. Starting in March 2018, amounts billed by transmission providers decreased due to the impacts from Federal Tax Reform. During 2018, Alliant Energy, IPL and WPL recorded the benefits associated with lower transmission expense as regulatory liabilities. In May 2018, IPL starting providing these benefits back to its retail electric customers utilizing the transmission recovery mechanism. WPL is deferring these benefits until a future rate proceeding. Offsetting WPL’s increase in regulatory liabilities was transmission expense amortizations as authorized in the WPL retail electric rate review (2017/2018 Test Period).
WPL earnings sharing mechanism -
Pursuant to PSCW orders, WPL must defer a portion of its earnings if its annual regulatory return on common equity exceeds certain levels during the related test periods. As of
December 31, 2018
, Alliant Energy and WPL deferred
$20 million
of WPL’s 2018 earnings related to this provision. The timing of the refund of these regulatory liabilities to customers will be determined in a future WPL regulatory proceeding.
Commodity cost recovery -
Refer to
Note 1(g)
for details of IPL’s and WPL’s commodity cost recovery mechanisms.
|
68
|
||
IPL’s tax benefit riders -
The IUB has approved electric and gas tax benefit riders proposed by IPL, which utilize regulatory liabilities to credit bills of IPL’s Iowa retail electric and gas customers to help offset the impact of rate increases on such customers. Alliant Energy and IPL recognize an offsetting reduction to income tax expense for the after-tax amounts credited to such customers, resulting in no impact to their net income from the electric and gas tax benefit riders. The tax benefit riders regulatory liabilities are related to tax benefits from tax accounting method changes for repairs expenditures and cost of removal expenditures, and a rate-making accounting change for capitalized interest. In
2018
, Alliant Energy’s and IPL’s “IPL’s tax benefit riders” regulatory liabilities decreased by
$19 million
as follows (in millions):
|
Electric tax benefit rider credits
|
|
$17
|
|
|
Gas tax benefit rider credits
|
2
|
|
|
|
|
$19
|
|
|
Other -
In January 2018, the IUB issued an order requiring IPL and other investor-owned utilities in Iowa to track all calculated differences since January 1, 2018 resulting from Federal Tax Reform, such that any over-collections can be refunded to its customers at a future date. Pursuant to IUB approval, the retail electric portion of IPL’s Federal Tax Reform benefits is currently being refunded to customers, beginning May 2018. In January 2018, the PSCW issued an order directing WPL and other investor-owned utilities in Wisconsin to defer the revenue requirement impacts resulting from Federal Tax Reform since its inception. Pursuant to PSCW approval, the retail electric and gas portions of WPL’s Federal Tax Reform benefits are currently being refunded to customers, beginning June 2018. In 2018, Alliant Energy, IPL, and WPL refunded benefits of
$66 million
,
$25 million
and
$41 million
, respectively, from the 2018 impact of Federal Tax Reform, which were recorded as a reduction in revenues. As of
December 31, 2018
, Alliant Energy’s, IPL’s and WPL’s remaining deferrals related to Federal Tax Reform were
$20 million
,
$15 million
and
$5 million
, respectively, which are included in “Other” in the regulatory liabilities table above.
Utility Rate Reviews
-
IPL’s Retail Electric Rate Review (2016 Test Year) -
In April 2017, IPL filed a request with the IUB to increase annual electric base rates for its Iowa retail electric customers. The request was based on a 2016 historical Test Year and an interim retail electric base rate increase of
$102 million
, or approximately
7%
, on an annual basis, was implemented effective April 13, 2017. Tax benefit rider credits and MISO transmission owner return on equity refunds were used to reduce the effect of the interim rate increase on customer bills in 2017. In September 2017, IPL reached a partial, non-unanimous settlement agreement with intervener groups for an annual retail electric base rate increase of
$130 million
, or approximately
9%
. In February 2018, the IUB issued an order approving the settlement. Final rates were effective May 1, 2018. The final rate increase includes continuation of the electric transmission cost rider; increased depreciation expense resulting from an updated depreciation study; recovery over a
four
-year period of ARO expenditures since the last retail electric rate filing in 2010; recovery over a
10
-year period of the remaining net book value of Sutherland Units 1 and 3, unamortized forward contract costs for SO2 emission allowances and cancelled project costs approved in a prior EPB; and no double leverage applied to the weighted-average cost of capital. As a result of the partial settlement, in 2017, IPL recorded a write-down of regulatory assets of
$9 million
, including
$4 million
to “Other operation and maintenance” expenses primarily related to IPL being no longer probable of earning a return on the remaining net book value of Sutherland Units 1 and 3 from its retail customers with implementation of final rates, and
$5 million
to “Depreciation and amortization” expenses for certain AROs deemed no longer probable of recovery in future rates.
WPL’s Retail Electric and Gas Rate Review (2019/2020 Test Period) -
In December 2018, the PSCW issued an order approving WPL’s proposed settlement for its retail electric and gas rate review covering the 2019/2020 Test Period, which was based on a stipulated agreement between WPL and intervener groups. Under the settlement, WPL retail electric and gas base rates will not change from current levels through the end of 2020.
WPL’s Retail Electric and Gas Rate Review (2017/2018 Test Period) -
In December 2016, WPL received an order from the PSCW authorizing WPL to implement increases in annual retail electric and gas rates of
$9 million
and
$9 million
, respectively, effective January 1, 2017 followed by a freeze of such rates through the end of 2018. The
$9 million
net annual retail electric rate increase reflects a
$60 million
increase in base rates, partially offset by a
$51 million
reduction in fuel-related costs, using an estimate for 2017 fuel-related costs. The order included utilization of amounts that WPL previously over-recovered from its customers for energy efficiency cost recovery and electric transmission cost recovery to reduce the requested base rate increase. The order also included provisions that required WPL to defer a portion of its earnings if its annual regulatory return on common equity exceeded certain levels in 2017 or 2018.
|
69
|
||
NOTE 3. PROPERTY, PLANT AND EQUIPMENT
At December 31, details of property, plant and equipment on the balance sheets were as follows (in millions):
|
Alliant Energy
|
IPL
|
WPL
|
|||||||||||||||||||||
|
2018
|
2017
|
2018
|
2017
|
2018
|
2017
|
||||||||||||||||||
|
Utility:
|
|||||||||||||||||||||||
|
Electric plant:
|
|||||||||||||||||||||||
|
Generation in service
|
|
$6,800.6
|
|
|
$6,655.3
|
|
|
$3,610.4
|
|
|
$3,715.9
|
|
|
$3,190.2
|
|
|
$2,939.4
|
|
|||||
|
Distribution in service
|
5,452.2
|
|
5,123.5
|
|
3,023.7
|
|
2,820.9
|
|
2,428.5
|
|
2,302.6
|
|
|||||||||||
|
Other in service
|
410.8
|
|
425.1
|
|
260.4
|
|
282.3
|
|
150.4
|
|
142.8
|
|
|||||||||||
|
Anticipated to be retired early (a)
|
—
|
|
93.0
|
|
—
|
|
—
|
|
—
|
|
93.0
|
|
|||||||||||
|
Total electric plant
|
12,663.6
|
|
12,296.9
|
|
6,894.5
|
|
6,819.1
|
|
5,769.1
|
|
5,477.8
|
|
|||||||||||
|
Gas plant in service
|
1,387.6
|
|
1,244.0
|
|
763.1
|
|
654.8
|
|
624.5
|
|
589.2
|
|
|||||||||||
|
Other plant in service
|
513.2
|
|
571.9
|
|
322.4
|
|
333.4
|
|
190.8
|
|
238.5
|
|
|||||||||||
|
Accumulated depreciation
|
(4,314.6
|
)
|
(4,283.1
|
)
|
(2,294.7
|
)
|
(2,311.0
|
)
|
(2,019.9
|
)
|
(1,972.1
|
)
|
|||||||||||
|
Net plant
|
10,249.8
|
|
9,829.7
|
|
5,685.3
|
|
5,496.3
|
|
4,564.5
|
|
4,333.4
|
|
|||||||||||
|
Leased Sheboygan Falls Energy Facility, net (b)
|
—
|
|
—
|
|
—
|
|
—
|
|
38.1
|
|
46.2
|
|
|||||||||||
|
Construction work in progress
|
1,774.8
|
|
962.2
|
|
1,091.2
|
|
424.4
|
|
683.6
|
|
537.8
|
|
|||||||||||
|
Other, net
|
6.1
|
|
6.0
|
|
5.0
|
|
5.5
|
|
1.1
|
|
0.5
|
|
|||||||||||
|
Total utility
|
12,030.7
|
|
10,797.9
|
|
6,781.5
|
|
5,926.2
|
|
5,287.3
|
|
4,917.9
|
|
|||||||||||
|
Non-utility and other:
|
|||||||||||||||||||||||
|
Non-utility Generation, net (c)
|
86.9
|
|
90.9
|
|
—
|
|
—
|
|
—
|
|
—
|
|
|||||||||||
|
Corporate Services and other, net (d)
|
344.8
|
|
345.7
|
|
—
|
|
—
|
|
—
|
|
—
|
|
|||||||||||
|
Total non-utility and other
|
431.7
|
|
436.6
|
|
—
|
|
—
|
|
—
|
|
—
|
|
|||||||||||
|
Total property, plant and equipment
|
|
$12,462.4
|
|
|
$11,234.5
|
|
|
$6,781.5
|
|
|
$5,926.2
|
|
|
$5,287.3
|
|
|
$4,917.9
|
|
|||||
|
(a)
|
In 2018, WPL retired Edgewater Unit 4 and reclassified the remaining net book value of this EGU from property, plant and equipment to a regulatory asset on Alliant Energy’s and WPL’s balance sheets.
|
|
(b)
|
Less accumulated amortization of
$82.8 million
and
$77.6 million
for WPL as of
December 31, 2018
and
2017
, respectively. The Sheboygan Falls Energy Facility is eliminated from WPL upon consolidation and is included in the “Non-utility Generation, net” line within Alliant Energy’s consolidated property, plant and equipment.
|
|
(c)
|
Less accumulated depreciation of
$54.5 million
and
$50.5 million
for Alliant Energy as of
December 31, 2018
and
2017
, respectively.
|
|
(d)
|
Less accumulated depreciation of
$167.5 million
and
$285.6 million
for Alliant Energy as of
December 31, 2018
and
2017
, respectively.
|
Generation in Service
-
WPL’s Acquisition of Forward Wind Energy Center -
In 2018, WPL, along with WPSC and MGE, received approval from the PSCW and FERC to acquire a partial ownership interest in the assets of FWEC, which is a
129
MW wind farm located in Wisconsin. In April 2018, WPL acquired
55
MW of the FWEC wind farm for approximately
$74 million
. WPL, WPSC and MGE had been receiving electricity from the FWEC wind farm under PPAs since FWEC began commercial operations in 2008. Upon completion of the acquisitions, such PPAs terminated. As of the closing date, the estimated fair value of the assets purchased and the liabilities assumed by WPL were as follows (in millions):
|
Property, plant and equipment, net
|
|
$81
|
|
|
Liabilities
|
7
|
|
|
|
Net assets acquired
|
|
$74
|
|
Franklin County Wind Farm -
In 2016, based on an evaluation of the strategic options for the Franklin County wind farm, Alliant Energy concluded it was probable the Franklin County wind farm would be transferred to IPL. As a result, Alliant Energy performed an impairment analysis of such assets and recorded non-cash, pre-tax asset valuation charges of
$86 million
(after-tax charges of
$51 million
, or
$0.23
per share) in 2016. Alliant Energy recorded such charges as a reduction to property, plant and equipment on its balance sheet and charges to “Asset valuation charges for Franklin County wind farm” in its income statement in 2016.
In April 2017, the Franklin County wind farm was transferred from AEF to IPL as approved by a February 2017 FERC order. IPL’s purchase price, including certain transaction-related costs, was
$32 million
. As of the closing date, the estimated fair values of the assets purchased and liabilities assumed by IPL were as follows (in millions):
|
70
|
||
|
Electric plant in service
|
|
$40
|
|
|
Current assets
|
2
|
|
|
|
Total assets acquired
|
42
|
|
|
|
Other liabilities
|
10
|
|
|
|
Net assets acquired
|
|
$32
|
|
AFUDC
- AFUDC represents costs to finance construction additions, including a return on equity component and cost of debt component as required by regulatory accounting. The concurrent credit for the amount of AFUDC capitalized is recorded as “Allowance for funds used during construction” in the income statements. The amount of AFUDC generated by equity and debt components was as follows (in millions):
|
Alliant Energy
|
IPL
|
WPL
|
|||||||||||||||||||||||||||||||||
|
2018
|
2017
|
2016
|
2018
|
2017
|
2016
|
2018
|
2017
|
2016
|
|||||||||||||||||||||||||||
|
Equity
|
|
$51.4
|
|
|
$33.6
|
|
|
$42.3
|
|
|
$28.6
|
|
|
$21.1
|
|
|
$35.2
|
|
|
$22.8
|
|
|
$12.5
|
|
|
$7.1
|
|
||||||||
|
Debt
|
24.2
|
|
16.1
|
|
20.2
|
|
13.6
|
|
10.3
|
|
16.8
|
|
10.6
|
|
5.8
|
|
3.4
|
|
|||||||||||||||||
|
|
$75.6
|
|
|
$49.7
|
|
|
$62.5
|
|
|
$42.2
|
|
|
$31.4
|
|
|
$52.0
|
|
|
$33.4
|
|
|
$18.3
|
|
|
$10.5
|
|
|||||||||
Non-utility and Other
-
The non-utility and other property, plant and equipment recorded on Alliant Energy’s balance sheets includes the following:
Non-utility Generation -
The Sheboygan Falls Energy Facility was placed into service in 2005 and is depreciated using the straight-line method over a
35
-year period. As of
December 31, 2018
, Alliant Energy recorded
$87 million
on its balance sheet related to the Sheboygan Falls Energy Facility.
Corporate Services and Other -
Property, plant and equipment related to Corporate Services includes a customer billing and information system for IPL and WPL and other computer software, and the corporate headquarters building located in Madison, Wisconsin. The customer billing and information system is amortized using the straight-line method over a
12
-year period. The majority of the remaining software is amortized over a
5
-year period. Property, plant and equipment related to Transportation includes a short-line railway in Iowa and a barge terminal on the Mississippi River. The Corporate Services and Other property, plant and equipment is depreciated using the straight-line method over periods ranging from
5
to
30
years.
NOTE 4. JOINTLY-OWNED ELECTRIC UTILITY PLANT
Under joint ownership agreements with other utilities, IPL and WPL have undivided ownership interests in jointly-owned EGUs. Each of the respective owners is responsible for the financing of its portion of the construction costs. KWh generation and operating expenses are primarily divided between the joint owners on the same basis as ownership. IPL’s and WPL’s shares of expenses from jointly-owned EGUs are included in the corresponding operating expenses (e.g., electric production fuel, other operation and maintenance, etc.) in their income statements. Information relative to IPL’s and WPL’s ownership interest in these jointly-owned EGUs at
December 31, 2018
was as follows (dollars in millions):
|
Ownership
|
Electric
|
Accumulated Provision
|
Construction
|
|||||||||||
|
Interest %
|
Plant
|
for Depreciation
|
Work in Progress
|
|||||||||||
|
IPL
|
||||||||||||||
|
Ottumwa Unit 1
|
48.0
|
%
|
|
$507.1
|
|
|
$161.7
|
|
|
$65.3
|
|
|||
|
George Neal Unit 4
|
25.7
|
%
|
187.3
|
|
89.8
|
|
1.2
|
|
||||||
|
George Neal Unit 3
|
28.0
|
%
|
156.7
|
|
57.8
|
|
1.4
|
|
||||||
|
Louisa Unit 1
|
4.0
|
%
|
39.2
|
|
23.9
|
|
0.8
|
|
||||||
|
890.3
|
|
333.2
|
|
68.7
|
|
|||||||||
|
WPL
|
||||||||||||||
|
Columbia Units 1-2
|
52.5
|
%
|
779.4
|
|
247.9
|
|
9.8
|
|
||||||
|
FWEC
|
42.6
|
%
|
119.7
|
|
41.2
|
|
0.1
|
|
||||||
|
West Riverside (a)
|
91.8
|
%
|
—
|
|
—
|
|
538.4
|
|
||||||
|
899.1
|
|
289.1
|
|
548.3
|
|
|||||||||
|
Alliant Energy
|
|
$1,789.4
|
|
|
$622.3
|
|
|
$617.0
|
|
|||||
|
(a)
|
In January 2018, certain electric cooperatives, which currently have wholesale power supply agreements with WPL, acquired a partial ownership interest in West Riverside.
|
|
71
|
||
NOTE 5. RECEIVABLES
NOTE 5(a) Accounts Receivable -
Details for accounts receivable included on the balance sheets as of December 31 were as follows (in millions):
|
Alliant Energy
|
IPL
|
WPL
|
|||||||||||||||||||||
|
2018
|
2017
|
2018
|
2017
|
2018
|
2017
|
||||||||||||||||||
|
Customer
|
|
$91.0
|
|
|
$103.3
|
|
|
$—
|
|
|
$—
|
|
|
$84.8
|
|
|
$97.7
|
|
|||||
|
Unbilled utility revenues
|
74.2
|
|
85.1
|
|
—
|
|
—
|
|
74.2
|
|
85.1
|
|
|||||||||||
|
Deferred proceeds
|
119.4
|
|
222.1
|
|
119.4
|
|
222.1
|
|
—
|
|
—
|
|
|||||||||||
|
Other
|
76.3
|
|
84.3
|
|
37.2
|
|
44.1
|
|
38.5
|
|
40.1
|
|
|||||||||||
|
Allowance for doubtful accounts
|
(10.5
|
)
|
(12.0
|
)
|
(3.1
|
)
|
(1.3
|
)
|
(7.4
|
)
|
(10.7
|
)
|
|||||||||||
|
|
$350.4
|
|
|
$482.8
|
|
|
$153.5
|
|
|
$264.9
|
|
|
$190.1
|
|
|
$212.2
|
|
||||||
NOTE 5(b) Sales of Accounts Receivable -
IPL maintains a Receivables Agreement whereby it may sell its customer accounts receivables, unbilled revenues and certain other accounts receivables to a third party through wholly-owned and consolidated special purpose entities. In March 2018, IPL amended and extended through March 2021 the purchase commitment from the third party to which it sells its receivables. IPL pays a monthly fee to the third party that varies based on interest rates, limits on cash proceeds and cash amounts received from the third party. Deferred proceeds represent IPL’s interest in the receivables sold to the third party. At IPL’s request, deferred proceeds are paid to IPL from collections of receivables, after paying any required expenses incurred by the third party and the collection agent. Corporate Services acts as collection agent for the third party and receives a fee for collection services. The Receivables Agreement can be terminated by the third party if arrears or write-offs exceed certain levels. The transfers of receivables meet the criteria for sale accounting established by the transfer of financial assets accounting rules. IPL believes that the allowance for doubtful accounts related to its sales of receivables is a reasonable approximation of credit risk of the customers that generated the receivables. Refer to
Note 16
for discussion of the fair value of deferred proceeds.
Under the Receivables Agreement, IPL has the right to receive cash proceeds, up to a certain limit, from the third party in exchange for the receivables sold. Effective April 2018, the limit on cash proceeds fluctuates between
$90 million
and
$110 million
. Cash proceeds are used by IPL to meet short-term financing needs, and cannot exceed the current limit or amount of receivables available for sale, whichever is less. As of
December 31, 2018
, IPL had no available capacity under its sales of accounts receivable program. IPL’s maximum and average outstanding aggregate cash proceeds (based on daily outstanding balances) related to the sales of accounts receivable program were as follows (in millions):
|
Maximum
|
Average
|
||||||||||
|
2018
|
2017
|
2016
|
2018
|
2017
|
2016
|
||||||
|
Outstanding aggregate cash proceeds
|
$116.0
|
$112.0
|
$172.0
|
$53.4
|
$62.2
|
$73.2
|
|||||
As of December 31, the attributes of IPL’s receivables sold under the Receivables Agreement were as follows (in millions):
|
2018
|
2017
|
||
|
Customer accounts receivable
|
$140.1
|
$133.8
|
|
|
Unbilled utility revenues
|
97.1
|
112.7
|
|
|
Other receivables
|
0.1
|
0.3
|
|
|
Receivables sold to third party
|
237.3
|
246.8
|
|
|
Less: cash proceeds
|
108.0
|
12.0
|
|
|
Deferred proceeds
|
129.3
|
234.8
|
|
|
Less: allowance for doubtful accounts
|
9.9
|
12.7
|
|
|
Fair value of deferred proceeds
|
$119.4
|
$222.1
|
|
|
Outstanding receivables past due
|
$35.5
|
$44.7
|
|
Additional attributes of IPL’s receivables sold under the Receivables Agreement were as follows (in millions):
|
2018
|
2017
|
2016
|
|||
|
Collections
|
$2,076.7
|
$1,647.1
|
$1,818.1
|
||
|
Write-offs, net of recoveries
|
21.3
|
17.7
|
4.8
|
||
In connection with the implementation of IPL’s new customer billing and information system in 2016, IPL postponed the write-off of customer bills for a portion of 2016, resulting in lower write-offs in 2016 compared to 2017 and 2018.
|
72
|
||
NOTE 6. INVESTMENTS
Unconsolidated Equity Investments
-
Unconsolidated investments accounted for under the equity method of accounting are as follows (in millions):
|
Ownership Interest at
|
Carrying Value at December 31,
|
Equity (Income) / Loss
|
|||||||||||||||||||
|
December 31, 2018
|
2018
|
2017
|
2018
|
2017
|
2016
|
||||||||||||||||
|
Alliant Energy
|
|||||||||||||||||||||
|
ATC Holdings (a)
|
16%-20%
|
|
$293.6
|
|
|
$274.2
|
|
|
($38.1
|
)
|
|
($42.4
|
)
|
|
($39.1
|
)
|
|||||
|
Non-utility wind farm in Oklahoma
|
50%
|
105.1
|
|
98.3
|
|
(15.6
|
)
|
(1.8
|
)
|
—
|
|
||||||||||
|
Other
|
Various
|
22.6
|
|
8.9
|
|
(0.9
|
)
|
(0.6
|
)
|
(0.5
|
)
|
||||||||||
|
|
$421.3
|
|
|
$381.4
|
|
|
($54.6
|
)
|
|
($44.8
|
)
|
|
($39.6
|
)
|
|||||||
|
WPL
|
|||||||||||||||||||||
|
ATC
|
—%
|
|
$—
|
|
|
$—
|
|
|
$—
|
|
|
$—
|
|
|
($39.1
|
)
|
|||||
|
Wisconsin River Power Company
|
50%
|
8.1
|
|
8.3
|
|
(0.9
|
)
|
(0.7
|
)
|
(0.7
|
)
|
||||||||||
|
|
$8.1
|
|
|
$8.3
|
|
|
($0.9
|
)
|
|
($0.7
|
)
|
|
($39.8
|
)
|
|||||||
|
(a)
|
As of
December 31, 2018
, Alliant Energy’s interest in ATC Holdings is comprised of a
16%
ownership interest in ATC and a
20%
ownership interest in ATC Holdco LLC, which are described below. Alliant Energy currently has the ability to exercise significant influence over ATC’s and ATC Holdco LLC’s financial and operating policies through its participation on ATC’s Board of Directors.
|
Summary aggregate financial information from the financial statements of these holdings is as follows (in millions):
|
Alliant Energy
|
WPL
|
||||||||||||||||||||||
|
2018
|
2017
|
2016
|
2018
|
2017
|
2016
|
||||||||||||||||||
|
Revenues
|
|
$724
|
|
|
$741
|
|
|
$658
|
|
|
$8
|
|
|
$8
|
|
|
$658
|
|
|||||
|
Operating income
|
325
|
|
374
|
|
331
|
|
2
|
|
4
|
|
331
|
|
|||||||||||
|
Net income
|
217
|
|
267
|
|
232
|
|
1
|
|
2
|
|
234
|
|
|||||||||||
|
As of December 31:
|
|||||||||||||||||||||||
|
Current assets
|
144
|
|
104
|
|
4
|
|
7
|
|
|||||||||||||||
|
Non-current assets
|
5,498
|
|
5,041
|
|
19
|
|
20
|
|
|||||||||||||||
|
Current liabilities
|
644
|
|
770
|
|
1
|
|
2
|
|
|||||||||||||||
|
Non-current liabilities
|
2,315
|
|
2,038
|
|
6
|
|
8
|
|
|||||||||||||||
|
Noncontrolling interest
|
223
|
|
255
|
|
—
|
|
—
|
|
|||||||||||||||
Interest in ATC and WPL’s Noncontrolling Interest
-
Prior to 2014, WPL owned
100%
of WPL Transco, which held Alliant Energy’s interest in ATC. In 2014, WPL Transco’s operating agreement was amended to allow ATI, a wholly-owned subsidiary of AEF, to become a member of WPL Transco in addition to WPL. Prior to the transfer of the interest in ATC to ATI discussed below, WPL consolidated WPL Transco, and ATI’s ownership in WPL Transco was recorded as a noncontrolling interest in total equity on WPL’s balance sheets. On December 31, 2016, pursuant to a PSCW order, WPL Transco was liquidated and WPL transferred its interest in ATC to ATI. As a result, WPL no longer records equity income from its prior interest in ATC. In conjunction with the transfer of the interest in ATC, a deferred intercompany tax gain recognized by WPL was assumed by ATI. The impact of WPL’s transfer of the interest in ATC Holdings, including the assumption of such intercompany tax gain by ATI, was recorded as a net reduction in total equity of
$163.6 million
on WPL’s balance sheet. WPL’s income statement includes all of the equity earnings from ATC through December 31, 2016, the date of transfer. There were no impacts of this transfer to Alliant Energy’s consolidated financial statements. As of December 31, 2016, ATI owns Alliant Energy’s entire interest in ATC Holdings.
Interest in ATC Holdco LLC
-
In 2011, Duke Energy Corporation and ATC announced the creation of Duke-American Transmission Company, LLC, a joint venture that is expected to acquire, build, own and operate new electric transmission infrastructure in North America. In 2017, ATC transferred a portion of its interest in Duke-American Transmission Company, LLC to ATC Holdco LLC, and as a result, Alliant Energy contributed additional equity capital funding based on its ownership interest in ATC Holdco LLC. A portion of the proceeds from the transfer was distributed to all ATC Holdco LLC’s owners based on their ATC ownership percentage.
Non-utility Wind Farm in Oklahoma
-
In July 2017, a wholly-owned subsidiary of AEF acquired
50%
of a cash equity ownership interest in a
225
MW non-utility wind farm located in Oklahoma, which started commercial operations in December 2016. The wind farm provides electricity to a third-party under a long-term PPA, and has both cash and tax equity ownership. The equity income recognized in 2018 was primarily related to the impacts of Federal Tax Reform. The
|
73
|
||
liquidation method utilized to recognize Alliant Energy’s share of the wind farm’s earnings includes utilizing the federal income tax rate in effect as of the end of the measurement period. The lower federal income tax rate effective as of January 1, 2018 resulted in an acceleration of earnings attributable to Alliant Energy’s interest in the Oklahoma wind farm. This increase in earnings is expected to reverse over time. Alliant Energy does not maintain or operate the wind farm, and provided a parent guarantee of its subsidiary’s indemnification obligations under the operating agreement and PPA. Refer to
Note 17(d)
for discussion of the guarantee.
NOTE 7. COMMON EQUITY
Common Share Activity
-
A summary of Alliant Energy’s common stock activity was as follows:
|
2018
|
2017
|
2016
|
||||||
|
Shares outstanding, January 1
|
231,348,646
|
|
227,673,654
|
|
226,918,432
|
|
||
|
At-the-market offering programs
|
4,171,013
|
|
3,074,931
|
|
—
|
|
||
|
Shareowner Direct Plan issuances
|
576,965
|
|
640,723
|
|
732,814
|
|
||
|
Equity-based compensation plans (
Note 13(b)
)
|
5,078
|
|
5,185
|
|
22,408
|
|
||
|
Other
|
(38,423
|
)
|
(45,847
|
)
|
—
|
|
||
|
Shares outstanding, December 31
|
236,063,279
|
|
231,348,646
|
|
227,673,654
|
|
||
At
December 31, 2018
, Alliant Energy had a total of
11.2 million
shares available for issuance in the aggregate, pursuant to its Amended and Restated OIP, Shareowner Direct Plan and 401(k) Savings Plan.
At-the-Market Offering Programs -
In 2018 and 2017, Alliant Energy filed prospectus supplements under which it could sell up to
$175 million
and
$125 million
of its common stock, respectively, through at-the-market offering programs. In 2018, Alliant Energy issued
4,171,013
shares of common stock through this program and received cash proceeds of
$173 million
, net of
$2 million
in commissions and fees. In 2017, Alliant Energy issued
3,074,931
shares of common stock through this program and received cash proceeds of
$124 million
, net of
$1 million
in commissions and fees. The 2017 at-the-market offering program expired in 2018, and Alliant Energy currently has no plans to issue any additional common stock through the 2018 at-the-market offering program.
Shareowner Direct Plan -
Alliant Energy satisfies its requirements under the Shareowner Direct Plan (dividend reinvestment and stock purchase plan) by acquiring Alliant Energy common stock through original issue, rather than on the open market.
Equity Forward Agreements
-
In December 2018, Alliant Energy entered into forward sale agreements with various counterparties in connection with a public offering of
8,358,973
shares of Alliant Energy common stock. In the forward sale transaction, the counterparties, or their affiliates, borrowed an aggregate of
8,358,973
shares of Alliant Energy common stock from third parties and sold such shares to the related underwriters. Alliant Energy has concluded that the forward sale agreements meet the derivative scope exception for certain contracts involving an entity’s own equity. Alliant Energy has not yet received any proceeds from the offering and no amounts have been or will be recorded in equity on Alliant Energy’s balance sheets until the forward sale agreements settle. Alliant Energy expects to settle the forward sale agreements prior to December 31, 2019 through physical delivery of shares of common stock in exchange for cash proceeds at the then-applicable forward sale price; however, Alliant Energy may elect cash settlement or net share settlement for all or a portion of the obligations under the forward sale agreements. The initial forward sale price of
$44.33
per share, is subject to daily adjustment based on a floating interest rate factor, and will decrease by other fixed amounts specified in the forward sale agreement. Until settlement of the forward sale agreements, Alliant Energy’s EPS dilution resulting from the agreements, if any, is determined using the treasury stock method. Share dilution occurs when the average market price of Alliant Energy stock during the reporting period is higher than the forward sale price as of the end of the reporting period. As of December 31, 2018, the securities under the forward sale agreements were excluded from the calculation of diluted EPS as they were antidilutive.
Shareowner Rights Agreement
-
Alliant Energy previously established an amended and restated Shareowner Rights Agreement. The rights under this agreement were exercisable if a person or group acquired, or announced an intention to acquire,
15%
or more of Alliant Energy’s outstanding common stock. In January 2018, Alliant Energy’s Board of Directors authorized the redemption of the rights, which were redeemed to shareowners as of the close of business on January 31, 2018.
Comprehensive Income (Loss)
-
In
2018
,
2017
and
2016
, Alliant Energy’s other comprehensive income (loss) was
$2.2 million
,
($0.1) million
and
$0 million
, respectively; therefore, its comprehensive income was substantially equal to its net income and its comprehensive income attributable to Alliant Energy common shareowners was substantially equal to its net income attributable to Alliant Energy common shareowners for such periods. In
2018
,
2017
and
2016
, IPL and WPL had no
|
74
|
||
other comprehensive income; therefore their comprehensive income was equal to their net income and their comprehensive income available for common stock was equal to their earnings available for common stock for such periods.
NOTE 8. PREFERRED STOCK
IPL is authorized to issue up to
16,000,000
shares of cumulative preferred stock in aggregate. Information related to the carrying value of IPL’s cumulative preferred stock at December 31 was as follows:
|
Series
|
Liquidation Preference/Stated Value
|
Shares Authorized
|
Shares Outstanding
|
2018
|
2017
|
|||||||||
|
(in millions)
|
||||||||||||||
|
5.1%
|
$25
|
8,000,000
|
8,000,000
|
|
$200.0
|
|
|
$200.0
|
|
|||||
IPL may, at its option, redeem the
5.1%
cumulative preferred stock for cash at a redemption price of
$25
per share plus accrued and unpaid dividends up to the redemption date.
The current articles of incorporation of IPL contain a provision that grants the holders of its cumulative preferred stock voting rights to elect
two
members of IPL’s Board of Directors if preferred dividends equal to
six
or more quarterly dividend requirements (whether or not consecutive) are in arrears. Such voting rights would not provide the holders of IPL’s preferred stock control of the Board of Directors and could not force IPL to redeem its preferred stock.
NOTE 9. DEBT
NOTE 9(a) Short-term Debt -
Alliant Energy and its subsidiaries maintain committed bank lines of credit to provide short-term borrowing flexibility and back-stop liquidity for commercial paper outstanding. At
December 31, 2018
, the short-term borrowing capacity under a single credit facility agreement, which expires in August 2022, totaled
$1 billion
(
$400 million
for Alliant Energy at the parent company level,
$250 million
for IPL and
$350 million
for WPL). Subject to certain conditions, Alliant Energy (at the parent company level), IPL and WPL may each reallocate and change its sublimit up to
$500 million
,
$400 million
and
$500 million
, respectively, within the $1 billion total commitment. Information regarding commercial paper classified as short-term debt and back-stopped by the credit facility was as follows (dollars in millions):
|
Alliant Energy
|
IPL
|
WPL
|
|||||||||
|
December 31
|
2018
|
2017
|
2018
|
2017
|
2018
|
2017
|
|||||
|
Commercial paper outstanding
|
$441.2
|
$320.2
|
$50.4
|
$—
|
$105.5
|
$25.0
|
|||||
|
Commercial paper weighted average interest rates
|
2.8%
|
2.0%
|
2.8%
|
N/A
|
2.5%
|
1.5%
|
|||||
|
Available credit facility capacity
|
$558.8
|
$679.8
|
$199.6
|
$250.0
|
$244.5
|
$325.0
|
|||||
|
Alliant Energy
|
IPL
|
WPL
|
|||||||||
|
For the year ended
|
2018
|
2017
|
2018
|
2017
|
2018
|
2017
|
|||||
|
Maximum amount outstanding (based on daily outstanding balances)
|
$446.5
|
$424.4
|
$50.4
|
$20.0
|
$126.0
|
$271.2
|
|||||
|
Average amount outstanding (based on daily outstanding balances)
|
$221.4
|
$294.3
|
$1.5
|
$0.5
|
$36.6
|
$118.2
|
|||||
|
Weighted average interest rates
|
2.2%
|
1.2%
|
2.3%
|
1.3%
|
2.1%
|
1.0%
|
|||||
In June 2018, AEF retired its
$95 million
,
364
-day variable-rate (
2.2%
at December 31, 2017) term loan credit agreement.
Financial Covenants
-
The single credit facility agreement contains a financial covenant, which requires Alliant Energy, IPL and WPL to maintain certain debt-to-capital ratios in order to borrow under the credit facility. AEF’s term loan credit agreement contains a financial covenant, which requires Alliant Energy to maintain a certain debt-to-capital ratio in order to borrow under the term loan credit agreement. The required debt-to-capital ratios compared to the actual debt-to-capital ratios at
December 31, 2018
were as follows:
|
Alliant Energy
|
IPL
|
WPL
|
|||
|
Requirement, not to exceed
|
65%
|
65%
|
65%
|
||
|
Actual
|
55%
|
45%
|
48%
|
||
The debt component of the capital ratios includes long- and short-term debt (excluding non-recourse debt and hybrid securities to the extent the total carrying value of such hybrid securities does not exceed
15%
of consolidated capital of the applicable borrower), capital lease obligations, certain letters of credit, guarantees of the foregoing and new synthetic leases. Unfunded vested benefits under qualified pension plans and sales of accounts receivable are not included in the debt-to-capital ratios. The equity component of the capital ratios excludes accumulated other comprehensive income (loss).
|
75
|
||
NOTE 9(b) Long-Term Debt -
Long-term debt, net as of December 31 was as follows (dollars in millions):
|
2018
|
2017
|
||||||||||||||||||||||
|
Alliant Energy
|
IPL
|
WPL
|
Alliant Energy
|
IPL
|
WPL
|
||||||||||||||||||
|
Senior Debentures (a):
|
|||||||||||||||||||||||
|
3.65%, due 2020
|
|
$200.0
|
|
|
$200.0
|
|
|
$—
|
|
|
$200.0
|
|
|
$200.0
|
|
|
$—
|
|
|||||
|
3.25%, due 2024
|
500.0
|
|
500.0
|
|
—
|
|
500.0
|
|
500.0
|
|
—
|
|
|||||||||||
|
3.4%, due 2025
|
250.0
|
|
250.0
|
|
—
|
|
250.0
|
|
250.0
|
|
—
|
|
|||||||||||
|
5.5%, due 2025
|
50.0
|
|
50.0
|
|
—
|
|
50.0
|
|
50.0
|
|
—
|
|
|||||||||||
|
4.1%, due 2028 (b)
|
500.0
|
|
500.0
|
|
—
|
|
—
|
|
—
|
|
—
|
|
|||||||||||
|
6.45%, due 2033
|
100.0
|
|
100.0
|
|
—
|
|
100.0
|
|
100.0
|
|
—
|
|
|||||||||||
|
6.3%, due 2034
|
125.0
|
|
125.0
|
|
—
|
|
125.0
|
|
125.0
|
|
—
|
|
|||||||||||
|
6.25%, due 2039
|
300.0
|
|
300.0
|
|
—
|
|
300.0
|
|
300.0
|
|
—
|
|
|||||||||||
|
4.7%, due 2043
|
250.0
|
|
250.0
|
|
—
|
|
250.0
|
|
250.0
|
|
—
|
|
|||||||||||
|
3.7%, due 2046
|
300.0
|
|
300.0
|
|
—
|
|
300.0
|
|
300.0
|
|
—
|
|
|||||||||||
|
5.875% (Retired in 2018)
|
—
|
|
—
|
|
—
|
|
100.0
|
|
100.0
|
|
—
|
|
|||||||||||
|
7.25% (Retired in 2018)
|
—
|
|
—
|
|
—
|
|
250.0
|
|
250.0
|
|
—
|
|
|||||||||||
|
2,575.0
|
|
2,575.0
|
|
—
|
|
2,425.0
|
|
2,425.0
|
|
—
|
|
||||||||||||
|
Debentures (a):
|
|||||||||||||||||||||||
|
5%, due 2019
|
250.0
|
|
—
|
|
250.0
|
|
250.0
|
|
—
|
|
250.0
|
|
|||||||||||
|
4.6%, due 2020
|
150.0
|
|
—
|
|
150.0
|
|
150.0
|
|
—
|
|
150.0
|
|
|||||||||||
|
2.25%, due 2022
|
250.0
|
|
—
|
|
250.0
|
|
250.0
|
|
—
|
|
250.0
|
|
|||||||||||
|
3.05%, due 2027
|
300.0
|
|
—
|
|
300.0
|
|
300.0
|
|
—
|
|
300.0
|
|
|||||||||||
|
6.25%, due 2034
|
100.0
|
|
—
|
|
100.0
|
|
100.0
|
|
—
|
|
100.0
|
|
|||||||||||
|
6.375%, due 2037
|
300.0
|
|
—
|
|
300.0
|
|
300.0
|
|
—
|
|
300.0
|
|
|||||||||||
|
7.6%, due 2038
|
250.0
|
|
—
|
|
250.0
|
|
250.0
|
|
—
|
|
250.0
|
|
|||||||||||
|
4.1%, due 2044
|
250.0
|
|
—
|
|
250.0
|
|
250.0
|
|
—
|
|
250.0
|
|
|||||||||||
|
1,850.0
|
|
—
|
|
1,850.0
|
|
1,850.0
|
|
—
|
|
1,850.0
|
|
||||||||||||
|
Other:
|
|||||||||||||||||||||||
|
AEF term loan credit agreement through April 2020, 3% at December 31, 2018 (with Alliant Energy as guarantor) (c)
|
300.0
|
|
—
|
|
—
|
|
—
|
|
—
|
|
—
|
|
|||||||||||
|
Corporate Services 3.45% senior notes, due 2022 (a)
|
75.0
|
|
—
|
|
—
|
|
75.0
|
|
—
|
|
—
|
|
|||||||||||
|
AEF 3.75% senior notes, due 2023 (with Alliant Energy as guarantor) (a)(d)
|
400.0
|
|
—
|
|
—
|
|
—
|
|
—
|
|
—
|
|
|||||||||||
|
AEF 4.25% senior notes, due 2028 (with Alliant Energy as guarantor) (a)(d)
|
300.0
|
|
—
|
|
—
|
|
—
|
|
—
|
|
—
|
|
|||||||||||
|
Sheboygan Power, LLC 5.06% senior secured notes, due 2019 to 2024 (secured by the Sheboygan Falls Energy Facility and related assets) (a)
|
44.3
|
|
—
|
|
—
|
|
49.6
|
|
—
|
|
—
|
|
|||||||||||
|
AEF term loan credit agreement, 2% at December 31, 2017 (with Alliant Energy as guarantor) (Retired in 2018) (d)
|
—
|
|
—
|
|
—
|
|
500.0
|
|
—
|
|
—
|
|
|||||||||||
|
Other, 1% at December 31, 2018, due 2019 to 2025
|
2.4
|
|
—
|
|
—
|
|
2.9
|
|
—
|
|
—
|
|
|||||||||||
|
1,121.7
|
|
—
|
|
—
|
|
627.5
|
|
—
|
|
—
|
|
||||||||||||
|
Subtotal
|
5,546.7
|
|
2,575.0
|
|
1,850.0
|
|
4,902.5
|
|
2,425.0
|
|
1,850.0
|
|
|||||||||||
|
Current maturities
|
(256.5
|
)
|
—
|
|
(250.0
|
)
|
(855.7
|
)
|
(350.0
|
)
|
—
|
|
|||||||||||
|
Unamortized debt issuance costs
|
(32.1
|
)
|
(17.2
|
)
|
(9.6
|
)
|
(25.4
|
)
|
(14.3
|
)
|
(10.5
|
)
|
|||||||||||
|
Unamortized debt (discount) and premium, net
|
(11.8
|
)
|
(5.5
|
)
|
(5.5
|
)
|
(10.8
|
)
|
(4.7
|
)
|
(6.1
|
)
|
|||||||||||
|
Long-term debt, net (e)
|
|
$5,246.3
|
|
|
$2,552.3
|
|
|
$1,584.9
|
|
|
$4,010.6
|
|
|
$2,056.0
|
|
|
$1,833.4
|
|
|||||
|
(a)
|
Contains optional redemption provisions which, if elected by the issuer at its sole discretion, could require material redemption premium payments by the issuer. The redemption premium payments under these optional redemption provisions are variable and dependent on applicable U.S. Treasury rates at the time of redemption.
|
|
(b)
|
In September 2018, IPL issued
$500 million
of 4.1% senior debentures due 2028. The senior debentures were issued as green bonds, and all of the net proceeds were allocated for the construction and development of wind and solar projects.
|
|
(c)
|
In April 2018, AEF entered into a
$300 million
variable-rate term loan credit agreement and used the proceeds from borrowings under this agreement for general corporate purposes. Refer to
Note 9(a)
for discussion of a financial covenant contained in AEF’s term loan credit agreement.
|
|
(d)
|
In June 2018, AEF issued
$400 million
of 3.75% senior notes due 2023 and
$300 million
of 4.25% senior notes due 2028. The proceeds from the issuances were used by AEF to retire its
$500 million
and
$95 million
variable-rate term loan credit agreements expiring in 2018, to reduce Alliant Energy’s outstanding commercial paper and for general corporate purposes.
|
|
(e)
|
There were no significant sinking fund requirements related to the outstanding long-term debt.
|
|
76
|
||
Five-Year Schedule of Long-term Debt Maturities
- At
December 31, 2018
, long-term debt maturities for
2019
through
2023
were as follows (in millions):
|
2019
|
2020
|
2021
|
2022
|
2023
|
|||||||||||||||
|
IPL
|
|
$—
|
|
|
$200
|
|
|
$—
|
|
|
$—
|
|
|
$—
|
|
||||
|
WPL
|
250
|
|
150
|
|
—
|
|
250
|
|
—
|
|
|||||||||
|
Corporate Services
|
—
|
|
—
|
|
—
|
|
75
|
|
—
|
|
|||||||||
|
AEF
|
6
|
|
307
|
|
8
|
|
8
|
|
408
|
|
|||||||||
|
Alliant Energy
|
|
$256
|
|
|
$657
|
|
|
$8
|
|
|
$333
|
|
|
$408
|
|
||||
Fair Value of Long-term Debt
- Refer to
Note 16
for information on the fair value of long-term debt outstanding.
NOTE 10. LEASES
NOTE 10(a) Operating Leases -
Various agreements have been entered into related to property, plant and equipment rights that are accounted for as operating leases. In
2018
,
2017
and
2016
, rental expenses associated with operating leases were not material. At
December 31, 2018
, future minimum operating lease payments, excluding contingent rentals, were as follows (in millions):
|
2019
|
2020
|
2021
|
2022
|
2023
|
Thereafter
|
Total
|
|||||||||||||||||||||
|
Alliant Energy
|
|
$5
|
|
|
$5
|
|
|
$3
|
|
|
$3
|
|
|
$2
|
|
|
$12
|
|
|
$30
|
|
||||||
|
IPL
|
3
|
|
2
|
|
2
|
|
2
|
|
2
|
|
12
|
|
23
|
|
|||||||||||||
|
WPL
|
2
|
|
3
|
|
1
|
|
—
|
|
—
|
|
—
|
|
6
|
|
|||||||||||||
NOTE 10(b) Capital Leases -
WPL
-
In 2005, WPL entered into a
20
-year agreement with AEF’s Non-utility Generation business to lease the Sheboygan Falls Energy Facility, with an option for
two
lease renewal periods thereafter. The lease became effective in 2005 when the EGU began commercial operation. WPL is responsible for the operation of the EGU and has exclusive rights to its output, and the PSCW approved this affiliated lease agreement in 2005. The capital lease asset is amortized using the straight-line method over the
20
-year lease term. WPL’s retail and wholesale rates include recovery of the Sheboygan Falls Energy Facility lease payments. The Sheboygan Falls Energy Facility lease expenses were included in WPL’s income statements as follows (in millions):
|
2018
|
2017
|
2016
|
|||||||||
|
Interest expense
|
|
$8
|
|
|
$9
|
|
|
$9
|
|
||
|
Depreciation and amortization
|
6
|
|
6
|
|
6
|
|
|||||
|
|
$14
|
|
|
$15
|
|
|
$15
|
|
|||
At
December 31, 2018
, WPL’s estimated future minimum capital lease payments for the Sheboygan Falls Energy Facility were as follows (in millions):
|
2019
|
2020
|
2021
|
2022
|
2023
|
Thereafter
|
Total
|
Less: amount representing interest
|
Present value of minimum capital lease payments
|
|||||||||
|
Sheboygan Falls Energy Facility
|
$15
|
$15
|
$15
|
$15
|
$15
|
$19
|
$94
|
$26
|
$68
|
||||||||
NOTE 11. REVENUES
Revenues from Alliant Energy’s, IPL’s and WPL’s utility businesses are primarily from electric and gas sales provided to customers based on approved tariffs or specific contracts with customers. IPL’s and WPL’s primary performance obligations under such arrangements are to deliver electricity and gas, and their customers simultaneously receive and consume the electricity and gas. For such arrangements, revenues are recognized equivalent to the value of the electricity or gas supplied during each period, including amounts billed during each period and changes in amounts estimated to be billed at the end of each period. IPL and WPL apply the right to invoice method to measure progress towards completing performance obligations to transfer electricity and gas to their customers.
IPL provides retail electric and gas service to customers in Iowa, and WPL provides retail and wholesale electric and retail gas service to customers in Wisconsin. IPL also sells electricity to wholesale customers in Minnesota, Illinois and Iowa, as well as steam from its Prairie Creek Generating Station to high-pressure steam customers in Iowa.
IPL’s and WPL’s retail electric and gas revenues include sales to residential, commercial and industrial customers. IPL’s and WPL’s retail electric and gas customer prices are based on IPL’s and WPL’s cost of service and are determined through
|
77
|
||
general rate review proceedings and various tariff filings with the IUB and PSCW, respectively. Such tariff-based services provide electricity or gas to customers without a defined contractual term.
IPL and WPL have wholesale electric market-based rate authority from FERC allowing them to participate in wholesale energy markets (e.g. MISO) and transact directly with third parties. This authority from FERC allows sales of electricity referred to as bulk power sales based on current market values. FERC also allows IPL and WPL to enter into power supply agreements with municipalities and rural electric cooperatives with defined contractual terms, which include standard pricing mechanisms that are detailed in current tariffs accepted by FERC through wholesale rate review proceedings.
Revenues from Alliant Energy’s non-utility business customers are primarily from its Transportation business, which includes a short-line railway that provides freight service, hauling services on the Mississippi River, and other transfer and storage services.
As of
December 31, 2018
, revenue expected to be recognized in any future year related to remaining performance obligations is not material, as the majority of revenues are recognized as services are rendered or commodities are delivered, and are from contracts with durations of less than one year. Alliant Energy, IPL and WPL do not have any material contract assets or contract liabilities, or contract acquisition fulfillment costs.
Disaggregation of revenues from contracts with customers, which correlates to revenues for each reportable segment, was as follows (in millions):
|
Alliant Energy
|
IPL
|
WPL
|
|||||||||||||||||||||||||||||||||
|
2018
|
2017
|
2016
|
2018
|
2017
|
2016
|
2018
|
2017
|
2016
|
|||||||||||||||||||||||||||
|
Electric Utility:
|
|||||||||||||||||||||||||||||||||||
|
Retail - residential
|
|
$1,063.4
|
|
|
$1,006.2
|
|
|
$1,001.1
|
|
|
$590.6
|
|
|
$535.6
|
|
|
$536.7
|
|
|
$472.8
|
|
|
$470.6
|
|
|
$464.4
|
|
||||||||
|
Retail - commercial
|
735.6
|
|
710.3
|
|
712.6
|
|
486.8
|
|
452.7
|
|
445.4
|
|
248.8
|
|
257.6
|
|
267.2
|
|
|||||||||||||||||
|
Retail - industrial
|
888.8
|
|
853.1
|
|
851.1
|
|
500.8
|
|
459.7
|
|
460.4
|
|
388.0
|
|
393.4
|
|
390.7
|
|
|||||||||||||||||
|
Wholesale
|
188.4
|
|
238.4
|
|
256.6
|
|
71.2
|
|
95.5
|
|
94.2
|
|
117.2
|
|
142.9
|
|
162.4
|
|
|||||||||||||||||
|
Bulk power and other
|
124.1
|
|
86.7
|
|
54.1
|
|
81.7
|
|
55.4
|
|
33.0
|
|
42.4
|
|
31.3
|
|
21.1
|
|
|||||||||||||||||
|
Total Electric Utility
|
3,000.3
|
|
2,894.7
|
|
2,875.5
|
|
1,731.1
|
|
1,598.9
|
|
1,569.7
|
|
1,269.2
|
|
1,295.8
|
|
1,305.8
|
|
|||||||||||||||||
|
Gas Utility:
|
|||||||||||||||||||||||||||||||||||
|
Retail - residential
|
254.4
|
|
224.7
|
|
197.6
|
|
152.3
|
|
123.2
|
|
110.6
|
|
102.1
|
|
101.5
|
|
87.0
|
|
|||||||||||||||||
|
Retail - commercial
|
133.0
|
|
123.2
|
|
109.6
|
|
75.9
|
|
67.9
|
|
61.9
|
|
57.1
|
|
55.3
|
|
47.7
|
|
|||||||||||||||||
|
Retail - industrial
|
14.9
|
|
16.7
|
|
15.2
|
|
10.2
|
|
11.1
|
|
10.6
|
|
4.7
|
|
5.6
|
|
4.6
|
|
|||||||||||||||||
|
Transportation/other
|
44.3
|
|
36.3
|
|
33.0
|
|
27.8
|
|
23.8
|
|
20.9
|
|
16.5
|
|
12.5
|
|
12.1
|
|
|||||||||||||||||
|
Total Gas Utility
|
446.6
|
|
400.9
|
|
355.4
|
|
266.2
|
|
226.0
|
|
204.0
|
|
180.4
|
|
174.9
|
|
151.4
|
|
|||||||||||||||||
|
Other Utility:
|
|||||||||||||||||||||||||||||||||||
|
Steam
|
35.2
|
|
34.6
|
|
33.9
|
|
35.2
|
|
34.6
|
|
33.9
|
|
—
|
|
—
|
|
—
|
|
|||||||||||||||||
|
Other utility
|
12.8
|
|
12.9
|
|
14.7
|
|
9.8
|
|
10.8
|
|
12.8
|
|
3.0
|
|
2.1
|
|
1.9
|
|
|||||||||||||||||
|
Total Other Utility
|
48.0
|
|
47.5
|
|
48.6
|
|
45.0
|
|
45.4
|
|
46.7
|
|
3.0
|
|
2.1
|
|
1.9
|
|
|||||||||||||||||
|
Non-Utility and Other:
|
|||||||||||||||||||||||||||||||||||
|
Transportation and other
|
39.6
|
|
39.1
|
|
40.5
|
|
—
|
|
—
|
|
—
|
|
—
|
|
—
|
|
—
|
|
|||||||||||||||||
|
Total Non-Utility and Other
|
39.6
|
|
39.1
|
|
40.5
|
|
—
|
|
—
|
|
—
|
|
—
|
|
—
|
|
—
|
|
|||||||||||||||||
|
Total revenues
|
|
$3,534.5
|
|
|
$3,382.2
|
|
|
$3,320.0
|
|
|
$2,042.3
|
|
|
$1,870.3
|
|
|
$1,820.4
|
|
|
$1,452.6
|
|
|
$1,472.8
|
|
|
$1,459.1
|
|
||||||||
NOTE 12. INCOME TAXES
Federal Tax Reform Adjustments
-
In December 2017, Federal Tax Reform was enacted, which had a material impact on Alliant Energy’s, IPL’s and WPL’s 2017 financial statements since changes in tax laws must be recognized in the period in which the law is enacted. The most significant provision of Federal Tax Reform that impact Alliant Energy, IPL and WPL was the reduction in the federal corporate tax rate from
35%
to
21%
. As a result of Federal Tax Reform, at December 31, 2017, Alliant Energy’s, IPL’s and WPL’s regulated utility operations recorded the net impacts from re-measuring deferred tax assets and liabilities as a change in regulatory liabilities or regulatory assets. Alliant Energy’s, IPL’s and WPL’s non-utility operations recorded the net change in deferred tax assets and liabilities to “Income tax expense (benefit)” in their respective income statement or as an increase to “Other liabilities” or decrease in “ATC Holdings” on Alliant Energy’s balance sheet. As a result of Federal Tax Reform, Alliant Energy, IPL and WPL recorded tax expense (benefits) in their 2017 income statements of
($18.1) million
,
$3.8 million
, and
($14.5) million
, respectively.
|
78
|
||
In 2018, additional rules were issued related to Federal Tax Reform, including clarifications of the treatment of bonus depreciation deductions, which impacted the federal income tax return for the calendar year 2017. As result of these clarifying rules, Alliant Energy, IPL and WPL recorded tax benefits of
$5.6 million
,
$1.1 million
and
$5.5 million
, respectively, in 2018.
Iowa Tax Reform
-
In May 2018, Iowa tax reform was enacted, resulting in a reduction in the Iowa income tax rate from
12%
to
9.8%
, effective January 1, 2021 and the elimination of the deduction for federal income taxes, effective January 1, 2022. Alliant Energy’s and IPL’s deferred tax assets and liabilities as of June 30, 2018 were remeasured based upon the new tax rate, and as a result, Alliant Energy’s and IPL’s tax-related regulatory assets decreased
$33.7 million
and tax-related regulatory liabilities increased
$7.3 million
in the second quarter of 2018.
Income Tax Expense (Benefit)
-
The components of “Income tax expense (benefit)” in the income statements were as follows (in millions):
|
Alliant Energy
|
IPL
|
WPL
|
|||||||||||||||||||||||||||||||||
|
2018
|
2017
|
2016
|
2018
|
2017
|
2016
|
2018
|
2017
|
2016
|
|||||||||||||||||||||||||||
|
Current tax expense (benefit):
|
|||||||||||||||||||||||||||||||||||
|
Federal
|
|
($1.0
|
)
|
|
($41.0
|
)
|
|
$1.8
|
|
|
$14.9
|
|
|
($27.9
|
)
|
|
($12.8
|
)
|
|
($9.2
|
)
|
|
$5.5
|
|
|
($22.3
|
)
|
||||||||
|
State
|
(5.1
|
)
|
8.5
|
|
17.2
|
|
(7.1
|
)
|
1.6
|
|
15.5
|
|
(4.4
|
)
|
2.5
|
|
1.1
|
|
|||||||||||||||||
|
IPL’s tax benefit riders
|
(13.2
|
)
|
(40.4
|
)
|
(44.2
|
)
|
(13.2
|
)
|
(40.4
|
)
|
(44.2
|
)
|
—
|
|
—
|
|
—
|
|
|||||||||||||||||
|
Deferred tax expense (benefit):
|
|||||||||||||||||||||||||||||||||||
|
Federal
|
67.9
|
|
159.5
|
|
112.8
|
|
9.5
|
|
72.5
|
|
59.1
|
|
43.8
|
|
55.0
|
|
112.3
|
|
|||||||||||||||||
|
State
|
29.8
|
|
12.3
|
|
4.9
|
|
7.3
|
|
(2.2
|
)
|
(9.0
|
)
|
22.1
|
|
16.6
|
|
20.8
|
|
|||||||||||||||||
|
Production tax credits
|
(29.5
|
)
|
(31.1
|
)
|
(31.8
|
)
|
(14.0
|
)
|
(14.1
|
)
|
(14.0
|
)
|
(15.5
|
)
|
(17.0
|
)
|
(17.8
|
)
|
|||||||||||||||||
|
Investment tax credits
|
(1.2
|
)
|
(1.1
|
)
|
(1.3
|
)
|
(0.6
|
)
|
(0.4
|
)
|
(0.5
|
)
|
(0.6
|
)
|
(0.7
|
)
|
(0.8
|
)
|
|||||||||||||||||
|
|
$47.7
|
|
|
$66.7
|
|
|
$59.4
|
|
|
($3.2
|
)
|
|
($10.9
|
)
|
|
($5.9
|
)
|
|
$36.2
|
|
|
$61.9
|
|
|
$93.3
|
|
|||||||||
Income Tax Rates
-
The overall income tax rates shown in the following table were computed by dividing income tax expense (benefit) by income from continuing operations before income taxes.
|
Alliant Energy
|
IPL
|
WPL
|
||||||||||||||||||||||||
|
2018
|
2017
|
2016
|
2018
|
2017
|
2016
|
2018
|
2017
|
2016
|
||||||||||||||||||
|
Statutory federal income tax rate
|
21.0
|
%
|
35.0
|
%
|
35.0
|
%
|
21.0
|
%
|
35.0
|
%
|
35.0
|
%
|
21.0
|
%
|
35.0
|
%
|
35.0
|
%
|
||||||||
|
State income taxes, net of federal benefits
|
7.0
|
|
5.5
|
|
5.4
|
|
7.7
|
|
6.5
|
|
6.4
|
|
6.2
|
|
5.1
|
|
5.1
|
|
||||||||
|
Effect of rate-making on property-related differences
|
(7.6
|
)
|
(8.5
|
)
|
(8.5
|
)
|
(14.0
|
)
|
(19.1
|
)
|
(16.2
|
)
|
(2.3
|
)
|
(1.7
|
)
|
(0.7
|
)
|
||||||||
|
Production tax credits
|
(5.2
|
)
|
(6.1
|
)
|
(7.2
|
)
|
(5.2
|
)
|
(6.7
|
)
|
(6.3
|
)
|
(6.4
|
)
|
(7.1
|
)
|
(6.2
|
)
|
||||||||
|
IPL’s tax benefit riders
|
(2.3
|
)
|
(7.6
|
)
|
(10.0
|
)
|
(4.9
|
)
|
(18.7
|
)
|
(20.1
|
)
|
—
|
|
—
|
|
—
|
|
||||||||
|
Adjustment for prior period taxes
|
(2.3
|
)
|
(1.5
|
)
|
(0.8
|
)
|
(4.8
|
)
|
(3.4
|
)
|
(1.2
|
)
|
(0.2
|
)
|
—
|
|
(0.1
|
)
|
||||||||
|
Federal Tax Reform adjustments
|
(1.0
|
)
|
(3.4
|
)
|
—
|
|
(0.4
|
)
|
1.7
|
|
—
|
|
(2.3
|
)
|
(5.8
|
)
|
—
|
|
||||||||
|
Other items, net
|
(1.2
|
)
|
(0.9
|
)
|
(0.5
|
)
|
(0.6
|
)
|
(0.3
|
)
|
(0.3
|
)
|
(1.2
|
)
|
(0.6
|
)
|
(0.5
|
)
|
||||||||
|
Overall income tax rate
|
8.4
|
%
|
12.5
|
%
|
13.4
|
%
|
(1.2
|
%)
|
(5.0
|
%)
|
(2.7
|
%)
|
14.8
|
%
|
24.9
|
%
|
32.6
|
%
|
||||||||
|
79
|
||
Deferred Tax Assets and Liabilities
-
The deferred tax assets and liabilities included on the balance sheets at December 31 arise from the following temporary differences (in millions):
|
Alliant Energy
|
IPL
|
WPL
|
|||||||||||||||||||||
|
2018
|
2017
|
2018
|
2017
|
2018
|
2017
|
||||||||||||||||||
|
Deferred tax liabilities:
|
|||||||||||||||||||||||
|
Property
|
|
$1,975.5
|
|
|
$1,852.7
|
|
|
$1,158.4
|
|
|
$1,102.6
|
|
|
$735.2
|
|
|
$674.2
|
|
|||||
|
ATC Holdings
|
102.4
|
|
86.4
|
|
—
|
|
—
|
|
—
|
|
—
|
|
|||||||||||
|
Other
|
80.5
|
|
75.9
|
|
69.4
|
|
63.4
|
|
34.4
|
|
36.5
|
|
|||||||||||
|
Total deferred tax liabilities
|
2,158.4
|
|
2,015.0
|
|
1,227.8
|
|
1,166.0
|
|
769.6
|
|
710.7
|
|
|||||||||||
|
Deferred tax assets:
|
|||||||||||||||||||||||
|
Federal credit carryforwards
|
299.1
|
|
260.7
|
|
133.2
|
|
113.1
|
|
147.4
|
|
131.0
|
|
|||||||||||
|
Net operating losses carryforwards - federal
|
158.6
|
|
174.4
|
|
114.1
|
|
107.4
|
|
26.4
|
|
43.7
|
|
|||||||||||
|
Net operating losses carryforwards - state
|
47.0
|
|
41.3
|
|
0.9
|
|
0.9
|
|
0.5
|
|
0.2
|
|
|||||||||||
|
Other
|
59.8
|
|
69.2
|
|
22.8
|
|
34.5
|
|
14.1
|
|
14.7
|
|
|||||||||||
|
Subtotal deferred tax assets
|
564.5
|
|
545.6
|
|
271.0
|
|
255.9
|
|
188.4
|
|
189.6
|
|
|||||||||||
|
Valuation allowances
|
(9.2
|
)
|
(9.0
|
)
|
(0.5
|
)
|
(0.6
|
)
|
(0.8
|
)
|
(1.3
|
)
|
|||||||||||
|
Total deferred tax assets
|
555.3
|
|
536.6
|
|
270.5
|
|
255.3
|
|
187.6
|
|
188.3
|
|
|||||||||||
|
Total deferred tax liabilities, net
|
|
$1,603.1
|
|
|
$1,478.4
|
|
|
$957.3
|
|
|
$910.7
|
|
|
$582.0
|
|
|
$522.4
|
|
|||||
Carryforwards -
At
December 31, 2018
, carryforwards and expiration dates were estimated as follows (in millions):
|
Range of Expiration Dates
|
Alliant Energy
|
IPL
|
WPL
|
||||||||||
|
Federal net operating losses
|
2031-2037
|
|
$766
|
|
|
$551
|
|
|
$126
|
|
|||
|
State net operating losses
|
2018-2038
|
792
|
|
13
|
|
8
|
|
||||||
|
Federal tax credits
|
2022-2038
|
299
|
|
133
|
|
147
|
|
||||||
Valuation Allowances
- Due to the anticipated future reductions in revenues from utility customers due to Federal Tax Reform, Alliant Energy expects its Federal net operating losses carryforwards will not be fully utilized until 2024. Because taxable income must be reduced by net operating losses carryforwards prior to utilizing federal tax credit carryforwards, Alliant Energy currently does not expect to utilize 2002 and 2003 vintage federal credit carryforwards prior to their expiration in 2022 and 2023, respectively. As a result, Alliant Energy established valuation allowances for the 2002 and 2003 vintage federal credit carryforwards in 2017 that remain as of December 31, 2018.
Uncertain Tax Positions
-
At
December 31, 2018
,
2017
and
2016
, there were no uncertain tax positions or penalties accrued related to uncertain tax positions. As of
December 31, 2018
, no material changes to unrecognized tax benefits are expected during the next 12 months.
Open tax years -
Tax years that remain subject to the statute of limitations in the major jurisdictions for each of Alliant Energy, IPL and WPL are as follows:
|
Consolidated federal income tax returns (a)
|
2015
|
-
|
2017
|
|
Consolidated Iowa income tax returns (b)
|
2015
|
-
|
2017
|
|
Wisconsin combined tax returns (c)
|
2014
|
-
|
2017
|
|
(a)
|
These federal tax returns are effectively settled as a result of participation in the IRS Compliance Assurance Program, which allows Alliant Energy and the IRS to work together to resolve issues related to Alliant Energy’s current tax year before filing its federal income tax return. The statute of limitations for these federal tax returns expires
three
years from each filing date.
|
|
(b)
|
The statute of limitations for these Iowa tax returns expires
three
years from each filing date.
|
|
(c)
|
The statute of limitations for these Wisconsin combined tax returns expires
four
years from each filing date.
|
NOTE 13. BENEFIT PLANS
NOTE 13(a) Pension and Other Postretirement Benefits Plans -
Retirement benefits are provided to substantially all employees through various qualified and non-qualified non-contributory defined benefit pension plans (currently closed to new hires), and/or through defined contribution plans (including 401(k) savings plans). Benefits of the non-contributory defined benefit pension plans are based on the plan participant’s years of service, age and compensation. Benefits of the defined contribution plans are based on the plan participant’s years of service, age, compensation and contributions. Certain
|
80
|
||
defined benefit postretirement health care and life benefits are provided to eligible retirees. In general, the retiree health care plans consist of fixed benefit subsidy structures and the retiree life insurance plans are non-contributory.
IPL and WPL account for their participation in Alliant Energy and Corporate Services sponsored plans as multiple-employer plans. In IPL’s and WPL’s tables below, the defined benefit pension plan amounts represent those respective amounts for their bargaining unit employees covered under the qualified plans that they sponsor, as well as amounts directly assigned to them related to their current and former non-bargaining employees who are participants in the Alliant Energy and Corporate Services sponsored qualified and non-qualified defined benefit pension plans. In IPL’s and WPL’s tables below, the OPEB plan amounts represent respective amounts for their employees, as well as amounts directly assigned to them related to their current and former non-bargaining employees who are participants in the Corporate Services sponsored OPEB plan.
Assumptions
- The assumptions for defined benefit pension and OPEB plans at the measurement date of December 31 were as follows:
|
Defined Benefit Pension Plans
|
OPEB Plans
|
|||||||||||||||||||
|
Alliant Energy
|
2018
|
2017
|
2016
|
2018
|
2017
|
2016
|
||||||||||||||
|
Discount rate for benefit obligations
|
4.34%
|
3.66%
|
4.19%
|
4.24%
|
3.53%
|
3.98%
|
||||||||||||||
|
Discount rate for net periodic cost
|
3.66%
|
4.19%
|
4.47%
|
3.53%
|
3.98%
|
4.30%
|
||||||||||||||
|
Expected rate of return on plan assets
|
7.60%
|
7.60%
|
7.60%
|
5.44%
|
5.80%
|
6.30%
|
||||||||||||||
|
Interest crediting rate for Alliant Energy Cash Balance Pension Plan
|
5.04%
|
4.64%
|
3.17%
|
N/A
|
N/A
|
N/A
|
||||||||||||||
|
Rate of compensation increase
|
3.65
|
%
|
-
|
4.50%
|
3.65
|
%
|
-
|
4.50%
|
3.65
|
%
|
-
|
4.50%
|
N/A
|
N/A
|
N/A
|
|||||
|
Medical cost trend on covered charges:
|
||||||||||||||||||||
|
Initial trend rate (end of year)
|
N/A
|
N/A
|
N/A
|
6.50%
|
6.75%
|
7.00%
|
||||||||||||||
|
Ultimate trend rate
|
N/A
|
N/A
|
N/A
|
5.00%
|
5.00%
|
5.00%
|
||||||||||||||
|
Qualified Defined Benefit Pension Plan
|
OPEB Plans
|
||||||||||
|
IPL
|
2018
|
2017
|
2016
|
2018
|
2017
|
2016
|
|||||
|
Discount rate for benefit obligations
|
4.35%
|
3.68%
|
4.22%
|
4.23%
|
3.51%
|
3.95%
|
|||||
|
Discount rate for net periodic cost
|
3.68%
|
4.22%
|
4.50%
|
3.51%
|
3.95%
|
4.28%
|
|||||
|
Expected rate of return on plan assets
|
7.60%
|
7.60%
|
7.60%
|
5.60%
|
6.20%
|
6.60%
|
|||||
|
Rate of compensation increase
|
3.65%
|
3.65%
|
3.65%
|
N/A
|
N/A
|
N/A
|
|||||
|
Medical cost trend on covered charges:
|
|||||||||||
|
Initial trend rate (end of year)
|
N/A
|
N/A
|
N/A
|
6.50%
|
6.75%
|
7.00%
|
|||||
|
Ultimate trend rate
|
N/A
|
N/A
|
N/A
|
5.00%
|
5.00%
|
5.00%
|
|||||
|
Qualified Defined Benefit Pension Plan
|
OPEB Plans
|
||||||||||
|
WPL
|
2018
|
2017
|
2016
|
2018
|
2017
|
2016
|
|||||
|
Discount rate for benefit obligations
|
4.35%
|
3.69%
|
4.23%
|
4.23%
|
3.51%
|
3.96%
|
|||||
|
Discount rate for net periodic cost
|
3.69%
|
4.23%
|
4.51%
|
3.51%
|
3.96%
|
4.28%
|
|||||
|
Expected rate of return on plan assets
|
7.60%
|
7.60%
|
7.60%
|
3.84%
|
3.50%
|
4.70%
|
|||||
|
Rate of compensation increase
|
3.65%
|
3.65%
|
3.65%
|
N/A
|
N/A
|
N/A
|
|||||
|
Medical cost trend on covered charges:
|
|||||||||||
|
Initial trend rate (end of year)
|
N/A
|
N/A
|
N/A
|
6.50%
|
6.75%
|
7.00%
|
|||||
|
Ultimate trend rate
|
N/A
|
N/A
|
N/A
|
5.00%
|
5.00%
|
5.00%
|
|||||
Expected rate of return on plan assets -
The expected rate of return on plan assets is based on projected asset class returns using target allocations. A forward-looking building blocks approach is used, and historical returns, survey information and capital market information are analyzed to support the expected rate of return on plan assets assumption. Refer to “Investment Strategy for Plan Assets” below for additional information related to investment strategy and mix of assets for the pension and OPEB plans.
Life Expectancy -
The life expectancy assumption is used in determining the benefit obligation and net periodic benefit cost for defined benefit pension and OPEB plans. This assumption utilizes base mortality tables that were released in 2014 by the Society of Actuaries, and was updated in 2016 and 2018.
|
81
|
||
Net Periodic Benefit Costs
-
The components of net periodic benefit costs for sponsored defined benefit pension and OPEB plans are included in the tables below (in millions). The service cost component of net periodic benefit costs is included in “Other operation and maintenance” expenses in the income statements and all other components of net periodic benefit costs are included in “Other (income) and deductions” in the income statements.
|
Alliant Energy
|
Defined Benefit Pension Plans
|
OPEB Plans
|
|||||||||||||||||||||
|
2018
|
2017
|
2016
|
2018
|
2017
|
2016
|
||||||||||||||||||
|
Service cost
|
|
$12.1
|
|
|
$12.5
|
|
|
$12.6
|
|
|
$4.2
|
|
|
$5.0
|
|
|
$5.3
|
|
|||||
|
Interest cost
|
46.8
|
|
51.0
|
|
53.0
|
|
7.7
|
|
8.6
|
|
9.4
|
|
|||||||||||
|
Expected return on plan assets (a)
|
(69.7
|
)
|
(65.5
|
)
|
(65.5
|
)
|
(6.0
|
)
|
(6.1
|
)
|
(6.1
|
)
|
|||||||||||
|
Amortization of prior service credit (b)
|
(0.7
|
)
|
(0.4
|
)
|
(0.3
|
)
|
(0.2
|
)
|
(0.2
|
)
|
(4.1
|
)
|
|||||||||||
|
Amortization of actuarial loss (c)
|
35.2
|
|
37.6
|
|
37.4
|
|
3.4
|
|
3.8
|
|
4.7
|
|
|||||||||||
|
Settlement losses (d)
|
—
|
|
0.9
|
|
—
|
|
—
|
|
—
|
|
—
|
|
|||||||||||
|
|
$23.7
|
|
|
$36.1
|
|
|
$37.2
|
|
|
$9.1
|
|
|
$11.1
|
|
|
$9.2
|
|
||||||
|
IPL
|
Defined Benefit Pension Plans
|
OPEB Plans
|
|||||||||||||||||||||
|
2018
|
2017
|
2016
|
2018
|
2017
|
2016
|
||||||||||||||||||
|
Service cost
|
|
$7.4
|
|
|
$7.3
|
|
|
$7.5
|
|
|
$1.7
|
|
|
$2.1
|
|
|
$2.3
|
|
|||||
|
Interest cost
|
21.4
|
|
23.5
|
|
24.5
|
|
3.1
|
|
3.5
|
|
3.8
|
|
|||||||||||
|
Expected return on plan assets (a)
|
(32.6
|
)
|
(30.8
|
)
|
(30.9
|
)
|
(4.4
|
)
|
(4.3
|
)
|
(4.3
|
)
|
|||||||||||
|
Amortization of prior service credit (b)
|
(0.2
|
)
|
(0.2
|
)
|
(0.2
|
)
|
—
|
|
—
|
|
(2.6
|
)
|
|||||||||||
|
Amortization of actuarial loss (c)
|
14.9
|
|
16.1
|
|
16.5
|
|
1.3
|
|
2.0
|
|
2.6
|
|
|||||||||||
|
|
$10.9
|
|
|
$15.9
|
|
|
$17.4
|
|
|
$1.7
|
|
|
$3.3
|
|
|
$1.8
|
|
||||||
|
WPL
|
Defined Benefit Pension Plans
|
OPEB Plans
|
|||||||||||||||||||||
|
2018
|
2017
|
2016
|
2018
|
2017
|
2016
|
||||||||||||||||||
|
Service cost
|
|
$4.4
|
|
|
$4.9
|
|
|
$4.9
|
|
|
$1.6
|
|
|
$1.9
|
|
|
$2.0
|
|
|||||
|
Interest cost
|
20.2
|
|
21.8
|
|
22.3
|
|
3.1
|
|
3.4
|
|
3.8
|
|
|||||||||||
|
Expected return on plan assets (a)
|
(30.4
|
)
|
(28.5
|
)
|
(28.3
|
)
|
(0.6
|
)
|
(0.8
|
)
|
(0.8
|
)
|
|||||||||||
|
Amortization of prior service cost (credit) (b)
|
(0.1
|
)
|
0.1
|
|
0.2
|
|
(0.2
|
)
|
(0.2
|
)
|
(0.9
|
)
|
|||||||||||
|
Amortization of actuarial loss (c)
|
17.2
|
|
18.5
|
|
17.6
|
|
2.0
|
|
1.6
|
|
1.8
|
|
|||||||||||
|
|
$11.3
|
|
|
$16.8
|
|
|
$16.7
|
|
|
$5.9
|
|
|
$5.9
|
|
|
$5.9
|
|
||||||
|
(a)
|
The expected return on plan assets is based on the expected rate of return on plan assets and the fair value approach to the market-related value of plan assets.
|
|
(b)
|
Unrecognized prior service costs (credits) for the OPEB plans are amortized over the average future service period to full eligibility of the participants of each plan.
|
|
(c)
|
Unrecognized net actuarial gains or losses in excess of 10% of the greater of the plans’ benefit obligations or assets are amortized over the average future service lives of plan participants, except for the Alliant Energy Cash Balance Pension Plan where gains or losses outside the 10% threshold are amortized over the time period the participants are expected to receive benefits.
|
|
(d)
|
Settlement losses related to payments made to retired executives of Alliant Energy.
|
|
82
|
||
Benefit Plan Assets and Obligations
- A reconciliation of the funded status of qualified and non-qualified defined benefit pension and OPEB plans to the amounts recognized on the balance sheets at December 31 was as follows (in millions):
|
Defined Benefit Pension Plans
|
OPEB Plans
|
||||||||||||||
|
Alliant Energy
|
2018
|
2017
|
2018
|
2017
|
|||||||||||
|
Change in benefit obligation:
|
|||||||||||||||
|
Net benefit obligation at January 1
|
|
$1,303.1
|
|
|
$1,244.3
|
|
|
$222.3
|
|
|
$220.1
|
|
|||
|
Service cost
|
12.1
|
|
12.5
|
|
4.2
|
|
5.0
|
|
|||||||
|
Interest cost
|
46.8
|
|
51.0
|
|
7.7
|
|
8.6
|
|
|||||||
|
Plan participants’ contributions
|
—
|
|
—
|
|
3.1
|
|
2.9
|
|
|||||||
|
Actuarial (gain) loss
|
(96.2
|
)
|
83.6
|
|
(8.2
|
)
|
5.4
|
|
|||||||
|
Gross benefits paid
|
(90.8
|
)
|
(88.3
|
)
|
(23.0
|
)
|
(19.7
|
)
|
|||||||
|
Net benefit obligation at December 31
|
1,175.0
|
|
1,303.1
|
|
206.1
|
|
222.3
|
|
|||||||
|
Change in plan assets:
|
|||||||||||||||
|
Fair value of plan assets at January 1
|
950.7
|
|
895.7
|
|
111.1
|
|
105.8
|
|
|||||||
|
Actual return on plan assets
|
(57.8
|
)
|
136.7
|
|
(2.6
|
)
|
12.9
|
|
|||||||
|
Employer contributions
|
6.5
|
|
6.6
|
|
10.5
|
|
9.2
|
|
|||||||
|
Plan participants’ contributions
|
—
|
|
—
|
|
3.1
|
|
2.9
|
|
|||||||
|
Gross benefits paid
|
(90.8
|
)
|
(88.3
|
)
|
(23.0
|
)
|
(19.7
|
)
|
|||||||
|
Fair value of plan assets at December 31
|
808.6
|
|
950.7
|
|
99.1
|
|
111.1
|
|
|||||||
|
Under funded status at December 31
|
|
($366.4
|
)
|
|
($352.4
|
)
|
|
($107.0
|
)
|
|
($111.2
|
)
|
|||
|
Defined Benefit Pension Plans
|
OPEB Plans
|
||||||||||||||
|
Alliant Energy
|
2018
|
2017
|
2018
|
2017
|
|||||||||||
|
Amounts recognized on the balance sheets consist of:
|
|||||||||||||||
|
Non-current assets
|
|
$—
|
|
|
$—
|
|
|
$7.5
|
|
|
$8.8
|
|
|||
|
Current liabilities
|
(2.3
|
)
|
(2.2
|
)
|
(9.6
|
)
|
(9.1
|
)
|
|||||||
|
Pension and other benefit obligations
|
(364.1
|
)
|
(350.2
|
)
|
(104.9
|
)
|
(110.9
|
)
|
|||||||
|
Net amounts recognized at December 31
|
|
($366.4
|
)
|
|
($352.4
|
)
|
|
($107.0
|
)
|
|
($111.2
|
)
|
|||
|
Amounts recognized in Regulatory Assets consist of:
|
|||||||||||||||
|
Net actuarial loss
|
|
$505.2
|
|
|
$509.1
|
|
|
$44.5
|
|
|
$47.4
|
|
|||
|
Prior service credit
|
(5.8
|
)
|
(6.5
|
)
|
(1.1
|
)
|
(1.3
|
)
|
|||||||
|
|
$499.4
|
|
|
$502.6
|
|
|
$43.4
|
|
|
$46.1
|
|
||||
|
Defined Benefit Pension Plans
|
OPEB Plans
|
||||||||||||||
|
IPL
|
2018
|
2017
|
2018
|
2017
|
|||||||||||
|
Change in benefit obligation:
|
|||||||||||||||
|
Net benefit obligation at January 1
|
|
$592.9
|
|
|
$570.4
|
|
|
$89.4
|
|
|
$90.1
|
|
|||
|
Service cost
|
7.4
|
|
7.3
|
|
1.7
|
|
2.1
|
|
|||||||
|
Interest cost
|
21.4
|
|
23.5
|
|
3.1
|
|
3.5
|
|
|||||||
|
Plan participants’ contributions
|
—
|
|
—
|
|
1.0
|
|
1.0
|
|
|||||||
|
Actuarial (gain) loss
|
(44.4
|
)
|
34.9
|
|
(4.3
|
)
|
(0.1
|
)
|
|||||||
|
Gross benefits paid
|
(43.4
|
)
|
(43.2
|
)
|
(8.4
|
)
|
(7.2
|
)
|
|||||||
|
Net benefit obligation at December 31
|
533.9
|
|
592.9
|
|
82.5
|
|
89.4
|
|
|||||||
|
Change in plan assets:
|
|||||||||||||||
|
Fair value of plan assets at January 1
|
443.7
|
|
422.0
|
|
72.9
|
|
68.2
|
|
|||||||
|
Actual return on plan assets
|
(26.8
|
)
|
64.3
|
|
(1.4
|
)
|
8.9
|
|
|||||||
|
Employer contributions
|
4.3
|
|
0.6
|
|
2.6
|
|
2.0
|
|
|||||||
|
Plan participants’ contributions
|
—
|
|
—
|
|
1.0
|
|
1.0
|
|
|||||||
|
Gross benefits paid
|
(43.4
|
)
|
(43.2
|
)
|
(8.4
|
)
|
(7.2
|
)
|
|||||||
|
Fair value of plan assets at December 31
|
377.8
|
|
443.7
|
|
66.7
|
|
72.9
|
|
|||||||
|
Under funded status at December 31
|
|
($156.1
|
)
|
|
($149.2
|
)
|
|
($15.8
|
)
|
|
($16.5
|
)
|
|||
|
83
|
||
|
Defined Benefit Pension Plans
|
OPEB Plans
|
||||||||||||||
|
IPL
|
2018
|
2017
|
2018
|
2017
|
|||||||||||
|
Amounts recognized on the balance sheets consist of:
|
|||||||||||||||
|
Non-current assets
|
|
$—
|
|
|
$—
|
|
|
$4.7
|
|
|
$5.9
|
|
|||
|
Current liabilities
|
(0.6
|
)
|
(0.5
|
)
|
(1.9
|
)
|
(2.0
|
)
|
|||||||
|
Pension and other benefit obligations
|
(155.5
|
)
|
(148.7
|
)
|
(18.6
|
)
|
(20.4
|
)
|
|||||||
|
Net amounts recognized at December 31
|
|
($156.1
|
)
|
|
($149.2
|
)
|
|
($15.8
|
)
|
|
($16.5
|
)
|
|||
|
Amounts recognized in Regulatory Assets consist of:
|
|||||||||||||||
|
Net actuarial loss
|
|
$218.8
|
|
|
$218.9
|
|
|
$18.8
|
|
|
$18.7
|
|
|||
|
Prior service credit
|
(1.8
|
)
|
(2.1
|
)
|
—
|
|
—
|
|
|||||||
|
|
$217.0
|
|
|
$216.8
|
|
|
$18.8
|
|
|
$18.7
|
|
||||
|
Defined Benefit Pension Plans
|
OPEB Plans
|
||||||||||||||
|
WPL
|
2018
|
2017
|
2018
|
2017
|
|||||||||||
|
Change in benefit obligation:
|
|||||||||||||||
|
Net benefit obligation at January 1
|
|
$559.8
|
|
|
$529.2
|
|
|
$90.4
|
|
|
$88.9
|
|
|||
|
Service cost
|
4.4
|
|
4.9
|
|
1.6
|
|
1.9
|
|
|||||||
|
Interest cost
|
20.2
|
|
21.8
|
|
3.1
|
|
3.4
|
|
|||||||
|
Plan participants’ contributions
|
—
|
|
—
|
|
1.4
|
|
1.4
|
|
|||||||
|
Actuarial (gain) loss
|
(40.0
|
)
|
38.3
|
|
(2.5
|
)
|
4.1
|
|
|||||||
|
Gross benefits paid
|
(37.8
|
)
|
(34.4
|
)
|
(10.8
|
)
|
(9.3
|
)
|
|||||||
|
Net benefit obligation at December 31
|
506.6
|
|
559.8
|
|
83.2
|
|
90.4
|
|
|||||||
|
Change in plan assets:
|
|||||||||||||||
|
Fair value of plan assets at January 1
|
415.0
|
|
389.7
|
|
18.7
|
|
18.6
|
|
|||||||
|
Actual return on plan assets
|
(25.1
|
)
|
59.6
|
|
(0.1
|
)
|
1.2
|
|
|||||||
|
Employer contributions
|
0.1
|
|
0.1
|
|
7.5
|
|
6.8
|
|
|||||||
|
Plan participants’ contributions
|
—
|
|
—
|
|
1.4
|
|
1.4
|
|
|||||||
|
Gross benefits paid
|
(37.8
|
)
|
(34.4
|
)
|
(10.8
|
)
|
(9.3
|
)
|
|||||||
|
Fair value of plan assets at December 31
|
352.2
|
|
415.0
|
|
16.7
|
|
18.7
|
|
|||||||
|
Under funded status at December 31
|
|
($154.4
|
)
|
|
($144.8
|
)
|
|
($66.5
|
)
|
|
($71.7
|
)
|
|||
|
Defined Benefit Pension Plans
|
OPEB Plans
|
||||||||||||||
|
WPL
|
2018
|
2017
|
2018
|
2017
|
|||||||||||
|
Amounts recognized on the balance sheets consist of:
|
|||||||||||||||
|
Non-current assets
|
|
$—
|
|
|
$—
|
|
|
$2.8
|
|
|
$2.9
|
|
|||
|
Current liabilities
|
(0.1
|
)
|
(0.1
|
)
|
(7.4
|
)
|
(6.8
|
)
|
|||||||
|
Pension and other benefit obligations
|
(154.3
|
)
|
(144.7
|
)
|
(61.9
|
)
|
(67.8
|
)
|
|||||||
|
Net amounts recognized at December 31
|
|
($154.4
|
)
|
|
($144.8
|
)
|
|
($66.5
|
)
|
|
($71.7
|
)
|
|||
|
Amounts recognized in Regulatory Assets consist of:
|
|||||||||||||||
|
Net actuarial loss
|
|
$223.0
|
|
|
$224.7
|
|
|
$19.9
|
|
|
$23.6
|
|
|||
|
Prior service credit
|
(1.3
|
)
|
(1.5
|
)
|
(1.1
|
)
|
(1.3
|
)
|
|||||||
|
|
$221.7
|
|
|
$223.2
|
|
|
$18.8
|
|
|
$22.3
|
|
||||
Actuarial gains related to benefit obligations in 2018 for defined benefit pension and OPEB plans were primarily due to increases in the discount rates and the impact of the updated mortality table, partially offset by experience losses. Actuarial losses related to benefit obligations in 2017 for defined benefit pension and OPEB plans were primarily due to decreases in the discount rates.
|
84
|
||
Included in the following tables are accumulated benefit obligations, aggregate amounts applicable to defined benefit pension and OPEB plans with accumulated benefit obligations in excess of plan assets, as well as defined benefit pension plans with projected benefit obligations in excess of plan assets as of the December 31 measurement date (in millions):
|
Defined Benefit Pension Plans
|
OPEB Plans
|
||||||||||||||
|
Alliant Energy
|
2018
|
2017
|
2018
|
2017
|
|||||||||||
|
Accumulated benefit obligations
|
|
$1,139.9
|
|
|
$1,269.0
|
|
|
$206.1
|
|
|
$222.3
|
|
|||
|
Plans with accumulated benefit obligations in excess of plan assets:
|
|||||||||||||||
|
Accumulated benefit obligations
|
1,139.9
|
|
1,269.0
|
|
206.1
|
|
222.3
|
|
|||||||
|
Fair value of plan assets
|
808.6
|
|
950.7
|
|
99.1
|
|
111.1
|
|
|||||||
|
Plans with projected benefit obligations in excess of plan assets:
|
|||||||||||||||
|
Projected benefit obligations
|
1,175.0
|
|
1,303.1
|
|
N/A
|
|
N/A
|
|
|||||||
|
Fair value of plan assets
|
808.6
|
|
950.7
|
|
N/A
|
|
N/A
|
|
|||||||
|
Defined Benefit Pension Plans
|
OPEB Plans
|
||||||||||||||
|
IPL
|
2018
|
2017
|
2018
|
2017
|
|||||||||||
|
Accumulated benefit obligations
|
|
$514.3
|
|
|
$573.1
|
|
|
$82.5
|
|
|
$89.4
|
|
|||
|
Plans with accumulated benefit obligations in excess of plan assets:
|
|||||||||||||||
|
Accumulated benefit obligations
|
514.3
|
|
573.1
|
|
82.5
|
|
89.4
|
|
|||||||
|
Fair value of plan assets
|
377.8
|
|
443.7
|
|
66.7
|
|
72.9
|
|
|||||||
|
Plans with projected benefit obligations in excess of plan assets:
|
|||||||||||||||
|
Projected benefit obligations
|
533.9
|
|
592.9
|
|
N/A
|
|
N/A
|
|
|||||||
|
Fair value of plan assets
|
377.8
|
|
443.7
|
|
N/A
|
|
N/A
|
|
|||||||
|
Defined Benefit Pension Plans
|
OPEB Plans
|
||||||||||||||
|
WPL
|
2018
|
2017
|
2018
|
2017
|
|||||||||||
|
Accumulated benefit obligations
|
|
$494.8
|
|
|
$548.1
|
|
|
$83.2
|
|
|
$90.4
|
|
|||
|
Plans with accumulated benefit obligations in excess of plan assets:
|
|||||||||||||||
|
Accumulated benefit obligations
|
494.8
|
|
548.1
|
|
83.2
|
|
90.4
|
|
|||||||
|
Fair value of plan assets
|
352.2
|
|
415.0
|
|
16.7
|
|
18.7
|
|
|||||||
|
Plans with projected benefit obligations in excess of plan assets:
|
|||||||||||||||
|
Projected benefit obligations
|
506.6
|
|
559.8
|
|
N/A
|
|
N/A
|
|
|||||||
|
Fair value of plan assets
|
352.2
|
|
415.0
|
|
N/A
|
|
N/A
|
|
|||||||
In addition to the amounts recognized in regulatory assets in the above tables for IPL and WPL, regulatory assets were recognized for amounts associated with Corporate Services employees participating in other Alliant Energy sponsored benefit plans that were allocated to IPL and WPL at December 31 as follows (in millions):
|
IPL
|
WPL
|
||||||||||||||
|
2018
|
2017
|
2018
|
2017
|
||||||||||||
|
Regulatory assets
|
|
$38.2
|
|
|
$38.9
|
|
|
$27.7
|
|
|
$28.1
|
|
|||
Estimated Future Employer Contributions and Benefit Payments
-
Estimated funding for the qualified and non-qualified defined benefit pension and OPEB plans for
2019
is as follows (in millions):
|
Alliant Energy
|
IPL
|
WPL
|
|||||||||
|
Defined benefit pension plans (a)
|
|
$33.8
|
|
|
$16.5
|
|
|
$15.6
|
|
||
|
OPEB plans
|
9.6
|
|
1.9
|
|
7.4
|
|
|||||
|
(a)
|
Alliant Energy sponsors several non-qualified defined benefit pension plans that cover certain current and former key employees of IPL and WPL. Alliant Energy allocates pension costs to IPL and WPL for these plans. In addition, IPL and WPL amounts reflect funding for their non-bargaining employees who are participants in the Alliant Energy and Corporate Services sponsored qualified and non-qualified defined benefit pension plans.
|
|
85
|
||
Expected benefit payments for the qualified and non-qualified defined benefit plans, which reflect expected future service, as appropriate, are as follows (in millions):
|
Alliant Energy
|
2019
|
2020
|
2021
|
2022
|
2023
|
2024 - 2028
|
|||||||||||||||||
|
Defined benefit pension benefits
|
|
$71.7
|
|
|
$86.1
|
|
|
$74.7
|
|
|
$76.3
|
|
|
$77.8
|
|
|
$388.3
|
|
|||||
|
OPEB
|
19.3
|
|
18.1
|
|
17.8
|
|
17.5
|
|
17.0
|
|
77.7
|
|
|||||||||||
|
|
$91.0
|
|
|
$104.2
|
|
|
$92.5
|
|
|
$93.8
|
|
|
$94.8
|
|
|
$466.0
|
|
||||||
|
IPL
|
2019
|
2020
|
2021
|
2022
|
2023
|
2024 - 2028
|
|||||||||||||||||
|
Defined benefit pension benefits
|
|
$33.0
|
|
|
$35.1
|
|
|
$35.1
|
|
|
$36.4
|
|
|
$37.5
|
|
|
$182.9
|
|
|||||
|
OPEB
|
7.3
|
|
7.3
|
|
7.2
|
|
7.1
|
|
6.9
|
|
31.3
|
|
|||||||||||
|
|
$40.3
|
|
|
$42.4
|
|
|
$42.3
|
|
|
$43.5
|
|
|
$44.4
|
|
|
$214.2
|
|
||||||
|
WPL
|
2019
|
2020
|
2021
|
2022
|
2023
|
2024 - 2028
|
|||||||||||||||||
|
Defined benefit pension benefits
|
|
$31.4
|
|
|
$31.8
|
|
|
$31.9
|
|
|
$32.0
|
|
|
$32.5
|
|
|
$165.3
|
|
|||||
|
OPEB
|
8.8
|
|
7.6
|
|
7.4
|
|
7.1
|
|
6.8
|
|
30.7
|
|
|||||||||||
|
|
$40.2
|
|
|
$39.4
|
|
|
$39.3
|
|
|
$39.1
|
|
|
$39.3
|
|
|
$196.0
|
|
||||||
Investment Strategy for Plan Assets
-
Investment strategies for defined benefit pension and OPEB plan assets combine preservation of principal and prudent risk-taking to protect the integrity of plan assets, in order to meet the obligations to plan participants while minimizing benefit costs over the long term. Investment risk of plan assets is mitigated through diversification, including broad U.S. equity, international equity and fixed income exposure, and global asset and risk parity strategies. Global asset and risk parity strategies may include investments in global equity, global debt, commodities and currencies.
Defined Benefit Pension Plan Assets -
The asset mix of defined benefit pension plans is governed by allocation targets. Historical performance results and future expectations suggest that equity securities will provide higher total investment returns than fixed income securities over a long-term investment horizon. Consistent with the goals of meeting obligations to plan participants and minimizing benefit costs over the long-term, the defined benefit pension plans have a long-term investment posture more heavily weighted toward equity holdings. The asset allocation is monitored regularly and appropriate steps are taken as needed to rebalance the assets within the prescribed ranges. An overlay management service is also used to help maintain target allocations and meet liquidity needs. The overlay manager is authorized to use derivative financial instruments to facilitate this service. For separately managed accounts, prohibited investments include, but are not limited to, direct ownership of real estate, oil and gas limited partnerships, securities of the managers’ firms or affiliate firms, and Alliant Energy securities.
At
December 31, 2018
, the current target ranges and actual allocations for the defined benefit pension plan assets were as follows:
|
Target Range
|
Actual
|
|||||
|
Allocation
|
Allocation
|
|||||
|
Cash and equivalents
|
0
|
%
|
-
|
5%
|
4%
|
|
|
Equity securities - U.S.
|
11
|
%
|
-
|
41%
|
25%
|
|
|
Equity securities - international
|
14
|
%
|
-
|
34%
|
22%
|
|
|
Global asset securities
|
5
|
%
|
-
|
15%
|
9%
|
|
|
Risk parity securities
|
5
|
%
|
-
|
15%
|
10%
|
|
|
Fixed income securities
|
20
|
%
|
-
|
40%
|
30%
|
|
Other Postretirement Benefits Plan Assets -
OPEB plan assets are comprised of specific assets within certain defined benefit pension plans (401(h) assets) as well as assets held in VEBA trusts. The investment strategy of the Corporate Services 401(h) assets mirrors those of the defined benefit pension plans, which are discussed above. For VEBA trusts with assets greater than
$5 million
and the WPL 401(h) assets, the mix among asset classes is governed by allocation targets. The asset allocation is monitored regularly and appropriate steps are taken as needed to rebalance the assets within the prescribed ranges. At
December 31, 2018
, the current target ranges and actual allocations for VEBA trusts with assets greater than
$5 million
and the WPL 401(h) assets were as follows:
|
86
|
||
|
Target Range
|
Actual
|
|||||
|
Allocation
|
Allocation
|
|||||
|
Cash and equivalents
|
0
|
%
|
-
|
5%
|
1%
|
|
|
Equity securities - U.S.
|
0
|
%
|
-
|
46%
|
24%
|
|
|
Equity securities - international
|
0
|
%
|
-
|
34%
|
2%
|
|
|
Fixed income securities
|
20
|
%
|
-
|
100%
|
73%
|
|
Fair Value Measurements
-
Fair value measurement accounting establishes three levels of fair value hierarchy that prioritize the inputs to valuation techniques used to measure fair value. Refer to
Note 16
for discussion of levels within the fair value hierarchy. Level 1 items include investments in securities held in registered investment companies, treasury bills and directly held equity securities, which are valued at the closing price reported in the active market in which the securities are traded. Level 2 items include fixed income securities consisting of corporate and government bonds, which are valued at the closing price reported in the active market for similar assets in which the individual securities are traded or based on yields currently available on comparable securities of issuers with similar credit ratings. Certain investments that are measured at fair value using the net asset value practical expedient have not been classified in the fair value hierarchy. These fair value amounts are included in the tables below to reconcile the fair value hierarchy to the respective total plan assets.
At December 31, the fair values of qualified and non-qualified defined benefit pension plan assets were as follows (in millions):
|
2018
|
2017
|
||||||||||||||||||||||||||||||
|
Fair
|
Level
|
Level
|
Level
|
Fair
|
Level
|
Level
|
Level
|
||||||||||||||||||||||||
|
Alliant Energy
|
Value
|
1
|
2
|
3
|
Value
|
1
|
2
|
3
|
|||||||||||||||||||||||
|
Cash and equivalents
|
|
$36.4
|
|
|
$3.0
|
|
|
$33.4
|
|
|
$—
|
|
|
$28.2
|
|
|
$4.5
|
|
|
$23.7
|
|
|
$—
|
|
|||||||
|
Equity securities - U.S.
|
130.2
|
|
130.2
|
|
—
|
|
—
|
|
158.3
|
|
158.3
|
|
—
|
|
—
|
|
|||||||||||||||
|
Equity securities - international
|
116.0
|
|
116.0
|
|
—
|
|
—
|
|
137.5
|
|
137.5
|
|
—
|
|
—
|
|
|||||||||||||||
|
Global asset securities
|
42.1
|
|
42.1
|
|
—
|
|
—
|
|
49.4
|
|
49.4
|
|
—
|
|
—
|
|
|||||||||||||||
|
Fixed income securities
|
127.8
|
|
52.5
|
|
75.3
|
|
—
|
|
135.9
|
|
55.8
|
|
80.1
|
|
—
|
|
|||||||||||||||
|
Total assets in fair value hierarchy
|
452.5
|
|
|
$343.8
|
|
|
$108.7
|
|
|
$—
|
|
509.3
|
|
|
$405.5
|
|
|
$103.8
|
|
|
$—
|
|
|||||||||
|
Assets measured at net asset value
|
355.4
|
|
441.1
|
|
|||||||||||||||||||||||||||
|
Accrued investment income
|
1.2
|
|
1.0
|
|
|||||||||||||||||||||||||||
|
Due to brokers, net (pending trades with brokers)
|
(0.5
|
)
|
(0.7
|
)
|
|||||||||||||||||||||||||||
|
Total pension plan assets
|
|
$808.6
|
|
|
$950.7
|
|
|||||||||||||||||||||||||
|
2018
|
2017
|
||||||||||||||||||||||||||||||
|
Fair
|
Level
|
Level
|
Level
|
Fair
|
Level
|
Level
|
Level
|
||||||||||||||||||||||||
|
IPL
|
Value
|
1
|
2
|
3
|
Value
|
1
|
2
|
3
|
|||||||||||||||||||||||
|
Cash and equivalents
|
|
$17.0
|
|
|
$1.4
|
|
|
$15.6
|
|
|
$—
|
|
|
$13.2
|
|
|
$2.2
|
|
|
$11.0
|
|
|
$—
|
|
|||||||
|
Equity securities - U.S.
|
60.8
|
|
60.8
|
|
—
|
|
—
|
|
73.9
|
|
73.9
|
|
—
|
|
—
|
|
|||||||||||||||
|
Equity securities - international
|
54.2
|
|
54.2
|
|
—
|
|
—
|
|
64.2
|
|
64.2
|
|
—
|
|
—
|
|
|||||||||||||||
|
Global asset securities
|
19.7
|
|
19.7
|
|
—
|
|
—
|
|
23.0
|
|
23.0
|
|
—
|
|
—
|
|
|||||||||||||||
|
Fixed income securities
|
59.7
|
|
24.5
|
|
35.2
|
|
—
|
|
63.4
|
|
26.0
|
|
37.4
|
|
—
|
|
|||||||||||||||
|
Total assets in fair value hierarchy
|
211.4
|
|
|
$160.6
|
|
|
$50.8
|
|
|
$—
|
|
237.7
|
|
|
$189.3
|
|
|
$48.4
|
|
|
$—
|
|
|||||||||
|
Assets measured at net asset value
|
166.1
|
|
205.8
|
|
|||||||||||||||||||||||||||
|
Accrued investment income
|
0.6
|
|
0.5
|
|
|||||||||||||||||||||||||||
|
Due to brokers, net (pending trades with brokers)
|
(0.3
|
)
|
(0.3
|
)
|
|||||||||||||||||||||||||||
|
Total pension plan assets
|
|
$377.8
|
|
|
$443.7
|
|
|||||||||||||||||||||||||
|
87
|
||
|
2018
|
2017
|
||||||||||||||||||||||||||||||
|
Fair
|
Level
|
Level
|
Level
|
Fair
|
Level
|
Level
|
Level
|
||||||||||||||||||||||||
|
WPL
|
Value
|
1
|
2
|
3
|
Value
|
1
|
2
|
3
|
|||||||||||||||||||||||
|
Cash and equivalents
|
|
$15.9
|
|
|
$1.3
|
|
|
$14.6
|
|
|
$—
|
|
|
$12.3
|
|
|
$2.0
|
|
|
$10.3
|
|
|
$—
|
|
|||||||
|
Equity securities - U.S.
|
56.7
|
|
56.7
|
|
—
|
|
—
|
|
69.1
|
|
69.1
|
|
—
|
|
—
|
|
|||||||||||||||
|
Equity securities - international
|
50.5
|
|
50.5
|
|
—
|
|
—
|
|
60.0
|
|
60.0
|
|
—
|
|
—
|
|
|||||||||||||||
|
Global asset securities
|
18.4
|
|
18.4
|
|
—
|
|
—
|
|
21.6
|
|
21.6
|
|
—
|
|
—
|
|
|||||||||||||||
|
Fixed income securities
|
55.6
|
|
22.8
|
|
32.8
|
|
—
|
|
59.3
|
|
24.3
|
|
35.0
|
|
—
|
|
|||||||||||||||
|
Total assets in fair value hierarchy
|
197.1
|
|
|
$149.7
|
|
|
$47.4
|
|
|
$—
|
|
222.3
|
|
|
$177.0
|
|
|
$45.3
|
|
|
$—
|
|
|||||||||
|
Assets measured at net asset value
|
154.8
|
|
192.5
|
|
|||||||||||||||||||||||||||
|
Accrued investment income
|
0.5
|
|
0.5
|
|
|||||||||||||||||||||||||||
|
Due to brokers, net (pending trades with brokers)
|
(0.2
|
)
|
(0.3
|
)
|
|||||||||||||||||||||||||||
|
Total pension plan assets
|
|
$352.2
|
|
|
$415.0
|
|
|||||||||||||||||||||||||
At December 31, the fair values of OPEB plan assets were as follows (in millions):
|
2018
|
2017
|
||||||||||||||||||||||||||||||
|
Fair
|
Level
|
Level
|
Level
|
Fair
|
Level
|
Level
|
Level
|
||||||||||||||||||||||||
|
Alliant Energy
|
Value
|
1
|
2
|
3
|
Value
|
1
|
2
|
3
|
|||||||||||||||||||||||
|
Cash and equivalents
|
|
$1.4
|
|
|
$1.1
|
|
|
$0.3
|
|
|
$—
|
|
|
$1.2
|
|
|
$0.7
|
|
|
$0.5
|
|
|
$—
|
|
|||||||
|
Equity securities - U.S.
|
3.9
|
|
3.9
|
|
—
|
|
—
|
|
27.9
|
|
27.9
|
|
—
|
|
—
|
|
|||||||||||||||
|
Equity securities - international
|
2.9
|
|
2.9
|
|
—
|
|
—
|
|
11.4
|
|
11.4
|
|
—
|
|
—
|
|
|||||||||||||||
|
Global asset securities
|
0.4
|
|
0.4
|
|
—
|
|
—
|
|
0.4
|
|
0.4
|
|
—
|
|
—
|
|
|||||||||||||||
|
Fixed income securities
|
68.2
|
|
67.5
|
|
0.7
|
|
—
|
|
66.6
|
|
66.0
|
|
0.6
|
|
—
|
|
|||||||||||||||
|
Total assets in fair value hierarchy
|
76.8
|
|
|
$75.8
|
|
|
$1.0
|
|
|
$—
|
|
107.5
|
|
|
$106.4
|
|
|
$1.1
|
|
|
$—
|
|
|||||||||
|
Assets measured at net asset value
|
22.3
|
|
3.6
|
|
|||||||||||||||||||||||||||
|
Total OPEB plan assets
|
|
$99.1
|
|
|
$111.1
|
|
|||||||||||||||||||||||||
|
2018
|
2017
|
||||||||||||||||||||||||||||||
|
Fair
|
Level
|
Level
|
Level
|
Fair
|
Level
|
Level
|
Level
|
||||||||||||||||||||||||
|
IPL
|
Value
|
1
|
2
|
3
|
Value
|
1
|
2
|
3
|
|||||||||||||||||||||||
|
Cash and equivalents
|
|
$0.7
|
|
|
$0.7
|
|
|
$—
|
|
|
$—
|
|
|
$0.3
|
|
|
$0.3
|
|
|
$—
|
|
|
$—
|
|
|||||||
|
Equity securities - U.S.
|
—
|
|
—
|
|
—
|
|
—
|
|
22.3
|
|
22.3
|
|
—
|
|
—
|
|
|||||||||||||||
|
Equity securities - international
|
—
|
|
—
|
|
—
|
|
—
|
|
7.5
|
|
7.5
|
|
—
|
|
—
|
|
|||||||||||||||
|
Fixed income securities
|
47.0
|
|
47.0
|
|
—
|
|
—
|
|
42.8
|
|
42.8
|
|
—
|
|
—
|
|
|||||||||||||||
|
Total assets in fair value hierarchy
|
47.7
|
|
|
$47.7
|
|
|
$—
|
|
|
$—
|
|
72.9
|
|
|
$72.9
|
|
|
$—
|
|
|
$—
|
|
|||||||||
|
Assets measured at net asset value
|
19.0
|
|
—
|
|
|||||||||||||||||||||||||||
|
Total OPEB plan assets
|
|
$66.7
|
|
|
$72.9
|
|
|||||||||||||||||||||||||
|
2018
|
2017
|
||||||||||||||||||||||||||||||
|
Fair
|
Level
|
Level
|
Level
|
Fair
|
Level
|
Level
|
Level
|
||||||||||||||||||||||||
|
WPL
|
Value
|
1
|
2
|
3
|
Value
|
1
|
2
|
3
|
|||||||||||||||||||||||
|
Cash and equivalents
|
|
$0.1
|
|
|
$0.1
|
|
|
$—
|
|
|
$—
|
|
|
$0.6
|
|
|
$0.3
|
|
|
$0.3
|
|
|
$—
|
|
|||||||
|
Fixed income securities
|
16.6
|
|
16.6
|
|
—
|
|
—
|
|
18.1
|
|
18.1
|
|
—
|
|
—
|
|
|||||||||||||||
|
Total OPEB plan assets
|
|
$16.7
|
|
|
$16.7
|
|
|
$—
|
|
|
$—
|
|
|
$18.7
|
|
|
$18.4
|
|
|
$0.3
|
|
|
$—
|
|
|||||||
For the various defined benefit pension and OPEB plans, Alliant Energy common stock represented less than
1%
of assets directly held in the plans at
December 31, 2018
and
2017
.
401(k) Savings Plans
-
A significant number of employees participate in defined contribution retirement plans (401(k) savings plans). Alliant Energy common stock directly held by participants represented
11.5%
and
11.5%
of total assets in the 401(k) savings plans at
December 31, 2018
and
2017
, respectively. Costs related to the 401(k) savings plans, which are partially based on the participants’ contributions and include allocated costs associated with Corporate Services employees for IPL and WPL, were as follows (in millions):
|
Alliant Energy
|
IPL
|
WPL
|
|||||||||||||||||||||||||||||||||
|
2018
|
2017
|
2016
|
2018
|
2017
|
2016
|
2018
|
2017
|
2016
|
|||||||||||||||||||||||||||
|
401(k) costs
|
|
$25.1
|
|
|
$24.8
|
|
|
$23.6
|
|
|
$13.0
|
|
|
$12.8
|
|
|
$12.0
|
|
|
$11.2
|
|
|
$11.1
|
|
|
$10.7
|
|
||||||||
|
88
|
||
NOTE 13(b) Equity-based Compensation Plans -
In 2015, Alliant Energy’s shareowners approved the Amended and Restated OIP, which permits the grant of shares of Alliant Energy common stock, restricted stock, restricted stock units, performance shares, performance units, and other stock-based or cash-based awards to key employees. At
December 31, 2018
, performance shares and restricted stock units (performance- and time-vesting) were outstanding under the Amended and Restated OIP, and
6.8 million
shares of Alliant Energy’s common stock remained available for grants under the Amended and Restated OIP. Alliant Energy satisfies share payouts related to equity awards under the Amended and Restated OIP through the issuance of new shares of its common stock. Alliant Energy also has the DLIP, which permits the grant of cash-based long-term awards, including performance units, restricted cash awards and restricted units, to certain key employees. At
December 31, 2018
, performance units and restricted units (performance- and time-vesting) were outstanding under the DLIP, and the the amount of nonvested restricted units was not material. There is no limit to the number of grants that can be made under the DLIP and Alliant Energy satisfies all payouts under the DLIP through cash payments. Nonvested awards generally do not have non-forfeitable rights to dividends or dividend equivalents when dividends are paid to common shareowners. A summary of compensation expense, including amounts allocated to IPL and WPL, and the related income tax benefits recognized for share-based compensation awards was as follows (in millions):
|
Alliant Energy
|
IPL
|
WPL
|
|||||||||||||||||||||||||||||||||
|
2018
|
2017
|
2016
|
2018
|
2017
|
2016
|
2018
|
2017
|
2016
|
|||||||||||||||||||||||||||
|
Compensation expense
|
|
$17.0
|
|
|
$15.1
|
|
|
$18.0
|
|
|
$9.4
|
|
|
$8.3
|
|
|
$9.5
|
|
|
$6.9
|
|
|
$6.4
|
|
|
$7.9
|
|
||||||||
|
Income tax benefits
|
4.9
|
|
6.2
|
|
7.4
|
|
2.8
|
|
3.4
|
|
4.0
|
|
1.9
|
|
2.6
|
|
3.2
|
|
|||||||||||||||||
As of
December 31, 2018
, Alliant Energy’s, IPL’s and WPL’s total unrecognized compensation cost related to share-based compensation awards was
$4.9 million
,
$2.7 million
and
$2.1 million
, respectively, which is expected to be recognized over a weighted average period of between
one
and
two
years. Share-based compensation expense is recognized on a straight-line basis over the requisite service periods and is primarily recorded in “Other operation and maintenance” in the income statements.
Performance Shares and Performance Units
-
Payouts of performance shares under the Amended and Restated OIP and performance units under the DLIP to key employees are contingent upon achievement over
three
-year periods of specified performance criteria, which currently include metrics of total shareowner return relative to an investor-owned utility peer group. Performance shares can be paid out in shares of Alliant Energy’s common stock, cash or a combination of cash and stock. Performance units must be paid out in cash. Alliant Energy assumes it will make future payouts of its performance shares and performance units in cash; therefore, performance shares and performance units are accounted for as liability awards. A summary of the performance shares and performance units activity, with amounts representing the target number of awards, was as follows:
|
Performance Shares
|
Performance Units
|
||||||||||||||||
|
2018
|
2017
|
2016
|
2018
|
2017
|
2016
|
||||||||||||
|
Nonvested awards, January 1
|
223,511
|
|
257,599
|
|
288,430
|
|
71,737
|
|
93,320
|
|
116,412
|
|
|||||
|
Granted
|
74,163
|
|
65,350
|
|
68,585
|
|
19,840
|
|
21,558
|
|
23,918
|
|
|||||
|
Vested
|
(90,806
|
)
|
(99,438
|
)
|
(98,186
|
)
|
(31,910
|
)
|
(37,395
|
)
|
(42,760
|
)
|
|||||
|
Forfeited
|
(3,680
|
)
|
—
|
|
(1,230
|
)
|
(1,906
|
)
|
(5,746
|
)
|
(4,250
|
)
|
|||||
|
Nonvested awards, December 31
|
203,188
|
|
223,511
|
|
257,599
|
|
57,761
|
|
71,737
|
|
93,320
|
|
|||||
Granted Awards
- Each performance share’s and performance unit’s value is based on the closing market price of
one
share of Alliant Energy’s common stock at the end of the performance period. The actual payout for performance shares and performance units is dependent upon actual performance and may range from
zero
to
200%
of the target number of awards. Compensation expense for performance shares and performance units is recorded ratably over the performance period based on the fair value of the awards at each reporting period.
Vested Awards -
Certain performance shares and performance units vested, resulting in payouts (a combination of cash and common stock for the performance shares and cash only for the performance units) as follows:
|
Performance Shares
|
Performance Units
|
||||||||||
|
2018
|
2017
|
2016
|
2018
|
2017
|
2016
|
||||||
|
2015 Grant
|
2014 Grant
|
2013 Grant
|
2015 Grant
|
2014 Grant
|
2013 Grant
|
||||||
|
Performance awards vested
|
90,806
|
99,438
|
98,186
|
31,910
|
37,395
|
42,760
|
|||||
|
Percentage of target number of performance awards
|
137.5%
|
147.5%
|
165.0%
|
137.5%
|
147.5%
|
165.0%
|
|||||
|
Aggregate payout value (in millions)
|
$5.3
|
$5.6
|
$5.1
|
$1.4
|
$1.5
|
$1.7
|
|||||
|
Payout - cash (in millions)
|
$4.9
|
$5.1
|
$2.9
|
$1.4
|
$1.5
|
$1.7
|
|||||
|
Payout - common stock shares issued
|
5,078
|
5,185
|
22,408
|
N/A
|
N/A
|
N/A
|
|||||
|
89
|
||
Fair Value of Awards -
At
December 31, 2018
, Alliant Energy’s common stock closing price was
$42.25
. Additio
nal i
nformation related to fair values of nonvested performance shares and performance units at
December 31, 2018
, by year of grant, was as follows:
|
Performance Shares
|
Performance Units
|
||||||||||||||||||||||
|
2018 Grant
|
2017 Grant
|
2016 Grant
|
2018 Grant
|
2017 Grant
|
2016 Grant
|
||||||||||||||||||
|
Nonvested awards at target
|
70,483
|
|
65,350
|
|
67,355
|
|
19,196
|
|
18,062
|
|
20,503
|
|
|||||||||||
|
Estimated payout percentage based on performance criteria
|
85
|
%
|
85
|
%
|
143
|
%
|
85
|
%
|
85
|
%
|
143
|
%
|
|||||||||||
|
Fair values of each nonvested award
|
|
$35.91
|
|
|
$35.91
|
|
|
$60.42
|
|
|
$35.91
|
|
|
$35.91
|
|
|
$60.42
|
|
|||||
Performance Restricted Stock Units
-
Payouts of performance restricted stock units under the Amended and Restated OIP are based on the achievement of certain performance targets (currently specified growth of consolidated net income from continuing operations) during a
three
-year performance period. The actual number of units that will be paid out upon vesting is dependent upon actual performance and may range from
zero
to
200%
of the target number of units. If performance targets are not met during the performance period, these units are forfeited. Performance restricted stock units generally must be paid out in shares and are accounted for as equity awards. Each performance restricted stock unit’s value is based on the closing market price of
one
share of Alliant Energy’s common stock on the grant date of the award. Compensation expense is recorded ratably over the performance period based on a probability assessment of payouts for the awards at each reporting period. A summary of the performance restricted stock units activity, with amounts representing the target number of units, was as follows:
|
2018
|
2017
|
2016
|
||||||||||||||||||
|
Units
|
Weighted Average
Grant Date Fair Value
|
Units
|
Weighted Average
Grant Date Fair Value
|
Units
|
Weighted Average
Grant Date Fair Value
|
|||||||||||||||
|
Nonvested units, January 1
|
132,705
|
|
|
$36.50
|
|
67,355
|
|
|
$33.96
|
|
—
|
|
|
$—
|
|
|||||
|
Granted
|
74,163
|
|
38.60
|
|
65,350
|
|
39.12
|
|
68,585
|
|
33.96
|
|
||||||||
|
Forfeited
|
(3,680
|
)
|
38.60
|
|
—
|
|
—
|
|
(1,230
|
)
|
33.90
|
|
||||||||
|
Nonvested units, December 31
|
203,188
|
|
37.23
|
|
132,705
|
|
36.50
|
|
67,355
|
|
33.96
|
|
||||||||
Restricted Stock Units
-
Payouts of restricted stock units under the Amended and Restated OIP are based on the expiration of a
three
-year time-vesting period. Each restricted stock unit’s value is based on the closing market price of
one
share of Alliant Energy’s common stock at the end of the time-vesting period. Compensation expense is recorded ratably over the performance period based on the fair value of the awards at each reporting period. Restricted stock units can be paid out in shares of Alliant Energy common stock, cash or a combination of cash and stock. Alliant Energy assumes it will make future payouts of its restricted stock units in cash; therefore, restricted stock units are accounted for as liability awards. A summary of the restricted stock units activity was as follows:
|
2018
|
2017
|
2016
|
||||||
|
Nonvested units, January 1
|
113,749
|
|
57,736
|
|
—
|
|
||
|
Granted
|
63,568
|
|
56,013
|
|
58,790
|
|
||
|
Forfeited
|
(3,154
|
)
|
—
|
|
(1,054
|
)
|
||
|
Nonvested units, December 31
|
174,163
|
|
113,749
|
|
57,736
|
|
||
NOTE 13(c) Deferred Compensation Plan -
Alliant Energy maintains a DCP under which key employees may defer up to
100%
of base salary and short-term cash incentive compensation and directors may elect to defer all or part of their retainer and committee fees. Key employees who have made the maximum allowed contribution to the Alliant Energy 401(k) Savings Plan may receive an additional credit to the DCP. Key employees and directors may elect to have their deferrals credited to a company stock account, an interest account, equity accounts or mutual fund accounts based on certain benchmark funds.
Company Stock Account
-
The DCP does not permit diversification of deferrals credited to the company stock account and all distributions from participants’ company stock accounts are made in the form of shares of Alliant Energy common stock. The deferred compensation obligations for participants’ company stock accounts are recorded in “Additional paid-in capital” and the shares of Alliant Energy common stock held in a rabbi trust to satisfy this obligation are recorded in “Shares in deferred compensation trust” on Alliant Energy’s balance sheets. At December 31, the carrying value of the deferred compensation obligation for the company stock account and the shares in the deferred compensation trust based on the
|
90
|
||
historical value of the shares of Alliant Energy common stock contributed to the rabbi trust, and the fair market value of the shares held in the rabbi trust, were as follows (in millions):
|
2018
|
2017
|
||||||
|
Carrying value
|
|
$9.8
|
|
|
$11.1
|
|
|
|
Fair market value
|
16.2
|
|
19.7
|
|
|||
Interest, Equity and Mutual Fund Accounts
-
Distributions from participants’ interest, equity and mutual fund accounts are in the form of cash payments. The deferred compensation obligations for participants’ interest, equity and mutual fund accounts are recorded in “Pension and other benefit obligations” on the balance sheets. At December 31,
2018
and
2017
, the carrying value of Alliant Energy’s deferred compensation obligations for participants’ interest, equity and mutual fund accounts, which approximates fair market value, was
$21.0 million
and
$21.8 million
, respectively.
NOTE 14. ASSET RETIREMENT OBLIGATIONS
Recognized AROs relate to legal obligations for the removal, closure or dismantlement of several assets including, but not limited to, wind farms, ash ponds, active ash landfills, solar generation and above ground storage tanks. Recognized AROs also include legal obligations for the management and final disposition of asbestos and polychlorinated biphenyls. AROs are recorded in “Other current liabilities” and “Other liabilities” on the balance sheets. Refer to
Note 2
for information regarding regulatory assets related to AROs. A reconciliation of the changes in AROs associated with long-lived assets is as follows (in millions):
|
Alliant Energy
|
IPL
|
WPL
|
|||||||||||||||||||||
|
2018
|
2017
|
2018
|
2017
|
2018
|
2017
|
||||||||||||||||||
|
Balance, January 1
|
|
$184.5
|
|
|
$195.7
|
|
|
$134.1
|
|
|
$124.7
|
|
|
$50.4
|
|
|
$61.4
|
|
|||||
|
Revisions in estimated cash flows
|
(10.1
|
)
|
4.3
|
|
(10.1
|
)
|
7.0
|
|
—
|
|
(2.7
|
)
|
|||||||||||
|
Liabilities settled
|
(10.4
|
)
|
(23.5
|
)
|
(9.7
|
)
|
(13.1
|
)
|
(0.7
|
)
|
(10.4
|
)
|
|||||||||||
|
Liabilities incurred
|
7.3
|
|
2.0
|
|
—
|
|
11.7
|
|
7.3
|
|
—
|
|
|||||||||||
|
Accretion expense
|
6.2
|
|
6.0
|
|
4.0
|
|
3.8
|
|
2.2
|
|
2.1
|
|
|||||||||||
|
Balance, December 31
|
|
$177.5
|
|
|
$184.5
|
|
|
$118.3
|
|
|
$134.1
|
|
|
$59.2
|
|
|
$50.4
|
|
|||||
NOTE 15. DERIVATIVE INSTRUMENTS
Commodity Derivatives
-
Purpose -
Derivative instruments are used for risk management purposes to mitigate exposures to fluctuations in certain commodity prices, transmission congestion costs and rail transportation costs. Risk policies are maintained that govern the use of such derivative instruments. Derivative instruments were not designated as hedging instruments and included the following:
|
Risk management purpose
|
Type of instrument
|
|
Mitigate pricing volatility for:
|
|
|
Fuel used to supply natural gas-fired EGUs
|
Natural gas swap, options and physical forward contracts (IPL and WPL)
|
|
Natural gas supplied to retail customers
|
Natural gas swap, options and physical forward contracts (IPL and WPL)
|
|
Fuel used at coal-fired EGUs
|
Coal physical forward contracts (IPL and WPL)
|
|
Optimize the value of natural gas pipeline capacity
|
Natural gas physical forward contracts (IPL and WPL)
|
|
Natural gas swap contracts (IPL)
|
|
|
Manage transmission congestion costs
|
FTRs (IPL and WPL)
|
|
Manage rail transportation costs
|
Diesel fuel swap contracts (WPL)
|
Notional Amounts -
As of
December 31, 2018
, gross notional amounts and settlement/delivery years related to outstanding swap contracts, option contracts, physical forward contracts and FTRs that were accounted for as commodity derivative instruments were as follows (units in thousands):
|
FTRs
|
Natural Gas
|
Coal
|
Diesel Fuel
|
||||||||||||||||
|
MWhs
|
Years
|
Dths
|
Years
|
Tons
|
Years
|
Gallons
|
Years
|
||||||||||||
|
Alliant Energy
|
10,399
|
|
2019
|
181,694
|
|
2019-2026
|
10,467
|
|
2019-2021
|
3,024
|
|
2019
|
|||||||
|
IPL
|
5,954
|
|
2019
|
80,150
|
|
2019-2026
|
4,410
|
|
2019-2021
|
—
|
|
|
|||||||
|
WPL
|
4,445
|
|
2019
|
101,544
|
|
2019-2026
|
6,057
|
|
2019-2021
|
3,024
|
|
2019
|
|||||||
|
91
|
||
Financial Statement Presentation -
Derivative instruments are recorded at fair value each reporting date on the balance sheet as assets or liabilities. At December 31, the fair values of current derivative assets are included in “Other current assets,” non-current derivative assets are included in “Deferred charges and other,” current derivative liabilities are included in “Other current liabilities” and non-current derivative liabilities are included in “Other liabilities” on the balance sheets as follows (in millions):
|
Alliant Energy
|
IPL
|
WPL
|
|||||||||||||||||||||
|
2018
|
2017
|
2018
|
2017
|
2018
|
2017
|
||||||||||||||||||
|
Current derivative assets
|
|
$24.6
|
|
|
$21.1
|
|
|
$16.1
|
|
|
$15.8
|
|
|
$8.5
|
|
|
$5.3
|
|
|||||
|
Non-current derivative assets
|
3.7
|
|
4.0
|
|
1.6
|
|
1.3
|
|
2.1
|
|
2.7
|
|
|||||||||||
|
Current derivative liabilities
|
5.6
|
|
18.7
|
|
3.1
|
|
5.0
|
|
2.5
|
|
13.7
|
|
|||||||||||
|
Non-current derivative liabilities
|
17.7
|
|
23.0
|
|
8.1
|
|
14.4
|
|
9.6
|
|
8.6
|
|
|||||||||||
Credit Risk-related Contingent Features -
Various agreements contain credit risk-related contingent features, including requirements to maintain certain credit ratings and/or limitations on liability positions under the agreements based on credit ratings. Certain of these agreements with credit risk-related contingency features are accounted for as derivative instruments. In the event of a material change in creditworthiness or if liability positions exceed certain contractual limits, credit support may need to be provided in the form of letters of credit or cash collateral up to the amount of exposure under the contracts, or the contracts may need to be unwound and underlying liability positions paid. At
December 31, 2018
and
2017
, the aggregate fair value of all derivative instruments with credit risk-related contingent features in a net liability position was not materially different than amounts that would be required to be posted as credit support to counterparties by Alliant Energy, IPL or WPL if the most restrictive credit risk-related contingent features for derivative agreements in a net liability position were triggered.
Balance Sheet Offsetting
- The fair value amounts of derivative instruments subject to a master netting arrangement are not netted by counterparty on the balance sheets. However, if the fair value amounts of derivative instruments by counterparty were netted, amounts would not be materially different from gross amounts of derivative assets and derivative liabilities at
December 31, 2018
and
2017
. Fair value amounts recognized for the right to reclaim cash collateral (receivable) or the obligation to return cash collateral (payable) are not offset against fair value amounts recognized for derivative instruments executed with the same counterparty under the same master netting arrangement.
NOTE 16. FAIR VALUE MEASUREMENTS
Valuation Hierarchy
-
Fair value measurement accounting establishes three levels of fair value hierarchy that prioritize the inputs to valuation techniques used to measure fair value. Level 1 pricing inputs are quoted prices available in active markets for identical assets or liabilities as of the reporting date. Level 2 pricing inputs are quoted prices for similar assets or liabilities in active markets or quoted prices for identical or similar assets or liabilities in markets that are not active as of the reporting date. Level 3 pricing inputs are unobservable inputs for assets or liabilities for which little or no market data exist and require significant management judgment or estimation.
The fair value hierarchy gives the highest priority to quoted prices in active markets (Level 1) and the lowest priority to unobservable data (Level 3). In some cases, the inputs used to measure fair value might fall in different levels of the fair value hierarchy. The lowest level input that is significant to a fair value measurement in its entirety determines the applicable level in the fair value hierarchy. Assessing the significance of a particular input to the fair value measurement in its entirety requires judgment, considering factors specific to the asset or liability.
Valuation Techniques
-
Derivative assets and derivative liabilities -
Swap, option and physical forward commodity contracts were non-exchange-based derivative instruments and were valued using indicative price quotations from a pricing vendor that provides daily exchange forward price settlements, from broker or dealer quotations, from market publications or from on-line exchanges. The indicative price quotations reflected the average of the bid-ask mid-point prices and were obtained from sources believed to provide the most liquid market for the commodity. A portion of these indicative price quotations were corroborated using quoted prices for similar assets or liabilities in active markets and categorized derivative instruments based on such indicative price quotations as Level 2. Commodity contracts that were valued using indicative price quotations based on significant assumptions such as seasonal or monthly shaping and indicative price quotations that could not be readily corroborated were categorized as Level 3. Swap, option and physical forward commodity contracts were predominately at liquid trading points. FTRs were valued using auction prices and were categorized as Level 3. Refer to
Note 15
for additional details of derivative assets and derivative liabilities.
|
92
|
||
Deferred proceeds (sales of receivables) -
The fair value of IPL’s deferred proceeds related to its sales of accounts receivable program was calculated each reporting date using the cost approach valuation technique. The fair value represents the carrying amount of receivables sold less the allowance for doubtful accounts associated with the receivables sold and cash amounts received from the receivables sold due to the short-term nature of the collection period. These inputs were considered unobservable and deferred proceeds were categorized as Level 3. Deferred proceeds represent IPL’s maximum exposure to loss related to the receivables sold. Refer to
Note 5(b)
for additional information regarding deferred proceeds.
Long-term debt (including current maturities) -
The fair value of long-term debt instruments was based on a discounted cash flow methodology using observable data from comparably traded securities with similar credit profiles, and was substantially classified as Level 2. Refer to
Note 9(b)
for additional information regarding long-term debt.
Fair Value of Financial Instruments
-
The carrying amounts of current assets and current liabilities approximate fair value because of the short maturity of such financial instruments. Carrying amounts and the related estimated fair values of other financial instruments at December 31 were as follows (in millions):
|
Alliant Energy
|
2018
|
2017
|
|||||||||||||||||||||||||||||||||||||
|
Fair Value
|
Fair Value
|
||||||||||||||||||||||||||||||||||||||
|
Carrying
|
Level
|
Level
|
Level
|
Carrying
|
Level
|
Level
|
Level
|
||||||||||||||||||||||||||||||||
|
Amount
|
1
|
2
|
3
|
Total
|
Amount
|
1
|
2
|
3
|
Total
|
||||||||||||||||||||||||||||||
|
Assets:
|
|||||||||||||||||||||||||||||||||||||||
|
Derivatives
|
|
$28.3
|
|
|
$—
|
|
|
$8.9
|
|
|
$19.4
|
|
|
$28.3
|
|
|
$25.1
|
|
|
$—
|
|
|
$4.1
|
|
|
$21.0
|
|
|
$25.1
|
|
|||||||||
|
Deferred proceeds
|
119.4
|
|
—
|
|
—
|
|
119.4
|
|
119.4
|
|
222.1
|
|
—
|
|
—
|
|
222.1
|
|
222.1
|
|
|||||||||||||||||||
|
Liabilities and equity:
|
|||||||||||||||||||||||||||||||||||||||
|
Derivatives
|
23.3
|
|
—
|
|
16.1
|
|
7.2
|
|
23.3
|
|
41.7
|
|
—
|
|
8.5
|
|
33.2
|
|
41.7
|
|
|||||||||||||||||||
|
Long-term debt (incl. current maturities)
|
5,502.8
|
|
—
|
|
5,858.4
|
|
2.4
|
|
5,860.8
|
|
4,866.3
|
|
—
|
|
5,444.6
|
|
2.9
|
|
5,447.5
|
|
|||||||||||||||||||
|
IPL
|
2018
|
2017
|
|||||||||||||||||||||||||||||||||||||
|
Fair Value
|
Fair Value
|
||||||||||||||||||||||||||||||||||||||
|
Carrying
|
Level
|
Level
|
Level
|
Carrying
|
Level
|
Level
|
Level
|
||||||||||||||||||||||||||||||||
|
Amount
|
1
|
2
|
3
|
Total
|
Amount
|
1
|
2
|
3
|
Total
|
||||||||||||||||||||||||||||||
|
Assets:
|
|||||||||||||||||||||||||||||||||||||||
|
Derivatives
|
|
$17.7
|
|
|
$—
|
|
|
$4.0
|
|
|
$13.7
|
|
|
$17.7
|
|
|
$17.1
|
|
|
$—
|
|
|
$2.0
|
|
|
$15.1
|
|
|
$17.1
|
|
|||||||||
|
Deferred proceeds
|
119.4
|
|
—
|
|
—
|
|
119.4
|
|
119.4
|
|
222.1
|
|
—
|
|
—
|
|
222.1
|
|
222.1
|
|
|||||||||||||||||||
|
Liabilities and equity:
|
|||||||||||||||||||||||||||||||||||||||
|
Derivatives
|
11.2
|
|
—
|
|
6.5
|
|
4.7
|
|
11.2
|
|
19.4
|
|
—
|
|
2.9
|
|
16.5
|
|
19.4
|
|
|||||||||||||||||||
|
Long-term debt (incl. current maturities)
|
2,552.3
|
|
—
|
|
2,691.2
|
|
—
|
|
2,691.2
|
|
2,406.0
|
|
—
|
|
2,665.7
|
|
—
|
|
2,665.7
|
|
|||||||||||||||||||
|
WPL
|
2018
|
2017
|
|||||||||||||||||||||||||||||||||||||
|
Fair Value
|
Fair Value
|
||||||||||||||||||||||||||||||||||||||
|
Carrying
|
Level
|
Level
|
Level
|
Carrying
|
Level
|
Level
|
Level
|
||||||||||||||||||||||||||||||||
|
Amount
|
1
|
2
|
3
|
Total
|
Amount
|
1
|
2
|
3
|
Total
|
||||||||||||||||||||||||||||||
|
Assets:
|
|||||||||||||||||||||||||||||||||||||||
|
Derivatives
|
|
$10.6
|
|
|
$—
|
|
|
$4.9
|
|
|
$5.7
|
|
|
$10.6
|
|
|
$8.0
|
|
|
$—
|
|
|
$2.1
|
|
|
$5.9
|
|
|
$8.0
|
|
|||||||||
|
Liabilities and equity:
|
|||||||||||||||||||||||||||||||||||||||
|
Derivatives
|
12.1
|
|
—
|
|
9.6
|
|
2.5
|
|
12.1
|
|
22.3
|
|
—
|
|
5.6
|
|
16.7
|
|
22.3
|
|
|||||||||||||||||||
|
Long-term debt (incl. current maturities)
|
1,834.9
|
|
—
|
|
2,043.7
|
|
—
|
|
2,043.7
|
|
1,833.4
|
|
—
|
|
2,147.9
|
|
—
|
|
2,147.9
|
|
|||||||||||||||||||
|
93
|
||
Information for fair value measurements using significant unobservable inputs (Level 3 inputs) was as follows (in millions):
|
Alliant Energy
|
Commodity Contract Derivative
|
||||||||||||||
|
Assets and (Liabilities), net
|
Deferred Proceeds
|
||||||||||||||
|
2018
|
2017
|
2018
|
2017
|
||||||||||||
|
Beginning balance, January 1
|
|
($12.2
|
)
|
|
$8.7
|
|
|
$222.1
|
|
|
$211.1
|
|
|||
|
Total net gains (losses) included in changes in net assets (realized/unrealized)
|
9.1
|
|
(32.9
|
)
|
—
|
|
—
|
|
|||||||
|
Transfers out of Level 3 (a)
|
16.1
|
|
12.2
|
|
—
|
|
—
|
|
|||||||
|
Purchases
|
26.7
|
|
28.3
|
|
—
|
|
—
|
|
|||||||
|
Sales
|
(0.5
|
)
|
(0.3
|
)
|
—
|
|
—
|
|
|||||||
|
Settlements (b)
|
(27.0
|
)
|
(28.2
|
)
|
(102.7
|
)
|
11.0
|
|
|||||||
|
Ending balance, December 31
|
|
$12.2
|
|
|
($12.2
|
)
|
|
$119.4
|
|
|
$222.1
|
|
|||
|
The amount of total net gains (losses) for the period included in changes in net assets attributable to the change in unrealized gains (losses) relating to assets and liabilities held at December 31
|
|
$10.7
|
|
|
($31.0
|
)
|
|
$—
|
|
|
$—
|
|
|||
|
IPL
|
Commodity Contract Derivative
|
||||||||||||||
|
Assets and (Liabilities), net
|
Deferred Proceeds
|
||||||||||||||
|
2018
|
2017
|
2018
|
2017
|
||||||||||||
|
Beginning balance, January 1
|
|
($1.4
|
)
|
|
$10.1
|
|
|
$222.1
|
|
|
$211.1
|
|
|||
|
Total net losses included in changes in net assets (realized/unrealized)
|
(0.5
|
)
|
(14.8
|
)
|
—
|
|
—
|
|
|||||||
|
Transfers out of Level 3 (a)
|
11.0
|
|
3.1
|
|
—
|
|
—
|
|
|||||||
|
Purchases
|
22.5
|
|
24.6
|
|
—
|
|
—
|
|
|||||||
|
Sales
|
(0.4
|
)
|
(0.2
|
)
|
—
|
|
—
|
|
|||||||
|
Settlements (b)
|
(22.2
|
)
|
(24.2
|
)
|
(102.7
|
)
|
11.0
|
|
|||||||
|
Ending balance, December 31
|
|
$9.0
|
|
|
($1.4
|
)
|
|
$119.4
|
|
|
$222.1
|
|
|||
|
The amount of total net gains (losses) for the period included in changes in net assets attributable to the change in unrealized gains (losses) relating to assets and liabilities held at December 31
|
|
$0.2
|
|
|
($13.5
|
)
|
|
$—
|
|
|
$—
|
|
|||
|
WPL
|
Commodity Contract Derivative
|
||||||
|
Assets and (Liabilities), net
|
|||||||
|
2018
|
2017
|
||||||
|
Beginning balance, January 1
|
|
($10.8
|
)
|
|
($1.4
|
)
|
|
|
Total net gains (losses) included in changes in net assets (realized/unrealized)
|
9.6
|
|
(18.1
|
)
|
|||
|
Transfers out of Level 3 (a)
|
5.1
|
|
9.1
|
|
|||
|
Purchases
|
4.2
|
|
3.7
|
|
|||
|
Sales
|
(0.1
|
)
|
(0.1
|
)
|
|||
|
Settlements
|
(4.8
|
)
|
(4.0
|
)
|
|||
|
Ending balance, December 31
|
|
$3.2
|
|
|
($10.8
|
)
|
|
|
The amount of total net gains (losses) for the period included in changes in net assets attributable to the change in unrealized gains (losses) relating to assets and liabilities held at December 31
|
|
$10.5
|
|
|
($17.5
|
)
|
|
|
(a)
|
Observable market inputs became available for certain commodity contracts previously classified as Level 3 for transfers out of Level 3.
|
|
(b)
|
Settlements related to deferred proceeds are due to the change in the carrying amount of receivables sold less the allowance for doubtful accounts associated with the receivables sold and cash amounts received from the receivables sold.
|
Commodity Contracts -
The fair value of electric, FTR and natural gas commodity contracts categorized as Level 3 was recognized as net derivative assets (liabilities) at December 31 as follows (in millions):
|
Alliant Energy
|
IPL
|
WPL
|
|||||||||||||||||||||
|
Excluding FTRs
|
FTRs
|
Excluding FTRs
|
FTRs
|
Excluding FTRs
|
FTRs
|
||||||||||||||||||
|
2018
|
|
$3.2
|
|
|
$9.0
|
|
|
$1.8
|
|
|
$7.2
|
|
|
$1.4
|
|
|
$1.8
|
|
|||||
|
2017
|
(23.5
|
)
|
11.3
|
|
(11.5
|
)
|
10.1
|
|
(12.0
|
)
|
1.2
|
|
|||||||||||
|
94
|
||
NOTE 17. COMMITMENTS AND CONTINGENCIES
NOTE 17(a) Capital Purchase Commitments -
Various contractual obligations contain minimum future commitments related to capital expenditures for certain construction projects. IPL’s projects include the expansion of wind generation. WPL’s projects include West Riverside. At
December 31, 2018
, Alliant Energy’s, IPL’s and WPL’s minimum future commitments for these projects were
$40 million
,
$14 million
and
$26 million
, respectively.
NOTE 17(b) Other Purchase Commitments -
Various commodity supply, transportation and storage contracts help meet obligations to provide electricity and natural gas to utility customers. In addition, there are various purchase commitments associated with other goods and services. At
December 31, 2018
, the related minimum future commitments were as follows (in millions):
|
Alliant Energy
|
2019
|
2020
|
2021
|
2022
|
2023
|
Thereafter
|
Total
|
||||||||||||||||||||
|
Purchased power (a)
|
|
$159
|
|
|
$135
|
|
|
$149
|
|
|
$140
|
|
|
$155
|
|
|
$307
|
|
|
$1,045
|
|
||||||
|
Natural gas
|
254
|
|
151
|
|
119
|
|
94
|
|
67
|
|
196
|
|
881
|
|
|||||||||||||
|
Coal (b)
|
102
|
|
49
|
|
26
|
|
9
|
|
9
|
|
—
|
|
195
|
|
|||||||||||||
|
Other (c)
|
60
|
|
4
|
|
3
|
|
2
|
|
2
|
|
—
|
|
71
|
|
|||||||||||||
|
|
$575
|
|
|
$339
|
|
|
$297
|
|
|
$245
|
|
|
$233
|
|
|
$503
|
|
|
$2,192
|
|
|||||||
|
IPL
|
2019
|
2020
|
2021
|
2022
|
2023
|
Thereafter
|
Total
|
||||||||||||||||||||
|
Purchased power (a)
|
|
$144
|
|
|
$135
|
|
|
$149
|
|
|
$140
|
|
|
$155
|
|
|
$307
|
|
|
$1,030
|
|
||||||
|
Natural gas
|
124
|
|
55
|
|
42
|
|
33
|
|
26
|
|
83
|
|
363
|
|
|||||||||||||
|
Coal (b)
|
52
|
|
29
|
|
20
|
|
9
|
|
9
|
|
—
|
|
119
|
|
|||||||||||||
|
Other (c)
|
24
|
|
3
|
|
3
|
|
2
|
|
2
|
|
—
|
|
34
|
|
|||||||||||||
|
|
$344
|
|
|
$222
|
|
|
$214
|
|
|
$184
|
|
|
$192
|
|
|
$390
|
|
|
$1,546
|
|
|||||||
|
WPL
|
2019
|
2020
|
2021
|
2022
|
2023
|
Thereafter
|
Total
|
||||||||||||||||||||
|
Purchased power
|
|
$15
|
|
|
$—
|
|
|
$—
|
|
|
$—
|
|
|
$—
|
|
|
$—
|
|
|
$15
|
|
||||||
|
Natural gas
|
130
|
|
96
|
|
77
|
|
61
|
|
41
|
|
113
|
|
518
|
|
|||||||||||||
|
Coal (b)
|
50
|
|
20
|
|
6
|
|
—
|
|
—
|
|
—
|
|
76
|
|
|||||||||||||
|
Other (c)
|
23
|
|
—
|
|
—
|
|
—
|
|
—
|
|
—
|
|
23
|
|
|||||||||||||
|
|
$218
|
|
|
$116
|
|
|
$83
|
|
|
$61
|
|
|
$41
|
|
|
$113
|
|
|
$632
|
|
|||||||
|
(a)
|
Includes payments required by PPAs for capacity rights and minimum quantities of MWhs required to be purchased. In July 2018, IPL entered into an amendment to shorten the term of the DAEC PPA by
five
years in exchange for a
$110 million
buyout payment by IPL in September 2020, subject to IUB approval. In December 2018, IPL received an order from the IUB, which was effective in January 2019, approving recovery of the buyout payment. As a result, Alliant Energy’s and IPL’s amounts in the above table do not include the September 2020 buyout payment, and the minimum future commitments reflect IPL’s purchase of capacity and the resulting energy from DAEC through December 2025, the original term of the PPA prior to the amendment. Amounts in the above table for 2021 and beyond relate to the DAEC PPA.
|
|
(b)
|
Corporate Services entered into system-wide coal contracts on behalf of IPL and WPL that include minimum future commitments. These commitments were assigned to IPL and WPL based on information available as of
December 31, 2018
regarding expected future usage, which is subject to change.
|
|
(c)
|
Includes individual commitments incurred during the normal course of business that exceeded
$1 million
at
December 31, 2018
.
|
NOTE 17(c) Legal Proceedings -
Alliant Energy, IPL and WPL are involved in legal and administrative proceedings before various courts and agencies with respect to matters arising in the ordinary course of business. Although unable to predict the outcome of these matters, Alliant Energy, IPL and WPL believe that appropriate reserves have been established and final disposition of these actions will not have a material effect on their financial condition or results of operations.
NOTE 17(d) Guarantees and Indemnifications -
Whiting Petroleum
-
In 2004, Alliant Energy sold its remaining interest in Whiting Petroleum. Whiting Petroleum is an independent oil and gas company. Alliant Energy Resources, LLC, as the successor to a predecessor entity that owned Whiting Petroleum, and a wholly-owned subsidiary of AEF, continues to guarantee the partnership obligations of an affiliate of Whiting Petroleum under general partnership agreements in the oil and gas industry, including with respect to the future abandonment of certain platforms off the coast of California and related onshore plant and equipment owned by the partnerships. The guarantees do not include a maximum limit. As of
December 31, 2018
, the present value of the abandonment obligations is estimated at
$36 million
. Alliant Energy is not aware of any material liabilities related to these
|
95
|
||
guarantees of which it is probable that Alliant Energy Resources, LLC will be obligated to pay and therefore has not recognized any material liabilities related to this guarantee as of
December 31, 2018
and
2017
.
Non-utility Wind Farm in Oklahoma
-
In July 2017, a wholly-owned subsidiary of AEF acquired a cash equity ownership interest in a non-utility wind farm located in Oklahoma. The wind farm provides electricity to a third-party under a long-term PPA. Alliant Energy provided a parent guarantee of its subsidiary’s indemnification obligations under the related operating agreement and PPA. Alliant Energy’s obligations under the operating agreement were
$90 million
as of
December 31, 2018
and will reduce annually until expiring in
July 2047
. Alliant Energy’s obligations under the PPA are subject to a maximum limit of
$17 million
and expire in
December 2031
, subject to potential extension. Alliant Energy is not aware of any material liabilities related to this guarantee that it is probable that it will be obligated to pay and therefore has not recognized any material liabilities related to this guarantee as of
December 31, 2018
and
2017
.
IPL’s Minnesota Electric Distribution Assets
-
IPL provided indemnifications associated with the July 2015 sale of its Minnesota electric distribution assets for losses resulting from potential breach of IPL’s representations, warranties and obligations under the sale agreement. Alliant Energy and IPL believe the likelihood of having to make any material cash payments under these indemnifications is remote. IPL has not recorded any material liabilities related to these indemnifications as of
December 31, 2018
and
2017
. The general terms of the indemnifications provided by IPL included a maximum limit of
$17 million
and expire in
October 2020
.
NOTE 17(e) Environmental Matters -
Alliant Energy, IPL and WPL are subject to environmental regulations as a result of their current and past operations. These regulations are designed to protect public health and the environment and have resulted in compliance, remediation, containment and monitoring obligations, which are recorded as current and non-current environmental liabilities. Substantially all of the environmental liabilities recorded on the balance sheets relate to MGP sites.
MGP Sites
-
IPL and WPL have current or previous ownership interests in various sites that are previously associated with the production of gas for which IPL and WPL have, or may have in the future, liability for investigation, remediation and monitoring costs. IPL and WPL are working pursuant to the requirements of various federal and state agencies to investigate, mitigate, prevent and remediate, where necessary, the environmental impacts to property, including natural resources, at and around these former MGP sites in order to protect public health and the environment. At
December 31, 2018
, estimated future costs expected to be incurred for the investigation, remediation and monitoring of the MGP sites, as well as environmental liabilities recorded on the balance sheets for these sites, which are not discounted, were as follows (in millions). At
December 31, 2018
, such amounts for WPL were not material.
|
Alliant Energy
|
IPL
|
||||||||||
|
Range of estimated future costs
|
|
$11
|
|
-
|
$29
|
|
$8
|
|
-
|
$24
|
|
|
Current and non-current environmental liabilities
|
15
|
12
|
|||||||||
IPL Consent Decree
- In 2015, the U.S. District Court for the Northern District of Iowa approved a Consent Decree that IPL entered into with the EPA, the Sierra Club, the State of Iowa and Linn County in Iowa, thereby resolving potential CAA issues associated with emissions from IPL’s coal-fired generating facilities in Iowa. IPL has completed various requirements under the Consent Decree. IPL’s remaining requirements include installing an SCR system or equivalent NOx reduction system at Ottumwa by December 31, 2019, and fuel switching or retiring Burlington by December 31, 2021 and Prairie Creek Units 1 and 3 by December 31, 2025. Alliant Energy and IPL currently expect to recover material costs incurred by IPL related to compliance with the terms of the Consent Decree from IPL’s electric customers.
Other Environmental Contingencies
-
In addition to the environmental liabilities discussed above, various environmental rules are monitored that may have a significant impact on future operations. Several of these environmental rules are subject to legal challenges, reconsideration and/or other uncertainties. Given uncertainties regarding the outcome, timing and compliance plans for these environmental matters, the complete financial impact of each of these rules is not able to be determined; however future capital investments and/or modifications to EGUs to comply with certain of these rules could be significant. Specific current, proposed or potential environmental matters include, among others: Effluent Limitation Guidelines, CCR Rule, and various legislation and EPA regulations to monitor and regulate the emission of GHG, including the CAA.
NOTE 17(f) Credit Risk -
IPL provides retail electric and gas services in Iowa and wholesale electric service in Minnesota, Illinois and Iowa. WPL provides retail electric and gas services and wholesale electric service in Wisconsin. The geographic concentration of IPL’s and WPL’s customers did not contribute significantly to overall credit risk exposure. In addition, as a result of a diverse customer base, IPL and WPL did not have any significant credit risk concentration for receivables arising from the sale of electricity or gas services.
|
96
|
||
Alliant Energy, IPL and WPL are subject to credit risk related to the ability of counterparties to meet their contractual payment obligations or the potential non-performance of counterparties to deliver contracted commodities and other goods or services at the contracted price. Credit policies are maintained to mitigate credit risk. These credit policies include evaluation of the financial condition of certain counterparties, use of credit risk-related contingent provisions in certain agreements that require credit support from counterparties not meeting specific criteria, diversification of counterparties to reduce concentrations of credit risk and the use of standardized agreements that facilitate the netting of cash flows associated with certain counterparties. Based on these credit policies and counterparty diversification, as well as utility cost recovery mechanisms, it is unlikely that counterparty non-performance would have a material effect on financial condition or results of operations. However, there is no assurance that these items will protect against all losses from counterparty non-performance.
Refer to Notes
5(a)
and
15
for details of allowances for doubtful accounts and credit risk-related contingent features, respectively.
NOTE 17(g) Collective Bargaining Agreements -
At
December 31, 2018
, employees covered by collective bargaining agreements represented
55%
,
63%
and
82%
of total employees of Alliant Energy, IPL and WPL, respectively. In May 2019, WPL’s collective bargaining agreement with International Brotherhood of Electrical Workers Local 965 expires, representing
26%
and
82%
of total employees of Alliant Energy and WPL, respectively.
NOTE 18. SEGMENTS OF BUSINESS
Alliant Energy
-
Alliant Energy’s principal businesses as of
December 31, 2018
are:
|
•
|
Utility -
includes the operations of IPL and WPL, which primarily serve retail customers in Iowa and Wisconsin. The utility business has
three
reportable segments: a) utility electric operations; b) utility gas operations; and c) utility other, which includes steam operations and the unallocated portions of the utility business. Various line items in the following tables are not allocated to the electric and gas segments for management reporting purposes, and therefore, are included only in “Total Utility.”
|
|
•
|
ATC Holdings, Non-utility, Parent and Other -
includes the operations of AEF and its subsidiaries, Corporate Services, the Alliant Energy parent company, and any Alliant Energy parent company consolidating adjustments. AEF is comprised of Alliant Energy’s interest in ATC Holdings, Transportation, a non-utility wind farm, the Sheboygan Falls Energy Facility and other non-utility holdings.
|
Alliant Energy’s administrative support services are directly charged to the applicable segment where practicable. In all other cases, administrative support services are allocated to the applicable segment based on services agreements. Intersegment revenues were not material to Alliant Energy’s operations and there was no single customer whose revenues were 10% or more of Alliant Energy’s consolidated revenues. All of Alliant Energy’s operations and assets are located in the U.S. Certain financial information relating to Alliant Energy’s business segments, which represent the services provided to its customers, was as follows (in millions):
|
ATC Holdings,
|
|||||||||||||||||||||||
|
Utility
|
Non-utility,
|
Alliant Energy
|
|||||||||||||||||||||
|
2018
|
Electric
|
Gas
|
Other
|
Total
|
Parent and Other
|
Consolidated
|
|||||||||||||||||
|
Revenues
|
|
$3,000.3
|
|
|
$446.6
|
|
|
$48.0
|
|
|
$3,494.9
|
|
|
$39.6
|
|
|
$3,534.5
|
|
|||||
|
Depreciation and amortization
|
457.3
|
|
42.0
|
|
3.6
|
|
502.9
|
|
4.0
|
|
506.9
|
|
|||||||||||
|
Operating income
|
610.2
|
|
53.2
|
|
0.3
|
|
663.7
|
|
30.7
|
|
694.4
|
|
|||||||||||
|
Interest expense
|
217.2
|
|
29.8
|
|
247.0
|
|
|||||||||||||||||
|
Equity income from unconsolidated investments, net
|
(0.9
|
)
|
—
|
|
—
|
|
(0.9
|
)
|
(53.7
|
)
|
(54.6
|
)
|
|||||||||||
|
Income taxes
|
33.0
|
|
14.7
|
|
47.7
|
|
|||||||||||||||||
|
Net income attributable to Alliant Energy common shareowners
|
472.1
|
|
40.0
|
|
512.1
|
|
|||||||||||||||||
|
Total assets
|
12,486.3
|
|
1,184.4
|
|
893.2
|
|
14,563.9
|
|
862.1
|
|
15,426.0
|
|
|||||||||||
|
Investments in equity method subsidiaries
|
8.1
|
|
—
|
|
—
|
|
8.1
|
|
413.2
|
|
421.3
|
|
|||||||||||
|
Construction and acquisition expenditures
|
1,421.1
|
|
146.8
|
|
0.4
|
|
1,568.3
|
|
65.6
|
|
1,633.9
|
|
|||||||||||
|
97
|
||
|
ATC Holdings,
|
|||||||||||||||||||||||
|
Utility
|
Non-utility,
|
Alliant Energy
|
|||||||||||||||||||||
|
2017
|
Electric
|
Gas
|
Other
|
Total
|
Parent and Other
|
Consolidated
|
|||||||||||||||||
|
Revenues
|
|
$2,894.7
|
|
|
$400.9
|
|
|
$47.5
|
|
|
$3,343.1
|
|
|
$39.1
|
|
|
$3,382.2
|
|
|||||
|
Depreciation and amortization
|
412.0
|
|
38.2
|
|
7.7
|
|
457.9
|
|
3.9
|
|
461.8
|
|
|||||||||||
|
Operating income (loss)
|
601.7
|
|
47.7
|
|
(11.6
|
)
|
637.8
|
|
33.4
|
|
671.2
|
|
|||||||||||
|
Interest expense
|
206.2
|
|
9.4
|
|
215.6
|
|
|||||||||||||||||
|
Equity income from unconsolidated investments, net
|
(0.7
|
)
|
—
|
|
—
|
|
(0.7
|
)
|
(44.1
|
)
|
(44.8
|
)
|
|||||||||||
|
Income taxes
|
51.0
|
|
15.7
|
|
66.7
|
|
|||||||||||||||||
|
Net income attributable to Alliant Energy common shareowners
|
403.4
|
|
53.9
|
|
457.3
|
|
|||||||||||||||||
|
Total assets
|
11,396.2
|
|
1,199.8
|
|
766.5
|
|
13,362.5
|
|
825.3
|
|
14,187.8
|
|
|||||||||||
|
Investments in equity method subsidiaries
|
8.3
|
|
—
|
|
—
|
|
8.3
|
|
373.1
|
|
381.4
|
|
|||||||||||
|
Construction and acquisition expenditures
|
1,154.9
|
|
125.2
|
|
1.7
|
|
1,281.8
|
|
185.1
|
|
1,466.9
|
|
|||||||||||
|
ATC Holdings,
|
|||||||||||||||||||||||
|
Utility
|
Non-utility,
|
Alliant Energy
|
|||||||||||||||||||||
|
2016
|
Electric
|
Gas
|
Other
|
Total
|
Parent and Other
|
Consolidated
|
|||||||||||||||||
|
Revenues
|
|
$2,875.5
|
|
|
$355.4
|
|
|
$48.6
|
|
|
$3,279.5
|
|
|
$40.5
|
|
|
$3,320.0
|
|
|||||
|
Depreciation and amortization
|
367.0
|
|
34.2
|
|
2.1
|
|
403.3
|
|
8.3
|
|
411.6
|
|
|||||||||||
|
Operating income (loss)
|
586.5
|
|
33.0
|
|
(4.7
|
)
|
614.8
|
|
(60.7
|
)
|
554.1
|
|
|||||||||||
|
Interest expense
|
194.6
|
|
1.6
|
|
196.2
|
|
|||||||||||||||||
|
Equity income from unconsolidated investments, net
|
(0.7
|
)
|
—
|
|
—
|
|
(0.7
|
)
|
(38.9
|
)
|
(39.6
|
)
|
|||||||||||
|
Income tax expense (benefit)
|
71.4
|
|
(12.0
|
)
|
59.4
|
|
|||||||||||||||||
|
Net income (loss) attributable to Alliant Energy common shareowners
|
385.2
|
|
(13.7
|
)
|
371.5
|
|
|||||||||||||||||
|
Total assets
|
10,722.9
|
|
1,091.1
|
|
781.0
|
|
12,595.0
|
|
778.8
|
|
13,373.8
|
|
|||||||||||
|
Investments in equity method subsidiaries
|
7.7
|
|
—
|
|
—
|
|
7.7
|
|
318.3
|
|
326.0
|
|
|||||||||||
|
Construction and acquisition expenditures
|
994.0
|
|
137.1
|
|
0.1
|
|
1,131.2
|
|
65.6
|
|
1,196.8
|
|
|||||||||||
IPL
-
IPL is a utility primarily serving retail customers in Iowa and includes
three
reportable segments: a) electric operations; b) gas operations; and c) other, which includes steam operations and the unallocated portions of the utility business. Various line items in the following tables are not allocated to the electric and gas segments for management reporting purposes, and therefore, are included only in “Total.” Intersegment revenues were not material to IPL’s operations and there was no single customer whose revenues were 10% or more of IPL’s consolidated revenues. All of IPL’s operations and assets are located in the U.S. Certain financial information relating to IPL’s business segments, which represent the services provided to its customers, was as follows (in millions):
|
2018
|
Electric
|
Gas
|
Other
|
Total
|
|||||||||||
|
Revenues
|
|
$1,731.1
|
|
|
$266.2
|
|
|
$45.0
|
|
|
$2,042.3
|
|
|||
|
Depreciation and amortization
|
254.7
|
|
25.2
|
|
3.6
|
|
283.5
|
|
|||||||
|
Operating income
|
318.2
|
|
28.3
|
|
4.3
|
|
350.8
|
|
|||||||
|
Interest expense
|
119.4
|
|
|||||||||||||
|
Income tax benefit
|
(3.2
|
)
|
|||||||||||||
|
Earnings available for common stock
|
264.0
|
|
|||||||||||||
|
Total assets
|
7,219.9
|
|
687.5
|
|
504.0
|
|
8,411.4
|
|
|||||||
|
Construction and acquisition expenditures
|
890.6
|
|
99.7
|
|
0.4
|
|
990.7
|
|
|||||||
|
2017
|
Electric
|
Gas
|
Other
|
Total
|
|||||||||||
|
Revenues
|
|
$1,598.9
|
|
|
$226.0
|
|
|
$45.4
|
|
|
$1,870.3
|
|
|||
|
Depreciation and amortization
|
215.1
|
|
22.2
|
|
7.7
|
|
245.0
|
|
|||||||
|
Operating income (loss)
|
287.3
|
|
21.7
|
|
(4.9
|
)
|
304.1
|
|
|||||||
|
Interest expense
|
112.4
|
|
|||||||||||||
|
Income tax benefit
|
(10.9
|
)
|
|||||||||||||
|
Earnings available for common stock
|
216.8
|
|
|||||||||||||
|
Total assets
|
6,524.4
|
|
727.9
|
|
353.7
|
|
7,606.0
|
|
|||||||
|
Construction and acquisition expenditures
|
594.1
|
|
80.7
|
|
1.2
|
|
676.0
|
|
|||||||
|
98
|
||
|
2016
|
Electric
|
Gas
|
Other
|
Total
|
|||||||||||
|
Revenues
|
|
$1,569.7
|
|
|
$204.0
|
|
|
$46.7
|
|
|
$1,820.4
|
|
|||
|
Depreciation and amortization
|
189.4
|
|
19.3
|
|
2.1
|
|
210.8
|
|
|||||||
|
Operating income
|
257.8
|
|
16.4
|
|
3.4
|
|
277.6
|
|
|||||||
|
Interest expense
|
103.2
|
|
|||||||||||||
|
Income tax benefit
|
(5.9
|
)
|
|||||||||||||
|
Earnings available for common stock
|
215.6
|
|
|||||||||||||
|
Total assets
|
6,278.2
|
|
653.3
|
|
373.2
|
|
7,304.7
|
|
|||||||
|
Construction and acquisition expenditures
|
598.1
|
|
91.5
|
|
0.1
|
|
689.7
|
|
|||||||
WPL
-
WPL is a utility serving customers in Wisconsin and includes
three
reportable segments: a) electric operations; b) gas operations; and c) other, which includes WPL’s interest in ATC in 2016, and the unallocated portions of the utility business. Various line items in the following tables are not allocated to the electric and gas segments for management reporting purposes, and therefore, are included only in “Total.” Intersegment revenues were not material to WPL’s operations and there was no single customer whose revenues were 10% or more of WPL’s consolidated revenues. All of WPL’s operations and assets are located in the U.S. Certain financial information relating to WPL’s business segments, which represent the services provided to its customers, was as follows (in millions):
|
2018
|
Electric
|
Gas
|
Other
|
Total
|
|||||||||||
|
Revenues
|
|
$1,269.2
|
|
|
$180.4
|
|
|
$3.0
|
|
|
$1,452.6
|
|
|||
|
Depreciation and amortization
|
202.6
|
|
16.8
|
|
—
|
|
219.4
|
|
|||||||
|
Operating income (loss)
|
292.0
|
|
24.9
|
|
(4.0
|
)
|
312.9
|
|
|||||||
|
Interest expense
|
97.8
|
|
|||||||||||||
|
Income taxes
|
36.2
|
|
|||||||||||||
|
Earnings available for common stock
|
208.1
|
|
|||||||||||||
|
Total assets
|
5,266.4
|
|
496.9
|
|
389.2
|
|
6,152.5
|
|
|||||||
|
Construction and acquisition expenditures
|
530.5
|
|
47.1
|
|
—
|
|
577.6
|
|
|||||||
|
2017
|
Electric
|
Gas
|
Other
|
Total
|
|||||||||||
|
Revenues
|
|
$1,295.8
|
|
|
$174.9
|
|
|
$2.1
|
|
|
$1,472.8
|
|
|||
|
Depreciation and amortization
|
196.9
|
|
16.0
|
|
—
|
|
212.9
|
|
|||||||
|
Operating income (loss)
|
314.4
|
|
26.0
|
|
(6.7
|
)
|
333.7
|
|
|||||||
|
Interest expense
|
93.8
|
|
|||||||||||||
|
Income taxes
|
61.9
|
|
|||||||||||||
|
Earnings available for common stock
|
186.6
|
|
|||||||||||||
|
Total assets
|
4,871.8
|
|
471.9
|
|
412.8
|
|
5,756.5
|
|
|||||||
|
Construction and acquisition expenditures
|
592.4
|
|
44.5
|
|
0.5
|
|
637.4
|
|
|||||||
|
2016
|
Electric
|
Gas
|
Other
|
Total
|
|||||||||||
|
Revenues
|
|
$1,305.8
|
|
|
$151.4
|
|
|
$1.9
|
|
|
$1,459.1
|
|
|||
|
Depreciation and amortization
|
177.6
|
|
14.9
|
|
—
|
|
192.5
|
|
|||||||
|
Operating income (loss)
|
328.7
|
|
16.6
|
|
(8.1
|
)
|
337.2
|
|
|||||||
|
Interest expense
|
91.4
|
|
|||||||||||||
|
Equity income from unconsolidated investments
|
(0.7
|
)
|
—
|
|
(39.1
|
)
|
(39.8
|
)
|
|||||||
|
Income taxes
|
93.3
|
|
|||||||||||||
|
Earnings available for common stock
|
190.4
|
|
|||||||||||||
|
Total assets
|
4,444.7
|
|
437.8
|
|
407.8
|
|
5,290.3
|
|
|||||||
|
Construction and acquisition expenditures
|
395.9
|
|
45.6
|
|
11.5
|
|
453.0
|
|
|||||||
NOTE 19. RELATED PARTIES
Service Agreements
-
Pursuant to service agreements, IPL and WPL receive various administrative and general services from an affiliate, Corporate Services. These services are billed to IPL and WPL at cost based on expenses incurred by Corporate Services for the benefit of IPL and WPL, respectively. These costs consisted primarily of employee compensation and benefits, fees associated with various professional services, depreciation and amortization of property, plant and equipment, and a return on net assets. Corporate Services also acts as agent on behalf of IPL and WPL pursuant to the service agreements. As agent, Corporate Services enters into energy, capacity, ancillary services, and transmission sale and purchase transactions within MISO. Corporate Services assigns such sales and purchases among IPL and WPL based on statements received from MISO. The amounts billed for services provided, sales credited and purchases were as follows (in millions):
|
99
|
||
|
IPL
|
WPL
|
||||||||||||||||||||||
|
2018
|
2017
|
2016
|
2018
|
2017
|
2016
|
||||||||||||||||||
|
Corporate Services billings
|
|
$170
|
|
|
$177
|
|
|
$161
|
|
|
$132
|
|
|
$135
|
|
|
$133
|
|
|||||
|
Sales credited
|
48
|
|
23
|
8
|
28
|
|
13
|
7
|
|||||||||||||||
|
Purchases billed
|
358
|
|
364
|
433
|
81
|
|
115
|
102
|
|||||||||||||||
As of December 31, net intercompany payables to Corporate Services were as follows (in millions):
|
2018
|
2017
|
||||||
|
IPL
|
|
$95
|
|
|
$114
|
|
|
|
WPL
|
71
|
|
61
|
|
|||
ATC
-
Pursuant to various agreements, WPL receives a range of transmission services from ATC. WPL provides operation, maintenance, and construction services to ATC. WPL and ATC also bill each other for use of shared facilities owned by each party. The related amounts billed between the parties were as follows (in millions):
|
2018
|
2017
|
2016
|
|||||||||
|
ATC billings to WPL
|
|
$106
|
|
|
$105
|
|
|
$110
|
|
||
|
WPL billings to ATC
|
11
|
|
10
|
|
13
|
|
|||||
As of December 31,
2018
and
2017
, WPL owed ATC net amounts of
$8 million
and
$9 million
, respectively. Refer to
Note 6
for discussion of WPL’s transfer of its investment in ATC to ATI on December 31, 2016.
WPL’s Sheboygan Falls Energy Facility Lease
-
Refer to
Note 10(b)
for discussion of WPL’s Sheboygan Falls Energy Facility lease.
Franklin County Wind Farm
-
Refer to
Note 3
for discussion of the transfer of the Franklin County wind farm from AEF to IPL in April 2017.
NOTE 20. SELECTED CONSOLIDATED QUARTERLY FINANCIAL DATA (UNAUDITED)
Alliant Energy
-
All “per share” references refer to earnings per diluted share. Summation of the individual quarters may not equal annual totals due to rounding.
|
2018
|
2017
|
||||||||||||||||||||||||||||||
|
March 31
|
June 30
|
Sep. 30
|
Dec. 31
|
March 31
|
June 30
|
Sep. 30
|
Dec. 31
|
||||||||||||||||||||||||
|
(in millions, except per share data)
|
|||||||||||||||||||||||||||||||
|
Revenues
|
|
$916.3
|
|
|
$816.1
|
|
|
$928.6
|
|
|
$873.5
|
|
|
$853.9
|
|
|
$765.3
|
|
|
$906.9
|
|
|
$856.1
|
|
|||||||
|
Operating income
|
165.7
|
|
151.2
|
|
256.1
|
|
121.4
|
|
147.2
|
|
153.7
|
|
236.3
|
|
134.0
|
|
|||||||||||||||
|
Amounts attributable to Alliant Energy common shareowners:
|
|||||||||||||||||||||||||||||||
|
Income from continuing operations, net of tax
|
120.9
|
|
100.4
|
|
205.5
|
|
85.3
|
|
99.0
|
|
94.3
|
|
168.8
|
|
93.8
|
|
|||||||||||||||
|
Income from discontinued operations, net of tax
|
—
|
|
—
|
|
—
|
|
—
|
|
1.4
|
|
—
|
|
—
|
|
—
|
|
|||||||||||||||
|
Net income
|
120.9
|
|
100.4
|
|
205.5
|
|
85.3
|
|
100.4
|
|
94.3
|
|
168.8
|
|
93.8
|
|
|||||||||||||||
|
Earnings per weighted average common share attributable to Alliant Energy common shareowners:
|
|||||||||||||||||||||||||||||||
|
Income from continuing operations, net of tax
|
0.52
|
|
0.43
|
|
0.87
|
|
0.36
|
|
0.43
|
|
0.41
|
|
0.73
|
|
0.41
|
|
|||||||||||||||
|
Income from discontinued operations, net of tax
|
—
|
|
—
|
|
—
|
|
—
|
|
0.01
|
|
—
|
|
—
|
|
—
|
|
|||||||||||||||
|
Net income
|
0.52
|
|
0.43
|
|
0.87
|
|
0.36
|
|
0.44
|
|
0.41
|
|
0.73
|
|
0.41
|
|
|||||||||||||||
|
100
|
||
IPL
-
Earnings per share data is not disclosed for IPL given Alliant Energy is the sole shareowner of all shares of IPL’s common stock outstanding during the periods presented.
|
2018
|
2017
|
||||||||||||||||||||||||||||||
|
March 31
|
June 30
|
Sep. 30
|
Dec. 31
|
March 31
|
June 30
|
Sep. 30
|
Dec. 31
|
||||||||||||||||||||||||
|
(in millions)
|
|||||||||||||||||||||||||||||||
|
Revenues
|
|
$525.8
|
|
|
$474.8
|
|
|
$547.6
|
|
|
$494.1
|
|
|
$450.5
|
|
|
$420.2
|
|
|
$527.4
|
|
|
$472.2
|
|
|||||||
|
Operating income
|
75.6
|
|
77.7
|
|
143.1
|
|
54.4
|
|
51.3
|
|
68.1
|
|
133.8
|
|
50.9
|
|
|||||||||||||||
|
Net income
|
49.3
|
|
54.2
|
|
129.1
|
|
41.6
|
|
39.8
|
|
45.3
|
|
123.0
|
|
18.9
|
|
|||||||||||||||
|
Earnings available for common stock
|
46.7
|
|
51.7
|
|
126.5
|
|
39.1
|
|
37.2
|
|
42.8
|
|
120.4
|
|
16.4
|
|
|||||||||||||||
WPL
-
Earnings per share data is not disclosed for WPL given Alliant Energy is the sole shareowner of all shares of WPL’s common stock outstanding during the periods presented.
|
2018
|
2017
|
||||||||||||||||||||||||||||||
|
March 31
|
June 30
|
Sep. 30
|
Dec. 31
|
March 31
|
June 30
|
Sep. 30
|
Dec. 31
|
||||||||||||||||||||||||
|
(in millions)
|
|||||||||||||||||||||||||||||||
|
Revenues
|
|
$381.7
|
|
|
$330.8
|
|
|
$370.7
|
|
|
$369.4
|
|
|
$393.1
|
|
|
$334.8
|
|
|
$370.2
|
|
|
$374.7
|
|
|||||||
|
Operating income
|
84.0
|
|
63.4
|
|
104.2
|
|
61.3
|
|
88.6
|
|
76.2
|
|
93.5
|
|
75.4
|
|
|||||||||||||||
|
Net income
|
54.0
|
|
39.8
|
|
76.3
|
|
38.0
|
|
45.5
|
|
38.1
|
|
49.8
|
|
53.2
|
|
|||||||||||||||
|
Earnings available for common stock
|
54.0
|
|
39.8
|
|
76.3
|
|
38.0
|
|
45.5
|
|
38.1
|
|
49.8
|
|
53.2
|
|
|||||||||||||||
ITEM 9. CHANGES IN AND DISAGREEMENTS WITH ACCOUNTANTS ON ACCOUNTING AND FINANCIAL DISCLOSURE
None.
ITEM 9A. CONTROLS AND PROCEDURES
Alliant Energy’s, IPL’s and WPL’s management evaluated, with the participation of each of Alliant Energy’s, IPL’s and WPL’s Chief Executive Officer, Chief Financial Officer and Disclosure Committee, the effectiveness of the design and operation of Alliant Energy’s, IPL’s and WPL’s disclosure controls and procedures as of the end of the quarter ended
December 31, 2018
pursuant to the requirements of the Securities Exchange Act of 1934, as amended. Based on their evaluation, the Chief Executive Officers and the Chief Financial Officer concluded that Alliant Energy’s, IPL’s and WPL’s disclosure controls and procedures were effective as of the end of the quarter ended
December 31, 2018
.
There was no change in Alliant Energy’s, IPL’s and WPL’s internal control over financial reporting that occurred during the quarter ended
December 31, 2018
that has materially affected, or is reasonably likely to materially affect, Alliant Energy’s, IPL’s and WPL’s internal control over financial reporting.
Management’s Annual Report on Internal Control over Financial Reporting
-
The management of Alliant Energy, IPL and WPL are responsible for establishing and maintaining adequate internal control over financial reporting, as such term is defined in Rules 13a-15(f) and 15d-15(f) under the Securities Exchange Act of 1934. Alliant Energy’s, IPL’s and WPL’s internal control over financial reporting is designed to provide reasonable assurance regarding the reliability of financial reporting and the preparation of financial statements for external purposes in accordance with GAAP.
Because of the inherent limitations of internal control over financial reporting, misstatements may not be prevented or detected on a timely basis. Also, projections of any evaluation of the effectiveness of the internal control over financial reporting to future periods are subject to the risk that the controls may become inadequate because of changes in conditions, or that the degree of compliance with the policies or procedures may deteriorate.
Alliant Energy’s, IPL’s and WPL’s management assessed the effectiveness of their respective internal control over financial reporting as of
December 31, 2018
using the criteria set forth in
Internal Control - Integrated Framework (2013)
issued by the Committee of Sponsoring Organizations of the Treadway Commission. Based on these assessments, Alliant Energy’s, IPL’s and WPL’s management concluded that, as of
December 31, 2018
, their respective internal control over financial reporting was effective.
Deloitte & Touche LLP, Alliant Energy’s independent registered public accounting firm, has audited Alliant Energy’s internal control over financial reporting. That report is included herein. This report does not include an attestation report of IPL’s and WPL’s independent registered public accounting firm regarding its assessment of IPL’s and WPL’s internal control over financial reporting.
|
101
|
||
REPORT OF INDEPENDENT REGISTERED PUBLIC ACCOUNTING FIRM
To the Shareowners and the Board of Directors of Alliant Energy Corporation:
Opinion on Internal Control over Financial Reporting
We have audited the internal control over financial reporting of Alliant Energy Corporation and subsidiaries (the “Company”) as of
December 31, 2018
, based on criteria established in
Internal Control - Integrated Framework (2013)
issued by the Committee of Sponsoring Organizations of the Treadway Commission (COSO). In our opinion, the Company maintained, in all material respects, effective internal control over financial reporting as of
December 31, 2018
, based on criteria established in
Internal Control - Integrated Framework (2013)
issued by COSO.
We have also audited, in accordance with the standards of the Public Company Accounting Oversight Board (United States) (PCAOB), the consolidated financial statements as of and for the year ended
December 31, 2018
, of the Company and our report dated
February 22, 2019
, expressed an unqualified opinion on those financial statements and included an explanatory paragraph regarding the Company’s adoption of Financial Accounting Standards Board Accounting Standards Update 2016-15,
Classification of Certain Cash Receipts and Cash Payments
.
Basis for Opinion
The Company’s management is responsible for maintaining effective internal control over financial reporting and for its assessment of the effectiveness of internal control over financial reporting, included in the accompanying Management’s Annual Report on Internal Control over Financial Reporting. Our responsibility is to express an opinion on the Company’s internal control over financial reporting based on our audit. We are a public accounting firm registered with the PCAOB and are required to be independent with respect to the Company in accordance with the U.S. federal securities laws and the applicable rules and regulations of the Securities and Exchange Commission and the PCAOB.
We conducted our audit in accordance with the standards of the PCAOB. Those standards require that we plan and perform the audit to obtain reasonable assurance about whether effective internal control over financial reporting was maintained in all material respects. Our audit included obtaining an understanding of internal control over financial reporting, assessing the risk that a material weakness exists, testing and evaluating the design and operating effectiveness of internal control based on the assessed risk, and performing such other procedures as we considered necessary in the circumstances. We believe that our audit provides a reasonable basis for our opinion.
Definition and Limitations of Internal Control over Financial Reporting
A company’s internal control over financial reporting is a process designed to provide reasonable assurance regarding the reliability of financial reporting and the preparation of financial statements for external purposes in accordance with generally accepted accounting principles. A company’s internal control over financial reporting includes those policies and procedures that (1) pertain to the maintenance of records that, in reasonable detail, accurately and fairly reflect the transactions and dispositions of the assets of the company; (2) provide reasonable assurance that transactions are recorded as necessary to permit preparation of financial statements in accordance with generally accepted accounting principles, and that receipts and expenditures of the company are being made only in accordance with authorizations of management and directors of the company; and (3) provide reasonable assurance regarding prevention or timely detection of unauthorized acquisition, use, or disposition of the company’s assets that could have a material effect on the financial statements.
Because of its inherent limitations, internal control over financial reporting may not prevent or detect misstatements. Also, projections of any evaluation of effectiveness to future periods are subject to the risk that controls may become inadequate because of changes in conditions, or that the degree of compliance with the policies or procedures may deteriorate.
/s/ DELOITTE & TOUCHE LLP
DELOITTE & TOUCHE LLP
Milwaukee, Wisconsin
February 22, 2019
|
102
|
||
ITEM 9B. OTHER INFORMATION
None.
PART III
ITEM 10. DIRECTORS, EXECUTIVE OFFICERS AND CORPORATE GOVERNANCE
The directors of Alliant Energy, IPL and WPL are the same, and therefore, the information required by Item 10 relating to directors and nominees for election of directors is the same for all registrants. The information required by Item 10 relating to directors and nominees for election of directors at the
2019
Annual Meeting of Shareowners, the timely filing of reports under Section 16 of the Securities Exchange Act of 1934, audit committees and audit committee financial experts, and Alliant Energy’s, IPL’s and WPL’s Code of Conduct is incorporated herein by reference to the relevant information in the
2019
Alliant Energy Proxy Statement, which will be filed with the SEC within 120 days after the end of Alliant Energy’s, IPL’s and WPL’s fiscal years. The code of ethics, also referred to as the Code of Conduct, of Alliant Energy, IPL and WPL are the same. Information regarding executive officers of Alliant Energy, IPL and WPL may be found in Part I of this report under the caption “
Executive Officers of the Registrants
.”
ITEM 11. EXECUTIVE COMPENSATION
The directors and executive officers of Alliant Energy, IPL and WPL for which compensation information must be included are the same. Therefore, the information required by Item 11 for each of Alliant Energy, IPL and WPL is incorporated herein by reference to the relevant information in the
2019
Alliant Energy Proxy Statement, which will be filed with the SEC within 120 days after the end of Alliant Energy’s, IPL’s and WPL’s fiscal years.
ITEM 12. SECURITY OWNERSHIP OF CERTAIN BENEFICIAL OWNERS AND MANAGEMENT AND RELATED STOCKHOLDER MATTERS
ALLIANT ENERGY
Information regarding Alliant Energy’s equity compensation plans as of
December 31, 2018
was as follows:
|
(A)
|
(C)
|
|||||
|
Number of securities to be
|
(B)
|
Number of securities remaining available
|
||||
|
issued upon exercise of
|
Weighted-average exercise
|
for future issuance under equity
|
||||
|
outstanding options,
|
price of outstanding options,
|
compensation plans (excluding
|
||||
|
Plan Category
|
warrants and rights
|
warrants and rights
|
securities reflected in column (A))
|
|||
|
Equity compensation plans approved by shareowners
|
948,186 (a)
|
$37.37
|
6,758,044 (b)
|
|||
|
Equity compensation plans not approved by shareowners (c)
|
N/A
|
N/A
|
N/A (d)
|
|||
|
948,186
|
$37.37
|
6,758,044
|
||||
|
(a)
|
Represents performance shares, performance restricted stock units and restricted stock units granted under the OIP. Performance shares may be paid out in shares of Alliant Energy’s common stock, cash, or a combination of cash and stock and performance restricted stock units are paid out in shares of Alliant Energy’s common stock. The performance share and performance restricted stock unit awards are adjusted by a performance multiplier, which ranges from zero to 200%, based on the performance criteria. The performance share and performance restricted stock unit awards included in column (A) of the table reflect an assumed payout in the form of Alliant Energy’s common stock at the maximum performance multiplier of 200% for the
2018
and
2017
grants, and at the estimated payout percentages for the
2016
grants. Also included are restricted stock units granted under the OIP, which may be paid out in shares of Alliant Energy’s common stock, cash, or a combination of cash and stock at the expiration of a three-year time-vesting period.
|
|
(b)
|
All of the available shares under the Amended and Restated OIP may be issued as awards in the form of shares of Alliant Energy’s common stock, restricted stock, restricted stock units, performance shares, performance units and other stock-based or cash-based awards. As of
December 31, 2018
, there were performance shares and restricted stock units (performance- and time-vesting) outstanding under the Amended and Restated OIP.
|
|
(c)
|
As of
December 31, 2018
, there were
384,580
shares of Alliant Energy’s common stock held under the DCP, which is described in
Note 13(c)
.
|
|
(d)
|
There is no limit on the number of shares of Alliant Energy’s common stock that may be held under the DCP.
|
|
103
|
||
The remainder of the information required by Item 12 is incorporated herein by reference to the relevant information in the
2019
Alliant Energy Proxy Statement, which will be filed with the SEC within 120 days after the end of Alliant Energy’s fiscal year.
IPL AND WPL
None of IPL’s directors or executive officers own any shares of preferred stock in IPL. The remainder of the information required by Item 12 is incorporated herein by reference to the relevant information in the
2019
Alliant Energy Proxy Statement, which will be filed with the SEC within 120 days after the end of IPL’s and WPL’s fiscal years.
ITEM 13. CERTAIN RELATIONSHIPS AND RELATED TRANSACTIONS, AND DIRECTOR INDEPENDENCE
The information required by Item 13 for each of Alliant Energy, IPL and WPL is incorporated herein by reference to the relevant information in the
2019
Alliant Energy Proxy Statement, which will be filed with the SEC within 120 days after the end of Alliant Energy’s, IPL’s and WPL’s fiscal years.
ITEM 14. PRINCIPAL ACCOUNTING FEES AND SERVICES
ALLIANT ENERGY
The information required by Item 14 is incorporated herein by reference to the relevant information in the
2019
Alliant Energy Proxy Statement, which will be filed with the SEC within 120 days after the end of Alliant Energy’s fiscal year.
IPL AND WPL
Each of IPL’s and WPL’s Audit Committee of the Board of Directors has adopted a policy that requires advance approval of all audit, audit-related, tax and other permitted services performed by the independent registered public accounting firm. The policy provides for pre-approval by the Audit Committee of specifically defined audit and non-audit services after the Audit Committee is provided with the appropriate level of details regarding the specific services to be provided. The policy does not permit delegation of the Audit Committee’s authority to management. In the event the need for specific services arises between Audit Committee meetings, the Audit Committee has delegated to the Chairperson of the Audit Committee authority to approve permitted services provided that the Chairperson reports any decisions to the Audit Committee at its next scheduled meeting. The principal accounting fees billed to Alliant Energy by its independent registered public accounting firm, all of which were approved in advance by the Audit Committee, directly related and allocated to IPL and WPL were as follows (in thousands):
|
IPL
|
WPL
|
||||||||||||||||||||||||||
|
2018
|
2017
|
2018
|
2017
|
||||||||||||||||||||||||
|
Fees
|
% of Total
|
Fees
|
% of Total
|
Fees
|
% of Total
|
Fees
|
% of Total
|
||||||||||||||||||||
|
Audit fees
|
|
$1,483
|
|
91
|
%
|
|
$1,083
|
|
90
|
%
|
|
$1,102
|
|
94
|
%
|
|
$1,070
|
|
93
|
%
|
|||||||
|
Audit-related fees
|
111
|
|
7
|
%
|
67
|
|
5
|
%
|
37
|
|
3
|
%
|
42
|
|
4
|
%
|
|||||||||||
|
Tax fees
|
31
|
|
2
|
%
|
9
|
|
1
|
%
|
24
|
|
2
|
%
|
2
|
|
—
|
%
|
|||||||||||
|
All other fees
|
10
|
|
—
|
%
|
44
|
|
4
|
%
|
8
|
|
1
|
%
|
36
|
|
3
|
%
|
|||||||||||
|
|
$1,635
|
|
100
|
%
|
|
$1,203
|
|
100
|
%
|
|
$1,171
|
|
100
|
%
|
|
$1,150
|
|
100
|
%
|
||||||||
IPL’s and WPL’s audit fees for
2018
and
2017
consisted of the respective fees billed for the audits of the financial statements of IPL and its subsidiary and WPL and its subsidiary, for reviews of financial statements included in Form 10-Q filings, and for services normally provided in connection with statutory and regulatory filings, such as financing transactions. IPL’s and WPL’s audit fees also included their respective portion of fees for the
2018
and
2017
audits of Alliant Energy’s financial statements and effectiveness of internal controls over financial reporting. IPL’s and WPL’s audit-related fees for
2018
and
2017
consisted of the fees billed for services rendered related to employee benefits plan audits and other attest services. IPL’s and WPL’s tax fees for
2018
and
2017
consisted of the fees billed for professional services rendered for tax compliance, tax advice and tax planning, including all services performed by the tax professional staff of affiliates of the independent registered public accounting firm, except those rendered in connection with the audit. All other fees for
2018
and
2017
for IPL and WPL consisted of license fees for accounting research software products and seminars, and, with respect to 2017, consultation services. The Audit Committee does not consider the provision of non-audit services by the independent registered public accounting firm described above to be incompatible with maintaining independence of the independent registered public accounting firm.
|
104
|
||
PART IV
ITEM 15. EXHIBITS, FINANCIAL STATEMENT SCHEDULES
|
(1)
|
Consolidated Financial Statements - Refer to
Item 8
Financial Statements and Supplementary Data.
|
|
(2)
|
Financial Statement Schedules
-
|
SCHEDULE I - CONDENSED PARENT COMPANY FINANCIAL STATEMENTS
|
ALLIANT ENERGY CORPORATION (Parent Company Only)
|
Year Ended December 31,
|
||||||||||
|
CONDENSED STATEMENTS OF INCOME
|
2018
|
2017
|
2016
|
||||||||
|
(in millions)
|
|||||||||||
|
Revenues
|
|
$—
|
|
|
$—
|
|
|
$1
|
|
||
|
Operating expenses
|
5
|
|
2
|
|
3
|
|
|||||
|
Operating loss
|
(5
|
)
|
(2
|
)
|
(2
|
)
|
|||||
|
Other (income) and deductions:
|
|||||||||||
|
Equity earnings from consolidated subsidiaries
|
(523
|
)
|
(457
|
)
|
(374
|
)
|
|||||
|
Interest expense
|
4
|
|
3
|
|
3
|
|
|||||
|
Other
|
2
|
|
—
|
|
(2
|
)
|
|||||
|
Total other (income) and deductions
|
(517
|
)
|
(454
|
)
|
(373
|
)
|
|||||
|
Income before income taxes
|
512
|
|
452
|
|
371
|
|
|||||
|
Income tax benefit
|
(1
|
)
|
(6
|
)
|
(1
|
)
|
|||||
|
Net income
|
|
$513
|
|
|
$458
|
|
|
$372
|
|
||
Refer to accompanying Notes to Condensed Financial Statements.
|
ALLIANT ENERGY CORPORATION (Parent Company Only)
|
December 31,
|
||||||
|
CONDENSED BALANCE SHEETS
|
2018
|
2017
|
|||||
|
(in millions)
|
|||||||
|
ASSETS
|
|||||||
|
Current assets:
|
|||||||
|
Notes receivable from affiliated companies
|
|
$23
|
|
|
$50
|
|
|
|
Other
|
4
|
|
7
|
|
|||
|
Total current assets
|
27
|
|
57
|
|
|||
|
Investments:
|
|||||||
|
Investments in consolidated subsidiaries
|
5,518
|
|
4,676
|
|
|||
|
Other
|
1
|
|
2
|
|
|||
|
Total investments
|
5,519
|
|
4,678
|
|
|||
|
Other assets
|
81
|
|
78
|
|
|||
|
Total assets
|
|
$5,627
|
|
|
$4,813
|
|
|
|
LIABILITIES AND EQUITY
|
|||||||
|
Current liabilities:
|
|||||||
|
Commercial paper
|
|
$285
|
|
|
$295
|
|
|
|
Notes payable to affiliated companies
|
719
|
|
305
|
|
|||
|
Other
|
21
|
|
12
|
|
|||
|
Total current liabilities
|
1,025
|
|
612
|
|
|||
|
Other liabilities
|
17
|
|
20
|
|
|||
|
Common equity:
|
|||||||
|
Common stock and additional paid-in capital
|
2,048
|
|
1,848
|
|
|||
|
Retained earnings
|
2,545
|
|
2,344
|
|
|||
|
Accumulated other comprehensive income
|
2
|
|
—
|
|
|||
|
Shares in deferred compensation trust
|
(10
|
)
|
(11
|
)
|
|||
|
Total common equity
|
4,585
|
|
4,181
|
|
|||
|
Total liabilities and equity
|
|
$5,627
|
|
|
$4,813
|
|
|
Refer to accompanying Notes to Condensed Financial Statements.
|
105
|
||
|
ALLIANT ENERGY CORPORATION (Parent Company Only)
|
Year Ended December 31,
|
||||||||||
|
CONDENSED STATEMENTS OF CASH FLOWS
|
2018
|
|
2017
|
|
2016
|
||||||
|
|
(in millions)
|
||||||||||
|
Net cash flows from operating activities
|
|
$311
|
|
|
|
$273
|
|
|
|
$254
|
|
|
Cash flows from (used for) investing activities:
|
|
|
|
|
|
|
|
|
|||
|
Capital contributions to consolidated subsidiaries
|
(625
|
)
|
|
(290
|
)
|
|
(250
|
)
|
|||
|
Capital repayments from consolidated subsidiaries
|
—
|
|
|
—
|
|
|
130
|
|
|||
|
Net change in notes receivable from and payable to affiliates
|
441
|
|
54
|
|
294
|
|
|||||
|
Other
|
—
|
|
|
—
|
|
|
10
|
|
|||
|
Net cash flows from (used for) investing activities
|
(184
|
)
|
|
(236
|
)
|
|
184
|
|
|||
|
Cash flows used for financing activities:
|
|
|
|
|
|
|
|
|
|||
|
Common stock dividends
|
(312
|
)
|
|
(288
|
)
|
|
(267
|
)
|
|||
|
Proceeds from issuance of common stock, net
|
197
|
|
150
|
|
27
|
|
|||||
|
Payments to retire long-term debt
|
—
|
|
—
|
|
(250
|
)
|
|||||
|
Net change in commercial paper
|
(10
|
)
|
|
103
|
|
|
52
|
|
|||
|
Other
|
(2
|
)
|
|
(2
|
)
|
|
—
|
|
|||
|
Net cash flows used for financing activities
|
(127
|
)
|
|
(37
|
)
|
|
(438
|
)
|
|||
|
Net increase (decrease) in cash, cash equivalents and restricted cash
|
—
|
|
|
—
|
|
|
—
|
|
|||
|
Cash, cash equivalents and restricted cash at beginning of period
|
—
|
|
|
—
|
|
|
—
|
|
|||
|
Cash, cash equivalents and restricted cash at end of period
|
|
$—
|
|
|
|
$—
|
|
|
|
$—
|
|
|
Supplemental cash flows information:
|
|
|
|
|
|
|
|
|
|||
|
Cash (paid) refunded during the period for:
|
|
|
|
|
|
|
|
|
|||
|
Interest, net of capitalized interest
|
|
($4
|
)
|
|
|
($3
|
)
|
|
|
($3
|
)
|
|
Income taxes, net
|
5
|
|
|
—
|
|
|
(37
|
)
|
|||
Refer to accompanying Notes to Condensed Financial Statements.
ALLIANT ENERGY CORPORATION
(Parent Company Only)
NOTES TO CONDENSED FINANCIAL STATEMENTS
Pursuant to rules and regulations of the SEC, the Condensed Financial Statements of Alliant Energy Corporation (Parent Company Only) do not reflect all of the information and notes normally included with financial statements prepared in accordance with GAAP. Therefore, these Condensed Financial Statements should be read in conjunction with the Financial Statements and related Notes included in the combined
2018
Form 10-K, Part II,
Item 8
, which is incorporated herein by reference.
In the Condensed Financial Statements of Alliant Energy Corporation (Parent Company Only), investments in subsidiaries are accounted for using the equity method.
|
106
|
||
SCHEDULE II - VALUATION AND QUALIFYING ACCOUNTS AND RESERVES
|
Additions
|
|||||||
|
Balance,
|
Charged to
|
Charged to Other
|
Balance,
|
||||
|
Description
|
January 1
|
Expense
|
Accounts (a)
|
Deductions (b)
|
December 31
|
||
|
(in millions)
|
|||||||
Valuation and Qualifying Accounts Which are Deducted in the Balance Sheet From the Assets to Which They Apply:
|
Accumulated Provision for Uncollectible Accounts:
|
||||||||||||||||||
|
Alliant Energy (c)
|
||||||||||||||||||
|
Year ended December 31, 2018
|
|
$12.0
|
|
|
$21.2
|
|
|
$1.0
|
|
|
$23.7
|
|
|
$10.5
|
|
|||
|
Year ended December 31, 2017
|
8.7
|
|
15.1
|
|
5.4
|
|
17.2
|
|
12.0
|
|
||||||||
|
Year ended December 31, 2016
|
4.8
|
|
17.4
|
|
8.8
|
|
22.3
|
|
8.7
|
|
||||||||
|
IPL (c)
|
||||||||||||||||||
|
Year ended December 31, 2018
|
|
$1.3
|
|
|
$20.9
|
|
|
$—
|
|
|
$19.1
|
|
|
$3.1
|
|
|||
|
Year ended December 31, 2017
|
1.1
|
|
14.9
|
|
—
|
|
14.7
|
|
1.3
|
|
||||||||
|
Year ended December 31, 2016
|
0.6
|
|
17.2
|
|
—
|
|
16.7
|
|
1.1
|
|
||||||||
|
WPL
|
||||||||||||||||||
|
Year ended December 31, 2018
|
|
$10.7
|
|
|
$0.3
|
|
|
$1.0
|
|
|
$4.6
|
|
|
$7.4
|
|
|||
|
Year ended December 31, 2017
|
7.1
|
|
0.2
|
|
5.4
|
|
2.0
|
|
10.7
|
|
||||||||
|
Year ended December 31, 2016
|
3.7
|
|
0.1
|
|
8.8
|
|
5.5
|
|
7.1
|
|
||||||||
Note: The above provisions relate to various customer, notes and other receivable balances included in various line items on the respective balance sheets.
Other Reserves:
|
Accumulated Provision for Other Reserves (d):
|
||||||||||||||||||
|
Alliant Energy
|
||||||||||||||||||
|
Year ended December 31, 2018
|
|
$23.0
|
|
|
$1.4
|
|
|
$—
|
|
|
$9.5
|
|
|
$14.9
|
|
|||
|
Year ended December 31, 2017
|
25.1
|
|
3.3
|
|
5.1
|
|
10.5
|
|
23.0
|
|
||||||||
|
Year ended December 31, 2016
|
27.1
|
|
6.1
|
|
—
|
|
8.1
|
|
25.1
|
|
||||||||
|
IPL
|
||||||||||||||||||
|
Year ended December 31, 2018
|
|
$7.6
|
|
|
$0.9
|
|
|
$—
|
|
|
$2.1
|
|
|
$6.4
|
|
|||
|
Year ended December 31, 2017
|
8.7
|
|
0.3
|
|
—
|
|
1.4
|
|
7.6
|
|
||||||||
|
Year ended December 31, 2016
|
9.4
|
|
1.0
|
|
—
|
|
1.7
|
|
8.7
|
|
||||||||
|
WPL
|
||||||||||||||||||
|
Year ended December 31, 2018
|
|
$6.4
|
|
|
$0.5
|
|
|
$—
|
|
|
$2.3
|
|
|
$4.6
|
|
|||
|
Year ended December 31, 2017
|
8.1
|
|
0.1
|
|
—
|
|
1.8
|
|
6.4
|
|
||||||||
|
Year ended December 31, 2016
|
11.4
|
|
1.8
|
|
—
|
|
5.1
|
|
8.1
|
|
||||||||
|
(a)
|
Accumulated provision for uncollectible accounts: In accordance with its regulatory treatment, certain amounts provided by WPL are recorded in regulatory assets. WPL expenses these amounts when an uncollectible account is written-off.
|
Accumulated provision for other reserves: In 2017, Alliant Energy recorded amounts to deferred tax liabilities related to the impacts of Federal Tax Reform.
|
(b)
|
Deductions are of the nature for which the reserves were created. In the case of the accumulated provision for uncollectible accounts, deductions from this reserve are reduced by recoveries of amounts previously written off.
|
|
(c)
|
Refer to
Note 5(b)
for discussion of IPL’s sales of accounts receivable program.
|
|
(d)
|
Other reserves are largely related to injury and damage claims arising in the ordinary course of business, and the impacts of Federal Tax Reform.
|
NOTE: All other schedules are omitted because they are not applicable or not required, or because that required information is shown either in the financial statements or in the notes thereto.
|
(3)
|
Exhibits Required by SEC Regulation S-K
- Pursuant to Item 601(b)(4)(iii) of Regulation S-K, the registrants agree to furnish to the SEC, upon request, any instrument defining the rights of holders of unregistered long-term debt not filed as an exhibit to this combined Form 10-K. No such instrument authorizes securities in excess of 10% of the total assets of Alliant Energy, IPL or WPL, as the case may be. The following exhibits for Alliant Energy, IPL and WPL are filed herewith or incorporated herein by reference.
|
|
107
|
||
|
Exhibit Number
|
Description
|
|
|
1.1
|
||
|
3.1
|
||
|
3.1a
|
||
|
3.2
|
||
|
3.3
|
||
|
3.4
|
||
|
3.5
|
||
|
3.6
|
||
|
4.1
|
||
|
4.2
|
||
|
4.3
|
||
|
4.4
|
||
|
4.5
|
||
|
4.6
|
||
|
4.7
|
||
|
4.8
|
||
|
4.9
|
||
|
4.10
|
||
|
4.11
|
||
|
4.12
|
||
|
4.13
|
||
|
4.14
|
||
|
4.15
|
||
|
4.15a
|
||
|
4.16
|
||
|
4.17
|
||
|
4.18
|
||
|
108
|
||
|
Exhibit Number
|
Description
|
|
|
4.19
|
||
|
4.20
|
||
|
4.20a
|
||
|
4.21
|
||
|
4.22
|
||
|
4.23
|
||
|
4.24
|
||
|
10.1
|
||
|
10.2
|
||
|
10.3
|
||
|
10.4
|
||
|
10.5
|
||
|
10.6#
|
||
|
10.6a#
|
||
|
10.6b#
|
||
|
10.6c#
|
||
|
10.6d#
|
||
|
10.6e#
|
||
|
10.6f#
|
||
|
10.6g#
|
||
|
10.7#
|
||
|
10.7a#
|
||
|
10.7b#
|
||
|
10.7c#
|
||
|
10.8#
|
||
|
10.8a#
|
||
|
10.9#
|
||
|
10.10#
|
||
|
10.10a#
|
||
|
109
|
||
|
Exhibit Number
|
Description
|
|
|
10.10b#
|
||
|
10.11#
|
||
|
10.11a#
|
||
|
10.12#
|
||
|
10.13#
|
||
|
10.13a#
|
||
|
10.13b#
|
||
|
10.14#
|
||
|
10.15#
|
||
|
10.15a#
|
||
|
10.16#
|
||
|
10.17#
|
||
|
10.18#
|
||
|
10.19#
|
||
|
21.1
|
||
|
23.1
|
||
|
23.2
|
||
|
23.3
|
||
|
31.1
|
||
|
31.2
|
||
|
31.3
|
||
|
31.4
|
||
|
31.5
|
||
|
31.6
|
||
|
32.1
|
||
|
32.2
|
||
|
32.3
|
||
|
101.INS
|
Extensible Business Reporting Language (XBRL) Instance Document
|
|
|
101.SCH
|
XBRL Taxonomy Extension Schema Document
|
|
|
101.CAL
|
XBRL Taxonomy Extension Calculation Linkbase Document
|
|
|
101.LAB
|
XBRL Taxonomy Extension Label Linkbase Document
|
|
|
101.PRE
|
XBRL Taxonomy Extension Presentation Linkbase Document
|
|
|
101.DEF
|
XBRL Taxonomy Extension Definition Linkbase Document
|
|
# A management contract or compensatory plan or arrangement.
ITEM 16. FORM 10-K SUMMARY
None.
|
110
|
||
SIGNATURES
Pursuant to the requirements of Section 13 or 15(d) of the Securities Exchange Act of 1934, the Registrants have duly caused this report to be signed on their behalf by the undersigned, thereunto duly authorized on the
22nd day of February 2019
.
|
ALLIANT ENERGY
|
INTERSTATE POWER
|
WISCONSIN POWER
|
||
|
CORPORATION
|
AND LIGHT COMPANY
|
AND LIGHT COMPANY
|
||
|
By: /s/ Patricia L. Kampling
|
By: /s/ John O. Larsen
|
By: /s/ John O. Larsen
|
||
|
Patricia L. Kampling
|
John O. Larsen
|
John O. Larsen
|
||
|
Chairman and Chief Executive Officer
|
Chief Executive Officer
|
Chief Executive Officer
|
||
Pursuant to the requirements of the Securities Exchange Act of 1934, this report has been signed below by the following persons on behalf of the Registrants and in the capacities indicated on the
22nd day of February 2019
.
|
ALLIANT ENERGY
|
INTERSTATE POWER
|
WISCONSIN POWER
|
||
|
CORPORATION
|
AND LIGHT COMPANY
|
AND LIGHT COMPANY
|
||
|
/s/ Patricia L. Kampling
|
/s/ John O. Larsen
|
/s/ John O. Larsen
|
||
|
Patricia L. Kampling
|
John O. Larsen
|
John O. Larsen
|
||
|
Chairman, Chief Executive Officer and Director (Principal Executive Officer)
|
Chief Executive Officer and Director (Principal Executive Officer)
|
Chief Executive Officer and Director (Principal Executive Officer)
|
||
|
/s/ Robert J. Durian
|
/s/ Robert J. Durian
|
/s/ Robert J. Durian
|
||
|
Robert J. Durian
|
Robert J. Durian
|
Robert J. Durian
|
||
|
Senior Vice President and Chief Financial Officer (Principal Financial Officer)
|
Senior Vice President and Chief Financial Officer (Principal Financial Officer)
|
Senior Vice President and Chief Financial Officer (Principal Financial Officer)
|
||
|
/s/ Benjamin M. Bilitz
|
/s/ Benjamin M. Bilitz
|
/s/ Benjamin M. Bilitz
|
||
|
Benjamin M. Bilitz
|
Benjamin M. Bilitz
|
Benjamin M. Bilitz
|
||
|
Chief Accounting Officer and Controller (Principal Accounting Officer)
|
Chief Accounting Officer and Controller (Principal Accounting Officer)
|
Chief Accounting Officer and Controller (Principal Accounting Officer)
|
||
|
/s/ Patrick E. Allen
|
/s/ Patricia L. Kampling
|
/s/ Patricia L. Kampling
|
||
|
Patrick E. Allen, Director
|
Patricia L. Kampling, Chairman and Director
|
Patricia L. Kampling, Chairman and Director
|
||
|
/s/ Deborah B. Dunie
|
/s/ Patrick E. Allen
|
/s/ Patrick E. Allen
|
||
|
Deborah B. Dunie, Director
|
Patrick E. Allen, Director
|
Patrick E. Allen, Director
|
||
|
/s/ Darryl B. Hazel
|
/s/ Deborah B. Dunie
|
/s/ Deborah B. Dunie
|
||
|
Darryl B. Hazel, Director
|
Deborah B. Dunie, Director
|
Deborah B. Dunie, Director
|
||
|
/s/ John O. Larsen
|
/s/ Darryl B. Hazel
|
/s/ Darryl B. Hazel
|
||
|
John O. Larsen, Director
|
Darryl B. Hazel, Director
|
Darryl B. Hazel, Director
|
||
|
/s/ Singleton B. McAllister
|
/s/ Singleton B. McAllister
|
/s/ Singleton B. McAllister
|
||
|
Singleton B. McAllister, Director
|
Singleton B. McAllister, Director
|
Singleton B. McAllister, Director
|
||
|
/s/ Roger K. Newport
|
/s/ Roger K. Newport
|
/s/ Roger K. Newport
|
||
|
Roger K. Newport, Director
|
Roger K. Newport, Director
|
Roger K. Newport, Director
|
||
|
/s/ Thomas F. O’Toole
|
/s/ Thomas F. O’Toole
|
/s/ Thomas F. O’Toole
|
||
|
Thomas F. O’Toole, Director
|
Thomas F. O’Toole, Director
|
Thomas F. O’Toole, Director
|
||
|
/s/ Dean C. Oestreich
|
/s/ Dean C. Oestreich
|
/s/ Dean C. Oestreich
|
||
|
Dean C. Oestreich, Director
|
Dean C. Oestreich, Director
|
Dean C. Oestreich, Director
|
||
|
/s/ Carol P. Sanders
|
/s/ Carol P. Sanders
|
/s/ Carol P. Sanders
|
||
|
Carol P. Sanders, Director
|
Carol P. Sanders, Director
|
Carol P. Sanders, Director
|
||
|
/s/ Susan D. Whiting
|
/s/ Susan D. Whiting
|
/s/ Susan D. Whiting
|
||
|
Susan D. Whiting, Director
|
Susan D. Whiting, Director
|
Susan D. Whiting, Director
|
||
|
111
|
||
TABLE OF CONTENTS
Part IItem 1. BusinessItem 1A. Risk FactorsItem 1B. Unresolved Staff CommentsItem 2. PropertiesItem 3. Legal ProceedingsItem 4. Mine Safety DisclosuresPart IIItem 5. Market For Registrants Common Equity, Related Stockholder Matters and Issuer Purchases Of Equity SecuritiesItem 6. Selected Financial DataItem 7. Management S Discussion and Analysis Of Financial Condition and Results Of OperationsItem 7A. Quantitative and Qualitative Disclosures About Market RiskItem 8. Financial Statements and Supplementary DataNote 1. Summary Of Significant Accounting PoliciesNote 1(a) General -Note 1(b) Regulatory Assets and Regulatory Liabilities -Note 1(c) Income Taxes -Note 1(d) Cash, Cash Equivalents and Restricted Cash -Note 1(e) Property, Plant and Equipment -Note 1(f) Revenue Recognition -Note 1(g) Utility Cost Recovery Mechanisms -Note 1(h) Financial Instruments -Note 1(i) Asset Impairments -Note 1(j) Asset Retirement Obligations -Note 1(k) Debt Issuance and Retirement Costs -Note 1(l) Allowance For Doubtful Accounts -Note 1(m) Variable Interest Entities -Note 1(n) New Accounting Standards -Note 2. Regulatory MattersNote 3. Property, Plant and EquipmentNote 4. Jointly-owned Electric Utility PlantNote 5. ReceivablesNote 5(a) Accounts Receivable -Note 5(b) Sales Of Accounts Receivable -Note 6. InvestmentsNote 7. Common EquityNote 8. Preferred StockNote 9. DebtNote 9(a) Short-term Debt -Note 9(b) Long-term Debt - Long-term Debt, Net As Of December 31 Was As Follows (dollars in Millions):Note 9(b) Long-term Debt -Note 10. LeasesNote 10(a) Operating Leases -Note 10(b) Capital Leases -Note 11. RevenuesNote 12. Income TaxesNote 13. Benefit PlansNote 13(a) Pension and Other Postretirement Benefits Plans -Note 13(b) Equity-based Compensation Plans -Note 13(c) Deferred Compensation Plan -Note 14. Asset Retirement ObligationsNote 15. Derivative InstrumentsNote 16. Fair Value MeasurementsNote 17. Commitments and ContingenciesNote 17(a) Capital Purchase Commitments -Note 17(b) Other Purchase Commitments -Note 17(c) Legal Proceedings -Note 17(d) Guarantees and Indemnifications -Note 17(e) Environmental Matters -Note 17(f) Credit Risk -Note 17(g) Collective Bargaining Agreements -Note 18. Segments Of BusinessNote 19. Related PartiesNote 20. Selected Consolidated Quarterly Financial Data (unaudited)Item 9. Changes in and Disagreements with Accountants on Accounting and Financial DisclosureItem 9A. Controls and ProceduresItem 9B. Other InformationPart IIIItem 10. Directors, Executive Officers and Corporate GovernanceItem 11. Executive CompensationItem 12. Security Ownership Of Certain Beneficial Owners and Management and Related Stockholder MattersItem 13. Certain Relationships and Related Transactions, and Director IndependenceItem 14. Principal Accounting Fees and ServicesPart IVItem 15. Exhibits, Financial Statement SchedulesItem 16. Form 10-k Summary