ALLIANT ENERGY CORP
10-Ks and 10-Qs
|
|
|
|
|
|
|
|
|
|
|
|
|
|
|
|
|
|
|
|
|
|
|
|
|
|
|
|
|
|
|
|
|
|
|
|
|
|
|
|
|
|
|
|
|
|
|
|
|
|
|
|
|
|
|
|
|
|
|
UNITED STATES
SECURITIES AND EXCHANGE COMMISSION
WASHINGTON, D.C. 20549
FORM
10-Q
For the quarterly period ended
March 31, 2023
or
For the transition period from to

Name of Registrant, State of Incorporation, Address of Principal Executive Offices, Telephone Number, Commission File Number, IRS Employer Identification Number
(a
Wisconsin
Corporation)
Telephone (
608
)
458-3311
Commission File Number -
1-9894
IRS Employer Identification Number -
39-1380265
(an
Iowa
corporation)
Telephone (
319
)
786-4411
Commission File Number -
1-4117
IRS Employer Identification Number -
42-0331370
(a
Wisconsin
corporation)
Telephone (
608
)
458-3311
Commission File Number -
0-337
IRS Employer Identification Number -
39-0714890
This combined Form 10-Q is separately filed by Alliant Energy Corporation, Interstate Power and Light Company and Wisconsin Power and Light Company. Information contained in the Form 10-Q relating to Interstate Power and Light Company and Wisconsin Power and Light Company is filed by each such registrant on its own behalf. Each of Interstate Power and Light Company and Wisconsin Power and Light Company makes no representation as to information relating to registrants other than itself.
Securities registered pursuant to Section 12(b) of the Act:
Alliant Energy Corporation,
Common Stock, $0.01 Par Value
, Trading Symbol
LNT
,
Nasdaq Global Select Market
Indicate by check mark whether the registrant (1) has filed all reports required to be filed by Section 13 or 15(d) of the Securities Exchange Act of 1934 during the preceding 12 months (or for such shorter period that the registrant was required to file such reports), and (2) has been subject to such filing requirements for the past 90 days.
Alliant Energy Corporation -
Yes
☒ No ☐
Interstate Power and Light Company -
Yes
☒ No ☐
Wisconsin Power and Light Company -
Yes
☒ No ☐
Indicate by check mark whether the registrant has submitted electronically every Interactive Data File required to be submitted pursuant to Rule 405 of Regulation S-T (§232.405 of this chapter) during the preceding 12 months (or for such shorter period that the registrant was required to submit such files).
Alliant Energy Corporation -
Yes
☒ No ☐
Interstate Power and Light Company -
Yes
☒ No ☐
Wisconsin Power and Light Company -
Yes
☒ No ☐
Indicate by check mark whether the registrant is a large accelerated filer, an accelerated filer, a non-accelerated filer, a smaller reporting company, or an emerging growth company. See the definitions of “large accelerated filer,” “accelerated filer,” “smaller reporting company,” and “emerging growth company” in Rule 12b-2 of the Exchange Act.
Alliant Energy Corporation -
Large Accelerated Filer
☒ Accelerated Filer ☐ Non-accelerated Filer ☐ Smaller Reporting Company
☐
Emerging Growth Company
☐
Interstate Power and Light Company - Large Accelerated Filer ☐ Accelerated Filer ☐
Non-accelerated Filer
☒ Smaller Reporting Company
☐
Emerging Growth Company
☐
Wisconsin Power and Light Company - Large Accelerated Filer ☐ Accelerated Filer ☐
Non-accelerated Filer
☒ Smaller Reporting Company
☐
Emerging Growth Company
☐
If an emerging growth company, indicate by check mark if the registrant has elected not to use the extended transition period for complying with any new or revised financial accounting standards provided pursuant to Section 13(a) of the Exchange Act.
Alliant Energy Corporation ☐
Interstate Power and Light Company ☐
Wisconsin Power and Light Company ☐
Indicate by check mark whether the registrant is a shell company (as defined in Rule 12b-2 of the Exchange Act).
Alliant Energy Corporation - Yes
☐
No ☒
Interstate Power and Light Company - Yes
☐
No ☒
Wisconsin Power and Light Company - Yes
☐
No ☒
Number of shares outstanding of each class of common stock as of March 31, 2023:
Alliant Energy Corporation, Common Stock, $0.01 par value,
251,387,788
shares outstanding
Interstate Power and Light Company, Common Stock, $2.50 par value,
13,370,788
shares outstanding (all outstanding shares are owned beneficially and of record by Alliant Energy Corporation)
Wisconsin Power and Light Company, Common Stock, $5 par value,
13,236,601
shares outstanding (all outstanding shares are owned beneficially and of record by Alliant Energy Corporation)
TABLE OF CONTENTS
| Page | |||||
DEFINITIONS
The following abbreviations or acronyms used in this report are defined below:
| Abbreviation or Acronym | Definition | Abbreviation or Acronym | Definition | ||||||||
|
2022 Form 10-K
|
Combined Annual Report on Form 10-K filed by Alliant Energy, IPL and WPL for the year ended Dec. 31, 2022
|
IUB | Iowa Utilities Board | ||||||||
| AEF | Alliant Energy Finance, LLC | MDA | Management’s Discussion and Analysis of Financial Condition and Results of Operations | ||||||||
| AFUDC | Allowance for funds used during construction | MISO | Midcontinent Independent System Operator, Inc. | ||||||||
| Alliant Energy | Alliant Energy Corporation | MW | Megawatt | ||||||||
| ATC | American Transmission Company LLC | MWh | Megawatt-hour | ||||||||
| ATC Holdings | Interest in American Transmission Company LLC and ATC Holdco LLC | N/A | Not applicable | ||||||||
| Corporate Services | Alliant Energy Corporate Services, Inc. | Note(s) | Combined Notes to Condensed Consolidated Financial Statements | ||||||||
| Dth | Dekatherm | OPEB | Other postretirement benefits | ||||||||
| EGU | Electric generating unit | PPA | Purchased power agreement | ||||||||
| EPA | U.S. Environmental Protection Agency | PSCW | Public Service Commission of Wisconsin | ||||||||
| EPS | Earnings per weighted average common share | SEC | Securities and Exchange Commission | ||||||||
| Financial Statements | Condensed Consolidated Financial Statements | U.S. | United States of America | ||||||||
| FTR | Financial transmission right | West Riverside | West Riverside Energy Center and Solar Facility | ||||||||
| GAAP | U.S. generally accepted accounting principles | Whiting Petroleum | Whiting Petroleum Corporation | ||||||||
| IPL | Interstate Power and Light Company | WPL | Wisconsin Power and Light Company | ||||||||
FORWARD-LOOKING STATEMENTS
Statements contained in this report that are not of historical fact are forward-looking statements intended to qualify for the safe harbors from liability established by the Private Securities Litigation Reform Act of 1995. These forward-looking statements can be identified as such because the statements include words such as “may,” “believe,” “expect,” “anticipate,” “plan,” “project,” “will,” “projections,” “estimate,” or other words of similar import. Similarly, statements that describe future financial performance or plans or strategies are forward-looking statements. Such forward-looking statements are subject to certain risks and uncertainties that could cause actual results to differ materially from those expressed in, or implied by, such statements. Some, but not all, of the risks and uncertainties of Alliant Energy, IPL and WPL that could materially affect actual results include:
•
the direct or indirect effects resulting from cyber security incidents or attacks on our physical infrastructure, or responses to such incidents;
•
the impact of customer- and third party-owned generation, including alternative electric suppliers, in IPL’s and WPL’s service territories on system reliability, operating expenses and customers’ demand for electricity;
•
the impact of energy efficiency, franchise retention and customer disconnects on sales volumes and margins;
•
the impact that price changes may have on IPL’s and WPL’s customers’ demand for electric, gas and steam services and their ability to pay their bills;
•
inflation and higher interest rates;
•
changes in the price of delivered natural gas, transmission, purchased electricity and coal, particularly during elevated market prices, and any resulting changes to counterparty credit risk, due to shifts in supply and demand caused by market conditions, regulations and MISO’s seasonal resource adequacy process;
•
IPL’s and WPL’s ability to obtain adequate and timely rate relief to allow for, among other things, the recovery of and/or the return on costs, including fuel costs, operating costs, transmission costs, capacity costs, deferred expenditures, deferred tax assets, tax expense, interest expense, capital expenditures, and remaining costs related to EGUs that may be permanently closed and certain other retired assets, decreases in sales volumes, earning their authorized rates of return, and the payments to their parent of expected levels of dividends;
•
the ability to obtain regulatory approval for construction projects with acceptable conditions;
•
the ability to complete construction of renewable generation and storage projects by planned in-service dates and within the cost targets set by regulators due to cost increases of and access to materials, equipment and commodities including due to tariffs, duties or other assessments, such as any additional tariffs resulting from U.S. Department of Commerce investigations into and any decisions made regarding the sourcing of solar project materials and equipment from certain countries, labor issues or supply shortages, the ability to successfully resolve warranty issues or contract disputes, the ability to achieve the expected level of tax benefits based on tax guidelines and project costs, and the ability to efficiently utilize the renewable generation and storage project tax benefits for the benefit of customers;
•
the ability to utilize tax credits generated to date, and those that may be generated in the future, before they expire, as well as the ability to transfer tax credits that may be generated in the future at adequate pricing;
•
disruptions to ongoing operations and the supply of materials, services, equipment and commodities needed to construct solar generation, battery storage and electric and gas distribution projects, which may result from geopolitical issues, supplier manufacturing constraints, labor issues or transportation issues, and thus affect the ability to meet capacity requirements and result in increased capacity expense;
•
federal and state regulatory or governmental actions, including the impact of legislation, and regulatory agency orders;
|
1
|
||||||||
•
the impacts of changes in the tax code, including tax rates, minimum tax rates, and adjustments made to deferred tax assets and liabilities;
•
employee workforce factors, including the ability to hire and retain employees with specialized skills, impacts from employee retirements, changes in key executives, ability to create desired corporate culture, collective bargaining agreements and negotiations, work stoppages or restructurings;
•
disruptions in the supply and delivery of natural gas, purchased electricity and coal;
•
changes to the creditworthiness of, or performance of obligations by, counterparties with which Alliant Energy, IPL and WPL have contractual arrangements, including participants in the energy markets and fuel suppliers and transporters;
•
the impact of penalties or third-party claims related to, or in connection with, a failure to maintain the security of personally identifiable information, including associated costs to notify affected persons and to mitigate their information security concerns;
•
impacts that terrorist attacks may have on Alliant Energy’s, IPL’s and WPL’s operations and recovery of costs associated with restoration activities or on the operations of Alliant Energy’s investments;
•
any material post-closing paym
ents related to any past asset divestitures, including the sale of Whiting Petroleum, which could result from, among other things, indemnification agreements, warranties, guarantees or litigation;
•
weather effects on results of utility operations;
•
continued access to the capital markets on competitive terms and rates, and the actions of credit rating agencies;
•
changes to MISO’s resource adequacy process establishing capacity planning reserve margin and capacity accreditation requirements that may impact how and when new and existing generating facilities, including IPL’s and WPL’s additional solar generation, may be accredited with energy capacity, and may require IPL and WPL to adjust their current resource plans, to add resources to meet the requirements of MISO’s new process, or procure capacity in the market whereby such costs might not be recovered in rates;
•
the direct or indirect effects resulting from the ongoing novel coronavirus (COVID-19) pandemic and the spread of variant strains;
•
issues associated with environmental remediation and environmental compliance, including compliance with all environmental and emissions permits, the Coal Combustion Residuals Rule, future changes in environmental laws and regulations, including changes to Cross-State Air Pollution Rule emissions allowances and federal, state or local regulations for carbon dioxide emissions reductions from new and existing fossil-fueled EGUs, and litigation associated with environmental requirements;
•
increased pressure from customers, investors and other stakeholders to more rapidly reduce carbon dioxide emissions;
•
the ability to defend against environmental claims brought by state and federal agencies, such as the EPA, state natural resources agencies or third parties, such as the Sierra Club, and the impact on operating expenses of defending and resolving such claims;
•
the direct or indirect effects resulting from breakdown or failure of equipment in the operation of electric and gas distribution systems, such as mechanical problems and explosions or fires, and compliance with electric and gas transmission and distribution safety regulations, including regulations promulgated by the Pipeline and Hazardous Materials Safety Administration;
•
issues related to the availability and operations of EGUs, including start-up risks, breakdown or failure of equipment, availability of warranty coverage for equipment breakdowns or failures, performance below expected or contracted levels of output or efficiency, operator error, employee safety, transmission constraints, compliance with mandatory reliability standards and risks related to recovery of resulting incremental operating, fuel-related and capital costs through rates;
•
impacts that excessive heat, excessive cold, storms or natural disasters may have on Alliant Energy’s, IPL’s and WPL’s operations and construction activities, and recovery of costs associated with restoration activities, or on the operations of Alliant Energy’s investments;
•
Alliant Energy’s ability to sustain its dividend payout ratio goal;
•
changes to costs of providing benefits and related funding requirements of pension and OPEB plans due to the market value of the assets that fund the plans, economic conditions, financial market performance, interest rates, timing and form of benefits payments, life expectancies and demographics;
•
material changes in employee-related benefit and compensation costs, including settlement losses related to pension plans;
•
risks associated with operation and ownership of non-utility holdings;
•
changes in technology that alter the channels through which customers buy or utilize Alliant Energy’s, IPL’s or WPL’s products and services;
•
impacts on equity income from unconsolidated investments from changes in valuations of the assets held, as well as potential changes to ATC’s authorized return on equity;
•
impacts of IPL’s future tax benefits from Iowa rate-making practices, including deductions for repairs expenditures, allocation of mixed service costs and state depreciation, and recoverability of the associated regulatory assets from customers, when the differences reverse in future periods;
•
current or future litigation, regulatory investigations, proceedings or inquiries;
•
reputational damage from negative publicity, protests, fines, penalties and other negative consequences resulting in regulatory and/or legal actions;
•
the effect of accounting standards issued periodically by standard-setting bodies;
•
the ability to successfully complete tax audits and changes in tax accounting methods with no material impact on earnings and cash flows; and
Alliant Energy, IPL and WPL each assume no obligation, and disclaim any duty, to update the forward-looking statements in this report, except as required by law.
Available Information. Alliant Energy routinely posts important information on its website and considers the Investors section of its website,
www.alliantenergy.com/investors
, a channel of distribution for material information. Information contained on Alliant Energy’s website is not incorporated herein.
|
2
|
||||||||
PART I. FINANCIAL INFORMATION
ITEM 1. CONDENSED CONSOLIDATED FINANCIAL STATEMENTS (UNAUDITED)
ALLIANT ENERGY CORPORATION
CONDENSED CONSOLIDATED STATEMENTS OF INCOME (UNAUDITED)
| For the Three Months | |||||||||||
| Ended March 31, | |||||||||||
| 2023 | 2022 | ||||||||||
| (in millions, except per share amounts) | |||||||||||
| Revenues: | |||||||||||
| Electric utility |
$
|
$
|
|||||||||
| Gas utility |
|
|
|||||||||
| Other utility |
|
|
|||||||||
| Non-utility |
|
|
|||||||||
| Total revenues |
|
|
|||||||||
| Operating expenses: | |||||||||||
| Electric production fuel and purchased power |
|
|
|||||||||
| Electric transmission service |
|
|
|||||||||
| Cost of gas sold |
|
|
|||||||||
| Other operation and maintenance |
|
|
|||||||||
| Depreciation and amortization |
|
|
|||||||||
| Taxes other than income taxes |
|
|
|||||||||
| Total operating expenses |
|
|
|||||||||
| Operating income |
|
|
|||||||||
| Other (income) and deductions: | |||||||||||
| Interest expense |
|
|
|||||||||
| Equity income from unconsolidated investments, net |
(
|
(
|
|||||||||
| Allowance for funds used during construction |
(
|
(
|
|||||||||
| Other |
|
|
|||||||||
| Total other (income) and deductions |
|
|
|||||||||
| Income before income taxes |
|
|
|||||||||
| Income tax expense (benefit) |
(
|
|
|||||||||
| Net income attributable to Alliant Energy common shareowners |
$
|
$
|
|||||||||
| Weighted average number of common shares outstanding: | |||||||||||
| Basic |
|
|
|||||||||
| Diluted |
|
|
|||||||||
|
Earnings per weighted average common share attributable to Alliant Energy common
shareowners (basic and diluted)
|
$
|
$
|
|||||||||
Refer to accompanying Combined Notes to Condensed Consolidated Financial Statements.
|
3
|
||||||||
ALLIANT ENERGY CORPORATION
CONDENSED CONSOLIDATED BALANCE SHEETS (UNAUDITED)
|
March 31,
2023 |
December 31,
2022 |
||||||||||
|
(in millions, except per
share and share amounts) |
|||||||||||
| ASSETS | |||||||||||
| Current assets: | |||||||||||
| Cash and cash equivalents |
$
|
$
|
|||||||||
| Accounts receivable, less allowance for expected credit losses |
|
|
|||||||||
| Production fuel, at weighted average cost |
|
|
|||||||||
| Gas stored underground, at weighted average cost |
|
|
|||||||||
| Materials and supplies, at weighted average cost |
|
|
|||||||||
| Regulatory assets |
|
|
|||||||||
| Other |
|
|
|||||||||
| Total current assets |
|
|
|||||||||
| Property, plant and equipment, net |
|
|
|||||||||
| Investments: | |||||||||||
| ATC Holdings |
|
|
|||||||||
| Other |
|
|
|||||||||
| Total investments |
|
|
|||||||||
| Other assets: | |||||||||||
| Regulatory assets |
|
|
|||||||||
| Deferred charges and other |
|
|
|||||||||
| Total other assets |
|
|
|||||||||
| Total assets |
$
|
$
|
|||||||||
| LIABILITIES AND EQUITY | |||||||||||
| Current liabilities: | |||||||||||
| Current maturities of long-term debt |
$
|
$
|
|||||||||
| Commercial paper |
|
|
|||||||||
| Other short-term borrowings |
|
|
|||||||||
| Accounts payable |
|
|
|||||||||
| Regulatory liabilities |
|
|
|||||||||
| Other |
|
|
|||||||||
| Total current liabilities |
|
|
|||||||||
| Long-term debt, net (excluding current portion) |
|
|
|||||||||
| Other liabilities: | |||||||||||
| Deferred tax liabilities |
|
|
|||||||||
| Regulatory liabilities |
|
|
|||||||||
| Pension and other benefit obligations |
|
|
|||||||||
| Other |
|
|
|||||||||
| Total other liabilities |
|
|
|||||||||
|
|
|
||||||||||
| Equity: | |||||||||||
| Alliant Energy Corporation common equity: | |||||||||||
|
Common stock - $
|
|
|
|||||||||
| Additional paid-in capital |
|
|
|||||||||
| Retained earnings |
|
|
|||||||||
| Accumulated other comprehensive loss |
(
|
|
|||||||||
|
Shares in deferred compensation trust -
|
(
|
(
|
|||||||||
| Total Alliant Energy Corporation common equity |
|
|
|||||||||
| Total liabilities and equity |
$
|
$
|
|||||||||
Refer to accompanying Combined Notes to Condensed Consolidated Financial Statements.
|
4
|
||||||||
ALLIANT ENERGY CORPORATION
CONDENSED CONSOLIDATED STATEMENTS OF CASH FLOWS (UNAUDITED)
| For the Three Months | |||||||||||
| Ended March 31, | |||||||||||
| 2023 | 2022 | ||||||||||
| (in millions) | |||||||||||
| Cash flows from operating activities: | |||||||||||
| Net income |
$
|
$
|
|||||||||
| Adjustments to reconcile net income to net cash flows from operating activities: | |||||||||||
|
Depreciation and amortization
|
|
|
|||||||||
| Other |
(
|
|
|||||||||
| Other changes in assets and liabilities: | |||||||||||
| Accounts receivable |
(
|
(
|
|||||||||
| Gas stored underground |
|
|
|||||||||
| Derivative assets |
|
(
|
|||||||||
| Regulatory assets |
(
|
|
|||||||||
| Accounts payable |
(
|
(
|
|||||||||
| Regulatory liabilities |
(
|
|
|||||||||
| Other |
(
|
(
|
|||||||||
| Net cash flows from operating activities |
|
|
|||||||||
| Cash flows used for investing activities: | |||||||||||
| Construction and acquisition expenditures: | |||||||||||
| Utility business |
(
|
(
|
|||||||||
| Other |
(
|
(
|
|||||||||
| Cash receipts on sold receivables |
|
|
|||||||||
| Proceeds from sale of partial ownership interest in West Riverside |
|
|
|||||||||
| Other |
(
|
(
|
|||||||||
| Net cash flows used for investing activities |
(
|
(
|
|||||||||
| Cash flows from financing activities: | |||||||||||
| Common stock dividends |
(
|
(
|
|||||||||
| Proceeds from issuance of long-term debt |
|
|
|||||||||
| Payments to retire long-term debt |
|
(
|
|||||||||
| Net change in commercial paper and other short-term borrowings |
(
|
(
|
|||||||||
| Other |
(
|
(
|
|||||||||
| Net cash flows from financing activities |
|
|
|||||||||
| Net increase in cash, cash equivalents and restricted cash |
|
|
|||||||||
| Cash, cash equivalents and restricted cash at beginning of period |
|
|
|||||||||
| Cash, cash equivalents and restricted cash at end of period |
$
|
$
|
|||||||||
| Supplemental cash flows information: | |||||||||||
| Cash paid during the period for: | |||||||||||
| Interest |
($
|
($
|
|||||||||
| Significant non-cash investing and financing activities: | |||||||||||
| Accrued capital expenditures |
$
|
$
|
|||||||||
| Beneficial interest obtained in exchange for securitized accounts receivable |
$
|
$
|
|||||||||
Refer to accompanying Combined Notes to Condensed Consolidated Financial Statements.
|
5
|
||||||||
INTERSTATE POWER AND LIGHT COMPANY
CONDENSED CONSOLIDATED STATEMENTS OF INCOME (UNAUDITED)
| For the Three Months | |||||||||||
| Ended March 31, | |||||||||||
| 2023 | 2022 | ||||||||||
| (in millions) | |||||||||||
| Revenues: | |||||||||||
| Electric utility |
$
|
$
|
|||||||||
| Gas utility |
|
|
|||||||||
| Steam and other |
|
|
|||||||||
| Total revenues |
|
|
|||||||||
| Operating expenses: | |||||||||||
| Electric production fuel and purchased power |
|
|
|||||||||
| Electric transmission service |
|
|
|||||||||
| Cost of gas sold |
|
|
|||||||||
| Other operation and maintenance |
|
|
|||||||||
| Depreciation and amortization |
|
|
|||||||||
| Taxes other than income taxes |
|
|
|||||||||
| Total operating expenses |
|
|
|||||||||
| Operating income |
|
|
|||||||||
| Other (income) and deductions: | |||||||||||
| Interest expense |
|
|
|||||||||
| Allowance for funds used during construction |
(
|
(
|
|||||||||
| Other |
|
|
|||||||||
| Total other (income) and deductions |
|
|
|||||||||
| Income before income taxes |
|
|
|||||||||
| Income tax benefit |
(
|
(
|
|||||||||
| Net income |
$
|
$
|
|||||||||
Earnings per share data is not disclosed given Alliant Energy Corporation is the sole shareowner of all shares of IPL’s common stock outstanding during the periods presented.
Refer to accompanying Combined Notes to Condensed Consolidated Financial Statements.
|
6
|
||||||||
INTERSTATE POWER AND LIGHT COMPANY
CONDENSED CONSOLIDATED BALANCE SHEETS (UNAUDITED)
|
March 31,
2023 |
December 31,
2022 |
||||||||||
|
(in millions, except per
share and share amounts) |
|||||||||||
| ASSETS | |||||||||||
| Current assets: | |||||||||||
| Cash and cash equivalents |
$
|
$
|
|||||||||
| Accounts receivable, less allowance for expected credit losses |
|
|
|||||||||
| Production fuel, at weighted average cost |
|
|
|||||||||
| Gas stored underground, at weighted average cost |
|
|
|||||||||
| Materials and supplies, at weighted average cost |
|
|
|||||||||
| Regulatory assets |
|
|
|||||||||
| Other |
|
|
|||||||||
| Total current assets |
|
|
|||||||||
| Property, plant and equipment, net |
|
|
|||||||||
| Other assets: | |||||||||||
| Regulatory assets |
|
|
|||||||||
| Deferred charges and other |
|
|
|||||||||
| Total other assets |
|
|
|||||||||
| Total assets |
$
|
$
|
|||||||||
| LIABILITIES AND EQUITY | |||||||||||
| Current liabilities: | |||||||||||
| Accounts payable |
$
|
$
|
|||||||||
| Accounts payable to associated companies |
|
|
|||||||||
| Accrued taxes |
|
|
|||||||||
| Accrued interest |
|
|
|||||||||
| Regulatory liabilities |
|
|
|||||||||
| Other |
|
|
|||||||||
| Total current liabilities |
|
|
|||||||||
| Long-term debt, net |
|
|
|||||||||
| Other liabilities: | |||||||||||
| Deferred tax liabilities |
|
|
|||||||||
| Regulatory liabilities |
|
|
|||||||||
| Pension and other benefit obligations |
|
|
|||||||||
| Other |
|
|
|||||||||
| Total other liabilities |
|
|
|||||||||
|
|
|
||||||||||
| Equity: | |||||||||||
| Interstate Power and Light Company common equity: | |||||||||||
|
Common stock - $
|
|
|
|||||||||
| Additional paid-in capital |
|
|
|||||||||
| Retained earnings |
|
|
|||||||||
| Total Interstate Power and Light Company common equity |
|
|
|||||||||
| Total liabilities and equity |
$
|
$
|
|||||||||
Refer to accompanying Combined Notes to Condensed Consolidated Financial Statements.
|
7
|
||||||||
INTERSTATE POWER AND LIGHT COMPANY
CONDENSED CONSOLIDATED STATEMENTS OF CASH FLOWS (UNAUDITED)
| For the Three Months | |||||||||||
| Ended March 31, | |||||||||||
| 2023 | 2022 | ||||||||||
| (in millions) | |||||||||||
| Cash flows from operating activities: | |||||||||||
| Net income |
$
|
$
|
|||||||||
| Adjustments to reconcile net income to net cash flows from operating activities: | |||||||||||
| Depreciation and amortization |
|
|
|||||||||
| Deferred tax expense and tax credits |
|
|
|||||||||
| Other |
(
|
(
|
|||||||||
| Other changes in assets and liabilities: | |||||||||||
| Accounts receivable |
(
|
(
|
|||||||||
| Income tax refunds receivable |
(
|
(
|
|||||||||
| Gas stored underground |
|
|
|||||||||
| Derivative assets |
|
(
|
|||||||||
| Accounts payable |
(
|
(
|
|||||||||
| Regulatory liabilities |
(
|
|
|||||||||
| Other |
(
|
|
|||||||||
| Net cash flows from operating activities |
|
|
|||||||||
| Cash flows from investing activities: | |||||||||||
| Construction and acquisition expenditures |
(
|
(
|
|||||||||
| Cash receipts on sold receivables |
|
|
|||||||||
| Other |
(
|
(
|
|||||||||
| Net cash flows from investing activities |
|
|
|||||||||
| Cash flows used for financing activities: | |||||||||||
| Common stock dividends |
(
|
(
|
|||||||||
| Other |
(
|
|
|||||||||
| Net cash flows used for financing activities |
(
|
(
|
|||||||||
| Net increase in cash, cash equivalents and restricted cash |
|
|
|||||||||
| Cash, cash equivalents and restricted cash at beginning of period |
|
|
|||||||||
| Cash, cash equivalents and restricted cash at end of period |
$
|
$
|
|||||||||
| Supplemental cash flows information: | |||||||||||
| Cash paid during the period for: | |||||||||||
| Interest |
($
|
($
|
|||||||||
| Significant non-cash investing and financing activities: | |||||||||||
| Accrued capital expenditures |
$
|
$
|
|||||||||
| Beneficial interest obtained in exchange for securitized accounts receivable |
$
|
$
|
|||||||||
Refer to accompanying Combined Notes to Condensed Consolidated Financial Statements.
|
8
|
||||||||
WISCONSIN POWER AND LIGHT COMPANY
CONDENSED CONSOLIDATED STATEMENTS OF INCOME (UNAUDITED)
| For the Three Months | |||||||||||
| Ended March 31, | |||||||||||
| 2023 | 2022 | ||||||||||
| (in millions) | |||||||||||
| Revenues: | |||||||||||
| Electric utility |
$
|
$
|
|||||||||
| Gas utility |
|
|
|||||||||
| Total revenues |
|
|
|||||||||
| Operating expenses: | |||||||||||
| Electric production fuel and purchased power |
|
|
|||||||||
| Electric transmission service |
|
|
|||||||||
| Cost of gas sold |
|
|
|||||||||
| Other operation and maintenance |
|
|
|||||||||
| Depreciation and amortization |
|
|
|||||||||
| Taxes other than income taxes |
|
|
|||||||||
| Total operating expenses |
|
|
|||||||||
| Operating income |
|
|
|||||||||
| Other (income) and deductions: | |||||||||||
| Interest expense |
|
|
|||||||||
| Allowance for funds used during construction |
(
|
(
|
|||||||||
| Other |
|
|
|||||||||
| Total other (income) and deductions |
|
|
|||||||||
| Income before income taxes |
|
|
|||||||||
| Income tax expense |
|
|
|||||||||
| Net income |
$
|
$
|
|||||||||
Earnings per share data is not disclosed given Alliant Energy Corporation is the sole shareowner of all shares of WPL’s common stock outstanding during the periods presented.
Refer to accompanying Combined Notes to Condensed Consolidated Financial Statements.
|
9
|
||||||||
WISCONSIN POWER AND LIGHT COMPANY
CONDENSED CONSOLIDATED BALANCE SHEETS (UNAUDITED)
|
March 31,
2023 |
December 31,
2022 |
||||||||||
|
(in millions, except per
share and share amounts) |
|||||||||||
| ASSETS | |||||||||||
| Current assets: | |||||||||||
| Cash and cash equivalents |
$
|
$
|
|||||||||
| Accounts receivable, less allowance for expected credit losses |
|
|
|||||||||
| Production fuel, at weighted average cost |
|
|
|||||||||
| Gas stored underground, at weighted average cost |
|
|
|||||||||
| Materials and supplies, at weighted average cost |
|
|
|||||||||
| Regulatory assets |
|
|
|||||||||
| Prepaid gross receipts tax |
|
|
|||||||||
| Other |
|
|
|||||||||
| Total current assets |
|
|
|||||||||
| Property, plant and equipment, net |
|
|
|||||||||
| Other assets: | |||||||||||
| Regulatory assets |
|
|
|||||||||
| Deferred charges and other |
|
|
|||||||||
| Total other assets |
|
|
|||||||||
| Total assets |
$
|
$
|
|||||||||
| LIABILITIES AND EQUITY | |||||||||||
| Current liabilities: | |||||||||||
| Commercial paper |
$
|
$
|
|||||||||
| Accounts payable |
|
|
|||||||||
| Regulatory liabilities |
|
|
|||||||||
| Other |
|
|
|||||||||
| Total current liabilities |
|
|
|||||||||
| Long-term debt, net |
|
|
|||||||||
| Other liabilities: | |||||||||||
|
Deferred tax liabilities
|
|
|
|||||||||
| Regulatory liabilities |
|
|
|||||||||
| Pension and other benefit obligations |
|
|
|||||||||
| Other |
|
|
|||||||||
| Total other liabilities |
|
|
|||||||||
|
|
|
||||||||||
| Equity: | |||||||||||
| Wisconsin Power and Light Company common equity: | |||||||||||
|
Common stock - $
|
|
|
|||||||||
| Additional paid-in capital |
|
|
|||||||||
| Retained earnings |
|
|
|||||||||
| Total Wisconsin Power and Light Company common equity |
|
|
|||||||||
| Total liabilities and equity |
$
|
$
|
|||||||||
Refer to accompanying Combined Notes to Condensed Consolidated Financial Statements.
|
10
|
||||||||
WISCONSIN POWER AND LIGHT COMPANY
CONDENSED CONSOLIDATED STATEMENTS OF CASH FLOWS (UNAUDITED)
| For the Three Months | |||||||||||
| Ended March 31, | |||||||||||
| 2023 | 2022 | ||||||||||
| (in millions) | |||||||||||
| Cash flows from operating activities: | |||||||||||
| Net income |
$
|
$
|
|||||||||
| Adjustments to reconcile net income to net cash flows from operating activities: | |||||||||||
| Depreciation and amortization |
|
|
|||||||||
| Other |
(
|
(
|
|||||||||
| Other changes in assets and liabilities: | |||||||||||
| Accounts receivable |
|
(
|
|||||||||
| Gas stored underground |
|
|
|||||||||
| Derivative assets |
|
(
|
|||||||||
| Regulatory assets |
(
|
|
|||||||||
| Accounts payable |
(
|
(
|
|||||||||
| Derivative liabilities |
|
(
|
|||||||||
| Regulatory liabilities |
(
|
|
|||||||||
| Accrued taxes |
|
|
|||||||||
| Other |
|
|
|||||||||
| Net cash flows from operating activities |
|
|
|||||||||
| Cash flows used for investing activities: | |||||||||||
| Construction and acquisition expenditures |
(
|
(
|
|||||||||
| Proceeds from sale of partial ownership interest in West Riverside |
|
|
|||||||||
| Other |
(
|
(
|
|||||||||
| Net cash flows used for investing activities |
(
|
(
|
|||||||||
| Cash flows from financing activities: | |||||||||||
| Common stock dividends |
(
|
(
|
|||||||||
| Capital contributions from parent |
|
|
|||||||||
| Proceeds from issuance of long-term debt |
|
|
|||||||||
| Net change in commercial paper |
(
|
(
|
|||||||||
| Other |
(
|
(
|
|||||||||
| Net cash flows from financing activities |
|
|
|||||||||
| Net increase in cash, cash equivalents and restricted cash |
|
|
|||||||||
| Cash, cash equivalents and restricted cash at beginning of period |
|
|
|||||||||
| Cash, cash equivalents and restricted cash at end of period |
$
|
$
|
|||||||||
| Supplemental cash flows information: | |||||||||||
| Cash paid during the period for: | |||||||||||
| Interest |
($
|
($
|
|||||||||
| Significant non-cash investing and financing activities: | |||||||||||
| Accrued capital expenditures |
$
|
$
|
|||||||||
Refer to accompanying Combined Notes to Condensed Consolidated Financial Statements.
|
11
|
||||||||
ALLIANT ENERGY CORPORATION
INTERSTATE POWER AND LIGHT COMPANY
WISCONSIN POWER AND LIGHT COMPANY
COMBINED NOTES TO CONDENSED CONSOLIDATED FINANCIAL STATEMENTS (UNAUDITED)
NOTE 1.
SUMMARY OF SIGNIFICANT ACCOUNTING POLICIES
NOTE 1(a) General -
The interim unaudited Financial Statements included herein have been prepared pursuant to the rules and regulations of the SEC. Accordingly, certain information and note disclosures normally included in financial statements prepared in accordance with GAAP have been condensed or omitted, although management believes that the disclosures are adequate to make the information presented not misleading. These Financial Statements should be read in conjunction with the financial statements and the notes thereto included in the 2022
Form 10-K
.
NOTE 1(b) Cash and Cash Equivalents -
At March 31, 2023, Alliant Energy’s, IPL’s and WPL’s cash and cash equivalents included $
148
million, $
30
million and $
83
million of money market fund investments, respectively, with interest rates of
5
%.
NOTE 2.
REGULATORY MATTERS
Regulatory Assets and Regulatory Liabilities
-
Regulatory assets were comprised of the following items (in millions):
| Alliant Energy | IPL | WPL | |||||||||||||||||||||||||||||||||
|
March 31,
2023 |
December 31,
2022 |
March 31,
2023 |
December 31,
2022 |
March 31,
2023 |
December 31,
2022 |
||||||||||||||||||||||||||||||
| Tax-related |
$
|
$
|
$
|
$
|
$
|
$
|
|||||||||||||||||||||||||||||
| Pension and OPEB costs |
|
|
|
|
|
|
|||||||||||||||||||||||||||||
| Asset retirement obligations |
|
|
|
|
|
|
|||||||||||||||||||||||||||||
| Commodity cost recovery |
|
|
|
|
|
|
|||||||||||||||||||||||||||||
| Derivatives |
|
|
|
|
|
|
|||||||||||||||||||||||||||||
| Assets retired early |
|
|
|
|
|
|
|||||||||||||||||||||||||||||
| IPL’s Duane Arnold Energy Center PPA amendment |
|
|
|
|
— | — | |||||||||||||||||||||||||||||
| WPL’s Western Wisconsin gas distribution expansion investments |
|
|
— | — |
|
|
|||||||||||||||||||||||||||||
| Other |
|
|
|
|
|
|
|||||||||||||||||||||||||||||
|
$
|
$
|
$
|
$
|
$
|
$
|
||||||||||||||||||||||||||||||
Derivatives -
Refer to
Note 11
for discussion of changes in Alliant Energy’s, IPL’s and WPL’s derivative liabilities/assets during the three months ended March 31, 2023, which result in comparable changes to regulatory assets/liabilities on the balance sheets.
Regulatory liabilities were comprised of the following items (in millions):
| Alliant Energy | IPL | WPL | |||||||||||||||||||||||||||||||||
|
March 31,
2023 |
December 31,
2022 |
March 31,
2023 |
December 31,
2022 |
March 31,
2023 |
December 31,
2022 |
||||||||||||||||||||||||||||||
| Tax-related |
$
|
$
|
$
|
$
|
$
|
$
|
|||||||||||||||||||||||||||||
| Cost of removal obligations |
|
|
|
|
|
|
|||||||||||||||||||||||||||||
| Derivatives |
|
|
|
|
|
|
|||||||||||||||||||||||||||||
| Electric transmission cost recovery |
|
|
|
|
|
|
|||||||||||||||||||||||||||||
| WPL’s West Riverside liquidated damages |
|
|
— | — |
|
|
|||||||||||||||||||||||||||||
| Commodity cost recovery |
|
|
|
|
|
|
|||||||||||||||||||||||||||||
| Other |
|
|
|
|
|
|
|||||||||||||||||||||||||||||
|
$
|
$
|
$
|
$
|
$
|
$
|
||||||||||||||||||||||||||||||
|
12
|
||||||||
NOTE 3.
PROPERTY, PLANT AND EQUIPMENT
NOTE 4.
RECEIVABLES
NOTE 4(b) - Sales of Accounts Receivable -
IPL maintains a Receivables Purchase and Sale Agreement (Receivables Agreement) whereby it may sell its customer accounts receivables, unbilled revenues and certain other accounts receivables to a third party through wholly-owned and consolidated special purpose entities. In March 2023, IPL amended and extended through March 2024 the purchase commitment from the third party to which it sells its receivables. The transfers of receivables meet the criteria for sale accounting established by the transfer of financial assets accounting rules. As of March 31, 2023, IPL had $
21
million of available capacity under its sales of accounts receivable program.
IPL’s maximum and average outstanding cash proceeds (based on daily outstanding balances) related to the sales of accounts receivable program for the three months ended March 31 were as follows (in millions):
| 2023 | 2022 | ||||||||||
| Maximum outstanding aggregate cash proceeds |
$
|
$
|
|||||||||
| Average outstanding aggregate cash proceeds |
|
|
|||||||||
The attributes of IPL’s receivables sold under the Receivables Agreement were as follows (in millions):
| March 31, 2023 | December 31, 2022 | ||||||||||
| Customer accounts receivable |
$
|
$
|
|||||||||
| Unbilled utility revenues |
|
|
|||||||||
| Receivables sold to third party |
|
|
|||||||||
| Less: cash proceeds |
|
|
|||||||||
| Deferred proceeds |
|
|
|||||||||
| Less: allowance for expected credit losses |
|
|
|||||||||
| Fair value of deferred proceeds |
$
|
$
|
|||||||||
As of March 31, 2023, outstanding receivables past due under the Receivables Agreement were $
26
million.
Additional attributes of IPL’s receivables sold under the Receivables Agreement for the three months ended March 31 were as follows (in millions):
| 2023 | 2022 | ||||||||||
| Collections |
$
|
$
|
|||||||||
| Write-offs, net of recoveries |
|
|
|||||||||
NOTE 5.
INVESTMENTS
Unconsolidated Equity Investments
-
Alliant Energy’s equity (income) loss from unconsolidated investments accounted for under the equity method of accounting for the three months ended March 31 was as follows (in millions):
| 2023 | 2022 | ||||||||||
| ATC Holdings |
($
|
($
|
|||||||||
| Other |
(
|
(
|
|||||||||
|
($
|
($
|
||||||||||
NOTE 6.
COMMON EQUITY
Common Share Activity
-
A summary of Alliant Energy’s common stock activity was as follows:
|
Shares outstanding, January 1, 2023
|
|
||||
| Shareowner Direct Plan |
|
||||
| Equity-based compensation plans |
|
||||
|
Shares outstanding, March 31, 2023
|
|
||||
|
13
|
||||||||
Changes in Shareowners’ Equity
-
A summary of changes in shareowners’ equity was as follows (in millions):
| Alliant Energy | Accumulated | Shares in | |||||||||||||||||||||||||||||||||
| Additional | Other | Deferred | Total | ||||||||||||||||||||||||||||||||
| Common | Paid-In | Retained | Comprehensive | Compensation | Common | ||||||||||||||||||||||||||||||
| Stock | Capital | Earnings | Loss | Trust | Equity | ||||||||||||||||||||||||||||||
| Three Months Ended March 31, 2023 | |||||||||||||||||||||||||||||||||||
|
Beginning balance, December 31, 2022
|
$
|
$
|
$
|
$
|
($
|
$
|
|||||||||||||||||||||||||||||
| Net income attributable to Alliant Energy common shareowners |
|
|
|||||||||||||||||||||||||||||||||
|
Common stock dividends ($
|
(
|
(
|
|||||||||||||||||||||||||||||||||
| Shareowner Direct Plan issuances |
|
|
|||||||||||||||||||||||||||||||||
| Equity-based compensation plans and other |
(
|
(
|
|||||||||||||||||||||||||||||||||
| Other comprehensive loss, net of tax |
(
|
(
|
|||||||||||||||||||||||||||||||||
|
Ending balance, March 31, 2023
|
$
|
$
|
$
|
($
|
($
|
$
|
|||||||||||||||||||||||||||||
| Three Months Ended March 31, 2022 | |||||||||||||||||||||||||||||||||||
|
Beginning balance, December 31, 2021
|
$
|
$
|
$
|
$
|
($
|
$
|
|||||||||||||||||||||||||||||
| Net income attributable to Alliant Energy common shareowners |
|
|
|||||||||||||||||||||||||||||||||
|
Common stock dividends ($
|
(
|
(
|
|||||||||||||||||||||||||||||||||
| Shareowner Direct Plan issuances |
|
|
|||||||||||||||||||||||||||||||||
| Equity-based compensation plans and other |
(
|
|
(
|
||||||||||||||||||||||||||||||||
|
Ending balance, March 31, 2022
|
$
|
$
|
$
|
$
|
($
|
$
|
|||||||||||||||||||||||||||||
| IPL | Additional | Total | |||||||||||||||||||||
| Common | Paid-In | Retained | Common | ||||||||||||||||||||
| Stock | Capital | Earnings | Equity | ||||||||||||||||||||
| Three Months Ended March 31, 2023 | |||||||||||||||||||||||
|
Beginning balance, December 31, 2022
|
$
|
$
|
$
|
$
|
|||||||||||||||||||
| Net income |
|
|
|||||||||||||||||||||
| Common stock dividends |
(
|
(
|
|||||||||||||||||||||
|
Ending balance, March 31, 2023
|
$
|
$
|
$
|
$
|
|||||||||||||||||||
| Three Months Ended March 31, 2022 | |||||||||||||||||||||||
|
Beginning balance, December 31, 2021
|
$
|
$
|
$
|
$
|
|||||||||||||||||||
| Net income |
|
|
|||||||||||||||||||||
| Common stock dividends |
(
|
(
|
|||||||||||||||||||||
|
Ending balance, March 31, 2022
|
$
|
$
|
$
|
$
|
|||||||||||||||||||
| WPL | Additional | Total | |||||||||||||||||||||
| Common | Paid-In | Retained | Common | ||||||||||||||||||||
| Stock | Capital | Earnings | Equity | ||||||||||||||||||||
| Three Months Ended March 31, 2023 | |||||||||||||||||||||||
|
Beginning balance, December 31, 2022
|
$
|
$
|
$
|
$
|
|||||||||||||||||||
| Net income |
|
|
|||||||||||||||||||||
| Common stock dividends |
(
|
(
|
|||||||||||||||||||||
| Capital contributions from parent |
|
|
|||||||||||||||||||||
|
Ending balance, March 31, 2023
|
$
|
$
|
$
|
$
|
|||||||||||||||||||
| Three Months Ended March 31, 2022 | |||||||||||||||||||||||
|
Beginning balance, December 31, 2021
|
$
|
$
|
$
|
$
|
|||||||||||||||||||
| Net income |
|
|
|||||||||||||||||||||
| Common stock dividends |
(
|
(
|
|||||||||||||||||||||
| Capital contributions from parent |
|
|
|||||||||||||||||||||
|
Ending balance, March 31, 2022
|
$
|
$
|
$
|
$
|
|||||||||||||||||||
|
14
|
||||||||
NOTE 7.
DEBT
NOTE 7(a) Short-term Debt -
In March 2023, Alliant Energy, IPL and WPL extended their single credit facility agreement, which currently expires in December 2027, and reallocated credit facility capacity amounts to $
450
million for Alliant Energy at the parent company level, $
250
million for IPL and $
300
million for WPL, within the $
1
billion total commitment.
Information regarding Alliant Energy’s, IPL’s and WPL’s commercial paper classified as short-term debt was as follows (dollars in millions):
| March 31, 2023 | Alliant Energy | IPL | WPL | ||||||||||||||
| Amount outstanding |
$
|
$
|
$
|
||||||||||||||
| Weighted average interest rates |
|
N/A |
|
||||||||||||||
| Available credit facility capacity |
$
|
$
|
$
|
||||||||||||||
| Alliant Energy | WPL | ||||||||||||||||||||||
| Three Months Ended March 31 | 2023 | 2022 | 2023 | 2022 | |||||||||||||||||||
| Maximum amount outstanding (based on daily outstanding balances) |
$
|
$
|
$
|
$
|
|||||||||||||||||||
| Average amount outstanding (based on daily outstanding balances) |
$
|
$
|
$
|
$
|
|||||||||||||||||||
| Weighted average interest rates |
|
|
|
|
|||||||||||||||||||
In January 2023, AEF received $
50
million of proceeds from its December 2022 term loan credit agreement, which was classified as “Other short-term borrowings” on Alliant Energy’s balance sheet as of March 31, 2023.
NOTE 7(b) Long-term Debt -
In March 2023, WPL issued $
300
million of
4.95
% debentures due 2033. The debentures were issued as green bonds, and an amount equal to or in excess of the net proceeds will be allocated or disbursed for the development and acquisition of WPL’s solar EGUs.
Convertible Senior Notes
-
In March 2023, Alliant Energy issued $
575
million of
3.875
% convertible senior notes (the Notes), which are senior unsecured obligations, and used the net proceeds from the issuance for general corporate purposes. The Notes will mature on March 15, 2026 unless earlier converted or repurchased, and no sinking fund is provided for the Notes. Alliant Energy may not redeem the Notes prior to the maturity date. Holders may convert their Notes at their option at any time prior to the close of business on the business day immediately preceding December 15, 2025 only under the following circumstances:
•
during any calendar quarter commencing after the calendar quarter ending on June 30, 2023 (and only during such calendar quarter), if the last reported sale price of Alliant Energy’s common stock for at least
20
trading days (whether or not consecutive) during a period of
30
consecutive trading days ending on, and including, the last trading day of the immediately preceding calendar quarter is greater than or equal to
130
% of the conversion price on each applicable trading day during such period;
•
during the
5
business day period after any
10
consecutive trading day period (the “measurement period”) in which the trading price (as defined in the related Indenture) per $
1,000
principal amount of Notes for each trading day of the measurement period was less than
98
% of the product of the last reported sale price of Alliant Energy’s common stock and the conversion rate on each such trading day; or
•
upon the occurrence of specified corporate events.
On or after December 15, 2025 until the close of business on the business day immediately preceding the maturity date, holders may convert all or any portion of their Notes at any time, regardless of the foregoing circumstances. Upon conversion of the Notes, Alliant Energy will pay cash up to the aggregate principal amount of the Notes to be converted and pay or deliver, as the case may be, cash, shares of its common stock or a combination of cash and shares of its common stock, at its election, in respect of the remainder, if any, of its conversion obligation in excess of the aggregate principal amount of the Notes being converted.
The conversion rate will initially be
15.5461
shares of common stock per $
1,000
principal amount of Notes (equivalent to an initial conversion price of approximately $
64.32
per share of Alliant Energy’s common stock). The conversion rate will be subject to adjustment in some events but will not be adjusted for any accrued and unpaid interest. In addition, following certain corporate events that occur prior to the maturity date, Alliant Energy will, in certain circumstances, increase the conversion rate for a holder who elects to convert its Notes in connection with such a corporate event.
If Alliant Energy undergoes a fundamental change (as defined in the related Indenture), then, subject to certain conditions, holders of the Notes may require Alliant Energy to repurchase for cash all or any portion of its Notes at a repurchase price equal to
100
% of the principal amount of the Notes to be repurchased, plus accrued and unpaid interest to, but excluding, the fundamental change repurchase date.
|
15
|
||||||||
NOTE 8.
REVENUES
Disaggregation of revenues from contracts with customers, which correlates to revenues for each reportable segment, was as follows (in millions):
| Alliant Energy | IPL | WPL | |||||||||||||||||||||||||||||||||
| Three Months Ended March 31 | 2023 | 2022 | 2023 | 2022 | 2023 | 2022 | |||||||||||||||||||||||||||||
| Electric Utility: | |||||||||||||||||||||||||||||||||||
| Retail - residential |
$
|
$
|
$
|
$
|
$
|
$
|
|||||||||||||||||||||||||||||
| Retail - commercial |
|
|
|
|
|
|
|||||||||||||||||||||||||||||
| Retail - industrial |
|
|
|
|
|
|
|||||||||||||||||||||||||||||
| Wholesale |
|
|
|
|
|
|
|||||||||||||||||||||||||||||
| Bulk power and other |
|
|
|
|
|
|
|||||||||||||||||||||||||||||
| Total Electric Utility |
|
|
|
|
|
|
|||||||||||||||||||||||||||||
| Gas Utility: | |||||||||||||||||||||||||||||||||||
| Retail - residential |
|
|
|
|
|
|
|||||||||||||||||||||||||||||
| Retail - commercial |
|
|
|
|
|
|
|||||||||||||||||||||||||||||
| Retail - industrial |
|
|
|
|
|
|
|||||||||||||||||||||||||||||
| Transportation/other |
|
|
|
|
|
|
|||||||||||||||||||||||||||||
| Total Gas Utility |
|
|
|
|
|
|
|||||||||||||||||||||||||||||
| Other Utility: | |||||||||||||||||||||||||||||||||||
| Steam |
|
|
|
|
— | — | |||||||||||||||||||||||||||||
| Other utility |
|
|
|
|
|
|
|||||||||||||||||||||||||||||
| Total Other Utility |
|
|
|
|
|
|
|||||||||||||||||||||||||||||
| Non-Utility and Other: | |||||||||||||||||||||||||||||||||||
| Travero and other |
|
|
— | — | — | — | |||||||||||||||||||||||||||||
| Total Non-Utility and Other |
|
|
— | — | — | — | |||||||||||||||||||||||||||||
| Total revenues |
$
|
$
|
$
|
$
|
$
|
$
|
|||||||||||||||||||||||||||||
NOTE 9.
INCOME TAXES
Income Tax Rates
-
Overall effective income tax rates, which were computed by dividing income tax expense (benefit) by income before income taxes, were as follows. The effective income tax rates were different than the federal statutory rate primarily due to state income taxes, production tax credits, amortization of excess deferred taxes and the effect of rate-making on property-related differences.
| Alliant Energy | IPL | WPL | |||||||||||||||||||||||||||||||||
| 2023 | 2022 | 2023 | 2022 | 2023 | 2022 | ||||||||||||||||||||||||||||||
| Overall income tax rate |
(
|
|
(
|
(
|
|
|
|||||||||||||||||||||||||||||
Deferred Tax Assets and Liabilities
-
Carryforwards -
At March 31, 2023, the carryforwards and expiration dates were estimated as follows (in millions):
| Range of Expiration Dates | Alliant Energy | IPL | WPL | ||||||||||||||||||||
| State net operating losses | 2025-2043 |
$
|
$
|
$
|
|||||||||||||||||||
| Federal tax credits | 2027-2043 |
|
|
|
|||||||||||||||||||
NOTE 10.
BENEFIT PLANS
NOTE 10(a) Pension and OPEB Plans -
Net Periodic Benefit Costs
-
The components of net periodic benefit costs for sponsored defined benefit pension and OPEB plans for the three months ended March 31 are included below (in millions). For IPL and WPL, amounts are for their plan participants covered under plans they sponsor, as well as amounts directly assigned to them related to certain participants in the Alliant Energy and Corporate Services sponsored plans.
|
16
|
||||||||
| Defined Benefit Pension Plans | OPEB Plans | ||||||||||||||||||||||
| Alliant Energy | 2023 | 2022 | 2023 | 2022 | |||||||||||||||||||
| Service cost |
$
|
$
|
$
|
$
|
|||||||||||||||||||
| Interest cost |
|
|
|
|
|||||||||||||||||||
| Expected return on plan assets |
(
|
(
|
(
|
(
|
|||||||||||||||||||
| Amortization of actuarial loss |
|
|
|
|
|||||||||||||||||||
|
$
|
$
|
$
|
$
|
||||||||||||||||||||
| Defined Benefit Pension Plans | OPEB Plans | ||||||||||||||||||||||
| IPL | 2023 | 2022 | 2023 | 2022 | |||||||||||||||||||
| Service cost |
$
|
$
|
$
|
$
|
|||||||||||||||||||
| Interest cost |
|
|
|
|
|||||||||||||||||||
| Expected return on plan assets |
(
|
(
|
(
|
(
|
|||||||||||||||||||
| Amortization of actuarial loss |
|
|
|
|
|||||||||||||||||||
|
$
|
$
|
$
|
$
|
||||||||||||||||||||
| Defined Benefit Pension Plans | OPEB Plans | ||||||||||||||||||||||
| WPL | 2023 | 2022 | 2023 | 2022 | |||||||||||||||||||
| Service cost |
$
|
$
|
$
|
$
|
|||||||||||||||||||
| Interest cost |
|
|
|
|
|||||||||||||||||||
| Expected return on plan assets |
(
|
(
|
|
|
|||||||||||||||||||
| Amortization of actuarial loss |
|
|
|
|
|||||||||||||||||||
|
$
|
$
|
$
|
$
|
||||||||||||||||||||
NOTE 10(b) Equity-based Compensation Plans -
A summary of compensation expense, including amounts allocated to IPL and WPL, and the related income tax benefits recognized for share-based compensation awards for the three months ended March 31 was as follows (in millions):
| Alliant Energy | IPL | WPL | |||||||||||||||||||||||||||||||||
| 2023 | 2022 | 2023 | 2022 | 2023 | 2022 | ||||||||||||||||||||||||||||||
| Compensation expense |
$
|
$
|
$
|
$
|
$
|
$
|
|||||||||||||||||||||||||||||
| Income tax benefits |
|
|
|
|
|
|
|||||||||||||||||||||||||||||
As of March 31, 2023, Alliant Energy’s, IPL’s and WPL’s total unrecognized compensation cost related to share-based compensation awards was $
18
million, $
9
million and $
8
million, respectively, which is expected to be recognized over a weighted average period of between
1
year and
2
years.
For the three months ended March 31, 2023, performance shares, performance restricted stock units and restricted stock units were granted to key employees under existing plans as follows. These shares and units will be paid out in shares of common stock, and are therefore accounted for as equity awards.
| Weighted Average | |||||||||||
| Grants | Grant Date Fair Value | ||||||||||
| Performance shares |
|
$
|
|||||||||
| Performance restricted stock units |
|
|
|||||||||
| Restricted stock units |
|
|
|||||||||
As of March 31, 2023,
170,209
shares were included in the calculation of diluted EPS related to the nonvested equity awards.
NOTE 11.
DERIVATIVE INSTRUMENTS
Commodity Derivatives
-
Notional Amounts -
As of March 31, 2023, gross notional amounts and settlement/delivery years related to outstanding swap contracts, option contracts, physical forward contracts and FTRs that were accounted for as commodity derivative instruments were as follows (units in thousands):
| Electricity | FTRs | Natural Gas | Coal | ||||||||||||||||||||||||||||||||||||||||||||
| MWhs | Years | MWhs | Years | Dths | Years | Tons | Years | ||||||||||||||||||||||||||||||||||||||||
|
Alliant Energy
|
|
2023-2025 |
|
2023 |
|
2023-2032 |
|
2023 | |||||||||||||||||||||||||||||||||||||||
| IPL |
|
2023-2025 |
|
2023 |
|
2023-2030 |
|
2023 | |||||||||||||||||||||||||||||||||||||||
| WPL |
|
2023 |
|
2023 |
|
2023-2032 |
|
2023 | |||||||||||||||||||||||||||||||||||||||
|
17
|
||||||||
Financial Statement Presentation -
Derivative instruments are recorded at fair value each reporting date on the balance sheets as assets or liabilities as follows (in millions):
| Alliant Energy | IPL | WPL | |||||||||||||||||||||||||||||||||
|
March 31,
2023 |
December 31,
2022 |
March 31,
2023 |
December 31,
2022 |
March 31,
2023 |
December 31,
2022 |
||||||||||||||||||||||||||||||
| Current derivative assets |
$
|
$
|
$
|
$
|
$
|
$
|
|||||||||||||||||||||||||||||
| Non-current derivative assets |
|
|
|
|
|
|
|||||||||||||||||||||||||||||
| Current derivative liabilities |
|
|
|
|
|
|
|||||||||||||||||||||||||||||
| Non-current derivative liabilities |
|
|
|
|
|
|
|||||||||||||||||||||||||||||
During the three months ended March 31, 2023, Alliant Energy’s, IPL’s and WPL’s current derivative assets decreased primarily due to settlements of natural gas, FTR and electricity contracts. Alliant Energy’s and WPL’s derivative liabilities increased primarily due to lower natural gas prices. IPL’s current derivative liabilities decreased primarily due to settlements of natural gas contracts. Based on IPL’s and WPL’s cost recovery mechanisms, the changes in the fair value of derivative liabilities/assets resulted in comparable changes to regulatory assets/liabilities on the balance sheets.
Credit Risk-related Contingent Features -
Various agreements contain credit risk-related contingent features, including requirements to maintain certain credit ratings and/or limitations on liability positions under the agreements based on credit ratings. Certain of these agreements with credit risk-related contingency features are accounted for as derivative instruments. In the event of a material change in creditworthiness or if liability positions exceed certain contractual limits, credit support may need to be provided up to the amount of exposure under the contracts, or the contracts may need to be unwound and underlying liability positions paid. At March 31, 2023 and December 31, 2022, the aggregate fair value of all derivative instruments with credit risk-related contingent features in a net liability position was not materially different than amounts that would be required to be posted as credit support to counterparties by Alliant Energy, IPL or WPL if the most restrictive credit risk-related contingent features for derivative agreements in a net liability position were triggered.
Balance Sheet Offsetting
- The fair value amounts of derivative instruments subject to a master netting arrangement are not netted by counterparty on the balance sheets.
However, if the fair value amounts of derivative instruments by counterparty were netted, derivative assets and derivative liabilities related to commodity contracts would have been presented on the balance sheets as follows (in millions):
| Alliant Energy | IPL | WPL | |||||||||||||||||||||||||||||||||
| Gross | Gross | Gross | |||||||||||||||||||||||||||||||||
| (as reported) | Net | (as reported) | Net | (as reported) | Net | ||||||||||||||||||||||||||||||
| March 31, 2023 | |||||||||||||||||||||||||||||||||||
| Derivative assets |
$
|
$
|
$
|
$
|
$
|
$
|
|||||||||||||||||||||||||||||
| Derivative liabilities |
|
|
|
|
|
|
|||||||||||||||||||||||||||||
| December 31, 2022 | |||||||||||||||||||||||||||||||||||
| Derivative assets |
|
|
|
|
|
|
|||||||||||||||||||||||||||||
| Derivative liabilities |
|
|
|
|
|
|
|||||||||||||||||||||||||||||
Fair value amounts recognized for the right to reclaim cash collateral (receivable) or the obligation to return cash collateral (payable) are not offset against fair value amounts recognized for derivative instruments executed with the same counterparty under the same master netting arrangement.
Interest Rate Derivative
-
In January 2023, AEF entered into a $
300
million interest rate swap maturing in January 2026 to mitigate interest rate risk. Under the terms of the swap, AEF exchanged a variable interest rate for a fixed interest rate of
3.93
% on a portion of its variable-rate term loan borrowings. The related interest rate derivative was valued based on quoted prices that utilize current market interest rate forecasts. As of March 31, 2023, $
1
million of non-current interest rate derivative liabilities were recorded in “Other liabilities” on Alliant Energy’s balance sheet. This interest rate derivative was designated as a cash flow hedge, with changes in fair value recorded as other comprehensive income/loss. As of March 31, 2023, accumulated other comprehensive loss included $
1
million of losses related to the interest rate swap. For the three months ended March 31, 2023, a $
1
million reduction to interest expense was recorded in Alliant Energy’s income statement related to the interest rate swap.
|
18
|
||||||||
NOTE 12.
FAIR VALUE MEASUREMENTS
Fair Value of Financial Instruments
- The carrying amounts of current assets and current liabilities approximate fair value because of the short maturity of such financial instruments.
Carrying amounts and related estimated fair values of other financial instruments were as follows (in millions):
| Alliant Energy | March 31, 2023 | December 31, 2022 | |||||||||||||||||||||||||||||||||||||||||||||||||||||||||
| Fair Value | Fair Value | ||||||||||||||||||||||||||||||||||||||||||||||||||||||||||
| Carrying | Level | Level | Level | Carrying | Level | Level | Level | ||||||||||||||||||||||||||||||||||||||||||||||||||||
| Amount | 1 | 2 | 3 | Total | Amount | 1 | 2 | 3 | Total | ||||||||||||||||||||||||||||||||||||||||||||||||||
| Assets: | |||||||||||||||||||||||||||||||||||||||||||||||||||||||||||
| Money market fund investments |
$
|
$
|
$
|
$
|
$
|
$
|
$
|
$
|
$
|
$
|
|||||||||||||||||||||||||||||||||||||||||||||||||
| Commodity derivatives |
|
|
|
|
|
|
|
|
|
|
|||||||||||||||||||||||||||||||||||||||||||||||||
| Deferred proceeds |
|
|
|
|
|
|
|
|
|
|
|||||||||||||||||||||||||||||||||||||||||||||||||
| Liabilities: | |||||||||||||||||||||||||||||||||||||||||||||||||||||||||||
| Commodity derivatives |
|
|
|
|
|
|
|
|
|
|
|||||||||||||||||||||||||||||||||||||||||||||||||
| Interest rate derivatives |
|
|
|
|
|
|
|
|
|
|
|||||||||||||||||||||||||||||||||||||||||||||||||
| Long-term debt (incl. current maturities) |
|
|
|
|
|
|
|
|
|
|
|||||||||||||||||||||||||||||||||||||||||||||||||
| IPL | March 31, 2023 | December 31, 2022 | |||||||||||||||||||||||||||||||||||||||||||||||||||||||||
| Fair Value | Fair Value | ||||||||||||||||||||||||||||||||||||||||||||||||||||||||||
| Carrying | Level | Level | Level | Carrying | Level | Level | Level | ||||||||||||||||||||||||||||||||||||||||||||||||||||
| Amount | 1 | 2 | 3 | Total | Amount | 1 | 2 | 3 | Total | ||||||||||||||||||||||||||||||||||||||||||||||||||
| Assets: | |||||||||||||||||||||||||||||||||||||||||||||||||||||||||||
| Money market fund investments |
$
|
$
|
$
|
$
|
$
|
$
|
$
|
$
|
$
|
$
|
|||||||||||||||||||||||||||||||||||||||||||||||||
| Commodity derivatives |
|
|
|
|
|
|
|
|
|
|
|||||||||||||||||||||||||||||||||||||||||||||||||
| Deferred proceeds |
|
|
|
|
|
|
|
|
|
|
|||||||||||||||||||||||||||||||||||||||||||||||||
| Liabilities: | |||||||||||||||||||||||||||||||||||||||||||||||||||||||||||
| Commodity derivatives |
|
|
|
|
|
|
|
|
|
|
|||||||||||||||||||||||||||||||||||||||||||||||||
| Long-term debt |
|
|
|
|
|
|
|
|
|
|
|||||||||||||||||||||||||||||||||||||||||||||||||
| WPL | March 31, 2023 | December 31, 2022 | |||||||||||||||||||||||||||||||||||||||||||||||||||||||||
| Fair Value | Fair Value | ||||||||||||||||||||||||||||||||||||||||||||||||||||||||||
| Carrying | Level | Level | Level | Carrying | Level | Level | Level | ||||||||||||||||||||||||||||||||||||||||||||||||||||
| Amount | 1 | 2 | 3 | Total | Amount | 1 | 2 | 3 | Total | ||||||||||||||||||||||||||||||||||||||||||||||||||
| Assets: | |||||||||||||||||||||||||||||||||||||||||||||||||||||||||||
| Money market fund investments |
$
|
$
|
$
|
$
|
$
|
$
|
$
|
$
|
$
|
$
|
|||||||||||||||||||||||||||||||||||||||||||||||||
| Commodity derivatives |
|
|
|
|
|
|
|
|
|
|
|||||||||||||||||||||||||||||||||||||||||||||||||
| Liabilities: | |||||||||||||||||||||||||||||||||||||||||||||||||||||||||||
| Commodity derivatives |
|
|
|
|
|
|
|
|
|
|
|||||||||||||||||||||||||||||||||||||||||||||||||
| Long-term debt |
|
|
|
|
|
|
|
|
|
|
|||||||||||||||||||||||||||||||||||||||||||||||||
Information for fair value measurements using significant unobservable inputs (Level 3 inputs) was as follows (in millions):
| Alliant Energy | Commodity Contract Derivative | ||||||||||||||||||||||
| Assets and (Liabilities), net | Deferred Proceeds | ||||||||||||||||||||||
| Three Months Ended March 31 | 2023 | 2022 | 2023 | 2022 | |||||||||||||||||||
| Beginning balance, January 1 |
$
|
$
|
$
|
$
|
|||||||||||||||||||
| Total net losses included in changes in net assets (realized/unrealized) |
(
|
(
|
|
|
|||||||||||||||||||
| Settlements (a) |
(
|
(
|
(
|
|
|||||||||||||||||||
|
Ending balance, March 31
|
($
|
$
|
$
|
$
|
|||||||||||||||||||
|
The amount of total net losses for the period included in changes in net assets attributable to the change in unrealized losses relating to assets and liabilities held at March 31
|
($
|
($
|
$
|
$
|
|||||||||||||||||||
|
19
|
||||||||
| IPL | Commodity Contract Derivative | ||||||||||||||||||||||
| Assets and (Liabilities), net | Deferred Proceeds | ||||||||||||||||||||||
| Three Months Ended March 31 | 2023 | 2022 | 2023 | 2022 | |||||||||||||||||||
| Beginning balance, January 1 |
$
|
$
|
$
|
$
|
|||||||||||||||||||
|
Total net gains (losses) included in changes in net assets (realized/unrealized)
|
|
(
|
|
|
|||||||||||||||||||
| Settlements (a) |
(
|
(
|
(
|
|
|||||||||||||||||||
|
Ending balance, March 31
|
$
|
$
|
$
|
$
|
|||||||||||||||||||
|
The amount of total net gains (losses) for the period included in changes in net assets attributable to the change in unrealized gains (losses) relating to assets and liabilities held at March 31
|
$
|
($
|
$
|
$
|
|||||||||||||||||||
| WPL | Commodity Contract Derivative | ||||||||||
| Assets and (Liabilities), net | |||||||||||
| Three Months Ended March 31 | 2023 | 2022 | |||||||||
| Beginning balance, January 1 |
$
|
$
|
|||||||||
|
Total net losses included in changes in net assets (realized/unrealized)
|
(
|
(
|
|||||||||
| Settlements |
(
|
(
|
|||||||||
|
Ending balance, March 31
|
($
|
$
|
|||||||||
|
The amount of total net losses for the period included in changes in net assets attributable to the change in unrealized losses relating to assets and liabilities held at March 31
|
($
|
($
|
|||||||||
(a)
Settlements related to deferred proceeds are due to the change in the carrying amount of receivables sold less the allowance for expected credit losses associated with the receivables sold and cash amounts received from the receivables sold.
Commodity Contracts -
The fair value of FTR and natural gas commodity contracts categorized as Level 3 was recognized as net derivative assets (liabilities) as follows (in millions):
| Alliant Energy | IPL | WPL | |||||||||||||||||||||||||||||||||
| Excluding FTRs | FTRs | Excluding FTRs | FTRs | Excluding FTRs | FTRs | ||||||||||||||||||||||||||||||
| March 31, 2023 |
($
|
$
|
($
|
$
|
($
|
$
|
|||||||||||||||||||||||||||||
| December 31, 2022 |
(
|
|
(
|
|
(
|
|
|||||||||||||||||||||||||||||
NOTE 13.
COMMITMENTS AND CONTINGENCIES
NOTE 13(a) Capital Purchase Commitments -
Various contractual obligations contain minimum future commitments related to capital expenditures for certain construction projects, including IPL’s and WPL’s expansion of solar generation. At March 31, 2023, Alliant Energy’s, IPL’s and WPL’s minimum future commitments for these projects were $
252
million, $
40
million and $
212
million, respectively.
NOTE 13(b) Other Purchase Commitments -
Various commodity supply, transportation and storage contracts help meet obligations to provide electricity and natural gas to utility customers. In addition, there are various purchase commitments associated with other goods and services.
At March 31, 2023, related minimum future commitments were as follows (in millions):
| Alliant Energy | IPL | WPL | |||||||||||||||
| Natural gas |
$
|
$
|
$
|
||||||||||||||
| Coal |
|
|
|
||||||||||||||
| Other (a) |
|
|
|
||||||||||||||
|
$
|
$
|
$
|
|||||||||||||||
(a)
Includes individual commitments incurred during the normal course of business that exceeded $
1
million at March 31, 2023.
NOTE 13(c) Guarantees and Indemnifications -
Whiting Petroleum
-
Whiting Petroleum is an independent oil and gas company. In 2004, Alliant Energy sold its remaining interest in Whiting Petroleum. Alliant Energy Resources, LLC, as the successor to a predecessor entity that owned Whiting Petroleum, and a wholly-owned subsidiary of AEF, continues to guarantee the partnership obligations of an affiliate of Whiting Petroleum under multiple general partnership agreements in the oil and gas industry. The guarantees do not include a maximum limit. Based on information made available to Alliant Energy by Whiting Petroleum, the Whiting Petroleum affiliate holds an approximate
6
% share in the partnerships, and currently known obligations include costs associated with the future
|
20
|
||||||||
abandonment of certain facilities owned by the partnerships. The general partnerships were formed under California law, and Alliant Energy Resources, LLC may need to perform under the guarantees if the affiliate of Whiting Petroleum is unable to meet its partnership obligations.
As of March 31, 2023, the currently known partnership obligations for the abandonment obligations are estimated at $
58
million, which represents Alliant Energy’s currently estimated maximum exposure under the guarantees. Alliant Energy estimates its expected loss to be a portion of the $
58
million of known partnership abandonment obligations of the Whiting Petroleum affiliate and the other partners. Alliant Energy is not aware of any material liabilities related to these guarantees that it is probable that it will be obligated to pay; however, as of both March 31, 2023 and December 31, 2022, a liability of $
5
million is recorded in “Other liabilities” on Alliant Energy’s balance sheets for expected credit losses related to the contingent obligations that are in the scope of these guarantees.
Whiting Petroleum completed a business combination with Oasis Petroleum Inc. in July 2022. The combined operations are now known as Chord Energy Corporation. The business combination is not expected to affect the scope of the Whiting Petroleum affiliate’s obligations to Alliant Energy or Alliant Energy’s related guarantees.
Non-utility Wind Farm in Oklahoma
-
In 2017, a wholly-owned subsidiary of AEF acquired a cash equity ownership interest in a non-utility wind farm located in Oklahoma. The wind farm provides electricity to a third party under a long-term PPA. Alliant Energy provided a parent guarantee of its subsidiary’s indemnification obligations under the related operating agreement and PPA. Alliant Energy’s obligations under the operating agreement were $
59
million as of March 31, 2023 and will reduce annually until expiring in July 2047. Alliant Energy’s obligations under the PPA are subject to a maximum limit of $
17
million and expire in December 2031, subject to potential extension. Alliant Energy is not aware of any material liabilities related to this guarantee that it is probable that it will be obligated to pay and therefore has not recognized any material liabilities related to this guarantee as of March 31, 2023 and December 31, 2022.
NOTE 13(d) Environmental Matters -
Manufactured Gas Plant (MGP) Sites
-
IPL and WPL have current or previous ownership interests in various sites that are previously associated with the production of gas for which IPL and WPL have, or may have in the future, liability for investigation, remediation and monitoring costs. IPL and WPL are working pursuant to the requirements of various federal and state agencies to investigate, mitigate, prevent and remediate, where necessary, the environmental impacts to property, including natural resources, at and around these former MGP sites in order to protect public health and the environment.
At March 31, 2023, estimated future costs expected to be incurred for the investigation, remediation and monitoring of the MGP sites, as well as environmental liabilities recorded on the balance sheets for these sites, which are not discounted, were as follows (in millions):
| Alliant Energy | IPL | WPL | |||||||||||||||||||||||||||||||||
| Range of estimated future costs |
$
|
-
|
$
|
$
|
-
|
$
|
$
|
-
|
$
|
||||||||||||||||||||||||||
| Current and non-current environmental liabilities |
$
|
$
|
$
|
||||||||||||||||||||||||||||||||
IPL Consent Decree
- In 2015, the U.S. District Court for the Northern District of Iowa approved a Consent Decree that IPL entered into with the EPA, the Sierra Club, the State of Iowa and Linn County in Iowa, thereby resolving potential Clean Air Act issues associated with emissions from IPL’s coal-fired generating facilities in Iowa. IPL has completed various requirements under the Consent Decree. IPL’s remaining requirements include fuel switching or retiring Prairie Creek Units 1 and 3 by December 31, 2025. Alliant Energy and IPL currently expect to recover material costs incurred by IPL related to compliance with the terms of the Consent Decree from IPL’s electric customers.
Other Environmental Contingencies
-
In addition to the environmental liabilities discussed above, various environmental rules are monitored that may have a significant impact on future operations. Several of these environmental rules are subject to legal challenges, reconsideration and/or other uncertainties. Given uncertainties regarding the outcome, timing and compliance plans for these environmental matters, the complete financial impact of each of these rules is not able to be determined; however, future capital investments and/or modifications to EGUs and electric and gas distribution systems to comply with certain of these rules could be significant. Specific current, proposed or potential environmental matters include, among others: Cross-State Air Pollution Rule, Effluent Limitation Guidelines, Coal Combustion Residuals Rule, and various legislation and EPA regulations to monitor and regulate the emission of greenhouse gases, including the Clean Air Act.
NOTE 13(e) MISO Transmission Owner Return on Equity Complaints -
A group of stakeholders, including MISO cooperative and municipal utilities, previously filed complaints with the Federal Energy Regulatory Commission (FERC) requesting a reduction to the base return on equity authorized for MISO transmission owners, including ITC Midwest LLC and ATC. In 2019, FERC issued an order on the previously filed complaints and reduced the base return on equity authorized for the MISO transmission owners to
9.88
% for November 12, 2013 through February 11, 2015, and subsequent to September 28, 2016. In 2020, FERC issued orders in response to various rehearing requests and increased the base return on equity authorized for the MISO transmission owners from
9.88
% to
10.02
% for November 12, 2013 through February 11, 2015, and subsequent to September 28, 2016. In August 2022, the U.S. Court of Appeals for the District of Columbia Circuit vacated FERC’s prior orders that established the base return on equity authorized for the MISO transmission owners and remanded the cases to FERC for further proceedings, which may result in additional changes to the base return on equity authorized for
|
21
|
||||||||
NOTE 14.
SEGMENTS OF BUSINESS
Certain financial information relating to Alliant Energy’s, IPL’s and WPL’s business segments is as follows. Intersegment revenues were not material to their respective operations.
| Alliant Energy | ATC Holdings, | Alliant | |||||||||||||||||||||||||||||||||
| Utility | Non-Utility, | Energy | |||||||||||||||||||||||||||||||||
| Electric | Gas | Other | Total | Parent and Other | Consolidated | ||||||||||||||||||||||||||||||
| (in millions) | |||||||||||||||||||||||||||||||||||
| Three Months Ended March 31, 2023 | |||||||||||||||||||||||||||||||||||
| Revenues |
$
|
$
|
$
|
$
|
$
|
$
|
|||||||||||||||||||||||||||||
| Operating income |
|
|
|
|
|
|
|||||||||||||||||||||||||||||
| Net income attributable to Alliant Energy common shareowners |
|
|
|
||||||||||||||||||||||||||||||||
| Three Months Ended March 31, 2022 | |||||||||||||||||||||||||||||||||||
| Revenues |
$
|
$
|
$
|
$
|
$
|
$
|
|||||||||||||||||||||||||||||
| Operating income |
|
|
|
|
|
|
|||||||||||||||||||||||||||||
| Net income attributable to Alliant Energy common shareowners |
|
|
|
||||||||||||||||||||||||||||||||
| IPL | Electric | Gas | Other | Total | |||||||||||||||||||
| (in millions) | |||||||||||||||||||||||
| Three Months Ended March 31, 2023 | |||||||||||||||||||||||
| Revenues |
$
|
$
|
$
|
$
|
|||||||||||||||||||
| Operating income |
|
|
|
|
|||||||||||||||||||
| Net income |
|
||||||||||||||||||||||
| Three Months Ended March 31, 2022 | |||||||||||||||||||||||
| Revenues |
$
|
$
|
$
|
$
|
|||||||||||||||||||
| Operating income |
|
|
|
|
|||||||||||||||||||
| Net income |
|
||||||||||||||||||||||
| WPL | Electric | Gas | Other | Total | |||||||||||||||||||
| (in millions) | |||||||||||||||||||||||
| Three Months Ended March 31, 2023 | |||||||||||||||||||||||
| Revenues |
$
|
$
|
$
|
$
|
|||||||||||||||||||
| Operating income |
|
|
|
|
|||||||||||||||||||
| Net income |
|
||||||||||||||||||||||
| Three Months Ended March 31, 2022 | |||||||||||||||||||||||
| Revenues |
$
|
$
|
$
|
$
|
|||||||||||||||||||
| Operating income |
|
|
|
|
|||||||||||||||||||
| Net income |
|
||||||||||||||||||||||
NOTE 15.
RELATED PARTIES
Service Agreements
-
Pursuant to service agreements, IPL and WPL receive various administrative and general services from an affiliate, Corporate Services. These services are billed to IPL and WPL at cost based on expenses incurred by Corporate Services for the benefit of IPL and WPL, respectively. These costs consisted primarily of employee compensation and benefits, fees associated with various professional services, depreciation and amortization of property, plant and equipment, and a return on net assets. Corporate Services also acts as agent on behalf of IPL and WPL pursuant to the service agreements. As agent, Corporate Services enters into energy, capacity, ancillary services, and transmission sale and purchase transactions within MISO. Corporate Services assigns such sales and purchases among IPL and WPL based on statements received from MISO.
The amounts billed for services provided, sales credited and purchases for the three months ended March 31 were as follows (in millions):
| IPL | WPL | ||||||||||||||||||||||
| 2023 | 2022 | 2023 | 2022 | ||||||||||||||||||||
| Corporate Services billings |
$
|
$
|
$
|
$
|
|||||||||||||||||||
| Sales credited |
|
|
|
|
|||||||||||||||||||
| Purchases billed |
|
|
|
|
|||||||||||||||||||
|
22
|
||||||||
Net intercompany payables to Corporate Services were as follows (in millions):
| IPL | WPL | ||||||||||||||||||||||
| March 31, 2023 | December 31, 2022 | March 31, 2023 | December 31, 2022 | ||||||||||||||||||||
| Net payables to Corporate Services |
$
|
$
|
$
|
$
|
|||||||||||||||||||
ATC
-
Pursuant to various agreements, WPL receives a range of transmission services from ATC. WPL provides operation, maintenance, and construction services to ATC. WPL and ATC also bill each other for use of shared facilities owned by each party.
The related amounts billed between the parties for the three months ended March 31 were as follows (in millions):
| 2023 | 2022 | ||||||||||
| ATC billings to WPL |
$
|
$
|
|||||||||
| WPL billings to ATC |
|
|
|||||||||
WPL owed ATC net amounts of $
9
million as of March 31, 2023 and $
10
million as of December 31, 2022.
ITEM 2. MANAGEMENT’S DISCUSSION AND ANALYSIS OF FINANCIAL CONDITION AND RESULTS OF OPERATIONS
This MDA includes information relating to Alliant Energy, and IPL and WPL (collectively, the Utilities), as well as ATC Holdings, AEF and Corporate Services. Where appropriate, information relating to a specific entity has been segregated and labeled as such. The following discussion and analysis should be read in conjunction with the
Financial Statements
and the
Notes
included in this report, as well as the financial statements, notes and MDA included in the 2022
Form 10-K
. Unless otherwise noted, all “per share” references in MDA refer to earnings per diluted share.
2023 HIGHLIGHTS
Customer Investments:
•
In March 2023, the IUB issued a certificate of public convenience, use and necessity (GCU Certificate) granting IPL approval to construct, own and operate up to 50 MW of solar generation and up to 25 MW of battery storage in Union County, Iowa.
•
In April 2023, the IUB issued a GCU Certificate granting IPL approval to construct, own and operate up to 150 MW of solar generation and up to 75 MW of battery storage in Lee County, Iowa.
•
In 2021, IPL filed for advance rate-making principles with the IUB for up to 400 MW of solar generation and 75 MW of battery storage. On April 27, 2023, the IUB approved advance rate-making principles for up to 200 MW of solar generation. The IUB’s order included a cost target of $1,575/kilowatt, including AFUDC and transmission upgrade costs among other costs. Any reasonable and prudent costs incurred in excess of the cost target, as well as the related return on common equity, would need to be addressed in future IPL retail electric rate review filings. IPL has 20 days from the date of the IUB’s order to ask for reconsideration of the advance rate-making principles, and 30 days from the date of the IUB’s order to accept the approved advance rate-making principles.
Rate Matters:
•
In April 2023, WPL filed a retail electric and gas rate review with the PSCW for the 2024/2025 forward-looking Test Period. The key drivers for the filing include revenue requirement impacts of increasing electric and gas rate base, including investments in solar generation and battery storage. The filing requested approval for WPL to implement increases in annual rates for its retail electric and gas customers of $111 million and $17 million in 2024, respectively, with any granted rate changes expected to be effective on January 1, 2024. WPL’s filing also requested approval to implement an additional $71 million increase in annual rates for its retail electric customers in 2025, with any granted rate changes expected to be effective on January 1, 2025. WPL also requested to maintain its current authorized return on common equity of 10% and implement an approximate 56% common equity component of its regulatory capital structure, as well as receive continued recovery of and a return on the remaining net book value of Edgewater Unit 5, which is currently expected to be retired by June 1, 2025. A decision from the PSCW is expected by the end of 2023.
RESULTS OF OPERATIONS
Results of operations include financial information prepared in accordance with GAAP as well as utility electric margins and utility gas margins, which are not measures of financial performance under GAAP. Utility electric margins are defined as electric revenues less electric production fuel, purchased power and electric transmission service expenses. Utility gas margins are defined as gas revenues less cost of gas sold. Utility electric margins and utility gas margins are non-GAAP financial measures because they exclude other utility and non-utility revenues, other operation and maintenance expenses, depreciation and amortization expenses, and taxes other than income tax expense.
Management believes that utility electric and gas margins provide a meaningful basis for evaluating and managing utility operations since electric production fuel, purchased power and electric transmission service expenses and cost of gas sold are
|
23
|
||||||||
generally passed through to customers, and therefore, result in changes to electric and gas revenues that are comparable to changes in such expenses. The presentation of utility electric and gas margins herein is intended to provide supplemental information for investors regarding operating performance. These utility electric and gas margins may not be comparable to how other entities define utility electric and gas margin. Furthermore, these measures are not intended to replace operating income as determined in accordance with GAAP as an indicator of operating performance.
Additionally, the table below includes EPS for Utilities and Corporate Services, ATC Holdings, and Non-utility and Parent, which are non-GAAP financial measures. Alliant Energy believes these non-GAAP financial measures are useful to investors because they facilitate an understanding of segment performance and trends, and provide additional information about Alliant Energy’s operations on a basis consistent with the measures that management uses to manage its operations and evaluate its performance.
Financial Results Overview
-
Alliant Energy’s net income and EPS attributable to Alliant Energy common shareowners for the three months ended March 31 were as follows (dollars in millions, except per share amounts):
| 2023 | 2022 | ||||||||||||||||||||||
| Income (Loss) | EPS | Income | EPS | ||||||||||||||||||||
| Utilities and Corporate Services | $163 | $0.65 | $183 | $0.73 | |||||||||||||||||||
| ATC Holdings | 9 | 0.04 | 8 | 0.03 | |||||||||||||||||||
| Non-utility and Parent | (9) | (0.04) | 1 | 0.01 | |||||||||||||||||||
| Alliant Energy Consolidated | $163 | $0.65 | $192 | $0.77 | |||||||||||||||||||
Alliant Energy’s Utilities and Corporate Services net income decreased by $20 million for the three-month period, primarily due to lower retail electric and gas sales due to impacts of warmer than normal temperatures on customer demand in the first quarter of 2023, compared to an increase in sales in the first quarter of 2022 due to impacts of colder than normal temperatures on customer demand, higher interest expense and timing of income tax expense. These items were partially offset by higher electric revenues resulting from higher revenue requirements and AFUDC from WPL’s capital investments.
Alliant Energy’s Non-utility and Parent net income decreased by $10 million for the three-month period, primarily due to higher interest expense.
For the three months ended March 31, operating income and a reconciliation of utility electric and gas margins to the most directly comparable GAAP measure, operating income, was as follows (in millions):
| Alliant Energy | IPL | WPL | |||||||||||||||||||||||||||||||||
| Three Months | 2023 | 2022 | 2023 | 2022 | 2023 | 2022 | |||||||||||||||||||||||||||||
| Operating income | $222 | $248 | $96 | $110 | $121 | $131 | |||||||||||||||||||||||||||||
| Electric utility revenues | $768 | $773 | $388 | $400 | $380 | $373 | |||||||||||||||||||||||||||||
| Electric production fuel and purchased power expenses | (157) | (168) | (47) | (67) | (109) | (101) | |||||||||||||||||||||||||||||
| Electric transmission service expense | (146) | (138) | (104) | (97) | (42) | (41) | |||||||||||||||||||||||||||||
| Utility Electric Margin (non-GAAP) | 465 | 467 | 237 | 236 | 229 | 231 | |||||||||||||||||||||||||||||
| Gas utility revenues | 276 | 262 | 150 | 139 | 126 | 123 | |||||||||||||||||||||||||||||
| Cost of gas sold | (181) | (168) | (95) | (85) | (86) | (83) | |||||||||||||||||||||||||||||
| Utility Gas Margin (non-GAAP) | 95 | 94 | 55 | 54 | 40 | 40 | |||||||||||||||||||||||||||||
| Other utility revenues | 11 | 11 | 11 | 11 | — | — | |||||||||||||||||||||||||||||
| Non-utility revenues | 22 | 22 | — | — | — | — | |||||||||||||||||||||||||||||
| Other operation and maintenance expenses | (174) | (153) | (95) | (83) | (66) | (58) | |||||||||||||||||||||||||||||
| Depreciation and amortization expenses | (166) | (166) | (96) | (94) | (68) | (70) | |||||||||||||||||||||||||||||
| Taxes other than income tax expense | (31) | (27) | (16) | (14) | (14) | (12) | |||||||||||||||||||||||||||||
| Operating income | $222 | $248 | $96 | $110 | $121 | $131 | |||||||||||||||||||||||||||||
Operating Income Variances
-
Variances between periods in operating income for the three months ended March 31, 2023 compared to the same period in 2022 were as follows (in millions):
| Alliant Energy | IPL | WPL | |||||||||||||||
| Total higher (lower) utility electric margin variance (Refer to details below) | ($2) | $1 | ($2) | ||||||||||||||
| Total higher utility gas margin variance (Refer to details below) | 1 | 1 | — | ||||||||||||||
| Total higher other operation and maintenance expenses variance (Refer to details below) | (21) | (12) | (8) | ||||||||||||||
| Total (higher) lower depreciation and amortization expense | — | (2) | 2 | ||||||||||||||
| Other | (4) | (2) | (2) | ||||||||||||||
| ($26) | ($14) | ($10) | |||||||||||||||
|
24
|
||||||||
Electric and Gas Revenues and Sales Summary
-
Electric and gas revenues (in millions), and MWh and Dth sales (in thousands), for the three months ended March 31 were as follows:
| Alliant Energy | Electric | Gas | |||||||||||||||||||||||||||||||||||||||||||||
| Revenues | MWhs Sold | Revenues | Dths Sold | ||||||||||||||||||||||||||||||||||||||||||||
| 2023 | 2022 | 2023 | 2022 | 2023 | 2022 | 2023 | 2022 | ||||||||||||||||||||||||||||||||||||||||
| Retail | $686 | $692 | 6,201 | 6,388 | $262 | $248 | 22,310 | 26,095 | |||||||||||||||||||||||||||||||||||||||
| Sales for resale: | |||||||||||||||||||||||||||||||||||||||||||||||
| Wholesale | 46 | 47 | 698 | 721 | N/A | N/A | N/A | N/A | |||||||||||||||||||||||||||||||||||||||
| Bulk power and other | 23 | 21 | 1,243 | 1,224 | N/A | N/A | N/A | N/A | |||||||||||||||||||||||||||||||||||||||
| Transportation/Other | 13 | 13 | 15 | 17 | 14 | 14 | 32,614 | 29,877 | |||||||||||||||||||||||||||||||||||||||
| $768 | $773 | 8,157 | 8,350 | $276 | $262 | 54,924 | 55,972 | ||||||||||||||||||||||||||||||||||||||||
| IPL | Electric | Gas | |||||||||||||||||||||||||||||||||||||||||||||
| Revenues | MWhs Sold | Revenues | Dths Sold | ||||||||||||||||||||||||||||||||||||||||||||
| 2023 | 2022 | 2023 | 2022 | 2023 | 2022 | 2023 | 2022 | ||||||||||||||||||||||||||||||||||||||||
| Retail | $362 | $379 | 3,544 | 3,651 | $141 | $130 | 11,459 | 13,601 | |||||||||||||||||||||||||||||||||||||||
| Sales for resale: | |||||||||||||||||||||||||||||||||||||||||||||||
| Wholesale | 12 | 15 | 187 | 194 | N/A | N/A | N/A | N/A | |||||||||||||||||||||||||||||||||||||||
| Bulk power and other | 7 | (2) | 496 | 403 | N/A | N/A | N/A | N/A | |||||||||||||||||||||||||||||||||||||||
| Transportation/Other | 7 | 8 | 8 | 8 | 9 | 9 | 12,035 | 12,020 | |||||||||||||||||||||||||||||||||||||||
| $388 | $400 | 4,235 | 4,256 | $150 | $139 | 23,494 | 25,621 | ||||||||||||||||||||||||||||||||||||||||
| WPL | Electric | Gas | |||||||||||||||||||||||||||||||||||||||||||||
| Revenues | MWhs Sold | Revenues | Dths Sold | ||||||||||||||||||||||||||||||||||||||||||||
| 2023 | 2022 | 2023 | 2022 | 2023 | 2022 | 2023 | 2022 | ||||||||||||||||||||||||||||||||||||||||
| Retail | $324 | $313 | 2,657 | 2,737 | $121 | $118 | 10,851 | 12,494 | |||||||||||||||||||||||||||||||||||||||
| Sales for resale: | |||||||||||||||||||||||||||||||||||||||||||||||
| Wholesale | 34 | 32 | 511 | 527 | N/A | N/A | N/A | N/A | |||||||||||||||||||||||||||||||||||||||
| Bulk power and other | 16 | 23 | 747 | 821 | N/A | N/A | N/A | N/A | |||||||||||||||||||||||||||||||||||||||
| Transportation/Other | 6 | 5 | 7 | 9 | 5 | 5 | 20,579 | 17,857 | |||||||||||||||||||||||||||||||||||||||
| $380 | $373 | 3,922 | 4,094 | $126 | $123 | 31,430 | 30,351 | ||||||||||||||||||||||||||||||||||||||||
Sales Trends and Temperatures
-
Alliant Energy’s retail electric and gas sales volumes decreased 3% and 15%, respectively, for the three months ended March 31, 2023 compared to the same period in 2022, primarily due to changes in temperatures.
Estimated increases (decreases) to electric and gas margins from the impacts of temperatures for the three months ended March 31 were as follows (in millions):
| Electric Margins | Gas Margins | ||||||||||||||||||||||||||||||||||
| 2023 | 2022 | Change | 2023 | 2022 | Change | ||||||||||||||||||||||||||||||
| IPL | ($4) | $5 | ($9) | ($3) | $3 | ($6) | |||||||||||||||||||||||||||||
| WPL | (5) | 2 | (7) | (3) | 1 | (4) | |||||||||||||||||||||||||||||
| Total Alliant Energy | ($9) | $7 | ($16) | ($6) | $4 | ($10) | |||||||||||||||||||||||||||||
Electric Sales for Resale
-
Electric sales for resale volume changes were largely due to changes in sales in the wholesale energy markets operated by MISO. These changes are impacted by several factors, including the availability and dispatch of Alliant Energy’s EGUs and electricity demand within these wholesale energy markets. Changes in sales for resale revenues were largely offset by changes in fuel-related costs, and therefore, did not have a significant impact on electric margins.
Gas Transportation/Other
-
Gas transportation/other sales volume changes were largely due to changes in the gas volumes supplied to Alliant Energy’s natural gas-fired EGUs caused by the availability and dispatch of such EGUs. Changes in these transportation/other revenues did not have a significant impact on gas margins.
|
25
|
||||||||
Utility Electric Margin Variances
-
The following items contributed to increased (decreased) utility electric margins for the three months ended March 31, 2023 compared to the same period in 2022 as follows (in millions):
| Alliant Energy | IPL | WPL | |||||||||||||||
| Estimated changes in sales volumes caused by temperatures | ($16) | ($9) | ($7) | ||||||||||||||
| Higher revenues at IPL due to changes in the renewable energy rider (mostly offset by changes in income taxes) | 7 | 7 | — | ||||||||||||||
| Other | 7 | 3 | 5 | ||||||||||||||
| ($2) | $1 | ($2) | |||||||||||||||
Utility Gas Margin Variances
- The following items contributed to increased (decreased) utility gas margins for the three months ended March 31, 2023 compared to the same period in 2022 as follows (in millions):
| Alliant Energy | IPL | WPL | |||||||||||||||
| Higher revenues at IPL related to changes in recovery amounts for energy efficiency costs through the energy efficiency rider (mostly offset by changes in energy efficiency expense) | $6 | $6 | $— | ||||||||||||||
| Higher revenue requirements at WPL (a) | 4 | — | 4 | ||||||||||||||
| Estimated changes in sales volumes caused by temperatures | (10) | (6) | (4) | ||||||||||||||
| Other | 1 | 1 | — | ||||||||||||||
| $1 | $1 | $— | |||||||||||||||
(a)
In December 2022, the PSCW issued an order authorizing an annual base rate increase of $9 million for WPL’s retail gas customers, covering the 2023 forward-looking Test Period, which reflects changes in weighted average cost of capital, updated depreciation rates and modifications to certain regulatory asset and regulatory liability amortizations. These retail gas rate changes were effective on January 1, 2023 and extend through the end of 2023.
Other Operation and Maintenance Expenses Variances
-
The following items contributed to (increased) decreased other operation and maintenance expenses for the three months ended March 31, 2023 compared to the same period in 2022 as follows (in millions):
| Alliant Energy | IPL | WPL | |||||||||||||||
| Higher energy efficiency expense at IPL (mostly offset by higher revenues) | ($6) | ($6) | $— | ||||||||||||||
| Higher generation operation and maintenance expenses | (5) | 2 | (7) | ||||||||||||||
| Other | (10) | (8) | (1) | ||||||||||||||
| ($21) | ($12) | ($8) | |||||||||||||||
Other Income and Deductions Variances
-
The following items contributed to (increased) decreased other income and deductions for the three months ended March 31, 2023 compared to the same period in 2022 as follows (in millions):
| Alliant Energy | IPL | WPL | |||||||||||||||
| Higher interest expense primarily due to financings completed in 2023 and 2022, and higher interest rates | ($20) | $— | ($9) | ||||||||||||||
| Higher AFUDC primarily due to changes in construction work in progress balances related to WPL’s solar generation | 8 | — | 7 | ||||||||||||||
| Other | (1) | (1) | (1) | ||||||||||||||
| ($13) | ($1) | ($3) | |||||||||||||||
LIQUIDITY AND CAPITAL RESOURCES
The liquidity and capital resources summary included in the 2022
Form 10-K
has not changed materially, except as described below.
Liquidity Position
-
At March 31, 2023, Alliant Energy had $157 million of cash and cash equivalents, $940 million ($450 million at the parent company, $250 million at IPL and $240 million at WPL) of available capacity under the single revolving credit facility and $21 million of available capacity at IPL under its sales of accounts receivable program.
|
26
|
||||||||
Capital Structure
-
Capital structures at March 31, 2023 were as follows (Long-term Debt (including current maturities) (LD); Short-term Debt (SD); Common Equity (CE)):
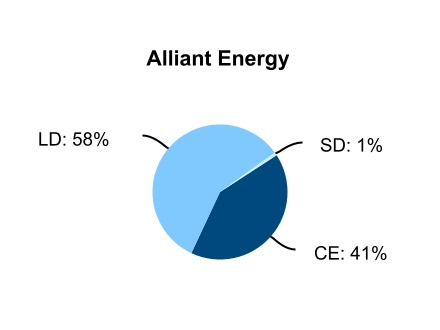
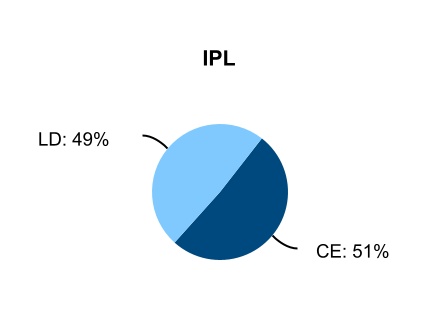
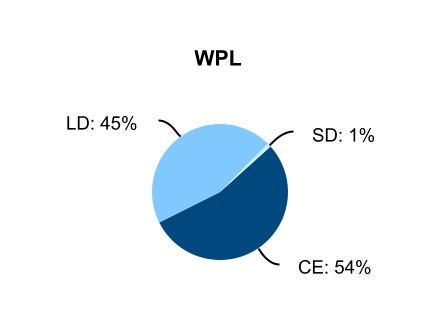
Cash Flows
-
Selected information from the cash flows statements was as follows (in millions):
| Alliant Energy | IPL | WPL | |||||||||||||||||||||||||||||||||
| 2023 | 2022 | 2023 | 2022 | 2023 | 2022 | ||||||||||||||||||||||||||||||
| Cash, cash equivalents and restricted cash, January 1 | $24 | $40 | $15 | $34 | $5 | $2 | |||||||||||||||||||||||||||||
| Cash flows from (used for): | |||||||||||||||||||||||||||||||||||
| Operating activities | 188 | 251 | 24 | 89 | 185 | 167 | |||||||||||||||||||||||||||||
| Investing activities | (263) | (223) | 70 | 18 | (295) | (217) | |||||||||||||||||||||||||||||
| Financing activities | 212 | 3 | (74) | (79) | 191 | 52 | |||||||||||||||||||||||||||||
| Net increase | 137 | 31 | 20 | 28 | 81 | 2 | |||||||||||||||||||||||||||||
|
Cash, cash equivalents and restricted cash, March 31
|
$161 | $71 | $35 | $62 | $86 | $4 | |||||||||||||||||||||||||||||
Operating Activities -
The following items contributed to increased (decreased) operating activity cash flows for the three months ended March 31, 2023 compared to the same period in 2022 (in millions):
| Alliant Energy | IPL | WPL | |||||||||||||||
| Changes in interest payments | ($31) | $— | ($17) | ||||||||||||||
| Decreased collections from IPL’s and WPL’s retail customers caused by temperature impacts on electric and gas sales | (26) | (15) | (11) | ||||||||||||||
| Changes in the sales of accounts receivable at IPL | (13) | (13) | — | ||||||||||||||
| Timing of intercompany payments and receipts | — | (5) | 14 | ||||||||||||||
| Other (primarily due to other changes in working capital) | 7 | (32) | 32 | ||||||||||||||
| ($63) | ($65) | $18 | |||||||||||||||
Investing Activities -
The following items contributed to increased (decreased) investing activity cash flows for the three months ended March 31, 2023 compared to the same period in 2022 (in millions):
| Alliant Energy | IPL | WPL | |||||||||||||||
| Higher utility construction and acquisition expenditures (a) | ($110) | ($5) | ($104) | ||||||||||||||
| Changes in the amount of cash receipts on sold receivables | 58 | 58 | — | ||||||||||||||
| Proceeds from sale of partial ownership interest in West Riverside | 25 | — | 25 | ||||||||||||||
| Other | (13) | (1) | 1 | ||||||||||||||
| ($40) | $52 | ($78) | |||||||||||||||
(a)
Largely due to higher expenditures for WPL’s solar generation.
Construction and Acquisition Expenditures
- In March 2023, WPL notified the PSCW that it currently expects estimated construction costs and related rate base additions associated with its 414 MW of new solar generation will exceed amounts approved by the PSCW in June 2022 by approximately 10-14% due to higher commodity, labor and other site-specific costs. A significant portion of these higher estimated construction costs are included in the anticipated construction and acquisition expenditures included in “Liquidity and Capital Resources” in the 2022
Form 10-K
.
|
27
|
||||||||
Financing Activities -
The following items contributed to increased (decreased) financing activity cash flows for the three months ended March 31, 2023 compared to the same period in 2022 (in millions):
| Alliant Energy | IPL | WPL | |||||||||||||||
| Lower payments to retire long-term debt | $300 | $— | $— | ||||||||||||||
| Higher net proceeds from issuance of long-term debt | 212 | — | 297 | ||||||||||||||
| Net changes in the amount of commercial paper and other short-term borrowings outstanding | (293) | — | (151) | ||||||||||||||
| Other | (10) | 5 | (7) | ||||||||||||||
| $209 | $5 | $139 | |||||||||||||||
State Regulatory Financing Authorization
- In March 2023, WPL received authorization from the PSCW to have up to $500 million of short-term borrowings and/or letters of credit outstanding at any time through the expiration date of WPL’s credit facility agreement.
Common Stock Issuances
- Refer to
Note 6
for discussion of common stock issuances by Alliant Energy in 2023.
Short-term Debt
- Refer to
N
ote 7(a)
for discussion of Alliant Energy’s, IPL’s and WPL’s single credit facility agreement that was amended and extended in March 2023, which includes a revised cross-default provision related to prepayment of material debt prior to the stated maturity and certain other confirming changes, as well as details for proceeds from AEF’s December 2022 term loan credit agreement.
Long-term Debt
- Refer to
Note
7
(b)
for discussion of Alliant Energy’s and WPL’s issuance of long-term debt in 2023.
Interest Rate Risk
- As of March 31, 2023, Alliant Energy’s exposure to risk resulting from changes in interest rates associated with variable-rate borrowings was mitigated primarily due to its issuance of convertible senior notes and an interest rate swap on a portion of its variable-rate term loan borrowings, as well as WPL’s issuance of green bonds, all of which were executed in the first quarter of 2023. Assuming the impact of a hypothetical 100 basis point increase in interest rates on variable-rate borrowings and cash amounts outstanding under IPL’s sales of accounts receivable program at March 31, 2023, Alliant Energy’s annual pre-tax expense would increase by approximately $3 million.
Off-Balance Sheet Arrangements and Certain Financial Commitments
-
A summary of Alliant Energy’s and IPL’s off-balance sheet arrangements and Alliant Energy’s, IPL’s and WPL’s contractual obligations is included in the 2022
Form 10-K
and has not changed materially from the items reported in the 2022
Form 10-K
, except for the items described in Notes
4
,
7
and
1
3
.
ITEM 3. QUANTITATIVE AND QUALITATIVE DISCLOSURES ABOUT MARKET RISK
Quantitative and Qualitative Disclosures About Market Risk are reported in the 2022
Form 10-K
and have not changed materially.
ITEM 4. CONTROLS AND PROCEDURES
Alliant Energy’s, IPL’s and WPL’s management evaluated, with the participation of each of Alliant Energy’s, IPL’s and WPL’s Chief Executive Officer, Chief Financial Officer and Disclosure Committee, the effectiveness of the design and operation of Alliant Energy’s, IPL’s and WPL’s disclosure controls and procedures (as defined in Rule 13a-15(e) of the Securities Exchange Act of 1934, as amended) as of March 31, 2023 pursuant to the requirements of the Securities Exchange Act of 1934, as amended. Based on their evaluation, the Chief Executive Officers and the Chief Financial Officer concluded that Alliant Energy’s, IPL’s and WPL’s disclosure controls and procedures were effective as of the quarter ended March 31, 2023.
There was no change in Alliant Energy’s, IPL’s and WPL’s internal control over financial reporting that occurred during the quarter ended March 31, 2023 that has materially affected, or is reasonably likely to materially affect, Alliant Energy’s, IPL’s or WPL’s internal control over financial reporting.
PART II. OTHER INFORMATION
ITEM 1. LEGAL PROCEEDINGS
None. SEC regulations require Alliant Energy, IPL and WPL to disclose information about certain proceedings arising under federal, state or local environmental provisions when a governmental authority is a party to the proceedings and such proceedings involve potential monetary sanctions that Alliant Energy, IPL and WPL reasonably believe will exceed a specified threshold. Pursuant to the SEC regulations, Alliant Energy, IPL and WPL use a threshold of $1 million for purposes of determining whether disclosure of any such proceedings is required. Applying this threshold, there are no environmental matters to disclose for this period.
|
28
|
||||||||
ITEM 1A. RISK FACTORS
ITEM 2. UNREGISTERED SALES OF EQUITY SECURITIES AND USE OF PROCEEDS
A summary of Alliant Energy common stock repurchases for the quarter ended March 31, 2023 was as follows:
| Total Number | Average Price | Total Number of Shares | Maximum Number (or Approximate | |||||||||||||||||||||||
| of Shares | Paid Per | Purchased as Part of | Dollar Value) of Shares That May | |||||||||||||||||||||||
| Period | Purchased (a) | Share | Publicly Announced Plan | Yet Be Purchased Under the Plan (a) | ||||||||||||||||||||||
| January 1 through January 31 | 4,786 | $55.44 | — | N/A | ||||||||||||||||||||||
| February 1 through February 28 | 3,382 | 53.44 | — | N/A | ||||||||||||||||||||||
| March 1 through March 31 | 643 | 52.11 | — | N/A | ||||||||||||||||||||||
| 8,811 | 54.43 | — | ||||||||||||||||||||||||
(a)
All shares were purchased on the open market and held in a rabbi trust under the Alliant Energy Deferred Compensation Plan. There is no limit on the number of shares of Alliant Energy common stock that may be held under the Deferred Compensation Plan, which currently does not have an expiration date.
ITEM 6. EXHIBITS
The following Exhibits are filed herewith or incorporated herein by reference.
| Exhibit Number | Description | ||||
| 4.1 | |||||
| 4.2 | |||||
| 4.3 | |||||
| 31.1 | |||||
| 31.2 | |||||
| 31.3 | |||||
| 31.4 | |||||
| 31.5 | |||||
| 31.6 | |||||
| 32.1 | |||||
| 32.2 | |||||
| 32.3 | |||||
| 101.INS | Inline XBRL Instance Document - the instance document does not appear in the Interactive Data File because its XBRL tags are embedded within the Inline XBRL document | ||||
| 101.SCH | Inline XBRL Taxonomy Extension Schema Document | ||||
| 101.CAL | Inline XBRL Taxonomy Extension Calculation Linkbase Document | ||||
| 101.LAB | Inline XBRL Taxonomy Extension Label Linkbase Document | ||||
| 101.PRE | Inline XBRL Taxonomy Extension Presentation Linkbase Document | ||||
| 101.DEF | Inline XBRL Taxonomy Extension Definition Linkbase Document | ||||
| 104 | Cover Page Interactive Data File (embedded within the Inline XBRL document) | ||||
|
29
|
||||||||
SIGNATURES
Pursuant to the requirements of the Securities Exchange Act of 1934, Alliant Energy Corporation, Interstate Power and Light Company and Wisconsin Power and Light Company have each duly caused this report to be signed on its behalf by the undersigned thereunto duly authorized on the 5th day of May 2023.
| ALLIANT ENERGY CORPORATION | |||||
| Registrant | |||||
| By: /s/ Benjamin M. Bilitz | Chief Accounting Officer and Controller | ||||
| Benjamin M. Bilitz | (Principal Accounting Officer and Authorized Signatory) | ||||
| INTERSTATE POWER AND LIGHT COMPANY | |||||
| Registrant | |||||
| By: /s/ Benjamin M. Bilitz | Chief Accounting Officer and Controller | ||||
| Benjamin M. Bilitz | (Principal Accounting Officer and Authorized Signatory) | ||||
| WISCONSIN POWER AND LIGHT COMPANY | |||||
| Registrant | |||||
| By: /s/ Benjamin M. Bilitz | Chief Accounting Officer and Controller | ||||
| Benjamin M. Bilitz | (Principal Accounting Officer and Authorized Signatory) | ||||
|
30
|
||||||||
TABLE OF CONTENTS
Part I. Financial InformationItem 1. Condensed Consolidated Financial Statements (unaudited)Note 1. Summary Of Significant Accounting PoliciesNote 1(a) General -Note 1(b) Cash and Cash Equivalents -Note 2. Regulatory MattersNote 3. Property, Plant and EquipmentNote 4. ReceivablesNote 4(a) - Accounts Receivable -Note 4(b) - Sales Of Accounts Receivable -Note 5. InvestmentsNote 6. Common EquityNote 7. DebtNote 7(a) Short-term Debt -Note 7(b) Long-term Debt -Note 8. RevenuesNote 9. Income TaxesNote 10. Benefit PlansNote 10(a) Pension and Opeb Plans -Note 10(b) Equity-based Compensation Plans -Note 11. Derivative InstrumentsNote 12. Fair Value MeasurementsNote 13. Commitments and ContingenciesNote 13(a) Capital Purchase Commitments -Note 13(b) Other Purchase Commitments -Note 13(c) Guarantees and Indemnifications -Note 13(d) Environmental Matters -Note 13(e) Miso Transmission Owner Return on Equity Complaints -Note 14. Segments Of BusinessNote 15. Related PartiesItem 2. Management S Discussion and Analysis Of Financial Condition and Results Of OperationsItem 3. Quantitative and Qualitative Disclosures About Market RiskItem 4. Controls and ProceduresPart II. Other InformationItem 1. Legal ProceedingsItem 1A. Risk FactorsItem 2. Unregistered Sales Of Equity Securities and Use Of ProceedsItem 6. Exhibits