LANTHEUS HOLDINGS, INC.
10-Ks and 10-Qs
|
|
|
|
|
|
|
|
|
|
|
|
|
|
|
|
|
|
|
|
|
|
|
|
|
|
|
|
|
|
|
|
|
|
|
|
|
|
UNITED STATES
SECURITIES AND EXCHANGE COMMISSION
WASHINGTON, D.C. 20549
_______________________________________________________________
FORM 10-K
_______________________________________________________________
(Mark One)
|
þ
|
ANNUAL REPORT PURSUANT TO SECTION 13 OR 15(d) OF THE SECURITIES EXCHANGE ACT OF 1934
|
For the fiscal year ended
December 31, 2017
|
☐
|
TRANSITION REPORT PURSUANT TO SECTION 13 OR 15(d) OF THE SECURITIES EXCHANGE ACT OF 1934
|
Commission File Number 001-36569
_______________________________________________________________
|
LANTHEUS HOLDINGS, INC.
|
|
(Exact name of registrant as specified in its charter)
|
_______________________________________________________________
|
Delaware
|
35-2318913
|
|
|
(State or other jurisdiction of incorporation or organization)
|
(I.R.S. Employer Identification No.)
|
|
|
331 Treble Cove Road, North Billerica, MA
|
01862
|
|
|
(Address of principal executive offices)
|
(Zip Code)
|
|
Registrant’s telephone number, including area code:
(978) 671-8001
Securities registered pursuant to Section 12(b) of the Act:
|
Title of Each Class
|
Name of Each Exchange on Which Registered
|
|
|
Common Stock, $0.01 par value per share
|
NASDAQ Global Market
|
|
Securities registered pursuant to Section 12(g) of the Act:
None
_______________________________________________________________
Indicate by check mark if the registrant is a well-known seasoned issuer, as defined in Rule 405 of the Securities Act. Yes ☐ No
þ
Indicate by check mark if the registrant is not required to file reports pursuant to Section 13 or Section 15(d) of the Act. Yes ☐ No
þ
Indicate by check mark whether the registrant (1) has filed all reports required to be filed by Section 13 or 15(d) of the Securities Exchange Act of 1934 during the preceding 12 months (or for such shorter period that the registrant was required to file such reports), and (2) has been subject to such filing requirements for the past 90 days. Yes
þ
No ☐
Indicate by check mark whether the registrant has submitted electronically and posted on its corporate Web site, if any, every Interactive Data File required to be submitted and posted pursuant to Rule 405 of Regulation S-T (§ 232.405 of this chapter) during the preceding 12 months (or for such shorter period that the registrant was required to submit and post such files). Yes
þ
No ☐
Indicate by check mark if disclosure of delinquent filers pursuant to Item 405 of Regulation S-K is not contained herein, and will not be contained, to the best of registrant’s knowledge, in definitive proxy or information statements incorporated by reference in Part III of this form 10-K or any amendment to this Form 10-K
þ
Indicate by check mark whether the registrant is a large accelerated filer, an accelerated filer, a non-accelerated filer, or a smaller reporting company. See definitions of “large accelerated filer,” “accelerated filer,” “smaller reporting company,” and “emerging growth company” in Rule 12b-2 of the Exchange Act.
|
Large accelerated filer
|
☐
|
Accelerated filer
|
þ
|
|||
|
Non-accelerated filer
|
☐ (Do not check if a smaller reporting company)
|
Smaller reporting company
|
☐
|
|||
|
Emerging growth company
|
þ
|
|||||
If an emerging growth company, indicate by check mark if the registrant has elected not to use the extended transition period for complying with any new or revised financial accounting standards provided pursuant to Section 13(a) of the Exchange Act.
þ
Indicate by check mark whether the registrant is a shell company (as defined by Rule 12b-2 of the Act) Yes ☐ No
þ
The aggregate market value of the registrant’s common stock held by non-affiliates of the registrant on
June 30, 2017
was approximately
$541.6 million
based on the last reported sale price of the registrant’s common stock on the NASDAQ Global Market on
June 30, 2017
of
$17.65
per share.
As of
February 22, 2018
the registrant had
37,860,711
shares of common stock, $0.01 par value, issued and outstanding.
DOCUMENTS INCORPORATED BY REFERENCE
Listed hereunder are the documents, portions of which are incorporated by reference, and the parts of this Form 10-K into which such portions are incorporated:
The Registrant’s Definitive Proxy Statement for use in connection with the Annual Meeting of Stockholders to be held on
April 26, 2018
, portions of which are incorporated by reference into Parts II and III of this Form 10-K. The
2018
Proxy Statement will be filed with the Securities and Exchange Commission no later than 120 days after the close of our year ended
December 31, 2017
.
LANTHEUS HOLDINGS, INC.
ANNUAL REPORT ON FORM 10-K
TABLE OF CONTENTS
|
Page
|
||
CAUTIONARY NOTE REGARDING FORWARD-LOOKING STATEMENTS
Unless the context requires otherwise, references to “Lantheus,” “the Company,” “our company,” “we,” “us” and “our” refer to Lantheus Holdings, Inc. and, as the context requires, its direct and indirect subsidiaries, references to “Lantheus Holdings” refer to Lantheus Holdings, Inc. and references to “LMI” refer to Lantheus Medical Imaging, Inc., our wholly-owned subsidiary.
Some of the statements contained in this Annual Report on Form 10-K are forward-looking statements within the meaning of Section 27A of the Securities Act of 1933, as amended, and Section 21E of the Securities Exchange Act of 1934, as amended (the “Exchange Act”). These forward-looking statements, including, in particular, statements about our plans, strategies, prospects and industry estimates are subject to risks and uncertainties. These statements identify prospective information and include words such as “anticipates,” “intends,” “plans,” “seeks,” “believes,” “estimates,” “expects,” “should,” “could,” “predicts,” “hopes” and similar expressions. Examples of forward-looking statements include, but are not limited to, statements we make regarding: (i) our outlook and expectations including, without limitation, in connection with continued market expansion and penetration for our commercial products, particularly DEFINITY in the face of increased segment competition and potential generic competition as a result of future patent and regulatory exclusivity expirations; (ii) our outlook and expectations in connection with future performance of Xenon in the face of increased competition; and (iii) our outlook and expectations related to products manufactured at Jubilant HollisterStier (“JHS”) and global isotope supply. Forward-looking statements are based on our current expectations and assumptions regarding our business, the economy and other future conditions. Because forward-looking statements relate to the future, such statements are subject to inherent uncertainties, risks and changes in circumstances that are difficult to predict. Our actual results may differ materially from those contemplated by the forward-looking statements. Such statements are neither statements of historical fact nor guarantees or assurances of future performance. The matters referred to in the forward-looking statements contained in this Annual Report on Form 10-K may not in fact occur. We caution you therefore, against relying on any of these forward-looking statements. Important factors that could cause actual results to differ materially from those in the forward-looking statements include regional, national or global political, economic, business, competitive, market and regulatory conditions and the following:
|
•
|
Our ability to continue to grow the appropriate use of DEFINITY in suboptimal echocardiograms in the face of increased segment competition from other echocardiography contrast agents, including Optison from GE Healthcare Limited (“GE Healthcare”) and Lumason from Bracco Diagnostics Inc. (“Bracco”), and potential generic competition as a result of future patent and regulatory exclusivity expirations;
|
|
•
|
Risks associated with revenues and unit volumes for Xenon in pulmonary studies as a result of competition from Curium and potentially others;
|
|
•
|
Our dependence on key customers for our medical imaging products, and our ability to maintain and profitably renew our contracts with those key customers, including Cardinal Health (“Cardinal”), United Pharmacy Partners (“UPPI”), GE Healthcare and Jubilant Drax Image Radiopharmaceuticals (“JDI”) d/b/a Triad Isotopes, Inc. (“Triad”);
|
|
•
|
Our dependence upon third parties for the manufacture and supply of a substantial portion of our products, including DEFINITY at JHS;
|
|
•
|
Risks associated with the technology transfer programs to secure production of our products at additional contract manufacturer sites, including an alternative microbubble formulation at Samsung BioLogics (“SBL”) in South Korea;
|
|
•
|
The instability of the global Molybdenum-99 (“Moly”) supply, including recent regulatory issues at the NTP Radioisotopes (“NTP”) processing facility in South Africa, resulting in our inability to fill all of the demand for our TechneLite generators on certain manufacturing days;
|
|
•
|
Risks associated with our lead agent in development, flurpiridaz F 18, including:
|
|
◦
|
The ability of GE Healthcare to successfully complete the Phase 3 development program;
|
|
◦
|
The ability to obtain Food and Drug Administration (“FDA”) approval; and
|
|
◦
|
The ability to gain post-approval market acceptance and adequate reimbursement;
|
|
•
|
Risks associated with our two new internal clinical development programs - DEFINITY for an ejection fraction indication and LMI 1195 for heart failure patient risk stratification;
|
|
•
|
Risks associated with the manufacturing and distribution of our products and the regulatory requirements related thereto;
|
|
•
|
Risks associated with our investment in additional specialized manufacturing capabilities at our North Billerica, Massachusetts facility;
|
|
•
|
The dependence of certain of our customers upon third-party healthcare payors and the uncertainty of third-party coverage and reimbursement rates;
|
1
|
•
|
Uncertainties regarding the impact of ongoing U.S. healthcare reform proposals on our business, including related reimbursements for our current and potential future products;
|
|
•
|
Our being subject to extensive government regulation and our potential inability to comply with those regulations;
|
|
•
|
Potential liability associated with our marketing and sales practices;
|
|
•
|
The occurrence of any serious or unanticipated side effects with our products;
|
|
•
|
Our exposure to potential product liability claims and environmental liability;
|
|
•
|
The extensive costs, time and uncertainty associated with new product development, including further product development relying on external development partners or potentially developed internally;
|
|
•
|
Our inability to introduce new products and adapt to an evolving technology and diagnostic landscape;
|
|
•
|
Our inability to identify and in-license or acquire additional products to grow our business;
|
|
•
|
Our inability to protect our intellectual property and the risk of claims that we have infringed on the intellectual property of others;
|
|
•
|
Risks associated with prevailing economic or political conditions and events and financial, business and other factors beyond our control;
|
|
•
|
Risks associated with our international operations;
|
|
•
|
Our inability to adequately protect our facilities, equipment and technology infrastructure;
|
|
•
|
Our inability to hire or retain skilled employees and key personnel;
|
|
•
|
Our inability to utilize, or limitations in our ability to utilize, net operating loss carryforwards to reduce our future tax liability;
|
|
•
|
Risks related to our outstanding indebtedness and our ability to satisfy those obligations;
|
|
•
|
Costs and other risks associated with the Sarbanes-Oxley Act and the Dodd-Frank Act, including in connection with potentially becoming a large accelerated filer;
|
|
•
|
Risks related to the ownership of our common stock; and
|
|
•
|
Other factors that are described in Part I, Item 1A. “Risk Factors,” of this Annual Report on Form 10-K.
|
Factors that could cause or contribute to such differences include, but are not limited to, those that are discussed in other documents we file with the Securities and Exchange Commission (“SEC”). Any forward-looking statement made by us in this Annual Report on Form 10-K report speaks only as of the date on which it is made. Factors or events that could cause our actual results to differ may emerge from time to time, and it is not possible for us to predict all of them. We undertake no obligation to publicly update any forward-looking statement, whether as a result of new information, future developments or otherwise, except as may be required by law.
Trademarks
We own or have the rights to various trademarks, service marks and trade names, including, among others, the following: DEFINITY
®
, TechneLite
®
, Cardiolite
®
, Neurolite
®
, Vialmix
®
, Quadramet
®
(U.S. only), Luminity
®
, Miraluma
®
and Lantheus Medical Imaging
®
referred to in this Annual Report on Form 10-K. Solely for convenience, we refer to trademarks, service marks and trade names in this Annual Report on Form 10-K without the TM, SM and ® symbols. Those references are not intended to indicate, in any way, that we will not assert, to the fullest extent permitted under applicable law, our rights to our trademarks, service marks and trade names. Each trademark, trade name or service mark of any other company appearing in this Annual Report on Form 10-K, such as Lumason
®
, Myoview
®
, Optison
®
and SonoVue
®
are, to our knowledge, owned by that other company.
2
Overview
We are a global leader in the development, manufacture and commercialization of innovative diagnostic medical imaging agents and products that assist clinicians in the diagnosis and treatment of cardiovascular and other diseases. Clinicians use our imaging agents and products across a range of imaging modalities, including echocardiography and nuclear imaging. We believe that the resulting improved diagnostic information enables healthcare providers to better detect and characterize, or rule out, disease, potentially achieving improved patient outcomes, reducing patient risk and limiting overall costs for payers and the entire healthcare system. Our commercial products are used by cardiologists, nuclear physicians, radiologists, internal medicine physicians, technologists and sonographers working in a variety of clinical settings.
We sell our products globally and operate our business in two reportable segments, which are further described below:
|
•
|
U.S. Segment
produces and markets our medical imaging agents and products throughout the U.S. In the U.S., we primarily sell our products to radiopharmacies, integrated delivery networks, hospitals, clinics and group practices.
|
|
•
|
International Segment
operations consist of production and distribution activities in Puerto Rico and direct distribution activities in Canada. Additionally, within our International Segment, we have established and maintain third-party distribution relationships under which our products are marketed and sold in Europe, Canada, Australia, Asia-Pacific and Latin America.
|
During the year ended December 31, 2016, we sold certain business units that were part of our International Segment. In January 2016, we entered into an asset purchase agreement pursuant to which we sold substantially all of our Canadian radiopharmacy business and Gludef manufacturing and distribution business. In August 2016, we entered into a share purchase agreement pursuant to which we sold all of the stock of our Australian radiopharmacy servicing subsidiary. See Note
5
, “
Sales of Certain International Segment Assets
” included in the consolidated financial statements located elsewhere in this Annual Report on Form 10-K.
Our Product Portfolio
Our portfolio of nine commercial products is diversified across a range of imaging modalities. Our products include an ultrasound contrast agent and medical radiopharmaceuticals (including Technetium generators).
|
•
|
Ultrasound contrast agents are compounds that are used in diagnostic procedures, such as cardiac ultrasounds or echocardiograms, that are used by physicians to improve the clarity of the diagnostic image.
|
|
•
|
Medical radiopharmaceuticals are radioactive pharmaceuticals used by clinicians to perform nuclear imaging procedures.
|
|
•
|
In certain circumstances, a radioactive element, or radioisotope, is attached to a chemical compound to form the radiopharmaceutical. This act of attaching the radioisotope to the chemical compound is called radiolabeling, or labeling.
|
|
•
|
In other circumstances, a radioisotope can be used as a radiopharmaceutical without attaching any additional chemical compound.
|
|
•
|
Radioisotopes are most commonly manufactured in a nuclear research reactor, where a target is bombarded with subatomic particles, or in a cyclotron, which is a type of particle accelerator that also creates radioisotopes.
|
|
•
|
Two common forms of nuclear imaging procedures are single-photon emission computed tomography (“SPECT”) which measures gamma rays emitted by a SPECT radiopharmaceutical, and positron emission tomography (“PET”) which measures positrons emitted by a PET radiopharmaceutical.
|
As an example of the procedures in which our products may be used, in the diagnosis of cardiovascular disease, a typical diagnostic progression could include an electrocardiogram, followed by an echocardiogram (possibly using our agent DEFINITY), and then a nuclear myocardial perfusion imaging (“MPI”) study using either SPECT or PET imaging (possibly using our Technetium generator and our SPECT-based MPI agent). An MPI study assesses blood flow distribution to the heart. MPI is also used for diagnosing the presence of coronary artery disease.
DEFINITY and Our Microbubble Franchise Strategy
DEFINITY is the leading ultrasound contrast imaging agent based on revenue and usage in the U.S., and is indicated for use in patients with suboptimal echocardiograms. Numerous patient conditions can decrease the quality of images of the left ventricle, the primary pumping chamber of the heart.
3
There were approximately
33.1 million
echocardiograms performed in the U.S. in
2017
according to a third party source. Assuming
20%
of echocardiograms produce suboptimal images, as stated in the clinical literature, we estimate that approximately
6.6 million
echocardiograms in
2017
produced suboptimal images. The use of DEFINITY during echocardiography allows physicians to significantly improve their assessment of the function of the left ventricle.
DEFINITY is a clear, colorless, sterile liquid, which, upon activation in a Vialmix apparatus, a medical device specifically designed for DEFINITY, becomes a homogenous, opaque, milky white injectable suspension of perflutren-containing lipid microspheres. After activation and intravenous injection, DEFINITY improves the ultrasound delineation of the left ventricular endocardial border, or innermost layer of tissue that lines the chamber of the left ventricle. Better visualization of the left ventricle allows clinicians to make more informed decisions about disease status.
As part of our microbubble franchise strategy, we also plan to initiate two new clinical trials for DEFINITY in the second half of 2018. These trials will be designed to prove superior accuracy and improved reproducibility of DEFINITY-enhanced echocardiography over unenhanced echocardiography to measure left ventricular ejection fraction (“EF”). EF measures the percentage of blood leaving the left ventricle with each contraction and is an important measurement of heart function. If the trials are successful, we plan on filing a supplemental New Drug Application (“NDA”) in pursuit of an EF indication for DEFINITY, which, if approved, would provide us three years of regulatory exclusivity for DEFINITY in the EF indication. We believe that the EF indication, if granted, could drive further contrast penetration into and beyond the suboptimal echocardiography segment.
However, we can give no assurances that these clinical trials will be successful or that there will be an increase in unit sales of DEFINITY as a result of an EF indication.
DEFINITY offers flexible dosing and administration through an IV bolus or diluted bolus injection or continuous IV infusion. We believe DEFINITY’s synthetic lipid-cased coating gives the agent a distinct competitive advantage, because it provides a strong ultrasound signal and is the only perflutren-based echo contrast agent made without albumin. As a result, we believe DEFINITY will be a key driver of the future growth of our business, both in the U.S. and in international markets as we continue to grow contrast penetration through sales and marketing efforts focused on the appropriate use of contrast and maintain our leading position.
Since its launch in 2001, DEFINITY has been used in imaging procedures in more than
9.6 million
patients throughout the world. We estimate that DEFINITY had over
80%
share of the U.S. segment for contrast agents in echocardiography procedures as of December
2017
. DEFINITY currently competes with Optison, a GE Healthcare product, Lumason, a Bracco product (known as SonoVue outside the U.S.) as well as other non-echocardiography imaging modalities. DEFINITY, Optison and Lumason all carry an FDA-required boxed warning, which has been modified over time, to notify physicians and patients about potentially serious safety concerns or risks posed by the products. See Part I, Item 1A. “Risk Factors—
Ultrasound contrast agents may cause side effects which could limit our ability to sell DEFINITY
.”
DEFINITY is currently patent protected in the U.S. with an Orange Book-listed composition of matter patent expiring in
2019
, a manufacturing patent expiring in
2021
, a new Orange Book-listed method of use patent expiring in
2037
and an allowed manufacturing patent application that, when granted, will expire in
2037
. In addition, DEFINITY is protected in numerous foreign jurisdictions with patent or regulatory protection until
2019
. As part of our microbubble franchise strategy, we continue to actively pursue additional patents in connection with DEFINITY, alternative microbubble formulations, and related technology. DEFINITY generated revenues of
$157.3 million
,
$131.6 million
and
$111.9 million
for the years ended December 31,
2017
,
2016
and
2015
, respectively. DEFINITY represented approximately
48%
,
44%
and
38%
of our revenues in
2017
,
2016
and
2015
, respectively.
TechneLite
TechneLite is a self-contained system or generator of Technetium (“Tc99m”), a radioactive isotope with a six hour half-life, used by radiopharmacies to prepare various nuclear imaging agents. Technetium results from the radioactive decay of Moly itself a radioisotope with a 66-hour half-life produced in nuclear research reactors around the world from enriched uranium. The TechneLite generator is a little larger than a coffee can in size, and the self-contained system houses a vertical glass column at its core that contains Moly. During our manufacturing process, Moly is added to the column within the generator where it is adsorbed onto alumina powder. The column is sterilized, enclosed in a lead shield and further sealed in a cylindrical plastic container, which is then immediately shipped to our radiopharmacy customers. Because of the short half-lives of Moly and Technetium, radiopharmacies typically purchase TechneLite generators on a weekly basis pursuant to standing orders.
4
The Technetium produced by our TechneLite generator is the medical radioisotope that can be attached to a number of imaging agents, including our own Cardiolite products and Neurolite, during the radiolabeling process. To radiolabel a Technetium-based radiopharmaceutical, a vial of sterile saline and a vacuum vial are each affixed to the top of a TechneLite generator. The sterile saline is pulled through the generator where it attracts Technetium resulting from the radioactive decay of Moly within the generator column. The Technetium-containing radioactive saline is then pulled into the vacuum vial and subsequently combined by a radiopharmacist with the applicable imaging agent, and individual patient-specific radiolabeled imaging agent doses are then prepared. When administered, the imaging agent binds to specific tissues or organs for a period of time, enabling the Technetium to illustrate the functional health of the imaged tissues or organs in a diagnostic image. Our ability to produce and market TechneLite is highly dependent on our supply of Moly. See “Raw Materials and Supply Relationships—Molybdenum-99” below.
TechneLite is produced in
13
sizes and is currently marketed primarily in North America and Latin America, largely to radiopharmacies that prepare unit doses of radiopharmaceutical imaging agents and ship these preparations directly to hospitals for administration to patients. In the U.S., we have supply contracts with the significant radiopharmacy groups, including Cardinal, UPPI, GE Healthcare and Triad. We also supply generators on a purchase order basis to other customers. We estimate that TechneLite had over
40%
share of the U.S. generator market as of
December 31, 2017
, competing primarily with Technetium-based generators produced by Curium. In Puerto Rico, we also supply TechneLite to our wholly-owned radiopharmacy to prepare radiopharmaceutical imaging agent unit doses.
In Canada, where we sold our radiopharmacies in January 2016, we have a supply agreement with Isologic Innovative Radiopharmaceuticals Ltd. (“Isologic”), the buyer of those radiopharmacies (the “Isologic Supply Agreement”). Under the Isologic Supply Agreement, we supply Isologic with certain of our products on commercial terms, including certain product purchase commitments by Isologic. The agreement expires in January 2021 and may be terminated upon the occurrence of specified events, including a material breach by the other party, bankruptcy by either party or certain force majeure events. In Australia, where we sold our radiopharmacy servicing business in August 2016, we have a supply agreement with Global Medical Solutions (“GMS”), the buyer of that business (the “GMS Supply Agreement”). Under the GMS Supply Agreement, we supply GMS with certain of our products on commercial terms, including certain minimum product purchase commitments by GMS. The agreement expires in August 2020 and may be terminated in whole or in part on a product-by-product basis upon the occurrence of specified events, including a material breach by the other party, bankruptcy by either party or certain force majeure events.
The Moly used in our TechneLite generators can be produced using targets made of either highly-enriched uranium (“HEU”) or low-enriched uranium (“LEU”). LEU consists of uranium that contains less than 20% of the uranium-235 isotope. HEU is often considered weapons grade material, with 20% or more of uranium-235. The American Medical Isotopes Production Act of 2012 (“AMIPA”) encourages the domestic production of LEU Moly and provides for the eventual prohibition of the export of HEU from the U.S. Although Medicare generally does not provide separate payment to hospitals for the use of diagnostic radiopharmaceuticals administered in an outpatient setting, since 2013, the Centers for Medicare and Medicaid Services (“CMS”), the federal agency responsible for administering the Medicare program, has provided an add-on payment under the hospital outpatient prospective payment system for every Technetium diagnostic dose produced from non-HEU sourced Moly, to cover the marginal cost for radioisotopes produced from non-HEU sources. Our LEU TechneLite generator satisfies the reimbursement requirements under the applicable CMS rules.
TechneLite has patent protection in the U.S. and various foreign countries on certain component technology currently expiring in
2029
. In addition, given the significant know-how and trade secrets associated with the methods of manufacturing and assembling the TechneLite generator, we believe we have a substantial amount of valuable and defensible proprietary intellectual property associated with the product. We believe that our substantial capital investments in our highly automated TechneLite production line and our extensive experience in complying with the stringent regulatory requirements for the handling of nuclear materials create significant and sustainable competitive advantages for us in generator manufacturing and distribution. TechneLite generated revenues of
$104.6 million
,
$99.2 million
and
$72.6 million
for the years ended December 31,
2017
,
2016
and
2015
, respectively. TechneLite represented approximately
32%
,
33%
and
25%
of our revenues in
2017
,
2016
and
2015
, respectively.
Xenon
Xenon Xe 133 Gas (“Xenon”) is a radiopharmaceutical gas that is inhaled and used to assess pulmonary function and also to image cerebral blood flow. Our Xenon is manufactured by a third party as a bi-product of Moly production and is processed and finished by us. We are currently the leading provider of Xenon in the U.S. During the years ended
December 31,
2017
,
2016
and
2015
,
Xenon represented approximately
10%
,
10%
and
17%
of our revenues, respectively.
5
Other Commercial Products
In addition to the products listed above, our portfolio of commercial products also includes important imaging agents in specific segments, which provide a stable base of recurring revenue. Most of these products have a favorable industry position as a result of our substantial infrastructure investment, specialized workforce, technical know-how and supplier and customer relationships.
|
•
|
Neurolite
is an injectable, Technetium-labeled imaging agent used with SPECT technology to identify the area within the brain where blood flow has been blocked or reduced due to stroke. We launched Neurolite in 1995.
|
|
•
|
Cardiolite
, also known by its generic name sestamibi, is an injectable, Technetium-labeled imaging agent used in MPI procedures to assess blood flow to the muscle of the heart using SPECT. Cardiolite was approved by the FDA in 1990 and its market exclusivity expired in July 2008. Included in Cardiolite revenues are branded Cardiolite and generic sestamibi revenues.
|
|
•
|
Thallium TI 201
is an injectable radiopharmaceutical imaging agent used in MPI studies to detect cardiovascular disease. We have marketed Thallium since 1977 and manufacture the agent using cyclotron technology.
|
|
•
|
FDG
is an injectable, fluorine-18-radiolabeled imaging agent used with PET technology to identify and characterize tumors in patients undergoing oncologic diagnostic procedures. We manufacture and distribute FDG from our Puerto Rico radiopharmacy.
|
|
•
|
Gallium (Ga 67)
is an injectable radiopharmaceutical imaging agent used to detect certain infections and cancerous tumors, especially lymphoma. We manufacture Gallium using cyclotron technology.
|
|
•
|
Quadramet
, our only therapeutic product, is an injectable radiopharmaceutical used to treat severe bone pain associated with metastatic bone lesions. We serve as the direct manufacturer and supplier of Quadramet in the U.S.
|
For consolidated revenues and other consolidated financial information for our U.S. and International Segments, see Note
17
, “
Segment Informatio
n
” to our accompanying consolidated financial statements.
Distribution, Marketing and Sales
The following table sets forth certain key market information for each of our commercial products:
|
Product
|
Currently Marketed
|
Regulatory Approval,
but Not Currently Marketed |
|
DEFINITY
|
United States, Canada, Australia, South Korea, New Zealand, United Kingdom, Netherlands, Germany, Austria, Taiwan
|
Europe
(1)
, Israel, India, Singapore, Mexico
|
|
TechneLite
|
United States, Canada, Colombia,
Costa Rica, Taiwan, Australia, Panama, Dominican Republic, New Zealand, Venezuela, South Korea |
None
|
|
Xenon
|
United States
|
Canada
|
|
Cardiolite
|
United States, Canada, Cost Rica, Israel, Japan,
South Korea, Taiwan, Australia |
Thailand, New Zealand, Hong Kong, Panama, Philippines
|
|
Neurolite
|
United States, Canada, Costa Rica, Japan,
Hong Kong, Australia, Taiwan, Europe (2) , South Korea |
Thailand, Philippines, New Zealand, Austria, Czech Republic, Denmark, Finland, Norway, Sweden
|
|
Thallium Tl 201
|
United States, Canada, Australia,
South Korea, Pakistan, Panama, Taiwan, Colombia |
New Zealand
|
|
Gallium Ga 67
|
United States, Canada, Colombia, Australia, South Korea, Panama, Taiwan
|
Costa Rica, Mexico, New Zealand, Pakistan
|
|
FDG
|
Puerto Rico
|
None
|
|
Quadramet
|
United States
|
None
|
________________________________
|
(1)
|
Other than the United Kingdom, Netherlands, Germany and Austria.
|
|
(2)
|
Excluding Austria, Czech Republic, Denmark, Finland, Norway and Sweden.
|
In the U.S. and Canada, we have a sales team of approximately
80
employees that call on healthcare providers in the echocardiography space, as well as radiopharmacy chains, group purchasing organizations and integrated delivery networks.
6
Our radiopharmaceutical products are sold in the U.S. through a subset of our sales team, primarily to radiopharmacies. We sell a majority of our radiopharmaceutical products in the U.S. to four radiopharmacy groups—namely Cardinal, UPPI, GE Healthcare and Triad. Our contractual distribution and other arrangements with these radiopharmacy groups are as follows:
|
•
|
Cardinal maintains approximately
130
radiopharmacies that are typically located in large, densely populated urban areas in the U.S. We estimate that Cardinal’s radiopharmacies distributed approximately
40%
of the aggregate U.S. SPECT doses sold in the first half of
2017
(the latest information currently available to us). Our written supply agreement with Cardinal relating to TechneLite, Xenon, Neurolite and other products expires on
December 31, 2018
. The agreement specifies pricing levels and requirements to purchase minimum percentages of certain products during certain periods. The agreement may be terminated upon the occurrence of specified events, including a material breach by the other party and certain force majeure events.
|
|
•
|
UPPI is a cooperative purchasing group (roughly analogous to a group purchasing organization) of approximately
75
independently owned or smaller chain radiopharmacies located in the U.S. UPPI’s radiopharmacies are typically broadly dispersed geographically, with some urban presence and a substantial number of radiopharmacies located in suburban and rural areas of the country. We estimate that these independent radiopharmacies, together with approximately
30
unaffiliated, independent radiopharmacies, distributed approximately
29%
of the aggregate U.S. SPECT doses sold in the first half of
2017
. We currently have an agreement with UPPI for the distribution of TechneLite, Xenon and certain other products to radiopharmacies or families of radiopharmacies within the UPPI cooperative purchasing group. The agreement contains specified pricing levels based upon specified purchase amounts for UPPI. We are entitled to terminate the UPPI agreement upon 60 days written notice. The UPPI agreement expires on
December 31, 2019
.
|
|
•
|
GE Healthcare maintains approximately
30
radiopharmacies in the U.S. that purchase our TechneLite generators. We estimate that GE Healthcare distributed approximately
18%
of the aggregate U.S. SPECT doses sold in the first half of
2017
. We currently have an agreement with GE Healthcare for the distribution of TechneLite, Xenon and other products. The agreement provides that GE Healthcare will purchase a minimum percentage of TechneLite generators as well as certain other products from us. Our agreement, which expires on
December 31, 2020
, may be terminated by either party upon the occurrence of specified events including a material breach by either party, bankruptcy by either party, certain irresolvable regulatory changes or economic circumstances, or force majeure events.
|
|
•
|
Triad maintains approximately
55
radiopharmacies in the U.S. that purchase a range of our products. We estimate that Triad distributed approximately
10%
of the aggregate U.S. SPECT doses sold in the first half of
2017
. We currently have an agreement with Triad for the distribution of TechneLite, Xenon, Neurolite and other products. The agreement specifies pricing levels and percentage purchase requirements. The agreement will expire on
December 31, 2020
and may be terminated upon the occurrence of specified events, including a material breach by the other party and certain force majeure events.
|
In addition to the distribution arrangements for our radiopharmaceutical products described above, we also sell certain of our radiopharmaceutical products to independent radiopharmacies and directly to hospitals and clinics that maintain in-house radiopharmaceutical capabilities and operations. In the latter case, this represents a small percentage of overall sales because the majority of hospitals and clinics do not maintain these in-house capabilities.
In Puerto Rico, we own and operate one of the two radiopharmacies on the island, where we sell our own products as well as products of third parties to end-users.
In Europe, Australia, Asia-Pacific and Latin America, we utilize third party distributor relationships to market, sell and distribute our products, either on a country-by-country basis or on a multi-country regional basis.
In March 2012, we entered into a development and distribution arrangement for DEFINITY in China, Hong Kong and Macau with Double-Crane Pharmaceutical Company (“Double-Crane”). With Double-Crane’s support, we are currently pursuing the Chinese regulatory approval required to commercialize DEFINITY.
In July 2013, we submitted a clinical trial application to the Chinese Food and Drug Administration (“CFDA”) seeking an Import Drug License. After a very extensive waiting period caused by a large number of drugs seeking CFDA regulatory approval, in February 2016, the CFDA approved our clinical trial application. Double-Crane is now conducting on our behalf three confirmatory clinical trials in pursuit of cardiac, liver and kidney imaging indications, as well as one small pharmacokinetic study. If the clinical trials are successful, we currently estimate submitting an application for an Import Drug License to the CFDA in the second half of 2018 for subsequent approval.
We believe that international markets, particularly China, represent significant growth opportunities for our products. The Double-Crane distribution agreement did not have a meaningful impact on our revenues during the years ended
December 31, 2017
,
2016
and
2015
.
7
Seasonality
Our business has modest seasonality as patients may seek to schedule non-urgent diagnostic imaging procedures less frequently during the summer vacation months and over the year-end holidays.
Customers
Customers accounting for 10% or more of our consolidated revenues are as follows:
|
Year Ended
December 31,
|
|||||
|
2017
|
2016
|
2015
|
|||
|
Cardinal
|
12.0%
|
10.3%
|
11.3%
|
||
|
UPPI Radiopharmacies
|
10.4%
|
11.4%
|
11.9%
|
||
|
GE Healthcare
|
10.3%
|
***
|
***
|
||
________________________________
*** Amount represented less than 10% for the reporting period.
Backlog
Our backlog consists of orders for which a delivery schedule within the next twelve months has been specified. Orders included in backlog may be canceled or rescheduled by customers at any time with the exception of TechneLite orders. For TechneLite, customers must provide us with four weeks advanced notice to cancel an order. We do not believe that our backlog at any particular time is meaningful because it has historically been immaterial relative to our consolidated revenues and is not necessarily indicative of future revenues for any given period.
Competition
We believe that our key product characteristics, such as proven efficacy, reliability and safety, coupled with our core competencies, such as our efficient manufacturing processes, our established distribution network, our experienced field sales organization and our customer service focus, are important factors that distinguish us from our competitors.
The market for diagnostic medical imaging agents is highly competitive and continually evolving. Our principal competitors in existing diagnostic modalities include large, global companies that are more diversified than we are and that have substantial financial, manufacturing, sales and marketing, distribution and other resources. These competitors currently include Curium, GE Healthcare, Bracco and JDI, an affiliate of JHS, as well as other competitors, including NorthStar Medical Radioisotopes. We cannot anticipate their competitive actions in the same or competing diagnostic modalities, such as significant price reductions on products that are comparable to our own, development of new products that are more cost-effective or have superior performance than our current products or the introduction of generic versions after our proprietary products lose their current patent protection. In addition, distributors of our products could attempt to shift end-users to competing diagnostic modalities and products, or bundle the sale of a portfolio of products to the detriment of our specific products. Our current or future products could be rendered obsolete or uneconomical as a result of these activities.
Raw Materials and Supply Relationships
We rely on certain raw materials and supplies to produce our products. Due to the specialized nature of our products and the limited, and sometimes intermittent, supply of raw materials available in the market, we have established relationships with several key suppliers. For the year ended
December 31, 2017
, our largest suppliers of raw materials and supplies were NTP, acting for itself and on behalf of its subcontractor ANSTO,
and Institute for Radioelements (“IRE”)
, which, in the aggregate, accounted for approximately
32%
of our total purchases.
Molybdenum-99
Our TechneLite, Cardiolite and Neurolite products all rely on Moly, the radioisotope which is produced by bombarding uranium with neutrons in research reactors. With a 66-hour half-life, Moly decays into, among other things, Technetium-99m (Tc-99m), another radioisotope with a half-life of six hours. Tc-99m is the isotope that is attached to radiopharmaceuticals, including our own Cardiolite and Neurolite, during the labeling process and is the most common radioisotope used for medical diagnostic imaging purposes.
We currently purchase finished Moly from three of the four main processing sites in the world, namely, NTP in South Africa; ANSTO in Australia; and IRE in Belgium. These processing sites provide us Moly from five of the six main Moly-producing reactors in the world, namely, SAFARI in South Africa; OPAL in Australia; BR2 in Belgium; LVR-15 in the Czech Republic; and High Flux Reactor (“HFR”) in The Netherlands.
8
Historically, our largest supplier of Moly was Nordion, which relied on the National Research Universal (“NRU”) reactor in Canada for its supply of Moly. As a result of a decision by the Government of Canada, the NRU reactor exited the medical isotope business in November 2016.
Our agreement with NTP (the “NTP Agreement”), with NTP acting for itself and on behalf of its subcontractor ANSTO, specifies LMI’s percentage purchase requirements and unit pricing, and provides for the supply of Moly derived from LEU targets from NTP and ANSTO. ANSTO significantly increased its Moly production capacity from its existing facility in August 2016 and has a new Moly processing facility under construction, in cooperation with NTP, that ANSTO believes will expand its production capacity up to approximately 3,500 six-day Curies/week, which is expected to be in commercial operation in the second half of 2018. The NTP Agreement allows for termination upon the occurrence of certain events, including failure by NTP to provide our required amount of Moly, material breach of any provision by either party, bankruptcy by either party or force majeure events. The NTP Agreement expires on
December 31, 2020
.
Similar to the NTP Agreement, our agreement with IRE (the “IRE Agreement”) contains minimum percentage volume requirements and unit pricing. The IRE Agreement also requires IRE to provide certain favorable allocations of Moly during periods of supply shortage or failure. The IRE Agreement also provides for an increased supply of Moly derived from LEU targets upon IRE’s completion of its ongoing conversion program to modify its facilities and processes in accordance with Belgian nuclear security commitments. The IRE Agreement allows for termination upon the occurrence of certain events, including failure by IRE to provide our required amount of Moly, material breach of any provision by either party, bankruptcy by either party or force majeure events. The IRE Agreement expires on
December 31, 2018
, and is renewable by LMI on a year-to-year basis thereafter.
In 2016, IRE received approval from its regulator to expand its production capability by up to 50% of its former capacity. The combined ANSTO and IRE production capacity is expected to replace the NRU’s historical routine production levels.
To further augment and diversify our current supply, we are pursuing additional sources of Moly from potential new producers around the world that seek to produce Moly with existing or new reactors or technologies. For example, in November 2014, we entered into a strategic agreement with SHINE Medical Technologies, Inc. (“SHINE”), a Wisconsin-based company, for the future supply of Moly. Under the terms of the supply agreement, SHINE will provide Moly produced using its proprietary LEU-solution technology for use in our TechneLite generators once SHINE’s facility becomes operational and receives all necessary regulatory approvals, which SHINE now estimates will occur in 2020. See Part I, Item 1A. “Risk Factors—
The global supply of Moly is fragile and not stable. Our dependence on a limited number of third party suppliers for Moly could prevent us from delivering some of our products to our customers in the required quantities, within the required timeframe, or at all, which could result in order cancellations and decreased revenues
.”
Xenon
Xenon is a by-product of the Moly production process. Historically, Nordion was our sole supplier and captured Xenon from the NRU reactor. As a result of a decision by the Government of Canada, the NRU reactor exited the medical isotope business in November 2016. In January 2015, we entered into a strategic agreement with IRE for the future supply of Xenon. We now receive bulk unprocessed Xenon from IRE, which we process and finish for our customers at our North Billerica, Massachusetts manufacturing facility. Until we can qualify an additional source of bulk unprocessed Xenon, we will rely on IRE as a sole source provider. See Part I, Item 1A. “Risk Factors—
Our dependence upon third parties for the manufacture and supply of a substantial portion of our products could prevent us from delivering our products to our customers in the required quantities, within the required timeframes, or at all, which could result in order cancellations and decreased revenues
.”
Other Materials
We have additional supply arrangements for active pharmaceutical ingredients, excipients, packaging materials and other materials and components, none of which are exclusive, but a number of which are sole source, and all of which we currently believe are either in good standing or replaceable without any material disruption to our business.
9
Manufacturing
We maintain manufacturing operations at our North Billerica, Massachusetts facility. We manufacture TechneLite on a highly automated production line and Thallium and Gallium using our cyclotron technology, and we process and finish Xenon and Quadramet using our hot cell infrastructure. We also maintain manufacturing operations at our San Juan, Puerto Rico radiopharmacy and PET manufacturing facility where we manufacture FDG using cyclotron technology. We manufacture, finish and distribute our radiopharmaceutical products on a just-in-time basis, and supply our customers with these products either by next day delivery services or by either ground or air custom logistics. We believe that our substantial capital investments in our highly automated generator production line, our cyclotrons and our extensive experience in complying with the stringent regulatory requirements for the handling of nuclear materials and operations in the FDA regulated environment create significant and sustainable competitive advantages for us.
In addition to our in-house manufacturing capabilities, a substantial portion of our products are manufactured by third party contract manufacturing organizations, and in certain instances, we rely on them for sole source manufacturing. To ensure the quality of the products that are manufactured by third parties, the key raw materials used in those products are first sent to our North Billerica, Massachusetts facility, where we test them prior to the third party manufacturing of the final product. After the final products are manufactured, they are sent back to us for final quality control testing and then we ship them to our customers. We have expertise in the design, development and validation of complex manufacturing systems and processes, and our strong execution and quality control culture supports the just-in-time manufacturing model at our North Billerica, Massachusetts facility.
Manufacturing and Supply Arrangements
We currently have the following technology transfer and manufacturing and supply agreements in place for some of our major products:
|
•
|
DEFINITY
—In February 2012, we entered into a Manufacturing and Supply Agreement with JHS, for the manufacture of DEFINITY. Under the agreement, JHS manufactured DEFINITY for us for an initial term of five years. In September 2016, we extended the agreement through January 2022. The agreement contains automatic renewals for additional one-year periods thereafter. The agreement allows for termination upon the occurrence of certain events such as a material breach or default by either party, or bankruptcy by either party. The agreement also requires us to place orders for a minimum percentage of our requirements for DEFINITY with JHS. Based on our current projections, we believe that we will have sufficient supply of DEFINITY from JHS to meet expected demand.
|
On May 3, 2016, we entered into a Manufacturing and Supply Agreement with SBL to perform technology transfer and process development services to manufacture and supply an alternative microbubble formulation. There are no minimum purchase requirements under this agreement, which has an initial term of five years from the date of first commercial sale and is renewable at our option for an additional five years. This agreement allows for termination upon the occurrence of certain events, including material breach or bankruptcy of either party. We cannot give any assurances as to when those technology transfer activities will be completed and when we will begin to receive supply of an alternative microbubble formulation from SBL.
|
•
|
Cardiolite
—In May 2012, we entered into a Manufacturing and Supply Agreement with JHS for the manufacture of Cardiolite products. In the third quarter of 2016, we completed the technology transfer process and received FDA approval to manufacture Cardiolite at JHS. Under the agreement, JHS has agreed to manufacture products for an initial term of five years from the effective date. On November 9, 2017, we extended the term until December 31, 2020, and the agreement can be further extended for three additional one-year periods thereafter so long as the parties, using good faith, reasonable efforts, agree to new pricing for the upcoming additional term. The agreement allows for termination upon the occurrence of specified events, including material breach or bankruptcy by either party. The agreement requires us to place orders for 100% of our requirements for Cardiolite products with JHS during such term. Based on our current projections, we believe that we will have sufficient supply of Cardiolite products from JHS to meet expected demand.
|
|
•
|
Neurolite
—In May 2012, we entered into a Manufacturing and Supply Agreement with JHS for the manufacture of Neurolite, and in January 2015, the FDA granted approval to manufacture Neurolite at JHS. Under the agreement, JHS agreed to manufacture Neurolite for an initial term of five years from the effective date. On November 9, 2017, we extended the term of the agreement until December 31, 2020, and the agreement can be further extended for three additional one-year periods thereafter so long as the parties, using good faith, reasonable efforts, agree to new pricing for the upcoming additional term. The agreement allows for termination upon the occurrence of specified events, including material breach or bankruptcy by either party. The agreement also requires us to place orders for 100% of our requirements for Neurolite during such term. Based on our current projections, we believe that we will have sufficient supply of Neurolite from JHS to meet expected demand.
|
10
Although we are pursuing additional third party manufacturing relationships to establish and secure additional long-term or alternative suppliers as described above, we are uncertain of the timing as to when these arrangements could provide meaningful quantities of our products.
We have also commenced an extensive, multi-year effort to add specialized manufacturing capabilities at our North Billerica, Massachusetts facility. This project is part of a larger corporate growth strategy to create a competitive advantage in specialized manufacturing.
This project should not only deliver cost savings and supply chain redundancy for our current portfolio but also should afford us increased flexibility as we consider external opportunities. However, we
can give no assurance that we will be successful in these efforts or that we will be able to successfully manufacture any additional commercial products at our North Billerica, Massachusetts facility. See Part I, Item 1A. “Risk Factors—
Our dependence upon third parties for the manufacture and supply of a substantial portion of our products could prevent us from delivering our products to our customers in the required quantities, within the required timeframes, or at all, which could result in order cancellations and decreased revenues
,” Part I, Item 1A. “Risk Factors—
Challenges with product quality or product performance, including defects, caused by us or our suppliers could result in a decrease in customers and revenues, unexpected expenses and loss of market share
,” and Part I, Item 1A. “Risk Factors—
Our business and industry are subject to complex and costly regulations. If government regulations are interpreted or enforced in a manner adverse to us or our business, we may be subject to enforcement actions, penalties, exclusion and other material limitations on our operations
.”
Campus Strategy
We continually evaluate our extensive physical assets on our North Billerica, Massachusetts campus to optimize the carrying costs and use of these assets. In 2013, we sold approximately 100 acres of undeveloped land that we owned behind our manufacturing facilities. In February 2018, we sold an additional approximately six-acre parcel of undeveloped land adjacent to our manufacturing facilities and certain of our administrative offices. Later in 2018, we plan to raze an uneconomical and underutilized building on our North Billerica, Massachusetts campus. To house our proposed new, specialized manufacturing capabilities, we plan to retrofit a currently underutilized manufacturing and storage building.
Research and Development
For the years ended
December 31, 2017
,
2016
and
2015
, we invested
$18.1 million
,
$12.2 million
and
$14.4 million
in research and development (“R&D”), respectively. Our R&D team includes our Medical Affairs and Medical Information functions, which educate physicians on the scientific aspects of our commercial products and the approved indications, labeling and the receipt of reports relating to product quality or adverse events. We have developed a pipeline of three potential cardiovascular imaging agents which were discovered and developed in-house and which are protected by patents and patent applications we own in the U.S. and numerous foreign jurisdictions. See Part I, Item 1A. “Risk Factors—
The process of developing new drugs and obtaining regulatory approval is complex, time-consuming and costly, and the outcome is not certain
.”
DEFINITY - New Clinical Trials for Additional Indication - EF
As part of our microbubble franchise strategy, we plan to initiate two new clinical trials for DEFINITY in echocardiography in the second half of 2018. These trials will be designed to prove superior accuracy and improved reproducibility of DEFINITY contrast enhanced echocardiography over unenhanced echocardiography to measure left ventricular EF in a broad population not limited to suboptimal echocardiograms.
EF measures the percentage of blood leaving the left ventricle with each contraction and is an important measurement of heart function. EF may decrease if there is weakness in the heart muscle as a result of a heart attack, a genetic predisposition, heart valve or other disease, or long-standing, uncontrolled hypertension. We believe that accurate EF measurements are critical to clinical decision-making and patient management in a number of contexts, including monitoring patients treated with cardiotoxin drugs (for example, certain chemotherapeutic regimens) and considering whether to recommend an implantable cardiac defibrillator (“ICD”) or a cardiac resynchronization therapy device. Although unenhanced echocardiography is the most frequently used modality to determine EF in clinical practice, it has been hampered by its poor accuracy and reproducibility. We believe that DEFINITY-enhanced echocardiography could produce EF measurements that are superior to unenhanced echocardiography, potentially providing a clinician greater confidence in diagnosing and treating patients.
We currently anticipate that a total of approximately 300 patients will be enrolled in these clinical trials and that the truth standard for these trials will be cardiac magnetic resonance imaging. We intend to seek a special protocol assessment (“SPA”) for these trials from the FDA. If the trials are successful, we plan on filing a supplemental NDA in pursuit of an EF indication for DEFINITY, which, if approved, would provide us three years of regulatory exclusivity for DEFINITY in the EF indication. We believe that the EF indication, if granted, could drive further contrast penetration in a broader echocardiogram segment. However, we can give no assurances that these clinical trials will be successful or that there will be an increase in unit sales of DEFINITY as a result of an EF indication.
11
Flurpiridaz F 18—PET Myocardial Perfusion
We have developed flurpiridaz F 18, an internally discovered small molecule radiolabeled with fluorine-18, as an imaging agent used in PET MPI to assess blood flow to the heart.
Today, most MPI procedures use SPECT technology. Although SPECT imaging used in conjunction with a radiopharmaceutical imaging agent, such as Cardiolite, is most commonly used for MPI studies, PET imaging has gained considerable support in the field of cardiovascular imaging as it offers many advantages to SPECT imaging, including: higher image quality, increased diagnostic certainty, more accurate risk stratification and reduced patient radiation exposure
. PET imaging has demonstrated broad utility for diagnosis, prognosis, disease staging and therapeutic response. When used in combination with an appropriate radiopharmaceutical imaging agent, PET imaging can provide important insights into physiologic and metabolic processes in the body and be useful in evaluating a variety of conditions including heart disease, neurological disease and cancer. In addition, PET MPI imaging could be particularly useful in difficult-to-image patients, including women and obese patients. The use of PET technology in MPI tests represents a broad emerging application for a technology more commonly associated with oncology and neurology. We anticipate that the adoption of PET technology in MPI tests will increase significantly in the future.
Flurpiridaz F 18 Clinical Overview and Phase 3 Program
We submitted an Investigational New Drug Application (“IND”) for flurpiridaz F 18 to the FDA in August 2006. Our clinical program to date has consisted of three Phase 1 studies, a Phase 2 clinical trial, conducted from 2007 to 2010, involving 176 subjects who received PET MPI performed with flurpiridaz F 18 and completed the trial, and a Phase 3 clinical trial (“301 Trial”) conducted from 2011 to 2013.
The 301 Trial was an open-label, multicenter, international study with 755 subjects with known or suspected coronary artery disease (“CAD”) and scheduled for coronary angiography and SPECT imaging who completed the trial and were included in the efficacy analysis. Subjects underwent flurpiridaz F 18 PET MPI and SPECT MPI studies with coronary angiography used as the truth standard for each. The study then compared MPI imaging using flurpiridaz F 18 versus SPECT imaging with primary endpoints of superiority for sensitivity (identifying disease) and non-inferiority for specificity (ruling out disease).
In the fourth quarter of 2013, we announced preliminary results from the 301 Trial, and in May 2015, after a re-read of the 301 Trial results, we announced the complete results from the 301 Trial. Flurpiridaz F 18 appeared to be well-tolerated from a safety perspective, and PET MPI with flurpiridaz F 18 consistently showed a balanced performance in sensitivity and specificity, when compared to coronary angiography, while SPECT imaging results were skewed with low sensitivity and high specificity when compared to coronary angiography. When results were compared to one another, flurpiridaz F 18 imaging substantially outperformed SPECT imaging in sensitivity but did not meet the non-inferiority endpoint in specificity, implying a substantial and unexpected under-diagnosis of CAD with SPECT imaging in the trial.
In subgroup analyses, the risk-benefit profile of flurpiridaz F 18 appeared to be favorable in women, obese patients, patients with multi-vessel disease and diabetics. A significantly higher percentage of images were rated as either excellent or good with flurpiridaz F 18 imaging as compared to SPECT imaging, leading to a greater diagnostic certainty of interpretation. Importantly, radiation exposure associated with flurpiridaz F 18 imaging was reduced to approximately 50% of SPECT imaging. In addition, no drug-related serious adverse events were observed.
GE Healthcare Collaboration
In April 2017, we announced that we entered into a definitive, exclusive Collaboration and License Agreement (the “License Agreement”) with GE Healthcare for the continued Phase 3 development and worldwide commercialization of flurpiridaz F 18. Under the License Agreement, GE Healthcare will complete the worldwide development of flurpiridaz F 18, pursue worldwide regulatory approvals and, if successful, lead a worldwide launch and commercialization of the agent, with us collaborating on both development and commercialization through a joint steering committee.
For the second Phase 3 clinical trial for flurpiridaz F 18, technology transfer and preparatory activities, including discussions with Regulatory Authorities, have been completed. We expect patient recruitment for the second Phase 3 trial to begin in the first half of 2018. The prospective, open-label, international, multi-center trial of flurpiridaz F 18 for PET MPI in patients referred for invasive coronary angiography because of suspected coronary artery disease (“CAD”) will enroll up to 650 participants, with a target completion date in the second half of 2020. The primary outcome measure for the trial is the diagnostic efficacy of flurpiridaz F 18 PET MPI in the detection of significant CAD, with secondary outcome measures of diagnostic efficacy of flurpiridaz F 18 PET MPI compared with SPECT MPI in the detection of CAD in all patients. Secondary analysis will be performed in patients of special clinical interest, such as female, obese and diabetic patients, where current SPECT MPI technologies have shown certain limitations in the diagnostic performance.
12
LMI 1195—Cardiac Neuronal Imaging Agent
We have developed LMI 1195, an internally discovered small molecule that we believe may be a first-in-class fluorine-18-based PET radiopharmaceutical imaging agent designed to assess cardiac sympathetic nerve function. We believe LMI 1195 could become a useful tool in the diagnostic assessment of ischemic heart failure patients who may be at risk of sudden cardiac death.
Heart
failure (“HF”) is a major public health challenge because of high morbidity and mortality, frequent hospitalizations, and its financial burden on the community. Heart failure affects 6.5 million people in the U.S. today, and approximately 2 million patients may be eligible for evaluation for ICD implantation. The cost of HF continues to rise, placing financial burden on the U.S. economy and healthcare system. Overall HF costs were estimated to be approximately $31 billion in 2012. ICDs have been show to effectively reduce mortality rates.
HF
is associated with changes in the cardiac sympathetic nerve function. These changes appear early in the development of HF. The cardiac neuronal norepinephrine transporter (“NET”) has been shown to be a useful target for the non-invasive monitoring of the cardiac sympathetic status and the assessment of the likelihood of an HF patient to develop fatal arrhythmias. Nuclear cardiac imaging provides a unique tool to measure the molecular changes in the heart, including cardiac function of NET, in a non-invasive and repeatable manner. We developed LMI 1195 to target the NET and are encouraged by initial results that have been obtained in a variety of conditions.
In
our LMI 1195 clinical development program, we have completed a safety and dosimetry Phase 1 study in healthy volunteers. Excellent quality whole-body images were obtained, and the radiation dose to the subjects was found to be well within acceptable limits. Blood radioactivity cleared quickly and lung activity was low throughout the study. The agent also appeared to have a favorable safety profile.
Collaborations
with academic centers in the U.S., Canada and Europe have yielded clinical data that have been deemed adequate by the FDA to support advancing into a single Phase 3 clinical trial to support an NDA submission. We anticipate initiating this trial by the end of 2018. The trial will target patients with ischemic heart failure that are scheduled to undergo ICD implantation because of their risk of sudden cardiac death. Our trial is designed to demonstrate that LMI 1195 improves the risk stratification of these patients. If our trial is successful, we anticipate filing an NDA for this agent by 2021.
Ongoing
academic collaborations focusing on establishing the potential use of the agent for the diagnosis and treatment follow-up of neuroendocrine tumors, such as pheochromocytomas and paragangliomas, have also produced initial proof of concept data that is being pursued further.
LMI 1174—Vascular Remodeling Imaging Agent
We have developed LMI 1174, an internally discovered gadolinium-based magnetic resonance imaging (“MRI”) agent targeted to elastin in the arterial walls and atherosclerotic plaque. We believe that this agent could allow assessment of plaque location, burden, type of arterial wall remodeling and, as a result, the potential for a vascular event, which, in turn, could lead to heart attack or stroke.
Atherosclerosis is the leading cause of heart attacks, strokes and peripheral vascular disease. Elastin plays a key role in the structure of the arterial wall and in biological signaling functions. Several pathological stimuli may be responsible for triggering elastogenesis in atherosclerosis, leading to a marked increase in elastin content during plaque development. In addition to the increase in elastin seen in autopsy samples from patients with carotid atherosclerosis, there is also an increase of elastin in aortic aneurysm samples. As a result, an elastin-specific imaging agent may facilitate detection of remodeling of the arterial walls.
The majority of the assessments of atherosclerosis are currently obtained using angiography or MPI. MRI using LMI 1174 could allow for the identification, on a minimally-invasive basis without radiation exposure, of the presence and characteristics of atherosclerosis, potentially improving clinical decision-making to reduce the risks of cardiovascular events.
In our preclinical work, we have identified a series of low molecular weight molecules that bind to elastin and final optimization is ongoing. Our lead molecule, LMI 1174, has been used to demonstrate utility in a number of different animal models. We are currently working closely with investigators in the U.S. and Europe to develop additional preclinical data which may allow us to enter into clinical trials.
13
Intellectual Property
Patents, trademarks and other intellectual property rights, both in the U.S. and foreign countries, are very important to our business. We also rely on trade secrets, manufacturing know-how, technological innovations, licensing agreements and confidentiality agreements to maintain and improve our competitive position. We review third party proprietary rights, including patents and patent applications, as available, in an effort to develop an effective intellectual property strategy, avoid infringement of third party proprietary rights, identify licensing opportunities and monitor the intellectual property owned by others. Our ability to enforce and protect our intellectual property rights may be limited in certain countries outside the U.S., which could make it easier for competitors to capture market position in those countries by utilizing technologies that are similar to those developed or licensed by us. Competitors also may harm our sales by designing products that mirror the capabilities of our products or technology without infringing our intellectual property rights. If we do not obtain sufficient protection for our intellectual property, or if we are unable to effectively enforce our intellectual property rights, our competitiveness could be impaired, which would limit our growth and future revenue. See Part I, Item 1A. “Risk Factors—
If we are unable to protect our intellectual property, our competitors could develop and market products with features similar to our products, and demand for our products may decline
.”
Trademarks, Service Marks and Trade Names
We own various trademarks, service marks and trade names, including DEFINITY, TechneLite, Cardiolite, Neurolite, Vialmix, Quadramet (U.S. only), Luminity, Miraluma and Lantheus Medical Imaging. We have registered these trademarks, as well as others, in the U.S. and numerous foreign jurisdictions.
Patents
We actively seek to protect the proprietary technology that we consider important to our business, including chemical species, compositions and formulations, their methods of use and processes for their manufacture, as new intellectual property is developed. In addition to seeking patent protection in the U.S., we file patent applications in numerous foreign countries in order to further protect the inventions that we consider important to the development of our international business. We also rely upon trade secrets and contracts to protect our proprietary information. As of
January 31, 2018
, our patent portfolio included a total of
35
issued U.S. patents,
242
issued foreign patents,
25
pending patent applications in the U.S. and
154
pending foreign applications. These patents and patent applications include claims covering the composition of matter and methods of use for all of our preclinical and clinical stage agents.
Our patents cover many of our commercial products, and our current patent protection is generally in the U.S., Canada, Mexico, most of Western Europe, various markets in Asia, and Brazil. For DEFINITY, we hold a number of different compositions of matter, use, formulation and manufacturing patents. In the U.S., we have an Orange Book-listed composition of matter patent expiring in
2019
, a manufacturing patent expiring in
2021
, a new Orange Book-listed method of use patent expiring in
2037
and an allowed manufacturing patent application that, when granted, will expire in
2037
. Outside of the U.S., we have patent or regulatory extension protection in Canada, Europe and parts of Asia until
2019
. As part of our microbubble franchise strategy, we continue to actively pursue additional patents in connection with DEFINITY, alternative microbubble formulations, and related technology. TechneLite currently has patent protection in the U.S. and various foreign countries on certain component technology expiring in
2029
. In addition, given the significant know-how and trade secrets associated with the methods of manufacturing and assembling the TechneLite generator, we believe we have a substantial amount of valuable and defensible proprietary intellectual property associated with the product. Neither Cardiolite nor Neurolite is covered any longer by patent protection in either the U.S. or the rest of the world. Xenon, Thallium and Gallium have no patent protection; however, we are pursuing patent protections for an improved container for Xenon.
We have numerous patents and patent applications relating to our clinical development pipeline. We have patents and patent applications in numerous jurisdictions covering composition, use, formulation and manufacturing of flurpiridaz F 18, including in the U.S. a composition patent expiring in
2026
, a method of use patent expiring in
2028
and a method of manufacturing patent expiring in
2031
, in each case, in the absence of any regulatory extension, and various patent applications, one of which, if granted, will expire in
2033
. We also have patents and patent applications in numerous jurisdictions covering composition, use, and manufacture of LMI 1195, our cardiac neuronal imaging agent, including in the U.S. a composition patent expiring in
2030
in the absence of any regulatory extension, and patent applications which, if granted, will expire in
2027
and in
2031
in the absence of any patent term adjustment or regulatory extensions. Additionally, we have patents and patent applications in numerous jurisdictions covering composition, use and manufacture of LMI 1174, our vascular remodeling imaging agent, including in the U.S. a composition and method of use patent expiring in
2031
in the absence of any regulatory extension, and patent applications which, if granted, will expire in
2029
and
2030
in the absence of any patent term adjustment or regulatory extensions.
14
In addition to patents, we rely where necessary upon unpatented trade secrets and know-how, proprietary information and continuing technological innovation to develop and maintain our competitive position. We seek to protect our proprietary information, in part, using confidentiality agreements with our collaborators, employees, consultants and other third parties and invention assignment agreements with our employees. These confidentiality agreements may not prevent unauthorized disclosure of trade secrets and other proprietary information, and we cannot provide assurances that an employee or an outside party will not make an unauthorized disclosure of our trade secrets, other technical know-how or proprietary information. We may not have adequate monitoring abilities to discover, or adequate remedies for, any unauthorized disclosure. This might happen intentionally or inadvertently. It is possible that a competitor will make use of such information, and that our competitive position will be compromised, in spite of any legal action we might take against persons making such unauthorized disclosures. In addition, our trade secrets may otherwise become known or be independently discovered by competitors. To the extent that our collaborators, employees and consultants use intellectual property owned by others in their work for us, disputes may arise as to the rights in related or resulting know-how and inventions.
In addition, we license a limited number of third party technologies and other intellectual property rights that are incorporated into some elements of our drug discovery and development efforts. These licenses are not material to our business, and the technologies can be obtained from multiple sources. We are currently party to separate royalty-free, non-exclusive, cross-licenses with each of Bracco, GE Healthcare and Imcor Pharmaceutical Company. These cross-licenses give us freedom to operate in connection with contrast enhanced ultrasound imaging technology.
Regulatory Matters
Food and Drug Laws
The development, manufacture and commercialization of our agents and products are subject to comprehensive governmental regulation both within and outside the U.S. A number of factors substantially increase the time, difficulty and costs incurred in obtaining and maintaining the approval to market newly developed and existing products. These factors include governmental regulation, such as detailed inspection of and controls over research and laboratory procedures, clinical investigations, manufacturing, marketing, sampling, distribution, import and export, record keeping and storage and disposal practices, together with various post-marketing requirements. Governmental regulatory actions can result in the seizure or recall of products, suspension or revocation of the authority necessary for their production and sale as well as other civil or criminal sanctions.
Our activities related to the development, manufacture, packaging or repackaging of our pharmaceutical and medical device products subject us to a wide variety of laws and regulations. We are required to register for permits and/or licenses with, seek approvals from and comply with operating and security standards of the FDA, the U.S. Nuclear Regulatory Commission (“NRC”), the U.S. Department of Health and Human Services (“HHS”), Health Canada, the European Medicines Agency (“EMA”), the U.K. Medicines and Healthcare Products Regulatory Agency (“MHRA”), the CFDA and various state and provincial boards of pharmacy, state and provincial controlled substance agencies, state and provincial health departments and/or comparable state and provincial agencies, as well as foreign agencies, and certain accrediting bodies depending upon the type of operations and location of product distribution, manufacturing and sale.
The FDA and various state regulatory authorities regulate the research, testing, manufacture, safety, labeling, storage, recordkeeping, premarket approval, marketing, advertising and promotion, import and export and sales and distribution of pharmaceutical products in the U.S. Prior to marketing a pharmaceutical product, we must first receive FDA approval. In the U.S., the FDA regulates drugs under the Federal Food, Drug, and Cosmetic Act (“FDCA”) and implementing regulations. The process of obtaining regulatory approvals and compliance with appropriate federal, state, local, and foreign statutes and regulations requires the expenditure of substantial time and financial resources. Currently, the process required by the FDA before a drug product may be marketed in the U.S. generally involves the following:
|
•
|
Completion of preclinical laboratory tests, animal studies and formulation studies according to Good Laboratory Practices regulations;
|
|
•
|
Submission to the FDA of an IND which must become effective before human clinical studies may begin;
|
|
•
|
Performance of adequate and well-controlled human clinical studies according to Good Clinical Practices and other requirements, to establish the safety and efficacy of the proposed drug product for its intended use;
|
|
•
|
Submission to the FDA of an NDA for a new drug;
|
|
•
|
Satisfactory completion of an FDA inspection of the manufacturing facility or facilities at which the drug product is produced to assess compliance with current Good Manufacturing Practices (“cGMPs”) regulations; and
|
|
•
|
FDA review and approval of the NDA.
|
15
The testing and approval process requires substantial time, effort, and financial resources, and we cannot be certain that any approvals for our agents in development will be granted on a timely basis, if at all. Once a pharmaceutical agent is identified for development, it enters the preclinical testing stage. Preclinical tests include laboratory evaluations of product chemistry, toxicity, formulation, and stability, as well as animal studies to assess its potential safety and efficacy. This testing culminates in the submission of the IND to the FDA.
Once the IND becomes effective, the clinical trial program may begin. Each new clinical trial protocol must be submitted to the FDA before the study may begin. Human clinical studies are typically conducted in three sequential phases that may overlap or be combined:
|
•
|
Phase 1.
The agent is initially introduced into healthy human subjects and tested for safety, dosage tolerance, absorption, metabolism, distribution and excretion. In the case of some products for severe or life-threatening diseases, especially when the agent may be too inherently toxic to ethically administer to healthy volunteers, the initial human testing is often conducted in patients with those diseases.
|
|
•
|
Phase 2.
Involves studies in a limited patient population to identify possible adverse effects and safety risks, to evaluate preliminarily the efficacy of the agent for specific targeted diseases and to determine dosage tolerance and optimal dosage and schedule.
|
|
•
|
Phase 3.
Clinical studies are undertaken to further evaluate dosage, clinical efficacy and safety in an expanded patient population at geographically dispersed clinical study sites. These studies are intended to collect sufficient safety and effectiveness data to support the NDA for FDA approval.
|
Clinical trial sponsors may request an SPA from the FDA. The FDA’s SPA process creates a written agreement between the sponsoring company and the FDA regarding the clinical trial design and other clinical trial issues that can be used to support approval of an agent. The SPA is intended to provide assurance that, if the agreed-upon clinical trial protocols are followed and the trial endpoints are achieved, then the data may serve as the primary basis for an efficacy claim in support of an NDA. However, the SPA agreement is not a guarantee of an approval of an agent or any permissible claims about the agent. In particular, the SPA is not binding on the FDA if public health concerns become evident that are unrecognized at the time that the SPA agreement is entered into, other new scientific concerns regarding product safety or efficacy arise, or if the clinical trial sponsor fails to comply with the agreed upon clinical trial protocols.
Progress reports detailing the results of the clinical studies must be submitted at least annually to the FDA and safety reports must be submitted to the FDA and the investigators for serious and unexpected adverse events. Submissions must also be made to inform the FDA of certain changes to the clinical trial protocol. Federal law also requires the sponsor to register the trials on public databases when they are initiated, and to disclose the results of the trials on public databases upon completion. Phase 1, Phase 2 and Phase 3 testing may not be completed successfully within any specified period, if at all. The FDA or the clinical trial sponsor may suspend or terminate a clinical study at any time on various grounds, including a finding that the research subjects or patients are being exposed to an unacceptable health risk. Similarly, any institutional review board (“IRB”), serving any of the institutions participating in the clinical trial can suspend or terminate approval of a clinical study at a relevant institution if the clinical study is not being conducted in accordance with the IRB’s requirements or if the agent has been associated with unexpected serious harm to patients. Failure to register a clinical trial or disclose study results within the required time periods could result in penalties, including civil monetary penalties.
Concurrent with clinical studies, companies usually complete additional animal studies and must also develop additional information about the chemistry and physical characteristics of the product and finalize a process for manufacturing the product in commercial quantities in accordance with cGMP requirements. The manufacturing process must be capable of consistently producing quality batches of the agent and, among other things, the manufacturer must develop methods for testing the identity, strength, quality and purity of the final product. Additionally, appropriate packaging must be selected and tested and stability studies must be conducted to demonstrate that the agent does not undergo unacceptable deterioration over its shelf life.
16
The results of product development, preclinical studies and clinical studies, along with descriptions of the manufacturing process, analytical tests conducted on the drug product, proposed labeling, and other relevant information, are submitted to the FDA as part of an NDA for a new drug, requesting approval to market the agent. The submission of an NDA is subject to the payment of a substantial user fee, pursuant to the Prescription Drug User Fee Act (“PDUFA”), which was first enacted in 1992 to provide the FDA with additional resources to speed the review of important new medicines. A waiver of that fee may be obtained under certain limited circumstances. PDUFA expires every five years and must be reauthorized by Congress. The current version of PDUFA, the sixth reauthorization (“PDUFA VI”), was renewed as part of the FDA Reauthorization Act (“FDARA”) in 2017 and is scheduled to expire in 2022. PDUFA VI focuses on expanding the role for patient input into the drug development process, continuing to devote resources to the review of breakthrough products to treat serious and life-threatening diseases as well as to treat rare diseases, and exploring opportunities to include real-world evidence in the regulatory review process. In December 2016, Congress enacted and President Obama signed the 21st Century Cures bill into law. That law contains a number of provisions that may change regulatory requirements for drugs and medical devices. Given the bill’s relatively recent enactment, the FDA is still in the process of taking steps to implement the various provisions of the 21
st
Century Cures law. Therefore, it is still uncertain whether or to what extent any changes or additions to regulatory requirements authorized by the new law will have an impact on the regulation of drugs or medical devices.
The approval process is lengthy and difficult and the FDA may refuse to approve an NDA if the applicable regulatory criteria are not satisfied. The FDA has substantial discretion in the product approval process, and it is impossible to predict with any certainty whether and when the FDA will grant marketing approval. The FDA may on occasion require the sponsor of an NDA to conduct additional clinical studies or to provide other scientific or technical information about the product, and these additional requirements may lead to unanticipated delay or expense. Even if such data and information are submitted, the FDA may ultimately decide that the NDA does not satisfy the criteria for approval. Data obtained from clinical studies are not always conclusive, and the FDA may interpret data differently than we interpret the same data.
If a product receives regulatory approval, the approval may be significantly limited to specific diseases and dosages or the indications for use may otherwise be limited, which could restrict the commercial value of the product. Further, the FDA may require that certain contraindications, warnings or precautions be included in the product labeling. In addition, the FDA may require Phase 4 testing which involves clinical studies designed to further assess a drug product’s safety and effectiveness after NDA approval. The FDA also may impose a Risk Evaluation and Mitigation Strategy (“REMS”) to ensure that the benefits of a product outweigh its risks. A REMS could add training requirements for healthcare professionals, safety communications efforts and limits on channels of distribution, among other things. The sponsor would be required to evaluate and monitor the various REMS activities and adjust them if need be. Whether a REMS would be imposed on any of our products and any resulting financial impact is uncertain at this time.
Any drug products for which we receive FDA approvals are subject to continuing regulation by the FDA, including, among other things, record-keeping requirements, reporting of adverse experiences with the product, providing the FDA with updated safety and efficacy information, product sampling and distribution requirements, complying with certain electronic records and signature requirements, and complying with FDA promotion and advertising requirements. The FDA strictly regulates labeling, advertising, promotion and other types of information on products that are placed on the market. Drugs may be promoted only for the approved indications and in accordance with the provisions of the approved label and promotional claims must be appropriately balanced with important safety information and otherwise be adequately substantiated. Further, manufacturers of drugs must continue to comply with cGMP requirements, which are extensive and require considerable time, resources and ongoing investment to ensure compliance. In addition, changes to the manufacturing process generally require prior FDA approval before being implemented, and other types of changes to the approved product, such as adding new indications and additional labeling claims, are also subject to further FDA review and approval.
Drug product manufacturers and other entities involved in the manufacturing and distribution of approved drugs products are required to register their establishments with the FDA and certain state agencies, and are subject to periodic unannounced inspections by the FDA and certain other agencies for compliance with cGMP and other laws. The cGMP requirements apply to all stages of the manufacturing process, including the production, processing, sterilization, packaging, labeling, storage and shipment of the drug product. Manufacturers must establish validated systems to ensure that products meet specifications and regulatory standards, and test each product batch or lot prior to its release. In addition, manufacturers of commercial PET products, including radiopharmacies, hospitals and academic medical centers, are required to submit either an NDA or Abbreviated New Drug Application (“ANDA”) in order to produce PET drugs for clinical use, or produce the drugs under an IND.
The FDA also regulates the preclinical and clinical testing, design, manufacture, safety, efficacy, labeling, storage, record keeping, sales and distribution, post-market adverse event reporting, import/export and advertising and promotion of any medical devices that we distribute pursuant to the FDCA and FDA’s implementing regulations. The Federal Trade Commission shares jurisdiction with the FDA over the promotion and advertising of certain medical devices. The FDA can also impose restrictions on the sale, distribution or use of medical devices at the time of their clearance or approval, or subsequent to marketing. Currently, two medical devices, both of which are manufactured by third parties that hold the product clearances, comprise only a small portion of our revenues.
17
The FDA may withdraw marketing authorization for a pharmaceutical or medical device product if compliance with regulatory standards is not maintained or if problems occur after the product reaches the market. Later discovery of previously unknown problems with a product may result in restrictions on the product or even complete withdrawal of the product from the market. Further, the failure to maintain compliance with regulatory requirements may result in administrative or judicial actions, such as fines, civil monetary penalties, warning letters, holds on clinical studies, product recalls or seizures, product detention or refusal to permit the import or export of pharmaceuticals or medical device products, refusal to approve pending applications or supplements, restrictions on marketing or manufacturing, injunctions, or civil or criminal penalties.
Because our operations include the manufacture and distribution of medical radioisotopes and other medical products, we are subject to regulation by the NRC and the departments of health of each state in which we operate and the applicable state boards of pharmacy. In addition, the FDA is also involved in the regulation of cyclotron facilities where PET products are produced in compliance with cGMP requirements and U.S. Pharmacopeia requirements for PET drug compounding.
Drug laws also are in effect in many of the non-U.S. markets in which we conduct business. These laws range from comprehensive drug approval requirements to requests for product data or certifications. In addition, inspection of and controls over manufacturing, as well as monitoring of adverse events, are components of most of these regulatory systems. Most of our business is subject to varying degrees of governmental regulation in the countries in which we operate, and the general trend is toward increasingly stringent regulation. The exercise of broad regulatory powers by the FDA continues to result in increases in the amount of testing and documentation required for approval or clearance of new drugs and devices, all of which add to the expense of product introduction. Similar trends also are evident in major non-U.S. markets, including Canada, the European Union, Australia and Japan.
To assess and facilitate compliance with applicable FDA, the NRC and other state, federal and foreign regulatory requirements, we regularly review our quality systems to assess their effectiveness and identify areas for improvement. As part of our quality review, we perform assessments of our suppliers of the raw materials that are incorporated into products and conduct quality management reviews designed to inform management of key issues that may affect the quality of our products. From time to time, we may determine that products we manufactured or marketed do not meet our specifications, published standards, such as those issued by the International Standards Organization, or regulatory requirements. When a quality or regulatory issue is identified, we investigate the issue and take appropriate corrective action, such as withdrawal of the product from the market, correction of the product at the customer location, notice to the customer of revised labeling and other actions.
Hatch-Waxman Act
The Drug Price Competition and Patent Term Restoration Act of 1984, known as the Hatch-Waxman Act, added two pathways for FDA drug approval. First, the Hatch-Waxman Act permits the FDA to approve ANDAs for generic versions of drugs if the ANDA applicant demonstrates, among other things, that its product is bioequivalent to the innovator product and provides relevant chemistry, manufacturing and product data. Second, the Hatch-Waxman Act created what is known as a Section 505(b)(2) NDA, which requires the same information as a full NDA (known as a Section 505(b)(1) NDA), including full reports of clinical and preclinical studies but allows some of the information from the reports required for marketing approval to come from studies which the applicant does not own or have a legal right of reference. A Section 505(b)(2) NDA permits a manufacturer to obtain marketing approval for a drug without needing to conduct or obtain a right of reference for all of the required studies. The Hatch-Waxman Act also provides for: (1) restoration of a portion of a product’s patent term that was lost during clinical development and application review by the FDA; and (2) statutory protection, known as exclusivity, against the FDA’s acceptance or approval of certain competitor applications.
Patent term extension can compensate for time lost during product development and the regulatory review process by returning up to five years of patent life for a patent that covers a new product or its use. This period is generally one-half the time between the effective date of an IND and the submission date of an NDA, plus the time between the submission date of an NDA and the approval of that application. Patent term extensions, however, are subject to a maximum extension of five years, and the patent term extension cannot extend the remaining term of a patent beyond a total of 14 years. The application for patent term extension is subject to approval by the U.S. Patent and Trademark Office in conjunction with the FDA.
18
The Hatch-Waxman Act also provides for a period of statutory protection for new drugs that receive NDA approval from the FDA. If the FDA approves a Section 505(b)(1) NDA for a new drug that is a new chemical entity, meaning that the FDA has not previously approved any other new drug containing any same active moiety, then the Hatch-Waxman Act prohibits the submission or approval of an ANDA or a Section 505(b)(2) NDA for a period of five years from the date of approval of the NDA, except that the FDA may accept an application for review after four years under certain circumstances. The Hatch-Waxman Act will not prevent the filing or approval of a full NDA, as opposed to an ANDA or Section 505(b)(2) NDA, for any drug, but the competitor would be required to conduct its own clinical trials, and any use of the drug for which marketing approval is sought could not violate another NDA holder’s patent claims. The Hatch-Waxman Act provides for a three-year period of exclusivity for an NDA for a new drug containing an active moiety that was previously approved by the FDA, but also includes new clinical data (other than bioavailability and bioequivalence studies) to support an innovation over the previously approved drug and those studies were conducted or sponsored by the applicant and were essential to approval of the application. This three-year exclusivity period does not prohibit the FDA from accepting an application from a third party for a drug with that same innovation, but it does prohibit the FDA from approving that application for the three-year period. The three-year exclusivity does not prohibit the FDA, with limited exceptions, from approving generic drugs containing the same active ingredient but without the new innovation.
Healthcare Reform and Other Laws Affecting Payment
We operate in a highly-regulated industry. The U.S. and state governments continue to propose and pass legislation that may affect the availability and cost of healthcare. For example, the Patient Protection and Affordable Care Act, as amended by the Health Care and Education Reconciliation Act, or collectively, the Healthcare Reform Act, substantially changes the way in which healthcare is financed by both governmental and private insurers and has a significant impact on the pharmaceutical industry. The Healthcare Reform Act contains a number of provisions that affect coverage, reimbursement and/or delivery of drug products and the medical imaging procedures in which our drug products are used. Key provisions include the following:
|
•
|
increasing the presumed utilization rate for imaging equipment costing $1 million or more in the physician office and free-standing imaging facility setting which reduces the Medicare per procedure medical imaging reimbursement; subsequent legislation further increased the presumed utilization rate effective January 1, 2014;
|
|
•
|
increasing drug rebates paid to state Medicaid programs under the Medicaid Drug Rebate Program for brand name prescription drugs and extending those rebates to Medicaid managed care organizations;
|
|
•
|
imposing a non-deductible annual fee on pharmaceutical manufacturers or importers who sell brand name prescription drugs to specified federal government programs;
|
|
•
|
imposing an excise tax on the sale of taxable medical devices, to be paid by the entity that manufactures or imports the device: (which tax applied to applicable sales made from January 1, 2013 through December 31, 2015, but is currently suspended for 2016 through 2019); and
|
|
•
|
amending the federal self-referral laws to require referring physicians ordering certain diagnostic imaging services to inform patients under certain circumstances that the patients may obtain the services from other local and unaffiliated suppliers (which may affect the setting in which a patient obtains services).
|
The Healthcare Reform Act also establishes an Independent Payment Advisory Board (“IPAB”) to reduce the per capita rate of growth in Medicare spending by proposing changes to Medicare payments if expenditures exceed certain targets. A proposal made by the IPAB must be implemented by CMS, unless Congress adopts a proposal that achieves the necessary savings. IPAB proposals may impact payments for physician and free-standing imaging services beginning in 2015 and for hospital services beginning in 2020. The threshold for triggering IPAB proposals has not been reached through 2017, so no adjustments will be made under the IPAB until 2020 (at the earliest).
The Healthcare Reform Act also amended the federal self-referral laws, requiring referring physicians to inform patients under certain circumstances that the patients may obtain services, including MRI, computed tomography (“CT”), PET and certain other diagnostic imaging services, from a provider other than that physician, another physician in his or her group practice, or another individual under direct supervision of the physician or another physician in the group practice. The referring physician must provide each patient with a written list of other suppliers who furnish those services in the area in which the patient resides. These new requirements could have the effect of shifting where certain diagnostic medical imaging procedures are performed.
The Healthcare Reform Act has been subject to political and judicial challenges. In 2012, the U.S. Supreme Court considered the constitutionality of certain provisions of the law. The U.S. Supreme Court upheld as constitutional the mandate for individuals to obtain health insurance, but held the provision allowing the federal government to withhold certain Medicaid funds to states that do not expand state Medicaid programs unconstitutional. Therefore, not all states have expanded their Medicaid programs under the Healthcare Reform Act. Political and judicial challenges to the law have continued in the wake of the Court’s ruling.
19
Modification to or repeal of all or certain provisions of the Healthcare Reform Act are expected as a result of the outcome of the recent presidential election and Republicans maintaining control of Congress, consistent with statements made by President Donald Trump and members of Congress during the presidential campaign and following the election. Notably, Congress enacted legislation in 2017 that eliminates the Healthcare Reform Act’s “individual mandate” beginning in 2019, which may significantly impact the number of covered lives participating in exchange plans. We cannot predict the ultimate content, timing or effect of any changes to the Healthcare Reform Act or other federal and state reform efforts. There is no assurance that federal or state health care reform will not adversely affect our future business and financial results, and we cannot predict how future federal or state legislative, judicial or administrative changes relating to healthcare reform will affect our business.
Recently, there has been considerable public and government scrutiny of pharmaceutical pricing and proposals to address the perceived high cost of pharmaceuticals. Efforts by government officials or legislators to implement measures to regulate prices or payment for pharmaceutical products could limit our flexibility in establishing prices for our products or otherwise adversely affect our business if implemented. Changes could occur at the federal level or state level and may be adopted by statute, rule, or sub-regulatory policies. Recent state legislative efforts seek to address drug costs and generally have focused on increasing transparency around drug costs or limiting drug prices.
General legislative cost control measures may also affect reimbursement for our products. The Budget Control Act, as amended, resulted in the imposition of 2% reductions in Medicare (but not Medicaid) payments to providers in 2013 and will remain in effect through 2025 unless additional Congressional action is taken. Any significant spending reductions affecting Medicare, Medicaid or other publicly funded or subsidized health programs that may be implemented and/or any significant taxes or fees that may be imposed on us could have an adverse impact on our business results of operations, financial condition and cash flows.
Healthcare Fraud and Abuse Laws
We are subject to various federal, state and local laws targeting fraud and abuse in the healthcare industry, including anti-kickback and false claims laws. Violations of fraud and abuse laws may be punishable by criminal or civil sanctions, including fines and civil monetary penalties, and/or exclusion from federal health care programs (including Medicare and Medicaid). Federal and state authorities are paying increased attention to enforcement of these laws within the pharmaceutical industry, and private individuals have been active in alleging violations of the laws and bringing suits on behalf of the government under the federal False Claims Act (“FCA”). Violations of international fraud and abuse laws could result in similar penalties, including exclusion from participation in health programs outside the U.S. If we were subject to allegations concerning, or were convicted of violating, these laws, our business could be harmed.
The federal Anti-Kickback Statute generally prohibits, among other things, a pharmaceutical manufacturer from directly or indirectly soliciting, offering, receiving, or paying any remuneration in cash or in kind where one purpose is either to induce the referral of an individual for, or the purchase or prescription of a particular drug that is payable by a federal health care program, including Medicare or Medicaid. The Healthcare Reform Act clarifies the intent requirements of the federal Anti-Kickback Statute, providing that a person or entity does not need to have actual knowledge of the statute or a specific intent to violate the statute. Violations of the federal Anti-Kickback Statute can result in exclusion from Medicare, Medicaid or other governmental programs as well as civil and criminal fines and penalties of up to $50,000 per violation and three times the amount of the unlawful remuneration. In addition, the Healthcare Reform Act revised the FCA to provide that a claim arising from a violation of the Federal Anti-Kickback Statute constitutes a false or fraudulent claim for purposes of the FCA. The majority of states also have anti-kickback, false claims, and similar fraud and abuse laws and although the specific provisions of these laws vary, their scope is generally broad, and there may not be regulations, guidance or court decisions that apply the laws to particular industry practices. There is therefore a possibility that our practices might be challenged under the anti-kickback statutes or similar laws.
Federal and state false claims laws generally prohibit anyone from knowingly and willfully, among other activities, presenting, or causing to be presented for payment to third party payors (including Medicare and Medicaid) claims for drugs or services that are false or fraudulent (which may include claims for services not provided as claimed or claims for medically unnecessary services). A claim arising from a violation of the Federal Anti-Kickback Statute constitutes a false or fraudulent claim for purposes of the FCA. False or fraudulent claims for purposes of the FCA carry fines and civil penalties for violations ranging from $11,181 to $22,363 for each false claim, plus up to three times the amount of damages sustained by the federal government and, most critically, may provide the basis for exclusion from federally funded healthcare programs. There is also a criminal FCA statute by which individuals or entities that submit false claims can face criminal penalties. In addition, under the federal Civil Monetary Penalty Law, the Department of Health and Human Services Office of Inspector General has the authority to exclude from participation in federal health care programs or to impose civil penalties against any person who, among other things, knowingly presents, or causes to be presented, certain false or otherwise improper claims. Our activities relating to the sale and marketing of our products may be subject to scrutiny under these laws.
20
Laws and regulations have also been enacted by the federal government and various states to regulate the sales and marketing practices of pharmaceutical manufacturers. The laws and regulations generally limit financial interactions between manufacturers and health care providers; require pharmaceutical companies to comply with the pharmaceutical industry’s voluntary compliance guidelines and the relevant compliance guidance promulgated by the U.S. federal government; and/or require disclosure to the government and/or public of financial interactions (so-called “sunshine laws”). The Healthcare Reform Act requires manufacturers to submit information to the FDA on the identity and quantity of drug samples requested and distributed by a manufacturer during each year. Many of these laws and regulations contain ambiguous requirements or require administrative guidance for implementation. Given the lack of clarity in laws and their implementation, our activities could be subject to the penalty provisions of the pertinent federal and state laws and regulations.
Other Healthcare Laws
Our operations may be affected by the Health Insurance Portability and Accountability Act of 1996 (“HIPAA”) as amended by the Health Information Technology for Economic and Clinical Health Act and its implementing regulations (“HITECH”) which impose obligations on certain “covered entities” (healthcare providers, health plans and healthcare clearinghouses) and certain of their “business associate” contractors with respect to safeguarding the privacy, security and transmission of individually identifiable health information. Although we believe that we are neither a “covered entity” nor a “business associate” under the legislation, a business associate relationship may be imputed from facts and circumstances even in the absence of an actual business associate agreement. In addition, HIPAA and HITECH may affect our interactions with customers who are covered entities or their business associates.
Antitrust and Competition Laws
The federal government and most states have enacted antitrust laws that prohibit specific types of anti-competitive conduct, including price fixing, wage fixing, concerted refusals to deal, price discrimination and tying arrangements, as well as monopolization and acquisitions of competitors that have, or may have, a substantial adverse effect on competition. Violations of federal or state antitrust laws can result in various sanctions, including criminal and civil penalties. We believe we are in compliance with such federal and state laws, but courts or regulatory authorities may reach a determination in the future that could adversely affect our business, results of operations, financial condition and cash flows. In addition, we are subject to similar antitrust and anti-competition laws in foreign countries. We believe we are in compliance with such laws, however, any violation could create a substantial liability for us and also cause a loss of reputation in both foreign and domestic markets.
Laws Relating to Foreign Trade
We are subject to various federal and foreign laws that govern our international business practices with respect to payments to government officials. Those laws include the Foreign Corrupt Practices Act (“FCPA”) which prohibits U.S. companies and their representatives from paying, offering to pay, promising, or authorizing the payment of anything of value to any foreign government official, government staff member, political party, or political candidate for the purpose of obtaining or retaining business or to otherwise obtain favorable treatment or influence a person working in an official capacity. In many countries, the healthcare professionals we regularly interact with may meet the FCPA’s definition of a foreign government official. The FCPA also requires public companies to make and keep books and records that accurately and fairly reflect their transactions and to devise and maintain an adequate system of internal accounting controls.
Those laws also include the U.K. Bribery Act (“Bribery Act”) which proscribes giving and receiving bribes in the public and private sectors, bribing a foreign public official, and failing to have adequate procedures to prevent employees and other agents from giving bribes. U.S. companies that conduct business in the United Kingdom generally will be subject to the Bribery Act. Penalties under the Bribery Act include potentially unlimited fines for companies and criminal sanctions for corporate officers under certain circumstances.
Our policies mandate compliance with these anti-bribery laws. Our operations reach many parts of the world that have experienced governmental corruption to some degree, and in certain circumstances strict compliance with anti-bribery laws may conflict with local customs and practices. Despite our training and compliance programs, our internal control policies and procedures may not always protect us from reckless or criminal acts committed by our employees or agents.
We are also subject to trade control regulations and trade sanctions laws that restrict the movement of certain goods, currency, products, materials, services and technology to, and certain operations in, various countries or with certain persons. Our ability to transfer people and products among certain countries may be subjected to these laws and regulations.
Health and Safety Laws
We are also subject to various federal, state and local laws, regulations and recommendations, both in the U.S. and abroad, relating to safe working conditions, laboratory and manufacturing practices and the use, transportation and disposal of hazardous or potentially hazardous substances.
21
Environmental Matters
We are subject to various federal, state and local laws and regulations relating to the protection of the environment, human health and safety in the U.S. and in other jurisdictions in which we operate. Our operations, like those of other medical product companies, involve the transport, use, handling, storage, exposure to and disposal of materials and wastes regulated under environmental laws, including hazardous and radioactive materials and wastes. If we violate these laws and regulations, we could be fined, criminally charged or otherwise sanctioned by regulators. We believe that our operations currently comply in all material respects with applicable environmental laws and regulations. See Part I, Item 1A. “Risk Factors—
We use hazardous materials in our business and must comply with environmental laws and regulations, which can be expensive
.”
Certain environmental laws and regulations assess liability on current or previous owners or operators of real property for the cost of investigation, removal or remediation of hazardous materials or wastes at those formerly owned or operated properties or at third party properties at which they have disposed of hazardous materials or wastes. In addition to cleanup actions brought by governmental authorities, private parties could bring personal injury, property damage or other claims due to the presence of, or exposure to, hazardous materials or wastes. We currently are not party to any claims or any obligations to investigate or remediate any material contamination at any of our facilities.
We are required to maintain a number of environmental permits and nuclear licenses for our North Billerica, Massachusetts facility, which is our primary manufacturing, packaging and distribution facility. In particular, we must maintain a nuclear byproducts materials license issued by the Commonwealth of Massachusetts. This license requires that we provide financial assurance demonstrating our ability to cover the cost of decommissioning and decontaminating (“D&D”) the Billerica site at the end of its use as a nuclear facility. In addition, we have a radioactive production facility in San Juan, Puerto Rico, where we must also maintain a number of environmental permits and nuclear licenses. As of
December 31, 2017
, we currently estimate the D&D cost to be approximately
$26.9 million
. As of
December 31, 2017
and
2016
, we have a liability recorded associated with the fair value of the asset retirement obligations of
$10.4 million
and
$9.4 million
, respectively. We currently provide this financial assurance in the form of surety bonds. We generally contract with third parties for the disposal of wastes generated by our operations. Prior to disposal, we store any low level radioactive waste at our facilities until the materials are below regulatory limits, as allowed by our licenses and permits.
Environmental laws and regulations are complex, change frequently and have become more stringent over time. While we have budgeted for future capital and operating expenditures to maintain compliance with these laws and regulations, we cannot assure you that our costs of complying with current or future environmental protection, health and safety laws and regulations will not exceed our estimates or adversely affect our results of operations and financial condition. Further, we cannot assure you that we will not be subject to additional environmental claims for personal injury or cleanup in the future based on our past, present or future business activities. While it is not feasible to predict the future costs of ongoing environmental compliance, it is possible that there will be a need for future provisions for environmental costs that, in management’s opinion, are not likely to have a material effect on our financial condition, but could be material to the results of operations in any one accounting period.
Employees
As of
December 31, 2017
, we had
483
employees, of which
439
were located in the U.S. and
44
were located internationally, and
75
contractors. None of our employees are represented by a collective bargaining agreement, and we believe that our relationship with our employees is good.
Corporate History
Founded in 1956 as New England Nuclear Corporation, our medical imaging diagnostic business was purchased by E.I. du Pont de Nemours and Company (“DuPont”) in 1981. Bristol Myers Squibb (“BMS”) subsequently acquired our diagnostic medical imaging business as part of its acquisition of DuPont Pharmaceuticals in 2001. In January 2008, Avista Capital Partners, L.P., Avista Capital Partners (Offshore), L.P. and ACP-Lantern Co-Invest, LLC (collectively “Avista”) formed Lantheus Holdings and its subsidiary, Lantheus MI Intermediate, Inc. (“Lantheus Intermediate”), and, through Lantheus Intermediate, acquired our medical imaging business from BMS. On June 30, 2015, we completed an initial public offering (“IPO”) of our common stock. Immediately prior to the consummation of our IPO, Lantheus Intermediate merged with and into Lantheus Holdings, which was the survivor of the merger. Our common stock is traded on the NASDAQ Global Market under the symbol “LNTH”.
22
Available Information
Our global Internet site is www.lantheus.com. We routinely make available important information, including copies of our Annual Reports on Form 10-K, Quarterly Reports on Form 10-Q, Current Reports on Form 8-K and amendments to those reports filed or furnished pursuant to Section 13(a) or 15(d) of the Securities Exchange Act of 1934, as soon as reasonably practicable after such reports are electronically filed with, or furnished to, the SEC, free of charge on our website at www.investor.lantheus.com. We recognize our website as a key channel of distribution to reach public investors and as a means of disclosing material non-public information to comply with our disclosure obligations under SEC Regulation FD. Information contained on our website shall not be deemed incorporated into, or to be part of this Annual Report on Form 10-K, and any website references are not intended to be made through active hyperlinks.
The public may read and copy any materials we file with the SEC at the SEC’s Public Reference Room at 100 F Street, N.E., Washington, D.C. 20549. The public may obtain information on the operation of the Public Reference Room by calling the SEC at 1-800-SEC-0330. Our reports filed with, or furnished to, the SEC are also available on the SEC’s website at www.sec.gov, and for Annual Reports on Form 10-K and Quarterly Reports on Form 10-Q, in an XBRL (Extensible Business Reporting Language) format. XBRL is an electronic coding language used to create interactive financial statement data over the Internet. The information on our website is neither part of nor incorporated by reference in this Annual Report on Form 10-K.
You should carefully consider the following risks. These risks could materially affect our business, results of operations or financial condition, cause the trading price of our outstanding common stock to decline materially or cause our actual results to differ materially from those expected or those expressed in any forward-looking statements made by us or on our behalf. See “Cautionary Note Regarding Forward-Looking Statements” and the risks of our businesses described elsewhere in this Annual Report on Form 10‑K.
Risks Related to Our Products
The growth of our business is substantially dependent on our ability to continue to grow the appropriate use of DEFINITY in suboptimal echocardiograms in the face of increased segment competition from other existing echocardiography agents and potential generic competitors as a result of future patent and regulatory exclusivity expirations
.
The growth of our business is substantially dependent on our ability to continue to grow the appropriate use of DEFINITY in suboptimal echocardiograms. There were approximately
33.1 million
echocardiograms in 2017 according to a third-party source. Assuming
20%
of echocardiograms produce suboptimal images, as stated in the clinical literature, we estimate that approximately
6.6 million
echocardiograms in 2017 produced suboptimal images. We estimate that DEFINITY held over
80%
of the U.S. market for contrast agents in echocardiography procedures as of December 2017. DEFINITY currently competes with Optison, a GE Healthcare product, Lumason, a Bracco product (known as SonoVue outside the U.S.), as well as other non-echocardiography agents.
We launched DEFINITY in 2001, and in the U.S., an Orange Book-listed composition of matter patent will expire in
2019
, a manufacturing patent will expire in
2021
, a new Orange Book-listed method of use patent will expire in
2037
and an allowed manufacturing patent application that, when granted, will expire in
2037
. In numerous foreign jurisdictions, patent protection or regulatory exclusivity will currently expire in
2019
. As part of our microbubble franchise strategy, we continue to actively pursue additional patents in connection with DEFINITY, alternative microbubble formulations, and related technology. We also plan to initiate additional clinical trials with DEFINITY to pursue expansion of the current DEFINITY indication to include EF. However, we can give no assurance that our microbubble franchise strategy will be successful or that new patents or approvals will protect the agent or be defensible in the face of potential generic competition.
We have on-going development and technology transfer activities for an alternative microbubble formulation with SBL located in Songdo, South Korea, approximately 20 miles southwest of Seoul, but can give no assurances as to when those technology transfer activities will be completed and when we will begin to receive a supply of an alternative microbubble formulation from SBL. In addition, those activities could be adversely affected by on-going political and military tensions on the Korean peninsula.
If we are not able to continue to grow DEFINITY sales, we may not be able to continue to grow the revenue and cash flow of the business, which could have a negative effect on our business, results of operations and financial condition.
23
We face revenue and unit volume risk for Xenon in pulmonary studies as a result of competition from Curium and potentially others
.
Historically, several companies, including Curium, sold packaged Xenon as a pulmonary imaging agent in the U.S., but from 2010 through the first quarter of 2016 we were the only supplier of this imaging agent in the U.S. In March 2016, Curium received regulatory approval from the FDA to again sell packaged Xenon in the U.S. and began to do so. Depending upon the pricing, extent of availability and market penetration of Curium’s offering, we believe we are at risk for volume loss and price erosion from those customers that are not subject to price or volume commitments with us.
Xenon is frequently administered as part of a ventilation scan to evaluate pulmonary function prior to a perfusion scan with microaggregated albumin (“MAA”), a Technetium-based radiopharmaceutical used to evaluate blood flow to the lungs. Currently, JDI is the sole supplier of MAA on a global basis. Since 2014, JDI has instituted multiple and substantial price increases for MAA. The increased price of MAA, or difficulties in obtaining MAA, could decrease the frequency in which MAA is used for lung perfusion evaluation, in turn, decreasing the frequency that Xenon is used for pulmonary function evaluation, resulting in a negative effect on our business, results of operations, financial condition and cash flows.
In addition to competition from Curium, other imaging agents and modalities could potentially compete with, or displace, packaged Xenon in pulmonary studies. For example, in December 2017, JDI received FDA approval for the use of DTPA (Kit for the Preparation of Technetium Tc99M Pentetate Injection) (“DTPA”) in lung ventilation assessments. If there is an increase in the use of DTPA or other imaging agents or modalities in place of packaged Xenon, our current sales volumes would decrease, which could have a negative effect on our business, results of operations, financial condition and cash flows.
In the U.S., we are heavily dependent on a few large customers and group purchasing organization arrangements to generate a majority of our revenues for our nuclear medical imaging products and our other products. Outside of the U.S., we rely primarily on distributors to generate a substantial portion of our revenue
.
In the U.S., we have historically relied on a limited number of radiopharmacy customers, primarily Cardinal, UPPI, GE Healthcare and Triad, to distribute our current largest volume nuclear imaging products and generate a majority of our revenues. Three customers accounted for approximately
33%
of our revenues in the year ended December 31, 2017, with Cardinal, UPPI and GE Healthcare accounting for approximately
12%
,
10%
and
10%
, respectively. Among the existing radiopharmacies in the U.S., continued consolidations, divestitures and reorganizations may have a negative effect on our business, results of operations, financial condition and cash flows. We generally have distribution arrangements with our major radiopharmacy customers pursuant to multi-year contracts, each of which is subject to renewal. If these contracts are terminated prior to expiration of their term, or are not renewed, or are renewed on terms that are less favorable to us, then such an event could have a material adverse effect on our business, results of operations, financial condition and cash flows.
For all of our medical imaging products, we continue to experience significant pricing pressures from our competitors, large customers and group purchasing organizations, and any significant, additional pricing pressures could lead to a reduction in revenue which could have a material adverse effect on our business, results of operations, financial condition and cash flows.
Outside of the U.S., Canada and Puerto Rico, we have no sales force and, consequently, rely on third-party distributors, either on a country-by-country basis or on a multi-country, regional basis, to market, sell and distribute our products. In Canada, we maintain our own direct sales force to sell DEFINITY. We formerly owned or operated radiopharmacies and we now sell radiopharmaceutical products under the Isologic Supply Agreement. In Australia, we also formerly owned or operated radiopharmacies, and we now sell DEFINITY and radiopharmaceutical products under the GMS Supply Agreement. Distributors accounted for approximately
45%
,
34%
and
15%
of International segment revenues for the years ended December 31, 2017, 2016 and 2015, respectively. In certain circumstances, distributors may also sell competing products to our own or products for competing diagnostic modalities and may have incentives to shift sales towards those competing products. As a result, we cannot assure you that our international distributors will increase or maintain current levels of unit sales or that we will be able to increase or maintain our current unit pricing, which, in turn, could have a material adverse effect on our business, results of operations, financial condition and cash flows.
Our dependence upon third parties for the manufacture and supply of a substantial portion of our products could prevent us from delivering our products to our customers in the required quantities, within the required timeframes, or at all, which could result in order cancellations and decreased revenues
.
We obtain a substantial portion of our products from third party manufacturers and suppliers. We rely on JHS as our sole source manufacturer of DEFINITY, Neurolite, Cardiolite and evacuation vials. We currently have additional on-going technology transfer activities for an alternative microbubble formulation with SBL, but we cannot give any assurances as to when that technology transfer will be completed and when we will actually receive supply of an alternative microbubble formulation from SBL. Currently, our DEFINITY, Neurolite, Cardiolite, evacuation vial and saline product supplies are approved for manufacture by a single manufacturer.
24
Based on our current estimates, we believe that we will have sufficient supply of DEFINITY, Neurolite, Cardiolite and evacuation vials from JHS, and sufficient supply of saline from our sole manufacturer, to meet expected demand. However, we can give no assurances that JHS or our other manufacturing partner will be able to manufacture and distribute our products in a high quality and timely manner and in sufficient quantities to allow us to avoid product stock-outs and shortfalls. Currently, regulatory authorities in certain countries have not yet approved JHS as a manufacturer of certain of our products. Accordingly, until those regulatory approvals have been obtained, our business, results of operations, financial condition and cash flows will continue to be adversely affected.
Xenon is captured as a by-product of the Moly production process. Historically, Nordion was our sole supplier of Xenon, from Moly generated at the NRU reactor in Canada. As a result of a decision by the Government of Canada, the NRU reactor exited the medical isotope business in November 2016. We now receive bulk unprocessed Xenon from IRE resulting from HEU Moly production, which we process and finish for our customers. We do not yet receive Xenon resulting from LEU Moly production at IRE and can give no assurances as to the timing of the availability of LEU Xenon. We believe we will have a sufficient supply of HEU and LEU Xenon to meet our customers’ needs. However, until IRE converts to LEU Xenon production or we can qualify an additional source of bulk unprocessed Xenon, we will rely on IRE as a sole source provider of HEU Xenon. For the year ended December 31, 2017, Xenon represented approximately
10%
of our revenues.
In addition to the products described above, for reasons of quality assurance or cost-effectiveness, we purchase certain components and raw materials from sole suppliers (including, for example, the lead casing for our TechneLite generators and the lipid blend material used in the processing of DEFINITY). Because we do not control the actual production of many of the products we sell and many of the raw materials and components that make up the products we sell, we may be subject to delays caused by interruption in production based on events and conditions outside of our control. At our North Billerica, Massachusetts facility, we manufacture TechneLite on a relatively new, highly automated production line, as well as Thallium and Gallium using our older cyclotron technology and Xenon and Quadramet using our hot cell infrastructure. As with all manufacturing facilities, equipment and infrastructure age and become subject to increasing maintenance and repair. If we or one of our manufacturing partners experiences an event, including a labor dispute, natural disaster, fire, power outage, machinery breakdown, security problem, failure to meet regulatory requirements, product quality issue, technology transfer issue or other issue, we may be unable to manufacture the relevant products at previous levels or on the forecasted schedule, if at all. Due to the stringent regulations and requirements of the governing regulatory authorities regarding the manufacture of our products, we may not be able to quickly restart manufacturing at a third party or our own facility or establish additional or replacement sources for certain products, components or materials.
In addition to our existing manufacturing relationships, we are also pursuing new manufacturing relationships to establish and secure additional or alternative suppliers for our commercial products. We currently have additional on-going technology transfer activities for an alternative microbubble formulation with SBL.
We have also commenced an extensive, multi-year effort to add specialized manufacturing capabilities at our North Billerica, Massachusetts facility. This project is part of a larger corporate growth strategy to create a competitive advantage in specialized manufacturing. This project should not only deliver cost savings and supply chain redundancy for our current portfolio but also should afford us increased flexibility as we consider external opportunities. H
owever, we cannot assure you that these activities or any of our additional supply activities will be successful or that we will be able to avoid or mitigate interim supply shortages before new sources of product are fully functional and qualified. In addition, we cannot assure you that our existing manufacturers or suppliers or any new manufacturers or suppliers can adequately maintain either their financial health or regulatory compliance to allow continued production and supply. A reduction or interruption in manufacturing, or an inability to secure alternative sources of raw materials or components, could eventually have a material adverse effect on our business, results of operations, financial condition and cash flows.
The global supply of Moly is fragile and not stable. Our dependence on a limited number of third party suppliers for Moly could prevent us from delivering some of our products to our customers in the required quantities, within the required timeframe, or at all, which could result in order cancellations and decreased revenues
.
A critical ingredient of TechneLite is Moly. We currently purchase finished Moly from three of the four main processing sites in the world, namely NTP in South Africa; ANSTO in Australia; and IRE in Belgium. These processing sites provide us Moly from five of the six main Moly-producing reactors in the world, namely, OPAL in Australia; BR2 in Belgium; LVR-15 in the Czech Republic; HFR in The Netherlands; and SAFARI in South Africa.
Historically, our largest supplier of Moly was Nordion, which has relied on the NRU reactor owned by Atomic Energy of Canada Limited, a Crown corporation of the Government of Canada, located in Chalk River, Ontario. As a result of a decision by the Government of Canada, the NRU reactor exited the medical isotope business in November 2016.
25
ANSTO has under construction, in cooperation with NTP, a new Moly processing facility that ANSTO believes will nearly double its production capacity by approximately 2.5 times, with commercial production planned to start in the second half of 2018. In addition, IRE received approval from its regulator to expand its production capability by up to 50% of its former capacity. This new ANSTO and IRE production capacity is expected to replace the NRU’s most recent routine production. While we believe this additional Moly supply will give us the most balanced and diversified Moly supply chain in the industry, a prolonged disruption of service from only one of our Moly suppliers could have a material adverse effect on our business, results of operations, financial condition and cash flows. For example, due to regulatory issues, the NTP processing facility was off-line from late November 2017 until mid February 2018, and we were forced to rely on Moly supply from only ANSTO and IRE during this period, resulting in our inability to fill all of the demand for our TechneLite generators on certain manufacturing days and consequently decreasing revenue and cash flow from this product line during this period as compared to prior periods. A longer term outage from one of our three Moly suppliers could have a substantial negative effect on our business, results of operations, financial condition and cash flows.
We are also pursuing additional sources of Moly from potential new producers around the world to further augment our current supply. In November 2014, we entered into a strategic agreement with SHINE for the future supply of Moly. Under the terms of the supply agreement, SHINE will provide Moly produced using its proprietary LEU-solution technology for use in our TechneLite generators once SHINE’s facility becomes operational and receives all necessary regulatory approvals, which SHINE now estimates will occur in 2020. However, we cannot assure you that SHINE or any other possible additional sources of Moly will result in commercial quantities of Moly for our business, or that these new suppliers together with our current suppliers will be able to deliver a sufficient quantity of Moly to meet our needs.
U.S., Canadian and international governments have encouraged the development of a number of alternative Moly production projects with existing reactors and technologies as well as new technologies. However, we cannot say when, or if, the Moly produced from these projects will become available. As a result, there is a limited amount of Moly available which could limit the quantity of TechneLite that we could manufacture, sell and distribute, resulting in a further substantial negative effect on our business, results of operations, financial condition and cash flows.
Most of the global suppliers of Moly rely on Framatone-CERCA in France to fabricate uranium targets and in some cases fuel for research reactors from which Moly is produced. Absent a new supplier, a supply disruption relating to uranium targets or fuel could have a substantial negative effect on our business, results of operations, financial condition and cash flows.
The instability of the global supply of Moly, including supply shortages, resulted in increases in the cost of Moly, which has negatively affected our margins, and more restrictive agreements with suppliers, which could further increase our costs
.
With the general instability in the global supply of Moly, including supply shortages during 2009 and 2010, we have faced substantial increases in the cost of Moly in comparison to historical costs. We expect these cost increases to continue in the future as the Moly suppliers move closer to a full cost recovery business model. The Organization of Economic Cooperation and Development (“OECD”) defines full cost recovery as the identification of all of the costs of production and recovering these costs from the market. While we are generally able to pass Moly cost increases on to our customers in our customer contracts, if we are not able to do so in the future, our margins may decline further with respect to our TechneLite generators, which could have a material adverse effect on our business, results of operations, financial condition and cash flows.
Our just-in-time manufacturing of radiopharmaceutical products relies on the timely receipt of radioactive raw materials and the timely shipment of finished goods, and any disruption of our supply or distribution networks could have a negative effect on our business
.
Because a number of our radiopharmaceutical products, including our TechneLite generators, rely on radioisotopes with limited half-lives, we must manufacture, finish and distribute these products on a just-in-time basis, because the underlying radioisotope is in a constant state of radio decay. For example, if we receive Moly in the morning of a manufacturing day for TechneLite generators, then we will generally ship finished generators to customers by the end of that same business day. Shipment of generators may be by next day delivery services or by either ground or air custom logistics. Any delay in us receiving radioisotopes from suppliers or being able to have finished products delivered to customers because of weather or other unforeseen transportation issues could have a negative effect on our business, results of operations, financial condition and cash flows.
26
Challenges with product quality or product performance, including defects, caused by us or our suppliers could result in a decrease in customers and revenues, unexpected expenses and loss of market share
.
The manufacture of our products is highly exacting and complex and must meet stringent quality requirements, due in part to strict regulatory requirements, including the FDA’s cGMPs. Problems may be identified or arise during manufacturing quality review, packaging or shipment for a variety of reasons including equipment malfunction, failure to follow specific protocols and procedures, defective raw materials and environmental factors. Additionally, manufacturing flaws, component failures, design defects, off-label uses or inadequate disclosure of product-related information could result in an unsafe condition or the injury or death of a patient. Those events could lead to a recall of, or issuance of a safety alert relating to, our products. We also may undertake voluntarily to recall products or temporarily shut down production lines based on internal safety and quality monitoring and testing data.
Quality, regulatory and recall challenges could cause us to incur significant costs, including costs to replace products, lost revenue, damage to customer relationships, time and expense spent investigating the cause and costs of any possible settlements or judgments related thereto and potentially cause similar losses with respect to other products. These challenges could also divert the attention of our management and employees from operational, commercial or other business efforts. If we deliver products with defects, or if there is a perception that our products or the processes related to our products contain errors or defects, we could incur additional recall and product liability costs, and our credibility and the market acceptance and sales of our products could be materially adversely affected. Due to the strong name recognition of our brands, an adverse event involving one of our products could result in reduced market acceptance and demand for all products within that brand, and could harm our reputation and our ability to market our products in the future. In some circumstances, adverse events arising from or associated with the design, manufacture or marketing of our products could result in the suspension or delay of regulatory reviews of our applications for new product approvals. These challenges could have a material adverse effect on our business, results of operations, financial condition and cash flows.
We face significant competition in our business and may not be able to compete effectively
.
The market for diagnostic medical imaging agents is highly competitive and continually evolving. Our principal competitors in existing diagnostic modalities include large, global companies with substantial financial, manufacturing, sales and marketing and logistics resources that are more diversified than ours, such as GE Healthcare, Bracco, Curium and Jubilant Life Sciences, as well as other competitors, including NorthStar Medical Radioisotopes. We cannot anticipate their actions in the same or competing diagnostic modalities, such as significant price reductions on products that are comparable to our own, development or introduction of new products that are more cost-effective or have superior performance than our current products, the introduction of generic versions when our proprietary products lose their patent protection or the new entry into a generic market in which we are already a participant. In addition, distributors of our products could attempt to shift end-users to competing diagnostic modalities and products. Our current or future products could be rendered obsolete or uneconomical as a result of these activities. Our failure to compete effectively could cause us to lose market share to our competitors and have a material adverse effect on our business, results of operations, financial condition and cash flows.
27
Risks Related to Reimbursement and Regulation
Certain of our customers are highly dependent on payments from third party payors, including government sponsored programs, particularly Medicare, in the U.S. and other countries in which we operate, and reductions in third party coverage and reimbursement rates for our products (or services provided with our products) could adversely affect our business and results of operations
.
A substantial portion of our revenue depends, in part, on the extent to which the costs of our products purchased by our customers are reimbursed by third party payors, including Medicare, Medicaid, other U.S. government sponsored programs, non-U.S. governmental payors and private payors. These third party payors exercise significant control over patient access and increasingly use their enhanced bargaining power to secure discounted rates and impose other requirements that may reduce demand for our products. Our potential customers’ ability to obtain appropriate reimbursement for products and services from these third party payors affects the selection of products they purchase and the prices they are willing to pay. For example, certain radiopharmaceuticals, when used for non-invasive imaging of the perfusion of the heart for the diagnosis and management of patients with known or suspected coronary artery disease, are currently subject to a Medicare National Coverage Determination (“NCD”). The NCD permits the coverage of such radiopharmaceuticals only when certain criteria are met. Our pipeline products, including flurpiridaz F 18, if approved, may become subject to this NCD, and may not be covered at all. If Medicare and other third party payors do not provide appropriate reimbursement for the costs of our products (or services provided using our products), deny the coverage of the products (or those services), or reduce current levels of reimbursement, healthcare professionals may not prescribe our products and providers and suppliers may not purchase our products. In addition, demand for new products may be limited unless we obtain favorable reimbursement policies (including coverage, coding and payment) from governmental and private third party payors at the time of the product’s introduction, which will depend, in part, on our ability to demonstrate that a new agent has a positive impact on clinical outcomes. Third party payors continually review their coverage policies for existing and new therapies and can deny coverage for treatments that include the use of our products or revise payment policies such that payments do not adequately cover the cost of our products. Even if third party payors make coverage and reimbursement available, that reimbursement may not be adequate or these payors’ reimbursement policies may have an adverse effect on our business, results of operations, financial condition and cash flows.
Over the past several years, Medicare has implemented numerous changes to payment policies for imaging procedures in both the hospital setting and non-hospital settings (which include physician offices and freestanding imaging facilities). Some of these changes have had a negative impact on utilization of imaging services. Examples of these changes include:
|
•
|
Limiting payments for imaging services in physician offices and free-standing imaging facility settings based upon rates paid to hospital outpatient departments;
|
|
•
|
Reducing payments for certain imaging procedures when performed together with other imaging procedures in the same family of procedures on the same patient on the same day in the physician office and free-standing imaging facility setting;
|
|
•
|
Making significant revisions to the methodology for determining the practice expense component of the Medicare payment applicable to the physician office and free-standing imaging facility setting which results in a reduction in payment; and
|
|
•
|
Revising payment policies and reducing payment amounts for imaging procedures performed in the hospital outpatient setting.
|
In the physician office and free-standing imaging facility setting, services provided using our products are reimbursed under the Medicare physician fee schedule. Since 2015, payments under the Medicare physician fee schedule have been subject to specific annual updates: a 0.5% update through 2019; no updates from 2020 to 2025; and, beginning in 2026, differential updates based on whether the physician participates in alternative payment models (with 0.75% updates for participants and 0.25% updates for non-participants). The legislation also adjusts the fee schedule payments, beginning in 2019, for certain physicians based on their performance under a consolidated measurement system (that measures performance with respect to quality, resource utilization, meaningful use of certified electronic health records technology, and clinical practice improvement activities). Also beginning in 2019, physicians may be eligible for a bonus based on the use of certain alternative payment models designated as “advanced” by CMS. The ongoing and future impact of these changes cannot be determined at this time.
28
We believe that Medicare changes to payment policies for imaging procedures applicable to non-hospital settings will continue to result in certain physician practices ceasing to provide these services and a further shifting of where certain medical imaging procedures are performed, from the physician office and free-standing imaging facility settings to the hospital outpatient setting. Changes applicable to Medicare payment in the hospital outpatient setting could also influence the decisions by hospital outpatient physicians to perform procedures that involve our products. Within the hospital outpatient setting, CMS payment policy is such that the use of many of our products are not separately payable by Medicare, although certain new drug products are eligible for separate payment for the first three years after approval. Specifically, since 2013, although Medicare generally does not provide separate payment to hospitals for the use of diagnostic radiopharmaceuticals administered in an outpatient setting, CMS has had a policy to make a nominal additional payment ($10) to hospitals that utilize products with non-HEU, meaning the product is 95% derived from non-HEU sources. This payment policy continues in 2018. Although some of our TechneLite generators are manufactured using non-HEU, not all of our TechneLite generators currently meet CMS’s definition of non-HEU, and therefore this payment is not available for doses produced by the latter category of TechneLite generators used by our customers. Changes to the Medicare hospital outpatient prospective payment system payment rates, including reductions implemented for certain hospital outpatient sites, could influence the decisions by hospital outpatient physicians to perform procedures that involve our products.
We also believe that all these changes and their resulting pressures may incrementally reduce the overall number of diagnostic medical imaging procedures performed. These changes overall could slow the acceptance and introduction of next-generation imaging equipment into the marketplace, which, in turn, could adversely impact the future market adoption of certain of our imaging agents already in the market or currently in clinical or preclinical development. We expect that there will continue to be proposals to reduce or limit Medicare and Medicaid payment for diagnostic services.
We also expect increased regulation and oversight of advanced diagnostic testing in which our products are used. Federal legislation requires CMS to develop appropriate use criteria (“AUC”) that professionals must consult when ordering advanced diagnostic imaging services (which include MRI, CT, nuclear medicine (including PET) and other advanced diagnostic imaging services that the Secretary of HHS, may specify). Beginning in 2020, the ordering professional will be required to consult a qualified clinical decision support mechanism, as identified by HHS, as to whether the ordered service adheres to the applicable AUC. Reimbursement penalties will apply in 2021 if this requirement is not met (and documented on the claim). To the extent that these types of changes have the effect of reducing the aggregate number of diagnostic medical imaging procedures performed in the U.S., our business, results of operations, financial condition and cash flows would be adversely affected. See Part I, Item I. “Business—Regulatory Matters.”
Reforms to the U.S. healthcare system may adversely affect our business
.
A significant portion of our patient volume is derived from U.S. government healthcare programs, principally Medicare, which are highly regulated and subject to frequent and substantial changes. The Healthcare Reform Act substantially changed the way healthcare is financed by both governmental and private insurers. The law contains a number of provisions that affect coverage and reimbursement of drug products and medical imaging procedures in which our drug products are used and/or that could potentially reduce the aggregate number of diagnostic medical imaging procedures performed in the U.S. See Part I, Item 1. “Business—Regulatory Matters—Healthcare Reform and Other Laws Affecting Payment.” Subsequently, the Medicare Access and CHIP Reauthorization Act of 2015 significantly revised the methodology for updating the Medicare physician fee schedule. And more recently, Congress enacted legislation in 2017 that eliminates the Healthcare Reform Act’s “individual mandate” beginning in 2019, which may significantly impact the number of covered lives participating in exchange plans. Congress continues to consider other healthcare reform legislation. There is no assurance that the Healthcare Reform Act, as currently enacted or as amended in the future, will not adversely affect our business and financial results, and we cannot predict how future federal or state legislative, judicial or administrative changes relating to healthcare reform will affect our business.
In addition, other legislative changes have been proposed and adopted since the Healthcare Reform Act was enacted. The Budget Control Act of 2011 and subsequent Congressional actions includes provisions to reduce the federal deficit. These provisions have resulted in the imposition of 2% reductions in Medicare payments to providers, which went into effect on April 1, 2013 and will remain in effect through 2024, and a 4% reduction in payment to providers during the first half of 2025 unless additional Congressional action is taken. Any significant spending reductions affecting Medicare, Medicaid or other publicly funded or subsidized health programs that may be implemented and/or any significant taxes or fees that may be imposed on us, as part of any broader deficit reduction effort or legislative replacement to the Budget Control Act, could have an adverse impact on our business, results of operations, financial condition and cash flows.
29
Further, changes in payor mix and reimbursement by private third party payors may also affect our business. Rates paid by some private third party payors are based, in part, on established physician, clinic and hospital charges and are generally higher than Medicare payment rates. Reductions in the amount of reimbursement paid for diagnostic medical imaging procedures and changes in the mix of our patients between non-governmental payors and government sponsored healthcare programs and among different types of non-government payor sources, could have a material adverse effect on our business, results of operations, financial condition and cash flows.
The full impact on our business of healthcare reforms and other new laws, or changes in existing laws, is uncertain. Nor is it clear whether additional legislative changes will be adopted or how those changes would affect our industry in general or our ability to successfully commercialize our products or develop new products.
Our business and industry are subject to complex and costly regulations. If government regulations are interpreted or enforced in a manner adverse to us or our business, we may be subject to enforcement actions, penalties, exclusion and other material limitations on our operations
.
Both before and after the approval of our products and agents in development, we, our products, development agents, operations, facilities, suppliers, distributors, contract manufacturers, contract research organizations and contract testing laboratories are subject to extensive and, in certain circumstances, expanding regulation by federal, state and local government agencies in the U.S. as well as non-U.S. and transnational laws and regulations, with regulations differing from country to country, including, among other things, anti-trust and competition laws and regulations. In the U.S., the FDA regulates, among other things, the pre-clinical testing, clinical trials, manufacturing, safety, efficacy, potency, labeling, storage, record keeping, quality systems, advertising, promotion, sale, distribution, and import and export of drug products. We are required to register our business for permits and/or licenses with, and comply with the stringent requirements of the FDA, the NRC, the HHS, Health Canada, the EMA, the MHRA, the CFDA, state and provincial boards of pharmacy, state and provincial health departments and other federal, state and provincial agencies.
Under U.S. law, for example, we are required to report certain adverse events and production problems, if any, to the FDA. We also have similar adverse event and production reporting obligations outside of the U.S., including to the EMA and MHRA. Additionally, we must comply with requirements concerning advertising and promotion for our products, including the prohibition on the promotion of our products for indications that have not been approved by the FDA or a so-called “off-label use.” If the FDA determines that our promotional materials constitute the unlawful promotion of an off-label use, it could request that we modify our promotional materials or subject us to regulatory or enforcement actions. Also, quality control and manufacturing procedures at our own facility and at third party suppliers must conform to cGMP regulations and other applicable law after approval, and the FDA periodically inspects manufacturing facilities to assess compliance with cGMPs and other applicable law, and, from time to time, makes those cGMPs more stringent. Accordingly, we and others with whom we work must expend time, money, and effort in all areas of regulatory compliance, including manufacturing, production and quality control. If in the future issues arise at a third party manufacturer, the FDA could take regulatory action which could limit or suspend the ability of that third party to manufacture our products or have any additional products approved at the relevant facility for manufacture until the issues are resolved and remediated. Such a limitation or suspension could have a material adverse effect on our business, results of operations, financial condition and cash flows.
We are also subject to laws and regulations that govern financial and other arrangements between pharmaceutical manufacturers and healthcare providers, including federal and state anti-kickback statutes, federal and state false claims laws and regulations and other fraud and abuse laws and regulations. For example, in 2010, we entered into a Medicaid Drug Rebate Agreement with the federal government for some but not all of our products, and in 2016 entered into a separate Medicaid Drug Rebate Agreement for the balance of our products. These agreements require us to report certain price information to the federal government that could subject us to potential liability under the FCA, civil monetary penalties or liability under other laws and regulations in connection with the covered products as well as the products not at the time covered by the agreements. Determination of the rebate amount that we pay to state Medicaid programs for our products, as well as determination of payment amounts for some of our products under Medicare and certain other third party payers, including government payers, depends upon information reported by us to the government. If we provide customers or government officials with inaccurate information about the products’ pricing or eligibility for coverage, or the products fail to satisfy coverage requirements, we could be terminated from the rebate program, be excluded from participation in government healthcare programs, or be subject to potential liability under the False Claims Act or other laws and regulations. See Part I, Item 1. “Business—Regulatory Matters—Healthcare Fraud and Abuse Laws.”
Failure to comply with other requirements and restrictions placed upon us or our third party manufacturers or suppliers by laws and regulations can result in fines, civil and criminal penalties, exclusion from federal healthcare programs and debarment. Possible consequences of those actions could include:
|
•
|
Substantial modifications to our business practices and operations;
|
30
|
•
|
Significantly reduced demand for our products (if products become ineligible for reimbursement under federal and state healthcare programs);
|
|
•
|
A total or partial shutdown of production in one or more of the facilities where our products are produced while the alleged violation is being remediated;
|
|
•
|
Delays in or the inability to obtain future pre-market clearances or approvals; and
|
|
•
|
Withdrawals or suspensions of our current products from the market.
|
Regulations are subject to change as a result of legislative, administrative or judicial action, which may also increase our costs or reduce sales. Violation of any of these regulatory schemes, individually or collectively, could disrupt our business and have a material adverse effect on our business, results of operations, financial condition and cash flows.
Our marketing and sales practices may contain risks that could result in significant liability, require us to change our business practices and restrict our operations in the future
.
We are subject to numerous domestic (federal, state and local) and foreign laws addressing fraud and abuse in the healthcare industry, including the FCA and Federal Anti-Kickback Statute, self-referral laws, the FCPA, the Bribery Act, FDA promotional restrictions, the federal disclosure (sunshine) law and state marketing and disclosure (sunshine) laws. Violations of these laws are punishable by criminal or civil sanctions, including substantial fines, imprisonment and exclusion from participation in healthcare programs such as Medicare and Medicaid as well as health programs outside the U.S., and even alleged violations can result in the imposition of corporate integrity agreements that could severely restrict or limit our business practices. See Part I, Item 1. “Business-Regulatory Matters-Healthcare Fraud and Abuse Laws and Laws Relating to Foreign Trade.” These laws and regulations are complex and subject to changing interpretation and application, which could restrict our sales or marketing practices. Even minor and inadvertent irregularities could potentially give rise to a charge that the law has been violated. Although we believe we maintain an appropriate compliance program, we cannot be certain that the program will adequately detect or prevent violations and/or the relevant regulatory authorities may disagree with our interpretation. Additionally, if there is a change in law, regulation or administrative or judicial interpretations, we may have to change one or more of our business practices to be in compliance with these laws. Required changes could be costly and time consuming.
If our operations are found to be in violation of these laws or any other government regulations that apply to us, we may be subject to penalties, including, without limitation, civil and criminal penalties, damages, fines, imprisonment, the curtailment or restructuring of our operations, or exclusion from state and federal healthcare programs including Medicare and Medicaid, any of which could have a material adverse effect on our business, results of operations, financial condition and cash flows.
As an Emerging Growth Company (“EGC”) under the JOBS Act, we have not been required to evaluate our internal control over financial reporting as required by Section 404 of the Sarbanes-Oxley Act. If we transition from being an EGC to being a “large accelerated filer,” we will be required to implement the necessary procedures and practices related to internal control over financial reporting, and we may identify deficiencies that we may not be able to remediate in time to meet the necessary deadline
.
Since our IPO in June 2015, we have been considered an EGC under the JOBS Act and have not been required to evaluate our internal controls over financial reporting as required by Section 404 of the Sarbanes-Oxley Act. Section 404 requires annual management assessments of the effectiveness of our internal control over financial reporting and a report by our independent registered public accounting firm on the effectiveness of those internal controls, starting with the year we cease being an EGC and become a “large accelerated filer.” That year could be as soon as 2018 if our market capitalization is at least $700 million on June 29, 2018. Once we are no longer an EGC, our independent registered public accounting firm will be required to attest to the effectiveness of our internal control over financial reporting on an annual basis. The rules governing the standards that must be met for our management to assess our internal control over financial reporting are complex and require significant documentation, testing and possible remediation of our existing controls and the incurrence of significant additional expenditures.
In connection with the implementation of the necessary procedures and practices related to internal control over financial reporting, we may identify deficiencies that we may not be able to remediate in time to meet the necessary deadline. In addition, we may encounter problems or delays in completing the implementation of any requested improvements and receiving a favorable attestation in connection with the attestation provided by our independent registered public accounting firm. We will be unable to issue securities in the public markets through the use of a shelf registration statement if we are not in compliance with Section 404. Furthermore, failure to achieve and maintain an effective internal control environment could limit our ability to report our financial results accurately and timely and have a material adverse effect on our business, results of operations, financial condition and cash flows.
31
Risks Related to Safety
Ultrasound contrast agents may cause side effects which could limit our ability to sell DEFINITY
.
DEFINITY is an ultrasound contrast agent based on perflutren lipid microspheres. In 2007, the FDA received reports of deaths and serious cardiopulmonary reactions following the administration of ultrasound micro-bubble contrast agents used in echocardiography. Four of the 11 reported deaths were caused by cardiac arrest occurring either during or within 30 minutes following the administration of the contrast agent; most of the serious but non-fatal reactions also occurred in this time frame. As a result, in October 2007, the FDA requested t
hat we and GE Healthcare, which distributes Optison, a competitor to DEFINITY, add a boxed warning to these products emphasizing the risk for serious cardiopulmonary reactions and that the use of these products was contraindicated in certain patients. In a strong reaction by the cardiology community to the FDA’s new position, a letter was sent to the FDA, signed by 161 doctors, stating that the benefit of these ultrasound contrast agents outweighed the risks and urging that the boxed warning be removed. In May 2008, the FDA substantially modified the boxed warning. On May 2, 2011, the FDA held an advisory committee meeting to consider the status of ultrasound micro-bubble contrast agents and the boxed warning. In October 2011, we received FDA approval of further modifications to the DEFINITY label, including: further relaxing the boxed warning; eliminating the sentence in the Indication and Use section “The safety and efficacy of DEFINITY with exercise stress or pharmacologic stress testing have not been established” (previously added in October 2007 in connection with the imposition of the box warning); and including summary data from the post-approval CaRES (Contrast echocardiography Registry for Safety Surveillance) safety registry and the post-approval pulmonary hypertension study. Further, in January 2017, the FDA approved an additional modification to the DEFINITY label, removing the contraindication statement related to use in patients with a known or suspected cardiac shunt. Bracco’s ultrasound contrast agent, Lumason, has substantially similar safety labeling as DEFINITY and Optison. If additional safety issues arise, this may result in unfavorable changes in labeling or result in restrictions on the approval of our product, including removal of the product from the market. Lingering safety concerns about DEFINITY among some healthcare providers or future unanticipated side effects or safety concerns associated with DEFINITY could limit expanded use of DEFINITY and have a material adverse effect on the unit sales of this product and our financial condition and results of operations.
A heightened public or regulatory focus on the radiation risks of diagnostic imaging could have an adverse effect on our business
.
We believe that there has been heightened public and regulatory focus on radiation exposure, including the concern that repeated doses of radiation used in diagnostic imaging procedures pose the potential risk of long-term cell damage, cancer and other diseases. For example, starting in January 2012, CMS required the accreditation of facilities providing the technical component of advanced imaging services, including CT, MRI, PET and nuclear medicine, in non-hospital freestanding settings. In August 2011, The Joint Commission (an independent, not-for-profit organization that accredits and certifies more than 20,500 healthcare organizations and programs in the U.S.) issued an alert on the radiation risks of diagnostic imaging and recommended specific actions for providing “the right test and the right dose through effective processes, safe technology and a culture of safety.” Revised accreditation standards issued by The Joint Commission for diagnostic imaging took effect in July 2015.
Heightened regulatory focus on risks caused by the radiation exposure received by diagnostic imaging patients could lead to increased regulation of radiopharmaceutical manufacturers or healthcare providers who perform procedures that use our imaging agents, which could make the procedures more costly, reduce the number of providers who perform procedures and/or decrease the demand for our products. In addition, heightened public focus on or fear of radiation exposure could lead to decreased demand for our products by patients or by healthcare providers who order the procedures in which our agents are used. Although we believe that our diagnostic imaging agents when properly used do not expose patients and healthcare providers to unsafe levels of radiation, any of the foregoing risks could have an adverse effect on our business, results of operations, financial condition and cash flows.
In the ordinary course of business, we may be subject to product liability claims and lawsuits, including potential class actions, alleging that our products have resulted or could result in an unsafe condition or injury
.
Any product liability claim brought against us, with or without merit, could be time consuming and costly to defend and could result in an increase of our insurance premiums. Although we have not had any such claims to date, claims that could be brought against us might not be covered by our insurance policies. Furthermore, although we currently have product liability insurance coverage with policy limits that we believe are customary for pharmaceutical companies in the diagnostic medical imaging industry and adequate to provide us with insurance coverage for foreseeable risks, even where the claim is covered by our insurance, our insurance coverage might be inadequate and we would have to pay the amount of any settlement or judgment that is in excess of our policy limits. We may not be able to obtain insurance on terms acceptable to us or at all, since insurance varies in cost and can be difficult to obtain. Our failure to maintain adequate insurance coverage or successfully defend against product liability claims could have a material adverse effect on our business, results of operations, financial condition and cash flows.
32
We use hazardous materials in our business and must comply with environmental laws and regulations, which can be expensive
.
Our operations use hazardous materials and produce hazardous wastes, including radioactive, chemical and, in certain circumstances, biological materials and wastes. We are subject to a variety of federal, state and local laws and regulations as well as non-U.S. laws and regulations relating to the transport, use, handling, storage, exposure to and disposal of these materials and wastes. Environmental laws and regulations are complex, change frequently and have become more stringent over time. We are required to obtain, maintain and renew various environmental permits and nuclear licenses. Although we believe that our safety procedures for transporting, using, handling, storing and disposing of, and limiting exposure to, these materials and wastes comply in all material respects with the standards prescribed by applicable laws and regulations, the risk of accidental contamination or injury cannot be eliminated. We place a high priority on these safety procedures and seek to limit any inherent risks. We generally contract with third parties for the disposal of wastes generated by our operations. Prior to disposal, we store any low level radioactive waste at our facilities to decay until the materials are no longer considered radioactive. Although we believe we have complied in all material respects with all applicable environmental, health and safety laws and regulations, we cannot assure you that we have been or will be in compliance with all such laws at all times. If we violate these laws, we could be fined, criminally charged or otherwise sanctioned by regulators. We may be required to incur further costs to comply with current or future environmental and safety laws and regulations. In addition, in the event of accidental contamination or injury from these materials, we could be held liable for any damages that result and any such liability could exceed our resources.
While we have budgeted for current and future capital and operating expenditures to maintain compliance with these laws and regulations, we cannot assure you that our costs of complying with current or future environmental, health and safety laws and regulations will not exceed our estimates or adversely affect our results of operations and financial condition. Further, we cannot assure you that we will not be subject to additional environmental claims for personal injury, investigation or cleanup in the future based on our past, present or future business activities.
Risks Related to Our Business
Our business depends on our ability to successfully introduce new products and adapt to a changing technology and diagnostic landscape
.
The healthcare industry is characterized by continuous technological development resulting in changing customer preferences and requirements. The success of new product development depends on many factors, including our ability to fund development of new agents, anticipate and satisfy customer needs, obtain regulatory approval on a timely basis based on performance of our agents in development versus their clinical study comparators, develop and manufacture products in a cost-effective and timely manner, maintain advantageous positions with respect to intellectual property and differentiate our products from our competitors. To compete successfully in the marketplace, we must make substantial investments in new product development whether internally or externally through licensing or acquisitions. Our failure to introduce new and innovative products in a timely manner would have an adverse effect on our business, results of operations, financial condition and cash flows.
Even if we are able to develop, manufacture and obtain regulatory approvals for our new products, the success of these products would depend upon market acceptance and adequate reimbursement. Levels of market acceptance for our new products could be affected by a number of factors, including:
|
•
|
The availability of alternative products from our competitors;
|
|
•
|
The price of our products relative to those of our competitors;
|
|
•
|
The timing of our market entry;
|
|
•
|
Our ability to market and distribute our products effectively;
|
|
•
|
Market acceptance of our products; and
|
|
•
|
Our ability to obtain adequate reimbursement.
|
33
The field of diagnostic medical imaging is dynamic, with new products, including equipment and agents, continually being developed and existing products continually being refined. Our own diagnostic imaging agents compete not only with other similarly administered imaging agents but also with imaging agents employed in different and often competing diagnostic modalities. New imaging agents in a given diagnostic modality may be developed that provide benefits superior to the then-dominant agent in that modality, resulting in commercial displacement. Similarly, changing perceptions about comparative efficacy and safety including, among other things, comparative radiation exposure, as well as changing availability of supply may favor one agent over another or one modality over another. In addition, new or revised appropriate use criteria developed by professional societies, to assist physicians and other health care providers in making appropriate imaging decisions for specific clinical conditions, can and have reduced the frequency of and demand for certain imaging modalities and imaging agents. To the extent there is technological obsolescence in any of our products that we manufacture, resulting in lower unit sales or decreased unit sales prices, we will have increased unit overhead allocable to the remaining market share, which could have a material adverse effect on our business, results of operations, financial condition and cash flows.
The process of developing new drugs and obtaining regulatory approval is complex, time-consuming and costly, and the outcome is not certain
.
We currently have three agents in development, two of which (flurpiridaz F 18 and LMI 1195) are currently in clinical development, while a third (LMI 1174) is in pre-clinical development. To obtain regulatory approval for these agents, we must conduct extensive human tests, which are referred to as clinical trials, as well as meet other rigorous regulatory requirements, as further described in Part I, Item 1. “Business—Regulatory Matters.” Satisfaction of all regulatory requirements typically takes many years and requires the expenditure of substantial resources. A number of other factors may cause significant delays in the completion of our clinical trials, including unexpected delays in the initiation of clinical sites, slower than projected enrollment, competition with ongoing clinical trials and scheduling conflicts with participating clinicians, regulatory requirements, limits on manufacturing capacity and failure of an agent to meet required standards for administration to humans. In addition, it may take longer than we project to achieve study endpoints and complete data analysis for a trial or we may decide to slow down the enrollment in a trial in order to conserve financial resources.
Our agents in development are also subject to the risks of failure inherent in drug development and testing. The results of preliminary studies do not necessarily predict clinical success, and larger and later stage clinical trials may not produce the same results as earlier stage trials. Sometimes, agents that have shown promising results in early clinical trials have subsequently suffered significant setbacks in later clinical trials. Agents in later stage clinical trials may fail to show desired safety and efficacy traits, despite having progressed through initial clinical testing. In addition, the data collected from clinical trials of our agents in development may not be sufficient to support regulatory approval, or regulators could interpret the data differently and less favorably than we do. Further, the design of a clinical trial can determine whether its results will support approval of a product, and flaws in the design of a clinical trial may not become apparent until the clinical trial is well advanced. Clinical trials of potential products often reveal that it is not practical or feasible to continue development efforts. Regulatory authorities may require us or our partners to conduct additional clinical testing, in which case we would have to expend additional time and resources. The approval process may also be delayed by changes in government regulation, future legislation or administrative action or changes in regulatory policy that occur prior to or during regulatory review. The failure to provide clinical and preclinical data that are adequate to demonstrate to the satisfaction of the regulatory authorities that our agents in development are safe and effective for their proposed use will delay or preclude approval and will prevent us from marketing those products.
We are not permitted to market our agents in development in the U.S. or other countries until we have received requisite regulatory approvals. For example, securing FDA approval for a new drug requires the submission of an NDA to the FDA for our agents in development. The NDA must include extensive nonclinical and clinical data and supporting information to establish the agent’s safety and effectiveness for each indication. The NDA must also include significant information regarding the chemistry, manufacturing and controls for the product. The FDA review process can take many years to complete, and approval is never guaranteed. If a product is approved, the FDA may limit the indications for which the product may be marketed, require extensive warnings on the product labeling, impose restricted distribution programs, require expedited reporting of certain adverse events, or require costly ongoing requirements for post-marketing clinical studies and surveillance or other risk management measures to monitor the safety or efficacy of the agent. Markets outside of the U.S. also have requirements for approval of agents with which we must comply prior to marketing. Obtaining regulatory approval for marketing of an agent in one country does not ensure we will be able to obtain regulatory approval in other countries, but a failure or delay in obtaining regulatory approval in one country may have a negative effect on the regulatory process in other countries. Also, any regulatory approval of any of our products or agents in development, once obtained, may be withdrawn. Approvals might not be granted on a timely basis, if at all.
In our flurpiridaz F 18 Phase 3 program, in May 2015, we announced complete results from the 301 trial. Although flurpiridaz F 18 appeared to be well-tolerated from a safety perspective and outperformed SPECT in a highly statistically significant manner in the co-primary endpoint of sensitivity and in the secondary endpoints of image quality and diagnostic certainty, the agent did not meet its other co-primary endpoint of non-inferiority for identifying subjects without disease. In April 2017, we entered into the License
34
Agreement with GE Healthcare for the continued Phase 3 development and worldwide commercialization of flurpiridaz F 18. Under the License Agreement, GE Healthcare will, among other things, complete the worldwide development of flurpiridaz F 18 by conducting a second Phase 3 trial and pursue worldwide regulatory approvals. We cannot assure any particular outcome from GE Healthcare’s continued Phase 3 development of the agent or from regulatory review of either our or their Phase 3 study of the agent, that any of the data generated in either our or their sponsored Phase 3 study will be sufficient to support an NDA approval, that GE Healthcare will only have to conduct the one additional Phase 3 clinical study prior to filing an NDA, or that flurpiridaz F 18 will ever be approved as a PET MPI imaging agent by the FDA.
Similarly, we can give no assurance that we will be successful in either of our two new internal clinical development programs - DEFINITY for an EF indication and LMI 1195 for heart failure patient risk stratification.
See Part I, Item 1. “Business-Regulatory Matters-Food and Drug Laws.” Any failure or significant delay in completing clinical trials for our product candidates or in receiving regulatory approval for the sale of our product candidates may severely harm our business and delay or prevent us from being able to generate revenue from product sales.
Even if our agents in development proceed successfully through clinical trials and receive regulatory approval, there is no guarantee that an approved product can be manufactured in commercial quantities at a reasonable cost or that such a product will be successfully marketed or distributed. The burden associated with the marketing and distribution of products like ours is substantial. For example, rather than being manufactured at our own facilities, both flurpiridaz F 18 and LMI 1195 would require the creation of a complex, field-based network involving PET cyclotrons located at radiopharmacies where the agent would need to be manufactured and distributed rapidly to end-users, given the agent’s 110-minute half-life. In addition, in the case of both flurpiridaz F 18 and LMI 1195, obtaining adequate reimbursement is critical, including not only coverage from Medicare, Medicaid, other government payors as well as private payors but also appropriate payment levels which adequately cover the substantially higher manufacturing and distribution costs associated with a PET agent in comparison to a Technetium-based agent. We can give no assurance even if either flurpiridaz F 18 or LMI 1195 obtains regulatory approval that a network of PET cyclotrons can be established or that adequate reimbursement can be secured to allow the approved agent or agents to become commercially successful.
Our future growth may depend on our ability to identify and in-license or acquire additional products, and if we do not successfully do so, or otherwise fail to integrate any new products into our operations, we may have limited growth opportunities and it could materially adversely affect our relationships with customers and/or result in significant impairment charges
.
We are continuing to seek to acquire or in-license products, businesses or technologies that we believe are a strategic fit with our business strategy. Future in-licenses or acquisitions, however, may entail numerous operational and financial risks, including:
|
•
|
Exposure to unknown liabilities;
|
|
•
|
Disruption of our business, customer base and diversion of our management’s time and attention to develop acquired products or technologies;
|
|
•
|
A reduction of our current financial resources;
|
|
•
|
Difficulty or inability to secure financing to fund development activities for those acquired or in-licensed technologies;
|
|
•
|
Incurrence of substantial debt or dilutive issuances of securities to pay for acquisitions; and
|
|
•
|
Higher than expected acquisition and integration costs.
|
We may not have sufficient resources to identify and execute the acquisition or in-licensing of third party products, businesses and technologies and integrate them into our current infrastructure. In particular, we may compete with larger pharmaceutical companies and other competitors in our efforts to establish new collaborations and in-licensing opportunities. These competitors likely will have access to greater financial resources than we do and may have greater expertise in identifying and evaluating new opportunities. Furthermore, there may be overlap between our products or customers and the companies which we acquire that may create conflicts in relationships or other commitments detrimental to the integrated businesses. Additionally, the time between our expenditures to in-license or acquire new products, technologies or businesses and the subsequent generation of revenues from those acquired products, technologies or businesses (or the timing of revenue recognition related to licensing agreements and/or strategic collaborations) could cause fluctuations in our financial performance from period to period. Finally, if we devote resources to potential acquisitions or in-licensing opportunities that are never completed, or if we fail to realize the anticipated benefits of those efforts, we could incur significant impairment charges or other adverse financial consequences.
If we are unable to protect our intellectual property, our competitors could develop and market products with features similar to our products, and demand for our products may decline
.
Our commercial success will depend in part on obtaining and maintaining patent protection and trade secret protection of our commercial products and technologies and agents in development as well as successfully defending these patents and trade secrets against third party challenges, both in the U.S. and in foreign countries. We will only be able to protect our intellectual property from unauthorized use by third parties to the extent that we maintain the secrecy of our trade secrets and can enforce our valid patents and trademarks.
35
The patent positions of pharmaceutical and biotechnology companies can be highly uncertain and involve complex legal and factual questions for which important legal principles remain unresolved. In addition, changes in either the patent laws or in interpretations of patent laws in the U.S. or other countries may diminish the value of our intellectual property and we may not receive the same degree of protection in every jurisdiction. Accordingly, we cannot predict the breadth of claims that may be allowed or enforced in our patents or in third party patents.
The degree of future protection for our proprietary rights is uncertain because legal means afford only limited protection and may not adequately protect our rights or permit us to gain or keep our competitive advantage. For example:
|
•
|
We might not have been the first to make the inventions covered by each of our pending patent applications and issued patents, and we could lose our patent rights as a result;
|
|
•
|
We might not have been the first to file patent applications for these inventions or our patent applications may not have been timely filed, and we could lose our patent rights as a result;
|
|
•
|
Others may independently develop similar or alternative technologies or duplicate any of our technologies;
|
|
•
|
It is possible that none of our pending patent applications will result in any further issued patents;
|
|
•
|
Our issued patents may not provide a basis for commercially viable drugs, may not provide us with any protection from unauthorized use of our intellectual property by third parties, and may not provide us with any competitive advantages;
|
|
•
|
Our patent applications or patents may be subject to interferences, oppositions, post-grant review, ex-parte re-examinations, inter-partes review or similar administrative proceedings;
|
|
•
|
While we generally apply for patents in those countries where we intend to make, have made, use or sell patented products, we may not be able to accurately predict all of the countries where patent protection will ultimately be desirable and may be precluded from doing so at a later date;
|
|
•
|
We may choose not to seek patent protection in certain countries where the actual cost outweighs the perceived benefit at a certain time;
|
|
•
|
Patents issued in foreign jurisdictions may have different scopes of coverage as our U.S. patents and so our products may not receive the same degree of protection in foreign countries as they would in the U.S.;
|
|
•
|
We may not develop additional proprietary technologies that are patentable; or
|
|
•
|
The patents of others may have an adverse effect on our business.
|
Moreover, the issuance of a patent is not conclusive as to its validity or enforceability. A third party may challenge the validity or enforceability of a patent even after its issuance by the U.S. Patent and Trademark Office or the applicable foreign patent office. It is also uncertain how much protection, if any, will be afforded by our patents if we attempt to enforce them and they are challenged in court or in other proceedings, which may be brought in U.S. or non-U.S. jurisdictions to challenge the validity of a patent.
The defense and prosecution of intellectual property suits, interferences, oppositions and related legal and administrative proceedings are costly, time consuming to pursue and result in diversion of resources. The outcome of these proceedings is uncertain and could significantly harm our business. If we are not able to defend the patents of our technologies and products, then we will not be able to exclude competitors from marketing products that directly compete with our products, which could have a material adverse effect on our business, results of operations, financial condition and cash flows.
We will also rely on trade secrets and other know-how and proprietary information to protect our technology, especially where we do not believe patent protection is appropriate or obtainable. However, trade secrets are difficult to protect. We use reasonable efforts to protect our trade secrets, but our employees, consultants, contractors, outside scientific partners and other advisors may unintentionally or willfully disclose our confidential information to competitors or other third parties. Enforcing a claim that a third party improperly obtained and is using our trade secrets is expensive and time consuming, and the outcome is unpredictable. In addition, courts outside the U.S. are sometimes less willing to protect trade secrets. Moreover, our competitors may independently develop equivalent knowledge, methods and know-how. We rely on confidentiality agreements with our collaborators, employees, consultants and other third parties and invention assignment agreements with our employees to protect our trade secrets and other know-how and proprietary information concerning our business. These confidentiality agreements may not prevent unauthorized disclosure of trade secrets and other know-how and proprietary information, and there can be no guarantee that an employee or an outside party will not make an unauthorized disclosure of our trade secrets, other technical know-how or proprietary information, or that we can detect such an unauthorized disclosure. We may not have adequate remedies for any unauthorized disclosure. This might happen intentionally or inadvertently. It is possible that a competitor will make use of that information, and that our competitive position will be compromised, in spite of any legal action we might take against persons making those unauthorized disclosures, which could have a material adverse effect on our business, results of operations, financial condition and cash flows.
36
We rely on our trademarks, trade names and brand names to distinguish our products from the products of our competitors, and have registered or applied to register many of these trademarks, including DEFINITY, Cardiolite, TechneLite, Neurolite, Quadramet, Luminity, Miraluma and Lantheus Medical Imaging. We cannot assure you that any pending trademark applications will be approved. Third parties may also oppose our trademark applications, or otherwise challenge our use of the trademarks. If our trademarks are successfully challenged, we could be forced to re-brand our products, which could result in loss of brand recognition, and could require us to devote resources to advertising and marketing new brands. Further, we cannot assure you that competitors will not infringe our trademarks, or that we will have adequate resources to enforce our trademarks.
We may be subject to claims that we have infringed, misappropriated or otherwise violated the patent or other intellectual property rights of a third party. The outcome of any of these claims is uncertain and any unfavorable result could adversely affect our business, financial condition and results of operations
.
We may be subject to claims by third parties that we have infringed, misappropriated or otherwise violated their intellectual property rights. While we believe that the products that we currently manufacture using our proprietary technology do not infringe upon or otherwise violate proprietary rights of other parties or that meritorious defenses would exist with respect to any assertions to the contrary, we cannot assure you that we would not be found to infringe on or otherwise violate the proprietary rights of others.
We may be subject to litigation over infringement claims regarding the products we manufacture or distribute. This type of litigation can be costly and time consuming and could divert management’s attention and resources, generate significant expenses, damage payments (potentially including treble damages) or restrictions or prohibitions on our use of our technology, which could adversely affect our business, results of operations, financial condition and cash flows. In addition, if we are found to be infringing on proprietary rights of others, we may be required to develop non-infringing technology, obtain a license (which may not be available on reasonable terms, or at all), make substantial one-time or ongoing royalty payments, or cease making, using and/or selling the infringing products, any of which could have a material adverse effect on our business, results of operations, financial condition and cash flows.
We may be adversely affected by prevailing economic conditions and financial, business and other factors beyond our control
.
Our ability to attract and retain customers, invest in and grow our business and meet our financial obligations depends on our operating and financial performance, which, in turn, is subject to numerous factors, including the prevailing economic conditions and financial, business and other factors beyond our control, such as the rate of unemployment, the number of uninsured persons in the U.S. and inflationary pressures. We cannot anticipate all the ways in which the current or future economic climate and financial market conditions could adversely impact our business. We are exposed to risks associated with reduced profitability and the potential financial instability of our customers, many of which may be adversely affected by volatile conditions in the financial markets. For example, unemployment and underemployment, and the resultant loss of insurance, may decrease the demand for healthcare services and pharmaceuticals. If fewer patients are seeking medical care because they do not have insurance coverage, our customers may experience reductions in revenues, profitability and/or cash flow that could lead them to modify, delay or cancel orders for our products. If customers are not successful in generating sufficient revenue or are precluded from securing financing, they may not be able to pay, or may delay payment of, accounts receivable that are owed to us. This, in turn, could adversely affect our financial condition and liquidity. To the extent prevailing economic conditions result in fewer procedures being performed, our business, results of operations, financial condition and cash flows could be adversely affected.
Our business is subject to international economic, political and other risks that could negatively affect our results of operations or financial position
.
For the years ended
December 31, 2017
,
2016
and
2015
, we derived approximately
13%
,
15%
and
20%
of our revenues from outside the fifty United States, respectively. Accordingly, our business is subject to risks associated with doing business internationally, including:
|
•
|
Less stable political and economic environments and changes in a specific country’s or region’s political or economic conditions, including on-going political and military tensions on the Korean peninsula which could adversely affect our alternative microbubble formulation program at SBL;
|
|
•
|
Entering into or renewing commercial agreements with international governments or provincial authorities or entities directly or indirectly controlled by such governments or authorities, such as our Chinese partner Double-Crane Pharmaceutical Company;
|
|
•
|
International customers which are agencies or institutions of foreign governments;
|
|
•
|
Local business practices which may be in conflict with the U.S. Foreign Corrupt Practices Act and U.K. Bribery Act;
|
|
•
|
Currency fluctuations;
|
37
|
•
|
Potential negative consequences from changes in tax laws affecting our ability to repatriate profits;
|
|
•
|
Unfavorable labor regulations;
|
|
•
|
Greater difficulties in relying on non-U.S. courts to enforce either local or U.S. laws, particularly with respect to intellectual property;
|
|
•
|
Greater potential for intellectual property piracy;
|
|
•
|
Greater difficulties in managing and staffing non-U.S. operations;
|
|
•
|
The need to ensure compliance with the numerous in-country and international regulatory and legal requirements applicable to our business in each of these jurisdictions and to maintain an effective compliance program to ensure compliance with these requirements;
|
|
•
|
Changes in public attitudes about the perceived safety of nuclear facilities;
|
|
•
|
Changes in trade policies, regulatory requirements and other barriers;
|
|
•
|
Civil unrest or other catastrophic events; and
|
|
•
|
Longer payment cycles of non-U.S. customers and difficulty collecting receivables in non-U.S. jurisdictions.
|
These factors are beyond our control. The realization of any of these or other risks associated with operating outside the fifty United States could have a material adverse effect on our business, results of operations, financial condition and cash flows. As our international exposure increases and as we execute our strategy of international expansion, these risks may intensify.
We face currency and other risks associated with international sales
.
We generate revenue from export sales, as well as from operations conducted outside the fifty United States. During the years ended
December 31, 2017
,
2016
and
2015
, the net impact of foreign currency changes on transactions was a gain of
$0.3 million
and losses of
$0.9 million
and
$1.8 million
, respectively. Operations outside the U.S. expose us to risks including fluctuations in currency values, trade restrictions, tariff and trade regulations, U.S. export controls, non‑U.S. tax laws, shipping delays and economic and political instability. For example, violations of U.S. export controls, including those administered by the U.S. Treasury Department’s Office of Foreign Assets Control, could result in fines, other civil or criminal penalties and the suspension or loss of export privileges which could have a material adverse effect on our business, results of operations, financial conditions and cash flows.
With the exception of our United Kingdom subsidiary, the functional currencies of our International Segment subsidiaries are the respective local currencies of each entity. Exchange rates between some of these currencies and the U.S. Dollar have fluctuated significantly in recent years and may do so in the future. Historically, we have not used derivative financial instruments or other financial instruments to hedge against economic exposures related to foreign currencies.
Many of our customer relationships outside of the U.S. are, either directly or indirectly, with governmental entities, and we could be adversely affected by violations of the FCPA and similar worldwide anti-bribery laws outside the U.S
.
The FCPA, the Bribery Act and similar worldwide anti-bribery laws in non-U.S. jurisdictions generally prohibit companies and their intermediaries from making improper payments to non-U.S. officials for the purpose of obtaining or retaining business.
The FCPA prohibits us from providing anything of value to foreign officials for the purposes of obtaining or retaining business or securing any improper business advantage. It also requires us to keep books and records that accurately and fairly reflect our transactions. Because of the predominance of government-sponsored healthcare systems around the world, many of our customer relationships outside of the U.S. are, either directly or indirectly, with governmental entities and are therefore subject to the FCPA and similar anti-bribery laws in non-U.S. jurisdictions. In addition, the provisions of the Bribery Act extend beyond bribery of foreign public officials and are more onerous than the FCPA in a number of other respects, including jurisdiction, non-exemption of facilitation payments and penalties.
Our policies mandate compliance with these anti-bribery laws. We operate in many parts of the world that have experienced governmental corruption to some degree, and in certain circumstances strict compliance with anti-bribery laws may conflict with local customs and practices. Despite our training and compliance programs, our internal control policies and procedures may not always protect us from reckless or criminal acts committed by our employees or agents. Violations of these laws, or allegations of those violations, could disrupt our business and result in a material adverse effect on our results of operations, financial condition and cash flows.
38
Our business depends on the continued effectiveness and availability of our information technology infrastructure, and failures of this infrastructure could harm our operations
.
To remain competitive in our industry, we must employ information technologies to support manufacturing processes, quality processes, distribution, R&D and regulatory applications and that capture, manage and analyze large streams of data in compliance with applicable regulatory requirements. We rely extensively on technology, some of which is managed by third-party service providers, to allow the concurrent conduct of work sharing around the world. As with all information technology, our equipment and infrastructure age and become subject to increasing maintenance and repair and our systems generally are vulnerable to potential damage or interruptions from fires, natural disasters, power outages, blackouts, machinery breakdown, telecommunications failures and other unexpected events, as well as to break-ins, sabotage, increasingly sophisticated intentional acts of vandalism or cyber threats which, due to the nature of such attacks, may remain undetected for a period of time. As these threats continue to evolve, we may be required to expend additional resources to enhance our information security measures or to investigate and remediate any information security vulnerabilities. Given the extensive reliance of our business on technology, any substantial disruption or resulting loss of data that is not avoided or corrected by our backup measures could harm our business, reputation, operations and financial condition.
We may be limited in our ability to utilize, or may not be able to utilize, net operating loss carryforwards to reduce our future tax liability
.
As of December 31, 2017, we had federal income tax loss carryforwards of
$233.5 million
, which will begin to expire in
2030
and will completely expire in
2037
. We may be limited in our ability to use these tax loss carryforwards to reduce our future U.S. federal income tax liabilities if we were to experience another “ownership change” as specified in Section 382 of the Internal Revenue Code including if we were to issue a certain amount of equity securities, certain of our stockholders were to sell shares of our common stock, or we were to enter into certain strategic transactions.
We may not be able to hire or retain the number of qualified personnel, particularly scientific, medical and sales personnel, required for our business, which would harm the development and sales of our products and limit our ability to grow
.
Competition in our industry for highly skilled scientific, healthcare and sales personnel is intense. Although we have not had any material difficulty in the past in hiring or retaining qualified personnel, if we are unable to retain our existing personnel, or attract and train additional qualified personnel, either because of competition in our industry for these personnel or because of insufficient financial resources, then our growth may be limited and it could have a material adverse effect on our business.
If we lose the services of our key personnel, our business could be adversely affected
.
Our success is substantially dependent upon the performance, contributions and expertise of our chief executive officer, executive leadership and senior management team. Mary Anne Heino, our Chief Executive Officer and President, and other members of our executive leadership and senior management team play a significant role in generating new business and retaining existing customers. We have an employment agreement with Ms. Heino and a limited number of other individuals on our executive leadership team, although we cannot prevent them from terminating their employment with us. We do not maintain key person life insurance policies on any of our executive officers. While we have experienced both voluntary and involuntary turnover on our executive leadership team, to date we have been able to attract new, qualified individuals to lead our company and key functional areas. Our inability to retain our existing executive leadership and senior management team, maintain an appropriate internal succession program or attract and retain additional qualified personnel could have a material adverse effect on our business.
Risks Related to Our Capital Structure
We have a substantial amount of indebtedness which may limit our financial and operating activities and may adversely affect our ability to incur additional debt to fund future needs
.
As of
December 31, 2017
, we had approximately
$272.9 million
of total principal indebtedness remaining under our five‑year secured term loan facility, which matures on
June 30, 2022
(the “2017 Term Facility”) and
availability under our Revolving Facility
(the “2017 Revolving Facility” and, together with the 2017 Term Facility, the “2017 Facility”)
of
$75.0 million
. Our substantial indebtedness and any future indebtedness we incur could:
|
•
|
Require us to dedicate a substantial portion of cash flow from operations to the payment of interest on and principal of our indebtedness, thereby reducing the funds available for other purposes;
|
|
•
|
Make it more difficult for us to satisfy and comply with our obligations with respect to our outstanding indebtedness, namely the payment of interest and principal;
|
|
•
|
Make it more difficult to refinance the outstanding indebtedness;
|
|
•
|
Subject us to increased sensitivity to interest rate increases;
|
39
|
•
|
Make us more vulnerable to economic downturns, adverse industry or company conditions or catastrophic external events;
|
|
•
|
Limit our ability to withstand competitive pressures;
|
|
•
|
Reduce our flexibility in planning for or responding to changing business, industry and economic conditions; and
|
|
•
|
Place us at a competitive disadvantage to competitors that have relatively less debt than we have.
|
In addition, our substantial level of indebtedness could limit our ability to obtain additional financing on acceptable terms, or at all, for working capital, capital expenditures and general corporate purposes. Our liquidity needs could vary significantly and may be affected by general economic conditions, industry trends, performance and many other factors not within our control.
We may not be able to generate sufficient cash flow to meet our debt service obligations
.
Our ability to generate sufficient cash flow from operations to make scheduled payments on our debt obligations will depend on our future financial performance, which will be affected by a range of economic, competitive and business factors, many of which are outside of
our control. If we do not generate sufficient cash flow from operations to satisfy our debt obligations, including interest and principal payments, our credit ratings could be downgraded, and we may have to undertake alternative financing plans, such as refinancing or restructuring our debt, selling assets, entering into additional corporate collaborations or licensing arrangements for one or more of our products or agents in development, reducing or delaying capital investments or seeking to raise additional capital. We cannot assure you that any refinancing would be possible, that any assets could be sold, licensed or partnered, or, if sold, licensed or partnered, of the timing of the transactions and the amount of proceeds realized from those transactions, that additional financing could be obtained on acceptable terms, if at all, or that additional financing would be permitted under the terms of our various debt instruments then in effect. Furthermore, our ability to refinance would depend upon the condition of the financial and credit markets. Our inability to generate sufficient cash flow to satisfy our debt obligations, or to refinance our obligations on commercially reasonable terms or on a timely basis, would have an adverse effect on our business, results of operations and financial condition.
Despite our substantial indebtedness, we may incur more debt, which could exacerbate the risks described above
.
We and our subsidiaries may be able to incur substantial additional indebtedness in the future subject to the limitations contained in the agreements governing our debt, including the 2017 Facility. Although these agreements restrict us and our restricted subsidiaries from incurring additional indebtedness, these restrictions are subject to important exceptions and qualifications. For example, we are generally permitted to incur certain indebtedness, including indebtedness arising in the ordinary course of business, indebtedness among restricted subsidiaries and us and indebtedness relating to hedging obligations. See Part II, Item 7. “Management’s Discussion and Analysis of Financial Condition and Results of Operations—Liquidity and Capital Resources—External Sources of Liquidity.” If we or our subsidiaries incur additional debt, the risks that we and they now face as a result of our high leverage could intensify. In addition, 2017 Facility will not prevent us from incurring obligations that do not constitute indebtedness under the agreements.
Our 2017 Facility contains restrictions that will limit our flexibility in operating our business
.
Our 2017 Facility contains various covenants that limit our ability to engage in specified types of transactions. These covenants limit our and our restricted subsidiaries’ ability to, among other things:
|
•
|
Maintain net leverage above certain specified levels;
|
|
•
|
Incur additional debt;
|
|
•
|
Pay dividends or make other distributions;
|
|
•
|
Redeem stock;
|
|
•
|
Issue stock of subsidiaries;
|
|
•
|
Make certain investments;
|
|
•
|
Create liens;
|
|
•
|
Enter into transactions with affiliates; and
|
|
•
|
Merge, consolidate or transfer all or substantially all of our assets.
|
A breach of any of these covenants could result in a default under the 2017 Facility. We may also be unable to take advantage of business opportunities that arise because of the limitations imposed on us by the restrictive covenants under our indebtedness.
40
U.S. credit markets may impact our ability to obtain financing or increase the cost of future financing, including interest rate fluctuations based on macroeconomic conditions that are beyond our control
.
During periods of volatility and disruption in the U.S., European, or global credit markets, obtaining additional or replacement financing may be more difficult and the cost of issuing new debt or replacing our 2017 Facility could be higher than under our current 2017 Facility. Higher cost of new debt may limit our ability to have cash on hand for working capital, capital expenditures and acquisitions on terms that are acceptable to us. Additionally, our 2017 Facility has variable interest rates. By its nature, a variable interest rate will move up or down based on changes in the economy and other factors, all of which are beyond our control. If interest rates increase, our interest expense could increase, affecting earnings and reducing cash flows available for working capital, capital expenditures and acquisitions.
Our stock price could fluctuate significantly, which could cause the value of your investment to decline, and you may not be able to resell your shares at or above your purchase price
.
Securities markets worldwide have experienced, and may continue to experience, significant price and volume fluctuations. This market volatility, as well as general economic, market or political conditions, could reduce the market price of our common stock regardless of our operating performance. The trading price of our common stock is likely to be volatile and subject to wide price fluctuations in response to various factors, including:
|
•
|
Market conditions in the broader stock market;
|
|
•
|
Actual or anticipated fluctuations in our quarterly financial and operating results;
|
|
•
|
Issuance of new or changed securities analysts’ reports or recommendations;
|
|
•
|
Investor perceptions of us and the medical technology and pharmaceutical industries;
|
|
•
|
Sales, or anticipated sales, of large blocks of our stock;
|
|
•
|
Acquisitions or introductions of new products or services by us or our competitors;
|
|
•
|
Additions or departures of key personnel;
|
|
•
|
Regulatory or political developments;
|
|
•
|
Loss of intellectual property protections;
|
|
•
|
Litigation and governmental investigations; and
|
|
•
|
Changing economic conditions.
|
These and other factors may cause the market price and demand for our common stock to fluctuate substantially, which may limit or prevent investors from readily selling their shares of common stock and may otherwise negatively affect the liquidity of our common stock. In addition, in the past, when the market price of a stock has been volatile, holders of that stock have sometimes instituted securities class action litigation against the company that issued the stock. If any of our stockholders brought a lawsuit against us, we could incur substantial costs defending the lawsuit. Such a lawsuit could also divert the time and attention of our management from our business, which could significantly harm our profitability and reputation.
If securities or industry analysts do not publish research or reports about our business, if they adversely change their recommendations regarding our stock or if our results of operations do not meet their expectations, our stock price and trading volume could decline
.
The trading market for our common stock will be influenced by the research and reports that industry or securities analysts publish about us or our business. If one or more of these analysts cease coverage of our company or fail to publish reports on us regularly, we could lose visibility in the financial markets, which in turn could cause our stock price or trading volume to decline. Moreover, if one or more of the analysts who cover us downgrade our stock, or if our results of operations do not meet their expectations, our stock price could also decline.
We do not anticipate paying any cash dividends for the foreseeable future
.
We currently intend to retain our future earnings, if any, for the foreseeable future, to repay indebtedness and to fund the development and growth of our business. We do not intend to pay any dividends to holders of our common stock and the agreements governing our senior secured credit facilities limit our ability to pay dividends. As a result, capital appreciation in the price of our common stock, if any, will be your only source of gain on an investment in our common stock. See Part II, Item 5. “Market for Registrant’s Common Equity, Related Stockholder Matters and Issuer Purchases of Equity Securities—Dividend Policy”.
41
None.
The following table summarizes information regarding our significant leased and owned properties, as of
December 31, 2017
:
|
Location
|
Purpose
|
Segment
|
Square
Footage
|
Ownership
|
Lease Term
End
|
||||||
|
U.S.
|
|||||||||||
|
North Billerica,
Massachusetts
|
Corporate Headquarters, Manufacturing, Laboratory, Mixed Use and Other Office Space
|
U.S. Segment
|
578,000
|
|
Owned
|
N/A
|
|||||
|
Canada
|
|||||||||||
|
Quebec
|
Mixed Use and Office Space
|
International
Segment |
1,202
|
|
Leased
|
April 2019
|
|||||
|
Quebec
|
Distribution Center and Office Space
|
International
Segment |
1,433
|
|
Leased
|
May 2019
|
|||||
|
Puerto Rico
|
|||||||||||
|
San Juan
|
Manufacturing, Laboratory, Mixed Use and Office Space
|
International
Segment |
9,550
|
|
Leased
|
October 2024
|
|||||
We believe all of these facilities are well-maintained and suitable for the office, radiopharmacy, manufacturing or warehouse operations conducted in them and provide adequate capacity for current and foreseeable future needs.
From time to time, we are a party to various legal proceedings arising in the ordinary course of business. In addition, we have in the past been, and may in the future be, subject to investigations by governmental and regulatory authorities which expose us to greater risks associated with litigation, regulatory or other proceedings, as a result of which we could be required to pay significant fines or penalties. The outcome of litigation, regulatory or other proceedings cannot be predicted with certainty, and some lawsuits, claims, actions or proceedings may be disposed of unfavorably to us. In addition, intellectual property disputes often have a risk of injunctive relief which, if imposed against us, could materially and adversely affect our financial condition or results of operations.
As of
December 31, 2017
, we had no material ongoing litigation in which we were a party or any material ongoing regulatory or other proceeding and had no knowledge of any investigations by governmental or regulatory authorities in which we are a target that could have a material adverse effect on our current business.
We are currently in arbitration with Pharmalucence in connection with a Manufacturing and Supply Agreement dated November 12, 2013, under which Pharmalucence agreed to manufacture and supply DEFINITY for us. The commercial arrangement contemplated by that agreement was repeatedly delayed and ultimately never successfully realized. After extended settlement discussions between Sun Pharma, the ultimate parent of Pharmalucence, and us, which did not lead to a mutually acceptable outcome, on November 10, 2017, we filed an arbitration demand
(and later an amended arbitration demand) with the
American Arbitration Association (“AAA”) against Pharmalucence, alleging breach of contract,
breach of the covenant of good faith and fair dealing,
tortious misrepresentation and violation of the Massachusetts Consumer Protection Law, also known as Chapter 93A. We cannot predict the outcome of this dispute resolution proceeding and whether we will be able to obtain any financial recovery as a result of this proceeding.
Not applicable
42
Item 5.
Market for Registrant’s Common Equity, Related Stockholder Matters and Issuer Purchases of Equity Securities
Market Information
The Company’s common stock began trading on the NASDAQ Global Market under the symbol “LNTH” on June 25, 2015. Prior to that time, there was no established public trading market for our common stock. The following table sets forth the high and low intra-day sale prices per share of our common stock, as reported on the NASDAQ Global Market, for the quarterly periods indicated:
|
High
|
Low
|
|||||||
|
Year ended December 31, 2016
|
||||||||
|
First Quarter
|
$
|
3.38
|
|
$
|
1.76
|
|
||
|
Second Quarter
|
$
|
4.37
|
|
$
|
1.82
|
|
||
|
Third Quarter
|
$
|
10.10
|
|
$
|
3.46
|
|
||
|
Fourth Quarter
|
$
|
10.85
|
|
$
|
7.61
|
|
||
|
Year ended December 31, 2017
|
||||||||
|
First Quarter
|
$
|
14.25
|
|
$
|
7.95
|
|
||
|
Second Quarter
|
$
|
17.85
|
|
$
|
10.65
|
|
||
|
Third Quarter
|
$
|
20.45
|
|
$
|
15.05
|
|
||
|
Fourth Quarter
|
$
|
24.10
|
|
$
|
17.15
|
|
||
Holders of Record
On
February 22, 2018
, there were approximately
12
stockholders of record of our common stock. This number does not include stockholders for whom shares are held in “nominee” or “street” name.
43
Performance Graph
The performance graph set forth below shall not be deemed “soliciting material” or to be “filed” with the SEC. This graph will not be deemed “incorporated by reference” into any filing under the Securities Act of 1933, as amended, or the Securities Exchange Act of 1934, as amended (the “Exchange Act”), whether such filing occurs before or after the date hereof, except to the extent that the Company explicitly incorporates it by reference into in such filing.
The following graph provides a comparison of the cumulative total shareholder return on our common shares with that of the cumulative total shareholder return on the (i) Russell 2000 Index and (ii) the NASDAQ US Small Cap Index, commencing on June 25, 2015 and ending
December 31, 2017
. The graph assumes a hypothetical $100 investment in our common stock and in each of the comparative indices on June 25, 2015. Our historic share price performance is not necessarily indicative of future share price performance.
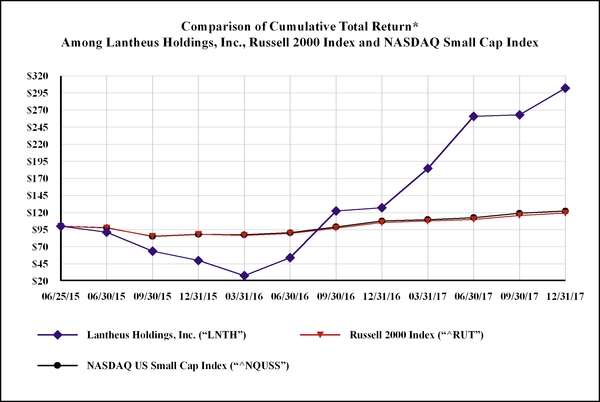
________________________________
* Assumes hypothetical investment of $100 in our common stock and each of the indices on June 25, 2015, the date of our IPO, including reinvestment of dividends.
44
Performance Graph Data
The following table sets forth
the cumulative total shareholder return on the hypothetical $100 investment in the Company’s common stock and each of the comparative indices on June 25, 2015:
|
Date
|
Lantheus Holdings, Inc. (“LNTH”)
|
Russell 2000 Index (“^RUT”)
|
NASDAQ US Small Cap Index (“^NQUSS”)
|
|||||||||
|
06/25/15
|
$
|
100.00
|
|
$
|
100.00
|
|
$
|
100.00
|
|
|||
|
06/30/15
|
$
|
91.43
|
|
$
|
97.43
|
|
$
|
97.76
|
|
|||
|
09/30/15
|
$
|
63.52
|
|
$
|
85.53
|
|
$
|
85.31
|
|
|||
|
12/31/15
|
$
|
49.93
|
|
$
|
88.26
|
|
$
|
88.24
|
|
|||
|
03/31/16
|
$
|
27.92
|
|
$
|
86.56
|
|
$
|
87.69
|
|
|||
|
06/30/16
|
$
|
54.21
|
|
$
|
89.51
|
|
$
|
90.60
|
|
|||
|
09/30/16
|
$
|
122.30
|
|
$
|
97.26
|
|
$
|
99.20
|
|
|||
|
12/31/16
|
$
|
127.03
|
|
$
|
105.45
|
|
$
|
107.67
|
|
|||
|
03/31/17
|
$
|
184.64
|
|
$
|
107.69
|
|
$
|
109.71
|
|
|||
|
06/30/17
|
$
|
260.71
|
|
$
|
109.98
|
|
$
|
112.60
|
|
|||
|
09/30/17
|
$
|
262.92
|
|
$
|
115.84
|
|
$
|
118.96
|
|
|||
|
12/31/17
|
$
|
302.07
|
|
$
|
119.31
|
|
$
|
122.28
|
|
|||
Issuer Purchase of Equity Securities
None.
Dividend Policy
We did not declare or pay any dividends and we do not currently intend to pay dividends in the foreseeable future. We currently expect to retain future earnings, if any, for the foreseeable future, to finance the growth and development of our business and to repay indebtedness. Our ability to pay dividends are restricted by our financing arrangements. See Part II, Item 7. “Management’s Discussion and Analysis of Financial Condition and Results of Operations—Liquidity and Capital Resources—External Sources of Liquidity” for further information.
Recent Sales of Unregistered Securities
None.
Repurchases
The following table presents information with respect to purchases of common stock we made during the quarter ended
December 31, 2017
. The Company does not currently have a share repurchase program in effect. The 2015 Equity Incentive Plan, adopted by the Company on June 24, 2015, as further amended April 27, 2017 (the “2015 Plan”), provides for the withholding of shares to satisfy minimum statutory tax withholding obligations. It does not specify a maximum number of shares that can be withheld for this purpose. The shares of common stock withheld to satisfy minimum tax withholding obligations may be deemed to be “issuer purchases” of shares that are required to be disclosed pursuant to this Item 5.
|
Period
|
Total Number of Shares Purchased
|
Average Price Paid Per Share
|
Total Number of Shares Purchased as Part of Publicly Announced Programs
|
Approximate Dollar Value of Shares that May Yet Be Purchased Under the Program
|
|||||||
|
October 2017 **
|
1,291
|
|
$
|
18.50
|
|
*
|
*
|
||||
|
November 2017 **
|
6,722
|
|
$
|
22.26
|
|
*
|
*
|
||||
|
December 2017 **
|
—
|
|
$
|
—
|
|
*
|
*
|
||||
|
8,013
|
|
*
|
|||||||||
________________________________
* These amounts are not applicable as the Company does not have a share repurchase program in effect.
|
**
|
Reflects shares withheld to satisfy minimum statutory tax withholding amounts due from employees related to the receipt of stock which resulted from the exercise of vesting of equity awards.
|
45
Securities Authorized for Issuance Under Equity Compensations Plans
The information required with respect to this item is incorporated herein by reference to our Definitive Proxy Statement for our
2018
Annual Meeting of Stockholders to be filed with the SEC no later than 120 days after the close of our year ended
December 31, 2017
.
Basis of Financial Information
The consolidated financial statements have been prepared in U.S. Dollars, in accordance with accounting principles generally accepted in the United States of America (“U.S. GAAP”). The consolidated financial statements include the accounts of Lantheus Holdings, Inc. and its wholly-owned subsidiaries. All intercompany accounts and transactions have been eliminated in consolidation.
Non-GAAP Financial Measures
Adjusted EBITDA and EBITDA as used in our equity incentive plans, collectively, our Non-GAAP Measures, as presented in this Annual Report on Form 10-K, are supplemental measures of our performance that are not required by, or presented in accordance with U.S. GAAP. They are not measurements of our financial performance under U.S. GAAP and should not be considered as alternatives to net income (loss) or any other performance measures derived in accordance with U.S. GAAP or as alternatives to cash flow from operating activities as measures of our liquidity.
Our presentation of our Non-GAAP Measures may not be comparable to similarly titled measures of other companies. We have included information concerning our Non-GAAP Measures in this Annual Report on Form 10-K because we believe that this information is used by certain investors as measures of a company’s historical performance.
Our Non-GAAP Measures have limitations as analytical tools, and you should not consider them in isolation, or as substitutes for analysis of our operating results or cash flows as reported under U.S. GAAP. Some of these limitations include:
|
•
|
They do not reflect our cash expenditures, or future requirements, for capital expenditures or contractual commitments;
|
|
•
|
They do not reflect changes in, or cash requirements for, our working capital needs;
|
|
•
|
They do not reflect the significant interest expense or the cash requirements necessary to service interest or principal payments, on our debt;
|
|
•
|
Although depreciation is a non-cash charge, the assets being depreciated will often have to be replaced in the future, and our Non-GAAP Measures do not reflect any cash requirements for those replacements;
|
|
•
|
They are not adjusted for all non-cash income or expense items that are reflected in our statements of cash flows; and
|
|
•
|
Other companies in our industry may calculate these measures differently than we do, limiting their usefulness as comparative measures.
|
Because of these limitations, our Non-GAAP Measures should not be considered as measures of discretionary cash available to us to invest in the growth of our business. We compensate for these limitations by relying primarily on our U.S. GAAP results and using our Non-GAAP Measures only for supplemental purposes.
46
Selected Financial Data
In the table below, we provide you with our selected consolidated financial data for the periods presented. We have prepared this information using our audited consolidated financial statements for the years ended
December 31, 2017
,
2016
,
2015
,
2014
and
2013
.
The following selected consolidated financial information should be read in conjunction with our consolidated financial statements, the related notes and Part II, Item 7. “Management’s Discussion and Analysis of Financial Condition and Results of Operations” included elsewhere in this Annual Report on Form 10-K. The results indicated below and elsewhere in this Annual Report on Form 10-K are not necessarily indicative of results to be expected for any future period.
_______________________________
|
Year Ended
December 31,
|
|||||||||||||||||||
|
2017
|
2016
|
2015
|
2014
|
2013
|
|||||||||||||||
|
Statements of Operations
|
(in thousands, except per share data)
|
||||||||||||||||||
|
Revenues
|
$
|
331,378
|
|
$
|
301,853
|
|
$
|
293,461
|
|
$
|
301,600
|
|
$
|
283,672
|
|
||||
|
Cost of goods sold
|
169,243
|
|
164,073
|
|
157,939
|
|
176,081
|
|
206,311
|
|
|||||||||
|
Sales and marketing
|
42,315
|
|
36,542
|
|
34,740
|
|
35,116
|
|
35,227
|
|
|||||||||
|
General and administrative
(a)
|
49,842
|
|
38,832
|
|
43,894
|
|
37,313
|
|
39,442
|
|
|||||||||
|
Research and development
|
18,125
|
|
12,203
|
|
14,358
|
|
13,673
|
|
30,459
|
|
|||||||||
|
Proceeds from manufacturer
|
—
|
|
—
|
|
—
|
|
—
|
|
(8,876
|
)
|
|||||||||
|
Gain on sales of assets
|
—
|
|
6,385
|
|
—
|
|
—
|
|
—
|
|
|||||||||
|
Operating income (loss)
|
51,853
|
|
56,588
|
|
42,530
|
|
39,417
|
|
(18,891
|
)
|
|||||||||
|
Interest expense
|
18,410
|
|
26,618
|
|
38,715
|
|
42,288
|
|
42,915
|
|
|||||||||
|
Debt retirement costs
|
—
|
|
1,896
|
|
—
|
|
—
|
|
—
|
|
|||||||||
|
Loss on extinguishment of debt
|
2,442
|
|
—
|
|
15,528
|
|
—
|
|
—
|
|
|||||||||
|
Other (income) expense
|
(8,638
|
)
|
(220
|
)
|
65
|
|
505
|
|
(1,265
|
)
|
|||||||||
|
Income (loss) before income taxes
|
39,639
|
|
28,294
|
|
(11,778
|
)
|
(2,366
|
)
|
(60,541
|
)
|
|||||||||
|
Income tax (benefit) provision
(b)
|
(83,746
|
)
|
1,532
|
|
2,968
|
|
1,195
|
|
1,014
|
|
|||||||||
|
Net income (loss)
|
$
|
123,385
|
|
$
|
26,762
|
|
$
|
(14,746
|
)
|
$
|
(3,561
|
)
|
$
|
(61,555
|
)
|
||||
|
Net income (loss) per common share:
|
|||||||||||||||||||
|
Basic
|
$
|
3.31
|
|
$
|
0.84
|
|
$
|
(0.60
|
)
|
$
|
(0.20
|
)
|
$
|
(3.42
|
)
|
||||
|
Diluted
|
$
|
3.17
|
|
$
|
0.82
|
|
$
|
(0.60
|
)
|
$
|
(0.20
|
)
|
$
|
(3.42
|
)
|
||||
|
Weighted-average common shares:
|
|||||||||||||||||||
|
Basic
|
37,276
|
|
32,044
|
|
24,440
|
|
18,081
|
|
18,032
|
|
|||||||||
|
Diluted
|
38,892
|
|
32,656
|
|
24,440
|
|
18,081
|
|
18,032
|
|
|||||||||
|
(a)
|
In 2017 and 2013, general and administrative expense includes losses on impairment of land of $0.9 million and $6.4 million, respectively.
|
|
(b)
|
The 2017 amount reflects the release of our valuation allowance of
$141.1 million
against its deferred tax assets offset by a provision of
$45.1 million
for remeasuring the Company’s deferred tax assets for the change in tax rates enacted under the Tax Cuts and Jobs Act of 2017.
|
|
Year Ended
December 31,
|
|||||||||||||||||||
|
2017
|
2016
|
2015
|
2014
|
2013
|
|||||||||||||||
|
Statements of Cash Flows Data
|
(in thousands)
|
||||||||||||||||||
|
Net cash provided by (used in):
|
|||||||||||||||||||
|
Operating activities
|
$
|
54,777
|
|
$
|
49,642
|
|
$
|
21,762
|
|
$
|
11,590
|
|
$
|
(15,572
|
)
|
||||
|
Investing activities
|
$
|
(16,309
|
)
|
$
|
3,281
|
|
$
|
(13,151
|
)
|
$
|
(7,682
|
)
|
$
|
(3,483
|
)
|
||||
|
Financing activities
|
$
|
(13,450
|
)
|
$
|
(30,217
|
)
|
$
|
999
|
|
$
|
(2,297
|
)
|
$
|
5,612
|
|
||||
47
|
December 31,
|
|||||||||||||||||||
|
2017
|
2016
|
2015
|
2014
|
2013
|
|||||||||||||||
|
Balance Sheet Data
|
(in thousands)
|
||||||||||||||||||
|
Cash and cash equivalents
|
$
|
76,290
|
|
$
|
51,178
|
|
$
|
28,596
|
|
$
|
19,739
|
|
$
|
18,578
|
|
||||
|
Total assets
|
$
|
383,858
|
|
$
|
255,898
|
|
$
|
242,379
|
|
$
|
243,153
|
|
$
|
252,682
|
|
||||
|
Long-term debt, net
|
$
|
265,393
|
|
$
|
274,460
|
|
$
|
349,858
|
|
$
|
392,863
|
|
$
|
390,408
|
|
||||
|
Total liabilities
|
$
|
360,567
|
|
$
|
362,414
|
|
$
|
427,668
|
|
$
|
482,423
|
|
$
|
488,199
|
|
||||
|
Total stockholders’ equity (deficit)
|
$
|
23,291
|
|
$
|
(106,516
|
)
|
$
|
(185,289
|
)
|
$
|
(239,270
|
)
|
$
|
(235,517
|
)
|
||||
|
Year Ended
December 31,
|
|||||||||||||||||||
|
2017
|
2016
|
2015
|
2014
|
2013
|
|||||||||||||||
|
Other Financial Data
|
(in thousands)
|
||||||||||||||||||
|
EBITDA
(a)
|
$
|
68,895
|
|
$
|
72,100
|
|
$
|
44,910
|
|
$
|
58,165
|
|
$
|
6,912
|
|
||||
|
Adjusted EBITDA
(a)
|
$
|
94,050
|
|
$
|
78,289
|
|
$
|
76,329
|
|
$
|
70,755
|
|
$
|
38,483
|
|
||||
|
Capital expenditures
|
$
|
17,543
|
|
$
|
7,398
|
|
$
|
13,151
|
|
$
|
8,137
|
|
$
|
5,010
|
|
||||
________________________________
|
(a)
|
EBITDA is defined as net income (loss) plus interest expense (net), income taxes, depreciation, amortization and accretion. EBITDA is a measure us
ed by management to measure operating performance. Adjusted EBITDA is defined as EBITDA, further adjusted to exclude certain items and other adjustments required or permitted in calculating Adjusted EBITDA under the agreements governing our long-term debt facilities. Adjusted EBITDA is also used by management to measure operating performance and by investors to measure a company’s ability to service its debt. Management believes that the inclusion of the adjustments to EBITDA applied in presenting Adjusted EBITDA are appropriate to provide additional information to investors about the Company’s performance across reporting periods on a consistent basis by excluding items that it does not believe are indicative of its core operating performance. See “—Non-GAAP Financial Measures.”
|
The following table provides a reconciliation of our net income (loss) to EBITDA and Adjusted EBITDA for the periods presented:
|
Year Ended
December 31,
|
||||||||||||||||||||
|
2017
|
2016
|
2015
|
2014
|
2013
|
||||||||||||||||
|
(in thousands)
|
||||||||||||||||||||
|
Net income (loss)
|
$
|
123,385
|
|
$
|
26,762
|
|
$
|
(14,746
|
)
|
$
|
(3,561
|
)
|
$
|
(61,555
|
)
|
|||||
|
Interest expense, net
|
18,391
|
|
26,598
|
|
38,691
|
|
42,261
|
|
42,811
|
|
||||||||||
|
Income tax (benefit) provision
(a)
|
(92,113
|
)
|
477
|
|
1,314
|
|
441
|
|
(127
|
)
|
||||||||||
|
Depreciation
|
12,485
|
|
9,915
|
|
11,813
|
|
9,901
|
|
9,336
|
|
||||||||||
|
Amortization of intangible assets
|
6,747
|
|
8,348
|
|
7,838
|
|
9,123
|
|
16,447
|
|
||||||||||
|
EBITDA
|
68,895
|
|
72,100
|
|
44,910
|
|
58,165
|
|
6,912
|
|
||||||||||
|
Stock and incentive plan compensation
|
6,769
|
|
3,527
|
|
2,002
|
|
1,031
|
|
578
|
|
||||||||||
|
Asset write-off
(b)
|
3,430
|
|
1,906
|
|
1,468
|
|
1,257
|
|
28,349
|
|
||||||||||
|
Severance and recruiting costs
(c)
|
1,715
|
|
2,090
|
|
1,360
|
|
818
|
|
5,239
|
|
||||||||||
|
Offering and other costs
(d)
|
576
|
|
126
|
|
7,412
|
|
4,525
|
|
2,117
|
|
||||||||||
|
Campus consolidation costs
|
1,152
|
|
—
|
|
—
|
|
—
|
|
—
|
|
||||||||||
|
Debt refinancing costs
|
2,557
|
|
—
|
|
—
|
|
—
|
|
—
|
|
||||||||||
|
Extinguishment of debt and debt retirement costs
|
2,442
|
|
1,896
|
|
15,528
|
|
—
|
|
—
|
|
||||||||||
|
Gain on sales of assets
|
—
|
|
(6,385
|
)
|
—
|
|
—
|
|
—
|
|
||||||||||
|
New manufacturer costs
(e)
|
4,304
|
|
3,029
|
|
3,649
|
|
4,959
|
|
4,164
|
|
||||||||||
|
Proceeds from manufacturer
|
—
|
|
—
|
|
—
|
|
—
|
|
(8,876
|
)
|
||||||||||
|
One-time contract and termination costs
|
2,210
|
|
—
|
|
—
|
|
—
|
|
—
|
|
||||||||||
|
Adjusted EBITDA
|
$
|
94,050
|
|
$
|
78,289
|
|
$
|
76,329
|
|
$
|
70,755
|
|
$
|
38,483
|
|
|||||
________________________________
|
(a)
|
Represents income tax (benefit) provision, less tax indemnification income associated with BMS. In 2017, this amount includes the release of our valuation allowance against our deferred tax assets and changes enacted under the Tax Cuts and Jobs Act of 2017.
|
|
(b)
|
Represents non-cash losses incurred associated with the write-down of land, intangible assets, inventory and other write-offs of long-lived assets. In 2017, the amount includes an impairment of land of
$0.9 million
. The 2013 amount consists primarily of a $6.4 million impairment of land, a $15.4 million impairment charge on the Cardiolite trademark intangible asset, a $1.7 million impairment charge on a customer relationship intangible asset and a $1.6 million inventory write-down related to Ablavar.
|
48
|
(c)
|
The amounts consist of severance and recruitment costs related to employees, executives and directors.
|
|
(d)
|
Represents offering costs incurred on behalf of certain stockholders pursuant to a registration rights agreement and other non-recurring costs. Other significant components include:
|
|
i.
|
one-time charge recorded in connection with the termination of our advisory services and monitoring agreement with our former sponsor of $6.5 million during 2015;
|
|
ii.
|
legal fees and disbursements incurred in connection with our business interruption claim associated with the NRU reactor shutdown during 2009 to 2010 of $1.1 million and $0.7 million in 2014 and 2013, respectively;
|
|
iii.
|
write-offs of IPO costs of $0.2 million and $2.4 million in 2015 and 2014, respectively; and
|
|
iv.
|
certain non-recurring charges related to a customer relationship in 2013.
|
|
(e)
|
Represents internal and external costs associated with establishing new manufacturing sources for our commercial and clinical candidate products.
|
49
The following discussion and analysis of our financial condition and results of operations should be read together with Item 6, “Selected Financial Data” and the consolidated financial statements and the related notes included in Item 8 of this Annual Report on Form 10-K. This discussion contains forward-looking statements related to future events and our future financial performance that are based on current expectations and subject to risks and uncertainties. Our actual results may differ materially from those anticipated in these forward-looking statements as a result of many factors, including those set forth in Part I—Item 1A. “Risk Factors” and “Cautionary Note Regarding Forward Looking Statements.” included in this Annual Report on Form 10-K.
Overview
Our Business
We are a global leader in the development, manufacture and commercialization of innovative diagnostic medical imaging agents and products that assist clinicians in the diagnosis and treatment of cardiovascular and other diseases. Clinicians use our imaging agents and products across a range of imaging modalities, including echocardiography and nuclear imaging. We believe that the resulting improved diagnostic information enables healthcare providers to better detect and characterize, or rule out, disease, potentially achieving improved patient outcomes, reducing patient risk and limiting overall costs for payers and the entire healthcare system.
Our commercial products are used by cardiologists, nuclear physicians, radiologists, internal medicine physicians, technologists and sonographers working in a variety of clinical settings. We sell our products to radiopharmacies, integrated delivery networks, hospitals, clinics and group practices.
We sell our products globally and have operations in the U.S., Puerto Rico and Canada and third-party distribution relationships in Europe, Canada, Australia, Asia-Pacific and Latin America.
Our Product Portfolio
Our product portfolio includes an ultrasound contrast agent and nuclear imaging products. Our principal products include the following:
|
•
|
DEFINITY
is an ultrasound contrast agent used in ultrasound exams of the heart, also known as echocardiography exams. DEFINITY contains perflutren-containing lipid microspheres and is indicated in the U.S. for use in patients with suboptimal echocardiograms to assist in imaging the left ventricular chamber and left endocardial border of the heart in ultrasound procedures. We launched DEFINITY in 2001, and in the U.S., an Orange Book-listed composition of matter patent will expire in
2019
, a manufacturing patent will expire in
2021
, a new Orange Book-listed method of use patent will expire in
2037
and an allowed manufacturing patent application that, when granted, will expire in
2037
. In numerous foreign jurisdictions, patent protection or regulatory exclusivity will currently expire in
2019
.
|
|
•
|
TechneLite
is a Technetium generator that provides the essential nuclear material used by radiopharmacies to radiolabel Cardiolite, Neurolite and other Technetium-based radiopharmaceuticals used in nuclear medicine procedures. TechneLite uses Moly as its active ingredient.
|
|
•
|
Xenon
is a radiopharmaceutical gas that is inhaled and used to assess pulmonary function and also for imaging cerebral blood flow. Xenon is manufactured by a third-party and is processed and finished by us.
|
Sales of our contrast agent, DEFINITY, are made in the U.S. and Canada through a DEFINITY direct sales team of 72 employees. In the U.S., our nuclear imaging products, including TechneLite, Xenon, Neurolite and Cardiolite, are primarily distributed through commercial radiopharmacies, the majority of which are controlled by or associated with Cardinal, UPPI, GE Healthcare and Triad. A small portion of our nuclear imaging product sales in the U.S. are made through our direct sales force to hospitals and clinics that maintain their own in-house radiopharmaceutical capabilities. Outside the U.S., we own one radiopharmacy in Puerto Rico, where we sell our own products as well as products of third-parties to end-users.
In January 2016, we sold our Canadian radiopharmacies to Isologic and entered into a supply agreement under which we supply Isologic with certain of our products on commercial terms, including certain product purchase commitments by Isologic. In August 2016, we sold our Australian radiopharmacy servicing business to GMS, and entered into a supply agreement under which we supply GMS with certain of our products on commercial terms, including certain minimum product purchase commitments by GMS.
We also maintain our own direct sales force in Canada so that we can control the importation, marketing, distribution and sale of our imaging agents in Canada. In Europe, Australia, Asia-Pacific and Latin America, we rely on third-party distributors to market, sell and distribute our nuclear imaging and contrast agent products, either on a country-by-country basis or on a multi-country regional basis.
50
The following table sets forth our revenues derived from our principal products:
|
|
Year Ended
December 31,
|
|||||||||||||||||||
|
(in thousands)
|
2017
|
% of
Revenues
|
2016
|
% of
Revenues
|
2015
|
% of
Revenues
|
||||||||||||||
|
DEFINITY
|
$
|
157,268
|
|
47.5
|
%
|
$
|
131,612
|
|
43.6
|
%
|
$
|
111,859
|
|
38.1
|
%
|
|||||
|
TechneLite
|
104,644
|
|
31.6
|
%
|
99,217
|
|
32.9
|
%
|
72,562
|
|
24.7
|
%
|
||||||||
|
Xenon
|
31,377
|
|
9.5
|
%
|
29,086
|
|
9.6
|
%
|
48,898
|
|
16.7
|
%
|
||||||||
|
Other
|
38,089
|
|
11.4
|
%
|
41,938
|
|
13.9
|
%
|
60,142
|
|
20.5
|
%
|
||||||||
|
Total revenues
|
$
|
331,378
|
|
100.0
|
%
|
$
|
301,853
|
|
100.0
|
%
|
$
|
293,461
|
|
100.0
|
%
|
|||||
Key Factors Affecting Our Results
Our business and financial performance have been, and continue to be, affected by the following:
Growth of DEFINITY and Our Microbubble Franchise Strategy
We believe the market opportunity for our contrast agent, DEFINITY, remains significant. DEFINITY is currently our fastest growing and highest margin commercial product. We believe that DEFINITY sales will continue to grow and that DEFINITY will constitute a greater share of our overall product mix. As we better educate the physician and healthcare provider community about the benefits and risks of this product, we believe we will be able to continue to grow the appropriate use of DEFINITY in suboptimal echocardiograms.
There are three echocardiography contrast agents approved by the FDA for sale in the U.S.—DEFINITY which we estimated as having over
80%
of the U.S. market for contrast agents in echocardiography procedures as of
December 31, 2017
, Optison from GE Healthcare and Lumason from Bracco. As part of our microbubble franchise strategy, we continue to actively pursue additional patents in connection with DEFINITY, alternative microbubble formulations, and related technology. We also plan to initiate additional clinical trials with DEFINITY in the second half of 2018 to pursue expansion of the current DEFINITY indication to include EF. However, we can give no assurance that our microbubble franchise strategy will be successful or that new patents or approvals will protect the agent or be defensible in the face of potential generic competition. See Part I, Item 1A. “Risk Factors—
The growth of our business is substantially dependent on our ability to continue to grow the appropriate use of DEFINITY in suboptimal echocardiograms in the face of increased segment competition from other existing echocardiography agents and potential generic competitors as a result of future patent and regulatory exclusivity expirations
.”
Competition for Xenon
Xenon gas for lung ventilation diagnosis is our third largest product by revenues. In order to increase the predictability of our Xenon business, we have entered into Xenon supply agreements with customers at committed volumes and reduced prices. These steps have resulted in more predictable Xenon unit volumes. Historically, several companies, including Curium, sold packaged Xenon as a pulmonary imaging agent in the U.S., but from 2010 through the first quarter of 2016, we were the only supplier of this imaging agent in the U.S. In March 2016, Curium received regulatory approval from the FDA to again sell packaged Xenon in the U.S. and began to do so. Depending upon the pricing, extent of availability and market penetration of Curium’s offering, we believe we are at risk for volume loss and price erosion from those customers which are not subject to price or volume commitments with us. In addition to competition from Curium, other imaging agents and modalities could potentially compete with, or displace, packaged Xenon in pulmonary studies. If there is an increase in the use of other imaging agents or modalities in place of packaged Xenon, our current sales volumes would decrease, which could have a negative effect on our business, results of operations, financial condition and cash flows. See Part I, Item 1A. “Risk Factors—
We face revenue and unit volume risk for Xenon in pulmonary studies as a result of competition from Curium and potentially others
.”
Inventory Supply
We obtain a substantial portion of our imaging agents from third-party suppliers. JHS is currently our sole source manufacturer of DEFINITY, Neurolite, Cardiolite and evacuation vials, the latter being an ancillary component for our TechneLite generators. We are currently seeking approval from certain foreign regulatory authorities for JHS to manufacture certain of our products. Until we receive these approvals, we will face continued limitations on where we can sell those products outside of the U.S.
51
In addition to JHS, we are also currently working to secure additional alternative suppliers for our key products as part of our ongoing supply chain diversification strategy. We have ongoing development and technology transfer activities for an alternative microbubble formulation with SBL, which is located in South Korea, but we cannot give any assurances as to if and when those technology transfer activities will be completed and when we will begin to receive supply of an alternative microbubble formulation from SBL.
We have also commenced an extensive, multi-year effort to add specialized manufacturing capabilities at our North Billerica, Massachusetts facility. This project is part of a larger strategy to create a competitive advantage in specialized manufacturing which will also allow us to optimize our costs and reduce our supply chain risk.
We plan to retrofit an underutilized manufacturing and storage building to house our proposed manufacturing facility. We can give no assurance that we will be successful in these efforts or that we will be able to successfully manufacture any additional commercial products at our North Billerica, Massachusetts facility. See Part I, Item 1A. “Risk Factors—
Our dependence upon third parties for the manufacture and supply of a substantial portion of our products could prevent us from delivering our products to our customers in the required quantities, within the required timeframes, or at all, which could result in order cancellations and decreased revenues
.”
Radiopharmaceuticals are decaying radioisotopes with half-lives ranging from a few hours to several days. These products cannot be kept in inventory because of their limited shelf lives and are subject to just-in-time manufacturing, processing and distribution, which takes place at our North Billerica, Massachusetts facility.
Global Isotope Supply
We currently have Moly supply agreements with NTP of South Africa, for itself and on behalf of its subcontractor ANSTO of Australia, running through December 31, 2020, and with IRE, running through December 31, 2018, renewable by us on a year-to-year basis thereafter. We also have a Xenon supply agreement with IRE which runs through June 30, 2019, also subject to extensions.
Historically, our largest supplier of Moly was Nordion, which relied on the NRU reactor in Canada for its supply of Moly. As a result of a decision by the Government of Canada, the NRU reactor exited the medical isotope business in November 2016. ANSTO has already significantly increased its Moly production capacity from its existing facility in August 2016 and has under construction, in cooperation with NTP, a new Moly processing facility that ANSTO believes will expand its production capacity, which is expected to be in commercial operation in the second half of 2018. In addition, IRE received approval from its regulator to expand its production capability by up to 50% of its former capacity. The combined ANSTO and IRE production capacity is expected to replace what was the NRU’s most recent routine production.
We believe we are generally well-positioned with ANSTO, IRE and NTP to have a secure supply of Moly, including low-enriched uranium-based Moly produced from targets containing less than 20% of Uranium-235 (“LEU Moly”). However, we still have challenges from to time to time in our Moly supply chain. For example, due to regulatory issues, the NTP processing facility was off-line from late November 2017 until mid February 2018, and we were forced to rely on Moly supply from only ANSTO and IRE during this period, resulting in our inability to fill all of the demand for our TechneLite generators on certain manufacturing days and consequently decreasing revenue and cash flow from this product line during this period as compared to prior periods.
We are receiving bulk unprocessed Xenon from IRE, which we are processing and finishing for our customers. We believe we are well-positioned to supply Xenon to our customers. See Part I, Item 1A. “Risk Factors—
The global supply of Moly is fragile and not stable. Our dependence on a limited number of third party suppliers for Moly could prevent us from delivering some of our products to our customers in the required quantities, within the required timeframe, or at all, which could result in order cancellations and decreased revenues
” and “—
Our dependence upon third parties for the manufacture and supply of a substantial portion of our products could prevent us from delivering our products to our customers in the required quantities, within the required timeframes, or at all, which could result in order cancellations and decreased revenues
.”
Research and Development Expenses
To remain a leader in the marketplace, we have historically made substantial investments in new product development. As a result, the positive contributions of those internally funded research and development programs have been a key factor in our historical results and success. On April 25, 2017, we announced entering into a definitive, exclusive Collaboration and License Agreement with GE Healthcare f
or the continued Phase 3 development and worldwide commercialization of flurpiridaz F 18. As part of our microbubble franchise strategy, in the second half of 2018, we plan to initiate additional clinical trials with DEFINITY to pursue expansion of the current DEFINITY indication to include EF. In addition, by year end 2018, we plan to enter into a single Phase 3 clinical trial for LMI 1195 to demonstrate improved risk stratification of ischemic heart failure patients. Our investments in these additional clinical activities will increase our operating expenses and impact our results of operations and cash flow.
Segments
We report our results of operations in two operating segments: U.S. and International. We generate a greater proportion of our revenues and net income (loss) in the U.S. segment, which consists of all regions of the U.S. with the exception of Puerto Rico.
52
Executive Overview
Our results for the year ended
December 31, 2017
as compared to the prior year reflect the following:
|
•
|
the release of our valuation allowance against our deferred tax assets and changes enacted under the Tax Cuts and Jobs Act of 2017;
|
|
•
|
increased revenues for DEFINITY in the suboptimal echocardiogram segment as a result of our continued focused sales efforts;
|
|
•
|
increased revenues for TechneLite, mainly the result of higher unit volumes and unit pricing;
|
|
•
|
increased revenues of $5.0 million from GE Healthcare for the continued Phase 3 development and worldwide commercialization of flurpiridaz F 18;
|
|
•
|
lower international revenues and cost of goods sold primarily as a result of the sale of our Australian radiopharmacies in 2016;
|
|
•
|
increased depreciation expense as a result of the scheduled decommissioning of certain long-lived assets;
|
|
•
|
general and administrative expense of
$2.6 million
incurred in connection with the refinancing and subsequent repricing of our debt, as well as a related
$2.4 million
loss on the extinguishment of debt; and
|
|
•
|
decreased interest expense of
$8.2 million
due to the refinancing, and subsequent repricing, of our debt which resulted in comparatively lower carrying amounts of outstanding debt principal and lower effective interest rates throughout the year ended
December 31, 2017
.
|
Results of Operations
The following is a summary of our consolidated results of operations:
|
Year Ended
December 31,
|
2017 vs. 2016
|
2016 vs. 2015
|
|||||||||||||||||||||||
|
(in thousands)
|
2017
|
2016
|
2015
|
Change
$
|
Change
%
|
Change
$
|
Change
% |
||||||||||||||||||
|
Revenues
|
$
|
331,378
|
|
$
|
301,853
|
|
$
|
293,461
|
|
$
|
29,525
|
|
9.8
|
%
|
$
|
8,392
|
|
2.9
|
%
|
||||||
|
Cost of goods sold
|
169,243
|
|
164,073
|
|
157,939
|
|
5,170
|
|
3.2
|
%
|
6,134
|
|
3.9
|
%
|
|||||||||||
|
Gross profit
|
162,135
|
|
137,780
|
|
135,522
|
|
24,355
|
|
17.7
|
%
|
2,258
|
|
1.7
|
%
|
|||||||||||
|
Operating expenses
|
|||||||||||||||||||||||||
|
Sales and marketing
|
42,315
|
|
36,542
|
|
34,740
|
|
5,773
|
|
15.8
|
%
|
1,802
|
|
5.2
|
%
|
|||||||||||
|
General and administrative
|
49,842
|
|
38,832
|
|
43,894
|
|
11,010
|
|
28.4
|
%
|
(5,062
|
)
|
(11.5
|
)%
|
|||||||||||
|
Research and development
|
18,125
|
|
12,203
|
|
14,358
|
|
5,922
|
|
48.5
|
%
|
(2,155
|
)
|
(15.0
|
)%
|
|||||||||||
|
Total operating expenses
|
110,282
|
|
87,577
|
|
92,992
|
|
22,705
|
|
25.9
|
%
|
(5,415
|
)
|
(5.8
|
)%
|
|||||||||||
|
Gain on sales of assets
|
—
|
|
6,385
|
|
—
|
|
(6,385
|
)
|
(100.0
|
)%
|
6,385
|
|
100.0
|
%
|
|||||||||||
|
Operating income
|
51,853
|
|
56,588
|
|
42,530
|
|
(4,735
|
)
|
(8.4
|
)%
|
14,058
|
|
33.1
|
%
|
|||||||||||
|
Interest expense
|
18,410
|
|
26,618
|
|
38,715
|
|
(8,208
|
)
|
(30.8
|
)%
|
(12,097
|
)
|
(31.2
|
)%
|
|||||||||||
|
Debt retirement costs
|
—
|
|
1,896
|
|
—
|
|
(1,896
|
)
|
(100.0
|
)%
|
1,896
|
|
100.0
|
%
|
|||||||||||
|
Loss on extinguishment of debt
|
2,442
|
|
—
|
|
15,528
|
|
2,442
|
|
100.0
|
%
|
(15,528
|
)
|
(100.0
|
)%
|
|||||||||||
|
Other (income) expense
|
(8,638
|
)
|
(220
|
)
|
65
|
|
(8,418
|
)
|
3,826.4
|
%
|
(285
|
)
|
(438.5
|
)%
|
|||||||||||
|
Income (loss) before income taxes
|
39,639
|
|
28,294
|
|
(11,778
|
)
|
11,345
|
|
40.1
|
%
|
40,072
|
|
(340.2
|
)%
|
|||||||||||
|
Income tax (benefit) provision
|
(83,746
|
)
|
1,532
|
|
2,968
|
|
(85,278
|
)
|
(5,566.4
|
)%
|
(1,436
|
)
|
(48.4
|
)%
|
|||||||||||
|
Net income (loss)
|
$
|
123,385
|
|
$
|
26,762
|
|
$
|
(14,746
|
)
|
$
|
96,623
|
|
361.0
|
%
|
$
|
41,508
|
|
(281.5
|
)%
|
||||||
53
Comparison of the Periods Ended
December 31, 2017
,
2016
and
2015
Revenues
Segment revenues are summarized by product as follows:
|
Year Ended
December 31, |
2017 vs. 2016
|
2016 vs. 2015
|
|||||||||||||||||||||||
|
(in thousands)
|
2017
|
2016
|
2015
|
Change
$ |
Change
% |
Change
$ |
Change
% |
||||||||||||||||||
|
U.S.
|
|||||||||||||||||||||||||
|
DEFINITY
|
$
|
153,581
|
|
$
|
128,677
|
|
$
|
109,656
|
|
$
|
24,904
|
|
19.4
|
%
|
$
|
19,021
|
|
17.3
|
%
|
||||||
|
TechneLite
|
90,489
|
|
85,412
|
|
62,034
|
|
5,077
|
|
5.9
|
%
|
23,378
|
|
37.7
|
%
|
|||||||||||
|
Xenon
|
31,373
|
|
29,078
|
|
48,868
|
|
2,295
|
|
7.9
|
%
|
(19,790
|
)
|
(40.5
|
)%
|
|||||||||||
|
Other
|
14,559
|
|
14,253
|
|
15,266
|
|
306
|
|
2.1
|
%
|
(1,013
|
)
|
(6.6
|
)%
|
|||||||||||
|
Total U.S. Revenues
|
290,002
|
|
257,420
|
|
235,824
|
|
32,582
|
|
12.7
|
%
|
21,596
|
|
9.2
|
%
|
|||||||||||
|
International
|
|||||||||||||||||||||||||
|
DEFINITY
|
3,687
|
|
2,935
|
|
2,203
|
|
752
|
|
25.6
|
%
|
732
|
|
33.2
|
%
|
|||||||||||
|
TechneLite
|
14,155
|
|
13,805
|
|
10,528
|
|
350
|
|
2.5
|
%
|
3,277
|
|
31.1
|
%
|
|||||||||||
|
Xenon
|
4
|
|
8
|
|
30
|
|
(4
|
)
|
(50.0
|
)%
|
(22
|
)
|
(73.3
|
)%
|
|||||||||||
|
Other
|
23,530
|
|
27,685
|
|
44,876
|
|
(4,155
|
)
|
(15.0
|
)%
|
(17,191
|
)
|
(38.3
|
)%
|
|||||||||||
|
Total International Revenues
|
41,376
|
|
44,433
|
|
57,637
|
|
(3,057
|
)
|
(6.9
|
)%
|
(13,204
|
)
|
(22.9
|
)%
|
|||||||||||
|
Total Revenues
|
$
|
331,378
|
|
$
|
301,853
|
|
$
|
293,461
|
|
$
|
29,525
|
|
9.8
|
%
|
$
|
8,392
|
|
2.9
|
%
|
||||||
2017 vs. 2016
The increase in U.S. segment revenues during the year ended
December 31, 2017
, as compared to the prior year is primarily due to increases in DEFINITY revenues of
$24.9 million
and Xenon revenues of
$2.3 million
as a result of higher unit volumes compared to the prior year. TechneLite revenues increased by
$5.1 million
as a result of higher unit volumes and unit pricing as compared to the prior year. Additionally, there was an increase of $5.0 million in Other revenues associated with the up-front license fee recognized related to the License Agreement with GE Healthcare for the continued Phase 3 development and worldwide commercialization of flurpiridaz F 18. Offsetting these increases was a $2.8 million decrease in Other revenues driven by rebate and allowance provisions, as well as a $1.6 million decrease in Ablavar revenues as the product is no longer sold.
The decrease in International segment revenues during the year ended
December 31, 2017
, as compared to the prior year, is primarily attributable to the sale of the Australian radiopharmacy business during
2016
.
2016 vs. 2015
The increase in U.S. segment revenues during the year ended
December 31, 2016
, as compared to the prior year is primarily due to a
$23.4 million
increase in TechneLite revenues as a result of contracts with customers that increased unit volumes and a
$19.0 million
increase in DEFINITY revenues as a result of higher unit volumes. Offsetting these increases was a
$19.8 million
decrease in Xenon revenues primarily as a result of contracts with significant customers that reduced unit pricing in exchange for committed volume purchases and a $1.7 million decrease in Ablavar as the product is no longer sold.
The decrease in the International segment revenues during the year ended
December 31, 2016
, as compared to the prior year is
primarily the result of the decreases in revenues in Canada and Australia attributable to the sale of our radiopharmacy businesses. In addition, foreign currency provided unfavorability of approximately $0.9 million for the year ended
December 31, 2016
compared to the prior year period.
Rebates and Allowances
Estimates for rebates and allowances represent our estimated obligations under contractual arrangements with third parties. Rebate accruals and allowances are recorded in the same period the related revenue is recognized, resulting in a reduction to Other revenue and the establishment of a liability which is included in accrued expenses. These rebates and allowances result from performance-based offers that are primarily based on attaining contractually specified sales volumes and growth, Medicaid rebate programs for our products, administrative fees of group purchasing organizations, royalties and certain distributor related commissions. The calculation of the accrual for these rebates and allowances is based on an estimate of the third-party’s buying patterns and the resulting applicable contractual rebate or commission rate(s) to be earned over a contractual period.
54
An analysis of the amount of, and change in, reserves is summarized as follows:
|
(in thousands)
|
Rebates and
Allowances
|
||
|
Balance, January 1, 2015
|
$
|
2,164
|
|
|
Current provisions relating to revenues in current year
|
6,413
|
|
|
|
Adjustments relating to prior years’ estimate
|
(84
|
)
|
|
|
Payments/credits relating to revenues
|
(6,190
|
)
|
|
|
Balance, December 31, 2015
|
2,303
|
|
|
|
Current provisions relating to revenues in current year
|
7,255
|
|
|
|
Adjustments relating to prior years’ estimate
|
(452
|
)
|
|
|
Payments/credits relating to revenues
|
(6,809
|
)
|
|
|
Balance, December 31, 2016
|
2,297
|
|
|
|
Current provisions relating to revenues in current year
|
9,568
|
|
|
|
Adjustments relating to prior years’ estimate
|
(654
|
)
|
|
|
Payments/credits relating to revenues
|
(8,351
|
)
|
|
|
Balance, December 31, 2017
|
$
|
2,860
|
|
Cost of Goods Sold
Cost of goods sold consists of manufacturing, distribution, intangible asset amortization, write-offs of excess and obsolete inventory and other costs related to our commercial products.
Cost of goods sold is summarized by segment as follows:
|
|
Year Ended
December 31, |
2017 vs. 2016
|
2016 vs. 2015
|
||||||||||||||||||||||
|
(in thousands)
|
2017
|
2016
|
2015
|
Change
$ |
Change
% |
Change
$ |
Change
% |
||||||||||||||||||
|
U.S.
|
$
|
135,331
|
|
$
|
129,070
|
|
$
|
106,982
|
|
$
|
6,261
|
|
4.9
|
%
|
$
|
22,088
|
|
20.6
|
%
|
||||||
|
International
|
33,912
|
|
35,003
|
|
50,957
|
|
(1,091
|
)
|
(3.1
|
)%
|
(15,954
|
)
|
(31.3
|
)%
|
|||||||||||
|
Total Cost of goods sold
|
$
|
169,243
|
|
$
|
164,073
|
|
$
|
157,939
|
|
$
|
5,170
|
|
3.2
|
%
|
$
|
6,134
|
|
3.9
|
%
|
||||||
2017 vs. 2016
The increase in U.S. segment cost of goods sold for the year ended
December 31, 2017
, as compared to the prior year is
primarily attributable to costs associated with the increase in sales volumes as discussed above. We also incurred increased technology transfer expenses compared to the prior year, which was offset by lower amortization expense as a result of a fully amortized intangible asset.
The decrease in International segment cost of goods sold for the year ended
December 31, 2017
, as compared to the prior year is
primarily attributable to lower manufacturing costs as a result of the sale of our Australian radiopharmacy business during 2016, partially offset by higher manufacturing costs for certain products due to higher sales volume and higher material costs for certain products.
2016 vs. 2015
The increase in the U.S. segment cost of goods sold for the year ended
December 31, 2016
, as compared to the prior year is primarily due to unit volumes noted in the revenue discussion above. Offsetting these increases was a $0.7 million decrease in technology transfer expenses.
The decrease in the International segment cost of goods sold during the year ended
December 31, 2016
, as compared to the prior year is
primarily due to lower manufacturing costs for certain products as a result of the sale of our Canadian and Australian radiopharmacy businesses.
55
Gross Profit
Gross profit is summarized by segment as follows:
|
|
Year Ended
December 31, |
2017 vs. 2016
|
2016 vs. 2015
|
||||||||||||||||||||||
|
(in thousands)
|
2017
|
2016
|
2015
|
Change
$ |
Change
% |
Change
$ |
Change
% |
||||||||||||||||||
|
U.S.
|
$
|
154,671
|
|
$
|
128,350
|
|
$
|
128,842
|
|
$
|
26,321
|
|
20.5
|
%
|
$
|
(492
|
)
|
(0.4
|
)%
|
||||||
|
International
|
7,464
|
|
9,430
|
|
6,680
|
|
(1,966
|
)
|
(20.8
|
)%
|
2,750
|
|
41.2
|
%
|
|||||||||||
|
Total Gross profit
|
$
|
162,135
|
|
$
|
137,780
|
|
$
|
135,522
|
|
$
|
24,355
|
|
17.7
|
%
|
$
|
2,258
|
|
1.7
|
%
|
||||||
2017 vs. 2016
The increase in U.S. segment gross profit for the year ended
December 31, 2017
, as compared to the prior year is
primarily attributable to higher DEFINITY and Xenon unit sales volumes and the recognition of $5.0 million in Other revenues associated with the License Agreement with GE Healthcare for the continued Phase 3 development and worldwide commercialization of flurpiridaz F 18 without any associated cost of goods sold.
The decrease in International segment gross profit for the year ended
December 31, 2017
, as compared to the prior year is
primarily attributable to higher manufacturing and material costs for certain products.
2016 vs. 2015
The decrease in the U.S. segment gross profit for the year ended
December 31, 2016
, as compared to the prior year is primarily due to lower Xenon unit volumes and lower selling price. Offsetting these decreases were increases in DEFINITY and TechneLite gross profit due to higher unit volumes.
The increase in the International segment gross profit during the year ended
December 31, 2016
, as compared to the prior year is
primarily due to lower Thallium cost of goods per unit, lower manufacturing costs for certain products as a result of the sale of our Canadian radiopharmacies and increased operational efficiencies as a result of the shutdown of one of our Puerto Rican radiopharmacies in the third quarter of 2015. These increases were partially offset by a $0.4 million unfavorable foreign exchange.
Sales and Marketing
Sales and marketing expenses consist primarily of salaries and other related costs for personnel in field sales, marketing, business development and customer service functions. Other costs in sales and marketing expenses include the development and printing of advertising and promotional material, professional services, market research and sales meetings.
Sales and marketing expense is summarized by segment as follows:
|
|
Year Ended
December 31, |
2017 vs. 2016
|
2016 vs. 2015
|
||||||||||||||||||||||
|
(in thousands)
|
2017
|
2016
|
2015
|
Change
$ |
Change
% |
Change
$ |
Change
% |
||||||||||||||||||
|
U.S.
|
$
|
39,471
|
|
$
|
32,919
|
|
$
|
31,130
|
|
$
|
6,552
|
|
19.9
|
%
|
$
|
1,789
|
|
5.7
|
%
|
||||||
|
International
|
2,844
|
|
3,623
|
|
3,610
|
|
(779
|
)
|
(21.5
|
)%
|
$
|
13
|
|
0.4
|
%
|
||||||||||
|
Total Sales and marketing
|
$
|
42,315
|
|
$
|
36,542
|
|
$
|
34,740
|
|
$
|
5,773
|
|
15.8
|
%
|
$
|
1,802
|
|
5.2
|
%
|
||||||
2017 vs. 2016
The increase in U.S. segment sales and marketing expense for the year ended
December 31, 2017
, as compared to the prior year is primarily attributable to employee-related expenses and promotional program expenses.
The decrease in International segment sales and marketing expense for the year ended
December 31, 2017
, as compared to the prior year is primarily attributable to lower employee headcount.
2016 vs. 2015
The increase in the U.S. segment sales and marketing expenses for the year ended
December 31, 2016
, as compared to the prior year is primarily due to employee related expenses, travel, promotional program expenses, as well as credit card fees, as a result of increased revenues.
56
The International segment sales and marketing expenses for the year ended
December 31, 2016
were in line with the prior year period.
General and Administrative
General and administrative expenses consist of salaries and other related costs for personnel in executive, finance, legal, information technology and human resource functions. Other costs included in general and administrative expenses are professional fees for information technology services, external legal fees, consulting and accounting services as well as bad debt expense, certain facility and insurance costs, including director and officer liability insurance.
General and administrative expense is summarized by segment as follows:
|
|
Year Ended
December 31, |
2017 vs. 2016
|
2016 vs. 2015
|
||||||||||||||||||||||
|
(in thousands)
|
2017
|
2016
|
2015
|
Change
$ |
Change
% |
Change
$ |
Change
% |
||||||||||||||||||
|
U.S.
|
$
|
49,269
|
|
$
|
37,389
|
|
$
|
42,091
|
|
$
|
11,880
|
|
31.8
|
%
|
$
|
(4,702
|
)
|
(11.2
|
)%
|
||||||
|
International
|
573
|
|
1,443
|
|
1,803
|
|
(870
|
)
|
(60.3
|
)%
|
(360
|
)
|
(20.0
|
)%
|
|||||||||||
|
Total General and administrative
|
$
|
49,842
|
|
$
|
38,832
|
|
$
|
43,894
|
|
$
|
11,010
|
|
28.4
|
%
|
$
|
(5,062
|
)
|
(11.5
|
)%
|
||||||
2017 vs. 2016
The increase in U.S. segment general and administrative expense for the year ended
December 31, 2017
, as compared to the prior year is primarily attributable to higher employee-related expenses,
$2.6 million
of debt refinancing costs, campus consolidation costs, certain contract termination charges to drive cost efficiencies and a
$0.9 million
land impairment charge.
The decrease in International segment general and administrative expenses for the year ended
December 31, 2017
, as compared to the prior year is primarily attributable to lower employee headcount and related expenses.
2016 vs. 2015
The decrease in the U.S. segment general and administrative expenses for the year ended
December 31, 2016
, as compared to the prior year is primarily due to the $6.5 million termination fee paid to terminate the advisory services and monitoring agreement with Avista in the prior year and lower bad debt expense. This was partially offset by higher amortization of capitalized software, increased employee related incentive costs, increased insurance costs and higher legal fees.
The decrease in the International segment general and administrative expenses for the year ended
December 31, 2016
, as compared to the prior year is
primarily due to lower employee headcount and related expenses.
Research and Development
Research and development expenses relate primarily to the development of new products to add to our portfolio and costs related to our medical affairs, medical information and regulatory functions. We do not allocate research and development expenses incurred in the U.S. to our International segment.
|
|
Year Ended
December 31, |
2017 vs. 2016
|
2016 vs. 2015
|
||||||||||||||||||||||
|
(in thousands)
|
2017
|
2016
|
2015
|
Change
$ |
Change
% |
Change
$ |
Change
% |
||||||||||||||||||
|
U.S.
|
$
|
16,692
|
|
$
|
11,574
|
|
$
|
13,613
|
|
$
|
5,118
|
|
44.2
|
%
|
$
|
(2,039
|
)
|
(15.0
|
)%
|
||||||
|
International
|
1,433
|
|
629
|
|
745
|
|
804
|
|
127.8
|
%
|
(116
|
)
|
(15.6
|
)%
|
|||||||||||
|
Total Research and development
|
$
|
18,125
|
|
$
|
12,203
|
|
$
|
14,358
|
|
$
|
5,922
|
|
48.5
|
%
|
$
|
(2,155
|
)
|
(15.0
|
)%
|
||||||
2017 vs. 2016
The increase in U.S. segment research and development expenses for the year ended
December 31, 2017
, as compared to the prior year is primarily attributable to an increase in depreciation expense and other charges resulting from the scheduled decommissioning of certain long-lived assets associated with research and development operations as well as higher employee-related expenses.
The increase in research and development expenses for International segment for the year ended
December 31, 2017
, as compared to the prior year is
primarily attributable to expenses incurred for a European Phase 4 study for one of our products.
57
2016 vs. 2015
The decrease in the U.S. segment research and development expenses for the year ended
December 31, 2016
, as compared to the prior year is primarily due to a reduction in depreciation expense as a result of a change in planned decommissioning of certain long-lived assets in the first quarter of 2015 associated with research and development operations, partially offset by higher employee related expenses.
The decrease in research and development expenses for the International segment for the year ended
December 31, 2016
, as compared to the prior year is
primarily due to lower expenses in Canada, as a result of the sale of our Canadian radiopharmacies.
Gain on Sales of Assets
Effective January 7, 2016, our Canadian subsidiary entered into an asset purchase agreement, pursuant to which it would sell substantially all of the assets of our Canadian radiopharmacies and Gludef manufacturing and distribution business to one of our existing Canadian radiopharmacy customers. The purchase price for the asset sale was $9.0 million in cash and also included a working capital adjustment of $0.5 million, resulting in a pre-tax gain of $5.9 million recorded within operating income during the year ended
December 31, 2016
.
Effective August 11, 2016, we entered into a share purchase agreement, pursuant to which we sold 100% of the stock of our Australian subsidiary to one of our existing radiopharmacy customers.
This sale included the radiopharmacy business as well as all the direct/bulk business.
The sale price for the share sale was AUD $2.0 million (approximately $1.5 million) in cash and also included a working capital receivable adjustment of approximately AUD $2.0 million (approximately $1.5 million), resulting in a pre-tax gain of $0.6 million, which was recorded within operating income during the year ended
December 31, 2016
.
Interest Expense
Interest expense for the year ended
December 31, 2017
decreased
$8.2 million
from the prior year as a result of a comparatively lower outstanding principal balance on our long-term debt throughout the year resulting from
voluntary prepayments on our 2015 Term Facility of $55.0 million and $20.0 million in the third and fourth quarters of
2016 and the subsequent refinancing of our 2015 Facility at the end of the first quarter of 2017.
Interest expense for
the year ended
December 31, 2016
decreased
$12.1 million
from the prior year as
a result of the refinancing of long-term debt at the end of the second quarter of
2015
. The year ended
December 31, 2016
reflects a full year at the reduced interest rate as a result of the refinancing. Furthermore, our voluntary prepayments of $55.0 million and $20.0 million in the third and fourth quarters of
2016
, respectively, also contributed to the reduction in interest expense for the year ended
December 31, 2016
.
For the year ended
December 31, 2016
we incurred $1.9 million in debt retirement costs related to the $75.0 million voluntary prepayments of principal on our Term Facility.
Loss on Extinguishment of Debt
During the year ended
December 31, 2017
, we incurred
$2.4 million
of losses on extinguishment of debt related to the refinancing and subsequent repricing of our long-term debt. For the year ended
December 31, 2015
, we incurred a
$15.5 million
loss on extinguishment of debt related to the redemption of LMI’s Notes.
Other (Income) Expense
Other (income) expense
increased
$8.4 million
from the prior year due to an increase of
$1.1 million
in foreign currency gains driven by favorable foreign exchange rates relative to the prior year and a
$7.3 million
increase in tax indemnification income as a result of the impact of the reduction in the U.S. federal corporate tax rate pursuant to the Tax Cuts and Jobs Act enacted on December 22, 2017.
For the year ended
December 31, 2016
, as compared to the same period in 2015, other (income) expense increased $0.3 million primarily due to a $0.9 million reduction in foreign currency losses, which was partially offset by a $0.6 million decrease in tax indemnification income.
58
Income Tax (Benefit) Provision
Income tax (benefit) provision is summarized as follows:
|
Year Ended
December 31, |
2017 vs. 2016
|
2016 vs. 2015
|
||||||||||||||||||||||
|
(in thousands)
|
2017
|
2016
|
2015
|
Change
$ |
Change
% |
Change
$ |
Change
% |
|||||||||||||||||
|
Income tax (benefit) provision
|
$
|
(83,746
|
)
|
$
|
1,532
|
|
$
|
2,968
|
|
$
|
(85,278
|
)
|
< (1,000)%
|
$
|
(1,436
|
)
|
(48.4
|
)%
|
||||||
Our benefit for income taxes in
2017
results primarily from releasing the valuation allowance previously recorded against U.S. deferred tax assets. The overall tax benefit in
2017
is reduced by a provision charge pertaining to the reduced U.S. federal tax rate effective January 1, 2018, which reduces our deferred tax asset balances at
December 31, 2017
. The tax benefit for
2017
is also reduced by tax expenses arising from the accrual of interest on uncertain tax positions, and small amounts of U.S. state and foreign taxes. The tax provisions recorded in 2016 and 2015 were primarily comprised of the accrual of interest associated with uncertain tax positions, offset by reversals of those positions as statutes lapsed or as such positions were settled during those years, as well as taxes due in certain foreign jurisdictions where we generate taxable income.
The
$85.3 million
increase in tax benefit for the year ended
December 31, 2017
primarily reflects the current year benefit of the release of the valuation allowance against U.S. deferred tax assets offset by a current year provision reflecting the reduction in value of those assets recorded upon the enactment of the Tax Cuts and Jobs Act of 2017. The
$1.4 million
decrease in the tax provision for the year ended December 31, 2016 when compared to the prior year, primarily reflected an increase in the amount of statute lapses and consequent contingent tax liability releases in 2016.
We regularly assess our ability to realize our deferred tax assets, and that assessment requires significant management judgment. In determining whether our deferred tax assets are more-likely-than-not realizable, we evaluated all available positive and negative evidence, and weighed that evidence on its objective verifiability and expected impact. Historically, we considered our history of net operating losses, customer concentration and contractual risk, DEFINITY supplier risks, the risk of Moly supply availability and cost, and certain product development risk, which resulted in our recording of a full valuation allowance against our domestic net deferred tax assets beginning in the year ended December 31, 2011,
and each year thereafter through the year ended December 31, 2016. We were profitable on a cumulative basis for the three-year period ended December 31, 2017, but all of that profitability was achieved during 2017 and 2016.
During the fourth quarter of 2017, we determined based on our consideration of the weight of positive and negative evidence that there was sufficient positive evidence that our federal and state deferred tax assets are more-likely-than-not realizable as of December 31, 2017. Our conclusion was primarily driven by the achievement of a sustained level of profitability, the expectation of sustained future profitability, and mitigating factors related to external supplier and customer risk sufficient to outweigh the available negative evidence. Accordingly, we released the valuation allowance previously recorded against our domestic net deferred tax assets resulting in an income tax benefit of $141.1 million. We will continue to assess the level of the valuation allowance required and if the weight of negative evidence exists in future periods to again support the recording of a partial or full valuation allowance against our U.S. deferred tax assets, that would likely have a material negative impact on our results of operations in that future period.
We continue to maintain a valuation allowance of $5.4 million on the portion of our foreign net deferred tax assets generated in jurisdictions with an insufficient history of cumulative profitability.
Our effective tax rate for each reporting period is presented as follows:
|
Year Ended
December 31, |
|||||
|
2017
|
2016
|
2015
|
|||
|
Effective tax rate
|
(211.3)%
|
5.4%
|
(25.2)%
|
||
Liquidity and Capital Resources
59
Cash Flows
The following table provides information regarding our cash flows:
|
Year Ended
December 31, |
||||||||||||
|
(in thousands)
|
2017
|
2016
|
2015
|
|||||||||
|
Net cash provided by operating activities
|
$
|
54,777
|
|
$
|
49,642
|
|
$
|
21,762
|
|
|||
|
Net cash (used in) provided by investing activities
|
$
|
(16,309
|
)
|
$
|
3,281
|
|
$
|
(13,151
|
)
|
|||
|
Net cash (used in) provided by financing activities
|
$
|
(13,450
|
)
|
$
|
(30,217
|
)
|
$
|
999
|
|
|||
Net Cash Provided by Operating Activities
Cash provided by operating activities of
$54.8 million
for the year ended
December 31, 2017
was driven primarily by net income of
$123.4 million
plus
$19.2 million
of depreciation, amortization and accretion expense,
$5.9 million
of stock-based compensation expense, offset by deferred taxes of
$86.9 million
related to the release of our valuation on our domestic net deferred tax assets during the year. In addition, we had an increase in our tax indemnification receivable of
$8.4 million
resulting primarily from the impact of recent U.S. federal tax legislation. These net sources of cash were offset by a net
decrease
of
$8.3 million
related to movements in our working capital accounts during the period. The overall
decrease
s in cash from our working capital accounts were primarily driven by higher accounts receivable related to increases in revenues to certain major customers and the timing of inventory purchases during the period offset by increases in accrued expenses primarily due to the timing of payments.
Cash provided by operating activities of
$49.6 million
for the year ended
December 31, 2016
was driven primarily by net income of
$26.8 million
plus
$18.3 million
of depreciation, amortization and accretion expense and
$1.9 million
of debt retirement costs offset by the gain on sale of assets of
$6.4 million
. In addition, our increase in cash from working capital during the year ended
December 31, 2016
, was driven primarily by an increase of
$5.7 million
in accounts payable due to the timing of payment runs and a
$1.3 million
increase in accrued expenses primarily due to an increase in accrued bonus, offset by a
$3.6 million
increase in inventory due to the timing of inventory receipts and a
$1.1 million
increase in accounts receivable due to increased sales.
Cash provided by operating activities of
$21.8 million
for the year ended
December 31, 2015
was primarily driven by a net loss of
$14.7 million
, which was offset by
$19.7 million
of depreciation, amortization, and accretion expense and
$15.5 million
loss on extinguishment of debt. These net sources of cash were offset by a decrease in cash from working capital. Our working capital decrease was driven primarily by a
$4.0 million
decrease in accrued expenses as a result of less interest following the debt refinancing in June 2015, a
$1.7 million
decrease in accounts payable due to the timing of payment runs and a $2.6 million increase in inventory due to timing of production and receipt of inventory.
Net Cash (Used in) Provided By Investing Activities
Net cash used in investing activities during the year ended
December 31, 2017
is primarily attributable to capital expenditures of
$17.5 million
offset by the cash proceeds of
$1.2 million
received from the sale of assets from our Australian radiopharmacy business during the third quarter of 2016.
Net cash provided by investing activities during the year ended
December 31, 2016
was primarily due to cash proceeds of
$10.6 million
received from the sales of our Canadian and Australian radiopharmacy businesses, offset by capital expenditures of
$7.4 million
.
Net cash used in investing activities during the year ended
December 31, 2015
reflects capital expenditures during the year of
$13.2 million
.
Net Cash (Used in) Provided by Financing Activities
Net cash used in financing activities during the year ended
December 31, 2017
is primarily attributable to the net cash outflow of $11.9
million
in connection with our refinancing of our previous $365 million seven-year term loan agreement with a new five-year $275 million term loan facility.
Net cash used in financing activities during the year ended
December 31, 2016
was primarily used to repay $55.0 million of the outstanding principal balance of our $365 million Term Facility with net proceeds of $39.9 million associated with the completion of a follow-on underwritten primary offering, and $15.1 million from cash on hand.
60
During the year ended
December 31, 2015
, we generated $421.3 million from the net proceeds of the Term Facility together with the net proceeds from the initial public offering. The net proceeds generated from the Term Facility and the initial public offering were used to repay in full the aggregate principal amount of the $400 million Notes, pay related premiums and expenses and pay down the
$8.0 million
of outstanding borrowings under the Revolving Facility, which totaled $417.8 million.
External Sources of Liquidity
On June 30, 2015, we completed our initial public offering, entered into a $365 million seven-year term facility (the “2015 Term Facility”) and amended and restated our revolving facility (the “2015 Revolving Facility”) that had a borrowing capacity of $50.0 million.
In September 2016, we completed a follow-on underwritten offering of 5,200,000 shares of common stock and utilized the net proceeds to us from this offering, combined with cash on hand, to prepay $55.0 million of the principal balance of our Term Facility. In November 2016, we completed a second follow-on underwritten offering that included 1,000,000 shares of common stock offered by us and utilized the net proceeds to us from this offering, combined with cash on hand, to prepay $20.0 million of the principal balance of our 2015 Term Facility.
In March 2017, we refinanced the 2015 Term Facility with a new five-year $275.0 million term loan facility (the “2017 Term Facility” and the loans thereunder, the “Term Loans”). In addition, we replaced our 2015 Revolving Facility with a new $75.0 million five-year revolving credit facility (the “2017 Revolving Facility” and, together with the 2017 Term Facility, the “2017 Facility”). The terms of the 2017 Facility are set forth in that certain Amended and Restated Credit Agreement, dated as of March 30, 2017 (the “Credit Agreement”), by and among us, the lenders from time to time party thereto and JPMorgan Chase Bank, N.A., as administrative agent and collateral agent. The 2017 Term Facility was issued net of a $0.7 million discount. We have the right to request an increase to the 2017 Term Facility or request the establishment of one or more new incremental term loan facilities, in an aggregate principal amount of up to $75.0 million, plus additional amounts, in certain circumstances.
We used the net proceeds of the 2017 Term Facility, together with approximately $15.3 million of cash on hand, to refinance in full the aggregate remaining principal amount of the loans outstanding under the 2015 Term Facility and pay related interest, transaction fees and expenses. No amounts were outstanding under the 2015 Revolving Facility at that time.
On November 29, 2017, we entered into Amendment No. 1 (the “Repricing Amendment”) to the 2017 Facility to, among other things, (i) reduce the applicable interest rate margins with respect to the LIBOR and Base Rate Term Loans (as defined in the Credit Agreement) and (ii) reduce
the applicable interest rate margins with respect to the LIBOR and Base Rate Revolving Loans (as defined in the Credit Agreement).
The Term Loans under the 2017 Term Facility bear interest, with pricing based from time to time at our election at (i) LIBOR plus a spread of
3.75%
or (ii) the Base Rate plus a spread of
2.75%
. Interest is payable (i) with respect to LIBOR Term Loans, at the end of each Interest Period (as defined in the Credit Agreement) and (ii) with respect to Base Rate Term Loans, at the end of each quarter. At
December 31, 2017
, our interest rate under the 2017 Term Facility was
5.3%
. As of
December 31, 2017
, the principal balance outstanding on our 2017 Term Facility was
$272.9 million
.
We are permitted to voluntarily prepay the Term Loans, in whole or in part. The 2017 Term Facility requires us to make mandatory prepayments of the outstanding Term Loans in certain circumstances. The 2017 Term Facility amortizes at 1.00% per year until its
June 30, 2022
maturity date.
Under the terms of the 2017 Revolving Facility, the lenders thereunder agreed to extend credit to us from time to time until March 30, 2022 (the “Revolving Termination Date”) consisting of revolving loans (the “Revolving Loans” and, together with the Term Loans, the “Loans”) in an aggregate principal amount not to exceed $75.0 million (the “Revolving Commitment”) at any time outstanding. The 2017 Revolving Facility includes a $20.0 million sub-facility for the issuance of letters of credit (the “Letters of Credit”). The Letters of Credit and the borrowings under the 2017 Revolving Facility are expected to be used for working capital and other general corporate purposes.
The Revolving Loans under the 2017 Revolving Facility bear interest, with pricing based from time to time at our election at (i) LIBOR plus a spread of
3.00%
or (ii) the Base Rate (as defined in the Credit Agreement) plus a spread of
2.00%
. The 2017 Revolving Facility also includes an unused line fee, which is set at
0.375%
while our secured leverage ratio (as defined in the Credit Agreement) is greater than 3.00 to 1.00 and
0.25%
when our secured leverage ratio is less than or equal to 3.00 to 1.00.
61
We are permitted to voluntarily prepay the Revolving Loans, in whole or in part, or reduce or terminate the Revolving Commitment, in each case, without premium or penalty. On any business day on which the total amount of outstanding Revolving Loans and Letters of Credit exceeds the total Revolving Commitment, we must prepay the Revolving Loans in an amount equal to such excess. The 2017 Facility contains a number of affirmative, negative, reporting and financial covenants, in each case subject to certain exceptions and materiality thresholds. The 2017 Facility requires us to be in quarterly compliance, measured on a trailing four quarter basis, with a financial covenant. The maximum consolidated leverage ratio permitted by the financial covenant is displayed in the table below:
|
2017 Facility Financial Covenants
|
|
|
Period
|
Consolidated
Leverage Ratio |
|
Q4 2017 through Q1 2018
|
5.00 to 1.00
|
|
Q2 2018 through Q1 2019
|
4.75 to 1.00
|
|
Thereafter
|
4.50 to 1.00
|
The 2017 Facility contains usual and customary restrictions on our ability and that of our subsidiaries to: (i) incur additional indebtedness (ii) create liens; (iii) consolidate, merge, sell or otherwise dispose of all or substantially all of its assets; (iv) sell certain assets; (v) pay dividends on, repurchase or make distributions in respect of capital stock or make other restricted payments; (vi) make certain investments; (vii) repay subordinated indebtedness prior to stated maturity; and (viii) enter into certain transactions with its affiliates.
Upon an event of default, the administrative agent under the Credit Agreement will have the right to declare the Loans and other obligations outstanding immediately due and payable and all commitments immediately terminated or reduced.
The 2017 Facility is guaranteed by Lantheus Holdings and Lantheus MI Real Estate, LLC (“LMI-RE”), and obligations under the 2017 Facility are generally secured by first priority liens over substantially all of the assets of each of LMI, Lantheus Holdings and LMI-RE (subject to customary exclusions set forth in the transaction documents) owned as of March 30, 2017 or thereafter acquired.
Our ability to fund our future capital needs will be affected by our ability to continue to generate cash from operations and may be affected by our ability to access the capital markets, money markets, or other sources of funding, as well as the capacity and terms of our financing arrangements.
We may from time to time repurchase or otherwise retire our debt and take other steps to reduce our debt or otherwise improve our balance sheet. These actions may include prepayments of our term loans or other retirements or refinancing of outstanding debt, privately negotiated transactions or otherwise. The amount of debt that may be retired, if any, would be decided at the sole discretion of our Board of Directors and will depend on market conditions, our cash position and other considerations.
Funding Requirements
Our future capital requirements will depend on many factors, including:
|
•
|
The pricing environment and the level of product sales of our currently marketed products, particularly DEFINITY and any additional products that we may market in the future;
|
|
•
|
Revenue mix shifts and associated volume and selling price changes that could result from contractual status changes with key customers and additional competition;
|
|
•
|
Our investment in the further clinical development and commercialization of existing products and development candidates;
|
|
•
|
The costs of investing in our facilities, equipment and technology infrastructure;
|
|
•
|
The extent to which we acquire or invest in new products, businesses and technologies;
|
|
•
|
The costs and timing of establishing manufacturing and supply arrangements for commercial supplies of our products;
|
|
•
|
Our ability to have product manufactured and released from JHS and other manufacturing sites in a timely manner in the future;
|
|
•
|
The costs of further commercialization of our existing products, particularly in international markets, including product marketing, sales and distribution and whether we obtain local partners to help share such commercialization costs;
|
|
•
|
The extent to which we choose to establish collaboration, co-promotion, distribution or other similar arrangements for our marketed products;
|
62
|
•
|
The legal costs relating to maintaining, expanding and enforcing our intellectual property portfolio, pursuing insurance or other claims and defending against product liability, regulatory compliance or other claims; and
|
|
•
|
The cost of interest on any additional borrowings which we may incur under our financing arrangements.
|
Until we successfully become dual sourced for our principal products, we are vulnerable to future supply shortages. Disruption in the financial performance could also occur if we experience significant adverse changes in product or customer mix, broad economic downturns, adverse industry or company conditions or catastrophic external events, including natural disasters and political or military conflict. If we experience one or more of these events in the future, we may be required to implement additional expense reductions, such as a delay or elimination of discretionary spending in all functional areas, as well as scaling back select operating and strategic initiatives.
If our capital resources become insufficient to meet our future capital requirements, we would need to finance our cash needs through public or private equity offerings, assets securitizations, debt financings, sale-leasebacks or other financing or strategic alternatives, to the extent such transactions are permissible under the covenants of our Credit Agreement. Additional equity or debt financing, or other transactions, may not be available on acceptable terms, if at all. If any of these transactions require an amendment or waiver under the covenants in our Credit Agreement, which could result in additional expenses associated with obtaining the amendment or waiver, we will seek to obtain such a waiver to remain in compliance with those covenants. However, we cannot be assured that such an amendment or waiver would be granted, or that additional capital will be available on acceptable terms, if at all.
At
December 31, 2017
, our only current committed external source of funds is our borrowing availability under our 2017 Revolving Facility. We had
$76.3 million
of cash and cash equivalents at
December 31, 2017
. Our 2017 Facility contains a number of affirmative, negative, reporting and financial covenants, in each case subject to certain exceptions and materiality thresholds. Incremental borrowings under the 2017 Revolving Facility may affect our ability to comply with the covenants in the 2017 Facility, including the financial covenant restricting total net leverage. Accordingly, we may be limited in utilizing the full amount of our 2017 Revolving Facility as a source of liquidity.
Based on our current operating plans, we believe that our existing cash and cash equivalents, results of operations and availability under our 2017 Revolving Facility will be sufficient to continue to fund our liquidity requirements for the foreseeable future.
63
Contractual Obligations
Contractual obligations represent future cash commitments and liabilities under agreements with third parties and exclude contingent contractual liabilities for which we cannot reasonably predict future payment, including contingencies related to potential future development, financing, certain suppliers, contingent royalty payments and/or scientific, regulatory, or commercial milestone payments under development agreements. The following table summarizes our contractual obligations as of
December 31, 2017
:
|
|
Payments Due by Period
|
||||||||||||||||||
|
(in thousands)
|
Total
|
Less than
1 Year
|
1 - 3 Years
|
3 -5 Years
|
More than
5 Years
|
||||||||||||||
|
Debt obligations (principal)
|
$
|
272,937
|
|
$
|
2,750
|
|
$
|
5,500
|
|
$
|
264,687
|
|
$
|
—
|
|
||||
|
Interest on debt obligations
(a)
|
63,588
|
|
14,651
|
|
28,896
|
|
20,041
|
|
—
|
|
|||||||||
|
Operating lease obligations
(b)
|
1,928
|
|
422
|
|
624
|
|
470
|
|
412
|
|
|||||||||
|
Purchase obligations
(c)
|
5,250
|
|
3,500
|
|
1,750
|
|
—
|
|
—
|
|
|||||||||
|
Capital lease obligations
|
269
|
|
124
|
|
145
|
|
—
|
|
—
|
|
|||||||||
|
Other long-term liabilities
(d)
|
—
|
|
—
|
|
—
|
|
—
|
|
—
|
|
|||||||||
|
Asset retirement obligations
(e)
|
—
|
|
—
|
|
—
|
|
—
|
|
—
|
|
|||||||||
|
Total contractual obligations
|
$
|
343,972
|
|
$
|
21,447
|
|
$
|
36,915
|
|
$
|
285,198
|
|
$
|
412
|
|
||||
________________________________
|
(a)
|
Amount relates to the minimum interest under our 2017 Term Facility.
|
|
(b)
|
Operating leases include minimum payments under leases for our facilities and certain equipment.
|
|
(c)
|
Excludes purchase orders for inventory in the normal course of business.
|
|
(d)
|
Our other long-term liabilities in the consolidated balance sheet include unrecognized tax benefits and related interest and penalties. As of
December 31, 2017
, we had unrecognized tax benefits of
$36.3 million
, which included interest and penalties, classified as noncurrent liabilities. At this time, we are unable to make a reasonably reliable estimate of the timing of payments in individual years in connection with these tax liabilities; therefore, such amounts are not included in the above contractual obligation table.
|
|
(e)
|
We have excluded asset retirement obligations from the table above due to the uncertainty of the timing of the future cash outflows related to the decommissioning of our radioactive operations. As of
December 31, 2017
, the liability, which was approximately
$10.4 million
, was measured at the present value of the obligation expected to be incurred of approximately
$26.9 million
.
|
Off-Balance Sheet Arrangements
We are required to provide the NRC and Massachusetts Department of Public Health financial assurance demonstrating our ability to fund the decommissioning of our North Billerica, Massachusetts production facility upon closure, though we do not intend to close the facility. We have provided this financial assurance in the form of a
$28.2 million
surety bond.
Since inception, we have not engaged in any other off-balance sheet arrangements, including structured finance, special purpose entities or variable interest entities.
Effects of Inflation
We do not believe that inflation has had a significant impact on our revenues or results of operations since inception. We expect our cost of product sales and other operating expenses will change in the future in line with periodic inflationary changes in price levels. Because we intend to retain and continue to use our property and equipment, we believe that the incremental inflation related to the replacement costs of those items will not materially affect our operations. However, the rate of inflation affects our expenses, such as those for employee compensation and contract services, which could increase our level of expenses and the rate at which we use our resources. While we generally believe that we will be able to offset the effect of price-level changes by adjusting our product prices and implementing operating efficiencies, any material unfavorable changes in price levels could have a material adverse effect on our financial condition, results of operations and cash flows.
Recent Accounting Standards
Refer to Note
2
, “
Summary of Significant Accounting Policies
,” in the accompanying consolidated financial statements located under Item 8 of this Annual Report on Form 10-K for information regarding recently issued accounting standards that may have a significant impact on our business.
64
Critical Accounting Policies and Estimates
The discussion and analysis of our financial condition and results of operations are based on our consolidated financial statements, which have been prepared in accordance with U.S. GAAP. These financial statements require us to make estimates and judgments that affect our reported assets and liabilities, revenues and expenses, and other financial information. Actual results may differ materially from these estimates under different assumptions and conditions. In addition, our reported financial condition and results of operations could vary due to a change in the application of a particular accounting standard.
We believe the following represent our critical accounting policies and estimates used in the preparation of our financial statements.
Revenue Recognition
Our revenue is generated from the sales of our diagnostic imaging agents to distributors, radiopharmacies and directly to hospitals and clinics. We recognize revenue when evidence of an arrangement exists, title has passed, substantially all the risks and rewards of ownership have transferred to the customer, the selling price is fixed and determinable and collectability is reasonably assured. For transactions for which revenue recognition criteria have not yet been met, the respective amounts are recorded as deferred revenue until that point in time when criteria are met and revenue can be recognized. Revenue is recognized net of reserves, which consist of allowances for returns and rebates. The estimates of these allowances are based on historical sales volumes and mix and require assumptions and judgments to be made in order to make those estimates. In the event that the sales mix is different from our estimates, we may be required to pay higher or lower returns and sales rebates than we previously estimated. Any changes to these estimates are recorded in the current period. During the years ended
December 31, 2017
,
2016
and
2015
changes in estimates of these allowances were not material.
Inventory
Inventory includes material, direct labor and related manufacturing overhead, and are stated at the lower of cost or market determined on a first-in, first-out basis. We record inventory when we take title to the product. We assess the recoverability of inventory to determine whether adjustments for impairment are required. Inventory that is in excess of future requirements is written down to its estimated net realizable value-based upon estimates of forecasted demand for our products. The estimates of demand require assumptions to be made of future operating performance and customer demand. If actual demand is less than what has been forecasted by management, additional inventory write downs may be required.
Goodwill, Intangibles and Long-Lived Assets
Goodwill is not amortized, but is instead tested for impairment at least annually and whenever events or circumstances indicate that it is more likely than not that it may be impaired. We have elected to perform the annual test of goodwill impairment as of October 31 of each year. All goodwill has been allocated to the U.S. reporting unit.
In performing our annual assessment, we are permitted to first perform a qualitative test and if necessary, perform a quantitative test. To conduct the quantitative impairment test of goodwill, we compare the fair value of a reporting unit to its carrying value. If the reporting unit’s carrying value exceeds its fair value, we would record an impairment loss to the extent that the carrying value of goodwill exceeds its implied fair value. We estimate the fair value of our reporting unit using discounted cash flow or other valuation models, such as comparative transactions and market multiples.
In performing the annual goodwill impairment assessment in the fourth quarter of 2017, we assessed qualitative factors to determine whether it is more-likely-than-not that the fair value of the reporting units were less than their carrying values. We determined that the fair value of the reporting unit was significantly in excess of the carrying value, accordingly, we did not perform a two-step goodwill impairment test. We did not recognize any goodwill impairment charges during the years ended December 31, 2017, 2016 and 2015.
We test intangible and long-lived assets for recoverability whenever events or changes in circumstances suggest that the carrying value of an asset or group of assets may not be recoverable. We measure the recoverability of assets to be held and used by comparing the carrying amount of the asset to future undiscounted net cash flows expected to be generated by the asset. If those assets are considered to be impaired, the impairment equals the amount by which the carrying amount of the assets exceeds the fair value of the assets. Any impairments are recorded as permanent reductions in the carrying amount of the assets. Long-lived assets, other than goodwill and other intangible assets, which are held for sale, are recorded at the lower of the carrying value or the fair market value less the estimated cost to sell.
Intangible assets, consisting of patents, trademarks and customer relationships related to our products are amortized in a method equivalent to the estimated utilization of the economic benefit of the asset. Trademarks and patents are amortized on a straight-line basis, and customer relationships are amortized on an accelerated basis.
65
Income Taxes
The provision for income taxes has been determined using the asset and liability approach of accounting for income taxes. The provision for income taxes represents income taxes paid or payable for the current year plus the change in deferred taxes during the year. Deferred taxes result from differences between the financial and tax bases of our assets and liabilities. Deferred tax assets and liabilities are measured using the currently enacted tax rates that apply to taxable income in effect for the years in which those tax attributes are expected to be recovered or paid, and are adjusted for changes in tax rates and tax laws when such changes are enacted.
On December 22, 2017, the United States enacted the Tax Cuts and Jobs Act of 2017 (the “Act”). The Act is significant and has wide-ranging effects. We are still studying all of the ramifications of the Act, but we believe the primary material impact to the Company will be on our ending net U.S. deferred tax assets, which are reduced as a result of the reduction in U.S. corporate tax rates from 35% to 21% for years beginning on or after January 1, 2018. We
recorded tax expense of $45.1 million during the year ended December 31, 2017, to reflect the impact of the Act on our ending net deferred tax assets carrying value. We reviewed recent guidance issued by the U.S. Treasury concerning the repatriation transition tax. The repatriation transition tax is expected to impact U.S. entities with accumulated yet unrepatriated or 'untaxed' foreign earnings. As of December 31, 2017, we had no accumulated unrepatriated foreign earnings, and therefore anticipate no significant impact from the new provisions of the Act concerning the repatriation transition tax.
We regularly assess our ability to realize our deferred tax assets, and that assessment requires significant management judgment. In determining whether our deferred tax assets are more-likely-than-not realizable, we evaluated all available positive and negative evidence, and weighed that evidence on its objective verifiability and expected impact. Historically, we considered our history of net operating losses, customer concentration and contractual risk, DEFINITY supplier risks, the risk of Moly supply availability and cost, and certain product development risk, which resulted in our recording of a full valuation allowance against our domestic net deferred tax assets beginning in the year ended December 31, 2011,
and each year thereafter through the year ended December 31, 2016. We were profitable on a cumulative basis for the three-year period ended December 31, 2017, but all of that profitability was achieved during 2017 and 2016.
During the fourth quarter of 2017, we determined based on our consideration of the weight of positive and negative evidence that there was sufficient positive evidence that our federal and state deferred tax assets are more-likely-than-not realizable as of December 31, 2017. Our conclusion was primarily driven by the achievement of a sustained level of profitability, the expectation of sustained future profitability, and mitigating factors related to external supplier and customer risk sufficient to outweigh the available negative evidence. Accordingly, we released the valuation allowance previously recorded against our domestic net deferred tax assets resulting in an income tax benefit of $141.1 million. We will continue to assess the level of the valuation allowance required and if the weight of negative evidence exists in future periods to again support the recording of a partial or full valuation allowance against our U.S. deferred tax assets, that would likely have a material negative impact on our results of operations in that future period.
We continue to maintain a valuation allowance of $5.4 million on the portion of our foreign net deferred tax assets generated in jurisdictions with an insufficient history of cumulative profitability.
We account for uncertain tax positions using a recognition threshold and measurement attribute for the financial statement recognition and measurement of a tax position taken or expected to be taken in a tax return. Differences between tax positions taken in a tax return and amounts recognized in the financial statements are recorded as adjustments to income taxes payable or receivable, or adjustments to deferred taxes, or both. We record related interest and penalties to income tax (benefit) provision.
We have a tax indemnification agreement with BMS related to certain contingent tax obligations arising prior to the acquisition of the business from BMS. The tax obligations are recognized in liabilities and the tax indemnification receivable is recognized within other noncurrent assets. The changes in the tax indemnification asset are recognized within other income in the statements of operations, and the changes in the related liabilities are recorded within the tax provision. Accordingly, as these reserves change, adjustments are included in the tax provision while the offsetting adjustment is included in other income. Assuming that the receivable from BMS continues to be considered recoverable by us, there is no net effect on earnings related to these liabilities and no net cash outflows.
The calculation of our tax liabilities involves certain estimates, assumptions and the application of complex tax regulations in numerous jurisdictions worldwide. Any material change in our estimates or assumptions, or the tax regulations, may have a material impact on our results of operations.
We are exposed to market risk from changes in interest rates and foreign currency exchange rates. We do not hold or issue financial instruments to reduce these risks or for trading purposes and have not historically used derivative financial instruments or other financial instruments to hedge these economic exposures.
66
Interest Rate Risk
Under our 2017 Facility, we have substantial variable rate debt. Fluctuations in interest rates may affect our business, financial condition, results of operations and cash flows. As of
December 31, 2017
, we had
$272.9 million
outstanding principal under our 2017 Term Facility with variable interest rates.
Furthermore, we are subject to interest rate risk in connection with our 2017 Revolving Facility, which is variable rate indebtedness. Interest rate changes could increase the amount of our interest payments and thus negatively impact our future earnings and cash flows. As of
December 31, 2017
, there was availability of
$75.0 million
on the 2017 Revolving Facility. Any increase in the interest rate under the 2017 Revolving Facility may have a negative impact on our future earnings to the extent we have outstanding borrowings under the 2017 Revolving Facility. The effect of a 100 basis points adverse change in market interest rates on our 2017 Term Facility, in excess of applicable minimum floors, on our interest expense would be approximately
$2.8 million
.
Historically, we have not used derivative financial instruments or other financial instruments to hedge such economic exposures.
Foreign Currency Risk
We face exposure to movements in foreign currency exchange rates whenever we, or any of our subsidiaries, enter into transactions with third parties that are denominated in currencies other than ours, or that subsidiary’s, functional currency. Intercompany transactions between entities that use different functional currencies also expose us to foreign currency risk.
During the years ended
December 31, 2017
,
2016
and
2015
, the net impact of foreign currency changes on transactions was a gain of $
0.3 million
and losses of
$0.9 million
and
$1.8 million
, respectively. Historically, we have not used derivative financial instruments or other financial instruments to hedge these economic exposures.
The Canadian dollar presents the primary currency risk on our earnings. At December 31, 2017, a hypothetical 10% change in value of the U.S. dollar relative to the Canadian dollar would not have materially affected our financial instruments.
67
LANTHEUS HOLDINGS, INC.
INDEX TO CONSOLIDATED FINANCIAL STATEMENTS
|
Page
|
|
68
REPORT OF INDEPENDENT REGISTERED PUBLIC ACCOUNTING FIRM
To the Board of Directors and Stockholders of
Lantheus Holdings, Inc.
North Billerica, Massachusetts
Opinion on the Financial Statements
We have audited the accompanying consolidated balance sheets of Lantheus Holdings, Inc. and subsidiaries (the “Company”) as of December 31, 2017 and 2016, and the related consolidated statements of operations, comprehensive income (loss), stockholders’ equity (deficit), and cash flows for each of the three years in the period ended December 31, 2017, and the related notes (collectively referred to as the "financial statements"). In our opinion, the financial statements present fairly, in all material respects, the financial position of the Company as of December 31, 2017 and 2016, and the results of its operations and its cash flows for each of the three years in the period ended December 31, 2017, in conformity with the accounting principles generally accepted in the United States of America.
Basis for Opinion
These financial statements are the responsibility of the Company's management. Our responsibility is to express an opinion on these financial statements based on our audits. We are a public accounting firm registered with the Public Company Accounting Oversight Board (United States) (PCAOB) and are required to be independent with respect to the Company in accordance with the U.S. federal securities laws and the applicable rules and regulations of the Securities and Exchange Commission and the PCAOB.
We conducted our audits in accordance with the standards of the PCAOB. Those standards require that we plan and perform the audit to obtain reasonable assurance about whether the financial statements are free of material misstatement. The Company is not required to have, nor were we engaged to perform, an audit of its internal control over financial reporting. As part of our audits, we are required to obtain an understanding of internal control over financial reporting but not for the purpose of expressing an opinion on the effectiveness of the Company’s internal control over financial reporting. Accordingly, we express no such opinion.
Our audits included performing procedures to assess the risks of material misstatement of the financial statements, whether due to error or fraud, and performing procedures that respond to those risks. Such procedures included examining, on a test basis, evidence regarding the amounts and disclosures in the financial statements. Our audits also included evaluating the accounting principles used and significant estimates made by management, as well as evaluating the overall presentation of the financial statements. We believe that our audits provide a reasonable basis for our opinion.
|
/s/ Deloitte & Touche LLP
|
|
Boston, Massachusetts
|
|
February 26, 2018
|
We have served as the Company’s auditor since 2007.
69
Lantheus Holdings, Inc.
(in thousands, except par value)
|
December 31,
|
|||||||
|
2017
|
2016
|
||||||
|
Assets
|
|||||||
|
Current assets
|
|||||||
|
Cash and cash equivalents
|
$
|
76,290
|
|
$
|
51,178
|
|
|
|
Accounts receivable, net
|
40,259
|
|
36,818
|
|
|||
|
Inventory
|
26,080
|
|
17,640
|
|
|||
|
Other current assets
|
5,221
|
|
5,183
|
|
|||
|
Total current assets
|
147,850
|
|
110,819
|
|
|||
|
Property, plant & equipment, net
|
92,999
|
|
94,187
|
|
|||
|
Intangibles, net
|
11,798
|
|
15,118
|
|
|||
|
Goodwill
|
15,714
|
|
15,714
|
|
|||
|
Deferred tax assets, net
|
87,010
|
|
65
|
|
|||
|
Other long-term assets
|
28,487
|
|
19,995
|
|
|||
|
Total assets
|
$
|
383,858
|
|
$
|
255,898
|
|
|
|
Liabilities and stockholders’ equity (deficit)
|
|||||||
|
Current liabilities
|
|||||||
|
Current portion of long-term debt
|
$
|
2,750
|
|
$
|
3,650
|
|
|
|
Revolving line of credit
|
—
|
|
—
|
|
|||
|
Accounts payable
|
17,464
|
|
18,940
|
|
|||
|
Accrued expenses and other liabilities
|
26,536
|
|
21,249
|
|
|||
|
Total current liabilities
|
46,750
|
|
43,839
|
|
|||
|
Asset retirement obligations
|
10,412
|
|
9,370
|
|
|||
|
Long-term debt, net
|
265,393
|
|
274,460
|
|
|||
|
Other long-term liabilities
|
38,012
|
|
34,745
|
|
|||
|
Total liabilities
|
360,567
|
|
362,414
|
|
|||
|
Commitments and contingencies (see Note 14)
|
|
|
|||||
|
Stockholders’ equity (deficit)
|
|||||||
|
Preferred stock ($0.01 par value, 25,000 shares authorized; no shares issued and outstanding)
|
—
|
|
—
|
|
|||
|
Common stock ($0.01 par value, 250,000 shares authorized; 37,765 and 36,756 shares issued and outstanding, respectively)
|
378
|
|
367
|
|
|||
|
Additional paid-in capital
|
232,960
|
|
226,462
|
|
|||
|
Accumulated deficit
|
(209,013
|
)
|
(332,398
|
)
|
|||
|
Accumulated other comprehensive loss
|
(1,034
|
)
|
(947
|
)
|
|||
|
Total stockholders’ equity (deficit)
|
23,291
|
|
(106,516
|
)
|
|||
|
Total liabilities and stockholders’ equity (deficit)
|
$
|
383,858
|
|
$
|
255,898
|
|
|
The accompanying notes are an integral part of these consolidated financial statements.
70
Lantheus Holdings, Inc.
(in thousands, except per share data)
|
|
Year Ended
December 31, |
||||||||||
|
|
2017
|
2016
|
2015
|
||||||||
|
Revenues
|
$
|
331,378
|
|
$
|
301,853
|
|
$
|
293,461
|
|
||
|
Cost of goods sold
|
169,243
|
|
164,073
|
|
157,939
|
|
|||||
|
Gross profit
|
162,135
|
|
137,780
|
|
135,522
|
|
|||||
|
Operating expenses
|
|||||||||||
|
Sales and marketing
|
42,315
|
|
36,542
|
|
34,740
|
|
|||||
|
General and administrative
|
49,842
|
|
38,832
|
|
43,894
|
|
|||||
|
Research and development
|
18,125
|
|
12,203
|
|
14,358
|
|
|||||
|
Total operating expenses
|
110,282
|
|
87,577
|
|
92,992
|
|
|||||
|
Gain on sales of assets
|
—
|
|
6,385
|
|
—
|
|
|||||
|
Operating income
|
51,853
|
|
56,588
|
|
42,530
|
|
|||||
|
Interest expense
|
18,410
|
|
26,618
|
|
38,715
|
|
|||||
|
Debt retirement costs
|
—
|
|
1,896
|
|
—
|
|
|||||
|
Loss on extinguishment of debt
|
2,442
|
|
—
|
|
15,528
|
|
|||||
|
Other (income) expense
|
(8,638
|
)
|
(220
|
)
|
65
|
|
|||||
|
Income (loss) before income taxes
|
39,639
|
|
28,294
|
|
(11,778
|
)
|
|||||
|
Income tax (benefit) provision
|
(83,746
|
)
|
1,532
|
|
2,968
|
|
|||||
|
Net income (loss)
|
$
|
123,385
|
|
$
|
26,762
|
|
$
|
(14,746
|
)
|
||
|
Net income (loss) per common share:
|
|||||||||||
|
Basic
|
$
|
3.31
|
|
$
|
0.84
|
|
$
|
(0.60
|
)
|
||
|
Diluted
|
$
|
3.17
|
|
$
|
0.82
|
|
$
|
(0.60
|
)
|
||
|
Weighted-average common shares outstanding:
|
|||||||||||
|
Basic
|
37,276
|
|
32,044
|
|
24,440
|
|
|||||
|
Diluted
|
38,892
|
|
32,656
|
|
24,440
|
|
|||||
The accompanying notes are an integral part of these consolidated financial statements.
71
Lantheus Holdings, Inc.
Consolidated Statements of Comprehensive Income (Loss)
(in thousands)
|
Year Ended
December 31, |
|||||||||||
|
2017
|
2016
|
2015
|
|||||||||
|
Net income (loss)
|
$
|
123,385
|
|
$
|
26,762
|
|
$
|
(14,746
|
)
|
||
|
Other comprehensive (loss) income:
|
|||||||||||
|
Reclassification adjustment for gains on sales of assets included in net income
|
—
|
|
435
|
|
—
|
|
|||||
|
Foreign currency translation
|
(87
|
)
|
603
|
|
(355
|
)
|
|||||
|
Total other comprehensive (loss) income
|
(87
|
)
|
1,038
|
|
(355
|
)
|
|||||
|
Comprehensive income (loss)
|
$
|
123,298
|
|
$
|
27,800
|
|
$
|
(15,101
|
)
|
||
The accompanying notes are an integral part of these consolidated financial statements.
72
Lantheus Holdings, Inc.
Consolidated Statements of Changes in Stockholders’ Equity (Deficit)
(in thousands)
|
Common Stock
|
Treasury
Stock
|
Additional
Paid-In
Capital
|
Accumulated
Deficit
|
Accumulated
Other
Comprehensive
Loss
|
Total
Stockholders’
Equity
(Deficit)
|
|||||||||||||||||||||||||
|
Shares
|
Amount
|
Shares
|
Amount
|
|||||||||||||||||||||||||||
|
Balance, January 1, 2015
|
18,081
|
|
$
|
181
|
|
(5
|
)
|
$
|
(106
|
)
|
$
|
106,699
|
|
$
|
(344,414
|
)
|
$
|
(1,630
|
)
|
$
|
(239,270
|
)
|
||||||||
|
Issuance of common stock from initial public offering, net of $6,362 issuance costs
|
12,257
|
|
122
|
|
—
|
|
—
|
|
67,055
|
|
—
|
|
—
|
|
67,177
|
|
||||||||||||||
|
Treasury stock retired
|
—
|
|
—
|
|
5
|
|
106
|
|
(106
|
)
|
—
|
|
—
|
|
—
|
|
||||||||||||||
|
Net loss
|
—
|
|
—
|
|
—
|
|
—
|
|
—
|
|
(14,746
|
)
|
—
|
|
(14,746
|
)
|
||||||||||||||
|
Other comprehensive loss
|
—
|
|
—
|
|
—
|
|
—
|
|
—
|
|
—
|
|
(355
|
)
|
(355
|
)
|
||||||||||||||
|
Issuance of common stock
|
40
|
|
—
|
|
—
|
|
—
|
|
—
|
|
—
|
|
—
|
|
—
|
|
||||||||||||||
|
Shares withheld to cover taxes
|
(13
|
)
|
—
|
|
—
|
|
—
|
|
(97
|
)
|
—
|
|
—
|
|
(97
|
)
|
||||||||||||||
|
Stock-based compensation
|
—
|
|
—
|
|
—
|
|
—
|
|
2,002
|
|
—
|
|
—
|
|
2,002
|
|
||||||||||||||
|
Balance, December 31, 2015
|
30,365
|
|
303
|
|
—
|
|
—
|
|
175,553
|
|
(359,160
|
)
|
(1,985
|
)
|
(185,289
|
)
|
||||||||||||||
|
Issuance of common stock, net of $2,080 issuance costs
|
6,200
|
|
62
|
|
—
|
|
—
|
|
48,758
|
|
—
|
|
—
|
|
48,820
|
|
||||||||||||||
|
Net income
|
—
|
|
—
|
|
—
|
|
—
|
|
—
|
|
26,762
|
|
—
|
|
26,762
|
|
||||||||||||||
|
Other comprehensive income
|
—
|
|
—
|
|
—
|
|
—
|
|
—
|
|
—
|
|
1,038
|
|
1,038
|
|
||||||||||||||
|
Stock option exercises
|
41
|
|
1
|
|
—
|
|
—
|
|
230
|
|
—
|
|
—
|
|
231
|
|
||||||||||||||
|
Vesting of restricted stock awards
|
214
|
|
2
|
|
—
|
|
—
|
|
(2
|
)
|
—
|
|
—
|
|
—
|
|
||||||||||||||
|
Shares withheld to cover taxes
|
(64
|
)
|
(1
|
)
|
—
|
|
—
|
|
(601
|
)
|
—
|
|
—
|
|
(602
|
)
|
||||||||||||||
|
Stock-based compensation
|
—
|
|
—
|
|
—
|
|
—
|
|
2,524
|
|
—
|
|
—
|
|
2,524
|
|
||||||||||||||
|
Balance, December 31, 2016
|
36,756
|
|
367
|
|
—
|
|
—
|
|
226,462
|
|
(332,398
|
)
|
(947
|
)
|
(106,516
|
)
|
||||||||||||||
|
Net income
|
—
|
|
—
|
|
—
|
|
—
|
|
—
|
|
123,385
|
|
—
|
|
123,385
|
|
||||||||||||||
|
Other comprehensive loss
|
—
|
|
—
|
|
—
|
|
—
|
|
—
|
|
—
|
|
(87
|
)
|
(87
|
)
|
||||||||||||||
|
Stock option exercises and employee stock plan purchases
|
478
|
|
5
|
|
—
|
|
—
|
|
3,429
|
|
—
|
|
—
|
|
3,434
|
|
||||||||||||||
|
Vesting of restricted stock awards
|
744
|
|
8
|
|
—
|
|
—
|
|
(8
|
)
|
—
|
|
—
|
|
—
|
|
||||||||||||||
|
Shares withheld to cover taxes
|
(214
|
)
|
(2
|
)
|
—
|
|
—
|
|
(2,851
|
)
|
—
|
|
—
|
|
(2,853
|
)
|
||||||||||||||
|
Stock-based compensation
|
—
|
|
—
|
|
—
|
|
—
|
|
5,928
|
|
—
|
|
—
|
|
5,928
|
|
||||||||||||||
|
Balance, December 31, 2017
|
37,765
|
|
$
|
378
|
|
—
|
|
$
|
—
|
|
$
|
232,960
|
|
$
|
(209,013
|
)
|
$
|
(1,034
|
)
|
$
|
23,291
|
|
||||||||
The accompanying notes are an integral part of these consolidated financial statements.
73
Lantheus Holdings, Inc.
(in thousands)
|
Year Ended
December 31,
|
|||||||||||
|
2017
|
2016
|
2015
|
|||||||||
|
Operating activities
|
|||||||||||
|
Net income (loss)
|
$
|
123,385
|
|
$
|
26,762
|
|
$
|
(14,746
|
)
|
||
|
Adjustments to reconcile net income (loss) to net cash flows from operating activities:
|
|||||||||||
|
Depreciation, amortization and accretion
|
19,231
|
|
18,263
|
|
19,651
|
|
|||||
|
Amortization of debt related costs
|
1,361
|
|
1,603
|
|
2,431
|
|
|||||
|
Write-off of deferred offering and financing costs
|
—
|
|
—
|
|
236
|
|
|||||
|
Provision for bad debt
|
136
|
|
53
|
|
773
|
|
|||||
|
Provision for excess and obsolete inventory
|
1,215
|
|
1,342
|
|
1,359
|
|
|||||
|
Stock-based compensation
|
5,928
|
|
2,524
|
|
2,002
|
|
|||||
|
Gain on sales of assets
|
—
|
|
(6,385
|
)
|
—
|
|
|||||
|
Loss on impairment of land
|
912
|
|
—
|
|
—
|
|
|||||
|
Loss on extinguishment of debt and debt retirement costs
|
2,442
|
|
1,896
|
|
15,528
|
|
|||||
|
Deferred taxes
|
(86,946
|
)
|
(155
|
)
|
99
|
|
|||||
|
Long-term income tax receivable
|
(8,413
|
)
|
(200
|
)
|
230
|
|
|||||
|
Long-term income tax payable and other long-term liabilities
|
2,793
|
|
565
|
|
638
|
|
|||||
|
Other
|
1,049
|
|
1,284
|
|
1,795
|
|
|||||
|
Increases (decreases) in cash from operating assets and liabilities:
|
|||||||||||
|
Accounts receivable
|
(3,407
|
)
|
(1,059
|
)
|
(14
|
)
|
|||||
|
Inventory
|
(9,620
|
)
|
(3,626
|
)
|
(2,609
|
)
|
|||||
|
Other current assets
|
(388
|
)
|
(155
|
)
|
(132
|
)
|
|||||
|
Accounts payable
|
604
|
|
5,700
|
|
(1,680
|
)
|
|||||
|
Income taxes
|
(30
|
)
|
(112
|
)
|
187
|
|
|||||
|
Accrued expenses and other liabilities
|
4,525
|
|
1,342
|
|
(3,986
|
)
|
|||||
|
Net cash provided by operating activities
|
54,777
|
|
49,642
|
|
21,762
|
|
|||||
|
Investing activities
|
|||||||||||
|
Capital expenditures
|
(17,543
|
)
|
(7,398
|
)
|
(13,151
|
)
|
|||||
|
Proceeds from sale of assets
|
1,234
|
|
10,605
|
|
—
|
|
|||||
|
Other
|
—
|
|
74
|
|
—
|
|
|||||
|
Net cash (used in) provided by investing activities
|
(16,309
|
)
|
3,281
|
|
(13,151
|
)
|
|||||
|
Financing activities
|
|||||||||||
|
Proceeds from issuance of common stock
|
187
|
|
50,900
|
|
73,539
|
|
|||||
|
Payments for public offering costs
|
(74
|
)
|
(2,006
|
)
|
(6,925
|
)
|
|||||
|
Proceeds from issuance of long-term debt
|
274,313
|
|
—
|
|
360,438
|
|
|||||
|
Payments on long-term debt
|
(286,694
|
)
|
(78,729
|
)
|
(1,900
|
)
|
|||||
|
Payments on senior notes
|
—
|
|
—
|
|
(400,000
|
)
|
|||||
|
Payment for call premium on senior notes
|
—
|
|
—
|
|
(9,752
|
)
|
|||||
|
Deferred financing costs
|
(1,576
|
)
|
(11
|
)
|
(6,304
|
)
|
|||||
|
Net movement in line of credit
|
—
|
|
—
|
|
(8,000
|
)
|
|||||
|
Proceeds from stock option exercises
|
3,247
|
|
231
|
|
—
|
|
|||||
|
Payments for minimum statutory tax withholding related to net share settlement of equity awards
|
(2,853
|
)
|
(602
|
)
|
(97
|
)
|
|||||
|
Net cash (used in) provided by financing activities
|
(13,450
|
)
|
(30,217
|
)
|
999
|
|
|||||
|
Effect of foreign exchange rates on cash and cash equivalents
|
94
|
|
(124
|
)
|
(753
|
)
|
|||||
|
Net increase in cash and cash equivalents
|
25,112
|
|
22,582
|
|
8,857
|
|
|||||
|
Cash and cash equivalents, beginning of year
|
51,178
|
|
28,596
|
|
19,739
|
|
|||||
|
Cash and cash equivalents, end of year
|
$
|
76,290
|
|
$
|
51,178
|
|
$
|
28,596
|
|
||
74
|
Year Ended
December 31,
|
|||||||||||
|
2017
|
2016
|
2015
|
|||||||||
|
Supplemental disclosure of cash flow information
|
|||||||||||
|
Cash paid during the period for:
|
|||||||||||
|
Interest
|
$
|
16,653
|
|
$
|
24,441
|
|
$
|
40,788
|
|
||
|
Income taxes, net of refunds of $17, $82 and $363, respectively
|
$
|
106
|
|
$
|
265
|
|
$
|
174
|
|
||
|
Schedule of non-cash investing and financing activities
|
|||||||||||
|
Additions of property, plant & equipment included in liabilities
|
$
|
2,738
|
|
$
|
4,990
|
|
$
|
1,125
|
|
||
|
Receivable in connection with sale of Australian subsidiary
|
$
|
—
|
|
$
|
1,479
|
|
$
|
—
|
|
||
The accompanying notes are an integral part of these consolidated financial statements.
75
Lantheus Holdings, Inc.
Notes to Consolidated Financial Statements
1
.
Description of Business
Lantheus Holdings, Inc., a Delaware corporation, is the parent company of Lantheus Medical Imaging, Inc. (“LMI”), also a Delaware corporation.
The Company develops, manufactures and commercializes innovative diagnostic medical imaging agents and other products that assist clinicians in the diagnosis and treatment of cardiovascular and other diseases. The Company’s commercial products are used by cardiologists, nuclear physicians, radiologists, internal medicine physicians, sonographers and technologists working in a variety of clinical settings. The Company sells its products to radiopharmacies, integrated delivery networks, hospitals, clinics and group practices. The Company sells its products globally and has operations in the U.S., Puerto Rico and Canada and third-party distribution relationships in Europe, Canada, Australia, Asia-Pacific and Latin America.
The Company has a portfolio of
nine
commercial products, which are diversified across a range of imaging modalities. The Company’s imaging agents include an ultrasound contrast agent and medical radiopharmaceuticals (including Technetium generators), including the following:
|
•
|
DEFINITY
is the leading ultrasound contrast imaging agent used by cardiologists and sonographers during cardiac ultrasound, or echocardiography, exams based on revenue and usage. DEFINITY is an injectable agent that, in the U.S., is indicated for use in patients with suboptimal echocardiograms to assist in the visualization of the left ventricle, the main pumping chamber of the heart. The use of DEFINITY in echocardiography allows physicians to significantly improve their assessment of the function of the left ventricle.
|
|
•
|
TechneLite
is a self-contained system, or generator, of Technetium (Tc99m), a radioisotope with a six hour half-life, used by radiopharmacies to prepare various nuclear imaging agents.
|
|
•
|
Xenon Xe 133 Gas (“Xenon”)
is a radiopharmaceutical gas that is inhaled and used to assess pulmonary function and also cerebral blood flow.
|
|
•
|
Neurolite
is an injectable, Technetium-labeled imaging agent used with Single Photon Emission Computed Tomography (“SPECT”) technology to identify the area within the brain where blood flow has been blocked or reduced due to stroke.
|
|
•
|
Cardiolite
is an injectable, Technetium-labeled imaging agent, also known by its generic name sestamibi, used with SPECT technology in myocardial perfusion imaging (“MPI”) procedures that assess blood flow distribution to the heart.
|
In the U.S., the Company sells DEFINITY through its direct sales team that calls on healthcare providers in the echocardiography space, as well as group purchasing organizations and integrated delivery networks. The Company’s radiopharmaceutical products are primarily distributed through third-party commercial radiopharmacies.
The Company’s International operations consist of sales directly to end users through its wholly-owned radiopharmacy in Puerto Rico and sales through the Company’s distributors in Europe, Canada, Australia, Asia-Pacific and Latin America.
2
.
Summary of Significant Accounting Policies
Basis of Presentation and Principles of Consolidation
The accompanying consolidated financial statements have been prepared in accordance with accounting principles generally accepted in the United States of America (“U.S. GAAP”). The consolidated financial statements include the accounts of the Company and its direct and indirect wholly-owned subsidiaries. All intercompany accounts and transactions have been eliminated in consolidation.
Reclassifications
Certain immaterial reclassifications have been made to conform the prior year consolidated financial statements and notes to the current year presentation.
76
Use of Estimates
The preparation of consolidated financial statements in conformity with U.S. GAAP requires management to make certain estimates and assumptions that affect the reported amounts of assets and liabilities at the date of the consolidated financial statements, and the reported amounts of revenues and expenses during the reporting period. The more significant estimates reflected in the Company’s consolidated financial statements include, but are not limited to, certain judgments regarding revenue recognition, goodwill, tangible and intangible asset valuation, inventory valuation, asset retirement obligations, income tax liabilities and related indemnification receivable, deferred tax assets and liabilities and accrued expenses. Actual results could materially differ from those estimates or assumptions.
Revenue Recognition
The Company recognizes revenue when evidence of an arrangement exists, title has passed, the risks and rewards of ownership have transferred to the customer, the selling price is fixed and determinable, and collectability is reasonably assured. For transactions for which all revenue recognition criteria have not yet been met, the respective amounts are recorded as deferred revenue until such point in time all criteria have been met and revenue can be recognized. Revenue is recognized net of reserves, which consist of allowances for returns and rebates.
Revenue arrangements with multiple elements are divided into separate units of accounting if certain criteria are met, including whether the delivered element has stand-alone value to the customer. The arrangement’s consideration is then allocated to each separate unit of accounting based on the relative selling price of each deliverable. The estimated selling price of each deliverable is determined using the following hierarchy of values: (i) vendor-specific objective evidence of fair value; (ii) third-party evidence of selling price; and (iii) best estimate of selling price. The best estimate of selling price reflects the Company’s best estimate of what the selling price would be if the deliverable was regularly sold by the Company on a stand-alone basis. The consideration allocated to each unit of accounting is then recognized as the related goods or services are delivered, limited to the consideration that is not contingent upon future deliverables. Supply or service transactions may involve the charge of a nonrefundable initial fee with subsequent periodic payments for future products or services. The up-front fees, even if nonrefundable, are recognized as revenue as the products and/or services are delivered and performed over the term of the arrangement.
Collaboration and License Agreement with GE Healthcare Limited
On April 25, 2017, the Company announced that it entered into a definitive, exclusive Collaboration and License Agreement (the “License Agreement”) with GE Healthcare Limited (“GE Healthcare”) for the continued Phase 3 development and worldwide commercialization of flurpiridaz F 18, an investigational positron emission tomography myocardial perfusion imaging agent that may improve the diagnosis of coronary artery disease. Under the License Agreement, GE Healthcare will complete the worldwide development of flurpiridaz F 18, pursue worldwide regulatory approvals and, if successful, lead a worldwide launch and commercialization of the agent, with LMI collaborating on both development and commercialization through a joint steering committee. LMI has an option to co-promote the agent in the U.S. GE Healthcare’s development plan will initially focus on obtaining regulatory approval for flurpiridaz F 18 in the U.S., Japan, Europe and Canada.
Under the terms of the License Agreement, the Company received an up-front payment of
$5.0 million
. In addition, the Company is eligible to receive, from GE Healthcare, up to
$60 million
in regulatory and sales-based milestones and tiered double-digit royalties on U.S. sales and mid-single digit royalties on sales outside the U.S. The Company has concluded that there was only one significant deliverable under the License Agreement, the license of the product, which was considered delivered upon the signing of the License Agreement. The Company recognized revenue of
$5.0 million
associated with entering into the license during the year ended
December 31, 2017
. In addition, because the Company concluded that the regulatory and sales-based milestones are solely dependent on GE Healthcare’s performance and that there are
no
continuing performance obligations from the Company, all development and sales milestones under the License Agreement are considered non-substantive. As of
December 31, 2017
, the Company has not recognized revenue for those milestones under the License Agreement and will recognize such revenue in the periods in which the milestones are achieved. Similarly, the Company will recognize royalty revenues in the periods of the sale of the related products, provided that the reported sales are reliably measurable, collectability is reasonably assured and the Company has no further performance obligations.
Product Returns
The Company provides a reserve for its estimate of sales recorded for which the related products are expected to be returned. The Company does not typically accept product returns unless an over‑shipment, non‑conforming shipment or shipment of defective goods has been provided to the customer. The Company adjusts its estimate of product returns if it becomes aware of other factors that could significantly impact its expected returns, including product recalls. These factors include its estimate of actual and historical return rates for non-conforming product and open return requests. Historically, the Company’s estimates of returns have approximated actual returns.
77
Shipping and Handling Revenues and Costs
The Company typically does not charge customers for shipping and handling costs, but any shipping and handling costs charged to customers are included in revenues. Shipping and handling costs are included in cost of goods sold and were
$14.3 million
,
$13.6 million
and
$17.4 million
for the years ended
December 31, 2017
,
2016
and
2015
, respectively.
Accounts Receivable
Accounts receivable consist of amounts billed and currently due from customers. The Company maintains an allowance for doubtful accounts for estimated losses. In determining the allowance, consideration includes the probability of recoverability based on past experience and general economic factors. Certain accounts receivable may be fully reserved when the Company becomes aware of any specific collection issues.
Also included in accounts receivable are miscellaneous receivables of
$0.8 million
and
$0.7 million
as of
December 31, 2017
and
2016
, respectively.
Rebates and Allowances
Estimates for rebates and allowances represent the Company’s estimated obligations under contractual arrangements with third parties. Rebate accruals and allowances are recorded in the same period the related revenue is recognized, resulting in a reduction to revenues and the establishment of a liability which is included in accrued expenses and other liabilities in the accompanying consolidated balance sheets. These rebates result from performance-based offers that are primarily based on attaining contractually specified sales volumes and growth, Medicaid rebate programs for certain products, administration fees of group purchasing organizations and certain distributor related commissions. The calculation of the accrual for these rebates and allowances is based on an estimate of the third-party’s buying patterns and the resulting applicable contractual rebate or commission rate(s) to be earned over a contractual period.
Income Taxes
The Company accounts for income taxes using an asset and liability approach. The income tax (benefit) provision represents income taxes paid or payable for the current year plus the change in deferred taxes during the year. Deferred taxes result from differences between the financial and tax bases of the Company’s assets and liabilities. Deferred tax assets and liabilities are measured using the currently enacted tax rates that apply to taxable income in effect for the years in which those tax attributes are expected to be recovered or paid, and are adjusted for changes in tax rates and tax laws when such changes are enacted.
Valuation allowances are recorded to reduce deferred tax assets when it is more-likely-than-not that a tax benefit will not be realized. The assessment of whether or not a valuation allowance is required involves the weighing of both positive and negative evidence concerning both historical and prospective information with greater weight given to evidence that is objectively verifiable. A history of recent losses is negative evidence that is difficult to overcome with positive evidence. In evaluating prospective information there are four sources of taxable income: reversals of taxable temporary differences, items that can be carried back to prior tax years (such as net operating losses), pre-tax income, and prudent and feasible tax planning strategies. Adjustments to the deferred tax valuation allowances are made in the period when those assessments are made.
The Company accounts for uncertain tax positions using a recognition threshold and measurement attribute for the financial statement recognition and measurement of a tax position taken or expected to be taken in a tax return. Differences between tax positions taken in a tax return and amounts recognized in the financial statements are recorded as adjustments to other long-term assets and liabilities, or adjustments to deferred taxes, or both. The Company classifies interest and penalties within the income tax (benefit) provision.
Net Income (Loss) per Common Share
Basic earnings per common share is computed by dividing net income (loss) by the weighted-average number of shares of common stock outstanding during the period. Diluted earnings per common share is computed by dividing net income by the weighted-average number of shares of common stock outstanding during the period, plus the potential dilutive effect of other securities if those securities were converted or exercised. During periods in which the Company incurs net losses, both basic and diluted loss per common share is calculated by dividing the net loss by the weighted-average shares of common stock outstanding and potentially dilutive securities are excluded from the calculation because their effect would be antidilutive.
Cash and Cash Equivalents
Cash and cash equivalents include savings deposits, certificates of deposit and money market funds that have original maturities of three months or less when purchased.
78
Concentration of Risks and Limited Suppliers
Financial instruments which potentially subject the Company to concentrations of credit risk consist principally of trade accounts receivable. The Company periodically reviews its accounts receivable for collectability and provides for an allowance for doubtful accounts to the extent that amounts are not expected to be collected. The Company sells primarily to large national distributors, which in turn, may resell the Company’s products.
The following table sets forth customers representing 10% or more of accounts receivable and 10% or more of revenues:
|
Accounts Receivable
December 31,
|
Revenues
Year Ended December 31,
|
||||||||
|
2017
|
2016
|
2017
|
2016
|
2015
|
|||||
|
Company A
|
***
|
***
|
12.0%
|
10.3%
|
11.3%
|
||||
|
Company B
|
14.5%
|
13.1%
|
10.4%
|
11.4%
|
11.9%
|
||||
|
Company C
|
***
|
10.5%
|
10.3%
|
***
|
***
|
||||
________________________________
*** Amount represented less than 10% for the reporting period.
The Company relies on certain materials used in its development and manufacturing processes, some of which are procured from only one or a few sources. The failure of one of these suppliers to deliver on schedule could delay or interrupt the manufacturing or commercialization process and would adversely affect the Company’s operating results. In addition, a disruption in the commercial supply of, or a significant increase in the cost of one of the Company’s materials from these sources could have a material adverse effect on the Company’s business, financial position and results of operations.
Historically, an important supplier of Moly and Xenon was Nordion, which relied on the NRU reactor in Chalk River, Ontario. As a result of a decision by the Government of Canada, the NRU reactor exited the medical isotope business in November 2016. The Company currently has Moly supply agreements with NTP Radioisotopes (“NTP”) of South Africa, for itself and on behalf of its subcontractor ANSTO of Australia, running through December 31, 2020, and with Institute for Radioelements (“IRE”) of Belgium, running through December 31, 2018 and renewable by us on a year-to-year basis thereafter. The Company also has a Xenon supply agreement with IRE which runs through June 30, 2019, also subject to extensions. The Company currently relies on IRE as the sole supplier of bulk-unprocessed Xenon which the Company processes and finishes for its customers. The Company currently relies on JHS as its sole source manufacturer of DEFINITY, Neurolite, Cardiolite and evacuation vials for TechneLite. The Company currently has no other active supplier of DEFINITY, Neurolite or Cardiolite.
The following table sets forth revenues for each of the Company’s products representing 10% or more of revenues:
|
Year Ended
December 31,
|
|||||
|
2017
|
2016
|
2015
|
|||
|
DEFINITY
|
47.5%
|
43.6%
|
38.1%
|
||
|
TechneLite
|
31.6%
|
32.9%
|
24.7%
|
||
|
Xenon
|
***
|
***
|
16.7%
|
||
________________________________
*** Amount represented less than 10% of revenues for the reporting period
Inventory
Inventory includes material, direct labor and related manufacturing overhead and is stated at the lower of cost or market on a first-in, first-out basis.
The Company assesses the recoverability of inventory to determine whether adjustments for excess and obsolete inventory are required. Inventory that is in excess of future requirements is written down to its estimated net realizable value based on product shelf life, forecasted demand and other factors.
Inventory costs associated with product that has not yet received regulatory approval are capitalized if the Company believes there is probable future commercial use of the product and future economic benefits of the asset. If future commercial use of the product is not probable, then inventory costs associated with such product are expensed as incurred. At
December 31, 2017
and
2016
, the Company had
no
capitalized inventories associated with product that did not have regulatory approval.
79
Property, Plant & Equipment
Property, plant & equipment are stated at cost. Replacements of major units of property are capitalized, and replaced properties are retired. Replacements of minor components of property and repair and maintenance costs are charged to expense as incurred. Certain costs to obtain or develop computer software are capitalized and amortized over the estimated useful life of the software. Depreciation and amortization is computed on a straight-line basis over the estimated useful lives of the related assets. The estimated useful lives of the major classes of depreciable assets are as follows:
|
Class
|
Range of Estimated Useful Lives
|
|
|
Buildings
|
10 - 50 years
|
|
|
Land improvements
|
15 - 40 years
|
|
|
Machinery and equipment
|
3 - 15 years
|
|
|
Furniture and fixtures
|
15 years
|
|
|
Leasehold improvements
|
Lesser of lease term or 15 years
|
|
|
Computer software
|
3 - 5 years
|
|
Upon retirement or other disposal of property, plant & equipment, the cost and related amount of accumulated depreciation are removed from the asset and accumulated depreciation accounts, respectively. The difference, if any, between the net asset value and the proceeds is included in operating income.
Included within machinery, equipment and fixtures are spare parts. Spare parts include replacement parts relating to plant & equipment and are either recognized as an expense when consumed or reclassified and capitalized as part of the related asset and depreciated over the remaining useful life of the related asset.
Goodwill
Goodwill is not amortized but is instead tested for impairment at least annually and whenever events or circumstances indicate that it is more likely-than-not that they may be impaired. The Company has elected to perform the annual test for goodwill impairment as of October 31 of each year. All goodwill has been allocated to the U.S. reporting unit.
In performing the Company’s annual assessment, the Company is permitted to first perform a qualitative test and if necessary, perform a quantitative test. To conduct the quantitative impairment test of goodwill, the Company compares the fair value of a reporting unit to its carrying value. If the reporting unit’s carrying value exceeds its fair value, the Company would record an impairment loss to the extent that the carrying value of goodwill exceeds its implied fair value. The Company estimates the fair value of its reporting unit using discounted cash flow or other valuation models, such as comparative transactions and market multiples. The Company did not recognize any goodwill impairment charges during the years ended December 31, 2017, 2016 or 2015.
Intangible and Long-Lived Assets
The Company tests intangible and long-lived assets for recoverability whenever events or changes in circumstances suggest that the carrying value of an asset or group of assets may not be recoverable. The Company measures the recoverability of assets to be held and used by comparing the carrying amount of the asset to future undiscounted net cash flows expected to be generated by the asset. If those assets are considered to be impaired, the impairment equals the amount by which the carrying amount of the assets exceeds the fair value of the assets. Any impairments are recorded as permanent reductions in the carrying amount of the assets. Long-lived assets, other than goodwill and other intangible assets that are held for sale are recorded at the lower of the carrying value or the fair market value less the estimated cost to sell.
Intangible assets, consisting of patents, trademarks and customer relationships related to the Company’s products are amortized in a method equivalent to the estimated utilization of the economic benefit of the asset.
Contingencies
In the normal course of business, the Company is subject to loss contingencies, such as legal proceedings and claims arising out of its business, that cover a wide range of matters, including, among others, product and environmental liability. The Company records accruals for those loss contingencies when it is probable that a liability will be incurred and the amount of loss can be reasonably estimated. The Company does not recognize gain contingencies until realized.
80
Fair Values of Financial Instruments
The estimated fair values of the Company’s financial instruments, including its cash and cash equivalents, accounts receivable, accounts payable and accrued expenses approximate the carrying values of these instruments due to their short term nature. The estimated fair value of the Company’s long term debt approximates its carrying values as the applicable interest rates are subject to change with market interest rates.
Advertising and Promotion Costs
Advertising and promotion costs are expensed as incurred. During the years ended
December 31, 2017
,
2016
and
2015
, the Company incurred
$4.4 million
,
$3.6 million
and
$3.1 million
, respectively in advertising and promotion costs, which are included in sales and marketing in the consolidated statements of operations.
Research and Development
Research and development costs are expensed as incurred and relate primarily to the development of new products to add to the Company’s portfolio and costs related to its medical affairs and medical information functions. Nonrefundable advance payments for goods or services that will be used or rendered for future research and development activities are deferred and recognized as an expense as the goods are delivered or the related services are performed.
Foreign Currency
The consolidated statements of operations of the Company’s foreign subsidiaries are translated into U.S. Dollars using weighted-average exchange rates. The net assets of the Company’s foreign subsidiaries are translated into U.S. Dollars using the end of period exchange rates. The impact from translating the net assets of these subsidiaries at changing rates are recorded in the foreign currency translation adjustment account, which is included in accumulated other comprehensive loss in the consolidated balance sheets.
Remeasurement of the Company’s foreign currency denominated transactions are included in net income. Transaction gains and losses are reported as a component of o
ther (income) expense
, in the consolidated statements of operations.
Stock-Based Compensation
The Company’s stock-based compensation cost is measured at the grant date of the stock-based award based on the fair value of the award and is recognized as expense over the requisite service period, which generally represents the vesting period, and includes an estimate of the awards that will be forfeited. The Company uses the Black-Scholes valuation model for estimating the fair value of stock options. The fair value of stock option awards is affected by the valuation assumptions, including the expected volatility based on comparable market participants, expected term of the option, risk-free interest rate and expected dividends. When a contingent cash settlement of vested options becomes probable, the Company reclassifies its vested awards to a liability and accounts for any
incremental compensation cost in the period in which the settlement becomes probable.
Expense for performance restricted stock awards is recognized based upon the fair value of the awards on the date of grant and the number of shares expected to vest based on the terms of the underlying award agreement and the requisite service period(s).
Other (Income) Expense
Other (income) expense consisted of the following:
|
|
Years Ended
December 31,
|
||||||||||
|
(in thousands)
|
2017
|
2016
|
2015
|
||||||||
|
Foreign currency (gains) losses
|
$
|
(253
|
)
|
$
|
853
|
|
$
|
1,752
|
|
||
|
Tax indemnification income
|
(8,367
|
)
|
(1,055
|
)
|
(1,655
|
)
|
|||||
|
Other income
|
(18
|
)
|
(18
|
)
|
(32
|
)
|
|||||
|
Total other (income) expense
|
$
|
(8,638
|
)
|
$
|
(220
|
)
|
$
|
65
|
|
||
Comprehensive Income (Loss)
Comprehensive income (loss) consists of net income and other gains and losses affecting stockholders’ equity that, under U.S. GAAP, are excluded from net income. For the Company, comprehensive income (loss) consists of foreign currency translation gains and losses. The accumulated other comprehensive loss balance consists entirely of foreign currency translation gains and losses.
81
Asset Retirement Obligations
The Company’s compliance with federal, state, local and foreign environmental laws and regulations may require it to remove or mitigate the effects of the disposal or release of chemical substances in jurisdictions where it does business or maintains properties. The Company establishes accruals when those costs are legally obligated and probable and can be reasonably estimated. Accrual amounts are estimated based on currently available information, regulatory requirements, remediation strategies, historical experience, the relative shares of the total remediation costs and a relevant discount rate, when the time periods of estimated costs can be reasonably predicted. Changes in these assumptions could impact the Company’s future reported results.
The Company has identified conditional asset retirement obligations related to the future removal and disposal of asbestos contained in certain of the buildings located on the Company’s North Billerica, Massachusetts campus. The asbestos is appropriately contained, and the Company believes it is compliant with all applicable environmental regulations. If these properties undergo major renovations or are demolished, certain environmental regulations are in place, which specify the manner in which asbestos must be handled and disposed. The Company is required to record the fair value of these conditional liabilities if they can be reasonably estimated. As of
December 31, 2017
and
2016
, sufficient information was not available to estimate a liability for such conditional asset retirement obligations as the obligations to remove the asbestos from these properties have indeterminable settlement dates. As such, no liability for conditional asset retirement obligations has been recorded in the accompanying consolidated balance sheets as of
December 31, 2017
and
2016
.
Self-Insurance Reserves
The Company’s consolidated balance sheets at
December 31, 2017
and
2016
include
$0.5 million
and
$0.4 million
of accrued liabilities associated with employee medical costs that are retained by the Company. The Company estimates the required liability of those claims on an undiscounted basis based upon various assumptions which include, but are not limited to, the Company’s historical loss experience and projected loss development factors. The required liability is also subject to adjustment in the future based upon changes in claims experience, including changes in the number of incidents (frequency) and change in the ultimate cost per incident (severity). The Company also maintains a separate cash account to fund these medical claims and must maintain a minimum balance as determined by the plan administrator. The balance of this restricted cash account was approximately
$0.1 million
at both
December 31, 2017
and
2016
, and is included in other current assets.
82
Recent Accounting Standards
The following table provides a description of recent accounting pronouncements that could have a material effect on the Company’s consolidated financial statements:
|
Standard
|
Description
|
Effective Date
for Company
|
Effect on the
Consolidated Financial
Statements
|
|
Recently Issued Accounting Standards Not Yet Adopted
|
|||
|
ASU 2017-09, Compensation—Stock Compensation (Topic 718): Scope of Modification Accounting
|
This ASU clarifies when to account for a change to the terms or conditions of a share–based payment award as a modification. Under the new guidance, modification accounting is required only if the fair value, vesting conditions or classification of the award (as equity or liability) changes as a result of the change in terms or conditions.
The new guidance will be applied prospectively to awards modified on or after the adoption date. The guidance is effective for annual periods, and interim periods within those annual periods, beginning after December 15, 2017 for all entities. Early adoption is permitted, including adoption in any interim period for which financial statements have not yet been issued or made available for issuance. |
January 1, 2018
|
The Company does not expect that the adoption of this standard will have a material impact on the Company’s consolidated financial statements.
|
|
ASU 2014-09, Revenue from Contracts with Customers (Topic 606) and related additional amendments ASU 2015-14, ASU 2016-08, ASU 2016-10, ASU 2016-11, ASU 2016-12, ASU 2016-20, ASU 2017-05, ASU 2017-10
|
This ASU and related amendments affect any entity that either enters into contracts with customers to transfer goods or services or enters into contracts for the transfer of nonfinancial assets, unless those contracts are within the scope of other standards. The guidance in this ASU supersedes the revenue recognition requirements in Topic 605, Revenue Recognition and most industry-specific guidance. The core principle of the guidance is that an entity should recognize revenue upon the transfer of promised goods or services to customers in an amount that reflects the consideration to which the entity expects to be entitled in exchange for those goods or services. The new guidance also includes a set of disclosure requirements that will provide users of financial statements with comprehensive information about the nature, amount, timing, and uncertainty of revenue and cash flows arising from a reporting organization’s contracts with customers. In August 2015, the Financial Accounting Standards Board issued ASU No. 2015-14, “Revenue from Contracts with Customers (Topic 606): Deferral of the Effective Date,” which defers the effective date of ASU 2014-09 by one year.
The standard is effective for annual reporting periods beginning after December 15, 2017, and interim periods therein, using either of the following transition methods: • A full retrospective approach reflecting the application of the standard in each prior reporting period with the option to elect certain practical expedients, or • A modified retrospective approach with the cumulative effect of initially adopting ASU 2014-09 recognized at the date of adoption (which includes additional footnote disclosures). |
January 1, 2018
|
The Company has completed its assessment of the impact of the standards on its contract portfolio by reviewing the Company’s current accounting policies and practices and identifying differences that will result from applying the requirements of the new standard to its revenue contracts. The Company categorized its customers into multiple customer types and assessed significant customer arrangements within those customer types. The Company concluded that upon adoption of the new standard there will not be a significant impact to its revenue. The Company, in part due to the limited impact, will utilize the modified retrospective approach of adopting the ASU. The Company has identified and implemented appropriate changes to its business processes and controls to support recognition and disclosure under the new standard. Although the Company does not expect that the adoption of the new standard will have a material impact to its revenues, the Company will significantly expand its disclosures in future filings related to the qualitative and quantitative aspects of its revenue streams.
|
|
ASU 2016-02, Leases (Topic 842)
|
This ASU supersedes existing guidance on accounting for leases in “Leases (Topic 840)” and generally requires all leases to be recognized in the statement of financial position. The provisions of ASU 2016-02 are effective for annual reporting periods beginning after December 15, 2018; early adoption is permitted. The provisions of this ASU are to be applied using a modified retrospective approach.
|
January 1, 2019
|
The Company is currently assessing the impact that this standard will have on its consolidated financial statements.
|
83
|
Standard
|
Description
|
Effective Date
for Company
|
Effect on the
Consolidated Financial
Statements
|
|
Accounting Standards Adopted During the Year Ended December 31, 2017
|
|||
|
ASU 2016-09, Compensation - Stock Compensation (Topic 718): Improvements to Employee Share-Based Payment Accounting
|
ASU 2016-09 simplifies several aspects of the stock compensation guidance in Topic 718 and other related guidance providing the following amendments:
• Accounting for income taxes upon vesting or exercise of share-based payments and related EPS effects • Classification of excess tax benefits on the statement of cash flows • Accounting for forfeitures • Liability classification exception for statutory tax withholding requirements • Cash flow presentation of employee taxes paid when an employer withholds shares for tax-withholding purposes • Elimination of the indefinite deferral in Topic 718 |
January 1, 2017
|
The adoption of this standard did not have a material impact on the Company’s consolidated financial statements.
|
3
.
Fair Value of Financial Instruments
Fair value is defined as the price that would be received to sell an asset or paid to transfer a liability in an orderly transaction between market participants at the measurement date. In order to increase consistency and comparability of fair value measurements, financial instruments are categorized based on a hierarchy that prioritizes observable and unobservable inputs used to measure fair value into three broad levels, which are described below:
|
•
|
Level 1
— Inputs are unadjusted quoted prices in active markets for identical assets or liabilities that the Company has the ability to access at the measurement date.
|
|
•
|
Level 2
— Inputs include quoted prices for similar assets and liabilities in active markets, quoted prices for identical or similar assets or liabilities in markets that are not active, inputs other than quoted prices that are observable for the asset or liability (i.e., interest rates, yield curves, etc.) and inputs that are derived principally from or corroborated by observable market data by correlation or other means (market corroborated inputs).
|
|
•
|
Level 3
— Unobservable inputs that reflect a Company’s estimates about the assumptions that market participants would use in pricing the asset or liability. The Company develops these inputs based on the best information available, including its own data.
|
The Company’s financial assets measured at fair value on a recurring basis consist of money market funds. The Company invests excess cash from its operating cash accounts in overnight investments and reflects these amounts in cash and cash equivalents in the consolidated balance sheets at fair value using quoted prices in active markets for identical assets.
The tables below present information about the Company’s assets and liabilities measured at fair value on a recurring basis:
|
|
December 31, 2017
|
||||||||||||||
|
(in thousands)
|
Total Fair
Value |
Level 1
|
Level 2
|
Level 3
|
|||||||||||
|
Money market
|
$
|
8,700
|
|
$
|
8,700
|
|
$
|
—
|
|
$
|
—
|
|
|||
|
Total
|
$
|
8,700
|
|
$
|
8,700
|
|
$
|
—
|
|
$
|
—
|
|
|||
|
|
December 31, 2016
|
||||||||||||||
|
(in thousands)
|
Total Fair
Value
|
Level 1
|
Level 2
|
Level 3
|
|||||||||||
|
Money market
|
$
|
3,565
|
|
$
|
3,565
|
|
$
|
—
|
|
$
|
—
|
|
|||
|
Total
|
$
|
3,565
|
|
$
|
3,565
|
|
$
|
—
|
|
$
|
—
|
|
|||
Nonrecurring Fair Value Measurements
As of December 31, 2017, the Company wrote down the value of land held for sale in the U.S. segment to its fair value, less estimated costs to sell, using Level 3 inputs. See Note 7 for further discussion regarding land held for sale.
84
4
.
Income Taxes
The components of income (loss) before income taxes is summarized as follows:
|
Year Ended
December 31,
|
|||||||||||
|
(in thousands)
|
2017
|
2016
|
2015
|
||||||||
|
U.S.
|
$
|
39,559
|
|
$
|
23,736
|
|
$
|
(2,670
|
)
|
||
|
International
|
80
|
|
4,558
|
|
(9,108
|
)
|
|||||
|
Income (loss) before income taxes
|
$
|
39,639
|
|
$
|
28,294
|
|
$
|
(11,778
|
)
|
||
The income tax (benefit) provision is summarized as follows:
|
Year Ended
December 31,
|
|||||||||||
|
(in thousands)
|
2017
|
2016
|
2015
|
||||||||
|
Current
|
|||||||||||
|
Federal
|
$
|
(58
|
)
|
$
|
(91
|
)
|
$
|
265
|
|
||
|
State
|
3,242
|
|
1,689
|
|
2,386
|
|
|||||
|
International
|
16
|
|
(49
|
)
|
218
|
|
|||||
|
3,200
|
|
1,549
|
|
2,869
|
|
||||||
|
Deferred
|
|||||||||||
|
Federal
|
(71,742
|
)
|
—
|
|
—
|
|
|||||
|
State
|
(15,220
|
)
|
—
|
|
—
|
|
|||||
|
International
|
16
|
|
(17
|
)
|
99
|
|
|||||
|
(86,946
|
)
|
(17
|
)
|
99
|
|
||||||
|
Income tax (benefit) provision
|
$
|
(83,746
|
)
|
$
|
1,532
|
|
$
|
2,968
|
|
||
A reconciliation of the income tax (benefit) provision with amounts determined by applying the U.S. federal income tax rate to income (loss) before income taxes is as follows:
|
Year Ended
December 31,
|
|||||||||||
|
(in thousands)
|
2017
|
2016
|
2015
|
||||||||
|
U.S. statutory rate
|
$
|
13,873
|
|
$
|
9,903
|
|
$
|
(4,122
|
)
|
||
|
Permanent items
|
(1,916
|
)
|
(570
|
)
|
(782
|
)
|
|||||
|
Write-off of foreign tax and research credits
|
—
|
|
7,125
|
|
—
|
|
|||||
|
Foreign tax credits
|
—
|
|
(319
|
)
|
306
|
|
|||||
|
Uncertain tax positions
|
3,128
|
|
1,529
|
|
2,523
|
|
|||||
|
Other tax credits
|
(175
|
)
|
90
|
|
(120
|
)
|
|||||
|
State and local taxes
|
1,252
|
|
433
|
|
478
|
|
|||||
|
Impact of rate change on deferred taxes
|
45,129
|
|
(383
|
)
|
749
|
|
|||||
|
True-up of prior year tax
|
7
|
|
(2,751
|
)
|
1,191
|
|
|||||
|
Foreign tax rate differential
|
97
|
|
(242
|
)
|
46
|
|
|||||
|
Valuation allowance
|
(141,094
|
)
|
(13,292
|
)
|
2,704
|
|
|||||
|
Benefit of windfall related to stock compensation
|
(2,723
|
)
|
—
|
|
—
|
|
|||||
|
Increase in indemnification deferred tax asset
|
(1,055
|
)
|
—
|
|
—
|
|
|||||
|
Other
|
(269
|
)
|
9
|
|
(5
|
)
|
|||||
|
Income tax (benefit) provision
|
$
|
(83,746
|
)
|
$
|
1,532
|
|
$
|
2,968
|
|
||
85
The components of deferred income tax assets (liabilities) are as follows:
|
December 31,
|
|||||||
|
(in thousands)
|
2017
|
2016
|
|||||
|
Deferred Tax Assets
|
|||||||
|
Federal benefit of state tax liabilities
|
$
|
7,510
|
|
$
|
11,420
|
|
|
|
Reserves, accruals and other
|
9,251
|
|
10,906
|
|
|||
|
Inventory obsolescence
|
239
|
|
14,138
|
|
|||
|
Capitalized research and development
|
9,941
|
|
18,861
|
|
|||
|
Amortization of intangibles other than goodwill
|
3,903
|
|
8,040
|
|
|||
|
Net operating loss carryforwards
|
63,202
|
|
80,808
|
|
|||
|
Depreciation
|
972
|
|
492
|
|
|||
|
Deferred tax assets
|
95,018
|
|
144,665
|
|
|||
|
Deferred Tax Liabilities
|
|||||||
|
Reserves, accruals and other
|
(1,346
|
)
|
(287
|
)
|
|||
|
Customer relationships
|
(1,294
|
)
|
(3,398
|
)
|
|||
|
Depreciation
|
—
|
|
—
|
|
|||
|
Deferred tax liability
|
(2,640
|
)
|
(3,685
|
)
|
|||
|
Less: valuation allowance
|
(5,368
|
)
|
(140,915
|
)
|
|||
|
$
|
87,010
|
|
$
|
65
|
|
||
|
Recorded in the accompanying consolidated balance sheets as:
|
|||||||
|
Noncurrent deferred tax assets
|
$
|
87,010
|
|
$
|
65
|
|
|
On December 22, 2017, the United States enacted the Tax Cuts and Jobs Act of 2017 (the “Act”). The Act is significant and has wide-ranging effects. The Company is still studying all of the ramifications of the Act, but expects the primary material impact will be on the Company’s ending net U.S. deferred tax assets, which have been reduced as a result of the reduction in U.S. corporate tax rates from 35% to 21% for years beginning on or after January 1, 2018. The Company recorded tax expense of
$45.1 million
during the year ended
December 31, 2017
, to reflect the impact of the Act on its ending net deferred tax assets carrying value. The Company has reviewed recent guidance issued by the U.S. Treasury concerning the repatriation transition tax. The repatriation transition tax is expected to impact U.S. entities with accumulated yet unrepatriated foreign earnings. As of
December 31, 2017
, the Company has
no
accumulated unrepatriated foreign earnings, and therefore has recorded no liability for the repatriation transition tax.
The Company regularly assesses its ability to realize its deferred tax assets, and that assessment requires significant management judgment. In determining whether its deferred tax assets are more-likely-than-not realizable, the Company evaluated all available positive and negative evidence, and weighed that evidence on its objective verifiability and expected impact. Historically, the Company considered its history of net operating losses, customer concentration and contractual risk, DEFINITY supplier risk, the risk of Moly supply availability and cost, and certain product development risks, which resulted in the Company recording a full valuation allowance against its domestic net deferred tax assets beginning in the year ended December 31, 2011, and each year thereafter through the year ended December 31, 2016. The Company was profitable on a cumulative basis for the
three-year
period ended
December 31, 2017
, but all of that profitability was achieved during 2017 and 2016.
During the fourth quarter of 2017, the Company determined based on its consideration of the weight of positive and negative evidence that there was sufficient positive evidence that its federal and state deferred tax assets are more-likely-than-not realizable as of
December 31, 2017
. The Company’s conclusion was primarily driven by the Company achieving a sustained level of profitability, the expectation of sustained future profitability, and mitigating factors related to external supplier and customer risk sufficient to outweigh the available negative evidence. Accordingly, the Company released the valuation allowance previously recorded against its domestic net deferred tax assets, resulting in an income tax benefit of
$141.1 million
. The Company will continue to assess the level of the valuation allowance required and if the weight of negative evidence exists in future periods to again support the recording of a partial or full valuation allowance against the Company’s U.S. deferred tax assets, that would likely have a material negative impact on the Company’s results of operations in that future period.
The Company continues to maintain a valuation allowance of
$5.4 million
on the portion of its foreign net deferred tax assets generated in jurisdictions with an insufficient history of cumulative profitability.
86
A summary of the changes in the Company’s valuation allowance is summarized below:
|
(in thousands)
|
Amount
|
||
|
Balance, January 1, 2015
|
$
|
152,138
|
|
|
Charged to income tax (benefit) provision
|
2,704
|
|
|
|
Foreign currency
|
(590
|
)
|
|
|
Deductions
|
—
|
|
|
|
Balance, December 31, 2015
|
154,252
|
|
|
|
Charged to income tax (benefit) provision
|
(13,292
|
)
|
|
|
Foreign currency
|
(45
|
)
|
|
|
Deductions
|
—
|
|
|
|
Balance, December 31, 2016
|
140,915
|
|
|
|
Charged to income tax (benefit) provision
|
2,305
|
|
|
|
Adoption of ASU 2016-09
|
2,929
|
|
|
|
Foreign currency
|
313
|
|
|
|
Deductions
|
—
|
|
|
|
Release valuation allowance
|
(141,094
|
)
|
|
|
Balance, December 31, 2017
|
$
|
5,368
|
|
The Company’s U.S. federal income tax returns are subject to examination for
three years
. The state and foreign income tax returns are subject to examination for periods varying from
three
to
four years
depending on the specific jurisdictions’ statutes of limitation.
At
December 31, 2017
, the Company has U.S. federal net operating loss carryovers of
$233.5 million
, which will begin to expire in
2030
and fully expire in
2037
. The Company has Massachusetts state research credit carryforward of
$2.6 million
, which will expire between
2024
and
2032
. The Company has Massachusetts investment tax credit carryforwards of approximately
$1.1 million
, of which
$0.4 million
have no expiration date, and the remainder of which will begin to expire in
2029
and fully expire in
2032
.
The Company has concluded that an ownership change, as defined under Section 382 of the Internal Revenue Code, occurred during the year ended December 31,
2016
. A Section 382 limitation now applies to the Company’s pre-change U.S. federal net operating loss carryforwards and other U.S. tax attributes. The limitation was computed based on the value of the Company just prior to the ownership change. It is the Company’s view that its ability to utilize U.S. federal net operating losses within the carryforward period is not reduced by the limitation imposed by this ownership change. However, the Company’s U.S. research credit carryforwards and U.S. foreign tax credit carryforwards will not be utilizable and as such these credits totaling
$7.1 million
were removed from the gross deferred tax asset balances as of
December 31, 2016
.
87
A reconciliation of the Company’s changes in uncertain tax positions for
2017
,
2016
and
2015
is as follows:
|
(in thousands)
|
Amount
|
||
|
Balance of uncertain tax positions as of January 1, 2015
|
$
|
12,144
|
|
|
Additions related to current year tax positions
|
—
|
|
|
|
Reductions related to prior year tax positions
|
—
|
|
|
|
Settlements
|
(694
|
)
|
|
|
Lapse of statute of limitations
|
—
|
|
|
|
Balance of uncertain tax positions as of December 31, 2015
|
11,450
|
|
|
|
Additions related to current year tax positions
|
—
|
|
|
|
Reductions related to prior year tax positions
|
—
|
|
|
|
Settlements
|
(593
|
)
|
|
|
Lapse of statute of limitations
|
(416
|
)
|
|
|
Balance of uncertain tax positions as of December 31, 2016
|
10,441
|
|
|
|
Additions related to current year tax positions
|
—
|
|
|
|
Reductions related to prior year tax positions
|
(506
|
)
|
|
|
Settlements
|
—
|
|
|
|
Lapse of statute of limitations
|
(69
|
)
|
|
|
Balance of uncertain tax positions as of December 31, 2017
|
$
|
9,866
|
|
As of
December 31, 2017
and
2016
, the total amount of unrecognized tax benefits were
$9.9 million
and
$10.4 million
, respectively, all of which, if recognized, would affect the effective tax rate. These amounts are primarily associated with domestic state tax issues, such as the allocation of income among various state tax jurisdictions.
As of
December 31, 2017
and
2016
, total liabilities for tax obligations and associated interest and penalties were
$37.0 million
and
$34.4 million
, respectively, consisting of income tax provisions for uncertain tax benefits of
$9.9 million
and
$10.4 million
, interest accruals of
$24.9 million
and
$21.9 million
, and penalty accruals of
$2.2 million
and
$2.1 million
, respectively. As of
December 31, 2017
and
2016
,
$36.3 million
and
$33.2 million
, respectively, were included in other long-term liabilities on the consolidated balance sheets and
$0.7 million
and
$1.2 million
, respectively, have reduced the Company’s deferred tax assets. Included in the
2017
,
2016
and
2015
tax provisions are
$3.1 million
,
$1.5 million
and
$2.5 million
, respectively, relating to interest and penalties, net of benefits for reversals of uncertain tax positions and interest and penalties recognized upon settlements and lapses of relevant statutes of limitation.
In accordance with the Company’s acquisition of the medical imaging business from Bristol Myers Squibb (“BMS”) in 2008, the Company entered into a tax indemnification agreement with BMS related to certain tax obligations arising prior to the acquisition of the Company, for which the Company has the primary legal obligation. A long-term receivable is recorded to account for the expected value to the Company of future indemnification payments, net of actual U.S. federal tax benefits. The tax indemnification receivable is recognized within other noncurrent assets. The total noncurrent asset related to the indemnification was
$26.3 million
and
$17.9 million
at
December 31, 2017
and
2016
, respectively. The changes in the tax indemnification asset are recognized within other (income) expense, in the consolidated statement of operations. In accordance with the Company’s accounting policy, the change in the tax liability and penalties and interest associated with these obligations (net of any offsetting federal or state benefit) is recognized within the tax provision. Accordingly, as these reserves change, adjustments are included in the tax provision while the offsetting adjustment is included in other (income) expense. Assuming that the receivable from BMS continues to be considered recoverable by the Company, there will be minimal net effect on earnings and net cash outflows related to these liabilities.
During the year ended
December 31, 2017
, BMS made
no
payments on behalf of the Company with respect to indemnified contingent tax liabilities. In
2016
and
2015
, BMS, on behalf of the Company, made payments totaling
$0.7 million
and
$1.9 million
, respectively to several states in connection with prior year state income tax filings. The amount due from BMS, included within other long-term assets, increased by
$8.4 million
, primarily due to the decrease in U.S. corporate tax rates effective January 1, 2018. In
2016
and
2015
, the amount due from BMS decreased by
$1.3 million
and
$1.6 million
for the years ended
December 31, 2016
, and
2015
, respectively, which represented the release of asset balances associated with pre-acquisition year-related tax payments made by BMS.
Included in other (income) expense for the years ended
December 31, 2017
,
2016
and
2015
, is tax indemnification income of
$8.4 million
,
$1.1 million
and
$1.7 million
, respectively. For the year ended
December 31, 2017
,
$6.5 million
of the tax indemnification income is related to the impact of the U.S. federal tax rate reduction, and the remainder arises from increases in the indemnified liabilities.
88
5
.
Sales of Certain International Segment Assets
Sale of Certain Canadian Assets
During the
fourth quarter of 2015
, the Company committed to a plan to sell certain assets and liabilities associated with the Company’s Canadian operations in the International Segment. This event qualified for held for sale accounting and the Company determined that the fair value of the net assets being sold significantly exceeded the carrying value as of
December 31, 2015
. The transaction was finalized in the
first quarter of 2016
.
Effective
January 7, 2016
, the Canadian subsidiary of the Company entered into an asset purchase agreement (“Canadian Asset Purchase Agreement”) pursuant to which it would sell substantially all of the assets of its Canadian radiopharmacy businesses and Gludef manufacturing and distribution business to one of its existing Canadian radiopharmacy customers.
The purchase price for the asset sale was
$9.0 million
in cash and also included a working capital adjustment of
$0.5 million
, which was settled in the
third quarter of 2016
. The Canadian Asset Purchase Agreement contained customary representations, warranties and covenants by each of the parties. Subject to certain limitations, the buyer will be indemnified for damages resulting from breaches or inaccuracies of the Company’s representations, warranties and covenants in the Canadian Asset Purchase Agreement.
As part of the transaction, the Company and the buyer also entered into a customary transition services agreement and a long-term supply contract under which the Company will supply the buyer with certain of the Company’s products on commercial terms and under which the buyer has agreed to certain product minimum purchase commitments.
The Company does not believe the sale of certain net assets in the international segment constituted a strategic shift that would have a major effect on its operations or financial results. As a result, this transaction is not classified as discontinued operations in the Company’s consolidated financial statements.
This sale of assets resulted in a pre-tax book gain of
$5.9 million
, which is recorded within gain on sales of assets in the accompanying consolidated statements of operations for the year ended
December 31, 2016
.
Sale of Australian Radiopharmacy Servicing Subsidiary
Effective
August 11, 2016
, the Company entered into a share purchase agreement (“Australian Share Purchase Agreement”) with one of its existing radiopharmacy customers under which it sold all of the stock of its Australian radiopharmacy servicing subsidiary.
The aggregate share sale price was
AUD $2.0 million
(approximately
$1.5 million
) in cash and also included a working capital adjustment of approximately
AUD $2.0 million
(approximately
$1.5 million
) for total proceeds of
AUD $4.0 million
(approximately
$3.0 million
) from the sale. As a result of this sale, the Company disposed of net assets of
$2.2 million
, primarily comprised of working capital accounts of
$2.0 million
.
This share sale resulted in an adjusted pre-tax book gain of
$0.5 million
, which is recorded within gain on sales of assets in the accompanying consolidated statements of operations for the year ended
December 31, 2016
. As a result of the sale of the Australian subsidiary, the Company reclassified
$0.4 million
from other comprehensive income to gain on sale of assets in the accompanying consolidated statements of operations for the year ended
December 31, 2016
.
The Australian Share Purchase Agreement contains customary representations, warranties and covenants by each of the parties. Subject to certain limitations, the buyer will be indemnified for damages resulting from breaches or inaccuracies of the Company’s representations, warranties and covenants in the Australian Share Purchase Agreement.
As part of the transaction, the Company and the buyer also entered into a long-term supply and distribution contract under which the Company will supply the buyer and its subsidiaries with the Company’s products on commercial terms and under which the buyer has agreed to certain product minimum purchase commitments.
The Company does not believe this sale of certain net assets in the international segment constituted a strategic shift that would have a major effect on its operations or financial results. As a result, this transaction is not classified as discontinued operations in the Company’s accompanying consolidated financial statements.
89
6
.
Inventory
Inventory consisted of the following:
|
December 31,
|
|||||||
|
(in thousands)
|
2017
|
2016
|
|||||
|
Raw materials
|
$
|
10,447
|
|
$
|
9,658
|
|
|
|
Work in process
|
5,509
|
|
3,965
|
|
|||
|
Finished goods
|
10,124
|
|
4,017
|
|
|||
|
Total inventory
|
$
|
26,080
|
|
$
|
17,640
|
|
|
As of
December 31, 2017
and
2016
, the Company had
$1.1 million
and
$1.2 million
of inventory classified within other long‑term assets, respectively, which represent raw materials not expected to be used by the Company during the next twelve months.
7
.
Property, Plant & Equipment, Net
Property, plant & equipment, net, consisted of the following:
|
|
December 31,
|
||||||
|
(in thousands)
|
2017
|
2016
|
|||||
|
Land
|
$
|
13,450
|
|
$
|
14,950
|
|
|
|
Buildings
|
76,059
|
|
70,628
|
|
|||
|
Machinery, equipment and fixtures
|
71,870
|
|
65,407
|
|
|||
|
Computer software
|
20,271
|
|
18,482
|
|
|||
|
Construction in progress
|
7,622
|
|
7,224
|
|
|||
|
189,272
|
|
176,691
|
|
||||
|
Less: accumulated depreciation and amortization
|
(96,273
|
)
|
(82,504
|
)
|
|||
|
Total property, plant & equipment, net
|
$
|
92,999
|
|
$
|
94,187
|
|
|
Depreciation and amortization expense related to property, plant & equipment, net, was
$14.8 million
,
$12.1 million
and
$12.9 million
for the years ended
December 31, 2017
,
2016
and
2015
, respectively.
Long-Lived Assets Held for Sale
During the fourth quarter of 2017, the Company committed to a plan to sell a portion of its land in the U.S. segment. This event qualified for held for sale accounting and the land was written down to its fair value, less estimated costs to sell, which is classified in other current assets in the accompanying consolidated balance sheet. This resulted in a loss of
$0.9 million
, which is included within general and administrative expenses in the accompanying consolidated statement of operations. The fair value was estimated utilizing Level 3 inputs and using a market approach, based on available data for transactions in the region, discussions with real estate brokers and the asking price of comparable properties in its principal market.
In
February 2018, the Company sold the land for net proceeds of
$1.0 million
.
8
.
Asset Retirement Obligations
The Company considers its legal obligation to remediate its facilities upon a decommissioning of its radioactive-related operations as an asset retirement obligation. The Company has production facilities which manufacture and process radioactive materials at its North Billerica, Massachusetts and San Juan, Puerto Rico sites.
The Company is required to provide the U.S. Nuclear Regulatory Commission and Massachusetts Department of Public Health financial assurance demonstrating the Company’s ability to fund the decommissioning of its North Billerica, Massachusetts production facility upon closure, although the Company does not intend to close the facility. The Company has provided this financial assurance in the form of a
$28.2 million
surety bond.
The fair value of a liability for asset retirement obligations is recognized in the period in which the liability is incurred. As of
December 31, 2017
, the liability is measured at the present value of the obligation expected to be incurred, of approximately
$26.9 million
, and is adjusted in subsequent periods as accretion expense is recorded. The corresponding asset retirement costs are capitalized as part of the carrying values of the related long-lived assets and depreciated over the assets’ useful lives.
90
The following table provides a summary of the changes in the Company’s asset retirement obligations:
|
(in thousands)
|
Amount
|
||
|
Balance, December 31, 2016
|
$
|
9,370
|
|
|
Accretion expense
|
1,042
|
|
|
|
Balance, December 31, 2017
|
$
|
10,412
|
|
9
.
Intangibles, Net
Intangibles, net, consisted of the following:
|
|
December 31, 2017
|
||||||||||||
|
(in thousands)
|
Amortization
Method |
Cost
|
Accumulated Amortization
|
Net
|
|||||||||
|
Trademarks
|
Straight-Line
|
$
|
13,540
|
|
$
|
(9,304
|
)
|
$
|
4,236
|
|
|||
|
Customer relationships
|
Accelerated
|
99,133
|
|
(92,072
|
)
|
7,061
|
|
||||||
|
Patents
|
Straight-Line
|
42,780
|
|
(42,279
|
)
|
501
|
|
||||||
|
Total
|
$
|
155,453
|
|
$
|
(143,655
|
)
|
$
|
11,798
|
|
||||
|
December 31, 2016
|
|||||||||||||
|
(in thousands)
|
Amortization
Method |
Cost
|
Accumulated Amortization
|
Net
|
|||||||||
|
Trademarks
|
Straight-Line
|
$
|
13,540
|
|
$
|
(8,752
|
)
|
$
|
4,788
|
|
|||
|
Customer relationships
|
Accelerated
|
98,926
|
|
(89,705
|
)
|
9,221
|
|
||||||
|
Patents
|
Straight-Line
|
42,780
|
|
(41,671
|
)
|
1,109
|
|
||||||
|
Total
|
$
|
155,246
|
|
$
|
(140,128
|
)
|
$
|
15,118
|
|
||||
The Company recorded amortization expense for its intangible assets of
$3.3 million
,
$5.1 million
and
$6.0 million
for the years ended
December 31, 2017
,
2016
and
2015
, respectively.
The below table summarizes the estimated aggregate amortization expense expected to be recognized on the above intangible assets:
|
(in thousands)
|
Amount
|
||
|
2018
|
$
|
2,649
|
|
|
2019
|
1,806
|
|
|
|
2020
|
1,571
|
|
|
|
2021
|
1,312
|
|
|
|
2022
|
1,175
|
|
|
|
2023 and thereafter
|
3,285
|
|
|
|
Total
|
$
|
11,798
|
|
10
.
Accrued Expenses and Other Liabilities
Accrued expenses are comprised of the following:
|
|
December 31,
|
||||||
|
(in thousands)
|
2017
|
2016
|
|||||
|
Compensation and benefits
|
$
|
14,469
|
|
$
|
12,312
|
|
|
|
Freight, distribution and operations
|
3,604
|
|
2,995
|
|
|||
|
Accrued rebates, discounts and chargebacks
|
2,860
|
|
2,297
|
|
|||
|
Accrued professional fees
|
2,852
|
|
1,701
|
|
|||
|
Other
|
2,751
|
|
1,944
|
|
|||
|
Total accrued expenses and other liabilities
|
$
|
26,536
|
|
$
|
21,249
|
|
|
91
11
.
Financing Arrangements
On
March 30, 2017
, the Company refinanced its previous
$365 million
seven
-year term loan agreement (the facility thereunder, the “2015 Term Facility”) with a new
five
-year
$275 million
term loan facility (the “2017 Term Facility” and the loans thereunder, the “Term Loans”). In addition, the Company replaced its previous
$50 million
five
-year asset based loan facility (the “ABL Facility”) with a new
$75 million
five
-year revolving credit facility (the “2017 Revolving Facility” and, together with the 2017 Term Facility, the “2017 Facility”). The terms of the 2017 Facility are set forth in that certain Amended and Restated Credit Agreement, dated as of
March 30, 2017
(the “Credit Agreement”), by and among Holdings, the Company, the lenders from time to time party thereto and JPMorgan Chase Bank, N.A., as administrative agent and collateral agent. The 2017 Term Facility was issued net of a
$0.7 million
discount. The Company has the right to request an increase to the 2017 Term Facility or request the establishment of one or more new incremental term loan facilities, in an aggregate principal amount of up to
$75.0 million
, plus additional amounts, in certain circumstances.
The net proceeds of the 2017 Term Facility, together with approximately
$15.3 million
of cash on hand, were used to refinance in full the aggregate remaining principal amount of the loans outstanding under the 2015 Term Facility and pay related interest, transaction fees and expenses.
No
amounts were outstanding under the ABL Facility at that time. The Company accounted for the refinancing as both a debt extinguishment and debt modification by evaluating the refinancing on a creditor by creditor basis. The Company recorded a loss on extinguishment of debt of
$2.2 million
related to the write-off of unamortized debt issuance costs and incurred general and administrative expenses of
$1.7 million
related to third-party costs associated with the modified debt. In addition, the Company incurred and capitalized
$1.6 million
of new debt issuance costs related to the refinancing.
On November 29, 2017, the Company entered into Amendment No. 1 (the “Repricing Amendment”) to the 2017 Facility to, among other things, (i) reduce the applicable interest rate margins with respect to the LIBOR and Base Rate Term Loans and (ii) reduce
the applicable interest rate margins with respect to the LIBOR and Base Rate Revolving Loans
. The Company accounted for the Repricing Amendment as both a debt extinguishment and debt modification by evaluating the refinancing on a creditor by creditor basis. The Company recorded a loss on extinguishment of
$0.2 million
related to the write-off of unamortized debt issuance costs and incurred general and administrative expenses of
$0.9 million
related to third-party costs associated with the repricing.
2017 Term Facility
The Term Loans under the 2017 Term Facility bear interest, with pricing based from time to time at the Company’s election at (i) LIBOR plus a spread of
3.75%
or (ii) the Base Rate (as defined in the Credit Agreement) plus a spread of
2.75%
. Interest is payable (i) with respect to LIBOR Term Loans, at the end of each Interest Period (as defined in the Credit Agreement) and (ii) with respect to Base Rate Term Loans, at the end of each quarter. At
December 31, 2017
, the Company’s interest rate under the 2017 Term Facility was
5.3%
.
The Company is permitted to voluntarily prepay the Term Loans, in whole or in part. The 2017 Term Facility requires the Company to make mandatory prepayments of the outstanding Term Loans in certain circumstances. The 2017 Term Facility amortizes at
1.00%
per year until its
June 30, 2022
maturity date.
The Company’s maturities of principal obligations under the 2017 Term Facility are as follows as of
December 31, 2017
:
|
(in thousands)
|
Amount
|
||
|
2018
|
2,750
|
|
|
|
2019
|
2,750
|
|
|
|
2020
|
2,750
|
|
|
|
2021
|
2,750
|
|
|
|
2022
|
261,937
|
|
|
|
Total principal outstanding
|
272,937
|
|
|
|
Unamortized debt discount
|
(2,036
|
)
|
|
|
Unamortized debt issuance costs
|
(2,758
|
)
|
|
|
Total
|
268,143
|
|
|
|
Less: current portion
|
(2,750
|
)
|
|
|
Total long-term debt
|
$
|
265,393
|
|
92
2017 Revolving Facility
Under the terms of the 2017 Revolving Facility, the lenders thereunder agreed to extend credit to the Company from time to time until
March 30, 2022
(the “Revolving Termination Date”) consisting of revolving loans (the “Revolving Loans” and, together with the Term Loans, the “Loans”) in an aggregate principal amount not to exceed
$75.0 million
(the “Revolving Commitment”) at any time outstanding. The 2017 Revolving Facility includes a
$20.0 million
sub-facility for the issuance of letters of credit (the “Letters of Credit”). The Letters of Credit and the borrowings under the 2017 Revolving Facility are expected to be used for working capital and other general corporate purposes.
The Revolving Loans under the 2017 Revolving Facility bear interest, with pricing based from time to time at the Company’s election at (i) LIBOR plus a spread of
3.00%
or (ii) the Base Rate (as defined in the Credit Agreement) plus a spread of
2.00%
. The 2017 Revolving Facility also includes an unused line fee, which is set at
0.38%
while the Company’s secured leverage ratio (as defined in the Credit Agreement) is greater than
3.00
to 1.00 and
0.25%
when the Company’s secured leverage ratio is less than or equal to
3.00
to 1.00.
The Company is permitted to voluntarily prepay the Revolving Loans, in whole or in part, or reduce or terminate the Revolving Commitment, in each case, without premium or penalty. On any business day on which the total amount of outstanding Revolving Loans and Letters of Credit exceeds the total Revolving Commitment, the Company must prepay the Revolving Loans in an amount equal to such excess. As of
December 31, 2017
, there were
no
outstanding borrowings under the 2017 Revolving Facility.
2017 Facility Covenants
The 2017 Facility contains a number of affirmative, negative, reporting and financial covenants, in each case subject to certain exceptions and materiality thresholds. The 2017 Facility requires the Company to be in quarterly compliance, measured on a trailing four quarter basis, with a financial covenant. The maximum consolidated leverage ratio permitted by the financial covenant is displayed in the table below:
|
2017 Facility Financial Covenant
|
|
|
Period
|
Consolidated
Leverage Ratio |
|
Q4 2017 through Q1 2018
|
5.00 to 1.00
|
|
Q2 2018 through Q1 2019
|
4.75 to 1.00
|
|
Thereafter
|
4.50 to 1.00
|
The 2017 Facility contains usual and customary restrictions on the ability of the Company and its subsidiaries to: (i) incur additional indebtedness (ii) create liens; (iii) consolidate, merge, sell or otherwise dispose of all or substantially all of its assets; (iv) sell certain assets; (v) pay dividends on, repurchase or make distributions in respect of capital stock or make other restricted payments; (vi) make certain investments; (vii) repay subordinated indebtedness prior to stated maturity; and (viii) enter into certain transactions with its affiliates.
Upon an event of default, the administrative agent under the Credit Agreement will have the right to declare the Loans and other obligations outstanding immediately due and payable and all commitments immediately terminated or reduced.
The 2017 Facility is guaranteed by Lantheus Holdings and Lantheus MI Real Estate, LLC (“LMI-RE”), and obligations under the 2017 Facility are generally secured by first priority liens over substantially all of the assets of each of LMI, Holdings and LMI-RE (subject to customary exclusions set forth in the transaction documents) owned as of
March 30, 2017
or thereafter acquired.
12
.
Stock-Based Compensation
Equity Incentive Plans
As of
December 31, 2017
, the Company’s approved equity incentive plans included the 2015 Equity Incentive Plan (“2015 Plan”), the 2013 Equity Incentive Plan (“2013 Plan”), and the 2008 Equity Incentive Plan (“2008 Plan”). These plans are administered by the Board of Directors and permit the granting of stock options, stock appreciation rights, restricted stock, restricted stock units and dividend equivalent rights (“DERs”) to employees, officers, directors and consultants of the Company. The Board of Directors may, at its sole discretion, grant DERs with respect to any award and such DER is treated as a separate award.
The Company has certain stock option and restricted stock awards outstanding under each of its equity incentive plans but, upon adoption of the 2015 Plan, no longer grants new equity awards under its 2008 and 2013 Plans. The Company adopted its 2015 Plan in June 2015 and subsequently amended the plan in April 2017 to increase the common stock reserved for issuance under the plan to an aggregate
5,755,277
shares.
93
Stock-based compensation expense recognized in the consolidated statements of operations is summarized below:
|
Year Ended
December 31,
|
|||||||||||
|
(in thousands)
|
2017
|
2016
|
2015
|
||||||||
|
Cost of goods sold
|
$
|
1,692
|
|
$
|
359
|
|
$
|
192
|
|
||
|
Sales and marketing
|
640
|
|
339
|
|
254
|
|
|||||
|
General and administrative
|
2,964
|
|
1,438
|
|
1,330
|
|
|||||
|
Research and development
|
632
|
|
388
|
|
226
|
|
|||||
|
Total stock-based compensation expense
|
$
|
5,928
|
|
$
|
2,524
|
|
$
|
2,002
|
|
||
Stock Options
Stock option awards under the 2015 Plan are granted with an exercise price equal to the fair value of the Company’s common stock at the date of grant. Time based option awards vest based on time, typically
four years
, and performance based option awards vest based on the performance criteria specified in the grant. All option awards have a
ten
-year contractual term. The Company recognizes compensation costs for its time based awards on a straight-line basis equal to the vesting period. The compensation cost for performance based awards is recognized on a graded vesting basis, based on the probability of achieving the performance targets over the requisite service period for the entire award. The fair value of each option award is estimated on the date of grant using a Black-Scholes valuation model that uses the assumptions noted in the following table. Expected volatilities are based on the historic volatility of a selected peer group. Expected dividends represent the dividends expected to be issued at the date of grant. The expected term of options represents the period of time that options granted are expected to be outstanding. The risk-free interest rate assumption is the U.S. Treasury rate at the date of the grant which most closely resembles the expected life of the options.
The table below summarizes the key assumptions used in valuing stock options granted:
|
Year Ended
December 31, 2015 |
||
|
Expected volatility
|
26.0% - 30.0%
|
|
|
Expected dividends
|
—
|
|
|
Expected life (in years)
|
4.1 - 6.3
|
|
|
Risk-free interest rate
|
1.3% - 1.9%
|
|
There were
no
stock options granted during the years ended
December 31, 2017
and
2016
.
A summary of option activity for
2017
is presented below:
|
Time
Based
|
Performance
Based
|
Total
Stock
Options
|
Weighted-
Average
Exercise
Price
|
Weighted-
Average
Remaining
Contractual
Term
(Years)
|
Aggregate
Intrinsic
Value
|
|||||||||||||
|
Balance at January 1, 2017
|
818,331
|
|
219,006
|
|
1,037,337
|
|
$
|
10.63
|
|
|||||||||
|
Options granted
|
—
|
|
—
|
|
—
|
|
$
|
—
|
|
|||||||||
|
Options exercised
|
(338,133
|
)
|
(127,099
|
)
|
(465,232
|
)
|
$
|
6.98
|
|
|||||||||
|
Options forfeited and expired
|
(2,565
|
)
|
(4,115
|
)
|
(6,680
|
)
|
$
|
9.47
|
|
|||||||||
|
Outstanding at December 31, 2017
|
477,633
|
|
87,792
|
|
565,425
|
|
$
|
13.65
|
|
3.9
|
$
|
4,150,751
|
|
|||||
|
Vested and expected to vest at December 31, 2017
|
477,633
|
|
87,792
|
|
565,425
|
|
$
|
13.65
|
|
3.9
|
$
|
4,150,751
|
|
|||||
|
Exercisable at December 31, 2017
|
371,861
|
|
87,792
|
|
459,653
|
|
$
|
14.94
|
|
4.4
|
$
|
2,774,300
|
|
|||||
The weighted-average grant-date fair values of options granted during the year ended
December 31, 2015
was
$1.44
. During the years ended
December 31, 2017
and
2016
,
465,232
and
40,976
options were exercised having aggregate intrinsic values of
$5.1 million
and
$0.2 million
, respectively.
No
stock options were exercised during the year ended
December 31, 2015
.
As of
December 31, 2017
, there was
no
remaining unrecognized compensation expense related to outstanding stock options. In addition, performance based options contain certain contingent features, such as change in control provisions, which allow for the vesting of previously forfeited and unvested awards.
94
Restricted Stock
A summary of restricted stock awards activity for
2017
is presented below:
|
Shares
|
Weighted-
Average Grant
Date Fair Value Per Share
|
|||||
|
Nonvested restricted stock, January 1, 2017
|
2,156,372
|
|
$
|
3.71
|
|
|
|
Granted
|
395,146
|
|
$
|
12.94
|
|
|
|
Vested
|
(744,244
|
)
|
$
|
3.86
|
|
|
|
Cancelled
|
(42,012
|
)
|
$
|
3.78
|
|
|
|
Nonvested restricted stock, December 31, 2017
|
1,765,262
|
|
$
|
5.72
|
|
|
As of
December 31, 2017
, there was
$6.2 million
of unrecognized compensation expense related to outstanding restricted stock, which is expected to be recognized over a weighted-average period of
1.9 years
.
Performance Restricted Stock Awards
Performance awards vest based on the requisite service period subject to the achievement of specific financial performance targets. The Company monitors the probability of achieving the performance targets on a quarterly basis and may adjust periodic stock compensation expense accordingly. The performance targets include the achievement of internal performance targets only.
A summary of performance restricted stock award activity for
2017
is presented below:
|
Shares
|
Weighted-
Average Grant
Date Fair Value Per Share
|
|||||
|
Nonvested performance restricted stock, January 1, 2017
|
—
|
|
$
|
—
|
|
|
|
Granted
|
303,495
|
|
$
|
16.69
|
|
|
|
Vested
|
—
|
|
$
|
—
|
|
|
|
Cancelled
|
(12,323
|
)
|
$
|
16.62
|
|
|
|
Nonvested performance restricted stock, December 31, 2017
|
291,172
|
|
$
|
16.70
|
|
|
As of
December 31, 2017
, there was
$3.9 million
of unrecognized compensation expense related to outstanding performance restricted stock which is expected to be recognized over a weighted-average period of
2.1 years
.
Modifications
During the year ended December 31, 2017, the Company recognized approximately
$1.3 million
of stock-based compensation expense associated with the modification of awards held by two individuals, one of which was effectuated in the third quarter of 2017 and one of which was effectuated in the fourth quarter of 2017. The modification of these awards affected the vesting terms of the awards.
Employee Stock Purchase Plan
In April 2017, the Company’s stockholders approved the 2017 Employee Stock Purchase Plan (“2017 ESPP”), which authorized the issuance of up to
250,000
shares of common stock thereunder. Under the terms of the 2017 ESPP, eligible U.S. employees can elect to acquire shares of the Company’s common stock through
periodic payroll deductions during a series of six month offering periods, which will generally begin in March and September of each year. Purchases under the 2017 ESPP are effected on the last business day of each offering period at a
15%
discount to the closing price on that day. The 2017 ESPP was implemented, subject to stockholder approval, on
March 10, 2017
, and the first purchases thereunder were made on
September 13, 2017
.
95
13
.
Net Income (Loss) Per Common Share
A summary of net income (loss) per common share is presented below:
|
|
Year Ended
December 31, |
||||||||||
|
(in thousands, except per share amounts)
|
2017
|
2016
|
2015
|
||||||||
|
Net income (loss)
|
$
|
123,385
|
|
$
|
26,762
|
|
$
|
(14,746
|
)
|
||
|
Basic weighted-average common shares outstanding
|
37,276
|
|
32,044
|
|
24,440
|
|
|||||
|
Effect of dilutive stock options
|
288
|
|
612
|
|
—
|
|
|||||
|
Effect of dilutive restricted stock
|
1,296
|
|
—
|
|
—
|
|
|||||
|
Effect of dilutive performance restricted stock
|
32
|
|
—
|
|
—
|
|
|||||
|
Diluted weighted-average common shares outstanding
|
38,892
|
|
32,656
|
|
24,440
|
|
|||||
|
Basic income (loss) per common share
|
$
|
3.31
|
|
$
|
0.84
|
|
$
|
(0.60
|
)
|
||
|
Diluted income (loss) per common share
|
$
|
3.17
|
|
$
|
0.82
|
|
$
|
(0.60
|
)
|
||
|
Antidilutive securities excluded from diluted net income (loss) per common share
|
604
|
|
1,563
|
|
2,269
|
|
|||||
14
.
Commitments and Contingencies
Leases and Purchase Commitments
The Company leases certain buildings, hardware and office space under operating leases and equipment under capital leases. In addition, the Company has entered into purchasing arrangements in which minimum quantities of goods or services have been committed to be purchased on an annual basis.
As of
December 31, 2017
, future payments required under noncancelable lease agreements and purchase commitments are as follows:
|
(in thousands)
|
Amount
|
||
|
2018
|
$
|
4,046
|
|
|
2019
|
2,262
|
|
|
|
2020
|
257
|
|
|
|
2021
|
235
|
|
|
|
2022
|
235
|
|
|
|
2023 and thereafter
|
412
|
|
|
|
Total
|
$
|
7,447
|
|
Rent expense was
$0.3 million
,
$0.4 million
and
$0.9 million
for the years ended
December 31, 2017
,
2016
and
2015
, respectively.
The Company has entered into agreements which contain certain percentage volume purchase requirements. The Company has excluded these future purchase commitments from the table above since there are
no
minimum purchase commitments or payments under these agreements.
Legal Proceedings
From time to time, the Company is a party to various legal proceedings arising in the ordinary course of business. In addition, the Company has in the past been, and may in the future be, subject to investigations by governmental and regulatory authorities, which expose it to greater risks associated with litigation, regulatory or other proceedings, as a result of which the Company could be required to pay significant fines or penalties. The outcome of litigation, regulatory or other proceedings cannot be predicted with certainty, and some lawsuits, claims, actions or proceedings may be disposed of unfavorably to the Company. In addition, intellectual property disputes often have a risk of injunctive relief which, if imposed against the Company, could materially and adversely affect its financial condition or results of operations.
96
As of
December 31, 2017
, the Company has no material ongoing litigation in which the Company was a party or any material ongoing regulatory or other proceedings and had no knowledge of any investigations by government or regulatory authorities in which the Company is a target that could have a material adverse effect on its current business.
The Company is currently in arbitration with Pharmalucence in connection with a Manufacturing and Supply Agreement dated November 12, 2013, under which Pharmalucence agreed to manufacture and supply DEFINITY for the Company. The commercial arrangement contemplated by that agreement was repeatedly delayed and ultimately never successfully realized. After extended settlement discussions between Sun Pharma, the ultimate parent of Pharmalucence, and the Company, which did not lead to a mutually acceptable outcome, on November 10, 2017, the Company filed an arbitration demand (and later an amended arbitration demand) with the American Arbitration Association (“AAA”) against Pharmalucence, alleging breach of contract, breach of the covenant of good faith and fair dealing, tortious misrepresentation and violation of the Massachusetts Consumer Protection Law, also known as Chapter 93A. The Company cannot predict the outcome of this dispute resolution proceeding and whether the Company will be able to obtain any financial recovery as a result of this proceeding.
15
.
401(k) Plan
The Company maintains a qualified 401(k) plan (the “401(k) Plan”) for its U.S. employees. The 401(k) Plan covers U.S. employees who meet certain eligibility requirements. Under the terms of the 401(k) Plan, the employees may elect to make tax-deferred contributions through payroll deductions within statutory and plan limits, and the Company may elect to make non-elective discretionary contributions. The Company may also make optional contributions to the 401(k) Plan for any plan year at its discretion.
Expense recognized by the Company for matching contributions made to the 401(k) Plan was
$1.8 million
,
$1.6 million
and
$1.6 million
for the years ended
December 31, 2017
,
2016
and
2015
, respectively.
16
.
Related Party Transactions
Avista Capital Partners, L.P. and its affiliates (“Avista”), historically the Company’s largest stockholder, provided certain advisory services to the Company pursuant to an advisory services and monitoring agreement. The Company was required to pay an annual fee of
$1.0 million
and other reasonable and customary advisory fees, as applicable, paid on a quarterly basis. The initial term of the agreement was
seven years
. On June 25, 2015, the Company exercised its right to terminate its advisory services and monitoring agreement with Avista. In connection with such termination, the Company paid Avista an aggregate termination fee of
$6.5 million
, which is included in general and administrative expenses in the consolidated statements of operations for the year ended December 31, 2015.
In the first quarter of 2016, the Company entered into a services agreement with
INC Research Holdings, Inc. (“INC”), now known as Syneos Health, Inc.,
to provide pharmacovigilance services. Avista and certain of its affiliates were principal owners of both INC and the Company during 2016. The agreement has a term of
three years
. During the year ended
December 31, 2016
, investment funds affiliated with Avista disposed of shares of INC common stock held by them. As a result, such investment funds were no longer a principal owner of INC. Related party expenses included in the following table represent expenses incurred during the period under which investment funds affiliated with Avista held an investment in INC.
The Company purchases inventory supplies from VWR Scientific (“VWR”). Avista and certain of its affiliates were principal owners of both VWR and the Company.
97
Related party expenses consisted of the following:
|
Year Ended
December 31,
|
|||||||||||||
|
(in thousands)
|
Transaction Type
|
2017
|
2016
|
2015
|
|||||||||
|
Avista Capital Partners, L.P. and its affiliates*
|
Offering costs paid on behalf of Avista pursuant to registration rights agreement, advisory services and other charges
|
$
|
326
|
|
$
|
12
|
|
$
|
500
|
|
|||
|
Avista Capital Partners, L.P. and its affiliates*
|
Termination fee
|
—
|
|
—
|
|
6,500
|
|
||||||
|
INC Research Holdings, Inc.
|
Pharmacovigilance services
|
—
|
|
780
|
|
—
|
|
||||||
|
VWR Scientific*
|
Inventory supplies
|
297
|
|
354
|
|
300
|
|
||||||
|
Total related party expenses
|
$
|
623
|
|
$
|
1,146
|
|
$
|
7,300
|
|
||||
* During the year ended
December 31, 2017
, Avista distributed approximately
6.3 million
shares of common stock of the Company in the aggregate, representing the remainder of their holdings in the Company. The transactions were effected as distributions-in-kind of the Company’s common stock to the investors in those investment funds. As such, Avista and VWR Scientific (an entity in which Avista had an interest) are no longer related parties.
Amounts billed and unbilled for related parties included in accounts payables and accrued expenses were immaterial at
December 31, 2016
.
17
.
Segment Informatio
n
The Company reports
two
operating segments, U.S. and International, based on geographic customer base. The results of these operating segments are regularly reviewed by the Company’s chief operating decision maker, the President and Chief Executive Officer. The Company’s segments derive revenues through the manufacture, marketing, selling and distribution of medical imaging products, focused primarily on cardiovascular diagnostic imaging. All goodwill has been allocated to the U.S. operating segment. The Company does not identify or allocate assets to its segments.
98
Selected information regarding the Company’s segments are provided as follows:
|
Year Ended
December 31, |
|||||||||||
|
(in thousands)
|
2017
|
2016
|
2015
|
||||||||
|
Revenues from external customers
|
|||||||||||
|
U.S.
|
$
|
290,002
|
|
$
|
257,420
|
|
$
|
235,824
|
|
||
|
International
|
41,376
|
|
44,433
|
|
57,637
|
|
|||||
|
Total revenues from external customers
|
$
|
331,378
|
|
$
|
301,853
|
|
$
|
293,461
|
|
||
|
Revenues by product
|
|||||||||||
|
DEFINITY
|
$
|
157,268
|
|
$
|
131,612
|
|
$
|
111,859
|
|
||
|
TechneLite
|
104,644
|
|
99,217
|
|
72,562
|
|
|||||
|
Xenon
|
31,377
|
|
29,086
|
|
48,898
|
|
|||||
|
Other
|
38,089
|
|
41,938
|
|
60,142
|
|
|||||
|
Total revenues
|
$
|
331,378
|
|
$
|
301,853
|
|
$
|
293,461
|
|
||
|
Geographical revenues
|
|||||||||||
|
U.S.
|
$
|
290,002
|
|
$
|
257,420
|
|
$
|
235,824
|
|
||
|
Canada
|
18,770
|
|
18,918
|
|
28,340
|
|
|||||
|
All other
|
22,606
|
|
25,515
|
|
29,297
|
|
|||||
|
Total revenues
|
$
|
331,378
|
|
$
|
301,853
|
|
$
|
293,461
|
|
||
|
Operating income
|
|||||||||||
|
U.S.
|
$
|
49,239
|
|
$
|
46,909
|
|
$
|
42,008
|
|
||
|
International
|
2,614
|
|
9,679
|
|
522
|
|
|||||
|
Operating income
|
51,853
|
|
56,588
|
|
42,530
|
|
|||||
|
Interest expense
|
18,410
|
|
26,618
|
|
38,715
|
|
|||||
|
Debt retirement costs
|
—
|
|
1,896
|
|
—
|
|
|||||
|
Loss on extinguishment of debt
|
2,442
|
|
—
|
|
15,528
|
|
|||||
|
Other (income) expense
|
(8,638
|
)
|
(220
|
)
|
65
|
|
|||||
|
Income (loss) before income taxes
|
$
|
39,639
|
|
$
|
28,294
|
|
$
|
(11,778
|
)
|
||
|
Depreciation and amortization
|
|||||||||||
|
U.S.
|
$
|
17,672
|
|
$
|
15,995
|
|
$
|
17,054
|
|
||
|
International
|
517
|
|
1,335
|
|
1,850
|
|
|||||
|
Total depreciation and amortization
|
$
|
18,189
|
|
$
|
17,330
|
|
$
|
18,904
|
|
||
|
|
December 31,
|
||||||
|
(in thousands)
|
2017
|
2016
|
|||||
|
Long-lived assets
|
|||||||
|
U.S.
|
$
|
91,537
|
|
$
|
92,650
|
|
|
|
International
|
1,462
|
|
1,537
|
|
|||
|
Total long-lived assets
|
$
|
92,999
|
|
$
|
94,187
|
|
|
99
18
.
Valuation and Qualifying Accounts
|
(in thousands)
|
Balance at Beginning of Year
|
Charged to Income
|
Deductions from Reserves
(1)
|
Other Adjustments
|
Balance at End of Year
|
|||||||||||||||
|
Allowance for doubtful accounts
|
||||||||||||||||||||
|
Year ended December 31, 2017
|
$
|
969
|
|
$
|
136
|
|
$
|
(128
|
)
|
$
|
—
|
|
$
|
977
|
|
|||||
|
Year ended December 31, 2016
|
$
|
881
|
|
$
|
53
|
|
$
|
(30
|
)
|
$
|
65
|
|
$
|
969
|
|
|||||
|
Year ended December 31, 2015
|
$
|
585
|
|
$
|
773
|
|
$
|
(477
|
)
|
$
|
—
|
|
$
|
881
|
|
|||||
|
Rebates and allowances
|
||||||||||||||||||||
|
Year ended December 31, 2017
|
$
|
2,297
|
|
$
|
9,568
|
|
$
|
(8,351
|
)
|
$
|
(654
|
)
|
$
|
2,860
|
|
|||||
|
Year ended December 31, 2016
|
$
|
2,303
|
|
$
|
7,255
|
|
$
|
(6,809
|
)
|
$
|
(452
|
)
|
$
|
2,297
|
|
|||||
|
Year ended December 31, 2015
|
$
|
2,164
|
|
$
|
6,413
|
|
$
|
(6,190
|
)
|
$
|
(84
|
)
|
$
|
2,303
|
|
|||||
________________________________
|
(1)
|
Amounts charged to deductions from allowance for doubtful accounts represent the write-off of uncollectible balances and represent payments for rebates and allowances.
|
19
.
Quarterly Consolidated Financial Data (Unaudited)
Summarized quarterly consolidated financial data is presented below:
|
Quarterly Periods During the Year Ended
December 31, 2017 |
|||||||||||||||
|
Q1
|
Q2
|
Q3
|
Q4
|
||||||||||||
|
(in thousands, except per share data)
|
|||||||||||||||
|
Revenues
|
$
|
81,359
|
|
$
|
88,837
|
|
|
$
|
79,941
|
|
$
|
81,241
|
|
||
|
Gross profit
|
$
|
39,762
|
|
$
|
45,947
|
|
|
$
|
38,527
|
|
$
|
37,899
|
|
||
|
Net income
(a)
|
$
|
4,138
|
|
$
|
13,595
|
|
|
$
|
8,526
|
|
$
|
97,126
|
|
||
|
Basic income per weighted-average share
(b)
|
$
|
0.11
|
|
$
|
0.37
|
|
|
$
|
0.23
|
|
$
|
2.58
|
|
||
|
Diluted income per weighted-average share
(b)
|
$
|
0.11
|
|
$
|
0.35
|
|
|
$
|
0.22
|
|
$
|
2.47
|
|
||
|
Quarterly Periods During the Year Ended
December 31, 2016 |
|||||||||||||||
|
Q1
|
Q2
|
Q3
|
Q4
|
||||||||||||
|
(in thousands, except per share data)
|
|||||||||||||||
|
Revenues
|
$
|
76,474
|
|
$
|
77,966
|
|
$
|
73,063
|
|
$
|
74,350
|
|
|||
|
Gross profit
|
$
|
33,701
|
|
$
|
35,751
|
|
$
|
33,681
|
|
$
|
34,647
|
|
|||
|
Net income
|
$
|
10,323
|
|
$
|
7,350
|
|
$
|
4,220
|
|
$
|
4,869
|
|
|||
|
Basic income per weighted-average share
(b)
|
$
|
0.34
|
|
$
|
0.24
|
|
$
|
0.14
|
|
$
|
0.13
|
|
|||
|
Diluted income per weighted-average share
(b)
|
$
|
0.34
|
|
$
|
0.24
|
|
$
|
0.13
|
|
$
|
0.13
|
|
|||
________________________________
|
(a)
|
Net income for the fourth quarter of 2017 reflects the income tax benefit due to the release of the Company’s valuation allowance of
$141.1 million
against its deferred tax assets offset by a provision of
$45.1 million
for remeasuring the Company’s deferred tax assets for the change in tax rates enacted under the Tax Cuts and Jobs Act of 2017.
|
|
(b)
|
Quarterly and annual computations are prepared independently. Accordingly, the sum of each quarter may not necessarily total the fiscal year period amounts noted elsewhere within this Annual Report on Form 10-K.
|
100
Not applicable.
Disclosure Controls and Procedures
The Company’s management, with the participation of the Company’s Chief Executive Officer (“CEO”) and Chief Financial Officer (“CFO”), its principal executive officer and principal financial officer, respectively, has evaluated the effectiveness of the Company’s disclosure controls and procedures as defined in Rule 13a-15(e) and 15d-15(e) of the Exchange Act. Based on that evaluation, the Company’s Chief Executive Officer and Chief Financial Officer concluded that the Company’s disclosure controls and procedures (as defined in Exchange Act Rules 13a-15(e) and 15d-15(e)) were effective as of the period covered by this report.
Management’s Annual Report on Internal Control Over Financial Reporting
Our management, with the participation of our CEO and CFO, is responsible for establishing and maintaining adequate internal control over financial reporting as defined in Rules 13a-15(f) and 15d-15(f) under the Exchange Act. Our internal control system is designed to provide reasonable assurance to our management and Board of Directors regarding the preparation and fair presentation of published financial statements.
Our management assessed the effectiveness of our internal control over financial reporting as of
December 31, 2017
. In making its assessment of internal control over financial reporting, our management used the criteria set forth by the Committee of Sponsoring Organizations of the Treadway Commission in Internal Control—Integrated Framework (2013). Based on this assessment, management concluded that, as of
December 31, 2017
, our internal control over financial reporting was effective.
We do not include an attestation report of our independent registered public accounting firm regarding internal control over financial reporting in this Annual Report on Form 10-K pursuant to the Jumpstart Our Business Startups Act of 2012, as amended (the “JOBS Act”). As a company with less than $1.07 billion in revenue during our last fiscal year, we qualify as an “emerging growth company,” as defined in the JOBS Act. An emerging growth company may take advantage of specified reduced reporting and other regulatory requirements or up to five years that are otherwise applicable generally to public companies. These provisions include, among other matters:
|
▪
|
Exemption from the auditor attestation requirement on the effectiveness of our system of internal control over financial reporting;
|
|
▪
|
Exemption from compliance with any new requirements adopted by the Public Company Accounting Oversight Board requiring mandatory audit firm rotation or a supplement to the auditor’s report in which the auditor would be required to provide additional information about the audit and the financial statements of the issuer;
|
|
▪
|
Exemption from the requirement to seek non-binding advisory votes on executive compensation and golden parachute arrangements; and
|
|
▪
|
Reduced disclosure about executive compensation arrangements.
|
We will remain an emerging growth company until December 31, 2020 unless, prior to that time, we have (i) more than $1.07 billion in annual revenue, (ii) have a market value for our common stock held by non-affiliates of more than $700 million as of the last day of our second fiscal quarter of the fiscal year when a determination is made that we are deemed to be a “large accelerated filer,” as defined in Rule 12b-2 promulgated under the Securities Exchange Act of 1934, as amended, or the Exchange Act, or (iii) issue more than $1 billion of non-convertible debt over a three-year period. As a result, we were not required to have our independent registered public accounting firm attest to, and report on, internal controls over financial reporting.
Changes in Internal Control Over Financial Reporting
There have been no changes during the quarter ended
December 31, 2017
in our internal control over financial reporting (as defined in Rule 13a-15(f) promulgated under the Exchange Act) that have materially affected, or are reasonably likely to materially affect, our internal control over financial reporting.
None.
101
Pursuant to Section 406 of the Sarbanes-Oxley Act of 2002, we have adopted a code of conduct and ethics (our “Code of Conduct”) for all of our employees, including our CEO, CFO and other senior financial officers, or persons performing similar functions, and each of the non-employee directors on our Board of Directors. Our Code of Conduct is currently available on our website, www.lantheus.com. The information on our web site is not part of, and is not incorporated into, this Annual Report on Form 10-K. We intend to provide any required disclosure of any amendment to or waiver from such code that applies to our CEO, CFO and other senior financial officers, or persons performing similar functions, in a Current Report on Form 8-K filed with the SEC.
The additional information required with respect to this item is incorporated herein by reference to our Definitive Proxy Statement for our
2018
Annual Meeting of Stockholders to be filed with the SEC no later than 120 days after the close of our year ended
December 31, 2017
.
The information required with respect to this item is incorporated herein by reference to our Definitive Proxy Statement for our 2018 Annual Meeting of Stockholders to be filed with the SEC no later than 120 days after the close of our year ended December 31, 2017.
The information required with respect to this item is incorporated herein by reference to our Definitive Proxy Statement for our 2018 Annual Meeting of Stockholders to be filed with the SEC no later than 120 days after the close of our year ended December 31, 2017.
The information required with respect to this item is incorporated herein by reference to our Definitive Proxy Statement for our 2018 Annual Meeting of Stockholders to be filed with the SEC no later than 120 days after the close of our year ended December 31, 2017.
The information required with respect to this item is incorporated herein by reference to our Definitive Proxy Statement for our 2018 Annual Meeting of Stockholders to be filed with the SEC no later than 120 days after the close of our year ended December 31, 2017.
102
(a)(1) Financial Statements
The following consolidated financial statements of Lantheus Holdings, Inc. are filed as part of this Annual Report on Form 10-K under Part II, Item 8. Financial Statements and Supplementary Data:
|
Page
|
|
(a)(2) Schedules
All schedules are omitted because they are not applicable, not required, or because the required information is included in the consolidated financial statements or notes thereto.
(a)(3) Exhibits
EXHIBIT INDEX
|
Incorporated by Reference
|
||||||||||
|
Exhibit
Number
|
Description of Exhibits
|
Form
|
File Number
|
Exhibit
|
Filing Date
|
|||||
|
2.1†
|
10-Q/A
|
001-36569
|
2.1
|
August 25, 2016
|
||||||
|
2.2†
|
10-Q
|
001-36569
|
10.1
|
November 1, 2016
|
||||||
|
3.1
|
8-K
|
001-36569
|
3.1
|
June 30, 2015
|
||||||
|
3.2
|
8-K
|
001-36569
|
3.2
|
June 30, 2015
|
||||||
|
4.1
|
8-K
|
001-36569
|
4.1
|
June 30, 2015
|
||||||
|
4.2
|
S-4
|
333-169785
|
4.1
|
October 6, 2010
|
||||||
|
4.3
|
8-K
|
333-169785
|
4.1
|
March 16, 2011
|
||||||
|
4.4
|
8-K
|
333-169785
|
4.1
|
March 21, 2011
|
||||||
|
4.5
|
S-4
|
333-169785
|
4.2
|
October 6, 2010
|
||||||
|
4.6
|
8-K
|
333-169785
|
4.2
|
March 21, 2011
|
||||||
|
4.7
|
S-4
|
333-169785
|
4.1
|
October 6, 2010
|
||||||
|
4.8
|
8-K
|
001-36569
|
4.2
|
June 30, 2015
|
||||||
|
10.1
|
S-4
|
333-169785
|
10.3
|
October 6, 2010
|
||||||
103
|
Incorporated by Reference
|
||||||||||
|
Exhibit
Number
|
Description of Exhibits
|
Form
|
File Number
|
Exhibit
|
Filing Date
|
|||||
|
10.2
|
S-4
|
333-169785
|
10.4
|
October 6, 2010
|
||||||
|
10.3
|
S-4
|
333-169785
|
10.5
|
October 6, 2010
|
||||||
|
10.4†
|
S-4
|
333-169785
|
10.9
|
December 23, 2010
|
||||||
|
10.5†
|
S-4
|
333-169785
|
10.10
|
December 1, 2010
|
||||||
|
10.6†
|
10-Q
|
333-169785
|
10.1
|
May 13, 2011
|
||||||
|
10.7†
|
S-4
|
333-169785
|
10.12
|
December 23, 2010
|
||||||
|
10.8†
|
10-K
|
333-169785
|
10.13
|
March 8, 2011
|
||||||
|
10.9†
|
S-4
|
333-169785
|
10.26
|
December 1, 2010
|
||||||
|
10.10†
|
S-4
|
333-169785
|
10.14
|
December 23, 2010
|
||||||
|
10.11†
|
S-4
|
333-169785
|
10.16
|
December 29, 2010
|
||||||
|
10.12†
|
S-4
|
333-169785
|
10.17
|
December 1, 2010
|
||||||
|
10.13+
|
S-4
|
333-169785
|
10.18
|
October 6, 2010
|
||||||
|
10.14+
|
S-4
|
333-169785
|
10.19
|
October 6, 2010
|
||||||
|
10.15+
|
S-4
|
333-169785
|
10.20
|
October 6, 2010
|
||||||
|
10.16+
|
S-4
|
333-169785
|
10.21
|
October 6, 2010
|
||||||
|
10.17+
|
S-4
|
333-169785
|
10.24
|
October 6, 2010
|
||||||
|
10.18†
|
10-Q
|
333-169785
|
10.1
|
May 15, 2012
|
||||||
|
10.19†
|
10-Q
|
333-169785
|
10.2
|
May 15, 2012
|
||||||
|
10.20†
|
10-Q
|
333-169785
|
10.1
|
August 14, 2012
|
||||||
|
10.21†
|
10-K
|
333-169785
|
10.52
|
March 29, 2013
|
||||||
|
10.22†
|
10-K
|
333-169785
|
10.53
|
March 29, 2013
|
||||||
|
10.23†
|
10-K
|
333-169785
|
10.54
|
March 29, 2013
|
||||||
|
10.25†
|
10-Q
|
333-169785
|
10.1
|
May 10, 2013
|
||||||
|
10.26+
|
8-K
|
333-169785
|
10.1
|
May 6, 2013
|
||||||
|
10.27+
|
8-K
|
333-169785
|
10.2
|
May 6, 2013
|
||||||
104
|
Incorporated by Reference
|
||||||||||
|
Exhibit
Number
|
Description of Exhibits
|
Form
|
File Number
|
Exhibit
|
Filing Date
|
|||||
|
10.28+
|
8-K
|
333-169785
|
10.3
|
May 6, 2013
|
||||||
|
10.30
|
10-Q
|
333-169785
|
10.1
|
August 7, 2013
|
||||||
|
10.33+
|
10-K
|
333-169785
|
10.48
|
March 11, 2014
|
||||||
|
10.34
|
S-1
|
333-196998
|
10.34
|
June 24, 2015
|
||||||
|
10.35
|
8-K
|
001-36569
|
10.2
|
June 30, 2015
|
||||||
|
10.36
|
8-K
|
001-36569
|
10.3
|
June 30, 2015
|
||||||
|
10.37+
|
S-1
|
333-196998
|
10.37
|
June 24, 2015
|
||||||
|
10.38+
|
S-1
|
333-196998
|
10.38
|
June 24, 2015
|
||||||
|
10.39+
|
S-1
|
333-196998
|
10.39
|
June 24, 2015
|
||||||
|
10.40+
|
S-1
|
333-196998
|
10.40
|
June 24, 2015
|
||||||
|
10.41+
|
S-1
|
333-196998
|
10.41
|
June 24, 2015
|
||||||
|
10.42+
|
10-Q
|
333-169785
|
10.1
|
May 5, 2015
|
||||||
|
10.43
|
8-K
|
001-36569
|
10.1
|
June 30, 2015
|
||||||
|
10.46
|
8-K
|
001-36569
|
10.4
|
June 30, 2015
|
||||||
|
10.47
|
8-K
|
001-36569
|
10.5
|
June 30, 2015
|
||||||
|
10.49+
|
8-K
|
001-36569
|
10.7
|
June 30, 2015
|
||||||
|
10.50+
|
8-K
|
001-36569
|
10.8
|
June 30, 2015
|
||||||
|
10.52+
|
10-Q
|
001-36569
|
10.2
|
November 4, 2015
|
||||||
|
10.53†
|
10-K
|
001-36569
|
10.53
|
March 2, 2016
|
||||||
|
10.54+
|
10-Q
|
001-36569
|
10.1
|
May 3, 2016
|
||||||
|
10.55+
|
10-Q
|
001-36569
|
10.2
|
May 3, 2016
|
||||||
|
10.56+
|
10-Q
|
001-36569
|
10.3
|
May 3, 2016
|
||||||
|
10.57+
|
8-K
|
001-36569
|
10.1
|
April 28, 2016
|
||||||
105
|
Incorporated by Reference
|
||||||||||
|
Exhibit
Number
|
Description of Exhibits
|
Form
|
File Number
|
Exhibit
|
Filing Date
|
|||||
|
10.58†
|
10-Q
|
001-36569
|
10.2
|
November 1, 2016
|
||||||
|
10.59+
|
8-K
|
001-36569
|
10.1
|
April 28, 2017
|
||||||
|
10.60+
|
8-K
|
001-36569
|
10.2
|
April 28, 2017
|
||||||
|
10.61
|
10-Q
|
001-36569
|
10.1
|
May 2, 2017
|
||||||
|
10.62†
|
10-Q
|
001-36569
|
10.1
|
August 1, 2017
|
||||||
|
10.63†
|
10-Q
|
001-36569
|
10.2
|
August 1, 2017
|
||||||
|
10.64*†
|
||||||||||
|
10.65*†
|
||||||||||
|
21.1*
|
||||||||||
|
23.1*
|
||||||||||
|
24.1*
|
||||||||||
|
31.1*
|
||||||||||
|
31.2*
|
||||||||||
|
32.1**
|
||||||||||
|
101.INS*
|
XBRL Instance Document
|
|||||||||
|
101.SCH*
|
XBRL Taxonomy Extension Schema
|
|||||||||
|
101.CAL*
|
XBRL Taxonomy Extension Calculation
|
|||||||||
|
101.DEF*
|
XBRL Taxonomy Extension Definition
|
|||||||||
|
101.LAB*
|
XBRL Taxonomy Extension Labels
|
|||||||||
|
101.PRE*
|
XBRL Taxonomy Extension Presentation
|
|||||||||
________________________________
|
*
|
Filed herewith.
|
|
**
|
Furnished herewith.
|
|
+
|
Indicates management contract or compensatory plan or arrangement.
|
|
†
|
Confidential treatment requested as to certain portions, which portions have been filed separately with the Securities and Exchange Commission
|
None.
106
SIGNATURES
Pursuant to the requirements of Section 13 or 15(d) of the Securities Exchange Act of 1934, the registrant has duly caused this report to be signed on its behalf by the undersigned, thereunto duly authorized.
|
LANTHEUS HOLDINGS, INC.
|
|
|
By:
|
/S/ MARY ANNE HEINO
|
|
Name:
|
Mary Anne Heino
|
|
Title:
|
President and Chief Executive Officer
|
|
Date:
|
February 26, 2018
|
We, the undersigned directors and officers of Lantheus Holdings, Inc., hereby severally constitute and appoint Mary Anne Heino, John W. Crowley and Michael P. Duffy, and each of them individually, with full powers of substitution and resubstitution, our true and lawful attorneys, with full powers to them and each of them to sign for us, in our names and in the capacities indicated below, any and all amendments to this Annual Report on Form 10-K filed with the SEC, granting unto said attorneys-in-fact and agents, each acting alone, full power and authority to do and perform each and every act and thing requisite and necessary to be done in and about the premises, as fully to all intents and purposes as he might or could do in person, hereby ratifying and confirming that any such attorney-in-fact and agent, or his substitute or substitutes, may lawfully do or cause to be done by virtue hereof.
Pursuant to the requirements of the Securities Exchange Act of 1934, this report has been signed below by the following persons on behalf of the registrant and in the capacities and on the dates indicated.
|
Signature
|
Title
|
Date
|
||
|
/S/ MARY ANNE HEINO
|
Chief Executive Officer, President and Director
(Principal Executive Officer) |
February 26, 2018
|
||
|
Mary Anne Heino
|
||||
|
/S/ JOHN W. CROWLEY
|
Chief Financial Officer and Treasurer
(Principal Financial and Accounting Officer) |
February 26, 2018
|
||
|
John W. Crowley
|
||||
|
/S/ BRIAN MARKISON
|
Chairman of the Board of Directors
|
February 26, 2018
|
||
|
Brian Markison
|
||||
|
/S/ JAMES C. CLEMMER
|
Director
|
February 26, 2018
|
||
|
James C. Clemmer
|
||||
|
/S/ SAMUEL R. LENO
|
Director
|
February 26, 2018
|
||
|
Samuel R. Leno
|
||||
|
/S/ JULIE H. MCHUGH
|
Director
|
February 26, 2018
|
||
|
Julie H. McHugh
|
||||
|
/S/ DR. FREDERICK A. ROBERTSON
|
Director
|
February 26, 2018
|
||
|
Dr. Frederick A. Robertson
|
||||
|
/S/ DR. DERACE L. SCHAFFER
|
Director
|
February 26, 2018
|
||
|
Dr. Derace L. Schaffer
|
||||
107
TABLE OF CONTENTS
Part IItem 1. BusinessItem 1A. Risk FactorsItem 1B. Unresolved Staff CommentsItem 2. PropertiesItem 3. Legal ProceedingsItem 4. Mine Safety DisclosuresPart IIItem 5. Market For Registrant S Common Equity, Related Stockholder Matters and Issuer Purchases Of Equity SecuritiesItem 6. Selected Financial DataItem 7. Management S Discussion and Analysis Of Financial Condition and Results Of OperationsItem 7A. Quantitative and Qualitative Disclosures About Market RiskItem 8. Financial Statements and Supplementary DataItem 9. Changes in and Disagreements with Accountants on Accounting and Financial DisclosureItem 9A. Controls and ProceduresItem 9B. Other InformationPart IIIItem 10. Directors, Executive Officers and Corporate GovernanceItem 11. Executive CompensationItem 12. Security Ownership Of Certain Beneficial Owners and Management and Related Stockholder MattersItem 13. Certain Relationships and Related Transactions, and Director IndependenceItem 14. Principal Accountant Fees and ServicesPart IVItem 15. Exhibits and Financial Statement SchedulesItem 16. Form 10-k Summary