LIGHT & WONDER, INC.
10-Ks and 10-Qs
|
|
|
|
|
|
|
|
|
|
|
|
|
|
|
|
|
|
|
|
|
|
|
|
|
|
|
|
|
|
|
|
|
|
|
|
|
|
|
|
|
|
|
|
|
|
|
|
|
|
|
|
|
|
|
|
|
|
|
|
|
|
UNITED STATES
SECURITIES AND EXCHANGE COMMISSION
Washington, D.C. 20549
FORM
10-Q
For the quarterly period ended
September 30, 2023
OR
For the transition period from to
Commission file number:
001-11693

(Exact name of registrant as specified in its charter)
|
|
|
|||||||
|
(State or other jurisdiction of incorporation or organization)
|
(I.R.S. Employer Identification No.)
|
|||||||
|
|
|
|||||||
| (Address of principal executive offices) |
(Zip Code)
|
|||||||
(
702
)
897-7150
(Registrant’s telephone number, including area code)
Securities registered pursuant to Section 12(b) of the Act:
| Title of each class | Trading Symbol(s) | Name of each exchange on which registered | ||||||
|
|
|
|
||||||
Indicate by check mark whether the registrant (1) has filed all reports required to be filed by Section 13 or 15(d) of the Securities Exchange Act of 1934 during the preceding 12 months (or for such shorter period that the registrant was required to file such reports), and (2) has been subject to such filing requirements for the past 90 days.
Yes
ý
No
¨
Indicate by check mark whether the registrant has submitted electronically every Interactive Data File required to be submitted pursuant to Rule 405 of Regulation S-T (§ 232.405 of this chapter) during the preceding 12 months (or for such shorter period that the registrant was required to submit such files).
Yes
ý
No
¨
Indicate by check mark whether the registrant is a large accelerated filer, an accelerated filer, a non-accelerated filer, a smaller reporting company, or an emerging growth company. See the definitions of “large accelerated filer,” “accelerated filer,” “smaller reporting company,” and “emerging growth company” in Rule 12b-2 of the Exchange Act.
|
|
☒
|
Accelerated filer | ☐ | ||||||||
|
Non-accelerated filer
|
☐
|
Smaller reporting company
|
|
||||||||
|
Emerging growth company
|
|
||||||||||
If an emerging growth company, indicate by check mark if the registrant has elected not to use the extended transition period for complying with any new or revised financial accounting standards provided pursuant to Section 13(a) of the Exchange Act.
☐
Indicate by check mark whether the registrant is a shell company (as defined in Rule 12b-2 of the Exchange Act). Yes
☐
No
ý
Common stock outstanding as of November 3, 2023 was
90,047,398
.
LIGHT & WONDER, INC. AND SUBSIDIARIES
INDEX TO FINANCIAL AND OTHER INFORMATION
THREE AND NINE MONTHS ENDED SEPTEMBER 30, 2023
|
Page
|
||||||||
|
Item 1.
|
||||||||
|
Item 2.
|
||||||||
|
Item 3.
|
||||||||
|
Item 4.
|
||||||||
|
Item 1.
|
||||||||
|
Item 1A.
|
||||||||
|
Item 2.
|
||||||||
|
Item 3.
|
||||||||
|
Item 4.
|
||||||||
|
Item 5.
|
||||||||
|
Item 6.
|
||||||||
2
| Glossary of Terms | ||||||||
| The following terms or acronyms used in this Quarterly Report on Form 10-Q are defined below: | ||||||||
| Term or Acronym | Definition | |||||||
| 2022 10-K | 2022 Annual Report on Form 10-K filed with the SEC on March 1, 2023 | |||||||
| 2025 Unsecured Notes | 8.625% senior unsecured notes due 2025 issued by LNWI | |||||||
| 2028 Unsecured Notes | 7.000% senior unsecured notes due 2028 issued by LNWI | |||||||
| 2029 Unsecured Notes | 7.250% senior unsecured notes due 2029 issued by LNWI | |||||||
| 2031 Unsecured Notes | 7.500% senior unsecured notes due 2031 issued by LNWI | |||||||
| AEBITDA | Adjusted EBITDA, our performance measure of profit or loss for our business segments | |||||||
| ASC | Accounting Standards Codification | |||||||
| ASU | Accounting Standards Update | |||||||
| ASX | Australian Securities Exchange | |||||||
| CDIs | CHESS Depositary Interests, instruments traded on the ASX | |||||||
| CMS | casino-management system | |||||||
| COVID-19 | Coronavirus disease first identified in 2019 (declared a pandemic by the World Health Organization on March 11, 2020), the resulting pandemic and the associated impacts on the macroeconomic environment in general and our business environment specifically | |||||||
| D&A | depreciation, amortization and impairments (excluding goodwill) | |||||||
|
Divested Businesses or Divestitures
|
The Lottery Business and Sports Betting Business combined or the sales of these, as appropriate within the context | |||||||
| Exchange Act | Securities Exchange Act of 1934, as amended | |||||||
| KPIs | Key Performance Indicators | |||||||
| L&W | Light & Wonder, Inc. | |||||||
| LBO | licensed betting office | |||||||
| LNWI | Light and Wonder International, Inc., a wholly-owned subsidiary of L&W and successor to Scientific Games International, Inc. | |||||||
| LNWI Credit Agreement |
That certain credit agreement, dated as of April 14, 2022, among LNWI, as the borrower, L&W, as a guarantor, the lenders from time to time party thereto, JPMorgan Chase Bank, N.A., as Administrative Agent, Collateral Agent and Swingline Lender, BofA Securities, Inc., BNP Paribas Securities Corp., Deutsche Bank Securities Inc., Fifth Third Bank, National Association, Barclays Bank PLC, Citizens Bank, N.A., Goldman Sachs Bank USA, Morgan Stanley Senior Funding, Inc., Royal Bank of Canada, Truist Securities, Inc., Credit Suisse Loan Funding LLC and Macquarie Capital (USA) Inc. as Lead Arrangers and Joint Bookrunners, as amended, restated, amended and restated, supplemented or otherwise modified from time to time
|
|||||||
| LNWI Revolver | Revolving credit facility with aggregate commitments of $750 million extended pursuant to the LNWI Credit Agreement | |||||||
| LNWI Term Loan B | Term loan facility, issued pursuant to the LNWI Credit Agreement | |||||||
| Lottery Business |
Our prior operating business segment that provided instant and draw‑based lottery products, lottery systems and lottery content and services to lottery operators wagering solutions to various gaming entities. This business segment was divested during the second quarter of 2022 and is included in discontinued operations in our financial statements
|
|||||||
| Note | a note in the Notes to Condensed Consolidated Financial Statements in this Quarterly Report on Form 10-Q, unless otherwise indicated | |||||||
| Participation | refers to gaming machines provided to customers through service or leasing arrangements in which we earn revenues and are paid based on: (1) a percentage of the amount wagered less payouts; (2) fixed daily-fees; (3) a percentage of the amount wagered; or (4) a combination of (2) and (3) | |||||||
| R&D | research and development | |||||||
| RSU | restricted stock unit | |||||||
| SciPlay | SciPlay Corporation | |||||||
| SciPlay Revolver | $150 million revolving credit facility agreement entered into by SciPlay Holding Company, LLC, a subsidiary of SciPlay Corporation, that matures in May 2024 | |||||||
| SEC | Securities and Exchange Commission | |||||||
| Securities Act | Securities Act of 1933, as amended | |||||||
3
| Senior Notes or Unsecured Notes | refers to the 2028 Unsecured Notes, 2029 Unsecured Notes and 2031 Unsecured Notes, collectively | |||||||
| SG&A | selling, general and administrative | |||||||
| Shufflers | various models of automatic card shufflers, deck checkers and roulette chip sorters | |||||||
| SOFR | Secured Overnight Financing Rate | |||||||
| Sports Betting Business |
Our prior line of business that provided sports betting services which enable customers to operate sports books, including betting markets across both fixed-odds and pari-mutual betting styles, a distribution platform, full gaming process support services and brand and player management. This business was divested during the third quarter of 2022 and is included in discontinued operations in our financial statements
|
|||||||
| U.S. GAAP | accounting principles generally accepted in the U.S. | |||||||
| U.S. jurisdictions | the 50 states in the U.S. plus the District of Columbia, U.S. Virgin Islands and Puerto Rico | |||||||
| VGT | video gaming terminal | |||||||
| VLT | video lottery terminal | |||||||
Intellectual Property Rights
All ® notices signify marks registered in the United States. © 2023 Light & Wonder, Inc. and/or their respective affiliates. All Rights Reserved.
The MONOPOLY name and logo, the distinctive design of the game board, the four corner squares, the MR. MONOPOLY name and character, as well as each of the distinctive elements of the board, cards, and the playing pieces are trademarks of Hasbro for its property trading game and game equipment and are used with permission. © 1935, 2023 Hasbro. All Rights Reserved. Licensed by Hasbro.
 and James Bond indicia © 1962-2023 Danjaq, LLC and MGM.
and all other James Bond related trademarks are trademarks of Danjaq, LLC. All Rights Reserved.
and James Bond indicia © 1962-2023 Danjaq, LLC and MGM.
and all other James Bond related trademarks are trademarks of Danjaq, LLC. All Rights Reserved.
4
FORWARD-LOOKING STATEMENTS
T
hroughout this Quarterly Report on Form 10-Q, we make “forward-looking statements” within the meaning of the U.S. Private Securities Litigation Reform Act of 1995. Forward-looking statements describe future expectations, plans, results or strategies and can often be identified by the use of terminology such as “may,” “will,” “estimate,” “intend,” “plan,” “continue,” “believe,” “expect,” “anticipate,” “target,” “should,” “could,” “potential,” “opportunity,” “goal,” or similar terminology. The forward-looking statements contained in this Quarterly Report on Form 10-Q are generally located in the material set forth under the heading “Management’s Discussion and Analysis of Financial Condition and Results of Operations” but may be found in other locations as well. These statements are based upon management’s current expectations, assumptions and estimates and are not guarantees of timing, future results or performance. Therefore, you should not rely on any of these forward-looking statements as predictions of future events. Actual results may differ materially from those contemplated in these statements due to a variety of risks and uncertainties and other factors, including, among other things:
•
our inability to successfully execute our strategy and rebranding initiative;
•
slow growth of new gaming jurisdictions, slow addition of casinos in existing jurisdictions and declines in the replacement cycle of gaming machines;
•
risks relating to foreign operations, including anti-corruption laws, fluctuations in currency rates, restrictions on the payment of dividends from earnings, restrictions on the import of products and financial instability;
•
difficulty predicting what impact, if any, new tariffs imposed by and other trade actions taken by the U.S. and foreign jurisdictions could have on our business;
•
U.S. and international economic and industry conditions, including increases in benchmark interest rates and the effects of inflation;
•
public perception of our response to environmental, social and governance issues;
•
changes in, or the elimination of, our share repurchase program;
•
resulting pricing variations and other impacts of our common stock being listed to trade on more than one stock exchange;
•
level of our indebtedness, higher interest rates, availability or adequacy of cash flows and liquidity to satisfy indebtedness, other obligations or future cash needs;
•
inability to further reduce or refinance our indebtedness;
•
restrictions and covenants in debt agreements, including those that could result in acceleration of the maturity of our indebtedness;
•
competition;
•
inability to win, retain or renew, or unfavorable revisions of, existing contracts, and the inability to enter into new contracts;
•
risks and uncertainties of potential changes in U.K. gaming legislation, including any new or revised licensing and taxation regimes, responsible gambling requirements and/or sanctions on unlicensed providers;
•
inability to adapt to, and offer products that keep pace with, evolving technology, including any failure of our investment of significant resources in our R&D efforts;
•
the possibility that we may be unable to achieve expected operational, strategic and financial benefits of the SciPlay Merger (as defined below);
•
the outcome of any legal proceedings that may be instituted following completion of the SciPlay Merger;
•
failure to retain key management and employees of SciPlay;
•
unpredictability and severity of catastrophic events, including but not limited to acts of terrorism, war, armed conflicts or hostilities or the COVID-19 pandemic, the impact such events may have on our customers, suppliers, employees, consultants, business partners or operations, as well as management’s response to any of the aforementioned factors;
•
changes in demand for our products and services;
•
dependence on suppliers and manufacturers;
•
SciPlay’s dependence on certain key providers;
•
ownership changes and consolidation in the gaming industry;
•
fluctuations in our results due to seasonality and other factors;
•
security and integrity of our products and systems, including the impact of any security breaches or cyber-attacks;
•
protection of our intellectual property, inability to license third-party intellectual property and the intellectual property rights of others;
•
reliance on or failures in information technology and other systems;
5
•
litigation and other liabilities relating to our business, including litigation and liabilities relating to our contracts and licenses, our products and systems, our employees (including labor disputes), intellectual property, environmental laws and our strategic relationships;
•
reliance on technological blocking systems;
•
challenges or disruptions relating to the completion of the domestic migration to our enterprise resource planning system;
•
laws and government regulations, both foreign and domestic, including those relating to gaming, data privacy and security, including with respect to the collection, storage, use, transmission and protection of personal information and other consumer data, and environmental laws, and those laws and regulations that affect companies conducting business on the internet, including online gambling;
•
legislative interpretation and enforcement, regulatory perception and regulatory risks with respect to gaming, especially internet wagering, social gaming and sports wagering;
•
changes in tax laws or tax rulings, or the examination of our tax positions;
•
opposition to legalized gaming or the expansion thereof and potential restrictions on internet wagering;
•
significant opposition in some jurisdictions to interactive social gaming, including social casino gaming and how such opposition could lead these jurisdictions to adopt legislation or impose a regulatory framework to govern interactive social gaming or social casino gaming specifically, and how this could result in a prohibition on interactive social gaming or social casino gaming altogether, restrict our ability to advertise our games, or substantially increase our costs to comply with these regulations;
•
expectations of shift to regulated digital gaming or sports wagering;
•
inability to develop successful products and services and capitalize on trends and changes in our industries, including the expansion of internet and other forms of digital gaming;
•
the continuing evolution of the scope of data privacy and security regulations, and our belief that the adoption of increasingly restrictive regulations in this area is likely within the U.S. and other jurisdictions;
•
incurrence of restructuring costs;
•
goodwill impairment charges including changes in estimates or judgments related to our impairment analysis of goodwill or other intangible assets;
•
stock price volatility;
•
failure to maintain adequate internal control over financial reporting;
•
dependence on key executives;
•
natural events that disrupt our operations, or those of our customers, suppliers or regulators; and
•
expectations of growth in total consumer spending on social casino gaming.
Additional information regarding risks and uncertainties and other factors that could cause actual results to differ materially from those contemplated in forward-looking statements is included from time to time in our filings with the SEC, including under “Risk Factors” in
Part II, Item 1A
of this Quarterly Report on Form 10-Q and
Part I, Item 1A
in our 2022 10-K. Forward-looking statements speak only as of the date they are made and, except for our ongoing obligations under the U.S. federal securities laws, we undertake no and expressly disclaim any obligation to publicly update any forward-looking statements whether as a result of new information, future events or otherwise.
You should also note that this Quarterly Report on Form 10-Q may contain references to industry market data and certain industry forecasts. Industry market data and industry forecasts are obtained from publicly available information and industry publications. Industry publications generally state that the information contained therein has been obtained from sources believed to be reliable, but that the accuracy and completeness of that information is not guaranteed. Although we believe industry information to be accurate, it is not independently verified by us and we do not make any representation as to the accuracy of that information. In general, we believe there is less publicly available information concerning the international gaming, social and digital gaming industries than the same industries in the U.S.
Due to rounding, certain numbers presented herein may not precisely recalculate.
6
PART I. FINANCIAL INFORMATION
Item 1. Condensed Consolidated Financial Statements
LIGHT & WONDER, INC. AND SUBSIDIARIES
CONSOLIDATED STATEMENTS OF OPERATIONS
(Unaudited, in millions, except per share amounts)
| Three Months Ended September 30, | Nine Months Ended September 30, | ||||||||||||||||||||||
| 2023 | 2022 | 2023 | 2022 | ||||||||||||||||||||
| Revenue: | |||||||||||||||||||||||
| Services | $ |
|
$ |
|
$ |
|
$ |
|
|||||||||||||||
| Products |
|
|
|
|
|||||||||||||||||||
| Total revenue |
|
|
|
|
|||||||||||||||||||
| Operating expenses: | |||||||||||||||||||||||
|
Cost of services
(1)
|
|
|
|
|
|||||||||||||||||||
|
Cost of products
(1)
|
|
|
|
|
|||||||||||||||||||
| Selling, general and administrative |
|
|
|
|
|||||||||||||||||||
| Research and development |
|
|
|
|
|||||||||||||||||||
| Depreciation, amortization and impairments |
|
|
|
|
|||||||||||||||||||
| Restructuring and other |
|
|
|
|
|||||||||||||||||||
| Operating income |
|
|
|
|
|||||||||||||||||||
| Other (expense) income: | |||||||||||||||||||||||
| Interest expense |
(
|
(
|
(
|
(
|
|||||||||||||||||||
| Loss on debt financing transactions |
(
|
|
(
|
(
|
|||||||||||||||||||
| Gain on remeasurement of debt and other |
|
|
|
|
|||||||||||||||||||
| Other income, net |
|
|
|
|
|||||||||||||||||||
| Total other expense, net |
(
|
(
|
(
|
(
|
|||||||||||||||||||
|
Net income (loss) from continuing operations before income taxes
|
|
|
|
(
|
|||||||||||||||||||
| Income tax expense |
(
|
(
|
(
|
(
|
|||||||||||||||||||
|
Net income (loss) from continuing operations
|
|
|
|
(
|
|||||||||||||||||||
|
Net income from discontinued operations, net of tax
(2)
|
|
|
|
|
|||||||||||||||||||
| Net income |
|
|
|
|
|||||||||||||||||||
| Less: Net income attributable to noncontrolling interest |
|
|
|
|
|||||||||||||||||||
| Net income attributable to L&W | $ |
|
$ |
|
$ |
|
$ |
|
|||||||||||||||
| Per Share - Basic: | |||||||||||||||||||||||
|
Net income (loss) from continuing operations
|
$ |
|
$ |
|
$ |
|
$ |
(
|
|||||||||||||||
| Net income from discontinued operations |
|
|
|
|
|||||||||||||||||||
| Net income attributable to L&W | $ |
|
$ |
|
$ |
|
$ |
|
|||||||||||||||
| Per Share - Diluted: | |||||||||||||||||||||||
|
Net income (loss) from continuing operations
|
$ |
|
$ |
|
$ |
|
$ |
(
|
|||||||||||||||
| Net income from discontinued operations |
|
|
|
|
|||||||||||||||||||
| Net income attributable to L&W | $ |
|
$ |
|
$ |
|
$ |
|
|||||||||||||||
| Weighted average number of shares used in per share calculations: |
|
|
|||||||||||||||||||||
| Basic shares |
|
|
|
|
|||||||||||||||||||
| Diluted shares |
|
|
|
|
|||||||||||||||||||
|
|
|||||||||||||||||||||||
|
|
|||||||||||||||||||||||
|
See accompanying notes to condensed consolidated financial statements.
|
|||||||||||||||||||||||
7
LIGHT & WONDER, INC. AND SUBSIDIARIES
CONSOLIDATED STATEMENTS OF COMPREHENSIVE INCOME
(Unaudited, in millions)
| Three Months Ended September 30, | Nine Months Ended September 30, | ||||||||||||||||||||||
| 2023 | 2022 | 2023 | 2022 | ||||||||||||||||||||
| Net income | $ |
|
$ |
|
$ |
|
$ |
|
|||||||||||||||
| Other comprehensive loss: | |||||||||||||||||||||||
| Foreign currency translation loss, net of tax |
(
|
(
|
(
|
(
|
|||||||||||||||||||
| Derivative financial instruments unrealized gain, net of tax |
|
|
|
|
|||||||||||||||||||
| Other comprehensive loss from continuing operations |
(
|
(
|
(
|
(
|
|||||||||||||||||||
| Other comprehensive income from discontinued operations |
|
|
|
|
|||||||||||||||||||
| Total comprehensive income |
|
|
|
|
|||||||||||||||||||
| Less: comprehensive income attributable to noncontrolling interest |
|
|
|
|
|||||||||||||||||||
| Comprehensive income attributable to L&W | $ |
|
$ |
|
$ |
|
$ |
|
|||||||||||||||
| See accompanying notes to condensed consolidated financial statements. | |||||||||||||||||||||||
8
LIGHT & WONDER, INC. AND SUBSIDIARIES
CONSOLIDATED BALANCE SHEETS
(Unaudited, in millions, except par value)
| As of | |||||||||||
| September 30, 2023 | December 31, 2022 | ||||||||||
|
ASSETS
|
|||||||||||
| Current assets: | |||||||||||
| Cash and cash equivalents | $ |
|
$ |
|
|||||||
| Restricted cash |
|
|
|||||||||
|
Receivables, net of allowance for credit losses of $
|
|
|
|||||||||
| Inventories |
|
|
|||||||||
| Prepaid expenses, deposits and other current assets |
|
|
|||||||||
| Total current assets |
|
|
|||||||||
| Non-current assets: | |||||||||||
| Restricted cash |
|
|
|||||||||
|
Receivables, net of allowance for credit losses of $
|
|
|
|||||||||
| Property and equipment, net |
|
|
|||||||||
| Operating lease right-of-use assets |
|
|
|||||||||
| Goodwill |
|
|
|||||||||
| Intangible assets, net |
|
|
|||||||||
| Software, net |
|
|
|||||||||
| Deferred income taxes |
|
|
|||||||||
| Other assets |
|
|
|||||||||
| Total assets | $ |
|
$ |
|
|||||||
|
LIABILITIES AND STOCKHOLDERS’ EQUITY
|
|||||||||||
|
Current liabilities:
|
|||||||||||
|
Current portion of long-term debt
|
$ |
|
$ |
|
|||||||
|
Accounts payable
|
|
|
|||||||||
|
Accrued liabilities
|
|
|
|||||||||
| Income taxes payable |
|
|
|||||||||
|
Total current liabilities
|
|
|
|||||||||
|
Deferred income taxes
|
|
|
|||||||||
|
Operating lease liabilities
|
|
|
|||||||||
|
Other long-term liabilities
|
|
|
|||||||||
|
Long-term debt, excluding current portion
|
|
|
|||||||||
|
Total liabilities
|
|
|
|||||||||
|
Commitments and contingencies (Note 16)
|
|
|
|||||||||
|
|
|||||||||||
|
Common stock, par value $
|
|
|
|||||||||
|
Additional paid-in capital
|
|
|
|||||||||
|
Retained earnings
|
|
|
|||||||||
|
Treasury stock, at cost,
|
(
|
(
|
|||||||||
|
Accumulated other comprehensive loss
|
(
|
(
|
|||||||||
|
Total L&W stockholders’ equity
|
|
|
|||||||||
|
Noncontrolling interest
|
|
|
|||||||||
|
Total stockholders’ equity
|
|
|
|||||||||
|
Total liabilities and stockholders’ equity
|
$ |
|
$ |
|
|||||||
| See accompanying notes to condensed consolidated financial statements. | |||||||||||
9
LIGHT & WONDER, INC. AND SUBSIDIARIES
CONDENSED CONSOLIDATED STATEMENTS OF CASH FLOWS
(Unaudited, in millions)
| Nine Months Ended September 30, | |||||||||||
| 2023 | 2022 | ||||||||||
|
Cash flows from operating activities:
|
|||||||||||
|
Net income
|
$ |
|
$ |
|
|||||||
| Less: Income from discontinued operations, net of tax |
|
(
|
|||||||||
|
Adjustments to reconcile net income (loss) from continuing operations to net cash provided by (used in) operating activities from continuing operations
|
|
|
|||||||||
|
Changes in working capital accounts, excluding the effects of acquisitions
|
(
|
(
|
|||||||||
|
Changes in deferred income taxes and other
|
(
|
|
|||||||||
|
Net cash provided by (used in) operating activities from continuing operations
|
|
(
|
|||||||||
|
Net cash provided by operating activities from discontinued operations
|
|
|
|||||||||
| Net cash provided by (used in) operating activities |
|
(
|
|||||||||
|
Cash flows from investing activities:
|
|||||||||||
| Capital expenditures |
(
|
(
|
|||||||||
| Acquisitions of businesses, net of cash acquired |
(
|
(
|
|||||||||
| Proceeds from settlement of cross-currency interest rate swaps and other |
(
|
|
|||||||||
|
Net cash used in investing activities from continuing operations
|
(
|
(
|
|||||||||
|
Net cash (used in) provided by investing activities from discontinued operations
(1)
|
(
|
|
|||||||||
| Net cash (used in) provided by investing activities |
(
|
|
|||||||||
|
Cash flows from financing activities:
|
|||||||||||
|
Borrowings under revolving credit facilities
|
|
|
|||||||||
|
Repayments under revolving credit facilities
|
|
(
|
|||||||||
|
Proceeds from issuance of senior notes and term loans
|
|
|
|||||||||
| Repayment of notes and term loans (including redemption premium) |
(
|
(
|
|||||||||
| Payments on long-term debt |
(
|
(
|
|||||||||
|
Payments of debt issuance and deferred financing costs
|
(
|
(
|
|||||||||
|
Payments on license obligations
|
(
|
(
|
|||||||||
| Purchase of L&W common stock |
(
|
(
|
|||||||||
| Purchase of SciPlay’s Class A common stock |
(
|
(
|
|||||||||
| Net redemptions of common stock under stock-based compensation plans and other |
(
|
(
|
|||||||||
|
Net cash used in financing activities from continuing operations
|
(
|
(
|
|||||||||
| Net cash used in financing activities from discontinued operations |
|
(
|
|||||||||
| Net cash used in financing activities |
(
|
(
|
|||||||||
| Effect of exchange rate changes on cash, cash equivalents and restricted cash |
(
|
(
|
|||||||||
|
(Decrease) increase in cash, cash equivalents and restricted cash
|
(
|
|
|||||||||
| Cash, cash equivalents and restricted cash, beginning of period |
|
|
|||||||||
|
Cash, cash equivalents and restricted cash, end of period
|
|
|
|||||||||
| Less: Cash, cash equivalents and restricted cash of discontinued operations |
|
|
|||||||||
| Cash, cash equivalents and restricted cash of continuing operations, end of period | $ |
|
$ |
|
|||||||
|
Supplemental cash flow information:
|
|||||||||||
| Cash paid for interest | $ |
|
$ |
|
|||||||
|
Income taxes paid
|
|
|
|||||||||
| Distributed earnings from equity investments |
|
|
|||||||||
| Cash paid for contingent consideration included in operating activities |
|
|
|||||||||
|
Supplemental non-cash transactions:
|
|||||||||||
|
Non-cash interest expense
|
$ |
|
$ |
|
|||||||
| Fair value of securities received in sale of discontinued operations |
|
|
|||||||||
|
|
|||||||||||
| See accompanying notes to condensed consolidated financial statements. | |||||||||||
10
LIGHT & WONDER, INC. AND SUBSIDIARIES
NOTES TO CONDENSED CONSOLIDATED FINANCIAL STATEMENTS
(Unaudited, amounts in USD, table amounts in millions, except per share amounts)
(1) Description of the Business and Summary of Significant Accounting Policies
Description of the Business
We are a leading cross-platform global games company with a focus on content and digital markets. Our portfolio of revenue-generating activities primarily includes supplying game content and gaming machines, CMSs and table game products and services to licensed gaming entities; providing social casino and other mobile games, including casual gaming, to retail customers; and providing a comprehensive suite of digital gaming content, distribution platforms, player account management systems, as well as various other iGaming content and services.
We report our results of operations in
three
business segments—Gaming, SciPlay and iGaming—representing our different products and services.
Our common stock is listed on The Nasdaq Stock Market under the ticker symbol “LNW.” Our common stock is also listed as CDIs on the ASX and commenced active trading on May 22, 2023 (AEST) under the ticker symbol “LNW.”
On October 23, 2023, we acquired the remaining approximately
17
% equity interest in SciPlay not already owned by us pursuant to a merger (the “SciPlay Merger”) in an all-cash transaction of $
496
million, excluding transaction fees and expenses. As a result of the SciPlay Merger, SciPlay ceased to be publicly traded and became a wholly owned subsidiary of L&W. Upon completion of the SciPlay Merger, the SciPlay Revolver was terminated. There were no borrowings outstanding under the SciPlay Revolver at the time of termination.
We completed the sales of our former Lottery Business and Sports Betting Business during the second and third quarters of 2022, respectively. We have reflected the prior period financial results of these Divested Businesses as discontinued operations in our consolidated statements of operations. Refer to Note 2 for further information.
Unless otherwise noted, amounts and disclosures included herein relate to our continuing operations.
Basis of Presentation and Principles of Consolidation
Significant Accounting Policies
Other Income, net
Computation of Basic and Diluted Net Income Attributable to L&W Per Share
For the three and nine months ended September 30, 2023, we included
1
million and
2
million, respectively, of common stock equivalents in the calculation of diluted net income attributable to L&W per share, and for the three months ended September 30, 2022, we included
2
million of common stock equivalents in the calculation of diluted net income
11
attributable to L&W per share. Basic and diluted net income attributable to L&W per share were the same for the nine months ended September 30, 2022, as all common stock equivalents would have been anti-dilutive for that period. We excluded
2
million of stock options and
2
million of RSUs outstanding from the calculation of diluted weighted-average common shares outstanding for the nine months ended September 30, 2022.
New Accounting Guidance
(2) Discontinued Operations
We completed the Divestitures in 2022 and reflected the prior period financial results of the Divested Businesses as discontinued operations in our consolidated statements of operations. For the sale of our former Lottery Business completed during the second quarter of 2022, we received $
5.7
billion in gross cash proceeds and recorded a pre-tax gain of $
4.6
billion. For the sale of our former Sports Betting Business completed during the third quarter of 2022, we received $
796
million in gross proceeds and recorded a pre-tax gain of $
362
million.
The summarized results of our discontinued operations were as follows:
|
Three Months Ended
September 30, 2022 |
Nine Months Ended
September 30, 2022 |
||||||||||
| Total revenue | $ |
|
$ |
|
|||||||
| Total cost of revenue |
|
|
|||||||||
|
Other operating expenses
(1)
|
|
|
|||||||||
| Operating (loss) income |
(
|
|
|||||||||
| Total other income, net |
|
|
|||||||||
|
Net (loss) income from discontinued operations before income taxes
|
(
|
|
|||||||||
| Gain on sale of discontinued operations before income taxes |
|
|
|||||||||
| Total net income from discontinued operations before income taxes |
|
|
|||||||||
| Income tax expense |
(
|
(
|
|||||||||
| Net income from discontinued operations, net of tax included in the consolidated statement of operations | $ |
|
$ |
|
|||||||
|
|
|||||||||||
(3) Revenue Recognition
The following table disaggregates revenues by type within each of our business segments:
| Three Months Ended September 30, | Nine Months Ended September 30, | ||||||||||||||||||||||
| 2023 | 2022 | 2023 | 2022 | ||||||||||||||||||||
| Gaming | |||||||||||||||||||||||
| Gaming operations | $ |
|
$ |
|
$ |
|
$ |
|
|||||||||||||||
| Gaming machine sales |
|
|
|
|
|||||||||||||||||||
| Gaming systems |
|
|
|
|
|||||||||||||||||||
| Table products |
|
|
|
|
|||||||||||||||||||
| Total | $ |
|
$ |
|
$ |
|
$ |
|
|||||||||||||||
| SciPlay | |||||||||||||||||||||||
| Mobile in-app purchases | $ |
|
$ |
|
$ |
|
$ |
|
|||||||||||||||
|
Web in-app purchases and other
(1)
|
|
|
|
|
|||||||||||||||||||
| Total | $ |
|
$ |
|
$ |
|
$ |
|
|||||||||||||||
| iGaming | $ |
|
$ |
|
$ |
|
$ |
|
|||||||||||||||
|
|
|||||||||||||||||||||||
12
The amount of rental income revenue that is outside the scope of ASC 606 was $
127
million and $
367
million for the three and nine months ended September 30, 2023, respectively, and $
116
million and $
347
million for the three and nine months ended September 30, 2022, respectively.
Contract Liabilities and Other Disclosures
The following table summarizes the activity in our contract liabilities for the reporting period:
| Nine Months Ended September 30, 2023 | |||||
|
Contract liability balance, beginning of period
(1)
|
$ |
|
|||
| Liabilities recognized during the period |
|
||||
| Amounts recognized in revenue from beginning balance |
(
|
||||
|
Contract liability balance, end of period
(1)
|
$ |
|
|||
|
|
|||||
| Receivables |
Contract Assets
(1)
|
||||||||||
| Beginning of period balance | $ |
|
$ |
|
|||||||
|
End of period balance, September 30, 2023
|
|
|
|||||||||
|
|
|||||||||||
As of September 30, 2023, we did not have material unsatisfied performance obligations for contracts expected to be long-term or contracts for which we recognize revenue at an amount other than for which we have the right to invoice for goods or services delivered or performed.
(4) Business Segments
We report our operations in
three
business segments—Gaming, SciPlay and iGaming—representing our different products and services. A detailed discussion regarding the products and services from which each reportable business segment derives its revenue is included in Notes 3 and 4 in our 2022 10-K.
In evaluating financial performance, our Chief Operating Decision Maker focuses on AEBITDA as management’s primary segment measure of profit or loss, which is described in footnote (2) to the below table. The accounting policies of our
13
| Three Months Ended September 30, 2023 | |||||||||||||||||||||||||||||
| Gaming | SciPlay | iGaming |
Unallocated and Reconciling Items
(1)
|
Total | |||||||||||||||||||||||||
|
Total revenue
|
$ | 465 | $ | 196 | $ | 70 | $ |
|
$ |
|
|||||||||||||||||||
|
AEBITDA
(2)
|
|
|
|
(
|
$ |
|
|||||||||||||||||||||||
|
Reconciling items to net income from continuing operations before income taxes:
|
|||||||||||||||||||||||||||||
|
D&A
|
(
|
(
|
(
|
(
|
(
|
||||||||||||||||||||||||
|
Restructuring and other
|
(
|
(
|
(
|
(
|
(
|
||||||||||||||||||||||||
|
Interest expense
|
(
|
(
|
|||||||||||||||||||||||||||
| Loss on debt financing transactions |
(
|
(
|
|||||||||||||||||||||||||||
|
Other income, net
|
|
|
|||||||||||||||||||||||||||
|
Stock-based compensation
|
(
|
(
|
|||||||||||||||||||||||||||
|
Net income from continuing operations before income taxes
|
$ |
|
|||||||||||||||||||||||||||
|
|
|||||||||||||||||||||||||||||
|
|
|||||||||||||||||||||||||||||
| Three Months Ended September 30, 2022 | |||||||||||||||||||||||||||||
| Gaming | SciPlay | iGaming |
Unallocated and Reconciling Items
(1)
|
Total | |||||||||||||||||||||||||
|
Total revenue
|
$ |
|
$ |
|
$ |
|
$ |
|
$ |
|
|||||||||||||||||||
|
AEBITDA
(2)
|
|
|
|
(
|
$ |
|
|||||||||||||||||||||||
|
Reconciling items to net income from continuing operations before income taxes:
|
|||||||||||||||||||||||||||||
|
D&A
|
(
|
(
|
(
|
(
|
(
|
||||||||||||||||||||||||
|
Restructuring and other
|
(
|
(
|
|
(
|
(
|
||||||||||||||||||||||||
|
Interest expense
|
(
|
(
|
|||||||||||||||||||||||||||
| Other income, net |
|
|
|||||||||||||||||||||||||||
| Stock-based compensation |
(
|
(
|
|||||||||||||||||||||||||||
|
Net income from continuing operations before income taxes
|
$ |
|
|||||||||||||||||||||||||||
| (1) Includes amounts not allocated to the business segments (including corporate costs) and items to reconcile the total business segments AEBITDA to our consolidated net income from continuing operations before income taxes. | |||||||||||||||||||||||||||||
|
(2) AEBITDA is described in footnote (2) to the first table in this Note 4.
|
|||||||||||||||||||||||||||||
14
| Nine Months Ended September 30, 2023 | |||||||||||||||||||||||||||||
| Gaming | SciPlay | iGaming |
Unallocated and Reconciling Items
(1)
|
Total | |||||||||||||||||||||||||
|
Total revenue
|
$ |
|
$ |
|
$ |
|
$ |
|
$ |
|
|||||||||||||||||||
|
AEBITDA
(2)
|
|
|
|
(
|
$ |
|
|||||||||||||||||||||||
|
Reconciling items to net income from continuing operations before income taxes:
|
|||||||||||||||||||||||||||||
|
D&A
|
(
|
(
|
(
|
(
|
(
|
||||||||||||||||||||||||
|
Restructuring and other
|
(
|
(
|
(
|
(
|
(
|
||||||||||||||||||||||||
|
Interest expense
|
(
|
(
|
|||||||||||||||||||||||||||
| Loss on debt financing transactions |
(
|
(
|
|||||||||||||||||||||||||||
|
Other income, net
|
|
|
|||||||||||||||||||||||||||
|
Stock-based compensation
|
(
|
(
|
|||||||||||||||||||||||||||
|
Net income from continuing operations before income taxes
|
$ |
|
|||||||||||||||||||||||||||
| (1) Includes amounts not allocated to the business segments (including corporate costs) and items to reconcile the total business segments AEBITDA to our consolidated net income from continuing operations before income taxes. | |||||||||||||||||||||||||||||
| (2) AEBITDA is described in footnote (2) to the first table in this Note 4. | |||||||||||||||||||||||||||||
| Nine Months Ended September 30, 2022 | |||||||||||||||||||||||||||||
| Gaming | SciPlay | iGaming |
Unallocated and Reconciling Items
(1)
|
Total | |||||||||||||||||||||||||
|
Total revenue
|
$ |
|
$ |
|
$ |
|
$ |
|
$ |
|
|||||||||||||||||||
|
AEBITDA
(2)
|
|
|
|
(
|
$ |
|
|||||||||||||||||||||||
|
Reconciling items to net loss from continuing operations before income taxes:
|
|||||||||||||||||||||||||||||
|
D&A
|
(
|
(
|
(
|
(
|
(
|
||||||||||||||||||||||||
|
Restructuring and other
|
(
|
(
|
(
|
(
|
(
|
||||||||||||||||||||||||
|
Interest expense
|
(
|
(
|
|||||||||||||||||||||||||||
|
Loss on debt financing transactions
|
(
|
(
|
|||||||||||||||||||||||||||
| Gain on remeasurement of debt and other |
|
|
|||||||||||||||||||||||||||
|
Other income, net
|
|
|
|||||||||||||||||||||||||||
| Stock-based compensation |
(
|
(
|
|||||||||||||||||||||||||||
|
Net loss from continuing operations before income taxes
|
$ |
(
|
|||||||||||||||||||||||||||
| (1) Includes amounts not allocated to the business segments (including corporate costs) and items to reconcile the total business segments AEBITDA to our consolidated net loss from continuing operations before income taxes. | |||||||||||||||||||||||||||||
| (2) AEBITDA is described in footnote (2) to the first table in this Note 4. | |||||||||||||||||||||||||||||
(5) Restructuring and Other
15
acquisition- and disposition-related costs and other unusual items.
The following table summarizes pre-tax restructuring and other costs for the periods presented:
| Three Months Ended September 30, | Nine Months Ended September 30, | ||||||||||||||||||||||
| 2023 | 2022 | 2023 | 2022 | ||||||||||||||||||||
| Employee severance and related | $ |
|
$ |
|
$ |
|
$ |
|
|||||||||||||||
|
Strategic review and related
(1)
|
|
|
|
|
|||||||||||||||||||
|
Contingent acquisition consideration
(2)
|
|
|
|
|
|||||||||||||||||||
| Restructuring, integration and other |
|
|
|
|
|||||||||||||||||||
| Total | $ |
|
$ |
|
$ |
|
$ |
|
|||||||||||||||
|
|
|||||||||||||||||||||||
|
|
|||||||||||||||||||||||
(6) Receivables, Allowance for Credit Losses and Credit Quality of Receivables
Receivables
The following table summarizes the components of current and long-term receivables, net:
| As of | |||||||||||
| September 30, 2023 | December 31, 2022 | ||||||||||
| Current: | |||||||||||
|
Receivables
|
$ |
|
$ |
|
|||||||
|
Allowance for credit losses
|
(
|
(
|
|||||||||
|
Current receivables, net
|
|
|
|||||||||
| Long-term: | |||||||||||
|
Receivables
|
|
|
|||||||||
|
Allowance for credit losses
|
(
|
(
|
|||||||||
| Long-term receivables, net |
|
|
|||||||||
|
Total receivables, net
|
$ |
|
$ |
|
|||||||
Allowance for Credit Losses
We manage our receivable portfolios using both geography and delinquency as key credit quality indicators.
The following summarizes geographical delinquencies of total receivables, net:
| As of | |||||||||||||||||||||||
| September 30, 2023 | Balances over 90 days past due | December 31, 2022 | Balances over 90 days past due | ||||||||||||||||||||
| Receivables: | |||||||||||||||||||||||
| U.S. and Canada | $ |
|
$ |
|
$ |
|
$ |
|
|||||||||||||||
| International |
|
|
|
|
|||||||||||||||||||
| Total receivables |
|
|
|
|
|||||||||||||||||||
| Receivables allowance: | |||||||||||||||||||||||
| U.S. and Canada |
(
|
(
|
(
|
(
|
|||||||||||||||||||
| International |
(
|
(
|
(
|
(
|
|||||||||||||||||||
| Total receivables allowance |
(
|
(
|
(
|
(
|
|||||||||||||||||||
| Receivables, net | $ |
|
$ |
|
$ |
|
$ |
|
|||||||||||||||
Account balances are charged against the allowances after all internal and external collection efforts have been exhausted and the potential for recovery is considered remote.
16
The activity in our allowance for receivable credit losses for each of the three and nine months ended September 30, 2023 and 2022 is as follows:
| 2023 | 2022 | ||||||||||||||||||||||
| Total | U.S. and Canada | International | Total | ||||||||||||||||||||
|
Beginning allowance for credit losses
|
$ |
(
|
$ |
(
|
$ |
(
|
$ |
(
|
|||||||||||||||
|
Provision
|
(
|
(
|
|
(
|
|||||||||||||||||||
|
Charge-offs and recoveries
|
|
|
|
|
|||||||||||||||||||
| Allowance for credit losses as of March 31 | $ |
(
|
$ |
(
|
$ |
(
|
$ |
(
|
|||||||||||||||
|
Provision
|
(
|
|
(
|
(
|
|||||||||||||||||||
|
Charge-offs and recoveries
|
|
|
|
|
|||||||||||||||||||
| Allowance for credit losses as of June 30 | $ |
(
|
$ |
(
|
$ |
(
|
$ |
(
|
|||||||||||||||
| Provision |
|
|
|
|
|||||||||||||||||||
| Charge-offs and recoveries |
|
|
|
|
|||||||||||||||||||
| Allowance for credit losses as of September 30 | $ |
(
|
$ |
(
|
$ |
(
|
$ |
(
|
|||||||||||||||
As of September 30, 2023 and December 31, 2022,
5
% and
3
%, respectively, of our total receivables, net, were past due by over 90 days.
Credit Quality of Receivables
We have certain concentrations of outstanding receivables in international locations that impact our assessment of the credit quality of our receivables. We monitor the macroeconomic and political environment in each of these locations in our assessment of the credit quality of our receivables. The international customers with significant concentrations (generally deemed to be exceeding 10%) of our receivables with terms longer than one year are primarily in the Latin America region (“LATAM”) and are primarily comprised of Mexico, Peru and Argentina.
The following table summarizes our LATAM receivables:
|
As of September 30, 2023
|
|||||||||||||||||
| Total | Current | Balances over 90 days past due | |||||||||||||||
| Receivables | $ |
|
$ |
|
$ |
|
|||||||||||
| Allowance for credit losses |
(
|
(
|
(
|
||||||||||||||
| Receivables, net | $ |
|
$ |
|
$ |
|
|||||||||||
We continuously review receivables and, as information concerning credit quality arises, reassess our expectations of future losses and record an incremental reserve if warranted at that time. Our current allowance for credit losses represents our current expectation of credit losses; however, future expectations could change as international unrest or other macro-economic factors impact the financial stability of our customers.
The fair value of receivables is estimated by discounting expected future cash flows using current interest rates at which similar loans would be made to borrowers with similar credit ratings and remaining maturities. As of September 30, 2023 and December 31, 2022, the fair value of receivables, net, approximated the carrying value due to contractual terms of receivables generally being less than 24 months.
(7) Inventories
Inventories consisted of the following:
| As of | |||||||||||
| September 30, 2023 | December 31, 2022 | ||||||||||
|
Parts and work-in-process
|
$ |
|
$ |
|
|||||||
|
Finished goods
|
|
|
|||||||||
|
Total inventories
|
$ |
|
$ |
|
|||||||
Parts and work-in-process include parts for gaming machines and our finished goods inventory primarily consists of gaming machines for sale.
17
(8) Property and Equipment, net
Property and equipment, net consisted of the following:
| As of | |||||||||||
| September 30, 2023 | December 31, 2022 | ||||||||||
| Land | $ |
|
$ |
|
|||||||
| Buildings and leasehold improvements |
|
|
|||||||||
| Gaming machinery and equipment |
|
|
|||||||||
| Furniture and fixtures |
|
|
|||||||||
| Construction in progress |
|
|
|||||||||
| Other property and equipment |
|
|
|||||||||
| Less: accumulated depreciation |
(
|
(
|
|||||||||
| Total property and equipment, net | $ |
|
$ |
|
|||||||
Depreciation expense is excluded from cost of services, cost of products and other operating expenses and is separately presented within Depreciation, amortization and impairments.
| Three Months Ended September 30, | Nine Months Ended September 30, | ||||||||||||||||||||||
| 2023 | 2022 | 2023 | 2022 | ||||||||||||||||||||
| Depreciation expense | $ |
|
$ |
|
$ |
|
$ |
|
|||||||||||||||
(9) Intangible Assets, net and Goodwill
Intangible Assets, net
The following tables present certain information regarding our intangible assets as of September 30, 2023 and December 31, 2022:
| As of | |||||||||||||||||||||||||||||||||||
| September 30, 2023 | December 31, 2022 | ||||||||||||||||||||||||||||||||||
|
Gross Carrying Value
|
Accumulated Amortization
|
Net Balance
|
Gross Carrying Value
|
Accumulated Amortization
|
Net Balance
|
||||||||||||||||||||||||||||||
|
Amortizable intangible assets:
|
|||||||||||||||||||||||||||||||||||
| Customer relationships | $ |
|
$ |
(
|
$ |
|
$ |
|
$ |
(
|
$ |
|
|||||||||||||||||||||||
| Intellectual property |
|
(
|
|
|
(
|
|
|||||||||||||||||||||||||||||
| Licenses |
|
(
|
|
|
(
|
|
|||||||||||||||||||||||||||||
| Brand names |
|
(
|
|
|
(
|
|
|||||||||||||||||||||||||||||
| Trade names |
|
(
|
|
|
(
|
|
|||||||||||||||||||||||||||||
| Patents and other |
|
(
|
|
|
(
|
|
|||||||||||||||||||||||||||||
| Total intangible assets | $ |
|
$ |
(
|
$ |
|
$ |
|
$ |
(
|
$ |
|
|||||||||||||||||||||||
The following reflects intangible amortization expense included within Depreciation, amortization and impairments.
| Three Months Ended September 30, | Nine Months Ended September 30, | ||||||||||||||||||||||
| 2023 | 2022 | 2023 | 2022 | ||||||||||||||||||||
|
Amortization expense
(1)
|
$ |
|
$ |
|
$ |
|
$ |
|
|||||||||||||||
|
|
|||||||||||||||||||||||
18
Goodwill
The table below reconciles the change in the carrying value of goodwill by business segment for the period from December 31, 2022 to September 30, 2023.
|
Gaming
(1)
|
SciPlay | iGaming | Totals | |||||||||||||||||||||||
|
Balance as of December 31, 2022
|
$ |
|
$ |
|
$ |
|
$ |
|
||||||||||||||||||
| Foreign currency adjustments |
(
|
(
|
(
|
(
|
||||||||||||||||||||||
|
Balance as of September 30, 2023
|
$ |
|
$ |
|
$ |
|
$ |
|
||||||||||||||||||
|
|
||||||||||||||||||||||||||
(10) Software, net
Software, net consisted of the following:
| As of | |||||||||||
| September 30, 2023 | December 31, 2022 | ||||||||||
| Software | $ |
|
$ |
|
|||||||
| Accumulated amortization |
(
|
(
|
|||||||||
| Software, net | $ |
|
$ |
|
|||||||
The following reflects amortization of software included within D&A:
| Three Months Ended September 30, | Nine Months Ended September 30, | ||||||||||||||||||||||
| 2023 | 2022 | 2023 | 2022 | ||||||||||||||||||||
| Amortization expense | $ |
|
$ |
|
$ |
|
$ |
|
|||||||||||||||
19
(11) Long-term Debt
The following table reflects our outstanding debt (in order of priority and maturity):
| As of | |||||||||||||||||||||||||||||||||||
| September 30, 2023 | December 31, 2022 | ||||||||||||||||||||||||||||||||||
| Final Maturity | Rate(s) | Face value | Unamortized debt discount/premium and deferred financing costs, net | Book value | Book value | ||||||||||||||||||||||||||||||
| Senior Secured Credit Facilities: | |||||||||||||||||||||||||||||||||||
|
SciPlay Revolver
(1)
|
2024 | variable | $ |
|
$ |
|
$ |
|
$ |
|
|||||||||||||||||||||||||
| LNWI Revolver | 2027 | variable |
|
|
|
|
|||||||||||||||||||||||||||||
| LNWI Term Loan B | 2029 | variable |
|
(
|
|
|
|||||||||||||||||||||||||||||
| LNWI Senior Notes: | |||||||||||||||||||||||||||||||||||
| 2025 Unsecured Notes | 2025 |
|
|
|
|
|
|||||||||||||||||||||||||||||
| 2028 Unsecured Notes | 2028 |
|
|
(
|
|
|
|||||||||||||||||||||||||||||
| 2029 Unsecured Notes | 2029 |
|
|
(
|
|
|
|||||||||||||||||||||||||||||
| 2031 Unsecured Notes | 2031 |
|
|
(
|
|
|
|||||||||||||||||||||||||||||
| Other | — | — |
|
|
|
|
|||||||||||||||||||||||||||||
| Total long-term debt outstanding | $ |
|
$ |
(
|
$ |
|
$ |
|
|||||||||||||||||||||||||||
| Less: current portion of long-term debt |
(
|
(
|
|||||||||||||||||||||||||||||||||
| Long-term debt, excluding current portion | $ |
|
$ |
|
|||||||||||||||||||||||||||||||
|
Fair value of debt
(2)
|
$ |
|
|||||||||||||||||||||||||||||||||
|
|
|||||||||||||||||||||||||||||||||||
|
|
|||||||||||||||||||||||||||||||||||
Issuance of 2031 Unsecured Notes and Redemption of 2025 Unsecured Notes
On August 23, 2023, we issued $
550
million in aggregate principal amount of
7.500
% senior unsecured notes due 2031 pursuant to an indenture among LNWI, as issuer, the Company, the other guarantors party thereto and Deutsche Bank Trust Company Americas, as trustee. We received net proceeds of $
544
million from the issuance. The 2031 Unsecured Notes bear interest at the rate of
7.500
% per annum, which accrues from August 23, 2023, and is payable semiannually in arrears on March 1 and September 1 of each year, beginning on March 1, 2024. We may redeem some or all of the 2031 Unsecured Notes at any time prior to September 1, 2026, at a redemption price equal to
100
% of the principal amount plus accrued and unpaid interest, if any, to the date of the redemption plus a “make whole” premium. We may redeem some or all of the 2031 Unsecured Notes at any time on or after September 1, 2026, at the prices specified in the indenture.
The 2031 Unsecured Notes are senior obligations of LNWI, rank equally with all of its existing and future senior debt and rank senior to all of its existing and future debt that is expressly subordinated to the 2031 Unsecured Notes. The 2031 Unsecured Notes are guaranteed on a senior unsecured basis by the Company and all of its wholly owned domestic restricted subsidiaries (other than LNWI and certain immaterial subsidiaries), subject to customary exceptions. The net proceeds of the 2031 Unsecured Notes offering, together with cash on hand, were used to redeem all $
550
million of the 2025 Unsecured Notes and to pay accrued and unpaid interest thereon plus related premiums, fees and expenses.
We were in compliance with the financial covenants under all debt agreements as of September 30, 2023 (for information regarding our financial covenants of all debt agreements, see Note 15 in our 2022 10-K).
20
Loss on Debt Financing Transactions
The following are components of the loss on debt financing transactions resulting from debt extinguishment and modification accounting for the three and nine months ended September 30, 2023 and 2022, respectively.
| Three Months Ended September 30, | Nine Months Ended September 30, | ||||||||||||||||||||||
| 2023 | 2022 | 2023 | 2022 | ||||||||||||||||||||
| Repayment of principal balance at premium | $ |
|
$ |
|
$ |
|
$ |
|
|||||||||||||||
| Unamortized debt discount and deferred financing costs, net |
|
|
|
|
|||||||||||||||||||
| Total loss on debt refinancing transactions | $ |
|
$ |
|
$ |
|
$ |
|
|||||||||||||||
For additional information regarding the terms of our credit facilities and Senior Notes, see Note 15 in our 2022 10-K.
(12) Fair Value Measurements
The fair value of our financial assets and liabilities is determined by reference to market data and other valuation techniques as appropriate. We believe the fair value of our financial instruments, which are principally cash and cash equivalents, restricted cash, receivables, other current assets, accounts payable and accrued liabilities, approximates their recorded values. Our assets and liabilities measured at fair value on a recurring basis are described below.
Derivative Financial Instruments
As of September 30, 2023, we held the following derivative instruments that were accounted for pursuant to ASC 815:
Interest Rate Swap Contracts
We use interest rate swap contracts as described below to mitigate gains or losses associated with the change in expected cash flows due to fluctuations in interest rates on our variable rate debt.
In April 2022, we entered into interest rate swap contracts to hedge a portion of our interest expense associated with our new variable rate debt to effectively fix the interest rate that we pay. These interest rate swap contracts were designated as cash flow hedges under ASC 815. We pay interest at a weighted-average fixed rate of
2.8320
% and receive interest at a variable rate equal to one-month Chicago Mercantile Exchange Term SOFR. The total notional amount of interest rate swaps was $
700
million as of September 30, 2023. These hedges mature in April 2027. We also previously had interest rate swap contracts that matured in February 2022.
All gains and losses from these hedges were recorded in other comprehensive income (loss) until the future underlying payment transactions occur. Any realized gains or losses resulting from the hedges were recognized (together with the hedged transaction) as interest expense. We estimated the fair value of our interest rate swap contracts by discounting the future cash flows of both the fixed rate and variable rate interest payments based on market yield curves. The inputs used to measure the fair value of our interest rate swap contracts were categorized as Level 2 in the fair value hierarchy as established by ASC 820.
The following table shows the gain and interest expense recognized on our interest rate swap contracts:
| Three Months Ended September 30, | Nine Months Ended September 30, | ||||||||||||||||||||||
| 2023 | 2022 | 2023 | 2022 | ||||||||||||||||||||
| Gain recorded in accumulated other comprehensive loss, net of tax | $ |
|
$ |
|
$ |
|
$ |
|
|||||||||||||||
| Interest income (expense) recorded related to interest rate swap contracts |
|
(
|
|
(
|
|||||||||||||||||||
We do not expect to reclassify material amounts from accumulated other comprehensive loss to interest expense in the next twelve months.
21
The following table shows the effect of interest rate swap contracts designated as cash flow hedges on interest expense in the consolidated statements of operations:
| Three Months Ended September 30, | Nine Months Ended September 30, | ||||||||||||||||||||||
| 2023 | 2022 | 2023 | 2022 | ||||||||||||||||||||
| Total interest expense which reflects the effects of cash flow hedges | $ |
(
|
$ |
(
|
$ |
(
|
$ |
(
|
|||||||||||||||
| Hedged item |
(
|
(
|
(
|
(
|
|||||||||||||||||||
| Derivative designated as hedging instrument |
|
|
|
|
|||||||||||||||||||
The following table shows the fair value of our hedges:
| As of | |||||||||||||||||
|
Balance Sheet Line Item
|
September 30, 2023 | December 31, 2022 | |||||||||||||||
| Interest rate swaps | Other assets | $ |
|
$ |
|
||||||||||||
Contingent Acquisition Consideration Liabilities
In connection with our acquisitions, we have recorded certain contingent consideration liabilities (including redeemable non-controlling interest), of which the values are primarily based on reaching certain earnings-based metrics. The related liabilities were recorded at fair value on their respective acquisition dates as a part of the consideration transferred and are remeasured each reporting period (other than for redeemable non-controlling interest, which is measured based on its redemption value). The inputs used to measure the fair value of our liabilities are categorized as Level 3 in the fair value hierarchy.
The table below reconciles the change in the contingent acquisition consideration liabilities (including deferred purchase price) for the period from December 31, 2022 to September 30, 2023.
| Total | Included in Accrued Liabilities | Included in Other Long-Term Liabilities | |||||||||||||||
|
Balance as of December 31, 2022
|
$ |
|
$ |
|
$ |
|
|||||||||||
| Payments |
(
|
||||||||||||||||
|
Fair value adjustments
(1)
|
|
||||||||||||||||
|
Other adjustments
(2)
|
(
|
||||||||||||||||
|
Balance as of September 30, 2023
|
$ |
|
$ |
|
$ |
|
|||||||||||
|
|
|||||||||||||||||
|
|
|||||||||||||||||
22
(13) Stockholders’ Equity
Changes in Stockholders’ Equity (Deficit)
The following tables present certain information regarding our stockholders’ equity as of September 30, 2023 and 2022:
| Nine Months Ended September 30, 2023 | |||||||||||||||||||||||||||||||||||||||||
| Common Stock | Additional Paid in Capital | Retained Earnings | Treasury Stock | Accumulated Other Comprehensive Loss | Noncontrolling Interest | Total | |||||||||||||||||||||||||||||||||||
| January 1, 2023 | $ |
|
$ |
|
$ |
|
$ |
(
|
$ |
(
|
$ |
|
$ |
|
|||||||||||||||||||||||||||
| Settlement of liability awards | — |
|
— | — | — | — |
|
||||||||||||||||||||||||||||||||||
| Vesting of RSUs, net of tax withholdings and other | — |
(
|
— | — | — | — |
(
|
||||||||||||||||||||||||||||||||||
| Purchase of treasury stock | — | — | — |
(
|
— | — |
(
|
||||||||||||||||||||||||||||||||||
| Purchase of SciPlay’s Class A common stock | — |
(
|
— | — | — | — |
(
|
||||||||||||||||||||||||||||||||||
| Stock-based compensation | — |
|
— | — | — | — |
|
||||||||||||||||||||||||||||||||||
| Net income | — | — |
|
— | — |
|
|
||||||||||||||||||||||||||||||||||
| Other comprehensive income | — | — | — | — |
|
— |
|
||||||||||||||||||||||||||||||||||
| March 31, 2023 | $ |
|
$ |
|
$ |
|
$ |
(
|
$ |
(
|
$ |
|
$ |
|
|||||||||||||||||||||||||||
| Vesting of RSUs, net of tax withholdings and other | — |
|
— | — | — | — |
|
||||||||||||||||||||||||||||||||||
| Purchase of treasury stock | — | — | — |
(
|
— | — |
(
|
||||||||||||||||||||||||||||||||||
| Purchase of SciPlay’s Class A common stock | — |
(
|
— | — | — |
|
(
|
||||||||||||||||||||||||||||||||||
| Stock-based compensation | — |
|
— | — | — | — |
|
||||||||||||||||||||||||||||||||||
| Net (loss) income | — | — |
(
|
— | — |
|
|
||||||||||||||||||||||||||||||||||
| Other comprehensive income | — | — | — | — |
|
— |
|
||||||||||||||||||||||||||||||||||
| June 30, 2023 | $ |
|
$ |
|
$ |
|
$ |
(
|
$ |
(
|
$ |
|
$ |
|
|||||||||||||||||||||||||||
| Vesting of RSUs, net of tax withholdings and other | — |
|
— | — | — | — |
|
||||||||||||||||||||||||||||||||||
|
Purchase of treasury stock
(1)
|
— | — | — |
(
|
— | — |
(
|
||||||||||||||||||||||||||||||||||
| Stock-based compensation | — |
|
— | — | — | — |
|
||||||||||||||||||||||||||||||||||
| Net income | — | — |
|
— | — |
|
|
||||||||||||||||||||||||||||||||||
| Other comprehensive loss | — | — | — | — |
(
|
— |
(
|
||||||||||||||||||||||||||||||||||
| September 30, 2023 | $ |
|
$ |
|
$ |
|
$ |
(
|
$ |
(
|
$ |
|
$ |
|
|||||||||||||||||||||||||||
|
|
|||||||||||||||||||||||||||||||||||||||||
23
| Nine Months Ended September 30, 2022 | |||||||||||||||||||||||||||||||||||||||||
| Common Stock | Additional Paid in Capital | Retained Earnings (Accumulated Loss) | Treasury Stock | Accumulated Other Comprehensive Loss | Noncontrolling Interest | Total | |||||||||||||||||||||||||||||||||||
| January 1, 2022 | $ |
|
$ |
|
$ |
(
|
$ |
(
|
$ |
(
|
$ |
|
$ |
(
|
|||||||||||||||||||||||||||
| Settlement of liability awards | — |
|
— | — | — | — |
|
||||||||||||||||||||||||||||||||||
| Vesting of RSUs, net of tax withholdings and other | — |
(
|
— | — | — | — |
(
|
||||||||||||||||||||||||||||||||||
| Purchase of treasury stock | — | — | — |
(
|
— | — |
(
|
||||||||||||||||||||||||||||||||||
| Stock-based compensation | — |
|
— | — | — | — |
|
||||||||||||||||||||||||||||||||||
| Net income | — | — |
|
— | — |
|
|
||||||||||||||||||||||||||||||||||
| Other comprehensive loss | — | — | — | — |
(
|
— |
(
|
||||||||||||||||||||||||||||||||||
| March 31, 2022 | $ |
|
$ |
|
$ |
(
|
$ |
(
|
$ |
(
|
$ |
|
$ |
(
|
|||||||||||||||||||||||||||
| Vesting of RSUs, net of tax withholdings and other | — | — | — | — | — | — |
|
||||||||||||||||||||||||||||||||||
| Purchase of treasury stock | — | — | — |
(
|
— | — |
(
|
||||||||||||||||||||||||||||||||||
| Purchase of SciPlay’s Class A common stock | — |
(
|
— | — | — |
(
|
(
|
||||||||||||||||||||||||||||||||||
| Stock-based compensation | — |
|
— | — | — | — |
|
||||||||||||||||||||||||||||||||||
| Net income | — | — |
|
— | — |
|
|
||||||||||||||||||||||||||||||||||
|
Other comprehensive loss
(1)
|
— | — | — | — |
(
|
— |
(
|
||||||||||||||||||||||||||||||||||
| June 30, 2022 | $ |
|
$ |
|
$ |
|
$ |
(
|
$ |
(
|
$ |
|
$ |
|
|||||||||||||||||||||||||||
| Vesting of RSUs, net of tax withholdings and other | — |
(
|
— | — | — | — |
(
|
||||||||||||||||||||||||||||||||||
| Purchase of SciPlay’s Class A common stock |
(
|
(
|
(
|
||||||||||||||||||||||||||||||||||||||
| Stock-based compensation | — |
|
— | — | — |
|
|
||||||||||||||||||||||||||||||||||
| Net income | — | — |
|
— | — |
|
|
||||||||||||||||||||||||||||||||||
|
Other comprehensive loss
(1)
|
— | — | — | — |
(
|
— |
(
|
||||||||||||||||||||||||||||||||||
| September 30, 2022 | $ |
|
$ |
|
$ |
|
$ |
(
|
$ |
(
|
$ |
|
$ |
|
|||||||||||||||||||||||||||
|
|
|||||||||||||||||||||||||||||||||||||||||
Stock-based Compensation
The following reflects total stock-based compensation expense recognized under all programs:
| Three Months Ended September 30, | Nine Months Ended September 30, | ||||||||||||||||||||||
| 2023 | 2022 | 2023 | 2022 | ||||||||||||||||||||
| Related to L&W stock options | $ |
|
$ |
|
$ |
|
$ |
|
|||||||||||||||
| Related to L&W RSUs |
|
|
|
|
|||||||||||||||||||
| Related to SciPlay RSUs |
|
|
|
|
|||||||||||||||||||
|
Total
(1)
|
$ |
|
$ |
|
$ |
|
$ |
|
|||||||||||||||
|
|
|||||||||||||||||||||||
24
Restricted Stock Units
A summary of the changes in RSUs outstanding under our equity-based compensation plans during the nine months ended September 30, 2023 is presented below:
| Number of Restricted Stock Units | Weighted Average Grant Date Fair Value | ||||||||||
|
Unvested RSUs as of December 31, 2022
|
|
$ |
|
||||||||
| Granted |
|
$ |
|
||||||||
| Vested |
(
|
$ |
|
||||||||
| Cancelled |
(
|
$ |
|
||||||||
|
Unvested RSUs as of September 30, 2023
|
|
$ |
|
||||||||
The weighted-average grant date fair value of RSUs granted during the nine months ended September 30, 2023 and 2022 was $
57.54
and $
57.26
, respectively. The fair value of each RSU grant is based on the market value of our common stock at the time of grant. As of September 30, 2023, we had $
58
million in total unrecognized stock-based compensation expense relating to unvested RSUs that will be amortized over a weighted-average period of approximately
two years
. The fair value at vesting date of RSUs vested during the nine months ended September 30, 2023 and 2022 was $
58
million and $
72
million, respectively.
Series A Junior Participating Preferred Stock and Rights Agreement
The 2018 Amended and Restated Rights Agreement, as described in Note 17 of our 2022 10-K, expired on June 19, 2023. Immediately prior to its expiration,
no
shares of Series A Junior Participating Preferred Stock were outstanding and
no
preferred share purchase rights had been exercised. At the time of the expiration of the agreement, the preferred share purchase rights expired and are no longer outstanding.
Share Repurchase Programs
On March 1, 2022, our Board of Directors approved a share repurchase program under which we are authorized to repurchase, from time to time through February 25, 2025, up to an aggregate amount of $
750
million of our outstanding common stock. During the nine months ended September 30, 2023, we repurchased
2.1
million shares of common stock under the program at an aggregate cost of $
146
million (including excise tax).
On May 9, 2022, SciPlay’s Board of Directors approved a share repurchase program under which it is authorized to repurchase, from time to time through May 9, 2024, up to an aggregate amount of $
60
million of its outstanding Class A common stock. On May 3, 2023, SciPlay’s Board of Directors approved another share repurchase program under which it is authorized to repurchase, from time to time through May 3, 2024, up to an aggregate amount of $
60
million of its outstanding Class A common stock. During the nine months ended September 30, 2023, SciPlay repurchased
1.4
million shares of Class A common stock under the programs at an aggregate cost of $
23
million. As described in Note 1, on October 23, 2023, we completed the SciPlay Merger, and upon its completion, the SciPlay share repurchase program was terminated.
(14) Income Taxes
Our income tax expense (including discrete items) was $
14
million and $
27
million for the three and nine months ended September 30, 2023, respectively, and $
4
million and $
8
million for the three and nine months ended September 30, 2022, respectively. In 2023, our effective tax rate differs from the U.S. statutory rate of
21
% primarily as a result of certain non-deductible items including foreign exchange losses, offset by tax benefits from internal restructuring transactions in the first quarter of 2023. In all periods, we recorded tax expense relative to pre-tax earnings in jurisdictions without valuation allowances, including our former
17
% noncontrolling interest in SciPlay.
25
(15) Leases
Our total operating lease expense for the three and nine months ended September 30, 2023 was $
6
million and $
17
million, respectively, and $
6
million and $
16
million for the three and nine months ended September 30, 2022, respectively. The total amount of variable and short-term lease payments was immaterial for all periods presented.
Supplemental balance sheet and cash flow information related to operating leases is as follows:
| As of | |||||||||||
| September 30, 2023 | December 31, 2022 | ||||||||||
| Operating lease right-of-use assets | $ |
|
$ |
|
|||||||
| Accrued liabilities |
|
|
|||||||||
| Operating lease liabilities |
|
|
|||||||||
| Total operating lease liabilities | $ |
|
$ |
|
|||||||
| Weighted average remaining lease term, units in years |
|
|
|||||||||
| Weighted average discount rate |
|
% |
|
% | |||||||
| Nine Months Ended September 30, | |||||||||||
| 2023 | 2022 | ||||||||||
| Cash paid for amounts included in the measurement of lease liabilities: | |||||||||||
|
Operating cash flows for operating leases
|
$ |
|
$ |
|
|||||||
| Right-of-use assets obtained in exchange for new lease liabilities: | |||||||||||
|
Operating leases
|
$ |
|
$ |
|
|||||||
Lease liability maturities:
| Remainder of 2023 | 2024 | 2025 | 2026 | 2027 | Thereafter | Less Imputed Interest | Total | ||||||||||||||||||||||||||||||||||||||||
| Operating leases | $ |
|
$ |
|
$ |
|
$ |
|
$ |
|
$ |
|
$ |
(
|
$ |
|
|||||||||||||||||||||||||||||||
As of September 30, 2023, we did not have material additional operating leases that have not yet commenced.
(16) Litigation
We are involved in various legal proceedings, which are described below.
We record an accrual for legal contingencies when it is both probable that a liability has been incurred and the amount or range of the loss can be reasonably estimated (although, as discussed below, there may be an exposure to loss in excess of the accrued liability). We evaluate our accruals for legal contingencies at least quarterly and, as appropriate, establish new accruals or adjust existing accruals to reflect (1) the facts and circumstances known to us at the time, including information regarding negotiations, settlements, rulings and other relevant events and developments, (2) the advice and analyses of counsel and (3) the assumptions and judgment of management. Legal costs associated with our legal proceedings are expensed as incurred. We had accrued liabilities of $
11
million for all of our legal matters that were contingencies as of September 30, 2023 and December 31, 2022.
Substantially all of our legal contingencies are subject to significant uncertainties and, therefore, determining the likelihood of a loss and/or the measurement of any loss involves a series of complex judgments about future events. Consequently, the ultimate outcomes of our legal contingencies could result in losses in excess of amounts we have accrued. We may be unable to estimate a range of possible losses for some matters pending against us or our subsidiaries, even when the amount of damages claimed against us or our subsidiaries is stated because, among other things: (1) the claimed amount may be exaggerated or unsupported; (2) the claim may be based on a novel legal theory or involve a large number of parties; (3) there may be uncertainty as to the likelihood of a class being certified or the ultimate size of the class; (4) there may be uncertainty as to the outcome of pending appeals or motions; (5) the matter may not have progressed sufficiently through discovery or there may be significant factual or legal issues to be resolved or developed; and/or (6) there may be uncertainty as to the enforceability of legal judgments and outcomes in certain jurisdictions. Other matters have progressed sufficiently that we are able to estimate a range of possible loss. For those legal contingencies disclosed herein as well as those related to the previously disclosed settlement agreement entered into in February 2015 with SNAI S.p.a., as to which a loss is reasonably possible, whether in excess of a related accrued liability or where there is no accrued liability, and for which we are able to estimate a
26
range of possible loss, the current estimated range is up to approximately $
13
million in excess of the accrued liabilities (if any) related to those legal contingencies. This aggregate range represents management’s estimate of additional possible loss in excess of the accrued liabilities (if any) with respect to these matters based on currently available information, including any damages claimed by the plaintiffs, and is subject to significant judgment and a variety of assumptions and inherent uncertainties. For example, at the time of making an estimate, management may have only preliminary, incomplete, or inaccurate information about the facts underlying a claim; its assumptions about the future rulings of the court or other tribunal on significant issues, or the behavior and incentives of adverse parties, regulators, indemnitors or co‑defendants, may prove to be wrong; and the outcomes it is attempting to predict are often not amenable to the use of statistical or other quantitative analytical tools. In addition, from time to time an outcome may occur that management had not accounted for in its estimate because it had considered that outcome to be remote. Furthermore, as noted above, the aggregate range does not include any matters for which we are not able to estimate a range of possible loss. Accordingly, the estimated aggregate range of possible loss does not represent our maximum loss exposure. Any such losses could have a material adverse impact on our results of operations, cash flows or financial condition. The legal proceedings underlying the estimated range will change from time to time, and actual results may vary significantly from the current estimate.
Colombia Litigation
Our subsidiary, LNWI, owned a minority interest in Wintech de Colombia S.A., or Wintech (now liquidated), which formerly operated the Colombian national lottery under a contract with Empresa Colombiana de Recursos para la Salud, S.A. (together with its successors, “Ecosalud”), an agency of the Colombian government. The contract provided for a penalty against Wintech, LNWI and the other shareholders of Wintech of up to $
5.0
million if certain levels of lottery sales were not achieved. In addition, LNWI delivered to Ecosalud a $
4.0
million surety bond as a further guarantee of performance under the contract. Wintech started the instant lottery in Colombia but, due to difficulties beyond its control, including, among other factors, social and political unrest in Colombia, frequently interrupted telephone service and power outages, and competition from another lottery being operated in a province of Colombia that we believe was in violation of Wintech’s exclusive license from Ecosalud, the projected sales level was not met for the year ended June 30, 1993.
In 1993, Ecosalud issued a resolution declaring that the contract was in default. In 1994, Ecosalud issued a liquidation resolution asserting claims for compensation and damages against Wintech, LNWI and other shareholders of Wintech for, among other things, realization of the full amount of the penalty, plus interest, and the amount of the bond. LNWI filed separate actions opposing each resolution with the Tribunal Contencioso of Cundinamarca in Colombia (the “Tribunal”), which upheld both resolutions. LNWI appealed each decision to the Council of State. In May 2012, the Council of State upheld the contract default resolution, which decision was notified to us in August 2012. In October 2013, the Council of State upheld the liquidation resolution, which decision was notified to us in December 2013.
In July 1996, Ecosalud filed a lawsuit against LNWI in the U.S. District Court for the Northern District of Georgia asserting many of the same claims asserted in the Colombia proceedings, including breach of contract, and seeking damages. In March 1997, the District Court dismissed Ecosalud’s claims. Ecosalud appealed the decision to the U.S. Court of Appeals for the Eleventh Circuit. The Court of Appeals affirmed the District Court’s decision in 1998.
In June 1999, Ecosalud filed a collection proceeding against LNWI to enforce the liquidation resolution and recover the claimed damages. In May 2013, the Tribunal denied LNWI’s merit defenses to the collection proceeding and issued an order of payment of approximately
90
billion Colombian pesos, or approximately $
30
million, plus default interest (potentially accrued since 1994 at a 12% statutory interest rate). LNWI filed an appeal to the Council of State, and on December 10, 2020, the Council of State issued a ruling affirming the Tribunal’s decision. On December 16, 2020, LNWI filed a motion for clarification of the Council of State’s ruling, which was denied on April 15, 2021. On April 22, 2021, LNWI filed a motion for reconsideration relating to that decision, which the Council of State denied on February 21, 2022. On May 24, 2022, the case was transferred from the Council of State to the Tribunal for further proceedings. On August 18, 2022, LNWI filed a constitutional challenge to the Council of State’s December 10, 2020 decision with that court, which was denied on October 7, 2022. On December 7, 2022, LNWI filed an appeal with the Council of State from the denial of the constitutional challenge, which was denied on May 24, 2023. On June 28, 2023, the Columbian Constitutional Court received the record of the constitutional appeal for further consideration, and on September 26, 2023, that court selected LNWI’s constitutional appeal for further consideration.
LNWI believes it has various defenses, including on the merits, against Ecosalud’s claims. Although we believe these claims will not result in a material adverse effect on our consolidated results of operations, cash flows or financial position, it is not feasible to predict the final outcome, and we cannot assure that these claims will not ultimately be resolved adversely to us or result in material liability.
27
TCS John Huxley Matter
On March 15, 2019, TCS John Huxley America, Inc., TCS John Huxley Europe Ltd., TCS John Huxley Asia Ltd., and Taiwan Fulgent Enterprise Co., Ltd. brought a civil action in the United States District Court for the Northern District of Illinois against L&W, Bally Technologies, Inc. and LNW Gaming, Inc., f/k/a Bally Gaming, Inc. In the complaint, the plaintiffs assert federal antitrust claims arising from the defendants’ procurement of particular U.S. and South African patents. The plaintiffs allege that the defendants used those patents to create an allegedly illegal monopoly in the market for automatic card shufflers sold to regulated casinos in the United States. On April 10, 2019, the defendants filed a motion to dismiss the plaintiffs’ complaint with prejudice. On April 25, 2019, the district court denied the defendants’ motion to dismiss without prejudice pursuant to the court’s local rules, after the plaintiffs advised that they intended to file an amended complaint. The plaintiffs filed their amended complaint on May 3, 2019, and on May 22, 2019, the defendants filed a motion to dismiss the plaintiffs’ amended complaint with prejudice. On March 20, 2020, the district court denied the defendants’ motion to dismiss the plaintiffs’ amended complaint, and defendants filed an answer to the plaintiffs’ amended complaint on June 19, 2020. On June 3, 2020, the trial court granted the defendants’ request to bifurcate proceedings in the case, with discovery to occur first into the statute of limitations and release defenses asserted by the defendants in their motion to dismiss, before proceeding into broader discovery. The trial court set a September 18, 2020, deadline for the parties to complete discovery relating to the statute of limitations and release defenses. On October 28, 2020, the court issued an order extending until January 15, 2021 the deadline for the parties to complete discovery relating to the statute of limitations defense. On February 9, 2021, the defendants filed a motion for summary judgment on their statute of limitations defense, addressing whether plaintiffs had actual knowledge of their claims prior to the start of the limitations period. The district court denied that motion for summary judgment on September 20, 2021. On January 13, 2023, the district court entered an order requiring, among other things, that the plaintiffs make a formal written settlement demand by January 20, 2023, that the defendants respond to that demand in writing by January 27, 2023, and that the parties file a status report by January 31, 2023 confirming that they have complied with the district court’s order. On January 31, 2023, the parties filed a joint status report confirming that they have complied with the district court’s order to make and respond to a formal written demand. Discovery closed on June 1, 2023. On June 30, 2023, the defendants filed a motion for summary judgment, which is pending. We are unable at this time to estimate a range of reasonably possible losses above the amount we have accrued for this matter due to the complexity of the plaintiffs’ claims, and the unpredictability of the outcome of the proceedings in the district court, and on any appeal therefrom.
Tonkawa Tribe Matter
On September 3, 2020, the Tonkawa Tribe of Indians of Oklahoma d/b/a Tonkawa Enterprises filed a putative class action complaint in the United States District Court for the District of Nevada against L&W, Bally Technologies, Inc. and LNW Gaming, Inc., f/k/a Bally Gaming, Inc. On October 5, 2020, the plaintiff filed a first amended complaint to add Cow Creek Band of Umpqua Tribe of Indians and the Umpqua Indian Development Corp., d/b/a Seven Feathers Casino as a plaintiff. On October 26, 2020, the plaintiffs filed a second amended complaint. In the complaint, the plaintiffs assert federal antitrust claims arising from the defendants’ procurement of particular U.S. patents. The plaintiffs allege that the defendants used those patents to create an allegedly illegal monopoly in the market for card shufflers sold or leased to regulated casinos in the United States. The plaintiffs seek to represent a putative class of all regulated United States casinos directly leasing or purchasing card shufflers from the defendants on or after April 1, 2009. The complaint seeks unspecified money damages, the award of plaintiff’s costs of suit, including reasonable attorneys’ fees and expert fees, and the award of pre-judgment and post-judgment interest. On November 19, 2020, the defendants filed a motion to dismiss plaintiffs’ second amended complaint or, in the alternative, to compel arbitration of plaintiffs’ claims. On November 20, 2020, Plaintiffs filed a motion for partial summary judgment, seeking a finding that defendants are collaterally estopped from re-litigating issues litigated in the 2018 litigation versus Shuffle Tech International Corp., Aces Up Gaming, and Poydras-Talrick Holdings. On August 27, 2021, the Nevada district court entered an order transferring the lawsuit to the United States District Court for the Northern District of Illinois. On May 19, 2022, the Illinois district court granted defendants’ motion to compel arbitration of plaintiffs’ individual claims; stayed all proceedings in the lawsuit pending resolution of the arbitral process; and accordingly dismissed all pending motions without prejudice as moot. We are currently unable to determine the likelihood of an outcome or estimate a range of reasonably possible losses, if any. We believe that the claims in the lawsuit are without merit, and intend to vigorously defend against them.
Giuliano and Rancho’s Club Casino Matter
On September 4, 2020, Alfred T. Giuliano, as liquidation trustee for RIH Acquisition NJ, LLC d/b/a The Atlantic Club Casino Hotel filed a putative class action complaint in the United States District Court for the Northern District of Illinois against L&W, Bally Technologies, Inc. and LNW Gaming, Inc., f/k/a Bally Gaming, Inc. In the complaint, the plaintiffs assert federal antitrust claims arising from the defendants’ procurement of particular U.S. patents. The plaintiffs allege that the defendants used those patents to create an allegedly illegal monopoly in the market for automatic card shufflers sold or leased in the United States. The plaintiffs seek to represent a putative class of all persons and entities that directly purchased or leased automatic card shufflers within the United States from the Defendants, or any predecessor, subsidiary, or affiliate thereof, at any
28
time between April 1, 2009, and the present. The complaint seeks unspecified money damages, which the complaint asks the court to treble, the award of plaintiff’s costs of suit, including attorneys’ fees, and the award of pre-judgment and post-judgment interest. On September 8, 2020, Rancho’s Club Casino, Inc., d/b/a Magnolia House Casino filed a putative class action complaint in the United States District Court for the Northern District of Illinois against L&W, Bally Technologies, Inc. and LNW Gaming, Inc., f/k/a Bally Gaming, Inc. In the complaint, the plaintiff asserts federal antitrust claims arising from the defendants’ procurement of particular U.S. patents. The plaintiff alleges that the defendants used those patents to create an allegedly illegal monopoly in the market for automatic card shufflers sold or leased in the United States. The plaintiff seeks to represent a putative class of all persons and entities that directly purchased or leased automatic card shufflers within the United States from the defendants, or any predecessor, subsidiary, or affiliate thereof, at any time between April 1, 2009, and the present. The complaint seeks unspecified money damages, which the complaint asks the court to treble, the award of plaintiff’s costs of suit, including attorneys’ fees, and the award of pre-judgment and post-judgment interest.
On October 29, 2020, the trial court consolidated the Giuliano and Rancho’s Club Casino matters. On October 30, 2020, the plaintiffs in the consolidated action filed a first amended consolidated complaint. On November 9, 2020, the defendants filed a motion to dismiss the plaintiffs’ first amended consolidated complaint, and also filed a motion to compel arbitration of plaintiff Alfred T. Giuliano’s individual claims. On May 19, 2022, the Illinois district court granted defendants’ motion to compel arbitration; stayed all proceedings in the lawsuit pending resolution of the arbitral process; and accordingly dismissed all pending motions without prejudice. On May 31, 2022, defendants filed a motion to lift the stay of the lawsuit for the limited purpose of amending the court’s May 19, 2022 order to confirm that plaintiff Alfred T. Giuliano must proceed to arbitration on an individual basis rather than a class-wide basis. On June 10, 2022, plaintiff Alfred T. Giuliano filed a notice of voluntary dismissal without prejudice, and the court therefore denied as moot defendants’ motion to lift the stay in an order entered on March 28, 2023. We are currently unable to determine the likelihood of an outcome or estimate a range of reasonably possible losses, if any. We believe that the claims in the consolidated lawsuit are without merit, and intend to vigorously defend against them.
In re Automatic Card Shufflers Litigation Matter
On April 2, 2021, Casino Queen, Inc. and Casino Queen Marquette, Inc. filed a putative class action complaint in the United States District Court for the Northern District of Illinois against L&W, Bally Technologies, Inc. and LNW Gaming, Inc., f/k/a Bally Gaming, Inc. In the complaint, the plaintiffs assert federal antitrust claims arising from the defendants’ procurement of particular U.S. patents. The plaintiffs allege that the defendants used those patents to create an allegedly illegal monopoly in the market for automatic card shufflers sold or leased in the United States. The plaintiffs seek to represent a putative class of all persons and entities that directly purchased or leased automatic card shufflers within the United States from the defendants, or any predecessor, subsidiary, or affiliate thereof, at any time between April 1, 2009, and the present. The complaint seeks unspecified money damages, which the complaint asks the court to treble, the award of plaintiffs’ costs of suit, including attorneys’ fees, and the award of pre-judgment and post-judgment interest. On June 11, 2021, the defendants filed a motion to dismiss plaintiffs’ complaint, which the court denied on May 19, 2022. We are currently unable to determine the likelihood of an outcome or estimate a range of reasonably possible losses, if any. We believe that the claims in the lawsuit are without merit, and intend to vigorously defend against them.
Mohawk Gaming Enterprises Matter
On November 9, 2020, Mohawk Gaming Enterprises LLC, d/b/a Akwesasne Mohawk Casino Resort, filed a demand for a putative class arbitration before the American Arbitration Association against L&W, Bally Technologies, Inc. and LNW Gaming, Inc., f/k/a Bally Gaming, Inc. (“Respondents”). In the complaint, the claimant asserts federal antitrust claims arising from the respondents’ procurement of particular U.S. patents. The claimant alleges that the respondents used those patents to create an allegedly illegal monopoly in the market for automatic card shufflers sold or leased in the United States. The claimant seeks to represent a putative class of all persons and entities that directly purchased or leased automatic card shufflers within the United States from the respondents, or any predecessor, subsidiary, or affiliate thereof, at any time between April 1, 2009, and the present. The complaint seeks unspecified money damages, which the complaint asks the arbitration panel to treble, and the award of claimant’s costs of suit, including attorneys’ fees. Respondents filed their answering statement on December 9, 2020. On October 29, 2021, the claimant filed a memorandum in support of class arbitration, which Respondents opposed on December 3, 2021. On February 8, 2022, the Arbitrator issued a clause construction award, finding that the arbitration could proceed on behalf of a class or classes. On February 11, 2022, Respondents filed a petition to vacate the award in the New York Supreme Court. The Court denied Respondents’ petition on August 9, 2022, and on August 16, 2022, Respondents appealed to the New York Appellate Division, First Department, which denied Respondents’ appeal on June 22, 2023. On April 15, 2022, Respondents filed a motion to dismiss the claimant’s complaint, which the Arbitrator denied on July 26, 2022. We are currently unable to determine the likelihood of an outcome or estimate a range of reasonably possible losses, if any. We believe that the claims in the arbitration demand are without merit, and intend to vigorously defend against them.
29
Boorn Matter
On September 15, 2022, plaintiff Hannelore Boorn filed a putative class action against L&W, SciPlay Corporation, and Appchi Media Ltd. in the Fayette Circuit Court of the Commonwealth of Kentucky. In her complaint, plaintiff seeks to represent a putative class of all persons in Kentucky who, within the past five years, purchased and allegedly lost $5.00 or more worth of chips, in a 24-hour period, playing SciPlay’s online social casino games. The complaint asserts claims for alleged violations of Kentucky’s “recovery of gambling losses” statute and for unjust enrichment, and seeks unspecified money damages, the award of reasonable attorneys’ fees and costs, pre- and post-judgment interest, and injunctive and/or other declaratory relief. On October 18, 2022, defendants removed the action to the United States District Court for the Eastern District of Kentucky. On October 26, 2022, the plaintiff filed a notice voluntarily dismissing the lawsuit without prejudice. On October 27, 2022, the district court entered an order dismissing the lawsuit. On November 17, 2022, the plaintiff filed an arbitration demand against defendants before the American Arbitration Association, pursuant to which she seeks declaratory judgments that (1) SciPlay’s online social casino games constitute gambling under Kentucky law, and (2) SciPlay’s terms of service are void under Kentucky law. On January 12, 2023, the respondents filed their answering statement to plaintiff’s arbitration demand. We are currently unable to determine the likelihood of an outcome or estimate a range of reasonably possible losses, if any. We believe that the claims in the arbitration demand are without merit, and intend to vigorously defend against them.
Allah Beautiful Matter
On December 19, 2022, claimant Prince Imanifest Allah Beautiful filed an arbitration demand against respondent SciPlay Corporation before the American Arbitration Association. The complaint asserts claims for alleged violations of New Jersey’s anti-gambling statutes and seeks unspecified money damages, including recovery of monies allegedly lost by New Jersey players of SciPlay’s online social casino games other than the claimant. On March 7, 2023, the respondent filed its answering statement to claimant’s arbitration demand. We are currently unable to determine the likelihood of an outcome or estimate a range of reasonably possible losses, if any. We believe that the claims in the arbitration demand are without merit, and intend to vigorously defend against them.
Sprinkle Matter
On December 12, 2022, claimant Matthew Sprinkle filed an arbitration demand against respondent SciPlay Corporation before the American Arbitration Association. The complaint asserts claims for alleged violations of Ohio’s anti-gambling statutes and seeks unspecified money damages, including recovery of monies allegedly lost by Ohio players of SciPlay’s online social casino games other than the claimant. On March 7, 2023, the respondent filed its answering statement to claimant’s arbitration demand. We are currently unable to determine the likelihood of an outcome or estimate a range of reasonably possible losses, if any. We believe that the claims in the arbitration demand are without merit, and intend to vigorously defend against them.
Sornberger Matter
On March 8, 2023, plaintiff Andrea Sornberger filed a complaint against SciPlay Corporation and SciPlay Games, LLC in the Circuit Court of the Franklin County, Alabama. The complaint asserts claims for alleged violations of Alabama anti-gambling statutes and seeks unspecified money damages, including recovery of monies allegedly lost by Alabama players of SciPlay’s online social casino games other than the plaintiff, the award of interests and costs, and injunctive and other relief. On April 12, 2023, defendants removed the action to the United States District Court for the Northern District of Alabama. On August 24, 2023, plaintiff voluntarily dismissed her complaint without prejudice, and re-filed it in the Circuit Court of Franklin County, Alabama. On September 27, 2023, defendants removed the re-filed action to the United States District Court for the Northern District of Alabama. We are currently unable to determine the likelihood of an outcome or estimate a range of reasonably possible losses, if any. We believe that the claims in the lawsuit are without merit, and intend to vigorously defend against them.
Roberts Matter
On July 25, 2023, claimant Donovan Roberts filed an arbitration demand against respondent SciPlay Corporation before the American Arbitration Association. The complaint asserts claims for alleged violations of Kentucky’s anti-gambling statutes and seeks unspecified money damages, including recovery of monies allegedly lost by Kentucky players of SciPlay’s online social casino games other than the claimant. On October 6, 2023, the respondent filed its answering statement to claimant’s arbitration demand. We are currently unable to determine the likelihood of an outcome or estimate a range of reasonably possible losses, if any. We believe that the claims in the arbitration demand are without merit, and intend to vigorously defend against them.
30
Ebersole Matter
On July 25, 2023, claimant Christopher Ebersole filed an arbitration demand against respondent SciPlay Corporation before the American Arbitration Association. The complaint asserts claims for alleged violations of Ohio’s anti-gambling statutes and seeks unspecified money damages, including recovery of monies allegedly lost by Ohio players of SciPlay’s online social casino games other than the claimant. On October 12, 2023, the respondent filed its answering statement to claimant’s arbitration demand. We are currently unable to determine the likelihood of an outcome or estimate a range of reasonably possible losses, if any. We believe that the claims in the arbitration demand are without merit, and intend to vigorously defend against them.
Murnaghan Matter
On July 25, 2023, claimant Hope Murnaghan filed an arbitration demand against respondent SciPlay Corporation before the American Arbitration Association. The complaint asserts claims for alleged violations of Massachusetts’ anti-gambling statutes and seeks unspecified money damages, including recovery of monies allegedly lost by Massachusetts players of SciPlay’s online social casino games other than the claimant. On October 12, 2023, the respondent filed its answering statement to claimant’s arbitration demand. We are currently unable to determine the likelihood of an outcome or estimate a range of reasonably possible losses, if any. We believe that the claims in the arbitration demand are without merit, and intend to vigorously defend against them.
31
Item 2. MANAGEMENT’S DISCUSSION AND ANALYSIS OF FINANCIAL CONDITION AND RESULTS OF OPERATIONS
The following discussion is intended to enhance the reader’s understanding of our operations and current business environment from management’s perspective and should be read in conjunction with the description of our business included under
Part I, Item 1
“Condensed Consolidated Financial Statements” and
Part II, Item 1A
“Risk Factors” in this Quarterly Report on Form 10-Q and under
Part I, Item 1
“Business,”
Item 1A
“Risk Factors” and
Part II, Item 7
“Management’s Discussion and Analysis of Financial Condition and Results of Operations” included in our 2022 10-K.
This “Management’s Discussion and Analysis of Financial Condition and Results of Operations” (“MD&A”) contains forward-looking statements within the meaning of the Private Securities Litigation Reform Act of 1995 and should be read in conjunction with the disclosures and information contained and referenced under “Forward-Looking Statements” and “Risk Factors” included in this Quarterly Report on Form 10-Q and “Risk Factors” included in our 2022 10-K. As used in this MD&A, the terms “we,” “us,” “our” and the “Company” mean L&W together with its consolidated subsidiaries.
BUSINESS OVERVIEW
We are a leading cross-platform global games company with a focus on content and digital markets. Our portfolio of revenue-generating activities primarily includes supplying game content and gaming machines, CMSs and table game products and services to licensed gaming entities; providing social casino and other mobile games, including casual gaming, to retail customers; and providing a comprehensive suite of digital gaming content, distribution platforms, player account management systems, as well as various other iGaming content and services.
As more fully described in
Part I, Item 1
“Business” in our 2022 10-K, we are executing on our s
trategy to become a leading cross-platform global games company with a focus on content and digital markets.
We report our results of operations in three business segments—Gaming, SciPlay and iGaming—representing our different products and services. See “Business Segments Results” below and Note 4 for additional business segment information.
Our operating results have substantially recovered from the impacts of the COVID-19 pandemic in 2020 and 2021; however, lingering impacts on supply chains in numerous industries have caused shortages of inputs/outputs, which in turn put inflationary pressures on the economy as a whole. Inflationary pressures may have an impact on discretionary income as people allocate more of their disposable income toward higher priced necessity goods and services, which could impact our customers. These circumstances may change in the future and such changes could be material.
In addition to our existing primary Nasdaq listing, our common stock is listed as CDIs on the ASX and commenced active trading on May 22, 2023 (AEST) under the ticker symbol “LNW.” We believe this secondary listing is creating substantial benefits for L&W and its shareholders, including enhancing the Company’s profile in Australia, one of the leading markets for the L&W’s Gaming business, and providing the Company access to new long-term Australian institutional investors that complement our strong existing base of shareholders.
We completed the third quarter of 2023 maintaining strong momentum and delivered a 10
th
consecutive quarter of consolidated revenue growth and fifth consecutive quarter of double-digit growth year-over-year, continuing advancement on our strategic plan and toward our long-term financial targets. Consolidated revenue growth was driven by double-digit growth across all of our businesses, including a fifth consecutive quarter of record revenues for SciPlay, and iGaming revenue held at a quarterly record level. We have returned $112 million of capital to shareholders through the repurchase of 1.5 million shares of common stock during the three months ended September 30, 2023, and since the initiation of the share repurchase program, we have returned a total of $550 million of capital to shareholders by repurchasing 9.1 million shares of common stock, or 73% of total program authorization.
As described in Note 1, on October 23, 2023, we acquired the remaining approximately 17% equity interest in SciPlay not already owned by us pursuant to the SciPlay Merger in an all-cash transaction for $496 million, excluding transaction fees and expenses. As a result of the SciPlay Merger, SciPlay ceased to be publicly traded and became a wholly owned subsidiary of L&W. We believe that this transaction will enable seamless collaboration with SciPlay that will add further momentum to our already robust cross-platform strategy, provide flexibility for use of SciPlay cash flows for investments across the enterprise, and facilitate long-term margin enhancement opportunities via synergies, all of which are expected to increase long-term shareholder value.
We have a significant portion of SciPlay personnel located in Tel Aviv, Israel. In light of current circumstances in Israel, we are actively monitoring developments and are ready to redirect resources as needed to minimize impact on SciPlay operations. We do not have servers or infrastructure that are located in Israel that host our games. While we have not yet seen an impact on our business from current events, they could negatively affect the performance of the personnel in that area and
32
have an adverse impact on our business if these events continue and/or escalate. Refer to “Risk Factors” under
Part II, Item 1A
in this Quarterly Report on Form 10-Q for more information.
CONSOLIDATED RESULTS
|
Three Months Ended
September 30, |
Variance
|
Nine Months Ended
September 30, |
Variance
|
||||||||||||||||||||||||||||||||||||||||||||
| ($ in millions) | 2023 |
|
2022 | 2023 vs. 2022 | 2023 | 2022 | 2023 vs. 2022 | ||||||||||||||||||||||||||||||||||||||||
|
Total revenue
|
$ | 731 | $ | 648 | $ | 83 | 13 | % | $ | 2,131 | $ | 1,830 | $ | 301 | 16 | % | |||||||||||||||||||||||||||||||
| Total operating expenses | 584 | 559 | 25 | 4 | % | 1,769 | 1,655 | 114 | 7 | % | |||||||||||||||||||||||||||||||||||||
| Operating income | 147 | 89 | 58 | 65 | % | 362 | 175 | 187 | 107 | % | |||||||||||||||||||||||||||||||||||||
| Net income (loss) from continuing operations before income taxes | 94 | 24 | 70 | 292 | % | 139 | (189) | 328 | 174 | % | |||||||||||||||||||||||||||||||||||||
| Net income (loss) from continuing operations | 80 | 20 | 60 | 300 | % | 112 | (197) | 309 | 157 | % | |||||||||||||||||||||||||||||||||||||
|
Net income from discontinued operations, net of tax
(1)
|
— | 315 | (315) | nm | — | 3,855 | (3,855) | nm | |||||||||||||||||||||||||||||||||||||||
| Net income attributable to L&W | 75 | 328 | (253) | nm | 96 | 3,645 | (3,549) | nm | |||||||||||||||||||||||||||||||||||||||
| nm = not meaningful. | |||||||||||||||||||||||||||||||||||||||||||||||
|
(1) The three months ended September 30, 2022 include a pre-tax gain of $362 million on the sale of the Sports Betting Business, and the nine months ended September 30, 2022 include a total pre-tax gain of $4,930 million on the Divestitures (see Note 2).
|
|||||||||||||||||||||||||||||||||||||||||||||||
Revenue
| Consolidated Revenue by Business Segment | ||||||||
| (in millions) | ||||||||
|
Three Months Ended September 30, 2023 and 2022
|
Nine Months Ended September 30, 2023 and 2022
|
|||||||
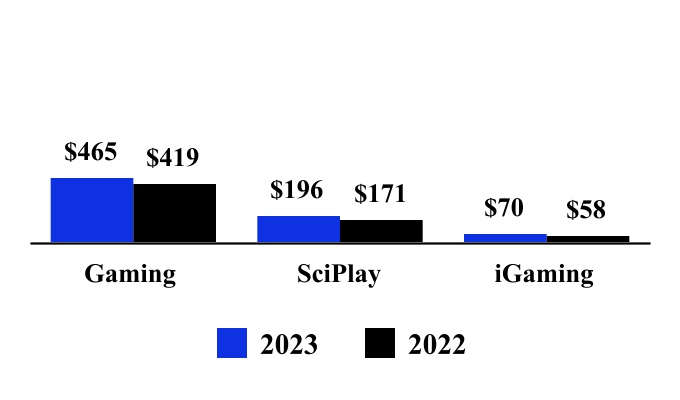
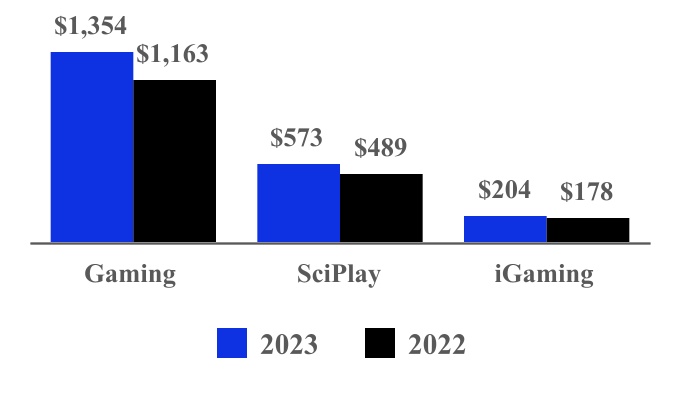
Gaming revenue growth of 11% and 16% for the three and nine months ended September 30, 2023, respectively, was primarily driven by continued momentum in global Gaming machine sales, coupled with stronger performance in our U.S. and Canada premium install base, and increased demand for Table products and Systems.
SciPlay revenue increased 15% and 17% for the three and nine months ended September 30, 2023, respectively. Average revenue per daily active user grew 20% and 22% for the three and nine months ended September 30, 2023, respectively, reaching a new record high of $0.96 for the three months ended September 30, 2023. Social casino payer engagement and average monthly paying users also increased for both periods.
The increases in iGaming revenue of 21% and 15% for the three and nine months ended September 30, 2023, respectively, were driven by growth both in the U.S. and international markets from the strength of our original content and benefited from $3 million and $5 million, respectively, in certain termination fees. In October 2023, we launched our live casino operations in Michigan, reaching a strategic market expansion milestone for our iGaming business.
33
Operating Expenses
|
Three Months Ended
September 30, |
Variance
|
Nine Months Ended
September 30, |
Variance
|
||||||||||||||||||||||||||||||||||||||||||||
| ($ in millions) | 2023 |
|
2022 | 2023 vs. 2022 | 2023 |
|
2022 | 2023 vs. 2022 | |||||||||||||||||||||||||||||||||||||||
| Operating expenses: | |||||||||||||||||||||||||||||||||||||||||||||||
| Cost of services | $ | 113 | $ | 101 | $ | 12 | 12 | % | $ | 331 | $ | 283 | $ | 48 | 17 | % | |||||||||||||||||||||||||||||||
| Cost of products | 105 | 92 | 13 | 14 | % | 307 | 251 | 56 | 22 | % | |||||||||||||||||||||||||||||||||||||
| Selling, general and administrative | 204 | 181 | 23 | 13 | % | 599 | 535 | 64 | 12 | % | |||||||||||||||||||||||||||||||||||||
| Research and development | 55 | 56 | (1) | (2) | % | 168 | 163 | 5 | 3 | % | |||||||||||||||||||||||||||||||||||||
| Depreciation, amortization and impairments | 90 | 102 | (12) | (12) | % | 298 | 317 | (19) | (6) | % | |||||||||||||||||||||||||||||||||||||
| Restructuring and other | 17 | 27 | (10) | (37) | % | 66 | 106 | (40) | (38) | % | |||||||||||||||||||||||||||||||||||||
|
Total operating expenses
|
$ | 584 | $ | 559 | $ | 25 | 4 | % | $ | 1,769 | $ | 1,655 | $ | 114 | 7 | % | |||||||||||||||||||||||||||||||
Cost of Revenue
Total cost of revenue for the three and nine months ended September 30, 2023 increased as a direct result of higher revenue as described above, driven by $13 million and $56 million, respectively, in higher cost of product revenue primarily associated with higher gaming machine sales. In addition, we recognized $8 million and $27 million for the three and nine months ended September 30, 2023, respectively, in higher cost of services for our SciPlay business segment correlated with revenue growth.
SG&A
SG&A increased for the three and nine months ended September 30, 2023 as compared to the prior year periods, primarily due to higher stock-based compensation expense of $17 million and $38 million, respectively, higher legal expenses of $3 million and $12 million, respectively, and higher salaries and benefits of $2 million and $5 million, respectively.
R&D
R&D remained relatively flat for the three months ended September 30, 2023, and the slight increase for the nine months ended September 30, 2023 was due to higher salaries and benefits in our SciPlay segment.
D&A
D&A decreased for the three and nine months ended September 30, 2023, primarily due to fully depreciated assets and amortization of intangible assets related to past acquisitions associated with our Gaming and iGaming segments. The decrease in the nine months ended September 30, 2023 was partially offset by an impairment charge of $5 million related to SciPlay restructuring of a certain foreign studio.
Restructuring and Other
The decrease in restructuring and other for the three and nine months ended September 30, 2023, as compared to the prior year periods, was primarily due to lower professional services, legal and other costs related to the strategic review and related transactions (see Note 5). The three and nine months ended September 30, 2023 included $3 million in costs associated with the SciPlay Merger, the nine months ended September 30, 2023 included $7 million in professional services associated with the ASX listing, and the nine months ended September 30, 2023 and 2022 included contingent consideration remeasurement charges of $10 million and $12 million, respectively.
34
Other Factors Affecting Net Income Attributable to L&W
| Three Months Ended September 30, | Nine Months Ended September 30, | Factors Affecting Net Income Attributable to L&W | |||||||||||||||||||||||||||
| (in millions) | 2023 | 2022 | 2023 | 2022 | 2023 vs. 2022 | ||||||||||||||||||||||||
| Interest expense | $ | (78) | $ | (68) | $ | (231) | $ | (254) |
The increase in interest expense for the three months ended September 30, 2023 is primarily due to rising interest rates impacting the LNWI Term Loan B. The decrease in interest expense for the nine months ended September 30, 2023 is primarily due to lower outstanding debt resulting from the redemption of certain senior notes and refinancing through the LNWI Credit Agreement completed in the second quarter of 2022.
|
||||||||||||||||||||
| Loss on debt financing transactions | (15) | — | (15) | (147) | Loss on debt financing transactions included charges of $12 million in the third quarter of 2023 and $90 million in the second quarter of 2022 associated with premiums paid to redeem certain senior notes (see Note 11). | ||||||||||||||||||||||||
| Gain on remeasurement of debt and other | — | — | — | 27 | Gains are attributable to remeasurement of previously held Euro-denominated senior notes and reflect changes in the Euro vs. the U.S. Dollar foreign exchange rates. These notes were redeemed during the second quarter of 2022. | ||||||||||||||||||||||||
| Other income, net | 40 | 3 | 23 | 10 | The increase in other income was primarily due to the impact of changes in foreign currency exchange rates. | ||||||||||||||||||||||||
Foreign Currency Exchange (F/X)
Our results are impacted by changes in foreign currency exchange rates used in the translation of foreign functional currencies into USD and the remeasurement of foreign currency transactions or balances. The impact of foreign currency exchange rate fluctuations represents the difference between current rates and prior-period rates applied to current activity. Our exposure to foreign currency volatility on revenue is as follows:
|
Three Months Ended September 30,
|
Nine Months Ended September 30, | ||||||||||||||||||||||||||||||||||||||||||||||
| 2023 | 2022 | 2023 | 2022 | ||||||||||||||||||||||||||||||||||||||||||||
|
($ in millions)
|
Revenue | % Consolidated Revenue | Revenue | % Consolidated Revenue | Revenue | % Consolidated Revenue | Revenue | % Consolidated Revenue | |||||||||||||||||||||||||||||||||||||||
| Foreign Currency: | |||||||||||||||||||||||||||||||||||||||||||||||
| British Pound Sterling | $ | 41 | 6 | % | $ | 34 | 5 | % | $ | 122 | 6 | % | $ | 118 | 6 | % | |||||||||||||||||||||||||||||||
| Euro | 56 | 8 | % | 49 | 8 | % | 169 | 8 | % | 145 | 8 | % | |||||||||||||||||||||||||||||||||||
| Australian Dollar | 54 | 7 | % | 35 | 5 | % | 151 | 7 | % | 72 | 4 | % | |||||||||||||||||||||||||||||||||||
BUSINESS SEGMENTS RESULTS (
for the three and nine months ended September 30, 2023 compared to the three and nine months ended September 30, 2022)
GAMING
Our Gaming business segment designs, develops, manufactures, markets and distributes a comprehensive portfolio of gaming content, products and services. We provide our Gaming portfolio of products and services to commercial casinos, Native American casinos, wide-area gaming operators such as LBOs, arcade and bingo operators in the U.K. and continental Europe, and government agencies and their affiliated operators.
We generate Gaming revenue from both services and products. Our services revenue includes revenue earned from Participation gaming machines, other leased gaming machines (including VLTs and electronic table games), supplied table products and services (including Shufflers), casino management technology solutions and systems, and other services revenues. Our products revenue includes the sale of new and used gaming machines, electronic table games, VLTs and VGTs, casino-management technology solutions and systems, table products, proprietary table game licensing, conversion kits (including game, hardware or operating system conversions) and spare parts.
For additional information, refer to the Gaming primary business activities summary included within “Business Segment Results” under
Item 7
of our 2022 10-K.
35
Current Year Update
We continue to see elevated demand for our Gaming products and services, while Gaming operations and Gaming machine sales have performed above pre-COVID levels. The increase in Gaming revenue for the three and nine months ended September 30, 2023, as compared to the prior year periods, was primarily driven by continued momentum in Gaming machine sales growing 23% and 37%, respectively, coupled with growth in Table products and Systems. Gaming operations also benefited from higher average daily revenue per unit, the continued success of our cabinets and strong game content performance. While demand remains strong, we are actively monitoring any impact of inflationary pressures and macroeconomic uncertainty that may impact our operations. We have experienced and continue to expect some level of supply chain volatility that could impact our ability to meet demand for our products and delay the timing of fulfillment and revenue recognition of orders.
Results of Operations and KPIs
|
Three and Nine Months Ended September 30, 2023 and 2022
|
||
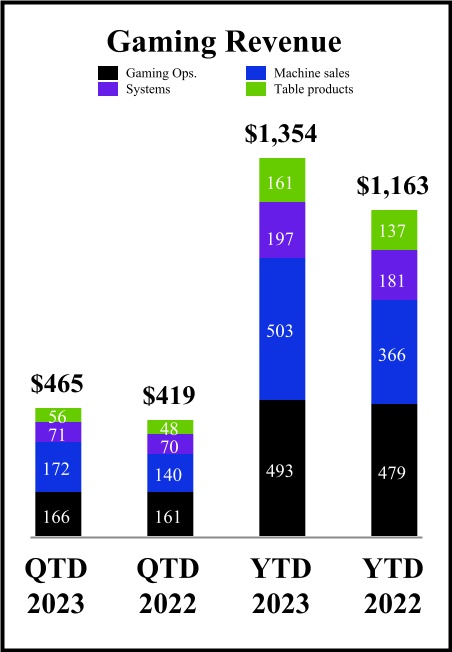
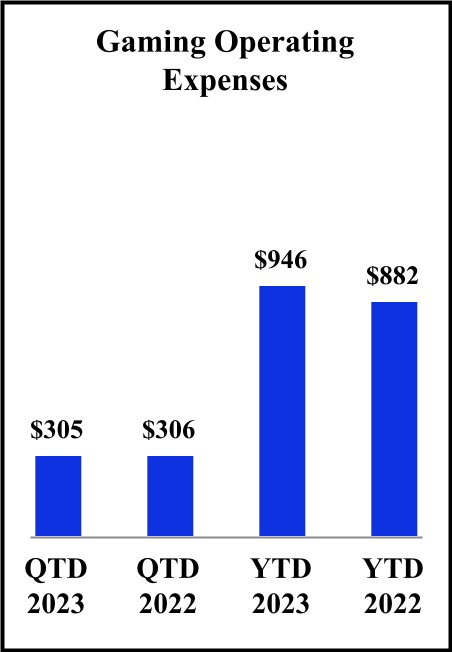
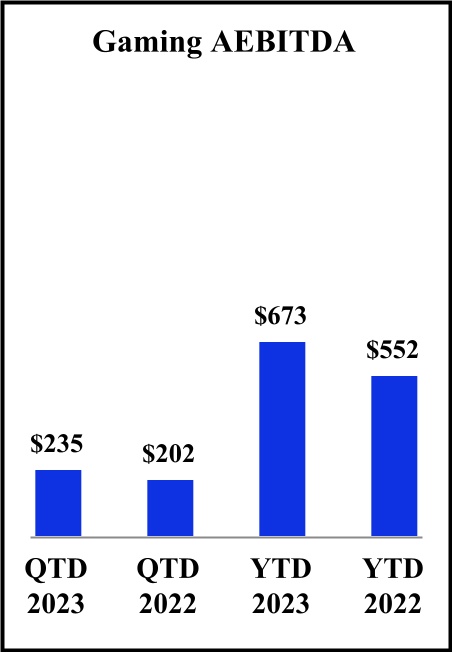
36
|
Three Months Ended
September 30, |
Variance
|
Nine Months Ended
September 30, |
Variance
|
||||||||||||||||||||||||||||||||||||||||||||
| ($ in millions) | 2023 | 2022 | 2023 vs. 2022 | 2023 | 2022 | 2023 vs. 2022 | |||||||||||||||||||||||||||||||||||||||||
| Revenue: | |||||||||||||||||||||||||||||||||||||||||||||||
|
Gaming operations
|
$ | 166 | $ | 161 | $ | 5 | 3 | % | $ | 493 | $ | 479 | $ | 14 | 3 | % | |||||||||||||||||||||||||||||||
|
Machine sales
|
172 | 140 | 32 | 23 | % | 503 | 366 | 137 | 37 | % | |||||||||||||||||||||||||||||||||||||
|
Systems
|
71 | 70 | 1 | 1 | % | 197 | 181 | 16 | 9 | % | |||||||||||||||||||||||||||||||||||||
|
Table products
|
56 | 48 | 8 | 17 | % | 161 | 137 | 24 | 18 | % | |||||||||||||||||||||||||||||||||||||
|
Total revenue
|
$ | 465 | $ | 419 | $ | 46 | 11 | % | $ | 1,354 | $ | 1,163 | $ | 191 | 16 | % | |||||||||||||||||||||||||||||||
|
F/X impact on revenue
|
$ | 2 | $ | (9) | $ | 11 | 122 | % | $ | (4) | $ | (19) | $ | 15 | 79 | % | |||||||||||||||||||||||||||||||
| Gaming KPIs: | |||||||||||||||||||||||||||||||||||||||||||||||
| U.S. and Canada units: | |||||||||||||||||||||||||||||||||||||||||||||||
| Installed base at period end | 31,035 | 30,536 | 499 | 2 | % | 31,035 | 30,536 | 499 | 2 | % | |||||||||||||||||||||||||||||||||||||
| Average daily revenue per unit | $ | 47.57 | $ | 45.68 | $ | 1.89 | 4 | % | $ | 46.80 | $ | 44.99 | $ | 1.81 | 4 | % | |||||||||||||||||||||||||||||||
|
International units
(1)
:
|
|||||||||||||||||||||||||||||||||||||||||||||||
| Installed base at period end | 22,442 | 28,100 | (5,658) | (20) | % | 22,442 | 28,100 | (5,658) | (20) | % | |||||||||||||||||||||||||||||||||||||
| Average daily revenue per unit | $ | 14.01 | $ | 12.39 | $ | 1.62 | 13 | % | $ | 14.87 | $ | 13.25 | $ | 1.62 | 12 | % | |||||||||||||||||||||||||||||||
| Gaming machine unit sales: | |||||||||||||||||||||||||||||||||||||||||||||||
| U.S. and Canada new unit shipments | 4,640 | 4,400 | 240 | 5 | % | 13,717 | 11,791 | 1,926 | 16 | % | |||||||||||||||||||||||||||||||||||||
| International new unit shipments | 4,045 | 2,859 | 1,186 | 41 | % | 11,796 | 7,252 | 4,544 | 63 | % | |||||||||||||||||||||||||||||||||||||
| Total new unit shipments | 8,685 | 7,259 | 1,426 | 20 | % | 25,513 | 19,043 | 6,470 | 34 | % | |||||||||||||||||||||||||||||||||||||
| Average sales price per new unit | $ | 18,104 | $ | 17,359 | $ | 745 | 4 | % | $ | 18,062 | $ | 17,224 | $ | 838 | 5 | % | |||||||||||||||||||||||||||||||
| (1) Units exclude those related to game content licensing. | |||||||||||||||||||||||||||||||||||||||||||||||
Gaming Operations
Gaming operations revenue for both current year periods demonstrated continued momentum driven by strong game performance of hit franchises and premium games. Average daily revenue per unit for U.S. and Canada increased by $1.89 and $1.81 for the three and nine months ended September 30, 2023, respectively, and for International units it increased by $1.62 and $1.62, respectively. Gaming operations for U.S. and Canada had a 499-unit increase in installed base, mainly due to growth in our premium games, partially offset by reductions in our public gaming and leased core products. International ending installed base decreased by 5,658 units primarily due to the expected closure of certain LBOs in the U.K. along with the reduction of certain low-yielding units in Greece and Latin America.
Gaming Machine Sales
Gaming machine sales revenue increased as operator capital spending returned to more normalized levels. The increases for the three and nine months ended September 30, 2023, as compared to prior periods, were due to higher sales of replacement units globally of 1,391 and 4,980, respectively, shipments of additional units into international new opening and
37
expansion markets of 649 and 2,255, respectively, and higher average sales price per new unit mainly due to favorable shifts in product mix. The following table summarizes Gaming machine sales changes:
|
Three Months Ended
September 30, |
Variance
|
Nine Months Ended
September 30, |
Variance
|
||||||||||||||||||||||||||||||||||||||||||||
| 2023 | 2022 | 2023 vs. 2022 | 2023 | 2022 | 2023 vs. 2022 | ||||||||||||||||||||||||||||||||||||||||||
| U.S. and Canada unit shipments: | |||||||||||||||||||||||||||||||||||||||||||||||
| Replacement units | 4,542 | 3,688 | 854 | 23 | % | 12,900 | 10,209 | 2,691 | 26 | % | |||||||||||||||||||||||||||||||||||||
| Casino opening and expansion units | 98 | 712 | (614) | (86) | % | 817 | 1,582 | (765) | (48) | % | |||||||||||||||||||||||||||||||||||||
| Total unit shipments | 4,640 | 4,400 | 240 | 5 | % | 13,717 | 11,791 | 1,926 | 16 | % | |||||||||||||||||||||||||||||||||||||
| International unit shipments: | |||||||||||||||||||||||||||||||||||||||||||||||
| Replacement units | 3,262 | 2,725 | 537 | 20 | % | 9,371 | 7,082 | 2,289 | 32 | % | |||||||||||||||||||||||||||||||||||||
| Casino opening and expansion units | 783 | 134 | 649 | 484 | % | 2,425 | 170 | 2,255 | 1,326 | % | |||||||||||||||||||||||||||||||||||||
| Total unit shipments | 4,045 | 2,859 | 1,186 | 41 | % | 11,796 | 7,252 | 4,544 | 63 | % | |||||||||||||||||||||||||||||||||||||
Operating Expenses and AEBITDA
Operating expenses for the three months ended September 30, 2023 decreased by $1 million, as compared to the corresponding prior year period, primarily due to lower D&A of $19 million as a result of fully depreciated and amortized assets, partially offset by $14 million in higher cost of revenue associated with the increase in revenue and $5 million in higher SG&A costs. Operating expenses for the nine months ended September 30, 2023 increased by $64 million, as compared to the corresponding prior year period, as a result of $68 million in higher cost of revenue associated with the increase in revenue as described above and $23 million in higher SG&A and restructuring and other costs, partially offset by lower D&A of $27 million.
For the three and nine months ended September 30, 2023 as compared to the prior year periods, AEBITDA increased by $33 million and $121 million, respectively, which is primarily related to increased revenue, and AEBITDA as a percentage of revenue (“AEBITDA margin”) increased by 3 percentage points to 51% and 50%, respectively, primarily driven by favorable revenue mix as well as margin enhancement initiatives. AEBITDA also benefited from a change in the incentive compensation mix from cash to equity awards, resulting in a $4 million and $8 million benefit, respectively, as well as lower legal expenses.
SCIPLAY
Our SciPlay business segment is a leading developer and publisher of digital games on mobile and web platforms. SciPlay operates primarily in the social gaming market, which is characterized by gameplay online or on mobile devices that is social, competitive and self-directed in pace and session length. SciPlay also operates in the hyper-casual space, which is characterized by simpler core loops and more repetitive gameplay than casual games. SciPlay generates a substantial portion of its revenue from in-app purchases in the form of virtual coins, chips and cards, which players can use to play slot games, table games or bingo games. Players who install SciPlay’s social games typically receive free coins, chips or cards upon the initial launch of the game and additional free coins, chips or cards at specific time intervals. Players may exhaust the coins, chips or cards that they receive for free and may choose to purchase additional coins, chips or cards in order to extend their time of game play. Once obtained, coins, chips and cards (either free or purchased) cannot be redeemed for cash nor exchanged for anything other than game play within SciPlay’s apps. SciPlay generates additional revenue through advertising arrangements in SciPlay’s hyper-casual games. Players who install SciPlay’s hyper-casual games receive free, unlimited gameplay that requires viewing of periodic in-game advertisements.
SciPlay currently offers a variety of social casino games, including
JACKPOT PARTY
®
Casino
,
GOLD FISH
®
Casino
,
QUICK HIT
®
S
lots
,
88 FORTUNES
®
Slots
,
MONOPOLY Slots,
and
HOT SHOT CASINO
®
. Our SciPlay business segment continues to pursue its strategy of expanding into the casual games market. Current casual game titles include
BINGO SHOWDOWN
®
and
Backgammon Live
as well as other titles in the hyper-casual space, including games such as
CANDY CHALLENGE 3D™
,
BOSS LIFE™
and
DEEP CLEAN INC. 3D™
. During 2023, SciPlay continued development and testing of various new games. SciPlay’s social casino games typically include slots-style game play and occasionally include table games-style game play, while its casual games blend solitaire-style or bingo game play with adventure game features and its hyper-casual games include many simple core loop mechanics. All of SciPlay’s games are offered and played across multiple platforms, including
APPLE
,
GOOGLE
,
FACEBOOK
,
AMAZON,
and
MICROSOFT
. In addition to SciPlay’s internally created game content, SciPlay’s content library includes recognizable game content from Light & Wonder. This content allows players
38
who like playing land-based game content to enjoy some of those same titles in SciPlay’s free-to-play games. SciPlay has access to Light & Wonder’s library of more than 1,500 iconic casino titles, including titles and content from third-party licensed brands such as
MONOPOLY
and
JAMES BOND™
. We believe that SciPlay’s access to this content, coupled with its years of experience developing in-house content, uniquely positions SciPlay to create compelling digital games.
Current Year Update
SciPlay continues to see strong momentum and higher payer engagement in 2023. Revenue growth was primarily attributable to the social casino business, including games such as
Jackpot Party Casino, Quick Hit Slots
and
Gold Fish Casino
. SciPlay continues to deploy significant updates across a number of their portfolio games, execute on its strategic game updates and enhanced analytics, and pursue international expansion.
Results of Operations and KPIs
|
Three and Nine Months Ended September 30, 2023 and 2022
|
||
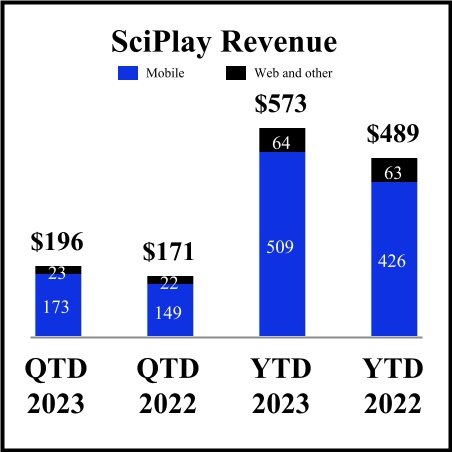
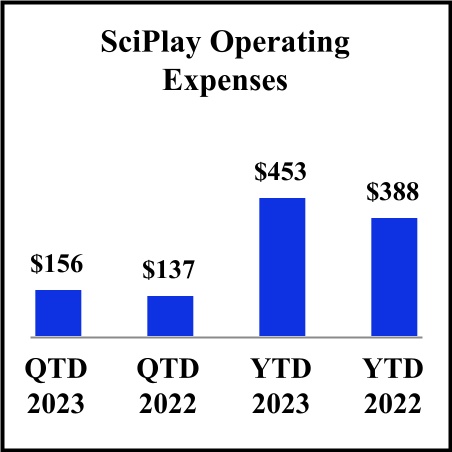
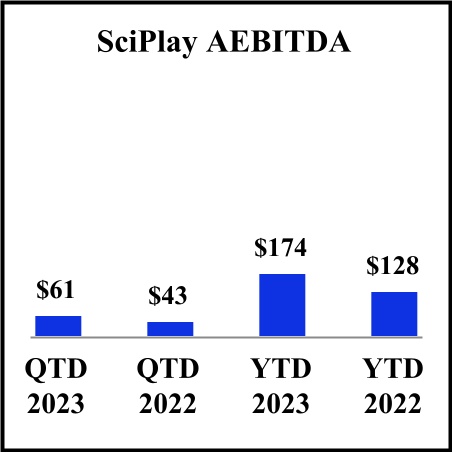
|
Three Months Ended
September 30, |
Variance
|
Nine Months Ended
September 30, |
Variance
|
||||||||||||||||||||||||||||||||||||||||||||
| (in millions unless otherwise noted) | 2023 | 2022 | 2023 vs. 2022 | 2023 | 2022 | 2023 vs. 2022 | |||||||||||||||||||||||||||||||||||||||||
| Revenue: | |||||||||||||||||||||||||||||||||||||||||||||||
|
Mobile in-app purchases
|
$ | 173 | $ | 149 | $ | 24 | 16 | % | $ | 509 | $ | 426 | $ | 83 | 19 | % | |||||||||||||||||||||||||||||||
|
Web in-app purchases and other
(1)
|
23 | 22 | 1 | 5 | % | 64 | 63 | 1 | 2 | % | |||||||||||||||||||||||||||||||||||||
|
Total revenue
|
$ | 196 | $ | 171 | $ | 25 | 15 | % | $ | 573 | $ | 489 | $ | 84 | 17 | % | |||||||||||||||||||||||||||||||
| SciPlay KPIs: | |||||||||||||||||||||||||||||||||||||||||||||||
| In-App Purchases: | |||||||||||||||||||||||||||||||||||||||||||||||
|
Mobile Penetration
(2)
|
90 | % | 90 | % | — | nm | 91 | % | 90 | % | 1 pp | nm | |||||||||||||||||||||||||||||||||||
|
Average MAU
(3)
|
5.7 | 5.9 | (0.2) | (3) | % | 5.8 | 6.0 | (0.2) | (3) | % | |||||||||||||||||||||||||||||||||||||
|
Average DAU
(4)
|
2.2 | 2.2 | — | — | % | 2.2 | 2.3 | (0.1) | (4) | % | |||||||||||||||||||||||||||||||||||||
|
ARPDAU
(5)
|
$ | 0.96 | $ | 0.80 | $ | 0.16 | 20 | % | $ | 0.93 | $ | 0.76 | $ | 0.17 | 22 | % | |||||||||||||||||||||||||||||||
|
Average MPU
(6)
(in thousands)
|
602 | 577 | 25 | 4 | % | 612 | 566 | 46 | 8 | % | |||||||||||||||||||||||||||||||||||||
|
AMRPPU
(7)
|
$ | 106.61 | $ | 95.45 | $ | 11.16 | 12 | % | $ | 102.03 | $ | 92.97 | $ | 9.06 | 10 | % | |||||||||||||||||||||||||||||||
|
Payer Conversion Rate
(8)
|
10.6 | % | 9.7 | % | 0.9 pp | nm | 10.5 | % | 9.4 | % | 1.1 pp | nm | |||||||||||||||||||||||||||||||||||
|
nm = not meaningful.
pp = percentage points.
(1) Other primarily represents advertising revenue, which was not material in the periods presented.
(2) Mobile penetration is defined as the percentage of business to consumer revenue generated from mobile platforms.
(3) MAU = Monthly Active Users is a count of visitors to SciPlay sites during a month. An individual who plays multiple games or from multiple devices may, in certain circumstances, be counted more than once. However, SciPlay uses third-party data to limit the occurrence of multiple counting.
(4) DAU = Daily Active Users is a count of visitors to SciPlay sites during a day. An individual who plays multiple games or from multiple devices may, in certain circumstances, be counted more than once. However, SciPlay uses third-party data to limit the occurrence of multiple counting.
(5) ARPDAU = Average Revenue Per DAU is calculated by dividing revenue for a period by the DAU for the period by the number of days for the period.
(6) MPU = Monthly Paying Users is the number of individual users who made an in-game purchase during a particular month.
(7) AMRPPU = Average Monthly Revenue Per Paying User is calculated by dividing average monthly revenue by average MPUs for the applicable time period.
(8) Payer conversion rate is calculated by dividing average MPU for the period by the average MAU for the same period.
|
|||||||||||||||||||||||||||||||||||||||||||||||
39
For the three months ended September 30, 2023, revenues increased as social casino payer engagement increased and average monthly revenue per paying user reached a new record high.
For the nine months ended September 30, 2023, revenues increased as social casino payer engagement increased with an increase in average monthly paying users.
The mobile penetration percentage for the three months ended September 30, 2023 was flat, and for the nine months ended September 30, 2023, it increased, primarily reflecting a continued trend of players migrating from web to mobile platforms to play SciPlay’s games.
Average MAU for the three and nine months ended September 30, 2023 decreased due to the turnover in users.
ARPDAU increased with an increase in payers and higher daily average revenue per player while DAU was flat for the three months ended
September 30, 2023
.
ARPDAU increased as a function of slightly lower average DAU coupled with an increase in
payers for the nine months ended September 30, 2023.
For the three and nine months ended September 30, 2023, AMRPPU and average MPU increased as payer conversion improved compared to the prior year period.
Payer conversion rates continue to be at high levels due to consistent
payer interaction with the games as a result of SciPlay’s
focus on introducing new content, features and live events in their games.
Operating Expenses and AEBITDA
The increase in operating expenses for the three and nine months ended September 30, 2023 as compared to the prior year periods primarily correlated with the increase in revenue (as described above) as a result of higher platform fees, higher stock-based compensation of $10 million and $19 million, respectively, and higher salaries and benefits related to an increase in headcount of $3 million and $11 million, respectively, partially offset by lower marketing spend of $4 million and $5 million, respectively. The nine months ended September 30, 2023 also included an impairment charge of $5 million related to the restructuring of a certain foreign studio.
AEBITDA for the three and nine months ended September 30, 2023 increased as compared to the prior year periods,
and
AEBITDA margin increased by 6 and 4 percentage points, respectively, primarily due to the increase in revenue (as described above) and reduced marketing spend, partially offset by higher operating costs resulting from increases in salaries and benefits.
iGAMING
Our iGaming business segment provides a comprehensive suite of digital gaming content, distribution platforms, player account management systems, as well as various other iGaming content and services. The majority of our revenue is derived from casino-style game content, including a wide variety of internally developed and branded games as well as popular third-party provider games. These games are made available to iGaming operators via content aggregation platforms, including Open Gaming System, remote gaming servers and various other platforms. We also provide our Open Platform System, a player account management system which offers a wide range of reporting and administrative functions and tools providing operators full control over all areas of digital gaming operations. Generally, we host the play of our game content which is integrated with the online casino operators’ websites.
Current Year Update
We continue to expand our customer base and capitalize on growth in the European and North American markets by leveraging our industry leading platforms, content and solutions, as well as invest in our ability to scale our own original U.S. land-based content offering. Currently we have launched in six U.S. states, and we are positioned to enter others as additional state legislatures authorize online gaming. In October 2023, we launched our live casino operations in Michigan, reaching a strategic market expansion milestone for our iGaming business.
40
Results of Operations
|
Three and Nine Months Ended September 30, 2023 and 2022
|
||
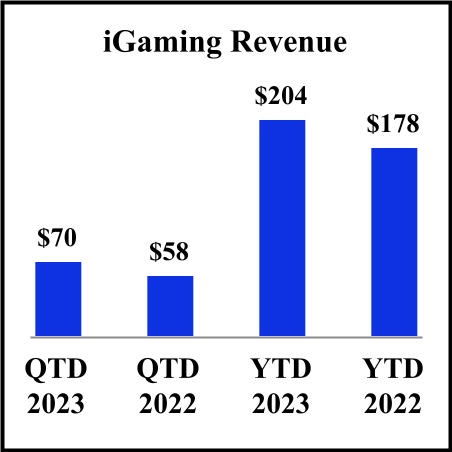
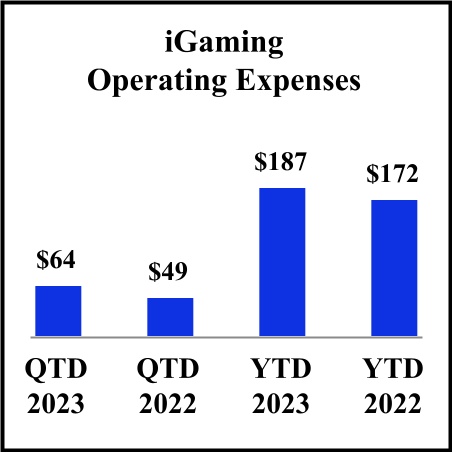
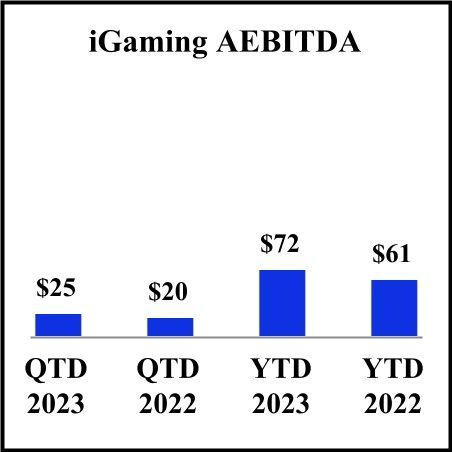
The increases in iGaming revenue of 21% and 15% for the three and nine months ended September 30, 2023, respectively, as compared to the prior year periods, were primarily due to continuing momentum in the U.S. market, which delivered 25% and 30% year-over-year revenue growth, respectively, driven by the strength of our original content and growth in our partner network, as well as growth in international markets. The current year periods also benefited from $3 million and $5 million, respectively, in certain license termination fees. Wagers processed through our Open Gaming System for both current year periods increased to $20 billion and $61 billion, respectively. Revenue for the three months ended September 30, 2023 was impacted by favorable impact of foreign currency translation of $2 million, and the nine months ended September 30, 2023 were impacted by unfavorable impact of $2 million.
AEBITDA for the three and nine months ended September 30, 2023 increased as compared to the prior year periods primarily due to the increase in revenue as described above. AEBITDA margin increased by 2 and 1 percentage points for the three and nine months ended September 30, 2023, respectively.
RECENTLY ISSUED ACCOUNTING GUIDANCE
We do not expect that any recently issued accounting guidance will have a significant effect on our consolidated financial statements.
CRITICAL ACCOUNTING ESTIMATES
For a description of our policies regarding our critical accounting estimates, see “Critical Accounting Estimates” in
Item 7
“Management’s Discussion and Analysis of Financial Condition and Results of Operations” included in our 2022 10-K.
There have been no significant changes in our critical accounting estimate policies or the application of those policies to our condensed consolidated financial statements from those presented in
Item 7
“Management's Discussion and Analysis of Financial Condition and Results of Operations” included in our 2022 10-K.
LIQUIDITY, CAPITAL RESOURCES AND WORKING CAPITAL
Cash and Available Liquidity
As of September 30, 2023, our principal sources of liquidity, other than cash flows provided by operating activities, were cash and cash equivalents, including SciPlay cash and cash equivalents (for our SciPlay business segment), and amounts available under the LNWI Revolver and SciPlay Revolver (for our SciPlay business segment).
41
Cash and Available Revolver Capacity
| (in millions) | Cash and cash equivalents | Revolver capacity | Revolver capacity drawn or committed to letters of credit | Total | ||||||||||||||||||||||
| L&W (excluding SciPlay) | $ | 485 | $ | 750 | $ | (11) | $ | 1,224 | ||||||||||||||||||
| SciPlay | 406 | 150 | — | 556 | ||||||||||||||||||||||
|
Total as of September 30, 2023
|
$ | 891 | $ | 900 | $ | (11) | $ | 1,780 | ||||||||||||||||||
| L&W (excluding SciPlay) | $ | 584 | $ | 750 | $ | (12) | $ | 1,322 | ||||||||||||||||||
| SciPlay | 330 | 150 | — | 480 | ||||||||||||||||||||||
|
Total as of December 31, 2022
|
$ | 914 | $ | 900 | $ | (12) | $ | 1,802 | ||||||||||||||||||
Total cash held by our foreign subsidiaries was $183 million and $142 million as of September 30, 2023 and December 31, 2022, respectively. We believe that substantially all cash held outside the U.S. is free from legal encumbrances or similar restrictions that would prevent it from being available to meet our global liquidity needs.
Our Gaming operations generally require significant upfront capital expenditures, and we may need to incur additional capital expenditures in order to retain or increase market share and continue our product investments. Other capital requirements for the near term primarily include debt principal and interest payments, purchase obligations, supply contracts, license agreement minimum guaranteed payments and lease obligations. There have been no material changes to our capital requirements disclosed in our 2022 10-K, other than those associated with the issuance of the 2031 Unsecured Notes and redemption of the 2025 Unsecured Notes.
In April 2023, we paid $32 million in cash taxes associated with the Divestitures. As required under our certain debt agreements, we used a portion of the proceeds received from the Divestitures to reinvest in our business through the SciPlay Merger (see Note 1 for additional details). On October 23, 2023, we paid $496 million to the holders of SciPlay Class A common stock in connection with the SciPlay Merger. Upon completion of the SciPlay Merger, the SciPlay Revolver was terminated, and any SciPlay cash and cash equivalents became available for use by L&W.
In connection with the termination of the SciPlay Revolver, during the fourth quarter of 2023, L&W intends to designate SciPlay and its wholly owned domestic subsidiaries and certain parent holding companies, which hold substantially all the assets of and operate SciPlay’s social gaming business, as “Restricted Subsidiaries” and join certain of these entities as guarantors under the LNWI Credit Agreement and the Unsecured Notes. As a result of such designations, these subsidiaries will be obligated to comply with many of the covenants set forth in those agreements and the assets, liabilities and financial results of those subsidiaries will be included in the calculation of the applicable financial metrics required by those agreements.
Our ability to make payments on and to refinance our indebtedness and other obligations depends on our ability to generate cash in the future. We may, from time to time, repurchase or otherwise repay, retire or refinance our debt, through our subsidiaries or otherwise. In the event we pursue significant acquisitions or other expansion opportunities, or conduct significant repurchases of our outstanding securities, we may need to raise additional capital. If we do not have adequate liquidity to support these activities, we may be unable to obtain financing for these cash needs on favorable terms or at all. For additional information regarding our cash needs and related risks, see “Risk Factors” under
Part I, Item 1A
in our 2022 10-K.
On March 1, 2022, our Board of Directors approved a share repurchase program under which we are authorized to repurchase, from time to time through February 25, 2025, up to an aggregate amount of $750 million of our outstanding common stock. During the nine months ended September 30, 2023, we repurchased 2.1 million shares of common stock under the program at an aggregate cost of $146 million (including excise tax).
On May 9, 2022, SciPlay’s Board of Directors approved a share repurchase program under which it is authorized to repurchase, from time to time through May 9, 2024, up to an aggregate amount of $60 million of its outstanding Class A common stock. SciPlay has since completed the initial share repurchase program authorization. On May 3, 2023, SciPlay’s Board of Directors approved another share repurchase program under which it is authorized to repurchase, from time to time through May 3, 2024, up to an aggregate amount of $60 million of its outstanding Class A common stock. No share repurchases have been made under the new program as of September 30, 2023. Upon completion of the SciPlay Merger, the SciPlay share repurchase program was terminated.
42
Cash Flow Summary
| Nine Months Ended September 30, |
Variance
|
||||||||||||||||
|
($ in millions)
|
2023 | 2022 | 2023 vs. 2022 | ||||||||||||||
| Net cash provided by (used in) operating activities from: | |||||||||||||||||
| Continuing operations | $ | 423 | $ | (346) | $ | 769 | |||||||||||
| Discontinued operations | — | 52 | (52) | ||||||||||||||
| Net cash provided by (used in) operating activities | 423 | (294) | 717 | ||||||||||||||
| Net cash (used in) provided by investing activities from: | |||||||||||||||||
| Continuing operations | (187) | (224) | 37 | ||||||||||||||
| Discontinued operations | (3) | 6,368 | (6,371) | ||||||||||||||
| Net cash (used in) provided by investing activities | (190) | 6,144 | (6,334) | ||||||||||||||
| Net cash used in financing activities from: | |||||||||||||||||
| Continuing operations | (251) | (5,210) | 4,959 | ||||||||||||||
| Discontinued operations | — | (3) | 3 | ||||||||||||||
| Net cash used in financing activities | (251) | (5,213) | 4,962 | ||||||||||||||
| Effect of exchange rate changes on cash, cash equivalents and restricted cash | (2) | (12) | 10 | ||||||||||||||
| (Decrease) increase in cash, cash equivalents and restricted cash | $ | (20) | $ | 625 | $ | (645) | |||||||||||
Cash Flows from Operating Activities
| Nine Months Ended September 30, |
Variance
|
||||||||||||||||
|
($ in millions)
|
2023 | 2022 | 2023 vs. 2022 | ||||||||||||||
| Net income | $ | 112 | $ | 3,658 | $ | (3,546) | |||||||||||
| Less: Income from discontinued operations, net of tax | — | (3,855) | 3,855 | ||||||||||||||
| Adjustments to reconcile net income (loss) from continuing operations to net cash provided by (used in) operating activities from continuing operations | 436 | 488 | (52) | ||||||||||||||
| Changes in working capital accounts, excluding the effects of acquisitions | (81) | (641) | 560 | ||||||||||||||
| Changes in deferred income taxes and other | (44) | 4 | (48) | ||||||||||||||
|
Net cash provided by (used in) operating activities from continuing operations
|
$ | 423 | $ | (346) | $ | 769 | |||||||||||
Net cash provided by operating activities from continuing operations increased primarily due to favorable changes in working capital accounts and a $209 million increase in earnings (drivers described above).
Changes in working capital accounts for the nine months ended September 30, 2023 as compared to the nine months ended September 30, 2022 primarily benefited from a decrease of $433 million in cash taxes paid associated with the Divestitures and lower interest payments, partially offset by $9 million in cash paid for contingent consideration and $7 million in professional services associated with the ASX listing. The prior year period was also negatively impacted by the timing of disbursements including costs associated with the strategic review, accelerated cash interest payments associated with refinancing debt transactions in April 2022 and $25 million paid by SciPlay for the Washington State matter settlement as described in Note 20 in our 2022 10-K.
Cash Flows from Investing Activities
Net cash used in investing activities from continuing operations decreased primarily due to SciPlay’s acquisition of Alictus Yazilim Anonim Şirketi in the prior year period, partially offset by the settlement of cross-currency interest rate swaps in the prior year period, in which we received $50 million in cash proceeds, and higher capital expenditures in the current year period. Capital expenditures are composed of investments in systems, equipment and other assets related to contracts, property and equipment, intangible assets and software.
Net cash provided by investing activities from discontinued operations decreased primarily as a result of the receipt of $6.4 billion in gross cash proceeds from the Divestitures, net of cash, cash equivalents and restricted cash transferred, during the nine months ended September 30, 2022.
43
Cash Flows from Financing Activities
Net cash used in financing activities decreased primarily due to the refinancing debt transactions in April 2022, in which we repaid $7.0 billion in senior notes (including redemption premium) and outstanding term loan borrowings and received $2.2 billion in proceeds from the issuance of the LNWI Term Loan B. This decrease was partially offset by costs related to the debt transactions in August 2023, in which we paid $20 million in premiums, fees and expenses for the issuance of the 2031 Unsecured Notes and redemption of the 2025 Unsecured Notes. We also purchased less of our outstanding common stock under our share repurchase program during the current year period. During the nine months ended September 30, 2023 and 2022, we purchased $145 million and $203 million, respectively, of our common stock.
Credit Agreement and Other Debt
For additional information regarding the LNWI Credit Agreement and other debt, interest rate risk and interest rate hedging instruments, see Notes 15 and 16 and
Item 7A
“Quantitative and Qualitative Disclosures About Market Risk” in our 2022 10-K as well as Notes 11 and 12 and
Item 3
below in this
Quarterly Report on Form
10-Q.
Off-Balance Sheet Arrangements
As of September 30, 2023, we did not have any significant off-balance sheet arrangements.
Item 3. Quantitative and Qualitative Disclosures about Market Risk
Market risk is the risk of loss arising from adverse changes in market rates and prices, such as interest rates, foreign exchange rates and commodity prices. The following are our primary exposures to market risks:
Interest Rate Risk
As of September 30, 2023, the face value of long-term debt was $3.9 billion, including $2.2 billion of variable-rate obligations. Assuming a constant outstanding balance for our variable-rate long-term debt and excluding the impact of interest rate swap contracts, a hypothetical 1% change in interest rates would result in interest expense changing by approximately $22 million. All of our interest rate sensitive financial instruments are held for purposes other than trading.
In April 2022, we entered into interest rate swap contracts with $700 million notional amount to hedge a portion of our interest expense associated with our variable rate debt to effectively fix the interest rate that we will pay. The objective of our interest rate swap contracts, which are designated as cash flow hedges of the future interest payments, is to eliminate the variability of cash flows attributable to the SOFR component of interest expense to be paid on a portion of our variable rate debt. These hedges mature in April 2027.
For additional information regarding our long-term debt and interest rate swap contracts, see Notes 11 and 12, respectively.
Item 4. Controls and Procedures
Under the supervision and with the participation of our management, including the Chief Executive Officer and Interim Chief Financial Officer, we have evaluated the effectiveness of our disclosure controls and procedures as required by Exchange Act Rule 3a-15(b) as of the end of the period covered by this report. Based on that evaluation, the Chief Executive Officer and Interim Chief Financial Officer have concluded that these disclosure controls and procedures are effective as of September 30, 2023.
There were no changes in our internal control over financial reporting during the three months ended September 30, 2023 that have materially affected, or are reasonably likely to materially affect, our internal control over financial reporting.
44
PART II. OTHER INFORMATION
Item 1. Legal Proceedings
For a description of our legal proceedings, see Note 16 in this Quarterly Report on Form 10-Q and Note 20 in our 2022 10-K.
Item 1A. Risk Factors
There have been no material changes in our risk factors from those disclosed under
Item 1A
“Risk Factors” included in our 2022 10-K, except as noted below.
Our secondary listing of the Company’s common stock on the Australian Securities Exchange could lead to price variations and other impacts on holders our common stock.
On May 22, 2023 (AEST), our common stock was listed as CDIs on the ASX and commenced active trading under the ASX code “LNW,” in addition to our existing primary listing on The Nasdaq Stock Market (“Nasdaq”). Dual listing may result in price variations between our securities listed on the different exchanges due to a number of factors, including that our common stock listed on the Nasdaq is traded in U.S. dollars and any CDIs listed on the ASX are traded in Australian Dollars, volatility in the exchange rate of the two currencies and differences between the vacation schedules, trading schedules and time zones of the two exchanges, among other factors. A decrease in the price of our securities in one market may result in a decrease in the price of our securities in the other market. Dual listing also presents us with the opportunity to raise additional funds through the issuance of CDIs, which could cause dilution to existing stockholders.
The SciPlay Merger subjects us to a number of risks and uncertainties, including whether it will yield additional value for our stockholders and adversely impact our business, financial results, results of operations, cash flows or stock price.
On October 23, 2023, we acquired the remaining approximately 17% equity interest in SciPlay not already owned by us pursuant to the SciPlay Merger in an all-cash transaction for $496 million, excluding transaction fees and expenses. The SciPlay Merger exposes us to a number of risks and uncertainties, including that L&W may be unable to achieve the expected operational, strategic and financial benefits of the SciPlay Merger; difficulties in retaining or motivating key management personnel of SciPlay; and exposure to potential litigation. Any of these factors could disrupt our business and could have a material adverse effect on our business, financial condition, results of operations, cash flows or stock price.
Unfavorable U.S. and international economic conditions, decreased discretionary spending, travel or operational disruptions due to other factors such as inflation, rising benchmark interest rates, terrorist activity or threat thereof, armed conflicts or hostilities, civil unrest, health epidemics, contagious disease outbreaks, or public perception thereof, other economic or political uncertainties, or other events beyond our control have adversely affected and may in the future adversely affect our business, results of operations, cash flows and financial condition.
Unfavorable economic conditions, including recession, inflation, economic slowdown, decreased liquidity in the financial markets, decreased availability of credit, relatively high rates of unemployment and inflation, have had, and may continue to have, a negative effect on our business. Socio-political factors such as terrorist activity or threat thereof, armed conflicts or hostilities, civil unrest or other economic or political uncertainties, or health epidemics, contagious disease outbreaks, or public perception thereof, or other events beyond our control that contribute to consumer unease may also result in decreased discretionary spending or travel by consumers and have a negative effect on our businesses. Such factors out of our control may also have effects beyond discretionary spending or travel, such as disruptions to our operations and productivity, which could also have a negative effect on our businesses. We cannot fully predict the effects that unfavorable social, political and economic conditions, economic uncertainties and public health crises and any resulting decrease in discretionary spending or travel would have on us, as they would be expected to impact our customers, suppliers, employees, consultants and business partners in varied ways. For a description of the impact of the COVID-19 pandemic and other public health crises, see the risk factor captioned “
The effects of the COVID-19 pandemic or similar health epidemics, contagious disease outbreaks and public perception thereof, continue to and, in the future, could impact our operations and, should negative impacts such as significant negative player engagement develop, adversely affect and continue to adversely affect our operations, business, results of operations, cash flows and financial condition
” disclosed under
Item 1A
“Risk Factors” included in our 2022 10-K. In our Gaming business, especially our Participation gaming business, our revenue is largely driven by players’ disposable incomes and level of gaming activity which may be reduced by unfavorable economic conditions. A further or extended decline in disposable income may result in reduced play levels on our Participation gaming machines, causing our results of operations and cash flows from these products to decline. Additionally, higher travel and other costs may adversely affect the number of players visiting our customers’ casinos. Adverse changes in discretionary consumer spending or consumer preferences, resulting in fewer patrons visiting casinos and reduced play levels, could also be driven by factors such as an unstable job market, outbreaks of contagious diseases or public perception thereof or fears of terrorism or other violence.
45
A decline in play levels has negatively impacted the results of operations, cash flows and financial condition of our casino customers and their ability to purchase or lease our products and services.
Unfavorable economic conditions have also impacted, and could continue to impact, the ability of our Gaming customers to make timely payments to us. These conditions, and the concentration of certain outstanding Gaming segment receivables, may increase our collection risks and materially impact our estimate of receivables allowance for credit losses. We increased our allowance for credit losses by $56 million for the year ended December 31, 2020. In addition, unfavorable economic conditions have caused, and may cause in the future, some of our Gaming customers to temporarily close gaming venues or ultimately declare bankruptcy, which adversely affects our business. Consistent with other suppliers in the gaming industry, our Gaming business has recently expanded the use of extended payment term financing for gaming machine purchases, and we expect to continue to provide a higher level of extended payment term financing in this business until demand from our customers for such financings abates or our business model changes. These financing arrangements may increase our collection risk, and if customers are not able to pay us, whether as a result of financial difficulties, bankruptcy or otherwise, we may incur provisions for bad debt related to our inability to collect certain receivables. In addition, both extended payment term financing and operating leases result in a delay in our receipt of cash, which reduces our cash balance, liquidity and financial flexibility to respond to changing economic events. Unfavorable economic conditions may also result in volatility in the credit and equity markets. The difficulty or inability of our customers to generate or obtain adequate levels of capital to finance their ongoing operations may reduce their ability to purchase our products and services. Refer to Note 7 in our 2022 10-K for international locations with significant concentrations of our receivables with terms longer than one year.
In our iGaming business based on a Participation model, our revenue is largely driven by disposable incomes and level of player activity. Unfavorable economic conditions have previously reduced and may later reduce the disposable incomes of end users consuming the services, which could negatively impact revenues for the iGaming business. Suppliers to our iGaming business may suffer financial difficulties and may not be able to offer their services and products, which could restrict the provision of our services and negatively impact our revenues. Various gambling regulators have implemented additional responsible and safer gambling measures relating to online casinos, including the implementation of bet limits, spin speeds, deposit limits and bonusing, which could negatively impact our revenues, particularly if additional gambling regulators follow suit or additional measures are introduced.
In our SciPlay business, while we maintain offices in the U.S., we have employees and consultants operating in foreign jurisdictions, including Israel, Turkey and Ukraine. In the foreign jurisdictions in which SciPlay operates, conditions such as political instability, terrorist activity or threat thereof, armed conflicts or hostilities and civil unrest could adversely affect our business and results of operations. For example, political, economic and military conditions in Israel, including acts of terrorism, war or other armed conflicts, such as Hamas’ attack against Israel, which has impacted our employees and operations, in Israel, could in the future cause business interruptions or other spillover effects that could materially adversely affect SciPlay’s business and results of operations.
There are ongoing concerns regarding the debt burden of certain countries, particularly in Europe and South America, and their ability to meet their future financial obligations, which have resulted in downgrades of the debt ratings for these countries. We currently operate in, and our growth strategy may involve pursuing expansion or business opportunities in certain of these jurisdictions, such as Argentina, Brazil, Greece, Italy, Puerto Rico, Turkey and Ukraine among others. These sovereign debt concerns, whether real or perceived, could result in a recession, prolonged economic slowdown, or otherwise negatively impact the general health and stability of the economies in these countries or more broadly. In more severe cases, this could result in a limitation on the availability or flow of capital, thereby restricting our liquidity and negatively impacting our results of operations, cash flows and financial condition.
46
Item 2. Unregistered Sales of Equity Securities and Use of Proceeds
We repurchased 1.5 million shares under the share repurchase program during the three months ended September 30, 2023.
| (in millions, except for price per share) | ||||||||||||||||||||||||||
| ISSUER PURCHASES OF EQUITY SECURITIES | ||||||||||||||||||||||||||
| Period |
Total Number of Shares
Purchased as Part of Publicly Announced Program |
Average Price Paid per Share
(1)
|
Total Cost of Repurchase
(in millions)
(1)
|
Approximate Dollar Value of Shares that May Yet Be Purchased Under the Program (in millions)
(1)
|
||||||||||||||||||||||
| 7/1/2023 - 7/31/2023 | 0.3 | $ | 69.58 | $ | 19 | $ | 293 | |||||||||||||||||||
| 8/1/2023 - 8/31/2023 | 1.2 | $ | 74.82 | $ | 93 | $ | 200 | |||||||||||||||||||
| 9/1/2023 - 9/30/2023 | — | $ | — | $ | — | $ | 200 | |||||||||||||||||||
| Total | 1.5 | $ | 73.87 | $ | 112 | $ | 200 | |||||||||||||||||||
|
(1) Average price paid per share is calculated on a settlement basis and excludes excise tax. As of January 1, 2023, our share repurchases in excess of issuances are subject to a 1% excise tax enacted by the Inflation Reduction Act. Any excise tax incurred is recognized in stockholders’ equity as part of the cost basis of the shares acquired. For the three months ended September 30, 2023, excise taxes totaled $1 million.
|
||||||||||||||||||||||||||
Item 3. Defaults Upon Senior Securities
None.
Item 4. Mine Safety Disclosures
Not applicable.
Item 5. Other Information
Insider Trading Arrangements and Policies
Certain of our officers or directors have made elections to participate in, and are participating in, our 401(k) plan and have made, and may from time to time make, elections to have shares withheld to cover withholding taxes, which may be designed to satisfy the affirmative defense conditions of Rule 10b5-1 under the Exchange Act or may constitute non-Rule 10b5-1 trading arrangements (as defined in Item 408(c) of Regulation S-K). During the three months ended September 30, 2023, no director or officer of the Company
adopted
or
terminated
a "Rule 10b5-1 trading arrangement" as such term is defined in Item 408(a) of Regulation S-K.
47
Item 6. Exhibits
|
Exhibit
Number |
Description | |||||||
| 2.1* | ||||||||
| 3.1 | ||||||||
| 3.2 | ||||||||
| 4.1 | ||||||||
| 10.1 | ||||||||
| 31.1 | ||||||||
| 31.2 | ||||||||
| 32.1 | ||||||||
| 32.2 | ||||||||
| 101.INS | Inline XBRL Instance Document - the instance document does not appear in the Interactive Data File because its XBRL tags are embedded within the Inline XBRL document. | |||||||
| 101.SCH | Inline XBRL Taxonomy Extension Schema Document | |||||||
| 101.CAL | Inline XBRL Taxonomy Extension Calculation Linkbase Document | |||||||
| 101.DEF | Inline XBRL Taxonomy Extension Definition Label Linkbase Document | |||||||
| 101.LAB | Inline XBRL Taxonomy Extension Label Linkbase Document | |||||||
| 101.PRE | Inline XBRL Taxonomy Extension Presentation Linkbase Document | |||||||
| 104 | Cover Page Interactive Data File - the cover page interactive data file does not appear in the Interactive Data File because its XBRL tags are embedded within the Inline XBRL document. | |||||||
* Schedules and exhibits have been omitted pursuant to Item 601(b)(2) of Regulation S-K. Light & Wonder agrees to furnish supplementally to the SEC a copy of any omitted schedule or exhibit upon request, subject to Light & Wonder’s right to request confidential treatment of any requested schedule or exhibit.
** Management contracts and compensation plans and arrangements.
*** Furnished herewith.
(†) Filed herewith.
48
SIGNATURES
Pursuant to the requirements of the Securities Exchange Act of 1934, the registrant has duly caused this report to be signed on its behalf by the undersigned thereunto duly authorized.
|
LIGHT & WONDER, INC.
|
|||||||||||
|
(Registrant)
|
|||||||||||
|
By:
|
/s/ Oliver Chow
|
||||||||||
|
Name:
|
Oliver Chow
|
||||||||||
|
Title:
|
Senior Vice President, Interim Chief Financial Officer, and Principal Financial Officer
|
||||||||||
|
Dated:
|
November 9, 2023
|
||||||||||
49
TABLE OF CONTENTS
Part I, Item 1AItem 3. Quantitative and Qualitative Disclosures About Market RiskItem 4. Controls and ProceduresPart II. Other InformationItem 1. Legal ProceedingsItem 1A. Risk FactorsItem 2. Unregistered Sales Of Equity Securities and Use Of ProceedsItem 3. Defaults Upon Senior SecuritiesItem 4. Mine Safety DisclosuresItem 5. Other InformationItem 6. Exhibits