COMSTOCK MINING INC.
10-Ks and 10-Qs
|
|
|
|
|
|
|
|
|
|
|
|
|
|
|
|
|
|
|
|
|
|
|
|
|
|
|
|
|
|
|
|
|
|
|
|
|
|
|
|
|
|
|
|
|
|
|
|
|
|
|
|
|
|
|
|
|
|
|
|
|
|
UNITED STATES
SECURITIES AND EXCHANGE COMMISSION
WASHINGTON, D.C. 20549
_______________________________________________________________________
FORM 10-K
_______________________________________________________________________
ý
ANNUAL REPORT PURSUANT TO SECTION 13 OR 15(d) OF THE SECURITIES
EXCHANGE ACT OF 1934
For the fiscal year ended
December 31, 2013
or
¨
TRANSITION REPORT PURSUANT TO SECTION 13 OR 15(d) OF THE SECURITIES
EXCHANGE ACT OF 1934
For the transition period from to
Commission File No. 001-35200
COMSTOCK MINING INC.
(Exact name of registrant as specified in its charter)
|
Nevada
|
1040
|
65-0955118
|
|
(State or other jurisdiction of
incorporation or organization)
|
(Primary Standard Industrial
Classification Code Number)
|
(I.R.S. Employer Identification
No.)
|
P.O. Box 1118
Virginia City, NV 89440
(775) 847-5272
(Address, including zip code, and telephone number,
including area code, of registrant's principal executive offices)
Securities Registered pursuant to Section 12(b) of the Act: Common Stock, par value $.000666 per share
Securities Registered pursuant to Section 12(g) of the Act: None
Indicate by check mark if the registrant is a well-known seasoned issuer, as defined in Rule 405 of the Securities Act.
Yes
¨
No
ý
Indicate by check mark if the registrant is not required to file reports pursuant to Section 13 or Section 15(d) of the Act.
Yes
¨
No
ý
Indicate by check mark whether the issuer (1) has filed all reports required to be filed by Section 13 or 15(d) of the Securities Exchange Act of 1934 during the past 12 months (or for such shorter period that the registrant was required to file such reports), and (2) has been subject to such filing requirements for the past 90 days.
Yes
ý
No
¨
Indicate by check mark whether the registrant has submitted electronically and posted on its corporate Web site, if any, every Interactive Data File required to be submitted and posted pursuant to Rule 405 of Regulation S-T during the preceding 12 months (or for such shorter period of time that the registrant was required to submit and post such files). Yes
ý
No
¨
Indicate by check mark if disclosure of delinquent filers pursuant to Item 405 of Regulation S-K is not contained herein, and will not be contained, to the best of registrant’s knowledge, in definitive proxy or information statements incorporated by reference in Part III of this Form 10-K or any amendment to this Form 10-K.
x
Indicate by check mark whether the registrant is a large accelerated filer, an accelerated filer, a non-accelerated filer, or a smaller reporting company. See the definitions of “large accelerated filer,” “accelerated filer,” and “smaller reporting company” in Rule 12b-2 of the Exchange Act.
|
Large accelerated filer
¨
|
Accelerated filer
x
|
|
Non-accelerated filer
¨
|
Smaller reporting company
¨
|
Indicate by check mark whether the registrant is a shell company (as defined in Rule 12b-2 of the Exchange Act).
Yes
¨
No
ý
The aggregate market value of the 68,162,898 shares of voting stock held by non-affiliates of the registrant based on the closing price on the NYSE MKT LLC on
June 28, 2013
was
$112,468,781
.
Indicate the number of shares outstanding of each of the registrant’s classes of common stock, as of the latest practicable date.
|
|
|
Shares Outstanding
|
|
Title of Class
|
|
March 14, 2014
|
|
Common Stock
|
|
72,852,435
|
DOCUMENTS INCORPORATED BY REFERENCE
Portions of Comstock Mining Inc.’s definitive Proxy Statement for its 2014 Annual Meeting of Shareholders to be filed with the Securities and Exchange Commission pursuant to Regulation 14A under the Securities Exchange Act of 1934, as amended, are incorporated by reference into Part II and Part III of this Form 10-K.
TABLE OF CONTENTS
|
|
|
|
|
|
|
|
|
|
|
|
|
|
||
Statement Regarding Forward-Looking Statements
Certain statements contained in this report on Form 10-K may constitute forward-looking statements within the meaning of applicable securities laws. All statements, other than statements of historical facts, are forward-looking statements. Forward-looking statements include statements about matters such as: future prices and sales of, and demand for, our products; future industry market conditions; future changes in our exploration activities, production capacity and operations; future exploration, production, operating and overhead costs; operational and management restructuring activities ; future employment and contributions of personnel; tax and interest rates; capital expenditures and their impact on us; nature and timing of restructuring charges and the impact thereof; productivity, business process, rationalization, investment, acquisition, consulting, operational, tax, financial and capital projects and initiatives; contingencies; environmental compliance and changes in the regulatory environment; and future working capital, costs, revenues, business opportunities, debt levels, cash flows, margins, earnings and growth.
The words “believe,” “expect,” “anticipate,” “estimate,” “project,” “plan,” “should,” “intend,” “may,” “will,” “would,” “potential” and similar expressions identify forward-looking statements, but are not the exclusive means of doing so. These statements are based on assumptions and assessments made by our management in light of their experience and their perception of historical and current trends, current conditions, possible future developments and other factors they believe to be appropriate. Forward-looking statements are not guarantees, representations or warranties and are subject to risks and uncertainties that could cause actual results, developments and business decisions to differ materially from those contemplated by such forward-looking statements. Some of those risks and uncertainties include the risk factors discussed in Item 1A, “Risk Factors” and the following: current global economic and capital market uncertainties; the speculative nature of gold or mineral exploration, including risks of diminishing quantities or grades of qualified resources and reserves; operational or technical difficulties in connection with exploration or mining activities; contests over our title to properties; potential dilution to our stockholders from our recapitalization and balance sheet restructuring activities; potential inability to continue to comply with government regulations; adoption of or changes in legislation or regulations adversely affecting our businesses; permitting constraints or delays, business opportunities that may be presented to, or pursued by, us; changes in the United States or other monetary or fiscal policies or regulations; interruptions in our production capabilities due to unexpected equipment failures; fluctuation of prices for gold or certain other commodities (such as silver, zinc, cyanide, water, diesel fuel, and electricity); changes in generally accepted accounting principles; geopolitical events; potential inability to implement our business strategies; potential inability to grow revenues organically; potential inability to attract and retain key personnel; interruptions in delivery of critical supplies and equipment raw materials due to credit or other limitations imposed by vendors; assertion of claims, lawsuits and proceedings against us; potential inability to maintain an effective system of internal controls over financial reporting; potential inability or failure to timely file periodic reports with the SEC; potential inability to list our securities on any securities exchange or market; and work stoppages or other labor difficulties. Occurrence of such events or circumstances could have a material adverse effect on our business, financial condition, results of operations or cash flows or the market price of our securities. All subsequent written and oral forward-looking statements by or attributable to us or persons acting on our behalf are expressly qualified in their entirety by these factors. We undertake no obligation to publicly update or revise any forward-looking statement.
Item 1.
Business
OUR COMPANY
Unless the context otherwise indicates, the terms “Comstock,” “we,” “us,” “our,” “our Company” or “the Company” mean Comstock Mining Inc. and its consolidated subsidiaries.
The Company is a producing, Nevada-based, gold and silver mining company with extensive, contiguous property in the historic Comstock and Silver City mining districts (collectively, the “Comstock District”). The Comstock District is located within the western portion of the Basin and Range Providence of Nevada, between Reno and Carson City. The Company was incorporated in Florida in 1999 and reincorporated in Nevada in 2008. The Company began acquiring properties and developing projects in the Comstock District in 2003. Since then, the Company has consolidated a substantial portion of the Comstock District, secured permits, built an infrastructure and brought exploration projects into production.
Because of the Comstock District’s historical significance, the geology is well known and has been extensively studied by the Company, our advisors and many independent researchers. We have expanded our understanding of the geology of the project area through vigorous surface mapping and drill hole logging. The volume of geologic data is immense, and thus far the reliability has been excellent, particularly in the various Lucerne Mine areas. We have amassed a large library of historic data and detailed surface mapping of Comstock District properties and continue to obtain historic information from private and public sources. We use such data in conjunction with information obtained from our current mining operations to target geological prospective exploration areas and plan exploratory drilling programs.
Our Lucerne Resource area is located in Storey County, Nevada, approximately three miles south of Virginia City and 30 miles southeast of Reno. Our Dayton Resource area, is located in Lyon County, Nevada, approximately six miles south of Virginia City. Access to the properties is by State Route 342, a paved highway.
Our business plan is to deliver stockholder value by validating qualified resources (measured and indicated) and reserves (proven and probable) of at least 3,250,000 gold equivalent ounces from our first two resource areas, Lucerne and Dayton; and significantly grow the commercial development of our operations through coordinated, district wide plans that are economically feasible and socially responsible.
The Company has already met the first three intermediate resource validation objectives by validating measured and indicated resources containing more than 2,100,000 gold equivalent ounces.
The Company has developed a mine plan intended to achieve initial commercial mining and processing operations in the Lucerne Mine and annual production rates of approximately 40,000 gold equivalent ounces. The Company achieved initial production and held its first pour of gold and silver on September 29, 2012 and produced more than 20,000 gold equivalent ounces in 2013.
The Company continues acquiring additional properties in the Comstock District, expanding its footprint and creating opportunities for exploration and mining. The Company now owns or controls approximately 7,447 acres of mining claims and parcels in the Comstock and Silver City Districts (a 26 % increase from 2012). The acreage is comprised of 1,376 acres of patented claims (private lands) and surface parcels (private lands) and 6,071 acres of unpatented mining claims, that are administered by the Bureau of Land Management (“BLM”).
The Company’s hospitality segment owns and operates the Gold Hill Hotel and related cottages. The hospitality segment is not generally seasonal in nature except for the period November through February when tourism population volumes are commonly lower.
Financial information for each of our segments is disclosed in footnote 15 to the consolidated financial statements.
Current Projects
The Company’s headquarters, mine operations and heap leach processing facility are in Storey County, Nevada, at 1200 American Flat Road, approximately three miles south of Virginia City, Nevada and 30 miles southeast of Reno, Nevada. The Company has focused to date on the Lucerne Resource area (including the east-side target within this area), the Dayton Resource area and the Spring Valley exploration target. We also plan on focusing exploration on the Northern Extension, Northern Targets, and Occidental Target areas subsequent to the exploration and development of Lucerne, Dayton and Spring Valley. The Company’s existing heap leach processing facility for gold and silver was redesigned and expanded in late 2013 to accommodate new production plans.
The Lucerne Resource area has been the focus of the Company’s exploration and development efforts since 2007. It includes the previously mined Billie the Kid, Hartford and Lucerne mining claims, and extends northeasterly to the area of the historic Woodville bonanza, and north to the historic Justice and Keystone mines. The Company has the key mining permits required for this area. The Lucerne Resource area is approximately 5,000 feet long, with an average width of 600 feet, representing less than three percent of the land holdings controlled by the Company and is the site of our current production activities. The east-side target within this area ranks as one of the Company’s top exploration and production expansion targets for late 2014.
The Dayton Resource area is southwest of Silver City in Lyon County, Nevada. It generally includes the Dayton, Kossuth and Alhambra claims, including the old Dayton mine workings, south to where the Kossuth claim crosses State Route 341. The historic Dayton mine was the last major underground mining operation in the Comstock District, before being closed after the War Production Board promulgated Limitation Order L-208, 7 F. R. 7992 on October 8, 1942, that closed down all gold mining operations in the United States and its territories. The Dayton Resource area ranks as one of the Company’s top exploration and potential mine production targets. Recently, the Lyon County Board of Commissioners approved a strategic master plan and zoning changes on the Dayton, Kossuth and Alhambra mining claims and other properties located in the Dayton Resource Area, enabling a more practical, comprehensive feasibility study for mining.
The Spring Valley exploration target lies at the southern end of the Comstock District, where the mineralized structures lie mostly concealed beneath a veneer of sediment gravels. The area includes the Kossuth claim south of State Route 341, the Dondero property, the New Daney lode mining claims, and the Company’s placer mining claims in Spring Valley and Gold Canyon.
The Northern Extension, Northern Targets and Occidental areas represent exploration target areas that contain many historic mining operations, including the Overman, Con Imperial, Caledonia, and Yellow Jacket mines, among others. Previous operators have explored the various mines in this area, some of which have led to mineralized material inventories. We believe that our consolidation of the Comstock District has provided us with opportunities to utilize the historical information available to identify drilling targets with significant potential.
5
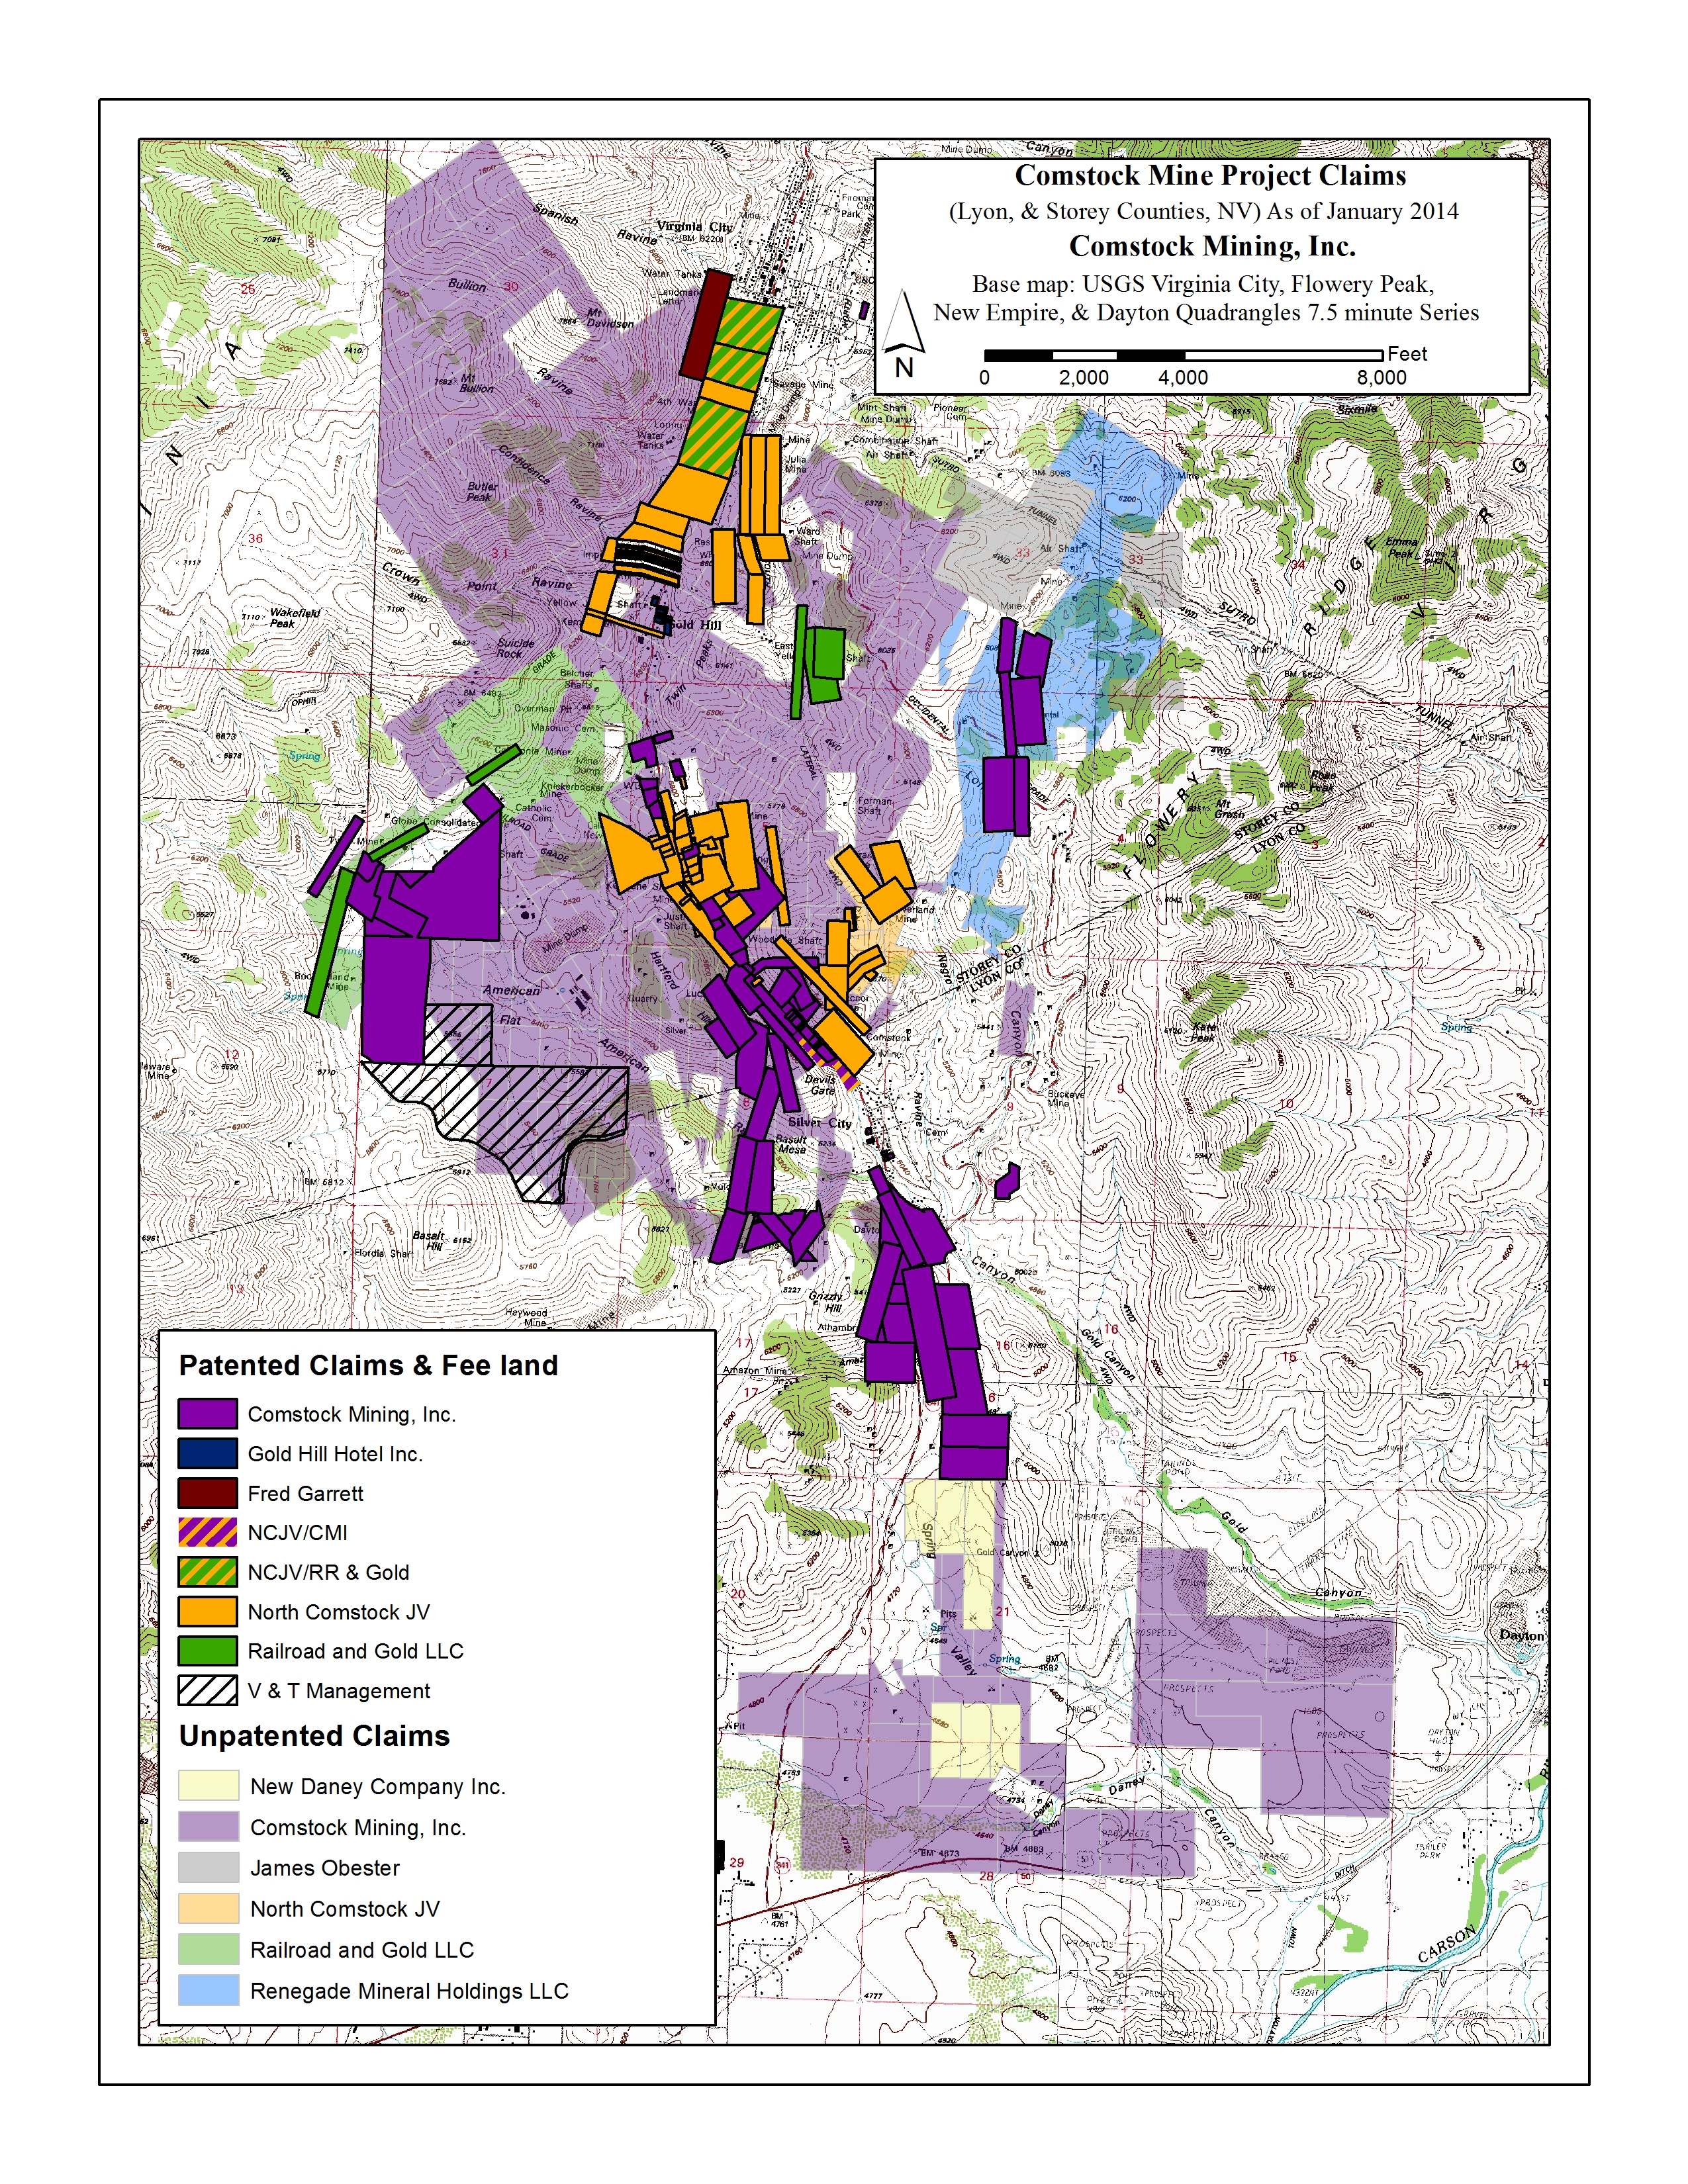
Figure-1 Comstock Mining’s Claims in Storey and Lyon Counties, Nevada
6
Our Comstock exploration activities include open pit gold and silver test mining, as defined by the Securities Exchange Commission (“SEC”) Industry Guide 7, we have not yet established any proven or probable reserves at our Comstock Lode Project.
Employees
As of December 31, 2013, we have 118 full-time mining employees, inclusive of our general and administrative function. We also have 5 full-time and 12 part-time hospitality employees working for the Gold Hill Hotel Inc.
Principal Markets
We sell our production on world markets at prices established by commodity markets. These prices are not within our control. We had revenues of
$24,103,013
in our first full year of production in our mining segment and $
723,574
of revenues in our hospitality segment during the year ended December 31, 2013. We had operating losses of $
20,539,151
and $
393,651
in our mining and hospitality segments, respectively, during the year ended December 31, 2013. We had total assets of
$42,841,452
and $
1,158,544
in our mining and hospitality segments, respectively, as of December 31, 2013. We did not have a hospitality segment for any period prior to fiscal year 2011. See footnote15 to our audited consolidated financial statements for additional information regarding our segments.
Government Regulation
Mining operations and exploration activities are subject to various national, state, and local laws and regulations in the United States, which govern prospecting, development, mining, production, exports, taxes, labor standards, occupational health, waste disposal, protection of the environment, mine safety, hazardous substances, and other matters. We have obtained or have pending applications for substantially all of those licenses, permits, and other authorizations currently required for our exploration and other programs. We believe that we are in compliance in all material respects with applicable mining, health, safety and environmental statutes and regulations. Capital expenditures relating to compliance with laws and regulations that regulate the discharge of materials into the environment, or otherwise relating to the protection of the environment, comprise a substantial part of our historical capital expenditures and our anticipated future capital expenditures. For example, we incur certain expenses and liabilities associated with our reclamation obligations. See “Reclamation” section below.
Reclamation
We are generally required to mitigate long-term environmental impacts by stabilizing, contouring, resloping, and revegetating various portions of a site after mining and mineral processing operations are completed. These reclamation efforts are conducted in accordance with plans reviewed and approved by the appropriate regulatory agencies.
The Nevada Revised Statutes and regulations promulgated by the Nevada State Environmental Commission and the Nevada Division of Environmental Protection, Bureau of Mining and Reclamation require a surety bond to be posted for mining projects that leave the site safe, stable and capable of providing for a productive post-mining land use. The Nevada State Environmental Commission and Division of Environmental Protection have approved our most recent reclamation plan, as revised, of $5,200,000. In July 2012, the Company placed a $4.67 million reclamation surety bond, through the Lexon Surety Group (“Lexon”) with the State of Nevada's Bureau of Mining Regulation Reclamation (“BMRR”). In November, 2013, the reclamation surety bond requirements were increased to $5.2 million. The surety bond requirements will be increased to approximately $6.35 million in March 2014.
As part of the surety agreement, the Company agreed to pay a 2.5% annual bonding fee and has signed a corporate guarantee. The cash collateral percentage due to Lexon is 50% of the total state bond amount of $5.2 million. At December 31, 2013, $1.6 million of the required collateral has been deposited and the remaining $1 million, payable in installments, is recorded as an accrued expense.
Competition
We compete with other mineral exploration and mining companies in connection with the acquisition of gold and other mineral properties and the attraction and retention of human capital. This competition may have substantially greater financial resources than we do.
7
History
The Company began acquiring properties and developing projects in the Comstock District in 2003. The Company produced over 12,000 ounces of gold and over 53,000 ounces of silver from 2004-2006 from our existing Lucerne mine and American Flat heap leach processing facilities. Our test mining activities were concluded in January 2007, when based on our longer-term production plans, we prioritized land consolidation and mine planning. The Company restarted mining operations in the third quarter of 2012 and resumed pouring doré bars of silver and gold in September 2012. In 2013, we accomplished the first major phase of our production plan goal by pouring over 20,000 gold equivalent ounces, that is,
17,739
ounces of gold and
186,482
ounces of silver.
Customers
All accounts receivable amounts related to mining are due from a single customer. Substantially all mining revenues recorded to date relate to the same customer. As gold can be sold through numerous gold market traders worldwide, the Company is not economically dependent on a limited number of customers for the sale of its product. The hospitality segment has numerous customers and is not dependent on any one customer.
Financing Events
During 2013, we completed two equity financing transactions resulting in over $18.75 million in gross financing to fund working capital, ramp up of initial operations, acquire properties, plant and equipment, and support mine development, and other general corporate matters.
On February 11, 2014, the Company entered into a new, lower cost $5 million revolving credit facility (the “Revolving Credit Facility”) with Auramet International, LLC, pursuant to which the Company may borrow up to $5 million outstanding at any one time. The proceeds of the Revolving Credit Facility will be used for working capital, including production ramp up and preparations for expansion of the Lucerne Mine, including targeted drilling on the east side of the Lucerne Resource area. Interest is payable at 9.5% per annum, and was paid in advance on the closing date of the Revolving Credit Facility. The indebtedness under the Revolving Credit Facility is secured by a security interest in certain real estate owned by the Company within the Company’s starter mine and a first priority security interest in all personal property of the Company and its wholly-owned subsidiary Comstock Mining LLC, subject to any existing or future Permitted Liens (as defined under the Revolving Credit Facility). Provided that no default has occurred and is continuing, and the Company has already repaid the principal amount of borrowings under the Revolving Credit Facility in an amount of not less than $1,000,000, the Company has the option until October 6, 2014 to re-borrow funds under the Revolving Credit Facility. The Revolving Credit Facility contains a covenant that requires the Company to maintain a minimum liquidity balance of $1 million (including cash and cash equivalents, plus 90% of the value of any doré that has been picked up by a secured carrier but not yet paid for, as of any date of determination). The Revolving Credit Facility additionally contains customary representations, warranties, affirmative covenants, negative covenants, and events of default, as well as conditions to borrowings. On February 12, 2014, the Company drew down proceeds of approximately $4.6 million. The Revolving Credit Facility will be repaid through 14 semi-monthly cash payments of $357,143 beginning August 8, 2014 and ending February 6, 2015.
An investment in our securities involves risk. You should carefully consider the following risk factors, in addition to those discussed elsewhere in this report, in evaluating our Company, its business, its industry and prospects. The risks described below are not the only ones facing us. Additional risks not presently known to us, or that we currently deem immaterial, may also have a material adverse effect on us. The following risks could cause our business, financial condition, results of operations or cash flows to be materially and adversely affected. In that case, the market price of our securities could decline, and you could lose part or all of your investment.
8
You may lose all or part of your investment.
If we are unable to find and mine adequate quantities of gold and silver ore, it is unlikely that the cash generated from our internal operations will suffice as a primary source of the liquidity necessary for anticipated working capital requirements. There is no assurance that the Company’s initiatives to improve its liquidity and financial position will be successful. Accordingly, there is substantial risk that the Company will be unable to continue as a going concern. In the event of insolvency, liquidation, reorganization, dissolution or other winding up of the Company, the Company’s creditors and preferred stockholders would be entitled to payment in full out of the Company’s assets before holders of common stock would be entitled to any payment, and the claims on such assets may exceed the value of such assets.
Because we may never earn significant revenues from our mine operations, our business may fail.
Our first full year of production was 2013. We have yet to generate positive earnings and there can be no assurance that we will ever operate profitably. We have a limited operating history. The success of our Company is significantly dependent on the uncertain events of the discovery and exploitation of mineralized materials on our properties or selling the rights to exploit those materials. If our business plan is not successful and we are not able to operate profitably, then our securities may become worthless and investors may lose all of their investment in our Company.
We recognize that if we are unable to generate significant revenues from the exploration and exploitation of our mineralized materials in the future, we will not be able to earn profits or continue operations. There is no history upon which to base any assumption as to the likelihood that we will prove successful, and we can provide no assurance that we will generate significant revenues or ever achieve profitability. If we are unsuccessful in addressing these risks, our business will fail and investors may lose all of their investment in our Company.
Transportation difficulties and weather interruptions may affect and delay proposed mining operations and impact our business plans
.
Our mining properties are accessible by road. The climate in the area is hot and dry in the summer but cold and subject to snow in the winter, which could at times hamper accessibility depending on the winter season precipitation levels. As a result, our exploration and mining plans could be delayed for several months each year. Such delays could affect our anticipated business operations and increase our expenses.
Supplies and equipment needed for exploration may not always be available. If we are unable to secure exploration supplies we may have to delay our anticipated business operations
.
Competition and unforeseen limited sources of supplies needed for our proposed exploration work could result in occasional shortages of supplies of certain products, equipment or materials. There is no guarantee we will be able to obtain certain products, equipment and/or materials as and when needed, without interruption, or on favorable terms, if at all. Such delays could affect our anticipated business operations and increase our expenses.
We have invested capital in high-risk mineral projects where we have not conducted sufficient exploration and engineering studies
.
We have invested capital and have otherwise been involved in various mineral properties and projects in the Comstock District where we have not conducted sufficient exploration and engineering studies to minimize the risk of project failure to the extent that is typical in the mining industry or prudent considering our size. Our mineral projects involve high risks because we have not invested sufficiently in the characterization of mineralized material, geologic analysis, metallurgical testing, mine planning and economic analysis to the same extent that other mining companies might deem reasonable. Standard industry practice calls for a mining company to prepare a formal mine plan and mining production schedule and have these documents reviewed and validated by a third party specialist. We have not had a formal mine plan and mining production schedule economically validated by a third party specialist.
9
We will not be successful unless we recover precious metals and sell them for a profit.
Our success depends on our ability to recover precious metals, process them, and successfully sell them for more than the cost of production. The success of this process depends on the market prices of metals in relation to our costs of production. We may not be able to generate a profit on the sale of gold or other minerals because we have limited control over our costs and have no ability to control the market prices. The total cash costs of production at any location are frequently subject to great variation from year to year as a result of a number of factors, such as the changing composition of ore grade or mineralized material production, and metallurgy and exploration activities in response to the physical shape and location of the ore body or deposit. In addition, costs are affected by the price of commodities, such as fuel and electricity. Such commodities are at times subject to volatile price movements, including increases that could make production unprofitable. A material increase in production costs or a decrease in the price of gold or other minerals could adversely affect our ability to earn a profit on the sale of gold or other minerals.
We do not have proven or probable reserves, and there is no assurance that the quantities of precious metals we produce will be sufficient to recover our investment and operating costs.
Our success depends on our ability to produce sufficient quantities of precious metals to recover our investment and operating costs. We do not have proven or probable reserves. Substantial expenditures are required to acquire existing gold properties with established reserves or to establish proven or probable reserves through drilling and analysis. We do anticipate expending large sums for additional drilling and analysis which may or may not establish proven or probable reserves on our properties. We drill in connection with our mineral exploration and mining activities and not with the purpose of establishing proven and probable reserves. While we estimate the amount of mineralized material we believe exists on our properties, our calculations are subject to uncertainty due to several factors, including the quantity and grade of ore, metal prices and recoverability of minerals in the mineral recovery process. There is a great degree of uncertainty attributable to the calculation of any mineralized material, particularly where there has not been significant drilling, mining and processing. Until the mineralized material located on our properties is actually mined and processed, the quantity and quality of the mineralized material must be considered as an estimate only. In addition, the estimated value of such mineralized material (regardless of the quantity) will vary depending on metal prices. Any material change in the estimated value of mineralized material may negatively affect the economic viability of our properties. In addition, there can be no assurance that we will achieve the same recoveries of metals contained in the mineralized material as in small-scale laboratory tests or that we will be able to duplicate such results in larger scale tests under on-site conditions or during production. There can be no assurance that our exploration activities will result in the discovery of sufficient quantities of mineralized material to recover our investment and operating costs.
The cost of our exploration and acquisition activities is substantial, and there is no assurance that the quantities of minerals we discover or acquire will justify commercial operations or replace reserves established in the future.
Mineral exploration, particularly for gold and other precious metals, is highly speculative in nature, involves many risks, and frequently is nonproductive. There can be no assurance that our exploration and acquisition activities will be commercially successful. If gold mineralization is discovered, it may take a number of years from the initial phases of drilling until production is possible, during which time the economic feasibility of production may change. Substantial expenditures are required to acquire existing gold properties, to establish ore reserves through drilling and analysis, to develop metallurgical processes to extract metal from the ore, and in the case of new properties, to develop the processing facilities and infrastructure at any site chosen for mineral exploration. There can be no assurance that any gold reserves or mineralized material that may be discovered or acquired in the future, if any, will be in sufficient quantities or of adequate grade to justify commercial operations or that the funds required for mineral production operation can be obtained on a timely or reasonable basis, if at all. Mining companies must continually replace mineralized material or reserves depleted by production. There can be no assurance that we will be successful in replacing any reserves or mineralized material acquired or established in the future.
10
The price of gold and silver fluctuate on a regular basis and a downturn in price could negatively impact our operations and cash flow.
Our operations will be significantly affected by changes in the market price of gold and silver if we are able to produce gold or other minerals. Gold and silver prices can fluctuate widely and may be affected by numerous factors, such as expectations for inflation, levels of interest rates, currency exchange rates, central bank sales, forward selling or other hedging activities, demand for precious metals, global or regional political and economic crises and production costs in major gold-producing regions, such as but not limited to South Africa and the former Soviet Union. The aggregate effect of these factors, all of which are beyond our control, is impossible for us to predict. If gold or silver prices decline substantially, it could adversely affect the realizable value of our assets and potentially, future results of operations and cash flow.
The use of hedging instruments may not prevent losses being realized on subsequent price decreases or may prevent gains being realized from subsequent price increases.
We may from time to time sell some future production of gold pursuant to hedge positions. If the gold price rises above the price at which future production has been committed under these hedge instruments, we will have an opportunity loss. If the gold price falls below that committed price, we may experience losses if a hedge counterparty defaults under a contract when the contract price exceeds the gold price. As of December 31, 2013, we have no material open hedge positions.
Since our business consists of exploring for, producing from, or acquiring gold and silver prospects, the drop in the price of gold or silver will negatively affect our asset values, cash flows, potential revenues and profits.
We plan to pursue opportunities to acquire properties with gold or silver mineralized material or reserves with exploration potential. The price that we pay to acquire these properties will be influenced, in large part, by the price of gold and silver at the time of the acquisition. Our potential future revenues are expected to be derived from the production and sale of gold and silver from these properties or from the sale of some of these properties. The value of any gold reserves and other mineralized material, and the value of any potential mineral production therefrom, will vary in direct proportion to variations in those mineral prices. The price of gold and silver has fluctuated widely as a result of numerous factors beyond our control. The effect of these factors on the price of gold and silver, and therefore the economic viability of our projects, cannot accurately be predicted. Any drop in the price of gold or silver would negatively affect our asset values, cash flows, potential revenues and profits.
We compete with other mineral exploration and mining companies which could lead to the loss of opportunities.
We compete with other mineral exploration and mining companies or individuals, including large, established mining companies with substantial capabilities and financial resources, to acquire rights to mineral properties containing gold and other minerals. There is a limited supply of desirable lands available for claim staking, lease or other acquisition. There can be no assurance that we will be able to acquire such properties when competing against competitors with substantially greater financial resources than we have.
The estimation of the ultimate recovery of gold and silver from the Lucerne Mine, although based on standard industry sampling and estimating methods, is subjective. Actual recoveries may vary from our estimations.
Our Lucerne Mine utilizes the heap leach process to extract gold and silver from ore. The heap leach process extracts gold and silver by placing ore on an impermeable pad and applying a diluted cyanide solution that dissolves a portion of the contained gold and silver, which are then recovered in metallurgical processes. We use several integrated steps in the process of extracting gold and silver to estimate the metal content of ore placed on the leach pad. Although we refine our estimates as appropriate at each step in the process, the final amounts are not determined until a third-party smelter converts the doré and determines final ounces of gold and silver available for sale. We then review this end result and reconcile it to the estimates we developed and used throughout the production process. Based on this review, we adjust our estimation procedures when appropriate. Due to the complexity of the estimation process and the number of steps involved, among other things, actual recoveries can vary from estimates, and the amount of the variation could be significant and could have a material adverse impact on our financial condition and results of operations.
Each of these factors not only applies to our current and future operations at the Lucerne Mine, but will also apply to any other active mine property and any future development of other properties not yet in production. In the case of mines that we may develop in the future, we will not have the benefit of actual experience in our estimates with respect to those mines, and there is a greater likelihood that actual results will vary from the estimates.
11
Reserve and other mineralized material calculations are estimates only, and are subject to uncertainty due to factors including metal prices, inherent variability of the ore and recoverability of metal in the mining process.
The calculation of mineral reserves, other mineralized material and grading are estimates and depend upon geological interpretation and statistical inferences or assumptions drawn from drilling and sampling analysis, which may prove to be unpredictable. There is a degree of uncertainty attributable to the calculation of mineral reserves and corresponding grades. Until mineral reserves and other mineralized materials are actually mined and processed, the quantity of ore and grades must be considered as an estimate only. In addition, the quantity of mineral reserves and other mineralized materials and ore may vary depending on metal prices. Any material change in the quantity of mineral reserves, other mineralized materials, mineralization, grade or stripping ratio may affect the economic viability of our properties. In addition, we can provide no assurance that gold recoveries or other metal recoveries experienced in small-scale laboratory tests will be duplicated in larger scale tests under on-site conditions or during production.
Cost estimates and timing of new projects are uncertain, which may adversely affect our expected production and profitability.
The capital expenditures and time required to develop and explore our properties, including the Lucerne Mine and the Dayton Resource area, are considerable and changes in costs, construction schedules or both, can adversely affect project economics and expected production and profitability. There are a number of factors that can affect costs and construction schedules, including, among others:
|
•
|
availability of labor, energy, transportation, equipment, and infrastructure;
|
|
•
|
changes in input commodity prices and labor costs;
|
|
•
|
fluctuations in currency exchange rates;
|
|
•
|
availability and terms of financing;
|
|
•
|
changes in anticipated tonnage, grade and metallurgical characteristics of the ore to be mined and processed;
|
|
•
|
recovery rates of gold and other metals from the ore;
|
|
•
|
difficulty of estimating construction costs over a period of year;
|
|
•
|
delays in completing any environmental review or in obtaining environmental or other government permits;
|
|
•
|
weather and severe climate impacts;
|
|
•
|
potential delays related to social and community issues.
|
We currently recover gold and silver from oxide ores at the Lucerne Mine. Oxide heap leach mining and processing has inherent variation, therefore, the costs and yields from this type of operation could vary greatly from our estimates.
Our activities are inherently hazardous and any exposure may exceed our insurance limits or may not be insurable.
Mineral exploration and operating activities are inherently hazardous. Operations in which we have direct or indirect interests will be subject to all the hazards and risks normally incidental to exploration and production of gold and other metals, any of which could result in work stoppages, damage to property and possible environmental damage. The nature of these risks is such that liabilities might exceed any applicable liability insurance policy limits. It is also possible that the liabilities and hazards might not be insurable, or we could elect not to insure ourselves against such liabilities because of the high premium costs, in which event, we could incur significant costs that could have a material adverse effect on our financial condition.
Our ability to execute our strategic plans depends upon our success in obtaining a variety of required governmental approvals that may be opposed by third-parties.
We do not possess all of the governmental approvals necessary to conduct the full extent of the operations contemplated by our strategic plan. Those operations will be delayed, hindered or prevented to the extent that we are unable to obtain the necessary permits and approvals in a timely fashion or at all. This inability may occur due to a variety of factors, including opposition by third parties, such as members of the public or environmental groups. We expect that future permit and approval applications and issuances will meet with similar opposition. We may encounter delays and added costs if permits and approvals are challenged.
12
Our operations are subject to strict environmental laws and regulations, which result in added costs of operations and operational delays.
Our operations are subject to strict environmental regulations, which could result in additional costs and operational delays. All phases of our operations are subject to environmental regulation. Environmental legislation is evolving in the United States generally, and Nevada specifically, in a manner that may require stricter standards and enforcement, increased fines and penalties for non-compliance, more stringent environmental assessments of proposed projects, and a heightened degree of responsibility for companies and their officers, directors, and employees. There is no assurance that any future changes in environmental regulation will not negatively affect our projects.
At the state level, mining operations in Nevada are regulated by the Nevada Division of Environmental Protection, or NDEP. Nevada state law requires our Nevada projects to hold Nevada water pollution control permits, which dictate operating controls and closure and post-closure requirements directed at protecting surface and ground water. In addition, we are required to hold Nevada reclamation permits required under Nevada law. These permits mandate concurrent and post-mining reclamation of mines and require the posting of reclamation bonds sufficient to guarantee the cost of mine reclamation. Other Nevada regulations govern operating and design standards for the construction and operation of any source of air contamination and landfill operations. Any changes to these laws and regulations could have a negative impact on our financial performance and results of operations by, for example, requiring changes to operating constraints, technical criteria, fees or surety requirements.
Because our land holdings are within the Carson River Mercury Superfund Site, our operations are subject to certain soil sampling and potential remediation requirements, which will result in added costs and delays; and we are also potentially subject to further costs as the result of on-going government investigation and future remediation decisions.
Substantially all of our land holdings are within the Carson River Mercury Superfund Site (CRMS) Study Area and portions are within the risk area boundaries identified by NDEP and the United States Environmental Protection Area (USEPA). These risk areas have been defined due to the known or suspected presence of certain contaminants of concern, including mercury, arsenic and lead. To comply with the agencies’ requirements in these areas, the Company will conduct a soil sampling pursuant to a plan that has been approved by the NDEP. This sampling is intended to demonstrate the absence of contamination before mining, processing or other operations in that area. If contamination above agency-established levels of concernis encountered, the Company intends to excavate and process such materials for metals recovery wherever feasible. If metals recovery is not feasible, the Company may avoid or defer excavating in that area or remove the materials for disposal. Through this sampling program and, if necessary, removal of contaminated materials, the Company intends to enable the NDEP and USEPA to better define the Carson River Superfund Site and the currently designated risk areas so as to eventually exclude our land holdings from such areas and from the Site itself to the maximum extent feasible. The NDEP and USEPA are continuing to study the ecological and human health risks that may be presented by contaminated sediments in certain portions of the Carson River watershed and downstream areas. The agencies’ studies indicate that these contaminants are primarily associated with historic mining tailings that have been redistributed into these waterways. The agencies have not adopted a remedial plan for these sediments nor have they decided whether remediation will be undertaken. Thus, there is no assurance that the Company will not be asked to undertake additional investigatory or remediation activities or to pay for such activities by the agencies or that future changes in CRMS-related requirements will not negatively affected our operations.
We have no insurance for environmental problems.
Insurance against environmental risks, including potential liability for pollution or other hazards as a result of the disposal of waste products occurring from exploration and production, has not generally been available in the mining industry. We have no insurance coverage for most environmental risks. In the event of a problem, the payment of environmental liabilities and costs would reduce the funds available to us for future operations. If we are unable to fund the cost of remedying an environmental problem, we might be required to enter into an interim compliance measure pending completion of the required remedy.
13
We are subject to federal and state laws that require environmental assessments and the posting of bonds, which add significant costs to our operations and delays in our projects.
Mining companies must post a bond or other surety to guarantee the cost of post-mining reclamation. These requirements could add significant additional cost and delays to any mining project undertaken by us. Our mineral exploration operations are required to be covered by reclamation bonds deemed adequate by regulators to cover these risks. We believe we currently maintain adequate reclamation bonds for our operations.
The Bureau of Land Management (“BLM”) requires that mining operations on lands subject to its regulation obtain an approved plan of operations subject to environmental impact evaluation under the National Environmental Policy Act. Any submission or significant modification to a plan of operations may also require the completion of an environmental assessment or Environmental Impact Statement prior to approval.
Title claims against our properties could require us to compensate parties making such claims, if successful, and divert management’s time from operations.
There may be challenges to our title in the properties in which we hold material interests. If there are title defects with respect to any of our properties, we might be required to compensate other persons or perhaps reduce our interest in the affected property. The validity of unpatented mineral claims, which constitute most of our holdings in the United States, is often uncertain and may be contested by the federal government and other parties. The validity of an unpatented mineral claim, in terms of both its location and its maintenance, depends on strict compliance with a complex body of federal and state, statutory and decisional law. Although we have attempted to acquire satisfactory title to our properties, we have not obtained title opinions or title insurance with respect to the acquisition of the unpatented mineral claims. The investigation and resolution of title issues would divert management’s time from ongoing exploration programs.
Our business depends on a limited number of key personnel, the loss of whom could negatively affect us.
Our officers and employees are important to our success. If any of them becomes unable or unwilling to continue in their respective positions, and we are unable to find suitable replacements, our business and financial results could be materially negatively affected.
Our stock is a penny stock and trading of our stock may be restricted by the SEC’s penny stock regulations, which may limit a stockholder’s ability to buy and sell our stock.
Our stock is a penny stock. Rule 3a51-1 generally defines “penny stock” to be any equity security that has a market price (as defined) less than $5.00 per share or an exercise price of less than $5.00 per share, subject to certain exceptions. Our securities are covered by the penny stock rules, which impose additional sales practice requirements on broker-dealers that sell to persons other than established customers and “accredited investors.” The term “accredited investor” refers generally to institutions with assets in excess of $5,000,000 or individuals with a net worth in excess of $1,000,000 (excluding one’s primary residence) or annual income exceeding $200,000 individually or $300,000 jointly with their spouse. The penny stock rules (including Rule 15g-9) require a broker-dealer, prior to a transaction in a penny stock not otherwise exempt from the rules, to deliver a standardized risk disclosure document in a form prepared by the SEC, which provides information about penny stocks and the nature and level of risks in the penny stock market. The broker-dealer also must provide the customer with current bid and offer quotations for the penny stock, the compensation of the broker-dealer and its salesperson in the transaction, and monthly account statements showing the market value of each penny stock held in the customer’s account. The bid and offer quotations, and the broker-dealer and salesperson compensation information, must be given to the customer orally or in writing prior to effecting the transaction and must be given to the customer in writing before or with the customer’s confirmation. In addition, the penny stock rules require that, prior to a transaction in a penny stock not otherwise exempt from these rules, the broker-dealer must make a special written determination that the penny stock is a suitable investment for the purchaser and receive the purchaser’s written agreement to the transaction. These disclosure requirements may have the effect of reducing the level of trading activity in the secondary market for the stock that is subject to these penny stock rules. Consequently, these penny stock rules may affect the ability of broker-dealers to trade our securities. We believe that the penny stock rules discourage investor interest in and limit the marketability of our common stock. The Financial Industry Regulatory Authority (FINRA) sales practice requirements may also limit a stockbroker’s ability to buy or sell our stock.
14
In addition to the “penny stock” rules promulgated by the SEC, FINRA has adopted rules that require that in recommending an investment to a customer, a broker-dealer must have reasonable grounds for believing that the investment is suitable for that customer. Prior to recommending speculative low priced securities to their non-institutional customers, broker-dealers must make reasonable efforts to obtain information about the customer’s financial status, tax status, investment objectives, and other information. Under interpretation of these rules, FINRA believes that there is a high probability that speculative low priced securities will not be suitable for at least some customers. The FINRA requirements make it more difficult for broker-dealers to recommend that their customers buy our common stock, which may limit your ability to buy or sell our stock and have an adverse effect on the market for our shares.
The price of the Company’s common stock may fluctuate significantly, which could negatively affect the Company and holders of its common stock.
The market price of the Company’s common stock may fluctuate significantly from time to time as a result of many factors, including:
|
•
|
investors’ perceptions of the Company and its prospects;
|
|
•
|
investors’ perceptions of the Company’s and/or the industry’s risk and return characteristics relative to other investment alternatives;
|
|
•
|
investors’ perceptions of the prospects of the mining and commodities markets;
|
|
•
|
difficulties between actual financial and operating results and those expected by investors and analysts;
|
|
•
|
our inability to obtain permits or otherwise fail to reach Company objectives;
|
|
•
|
actual or anticipated fluctuations in quarterly financial and operational results;
|
|
•
|
volatility in the equity securities market; and
|
|
•
|
sales, or anticipated sales, of large blocks of the Company’s common stock.
|
If securities or industry analysts do not publish research or publish inaccurate or unfavorable research about our business, our stock price and trading volume could decline.
The trading market for our common stock will depend in part on the research and reports that securities or industry analysts publish about us or our business. We have relatively little research coverage by securities and industry analysts. If no additional industry analysts commence coverage of the Company, the trading price for our common stock could be negatively impacted. If one or more of the analysts who cover us downgrades our common stock or publishes inaccurate or unfavorable research about our business, our stock price would likely decline. If one or more of these analysts cease coverage of us or fail to publish reports on us regularly, demand for our common stock could decrease, which could cause our stock price and trading volume to decline.
We do not expect to pay any cash dividends for the foreseeable future.
We currently expect to retain all available funds and future earnings, if any, for use in the operation and growth of our business and do not anticipate paying any cash dividends in the foreseeable future. Any future determination to pay cash dividends will be at the discretion of our Board, subject to compliance with applicable law, our organizational documents (including the certificates of designations for our preferred stock, which prohibit cash dividends to common stockholders without the consent of preferred stockholders) and any contractual provisions, including under agreements for indebtedness we may incur, that restrict or limit our ability to pay dividends, and will depend upon, among other factors, our results of operations, financial condition, earnings, capital requirements and other factors that our Board deems relevant. Investors seeking cash dividends in the foreseeable future should not purchase our common stock.
Restrictions imposed by the terms of the Company’s preferred stock may inhibit growth.
The certificates of designations of our preferred stock substantially limit the ability of the Company to incur debt, issue securities, enter into merger or acquisition transactions, redeem capital stock, or pay dividends to common shareholders, among other things. Such restrictions could significantly impact the Company’s ability to take certain actions that potentially could enhance shareholder value.
15
Holders of common stock are minority stockholders of the Company.
Mr. John V. Winfield, the Chairman of our Board of Directors, and entities that he controls (the “Winfield Group”), through its ownership of common stock, preferred shares and warrants of the Company, owns approximately 32.2% of the economic interests of the Company’s capital stock and approximately 68.8% of the voting security interests, in each case on an as converted basis, as of December 31, 2013. As a result, the ability of holders of common stock to determine the management and policies of the Company is significantly limited.
Outstanding convertible securities, options, warrants and restricted shares may result in substantial dilution.
At
December 31, 2013
, we had outstanding
70,188,937
shares of common stock. In addition, we had outstanding preferred shares, options, warrants and restricted shares. At
December 31, 2013
, shares of preferred shares and warrants were convertible into, or exercisable for, a total of approximately 55.3 million additional shares of our common stock, subject to further anti-dilution provisions. At
December 31, 2013
, approximately 3.6 million unvested restricted shares were outstanding.
The terms of the Operating Agreement of Northern Comstock LLC may significantly dilute the ownership interests of the common stock.
The Operating Agreement of Northern Comstock LLC provides for capital contributions by the Company in the form of shares of Series A-1 Convertible Preferred Stock (the “Series A-1 Preferred Stock”) unless Northern Comstock LLC requests payment in cash. The Operating Agreement provides for additional capital contributions of 862.5 shares of Series A-1 Preferred Stock (approximately 1.3 million shares of common stock as converted) on each anniversary of the Operating Agreement through and including the 39
th
anniversary, if no requests for contributions in cash were made. If an event of default occurs under the Operating Agreement, the additional capital contributions could be accelerated and the entire unpaid amount of the Company’s capital contribution, up to the aggregate 30,188 shares of Series A-1 Preferred Stock (approximately 46.4 million shares of common stock as converted) issuable under the Operating Agreement, could become issuable immediately at the option of Northern Comstock LLC. In addition the Operating Agreement provides that each time more than 200,000 additional gold equivalent ounces of measured and indicated resources are validated, the capital contributions for such year will be accelerated to $5 million or 5,000 shares of Series A-1 Preferred Stock.
The Company may issue additional common stock or other equity securities in the future that could dilute the ownership interest of existing stockholders.
The Company is currently authorized to issue 3,950,000,000 shares of common stock, of which
70,188,937
shares were issued and outstanding as of
December 31, 2013
, and 50,000,000 shares of preferred stock, of which 50,165 Preferred Shares are issued and outstanding as of the
December 31, 2013
. To maintain its capital at desired levels or to fund future growth, the Board may decide from time to time to issue additional shares of common stock, or securities convertible into, exchangeable for or representing rights to acquire shares of common stock. The sale of these securities may significantly dilute stockholders’ ownership interest and the market price of the common stock. New investors in other equity securities issued by the Company in the future may also have rights, preferences and privileges senior to the Company’s current stockholders that may adversely impact its current stockholders.
Comstock Mine Project
Location, Access, and Title to the Property
The Comstock Mine Project is located in Storey and Lyon Counties, Nevada. The property is physically situated just south of Virginia City, Nevada. Paved state routes from Reno, Carson City, and Virginia City provide access to the property. The Comstock Mine Project has been the focus of our efforts since 2007, and has been the subject of four National Instruments 43-101 technical reports published in May and August 2010, November 2011 and January 2013.
16
Our property rights to the mineral estate of the Comstock Mine Project consist of five mineral leases, one joint venture (providing exclusive rights to exploration, development, mining and production), and fee ownership of real property and mining claims administered by the BLM. This project has 98 patented and 338 unpatented mineral lode claims, as well as 25 unpatented placer claims. The Comstock Mine Project holdings consist of approximately 7,447 acres of mining claims and parcels. The acreage is comprised of approximately 1,376 acres of patented claims (private lands) and surface parcels (private lands) and approximately 6,071 acres of unpatented mining claims which the Bureau of Land Management, (“BLM”) administers.
The Comstock Mine Project mineral leases are as follows:
Fred Garrett - Lease
On April 1, 2008, we entered into a mineral exploration and mining lease agreement with Fred Garrett et al, covering one patented claim located in Storey County, Nevada. The lease remains in effect as long as exploration, development, mining, or processing operations are being conducted on a continuous basis, without a lapse of activity for more than 180 days. We pay a royalty to the lessor of $250 per month or a 3% net smelter royalty (“NSR”), whichever is greater. We are responsible for the payment and filing of annual maintenance fees, if any, and taxes for these claims.
James Obester Lease
On August 1, 2008, we entered into a mineral exploration and mining lease agreement with James Obester, covering ten unpatented claims located in Storey County. The lease remains in effect as long as exploration, development, mining, or processing operations are conducted on a continuous basis, without a lapse of activity of more than 180 days. We pay a royalty to the lessor amounting to $200 per month for the first two years and later increasing to $300 per month for the following three years, and then increasing to $500 per month thereafter. In addition, a NSR royalty percentage is applicable. The royalty percentage is a 2% NSR when the market price of gold is $900 or less per ounce and 3% NSR when gold is greater than $900 per ounce. We are also responsible for payment and filing of annual maintenance fees, if any, and taxes for these claims.
Railroad & Gold - Lease
On October 1, 2009, we entered into a mineral exploration and mining lease agreement with Railroad and Gold, LLC covering nine patented mining claims and sixteen unpatented mining claims in Storey County. The lease also includes rights for nine town lots and a rural parcel in American Flats. The lease is for an initial term of 15 years, but remains in effect for as long as exploration, development, mining, or processing operations are conducted on a continuous basis. We made an initial payment of $25,000 for the lease. The Company makes annual advance minimum royalty payments, which started with $30,000 on the first anniversary, and increasing by $5,000 each year. We are also required to pay a 4% NSR, which will be reduced by the sum of previously paid advance minimum royalties. We are also responsible for payment and filing of annual maintenance fees, if any, and taxes for these claims.
New Daney - Lease
On June 2, 2010, we entered into a Mineral Exploration and Mining Lease agreement with New Daney Company, Inc. covering seven unpatented lode claims. These claims are located in Lyon County and are contiguous with the Company’s Spring Valley mineral holdings. All production from the property is subject to a 3% NSR. Once permits have been obtained to put the property into production, lease payments will be treated as advance royalties, which will be credited against the NSR. The Company makes advance minimum royalty payments of $200 per month. The lease is for an initial term of five years. We have the option, if we believe the property warrants further development, to extend an additional five years and then continuously thereafter as long as exploration, development, mining, or processing operations are conducted on a continuous basis.
17
Renegade Mineral Holdings - Lease
On October 14, 2010, we acquired twenty-six unpatented lode-mining claims along the southern extension of the Occidental Lode structure in Storey County, Nevada. The historic Occidental Lode, also referred to as the Brunswick Lode, is located 1.5 miles due east of and sub-parallel to the veins of the main Comstock Lode. These claims adjoined and extended the Company’s previous holdings of six patented and six unpatented claims, significantly expanding the Company’s position on the Occidental Lode. The Lease has an initial term of three years and, in the event we determine that exploration results warrant further development, then the term can be extended initially for two additional six-year terms and then continuously thereafter as long as the Company is producing on property adjacent to or in the vicinity of these claims. The agreement includes a 3% NSR from production with the gold price capped at $2,000 per ounce. We are also responsible for payment and filing of annual maintenance fees, if any, and taxes for these claims.
Northern Comstock Minerals
On October 20, 2010, the Company entered into an operating agreement (the “Operating Agreement”) to form Northern Comstock LLC (“Northern Comstock”) with Mr. Winfield, our Chairman and largest shareholder, and an entity controlled by Mr. Winfield, DWC Resources, Inc. (“DWC”). As part of the Operating Agreement, the Company obtained rights relating to certain property formerly owned by DWC in Storey County, Nevada (the “DWC Property”) and two groups of properties leased by Mr. Winfield in Storey County, Nevada from the Sutro Tunnel Company (the “Sutro Property”) and Virginia City Ventures (the “VCV Property”).
Pursuant to the terms of the Operating Agreement for Northern Comstock, DWC contributed the DWC Property to Northern Comstock and John Winfield contributed his rights under the Sutro Property and the VCV Property to Northern Comstock. The Company contributed 862.5 shares of Series A-1 Preferred Stock in each annual period from 2010 to 2013, and contributes its services in the area of mine exploration, development and production to Northern Comstock. The terms of the Operating Agreement provide that on each anniversary of the Operating Agreement, up to and including the thirty-ninth (39
th
) anniversary, the Company will make additional capital contributions in the amount of $862,500, in the form of Series A-1 Preferred Stock or cash (upon request of Northern Comstock, which request for cash can be denied by the Company in certain circumstances). In addition the Operating Agreement provides that each time more than 200,000 gold equivalent ounces of measured and indicated resources are validated, the capital contributions for such year will be accelerated to $5 million or 5,000 shares of Series A-1 preferred stock.
The Operating Agreement provides the Company with the exclusive rights of development, production, mining and exploration on the respective properties and requires the Company to make certain expenditures toward that end. Under the terms of the Operating Agreement, all cash flows from the bullion or other minerals recovered from the ore mined out of the ground but untreated and minerals produced from the milling or reduction of ore to a higher grade produced from the DWC Property, Sutro Property or VCV Property, as applicable, or finished products produced from any such property, will be distributed to the Company after the payment of royalties associated with such properties.
Mineral production from the DWC Property is subject to a royalty on a sliding scale. At market gold prices over $750 per ounce, production of the first 500,000 ounces is subject to a 3% NSR. Production over 500,000 ounces is subject to a 6% NSR. Mineral production from the DWC Property is also subject to a 1% NSR payable to Mr. Art Wilson.
Mineral production on the Sutro Property is subject to a royalty on a sliding scale to John Winfield. At gold prices over $250 per ounce, production of the first 500,000 ounces is subject to a 1% NSR. Production over 500,000 ounces is subject to a 2% NSR. A separate royalty of 5% NSR is also payable to the Sutro Tunnel Company on all production from the Sutro Property. Mineral production from the VCV Property is subject to a 5% NSR. The Company makes advance minimum royalty payments of $6,000 per year on each of the Sutro Property and the VCV Property leases. Each lease is for an initial term of five years. We have the option, if we believe the property warrants further development, to extend an additional five years and then continuously thereafter as long as exploration, development, mining, or processing operations are conducted on a continuous basis.
The Como Project
The Como Project is located in Lyon County, Nevada, approximately 15 miles east of Carson City. The Company performed geological reconnaissance on this property, but has not drilled or collected any samples. We own a 100% interest in eight unpatented lode-mining claims, covering an area of approximately 168 acres in Lyon County, Nevada, that comprise the Como Project.
18
Facilities Area
The Company’s headquarters, mine operations and heap leach processing facility occupy a 78-acre site in Storey County, Nevada, at 1200 American Flat Road, approximately three miles south of Virginia City and 30 miles southeast of Reno, Nevada. The property was included in the acquisition of Plum Mining by the Company in November 2003.
Present Condition of Property and Work Performed
We have completed extensive geological mapping, sampling, and drilling on a portion of the Comstock Mine Project property, in order to characterize the mineralized material. We have performed metallurgical testing, mine planning, and economic analysis, and have produced internal reports of our mineralized material inventory. However, we have not established reserves that meet the requirements of SEC Industry Guide 7. Therefore, any activities that we perform on our lands and claims are considered exploratory in nature, including test mining.
Description of Equipment and other Infrastructure Facilities
We own or lease all property and equipment necessary to conduct mining and doré bar processing operations sufficient to support our current production rates.
Geology, Structure and Mineralization
Gold and silver mineralization in the Lucerne Resource area is highly dependent on geologic attributes including but not limited to: multiple episodes of mineralization; numerous fault structures of varying orientations that acted as fluid conduits for precious metal transport; and amenable host rocks for deposition of economic concentrations of precious metals. The primary host rocks for the current Comstock resource areas are early Miocene age volcanic rocks, primarily andesitic to rhyolite volcanic flows, domes and intrusive rocks.
Mineralization in the Lucerne Resource area is located in the historic mine sites of the Lucerne open-cut, Silver Hill, Hartford and Billie the Kid. The mentioned historic mines extracted precious metals from mining veins developed within the northwest striking Silver City fault zone. Detailed geologic studies by our geologic staff have identified within the Silver City fault zone four definitive sub-parallel northwest striking mineralized structures. The spacing between each of these structures is approximately 100 to 150 feet.
Our geologists have identified structurally complex zones developed within the Silver City fault zone that have enhanced precious metals grade of contiguous mineralization averaging 0.10 gold ounce per ton for 200 feet. The structural complexity is explained by cross-cutting east-west and northeast striking mineralized structures intersecting with the northwesterly striking assembly of Silver City fault zone structures.
Drill intercepts from the Lucerne Resource area commonly exhibit silver to gold ratios of approximately 10:1. This ratio, to date, has been validated from actual production results throughout 2013. This compares to historic ratios of silver to gold of 100:1 located in the northern Comstock District. Currently, exploration drilling has identified gold and silver mineralization over a strike distance of nearly one mile, with definition and in-fill drilling on 50 to 100 foot centers over almost one mile. Mineralization is open-ended to the north and south along strike and down-dip to the east, including the recently discovered Chute Zone in the eastern portion of the Lucerne.
Future Exploration Potential
The Comstock Mining district is a well-known, historic mining district, with over 150 years of production-based history. We have access to extensive reports and maps on various properties in the district, but to-date, we have only conducted detailed geologic exploration and resource modeling on less than 10% of our approximate 7,447 acre land position. We are conducting an ongoing exploration program to locate and test surface mineral targets, as well as deep underground bonanza targets, by using historic compilation, geological mapping, geochemical and geophysical investigations and drilling.
The Company’s mining and exploration activities are subject to various laws and regulations governing the protection of the environment. These laws and regulations are continually changing and are generally becoming more restrictive. The Company believes its operations are in compliance with applicable laws and regulations in all material respects. The Company
19
has made, and expects to make in the future, expenditures to comply with such laws and regulations, but cannot predict the full amount of such future expenditures.
On August 16, 2013, the Company received a “stop order” from the Nevada Division of Environmental Protection (NDEP) with respect to the use of certain crushing and transfer systems of the Company because emissions controls, although effective, were not deemed to be compliant with an applicable permit. The Company was able to remedy the controls and the stop order was lifted on August 23, 2013. The Company did not experience any material delays or work stoppages as a result of the stop order, and therefore revenues were not materially affected.
As a follow up and in accordance with the Nevada Administrative Code, on September 6, 2013, NDEP requested that the Company submit certain information and documentation to NDEP to support NDEP’s determination as to the compliance of the Company’s facility with the conditions of the operating permit. The Company provided all such requested information and documentation on a timely basis in accordance with the request. On February 21, 2014, the Company received a final notice of violation associated with this investigation, indicating no air emission violations occurred; however, a final warning, with no further action required, was issued indicating the Company failed to install certain air pollution control equipment. In most cases, the Company had installed alternative, more effective air control equipment. The Company believes that it is in full compliance with its permits granted by NDEP.
From time to time, we are involved in lawsuits, claims, investigations and proceedings that arise in the ordinary course of business. There are no matters pending that we expect to have a material adverse impact on our business, results of operations, financial condition or cash flow.
Under Section 1503(a) of the Dodd-Frank Wall Street and Consumer Protection Act, mine operations are required to include in their periodic reports filed with the SEC certain information concerning mine safety violations and other regulatory matters. The required information is included in Exhibit 95 to this report.
20
Item 5.
Market for Registrant’s Common Equity, Related Stockholder Matters and Issuer Purchases of Equity Securities
Price Range of Common Stock
Our common stock is traded on the NYSE MKT LLC exchange under the symbol “LODE.” The following table sets forth the quarterly high and low sales prices of our common stock for the periods set forth below:
|
Quarterly Period
|
High
|
Low
|
|||||
|
2013
|
|||||||
|
Fourth Quarter
|
$
|
1.90
|
|
$
|
1.64
|
|
|
|
Third Quarter
|
$
|
2.23
|
|
$
|
1.64
|
|
|
|
Second Quarter
|
$
|
2.06
|
|
$
|
1.65
|
|
|
|
First Quarter
|
$
|
2.20
|
|
$
|
1.78
|
|
|
|
2012
|
|
|
|
|
|||
|
Fourth Quarter
|
$
|
3.37
|
|
$
|
2.10
|
|
|
|
Third Quarter
|
$
|
3.42
|
|
$
|
2.46
|
|
|
|
Second Quarter
|
$
|
2.60
|
|
$
|
1.59
|
|
|
|
First Quarter
|
$
|
2.20
|
|
$
|
1.63
|
|
|
The last reported sale price of our common stock on the NYSE MKT on
March 14, 2014
, was $1.93 per share. As of
March 14, 2014
, the number of holders of record was approximately 526.
Equity Compensation Plan Information
See
Equity Compensation Plan Information
under
Item 11. Executive Compensation
and also below for information on plans approved by our stockholders.
On January 31, 2014, Comstock Mining Inc. (the “Company”) and its Chief Executive Officer and President, Corrado De Gasperis, entered into an amendment (the “Amendment”) to the employment agreement of Mr. De Gasperis, originally dated as of April 21, 2010 (the “Employment Agreement”). The Amendment extended the vesting schedule for equity awards contemplated by the Employment Agreement, so that initial vesting for such awards will not occur prior to May 1, 2014, except under limited circumstances such as a termination without cause, upon death or disability, or in connection with a change of control of the Company.
Recent Sales of Unregistered Securities
Set forth below is information regarding shares of common stock issued by us during the year ended December 31, 2013, and additional issuances through
March 14, 2014
that were not registered under the Securities Act and not previously disclosed in a quarterly report on Form 10-Q or in a current report on Form 8-K. Also included is the consideration, if any, received by us for such shares and information relating to the section of the Securities Act, or rule of the SEC, under which exemption from registration was claimed.
On October 22, 2013, the Company issued 88,888 of Rule 144 restricted shares of common stock to Greg Hess towards the purchase of property known as (the “5 Vacant Lots”). Escrow is scheduled to close on June 30, 2014.
On December 19, 2013, the Company issued 650,000 of Rule 144 restricted shares of common stock to V&T Management LLC as payment towards the purchase of 212 acres of private land (the "V&T Land"), located in American Flat in direct proximity of the Company's processing facilities.
21
On March 4, 2014, the Company issued 543,500 and 436,500 of Rule 144 restricted shares of common stock to Dan and Caroline Salzwimmer as payment towards the purchase of 78 acres of land (the "First Salzwimmer Purchase") and 30 acres of land and buildings (the "Second Salzwimmer Purchase"), respectively, both located in American Flat and directly adjacent to the Company's processing facilities and the V&T Land.
No underwriters were involved in the foregoing issuances of securities. The offers, sales and issuances of the securities described above were deemed to be exempt from registration under the Securities Act in reliance upon Section 4(2) of the Securities Act. The issuance of stock that was a private offering to accredited investors within the meaning of Rule 501 of Regulation D of the Securities Act. Each of the recipients of securities in these transactions had adequate access, through directorship, business or other relationships, to information about us.
The disclosure required pursuant to Items 201(d) and (e) of Regulation S-K is incorporated by reference to our definitive proxy statement.
Dividend Policy
We have never declared or paid any dividends on our common stock. We do not anticipate paying any cash dividends on our common stock in the foreseeable future. We currently intend to retain future earnings, if any, to finance operations and the expansion of our business. Any future determination to pay cash dividends will be at the discretion of the board of directors and will depend upon our financial condition, operating results, capital requirements and other factors the board of directors deems relevant. We are restricted from declaring or paying common stock dividends in cash under the terms of our Preferred Stock.
22
|
|
YEARS ENDED DECEMBER 31,
|
||||||||||||||||||
|
|
2013
|
2012
|
2011
|
2010
|
2009
|
||||||||||||||
|
REVENUES
|
|
|
|
|
|
|
|
|
|||||||||||
|
Revenue - Mining
|
$
|
24,103,013
|
|
$
|
4,504,457
|
|
$
|
—
|
|
$
|
—
|
|
$
|
—
|
|
||||
|
Revenue - Hospitality
|
723,574
|
|
634,159
|
|
473,386
|
|
—
|
|
—
|
|
|||||||||
|
Total revenues
|
24,826,587
|
|
5,138,616
|
|
473,386
|
|
—
|
|
—
|
|
|||||||||
|
COST AND EXPENSES
|
|
|
|
|
|
|
|
|
|||||||||||
|
Costs applicable to mining revenue
|
26,495,665
|
|
3,554,727
|
|
—
|
|
—
|
|
—
|
|
|||||||||
|
Hospitality operating costs
|
1,117,225
|
|
928,897
|
|
570,039
|
|
—
|
|
—
|
|
|||||||||
|
Reclamation and exploration expenses
|
8,504,992
|
|
18,305,303
|
|
9,501,327
|
|
3,938,560
|
|
3,019,537
|
|
|||||||||
|
General and administrative
|
7,968,725
|
|
9,277,944
|
|
4,474,726
|
|
2,104,018
|
|
1,303,939
|
|
|||||||||
|
Consultants and professional fees
|
1,672,782
|
|
3,391,379
|
|
1,481,835
|
|
1,021,238
|
|
244,610
|
|
|||||||||
|
Total cost and expenses
|
45,759,389
|
|
35,458,250
|
|
16,027,927
|
|
7,063,816
|
|
4,568,086
|
|
|||||||||
|
LOSS FROM OPERATIONS
|
(20,932,802
|
)
|
(30,319,634
|
)
|
(15,554,541
|
)
|
(7,063,816
|
)
|
(4,568,086
|
)
|
|||||||||
|
Total other income (expense), net
|
(414,218
|
)
|
(442,639
|
)
|
3,872,229
|
|
(53,262,603
|
)
|
(1,496,583
|
)
|
|||||||||
|
LOSS BEFORE INCOME TAXES
|
(21,347,020
|
)
|
(30,762,273
|
)
|
(11,682,312
|
)
|
(60,326,419
|
)
|
(6,064,669
|
)
|
|||||||||
|
INCOME TAX BENEFIT
|
—
|
|
—
|
|
76,081
|
|
—
|
|
—
|
|
|||||||||
|
NET LOSS
|
(21,347,020
|
)
|
(30,762,273
|
)
|
(11,606,231
|
)
|
(60,326,419
|
)
|
(6,064,669
|
)
|
|||||||||
|
DIVIDENDS ON CONVERTIBLE PREFERRED STOCK
|
(4,016,705
|
)
|
(4,370,247
|
)
|
(4,696,766
|
)
|
(1,276,902
|
)
|
—
|
|
|||||||||
|
NET LOSS AVAILABLE TO COMMON SHAREHOLDERS
|
$
|
(25,363,725
|
)
|
$
|
(35,132,520
|
)
|
$
|
(16,302,997
|
)
|
$
|
(61,603,321
|
)
|
$
|
(6,064,669
|
)
|
||||
|
Net loss per common share – basic
|
$
|
(0.42
|
)
|
$
|
(0.87
|
)
|
$
|
(0.66
|
)
|
$
|
(3.18
|
)
|
$
|
(0.34
|
)
|
||||
|
Net loss per common share – diluted
|
$
|
(0.42
|
)
|
$
|
(0.87
|
)
|
$
|
(0.66
|
)
|
$
|
(3.18
|
)
|
$
|
(0.34
|
)
|
||||
|
Total assets
|
$
|
43,999,996
|
|
$
|
47,864,545
|
|
$
|
26,974,152
|
|
$
|
37,121,524
|
|
$
|
4,925,154
|
|
||||
|
Long-term debt and capital lease obligations, including current portion
|
7,907,474
|
|
13,731,655
|
|
1,437,081
|
|
1,452,411
|
|
4,140,000
|
|
|||||||||
|
Total stockholders' equity (deficit)
|
20,243,748
|
|
18,394,562
|
|
16,597,675
|
|
24,666,005
|
|
(27,173,284
|
)
|
|||||||||
23
Item 7.
Management’s Discussion and Analysis of Financial Condition and Results of Operations
The following discussion provides information that we believe is relevant to an assessment and understanding of the consolidated results of operations and financial condition of the Company. It should be read in conjunction with the consolidated financial statements and accompanying notes also included in this 10-K.
The following discussion addresses matters we consider important for an understanding of our financial condition and results of operations as of and for the year ended December 31, 2013, as well as our future results.
Overview
The Company is a producing, Nevada-based, gold and silver mining company with extensive, contiguous property in the historic Comstock and Silver City mining districts (collectively, the “Comstock District”). The Comstock District is located within the western portion of the Basin and Range Province of Nevada, between Reno and Carson City. The Company began acquiring properties and developing projects in the Comstock District in 2003. Since then, the Company has consolidated a substantial portion of the Comstock District, secured permits, built an infrastructure and brought the exploration project into production.
Because of the Comstock District’s historical significance, the geology is well known and has been extensively studied by the Company, our advisors and many independent researchers. We have expanded our understanding of the geology of the project area through vigorous surface mapping and drill hole logging. The volume of geologic data is immense, and thus far the reliability has been excellent, particularly in the various Lucerne Mine areas. We have amassed a large library of historic data and detailed surface mapping of Comstock District properties and continue to obtain historic information from private and public sources. We use such data in conjunction with information obtained from our current mining operations, to target geological prospective exploration areas and plan exploratory drilling programs.
Our Lucerne Resource area is located in Storey County, Nevada, approximately three miles south of Virginia City and 30 miles southeast of Reno. Our Dayton Resource area, is located in Lyon County' Nevada, approximately six miles south of Virginia City. Access to the properties is by State Route 342, a paved highway.
Our business plan is to deliver stockholder value by validating qualified resources (measured and indicated) and reserves (proven and probable) of at least 3,250,000 gold equivalent ounces from our first two resource areas, Lucerne and Dayton; and significantly grow the commercial development of our operations through coordinated district wide plans that are economically feasible and socially responsible. The Company has already met the first three intermediate resource validation objectives by validating measured and indicated resources containing more than 2,000,000 gold equivalent ounces. The Company achieved initial production and held its first pour of gold and silver on September 29, 2012 and produced more than 20,000 gold equivalent ounces in 2013. The Company has developed a mine plan intended to ramp those annual production rates to approximately 40,000 gold equivalent ounces.
We continue acquiring additional properties in the Comstock District, expanding our footprint and creating opportunities for exploration and mining. The Company now owns or controls approximately 7,447 acres of mining claims and parcels in the Comstock and Silver City Districts (a 26 % increase from 2012). The acreage is comprised of approximately 1,376 acres of patented claims (private lands) and surface parcels (private lands) and approximately 6,071 acres of unpatented mining claims, which the Bureau of Land Management (“BLM”) administers.
Automatic conversion of Series A-2 Preferred Stock and Series B Preferred Stock
If the daily volume weighted average price exceeds $4.50 for any 20 Trading Days during any 30 consecutive trading day period, then all outstanding shares of the Series A-2 Preferred Stock and Series B Preferred Stock will be forced to convert into shares of common stock, based on the then-effective conversion price. The Company will provide each holder with notice within one trading day of meeting the requirements specifying the shares of Preferred Stock held by each holder and the date three trading days later when the conversion will take effect.
24
Equity Raises
In February 2012, the Company raised $17.25 million in gross proceeds (approximately $15.3 million, net of issuance costs) through an underwritten public offering of 9,078,948 shares of common stock at a price of $1.90 per share. In November and December 2012, the Company raised $9.3 million in gross proceeds (approximately $8.5 million, net of issuance costs) through an underwritten public offering of 4,246,573 shares under the Company’s Registration Statement on Form S-3, of our common stock at a price of $2.19 per share.
In March 2013, the Company raised
$10.0 million
in gross proceeds (approximately
$9.7 million
, net of issuance costs) through an underwritten public offering of
5,000,000
shares under the Company’s Registration Statement on Form S-3, of our common stock at a price of
$2.00
per share. In August 2013, the Company raised
$8.75 million
in gross proceeds (approximately
$8.6 million
, net of issuance costs) through an underwritten public offering of
4,146,920
shares of our common stock at a price of
$2.11
per share under the Company’s Registration Statement on Form S-3.
Our Team
We believe we have exceptional mine engineering, geological, geo-statistical, metallurgical, safety, regulatory, environmental, financial and operating competencies on our management team. As of December 31, 2013, we have 118 full-time employees. We also have 12 full-time and 5 part-time hospitality employees working for the Gold Hill Hotel, Inc. In addition, we have strengthened our system through agreements and relationships with certain key partners.
Corrado De Gasperis
h
as been President and CEO of Comstock Mining since April 2010, and appointed to the Board of Directors in June 2011. He brings over 26 years of industrial metals and mining manufacturing, operational and financial management, and capital markets experience. Previously, he served as the Chief Executive Officer of Barzel Industries Inc. (formerly Novamerican Steel Inc.) from April 2006 through September 2009. Barzel operated a network of 15 manufacturing, processing and distribution facilities in the United States and Canada that offered a wide range of metal solutions to a variety of industries, including construction, infrastructure development and mining. From 2001 to 2005, he served as Chief Financial Officer of GrafTech International Ltd., a global manufacturer of industrial graphite and carbon-based materials, in addition to his duties as Vice President and Chief Information Officer, which he assumed in 2000. He served as Controller of GrafTech from 1998 to 2000. From 1987 to 1998, Mr. De Gasperis was a certified public accountant with KPMG LLP. As a Senior Assurance Manager in the Manufacturing, Retail and Distribution Practice, he served major clients like General Electric and Union Carbide Corporation. KPMG announced his admittance, as a Partner, effective July 1, 1998.
Mr. De Gasperis holds a BBA from the Ancell School of Business at Western Connecticut State University, with honors and is a Member of the NYSE Markets Advisory Committee, the Northern Nevada Development Authority and the Northern Nevada Network. Mr. De Gasperis is also a founding member and the Chairman of the Board of Directors of the Comstock Foundation for History and Culture and is also a Director of the Gold Hill Hotel Inc., the most historic, continuously operating Hotel in Nevada.
Harold "Hal" Galbraith
joined Comstock Mining in March 2014 as Director of Mining and brings over 30 years of experience in open pit, gold, silver and copper operations, as well as surface coal mining operations, maintenance systems, technical services, and industrial engineering support. He has held a variety of positions including Mine Manager, Mine Production Superintendent, Sr. Production Engineer, Assistant Superintendent of Production, Senior Mining Engineer, Senior Projects Engineer, Long and Short Range Planner, and Safety Coordinator.
Mr. Galbraith holds a Bachelor of Science in Mining Engineering from the Pennsylvania State University.
25
Larry Martin
has been the Director of Exploration & Mineral Development since 2010 and Chief Geologist since 2008. He brings over 31 years of successful precious metals exploration, mine development and production experience. He participated and supervised exploration projects in Northwest Territories, Canada, Liberia, West Africa, Mexico, Honduras, and areas within the western region of the United States. Mr. Martin’s production experience is exemplified by supervisory positions in the following Nevada mines: Manhattan, Borealis, Hog Ranch, and Denton-Rawhide.
Mr. Martin’s geologic technical expertise overlapped into the environmental and civil engineering disciplines of geology. He was instrumental in the evaluation of geologic design parameters at the proposed nuclear repository site located at Yucca Mountain, Nevada. Mr. Martin participated in the geo-technical evaluation of the environmentally sensitive sites of Hanford Nuclear Reservation, Washington and Anniston military depot, Alabama; and the rock product dam project, East Side Reservoir Project, California. Most recently, Larry’s focus has been in Nevada precious metals exploration projects including: the Sleeper Gold Project and, currently, the Comstock Mine Project. Mr. Martin received his Bachelor of Science in Geologic Engineering from Colorado School of Mines in 1978. He is a Qualified Person (QP) and a Certified Professional Geologist (CPG) accredited by American Institute of Professional Geologists (AIPG). Mr. Martin is a certified expert witness by the 9th District Appellate United States Federal Court in the categories of Exploration and Structural Geology.
Steve Russell
became Senior Mine Geologist in 2010 and brings in excess of 35 years of experience in precious metal mine planning, grade control, open pit mine production, including extensive heap leaching processing, and exploration. Mr. Russell has extensive Nevada mine planning and production experience and is a recognized authority in the Comstock District. He also has international exploration experience in Chile and China. Mr. Russell’s exemplary career includes extensive and specific project work in the Comstock Lode District as a Mine Geologist, Exploration Geologist, and Mine Project Planning, including direct experience in the Company’s near term production areas including the Lucerne, Dayton and Spring Valley Projects.
Mr. Russell is a graduate of California State University in Fresno, where he obtained a B.A. in Industrial Technology in 1971, a B.A. in Geology in 1974, and a Masters in Geology in 1976, with a thesis on stratigraphy and structure of Mesozoic meta-volcanic rocks. He is an industry-published author of unique Western U.S. structural geology.
Brett (Randy) Harris
has been
the Director of Safety since 2010 and has over 35 years of experience in the fields of occupational health, safety and security. He has worked with organizations like Round Mountain Gold Corp. in Round Mountain, NV, Golden Predator Mines in Winnemucca and Imlay, NV and was most recently with the Turquoise Ridge Joint Venture between Barrick Gold and Newmont Mining Corporation. Mr. Harris also spent five years with the State of Nevada Mine Safety and Training Section as a Safety Specialist.
Mr. Harris has been involved with volunteer firefighting, search and rescue, EMT and ambulance services with Storey County, Silver City and Round Mountain. His safety training includes certification by the International Society of Mine Safety Professionals, OSH Standards 1910 Level I & II, and International Loss Control. Important to Comstock Mining's near-term and longer-term plans, he has strong safety expertise in both surface and underground mining.
Judd Merrill
became Chief Accounting Officer in 2014 and has been our Controller since 2011. Mr. Merrill brings strong financial planning, treasury and cash management experience in the mining sector in addition to his broader financial accounting, reporting and internal control experience, having worked as Controller of Fronteer Gold Inc. and Assistant Controller at Newmont Mining Corp., both in Nevada. He also worked for Meridian Gold Company and Deloitte & Touche LLP.
Mr. Merrill holds a Bachelor of Science in Accounting from Central Washington University and a Masters of Business Administration from the University of Nevada, Reno and is a Certified Public Accountant.
26
Exploration
Drill Program (Lucerne Resource Area)
In the Spring of 2013, the Company approved specific drilled locations along the west side of State Route 342 within the current Lucerne Resource area including, from south to north, The Billie the Kid, Lucerne, Justice and Keystone mine areas. The areas are located within the current mine plan and after reviewing the geologic sections, the decision was made to drill additional Reverse Circulation (RC) holes to confirm projected mineralization and collect material for additional metallurgical study. The drilling did confirm the predicted geological structures, elevations and extents of mineralization. The metallurgical studies enhanced our understanding of predicted recoveries compared to prior metallurgical analysis. The drilling and metallurgical studies (including electron micro-probe) found no evidence of reactive sulfide mineralization and no other mineralogical properties that would negatively affect the recoveries from our cyanide heap leach operation. The 2013 drilling program (the “Drill Program”) included a total of 22 drill holes and 4,065 feet. For Billie the Kid; we drilled six holes with an average depth of 340 feet. For Lucerne, we drilled thirteen holes with an average depth of 120 feet. For Justice, we drilled six holes with an average depth of 160 feet and for Keystone we only drilled one well-positioned hole down to 120 feet. The Drill Program was defined for specific information and collected information that confirmed predicted geologic and attributes and metallurgical properties.
Kentuck Drill Program
In the fall of 2013, the Company conducted a second more narrowly scoped drill program at the Kentuck mine dump ("Kentuck Program"). The Kentuck Program evaluated certain mine dump material located on Sutro Mining Co. lands. The mine dump was waste rock from historic mining on the Kentuck. The area tested was approximately 100 feet by 250 feet. The drill holes were arranged in a grid pattern that included 116 drill holes. The drill holes ranged from 20 feet to 60 feet, with an average depth of 24 feet. Analytical and metallurgical results are pending.
On-Going Drill Programs
The Company’s continues to evaluate high priority targets, including The East Side, Spring Valley, Occidental, Oest and the Northern Target areas. The Company did complete a successful phase of exploration drilling in Spring Valley in 2012.
The drilling in the northern portion of Spring Valley was partially predicated to confirm buried mineralization by drilling specific magnetic geophysical anomalies that had similar magnetic signatures as defined by mineralization defined by drill holes, drilled prior to the geophysical surface survey. The drilling was successful and the drill program is currently being expanded to test the full extent of the geophysical target.
The East Side Drill Program includes continuing infill drilling, metallurgical testing and geotechnical analysis to confirm the mineral potential and expand the mine plan on the East Side of State Route 342. In addition, the Company is designing a new phase of exploration drilling to include its highest-potential targets, including scoping studies of the Chute Zone in the Lucerne Resource area and plans for expanded exploration and development drilling in the Dayton Resource area that will allow for proper mineral assessment and mine plan development.
Production
During 2013, the Company completed the ramp up and stabilization activities of the production system, including significant improvements to the metal extraction processes, particularly in the Merrill-Crowe facility. We invested approximately $1.5 million for certain productivity enhancing actions associated with pump, pipe, filtration and press capacities, so the Merrill-Crowe and heap leach facilities could operate at fluid processing rates of over 1,000 gallons per minute. For substantially all of 2013, we were processing only 1.0 million tons of ore per annum due to a permit limitation. This limitation was unblocked during the fourth quarter when major modifications of our permits were approved. Accordingly, we surpassed our 2013 revenue guidance, exceeding the estimated 20,000 gold equivalent ounces, and producing over 20,800 gold equivalent ounces during the Company’s first full year of production.
On November 12, 2013, the Company received a major modification to its water pollution control permit, increasing our authorized capacity and our processing rate from a previous maximum of 1.0 million tons per annum to 4.0 million tons per annum. In December 2013, the Company completed the construction of two new leach pad cells and the supporting ponds and related infrastructure. The system is now operational and materials are being stacked, leached and processed. Our first five existing cells continue under solution, as typical, until the target gold and silver recovery rates have been achieved.
27
The completed expansion and improvements represent the next major phase of growth for the Company, enabling production growth of 100%, with the goal of reducing unit costs and increasing cash flow. The Company plans to exceed a production rate of 40,000 gold equivalent ounces in 2014.
The Company averaged over 400 gold-equivalent ounces poured per week in
2013
. The Company continuously adjusted its operations to improve grade, maximize yields and increase tons crushed and stacked throughout 2013, and averaged over 500 gold-equivalent ounces poured per week throughout the second half of 2013. Overall during
2013
, the Company crushed and stacked 1,072,000 dry tons of mineralized material, delivering
22,192
estimated ounces of recoverable gold and
396,082
estimated ounces of recoverable silver to the leach pads, positioning the Company well for growth. Material placed on the heap leach pads remains under solution until the target recovery rates are achieved. Throughout this period, the recovery of gold and silver continues, but the most effective economic recovery of gold and silver takes between 45 to 60 days to complete. The Company has recovered
68%
of the estimated recoverable gold and
48%
of the estimated recoverable silver from the portion of the heap under leach the longest. Preliminary laboratory metallurgical test results suggest that ultimate heap leach recovery will meet or exceed the estimated ounces of recoverable gold and silver.
For the quarter ended December 31, 2013, the Company realized an average sales price of $1,324.29 per ounce of gold and $20.68 per ounce of silver. In comparison, commodity market prices averaged $1,272.47 per ounce of gold and $20.76 per ounce of silver.
For the year ended
December 31, 2013
, the Company realized an average sales price of
$1,361.70
per ounce of gold and
$21.97
per ounce of silver. In comparison, commodity market prices in
2013
averaged
$1,411.03
per ounce of gold and
$23.83
per ounce of silver.
Operating Costs
During
2013
, actual Lucerne Mine costs applicable to mining revenue were
$26.5 million
, net of silver by-product credits. Cost applicable to mining revenue include mining and processing labor, maintenance, drilling and blasting and assaying costs associated with higher production rates and higher absorbed inventory costs incurred in advance of achieving the targeted production rate.
Costs applicable to mining revenue for the
twelve
months of
2013
include $1 million of higher hauling costs, including the previously incurred redundancy associated with our inability to use an existing haul road that crosses Lot 51 for most of the first quarter, and the transition costs associated with renting new haul vehicles while transitioning out of the existing, temporary vehicles. Costs applicable to mining revenue also include $4.7 million of depreciation and a
$1.5 million
write-down of inventory to market value during
2013
. Management believes the system is now capable of operating at twice the production rates of 2013 and is ramping up operations to those higher levels during the first quarter of 2014, now that final applicable permits have been approved.
During the third and fourth quarters, once production had stabilized, the Company continued focusing on stream-lining the organization and reducing general, administrative, consulting and other related costs. The Company has also focused on reducing costs applicable to mining and leveraging the existing fixed operating expenses for the production of higher ounces in the latter part of 2014. Costs applicable to mining, dropped sequentially, on a per ounce basis, every quarter during the year. Overall, cash costs dropped 55% from the first quarter to the fourth quarter, starting at over $2,190 per ounce during initial ramp up down to $989 per ounce in the fourth quarter. Once stabilized at the 40,000 ounce per annum run rate, the Company expects cash costs per ounce of gold mined of less than $750.
2014 Outlook
Through the end of 2013, the Company began transitioning into production at higher rates and grades with lower sustainable costs. The recently acquired permit now allows processing rates of up to 4 million tons of mineralized material to be placed on the leach pad per annum, and the Company’s 2014 business plan calls for processing and shipping 40,000 gold equivalent ounces. This expected 2014 production rate is double the 2013 rate. Two additional cells were constructed in 2013 and stacking on these cells has already commenced. The Company is also fully permitted to add an additional cell when needed.
28
Under our current mine plan, we anticipate doubling ounces produced when compared to 2013, for both gold and silver, targeting 40,000 gold equivalent ounces of production for 2014. These increases come with lower costs applicable to mining due to focused cost reduction efforts, as well as lower non-mining operating expenses. Once stabilized at the 40,000 ounce per annum run rate, the operating expenses per ounce mined will be significantly lower in 2014 than in 2013. The Company expects cash costs per ounce of gold mined of less than $750 per ounce. The Company updated its financial analysis for the Lucerne Mine and anticipates annual operating expenses, including all mining and processing costs, of less than $25 million per annum, a more than a $6 million reduction over prior year 2013. The Company has also identified $3.5 million of cost reductions in all other non-mining activities, including general, administrative and environmental areas.
Recent Developments
From January 1, 2014 through
March 14, 2014
, preferred shareholders converted
1,009
shares of convertible preferred stock into
611,514
common shares.
Subsequent to December 31, 2013, the Company entered into an agreement to purchase 78 Acres in American Flat, Storey County, Nevada for $1,107,000. The purchase price includes $10,000 cash and the remaining amount in Company restricted common stock. Escrow is expected to close on or before December 25th, 2014.
Subsequent to December 31, 2013, the Company entered into an agreement to purchase buildings and mining claims adjacent to it's processing facility on American Flat Road, Storey County, Nevada for $893,000. The purchase price includes $10,000 cash and the remaining amount in Company restricted common stock. Escrow is expected to close on or before February 25th, 2015.
On February 11, 2014, the Company entered into a new, lower cost $5 million revolving credit facility (the “Revolving Credit Facility”) with Auramet International, LLC, pursuant to which the Company may borrow up to $5 million outstanding at any one time. The proceeds of the Revolving Credit Facility will be used for working capital, including production ramp up and preparations for expansion of the Lucerne Mine, including targeted drilling on the east side of the Lucerne Resource area. Interest is payable at 9.5% per annum, and was paid in advance on the closing date of the Revolving Credit Facility. The indebtedness under the Revolving Credit Facility is secured by a security interest in certain real estate owned by the Company within the Company’s starter mine and a first priority security interest in all personal property of the Company and its wholly-owned subsidiary Comstock Mining LLC, subject to any existing or future Permitted Liens (as defined under the Revolving Credit Facility). Provided that no default has occurred and is continuing, and the Company has already repaid the principal amount of borrowings under the Revolving Credit Facility in an amount of not less than $1,000,000, the Company has the option until October 6, 2014 to re-borrow funds under the Revolving Credit Facility. The Revolving Credit Facility contains a covenant that requires the Company to maintain a minimum liquidity balance of $1 million (including cash and cash equivalents, plus 90% of the value of any doré that has been picked up by a secured carrier but not yet paid for, as of any date of determination). The Revolving Credit Facility additionally contains customary representations, warranties, affirmative covenants, negative covenants, and events of default, as well as conditions to borrowings. On February 12, 2014, the Company drew down proceeds of approximately $4.6 million. The Revolving Credit Facility will be repaid through 14 semi-monthly cash payments of $357,143 beginning August 8, 2014 and ending February 6, 2015.
Land and Mineral Right Acquisitions
We will continue to increase our footprint in the Comstock District through strategic acquisitions. We consider the historic Comstock district central to our growth strategy. The following acquisitions described below were completed in 2013.
On October 11, 2013, we entered into a purchase agreement for 5 vacant lots near our mining and processing operation. The purchase price of $200,000 comprised of a $40,000 cash payment and $160,000 in Company restricted common stock.
No transfer of deed will take place prior to Seller receiving the proceeds from the sale of shares. On October 22, 2013, the Company issued 88,888 of Rule 144 restricted shares of common stock to Greg Hess towards the purchase of this property. Escrow is scheduled to close on June 30, 2014.
On October 30, 2013, we exercised an option to purchase 212 Acres vacant land by our process facility in American Flat, Storey County, Nevada. The purchase price was $1,500,000 comprised of $30,000 cash payment and $1,470,000 in Company restricted common stock. No transfer of deed will take place prior to Seller receiving the proceeds from the sale of shares. On December 19, 2013, the Company issued 650,000 of Rule 144 restricted shares of common stock to V&T Management LLC as payment towards the purchase of this land.
Comparative Financial Information
Below we set forth a summary of comparative financial information for the twelve months ended
December 31, 2013
,
2012
and
2011
.
|
2013
|
2012
|
2011
|
Difference
2013 versus 2012 |
Difference
2012 versus 2011 |
|||||||||||||||
|
Revenue - Mining
|
$
|
24,103,013
|
|
$
|
4,504,457
|
|
$
|
—
|
|
$
|
19,598,556
|
|
$
|
4,504,457
|
|
||||
|
Revenue - Hospitality
|
723,574
|
|
634,159
|
|
473,386
|
|
89,415
|
|
160,773
|
|
|||||||||
|
|
|
|
|||||||||||||||||
|
Costs applicable to mining revenue
|
26,495,665
|
|
3,554,727
|
|
—
|
|
22,940,938
|
|
3,554,727
|
|
|||||||||
|
Hospitality operating costs
|
1,117,225
|
|
928,897
|
|
570,039
|
|
188,328
|
|
358,858
|
|
|||||||||
|
Reclamation and exploration expenses
|
8,504,992
|
|
18,305,303
|
|
9,501,327
|
|
(9,800,311
|
)
|
8,803,976
|
|
|||||||||
|
General and administrative
|
7,968,725
|
|
9,277,944
|
|
4,474,726
|
|
(1,309,219
|
)
|
4,803,218
|
|
|||||||||
|
Consulting and professional fees
|
1,672,782
|
|
3,391,379
|
|
1,481,835
|
|
(1,718,597
|
)
|
1,909,544
|
|
|||||||||
|
Loss for Operations
|
(20,932,802
|
)
|
(30,319,634
|
)
|
(15,554,541
|
)
|
9,386,832
|
|
(14,765,093
|
)
|
|||||||||
|
OTHER INCOME (EXPENSE)
|
|
|
|
|
|
|
|
|
|||||||||||
|
Change in fair value of derivatives
|
454,681
|
|
438,519
|
|
3,864,146
|
|
16,162
|
|
(3,425,627
|
)
|
|||||||||
|
Interest expense
|
(1,157,535
|
)
|
(929,837
|
)
|
(80,630
|
)
|
(227,698
|
)
|
(849,207
|
)
|
|||||||||
|
Interest income
|
2,101
|
|
17,309
|
|
72,928
|
|
(15,208
|
)
|
(55,619
|
)
|
|||||||||
|
Other, net
|
286,535
|
|
31,370
|
|
15,785
|
|
255,165
|
|
15,585
|
|
|||||||||
|
Income tax benefit
|
—
|
|
—
|
|
76,081
|
|
—
|
|
(76,081
|
)
|
|||||||||
|
Net Loss
|
$
|
(21,347,020
|
)
|
$
|
(30,762,273
|
)
|
$
|
(11,606,231
|
)
|
$
|
9,415,253
|
|
$
|
(19,156,042
|
)
|
||||
Mining revenue increased by
$19,598,556
in 2013 as compared to year ended 2012. This increase is primarily the result of the Company only being in production during the fourth quarter of 2012 as compared to the full year for 2013. The Company began selling gold and silver in October 2012. There was no mining revenue or costs applicable to mining revenue prior to 2012. In 2012, we produced and shipped 2,583 ounces of gold at the average selling price of $1,744.36 while in 2013, the Company produced and shipped
17,739
ounces of gold at the average selling price of
$1,361.70
.
The hospitality revenue was
$723,574
and
$634,159
for the years ended December 31, 2013 and 2012, respectively. The increase of
$89,415
from 2012 to 2013 was primarily the result of focused marketing and improvement activities. The hospitality revenue increased
$160,773
for the year ended 2012 compared to the same period in 2011. The increase is primarily the result of the hotel being owned for only a portion of 2011. There was no hospitality revenue prior to 2011. We acquired the historic Gold Hill Hotel and five related cottages in May 2011.
Hospitality operating costs increased
$188,328
for the year ended 2013 as compared to the year ended 2012. This increase primarily resulted from marketing efforts toward growing sales and improved utilization of the hospitality assets. Hospitality operating costs increased
$358,858
for the year ended 2012 compared to the same period in 2011. The increase is primarily the result of the hotel being owned for only a portion of 2011. There were no hospitality operating costs prior to 2011.
30
Reclamation and exploration expenses decreased
$9,800,311
for the year ended 2013 as compared to the year ended 2012. The decrease primarily resulted from shifting the Company's focus from exploration to production activities. Exploration activities in 2013 primarily represented geological support, grade and metallurgical analysis and assessment. Reclamation and exploration expenses increased by
$8,803,976
for the year ended 2012 as compared to the year ended 2011. The increase primarily resulted from activities associated with the preparation and commencement of mining activities for the Lucerne Mine, including increases of $2,517,115 associated with a one-time soil sampling program required prior to the commencement of mining activities; $2,218,792 for higher mining and geological labor and related expense, including $1,765,963 related to stock-based compensation expense; and $1,578,750 associated with permitting and related mine development costs for our Lucerne Resource area.
General and administrative expenses decreased by
$1,309,219
for the year ended 2013 as compared to the year ended 2012. This decrease is primarily the result of lower stock-based compensation expense and lower administrative costs. General and administrative expenses increased by
$4,803,218
for the year ended 2012 as compared to the year ended 2011. This increase is primarily the result of $3,644,602 related to stock-based compensation expense and, to a lesser extent, increases in insurance, travel and other administrative costs.
Consulting and professional fees decreased
$1,718,597
for the year ended 2013 as compared to the year ended 2012. The decrease resulted primarily from decrease in legal fees related to permitting and related appeals, gaining efficiencies on internal processes and shifting responsibilities from outsourcing and outside contractors to our well-qualified team. Consulting and professional fees increased
$1,909,544
for the year ended 2012 as compared to the year ended 2011. The increase resulted primarily from increased legal fees associated with permitting and related appeals, preparation of our sampling and analysis plan and related environmental compliance and, to a lesser extent, fees associated with internal control compliance and related business process improvement activities.
Interest expense increased
$227,698
for the year ended 2013 as compared to the year ended 2012. This increase resulted from the complete write off of the imputed interest due to the early payoff of the Golden Goose long-term debt obligation. Interest expense increased
$849,207
for the year ended 2012 as compared to the year ended 2011. This increase resulted from financing agreements entered into with Resource Income Fund associated with our $5 million working capital revolving credit facility and Caterpillar Financial associated with our $5 million equipment financing loan, both entered into in 2012, and from an increase in promissory notes issued to acquire additional properties.
Interest income decreased by
$15,208
during the year ended 2013 as compared to the year ended 2012. Interest income decreased by
$55,619
during the year ended 2012 as compared to the year ended 2011. This decrease in 2013 and 2012 resulted from an overall decrease in income generating cash and cash equivalents and available-for-sale securities during the year ended 2012 compared to the same period in 2011.
During the year ended December 31, 2013, we recognized a non-recurring gain on the settlement of our Auramet Facility obligations of approximately $287,000.
Net loss was
$21,347,020
and
$30,762,273
for the years ended December 31, 2013 and 2012, respectively. The decrease of
$9,415,253
from 2012 to 2013 was primarily the result of focused production and process improvements activities across entire operations during 2013. Net loss increased
$19,156,042
for the year ended 2012 compared to the same period in 2011. This increase resulted primarily from the Company gearing up to start mining activities and production from the Lucerne Mine, legal fees associated with permitting, environmental compliance and higher stock-based compensation expense.
Liquidity and Capital Resources
Total current assets were
$6.0 million
at
December 31, 2013
. Cash and cash equivalents on hand at
December 31, 2013
totaled
$2.4 million
. Inventories, stockpiles, and mineralized material on leach pad totaled
$1.1 million
. During the year ended
December 31, 2013
, the Company reduced its long-term debt and capital lease obligations by $5.8 million from a total balance of $13.7 million to $7.9 million. The decrease in long-term debt obligations resulted from scheduled principal payments (including the early repayment of the $5.0 million Auramet Facility), $1.0 million transfer of mining vehicles, and the settlement of a $2.0 million long-term debt obligation via the issuance of 1,000,000 shares of common stock. The Company also reduced its operating costs by entering into $4.3 million capital lease obligations for mining haul trucks during 2013. At December 31, 2013, these lease obligations totaled $3.6 million, inclusive of interest. The Company believes it has the ability to meet all its obligations, including its long-term and capital lease obligations, within the normal course of business for at least the next twelve months.
31
Net cash used in operating activities for the twelve months ended
December 31, 2013
was approximately
$10.3 million
as compared to
$22.4 million
for the year ended 2012. Our use of cash in 2013 was primarily from operating losses associated with ramping up production, and the $2.7 million of gold produced and directly transferred as payment on our Auramet Facility that was completely paid off.
Net cash used in investing activities for the year ended
December 31, 2013
, was
$6.7 million
, primarily as the result of capital asset purchases of
$6.0 million
and bond deposit increases of
$1.3 million
, net of
$597 thousand
of proceeds received from the sale of equipment that was previously used in our mining development and production activities. Cash used in investing for the year ended 2012 was approximately
$10.9 million
, primarily
$13.4 million
for purchases of equipment used in our mining development and production activities, offset by
$2.2 million
in proceeds from sale of available-for-sale securities and a reduction in reclamation bond deposits of approximately
$261 thousand
.
Net cash provided by financing activities for the year ended
2013
was
$13.4 million
, comprised of proceeds of approximately $18.3 million from the sale of securities in two public offerings totaling 9,146,920 shares of our common stock at prices of $2.00 and $2.11 per share, partially off-set by the pay-down of our long-term debt obligations of approximately
$4.9 million
. Net cash provided by financing activities for the year ended 2012 was
$32.3 million
, comprised of net proceeds from the sale of public securities through an underwritten public offering of 9,078,948 shares of common stock at a price of $1.90 per share and principal payments on long-term debt obligations of approximately
$9.7 million
.
When pouring commenced in late 2012, the Company averaged approximately 200 gold-equivalent ounces poured per week. The Company aims to continuously adjust its operations to improve grade, maximize yields and increase tons crushed and stacked. The Company continues ramping up its production and exceeded its targeted production rate of 400 ounces per week in 2013, and nearly 500 ounces per week during the fourth quarter of 2013. The Company currently anticipates production of 40,000 gold equivalent ounces for the full year 2014, resulting from improved grades, increased production, completed expansion and expanded permitted capacity during 2013.
The accompanying consolidated financial statements have been prepared assuming the Company will continue as a going concern. The Company was an exploration company for most of its existence and recently transitioned into production in the Lucerne Mine, and accordingly, has incurred net operating losses and negative cash flows from operations since inception. At
December 31, 2013
, the Company has cash and cash equivalents of
$2.4 million
. During 2013, the Company incurred a net loss of
$21.3 million
, used
$10.3 million
of cash in operations, and used
$4.9 million
for debt repayments. The Company continues its efforts to increase production, reduce costs and working capital needs, improve efficiencies, and maximize funds available for working capital. The Company’s current capital resources include cash and cash equivalents and other working capital resources, cash generated through operations, and existing financing arrangements. The Company’s certificate of incorporation permits it to incur indebtedness for money borrowed of up to $5 million at the discretion of the Board of Directors. The Company entered into a $5 million Revolving Credit Facility and drew down approximately $4.6 million in February 2014. The Company has financed its activities principally from the sale of equity securities and from debt financing. While the Company has been successful in the past in obtaining the necessary capital to support its operations, including registered equity financings from its existing shelf registration, borrowings, or other means, there is no assurance that the Company will be able to obtain additional equity capital or other financing, if needed. The Company received a commitment from a significant investor in March 2014 that it would provide the necessary level of financial support to enable the Company to pay its debts as they become due through March 31, 2015. Accordingly, the Company believes it will have sufficient funds to sustain its operations during the next 12 months as a result of the sources of funding detailed above.
Future production rates and gold prices below management’s expectations would adversely affect the Company’s results of operations, financial condition and cash flows. If the Company was unable to obtain any necessary additional funds, this could have an immediate material adverse effect on liquidity. In such case, the Company could be required to limit or discontinue certain business plans, activities or operations, reduce or delay certain capital expenditures or sell certain assets or businesses. There can be no assurance that the Company would be able to take any of such actions on favorable terms, in a timely manner or at all.
The Company’s recurring losses and negative cash flow from operations require an ongoing assessment of our ability to continue as a going concern. The consolidated financial statements included in this report do not include any adjustments that might result from the outcome of this uncertainty.
On March 11, 2014, the Bureau of Mining Regulation Reclamation (BMRR) increased its surety bond requirements for reclamation obligations to approximately $6.35 million related to the 28.8 acres of heap leach pad at the Lucerne Mine Project. The BMRR's surety bond requirement prior to such increase was $5.2 million. The Company plans to satisfy such surety bond requirements on or before April 11, 2014.
32
For 2014, we plan on spending up to $2-3 million in capital expenditures, primarily to prepare for future expanded mining operations including mining of the East Side of the Lucerne Resource. We will also pay down an additional $2.7 million of long-term debt obligations.
Contractual Obligations
Our contractual obligations at
December 31, 2013
are summarized as follows:
|
|
Payments Due by Period
|
||||||||||||||||||
|
|
|
Less than
|
1 - 3
|
4 - 5
|
More Than
|
||||||||||||||
|
Contractual Obligations
|
Total
|
1 Year
|
Years
|
Years
|
5 Years
|
||||||||||||||
|
Long-term debt and capital lease obligations
(1)
|
$
|
8,639,975
|
|
$
|
3,000,177
|
|
$
|
5,364,542
|
|
$
|
74,981
|
|
$
|
200,275
|
|
||||
|
Operating Leases
(2)
|
31,911,800
|
|
932,900
|
|
1,878,400
|
|
1,882,000
|
|
27,216,500
|
|
|||||||||
|
Reclamation and remediation obligations
(3)
|
5,342,804
|
|
—
|
|
5,342,804
|
|
—
|
|
—
|
|
|||||||||
|
Other
(4)
|
1,000,000
|
|
1,000,000
|
|
—
|
|
—
|
|
—
|
|
|||||||||
|
|
$
|
46,894,579
|
|
$
|
4,933,077
|
|
$
|
12,585,746
|
|
$
|
1,956,981
|
|
$
|
27,416,775
|
|
||||
|
(1)
|
Amounts represent principal of $7,907,474 and estimated interest payments of $732,501, assuming no early extinguishment.
|
|
(2)
|
The Company leases certain properties under operating leases expiring at various dates through 2049. See Note 21 to the Consolidated Financial Statements. Amounts include minimum rental and minimum advance royalty payments.
|
|
(3)
|
We are required to mitigate long-term environment impacts by stabilizing, contouring, resloping, and revegetating various portions of a site after mining and mineral processing operations are completed. These reclamation efforts are conducted in accordance with plans reviewed and approved by the appropriate regulatory agencies. The Nevada State Environmental Commission and Division of Environmental Protection and other agencies have approved our most recent reclamation plans, as revised, of approximately $5,300,000.
|
|
(4)
|
In November 2013, the Company placed a $5.2 million reclamation surety bond, through the Lexon Surety Group (“Lexon”) with the State of Nevada’s Bureau of Mining Regulation Reclamation (“BMRR”). The initial cash collateral percentage due to Lexon is approximately $2.6 million. At December 31, 2013, accrued expenses include $1 million remaining due to Lexon for the initial cash collateral.
|
Critical Accounting Policies and Estimates
The SEC has requested that all registrants address their most critical accounting policies. The SEC has indicated that a “critical accounting policy” is one which is both important to the representation of the registrant’s financial condition and results and requires management’s most difficult, subjective or complex judgments, often as a result of the need to make estimates about the effect of matters that are inherently uncertain. We base our estimates on past experience and on various other assumptions our management believes to be reasonable under the circumstances, the results of which form the basis for making judgments about carrying values of assets and liabilities that are not readily apparent from other sources. Actual results will differ, and may differ materially from these estimates under different assumptions or conditions. Additionally, changes in accounting estimates could occur in the future from period to period. Our management has discussed the development and selection of our most critical financial estimates with the audit committee of our Board of Directors. The following paragraphs identify our most critical accounting policies:
Impairment of Mineral Rights and Properties, Plant and Equipment
The Company assesses its mineral rights and properties, plant and equipment for possible impairment whenever events or changes in circumstances indicate that the carrying value of the assets may not be recoverable. Such indicators include changes in the Company's business plans, changes in precious metal prices and significant downward revisions of estimated mineralization quantities. If the carrying value of an asset exceeds the future undiscounted cash flows expected from the asset, an impairment charge is recorded for the excess of carrying value of the asset over its estimated fair value.
Determination as to whether and how much an asset is impaired involves management estimates on highly uncertain matters such as future commodity prices, the effects of inflation and technology improvements on operating expenses, and the outlook for global or regional demand conditions for gold and silver. However, the impairment reviews and calculations are based on assumptions that are consistent with the Company's business plans and long-term investment decisions.
33
Reclamation and Remediation Obligations
Reclamation costs are allocated to expense over the life of the related assets and are periodically adjusted to reflect changes in the estimated present value resulting from the passage of time and revisions to the estimates of either the timing or amount of the reclamation and remediation costs. Reclamation obligations are based on when the spending for an existing environmental disturbance will occur. We review, on at least an annual basis, the reclamation obligation at each mine site in accordance with guidance for accounting for asset retirement obligations.
Reclamation obligations for inactive mines are accrued based on management’s best estimate of the costs expected to be incurred at a site. Such cost estimates include, where applicable, ongoing care, maintenance and monitoring costs. Changes in estimates at inactive mines are reflected in earnings in the period an estimate is revised.
Accounting for reclamation and remediation obligations requires management to make estimates unique to each mining operation of the future costs we will incur to complete the reclamation and remediation work required to comply with existing laws and regulations. Actual costs incurred in future periods could differ from amounts estimated. Additionally, future changes to environmental laws and regulations could increase the extent of reclamation and remediation work required. Any such increases in future costs could materially impact the amounts charged to earnings for reclamation and remediation.
Stock-Based Compensation
We measure share-based compensation cost at the grant date based on the value of the award and recognize the cost as an expense over the term of the vesting period. Judgment is required in estimating the fair value of share-based awards granted and their expected forfeiture rate. If actual results differ significantly from these estimates, stock-based compensation expense and our results of operations could be materially impacted.
Income Taxes
Our income tax expense and deferred tax assets and liabilities reflect management’s best assessment of estimated future taxes to be paid. Deferred income taxes arise from temporary differences between the tax and financial statement recognition of revenue and expense. In evaluating our ability to recover our deferred tax assets, we consider all available positive and negative evidence, including scheduled reversals of deferred tax liabilities, projected future taxable income, tax planning strategies and recent financial operations. In projecting future taxable income, we develop assumptions including the amount of future state, federal and foreign pretax operating income, the reversal of temporary differences, and the implementation of feasible and prudent tax planning strategies. These assumptions require significant judgment about the forecasts of future taxable income and are consistent with the plans and estimates that we are using to manage the underlying businesses. Valuation allowances are recorded as reserves against net deferred tax assets by the Company when it is determined that net deferred tax assets are not likely to be realized in the foreseeable future.
The calculation of our tax liabilities involves dealing with uncertainties in the application of complex tax laws and regulations. Income tax positions must meet a more-likely-than-not recognition threshold to be recognized.
Derivative Instruments
The Company has previously recorded derivatives relating to contingent dividend payments on our Preferred Shares and gold forwards, calls and puts. These derivatives are recorded on the balance sheet at fair market value. Changes in the fair market value of derivatives are recorded in the consolidated statements of operations. Management applies judgment in estimating the fair value of derivative instruments that are sensitive to assumptions that include various observable and unobservable market inputs. These inputs include variables such as volatility, stock price, expected life, probability of conversions, commodity prices, commodity volatilities, and interest rates. Variations in these factors could materially affect amounts credited or charged to earnings to reflect the changes in fair market value of derivatives.
Inventories, Stockpiles and Mineralized Material on Leach Pads
Inventories, including stockpiles and mineralized material on leach pads are carried at the lower of cost or net realizable value. Cost is comprised of production costs for mineralized material produced and processed. Production costs include the costs of materials, costs of processing, direct labor, stock-based compensation, mine site and processing facility overhead costs, and depreciation, depletion and amortization.
34
Stockpiles -
Stockpiles represent mineralized material that has been extracted from the mine and is available for further processing. Stockpiles are measured by estimating the number of tons added and removed from the stockpile. Stockpile tonnages are verified by periodic surveys. Costs are allocated to stockpiles based on relative values of material stockpiled and processed using current mining costs incurred up to the point of stockpiling the material, including applicable overhead, depreciation, and depletion relating to mining operations, and removed at each stockpile’s average cost per ton. We record stockpiles at the lower of average cost or net realizable value (“NRV”) and carrying values are evaluated at least quarterly. NRV represents the estimated future sales price based on short-term and long-term metals prices, less estimated costs to complete production and bring the product to sale. The primary factors that influence the need to record write-downs of stockpiles include short-term and long-term metals prices and costs for production inputs such as labor, fuel and energy, materials and supplies, as well as realized mineralized material grades and actual production levels. If short-term and long-term metals prices decrease, the value of the stockpiles may decrease, and it may be necessary to record a write-down of stockpiles to NRV. Cost allocation to stockpiles and the NRV measurement involves the use of estimates and assumptions unique to each mining operation regarding current and future operating and capital costs, metal recoveries, production levels, commodity prices, engineering data and other factors. A high degree of judgment is involved in determining such assumptions and estimates and no assurance can be given that actual results will not differ significantly from those estimates and assumptions.
Mineralized Material on Leach Pads -
The Company utilizes a heap leaching process to recover gold from its mineralized material. Under this method, the mineralized material is placed on leach pads where it is treated with a chemical solution, which dissolves the gold contained in the material. The resulting gold-bearing solution is further processed in a facility where the gold is recovered. Costs are added to mineralized material on leach pads based on current mining and processing costs, including applicable depreciation and depletion relating to mining and processing operations. Costs are transferred from mineralized material on leach pads to subsequent stages of in-process inventories as the gold-bearing solution is processed. The value of such transferred costs of mineralized material on leach pads is based on the average cost per estimated recoverable ounce of gold on the leach pad. The estimates of recoverable gold on the leach pads are calculated from the quantities of material placed on the leach pads (measured tons added to the leach pads), the grade of material placed on the leach pads (based on assay data) and a recovery percentage. In general, leach pads recover approximately 95% of the recoverable ounces in the first six months of leaching, declining each month thereafter until the leaching process is complete. Although the quantities of recoverable material placed on the leach pads are reconciled by comparing the grades of material placed on pads to the quantities of gold actually recovered (metallurgical balancing), the nature of the leaching process inherently limits the ability to precisely monitor inventory levels. As a result, the metallurgical balancing process is constantly monitored and estimates are refined based on actual results over time.
Variations between actual and estimated quantities resulting from changes in assumptions and estimates that do not result in write-downs to NRV are accounted for on a prospective basis. The significant assumptions in determining the NRV apart from production cost and capitalized expenditure assumptions include gold prices. If short-term and long-term metals prices decrease, the value of the material on leach pads may decrease, and it may be necessary to record a write-down of mineralized material on leach pads to NRV.
In-process Inventories -
In-process inventories represent mineralized materials that are currently in the process of being converted to a saleable product through the Merrill-Crowe process. The value of in-process material is measured based on assays of the material fed into the process and the projected recoveries of material. In-process inventories are valued at the average cost of the material fed into the process attributable to the source material coming from the mines, stockpiles and/or leach pads plus the in-process conversion costs, including applicable depreciation relating to the process facilities incurred to that point in the process.
35
Metal Price –
Changes in the market price of gold may significantly affect our profitability and cash flow. Gold prices fluctuate widely due to factors such as: demand, global mine production levels, investor sentiment, central bank reserves, and the value of the U.S. dollar.
Interest Rate Risk –
Our exposure to market risk is confined to our cash and cash equivalents, all of which have maturities of less than three months and bear and pay interest in U.S. dollars. Since we invest in highly liquid, relatively low yield investments, we do not believe interest rate changes would have a material impact on us.
Our risk associated with fluctuating interest expense is limited to capital leases and other short-term obligations we may incur in our normal operations. The interest rates on our existing long-term debt borrowings are fixed and as a result, interest due on borrowings are not impacted by changes in market-based interest rates.
36
Item 8.
Financial Statements and Supplementary Data
CONSOLIDATED FINANCIAL STATEMENTS
DECEMBER 31, 2013, 2012 AND 2011
|
|
Page
|
|
|
|
|
|
|
|
|
|
|
|
|
|
|
|
Financial Statement Schedule
Comstock Mining Inc. and Subsidiaries
The following consolidated financial statement schedule of Comstock Mining Inc. and subsidiaries is filed as part of this Form 10-K. All other schedules have been omitted because they are not applicable, not required, or the information is included in the consolidated financial statements or notes thereto.
Exhibits. The exhibits listed in the accompanying index to exhibits immediately following the financial statements are filed as part of, or hereby incorporated by reference into, this Form 10-K.
37
REPORT OF INDEPENDENT REGISTERED PUBLIC ACCOUNTING FIRM
To the Board of Directors and Stockholders of
Comstock Mining Inc.
We have audited the accompanying consolidated balance sheets of Comstock Mining Inc. and subsidiaries (the "Company") as of December 31, 2013 and 2012, and the related consolidated statements of operations, changes in stockholders' equity, and changes in cash flows for each of the three years in the period ended December 31, 2013. Our audits also included the financial statement schedule listed in the Index at Item 15. These financial statements and financial statement schedule are the responsibility of the Company's management. Our responsibility is to express an opinion on these financial statements and financial statement schedule based on our audits.
We conducted our audits in accordance with the standards of the Public Company Accounting Oversight Board (United States). Those standards require that we plan and perform the audit to obtain reasonable assurance about whether the financial statements are free of material misstatement. An audit includes examining, on a test basis, evidence supporting the amounts and disclosures in the financial statements. An audit also includes assessing the accounting principles used and significant estimates made by management, as well as evaluating the overall financial statement presentation. We believe that our audits provide a reasonable basis for our opinion.
In our opinion, such consolidated financial statements present fairly, in all material respects, the financial position of the Company as of December 31, 2013 and 2012, and the results of its operations and its cash flows for each of the three years in the period ended December 31, 2013 in conformity with accounting principles generally accepted in the United States of America. Also, in our opinion, such financial statement schedule, when considered in relation to the basic consolidated financial statements taken as a whole, presents fairly in all material respects the information set forth therein.
We have also audited, in accordance with the standards of the Public Company Accounting Oversight Board (United States), the Company's internal control over financial reporting as of December 31, 2013, based on the criteria established in
Internal Control—Integrated Framework (1992)
issued by the Committee of Sponsoring Organizations of the Treadway Commission and our report dated March 17, 2014 expressed an unqualified opinion on the Company's internal control over financial reporting.
/s/ Deloitte & Touche LLP
Salt Lake City, Utah
March 17, 2014
F-1
COMSTOCK MINING INC. AND SUBSIDIARIES
DECEMBER 31,
2013
AND
2012
|
December 31, 2013
|
December 31, 2012
|
||||||
|
ASSETS
|
|
|
|
|
|||
|
CURRENT ASSETS:
|
|
|
|
|
|||
|
Cash and cash equivalents
|
$
|
2,409,446
|
|
$
|
5,973,079
|
|
|
|
Accounts receivable
|
14,629
|
|
634,643
|
|
|||
|
Inventories
|
591,961
|
|
662,929
|
|
|||
|
Stockpiles and mineralized material on leach pad
|
547,480
|
|
4,280,664
|
|
|||
|
Prepaid expenses
|
2,396,747
|
|
2,808,623
|
|
|||
|
Total current assets
|
5,960,263
|
|
14,359,938
|
|
|||
|
MINERAL RIGHTS AND PROPERITES, Net
|
7,470,780
|
|
7,614,780
|
|
|||
|
PROPERTIES, PLANT AND EQUIPMENT, Net
|
25,275,440
|
|
20,491,070
|
|
|||
|
RECLAMATION BOND DEPOSIT
|
2,742,804
|
|
2,510,804
|
|
|||
|
RETIREMENT OBLIGATION ASSET
|
2,491,956
|
|
2,803,318
|
|
|||
|
OTHER ASSETS
|
58,753
|
|
84,635
|
|
|||
|
TOTAL ASSETS
|
$
|
43,999,996
|
|
$
|
47,864,545
|
|
|
|
LIABILITIES AND STOCKHOLDERS’ EQUITY
|
|
|
|
|
|||
|
CURRENT LIABILITIES:
|
|
|
|
|
|||
|
Accounts payable
|
$
|
3,131,029
|
|
$
|
2,535,932
|
|
|
|
Accrued expenses
|
7,043,335
|
|
7,360,559
|
|
|||
|
Long-term debt obligations and capital lease – current portion
|
2,675,800
|
|
7,720,764
|
|
|||
|
Derivative liabilities
|
250,000
|
|
544,681
|
|
|||
|
Total current liabilities
|
13,100,164
|
|
18,161,936
|
|
|||
|
LONG-TERM LIABILITIES:
|
|
|
|
|
|||
|
Long-term debt and capital lease obligations
|
5,231,674
|
|
6,010,891
|
|
|||
|
Long-term reclamation liability
|
5,424,410
|
|
4,597,156
|
|
|||
|
Other liabilities
|
—
|
|
700,000
|
|
|||
|
Total long-term liabilities
|
10,656,084
|
|
11,308,047
|
|
|||
|
Total liabilities
|
23,756,248
|
|
29,469,983
|
|
|||
|
COMMITMENTS AND CONTINGENCIES
|
|
|
|
|
|||
|
STOCKHOLDERS’ EQUITY:
|
|
|
|
|
|||
|
Common stock, $.000666 par value, 3,950,000,000 shares authorized,
70,188,937 and 48,466,267 shares issued and outstanding at December 31, 2013 and 2012, respectively |
46,746
|
|
32,279
|
|
|||
|
Convertible Preferred Stock; 50,000,000 shares authorized
7.5% Series A-1 convertible preferred stock; $.000666 par value,
1,500,000 shares authorized, 24,362 and 23,499 shares issued and outstanding at
December 31, 2013 and 2012, respectively
|
16
|
|
16
|
|
|||
|
7.5% Series A-2 convertible preferred stock, $.000666 par value,
250,000 shares authorized, 1,610 and 5,271 shares issued and outstanding at December 31, 2013 and 2012, respectively |
1
|
|
4
|
|
|||
|
7.5% Series B convertible preferred stock, $.000666 par value,
600,000 shares authorized, 24,193 and 28,399 shares issued and outstanding at December 31, 2013 and 2012, respectively |
16
|
|
19
|
|
|||
|
Additional paid-in capital
|
199,167,304
|
|
175,985,559
|
|
|||
|
Accumulated deficit
|
(178,970,335
|
)
|
(157,623,315
|
)
|
|||
|
Total stockholders’ equity
|
20,243,748
|
|
18,394,562
|
|
|||
|
TOTAL LIABILITIES AND STOCKHOLDERS’ EQUITY
|
$
|
43,999,996
|
|
$
|
47,864,545
|
|
|
See notes to the consolidated financial statements.
F-2
COMSTOCK MINING INC. AND SUBSIDIARIES
YEARS ENDED DECEMBER 31,
2013
,
2012
AND
2011
|
|
2013
|
2012
|
2011
|
||||||||
|
REVENUES
|
|
|
|
|
|
|
|||||
|
Revenue - Mining
|
$
|
24,103,013
|
|
$
|
4,504,457
|
|
$
|
—
|
|
||
|
Revenue - Hospitality
|
723,574
|
|
634,159
|
|
473,386
|
|
|||||
|
Total revenues
|
24,826,587
|
|
5,138,616
|
|
473,386
|
|
|||||
|
COST AND EXPENSES
|
|
|
|
|
|
|
|||||
|
Costs applicable to mining revenue
|
26,495,665
|
|
3,554,727
|
|
—
|
|
|||||
|
Hospitality operating costs
|
1,117,225
|
|
928,897
|
|
570,039
|
|
|||||
|
Reclamation and exploration
|
8,504,992
|
|
18,305,303
|
|
9,501,327
|
|
|||||
|
General and administrative
|
7,968,725
|
|
9,277,944
|
|
4,474,726
|
|
|||||
|
Consultants and professional fees
|
1,672,782
|
|
3,391,379
|
|
1,481,835
|
|
|||||
|
Total cost and expenses
|
45,759,389
|
|
35,458,250
|
|
16,027,927
|
|
|||||
|
LOSS FROM OPERATIONS
|
(20,932,802
|
)
|
(30,319,634
|
)
|
(15,554,541
|
)
|
|||||
|
OTHER INCOME (EXPENSE)
|
|
|
|
|
|
|
|||||
|
Change in fair value of derivatives
|
454,681
|
|
438,519
|
|
3,864,146
|
|
|||||
|
Interest expense
|
(1,157,535
|
)
|
(929,837
|
)
|
(80,630
|
)
|
|||||
|
Interest income
|
2,101
|
|
17,309
|
|
72,928
|
|
|||||
|
Other
|
286,535
|
|
31,370
|
|
15,785
|
|
|||||
|
Total other income (expense), net
|
(414,218
|
)
|
(442,639
|
)
|
3,872,229
|
|
|||||
|
LOSS BEFORE INCOME TAXES
|
(21,347,020
|
)
|
(30,762,273
|
)
|
(11,682,312
|
)
|
|||||
|
INCOME TAX BENEFIT
|
—
|
|
—
|
|
76,081
|
|
|||||
|
NET LOSS
|
(21,347,020
|
)
|
(30,762,273
|
)
|
(11,606,231
|
)
|
|||||
|
DIVIDENDS ON CONVERTIBLE PREFERRED STOCK
|
(4,016,705
|
)
|
(4,370,247
|
)
|
(4,696,766
|
)
|
|||||
|
NET LOSS AVAILABLE TO COMMON SHAREHOLDERS
|
$
|
(25,363,725
|
)
|
$
|
(35,132,520
|
)
|
$
|
(16,302,997
|
)
|
||
|
Net loss per common share – basic
|
$
|
(0.42
|
)
|
$
|
(0.87
|
)
|
$
|
(0.66
|
)
|
||
|
Net loss per common share – diluted
|
$
|
(0.42
|
)
|
$
|
(0.87
|
)
|
$
|
(0.66
|
)
|
||
|
Weighted average common shares outstanding — basic
|
60,580,742
|
|
40,497,098
|
|
24,640,774
|
|
|||||
|
Weighted average common shares outstanding — diluted
|
60,580,742
|
|
40,497,098
|
|
24,640,774
|
|
|||||
See notes to the consolidated financial statements.
F-3
COMSTOCK MINING INC. AND SUBSIDIARIES
CONSOLIDATED STATEMENTS OF CHANGES IN STOCKHOLDERS’ EQUITY
YEARS ENDED DECEMBER 31,
2013
,
2012
AND
2011
|
|
Convertible Preferred Stock
|
|
|
|
|
|
|||||||||||||||||||||||||||||||||
|
|
Series A-1
|
Series A-2
|
Series B
|
Common Stock
|
Additional
|
Accumulated
|
|
||||||||||||||||||||||||||||||||
|
|
Shares
|
Amount
|
Shares
|
Amount
|
Shares
|
Amount
|
Shares
|
Amount
|
Paid-in
|
Deficit
|
Total
|
||||||||||||||||||||||||||||
|
BALANCE - January 1, 2011
|
21,775
|
|
$
|
15
|
|
8,382
|
|
$
|
5
|
|
35,749
|
|
$
|
24
|
|
21,154,663
|
|
$
|
14,089
|
|
$
|
139,906,683
|
|
$
|
(115,254,811
|
)
|
$
|
24,666,005
|
|
||||||||||
|
Common stock issued for:
|
|
|
|
|
|
|
|
|
|
|
|
|
|
|
|
|
|
|
|
|
|
|
|||||||||||||||||
|
Employee and director compensation
|
|
|
|
|
|
|
|
|
|
|
|
|
300,000
|
|
200
|
|
979,800
|
|
|
|
980,000
|
|
|||||||||||||||||
|
Payment of dividends
|
1,174,604
|
|
782
|
|
(782
|
)
|
—
|
|
|||||||||||||||||||||||||||||||
|
Purchase of mineral property
|
192,600
|
|
128
|
|
429,872
|
|
430,000
|
|
|||||||||||||||||||||||||||||||
|
Services
|
|
|
|
|
|
|
|
|
|
|
|
|
2,500
|
|
2
|
|
8,123
|
|
|
|
8,125
|
|
|||||||||||||||||
|
Stock-based compensation
|
|
|
|
|
|
|
|
|
|
|
|
|
|
|
|
|
203,731
|
|
|
|
203,731
|
|
|||||||||||||||||
|
Contingent dividend related to convertible preferred stock
|
|
|
|
|
|
|
|
|
|
|
|
|
|
|
|
|
(15,954
|
)
|
|
|
(15,954
|
)
|
|||||||||||||||||
|
Deemed dividend on beneficial conversion
|
|
|
|
|
|
|
|
|
|
|
|
|
|
|
|
|
638,276
|
|
|
|
638,276
|
|
|||||||||||||||||
|
feature related to convertible preferred stock
|
(638,276
|
)
|
|||||||||||||||||||||||||||||||||||||
|
Issuance of Series A-1 convertible preferred
|
|
|
|
|
|
|
|
|
|
|
|
|
|
|
|
|
|
|
|
|
—
|
|
|||||||||||||||||
|
stock for mineral lease
|
862
|
|
—
|
|
|
|
|
|
|
|
|
|
|
|
|
|
1,931,999
|
|
|
|
1,931,999
|
|
|||||||||||||||||
|
Conversion of Series A-2 convertible preferred stock into common stock
|
|
|
|
|
(1,710
|
)
|
(1
|
)
|
|
|
|
|
2,625,514
|
|
1,749
|
|
(1,748
|
)
|
|
|
—
|
|
|||||||||||||||||
|
Conversion of Series B convertible preferred stock into common stock
|
(5,842
|
)
|
(4
|
)
|
3,540,749
|
|
2,358
|
|
(2,354
|
)
|
—
|
|
|||||||||||||||||||||||||||
|
Net Loss
|
|
|
|
|
|
|
|
|
|
|
|
|
|
|
|
|
|
|
(11,606,231
|
)
|
(11,606,231
|
)
|
|||||||||||||||||
|
BALANCE - December 31, 2011
|
22,637
|
|
15
|
|
6,672
|
|
4
|
|
29,907
|
|
20
|
|
28,990,630
|
|
19,308
|
|
143,439,370
|
|
(126,861,042
|
)
|
16,597,675
|
|
|||||||||||||||||
|
Common stock issued for:
|
|
|
|
|
|
|
|
|
|
|
|
|
|
|
|
|
|
|
|
|
|
|
|||||||||||||||||
|
Public offering
|
13,325,521
|
|
8,875
|
|
26,541,122
|
|
26,549,997
|
|
|||||||||||||||||||||||||||||||
|
Public offering issuance costs
|
(2,858,871
|
)
|
(2,858,871
|
)
|
|||||||||||||||||||||||||||||||||||
|
Vested restricted stock
|
609,500
|
|
406
|
|
(406
|
)
|
—
|
|
|||||||||||||||||||||||||||||||
|
Payment of dividends
|
|
|
|
|
|
|
|
|
|
|
|
|
2,148,934
|
|
1,431
|
|
(1,431
|
)
|
|
|
—
|
|
|||||||||||||||||
|
Purchase of properties, plant and equipment
|
170,986
|
|
114
|
|
444,586
|
|
444,700
|
|
|||||||||||||||||||||||||||||||
|
Payment of long-term debt obligation
|
31,721
|
|
21
|
|
74,979
|
|
75,000
|
|
|||||||||||||||||||||||||||||||
|
Stock-based compensation
|
|
|
|
|
|
|
|
|
|
|
|
|
|
|
|
|
5,887,593
|
|
|
|
5,887,593
|
|
|||||||||||||||||
|
Deemed dividend on beneficial conversion
|
|
|
|
|
|
|
|
|
|
|
|
|
|
|
|
|
1,242,927
|
|
|
|
1,242,927
|
|
|||||||||||||||||
|
feature related to convertible preferred stock
|
(1,242,927
|
)
|
(1,242,927
|
)
|
|||||||||||||||||||||||||||||||||||
|
Issuance of Series A-1 convertible preferred stock for mineral lease
|
862
|
|
1
|
|
|
|
|
|
|
|
|
|
|
|
|
|
2,466,749
|
|
|
|
2,466,750
|
|
|||||||||||||||||
|
Contingent dividend related to convertible preferred stock
|
|
|
|
|
|
|
|
|
|
|
|
|
|
|
|
|
(6,009
|
)
|
|
|
(6,009
|
)
|
|||||||||||||||||
F-4
|
Conversion of Series A-2 convertible preferred stock into common stock
|
|
|
|
|
(1,401
|
)
|
—
|
|
|
|
|
|
2,152,217
|
|
1,433
|
|
(1,433
|
)
|
|
|
—
|
|
|||||||||||||||||
|
Conversion of Series B convertible preferred stock into common stock
|
|
|
|
|
|
|
|
|
(1,508
|
)
|
(1
|
)
|
913,910
|
|
609
|
|
(608
|
)
|
|
|
—
|
|
|||||||||||||||||
|
Cashless exercise of options
|
122,848
|
|
82
|
|
(82
|
)
|
—
|
|
|||||||||||||||||||||||||||||||
|
Net loss
|
|
|
|
|
|
|
|
|
|
|
|
|
|
|
|
|
|
|
(30,762,273
|
)
|
(30,762,273
|
)
|
|||||||||||||||||
|
BALANCE - December 31, 2012
|
23,499
|
|
16
|
|
5,271
|
|
4
|
|
28,399
|
|
19
|
|
48,466,267
|
|
32,279
|
|
175,985,559
|
|
(157,623,315
|
)
|
18,394,562
|
|
|||||||||||||||||
|
Common stock issued for:
|
|
|
|
|
|
|
|
|
|
|
|
|
|
|
|
|
|
|
|
|
|
|
|||||||||||||||||
|
Public offering
|
|
|
|
|
|
|
|
|
|
|
|
|
9,146,920
|
|
6,091
|
|
18,743,909
|
|
|
|
18,750,000
|
|
|||||||||||||||||
|
Public offering issuance costs
|
|
|
|
|
|
|
|
|
|
|
|
|
|
|
|
|
(459,515
|
)
|
|
|
(459,515
|
)
|
|||||||||||||||||
|
Vested restricted stock
|
|
|
|
|
|
|
|
|
|
|
|
|
1,199,300
|
|
799
|
|
(799
|
)
|
|
|
—
|
|
|||||||||||||||||
|
Payment of dividends
|
|
|
|
|
|
|
|
|
|
|
|
|
2,167,398
|
|
1,443
|
|
(1,443
|
)
|
|
|
—
|
|
|||||||||||||||||
|
Payment of long-term debt obligation
|
|
|
|
|
|
|
|
|
|
|
|
|
1,037,141
|
|
691
|
|
1,914,309
|
|
|
|
1,915,000
|
|
|||||||||||||||||
|
Deemed dividend on beneficial conversion
|
|
|
|
|
|
|
|
|
|
|
|
|
|
|
|
|
304,724
|
|
|
|
304,724
|
|
|||||||||||||||||
|
feature related to convertible preferred stock
|
|
|
|
|
|
|
|
|
|
|
|
|
|
|
|
|
(304,724
|
)
|
|
|
(304,724
|
)
|
|||||||||||||||||
|
Issuance of Series A-1 convertible preferred stock for mineral lease
|
863
|
|
—
|
|
|
|
|
|
|
|
|
|
|
|
|
|
2,047,575
|
|
|
|
2,047,575
|
|
|||||||||||||||||
|
Conversion of Series A-2 convertible preferred stock into common stock
|
|
|
|
|
(3,661
|
)
|
(3
|
)
|
|
|
|
|
5,623,003
|
|
3,745
|
|
(3,742
|
)
|
|
|
—
|
|
|||||||||||||||||
|
Conversion of Series B convertible preferred stock into common stock
|
|
|
|
|
|
|
|
|
(4,206
|
)
|
(3
|
)
|
2,548,908
|
|
1,698
|
|
(1,695
|
)
|
|
|
—
|
|
|||||||||||||||||
|
Stock-based compensation
|
|
|
|
|
|
|
|
|
|
|
|
|
|
|
|
|
943,146
|
|
|
|
943,146
|
|
|||||||||||||||||
|
Net loss
|
|
|
|
|
|
|
|
|
|
|
|
|
|
|
|
|
|
|
(21,347,020
|
)
|
(21,347,020
|
)
|
|||||||||||||||||
|
BALANCE - December 31, 2013
|
24,362
|
|
$
|
16
|
|
1,610
|
|
$
|
1
|
|
24,193
|
|
$
|
16
|
|
70,188,937
|
|
$
|
46,746
|
|
$
|
199,167,304
|
|
$
|
(178,970,335
|
)
|
$
|
20,243,748
|
|
||||||||||
See notes to consolidated financial statements.
F-5
COMSTOCK MINING INC. AND SUBSIDIARIES
YEARS ENDED DECEMBER 31,
2013
,
2012
AND
2011
|
|
2013
|
2012
|
2011
|
||||||||
|
OPERATING ACTIVITIES:
|
|
|
|
|
|
|
|||||
|
Net loss
|
$
|
(21,347,020
|
)
|
$
|
(30,762,273
|
)
|
$
|
(11,606,231
|
)
|
||
|
Adjustments to reconcile net loss to net cash used in operating activities:
|
|
|
|
|
|
|
|||||
|
Depreciation, amortization and depletion
|
4,821,575
|
|
2,503,147
|
|
269,549
|
|
|||||
|
Gain on sale of properties, plant, and equipment
|
—
|
|
—
|
|
(15,785
|
)
|
|||||
|
Loss on disposal of mineral rights and properties, plant, and equipment
|
1,015,496
|
|
14,169
|
|
—
|
|
|||||
|
Gain on settlement of debt
|
(286,535
|
)
|
|
—
|
|
|
—
|
|
|||
|
Stock payments and stock-based compensation
|
3,271,511
|
|
7,914,918
|
|
3,284,239
|
|
|||||
|
Accretion of reclamation liability
|
295,484
|
|
184,237
|
|
97,346
|
|
|||||
|
Write down of inventories and stockpiles, mineralized material on leach pad
|
1,514,574
|
|
—
|
|
—
|
|
|||||
|
Deferred income taxes
|
—
|
|
—
|
|
(76,081
|
)
|
|||||
|
Amortization of debt discounts and issuance costs
|
818,780
|
|
752,890
|
|
—
|
|
|||||
|
Net change in fair values of derivatives
|
(454,681
|
)
|
(438,519
|
)
|
(3,864,146
|
)
|
|||||
|
Changes in operating assets and liabilities, net of affects from acquisition:
|
|
|
|||||||||
|
Accounts receivable
|
(2,103,093
|
)
|
(634,643
|
)
|
—
|
|
|||||
|
Inventories
|
(291,351
|
)
|
(662,929
|
)
|
—
|
|
|||||
|
Stockpiles and mineralized material on leach pads
|
2,580,929
|
|
(4,280,664
|
)
|
—
|
|
|||||
|
Prepaid expenses
|
26,851
|
|
(393,461
|
)
|
66,000
|
|
|||||
|
Other assets
|
25,882
|
|
80,106
|
|
(98,516
|
)
|
|||||
|
Accounts payable
|
(200,431
|
)
|
1,450,440
|
|
126,414
|
|
|||||
|
Accrued expenses and other liabilities
|
32,776
|
|
1,859,149
|
|
169,310
|
|
|||||
|
NET CASH USED IN OPERATING ACTIVITIES
|
(10,279,253
|
)
|
(22,413,433
|
)
|
(11,647,901
|
)
|
|||||
|
INVESTING ACTIVITIES:
|
|
|
|
|
|
|
|||||
|
Proceeds from maturity of available-for-sale securities
|
—
|
|
2,211,287
|
|
4,403,950
|
|
|||||
|
Purchase of available-for-sale securities
|
—
|
|
—
|
|
(2,205,000
|
)
|
|||||
|
Purchase of mineral rights and properties, plant and equipment
|
(5,990,941
|
)
|
(13,366,348
|
)
|
(7,799,058
|
)
|
|||||
|
Acquisition of Gold Hill Hotel
|
—
|
|
—
|
|
(500,000
|
)
|
|||||
|
Proceeds from sale of mineral rights and properties, plant and equipment
|
596,820
|
|
—
|
|
102,000
|
|
|||||
|
Change in reclamation bond deposit
|
(1,282,000
|
)
|
260,944
|
|
—
|
|
|||||
|
NET CASH USED IN INVESTING ACTIVITIES
|
(6,676,121
|
)
|
(10,894,117
|
)
|
(5,998,108
|
)
|
|||||
|
FINANCING ACTIVITIES:
|
|
|
|
|
|
|
|||||
|
Principal payments on long-term debt and capital lease obligations
|
(4,898,744
|
)
|
(968,006
|
)
|
(782,290
|
)
|
|||||
|
Proceeds from long-term debt obligations
|
—
|
|
9,702,500
|
|
—
|
|
|||||
|
Long-term debt obligations issuance costs
|
—
|
|
(100,000
|
)
|
—
|
|
|||||
|
Proceeds from the issuance of common stock
|
18,750,000
|
|
24,349,203
|
|
—
|
|
|||||
|
Common stock issuance costs
|
(459,515
|
)
|
(658,078
|
)
|
—
|
|
|||||
|
NET CASH PROVIDED BY (USED IN) FINANCING ACTIVITIES
|
13,391,741
|
|
32,325,619
|
|
(782,290
|
)
|
|||||
|
DECREASE IN CASH AND CASH EQUIVALENTS
|
(3,563,633
|
)
|
(981,931
|
)
|
(18,428,299
|
)
|
|||||
|
CASH AND CASH EQUIVALENTS, BEGINNING OF YEAR
|
5,973,079
|
|
6,955,010
|
|
25,383,309
|
|
|||||
|
CASH AND CASH EQUIVALENTS, END OF YEAR
|
$
|
2,409,446
|
|
$
|
5,973,079
|
|
$
|
6,955,010
|
|
||
|
SUPPLEMENTAL CASH FLOW INFORMATION:
|
|
|
|
|
|
|
|||||
|
Cash paid for interest
|
$
|
349,390
|
|
$
|
295,258
|
|
$
|
64,837
|
|
||
|
Cash paid for income taxes
|
$
|
—
|
|
$
|
—
|
|
$
|
—
|
|
||
|
|
|
|
|
|
(Continued)
|
|
|||||
F-6
COMSTOCK MINING INC. AND SUBSIDIARIES
CONSOLIDATED STATEMENTS OF CHANGES IN CASH FLOWS
YEARS ENDED DECEMBER 31,
2013
,
2012
AND
2011
|
Supplemental disclosure of non-cash investing and financing
|
|
|
|
||||||||
|
activities:
|
|
|
|
||||||||
|
|
2013
|
2012
|
2011
|
||||||||
|
Conversion of Series A-2 and Series B convertible preferred stock
|
$
|
5,443
|
|
$
|
2,042
|
|
$
|
4,107
|
|
||
|
Dividends paid in common stock (par value)
|
1,443
|
|
1,431
|
|
782
|
|
|||||
|
Issuance of common stock for properties, plant and equipment
|
—
|
|
444,700
|
|
430,000
|
|
|||||
|
Issuance of common stock for long-term debt obligations payment
|
1,915,000
|
|
75,000
|
|
—
|
|
|||||
|
Issuance of Series A-1 convertible preferred stock for mineral lease capitalized in prepaid expenses
|
2,047,575
|
|
2,466,750
|
|
1,931,999
|
|
|||||
|
Issuance of long-term debt and capital lease obligations for purchase of mineral rights and properties, plant and equipment
|
4,472,840
|
|
2,801,125
|
|
426,960
|
|
|||||
|
Issuance of long-term debt obligations for Gold Hill Hotel acquisition
|
—
|
|
—
|
|
340,000
|
|
|||||
|
Additions to reclamation liability and retirement obligation asset
|
531,770
|
|
2,405,314
|
|
577,529
|
|
|||||
|
Reclamation bond deposit included in accrued expenses and other liabilities
|
1,000,000
|
|
2,050,000
|
|
—
|
|
|||||
|
Settlement of long-term debt obligations from gold transfers
|
2,723,107
|
|
—
|
|
—
|
|
|||||
|
Settlement of long-term debt obligations through transfer of properties, plant and equipment
|
1,028,180
|
|
—
|
|
—
|
|
|||||
|
Accrual of derivative liability — contingent dividend with offset to preferred stock
|
—
|
|
6,009
|
|
15,954
|
|
|||||
|
Properties, plant and equipment purchases in current liabilities
|
934,789
|
|
139,261
|
|
809,150
|
|
|||||
|
Common stock surrendered in cashless exercise of options
|
—
|
|
82
|
|
—
|
|
|||||
See Footnote 12 for disclosure of assets acquired and liabilities assumed in Gold Hill Hotel acquisition in 2011.
See notes to consolidated financial statements. (Concluded)
F-7
COMSTOCK MINING INC.
NOTES TO CONSOLIDATED FINANCIAL STATEMENTS
FOR THE YEARS ENDED DECEMBER 31, 2013, 2012 AND 2011
1. Nature of Business
Comstock Mining Inc. is a producing, Nevada-based gold and silver mining company with extensive, contiguous property in the historic Comstock and Silver City mining districts (collectively, the “Comstock District”). The Comstock District is located within the western portion of the Basin and Range Province of Nevada, between Reno and Carson City, Nevada. Our Lucerne Resource area is located in Storey County, Nevada, approximately three miles south of Virginia City, Nevada and 30 miles southeast of Reno, Nevada. The Company also operates the Gold Hill Hotel located in Gold Hill, Nevada between Virginia City and the Comstock Mine Project. As used in the notes to the consolidated financial statements, we refer to Comstock Mining Inc., and its wholly owned subsidiaries as “we,” “us,” “our,” or “Company.”
We continue acquiring additional properties in the Comstock District, expanding our footprint and creating opportunities for exploration, mining and processing. The Company now owns or controls approximately
7,447
acres of mining claims and parcels in the Comstock and Silver City Districts. The acreage is comprised of approximately
1,376
acres of patented claims (private lands) and surface parcels (private lands) and approximately
6,071
acres of unpatented mining claims, which the Bureau of Land Management, (“BLM”) administers.
2. Summary of Significant Accounting Policies
Principles of Consolidation -
The consolidated financial statements include the accounts of Comstock Mining Inc., and its wholly owned subsidiaries: Comstock Mining LLC and the Gold Hill Hotel, Inc. Inter-company transactions and balances have been eliminated.
Basis of Presentation -
The accompanying consolidated financial statements have been prepared in conformity with accounting principles generally accepted in the United States of America which contemplate continuation of the Company as a going concern.
The Company has recently transitioned into production in the Lucerne Mine and ramped up to the targeted
20,000
gold-equivalent-ounce annual production rate.
The Company has recurring net losses from operations and an accumulated deficit of
$179.0 million
as of December 31, 2013. For the year ended
December 31, 2013
, the Company incurred a net loss of
$21.3 million
and used
$10.3 million
cash in operations. As of
December 31, 2013
, the Company had cash and cash equivalents of
$2.4 million
, current assets of
$6.0 million
and current liabilities of
$13.1 million
, resulting in current liabilities in excess of current assets of
$7.1 million
. The Company continues its efforts to increase production, reduce costs and working capital needs, improve efficiencies, and maximize funds available for working capital. The Company believes that it will have sufficient liquidity to fund operations for the next twelve months through the use of current cash resources and cash generated through operations. However, in the event that production or other factors impacting future operating results fall below management's expectations, the Company would be required to obtain additional debt or equity financing to sustain operations, and the availability of such financing on acceptable terms, if at all, cannot be assured. The Company received a commitment from a significant investor in March 2014 that it would provide the necessary level of financial support to enable the Company to pay its debts as they become due through March 31, 2015. Accordingly, the Company believes it will have sufficient funds to sustain its operations during the next 12 months as a result of the sources of funding detailed above.
Cash and Cash Equivalents -
We consider all highly liquid, short-term investments with an original maturity of three months or less to be cash equivalents. The carrying value of cash equivalents approximates fair value. As of
December 31, 2013
, we had cash and cash equivalents in excess of federal insurance limits in the amount of approximately
$1,900,000
.
Inventories, Stockpiles and Mineralized Material on Leach Pads -
Inventories, including stockpiles and mineralized material on leach pads are carried at the lower of cost or net realizable value. Net realizable value represents the estimated future sales price of the product based on current and long-term metals prices, less the estimated costs to complete production and bring the product to sale. Write-downs of stockpiles, mineralized material on leach pads and inventories to net realizable value are reported as a component of costs applicable to mining revenue. Cost is comprised of production costs for mineralized material produced and processed. Production costs include the costs of materials, costs of processing, direct labor, mine site and processing facility overhead costs, stock-based compensation, and depreciation, amortization and depletion.
F-8
Stockpiles
-
Stockpiles represent mineralized material that has been extracted from the mine and is available for further processing. Stockpiles are measured by estimating the number of tons added and removed from the stockpile. Stockpile tonnages are verified by periodic surveys. Costs are allocated to stockpiles based on relative values of material stockpiled and processed using current mining costs incurred up to the point of stockpiling the material, including applicable overhead, depreciation, and depletion relating to mining operations, and removed at each stockpile’s average cost per ton.
Mineralized Material on Leach Pads
-
The Company utilizes a heap leaching process to recover gold from its mineralized material. Under this method, the mineralized material is placed on leach pads where it is treated with a chemical solution that dissolves the gold contained in the material. The resulting gold-bearing solution is further processed in a facility where the gold is recovered. Costs are added to mineralized material on leach pads based on current mining and processing costs, including applicable depreciation relating to mining and processing operations. Costs are transferred from mineralized material on leach pads to subsequent stages of in-process inventories as the gold-bearing solution is processed. The value of such transferred costs of mineralized material on leach pads is based on the average cost per estimated recoverable ounce of gold on the leach pad.
The estimates of recoverable gold on the leach pads are calculated from the quantities of material placed on the leach pads (measured tons added to the leach pads), the grade of material placed on the leach pads (based on assay data) and a recovery percentage.
Although the quantities of recoverable gold placed on the leach pads are reconciled by comparing the quantities and grades of material placed on leach pads to the quantities and grades quantities of gold actually recovered (metallurgical balancing), the nature of the leaching process inherently limits the ability to precisely monitor inventory levels. As a result, the metallurgical balancing process is constantly monitored and estimates are refined based on actual results over time. Variations between actual and estimated quantities resulting from changes in assumptions and estimates that do not result in write-downs to net realizable value are accounted for on a prospective basis.
In-process Inventories
-
In-process inventories represent mineralized materials that are currently in the process of being converted to a saleable product through the Merrill-Crowe process. The value of in-process material is measured based on assays of the material fed into the process and the projected recoveries of material. In-process inventories are valued at the average cost of the material fed into the process attributable to the source material coming from the mines, stockpiles and/or leach pads plus the in-process conversion costs, including applicable depreciation relating to the process facilities incurred to that point in the process.
Finished Goods Inventories
-
Finished goods inventories include gold that has been processed through the Company’s Merrill-Crowe facility and are valued at the average cost of their production.
Fair Value Measurements -
The fair value of a financial instrument is the amount that could be received upon the sale of an asset or paid to transfer a liability in an orderly transaction between market participants at the measurement date. Financial assets are marked to bid prices and financial liabilities are marked to offer prices. The fair value should be calculated based on assumptions that market participants would use in pricing the asset or liability, not on assumptions specific to the entity. In addition, the fair value of liabilities should include consideration of non-performance risk, including the party’s own credit risk.
Fair value measurements do not include transaction costs. A fair value hierarchy is used to prioritize the quality and reliability of the information used to determine fair values. Categorization within the fair value hierarchy is based on the lowest level of input that is significant to the fair value measurement. The fair value hierarchy is defined into the following three categories:
Level 1: Quoted market prices in active markets for identical assets or liabilities.
Level 2: Observable market-based inputs or unobservable inputs that are corroborated by market data.
Level 3: Unobservable inputs that are not corroborated by market data.
Long-Lived Assets -
We review the carrying amount of our long-lived assets for impairment whenever there are negative indicators of impairment. An asset is considered impaired when estimated future cash flows are less than the carrying amount of the asset. In the event the carrying amount of such asset is not considered recoverable, the asset is adjusted to its fair value. Fair value is generally determined based on discounted future cash flow.
F-9
Mineral Rights and Properties -
We defer acquisition costs until we determine the viability of the property. Since we do not have proven and probable reserves as defined by Securities and Exchange Commission (“SEC”) Industry Guide 7, exploration expenditures are expensed as incurred. We expense care and maintenance costs as incurred.
We review the carrying value of our mineral rights and properties for impairment whenever there are negative indicators of impairment. Our estimate of the gold price, mineralized materials, operating capital, and reclamation costs are subject to risks and uncertainties affecting the recoverability of our investment in the mineral claims and properties. Although we have made our best, most current estimate of these factors, it is possible that near term changes could adversely affect estimated net cash flows from our mineral claims and properties and possibly require future asset impairment write-downs.
Where estimates of future net operating cash flows are not available and where other conditions suggest impairment, we assess recoverability of carrying value from other means, including net cash flows generated by the sale of the asset. We use the units-of-production method to deplete the mineral rights and properties.
Properties, Plant and Equipment -
We record properties, plant and equipment at historical cost. We provide depreciation and amortization in amounts sufficient to match the cost of depreciable assets to operations over their estimated service lives or productive value. We capitalize expenditures for improvements that significantly extend the useful life of an asset. We charge expenditures for maintenance and repairs to operations when incurred. Depreciation is computed using the straight-line method over estimated useful lives as follows:
|
Building
|
7 to 15 years
|
|
|
Vehicles and equipment
|
3 to 7 years
|
|
|
Processing and laboratory
|
5 to 7 years
|
|
|
Furniture and fixtures
|
2 to 3 years
|
|
Reclamation Liabilities and Asset Retirement Obligations -
Minimum standards for site reclamation and closure have been established for us by various government agencies. Asset retirement obligations are recognized when incurred and recorded as liabilities at fair value. The liability is accreted over time through periodic charges to earnings. In addition, the asset retirement cost is capitalized and amortized over the life of the related asset. Reclamation costs are periodically adjusted to reflect changes in the estimated present value resulting from the passage of time and revisions to the estimates of either the timing or amount of the reclamation and abandonment costs. The Company reviews, on an annual basis, unless otherwise deemed necessary, the asset retirement obligation at each mine site.
Revenue Recognition -
Revenue is recognized from sales when persuasive evidence of an arrangement exists, the price is determinable, the product has been delivered, the title has been transferred to the customer and collection of the sales price is reasonably assured. Gold revenue is recorded at an agreed upon spot price and gold ounce measurement resulting in revenue and a receivable at the time of sale. Gold revenue is recorded net of refining charges and discounts. Sales of by-products (such as silver) are credited to costs applicable to mining revenue. Hospitality revenue is recognized as services are provided to customers.
All accounts receivable amounts are due from a single customer. Substantially all mining revenues recorded in the current period also related to the same customer. As gold can be sold through numerous gold market traders worldwide, the Company is not economically dependent on a limited number of customers for the sale of its product.
Stock Issued For Goods and Services -
Common shares issued for goods and services are valued based upon the fair market value of our common stock or the goods and services received, whichever is the most reliably measurable on the date of issue.
Stock-Based Compensation -
For stock-based transactions, compensation expense is recognized over the requisite service period, which is generally the vesting period, based on the estimated fair value on the grant date of the award.
Loss per Common Share -
Basic net loss per common share is computed by dividing net loss, less the preferred stock dividends, by the weighted average number of common shares outstanding. Dilutive loss per share includes any additional dilution from common stock equivalents, such as stock options and warrants, and convertible instruments, if the impact is not antidilutive. Since the Company incurred net losses for the periods presented, all equity-linked instruments are considered anti-dilutive.
F-10
Comprehensive Loss -
There were no components of comprehensive loss other than net loss for the years ended
December 31, 2013
,
2012
and
2011
.
Derivative Liabilities –
Derivatives liabilities are recorded at fair value when issued and the subsequent change in fair value each period is recorded in other income (expense) in the consolidated statements of operations. We do not hold or issue any derivative financial instruments for speculative trading purposes.
Gold Forward and Call Option Derivatives
During the year ended 2013, the Company began to manage its exposure to changes in gold market prices by entering into gold forward and call option derivative contracts whereby it agrees to sell specified amounts of gold at specified prices to its primary customer on a short term-basis. Premiums received at the inception of written gold call options are recorded as liability. Changes in the fair value of these gold forward and call option derivative contracts are included in mining revenue as they relate to future gold sales. We did not enter into any gold forward and call option derivative contracts of this nature during the year ended December 31, 2012.
Gold forward and call option derivatives outstanding at December 31, 2012 related to a debt obligation transaction; therefore, the changes in the fair value of these derivatives are included in other income (expense) in the consolidation statements of operations for the years ended December 31, 2013 and 2012. These gold forward and call derivatives expired during the year ended December 31, 2013.
Income Taxes -
We recognize deferred tax assets and liabilities based on differences between the consolidated financial statement carrying amounts and tax bases of certain assets and liabilities. Realization of deferred tax assets is dependent upon future earnings, if any. We provide a valuation allowance for deferred tax assets for which we do not consider realization of such deferred tax assets to be more likely than not.
Use of Estimates -
In preparing financial statements in conformity with generally accepted accounting principles, we are required to make estimates and assumptions that affect the reported amounts of assets and liabilities and the disclosure of contingent assets and liabilities at the date of the financial statements and revenues and expenditures during the reported periods. Actual results could differ materially from those estimates. Estimates may include those pertaining to valuation of inventories and mineralized material on leach pads, the estimated useful lives and valuation of properties, plant and equipment, mineral rights and properties, deferred tax assets, convertible preferred stock, derivative assets and liabilities, reclamation liabilities, stock-based compensation and payments, and contingent liabilities.
F-11
3. Inventories, Stockpiles and Mineralized Materials on Leach Pads
Inventories, stockpiles and mineralized materials on leach pads at
December 31, 2013
and 2012 consisted of the following:
|
2013
|
2012
|
||||||
|
Finished goods
|
$
|
—
|
|
$
|
—
|
|
|
|
In-process
|
591,961
|
|
662,929
|
|
|||
|
Total inventories
|
$
|
591,961
|
|
$
|
662,929
|
|
|
|
|
|
|
|||||
|
Stockpiles
|
$
|
45,455
|
|
$
|
361,061
|
|
|
|
Mineralized material on leach pads
|
502,025
|
|
3,919,603
|
|
|||
|
Total stockpiles and mineralized material on leach pads
|
$
|
547,480
|
|
$
|
4,280,664
|
|
|
During the year ended December 31, 2013, the Company wrote down inventories by
$362,320
and stockpiles and mineralized materials on leach pads by
$1,152,254
to reduce the carrying values to net realizable value. The write downs were included as components of cost applicable to mining revenue in the consolidated statements of operations. The primary factor that influenced the need to record the write downs was recent market declines in gold prices.
4. Derivative Financial Instruments
Derivative financial instruments at
December 31, 2013
and
2012
consisted of the following:
|
Derivative Type
|
2013
|
2012
|
|||||
|
Derivative liabilities
|
|
|
|
|
|||
|
Gold call options
|
$
|
—
|
|
$
|
16,330
|
|
|
|
Gold forwards
|
—
|
|
297,451
|
|
|||
|
Contingent debt obligation payment
|
250,000
|
|
—
|
|
|||
|
Contingent dividend payment
|
—
|
|
230,900
|
|
|||
|
Total derivative liabilities
|
$
|
250,000
|
|
$
|
544,681
|
|
|
Gold Call Option, Forward, and Put Derivatives -
During the year ended December 31, 2012, the Company entered into gold call, put, and forward derivative contracts in connection with the Auramet Facility transaction (see footnote 11). The gold puts expired during 2012 and the gold calls and forwards expired during 2013. The Company recognized gains on the change in fair value of the gold calls and forwards derivatives outstanding during the year ended December 31, 2013 of
$16,330
and
$297,451
, respectively. During the year ended December 31, 2012, the Company recognized a loss of
$172,500
on the gold puts, a gain of
$108,361
on the gold calls, and a loss of
$297,451
on the gold forwards. The changes in the fair value of these derivatives were included as components of change in fair value of derivatives in the consolidated statements of operations.
During the year ended December 31, 2013, the Company entered into separate gold forward and call option derivative contracts related to future gold sales with its primary customer. Premiums received at the inception of written gold call options are recorded as a liability and totaled
$217,935
for the year ended December 31, 2013. The Company recognized a gain of
$59,289
and
$217,935
on the change in fair value of the gold forward and call option derivatives, respectively, during the year ended December 31, 2013. The recognized gains were included as a component of mining revenues as the contracts relate to gold sales. The gold forward and call option derivative contracts outstanding at December 31, 2013 covered a total of
118
and
2,500
gold ounces with an average price of
$1,254
and
$1,293
per ounce, respectively, and are expected to settle or expire within three months. The fair value of these gold forward and call option derivatives was not significant as of December 31, 2013.
F-12
Contingent Debt Obligation Payment Derivative -
During the year ended December 31, 2013, the Company entered into an agreement to issue
1,000,000
shares of our common stock for a
$2,000,000
principal payment on its Golden Goose debt obligation (see footnote 11). As part of the agreement, the Company agreed to make an additional payment to the noteholder on December 31, 2014 equal to the difference between
$2,000,000
and the cash proceeds received from the noteholder’s subsequent sale of the common stock shares issued plus the value of any remaining unsold shares held by the noteholder on December 15, 2014. The value of the remaining unsold shares held by the noteholder will be determined based on the closing price of the Company’s common stock on December 15, 2014 multiplied by the number of remaining unsold shares as of December 15, 2014. We determined the contingent obligation to make an additional payment to ultimately satisfy the debt obligation was a derivative liability. The fair value of the common shares issued and derivative liability at issuance date was
$1,840,000
and
$160,000
, respectively. The derivative's fair value was
$250,000
at December 31, 2013. The recognized loss on the change in fair value of the derivative liability for the year ended December 31, 2013 was
$90,000
and was included as a component of change in fair value of derivatives in the consolidated statements of operations.
Contingent Dividend Payment Derivative -
The Series A1, Series A2 and Series B convertible preferred stock include a contingent dividend payment feature. The contingent dividend payment derivative is derived from the possibility the Company may be required to pay an additional dividend to all convertible preferred stockholders if the Series A2 convertible preferred stock is force converted to common stock before August 31, 2013 or if the Series B convertible preferred stock is force converted into common stock before October 18, 2013. Accordingly, we applied fair value measurement to the contingent dividend derivative at each reporting period using a Monte Carlo valuation model. Upon the issuance of
862.5
shares of Series A1 convertible preferred stock in 2012 and 2011, we recorded a derivative liability as an adjustment to the fair value basis of the convertible preferred stock issued of
$6,009
and
$15,954
, respectively. During the years ended December 31, 2013, 2012 and 2011, the Company recognized a gain of
$230,900
,
$800,109
, and
$3,864,164
, respectively, on the change in fair value of the contingent dividend payment derivative liability. Each of these amounts was recorded within the change in fair value of derivatives in the consolidated statements of operations. The contingent dividend payment feature expired in 2013.
5. Prepaid Expenses
Prepaid expenses at
December 31, 2013
and
2012
consisted of the following:
|
|
2013
|
2012
|
|||||
|
Prepaid mineral leases
|
$
|
1,739,633
|
|
$
|
2,022,830
|
|
|
|
Other
|
657,114
|
|
785,793
|
|
|||
|
Total
|
$
|
2,396,747
|
|
$
|
2,808,623
|
|
|
6. Mineral Rights and Properties, Net
Mineral rights and properties at
December 31, 2013
and
2012
consisted of the following:
|
2013
|
2012
|
||||||
|
Dayton resource area
|
$
|
2,932,226
|
|
$
|
2,932,226
|
|
|
|
Lucerne resource area
|
1,998,896
|
|
1,998,896
|
|
|||
|
Occidental area
|
1,002,172
|
|
1,002,172
|
|
|||
|
Spring Valley area
|
810,000
|
|
810,000
|
|
|||
|
Oest area
|
260,707
|
|
260,707
|
|
|||
|
Northern extension
|
157,205
|
|
157,205
|
|
|||
|
Northern targets
|
121,170
|
|
121,170
|
|
|||
|
Other mineral properties
|
317,404
|
|
317,404
|
|
|||
|
Water rights
|
90,000
|
|
90,000
|
|
|||
|
Accumulated depletion
|
(219,000
|
)
|
(75,000
|
)
|
|||
|
|
$
|
7,470,780
|
|
$
|
7,614,780
|
|
|
F-13
Mineral rights and properties balances as of
December 31, 2013
and 2012 are presented based on the Company’s identified mineral resource areas and exploration targets. During the years ended December 31, 2013, 2012, and 2011, the Company recognized
$144,000
,
$75,000
and
$0
, respectively, of depletion expense.
7. Properties, Plant and Equipment, Net
Properties, plant and equipment at
December 31, 2013
and
2012
consisted of the following:
|
|
2013
|
2012
|
|||||
|
Land and building
|
$
|
4,683,852
|
|
$
|
3,648,437
|
|
|
|
Vehicle and equipment
|
7,964,633
|
|
6,440,246
|
|
|||
|
Processing and laboratory
|
18,114,045
|
|
12,800,760
|
|
|||
|
Furniture and fixtures
|
754,885
|
|
562,577
|
|
|||
|
|
31,517,415
|
|
23,452,020
|
|
|||
|
Less accumulated depreciation
|
(6,241,975
|
)
|
(2,960,950
|
)
|
|||
|
|
$
|
25,275,440
|
|
$
|
20,491,070
|
|
|
During the year ended December 31, 2013, the Company acquired properties, plant and equipment totaling
$11.3 million
for continued expansion. The Company sold mining vehicles and other equipment with a gross book value of
$3.2 million
for a loss of
$1.0 million
during 2013. The loss is included in general and administrative cost and expenses in the consolidated statements of operations.
Property, plant and equipment capitalized under capital lease obligations as of December 31, 2013 included mining vehicles and equipment with a gross book value of
$3.8 million
and an accumulated depreciation value of
$0.3 million
. The Company did not have any property, plant, and equipment capitalized under capital lease obligations as of December 31, 2012.
During the years ended December 31, 2013, 2012 and 2011, the Company recognized
$3,834,442
;
$2,428,147
; and
$269,549
, respectively, of depreciation expense.
8. Reclamation Bond Deposit
The Nevada Revised Statutes and Regulations require a surety bond to be posted for mining projects that leave the site safe, stable and capable of providing for a productive post-mining land use. The bond insures for the estimated costs required to safely reclaim the natural environment to the regulatory standards established by the State of Nevada’s Division of Environmental Protection with the purposes of ensuring public safety, protecting the waters of the state, and providing for post mining land use. Accordingly, we had a
$5.2 million
reclamation surety bond through the Lexon Surety Group (“Lexon”) with the State of Nevada’s Bureau of Mining Regulation Reclamation as of December 31, 2013 and 2012. As part of the surety agreement, the Company agreed to pay a
2.5%
annual bonding fee. The total cash collateral, payable in installments through 2014, per the surety agreement was
$2.6 million
and
$2.3 million
at December 31, 2013 and 2012, respectively. The total cash collateral is a component of the reclamation bond deposit in the consolidated balance sheets. At December 31, 2013, accrued expenses included the remaining
$1 million
due to Lexon. At December 31, 2012, accrued expenses included
$1.4 million
and other liabilities included
$0.7 million
of the total
$2.1 million
due to Lexon.
The reclamation bond deposit at December 31, 2013 and 2012 consisted of the following:
|
2013
|
2012
|
||||||
|
Lexon surety bond cash collateral
|
$
|
2,600,000
|
|
$
|
2,300,000
|
|
|
|
Other cash reclamation bond deposits
|
142,804
|
|
210,804
|
|
|||
|
Total
|
$
|
2,742,804
|
|
$
|
2,510,804
|
|
|
F-14
9. Long-term Reclamation Liability and Retirement Obligation Asset
The Company is required to mitigate long-term environmental impacts by stabilizing, contouring, re-sloping, and re-vegetating various portions of our site after mining and mineral processing operations are completed. These reclamation efforts are conducted in accordance with plans reviewed and approved by the appropriate regulatory agencies.
We have accrued a long-term liability of
$5.4 million
and
$4.6 million
as of
December 31, 2013
and
2012
, respectively, for our obligation to reclaim our mine facility based on our most recent reclamation plan, as revised, submitted and approved by the Nevada State Environmental Commission and Division of Environmental Protection. In conjunction with recording the reclamation liability, we recorded a retirement obligation asset that is being amortized over the period of the anticipated land disturbance. Such costs are based on management’s current estimate of then expected amounts for the remediation work, assuming the work is performed within current laws and regulations. It is reasonably possible that, due to uncertainties associated with the application of laws and regulations by regulatory authorities and changes in reclamation or remediation technology, the ultimate cost of reclamation and remediation could change in the future. We periodically review the accrued reclamation liability for information indicating that our estimated liabilities may change. The accretion of the reclamation liability and the amortization of the retirement obligation asset for the years ended
December 31, 2013
,
2012
and
2011
totaled
$1.1 million
,
$0.6 million
, and
$0.2 million
, respectively, and were a component of reclamation and exploration expenses in the consolidated statements of operations.
Following is a reconciliation of the aggregate retirement liability associated with our reclamation plan for the mining projects for the years ended
December 31, 2013
,
2012
and
2011
:
|
|
2013
|
2012
|
2011
|
||||||||
|
Long-term reclamation liability — beginning of period
|
$
|
4,597,156
|
|
$
|
2,007,605
|
|
$
|
1,332,730
|
|
||
|
Additional obligations incurred
|
531,770
|
|
2,405,314
|
|
577,529
|
|
|||||
|
Accretion of reclamation liability
|
295,484
|
|
184,237
|
|
97,346
|
|
|||||
|
Long-term reclamation liability — end of period
|
$
|
5,424,410
|
|
$
|
4,597,156
|
|
$
|
2,007,605
|
|
||
Following is a reconciliation of the aggregate retirement obligation asset associated with our mining projects for the years ended
December 31, 2013
,
2012
and
2011
:
|
2013
|
2012
|
2011
|
|||||||||
|
Retirement obligation asset — beginning of period
|
$
|
2,803,318
|
|
$
|
825,481
|
|
$
|
339,357
|
|
||
|
Additional obligations incurred
|
531,770
|
|
2,405,314
|
|
577,529
|
|
|||||
|
Amortization of retirement obligation asset
|
(843,132
|
)
|
(427,477
|
)
|
(91,405
|
)
|
|||||
|
Retirement obligation asset — end of period
|
$
|
2,491,956
|
|
$
|
2,803,318
|
|
$
|
825,481
|
|
||
The increases in the reclamation liability and retirement obligation asset in
2013
were related to the expansion of the heap leach facility and related infrastructure. In
2012
and 2011, the additions to the reclamation liability were related primarily to the preparation and commencement of mining production activities.
10. Accrued Expenses
Accrued expenses at
December 31, 2013
and
2012
consisted of the following:
|
|
2013
|
2012
|
|||||
|
Tax indemnification accrual (Note 20)
|
$
|
4,094,349
|
|
$
|
4,007,024
|
|
|
|
Accrued reclamation bonding obligations
|
1,000,000
|
|
1,350,000
|
|
|||
|
Other accrued expenses
|
1,948,986
|
|
2,003,535
|
|
|||
|
|
$
|
7,043,335
|
|
$
|
7,360,559
|
|
|
F-15
Long-term debt and capital lease obligations at
December 31, 2013
and
2012
consisted of the following:
|
Note Description
|
2013
|
2012
|
|||||
|
$5,000,000 Note Payable (Auramet Facility) - Paid in full in 2013.
|
$
|
—
|
|
$
|
5,422,200
|
|
|
|
$5,000,000 Note Payable (Caterpillar Equipment Facility) - Principal and interest at 5.85% payable in monthly installments of $179,556 with the final payment due on or before March 31, 2015. Secured by certain equipment of the Company.
|
1,863,193
|
|
4,405,906
|
|
|||
|
$484,000 Note Payable (Caterpillar Equipment Facility) - Principal and interest at 4.95% payable in monthly installments of $11,142 with the final payment due on or before August 16, 2017. Secured by certain equipment of the Company.
|
448,402
|
|
—
|
|
|||
|
$2,500,000 Note Payable (Dayton Property "Golden Goose", as amended) - Principal payable in installments of $62,500 in January and April 2014. Secured by first deed of trust on the land. At December 31, 2013 and 2012, the note payable was net of imputed interest of $0 and $325,938, respectively.
|
125,000
|
|
2,050,966
|
|
|||
|
$725,000 Note Payable (Donovan Property) - Principal and interest at 6% payable in monthly installments of $6,178 with final payment due on or before July 1, 2015. Secured by deeds of trust on land and unpatented claims.
|
611,870
|
|
647,409
|
|
|||
|
$340,000 Note Payable (Gold Hill Hotel) - Principal and interest at 4.5% payable in monthly installments of $2,601 with the final payment due on or before April 30, 2026. Secured by first deed of trust on rental property.
|
296,496
|
|
313,938
|
|
|||
|
$300,000 Note Payable (White House) - Principal and interest at 4.5% payable in monthly installments of $1,520 with the final payment due on or before April 1, 2017. Secured by first deed of trust on the land.
|
291,811
|
|
296,798
|
|
|||
|
$240,000 Note Payable (Railroad & Gold Property) - Principal and interest at 4.5% payable in monthly installments of $1,835 with the final payment due on or before April 1, 2017. Secured by first deed of trust on the land.
|
220,618
|
|
232,421
|
|
|||
|
Notes Payable – Other – Various other notes payable with interest rates between 4.5% and 8% payable in monthly installments due on or before September 1, 2019. Secured by first deed of trust on various property owned by the Company.
|
403,278
|
|
362,017
|
|
|||
|
$3,824,297 Caterpillar Equipment Capital Lease - Principal and interest at 4.45% payable in monthly installments of $73,029 due on or before October 17, 2017. Secured by certain equipment under capital lease.
|
3,646,806
|
|
—
|
|
|||
|
Subtotal
|
7,907,474
|
|
13,731,655
|
|
|||
|
|
|
|
|
||||
|
Less current portion
|
(2,675,800
|
)
|
(7,720,764
|
)
|
|||
|
Long-term portion of long-term debt and capital lease obligations
|
$
|
5,231,674
|
|
$
|
6,010,891
|
|
|
F-16
Debt Obligations
Caterpillar Equipment Facility
In July 2012, the Company entered into a Master Loan and Security Agreement and other arrangements with Caterpillar Financial Services Corporation (the “Cat Equipment Facility”) pursuant to which the Company may borrow up to
$5 million
secured by certain equipment of the Company. During 2012, the Company borrowed
$5 million
under the Cat Equipment Facility. The Cat Equipment Facility bears interest at a rate of
5.85%
with a term of
30 months
except in the event of a default, including the occurrence of certain liquidity events, in which case the principal balance will bear interest at a rate of the lesser of
18%
per annum or the highest applicable rate allowed by law.
During the year ended December 31, 2013, the Company reduced the net outstanding balance due on the Cat Equipment Facility by
$2,542,713
, of which
$1,028,180
resulted from the transfer of mining vehicles.
Auramet Facility
In July 2012, the Company entered into an agreement with Resource Income Fund ("RIF"), with Auramet Trading, LLC ("Auramet") acting as gold agent, pursuant to which the Company may borrow up to
$5 million
outstanding at any one time (the “Auramet Facility”). The Company's obligations under the Auramet Facility are secured by a security interest in all personal property of the Company and certain real estate owned by the Company within the Company's starter mine (the "Starter Mine Patents"). The proceeds will be repaid through the delivery of
3,720
ounces of gold payable in
12
semimonthly deliveries of
310
ounces each beginning February 2013 and ending July 2013, or December 2013, if any amounts are redrawn under the agreement. The agreement is non-interest bearing except in the event of a default, in which case the balance would then bear interest at the lesser rate of
15%
per annum or the highest applicable rate allowed by law. In connection with entry into the Auramet Facility, the Company also entered into a purchase and sale agreement with Auramet, and the Company entered into a trading agreement the terms of which will govern all transactions of metals between Auramet and the Company. The Company drew down
$5 million
under the agreement in July 2012. The proceeds from the agreement have been recorded using an imputed interest rate of approximately
24%
. The agreements contain a covenant that requires the Company to maintain a minimum liquidity balance of
$3 million
(including cash and cash equivalents and short-term securities). The agreements additionally contain customary representations, warranties, affirmative covenants, negative covenants, and events of default, as well as conditions to borrowings.
In connection with the Auramet Facility, the Company granted RIF a call option to purchase
5,950
ounces of gold at a strike price of
$2,000
per ounce, exercisable on, and expiring on, July 24, 2013. The value of the option of
$124,691
was accounted for as a reduction to the debt proceeds at the date of the transaction and was amortized as interest expense over the term of the agreement. Additionally, the Company purchased an option to put
10,000
ounces of gold to Auramet at a strike price of
$1,250
per ounce for
$172,500
. The put option expired on January 29, 2013. Each of these call and put options has been recognized in the accompanying consolidated balance sheets at fair value as a derivative asset or liability by the Company. Changes in the fair value of these derivatives have been recognized currently within the consolidated statements of operations and included as a component of change in fair value of derivatives.
During the year ended December 31, 2013, the Company completed the repayment of the Auramet Facility, including imputed interest of
$953,397
, by delivery of gold with a total of
$2,723,107
and cash of
$2,819,065
. As the Company settled the Auramet Facility during a decline in gold prices, it recognized a gain of
$286,535
. The gain is included as a component of other income in the consolidated statements of operations.
Dayton Property “Golden Goose”
During the year ended December 31, 2012, the Company issued a
$2.5 million
0%
note payable to The Golden Goose Mine (“Golden Goose”) in connection with the purchase of the Dayton Resource Area “Golden Goose” mineral property. The mineral property and associated note payable was recorded imputing a
5.0%
interest rate.
During the period January 1, 2013 through October 31, 2013, the Company issued
37,141
shares of common stock for principal payments totaling
$75,000
.
F-17
In November 2013, the Company entered into an agreement with Golden Goose to settle the remaining note payable obligation and cancel all future royalties payable (
3%
net smelter royalty payable) with respect to Golden Goose’s relevant mining claims on the Dayton Resource Area property purchased by the Company with the issuance of the note payable. The note payable had a net carrying value of
$2,200,000
. Under the terms of the agreement, we agreed to make cash payments totaling
$200,000
;
$75,000
paid in November 2013;
$62,500
paid in January 2014; and
$62,500
to be paid on April 4, 2014. In addition, we issued Golden Goose
1,000,000
shares of common stock valued at
$1,840,000
in November 2013 for payment of notes payable with a net carrying value of
$2,000,000
. As part of the agreement, the Company agreed to make an additional payment to the noteholder on December 31, 2014 equal to the difference between
$2,000,000
and the cash proceeds received from the noteholder’s subsequent sale of the common stock shares issued plus the value of any remaining unsold shares held by the noteholder on December 15, 2014.
Future maturities of long-term debt and capital leases obligations are as follows:
|
Years Ending December 31:
|
|
||
|
2014
|
$
|
2,675,800
|
|
|
2015
|
2,108,978
|
|
|
|
2016
|
989,918
|
|
|
|
2017
|
1,902,724
|
|
|
|
2018
|
—
|
|
|
|
Thereafter
|
230,054
|
|
|
|
|
$
|
7,907,474
|
|
Capital Lease Obligations
Caterpillar Equipment Capital Lease
In September 2013, the Company entered into capital lease obligations totaling
$3.8 million
with Caterpillar Financial Services Corporation for the acquisition of mining vehicles and equipment.
The annual maturities of capital lease obligations, including interest, are as follows:
|
Years Ending December 31:
|
Amount
|
||
|
2014
|
$
|
876,351
|
|
|
2015
|
876,351
|
|
|
|
2016
|
876,352
|
|
|
|
2017
|
1,389,984
|
|
|
|
Total
|
4,019,038
|
|
|
|
Less: Interest
|
(372,232
|
)
|
|
|
Net capital lease obligations
|
3,646,806
|
|
|
|
Less: current portion
|
(730,009
|
)
|
|
|
Long-term portion of capital lease obligations
|
$
|
2,916,797
|
|
F-18
12. Acquisition of Gold Hill Hotel
On May 1, 2011, we acquired
100%
of the equity interests of the historic Gold Hill Hotel and
five
related cottages on or near the hotel property for
$840,000
consisting of a
$500,000
cash payment and the issuance of a
$340,000
note. We accounted for the acquisition as a business combination. The strategic purpose of purchasing the hotel was to participate in the on-going economic development of Gold Hill and Virginia City. Acquisition related costs during the year ended 2011 were approximately
$66,000
and were expensed in the consolidated statements of operations. The purchase price was allocated based on fair values as follows:
|
Assets acquired:
|
|
||
|
Current assets
|
$
|
26,587
|
|
|
Land
|
170,000
|
|
|
|
Building and improvements
|
530,000
|
|
|
|
Furniture and fixtures
|
140,000
|
|
|
|
Other assets
|
54,225
|
|
|
|
Total assets acquired
|
920,812
|
|
|
|
Liability assumed:
|
|
|
|
|
Accrued expenses
|
(4,731
|
)
|
|
|
Deferred tax liability
|
(76,081
|
)
|
|
|
Net assets acquired
|
$
|
840,000
|
|
Goodwill arising from the acquisition was not significant. After consideration of the tax allocation and the projected results and available taxable differences from the acquisition of the hotel, the Company reduced its estimate of the valuation allowance associated with its deferred tax asset and recorded an income tax benefit of approximately
$76,000
for the year ended December 31, 2011.
We have included Gold Hill Hotel’s results of operations in both our hospitality segment and our consolidated statements of operations from the date of acquisition. Our consolidated financial statements for the year ended December 31, 2011 reflect revenues and operating losses subsequent to the acquisition date of
$473,386
and
$26,391
, respectively, related to the Gold Hill Hotel acquisition. Pro forma disclosures including Gold Hill Hotel’s results of operations for periods prior to the date of acquisition are not presented herein as they were not material when compared with our consolidated statements of operations.
13. Stockholders’ Equity
Convertible Preferred Stock
The Company has
three
different series of convertible preferred stock as described below.
Series A-1 Convertible Preferred Stock
Each share of the Series A-1 convertible preferred stock has a stated value of
$1,000
per share and is convertible, at the holder’s election, into
1,536
shares of common stock at a conversion price of
$0.651
per share. Each share is also entitled to a liquidation and change of control preference equal to the stated value plus any accrued and unpaid dividends and any other fees outstanding. Each share of Series A-1 is entitled to five times the number of votes per share of common stock into which it can be converted. The Series A-1 convertible preferred stock may not be automatically converted into common stock by the Company (unlike the other series of convertible preferred stock that may be automatically converted under the circumstances described below).
F-19
In October 2013, 2012 and 2011, the Company issued
862.5
shares of Series A-1 convertible preferred stock, to Northern Comstock LLC (“Northern Comstock”), a related party of the Company, in prepayment of an annual mineral rights lease pursuant to the Northern Comstock LLC operating agreement. The Company estimated the fair value of the Series A-1 convertible preferred stock issued using a Monte Carlo model. The determination of the fair value was based on Level 3 inputs such as stock price, volatility, expected life, risk free interest rate, and expected dividends. Of the total fair value of the convertible preferred stock issued,
$2,328,367
,
$2,027,323
and
$2,092,382
was expensed as an equity-based payment to non-employees for the amount earned during the years ended
December 31, 2013
,
2012
and
2011
, respectively, and a remaining fair value of
$1,706,313
and
$1,987,104
was recorded as a prepaid expense as of
December 31, 2013
and
2012
, respectively. The conversion option embedded in the convertible preferred stock issued was considered a beneficial conversion feature at each issuance date because the effective conversion price of the conversion option was less than the Company’s common stock price at the date of issuances. The Company recorded a deemed dividend in additional paid-in-capital for this beneficial conversion feature of
$304,724
,
$1,242,927
and
$638,276
for the October 2013, 2012, and 2011 issuances, respectively.
Series A-2 Convertible Preferred Stock
Each share of the Series A-2 convertible preferred stock has a stated value of
$1,000
per share and is convertible, at the holder’s election, into
1,536
shares of common stock at a conversion price of
$0.651
per share. Each share is also entitled to a liquidation and change of control preference equal to the stated value plus any accrued and unpaid dividends and any other fees outstanding. Each share of Series A-2 convertible preferred stock automatically converts into shares of common stock when the average common stock price exceeds
$4.50
per share (for at least
20
trading days during any consecutive
30
-trading day period), as adjusted for stock splits and similar transactions. Each share entitles the holder to vote with the holders of common stock as a single class on all matters submitted to the vote of the common stock (on an as-converted basis).
Series B Convertible Preferred Stock
Each share of the Series B convertible preferred stock has a stated value of
$1,000
per share and is convertible, at the holder’s election, into
606
shares of common stock at a conversion price of
$1.65
per share. Each share is also entitled to a liquidation and change of control preference equal to the stated value plus any accrued and unpaid dividends and any other fees outstanding. Each share of Series B convertible preferred stock automatically converts into shares of common stock when the average common stock price exceeds
$4.50
per share (for at least
20
trading days during any consecutive
30
-trading day period), as adjusted for stock splits and similar transactions. Each share entitles the holder to vote with the holders of common stock as a single class on all matters submitted to the vote of the common stock (on an as-converted basis).
The Series A-1, Series A-2, and Series B convertible preferred stock are senior to all other classes of equity of the Company, in the event of the liquidation or change of control of the Company and, are entitled to semi-annual dividends at a rate of
7.5%
per annum, payable in cash, common stock, preferred stock or any combination of the foregoing, at the Company’s option. The Series A-1, Series A-2, and Series B convertible preferred stock also contain provisions providing weighted average anti-dilution protection. As of
December 31, 2013
, there were approximately
$2.0 million
in arrears of cumulative dividends resulting in a
($0.03)
impact on loss per share at
December 31, 2013
.
As long as
25%
or more of the Series A-1, Series A-2, and Series B convertible preferred stock originally issued is outstanding, the Company will be not be permitted, in each case without the consent of the majority of the holders of the Series A-1, Series A-2, and Series B convertible preferred stock, to execute certain strategic and business decisions, as provided in the related preferred stock documents. The Company is currently restricted from declaring or paying common stock dividends in cash under the terms of its convertible preferred stock.
From January 1, 2014 through
March 14, 2014
, preferred shareholders converted
1,009
shares of convertible preferred stock into
611,514
common shares.
F-20
Common Stock
In November 2013, the Company entered into agreements to purchase
two
properties for a total purchase price of
$1.7 million
. Total consideration transferred by the Company as of December 31, 2013 included cash payments of
$70,000
and
738,888
common stock shares. The Company has guaranteed that the sellers will receive total consideration for shares issued of
$1.3 million
by December 31, 2014. Should the value of the equity issued as of December 31, 2014 not be sufficient to satisfy the total consideration, Comstock may make additional cash payments to the sellers. Titles to the properties will not transfer until full consideration is received; therefore, as of December 31, 2013, the seller has not performed under the agreement. Accordingly, the related properties and equity issued were not given accounting consideration in the Company’s consolidated financial statements. The
738,888
common stock shares issued during the year ended December 31, 2013 have no impact on the basic and diluted earnings per share amounts.
During the year ended December 2013, the Company declared and issued
2,167,398
shares of common stock in payment of dividends with a fair value of
$4.2
million on the convertible preferred stock. As the Company cannot pay dividends out of accumulated deficits under Nevada laws, the dividends were recorded as a reduction to additional paid-in capital.
In January 2014, the Company declared and issued
1,141,142
shares of common stock in payment of dividends, with a fair value of
$2.0 million
, on the convertible preferred stock.
On January 11, 2013, the Company’s registration statement on Form S-3 filed in December 2012 (the “Registration Statement”) was declared effective by the Securities and Exchange Commission (the “SEC”). The Registration Statement covers the offer of up to
$50,000,000
of any combination of securities described in the prospectus.
In March 2013, the Company raised
$10.00 million
in gross proceeds (approximately
$9.70 million
, net of
$0.3 million
issuance costs) through an underwritten public offering of
5,000,000
shares of our common stock at a price of
$2.00
under the Company’s Registration Statement on Form S-3.
In August 2013, the Company raised
$8.75 million
in gross proceeds (approximately
$8.6 million
, net of
$0.2 million
issuance costs) through an underwritten public offering of
4,146,920
shares of our common stock at a price of
$2.11
per share under the Company’s Registration Statement on Form S-3.
During the year ended December 31, 2013, the Company issued
1,037,141
shares of common stock valued at
$1,915,000
for payment on its "Dayton Property Golden Goose" long-term debt obligation. (see Note 11).
During the year ended December 31, 2013,
1,199,300
shares of vested restricted stock were issued under the 2011 Equity Incentive Plan.
During the year ended
December 31, 2013
, preferred shareholders converted
3,661
shares of Series A-2 convertible preferred stock and
4,206
shares of Series B convertible preferred stock into
5,623,003
and
2,548,908
shares of common stock, respectively.
14. Fair Value Measurements
Assets and Liabilities Measured at Fair Value on a Recurring Basis
The following table presents our liabilities at
December 31, 2013
, which are measured at fair value on a recurring basis:
|
|
|
Fair Value Measurements at December 31, 2013
|
|||||||||||||
|
Total
|
Quoted
Prices
in Active
Markets
(Level 1)
|
Significant
Other
Observable
Inputs
(Level 2)
|
Significant
Unobservable
Inputs
(Level 3)
|
||||||||||||
|
Liabilities:
|
|
|
|
|
|||||||||||
|
Contingent debt obligation payment
|
$
|
250,000
|
|
$
|
—
|
|
$
|
250,000
|
|
$
|
—
|
|
|||
|
Total Liabilities
|
$
|
250,000
|
|
$
|
—
|
|
$
|
250,000
|
|
$
|
—
|
|
|||
F-21
The following table presents our liabilities at
December 31, 2012
, which are measured at fair value on a recurring basis:
|
|
|
Fair Value Measurements at December 31, 2012
|
|||||||||||||
|
Total
|
Quoted
Prices
in Active
Markets
(Level 1)
|
Significant
Other
Observable
Inputs
(Level 2)
|
Significant
Unobservable
Inputs
(Level 3)
|
||||||||||||
|
Liabilities:
|
|
|
|
|
|
|
|
|
|||||||
|
Gold call option derivative
|
$
|
16,330
|
|
$
|
—
|
|
$
|
16,330
|
|
$
|
—
|
|
|||
|
Gold forward derivative
|
297,451
|
|
$
|
—
|
|
297,451
|
|
$
|
—
|
|
|||||
|
Contingent dividend payment
|
230,900
|
|
—
|
|
—
|
|
230,900
|
|
|||||||
|
Total Liabilities
|
$
|
544,681
|
|
$
|
—
|
|
$
|
313,781
|
|
$
|
230,900
|
|
|||
During the years ended
December 31, 2013
and
2012
, there were no transfers of assets and liabilities between Level 1, Level 2, or Level 3.
Following is a description of the valuation methodologies used for the Company’s financial instruments measured at fair value on a recurring basis as well as the general classification of such instruments pursuant to the valuation hierarchy.
Contingent dividend payment derivative -
The Company’s contingent dividend payment derivative liability was valued using a Monte-Carlo model with various observable and unobservable market inputs and classified as Level 3 in the valuation hierarchy. These market inputs include volatility, stock price, maturity date, and discount rate. The contingent dividend derivative liability expired during 2013.
Contingent debt obligation payment derivative -
The Company’s contingent debt obligation payment derivative is valued based on a Black-Scholes model with various observable inputs. These inputs include contractual terms, stock price, volatility, dividend yield, and risk free interest rates. This derivative is classified within Level 2 of the valuation hierarchy.
Gold call option, forward, and put derivatives -
The Company’s gold forward, call options, and put derivatives are valued based on a Black-Scholes model with various observable inputs. These inputs include contractual terms, gold market prices, volatility of gold prices, and risk free interest rates. These derivatives are classified within Level 2 of the valuation hierarchy.
The following table indicates the changes in the Level 3 financial instruments for the years ended
December 31, 2013
and
2012
.
|
|
Contingent Dividend
Payment Derivative Liability
|
||
|
|
|
||
|
Balance at January 1, 2011
|
$
|
1,025,000
|
|
|
Issuance of convertible preferred stock
|
6,009
|
|
|
|
Change in fair value
|
(800,109
|
)
|
|
|
Balance at December 31, 2012
|
230,900
|
|
|
|
Change in fair value
|
(230,900
|
)
|
|
|
Balance at December 31, 2013
|
$
|
—
|
|
The following table sets forth a summary of the quantitative and qualitative information related to the unobservable inputs used in the valuation of the Company’s Level 3 financial instruments during the year
December 31, 2013
.
F-22
|
Description
|
Value at December 31, 2013
|
Valuation Techniques
|
Unobservable Input
|
Quantitave
Inputs Used
|
||||||
|
Contingent dividend payment derivative liability
|
$
|
—
|
|
Monte-Carlo Simulation
|
Discount Rate
|
12
|
%
|
|||
Significant changes to the unobservable inputs would result in a significantly different fair value measurement of the contingent dividend derivative liability.
The carrying amount of cash and cash equivalents and trade payables approximates fair value because of the short-term maturity of these financial instruments. At
December 31, 2013
, the fair value of long-term debt and capital lease obligations approximated
$7,400,000
, as determined by borrowing rates estimated to be available to us for debt with similar terms and conditions. At
December 31, 2012
the fair value of long-term debt obligations was $
14,045,000
. The fair value of assets and liabilities whose carrying value approximates fair value is determined using Level 2 inputs, with the exception of cash and cash
equivalents (Level 1).
15. Segment Reporting
Our management organizes the Company into
two
operating segments, mining and hospitality. Our mining segment consists of all activities and expenditures associated with mining. Our hospitality segment consist of hotel rooms, cottages, restaurant, bar and other services provided by Gold Hill Hotel. We evaluate the performance of our operating segments based on operating income (loss). All intercompany transactions have been eliminated, and intersegment revenues are not significant. Financial information relating to our reportable operating segments and reconciliation to the consolidated totals is as follows:
F-23
|
Year Ended
December 31,
|
|||||||||||
|
|
2013
|
2012
|
2011
|
||||||||
|
Revenues
|
|
|
|
|
|
|
|||||
|
Mining
|
$
|
24,103,013
|
|
$
|
4,504,457
|
|
$
|
—
|
|
||
|
Hospitality
|
723,574
|
|
634,159
|
|
473,386
|
|
|||||
|
Total revenues
|
24,826,587
|
|
5,138,616
|
|
473,386
|
|
|||||
|
Cost and Expenses
|
|
|
|
|
|
|
|||||
|
Mining
|
$
|
(44,642,164
|
)
|
$
|
(34,529,353
|
)
|
$
|
(15,457,888
|
)
|
||
|
Hospitality
|
(1,117,225
|
)
|
(928,897
|
)
|
(570,039
|
)
|
|||||
|
Total cost and expenses
|
(45,759,389
|
)
|
(35,458,250
|
)
|
(16,027,927
|
)
|
|||||
|
Operating Loss
|
|
|
|
|
|
|
|||||
|
Mining
|
$
|
(20,539,151
|
)
|
$
|
(30,024,896
|
)
|
$
|
(15,457,888
|
)
|
||
|
Hospitality
|
(393,651
|
)
|
(294,738
|
)
|
(96,653
|
)
|
|||||
|
Total loss from operations
|
(20,932,802
|
)
|
(30,319,634
|
)
|
(15,554,541
|
)
|
|||||
|
Other income (expense), net
|
(414,218
|
)
|
(442,639
|
)
|
3,872,229
|
|
|||||
|
Loss before income taxes
|
$
|
(21,347,020
|
)
|
$
|
(30,762,273
|
)
|
$
|
(11,682,312
|
)
|
||
|
Capital Expenditures
|
|
|
|
|
|
|
|||||
|
Mining
|
$
|
11,223,865
|
|
$
|
15,639,241
|
|
$
|
9,217,547
|
|
||
|
Hospitality
|
45,275
|
|
301,000
|
|
1,087,622
|
|
|||||
|
Total capital expenditures
|
$
|
11,269,140
|
|
$
|
15,940,241
|
|
$
|
10,305,169
|
|
||
|
Depreciation, Amortization and Depletion
|
|
|
|
|
|
|
|||||
|
Mining
|
$
|
4,687,674
|
|
$
|
2,380,251
|
|
$
|
199,287
|
|
||
|
Hospitality
|
133,901
|
|
122,896
|
|
70,262
|
|
|||||
|
Total depreciation, amortization and depletion
|
$
|
4,821,575
|
|
$
|
2,503,147
|
|
$
|
269,549
|
|
||
|
|
As of December 31,
|
||||||||||
|
|
2013
|
2012
|
2011
|
||||||||
|
Assets
|
|
|
|
|
|
|
|||||
|
Mining
|
$
|
42,841,452
|
|
$
|
46,606,912
|
|
$
|
25,824,143
|
|
||
|
Hospitality
|
1,158,544
|
|
1,257,633
|
|
1,150,009
|
|
|||||
|
|
$
|
43,999,996
|
|
$
|
47,864,545
|
|
$
|
26,974,152
|
|
||
For the year ended
December 31, 2013
and 2012, substantially all of the mining revenues were attributable to
one
customer.
F-24
16. Net Loss Per Common Share
Basic earnings per share is computed by dividing net loss available to common shareholders by the weighted average number of shares of common stock outstanding during the period. Diluted loss per share reflects the potential dilution that could occur if stock options, warrants, and convertible securities to issue common stock were exercised or converted into common stock. The following is a reconciliation of the numerator and denominator used in the basic and diluted computation of net loss per share:
|
Year Ended
December 31,
|
|||||||||||
|
|
2013
|
2012
|
2011
|
||||||||
|
Numerator:
|
|
|
|
|
|
|
|||||
|
Net loss
|
$
|
(21,347,020
|
)
|
$
|
(30,762,273
|
)
|
$
|
(11,606,231
|
)
|
||
|
Preferred stock dividends
|
(4,016,705
|
)
|
(4,370,247
|
)
|
(4,696,766
|
)
|
|||||
|
Loss available to common shareholders
|
$
|
(25,363,725
|
)
|
$
|
(35,132,520
|
)
|
$
|
(16,302,997
|
)
|
||
|
Denominator:
|
|
|
|
|
|
|
|||||
|
Basic weighted average shares outstanding
|
60,580,742
|
|
40,497,098
|
|
24,640,774
|
|
|||||
|
Effect of dilutive securities
|
—
|
|
—
|
|
—
|
|
|||||
|
Diluted weighted average shares outstanding
|
60,580,742
|
|
40,497,098
|
|
24,640,774
|
|
|||||
|
Net loss per common share:
|
|
|
|
|
|
|
|||||
|
Basic
|
$
|
(0.42
|
)
|
$
|
(0.87
|
)
|
$
|
(0.66
|
)
|
||
|
Diluted
|
$
|
(0.42
|
)
|
$
|
(0.87
|
)
|
$
|
(0.66
|
)
|
||
The following table includes the number of common stock equivalent shares that are not included in the computation of diluted loss per share, because the Company has a net loss and the inclusion of such shares would be antidilutive.
|
|
Shares
|
|||||||
|
|
2013
|
2012
|
2011
|
|||||
|
Stock options
|
50,000
|
|
50,000
|
|
450,000
|
|
||
|
Convertible preferred stock
|
54,558,567
|
|
61,405,753
|
|
63,147,728
|
|
||
|
Warrants
|
733,500
|
|
2,146,000
|
|
2,333,500
|
|
||
|
Restricted stock
|
3,627,600
|
|
5,024,400
|
|
4,610,000
|
|
||
|
|
58,969,667
|
|
68,626,153
|
|
70,541,228
|
|
||
17. Stock-Based Compensation
2011 Equity Incentive Plan
In 2011, the Company adopted the Comstock Mining Inc. 2011 Equity Incentive Plan (the “2011 Plan”). The 2011 Plan replaced the equity plans previously adopted by the Company, including, without limitation, those adopted in 2005 and 2006. The maximum number of shares of the Company’s common stock that may be delivered pursuant to awards granted under the 2011 Plan is
6,000,000
shares of common stock. The plan provides for the grant of various types of awards, including but not limited to restricted stock (including performance awards), restricted stock units, stock options, and other types of stock-based awards.
F-25
Performance-based Restricted Stock
On December 21, 2011, May 31, 2012, September 15, 2012, and September 19, 2013 the Board of Directors granted
4,710,000
shares,
755,000
shares,
525,000
shares, and
659,500
shares respectively, of restricted stock (performance awards) to certain employees under the 2011 Equity Incentive Plan. These awards vest primarily based on specific performance conditions including the validation of both resources (at least measured and indicated and / or proven and probable reserves) at levels of
1,000,000
,
1,500,000
,
2,000,000
, and
3,250,000
of gold equivalent ounces by an independent third party, completing the first pour from the mining operations, and achieving certain annual mining production rates at levels of
15,000
,
17,500
, and
20,000
of gold equivalent ounces for a period of at least
90
days. Certain of these awards will vest at the latter of the achievement of the aforementioned performance conditions or certain service period requirements, but only if the performance conditions have been met.
The restricted stock fair value was
$1.89
,
$2.02
,
$2.98
, and
$1.95
per share, respectively, at the grant dates (with a total grant date fair value of
$8,901,900
,
$1,525,000
,
$1,564,500
, and
$1,286,025
, respectively). The fair value was determined based on the fair value of the underlying common stock at the grant dates. The unvested restricted stock awards expire
five
years after the grant date.
Information related to non-vested restricted stock issued under the 2011 Plan is as follows:
|
Number of
Shares
|
Weighted Average
Grant Date
Fair Value
|
|||||
|
Balances at January 1, 2013
|
5,024,400
|
|
$
|
1.99
|
|
|
|
Grants
|
659,500
|
|
1.95
|
|
||
|
Vested
|
(1,141,300
|
)
|
2.12
|
|
||
|
Forfeitures
|
(915,000
|
)
|
2.08
|
|
||
|
Balances at December 31, 2013
|
3,627,600
|
|
$
|
1.92
|
|
|
We recognize compensation expense related to these restricted stock grants over the performance period based on a periodic assessment of the probability that the performance criteria will be achieved. At
December 31, 2013
, the Company has estimated that certain of these performance conditions are probable of being achieved and has therefore recognized compensation expense related to these restricted shares. Additionally, the Company has estimated that certain of these performance conditions are not probable of being achieved and therefore no expense related to those conditions has been recognized.
We recorded stock-based compensation (including restricted stock grants and other common stock grants) as follows:
|
Year Ended
December 31,
|
|||||||||||
|
|
2013
|
2012
|
2011
|
||||||||
|
Costs applicable to mining revenue
|
$
|
(155,964
|
)
|
$
|
429,916
|
|
$
|
—
|
|
||
|
Reclamation and exploration expenses
|
45,705
|
|
1,765,963
|
|
203,731
|
|
|||||
|
General and administrative
|
1,028,347
|
|
3,644,602
|
|
980,000
|
|
|||||
|
Hospitality operating costs
|
25,058
|
|
47,112
|
|
—
|
|
|||||
|
Total
|
$
|
943,146
|
|
$
|
5,887,593
|
|
$
|
1,183,731
|
|
||
At
December 31, 2013
, total unrecognized compensation expense related to non-vested restricted stock award shares that are expected to vest is approximately
$0.1 million
and should be recognized over a weighted average period of
5 months
.
F-26
Options
Prior to the 2011 Plan, the Company had previously issued options under prior programs. At
December 31, 2013
, our Company had
50,000
outstanding and fully vested employee and director options to acquire shares of common stock. The options outstanding at December 31, 2013 have a weighted average remaining contractual life of
4.75
years and a weighted average exercise price of
$4.00
per share. During 2013, there were no options granted, exercised, or forfeited.
During 2012,
400,000
options were exercised at an option exercise price of
$2.24
using the cashless exercise option resulting in the issuance of
122,848
common shares. The intrinsic value of the options exercised in 2012 was approximately
$396,800
.
There was no compensation expense recognized for the remaining outstanding options during the years ended December 31, 2013, 2012, and 2011.
Common Stock
During 2011, the outside directors of the Company were granted
300,000
shares of the Company’s common stock valued at
$980,000
. The shares were immediately vested and the related stock-based compensation has been recorded as
$980,000
of general and administrative cost and expenses in the accompanying consolidated statements of operations for the year ended December 31, 2011.
18. Stock Warrants
At December 31, 2013, our Company had
733,500
outstanding and fully vested stock warrants. The stock warrants outstanding at December 31, 2013 have a weighted average remaining contractual life of
0.85
years and a weighted average exercise price of
$3.27
per share. During 2013, there were no stock warrants granted or exercised. There were
1,412,500
stock warrants with a weighted average exercise price of
$3.57
which expired during the year ended December 31, 2013.
There was no expense recognized for the remaining outstanding stock warrants during the years ended December 31, 2013, 2012, and 2011.
19. Income Taxes
The provision (benefit) for income taxes from continued operations for the years ended
December 31, 2013
,
2012
and
2011
consist of the following:
|
|
2013
|
2012
|
2011
|
||||||||
|
Current:
|
|
|
|
|
|
|
|||||
|
Federal
|
$
|
—
|
|
$
|
—
|
|
$
|
—
|
|
||
|
Deferred:
|
|
|
|
|
|
|
|||||
|
Federal
|
—
|
|
—
|
|
(76,081
|
)
|
|||||
|
Income taxes provision
|
$
|
—
|
|
$
|
—
|
|
$
|
(76,081
|
)
|
||
|
Federal statutory rate
|
(34.0
|
)%
|
(34.0
|
)%
|
(34.0
|
)%
|
|||||
|
Change in valuation allowance
|
32.0
|
%
|
33.9
|
%
|
32.9
|
%
|
|||||
|
Other
|
2.0
|
%
|
0.1
|
%
|
0.4
|
%
|
|||||
|
|
—
|
%
|
—
|
%
|
(0.7
|
)%
|
|||||
F-27
Deferred income taxes at
December 31, 2013
and
2012
consisted of the following:
|
December 31, 2013
|
December 31, 2012
|
||||||
|
Asset retirement obligation
|
$
|
997,035
|
|
$
|
609,905
|
|
|
|
Mineral rights and properties, plant, and equipment
|
(846,679
|
)
|
(695,728
|
)
|
|||
|
Mining exploration, development, claims, and permit costs
|
7,812,828
|
|
5,576,631
|
|
|||
|
Derivatives - change in fair value
|
30,600
|
|
(487,274
|
)
|
|||
|
Stock-based compensation
|
1,720,564
|
|
2,261,053
|
|
|||
|
Net operating loss carryforward
|
45,411,753
|
|
40,925,397
|
|
|||
|
Transaction costs
|
1,392,079
|
|
1,362,388
|
|
|||
|
Other
|
194,145
|
|
48,048
|
|
|||
|
Valuation allowance
|
(56,712,325
|
)
|
(49,600,420
|
)
|
|||
|
Total net deferred tax assets
|
$
|
—
|
|
$
|
—
|
|
|
At
December 31, 2013
, the Company had federal net operating losses of approximately
$133,600,000
which will begin to expire in
2023
and could be subject to certain limitations under section 382 of the Internal Revenue Code.
The Company has provided a valuation allowance at
December 31, 2013
and
2012
of
$56,712,325
and
$49,600,420
for its net deferred tax assets as it cannot conclude it is more likely than not that they will be realized. The valuation allowance increased by
$7,111,905
,
$10,467,065
and
$3,897,000
in
2013
,
2012
and
2011
, respectively.
As of
December 31, 2013
and
2012
, the Company did not have any unrecognized tax benefits. The Company's policy is to recognize interest and penalties related to income tax matters in income tax expense. The Company currently has no federal or state tax examinations in progress nor has it had any federal or state tax examinations since its inception. The Company is subject to U.S. federal and state income tax examination for tax years 2009 and forward.
20. Related Party Transactions
Northern Comstock LLC
On October 20, 2010, the Company entered into an operating agreement to form Northern Comstock LLC (“Northern Comstock”) with Mr. Winfield, a shareholder of the Company and Chairman of the Board of Directors since June 2011, and an entity controlled by Mr. Winfield, DWC Resources, Inc. (DWC). As part of the operating agreement, the Company obtained the exclusive rights of production and exploration on certain parcels in Storey County, Nevada. The terms of the operating agreement provide that on each anniversary of the operating agreement, up to and including the
thirty-nine
(39t
h
) anniversary, the Company will make contributions in the amount of
$862,500
, in the form of Series A-1 convertible preferred stock or cash upon request of Northern Comstock. If any event of default occurs under the operating agreement, the additional capital contributions can be accelerated and the entire unpaid amount of the Company’s capital contributions, up to the remaining
30,188
shares of A-1 convertible preferred stock (approximately
46.4 million
shares of common stock as converted), could become issuable immediately. Under certain circumstances, the additional capital contributions can be accelerated. The operating agreement further requires the Company to make certain capital expenditures of not less than
$750,000
over
five
years with respect to each parcel. An up to
8%
net smelter royalty is payable to Northern Comstock and distributable to Mr. Winfield and DWC. Under the terms of the operating agreement, all operating activities from the minerals or finished products produced from the parcels of property are conducted by the Company and recognized in the Company’s consolidated financial statements. The Company has no right to receive periodic or liquidating distributions related to any amounts contributed to Northern Comstock. The payments to the Northern Comstock do not result in the acquisition of any equity interest in Northern Comstock as there is no entitlement to receive future distributions or changes in the fair value of the net assets of Northern Comstock. The annual mineral rights payments are considered equity-based payments to non-employees and measured at fair value. During the year ended
December 31, 2013
,
2012
and
2011
, the Company made payments on the operating agreement described above via the issuance of Series A-1 convertible preferred stock valued at
$2,047,575
,
$2,466,750
and
$1,931,999
respectively. These amounts were capitalized as prepaid expenses and are amortized over a
one year
period. During the year ended
December 31, 2013
,
2012
and
2011
, the Company recognized amortization expense of
$2,328,367
,
$2,027,325
and
$2,092,382
, respectively.
F-28
Tax Indemnification
On October 20, 2010, the Company exchanged all of its senior secured convertible and senior indebtedness owed to members of the Winfield Group, shareholders of the Company, for newly created Series A-1 preferred stock. As part of the exchange, the Company has agreed to indemnify the Winfield Group for any amounts as part of the exchange that are determined to be taxable as ordinary income to each member of the Winfield Group. Such indemnified amounts would include (i) any federal, state and local income tax, penalties and interest such member is actually obligated to pay out-of-pocket as a result of such determination, after taking into account (a) all increases in federal, state and local income taxes actually payable as a result of the receipt of any such indemnity payment and (b) the deduction to which such member would be entitled for federal income tax purposes for state and local income taxes paid. The Company may at its option, pay the indemnity amount either in cash or in a number of common shares equal to the indemnity amount divided by the average of the volume weighted average closing prices of common shares for the
five
consecutive trading days ending on the trading day that is immediately prior to the date of such payment.
Loss contingency provisions are recorded for probable losses at management’s best estimate of a loss, or when a best estimate cannot be made, a minimum loss contingency amount is recorded. At
December 31, 2013
and
2012
, the Company had a liability of
$4,094,349
and
$4,007,024
, respectively, for this tax indemnification at the estimated amount that is probable of being indemnified by the Company. While management believes that the assumptions and estimates used to determine this liability are reasonable, the ultimate outcome of those matters cannot presently be determined. Revisions in estimates of the potential liability could materially affect our operations in the period of adjustment.
KCA Laboratory
During 2013, the Company paid to Kappes, Cassiday & Associates, a related party of Daniel Kappes, a member of the Board of Directors since April 2012, for services related to processing consulting. Kappes, Cassiday & Associates received cash payments totaling
$49,504
in
2013
. During the year ended December 31, 2012, the Company paid Kappes, Cassiday & Associates cash payments totaling
$332,532
and issued shares of common stock for total consideration of
$300,000
for the purchase of a modular laboratory.
21. Commitments and Contingencies
The Company leases certain properties under operating leases expiring at various dates through 2049. Future minimum annual lease payments under these existing lease agreements are as follows as of
December 31, 2013
:
|
Year Ended December 31,
|
Third Party
Leases
|
Related Party
Leases
|
Total
|
||||||||
|
2014
|
$
|
52,400
|
|
$
|
880,500
|
|
$
|
932,900
|
|
||
|
2015
|
57,400
|
|
880,500
|
|
937,900
|
|
|||||
|
2016
|
60,000
|
|
880,500
|
|
940,500
|
|
|||||
|
2017
|
65,000
|
|
880,500
|
|
945,500
|
|
|||||
|
2018
|
70,000
|
|
868,500
|
|
938,500
|
|
|||||
|
Thereafter
|
425,000
|
|
26,791,500
|
|
27,216,500
|
|
|||||
|
|
$
|
729,800
|
|
$
|
31,182,000
|
|
$
|
31,911,800
|
|
||
Included in the related party leases above is an operating agreement with a related party and member of the Board of Directors. The terms of this agreement provide that the Company will make contributions in the amount of
$862,500
, in the form of Series A-1 convertible preferred stock or cash. The above disclosure assumes cash payments are made, although the actual fair value of the payment amount may differ if preferred stock is issued in lieu of cash.
Expense under operating leases, primarily paid with preferred stock recognized at its estimated grant date fair value, for the years ended
December 31, 2013
,
2012
and
2011
was
$2,411,767
,
$2,010,547
and
$2,155,950
, respectively.
F-29
The Company has minimum royalty obligations with certain of its mineral properties and leases. Minimum royalty payments payable are
$75,600
per year in 2013, increasing by approximately
$5,000
per year through 2017. For most of the mineral properties and leases, the Company is subject to a range of royalty obligations once production commences. These royalties range from
0.5%
to
6%
of net smelter revenues (NSR) from minerals produced on the properties. Some of the factors that will influence the amount of the royalties include ounces extracted and prices of gold. Royalties expense, including both NSR and minimum royalty obligations, was
$760,583
,
$177,379
, and
$58,100
for the years ended
2013
,
2012
, and
2011
, respectively.
The Company’s mining and exploration activities are subject to various laws and regulations governing the protection of the environment. These laws and regulations are continually changing and are generally becoming more restrictive. The Company conducts its operations so as to protect the public health and environment and believes its operations are in compliance with applicable laws and regulations in all material respects. The Company has made, and expects to make in the future, expenditures to comply with such laws and regulations, but cannot predict the full amount of such future expenditures.
On August 16, 2013, the Company received a “stop order” from the Nevada Division of Environmental Protection (NDEP) with respect to the use of certain crushing and transfer systems of the Company because emissions controls, although effective, were not deemed to be compliant with an applicable permit. The Company was able to remedy the controls and the stop order was lifted on August 23, 2013. The Company did not experience any material delays or work stoppages as a result of the stop order, and therefore revenues were not materially affected.
As a follow up and in accordance with the Nevada Administrative Code, on September 6, 2013, NDEP requested that the Company submit certain information and documentation to NDEP to support NDEP’s determination as to the compliance of the Company’s facility with the conditions of the operating permit. The Company provided all such requested information and documentation on a timely basis in accordance with the request. On February 21, 2014, the Company received a final notice of violation associated with this investigation, validating that no air emission violations occurred; however, a final warning, with no further action required, was issued indicating the Company failed to install certain air pollution control equipment. In most cases, the Company had installed alternative, superior, air control equipment. The Company believes that it is in full compliance with its permits granted by NDEP and will diligently respond to further requests from NDEP, if any.
From time to time, we are involved in lawsuits, claims, investigations and proceedings that arise in the ordinary course of business. There are no matters pending that we expect to have a material adverse impact on our business, results of operations, financial condition or cash flows.
F-30
22. Quarterly Results of Operations (Unaudited)
|
|
Quarter Ended
|
||||||||||||||
|
|
March 31
|
June 30
|
September 30
|
December 31
|
|||||||||||
|
2013
|
|
|
|
||||||||||||
|
Revenues
|
$
|
3,789,766
|
|
$
|
6,985,909
|
|
$
|
6,818,777
|
|
$
|
7,232,135
|
|
|||
|
Gross profit/(loss)
(1)
|
(252,672
|
)
|
(1,501,492
|
)
|
133,900
|
|
(1,166,039
|
)
|
|||||||
|
Loss from operations
|
(5,738,160
|
)
|
(5,664,953
|
)
|
(4,442,748
|
)
|
(5,086,941
|
)
|
|||||||
|
Net loss
|
(5,763,032
|
)
|
(5,524,324
|
)
|
(4,518,260
|
)
|
(5,541,404
|
)
|
|||||||
|
Net loss available to common shareholders
|
(6,797,339
|
)
|
(6,554,059
|
)
|
(5,491,383
|
)
|
(6,520,944
|
)
|
|||||||
|
Basic earnings per common share
|
(0.13
|
)
|
(0.11
|
)
|
(0.09
|
)
|
(0.09
|
)
|
|||||||
|
Diluted earnings per common share
|
(0.13
|
)
|
(0.11
|
)
|
(0.09
|
)
|
(0.09
|
)
|
|||||||
|
2012
|
|
|
|
|
|||||||||||
|
Revenues
|
$
|
111,722
|
|
$
|
182,523
|
|
$
|
182,792
|
|
$
|
4,661,579
|
|
|||
|
Gross profit/(loss)
(1)
|
(40,329
|
)
|
(13,449
|
)
|
(17,665
|
)
|
726,435
|
|
|||||||
|
Loss from operations
|
(7,660,816
|
)
|
(9,053,222
|
)
|
(7,805,878
|
)
|
(5,799,718
|
)
|
|||||||
|
Net loss
|
(7,332,598
|
)
|
(8,980,346
|
)
|
(8,994,179
|
)
|
(5,455,150
|
)
|
|||||||
|
Net loss available to common shareholders
|
(8,438,475
|
)
|
(10,082,744
|
)
|
(10,086,692
|
)
|
(6,524,609
|
)
|
|||||||
|
Basic earnings per common share
|
(0.24
|
)
|
(0.26
|
)
|
(0.24
|
)
|
(0.13
|
)
|
|||||||
|
Diluted earnings per common share
|
(0.24
|
)
|
(0.26
|
)
|
(0.24
|
)
|
(0.13
|
)
|
|||||||
(1)
Total revenues less costs applicable to mining revenue and hospitality operating costs.
F-31
23. Subsequent Events
Subsequent to
December 31, 2013
, the Company entered into an agreement to purchase
78
Acres in American Flat, Storey County, Nevada for
$1,107,000
. The purchase price includes
$10,000
cash and the remaining amount payable in restricted common stock. Escrow is expected to close on or before December 25th, 2014.
Subsequent to
December 31, 2013
, the Company also entered into an agreement to purchase buildings and mining claims adjacent to its processing facility on American Flat Road, Storey County, Nevada for
$893,000
. The purchase price includes
$10,000
cash and the remaining amount payable in restricted common stock. Escrow is expected to close on or before February 25, 2015.
On February 11, 2014, the Company entered into a new,
$5 million
revolving credit facility (the “Revolving Credit Facility”) with Auramet International, LLC, pursuant to which the Company may borrow up to
$5 million
outstanding at any one time. Interest is payable at
9.5%
per annum, and was paid in advance on the closing date of the Revolving Credit Facility. The indebtedness under the Revolving Credit Facility is secured by a security interest in certain real estate owned by the Company within the Company’s starter mine and a first priority security interest in all personal property of the Company and its wholly-owned subsidiary Comstock Mining LLC, subject to any existing or future Permitted Liens (as defined under the Revolving Credit Facility). Provided that no default has occurred and is continuing, and the Company has already repaid the principal amount of borrowings under the Revolving Credit Facility in an amount of not less than
$1,000,000
, the Company has the option until October 6, 2014 to re-borrow funds under the Revolving Credit Facility. The Revolving Credit Facility contains a covenant that requires the Company to maintain a minimum liquidity balance of
$1 million
(including cash and cash equivalents, plus
90%
of the value of any doré that has been picked up by a secured carrier but not yet paid for, as of any date of determination). The Revolving Credit Facility additionally contains customary representations, warranties, affirmative covenants, negative covenants, and events of default, as well as conditions to borrowings. On February 12, 2014, the Company drew down proceeds of approximately
$4.6 million
. The Revolving Credit Facility will be repaid through
14
semi-monthly cash payments of
$357,143
beginning August 8, 2014 and ending February 6, 2015.
SUPPLEMENTARY FINANCIAL DATA
The supplementary financial information required by Item 302 of Regulation S-K is contained in Note 22 to our consolidated financial statements set forth above.
F-32
None.
Evaluation of Disclosure Controls and Procedures
As of the end of the period covered by this Annual Report, management performed, with the participation of our Principal Executive Officer (who is also our Principal Financial Officer), an evaluation of the effectiveness of our disclosure controls and procedures as defined in Rules 13a-15(e) and 15d-15(e) of the Securities Exchange Act of 1934 (“Exchange Act”). Our disclosure controls and procedures are designed to ensure that information required to be disclosed in reports that we file or submit under the Exchange Act is recorded, processed, summarized, and reported within the time periods specified in the Exchange Act and SEC’s rules, and that such information is accumulated and communicated to our management, including our Principal Executive Officer (who is also our Principal Financial Officer), to allow timely decisions regarding required disclosures. There are inherent limitations to the effectiveness of any system of disclosure controls and procedures, including the possibility of human error and the circumvention or overriding of the controls and procedures. Accordingly, even effective disclosure controls and procedures can only provide reasonable assurance of achieving their control objectives. Our Principal Executive Officer (who is also our Principal Financial Officer) concluded that, as of December 31, 2013, our disclosure controls and procedures were effective.
38
MANAGEMENT'S REPORT ON INTERNAL CONTROL OVER FINANCIAL REPORTING
Our management is responsible for establishing and maintaining adequate internal control over financial reporting for the Company in accordance with and as defined in Rules 13a-15(f) and 15d-15(f) under the Securities Exchange Act of 1934 (“Exchange Act”). Our internal control over financial reporting is designed to provide reasonable assurance regarding the reliability of financial reporting and the preparation of financial statements for external purposes in accordance with generally accepted accounting principles. Our internal control over financial reporting includes those policies and procedures that:
(i) pertain to the maintenance of records that, in reasonable detail, accurately and fairly reflect the transactions and dispositions of our assets;
(ii) provide reasonable assurance that transactions are recorded as necessary to permit preparation of financial statements; and
(iii) provide reasonable assurance regarding prevention or timely detection of unauthorized transactions.
A material weakness is a deficiency, or a combination of deficiencies, in internal control over financial reporting, such that there is a reasonable possibility that a material misstatement of our annual or interim financial statements will not be prevented or detected on a timely basis.
Management has evaluated the effectiveness of the Company's internal control over financial reporting as of December 31, 2013. Management based its assessment on the framework set forth in COSO’s Internal Control – Integrated Framework (1992) in conjunction with Securities and Exchange Commission Release No. 33-8820 entitled "Commission Guidance Regarding Management’s Report on Internal Control Over Financial Reporting Under Section 13(a) or 15(d) of the Securities and Exchange Commission". We believe that internal control over financial reporting is effective as of December 31, 2013.
CHANGES IN INTERNAL CONTROL OVER FINANCIAL REPORTING
During the quarter ending December 31, 2013, there was no change in our internal control over financial reporting that materially affected, or is reasonably likely to materially affect our internal control over financial reporting.
Our independent registered public accountants have also issued an audit report on our internal control over financial reporting. Their report appears below.
39
REPORT OF INDEPENDENT REGISTERED PUBLIC ACCOUNTING FIRM
To the Board of Directors and Shareholders of Comstock Mining Inc.
We have audited the internal control over financial reporting of Comstock Mining Inc. and subsidiaries (the “Company”) as of December 31, 2013, based on criteria established in
Internal Control — Integrated Framework (1992)
issued by the Committee of Sponsoring Organizations of the Treadway Commission. The Company's management is responsible for maintaining effective internal control over financial reporting and for its assessment of the effectiveness of internal control over financial reporting, included in the accompanying Management's Report on Internal Control over Financial Reporting. Our responsibility is to express an opinion on the Company's internal control over financial reporting based on our audit.
We conducted our audit in accordance with the standards of the Public Company Accounting Oversight Board (United States). Those standards require that we plan and perform the audit to obtain reasonable assurance about whether effective internal control over financial reporting was maintained in all material respects. Our audit included obtaining an understanding of internal control over financial reporting, assessing the risk that a material weakness exists, testing and evaluating the design and operating effectiveness of internal control based on the assessed risk, and performing such other procedures as we considered necessary in the circumstances. We believe that our audit provides a reasonable basis for our opinion.
A company’s internal control over financial reporting is a process designed by, or under the supervision of, the company’s principal executive and principal financial officers, or persons performing similar functions and effected by the company’s board of directors, management, and other personnel to provide reasonable assurance regarding the reliability of financial reporting and the preparation of financial statements for external purposes in accordance with generally accepted accounting principles. A company’s internal control over financial reporting includes those policies and procedures that (1) pertain to the maintenance of records that, in reasonable detail, accurately and fairly reflect the transactions and dispositions of the assets of the company; (2) provide reasonable assurance that transactions are recorded as necessary to permit preparation of financial statements in accordance with generally accepted accounting principles, and that receipts and expenditures of the company are being made only in accordance with authorizations of management and directors of the company; and (3) provide reasonable assurance regarding prevention or timely detection of unauthorized acquisition, use, or disposition of the company’s assets that could have a material effect on the financial statements.
Because of the inherent limitations of internal control over financial reporting, including the possibility of collusion or improper management override of controls, material misstatements due to error or fraud may not be prevented or detected on a timely basis. Also, projections of any evaluation of the effectiveness of the internal control over financial reporting to future periods are subject to the risk that the controls may become inadequate because of changes in conditions, or that the degree of compliance with the policies or procedures may deteriorate.
In our opinion, the Company maintained, in all material respects, effective internal control over financial reporting as of December 31, 2013, based on the criteria established in
Internal Control — Integrated Framework (1992)
issued by the Committee of Sponsoring Organizations of the Treadway Commission.
We have also audited, in accordance with the standards of the Public Company Accounting Oversight Board (United States), the consolidated financial statements and financial statement schedule as of and for the year ended December 31, 2013 of the Company and our report dated March 17, 2014 expressed an unqualified opinion on those financial statements and financial statement schedule.
/s/ DELOITTE & TOUCHE LLP
Salt Lake City, Utah
March 17, 2014
40
Item 9B.
Other Information
None.
Item 10.
Directors, Executive Officers and Corporate Governance
The information required by item 10 is contained in the Proxy Statement and is incorporated herein by reference.
The information required by item 11 is contained in the Proxy Statement and is incorporated herein by reference.
The information required by item 12 is contained in the Proxy Statement and is incorporated herein by reference.
The information required by item 13 is contained in the Proxy Statement and is incorporated herein by reference.
Item 14.
Principal Accountants Fees and Services
The information required by item 14 is contained in the Proxy Statement and is incorporated herein by reference.
Item 15.
Exhibits and Financial Statement Schedules.
|
(a)
|
The following documents are filed as part of this Report:
|
|
(1)
|
Financial statements filed as part of this Report:
|
(2) Exhibits filed as part of this Report:
- Schedule II – Valuation and qualifying accounts
41
YEARS ENDED DECEMBER 31, 2013, 2012 AND 2011
|
Note Description
|
Balance at
Beginning of Year |
Additions
|
Deductions
|
Balance at End
of Year
|
|||||||||||
|
Year ended December 31, 2013
|
|
|
|
|
|
|
|
||||||||
|
Tax valuation allowance
|
$
|
49,600,420
|
|
$
|
7,111,905
|
|
$
|
—
|
|
$
|
56,712,325
|
|
|||
|
Year ended December 31, 2012
|
|
|
|
|
|
|
|
|
|||||||
|
Tax valuation allowance
|
$
|
39,133,355
|
|
$
|
10,467,065
|
|
$
|
—
|
|
$
|
49,600,420
|
|
|||
|
Year ended December 31, 2011
|
|
|
|
|
|
|
|
|
|||||||
|
Tax valuation allowance
|
$
|
35,235,982
|
|
$
|
3,897,373
|
|
$
|
—
|
|
$
|
39,133,355
|
|
|||
42
|
Exhibit
Number
|
Exhibit
|
|
|
|
|
|
|
3.1
|
Articles of Incorporation (previously filed with Securities and Exchange Commission on April 15, 2011 as exhibit 3.1 to the Company’s Annual Report on Form 10-K and incorporated herein by reference)
|
|
|
|
|
|
|
3.2
|
Amended and Restated Bylaws (previously filed with Securities and Exchange Commission on March 30, 2012 as exhibit 3.2 to the Company’s Annual Report on Form 10-K and incorporated herein by reference)
|
|
|
|
|
|
|
4.1
|
Certificate of Designation of Preferences, Rights and Limitations of 7 ½% Series A-1 Convertible Preferred Stock (previously filed with the Securities and Exchange Commission on October 21, 2010 as exhibit 4.1 to the Company’s Form 8-K and incorporated herein by reference)
|
|
|
|
|
|
|
4.2
|
Certificate of Designation of Preferences, Rights and Limitations of 7 ½% Series A-2 Convertible Preferred Stock (previously filed with the Securities and Exchange Commission on October 21, 2010 as exhibit 4.2 to the Company’s Form 8-K and incorporated herein by reference)
|
|
|
|
|
|
|
4.3
|
Certificate of Designation of Preferences, Rights and Limitations of 7 ½% Series B Convertible Preferred Stock (previously filed with the Securities and Exchange Commission on October 21, 2010 as exhibit 4.3 to the Company’s Form 8-K and incorporated herein by reference)
|
|
|
|
|
|
|
10.1
|
Comstock Mining Inc. 2011 Equity Incentive Plan (previously filed with the Securities and Exchange Commission on June 29, 2011 as exhibit 10.1 to the Company’s Current Report on Form 8-K and incorporated herein by reference)
|
|
|
|
|
|
|
10.2
|
Consent dated as of August 8, 2011, by and among the Company and the stockholders identified therein (previously filed with the Securities and Exchange Commission on August 11, 2011 as exhibit 10.1 to the Company’s Current Report on Form 8-K and incorporated herein by reference)
|
|
|
|
|
|
|
10.3
|
Form of Restricted Stock Agreement (previously filed with the Securities and Exchange Commission on December 23, 2012 as exhibit 10.1 to the Company’s Current Report on Form 8-K and incorporated herein by reference)
|
|
|
|
|
|
|
10.4
|
Form of Warrant (previously filed with the Securities and Exchange Commission on December 18, 2009 as exhibit 99.3 to the Company’s Form 8-K and incorporated herein by reference)
|
|
|
|
|
|
|
10.5
|
Employment Agreement, dated as of April 21, 2010, between the Company and Corrado De Gasperis (previously filed with the Securities and Exchange Commission on April 26, 2010 as exhibit 10.1 to the Company’s Form 8-K and incorporated herein by reference)
|
|
|
10.6
|
Limited Liability Company Operating Agreement of Northern Comstock LLC, dated as of October 19, 2010 (previously filed with the Securities and Exchange Commission on October 21, 2010 as exhibit 10.5 to the Company’s Form 8-K and incorporated herein by reference)
|
|
|
|
|
|
|
10.7
|
Master Loan and Security Agreement (previously filed with the Securities and Exchange Commission on September 14, 2012 as exhibit 10.1 to the Amendment to the Company’s Quarterly Report on Form 10-Q and incorporated by reference herein)
|
|
|
|
|
|
|
10.8
|
|
Secured Promissory Note and Guaranty (previously filed with the Securities and Exchange Commission on February 11, 2014 as exhibit 10.1 to the Company’s Current Report on Form 8-K and incorporated by reference herein)
|
|
|
|
|
43
|
10.10
|
|
General Security Agreement (Comstock Mining, Inc.) (previously filed with the Securities and Exchange Commission on February 11, 2014 as exhibit 10.3 to the Company’s Current Report on Form 8-K and incorporated by reference herein)
|
|
|
|
|
|
10.11
|
|
General Security Agreement (Comstock Mining LLC) (previously filed with the Securities and Exchange Commission on February 11, 2014 as exhibit 10.4 to the Company’s Current Report on Form 8-K and incorporated by reference herein)
|
|
|
|
|
|
10.12
|
|
Pledge Agreement (previously filed with the Securities and Exchange Commission on February 11, 2014 as exhibit 10.2 to the Company’s Current Report on Form 8-K and incorporated by reference herein)
|
|
|
|
|
|
10.13
|
|
Amended and Restated Master Purchase Contract (previously filed with the Securities and Exchange Commission on February 11, 2014 as exhibit 10.5 to the Company’s Current Report on Form 8-K and incorporated by reference herein)
|
|
|
|
|
|
10.14*
|
Amendment to Employment Agreement dated November 2, 2012
|
|
|
10.15*
|
Amendment to NO. 2 To Employment Agreement dated January 31, 2014
|
|
|
21*
|
|
Subsidiaries
|
|
|
|
|
|
23*
|
|
Consent of Deloitte & Touche LLP
|
|
|
|
|
|
24*
|
|
Powers of Attorney (included on signature page).
|
|
|
|
|
|
31.1*
|
|
Certification of Principal Executive Officer and Principal Financial Officer pursuant to Rule 13a-14(a) and Rule 15d-14(a), promulgated under the Securities Exchange Act of 1934, as amended
|
|
|
|
|
|
32.1*
|
|
Certification pursuant to 18 U.S.C. Section 1350, as adopted pursuant to Section 906 of the Sarbanes-Oxley Act of 2002
|
|
|
|
|
|
95*
|
|
Mine Safety Disclosures
|
|
|
|
|
|
101*
|
|
Interactive Data File (Annual Report on Form 10-K, for the year ended December 31, 2013, furnished in XBRL (eXtensible Business Reporting Language)).
Attached as Exhibit 101 to this report are the following documents formatted in XBRL: (i) the Consolidated Statements of Income for the fiscal years ended December 31, 2013, 2012 and 2011, (ii) the Consolidated Statements of Comprehensive Income for the fiscal years ended December 31, 2013, 2012 and 2011, (iii) the Consolidated Balance Sheets at December 31, 2013 and 2012, (iv) the Consolidated Statements of Changes in Equity for the fiscal years ended December 31, 2013, 2012 and 2011, (v) the Consolidated Statements of Cash Flows for the fiscal years ended December 31, 2013, 2012 and 2011 and (vi) the Notes to Consolidated Financial Statements
|
* Filed herewith.
44
SIGNATURES
Pursuant to the requirements of Section 13 or 15(d) of the Securities Exchange Act of 1934, the registrant has duly caused this report to be signed on its behalf by the undersigned, thereunto duly authorized.
|
|
COMSTOCK MINING INC.
|
|
|
|
(Registrant)
|
|
|
|
|
|
|
|
By:
|
/s/ Corrado De Gasperis
|
|
|
|
Name: Corrado De Gasperis
|
|
|
|
Title: Chief Executive Officer (Principal
Executive Officer and Principal Financial
Officer)
|
POWER OF ATTORNEY
KNOW ALL MEN BY THESE PRESENTS, that each individual whose signature appears below hereby constitutes and appoints Corrado De Gasperis as his or her true and lawful agent, proxy and attorney-in-fact, with full power of substitution and resubstitution, for him and in his name, place and stead, in any and all capacities, to (i) act on, sign and file with the Securities and Exchange Commission any and all amendments to this Report together with all schedules and exhibits thereto, (ii) act on, sign and file with the Securities and Exchange Commission any and all exhibits to this Report and any and all exhibits and schedules thereto, (iii) act on, sign and file any and all such certificates, notices, communications, reports, instruments, agreements and other documents as may be necessary or appropriate in connection therewith and (iv) take any and all such actions which may be necessary or appropriate in connection therewith, granting unto such agent, proxy and attorney-in-fact, full power and authority to do and perform each and every act and thing necessary or appropriate to be done, as fully for all intents and purposes as he might or could do in person, and hereby approving, ratifying and confirming all that such agent, proxy and attorney-in-fact, or any of his or their substitute or substitutes may lawfully do or cause to be done by virtue hereof.
Pursuant to the requirements of the Securities Exchange Act of 1934, this report has been signed below by the following persons on behalf of the registrant and in the capacities and on the dates indicated.
|
Signature
|
|
Title
|
|
Date
|
|
|
|
|
|
|
|
/s/ CORRADO DE GASPERIS
|
|
Director, President and Chief Executive Officer
|
|
March 17, 2014
|
|
Corrado De Gasperis
|
|
|
|
|
|
/s/ JUDD B. MERRILL
|
|
Chief Accounting Officer
|
|
March 17, 2014
|
|
Judd B. Merrill
|
|
|
|
|
|
/s/ DANIEL KAPPES
|
|
Director
|
|
March 17, 2014
|
|
Daniel Kappes
|
|
|
|
|
|
/s/ WILLIAM NANCE
|
|
Director
|
|
March 17, 2014
|
|
William Nance
|
|
|
|
|
|
/s/ ROBERT A. RESEIGH
|
|
Director
|
|
March 17, 2014
|
|
Robert A. Reseigh
|
|
|
|
|
|
/s/ JOHN V. WINFIELD
|
|
Director
|
|
March 17, 2014
|
|
John V. Winfield
|
|
|
|
|
|
|
|
|
|
|
45
Exhibit Index
|
Exhibit
Number
|
|
Exhibit
|
|
|
|
|
|
3.1
|
|
Articles of Incorporation (previously filed with Securities and Exchange Commission on April 15, 2011 as exhibit 3.1 to the Company’s Annual Report on Form 10-K and incorporated herein by reference)
|
|
|
|
|
|
3.2
|
|
Amended and Restated Bylaws (previously filed with Securities and Exchange Commission on March 30, 2012 as exhibit 3.2 to the Company’s Annual Report on Form 10-K and incorporated herein by reference)
|
|
|
|
|
|
4.1
|
|
Certificate of Designation of Preferences, Rights and Limitations of 7 ½% Series A-1 Convertible Preferred Stock (previously filed with the Securities and Exchange Commission on October 21, 2010 as exhibit 4.1 to the Company’s Form 8-K and incorporated herein by reference)
|
|
|
|
|
|
4.2
|
|
Certificate of Designation of Preferences, Rights and Limitations of 7 ½% Series A-2 Convertible Preferred Stock (previously filed with the Securities and Exchange Commission on October 21, 2010 as exhibit 4.2 to the Company’s Form 8-K and incorporated herein by reference)
|
|
|
|
|
|
4.3
|
|
Certificate of Designation of Preferences, Rights and Limitations of 7 ½% Series B Convertible Preferred Stock (previously filed with the Securities and Exchange Commission on October 21, 2010 as exhibit 4.3 to the Company’s Form 8-K and incorporated herein by reference)
|
|
|
|
|
|
10.1
|
|
Comstock Mining Inc. 2011 Equity Incentive Plan (previously filed with the Securities and Exchange Commission on June 29, 2011 as exhibit 10.1 to the Company’s Current Report on Form 8-K and incorporated herein by reference)
|
|
|
|
|
|
10.2
|
|
Consent dated as of August 8, 2011, by and among the Company and the stockholders identified therein (previously filed with the Securities and Exchange Commission on August 11, 2011 as exhibit 10.1 to the Company’s Current Report on Form 8-K and incorporated herein by reference)
|
|
|
|
|
|
10.3
|
|
Form of Restricted Stock Agreement (previously filed with the Securities and Exchange Commission on December 23, 2012 as exhibit 10.1 to the Company’s Current Report on Form 8-K and incorporated herein by reference)
|
|
|
|
|
|
10.4
|
|
Form of Warrant (previously filed with the Securities and Exchange Commission on December 18, 2009 as exhibit 99.3 to the Company’s Form 8-K and incorporated herein by reference)
|
|
|
|
|
|
10.5
|
|
Employment Agreement, dated as of April 21, 2010, between the Company and Corrado De Gasperis (previously filed with the Securities and Exchange Commission on April 26, 2010 as exhibit 10.1 to the Company’s Form 8-K and incorporated herein by reference)
|
|
|
|
|
|
10.6
|
|
Limited Liability Company Operating Agreement of Northern Comstock LLC, dated as of October 19, 2010 (previously filed with the Securities and Exchange Commission on October 21, 2010 as exhibit 10.5 to the Company’s Form 8-K and incorporated herein by reference)
|
|
|
|
|
|
10.7
|
|
Master Loan and Security Agreement (previously filed with the Securities and Exchange Commission on September 14, 2012 as exhibit 10.1 to the Amendment to the Company’s Quarterly Report on Form 10-Q and incorporated by reference herein)
|
|
10.8
|
|
Secured Promissory Note and Guaranty (previously filed with the Securities and Exchange Commission on February 11, 2014 as exhibit 10.1 to the Company’s Current Report on Form 8-K and incorporated by reference herein)
|
|
|
|
|
46
|
10.10
|
|
General Security Agreement (Comstock Mining, Inc.) (previously filed with the Securities and Exchange Commission on February 11, 2014 as exhibit 10.3 to the Company’s Current Report on Form 8-K and incorporated by reference herein)
|
|
|
|
|
|
10.11
|
|
General Security Agreement (Comstock Mining LLC) (previously filed with the Securities and Exchange Commission on February 11, 2014 as exhibit 10.4 to the Company’s Current Report on Form 8-K and incorporated by reference herein)
|
|
|
|
|
|
10.12
|
|
Pledge Agreement (previously filed with the Securities and Exchange Commission on February 11, 2014 as exhibit 10.2 to the Company’s Current Report on Form 8-K and incorporated by reference herein)
|
|
|
|
|
|
10.13
|
|
Amended and Restated Master Purchase Contract (previously filed with the Securities and Exchange Commission on February 11, 2014 as exhibit 10.5 to the Company’s Current Report on Form 8-K and incorporated by reference herein)
|
|
|
|
|
|
10.14*
|
Amendment to Employment Agreement dated November 2, 2012
|
|
|
10.15*
|
Amendment to NO. 2 To Employment Agreement dated January 31, 2014
|
|
|
21*
|
|
Subsidiaries
|
|
|
|
|
|
23*
|
|
Consent of Deloitte & Touche LLP
|
|
|
|
|
|
24*
|
|
Powers of Attorney (included on signature page).
|
|
|
|
|
|
31.1*
|
|
Certification of Principal Executive Officer and Principal Financial Officer pursuant to Rule 13a-14(a) and Rule 15d-14(a), promulgated under the Securities Exchange Act of 1934, as amended.
|
|
|
|
|
|
32.1*
|
|
Certification pursuant to 18 U.S.C. Section 1350, as adopted pursuant to Section 906 of the Sarbanes-Oxley Act of 2002
|
|
|
|
|
|
95*
|
|
Mine Safety Disclosures
|
|
|
|
|
|
101*
|
|
Interactive Data File (Annual Report on Form 10-K, for the year ended December 31, 2013, furnished in XBRL (eXtensible Business Reporting Language)).
Attached as Exhibit 101 to this report are the following documents formatted in XBRL: (i) the Consolidated Statements of Income for the fiscal years ended December 31, 2013, 2012 and 2011, (ii) the Consolidated Statements of Comprehensive Income for the fiscal years ended December 31, 2013, 2012 and 2011, (iii) the Consolidated Balance Sheets at December 31, 2013 and 2012, (iv) the Consolidated Statements of Changes in Equity for the fiscal years ended December 31, 2013, 2012 and 2011, (v) the Consolidated Statements of Cash Flows for the fiscal years ended December 31, 2013, 2012 and 2011 and (vi) the Notes to Consolidated Financial Statements
|
* Filed herewith.
47
TABLE OF CONTENTS
Part IItem 1. BusinessItem 1A. Risk FactorsItem 2. PropertiesItem 3. Legal ProceedingsItem 4. Mine Safety DisclosuresPart IIItem 5. Market For Registrant S Common Equity, Related Stockholder Matters and Issuer Purchases Of Equity SecuritiesItem 11. Executive CompensationItem 6. Selected Financial DataItem 7. Management S Discussion and Analysis Of Financial Condition and Results Of OperationsItem 7A. Quantitative and Qualitative Disclosures About Market RiskItem 8. Financial Statements and Supplementary DataItem 9. Changes and Disagreements with Accountants on Accounting and Financial DisclosureItem 9A. Controls and ProceduresItem 9B. Other InformationPart IIIItem 10. Directors, Executive Officers and Corporate GovernanceItem 12. Security Ownership Of Certain Beneficial Owners and Management and Related Stockholder MattersItem 13. Certain Relationships and Related Transactions, and Director IndependenceItem 14. Principal Accountants Fees and ServicesPart IVItem 15. Exhibits and Financial Statement Schedules