COMSTOCK MINING INC.
10-Ks and 10-Qs
|
|
|
|
|
|
|
|
|
|
|
|
|
|
|
|
|
|
|
|
|
|
|
|
|
|
|
|
|
|
|
|
|
|
|
|
|
|
|
|
|
|
|
|
|
|
|
|
|
|
|
|
|
|
|
|
|
|
|
|
|
|
UNITED STATES
SECURITIES AND EXCHANGE COMMISSION
WASHINGTON, D.C. 20549
_______________________________________________________________________
FORM 10-K
_______________________________________________________________________
ý
ANNUAL REPORT PURSUANT TO SECTION 13 OR 15(d) OF THE SECURITIES
EXCHANGE ACT OF 1934
For the fiscal year ended
December 31, 2016
or
¨
TRANSITION REPORT PURSUANT TO SECTION 13 OR 15(d) OF THE SECURITIES
EXCHANGE ACT OF 1934
For the transition period from to
Commission File No. 001-35200
COMSTOCK MINING INC.
(Exact name of registrant as specified in its charter)
|
Nevada
|
1040
|
65-0955118
|
|
(State or other jurisdiction of
incorporation or organization)
|
(Primary Standard Industrial
Classification Code Number)
|
(I.R.S. Employer Identification
No.)
|
P.O. Box 1118
Virginia City, NV 89440
(775) 847-5272
(Address, including zip code, and telephone number,
including area code, of registrant's principal executive offices)
Securities Registered pursuant to Section 12(b) of the Act: Common Stock, par value $.000666 per share
Securities Registered pursuant to Section 12(g) of the Act: None
Indicate by check mark if the registrant is a well-known seasoned issuer, as defined in Rule 405 of the Securities Act.
Yes
¨
No
ý
Indicate by check mark if the registrant is not required to file reports pursuant to Section 13 or Section 15(d) of the Act.
Yes
¨
No
ý
Indicate by check mark whether the issuer (1) has filed all reports required to be filed by Section 13 or 15(d) of the Securities Exchange Act of 1934 during the past 12 months (or for such shorter period that the registrant was required to file such reports), and (2) has been subject to such filing requirements for the past 90 days.
Yes
ý
No
¨
Indicate by check mark whether the registrant has submitted electronically and posted on its corporate Web site, if any, every Interactive Data File required to be submitted and posted pursuant to Rule 405 of Regulation S-T during the preceding 12 months (or for such shorter period of time that the registrant was required to submit and post such files). Yes
ý
No
¨
Indicate by check mark if disclosure of delinquent filers pursuant to Item 405 of Regulation S-K is not contained herein, and will not be contained, to the best of registrant’s knowledge, in definitive proxy or information statements incorporated by reference in Part III of this Form 10-K or any amendment to this Form 10-K.
¨
Indicate by check mark whether the registrant is a large accelerated filer, an accelerated filer, a non-accelerated filer, or a smaller reporting company. See the definitions of “large accelerated filer,” “accelerated filer,” and “smaller reporting company” in Rule 12b-2 of the Exchange Act.
|
Large accelerated filer
|
¨
|
Accelerated filer
|
¨
|
||
|
Non-accelerated filer
|
¨
|
Smaller reporting company
|
x
|
||
Indicate by check mark whether the registrant is a shell company (as defined in Rule 12b-2 of the Exchange Act).
Yes
¨
No
ý
The aggregate market value of the
128,786,430
shares of voting stock held by non-affiliates of the registrant based on the closing price on the NYSE MKT on
June 30, 2016
was
$20,605,829
.
Indicate the number of shares outstanding of each of the registrant’s classes of common stock, as of the latest practicable date.
|
|
|
Shares Outstanding
|
|
Title of Class
|
|
March 6, 2017
|
|
Common Stock
|
|
187,400,075
|
DOCUMENTS INCORPORATED BY REFERENCE
TABLE OF CONTENTS
|
|
|
|
|
|
|
|
|
|
|
|
|
|
||
Cautionary Notice Regarding Forward-Looking Statements
Certain statements contained in this report on Form 10-K or incorporated by reference into this Form 10-K may constitute forward-looking statements within the meaning of applicable securities laws. All statements, other than statements of historical facts, are forward-looking statements. Forward-looking statements include statements about matters such as: future prices and sales of, and demand for, our products; future industry market conditions; future changes in our mine planning, exploration activities, production capacity and operations; future exploration, production, operating and overhead costs; operational and management restructuring activities; future employment and contributions of personnel; tax and interest rates; capital expenditures and their impact on us; nature and timing of restructuring charges and the impact thereof; productivity, business process, rationalization, investment, acquisition, consulting, operational, tax, financial and capital projects and initiatives; contingencies; environmental law and regulation compliance and changes in the regulatory environment; remediation costs; and future working capital, costs, revenues, business opportunities, debt levels, cash flows, margins, earnings and growth.
The words “believe,” “expect,” “anticipate,” “estimate,” “project,” “plan,” “should,” “intend,” “may,” “will,” “would,” “potential” and similar expressions identify forward-looking statements, but are not the exclusive means of doing so. These statements are based on assumptions and assessments made by management in light of their experience and their perception of historical and current trends, current conditions, possible future developments and other factors they believe to be appropriate. Forward-looking statements are not guarantees, representations or warranties and are subject to risks and uncertainties, many of which are unforeseeable and beyond our control, and could cause actual results, developments and business decisions to differ materially from those contemplated by such forward-looking statements. Some of those risks and uncertainties include the risk factors discussed in Item 1A, “Risk Factors” and the following: adverse effects of climate changes or natural disasters; global economic and capital market uncertainties; the speculative nature of gold or mineral exploration, including risks of diminishing quantities or grades of qualified resources; operational or technical difficulties in connection with exploration or mining activities; contests over our title to properties; potential dilution to our stockholders from our stock issuances, recapitalization and balance sheet restructuring activities; potential inability to comply with applicable government regulations or law; adoption of or changes in legislation or regulations adversely affecting our businesses; permitting constraints or delays, business opportunities that may be presented to, or pursued by, us; changes in the United States or other monetary or fiscal policies or regulations; interruptions in our production capabilities due to capital constraints, equipment failures; fluctuation of prices for gold or certain other commodities (such as silver, zinc, cyanide, water, diesel fuel, and electricity); changes in generally accepted accounting principles; adverse effects of terrorism and geopolitical events; potential inability to implement our business strategies; potential inability to grow revenues; potential inability to attract and retain key personnel; interruptions in delivery of critical supplies and equipment raw materials due to credit or other limitations imposed by vendors; assertion of claims, lawsuits and proceedings against us; potential inability to satisfy debt and lease obligations; potential inability to maintain an effective system of internal controls over financial reporting; potential inability or failure to timely file periodic reports with the SEC; potential inability to list our securities on any securities exchange or market; and work stoppages or other labor difficulties. Occurrence of such events or circumstances could have a material adverse effect on our business, financial condition, results of operations or cash flows or the market price of our securities. All subsequent written and oral forward-looking statements by or attributable to us or persons acting on our behalf are expressly qualified in their entirety by these factors. Except as may be required by securities or other law, we undertake no obligation to publicly update or revise any forward-looking statements, whether as a result of new information, future events, or otherwise.
Glossary
“assay” means to test minerals by chemical or other methods for determining the amount of metals contained therein.
“claim” means a mining interest giving its holder the right to prospect, explore for and exploit minerals within a defined area.
“feasibility study” means a comprehensive study undertaken to determine the economic feasibility of a project; typically to determine if a construction and/or production decision can be made.
“grade” means the amount of precious metal in each ton of ore, expressed as troy ounces per ton.
“heap leaching” means a process whereby gold and silver are extracted by “heaping” crushed ore onto impermeable leach pads and applying a weak cyanide solution that dissolves the gold and silver from the ore into a precious metal-laden solution for further recovery.
“lode” is a vein-like deposit or rich supply of or source of gold or other minerals.
“mineralized material” is a body that contains mineralization that has been delineated by appropriately spaced drilling and/ or underground sampling to estimate a sufficient tonnage and average grade of metal(s). Such a deposit does not qualify as a reserve until a comprehensive evaluation based upon unit cost, grade, recoveries, and other material factors conclude legal and economic feasibility of extraction at the time of reserve determination.
“NSR” means net smelter return royalty.
“ore” means a mineral-bearing rock, which may be rich enough to be mined at a profit.
“placer” means alluvial deposit containing particles or larger pieces of gold or other minerals.
“probable reserves” means reserves for which quantity and grade and/or quality are computed from information similar to that used for proven (measured) reserves, but the sites for inspection, sampling and measurement are farther apart or are otherwise less adequately spaced. The degree of assurance, although lower than that for proven (measured) reserves, is high enough to assume continuity between points of observation.
“proven reserves” means reserves for which (a) quantity is computed from dimensions revealed in outcrops, trenches, workings or drill holes; grade and/or quality are computed from the results of detailed sampling and (b) the sites for inspection, sampling and measurement are spaced so closely and the geologic character is so well defined that size, shape, depth, and mineral content of reserves are well-established.
“quartz” is one of the most common of all rock-forming minerals and one of the most important constituents of the earth’s crust. Quartz may be transparent, translucent, or opaque; it may be colorless or colored.
“recovery” means that portion of the metal contained in the ore that is successfully extracted by processing, can also be expressed as a percentage.
“reserves” or “ore reserves” mean that part of a mineral deposit, which could be economically and legally extracted or produced at the time of the reserve determination.
“stripping ratio” or “strip ratio” means the ratio of waste tons to ore tons mined.
“tailings” means refuse materials resulting from the washing, concentration, or treatment of ore.
“ton” means a short ton (2,000 pounds).
“vein” is a deposit of non-sedimentary origin, which may or may not contain valuable minerals; lode.
“waste” means rock or other material lacking sufficient grade and/or other characteristics to be economically processed or stockpiled as ore and which is often necessary to access an ore deposit.
Item 1.
Business
OUR COMPANY
Unless the context otherwise indicates, the terms “Comstock,” “we,” “us,” “our,” “our Company” or “the Company” mean Comstock Mining Inc. and its consolidated subsidiaries.
The Company is a Nevada-based, gold and silver mining company with extensive, contiguous property in the historic Comstock and Silver City mining districts (collectively, the “Comstock District”). The Comstock District is located within the western portion of the Basin and Range Province of Nevada, between Reno and Carson City. The Company began acquiring properties and developing projects in the Comstock District in 2003. Since then, the Company has consolidated a substantial portion of the historic Comstock District, secured permits, built an infrastructure and brought exploration projects into production.
Because of the Comstock District’s historical significance, the geology is well known and has been extensively studied by the Company, our advisors and many independent researchers. We have expanded our understanding of the geology of the project area through vigorous surface mapping and drill hole logging. The volume of geologic data is immense, and thus far the reliability has been excellent, particularly in the various Lucerne Mine areas. We have amassed a large library of historic data and detailed surface mapping of Comstock District properties and continue to obtain historic information from private and public sources. We use such data in conjunction with information obtained from our current mining operations, to target geological prospective exploration areas and plan exploratory drilling programs, including expanded surface and underground drilling.
Our Lucerne Resource area is located in Storey County, Nevada, approximately three miles south of Virginia City and 30 miles southeast of Reno. Our Dayton Resource area is located in Lyon County, Nevada, approximately six miles south of Virginia City. Access to the properties is by State Route 341/342, a paved road.
The Company continues evaluating and acquiring properties, expanding its footprint and exploring all of our existing and prospective opportunities for further exploration, development and mining. The near-term goal of our business plan is to maximize intrinsic stockholder value realized, per share, by continuing to acquire mineralized and potentially mineralized properties, exploring, developing and validating qualified resources (measured, indicated and inferred) and reserves (proven and probable) that enable the commercial development of our operations through extended, long-lived mine plans that are economically feasible and socially responsible, including both the Lucerne and Dayton Mine plans, with both surface and underground development opportunities. We also plan to develop longer-term exploration plans for the remaining areas, which include the Spring Valley, the Northern Extension, Northern Targets and Occidental areas, subsequent to and in the case of the Spring Valley, concurrent with the exploration and development of Lucerne and Dayton.
The Company achieved initial production and held its first pour of gold and silver on September 29, 2012. The Company produced approximately
22,925
gold equivalent ounces in
2015
, the Company’s second full year in production and
5,099
gold equivalent ounces in
2016
. That is, the Company produced
19,601
ounces of gold and
222,416
ounces of silver in
2015
and
4,086
ounces of gold and
75,657
ounces of silver in
2016
.
The Company’s headquarters, mine operations and heap leach processing facility are in Storey County, Nevada, at 1200 American Flat Road and 117 American Flat Road, approximately three miles south of Virginia City, Nevada and 30 miles southeast of Reno, Nevada. The Company continues acquiring additional properties in the Comstock District, expanding its footprint and creating opportunities for further exploration, development and mining. The Company now owns or controls approximately
8,631
acres of mining claims and parcels in the Comstock and Silver City Districts. The acreage is comprised of approximately
2,266
acres of patented claims (private lands), surface parcels (private lands), and approximately
6,365
acres of unpatented mining claims, which the Bureau of Land Management (“BLM”) administers.
The Company’s real estate segment owns significant non-mining properties, including the Gold Hill Hotel, the Daney Ranch, 98-acre Silver Springs property, including senior water rights and other lands, homes and cottages. The Gold Hill Hotel consists of an operating hotel, restaurant and a bar. In 2015, the Company entered into an agreement to lease the Gold Hill Hotel to independent operators while retaining ownership. The initial term of the lease agreement was effective on April 1, 2015, and ends in March 2020. The tenant may renew the lease for two extended terms of five years each. Lease payments are due in monthly installments.
Financial information for each of our segments is disclosed in Note 13 to the consolidated financial statements.
5
Current Projects
The Company has identified six distinct target areas on its land holdings and has focused, to date, solely on the Lucerne Resource area (including surface and underground) and the Dayton Resource area. We anticipate developing exploration plans for the remaining areas, which include the Spring Valley, Northern Extension, Northern Targets, and Occidental Target areas, subsequent to the exploration and development of Lucerne and Dayton. The Company’s existing heap leach processing facility for gold and silver was redesigned and expanded in late 2013 and again in the fourth quarter of 2014, to accommodate future production plans.
The Lucerne Resource area has been the primary focus of the Company’s exploration and development efforts since 2007. It includes the previously mined Billie the Kid, Hartford and Lucerne mining claims, and extends east and northeasterly to the area of the historic Woodville bonanza, Succor and Lager Beer claims and north to the historic Justice and Keystone mines. The Company has the key mining permits required for mining this area. The Lucerne Resource area is approximately 5,000 feet long, with an average width of 600 feet, representing less than three percent of the land holdings controlled by the Company and is the site of our current production activities and ongoing exploration and development program.
The Dayton Resource area is southwest of Silver City in Lyon County, Nevada. It generally includes the Dayton, Kossuth and Alhambra claims, including the old Dayton Consolidated mine workings, south to where the Kossuth claim crosses State Route 341. The historic Dayton mine was the last major underground mining operation in the Comstock District, before being closed after the War Production Board promulgated Limitation Order L-208, 7 F. R. 7992 on October 8, 1942, that closed down all gold mining operations in the United States and its territories. The Dayton Resource area ranks as one of the Company’s top exploration and potential mine production targets. In January 2014, the Lyon County Board of Commissioners approved a strategic master plan and zoning changes on the Dayton, Kossuth and Alhambra mining claims and other properties located in the Dayton Resource area, enabling a more practical, comprehensive feasibility study for mining. Geological studies and development planning are currently underway utilizing data from the 30,818 feet of drilling completed in 2015, and data from prior drill programs.
The Spring Valley exploration target lies at the southern end of the Comstock District, where the mineralized structures lie mostly concealed beneath a veneer of sediment gravels. The area includes the Kossuth patented claim south of State Route 341, the Dondero patented property, the Daney patented claim, the New Daney lode mining claims, and the Company’s placer mining claims in Spring Valley and Gold Canyon.
The Northern Extension, Northern Targets and Occidental areas represent longer-term exploration target areas that contain many historic mining operations, including the Overman, Con Imperial, Caledonia, and Yellow Jacket mines. We believe that our consolidation of the Comstock District has provided us with opportunities to utilize the historical information available to identify drilling targets with significant potential.
6
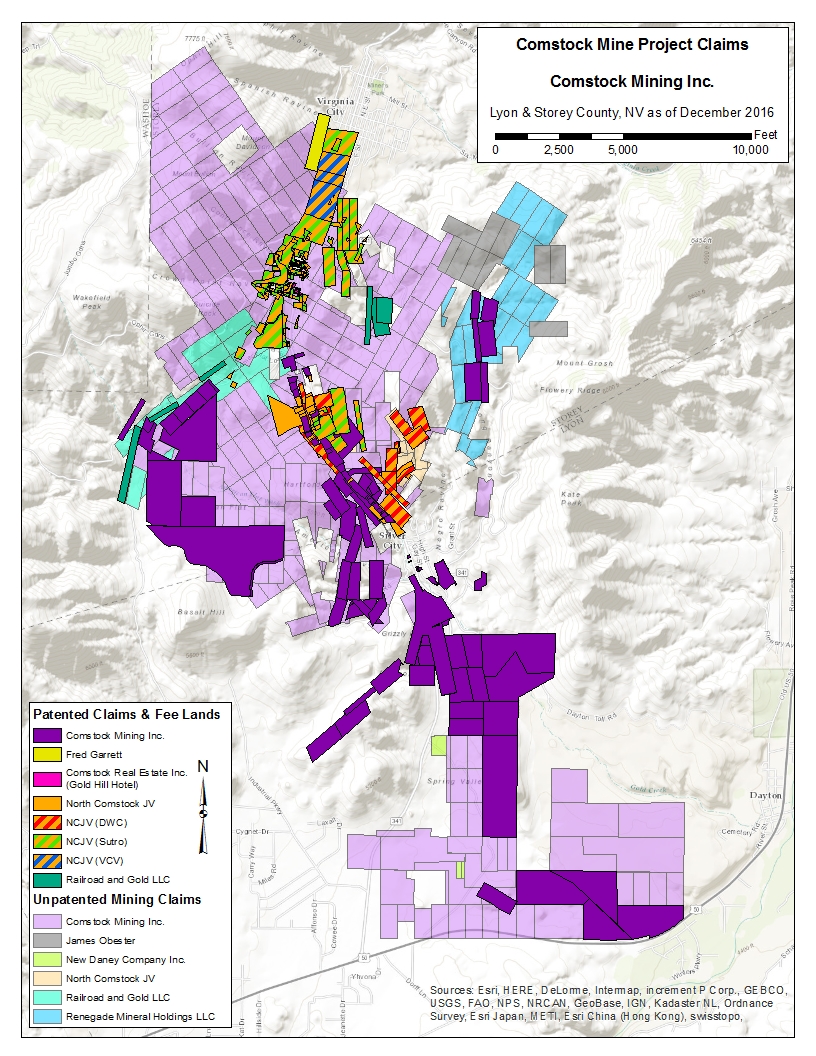
Figure-1 Comstock Mining’s Claims in Storey and Lyon Counties, Nevada
7
Our Comstock exploration activities include open pit gold and silver test mining. As defined by the Securities Exchange Commission (“SEC”) Industry Guide 7, we have not yet established any proven or probable reserves at our Comstock Lode Project.
Employees
As of
December 31, 2016
, we have
10
full-time employees and 2 part-time employees, inclusive of our general and administrative function.
Available Information
The Company maintains a website at comstockmining.com. Our annual report on Form 10-K, quarterly reports on Form 10-Q, current reports on Form 8-K and any amendments to those reports filed or furnished pursuant to Section 13(a) of the Securities Exchange Act of 1934 (“Exchange Act”) are made available through our website as soon as reasonably practical after we electronically file or furnish the reports to the SEC. Also available on our website are the Company’s Governance Guidelines and Code of Conduct, as well as the charters of the audit, compensation and nominating committees of the Board of Directors. Information on our website is not incorporated into this report. Stockholders may request free copies of these documents from:
Comstock Mining Inc.
Attention: Judd Merrill, Principal Financial Officer and Principal Accounting Officer
PO Box 1118
Virginia City, NV 89440
Principal Markets
We sell our production on world markets at prices established by commodity markets. These prices are not within our control. We had revenues of
$4.9 million
in our fourth full year of production in our mining segment and
$0.1 million
of revenues in our real estate segment during the year ended
December 31, 2016
. We had operating losses of
$10.2 million
and
$0.1 million
in our mining and real estate segments, respectively, during the year ended
December 31, 2016
. We had total assets of
$27.8 million
and $
6.0 million
in our mining and real estate segments, respectively, as of
December 31, 2016
. We did not have a real estate segment for any period prior to fiscal year 2011. See Note 13 to our audited consolidated financial statements for additional information regarding our segments.
Government Regulation
Mining operations and exploration activities are subject to various national, state, and local laws and regulations in the United States, which govern prospecting, development, mining, production, exports, taxes, labor standards, occupational health, waste disposal, protection of the environment, mine safety, hazardous substances, and other matters. We have obtained or have pending applications for substantially all of those licenses, permits, and other authorizations currently required for our mining, exploration and other development programs. We believe that we are in compliance in all material respects with applicable mining, health, safety and environmental statutes and regulations. Capital expenditures relating to compliance with laws and regulations that regulate the discharge of materials into the environment, or otherwise relating to the protection of the environment, comprise a substantial part of our historical capital expenditures and our anticipated future capital expenditures. For example, we incur certain expenses and liabilities associated with our reclamation obligations. See “Reclamation” section below.
Reclamation
We are generally required to mitigate long-term environmental impacts by stabilizing, contouring, re-sloping, and re-vegetating various portions of a site after mining and mineral processing operations are completed. These reclamation efforts are conducted in accordance with plans reviewed and approved by the appropriate regulatory agencies.
The Nevada Revised Statutes (NRS) 519A to 519A.280 and Nevada Administrative Code (NAC) 519A.010 to 519A.415 promulgated by the Nevada State Environmental Commission and the Nevada Division of Environmental Protection (“NDEP”), Bureau of Mining and Reclamation (“BMRR”) require a surety bond to be posted for mining projects so that after completion of the work on such mining projects, the sites are left safe, stable and capable of providing for a productive post-mining use. Over the past four years, the Company has provided a reclamation surety bond, through the Lexon Surety Group (“Lexon”), with the BMRR. The BMRR, with concurrence from Storey County, has approved our most recent reclamation
8
plan, as revised, and our estimated total costs related thereto of approximately
$7.7 million
, including,
$7.1 million
for BMRR and
$0.6 million
of additional reclamation surety bonding primarily with Storey County. For the years ended December 31,
2015
, and
2014
, the Company had provided estimates and surety bonds in the amounts of $11.6 million and $8.6 million, respectively.
As part of the surety agreement, the Company agreed to pay a
2.0%
annual bonding fee and has signed a corporate guarantee. The cash collateral percentage held on deposit by Lexon is typically
25.0%
or less of the current bond amount. The current bond amount with the State and County is
$7.7 million
and at
December 31, 2016
,
$2.5 million
of collateral was held on deposit.
Competition
We compete with other mineral exploration and mining companies in connection with the acquisition of gold and other mineral properties and the attraction and retention of human capital. Such competitors may have substantially greater financial resources than we do.
History
The Company began acquiring properties and developing projects in the Comstock District in 2003. The Company produced over 12,000 ounces of gold and over 53,000 ounces of silver from 2004-2006 from our existing Lucerne mine and American Flat heap leach processing facilities. Our test mining activities were concluded in January 2007, when based on our longer-term production plans, we prioritized land consolidation and mine planning. The Company restarted mining operations in the third quarter of 2012 and resumed pouring doré bars of silver and gold in September 2012. The Company produced over
59,454
ounces of gold and over
734,492
ounces of silver from September 2012 through December 2016, achieving annual rate of
22,925
gold equivalent ounces in 2014. The Company completed leaching from its existing leach pads in December 2016, and has transitioned to exploration and development activities, primarily in the Lucerne and Dayton Resource areas.
Customers
Substantially all mining revenues recorded to date relate to the same customer. As gold can be sold through numerous gold market traders worldwide, the Company is not economically dependent on a limited number of customers for the sale of its product. The real estate segment has numerous customers and is not dependent on any one customer.
Financing Events
In March and April
2016
, the Company completed two equity financing transactions totaling
$4.0 million
(approximately
$3.5 million
, net of issuance costs). The proceeds were used to accelerate certain prerequisites, including interim mine planning and expanded exploration and development activities for the next phase of Dayton drilling and development and general corporate purposes.
During 2016, the Company entered into a sales agreement with respect to an at-the-market offering program (“ATM Agreement”) pursuant to which the Company may offer and sell, from time to time at its sole discretion, shares of its common stock, having an aggregate offering price of up to $5.0 million. During the year ended
December 31, 2016
, the Company issued
1,835,300
shares of common stock through the Company’s at-the-market offering program. Gross proceeds from the issuance of shares totaled approximately
$0.5 million
.
9
An investment in our securities involves risk. You should carefully consider the following risk factors, in addition to those discussed elsewhere in this report, in evaluating our Company, its business, its industry and prospects. The risks described below are not the only ones facing us. Additional risks not presently known to us, or that we currently deem immaterial, may also have a material adverse effect on us. The following risks could cause our business, financial condition, results of operations or cash flows to be materially and adversely affected. In that case, the market price of our securities could decline, and you could lose part or all of your investment.
You may lose all or part of your investment.
If we are unable to find, mine and sell adequate quantities of gold and silver ore, it is unlikely that the cash generated from our internal operations will suffice as a source of the liquidity necessary for anticipated working capital requirements. There is no assurance that the Company’s initiatives to improve its liquidity and financial position will be successful. Accordingly, there is substantial risk that the Company will be unable to continue as a going concern. In the event of insolvency, liquidation, reorganization, dissolution or other winding up of the Company, the Company’s creditors would be entitled to payment in full out of the Company’s assets before holders of common stock would be entitled to any payment, and the claims on such assets may exceed the value of such assets.
We have a limited operating history.
We have a limited operating history. The success of our Company is significantly dependent on the uncertain events of the discovery and exploitation of mineralized materials on our properties or selling the rights to exploit those materials. If our business plan is not successful and we are not able to operate profitably, then our securities may become worthless and investors may lose all of their investment in our Company.
Because we may never earn significant revenues from our mine operations, our business may fail.
We recognize that if we are unable to generate significant revenues from the exploration and exploitation of our mineralized materials in the future, we will not be able to earn profits or continue operations. We have yet to generate positive earnings and there can be no assurance that we will ever operate profitably. There is no history upon which to base any assumption as to the likelihood that we will prove successful, and we can provide no assurance that we will generate significant revenues or ever achieve profitability. If we are unsuccessful, our business will fail and investors may lose all of their investment in our Company.
Transportation difficulties and weather interruptions may affect and delay proposed mining operations and impact our business plans
.
Our mining properties are accessible by road. The climate in the area is hot and dry in the summer but cold and subject to snow in the winter, which could, at times, hamper accessibility depending on the winter season precipitation levels. As a result, our exploration and mining plans could be delayed for several months each year. Such delays could affect our anticipated business operations and increase our expenses.
Moreover, extreme weather events (such as increased frequency or intensity of hurricanes or prolonged drought, flooded or frozen terrain) have the potential to disrupt operations at our projects. Extended disruptions to supply lines due to extreme weather could result in interruption of activities at the project sites, delay or increase the cost of construction of the projects, or otherwise adversely affect our business.
Supplies and equipment needed for exploration may not always be available. If we are unable to secure exploration supplies we may have to delay our anticipated business operations
.
Competition and unforeseen limited sources of supplies needed for our proposed exploration work could result in occasional shortages of supplies of certain products, equipment or materials. There is no guarantee we will be able to obtain certain products, equipment and/or materials as and when needed, without interruption, or on favorable terms, if at all. Such delays could affect our anticipated business operations and increase our expenses.
10
We have invested capital in high-risk mineral projects where we have not conducted sufficient exploration and engineering studies
.
We have invested capital and have otherwise been involved in various mineral properties and projects in the Comstock District where we have not conducted sufficient exploration and engineering studies to minimize the risk of project failure. Our mineral projects involve high risks because we have not invested sufficiently in the characterization of mineralized material, geologic analysis, metallurgical testing, mine planning and economic analysis. Standard industry practice calls for a mining company to prepare a formal mine plan and mining production schedule and have these documents reviewed and validated by a third party specialist. We have not had a formal mine plan and mining production schedule economically validated by a third party specialist.
We will not be successful unless we recover precious metals and sell them for a profit.
Our success depends on our ability to recover precious metals, process them, and successfully sell them for more than the cost of production. The success of this process depends on the market prices of metals in relation to our costs of production. We may not be able to generate a profit on the sale of gold or other minerals because we have limited control over our costs and have no ability to control the market prices. The total cash costs of production at any location are frequently subject to great variation from year to year as a result of a number of factors, such as the changing composition of ore grade or mineralized material production, and metallurgy and exploration activities in response to the physical shape and location of the ore body or deposit. In addition, costs are affected by the price of commodities, such as fuel and electricity. Such commodities are at times subject to volatile price movements, including increases that could make production unprofitable. A material increase in production costs or a decrease in the price of gold or other minerals could adversely affect our ability to earn a profit on the sale of gold or other minerals.
We do not have proven or probable reserves, and there is no assurance that the quantities of precious metals we produce will be sufficient to recover our investment and operating costs.
We do not have proven or probable reserves. Substantial expenditures are required to acquire existing gold properties with established reserves or to establish proven or probable reserves through drilling and analysis. Any sums expended for additional drilling and analysis may not establish proven or probable reserves on our properties. We drill in connection with our mineral exploration and mining activities and not with the purpose of establishing proven and probable reserves. While we estimate the amount of mineralized material we believe exists on our properties, our calculations are subject to uncertainty due to several factors, including the quantity and grade of ore, metal prices and recoverability of minerals in the mineral recovery process. There is a great degree of uncertainty attributable to the calculation of any mineralized material, particularly where there has not been significant drilling, mining and processing. Until the mineralized material located on our properties is actually mined and processed, the quantity and quality of the mineralized material must be considered as an estimate only. In addition, the estimated value of such mineralized material (regardless of the quantity) will vary depending on metal prices. Any material change in the estimated value of mineralized material may negatively affect the economic viability of our properties. In addition, there can be no assurance that we will achieve the same recoveries of metals contained in the mineralized material as in small-scale laboratory tests or that we will be able to duplicate such results in larger scale tests under on-site conditions or during production. There can be no assurance that our exploration activities will result in the discovery of sufficient quantities of mineralized material to recover our investment and operating costs.
The cost of our exploration and acquisition activities is substantial, and there is no assurance that the quantities of minerals we discover or acquire will justify commercial operations or replace reserves (to the extent reserves are established in the future).
Mineral exploration, particularly for gold and other precious metals, is highly speculative in nature and frequently is nonproductive. There can be no assurance that our exploration and acquisition activities will be commercially successful. If gold mineralization is discovered, it may take a number of years from the initial phases of drilling until production is possible, during which time the economic feasibility of production may change. Substantial expenditures are required to acquire existing gold properties, to establish ore reserves through drilling and analysis, to develop metallurgical processes to extract metal from the ore, and in the case of new properties, to develop the processing facilities and infrastructure at any site chosen for mineral exploration. There can be no assurance that any gold reserves or mineralized material that may be discovered or acquired in the future, if any, will be in sufficient quantities or of adequate grade to justify commercial operations or that the funds required for mineral production operation can be obtained on a timely or reasonable basis, if at all. Mining companies must continually replace mineralized material or reserves depleted by production. There can be no assurance that we will be successful in replacing any reserves or mineralized material acquired or established in the future.
11
The price of gold and silver fluctuate on a regular basis and a downturn in price could negatively impact our operations and cash flow.
Our operations will be significantly affected by changes in the market price of gold and silver if we are able to produce gold or other minerals. Gold and silver prices can fluctuate widely and may be affected by numerous factors, such as expectations for inflation, levels of interest rates, currency exchange rates, purchases and sales by governments and central banks, monetary policies employed by the world’s major central banks, fiscal policies employed by the world’s major industrialized economies, forward selling or other hedging activities, demand for precious metals, global or regional political and economic crises and production costs in major gold-producing regions, such as but not limited to South Africa and the former Soviet Union. The aggregate effect of these factors, all of which are beyond our control, is impossible for us to predict. If gold or silver prices decline substantially, it could adversely affect the realizable value of our assets and potentially, future results of operations and cash flow.
We plan to pursue opportunities to acquire properties with gold or silver reserves or mineralized material with exploration potential. The price that we pay to acquire these properties will be influenced, in large part, by the price of gold and silver at the time of the acquisition. We expect our potential future revenues to be derived from the production and sale of gold and silver from these properties or from the sale of some of these properties. The value of any mineralized material, and the value of any potential mineral production therefrom, will vary in direct proportion to variations in those mineral prices. The price of gold and silver has fluctuated widely as a result of numerous factors beyond our control. The effect of these factors on the price of gold and silver, and therefore the economic viability of our projects, cannot accurately be predicted. Any drop in the price of gold or silver would negatively affect our asset values, cash flows, potential revenues and profits.
The use of hedging instruments may not prevent losses being realized on subsequent price decreases or may prevent gains being realized from subsequent price increases.
We may from time to time sell some future production of gold pursuant to hedge positions. If the gold price rises above the price at which future production has been committed under these hedge instruments, we will have an opportunity loss. If the gold price falls below that committed price, we may experience losses if a hedge counterparty defaults under a contract when the contract price exceeds the gold price. As of
December 31, 2016
, we have no open hedge positions.
We compete with other mineral exploration and mining companies which could lead to the loss of opportunities.
We compete with other mineral exploration and mining companies or individuals, including large, established mining companies with substantial capabilities and financial resources, to acquire rights to mineral properties containing gold and other minerals. There is a limited supply of desirable lands available for claim staking, lease or other acquisition. There can be no assurance that we will be able to acquire such properties when competing against competitors with substantially greater financial resources than we have.
The estimation of the ultimate recovery of gold and silver, is subjective. Actual recoveries may vary from our estimates.
We utilize the heap leach process to extract gold and silver from ore. The heap leach process extracts gold and silver by placing ore on an impermeable pad and applying a diluted cyanide solution that dissolves a portion of the contained gold and silver, which are then recovered in metallurgical processes. We use several integrated steps in the process of extracting gold and silver to estimate the metal content of ore placed on the leach pad. The final amounts are not determined until a third-party smelter converts the doré and determines final ounces of gold and silver available for sale. We then review this end result and reconcile it to the estimates we developed and used throughout the production process. Based on this review, we adjust our estimation procedures when appropriate. Due to the complexity of the estimation process and the number of steps involved, among other things, actual recoveries can vary from estimates, and the amount of the variation could be significant and could have a material adverse impact on our financial condition and results of operations.
Resource and other mineralized material calculations are estimates only, and are subject to uncertainty due to factors including metal prices, inherent variability of the ore and recoverability of metal in the mining process.
The calculation of mineral resources, other mineralized material and grading are estimates and depend upon geological interpretation and statistical inferences or assumptions drawn from drilling and sampling analysis, which may prove to be unpredictable. There is a degree of uncertainty attributable to the calculation of mineral resources and corresponding grades. Until mineral resources and other mineralized materials are actually mined and processed, the quantity of ore and grades must be considered as an estimate only. In addition, the quantity of mineral resources and other mineralized materials and ore may vary depending on metal prices. Any material change in the quantity of mineral resources, other mineralized materials, mineralization, grade or stripping ratio may affect the economic viability of our properties. In addition, we can provide no
12
assurance that gold recoveries or other metal recoveries experienced in small-scale laboratory tests will be duplicated in larger scale tests under on-site conditions or during production.
Our mining production depends on the availability of sufficient water supplies.
Our mining operations require significant quantities of water for mining, ore processing and related support facilities. Most of our mining operations are in areas where water is scarce and competition among users for continuing access to water is significant. Continuous production at our mines is dependent on our ability to maintain our water rights and claims, and the continuing physical availability of the water supplies.
Cost estimates and timing of new projects are uncertain, which may adversely affect our expected production and profitability.
The capital expenditures and time required to develop and explore our properties, including the Lucerne Mine and the Dayton Resource area, are considerable and changes in costs, construction schedules or both, can adversely affect project economics and expected production and profitability. There are a number of factors that can affect costs and construction schedules, including, among others:
|
•
|
availability of labor, energy, transportation, equipment, and infrastructure;
|
|
•
|
changes in input commodity prices and labor costs;
|
|
•
|
fluctuations in currency exchange rates;
|
|
•
|
availability and terms of financing;
|
|
•
|
changes in anticipated tonnage, grade and metallurgical characteristics of the ore to be mined and processed;
|
|
•
|
recovery rates of gold and other metals from the ore;
|
|
•
|
difficulty of estimating construction costs over a period of a year;
|
|
•
|
delays in completing any environmental review or in obtaining environmental or other government permits;
|
|
•
|
weather and severe climate impacts; and
|
|
•
|
potential delays related to social, political and community issues.
|
We may experience increased costs or losses resulting from the hazards and uncertainties associated with mining.
The exploration for natural resources and the development and production of mining operations are activities that involve a high level of uncertainty. These can be difficult to predict and are often affected by risks and hazards outside of our control.
These factors include, but are not limited to:
|
•
|
environmental hazards, including discharge of metals, concentrates, pollutants or hazardous chemicals;
|
|
•
|
industrial accidents, including in connection with the operation of mining transportation equipment, milling equipment and/or conveyor systems and accidents associated with the preparation and ignition of large-scale blasting operations, milling, processing and transportation of chemicals, explosives or other materials;
|
|
•
|
surface or underground fires or floods;
|
|
•
|
unexpected geological formations or conditions (whether in mineral or gaseous form);
|
|
•
|
ground and water conditions;
|
|
•
|
fall-of-ground accidents in underground operations;
|
|
•
|
failure of mining pit slopes and tailings dam walls;
|
|
•
|
seismic activity; and
|
|
•
|
other natural phenomena, such as lightning, cyclonic or tropical storms, floods or other inclement weather conditions.
|
Our activities are inherently hazardous and any exposure may exceed our insurance limits or may not be insurable.
Mineral exploration and operating activities are inherently hazardous. Operations in which we have direct or indirect interests will be subject to all the hazards and risks normally incidental to exploration and production of gold and other metals, any of which could result in work stoppages, damage to property and possible environmental damage. The nature of these risks is such that liabilities might exceed any applicable liability insurance policy limits. It is also possible that the liabilities and hazards might not be insurable, or we could elect not to insure ourselves against such liabilities because of the high premium costs, in which event, we could incur significant costs that could have a material adverse effect on our financial condition.
13
Our ability to execute our strategic plans depends upon our success in obtaining a variety of required governmental approvals that may be opposed by third-parties.
We do not possess all of the governmental approvals necessary to conduct the full extent of the operations contemplated by our strategic plan. Those operations will be delayed, hindered or prevented to the extent that we are unable to obtain the necessary permits and approvals in a timely fashion or at all. This inability may occur due to a variety of factors, including opposition by third parties, such as members of the public or environmental groups. We expect that future permit and approval applications and issuances will meet with similar opposition. We may encounter delays and added costs if permits and approvals are challenged.
Mining companies are increasingly required to consider and provide benefits to the communities in which they operate.
As a result of public concern about the real or perceived detrimental effects of economic globalization and global climate impacts, businesses generally, and corporations in natural resource industries, face increasing public scrutiny of their activities. These businesses are under pressure to demonstrate that, as they seek to generate satisfactory returns on investment to shareholders, other stakeholders, including employees, governments, and communities surrounding operations benefit and will continue to benefit from their commercial activities. Such pressures tend to be particularly focused on companies whose activities are perceived to have a high impact on their social and physical environment. The potential consequences of these pressures include reputational damage, legal suits, increasing social investment obligations and pressure to increase taxes and royalties payable to governments and communities.
Our operations are subject to strict environmental laws and regulations, which could result in added costs of operations and operational delays.
Our operations are subject to strict environmental regulations, which could result in additional costs and operational delays. All phases of our operations are subject to environmental regulation. Environmental legislation is evolving in the United States generally, and Nevada specifically, in a manner that may require stricter standards and enforcement, increased fines and penalties for non-compliance, more stringent environmental assessments of proposed projects, and a heightened degree of responsibility for companies and their officers, directors, and employees. There is no assurance that any future changes in environmental regulation will not negatively affect our projects.
At the state level, mining operations in Nevada are regulated by NDEP. Nevada state law requires our Nevada projects to hold Nevada water pollution control permits, which dictate operating controls and closure and post-closure requirements directed at protecting surface and ground water. In addition, we are required to hold Nevada reclamation permits required under Nevada law. These permits mandate concurrent and post-mining reclamation of mines and require the posting of reclamation bonds sufficient to guarantee the cost of mine reclamation. Other Nevada regulations govern operating and design standards for the construction and operation of any source of air contamination and landfill operations. Any changes to these laws and regulations could have a negative impact on our financial performance and results of operations by, for example, requiring changes to operating constraints, technical criteria, fees or surety requirements.
Regulations and pending legislation governing issues involving climate change could result in increased operating costs which could have a material adverse effect on our business
.
Our business is an energy-intensive undertaking, resulting in a significant carbon footprint. A number of governments or governmental bodies have introduced or are contemplating regulatory changes in response to the potential impacts of climate change that are viewed as the result of emissions from the combustion of carbon-based fuels. Legislation and increased regulation and requirements regarding climate change could impose increased costs on us and our suppliers, including increased energy, capital equipment, environmental monitoring and reporting and other costs to comply with such regulations. Until the timing, scope and extent of any future requirements becomes known, we cannot predict the effect on our financial condition, financial position, results of operations and ability to compete.
14
Because our land holdings are within the Carson River Mercury Superfund Site, our operations are subject to certain soil sampling and potential remediation requirements, which may result in added costs and delays; and we are also potentially subject to further costs as the result of on-going government investigation and future remediation decisions.
Substantially all of our land holdings are within the Carson River Mercury Superfund Site (CRMS) Study Area and portions are within the risk area boundaries identified by NDEP and the United States Environmental Protection Area (USEPA). These risk areas have been defined due to the known or suspected presence of certain contaminants of concern, including mercury, arsenic and lead. To comply with the agencies’ requirements in these areas, the Company conducts soil sampling pursuant to a plan that has been approved by NDEP. This sampling is intended to demonstrate the absence of contamination before mining, processing or other operations in that area. If contamination above agency-established levels of concern is encountered, the Company intends to excavate and process such materials for metals recovery wherever feasible. If metals recovery is not feasible, the Company may avoid or defer excavating in that area, remove the materials for disposal, or cover the area with clean fill material. Through this sampling program and, if necessary, removal of contaminated materials, the Company intends to enable NDEP and USEPA to better define the Carson River Superfund Site and the currently designated risk areas so as to eventually exclude our land holdings from such areas and from the Site itself to the maximum extent feasible. NDEP and USEPA are continuing to study the ecological and human health risks that may be presented by contaminated sediments in certain portions of the Carson River watershed and downstream areas. The agencies’ studies indicate that these contaminants are primarily associated with historic mining tailings that have been redistributed into these waterways. The agencies have not adopted a remedial plan for these sediments nor have they decided whether remediation will be undertaken. Thus, there is no assurance that the Company will not be asked to undertake additional investigatory or remediation activities or to pay for such activities by the agencies or that future changes in CRMS-related requirements will not negatively affect our operations.
Our insurance and surety bonds for environmental-related issues are limited.
Our insurance and surety bonds against environmental risks are limited as to the maximum protection against potential liability for pollution or other hazards as a result of the disposal of waste products occurring from exploration and production. Further, there is no assurance that insurance carriers or surety bond providers will be able to meet their obligations under our arrangements with them. In the event that our environmental liabilities and costs exceed the coverage provided by our insurance carriers and surety bond providers or such parties are unable to meet their obligations, we would have limited funds available to us to remedy such liabilities or costs or for future operations. If we are unable to fund the cost of remedying an environmental problem, we also might be required to enter into an interim compliance measure pending completion of the required remedy.
We are subject to federal and state laws that require environmental assessments and the posting of bonds, which add significant costs to our operations and delays in our projects.
Mining companies must post a bond or other surety to guarantee the cost of post-mining reclamation. These requirements could add significant additional cost and delays to any mining project undertaken by us. Our mineral exploration operations are required to be covered by reclamation bonds deemed adequate by regulators to cover these risks.
BLM requires that mining operations on lands subject to its regulation obtain an approved plan of operations subject to environmental impact evaluation under the National Environmental Policy Act. Any submission or significant modification to a plan of operations may also require the completion of an environmental assessment or Environmental Impact Statement prior to approval.
The Company’s costs of close- down, reclamation, and rehabilitation could be higher than expected.
Close-down and reclamation works to return operating sites to the community can be extensive and costly. Estimated costs are provided for, and updated annually, over the life of each operation but the provisions might prove to be inadequate due to changes in legislation, standards and the emergence of new, or increases in the cost of, reclamation techniques. In addition, the expected timing of expenditure could change significantly due to changes in the business environment that might vary the life of an operation.
15
We may be subject to litigation.
We may be subject to legal proceedings. Due to the nature of our business, we may be subject to a variety of regulatory investigations, claims, lawsuits and other proceedings in the ordinary course of our business. The results of these legal proceedings cannot be predicted with certainty due to the uncertainty inherent in litigation, including the effects of discovery of new evidence or advancement of new legal theories, the difficulty of predicting decisions of judges and juries and the possibility that decisions may be reversed on appeal. There can be no assurances that these matters will not have a material adverse effect on our business.
Title claims against our properties could require us to compensate parties making such claims, if successful, and divert management’s time from operations.
There may be challenges to our title in the properties in which we hold material interests. If there are title defects with respect to any of our properties, we might be required to compensate other persons or perhaps reduce our interest in the affected property. The validity of unpatented mineral claims, which constitute most of our holdings in the United States, is often uncertain and may be contested by the federal government and other parties. The validity of an unpatented mineral claim, in terms of both its location and its maintenance, depends on strict compliance with a complex body of federal and state, statutory and decisional law. Although we have attempted to acquire satisfactory title to our properties, we have not obtained title opinions or title insurance with respect to the acquisition of the unpatented mineral claims. The investigation and resolution of title issues would divert management’s time from ongoing exploration programs.
Our business depends on a limited number of key personnel, the loss of who could negatively affect us.
Our officers and employees are important to our success. If any of them becomes unable or unwilling to continue in their respective positions, and we are unable to find suitable replacements, our business and financial results could be materially negatively affected.
Our business may be adversely affected by information technology disruptions.
Cybersecurity incidents are increasing in frequency, evolving in nature and include, but are not limited to, installation of malicious software, unauthorized access to data and other electronic security breaches that could lead to disruptions in systems, unauthorized release of confidential or otherwise protected information and the corruption of data. We believe that we have implemented appropriate measures to mitigate potential risks. However, given the unpredictability of the timing, nature and scope of information technology disruptions, we could be subject to manipulation or improper use of our systems and networks or financial losses from remedial actions, any of which could have a material adverse effect on our financial condition and results of operations.
We rely on contractors to conduct a significant portion of our operations and construction projects.
A significant portion of our operations and construction projects are currently conducted in whole or in part by contractors. As a result, our operations are subject to a number of risks, some of which are outside our control, including:
|
•
|
negotiating agreements with contractors on acceptable terms;
|
|
•
|
the inability to replace a contractor and its operating equipment in the event that either party terminates the agreement;
|
|
•
|
reduced control over those aspects of operations which are the responsibility of the contractor;
|
|
•
|
failure of a contractor to perform under its agreement;
|
|
•
|
interruption of operations or increased costs in the event that a contractor ceases its business due to insolvency or other unforeseen events;
|
|
•
|
failure of a contractor to comply with applicable legal and regulatory requirements, to the extent it is responsible for such compliance; and
|
|
•
|
problems of a contractor with managing its workforce, labor unrest or other employment issues.
|
In addition, we may incur liability to third parties as a result of the actions of our contractors. The occurrence of one or more of these risks could adversely affect our results of operations and financial position.
16
Our business requires substantial capital investment and we may be unable to raise additional funding on favorable terms.
The construction and operation of potential future projects and various exploration projects will require significant funding. Our operating cash flow and other sources of funding may become insufficient to meet all of these requirements, depending on the timing and costs of development of these and other projects. As a result, new sources of capital may be needed to meet the funding requirements of these investments and fund our ongoing business activities. Our ability to raise and service significant new sources of capital will be a function of macroeconomic conditions, future gold and silver prices, our operational performance and our current cash flow and debt position, among other factors. In the event of lower gold and silver prices, unanticipated operating or financial challenges, or a further dislocation in the financial markets as experienced in recent years, our ability to pursue new business opportunities, invest in existing and new projects, fund our ongoing operations and retire or service all of our outstanding debt could be significantly constrained.
Our substantial indebtedness and payment obligations under capital leases could adversely affect our operations, financial condition, cash flow, and operating flexibility.
Our significant amount of outstanding indebtedness and lease payment obligations, and the covenants contained in our debt agreements and documents governing such obligations could have a material adverse effect on our operations and financial condition. The size and terms of certain of our agreements limits our ability to obtain additional debt financing to fund future working capital, acquisitions, capital expenditures, engineering and product development costs, and other general corporate requirements. Other consequences for our operations could include:
|
•
|
making it more difficult for us to satisfy our obligations with respect to our other indebtedness, which could in turn result in an event of default on such other indebtedness;
|
|
•
|
impairing our ability to obtain additional financing in the future for working capital, capital expenditures, acquisitions, general corporate purposes or other purposes;
|
|
•
|
requiring us to dedicate a substantial portion of our cash flow from operations to debt service payments, thereby reducing the availability of cash for working capital, capital expenditures, acquisitions, general corporate purposes or other purposes;
|
|
•
|
limiting our flexibility in planning for, or reacting to, changes in our business and the industry in which we operate; and
|
|
•
|
placing us at a competitive disadvantage compared to our competitors that have proportionately less debt.
|
Our ability to make required payments of principal and interest on our debt and lease payments under our capital leases will depend on our future performance and the other cash requirements of our business. Our performance is subject to general economic, political, financial, competitive, and other factors that are beyond our control in addition to challenges that are unique to the Company. We cannot provide any assurance that our business will generate sufficient cash flow from operations or that future borrowings will be available in an amount sufficient to enable us to service our indebtedness and lease obligations.
Our debt and lease agreements contain certain restrictive covenants and customary events of default. These restrictive covenants limit our ability to take certain actions, such as, among other things: make restricted payments; incur additional debt and issue certain preferred stock; create liens; engage in mergers or consolidations or transfer all or substantially all of our assets; make certain dispositions and transfers of assets; place limitations on the ability of our restricted subsidiaries to make distributions; enter into transactions with affiliates; and guarantee indebtedness. One or more of these restrictive covenants may limit our ability to execute our preferred business strategy, take advantage of business opportunities, or react to changing industry conditions.
Upon an event of default, if not waived by our financing parties, our financing parties may declare all amounts outstanding as due and payable, which may cause cross-defaults under our other obligations. If our current financing parties accelerate the maturity of our indebtedness or obligations, we may not have sufficient capital available at that time to pay the amounts due to our financing parties on a timely basis, and there is no guarantee that we would be able to repay, refinance, or restructure the payments on such debt and lease obligations. Further, the financing parties would have the right to foreclose on certain of our assets, which could have a material adverse effect on our Company.
17
Our stock is a penny stock and trading of our stock may be restricted by the SEC’s penny stock regulations, which may limit a stockholder’s ability to buy and sell our stock.
Our stock is a penny stock. Rule 3a51-1 generally defines “penny stock” to be any equity security that has a market price (as defined) less than $5.00 per share or an exercise price of less than $5.00 per share, subject to certain exceptions. Our securities are covered by the penny stock rules, which impose additional sales practice requirements on broker-dealers that sell to persons other than established customers and “accredited investors.” The term “accredited investor” refers generally to institutions with assets in excess of $5,000,000 or individuals with a net worth in excess of $1,000,000 (excluding one’s primary residence) or annual income exceeding $200,000 individually or $300,000 jointly with their spouse. The penny stock rules (including Rule 15g-9) require a broker-dealer, prior to a transaction in a penny stock not otherwise exempt from the rules, to deliver a standardized risk disclosure document in a form prepared by the SEC, which provides information about penny stocks and the nature and level of risks in the penny stock market. The broker-dealer also must provide the customer with current bid and offer quotations for the penny stock, the compensation of the broker-dealer and its salesperson in the transaction, and monthly account statements showing the market value of each penny stock held in the customer’s account. The bid and offer quotations, and the broker-dealer and salesperson compensation information, must be given to the customer orally or in writing prior to effecting the transaction and must be given to the customer in writing before or with the customer’s confirmation. In addition, the penny stock rules require that, prior to a transaction in a penny stock not otherwise exempt from these rules, the broker-dealer must make a special written determination that the penny stock is a suitable investment for the purchaser and receive the purchaser’s written agreement to the transaction. These disclosure requirements may have the effect of reducing the level of trading activity in the secondary market for the stock that is subject to these penny stock rules. Consequently, these penny stock rules may affect the ability of broker-dealers to trade our securities. We believe that the penny stock rules discourage investor interest in and limit the marketability of our common stock. The Financial Industry Regulatory Authority (FINRA) sales practice requirements may also limit a stockbroker’s ability to buy or sell our stock.
In addition to the “penny stock” rules promulgated by the SEC, FINRA has adopted rules that require that in recommending an investment to a customer, a broker-dealer must have reasonable grounds for believing that the investment is suitable for that customer. Prior to recommending speculative low priced securities to their non-institutional customers, broker-dealers must make reasonable efforts to obtain information about the customer’s financial status, tax status, investment objectives, and other information. Under interpretation of these rules, FINRA believes that there is a high probability that speculative low priced securities will not be suitable for at least some customers. The FINRA requirements make it more difficult for broker-dealers to recommend that their customers buy our common stock, which may limit your ability to buy or sell our stock and have an adverse effect on the market for our shares.
If we are unable to maintain the listing standards of the NYSE MKT, our common stock may be delisted, which may have a material adverse effect on the liquidity and value of our common stock.
Our common stock is traded on the NYSE MKT. To maintain our listing on the NYSE MKT, we must meet certain financial and liquidity criteria. The market price of our common stock has been and may continue to be subject to significant fluctuation as a result of periodic variations in our revenues and results of operations. If we fail to meet any of the NYSE MKT’s listing standards, we may be delisted. In the event of delisting, trading of our common stock would most likely be conducted in the over the counter market on an electronic bulletin board established for unlisted securities, which could have a material adverse effect on the market liquidity and value of our common stock.
The price of the Company’s common stock may fluctuate significantly, which could negatively affect the Company and holders of its common stock.
The market price of the Company’s common stock may fluctuate significantly from time to time as a result of many factors, including:
|
•
|
investors’ perceptions of the Company and its prospects;
|
|
•
|
investors’ perceptions of the Company’s and/or the industry’s risk and return characteristics relative to other investment alternatives;
|
|
•
|
investors’ perceptions of the prospects of the mining and commodities markets;
|
|
•
|
difficulties between actual financial and operating results and those expected by investors and analysts;
|
|
•
|
our inability to obtain permits or otherwise fail to reach Company objectives;
|
|
•
|
changes in our capital structure;
|
|
•
|
trading volume fluctuations;
|
|
•
|
actual or anticipated fluctuations in quarterly financial and operational results;
|
|
•
|
volatility in the equity securities market; and
|
|
•
|
sales, or anticipated sales, of large blocks of the Company’s common stock.
|
18
If securities or industry analysts do not publish research or publish inaccurate or unfavorable research about our business, our stock price and trading volume could decline.
The trading market for our common stock will depend in part on the research and reports that securities or industry analysts publish about us or our business. We have relatively little research coverage by securities and industry analysts. If no additional industry analysts commence coverage of the Company, the trading price for our common stock could be negatively impacted. If one or more of the analysts who cover us downgrades our common stock or publishes inaccurate or unfavorable research about our business, our stock price would likely decline. If one or more of these analysts cease coverage of us or fail to publish reports on us regularly, demand for our common stock could decrease, which could cause our stock price and trading volume to decline.
We do not expect to pay any cash dividends for the foreseeable future.
We currently expect to retain all available funds and future earnings, if any, for use in the operation and growth of our business and do not anticipate paying any cash dividends in the foreseeable future. Any future determination to pay cash dividends will be at the discretion of our Board, subject to compliance with applicable law, our organizational documents and any contractual provisions, including under agreements for indebtedness we may incur, that restrict or limit our ability to pay dividends, and will depend upon, among other factors, our results of operations, financial condition, earnings, capital requirements and other factors that our Board deems relevant. Investors seeking cash dividends in the foreseeable future should not purchase our common stock.
The concentrated beneficial ownership of our common stock and the ability it affords to control our business may limit or eliminate other shareholders' ability to influence corporate affairs.
Based on filings made with the SEC, Mr. John V. Winfield, and entities that he controls (the “Winfield Group”) own
48,165,201
shares of the Company’s common stock and Van Den Berg Management, Inc. owns
30,189,136
shares of the Company’s common stock. Collectively, such shareholders own
78,354,337
shares, or approximately
41.8%
of the Company’s outstanding common stock as of
December 31, 2016
. Because of this concentrated stock ownership, the Company’s largest shareholders will be in a position to significantly influence the election of our board of directors and all other decisions on all matters requiring shareholder approval. As a result, the ability of other shareholders to determine the management and policies of the Company is significantly limited. The interests of these shareholders may differ from the interests of other shareholders with respect to the issuance of shares, business transactions with or sales to other companies, selection of officers and directors and other business decisions. This level of control may also have an adverse impact on the market value of our shares because our largest shareholders may institute or undertake transactions, policies or programs that may result in losses, may not take any steps to increase our visibility in the financial community and/or may sell sufficient numbers of shares to significantly decrease our price per share.
Restrictions imposed by the 2015 Stockholders' Agreement may inhibit growth.
The 2015 Stockholders’ Agreement limits the ability of the Company to incur debt, among other things. Such restrictions could significantly impact the Company’s ability to take certain actions that potentially could enhance shareholder value. Refer to Part III, Item 13 for more information about the Stockholder’s Agreement.
The terms of the Operating Agreement of Northern Comstock LLC require significant cash payments and may significantly dilute the ownership interests of the common stock.
The Operating Agreement of Northern Comstock LLC requires that the Company make monthly cash capital contributions of $30,000 to Northern Comstock LLC and annual capital contributions in the amount of $482,500 payable in common stock or cash, at the Company's option, unless the Company has cash and cash equivalents in excess of $10,500,000 on the date of such payments, wherein the Company would then be required to pay in cash. The number of shares to be delivered is calculated by dividing the amount of the capital contribution by the volume-weighted average closing price of the Company’s common stock on its primary trading market for the previous 20 consecutive trading days prior to such capital contribution. The Operating Agreement also provides for a one-time acceleration of $812,500 of the capital contributions payable when the Company receives net cash proceeds from sources other than operations that exceed $6,250,000. The agreement also includes an ongoing acceleration of the Company’s capital contribution obligations equal to 3% of the net smelter returns generated by the properties subject to the Northern Comstock LLC joint venture. The Operating Agreement also provides that if the Company defaults in its obligation to make the scheduled capital contributions, then the remaining capital contribution obligations may be converted into the principal amount of a 6% per annum promissory note payable by the
19
Company on the same schedule as the capital contributions, secured by a mortgage on the properties subject to the Northern Comstock LLC joint venture. The operating agreement requires that these capital contributions, totaling $9.75 million, commence in October 2015, and end in September 2027, unless prepaid by the Company.
The Company may issue additional common stock or other equity securities in the future that could dilute the ownership interest of existing stockholders.
The Company is currently authorized to issue 3,950,000,000 shares of common stock, of which
185,363,676
shares were issued and outstanding as of
December 31, 2016
, and 50,000,000 shares of preferred stock, of which
0
Preferred Shares are issued and outstanding as of the
December 31, 2016
. To maintain its capital at desired levels or to fund future growth, the Board may decide from time to time to issue additional shares of common stock, or securities convertible into, exchangeable for or representing rights to acquire shares of common stock. The sale of these securities may significantly dilute stockholders’ ownership interest and the market price of the common stock. New investors in other equity securities issued by the Company in the future may also have rights, preferences and privileges senior to the Company’s current stockholders that may adversely impact its current stockholders.
We have made and may in the future pursue investments in other companies, which could harm our operating results.
We have made, and could make in the future, investments in other companies, including privately-held companies in a development stage. Many of these private equity investments are inherently risky because the companies’ businesses may never develop, and we may incur losses related to these investments. In addition, we may be required to write down the carrying value of these investments to reflect other-than-temporary declines in their value, which could have a material adverse effect on our financial position and results of operations.
We may pursue acquisitions, divestitures, business combinations, joint ventures or other transactions with other companies, involving our properties or new properties, which could harm our operating results, may disrupt our business and could result in unanticipated accounting charges.
Acquisitions of other companies or new properties, divestitures, business combinations, joint ventures or other transactions with other companies may create additional, material risks for our business that could cause our results to differ materially and adversely from our expected or projected results. Such risk factors include the effects of possible disruption to the exploration activities and mine planning, loss of value associated with our properties, mismanagement of project development, additional risk and liability, indemnification obligations, sales of assets at unfavorable prices, poor execution of the strategic plan for the transaction, permit requirements, debt incurred or capital stock issued to enter into such transactions, the impact of any such transactions on our financial results, negative stakeholder reaction to any such transaction and our ability to successfully integrate an acquired company’s operations with our operations. If the purchase price of any acquired businesses exceeds the current fair values of the net tangible assets of such acquired businesses, we would be required to record material amounts of goodwill or other intangible assets, which could result in significant impairment and amortization expense in future periods. These charges, in addition to the results of operations of such acquired businesses and potential restructuring costs associated with an acquisition, could have a material adverse effect on our business, financial condition and results of operations. We cannot forecast the number, timing or size of future transactions, or the effect that any such transactions might have on our operating or financial results. Furthermore, potential transactions, whether or not consummated, will divert our management’s attention and may require considerable cash outlays at the expense of our existing operations. In addition, to complete future transactions, we may issue equity securities, incur debt, assume contingent liabilities or have amortization expenses and write-downs of acquired assets, which could adversely affect our profitability.
Diversity in application of accounting literature in the mining industry may impact our reported financial results.
The mining industry has limited industry-specific accounting literature and, as a result, we understand diversity in practice exists in the interpretation and application of accounting literature to mining-specific issues. As diversity in mining industry accounting is addressed, we may need to restate our reported results if the resulting interpretations differ from our current accounting practices. See Note 2 to the Consolidated Financial Statements for a summary of our significant accounting policies.
20
Comstock Mine Project
Location, Access, and Title to the Property
The Comstock Mine Project is located in Storey and Lyon Counties, Nevada. The property is physically situated just south of Virginia City, Nevada. Paved state routes from Reno, Carson City, and Virginia City provide access to the property. The Comstock Mine Project has been the focus of our efforts since 2007, and has been the subject of four National Instrument 43-101 (NI 43-101) technical reports published in May and August 2010, November 2011 and January 2013.
Our property rights to the mineral estate of the Comstock Mine Project consist of five mineral leases, one joint venture (providing exclusive rights to exploration, development, mining and production), and fee ownership of real property and mining claims administered by the BLM. This project has
110
patented and
366
unpatented mineral lode claims, as well as
25
unpatented placer claims. The Comstock Mine Project holdings consist of approximately
8,631
acres of mining claims and parcels. The acreage is comprised of approximately
2,266
acres of patented claims (private lands), surface parcels (private lands), and approximately
6,365
acres of unpatented mining claims that the BLM administers.
21
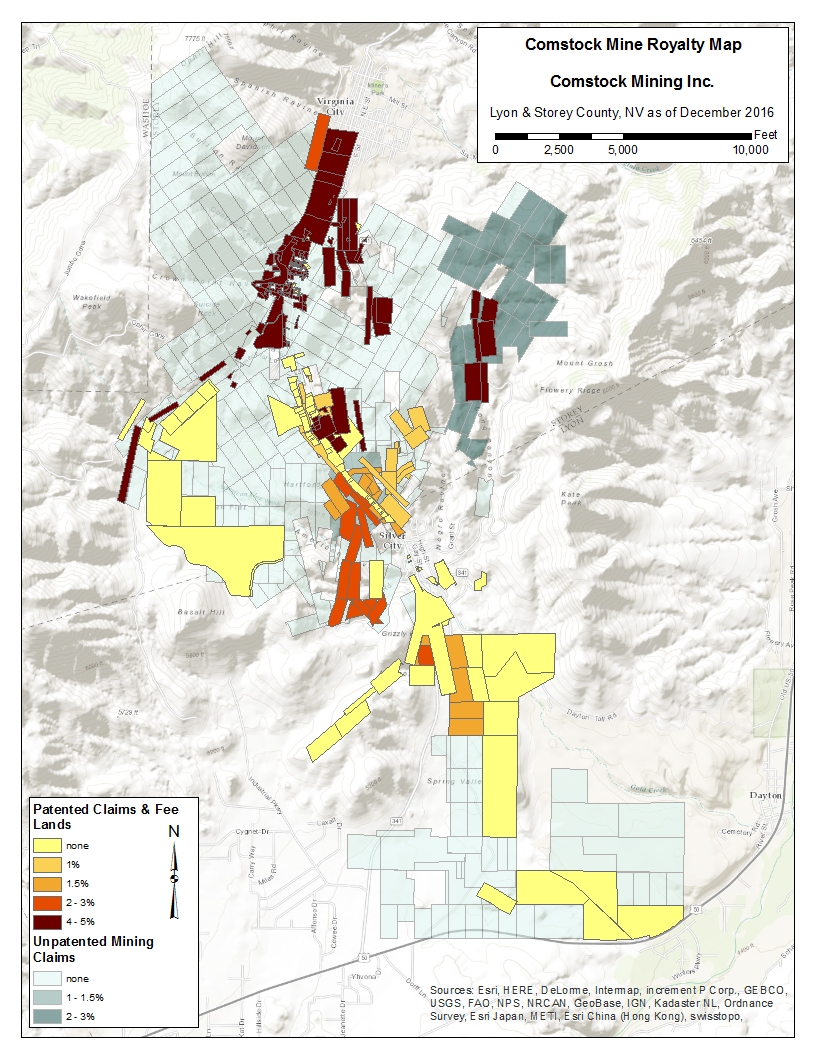
Figure-1 Comstock Mining’s Net Smelter Royalty, Patented and Unpatented Mining Claims in Storey and Lyon Counties, Nevada
22
The Comstock Mine Project mineral leases are as follows:
Fred Garrett - Lease
On April 1, 2008, we entered into a mineral exploration and mining lease agreement with Fred Garrett et al, covering one patented claim located in Storey County, Nevada. The lease remains in effect as long as exploration, development, mining, or processing operations are being conducted on a continuous basis, without a lapse of activity for more than 180 days. We pay a royalty to the lessor of $250 per month or a 3% net smelter royalty (“NSR”), whichever is greater. We are responsible for the payment and filing of annual maintenance fees, if any, and taxes for these claims.
James Obester Lease
On August 1, 2008, we entered into a mineral exploration and mining lease agreement with James Obester, covering ten unpatented claims located in Storey County. The lease remains in effect as long as exploration, development, mining, or processing operations are conducted on a continuous basis, without a lapse of activity of more than 180 days. We pay a royalty to the lessor amounting to $200 per month for the first two years and later increasing to $300 per month for the following three years, and then increasing to $500 per month thereafter. In addition, a NSR royalty percentage is applicable. The royalty percentage is a 2% NSR when the market price of gold is $900 or less per ounce and 3% NSR when gold is greater than $900 per ounce. We are also responsible for payment and filing of annual maintenance fees, if any, and taxes for these claims.
Railroad & Gold - Lease
On October 1, 2009, we entered into a mineral exploration and mining lease agreement with Railroad and Gold, LLC covering nine patented mining claims and sixteen unpatented mining claims in Storey County. The lease also includes rights for nine town lots and a rural parcel in American Flats. The lease is for an initial term of 15 years, but remains in effect for as long as exploration, development, mining, or processing operations are conducted on a continuous basis. We made an initial payment of $25,000 for the lease. The Company makes annual advance minimum royalty payments, which started with $30,000 on the first anniversary, and increasing by $5,000 each year. We are also required to pay a 4% NSR, which will be reduced by the sum of previously paid advance minimum royalties. We are also responsible for payment and filing of annual maintenance fees, if any, and taxes for these claims. Effective January 1, 2016, the royalty was reduced to 1% NSR in exchange for 24 monthly payments of $2,083. Additionally, starting January 1, 2016, the annual payment on the lease was reduced for 2016 to $18,000 per year and $20,400 per year in 2017 and 2018.
New Daney - Lease
On June 2, 2010, we entered into a mineral exploration and mining lease agreement with New Daney Company, Inc. covering seven unpatented lode claims. These claims are located in Lyon County and are contiguous with the Company’s Spring Valley mineral holdings. All production from the property is subject to a 3% NSR. Once permits have been obtained to put the property into production, lease payments will be treated as advance royalties, which will be credited against the NSR. The Company makes advance minimum royalty payments of $200 per month. The lease is for an initial term of five years. We have the option, if we believe the property warrants further development, to extend an additional five years and then continuously thereafter as long as exploration, development, mining, or processing operations are conducted on a continuous basis.
Renegade Mineral Holdings - Lease
On October 14, 2010, we acquired twenty-six unpatented lode-mining claims along the southern extension of the Occidental Lode structure in Storey County, Nevada. The historic Occidental Lode, also referred to as the Brunswick Lode, is located 1.5 miles due east of and sub-parallel to the veins of the main Comstock Lode. These claims adjoined and extended the Company’s previous holdings of six patented and six unpatented claims, significantly expanding the Company’s position on the Occidental Lode. The Lease has an initial term of three years and, in the event we determine that exploration results warrant further development, then the term can be extended initially for two additional six-year terms and then continuously thereafter as long as the Company is producing on property adjacent to or in the vicinity of these claims. The agreement includes a 3% NSR from production with the gold price capped at $2,000 per ounce. We are also responsible for payment and filing of annual maintenance fees, if any, and taxes for these claims.
23
Northern Comstock LLC
On October 20, 2010, the Company entered into an operating agreement (the “Operating Agreement”) to form Northern Comstock LLC (“Northern Comstock”) with Mr. Winfield, our largest shareholder, and an entity controlled by Mr. Winfield, DWC Resources, Inc. (“DWC”). As part of the Operating Agreement, the Company obtained rights relating to certain property formerly owned by DWC in Storey County, Nevada (the “DWC Property”) and two groups of properties leased by Mr. Winfield in Storey County, Nevada from the Sutro Tunnel Company (the “Sutro Property”) and Virginia City Ventures (the “VCV Property”).
Pursuant to the terms of the Operating Agreement for Northern Comstock, DWC contributed the DWC Property to Northern Comstock and John Winfield contributed his rights under the Sutro Property and the VCV Property to Northern Comstock. The Company contributed 862.5 shares of Series A-1 Preferred Stock in each annual period from 2010 to 2013, and contributes its services in the area of mine exploration, development and production to Northern Comstock. The terms of the Operating Agreement provided that on each anniversary of the Operating Agreement, up to and including the thirty-ninth (39
th
) anniversary, the Company would make additional capital contributions in the amount of $862,500, in the form of Series A-1 Preferred Stock or cash (upon request of Northern Comstock, which request for cash can be denied by the Company in certain circumstances).
On August 27, 2015 the Company signed an amendment related to the restructuring of its Joint Venture agreement with Northern Comstock LLC. The Amendments resulted in reduced capital contribution obligations of the Company from $31.05 million down to $9.75 million. The Operating Agreement of Northern Comstock LLC requires that the Company make monthly cash capital contributions of $30,000 to Northern Comstock LLC and annual capital contributions in the amount of $482,500 payable in stock or cash, at the Company's option, unless the Company has cash and cash equivalents in excess of $10,500,000 on the date of such payments, wherein the Company would then be required to pay in cash. The number of shares to be delivered is calculated by dividing the amount of the capital contribution by the volume-weighted average closing price of the Company’s common stock on its primary trading market for the previous 20 consecutive trading days prior to such capital contribution. The Operating Agreement also provides for a one-time acceleration of $812,500 of the capital contributions payable when the Company receives net cash proceeds from sources other than operations that exceed $6,250,000. The agreement also includes an ongoing acceleration of the Company’s capital contribution obligations equal to 3% of the net smelter returns generated by the properties subject to the Northern Comstock LLC joint venture. The Operating Agreement also provides that if the Company defaults in its obligation to make the scheduled capital contributions, then the remaining capital contribution obligations may be converted into the principal amount of a 6% per annum promissory note payable by the Company on the same schedule as the capital contributions, secured by a mortgage on the properties subject to the Northern Comstock LLC joint venture. The operating agreement requires that these capital contributions commence in October 2015, and end in September 2027, unless prepaid by the Company.
The Operating Agreement provides the Company with the exclusive rights of development, production, mining and exploration on the respective properties and requires the Company to make certain expenditures toward that end. Under the terms of the Operating Agreement, all cash flows from the bullion or other minerals recovered from the ore mined out of the ground but untreated and minerals produced from the milling or reduction of ore to a higher grade produced from the DWC Property, Sutro Property or VCV Property, as applicable, or finished products produced from any such property, will be distributed to the Company after the payment of royalties associated with such properties.
Mineral production from the DWC Property is subject to a 1% NSR payable to Mr. Art Wilson.
Mineral production on the Sutro Property is subject to a royalty of 5% NSR payable to the Sutro Tunnel Company on all production from the Sutro Property. Mineral production from the VCV Property is subject to a 5% NSR. The Company makes advance minimum royalty payments of $1,000 per month on the Sutro Property and $6,000 per year on the VCV Property leases. Each lease is for an initial term of five years. We have the option, if we believe the property warrants further development, to extend an additional five years and then continuously thereafter as long as exploration, development, mining, or processing operations are conducted on a continuous basis.
The Como Project
The Como Project is located in Lyon County, Nevada, approximately 15 miles east of Carson City. The Company performed geological reconnaissance on this property, but has not drilled or collected any samples. We own a 100% interest in eight unpatented lode-mining claims, covering an area of approximately 168 acres in Lyon County, Nevada, that comprise the Como Project.
24
Facilities Area
The heap leach facility and former Company headquarters originally occupied a 40-acre site in Storey County, Nevada, at 1200 American Flat Road, approximately three miles south of Virginia City and 30 miles southeast of Reno, Nevada. The property was included in the acquisition of Plum Mining by the Company in November 2003. The site has expanded, through land acquisitions, to 400 acres. The Company’s headquarters is at our Corporate Campus at 117, 119 and 123 American Flat Road in Gold Hill, Nevada, covering a 5-acre parcel. Our mining and reclamation operations have taken place over a nearly 100-acre area.
Present Condition of Property and Work Performed
We have completed extensive geological mapping, sampling, and drilling on a portion of the Comstock Mine Project property, in order to characterize the mineralized material. We have performed metallurgical testing, mine planning, and economic analysis, and have produced internal reports of our mineralized material inventory. However, we have not established reserves that meet the requirements of SEC Industry Guide 7. Therefore, any activities that we perform on our lands and claims are considered exploratory in nature, including test mining.
Geology, Structure and Mineralization
Gold and silver mineralization in the Lucerne Resource area is highly dependent on geologic attributes including but not limited to: multiple episodes of mineralization; numerous fault structures of varying orientations that acted as fluid conduits for precious metal transport; and amenable host rocks for deposition of economic concentrations of precious metals. The primary host rocks for the current Comstock resource areas are early Miocene age volcanic rocks, primarily andesitic to rhyolite volcanic flows, domes and intrusive rocks.
Mineralization in the Lucerne Resource area is located in the historic mine sites of the Lucerne open-cut, Silver Hill, Hartford and Billie the Kid. The mentioned historic mines extracted precious metals from mining veins developed within the northwest striking Silver City fault zone. Detailed studies by our geologic staff have identified within the Silver City fault zone four definitive sub-parallel northwest striking mineralized structures. The spacing between each of these structures is approximately 100 to 150 feet.
Our geologists have also identified structurally complex zones developed within the Silver City fault zone that have enhanced precious metals grade of contiguous mineralization averaging 0.10 gold ounce per ton for 200 feet. The structural complexity is explained by cross-cutting east-west and northeast striking mineralized structures intersecting with the northwesterly striking assembly of Silver City fault zone structures.
During 2014, 2015 and 2016, the mineralized material extracted from the Lucerne Resource area and historical dumps progressively increased in silver content. In early 2014, the silver to gold ratio was approximately 10:1. As the open cut developed the northern Justice portion of the Lucerne and deepened down-dip along the Silver City fault zone, the silver to gold ratio increased. The 2014 weighted average of silver to gold ratio was 17.5:1. During 2015 the weighted average silver to gold ratio was
18.5
:1. This compares to historic ratios of silver to gold of as high as 100:1 located in the northern Comstock District. Currently, exploration drilling has identified gold and silver mineralization over a strike distance of nearly one mile, with definition and in-fill drilling on 50 to 100 foot centers over almost one mile. Mineralization is open-ended to the north and south along strike and down-dip to the east, including the Chute Zone in the eastern portion of the Lucerne Resource area.
Future Exploration Potential
The Comstock Mining district is a well-known, historic mining district, with over 150 years of production-based history. For several years we have accumulated a vast collection of historic reports and maps on properties in the district. The data collection has been transformed into digital files with two-dimensional and three-dimensional presentation capabilities. Our exploration efforts in the past have been focused primarily upon the Lucerne and Dayton resource areas. We have conducted detailed geologic exploration and resource modeling on less than 10% of our approximate
8,631
-acre land position. Going forward the Company will continue conduct ongoing exploration and development programs in the Lucerne and Dayton resource areas and expand the exploration to underground mineral targets. This will include but not be limited to: further compilation and review of historic surface and sub-surface geology, geochemical and geophysical investigations and drilling.
The Company plans to conduct definition drilling and geotechnical core programs within the Dayton Resource area. The Dayton southern expansion program includes exploration and definition drilling of targets identified by the conventional percussion drill program, magnetic, IP and resistivity geophysical surveys.
25
The Company plans to advance the Dayton Resource area to full feasibility, with a production ready mine plan within the next two years. The volcanic host rocks and structural controls of the mineralization defined to date for the Dayton Resource area are projected south into Spring Valley (SV). Economic gold mineralization has been intercepted in several wide spaced drill holes conducted during numerous prior Spring Valley drilling programs. Over the past several months, the technical staff has identified multiple drill targets within several specific locations that encompass the Dayton Resource area and Spring Valley. The new targets are based on the Company's latest review of previous geophysical studies and current interpretation of the geology. Reference to the Company's quarterly activity, the Company's long term plan is to further develop the Lucerne and Dayton Spring valley complexes, while advancing plans for exploring the remaining historic mining areas, which include: the Gold Hill Group (Northern Extension and Northern Targets areas) and the Occidental Group.
The geologic and engineering team completed underground mapping, sampling, and surveying in a number of historic mine tunnels on and near the Dayton Resource area. Several historic mines operated in the Dayton area, leaving access to multiple structures from underground. Some historic adits have remained open or have been uncovered by the Company. Where accessible, the workings were inspected; geology mapped and mineralized material sampled. Once sampling was completed, the workings were surveyed to document the size of the mine workings, the location of the openings and location of the samples. The samples were then assayed at the Company’s in house metallurgical laboratory for gold and silver.
This underground sampling program has provided a wealth of assay information and provided critical information for furthering the geologic understanding of the Dayton. In some cases structures identified on the surface were traced underground and in other cases new structures were identified underground were surface expressions were absent or obscured. To facilitate one of the long lead items required to bring a project into production is baseline hydrologic data.
Dayton Hydrologic Study
A Reverse Circulation (RC) drill program was designed to support the Water Pollution Control Permit application. The initial program would require fourteen drill sites to evaluate the hydrological regime of the mine location and an additional five drill holes for the process facility.
The RC drilling would identify water levels and flow direction throughout the Dayton Project's hydrologic regime by testing multiple inner structurally bounded hydraulic cells. The measured static water levels, rate of flow and direction would be added to the mine model with respect to economic mineralization, proposed design mining depths and provide the initial mine water management requirements.
Several specific drill holes will provide multiple engineering attributes of the hydrologic and rock properties, including the potential of identifying additional economic resources. The completion of the RC drill holes will be used to position surgical core holes for geo-technical and metallurgical properties, acid/base accountability of waste rock and work indices of mineralized material.
A minimum of six RC drill holes will have three vibrating piezometers cemented down hole. One piezometer located within the top of the static water level. Another piezometer positioned mid-range within the water column and the third piezometer located at the contact of the Miocene volcanic rocks and the Paleozoic basement rocks. The data collected from the placement of the piezometers will be used to better position monitor well locations.
Spring Valley
Spring Valley is located south of the Dayton Resource area and south of State Route 341. Ground magnetic geophysical surveys identified a linear anomalous corridor, defined by a series of relative magnetic lows. Altered volcanic host rocks have been intercepted by limited drilling and identified several mineralized zones. Selected drill hole intercepts are highlighted (see Figure 7 in the Exploration section of the Management Discussion and Analysis). The exploration of Spring Valley will include phased drilling programs that will continue southerly from SR341 to the historic Daney mine site (see Figure 1 in the Exploration section of the Management Discussion and Analysis), with a total a strike length of approximately 8,000 feet.
26
Gold Hill Group
The northern Comstock underground targets of the Gold Hill Group will be prioritized and exploration proposals will follow. Several locations in the Gold Hill Group have been selected for a focused underground development evaluation. The historic mining record of the area has multiple accounts of mining activity and production prematurely halted. The reasons for halting the mining activity may have been litigation, unfavorable rock conditions and economic mineralization crossing claim boundaries owned by other mining companies of the time. The Company now has an opportunity to explore the mineral potential of this area more cost effectively by utilizing knowledge gained from the review of the historic records.
Occidental Group
The Occidental vein (a sub parallel vein system to the Comstock) is considered by the Company to be underexplored and recognized potentially as a significant exploration target, with historic, high grade ( > 0.3 optAu) production mined near surface in localized pods. The Occidental vein system, spanning patented and unpatented claims, consolidated as a group, has a measured strike length of over 7,600 feet, on land controlled by the Company. Detailed geologic assessment and mapping is ongoing to best define future drilling and development plans of this exploration target.
The Company’s mining and exploration activities are subject to various laws and regulations governing the protection of the environment. These laws and regulations are continually changing and are generally becoming more restrictive. The Company believes its operations are in compliance with applicable laws and regulations in all material respects. The Company has made, and expects to make in the future, expenditures to comply with such laws and regulations, but cannot predict the full amount of such future expenditures.
On January 31, 2014, the Comstock Residents Association (the “CRA”) and two of its members filed a civil action in the Third Judicial District Court of the State of Nevada in and for Lyon County (the “District Court”) against the Lyon County Board of Commissioners (the “Commissioners”) and the Company, asking the Court to reverse the Commissioners’ decision to grant an application for master plan amendment and zone change submitted and approved by the Commissioners on January 2, 2014 (the “Application”).
Prior to the approval of the Application, the master plan designation and zoning precluded mining on certain property of the Company in the area of Silver City, Lyon County. In April 2015, the District Court ruled in favor the Company and the Commissioners. The written Order Denying Petition for Judicial Review was filed and mailed to all parties on June 15, 2015. On July 14, 2015, the CRA and one individual (together “Appellants”) filed a Notice of Appeal of the Court Order, appealing the decision to the Nevada Supreme Court. On December 9, 2015, Appellants filed their Opening Brief in the Nevada Supreme Court, generally repeating the arguments that were made at the District Court. On January 15, 2016, the Company and the Commissioners jointly filed an Answering Brief. Briefing in the Nevada Supreme Court was completed with the Appellants’ filing of a Reply Brief on March 3, 2016. An oral argument before a three judge panel of the Nevada Supreme Court took place on September 14, 2016.
On December 2, 2016, the Nevada Supreme Court entered an order affirming all three of the District Court’s decisions associated with 1) the Commissioners’ discretion and authority for changing master plans and zoning, 2) their compliance with Nevada’s Open Meeting Law and 3) their compliance with Nevada statutory provisions. Specifically, the Supreme Court affirmed the District Court’s conclusions that Lyon County did not abuse its discretion and that it acted with substantial evidence in support of their decision, that the County did not violate Nevada’s Open Meeting Law and that the County did not violate statutory provisions regarding master plans.
The Supreme Court did reverse the District Court’s dismissal of CRA’s claim of a due process violation, concluding that this claim should not have been summarily dismissed and that further proceedings are necessary in the District Court on this single claim. This remaining issue is now back before the District Court in Lyon County for further proceedings. The Company and the Lyon County District Attorney are encouraged by the Supreme Court’s decision and look forward to a positive resolution of the sole remaining issue.
Refer to the relevant portions of Note 18 of the Financial Section of this report for additional information on legal proceedings.
27
From time to time, we are involved in lawsuits, claims, investigations and proceedings that arise in the ordinary course of business. We maintain insurance to mitigate losses related to certain risks. There are no matters pending or threatened that we expect to have a material adverse impact on our business, results of operations, financial condition or cash flow.
Under Section 1503(a) of the Dodd-Frank Wall Street and Consumer Protection Act, mine operations are required to include in their periodic reports filed with the SEC certain information concerning mine safety violations and other regulatory matters. The required information is included in Exhibit 95 to this report.
28
Item 5.
Market for Registrant’s Common Equity, Related Stockholder Matters and Issuer Purchases of Equity Securities
Price Range of Common Stock
Our common stock is traded on the NYSE MKT exchange under the symbol “LODE.” The following table sets forth the quarterly high and low sales prices of our common stock for the periods set forth below:
|
Quarterly Period
|
High
|
Low
|
|||||
|
2016
|
|||||||
|
Fourth Quarter
|
$
|
0.36
|
|
$
|
0.20
|
|
|
|
Third Quarter
|
$
|
0.46
|
|
$
|
0.35
|
|
|
|
Second Quarter
|
$
|
0.48
|
|
$
|
0.33
|
|
|
|
First Quarter
|
$
|
0.60
|
|
$
|
0.37
|
|
|
|
2015
|
|
|
|
|
|||
|
Fourth Quarter
|
$
|
0.65
|
|
$
|
0.36
|
|
|
|
Third Quarter
|
$
|
0.70
|
|
$
|
0.38
|
|
|
|
Second Quarter
|
$
|
0.83
|
|
$
|
0.53
|
|
|
|
First Quarter
|
$
|
1.11
|
|
$
|
0.60
|
|
|
The last reported sale price of our common stock on the NYSE MKT on
March 6, 2017
, was $0.23 per share. As of
March 6, 2017
, the number of holders of record was approximately 518.
Performance Graph
The following information is not deemed to be “soliciting material” or to be “filed” with the SEC or subject to Regulation 14A or 14C under the Exchange Act or to the liabilities of Section 18 of the Exchange Act, and will not be deemed to be incorporated by reference into any filing under the Exchange Act or the Securities Act of 1933, as amended (the “Securities Act”), except to the extent we specifically incorporate it by reference into such filing.
The following graph compares our cumulative total stockholder return from December 31, 2011 with those of the NYSE MKT Composite Index and the Market Vectors Gold Miners Index. The graph assumes that U.S. $100 was invested on December 31, 2011 in (1) our common stock, (2) the NYSE MKT Composite Index and (3) the Market Vectors Gold Miners Index. The measurement points utilized in the graph consist of the last trading day in each calendar year, which closely approximates the last day of our respective fiscal year. The historical stock performance presented below is not intended to and may not be indicative of future stock performance.
Comparison of 5-Year Cumulative Total Return
among Comstock Mining, the NYSE MKT Composite Index
and the Market Vectors Gold Miners Index.
29
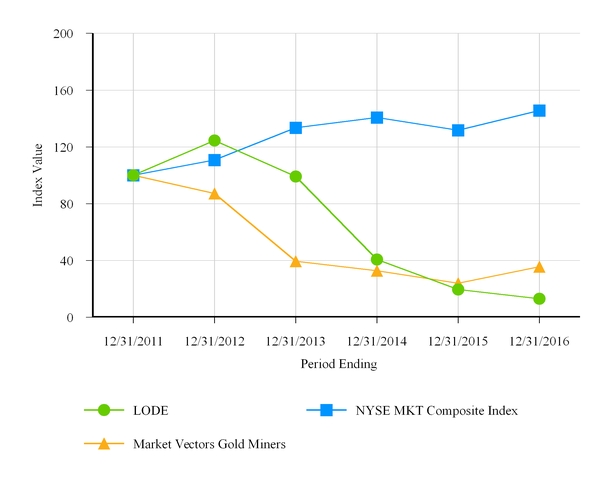
|
12/31/2011
|
|
12/31/2012
|
|
12/31/2013
|
|
12/31/2014
|
|
12/31/2015
|
|
12/31/2016
|
|
||||||
|
LODE
|
100.00
|
|
124.59
|
|
99.11
|
|
40.71
|
|
19.62
|
|
13.08
|
|
|||||
|
NYSE MKT Composite Index
|
100.00
|
|
110.74
|
|
133.43
|
|
140.64
|
|
131.72
|
|
145.61
|
|
|||||
|
Market Vectors Gold Miners
|
100.00
|
|
87.13
|
|
39.46
|
|
32.84
|
|
23.99
|
|
35.62
|
|
|||||
Equity Compensation Plan Information
See
Equity Compensation Plan Information
under
Item 11. Executive Compensation
and also below for information on plans approved by our stockholders.
Dividend Policy
We have never declared or paid any dividends on our common stock. We do not anticipate paying any cash dividends on our common stock in the foreseeable future. We currently intend to retain future earnings, if any, to finance operations and the expansion of our business. Any future determination to pay cash dividends will be at the discretion of the board of directors and will depend upon our financial condition, operating results, capital requirements and other factors the board of directors deems relevant.
30
|
|
YEARS ENDED DECEMBER 31,
|
||||||||||||||||||
|
|
2016
|
2015
|
2014
|
2013
|
2012
|
||||||||||||||
|
REVENUES
|
|
|
|
|
|
|
|
|
|||||||||||
|
Revenue - Mining
|
$
|
4,944,627
|
|
$
|
18,245,633
|
|
$
|
24,736,929
|
|
$
|
24,103,013
|
|
$
|
4,504,457
|
|
||||
|
Revenue - Real estate
|
125,590
|
|
247,217
|
|
846,432
|
|
723,574
|
|
634,159
|
|
|||||||||
|
Total revenues
|
5,070,217
|
|
18,492,850
|
|
25,583,361
|
|
24,826,587
|
|
5,138,616
|
|
|||||||||
|
COST AND EXPENSES
|
|
|
|
|
|
|
|
|
|||||||||||
|
Costs applicable to mining revenue
|
4,505,811
|
|
10,652,372
|
|
19,126,632
|
|
26,495,665
|
|
3,554,727
|
|
|||||||||
|
Real estate operating costs
|
182,423
|
|
342,634
|
|
1,260,972
|
|
1,117,225
|
|
928,897
|
|
|||||||||
|
Exploration and mine development
|
4,561,905
|
|
6,958,636
|
|
2,658,473
|
|
3,012,790
|
|
11,901,250
|
|
|||||||||
|
Mine claims and costs
|
1,125,989
|
|
1,299,823
|
|
2,393,722
|
|
2,596,650
|
|
2,668,345
|
|
|||||||||
|
Environmental and reclamation
|
1,309,901
|
|
2,054,447
|
|
2,464,314
|
|
2,895,552
|
|
3,735,708
|
|
|||||||||
|
Land and road development
|
79,461
|
|
2,857,720
|
|
—
|
|
—
|
|
—
|
|
|||||||||
|
General and administrative
|
3,518,071
|
|
6,752,731
|
|
6,371,954
|
|
9,641,507
|
|
12,669,323
|
|
|||||||||
|
Total cost and expenses
|
15,283,561
|
|
30,918,363
|
|
34,276,067
|
|
45,759,389
|
|
35,458,250
|
|
|||||||||
|
LOSS FROM OPERATIONS
|
(10,213,344
|
)
|
(12,425,513
|
)
|
(8,692,706
|
)
|
(20,932,802
|
)
|
(30,319,634
|
)
|
|||||||||
|
Total other income (expense), net
|
(2,751,360
|
)
|
1,971,086
|
|
(946,067
|
)
|
(414,218
|
)
|
(442,639
|
)
|
|||||||||
|
LOSS BEFORE INCOME TAXES
|
(12,964,704
|
)
|
(10,454,427
|
)
|
(9,638,773
|
)
|
(21,347,020
|
)
|
(30,762,273
|
)
|
|||||||||
|
INCOME TAX BENEFIT
|
—
|
|
—
|
|
—
|
|
—
|
|
—
|
|
|||||||||
|
NET LOSS
|
(12,964,704
|
)
|
(10,454,427
|
)
|
(9,638,773
|
)
|
(21,347,020
|
)
|
(30,762,273
|
)
|
|||||||||
|
DIVIDENDS ON CONVERTIBLE PREFERRED STOCK
|
—
|
|
(5,452,445
|
)
|
(3,672,785
|
)
|
(4,016,705
|
)
|
(4,370,247
|
)
|
|||||||||
|
NET LOSS AVAILABLE TO COMMON SHAREHOLDERS
|
$
|
(12,964,704
|
)
|
$
|
(15,906,872
|
)
|
$
|
(13,311,558
|
)
|
$
|
(25,363,725
|
)
|
$
|
(35,132,520
|
)
|
||||
|
Net loss per common share – basic
|
$
|
(0.07
|
)
|
$
|
(0.14
|
)
|
$
|
(0.17
|
)
|
$
|
(0.42
|
)
|
$
|
(0.87
|
)
|
||||
|
Net loss per common share – diluted
|
$
|
(0.07
|
)
|
$
|
(0.14
|
)
|
$
|
(0.17
|
)
|
$
|
(0.42
|
)
|
$
|
(0.87
|
)
|
||||
|
Total assets
|
$
|
33,843,031
|
|
$
|
43,212,891
|
|
$
|
46,455,872
|
|
$
|
43,999,996
|
|
$
|
47,864,545
|
|
||||
|
Long-term debt and capital lease obligations, including current portion
|
9,470,295
|
|
13,297,549
|
|
11,598,483
|
|
7,907,474
|
|
13,731,655
|
|
|||||||||
|
Total stockholders
’
equity
|
14,416,589
|
|
18,759,470
|
|
22,241,100
|
|
20,243,748
|
|
18,394,562
|
|
|||||||||
31
Item 7.
Management’s Discussion and Analysis of Financial Condition and Results of Operations
The following discussion provides information that we believe is relevant to an assessment and understanding of the consolidated results of operations and financial condition of the Company as of and for the year ended
December 31, 2016
, as well as our future results. It should be read in conjunction with the consolidated financial statements and accompanying notes also included in this Form 10-K.
Overview
The Company is a Nevada-based, gold and silver mining exploration, development and production company with extensive, contiguous property in the historic Comstock and Silver City mining districts (collectively, the “Comstock District”). The Comstock District is located within the western portion of the Basin and Range Province of Nevada, between Reno and Carson City. The Company began acquiring properties and developing projects in the Comstock District in 2003. Since then, the Company has consolidated a substantial portion of the historic Comstock District, secured permits, built an infrastructure and brought exploration projects into production.
The Company’s headquarters, mine operations and heap leach processing facility are in Storey County, Nevada, at 1200 American Flat Road, approximately three miles south of Virginia City, Nevada and 30 miles southeast of Reno, Nevada. Our Lucerne Resource area is located in Storey County, Nevada, approximately three miles south of Virginia City. Our Dayton Resource area is located in Lyon County, Nevada, approximately six miles south of Virginia City. Access to the properties is by State Route 342, a paved route.
Because of the Comstock District’s historical significance, the geology is well known and has been extensively studied by us, our advisors and many independent researchers. We have expanded our understanding of the geology of the project area through vigorous surface mapping and drill hole logging. The volume of geologic data is immense, and thus far the reliability has been excellent, particularly in the various Lucerne Mine areas. We have amassed a large library of historic data and detailed surface mapping of Comstock District properties and continue to obtain historic information from private and public sources. We use such data in conjunction with information obtained from our current operations, to target geological prospective exploration areas and plan exploratory drilling programs, including expanded surface and underground drilling.
The Company continues evaluating and acquiring properties inside and outside the district expanding its footprint and exploring all of our existing and prospective opportunities for further exploration, development and mining. The near-term goal of our business plan is to maximize intrinsic stockholder value realized, per share, by continuing to acquire mineralized and potentially mineralized properties, exploring, developing and validating qualified resources and reserves (proven and probable) that enable the commercial development of our operations through extended, long-lived mine plans that are economically feasible and socially responsible, including both the Lucerne and Dayton Mine plans, with both surface and underground development opportunities. We also plan to develop longer-term exploration plans for the remaining areas, which include the Spring Valley, Occidental, Northern Extension and Northern Targets areas, subsequent to and in some cases concurrent with the exploration and development of Lucerne and Dayton.
The Company achieved initial production and held its first pour of gold and silver on September 29, 2012. The Company produced approximately
18,455
and
5,099
gold equivalent ounces in 2015 and 2016, respectively. That is, the Company produced
15,451
ounces of gold and
221,723
ounces of silver in 2015, and
4,086
ounces of gold and
75,657
ounces of silver in 2016. Grade remained at
0.025
ounces of gold per ton and
0.436
ounces of silver per ton. The Company achieved recovery rate of
88.5%
for gold and
59.5%
for silver.
We continue expanding our property footprint and creating opportunities for further exploration, development and mining. The Company now owns or controls approximately
8,631
acres of mining claims and parcels in the Comstock and Silver City Districts. The acreage is comprised of approximately
2,266
acres of patented claims (private lands), surface parcels (private lands), and approximately
6,365
acres of unpatented mining claims, which the “BLM” administers.
Our Team
We believe we have exceptional mine engineering, geological, metallurgical, regulatory, environmental, financial and operating competencies on our management team. As of
December 31, 2016
, we have
10
full-time employees and 2 part-time employees. In addition, we have strengthened our system through agreements and relationships with certain key partners.
32
Corrado De Gasperis
has been President and CEO of the Company since April 2010, and appointed to the Board of Directors in June 2011. In September, 2015, Mr. De Gasperis also assumed the role of Executive Chairman of the Board. He brings over 30 years of industrial metals and mining manufacturing, operational and financial management, and capital markets experience. Previously, he served as the Chief Executive Officer of Barzel Industries Inc. (formerly Novamerican Steel Inc.) from April 2006 through September 2009. Barzel operated a network of 15 manufacturing, processing and distribution facilities in the United States and Canada that offered a wide range of metal solutions to a variety of industries, including construction, infrastructure development and mining. From 2001 to 2005, he served as Chief Financial Officer of GrafTech International Ltd., a global manufacturer of industrial graphite and carbon-based materials, in addition to his duties as Vice President and Chief Information Officer, which he assumed in 2000. He served as Controller of GrafTech from 1998 to 2000. From 1987 to 1998, Mr. De Gasperis was a certified public accountant with KPMG LLP. As a Senior Assurance Manager in the Manufacturing, Retail and Distribution Practice, he served major clients like General Electric and Union Carbide Corporation. KPMG announced his admittance, as a Partner, effective July 1, 1998.
Mr. De Gasperis holds a BBA from the Ancell School of Business at Western Connecticut State University, with honors. Mr. De Gasperis is also a founding member and the Chairman of the Board of Directors of the Comstock Foundation for History and Culture, a Director of Comstock Real Estate, Inc. (formerly Gold Hill Hotel, Inc.), and a Director of Nevada Works, furthering Northern Nevada’s economic development plans. He is also a Member of the NYSE Markets Advisory Committee, the Northern Nevada Development Authority, and the Northern Nevada Network.
Judd B. Merrill
became Chief Financial Officer of the Company in January 2015, and had been our Chief Accounting Officer since 2014, and our Controller since 2011. Mr. Merrill brings strong mining-based financial and capital resource planning, treasury and cash management experience in addition to his broader financial accounting, reporting and internal control experience, having worked as Controller of Fronteer Gold Inc. and Assistant Controller at Newmont Mining Corp., both in Nevada. He also worked for Meridian Gold Company and Deloitte & Touche LLP.
Mr. Merrill holds a Bachelor of Science in Accounting from Central Washington University and a Masters of Business Administration from the University of Nevada, Reno and is a Certified Public Accountant.
Laurence G. Martin
has been the Director of Exploration & Mineral Development since 2010, and Chief Geologist since 2008. He brings over 32 years of successful precious metals exploration, mine development and production experience. He participated and supervised exploration projects in Northwest Territories, Canada, Liberia, West Africa, Mexico, Honduras, and areas within the western region of the United States. Mr. Martin’s production experience is exemplified by supervisory positions in the following Nevada mines: Manhattan, Borealis, Hog Ranch, and Denton-Rawhide.
Mr. Martin’s geologic technical expertise overlapped into the environmental and civil engineering disciplines of geology. He was instrumental in the evaluation of geologic design parameters at the proposed nuclear repository site located at Yucca Mountain, Nevada. Mr. Martin participated in the geo-technical evaluation of the environmentally sensitive sites of Hanford Nuclear Reservation, Washington and Anniston military depot, Alabama; and the rock product dam project, East Side Reservoir Project, California. Most recently, Larry’s focus has been in Nevada precious metals exploration projects including: the Sleeper Gold Project and, currently, the Comstock Mine Project. Mr. Martin received his Bachelor of Science in Geologic Engineering from Colorado School of Mines in 1978. He is a Qualified Person (QP) and a Certified Professional Geologist (CPG) accredited by American Institute of Professional Geologists (AIPG). Mr. Martin is a certified expert witness by the 9th District Appellate United States Federal Court in the categories of Exploration and Structural Geology.
Timothy J. George
has worked with the Company as both an employee and a dedicated consultant, since 2014, as Senior Mine Engineer and brings nearly 10 years of experience in mine design, modeling and optimization. Mr. George has evaluated blast and loading designs in copper mining, coordinated production and maintenance activities in coal mines and has extensive long-term, strategic mine design, phasing and near term production scheduling, including geological and block model manipulation, fleet simulations and optimizations for surface mining as well as engineering design and boundary optimization for underground mining. Mr. George holds a Bachelor of Science Degree in Mining Engineering, Cum Laude, from the University of Arizona.
Scott Jolcover
is the Company's Director of Business Development. He has been in mining for nearly 35 years and with Comstock Mining since 2010. His prior mining experience includes working on the historic Comstock Lode with Gold Springs Inc. and Plum Mining Inc. since 1996. Scott manages major commercial transactions, including all land, water and major purchases and acquisitions. Scott has former real estate experience and worked as a licensed agent. He is also currently Chairman of the Virginia City Tourism Commission.
33
Exploration & Development
District-wide
During the first half of 2016, the Company focused on exploration and development in the Lucerne Resource area, primarily underground core drilling, underground drift (tunnel) development, and underground sampling into the Quartz Porphyry (PQ) and Succor geological targets. The Company has also developed specific plans for further Lucerne exploration activities to define the extent of known mineralization in the Succor, Woodville and Chute target areas.
During the second quarter of 2016, the Company expanded its exploration planning to include longer-term exploration targets across the broader Comstock District where multiple miles of additional mineralized strike zones have been identified and added to the Company’s exploration planning activities. This includes the southern portion of the Dayton Resource area, extending further south into the Spring Valley Group (refer to Figure 1), the Company’s Northern properties referred to as the Gold Hill Group and also northeastern properties within the Occidental Group.
During the third quarter of 2016, the exploration planning effort was focused on the Dayton Resource area. A draft plan has been designed for an expanded drilling program that would include Reverse Circulation (RC) and diamond core drill holes to place the Dayton Resource into a mine planning stage. The mine planning would incorporate the existing data and would be expanded by the additional infill, geotechnical and definition drilling.
Fourth quarter exploration and development efforts were focused upon the hydrological model of the Dayton Resource area. A Reverse Circulation (RC) drill program was designed to initially test the hydrologic regime within the proposed mine and process facility. After completion of the RC program, the data collected would be updated and modeled for targeting the optimal drill site locations for an additional diamond core drill program. The diamond hole locations would be specifically selected to define the hydrological, geotechnical and metallurgical properties during 2017, drilling programs.
The Company plans to advance the Dayton Resource area to full feasibility, with a production ready mine plan within the next two years. The volcanic host rocks and structural controls of the mineralization defined to date for the Dayton Resource area are projected south into Spring Valley. Economic gold mineralization has been intercepted in several wide spaced drill holes conducted during numerous prior Spring Valley drilling programs. Over the past several months, the technical staff has identified multiple drill targets within several specific locations that encompass the Dayton Resource area and Spring Valley. The new targets are based on the Company's latest review of previous geophysical studies and current interpretation of the geology. Reference to the Company's quarterly activity, the Company's long term plan is to further develop the remaining historic mining areas, which include: the Gold Hill Group (Northern Extension and Northern Targets areas), the Occidental Group, while continuing the exploration and development of the Lucerne Group.
34
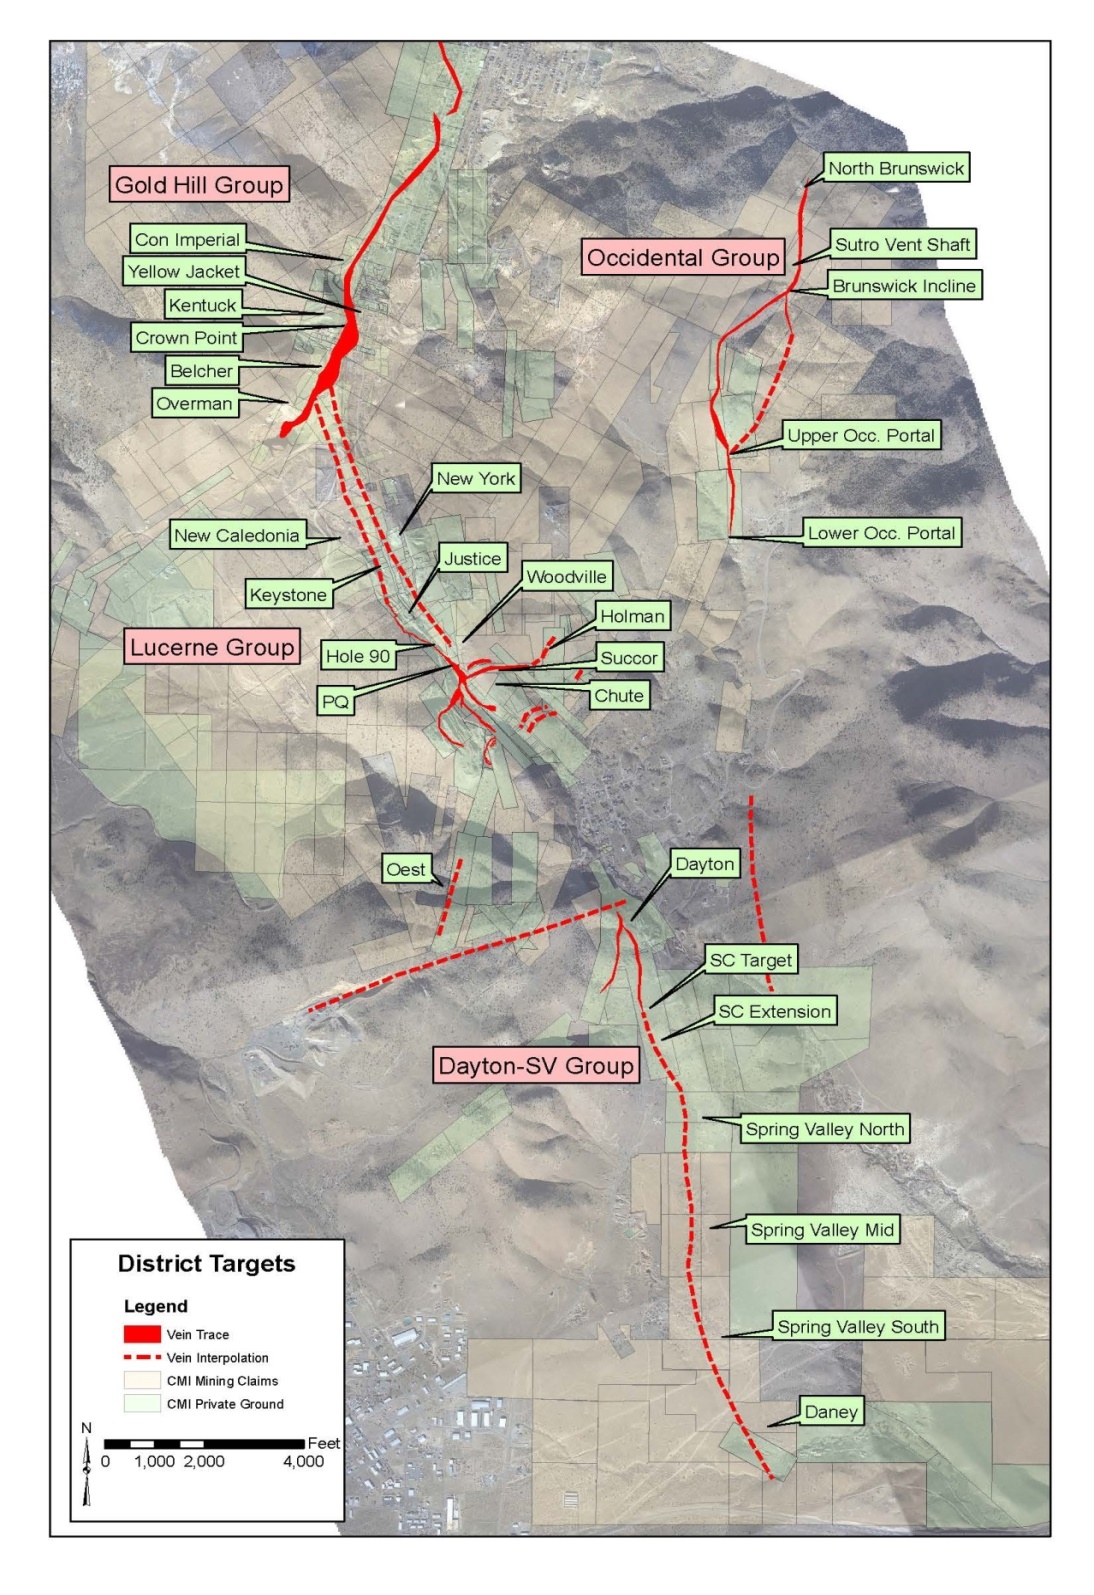
Figure 1 - General overview of priority surface and underground targets.
35
Lucerne Exploration Targets
The Company has designed additional exploration drilling programs within the Lucerne Group. This includes the Succor vein target, the Woodville area and the northern development of the PQ underground. During the development of the PQ underground target the Company drilled approximately 12,380 feet of HQ-3 and NQ core drilling and mineralized intervals were sampled from the Harris Drift. The drilling configuration is in the form of ‘fans’ that comprise a group of holes, with each drill bay having two or three fans of drill holes extending into the primary target. The core locations and orientations were specifically designed to infill and expand the areas of known, underground economic grade mineralization identified from previous surface drilling programs. (Figure 2)
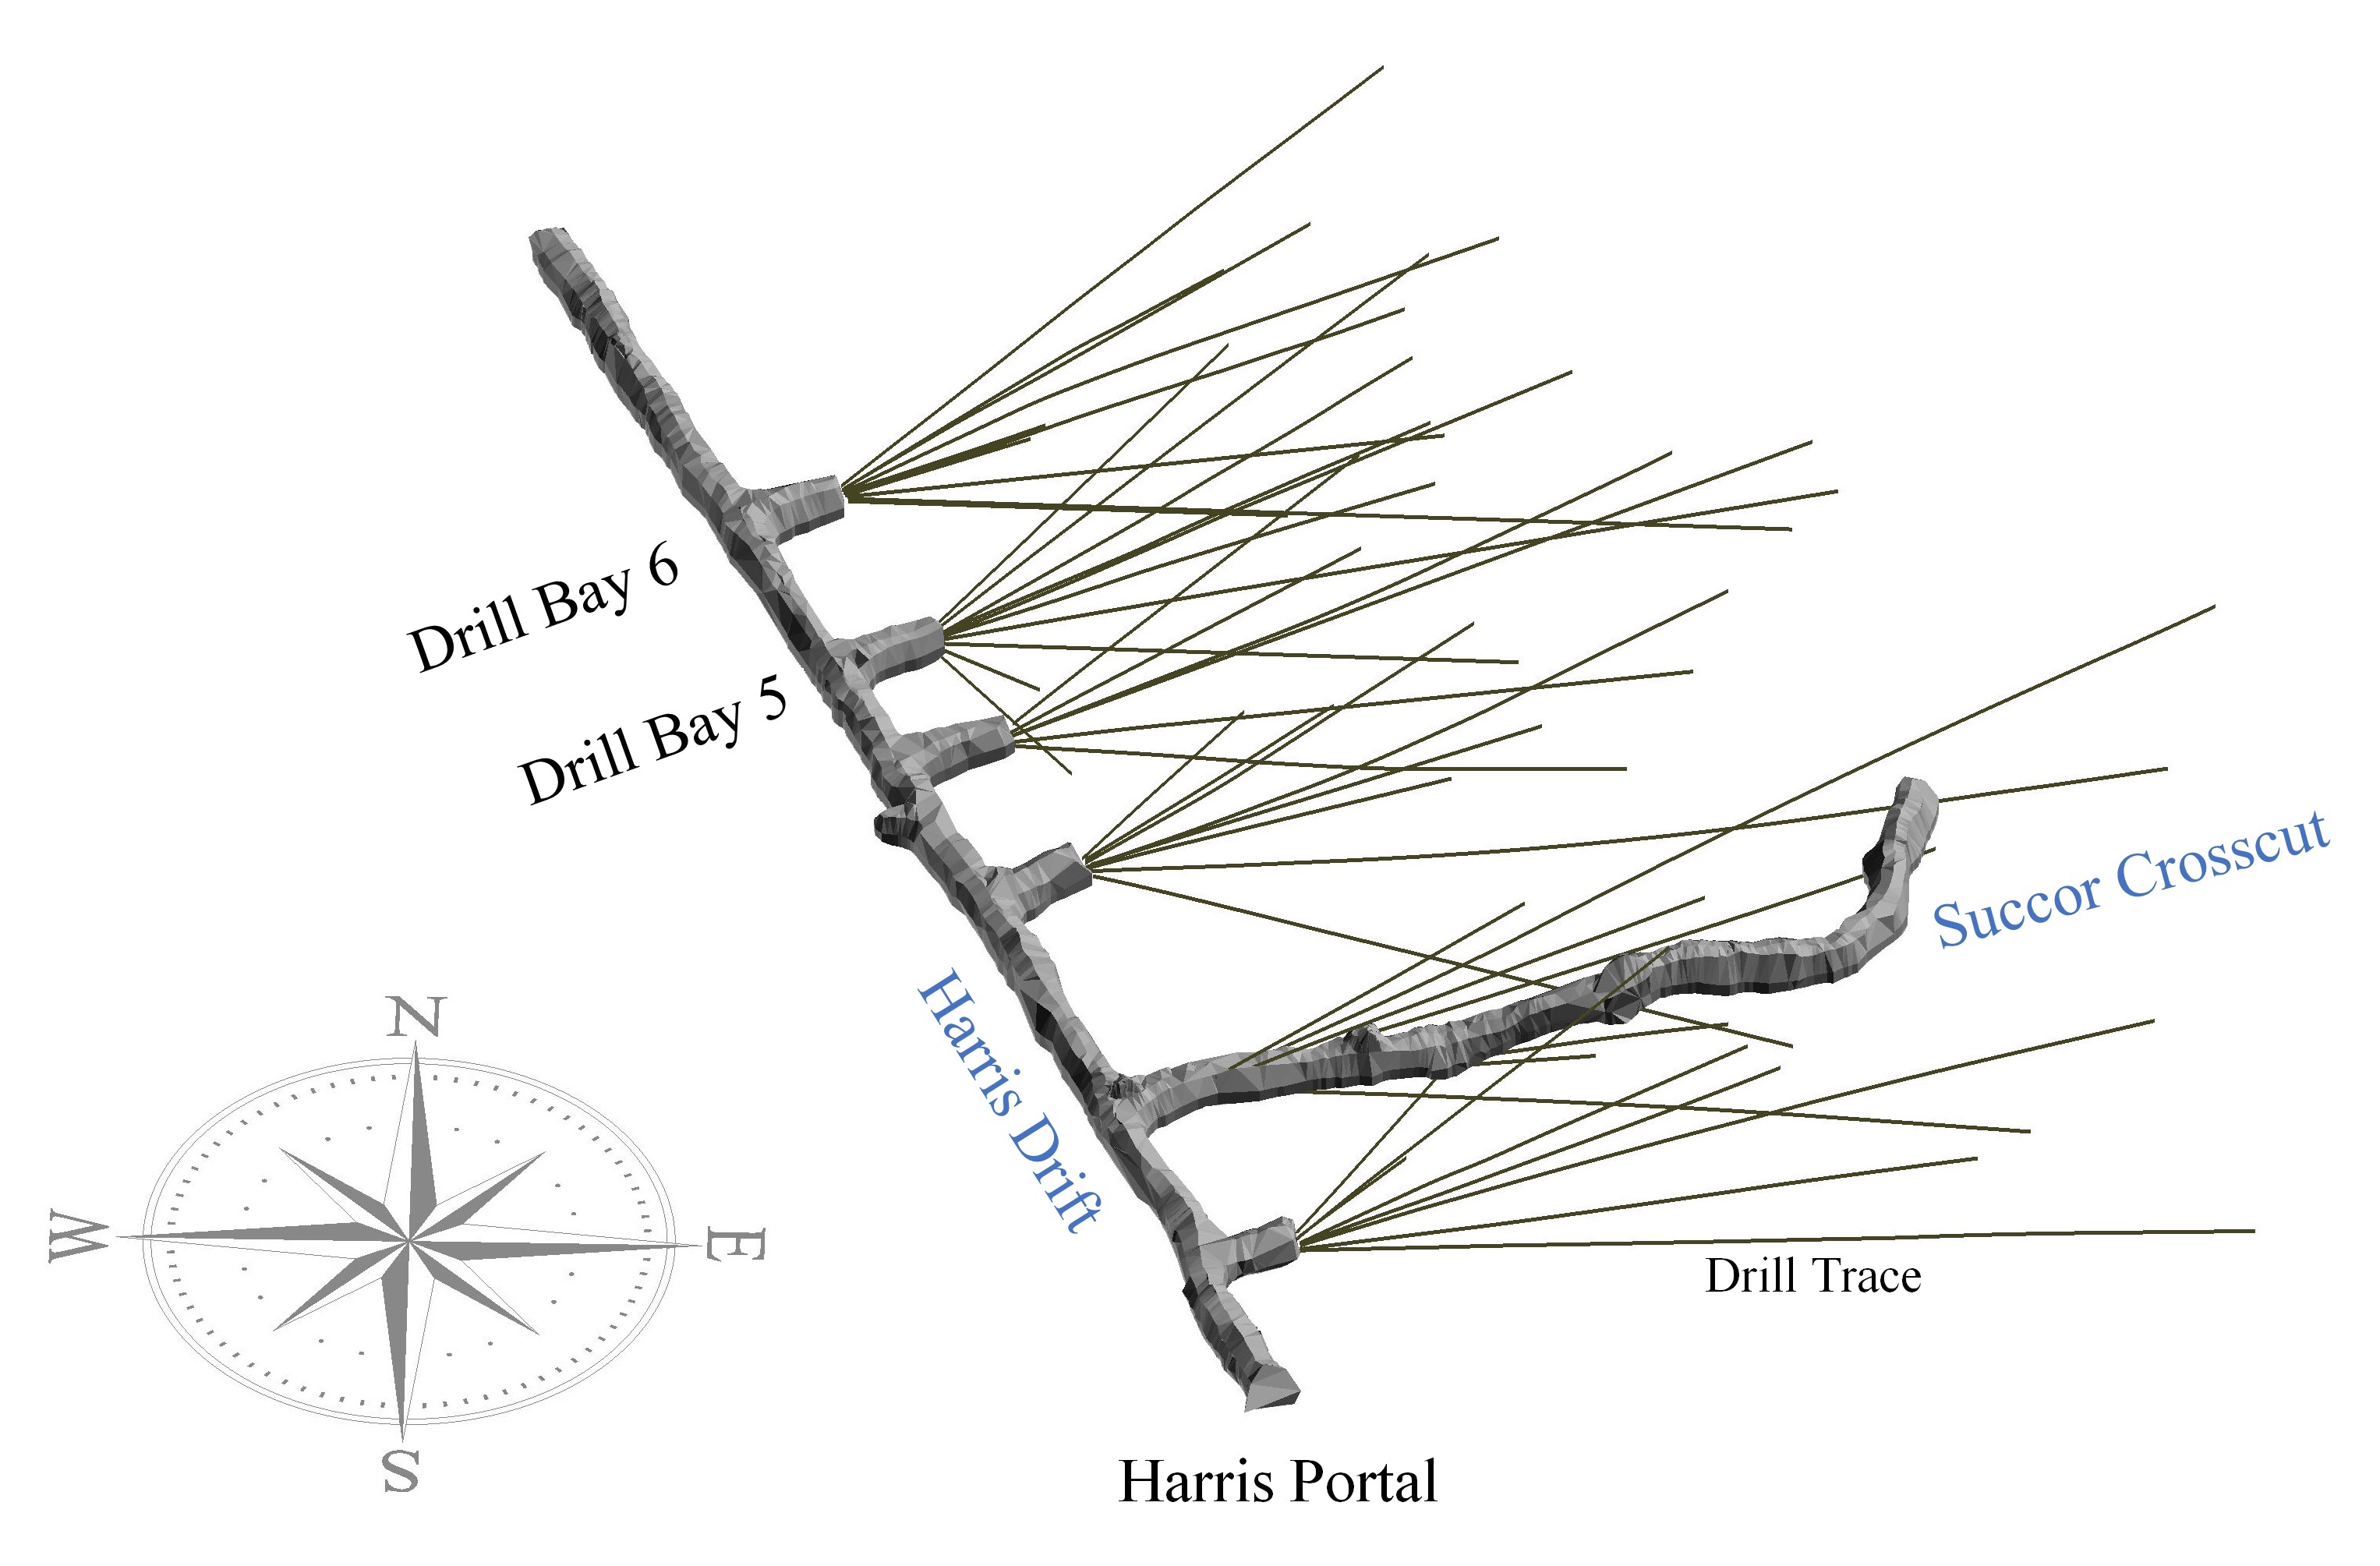
Figure 2 - 3D representation of the Harris Drift showing drill bays, drill fans, and the Succor crosscut.
The Company encountered contiguous mineralized intercepts (10 to 40 feet) from bays 3 through 6 as it moved north of the Silver City/Succor structural intersection and within and bordering the quartz porphyry (PQ) mass. The configuration of the longer and higher grade intercepts occur along the hanging wall contact of the PQ intrusive mass within both the Alta Andesite and PQ host rocks. The intervals show continuity laterally and vertically along the structural contact.
36
Drill results from 2016 are summarized in Table 1 below.
|
Drill Bay
|
Hole #
|
From (ft.)
|
To (ft.)
|
Length
|
Au opt
(1)
|
Ag opt
(2)
|
From (m)
|
To (m)
|
Interval (m)
|
Au Grams
|
Ag Grams
|
Au Equivalent Ounces
(3)
|
|||||||||||||||||||||||
|
5
|
LUGC16-042
|
5.0
|
|
10.0
|
|
5.0
|
|
0.240
|
|
7.500
|
|
1.5
|
|
3.0
|
|
1.5
|
|
8.23
|
|
257.11
|
|
0.336
|
|
||||||||||||
|
5
|
LUGC16-044
|
106.0
|
|
111.0
|
|
5.0
|
|
0.098
|
|
2.284
|
|
32.3
|
|
33.8
|
|
1.5
|
|
3.36
|
|
78.30
|
|
0.127
|
|
||||||||||||
|
5
|
LUGC16-044
|
116.0
|
|
120.0
|
|
4.0
|
|
0.094
|
|
1.908
|
|
35.4
|
|
36.6
|
|
1.2
|
|
3.22
|
|
65.41
|
|
0.118
|
|
||||||||||||
|
5
|
LUGC16-044
|
161.0
|
|
167.0
|
|
6.0
|
|
0.178
|
|
1.936
|
|
49.1
|
|
50.9
|
|
1.8
|
|
6.10
|
|
66.36
|
|
0.203
|
|
||||||||||||
|
6
|
LUGC16-043
|
156.0
|
|
163.5
|
|
7.5
|
|
0.157
|
|
0.488
|
|
47.5
|
|
49.8
|
|
2.3
|
|
5.38
|
|
16.72
|
|
0.163
|
|
||||||||||||
|
6
|
LUGC16-043
|
175.0
|
|
188.0
|
|
13.0
|
|
0.323
|
|
0.700
|
|
53.3
|
|
57.3
|
|
4.0
|
|
11.08
|
|
24.01
|
|
0.332
|
|
||||||||||||
|
6
|
Includes
|
181.0
|
|
188.0
|
|
7.0
|
|
0.506
|
|
0.668
|
|
55.2
|
|
57.3
|
|
2.1
|
|
17.35
|
|
22.89
|
|
0.515
|
|
||||||||||||
|
6
|
LUGC16-043
|
198.0
|
|
218.0
|
|
20.0
|
|
0.384
|
|
0.858
|
|
60.4
|
|
66.4
|
|
6.1
|
|
13.17
|
|
29.41
|
|
0.395
|
|
||||||||||||
|
6
|
Includes
|
198.0
|
|
213.0
|
|
15.0
|
|
0.473
|
|
0.865
|
|
60.4
|
|
64.9
|
|
4.6
|
|
16.22
|
|
29.65
|
|
0.484
|
|
||||||||||||
|
6
|
LUGC16-045
|
61.0
|
|
66.0
|
|
5.0
|
|
0.091
|
|
0.309
|
|
18.6
|
|
20.1
|
|
1.5
|
|
3.12
|
|
10.59
|
|
0.095
|
|
||||||||||||
|
6
|
LUGC16-045
|
145.0
|
|
149.0
|
|
4.0
|
|
0.126
|
|
0.887
|
|
44.2
|
|
45.4
|
|
1.2
|
|
4.32
|
|
30.39
|
|
0.137
|
|
||||||||||||
|
6
|
LUGC16-047
|
92.0
|
|
95.0
|
|
3.0
|
|
0.894
|
|
0.280
|
|
28.0
|
|
29.0
|
|
0.9
|
|
30.65
|
|
9.60
|
|
0.898
|
|
||||||||||||
|
6
|
LUGC16-047
|
203.0
|
|
223.5
|
|
20.5
|
|
0.149
|
|
0.604
|
|
61.9
|
|
68.1
|
|
6.2
|
|
5.11
|
|
20.71
|
|
0.157
|
|
||||||||||||
|
6
|
LUGC16-047
|
241.5
|
|
245.5
|
|
4.0
|
|
0.332
|
|
0.793
|
|
73.6
|
|
74.8
|
|
1.2
|
|
11.38
|
|
27.19
|
|
0.342
|
|
||||||||||||
|
6
|
LUGC16-047
|
248.0
|
|
249.0
|
|
1.0
|
|
0.290
|
|
0.805
|
|
75.6
|
|
75.9
|
|
0.3
|
|
9.94
|
|
27.60
|
|
0.300
|
|
||||||||||||
|
6
|
LUGC16-047
|
251.0
|
|
252.0
|
|
1.0
|
|
0.248
|
|
1.138
|
|
76.5
|
|
76.8
|
|
0.3
|
|
8.50
|
|
39.01
|
|
0.263
|
|
||||||||||||
|
6
|
LUGC16-047
|
305.0
|
|
318.5
|
|
13.5
|
|
0.160
|
|
0.314
|
|
93.0
|
|
97.1
|
|
4.1
|
|
5.49
|
|
10.77
|
|
0.164
|
|
||||||||||||
|
6
|
Includes
|
305.0
|
|
309.0
|
|
4.0
|
|
0.267
|
|
0.394
|
|
93.0
|
|
94.2
|
|
1.2
|
|
9.15
|
|
13.51
|
|
0.272
|
|
||||||||||||
|
6
|
LUGC16-048
|
96.5
|
|
101.5
|
|
5.0
|
|
0.321
|
|
11.550
|
|
29.4
|
|
30.9
|
|
1.5
|
|
10.99
|
|
395.95
|
|
0.469
|
|
||||||||||||
|
6
|
Includes
|
96.5
|
|
99.0
|
|
2.5
|
|
0.404
|
|
17.700
|
|
29.4
|
|
30.2
|
|
0.8
|
|
13.85
|
|
606.79
|
|
0.631
|
|
||||||||||||
|
6
|
LUGC16-048
|
149.5
|
|
167.0
|
|
17.5
|
|
0.346
|
|
0.737
|
|
45.6
|
|
50.9
|
|
5.3
|
|
11.85
|
|
25.28
|
|
0.355
|
|
||||||||||||
|
6
|
Includes
|
149.5
|
|
159.5
|
|
10.0
|
|
0.352
|
|
0.623
|
|
45.6
|
|
48.6
|
|
3.0
|
|
12.07
|
|
21.34
|
|
0.360
|
|
||||||||||||
|
6
|
Includes
|
164.5
|
|
167.0
|
|
2.5
|
|
0.640
|
|
0.666
|
|
50.1
|
|
50.9
|
|
0.8
|
|
21.94
|
|
22.81
|
|
0.649
|
|
||||||||||||
|
6
|
LUGC16-048
|
176.0
|
|
181.0
|
|
5.0
|
|
0.169
|
|
0.788
|
|
53.6
|
|
55.2
|
|
1.5
|
|
5.79
|
|
27.01
|
|
0.179
|
|
||||||||||||
|
6
|
LUGC16-048
|
280.0
|
|
286.0
|
|
6.0
|
|
0.126
|
|
1.015
|
|
85.3
|
|
87.2
|
|
1.8
|
|
4.32
|
|
34.78
|
|
0.139
|
|
||||||||||||
|
6
|
LUGC16-049
|
134.0
|
|
135.0
|
|
1.0
|
|
0.266
|
|
10.200
|
|
40.8
|
|
41.1
|
|
0.3
|
|
9.12
|
|
349.67
|
|
0.397
|
|
||||||||||||
|
6
|
LUGC16-049
|
177.5
|
|
183.0
|
|
5.5
|
|
0.236
|
|
0.515
|
|
54.1
|
|
55.8
|
|
1.7
|
|
8.09
|
|
17.66
|
|
0.243
|
|
||||||||||||
|
6
|
LUGC16-049
|
185.0
|
|
195.0
|
|
10.0
|
|
0.716
|
|
1.003
|
|
56.4
|
|
59.4
|
|
3.0
|
|
24.56
|
|
34.40
|
|
0.729
|
|
||||||||||||
Reported values are from American Assay Labs (AAL) and Inspectorate American Corporation (Inspectorate) owned by Bureau Veritas both located in Sparks, NV. AAL and Inspectorate lab methods include standard fire assay with ICP finish and gravimetric finish per each labs internal protocols.
(1)
Au opt - Gold ounces per ton
(2)
Ag opt - Silver ounces per ton
(3)
Gold Equivalent ratio based on gold to silver price ratio of 78:1 Ag:Au
(4)
Value reported is average of original and check assay
(5)
A separate assay on a 0.1 foot sample of material was analyzed by total digestion (in triplicate) with the result of 6.7 opt Au and <0.030 opt Ag
37
Throughout the PQ drill program, geologic cross sections oriented along the drill fans and level plans on 20 foot spacing were fashioned for the target area. With completion of drilling, core logging and assaying through Drill Bay 6, cross sections and level plans were prepared, reviewed, updated and digitized. The model was further refined as these sections were tied together to form a three-dimensional triangulation using Maptek Vulcan software.
Using the geologic model and assay data as a base, multiple grade shells were produced in the same manner. Starting with cross sections and level plans, the shells were digitized and then refined as they were tied together to form three-dimensional triangulations. These shells form the base of the block model used for internal planning and resource development. (Figure 3)
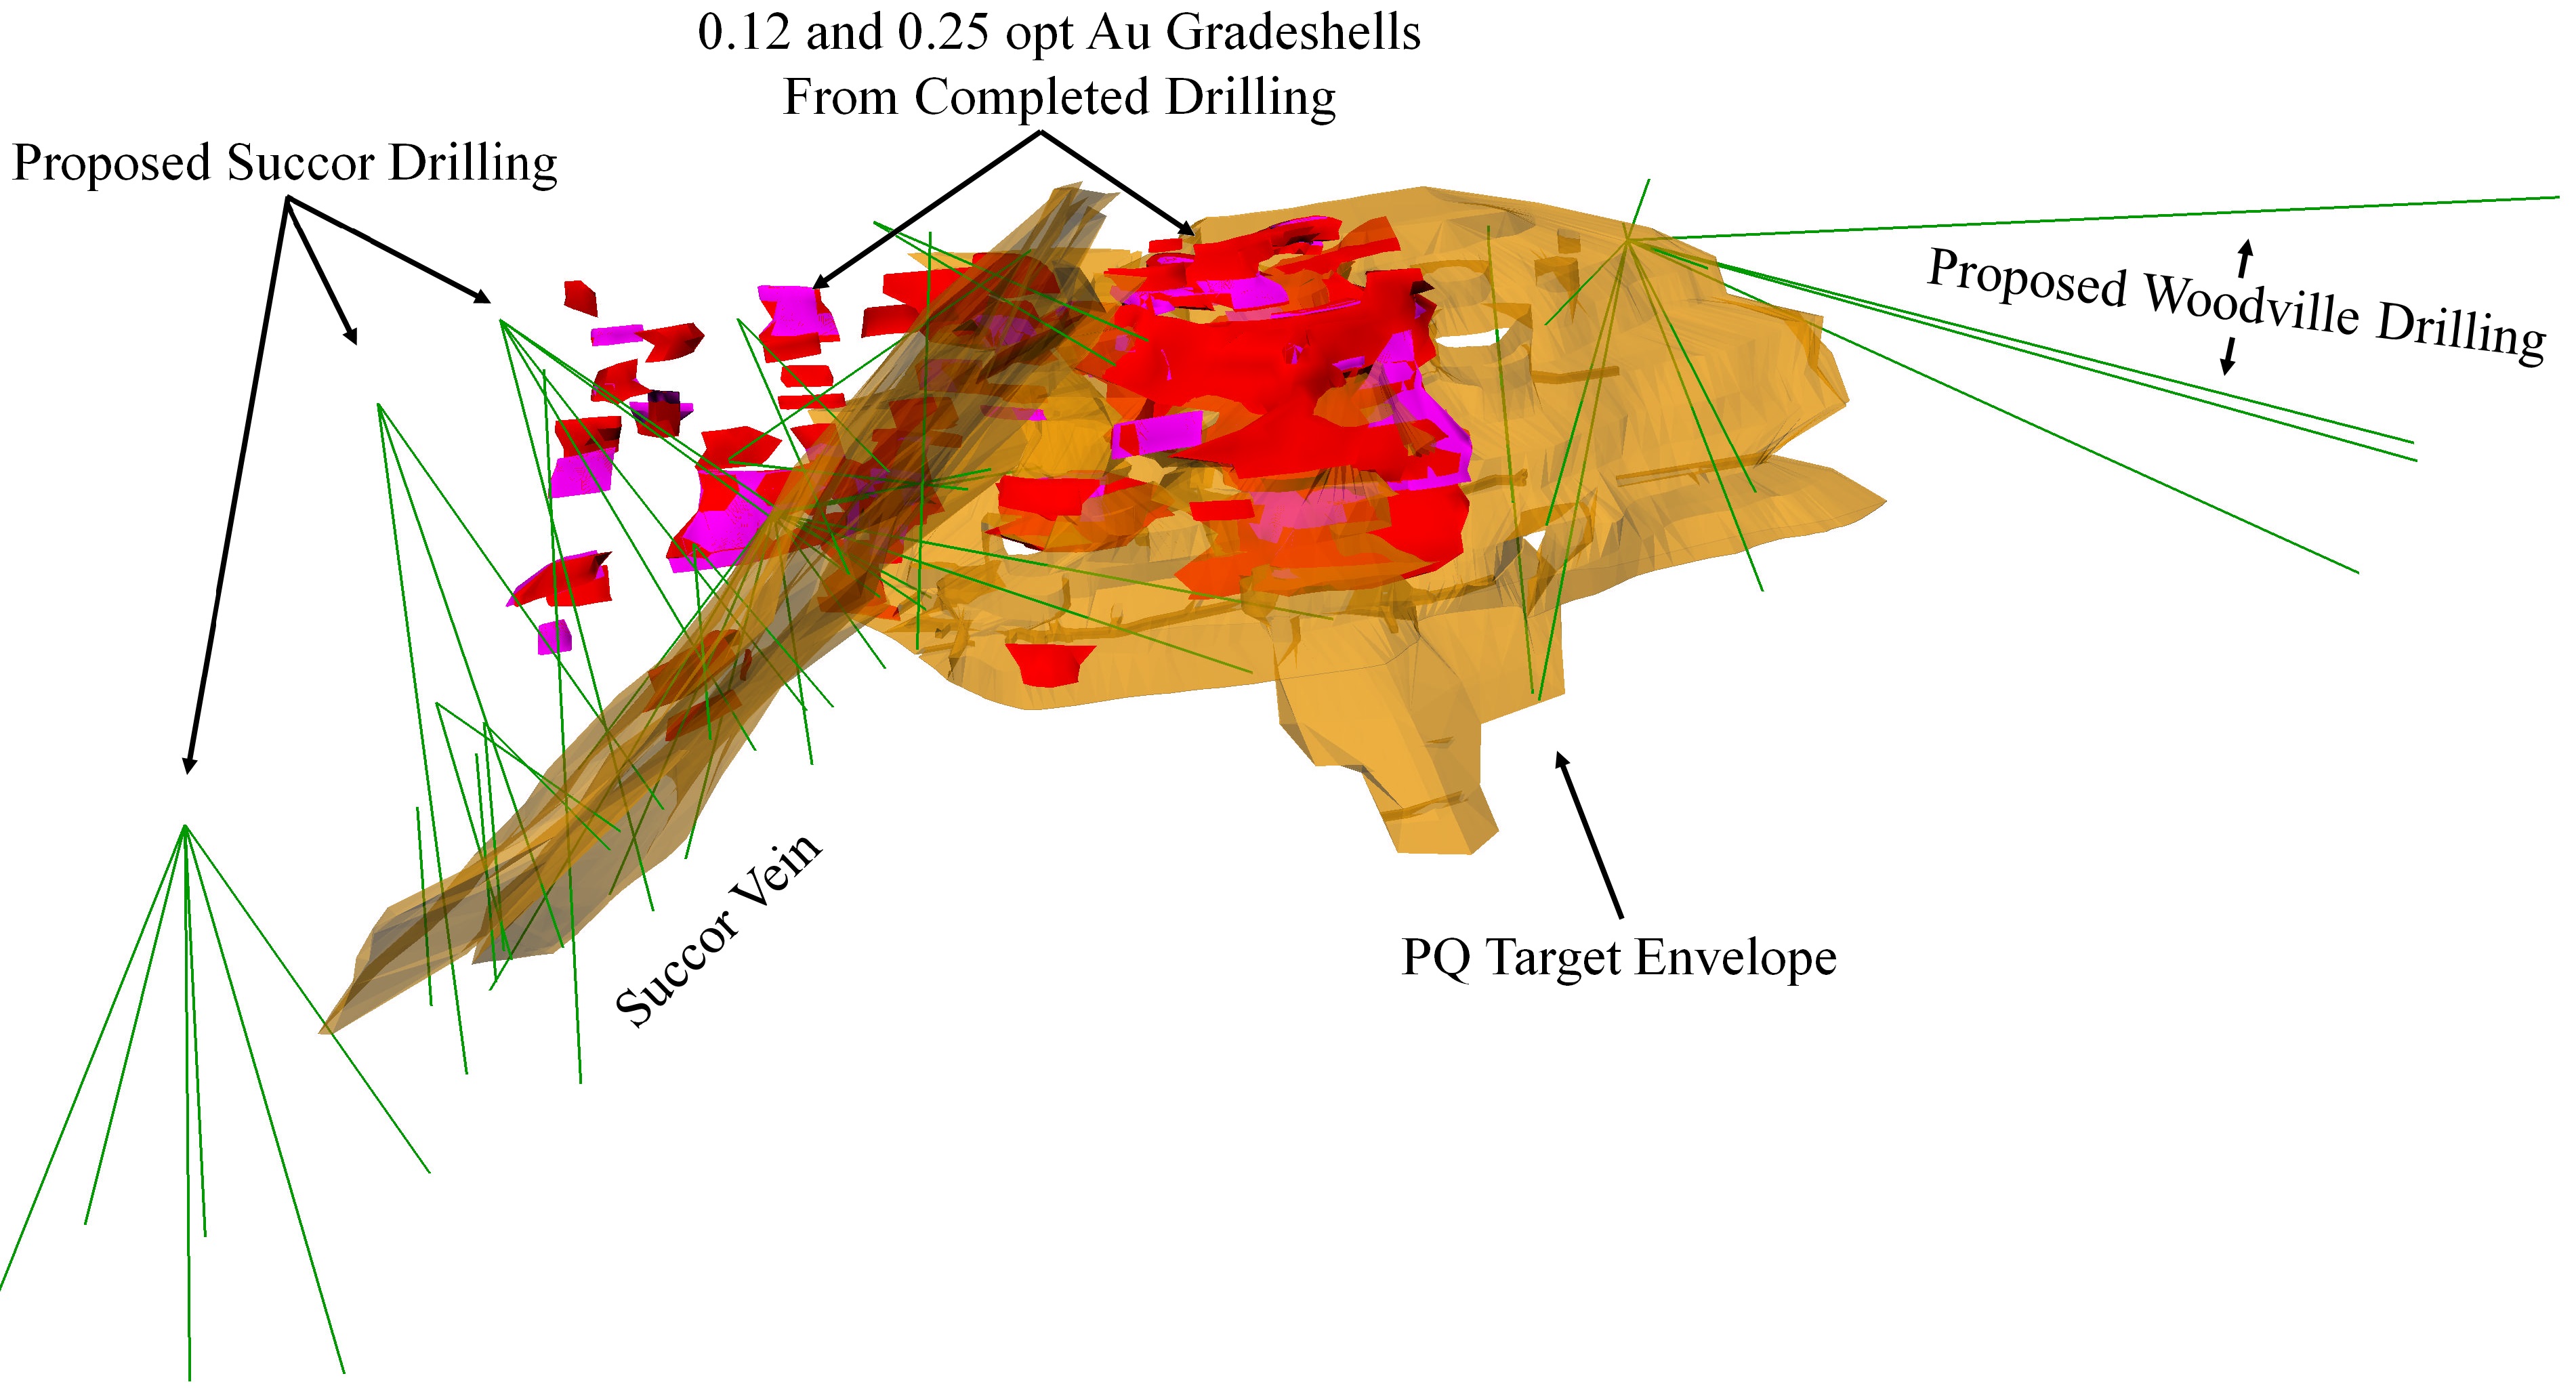
Figure 3 - Current grade shells: colored red for 0.12 opt Au cutoff (averaging 0.31 opt Au) and magenta 0.25 opt Au cutoff (averaging 0.61 opt Au), with PQ, Succor, and Woodville proposed drill programs.
Although the grade intercepts were promising, they have not yet yielded sufficient continuity for mining. The Company considers the initial 800 feet of advance within the Harris Drift as a first phase of development toward a longer-term exploration and development objective targeting a three-quarter-mile long mineralized corridor that includes the Lucerne (including the PQ target), Succor, Woodville and Chute zone systems (see Figure 4). Most of these systems remain open to the north and east and particularly at depth. A second phase of development was completed by advancing a crosscut originating from Drill Bay 2 to a total length of 450 feet toward the structural intersection of the Silver City fault zone and Succor vein zone. The design of the crosscut is geared toward favorable underground drilling position. The Succor represents an important target in conjunction with the PQ zone based on its location (perpendicular and adjacent to the PQ), past production history and the results from the Company’s 2011 and 2012 reverse circulation drill programs.
38
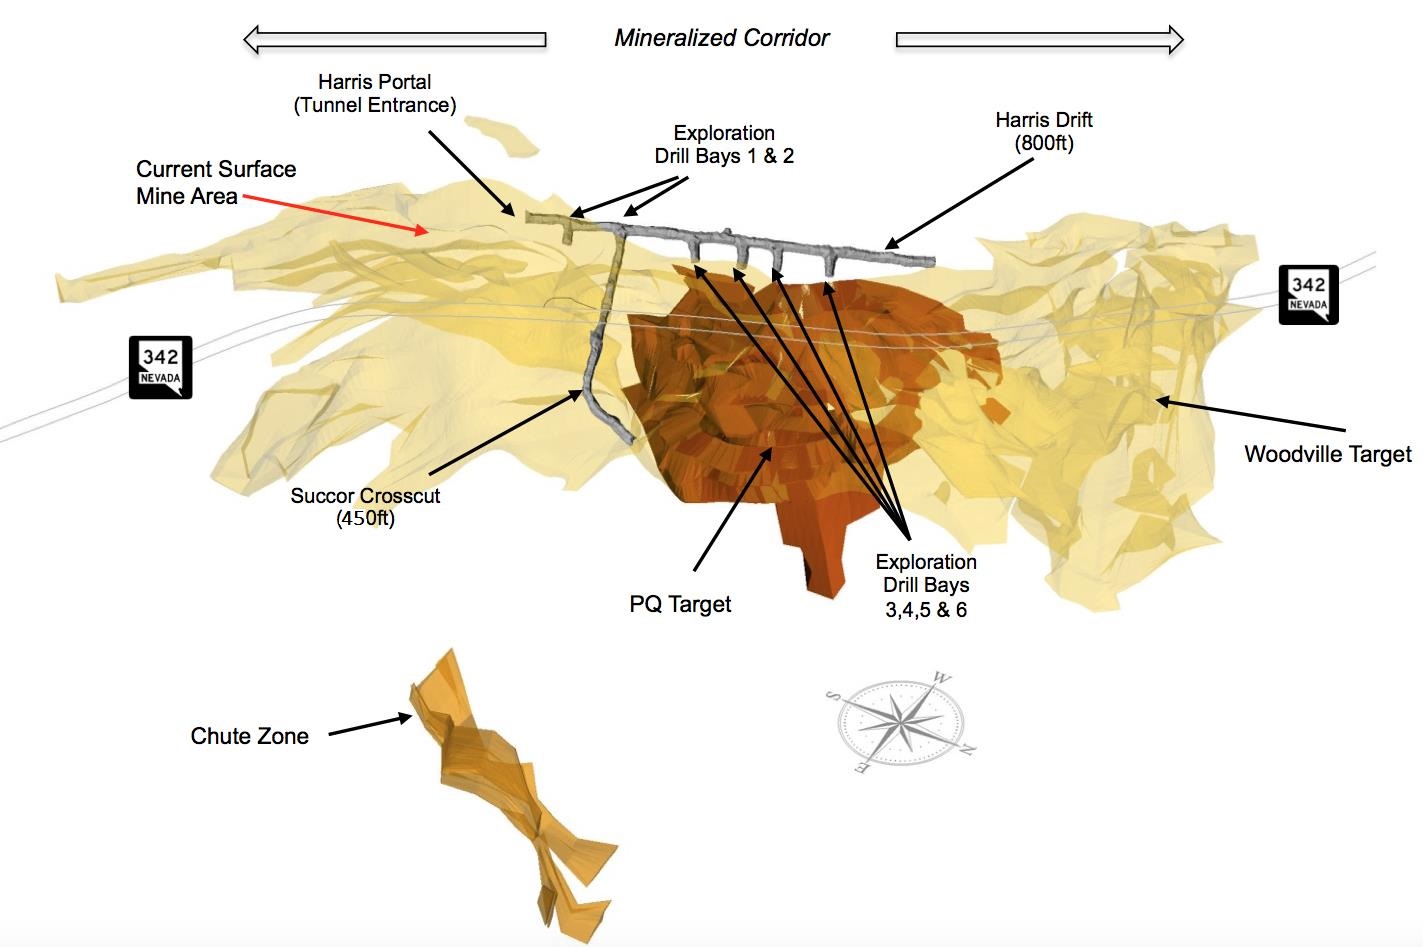
Figure 4 - Underground target areas highlighting the exploration drift and drill bays.
The Succor Vein Target has a strike length of greater than 1000 feet, an average true width of 15 feet and an average dip of 55 degrees. The structure has reported historic mining grades of approximately 0.620 ounces per ton of recovered gold equivalent grade and is open to the east and at depth, along the entire structure. The proposed drill holes shown in Figure 5 are designed to extend the depth of known mineralization identified by surface drilling.
39
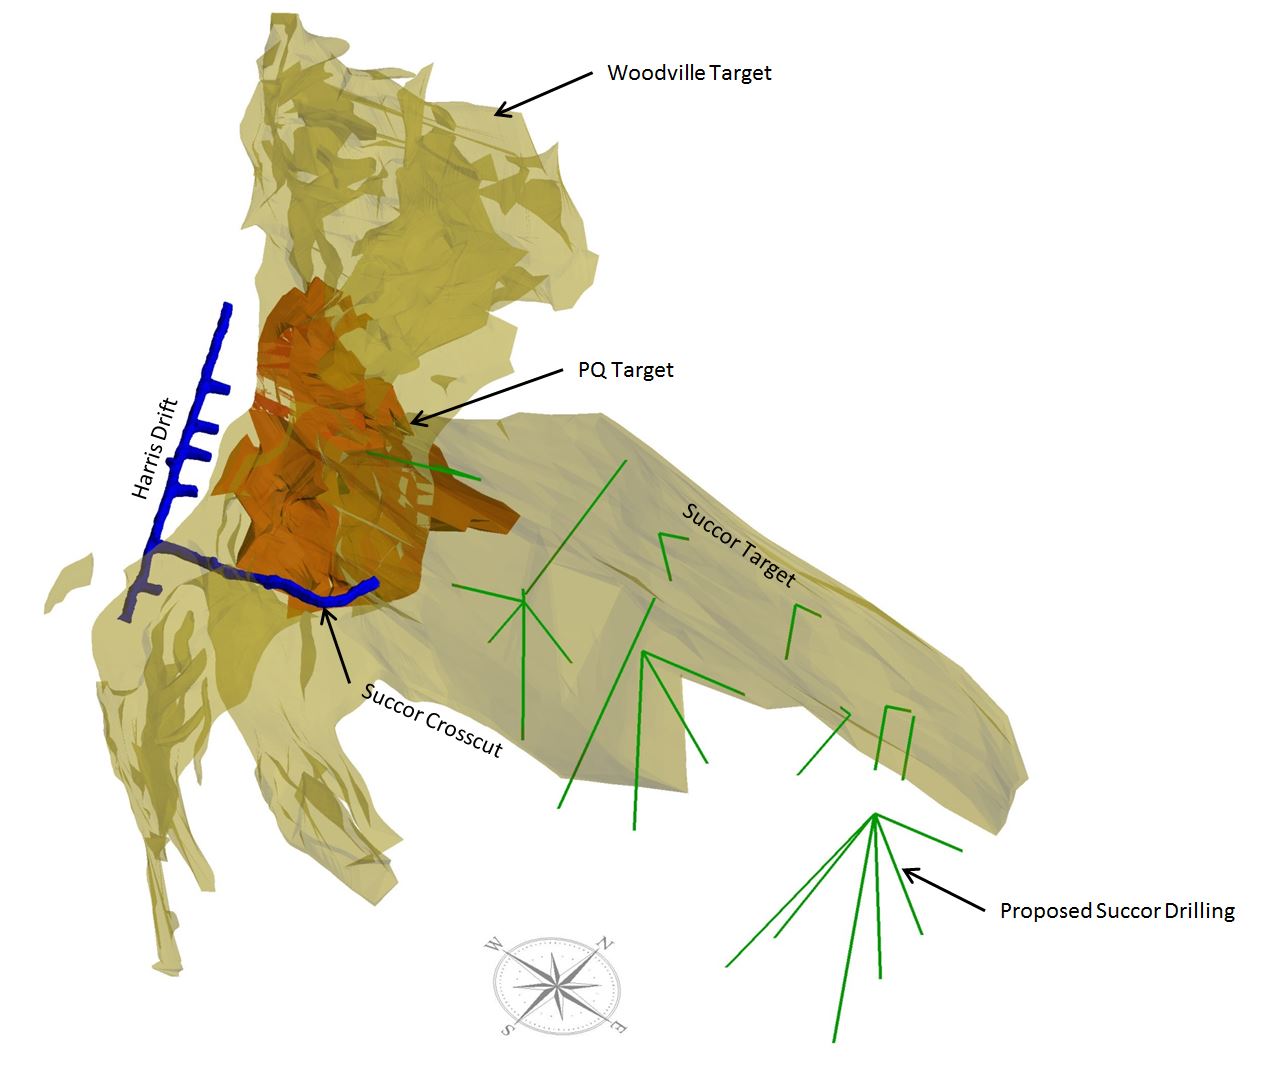
Figure 5 - Woodville, PQ, and Succor target areas with proposed Succor target drilling.
Future drill programs are being developed with a phased approach to extend the PQ mineralization and scope the Succor and Woodville targets.
The remaining phases of the road realignment, drainage establishment and seeding were completed during the third and fourth quarter of 2016.
Dayton Resource Area
Dayton planning continued with conceptual layout of the Dayton Mine and processing facility (Figure 6). This layout places the mine and facilities 100% on ground privately held by the Company while avoiding future drill targets. This simplifies and shortens the critical permitting chain.
In addition to infrastructure and drill planning, we performed due diligence assisted by SRK Consulting. The due diligence resulted in confirmation of the scoping level mine plans and agreement on the conceptual processing layout.
40

Figure 6 - Dayton Conceptual Mine and Processing Area
41
The Company plans to conduct definition drilling and geotechnical core programs within the Dayton Resource area, as previously described, and advance this area to full feasibility, with a production ready mine plan within the next two years. The Dayton and southern expansion programs includes exploration and definition drilling of targets identified by the prior conventional percussion, RC and diamond core drill programs and magnetic, IP and resistivity geophysical surveys (Figure 7).
The geologic and engineering team completed underground mapping, sampling, and surveying in a number of historic mine tunnels on and near the Dayton Resource area. Several historic mines operated in the Dayton area, leaving access to multiple structures from underground. Some historic adits have remained open or have been uncovered by the Company. Where accessible, the workings were inspected; geology mapped and mineralized material sampled. Once sampling was completed, the workings were surveyed to document the size of the mine workings, the location of the openings and location of the samples. The samples were then assayed at the Company’s in house metallurgical laboratory for gold and silver.
This underground sampling program has provided a wealth of assay information and provided critical information for furthering the geologic understanding of the Dayton area. In some cases structures identified on the surface were traced underground and in other cases new structures were identified underground were surface expressions were absent or obscured.
42
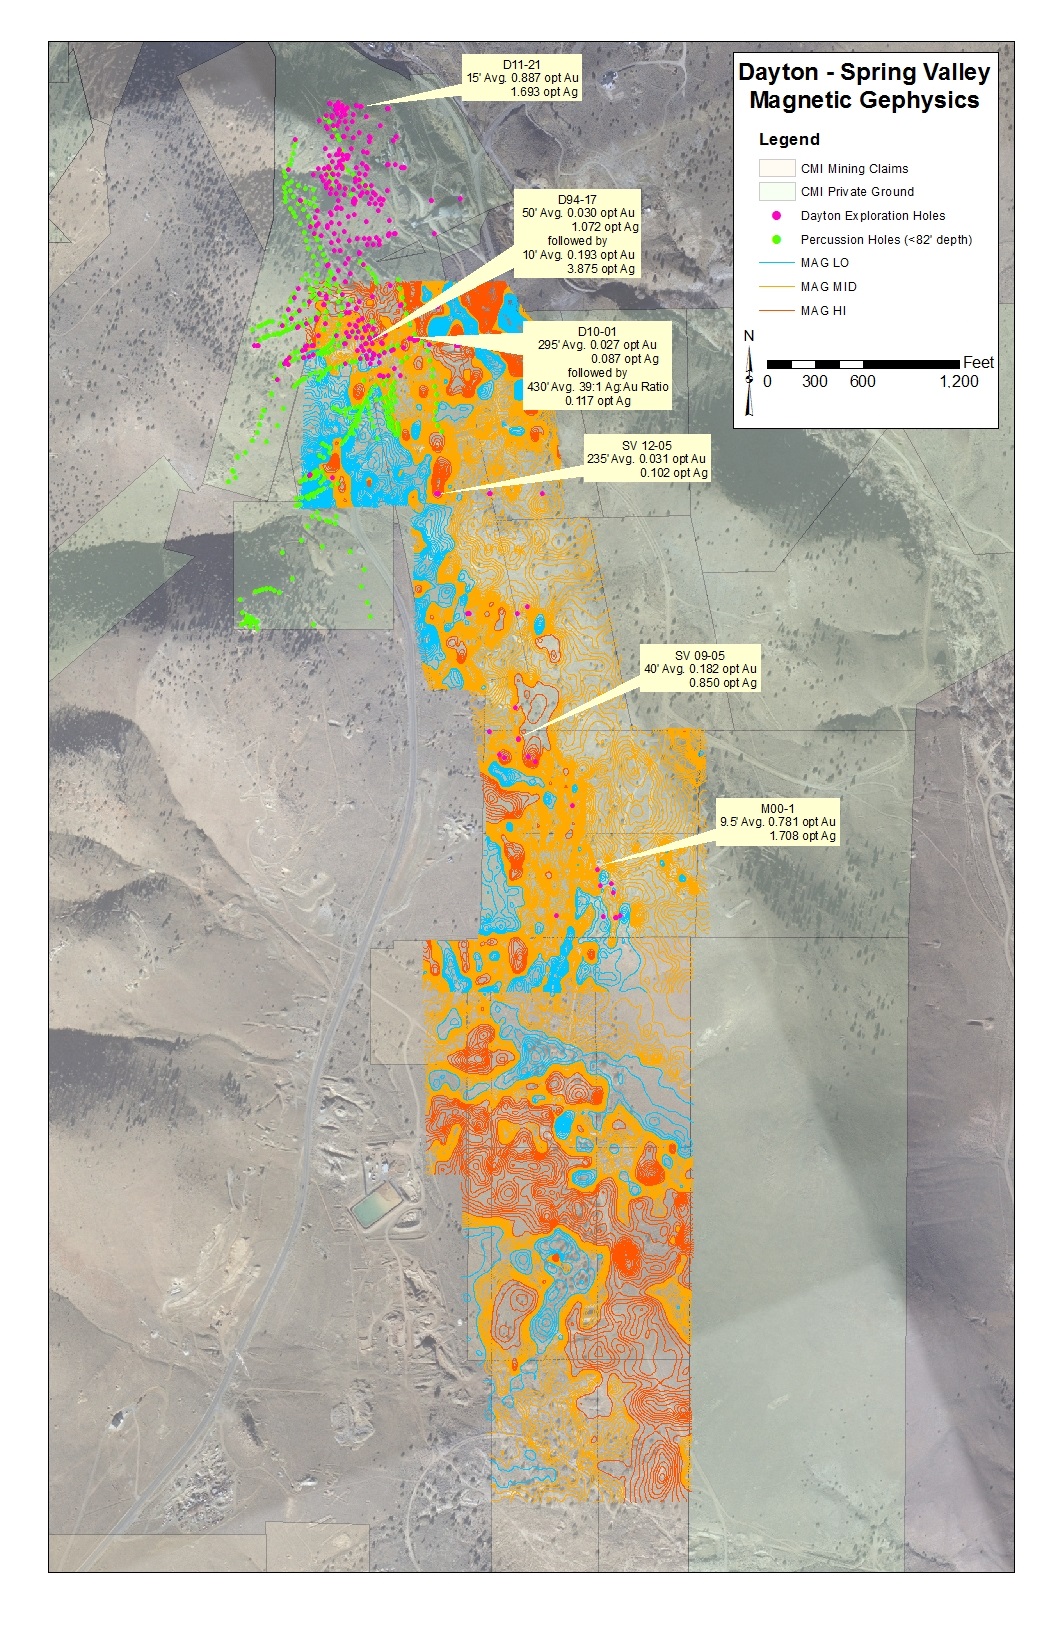
Figure 7 - Dayton and Spring Valley Magnetic Geophysics.
43
Dayton Hydrologic Study
A Reverse Circulation (RC) drill program was designed to support the Water Pollution Control Permit application.
The initial program would require fourteen (14) drill sites to evaluate the hydrological regime of the mine location and an additional five (5) drill holes for the process facility.
The RC drilling would identify water levels and flow direction throughout the Dayton Project's hydrologic regime by testing multiple inner structurally bounded hydraulic cells. The measured static water levels, rate of flow and direction would be added to the mine model with respect to economic mineralization, proposed design mining depths and provide the initial mine water management requirements.
Several specific drill holes will provide multiple engineering attributes of the hydrologic and rock properties, including the potential of identifying additional economic resources. The completion of the RC drill holes will be used to position surgical core holes for geo-technical and metallurgical properties, acid/base accountability of waste rock and work indices of mineralized material.
A minimum of six (6) RC drill holes will have three (3) vibrating piezometers cemented down hole. One piezometer located within the top of the static water level. Another piezometer positioned mid-range within the water column and the third piezometer located at the contact of the Miocene volcanic rocks and the Paleozoic basement rocks. The data collected from the placement of the piezometers will be used to better position monitor well locations.
Spring Valley
Spring Valley is located south of the Dayton Resource area and south of State Route 341. Ground magnetic geophysical surveys identified a linear anomalous corridor, defined by a series of relative magnetic lows. Altered volcanic host rocks have been intercepted by limited drilling and identified several mineralized zones. Selected drill hole intercepts are highlighted (see Figure 6). The exploration of Spring Valley will include phased drilling programs that will continue southerly from SR341 to the historic Daney mine site (see Figure 1), with a total a strike length of approximately 8,000 feet.
Gold Hill Group
The northern Comstock underground targets of the Gold Hill Group will be prioritized and exploration proposals will follow. Several locations in the Gold Hill Group have been selected for a focused underground development evaluation. The historic mining record of the area has multiple accounts of mining activity and production prematurely halted. The reasons for halting the mining activity may have been litigation, unfavorable rock conditions and economic mineralization crossing claim boundaries owned by other mining companies of the time. The Company now has an opportunity to explore the mineral potential of this area more cost effectively by utilizing knowledge gained from the review of the historic records.
Occidental Group
The Occidental vein (a sub parallel vein system to the Comstock) is considered by the Company to be underexplored and recognized potentially as a significant exploration target, with historic, high grade ( > 0.3 optAu) production mined near surface in localized pods. The Occidental vein system has a measured strike length of over 7,600 feet, on land controlled by the Company. Detailed geologic assessment and mapping is ongoing to best define future drilling and development of this exploration target.
Production
The Company operated a heap leach based, gold and silver production system, including a zinc-precipitate based Merrill-Crowe processing plant. The Company, under the existing water pollution control permit with the State of Nevada, has the crushing and processing capacity to operate at a rate of up to 4.0 million tons of material crushed and stacked, per annum. The Merrill-Crowe system facilitated that capacity with an operating fluid processing rate of over 1,000 gallons per minute.
The Company completed the extraction of mineralized material from the mine and additional mineralized material for the historic dump materials adjacent to the Lucerne Mine during the third quarter of 2015, and stacked those materials on the leach pads where the mineralized material continued under solution until the target gold and silver recovery rates had been achieved. The Company completed the leaching process from its leach pads in December 2016. The Company also stacked over
13,000
tons of mineralized material during May 2016. The final metallurgical yield estimates for all materials were approximately
88.5%
, for gold and 60% for silver.
44
The following table presents mining operations and gold and silver production by quarter for 2016 and 2015:
|
4Q 2016
|
3Q 2016
|
2Q 2016
|
1Q 2016
|
Total 2016
|
4Q 2015
|
3Q 2015
|
2Q 2015
|
1Q 2015
|
Total 2015
|
|||||||||||||||||||||
|
Mining Operations
|
||||||||||||||||||||||||||||||
|
Tons Mined
|
—
|
|
—
|
|
—
|
|
—
|
|
—
|
|
17,851
|
|
140,415
|
|
254,856
|
|
316,199
|
|
729,321
|
|
||||||||||
|
Processing
|
||||||||||||||||||||||||||||||
|
Tons Crushed
|
—
|
|
—
|
|
13,197
|
|
—
|
|
13,197
|
|
17,851
|
|
104,286
|
|
211,942
|
|
157,612
|
|
491,691
|
|
||||||||||
|
Weighted Average Grade Per Ton Au
|
—
|
|
—
|
|
0.025
|
|
—
|
|
0.025
|
|
0.023
|
|
0.021
|
|
0.030
|
|
0.039
|
|
0.031
|
|
||||||||||
|
Weighted Average Grade Per Ton Ag
|
—
|
|
—
|
|
0.436
|
|
—
|
|
0.436
|
|
0.564
|
|
0.573
|
|
0.654
|
|
0.734
|
|
0.659
|
|
||||||||||
|
Estimated Au Ounces Stacked
|
—
|
|
—
|
|
336
|
|
—
|
|
336
|
|
404
|
|
2,240
|
|
6,438
|
|
6,083
|
|
15,165
|
|
||||||||||
|
Estimated Ag Ounces Stacked
|
—
|
|
—
|
|
5,758
|
|
—
|
|
5,758
|
|
10,072
|
|
59,717
|
|
138,639
|
|
115,689
|
|
324,117
|
|
||||||||||
|
Estimated Au Equivalent* Ounces Stacked
|
—
|
|
—
|
|
413
|
|
—
|
|
413
|
|
540
|
|
3,034
|
|
8,344
|
|
7,669
|
|
19,587
|
|
||||||||||
|
Au Ounces Poured and Sold
|
276
|
|
853
|
|
1,255
|
|
1,702
|
|
4,086
|
|
2,334
|
|
3,847
|
|
4,575
|
|
4,695
|
|
15,451
|
|
||||||||||
|
Ag Ounces Poured and Sold
|
6,578
|
|
17,510
|
|
22,131
|
|
29,438
|
|
75,657
|
|
42,649
|
|
62,480
|
|
60,112
|
|
56,482
|
|
221,723
|
|
||||||||||
|
Au Equivalent* Ounces Poured
|
368
|
|
1,110
|
|
1,548
|
|
2,073
|
|
5,099
|
|
2,907
|
|
4,678
|
|
5,400
|
|
5,470
|
|
18,455
|
|
||||||||||
|
* Au Equivalent ounces = Au ounces (actual) + (Ag ounces (actual) ÷ the ratio of average gold to silver prices)
|
70.89
|
|
68.05
|
|
75.09
|
|
79.68
|
|
73.43
|
|
74.04
|
|
75.27
|
|
72.73
|
|
72.91
|
|
73.77
|
|
||||||||||
45
The following table presents weighted average grades of gold and silver by quarter:
|
Weighted Average per ton Gold
|
Weighted Average per ton Silver
|
||||
|
Q1, 2014
|
0.024
|
|
0.345
|
|
|
|
Q2, 2014
|
0.034
|
|
0.546
|
|
|
|
Q3, 2014
|
0.026
|
|
0.564
|
|
|
|
Q4, 2014
|
0.039
|
|
0.680
|
|
|
|
2014
|
0.030
|
|
0.527
|
|
|
|
Q1, 2015
|
0.039
|
|
0.734
|
|
|
|
Q2, 2015
|
0.030
|
|
0.654
|
|
|
|
Q3, 2015
|
0.021
|
|
0.573
|
|
|
|
Q4, 2015
|
0.023
|
|
0.564
|
|
|
|
2015
|
0.031
|
|
0.659
|
|
|
|
Q1, 2016
|
—
|
|
—
|
|
|
|
Q2, 2016
|
0.025
|
|
0.436
|
|
|
|
Q3, 2016
|
—
|
|
—
|
|
|
|
Q4, 2016
|
—
|
|
—
|
|
|
|
2016
|
0.025
|
|
0.436
|
|
|
The Company produced
18,455
and
5,099
gold equivalent ounces in 2015 and 2016, respectively. The Company estimated recovery reached approximately
88.5%
of the recoverable gold and
59.5%
of the recoverable silver from the heap leach
For the quarter ended
December 31, 2016
, the Company realized an average sales price of $1,250.08 per ounce of gold and $17.54 per ounce of silver. In comparison, commodity market prices averaged $1,217.99 per ounce of gold and $17.18 per ounce of silver.
For the year ended
December 31, 2016
, the Company realized an average sales price of
$1,241.27
per ounce of gold and
$18.02
per ounce of silver. In comparison, commodity market prices in
2016
averaged
$1,248.36
per ounce of gold and
$17.10
per ounce of silver.
Operating Costs
During fiscal year
2016
, actual cost applicable to mining revenue was
$5.7 million
,
$4.5 million
net of silver by-product credits as compared to
$14.2 million
,
$10.7 million
net of silver by-product credits in
2015
. This
60%
reduction of cost applicable to mining revenue is primarily a result of significantly lower labor and processing costs due to the Company’s transition from surface mining to underground exploration and development and higher experienced metallurgical yields. Costs applicable to mining revenue include processing labor, processing maintenance, processing reagents and assaying costs, among others. Cost applicable to mining revenue also includes
$2.6 million
and
$5.4 million
of depreciation for
2016
, and
2015
.
During the year ended
December 31, 2016
, the Company also focused on reducing non-mining costs. The Company has aggressively implemented organizational changes consistent with our transition from mining the Lucerne surface mine to growing our resource portfolio and related exploration and development activities toward production-ready mining projects. Accordingly, general and administrative costs and other non-mining costs, including mine claims and land costs, other real estate operating costs and environmental costs, have already declined $7 million as compared to
2015
. In addition, the Company eliminated royalties on both the Dayton and Lucerne Resource areas and simplified the capital structure, saving an additional $5.5 million over 2015, in dividends and payments associated with the former preferred share structure. The Company incurred approximately $0.3 million in severance costs during the year ended
December 31, 2016
, in mining, mine support and general and administrative expenses, associated with organizational cost reductions.
46
Outlook
Production during 2016 was limited to processing of existing leach pad materials. Considering the increased estimates of gold and silver recoveries, that is,
88.5%
for gold and
59.5%
for silver, the leach cycle continued well into the fourth quarter. The Company ceased processing material from its leach pad in December 2016. All operating costs associated with hauling, crushing and other ancillary activities have been eliminated or dramatically reduced as we transition the full organizational focus toward the discovery, development and establishment of reserves from Dayton and Lucerne, for future mining, and the exploration of our other targets, including the Spring Valley and the Occidental. The Company expects to operate with approximately 10 employees, including expert land, permitting, geology, engineering and metallurgical professionals. Total operating expenses for 2017 are expected to be $3.5 million, including Exploration and mine development, Mine claims, Environmental and reclamation, and General and administrative cost but excluding depreciation and amortization. Interest expense is expected to be $1.3 million.
The Company plans to sell non-mining related lands, buildings and water rights, for expected net cash proceeds of more than $14 million during the next twelve to eighteen months resulting in net profit of more than $8 million. These proceeds will be free of income taxes, eliminate current debt obligations and strengthen the financial position of the Company.
During the second quarter of 2017, the Company also plans on commencing Reverse Circulation (RC) drilling in Dayton sufficient to finalize the parameters of a mine plan and commence the permitting for the Dayton Mine. Infill drilling is expected to significantly expand the reserve potential for the Dayton mine plans. The Company has developed grade shells with higher average grades and believes the Dayton to have economically feasible potential and plans on developing those mine plans toward full feasibility during 2017, and production within the next two years. The Lucerne mine is fully permitted and requires additional drilling and development for advancing feasibility and establishing reserves.
The Company will report the results of the Lucerne and Dayton exploration and development programs as they become available.
Recent Developments
On July 14, 2016 the Bureau of Land Management (BLM), Sierra Front Field Office, conveyed ownership of approximately 24 acres to Northern Comstock, LLC. The parcel known locally as “Lot 51” is located on the American Flat Road, in Storey County, Nevada. The parcel was established as a lot and patented during the historic mining heyday of the Comstock District. The BLM’s action legally recognizes Lot 51 as private property. This marks the successful completion of a multi-year process to acquire this land from the BLM. Lot 51 represents a strategic parcel of land that enables an expanded and efficient haul route from the Lucerne mine.
On July 25, 2016, a wholly-owned subsidiary of the Company purchased 98 acres of land and 257 acre-feet of senior priority water rights in Silver Springs, Nevada for $3.2 million and entered into a Loan Agreement (the “Loan Agreement”) of $3.3 million for the purpose of purchasing the real property and water rights. The Loan Agreement was made with GF Comstock 1 LP, a third party. Hard Rock Nevada Inc., an employee owned entity, participated in approximately $0.2 million of the loan through GF Comstock 1 LP. The indebtedness under the Loan Agreement is secured by a deed of trust on the property purchased. The indebtedness under the Loan Agreement was fully repaid in January 2017, as part of the Debenture refinancing.
On August 1, 2016, the BLM approved a Right-of-Way Amendment for Comstock Mining LLC. In July 2012 Comstock Mining LLC submitted an application to the BLM to amend its existing Right-of-Way on the American Flat Road, located in Gold Hill, Storey County. Under the approved Right-of-Way Amendment, Comstock Mining LLC would be permitted to realign a portion of the American Flat Road to segregate public traffic from haul traffic for public safety. The Lucerne Haul Road, which Comstock Mining LLC has used since August 2012, would be used exclusively for haul purposes for public safety between the Lucerne Pit and American Flat where a processing facility exists. In order to approve the Right-of-Way Amendment, the BLM first had to complete compliance with the National Historic Preservation Act. This was done in February 2016 with the execution of a Memorandum of Agreement to resolve adverse effects to eight historic properties present. The BLM has also completed compliance with the National Environmental Policy Act by approving an environmental assessment.
On January 13, 2017, the Company issued an
11%
Senior Secured Debenture (the “Debenture”) due
2021
in an aggregate principal amount of
$10,723,000
. The Debenture is secured by (1) the pledge of equity interests in the Company’s subsidiaries Comstock Mining LLC, Comstock Real Estate, Inc. and Comstock Industrial LLC (collectively, the “Subsidiaries”) and (2) substantially all of the assets of the Company and the Subsidiaries pursuant to the Pledge and Security
47
Agreement (the “Security Agreement”) dated January 13, 2017. Hard Rock Nevada Inc., and employee owned entity, and another related party who is a significant shareholder of the Company participated in the debenture.The use of proceeds included refinancing substantially all of the Company’s then current obligations, certain drilling and development activities and general corporate purposes.
The Debenture has a term of four years. For the first two years following the initial issue date, interest on the Debenture will be payable in cash or in the form of additional Debentures to be issued by the Company (valued at face value) or a combination of the two types of consideration, at the Company’s option.
Equity Raises
In March and April 2016, the Company raised
$4.0 million
(approximately
$3.5 million
net of issuance costs) through an underwritten public offering of
11,500,000
shares of common stock at a price per share of
$0.35
.
During the year ended
December 31, 2016
, the Company issued
1,835,300
shares of common stock through the Company’s at-the-market offering program. Gross proceeds from the issuance of shares totaled approximately
$0.5 million
at an average price per share of
$0.28
.
Comparative Financial Information
Below we set forth a summary of comparative financial information for the twelve months ended
December 31, 2016
,
2015
and
2014
.
|
2016
|
2015
|
2014
|
Difference
2016 versus 2015 |
Difference
2015 versus 2014 |
|||||||||||||||
|
Revenue - mining
|
$
|
4,944,627
|
|
$
|
18,245,633
|
|
$
|
24,736,929
|
|
$
|
(13,301,006
|
)
|
$
|
(6,491,296
|
)
|
||||
|
Revenue - real estate
|
125,590
|
|
247,217
|
|
846,432
|
|
(121,627
|
)
|
(599,215
|
)
|
|||||||||
|
|
|
|
|
|
|||||||||||||||
|
Costs applicable to mining revenue
|
4,505,811
|
|
10,652,372
|
|
19,126,632
|
|
(6,146,561
|
)
|
(8,474,260
|
)
|
|||||||||
|
Real estate operating costs
|
182,423
|
|
342,634
|
|
1,260,972
|
|
(160,211
|
)
|
(918,338
|
)
|
|||||||||
|
Exploration and mine development
|
4,561,905
|
|
6,958,636
|
|
2,658,473
|
|
(2,396,731
|
)
|
4,300,163
|
|
|||||||||
|
Mine claims and costs
|
1,125,989
|
|
1,299,823
|
|
2,393,722
|
|
(173,834
|
)
|
(1,093,899
|
)
|
|||||||||
|
Environmental and reclamation
|
1,309,901
|
|
2,054,447
|
|
2,464,314
|
|
(744,546
|
)
|
(409,867
|
)
|
|||||||||
|
Land and road development
|
79,461
|
|
2,857,720
|
|
—
|
|
(2,778,259
|
)
|
2,857,720
|
|
|||||||||
|
General and administrative
|
3,518,071
|
|
6,752,731
|
|
6,371,954
|
|
(3,234,660
|
)
|
380,777
|
|
|||||||||
|
Loss from Operations
|
(10,213,344
|
)
|
(12,425,513
|
)
|
(8,692,706
|
)
|
2,212,169
|
|
(3,732,807
|
)
|
|||||||||
|
OTHER INCOME (EXPENSE)
|
|
|
|
|
|||||||||||||||
|
Change in fair value of derivatives
|
—
|
|
—
|
|
(963,169
|
)
|
—
|
|
963,169
|
|
|||||||||
|
Interest expense
|
(753,670
|
)
|
(1,216,887
|
)
|
(997,112
|
)
|
463,217
|
|
(219,775
|
)
|
|||||||||
|
Other income (expense)
|
(1,997,690
|
)
|
3,187,973
|
|
1,014,214
|
|
(5,185,663
|
)
|
2,173,759
|
|
|||||||||
|
Net Loss
|
$
|
(12,964,704
|
)
|
$
|
(10,454,427
|
)
|
$
|
(9,638,773
|
)
|
$
|
(2,510,277
|
)
|
$
|
(815,654
|
)
|
||||
Mining revenue decreased by
$13.3 million
in
2016
, as compared to the year ended
2015
. This decrease is primarily the result of lower production in
2016
. In the year ended
2016
, the Company produced and shipped
4,086
ounces of gold at the average selling price of
$1,241
. In comparison, the Company produced and shipped
15,451
ounces of gold at the average selling price of
$1,195
and
19,601
ounces of gold at the average selling price of $1,272 for the years ended
2015
and
2014
, respectively.
48
Real estate revenue was
$0.1 million
for the year ended
December 31, 2016
. This represents a decrease of
$0.1 million
from
2016
to
2015
. Effective April 1, 2015, the Company entered into an agreement to lease the Gold Hill Hotel operations. The Company retains ownership to the land and the Gold Hill Hotel properties while leasing the facilities and business to independent operators. Real estate revenue decreased $
0.6 million
from
2015
to
2014
. This decrease is primarily from higher direct hospitality revenue in 2015, in addition to leasing revenue from the independent operators, whereas 2016, reflects solely leasing revenue.
Real estate operating costs decreased
$0.2 million
for the year ended
December 31, 2016
, as compared to the year ended December 31,
2015
. This decrease primarily resulted from costs savings related to the leasing of the facilities and business to independent operators. Real estate operating costs decreased
$0.9 million
for the year ended
2015
compared to the same period in
2014
. This decrease is primarily from leasing the hotel to independent operators.
Costs applicable to mining revenue decreased by $
6.1 million
for the year ended
December 31, 2016
, as compared to
2015
. The
58%
reduction resulted from the completion of the Company’s first phase of mining and the transition toward the next phase of exploration and mine development resulting in lower mining and processing costs from the reduction of mining and processing staff. Costs applicable to mining revenue decreased by
$8.5 million
for the year ended
December 31, 2015
, as compared to
2014
. The decrease resulted from lowered labor, equipment and drill and blast costs, primarily due to a lower strip ratio and lower fuel costs, from both lower consumption and lower fuel prices. The lower labor resulted from lower production and a reduction in the support labor force by 43 employees during the year.
Exploration and mine development decreased by
$2.4 million
in
2016
, as compared to
2015
. The decrease is a result of exploration costs related to underground development activities and the completion of the Lucerne underground drifts in February 2016. The majority of the exploration and development was completed in 2015. Accordingly, exploration and mine development costs increased by
$4.3 million
in
2015
, as compared to
2014
. The increase was the result of exploration activities, including contract service fees associated with the commencement of the underground drift and drilling for the first underground exploration phase of the Lucerne Resource areas PQ target and the completion of a near-surface, drilling program at the Dayton Resource area.
Mine claim and costs decreased by
$0.2 million
for the year ended
2016
, as compared to
2015
. Mine claim costs consist of annual claim filing fees and annual payments related to the Northern Comstock joint venture. The operating agreement of Northern Comstock LLC was amended in the third quarter of 2015, resulting in significantly lower annual costs, from $1.9 million in 2014, to $0.8 million in 2015 and 2016. Ongoing costs have been permanently reduced to $0.8 million per annum.
Environmental and reclamation costs decreased by $
0.7 million
in
2016
, as compared to year ended
2015
. The decrease is the result of lower environmental labor and lower asset retirement obligation depreciation.
Environmental and reclamation
expenses decreased $
0.4 million
for the year ended
2015
, as compared to the year ended
2014
. The decrease is the result of lower environmental consulting and lower third party expenses associated with engineering services and mine planning offset by an increase in costs of contract service fees to commence the underground drift and drilling, associated with the first underground exploration phase of a PQ target.
Land and road development costs were
$2.9 million
in 2015 due to the road realignment project that was successfully completed in 2015.
General and administrative expenses decreased by
$3.2 million
for the year ended
2016
, as compared to the year ended
2015
. This decrease is primarily due to lower payroll costs of approximately $1.3 million, reduced fees, insurance and marketing of $0.6 million, reduced tax liabilities of $0.5 million, lower contributions of $0.4 million, lower legal and consulting fees of approximately $0.3 million, among other reductions, all in line with the cost reduction programs. General and administrative expenses increased by
$0.4 million
for the year ended
2015
, as compared to the year ended
2014
. This increase is primarily due to higher property and net proceeds tax. This was offset by lower payroll, accounting, legal, and administrative costs.
Change in fair value of derivatives decreased by
$1.0 million
for the year ended December 31, 2015, as compared to the year ended December 31, 2014. This change is primarily the result of the debt derivative obligation related to make whole provisions in the agreement with The Golden Goose Mine for the purchase of the properties in the Dayton Resource area. The make whole provision and shares issued were replaced with a note payable. There was no derivative liability recorded in 2016.
Interest expense decreased by
$0.5 million
in
2016
, as compared to year ended
2015
. The decrease is the result of the reduction or payoff of various financing agreements and loans.
49
Other loss increased by $
5.2 million
in
2016
, as compared by
2015
. The increase primarily resulted from a reduction in a loss contingency of approximately $3.2 million that was included in other income in the condensed consolidated statements of operations in 2015, and did not recur in 2016, and from other costs associated with property and equipment purchases. Other income increased by
$2.2 million
in 2015, as compared to 2014, as a result of gains resulting from the lapse of previously recorded contingencies associated with certain tax indemnities.
Net loss was
$13.0 million
and
$10.5 million
for the years ended
December 31, 2016
, and
2015
, respectively. The increase of
$2.5 million
from
2016
to
2015
was primarily the result of $13.3 million decrease in revenue,
$6.1 million
lower mining and processing costs,
$2.4 million
decrease in exploration and development costs,
$3.2 million
of lower general and administrative costs,
$0.7 million
lower environmental costs, offset by a $0.4 million reduction in interest expense and approximately
$5.2 million
in other income. The increase of
$0.8 million
from
2015
, to
2014
was primarily the result of an increase of mine development and exploration costs and the road development costs associated with SR 342, offset by a decrease in cost applicable to mining expense due to focused costs reduction and savings activities in hauling, related maintenance, mining, consulting, and stock based compensation expense and slightly higher revenue from production.
Liquidity and Capital Resources
Total current assets were
$8.0 million
at
December 31, 2016
. Cash and cash equivalents on hand at
December 31, 2016
totaled
$0.2 million
. The Company had no inventories, stockpiles, or mineralized material on leach pad. Subsequent to December 31, 2016 the Company issued an
11%
Senior Secured Debenture (the “Debenture”) due
2021
in an aggregate principal amount of
$10,723,000
, entered into a Securities Purchase Agreement (the “Securities Purchase Agreement”). The Debenture is secured by (1) the pledge of equity interests in the Subsidiaries and (2) substantially all of the assets of the Company and the Subsidiaries pursuant to the Security Agreement. The use of proceeds included refinancing substantially all of the Company’s then current obligations, and provided over $1 million for certain drilling and development activities and general corporate purposes. The table below shows the effect of the deal on year end balances.
|
|
December 31, 2016
|
Pro Forma 12/31/16
|
|||
|
Cash and cash equivalents
|
184,359
|
|
1,835,096
|
|
|
|
Long-term debt obligations and capital lease – current portion
|
483,669
|
|
483,669
|
|
|
|
Long-term debt and capital lease obligations
|
8,986,626
|
|
11,965,960
|
|
|
|
Common stock
|
123,453
|
|
123,453
|
|
|
The Company’s current capital resources include cash and cash equivalents and other working capital resources, certain planned, non-mining asset sales with expected net proceeds of over $7 million and existing financing arrangements, including an at-the-market offering program with International Assets Advisory LLC (“IAA”) described below. While the Company has been successful in the past in obtaining the necessary capital to support its operations, including registered equity financings from its existing shelf registration, borrowings, or other means, there is no assurance that the Company will be able to obtain additional equity or other financing, if needed. The Company believes it will have sufficient funds to sustain operations during the next twelve months as a result of the sources of funding described above.
During the twelve months ended December 31, 2016, the Company prioritized the continued reduction of all non-mining costs and including general and administrative, targeting $8.0 million of savings from reduced labor, legal, consulting and other general corporate expenditures, as compared to 2015.
The Company plans to sell non-mining related lands, buildings and water rights, valued at over $15 million, with expected net cash proceeds of over $14 million. These proceeds will eliminate debt obligations and strengthen the financial position of the Company. In the second and third quarters of 2016, the Company sold surface mining equipment, no longer required in our mine plans, for approximately $2 million that was used to significantly reduce the financing obligations associated with Caterpillar Finance. These combined actions should eliminate all or substantially all of the Company’s debt obligations in the next twelve months. There is no assurance that the Company will be able to sell such assets on favorable terms, or at all.
On June 28, 2016, the Company entered into an agreement with IAA, pursuant to which the Company may offer and sell shares of the Company’s common stock, par value $0.000666 per share, having an aggregate offering price of up to $5 million. Any shares offered and sold will be issued pursuant to the Company’s shelf registration statement on Form S-3 (and the related prospectus) declared effective by the SEC on February 5, 2016. Under the agreement, IAA may sell shares by any
50
method permitted by law and deemed to be an “at-the-market” offering as defined in Rule 415 promulgated under the Securities Act, including sales made directly on the NYSE MKT or on any other existing trading market for the common stock, sales to or through a market maker or sales in privately negotiated transactions. The Company is not obligated to make any sales of shares under the agreement, and if it elects to make any sales, the Company may set a minimum sales price for the shares. The offering of shares pursuant to the Sales Agreement will terminate upon the termination of the Sales Agreement by IAA or the Company, as permitted therein. The Company will pay IAA a commission rate of up to 2.5% of the gross sales price per share sold, subject to an agreed-upon minimum per share commission, and has agreed to reimburse IAA for certain specified expenses in connection with entering into the agreement. The Company also agreed to provide indemnification and contribution to IAA with respect to certain liabilities, including liabilities under the Securities Act. As of December 31, 2016, the Company sold 1,835,300 shares of common stock under the agreement resulting in net proceeds of $0.5 million.
On March 31, 2016, and April 13, 2016, the Company completed an underwritten public offering totaling
11,500,000
shares of its common stock. Gross proceeds to the Company from this offering were approximately
$4.0 million
before deducting underwriting commissions and other offering expenses of
$0.5 million
paid by the Company.
Net cash used in operating activities for the twelve months ended
December 31, 2016
was approximately
$2.6 million
as compared to
$3.0 million
for the year ended
2015
. The Company’s use of cash in
2016
was primarily related to underground drift and exploration expenditures, including the PQ and Succor targets and operating losses due to lower production. Our use of cash in
2015
, included $2.9 million for the SR-342 road realignment project, $3.3 million costs related to underground drift and exploration and $2.0 million for a reduction of accrued liabilities, offset by positive cash flow from revenues in excess of costs associated with mining revenue due to lower operating costs associated with lower labor, blasting, fuel and lower equipment costs.
Net cash provided by investing activities for the year ended
December 31, 2016
, was
$2.6 million
, primarily from equipment sales of approximately $3.2 million, offset by purchase of land and properties of approximately $0.8 million. Cash used in investing for the year ended
2015
, was approximately
$5.1 million
, primarily from $2.5 million for strategic land purchases, $2.3 million for the design and construction of the heap leach expansion, $1.0 million deposits towards the purchase of lands and bond deposit increases of $0.1 million, net of $0.8 million of proceeds received from the sale of equipment that was previously used in mining development and production activities.
Net cash used in financing activities for fiscal year
2016
was
$1.4 million
, comprised of net proceeds of $4.0 million from the sale of securities, $0.6 million proceeds from an amended agreement with Auramet and $0.3 million from proceeds from a short-term note
,
offset by the pay-down of long-term debt obligations of approximately $6.3 million. Net cash provided by financing activities for the year ended
2015
, was
$4.5 million
, comprised of proceeds of approximately $6.0 million from the sale of securities and proceeds of $4.4 million from the Revolving Credit Facility with Auramet and $5.0 million from the Varilease equipment lease agreement, partially off-set by the pay-down of our long-term debt obligations of approximately $10.9 million.
The accompanying unaudited condensed consolidated financial statements have been prepared assuming the Company will continue as a going concern, which considers the realization of assets and discharge of liabilities in the normal course of business and does not include any adjustments that might result from the outcome of uncertainties noted below.
The Company’s success depends on its ability to recover precious metals, process them and successfully sell them for more than the cost of production. The Company has limited control over its costs and has no ability to control the market prices. The costs of exploration and production may fluctuate as a result of a number of factors, such as the changing composition of ore grade or mineralized material production, and metallurgy and exploration activities in response to the physical shape and location of the ore body or deposit. In addition, costs are affected by the price of commodities such as fuel and electricity. Such commodities are at times subject to volatile price movements, including increases that could make production unprofitable. A material increase in production costs or a decrease in the price of gold or other minerals could materially affect the Company’s ability to generate cash flow.
Mineral exploration, particularly for gold and other precious metals, is highly speculative in nature, involves many risks and frequently is nonproductive. If gold mineralization is discovered, it may take a number of years from the initial phases of drilling until production is possible, if ever, during which time the economic feasibility of production may change. Substantial expenditures are required to establish ore reserves through drilling and analysis, to develop metallurgical processes to extract metal from the ore, and (in the case of new properties) to develop the processing facilities and infrastructure at any site chosen for mineral exploration. There can be no assurance that gold reserves or mineralized material that may be discovered or acquired in the future, if any, will be in sufficient quantities or of adequate grade to justify commercial operations
51
or that the funds required for mineral production operation can be obtained on a timely or reasonable basis, if at all. In addition, mineralized material or reserves that may be identified, if any, will be depleted by production.
The capital expenditures and time required to develop and explore our properties are considerable and changes in costs or construction schedules, delays in such construction or both can adversely affect project economics and expected production and profitability.
On March 28, 2016, the Company entered into a Drilling and Development Services for Common Stock Investment Agreement (the “Stock Investment Agreement”) between the Company and American Mining & Tunneling, LLC and American Drilling Corp, LLC (collectively “American”), pursuant to which the Company agreed to issue up to 9,000,000 shares of the Company’s common stock to AMT in exchange for $5.0 million in exchange for future drilling, mine development and underground mining services in connection with (but not limited to) the Company’s construction of an underground exploration portal, mining infrastructure and development of the Company’s Lucerne and Dayton Mine projects.
Future operating expenditures above management’s expectations, including exploration and mine development expenditures in excess of amounts to be raised from the issuance of equity under the ATM Agreement or in excess of the $5.0 million of services in exchange for stock under the agreement with American Mining and Tunneling, would adversely affect the Company’s results of operations, financial condition and cash flows. If the Company was unable to obtain any necessary additional funds, this could have an immediate material adverse effect on liquidity and could raise substantial doubt about the Company’s ability to continue as a going concern. In such case, the Company could be required to limit or discontinue certain business plans, activities or operations, reduce or delay certain capital expenditures or sell certain assets or businesses. There can be no assurance that the Company would be able to take any such actions on favorable terms, in a timely manner or at all.
Contractual Obligations
Our contractual obligations at
December 31, 2016
are summarized as follows:
|
|
Payments Due by Period
|
||||||||||||||||||
|
|
|
Less than
|
1 - 3
|
4 - 5
|
More Than
|
||||||||||||||
|
Contractual Obligations
|
Total
|
1 Year
|
Years
|
Years
|
5 Years
|
||||||||||||||
|
Long-term debt and capital lease obligations
(1)
|
$
|
10,195,870
|
|
$
|
634,545
|
|
$
|
9,236,052
|
|
$
|
325,273
|
|
$
|
—
|
|
||||
|
Operating Leases
(2)
|
9,083,900
|
|
850,900
|
|
2,521,500
|
|
1,685,000
|
|
4,026,500
|
|
|||||||||
|
Reclamation and remediation obligations
(3)
|
7,353,346
|
|
—
|
|
7,353,346
|
|
—
|
|
—
|
|
|||||||||
|
|
$
|
26,633,116
|
|
$
|
1,485,445
|
|
$
|
19,110,898
|
|
$
|
2,010,273
|
|
$
|
4,026,500
|
|
||||
|
(1)
|
Amounts represent principal of
$9.5 million
, and estimated interest payments of $0.7 million, assuming no early extinguishment. See Note 10 to the Consolidated Financial Statements.
|
|
(2)
|
The Company leases certain properties under operating leases expiring at various dates through 2027. See Note 19 to the Consolidated Financial Statements. Amounts include minimum rental and minimum advance royalty payments.
|
|
(3)
|
We are required to mitigate long-term environment impacts by stabilizing, contouring, resloping, and revegetating various portions of a site after mining and mineral processing operations are completed. These reclamation efforts are conducted in accordance with plans reviewed and approved by the appropriate regulatory agencies. The Nevada State Environmental Commission and Division of Environmental Protection and other agencies have approved our most recent reclamation plans, as revised, of approximately $7.1 million. In addition, the Company placed a
$0.6 million
reclamation surety bond through the Lexon Surety Group (“Lexon”), which includes
$0.1 million
with Storey County related to the move of State Route 342 and a $1.5 million with Storey County related to reclamation as of
December 31, 2016
. See Note 8 to the Consolidated Financial Statements.
|
52
Critical Accounting Estimates
The SEC has requested that all registrants address their most critical accounting policies. The SEC has indicated that a “critical accounting policy” is one which is both important to the representation of the registrant’s financial condition and results and requires management’s most difficult, subjective or complex judgments, often as a result of the need to make estimates about the effect of matters that are inherently uncertain. We base our estimates on past experience and on various other assumptions our management believes to be reasonable under the circumstances, the results of which form the basis for making judgments about carrying values of assets and liabilities that are not readily apparent from other sources. Actual results will differ, and may differ materially from these estimates under different assumptions or conditions. Additionally, changes in accounting estimates could occur in the future from period to period. Our management has discussed the development and selection of our most critical financial estimates with the audit committee of our Board of Directors. The following paragraphs identify our most critical accounting policies:
Impairment of Mineral Rights and Properties, Plant and Equipment
The Company assesses its mineral rights and properties, plant and equipment for possible impairment whenever events or changes in circumstances indicate that the carrying value of the assets may not be recoverable. Such indicators include changes in the Company’s business plans, changes in precious metal prices and significant downward revisions of estimated mineralization quantities. If the carrying value of an asset exceeds the future undiscounted cash flows expected from the asset, an impairment charge is recorded for the excess of carrying value of the asset over its estimated fair value.
Determination as to whether and how much an asset is impaired involves management estimates on highly uncertain matters such as future commodity prices, the effects of inflation and technology improvements on operating expenses, and the outlook for global or regional demand conditions for gold and silver. However, the impairment reviews and calculations are based on assumptions that are consistent with the Company’s business plans and long-term investment decisions.
Reclamation and Remediation Obligations
Reclamation costs are allocated to expense over the life of the related assets and are periodically adjusted to reflect changes in the estimated present value resulting from the passage of time and revisions to the estimates of either the timing or amount of the reclamation and remediation costs. Reclamation obligations are based on when the spending for an existing environmental disturbance will occur. We review, on at least an annual basis, the reclamation obligation at each mine site in accordance with guidance for accounting for asset retirement obligations.
Reclamation obligations for inactive mines are accrued based on management’s best estimate of the costs expected to be incurred at a site. Such cost estimates include, where applicable, ongoing care, maintenance and monitoring costs. Changes in estimates at inactive mines are reflected in earnings in the period an estimate is revised.
Accounting for reclamation and remediation obligations requires management to make estimates unique to each mining operation of the future costs we will incur to complete the reclamation and remediation work required to comply with existing laws and regulations. Actual costs incurred in future periods could differ from amounts estimated. Additionally, future changes to environmental laws and regulations could increase the extent of reclamation and remediation work required. Any such increases in future costs could materially impact the amounts charged to earnings for reclamation and remediation.
Stock-Based Compensation
We measure share-based compensation cost at the grant date based on the value of the award and recognize the cost as an expense over the term of the vesting period. Judgment is required in estimating the fair value of share-based awards granted and their expected forfeiture rate. If actual results differ significantly from these estimates, stock-based compensation expense and our results of operations could be materially impacted.
Income Taxes
Our income tax expense and deferred tax assets and liabilities reflect management’s best assessment of estimated future taxes to be paid. Deferred income taxes arise from temporary differences between the tax and financial statement recognition of revenue and expense. In evaluating our ability to recover our deferred tax assets, we consider all available positive and negative evidence, including scheduled reversals of deferred tax liabilities, projected future taxable income, tax planning strategies and recent financial operations. In projecting future taxable income, we develop assumptions including the amount of future state, federal and foreign pretax operating income, the reversal of temporary differences, and the
53
implementation of feasible and prudent tax planning strategies. These assumptions require significant judgment about the forecasts of future taxable income and are consistent with the plans and estimates that we are using to manage the underlying businesses. Valuation allowances are recorded as reserves against net deferred tax assets by the Company when it is determined that net deferred tax assets are not likely to be realized in the foreseeable future.
The calculation of our tax liabilities involves dealing with uncertainties in the application of complex tax laws and regulations. Income tax positions must meet a more-likely-than-not recognition threshold to be recognized.
Inventories, Stockpiles and Mineralized Material on Leach Pads
Inventories, including stockpiles and mineralized material on leach pads are carried at the lower of cost or net realizable value. Cost is comprised of production costs for mineralized material produced and processed. Production costs include the costs of materials, costs of processing, direct labor, stock-based compensation, mine site and processing facility overhead costs, and depreciation, depletion and amortization.
Stockpiles -
Stockpiles represent mineralized material that has been extracted from the mine and is available for further processing. Stockpiles are measured by estimating the number of tons added and removed from the stockpile. Stockpile tonnages are verified by periodic surveys. Costs are allocated to stockpiles based on relative values of material stockpiled and processed using current mining costs incurred up to the point of stockpiling the material, including applicable overhead, depreciation, and depletion relating to mining operations, and removed at each stockpile’s average cost per ton. We record stockpiles at the lower of average cost or net realizable value (“NRV”) and carrying values are evaluated at least quarterly. NRV represents the estimated future sales price based on short-term and long-term metals prices, less estimated costs to complete production and bring the product to sale. The primary factors that influence the need to record write-downs of stockpiles include short-term and long-term metals prices and costs for production inputs such as labor, fuel and energy, materials and supplies, as well as realized mineralized material grades and actual production levels. If short-term and long-term metals prices decrease, the value of the stockpiles may decrease, and it may be necessary to record a write-down of stockpiles to NRV. Cost allocation to stockpiles and the NRV measurement involves the use of estimates and assumptions unique to each mining operation regarding current and future operating and capital costs, metal recoveries, production levels, commodity prices, engineering data and other factors. A high degree of judgment is involved in determining such assumptions and estimates and no assurance can be given that actual results will not differ significantly from those estimates and assumptions.
Mineralized Material on Leach Pads -
The Company utilizes a heap leaching process to recover gold from its mineralized material. Under this method, the mineralized material is placed on leach pads where it is treated with a chemical solution, which dissolves the gold contained in the material. The resulting gold-bearing solution is further processed in a facility where the gold is recovered. Costs are added to mineralized material on leach pads based on current mining and processing costs, including applicable depreciation and depletion relating to mining and processing operations. Costs are transferred from mineralized material on leach pads to subsequent stages of in-process inventories as the gold-bearing solution is processed. The value of such transferred costs of mineralized material on leach pads is based on the average cost per estimated recoverable ounce of gold on the leach pad. The estimates of recoverable gold on the leach pads are calculated from the quantities of material placed on the leach pads (measured tons added to the leach pads), the grade of material placed on the leach pads (based on assay data) and a recovery percentage. In general, leach pads recover approximately 95% of the recoverable ounces in the first six months of leaching, declining each month thereafter until the leaching process is complete. Although the quantities of recoverable material placed on the leach pads are reconciled by comparing the grades of material placed on pads to the quantities of gold actually recovered (metallurgical balancing), the nature of the leaching process inherently limits the ability to precisely monitor inventory levels. As a result, the metallurgical balancing process is constantly monitored and estimates are refined based on actual results over time.
Variations between actual and estimated quantities resulting from changes in assumptions and estimates that do not result in write-downs to NRV are accounted for on a prospective basis. The significant assumptions in determining the NRV apart from production cost and capitalized expenditure assumptions include gold prices. If short-term and long-term metals prices decrease, the value of the material on leach pads may decrease, and it may be necessary to record a write-down of mineralized material on leach pads to NRV.
In-process Inventories -
In-process inventories represent mineralized materials that are currently in the process of being converted to a saleable product through the Merrill-Crowe process. The value of in-process material is measured based on assays of the material fed into the process and the projected recoveries of material. In-process inventories are valued at the average cost of the material fed into the process attributable to the source material coming from the mines, stockpiles and/or leach pads plus the in-process conversion costs, including applicable depreciation relating to the process facilities incurred to that point in the process.
54
Metal Price –
Changes in the market price of gold may significantly affect our profitability and cash flow. Gold prices fluctuate widely due to factors such as: demand, global mine production levels, investor sentiment, central bank reserves, and the value of the U.S. dollar.
Interest Rate Risk –
Our exposure to market risk is confined to our cash and cash equivalents, all of which have maturities of less than three months and bear and pay interest in U.S. dollars. Since we invest in highly liquid, relatively low yield investments, we do not believe interest rate changes would have a material impact on us.
Our risk associated with fluctuating interest expense is limited to capital leases and other short-term obligations we may incur in our normal operations. The interest rates on our existing long-term debt borrowings are fixed and as a result, interest due on borrowings are not impacted by changes in market-based interest rates.
55
Item 8.
Financial Statements and Supplementary Data
CONSOLIDATED FINANCIAL STATEMENTS
DECEMBER 31,
2016
,
2015
AND
2014
|
|
Page
|
|
|
|
|
|
|
|
|
|
|
|
|
|
|
|
Financial Statement Schedule
Comstock Mining Inc. and Subsidiaries
The following consolidated financial statement schedule of Comstock Mining Inc. and subsidiaries is filed as part of this Form 10-K. All other schedules have been omitted because they are not applicable, not required, or the information is included in the consolidated financial statements or notes thereto.
Exhibits. The exhibits listed in the accompanying index to exhibits immediately following the financial statements are filed as part of, or hereby incorporated by reference into, this Form 10-K.
56
REPORT OF INDEPENDENT REGISTERED PUBLIC ACCOUNTING FIRM
To the Board of Directors and Stockholders of
Comstock Mining Inc.
Virginia City, Nevada
We have audited the accompanying consolidated balance sheets of Comstock Mining Inc. and subsidiaries (the “Company”) as of December 31, 2016 and 2015, and the related consolidated statements of operations, changes in stockholders’ equity, and changes in cash flows for each of the three years in the period ended December 31, 2016. Our audits also included the financial statement schedule listed in the Index at Item 15. These financial statements and financial statement schedule are the responsibility of the Company’s management. Our responsibility is to express an opinion on the financial statements and financial statement schedule based on our audits.
We conducted our audits in accordance with the standards of the Public Company Accounting Oversight Board (United States). Those standards require that we plan and perform the audit to obtain reasonable assurance about whether the financial statements are free of material misstatement. An audit includes examining, on a test basis, evidence supporting the amounts and disclosures in the financial statements. An audit also includes assessing the accounting principles used and significant estimates made by management, as well as evaluating the overall financial statement presentation. We believe that our audits provide a reasonable basis for our opinion.
In our opinion, such consolidated financial statements present fairly, in all material respects, the financial position of Comstock Mining Inc. and subsidiaries as of December 31, 2016 and 2015, and the results of their operations and their cash flows for each of the three years in the period ended December 31, 2016, in conformity with accounting principles generally accepted in the United States of America. Also, in our opinion, such financial statement schedule, when considered in relation to the basic consolidated financial statements taken as a whole, presents fairly in all material respects the information set forth therein.
/s/ Deloitte & Touche LLP
Salt Lake City, Utah
March 9, 2017
F-1
COMSTOCK MINING INC. AND SUBSIDIARIES
CONSOLIDATED BALANCE SHEETS
DECEMBER 31,
2016
AND
2015
|
December 31, 2016
|
December 31, 2015
|
||||||
|
ASSETS
|
|
|
|
|
|||
|
CURRENT ASSETS:
|
|
|
|
|
|||
|
Cash and cash equivalents
|
$
|
184,359
|
|
$
|
1,663,170
|
|
|
|
Accounts receivable
|
—
|
|
24,642
|
|
|||
|
Inventories (Note 3)
|
—
|
|
450,951
|
|
|||
|
Stockpiles and mineralized material on leach pads (Note 3)
|
—
|
|
1,322,211
|
|
|||
|
Assets held for sale, Net (Note 6)
|
5,894,220
|
|
—
|
|
|||
|
Prepaid expenses and other current assets (Note 4)
|
1,885,792
|
|
2,188,053
|
|
|||
|
Total current assets
|
7,964,371
|
|
5,649,027
|
|
|||
|
MINERAL RIGHTS AND PROPERTIES, Net (Note 5)
|
7,205,081
|
|
7,205,081
|
|
|||
|
PROPERTIES, PLANT AND EQUIPMENT, Net (Note 6)
|
15,148,567
|
|
26,596,859
|
|
|||
|
RECLAMATION BOND DEPOSIT (Note 7)
|
2,622,544
|
|
2,642,804
|
|
|||
|
RETIREMENT OBLIGATION ASSET (Note 8)
|
617,126
|
|
1,107,120
|
|
|||
|
OTHER ASSETS
|
285,342
|
|
12,000
|
|
|||
|
TOTAL ASSETS
|
$
|
33,843,031
|
|
$
|
43,212,891
|
|
|
|
LIABILITIES AND STOCKHOLDERS’ EQUITY
|
|
|
|
|
|||
|
CURRENT LIABILITIES:
|
|
|
|
|
|||
|
Accounts payable
|
$
|
804,551
|
|
$
|
1,964,371
|
|
|
|
Accrued expenses (Note 9)
|
1,135,934
|
|
1,639,526
|
|
|||
|
Long-term debt and capital lease obligations – current portion (Note 10)
|
483,669
|
|
8,538,336
|
|
|||
|
Total current liabilities
|
2,424,154
|
|
12,142,233
|
|
|||
|
LONG-TERM LIABILITIES:
|
|
|
|
|
|||
|
Long-term debt and capital lease obligations (Note 10)
|
8,986,626
|
|
4,759,213
|
|
|||
|
Long-term reclamation liability (Note 8)
|
7,353,346
|
|
6,827,568
|
|
|||
|
Other liabilities
|
662,316
|
|
724,407
|
|
|||
|
Total long-term liabilities
|
17,002,288
|
|
12,311,188
|
|
|||
|
Total liabilities
|
19,426,442
|
|
24,453,421
|
|
|||
|
COMMITMENTS AND CONTINGENCIES (Note 18)
|
|
|
|
|
|||
|
STOCKHOLDERS’ EQUITY:
|
|
|
|
|
|||
|
Common stock, $.000666 par value, 3,950,000,000 shares authorized,
185,363,676 and 159,917,711 shares issued and outstanding at December 31, 2016 and 2015, respectively |
123,453
|
|
106,505
|
|
|||
|
Additional paid-in capital
|
226,321,375
|
|
217,716,500
|
|
|||
|
Accumulated deficit
|
(212,028,239
|
)
|
(199,063,535
|
)
|
|||
|
Total stockholders’ equity
|
14,416,589
|
|
18,759,470
|
|
|||
|
TOTAL LIABILITIES AND STOCKHOLDERS’ EQUITY
|
$
|
33,843,031
|
|
$
|
43,212,891
|
|
|
See notes to the consolidated financial statements.
F-2
COMSTOCK MINING INC. AND SUBSIDIARIES
YEARS ENDED DECEMBER 31,
2016
,
2015
AND
2014
|
|
2016
|
2015
|
2014
|
||||||||
|
REVENUES
|
|
|
|
|
|
|
|||||
|
Revenue - mining
|
$
|
4,944,627
|
|
$
|
18,245,633
|
|
$
|
24,736,929
|
|
||
|
Revenue - real estate
|
125,590
|
|
247,217
|
|
846,432
|
|
|||||
|
Total revenues
|
5,070,217
|
|
18,492,850
|
|
25,583,361
|
|
|||||
|
COST AND EXPENSES
|
|
|
|
|
|
|
|||||
|
Costs applicable to mining revenue
|
4,505,811
|
|
10,652,372
|
|
19,126,632
|
|
|||||
|
Real estate operating costs
|
182,423
|
|
342,634
|
|
1,260,972
|
|
|||||
|
Exploration and mine development
|
4,561,905
|
|
6,958,636
|
|
2,658,473
|
|
|||||
|
Mine claims and costs
|
1,125,989
|
|
1,299,823
|
|
2,393,722
|
|
|||||
|
Environmental and reclamation
|
1,309,901
|
|
2,054,447
|
|
2,464,314
|
|
|||||
|
Land and road development
|
79,461
|
|
2,857,720
|
|
—
|
|
|||||
|
General and administrative
|
3,518,071
|
|
6,752,731
|
|
6,371,954
|
|
|||||
|
Total cost and expenses
|
15,283,561
|
|
30,918,363
|
|
34,276,067
|
|
|||||
|
LOSS FROM OPERATIONS
|
(10,213,344
|
)
|
(12,425,513
|
)
|
(8,692,706
|
)
|
|||||
|
OTHER INCOME (EXPENSE)
|
|
|
|
|
|
|
|||||
|
Change in fair value of derivatives
|
—
|
|
—
|
|
(963,169
|
)
|
|||||
|
Interest expense
|
(753,670
|
)
|
(1,216,887
|
)
|
(997,112
|
)
|
|||||
|
Other income (expense)
|
(1,997,690
|
)
|
3,187,973
|
|
1,014,214
|
|
|||||
|
Total other income (expense), net
|
(2,751,360
|
)
|
1,971,086
|
|
(946,067
|
)
|
|||||
|
NET LOSS
|
(12,964,704
|
)
|
(10,454,427
|
)
|
(9,638,773
|
)
|
|||||
|
DIVIDENDS ON CONVERTIBLE PREFERRED STOCK
|
—
|
|
(5,452,445
|
)
|
(3,672,785
|
)
|
|||||
|
NET LOSS AVAILABLE TO COMMON SHAREHOLDERS
|
$
|
(12,964,704
|
)
|
$
|
(15,906,872
|
)
|
$
|
(13,311,558
|
)
|
||
|
Net loss per common share – basic
|
$
|
(0.07
|
)
|
$
|
(0.14
|
)
|
$
|
(0.17
|
)
|
||
|
Net loss per common share – diluted
|
$
|
(0.07
|
)
|
$
|
(0.14
|
)
|
$
|
(0.17
|
)
|
||
|
Weighted average common shares outstanding — basic
|
176,624,733
|
|
110,072,486
|
|
78,586,266
|
|
|||||
|
Weighted average common shares outstanding — diluted
|
176,624,733
|
|
110,072,486
|
|
78,586,266
|
|
|||||
See notes to the consolidated financial statements.
F-3
COMSTOCK MINING INC. AND SUBSIDIARIES
CONSOLIDATED STATEMENTS OF CHANGES IN STOCKHOLDERS’ EQUITY
YEARS ENDED DECEMBER 31,
2016
,
2015
AND
2014
|
|
Convertible Preferred Stock
|
|
|
|
|
|
|||||||||||||||||||||||||||||||||
|
|
Series A-1
|
Series A-2
|
Series B
|
Common Stock
|
Additional Paid-in Capital
|
Accumulated
Deficit
|
|
||||||||||||||||||||||||||||||||
|
|
Shares
|
Amount
|
Shares
|
Amount
|
Shares
|
Amount
|
Shares
|
Amount
|
Amount
|
Amount
|
Total
|
||||||||||||||||||||||||||||
|
BALANCE - January 1, 2014
|
24,362
|
|
$
|
16
|
|
1,610
|
|
$
|
1
|
|
24,193
|
|
$
|
16
|
|
70,188,937
|
|
$
|
46,746
|
|
$
|
199,167,304
|
|
$
|
(178,970,335
|
)
|
$
|
20,243,748
|
|
||||||||||
|
Common stock issued for:
|
|
|
|
|
|
|
|
|
|
|
|
|
|
|
|
|
|
|
|
|
|||||||||||||||||||
|
Public offering
|
7,475,000
|
|
4,978
|
|
10,988,304
|
|
10,993,282
|
|
|||||||||||||||||||||||||||||||
|
Public offering issuance costs
|
(32,019
|
)
|
(32,019
|
)
|
|||||||||||||||||||||||||||||||||||
|
Vested restricted stock
|
1,777,000
|
|
1,184
|
|
(1,184
|
)
|
—
|
|
|||||||||||||||||||||||||||||||
|
Payment of dividends
|
|
|
|
|
|
|
|
|
|
|
|
|
2,254,599
|
|
1,502
|
|
(1,502
|
)
|
|
|
—
|
|
|||||||||||||||||
|
Purchase of properties, plant and equipment
|
728,578
|
|
485
|
|
1,014,472
|
|
1,014,957
|
|
|||||||||||||||||||||||||||||||
|
Payment of long-term debt obligation
|
137,105
|
|
91
|
|
274,119
|
|
274,210
|
|
|||||||||||||||||||||||||||||||
|
Effective repurchase of common with issuance of long-term debt obligations
|
|
|
|
|
|
|
|
|
|
|
|
|
(1,000,000
|
)
|
(666
|
)
|
(783,118
|
)
|
|
|
(783,784
|
)
|
|||||||||||||||||
|
Conversion of Series B convertible preferred
|
|||||||||||||||||||||||||||||||||||||||
|
stock into common stock
|
|
|
|
|
|
|
|
|
(1,517
|
)
|
(1
|
)
|
919,381
|
|
612
|
|
(611
|
)
|
|
|
—
|
|
|||||||||||||||||
|
Stock-based compensation
|
|
|
|
|
|
|
|
|
|
|
|
|
|
|
|
|
169,479
|
|
|
|
169,479
|
|
|||||||||||||||||
|
Net loss
|
|
|
|
|
|
|
|
|
|
|
|
|
|
|
|
|
|
|
(9,638,773
|
)
|
(9,638,773
|
)
|
|||||||||||||||||
|
BALANCE - December 31, 2014
|
24,362
|
|
16
|
|
1,610
|
|
1
|
|
22,676
|
|
15
|
|
82,480,600
|
|
54,932
|
|
210,795,244
|
|
(188,609,108
|
)
|
22,241,100
|
|
|||||||||||||||||
|
Common stock issued for:
|
|
|
|
|
|
|
|
|
|
|
|
|
|
|
|
|
|
|
|
|
|
|
|||||||||||||||||
|
Public offering
|
|
|
|
|
|
|
|
|
|
|
|
|
10,169,492
|
|
6,773
|
|
5,993,227
|
|
|
|
6,000,000
|
|
|||||||||||||||||
|
Public offering issuance costs
|
|
|
|
|
|
|
|
|
|
|
|
|
|
|
|
|
(96,393
|
)
|
|
|
(96,393
|
)
|
|||||||||||||||||
|
Vested restricted stock
|
|
|
|
|
|
|
|
|
|
|
|
|
60,000
|
|
40
|
|
(40
|
)
|
|
|
—
|
|
|||||||||||||||||
|
Payment of dividends
|
|
|
|
|
|
|
|
|
|
|
|
|
11,842,085
|
|
7,887
|
|
(7,887
|
)
|
|
|
—
|
|
|||||||||||||||||
|
Purchase of properties, plant and equipment
|
|
|
|
|
|
|
|
|
|
|
|
|
1,726,312
|
|
1,150
|
|
1,023,640
|
|
|
|
1,024,790
|
|
|||||||||||||||||
|
Conversion of Series A-1 convertible preferred
|
|||||||||||||||||||||||||||||||||||||||
|
stock into common stock
|
(24,362
|
)
|
(16
|
)
|
37,422,416
|
|
24,923
|
|
(24,907
|
)
|
—
|
|
|||||||||||||||||||||||||||
|
Conversion of Series A-2 convertible preferred
|
|
|
|||||||||||||||||||||||||||||||||||||
|
stock into common stock
|
|
|
|
|
(1,610
|
)
|
(1
|
)
|
|
|
|
|
2,473,597
|
|
1,647
|
|
(1,646
|
)
|
|
|
—
|
|
|||||||||||||||||
|
Conversion of Series B convertible preferred
|
|||||||||||||||||||||||||||||||||||||||
|
stock into common stock
|
|
|
|
|
|
|
|
|
(22,676
|
)
|
(15
|
)
|
13,743,209
|
|
9,153
|
|
(9,138
|
)
|
|
|
—
|
|
|||||||||||||||||
|
Stock-based compensation
|
|
|
|
|
|
|
|
|
|
|
|
|
|
|
|
|
44,400
|
|
|
|
44,400
|
|
|||||||||||||||||
|
Net loss
|
|
|
|
|
|
|
|
|
|
|
|
|
|
|
|
|
|
|
(10,454,427
|
)
|
(10,454,427
|
)
|
|||||||||||||||||
|
BALANCE - December 31, 2015
|
—
|
|
|
—
|
|
—
|
|
—
|
|
—
|
|
—
|
|
159,917,711
|
|
106,505
|
|
217,716,500
|
|
(199,063,535
|
)
|
18,759,470
|
|
||||||||||||||||
F-4
|
Public offerings
|
13,335,300
|
|
8,882
|
|
4,539,007
|
|
4,547,889
|
|
|||||||||||||||||||||||||||||||
|
Public offering issuance costs
|
(610,645
|
)
|
(610,645
|
)
|
|||||||||||||||||||||||||||||||||||
|
Purchase of properties, plant and equipment
|
223,645
|
|
149
|
|
59,241
|
|
59,390
|
|
|||||||||||||||||||||||||||||||
|
Payment of debt obligation
|
10,617,896
|
|
7,072
|
|
4,116,692
|
|
4,123,764
|
|
|||||||||||||||||||||||||||||||
|
Payment for mineral lease
|
1,215,124
|
|
809
|
|
481,716
|
|
482,525
|
|
|||||||||||||||||||||||||||||||
|
Stock-based compensation
|
54,000
|
|
36
|
|
18,864
|
|
18,900
|
|
|||||||||||||||||||||||||||||||
|
Net loss
|
(12,964,704
|
)
|
(12,964,704
|
)
|
|||||||||||||||||||||||||||||||||||
|
BALANCE - December 31, 2016
|
—
|
|
$
|
—
|
|
—
|
|
$
|
—
|
|
—
|
|
$
|
—
|
|
185,363,676
|
|
$
|
123,453
|
|
$
|
226,321,375
|
|
$
|
(212,028,239
|
)
|
$
|
14,416,589
|
|
||||||||||
See notes to consolidated financial statements.
F-5
COMSTOCK MINING INC. AND SUBSIDIARIES
YEARS ENDED DECEMBER 31,
2016
,
2015
AND
2014
|
|
2016
|
2015
|
2014
|
||||||||
|
OPERATING ACTIVITIES:
|
|
|
|
|
|
|
|||||
|
Net loss
|
$
|
(12,964,704
|
)
|
$
|
(10,454,427
|
)
|
$
|
(9,638,773
|
)
|
||
|
Adjustments to reconcile net loss to net cash used in operating activities:
|
|
|
|
|
|
|
|||||
|
Depreciation, amortization and depletion
|
5,893,783
|
|
7,727,433
|
|
6,876,322
|
|
|||||
|
(Gain)/Loss on sale of properties, plant, and equipment
|
(357,037
|
)
|
(158,148
|
)
|
45,499
|
|
|||||
|
Stock payments and stock-based compensation
|
18,900
|
|
443,036
|
|
1,875,792
|
|
|||||
|
Accretion of reclamation liability
|
185,778
|
|
259,573
|
|
343,717
|
|
|||||
|
Amortization of debt discounts and issuance costs
|
456,757
|
|
566,723
|
|
621,196
|
|
|||||
|
Payment of interest expense and sales tax with common stock
|
337,863
|
|
—
|
|
—
|
|
|||||
|
Loss on payment of debt obligation with common stock
|
150,166
|
|
—
|
|
—
|
|
|||||
|
Change in fair value of shares issued to pay debt obligations
|
1,690,795
|
|
—
|
|
—
|
|
|||||
|
Net change in fair values of derivatives
|
—
|
|
—
|
|
963,169
|
|
|||||
|
Changes in operating assets and liabilities:
|
|||||||||||
|
Accounts receivable
|
24,642
|
|
297,764
|
|
(307,777
|
)
|
|||||
|
Inventories
|
450,951
|
|
(22,716
|
)
|
163,726
|
|
|||||
|
Stockpiles and mineralized material on leach pads
|
1,322,211
|
|
420,842
|
|
(1,195,573
|
)
|
|||||
|
Prepaid expenses and other current assets
|
76,297
|
|
(158,523
|
)
|
(115,926
|
)
|
|||||
|
Other assets
|
(273,342
|
)
|
20,872
|
|
25,881
|
|
|||||
|
Accounts payable
|
472,165
|
|
38,891
|
|
(333,320
|
)
|
|||||
|
Accrued expenses
|
(83,158
|
)
|
(1,977,933
|
)
|
(1,744,638
|
)
|
|||||
|
NET CASH USED IN OPERATING ACTIVITIES
|
(2,597,933
|
)
|
(2,996,613
|
)
|
(2,420,705
|
)
|
|||||
|
INVESTING ACTIVITIES:
|
|
|
|
|
|
|
|||||
|
Purchase of mineral rights and properties, plant and equipment
|
(746,536
|
)
|
(5,770,715
|
)
|
(2,624,691
|
)
|
|||||
|
Proceeds from sale of mineral rights and properties, plant and equipment
|
3,287,811
|
|
754,040
|
|
150,415
|
|
|||||
|
Change in reclamation bond deposit
|
20,260
|
|
(100,000
|
)
|
(800,000
|
)
|
|||||
|
NET CASH PROVIDED BY (USED) IN INVESTING ACTIVITIES
|
2,561,535
|
|
(5,116,675
|
)
|
(3,274,276
|
)
|
|||||
|
FINANCING ACTIVITIES:
|
|
|
|
|
|
|
|||||
|
Principal payments on long-term debt and capital lease obligations
|
(6,304,657
|
)
|
(10,855,345
|
)
|
(6,993,213
|
)
|
|||||
|
Proceeds from long-term debt obligations
|
925,000
|
|
9,419,392
|
|
4,626,289
|
|
|||||
|
Proceeds from the issuance of common stock
|
4,547,889
|
|
6,000,000
|
|
10,993,282
|
|
|||||
|
Common stock issuance costs
|
(610,645
|
)
|
(96,393
|
)
|
(32,019
|
)
|
|||||
|
NET CASH PROVIDED BY (USED IN) FINANCING ACTIVITIES
|
(1,442,413
|
)
|
4,467,654
|
|
8,594,339
|
|
|||||
|
INCREASE (DECREASE) IN CASH AND CASH EQUIVALENTS
|
(1,478,811
|
)
|
(3,645,634
|
)
|
2,899,358
|
|
|||||
|
CASH AND CASH EQUIVALENTS, BEGINNING OF YEAR
|
1,663,170
|
|
5,308,804
|
|
2,409,446
|
|
|||||
|
CASH AND CASH EQUIVALENTS, END OF YEAR
|
$
|
184,359
|
|
$
|
1,663,170
|
|
$
|
5,308,804
|
|
||
|
SUPPLEMENTAL CASH FLOW INFORMATION:
|
|
|
|
|
|
|
|||||
|
Cash paid for interest
|
$
|
537,510
|
|
$
|
1,099,306
|
|
$
|
736,320
|
|
||
|
Cash paid for income taxes
|
$
|
—
|
|
$
|
—
|
|
$
|
—
|
|
||
|
|
|
|
|
|
(Continued)
|
|
|||||
F-6
COMSTOCK MINING INC. AND SUBSIDIARIES
CONSOLIDATED STATEMENTS OF CHANGES IN CASH FLOWS
YEARS ENDED DECEMBER 31,
2016
,
2015
AND
2014
|
Supplemental disclosure of non-cash investing and financing
|
|
|
|
||||||||
|
activities:
|
|
|
|
||||||||
|
|
2016
|
2015
|
2014
|
||||||||
|
Issuance of long-term debt and capital lease obligations for purchase of mineral rights and properties, plant and equipment
|
$
|
3,243,125
|
|
$
|
2,046,745
|
|
$
|
3,730,163
|
|
||
|
Issuance of common stock for long-term debt obligations payment
|
2,529,755
|
|
—
|
|
274,119
|
|
|||||
|
Issuance of common stock for properties, plant and equipment
|
16,265
|
|
1,024,790
|
|
1,014,957
|
|
|||||
|
Property transferred in satisfaction of accounts payable
|
1,100,000
|
|
—
|
|
—
|
|
|||||
|
Reduction of derivative with issuance of long term debt obligation
|
—
|
|
1,170,000
|
|
—
|
|
|||||
|
Effective repurchase of common stock with issuance of long-term debt obligation
|
—
|
|
783,118
|
|
—
|
|
|||||
|
Additions to reclamation liability and retirement obligation asset
|
340,000
|
|
659,295
|
|
140,573
|
|
|||||
|
Properties, plant and equipment purchases in current liabilities
|
—
|
|
531,985
|
|
402,803
|
|
|||||
|
Issuance of Common stock for mineral lease
|
(482,525
|
)
|
—
|
|
—
|
|
|||||
|
Reclamation bond deposit included in accrued expenses and other liabilities
|
—
|
|
—
|
|
100,000
|
|
|||||
|
Conversion of Series A-1, A-2 and Series B convertible preferred stock
|
—
|
|
35,723
|
|
612
|
|
|||||
|
Dividends paid in common stock (par value)
|
—
|
|
7,887
|
|
1,502
|
|
|||||
See notes to consolidated financial statements. (Concluded)
F-7
COMSTOCK MINING INC.
NOTES TO CONSOLIDATED FINANCIAL STATEMENTS
FOR THE YEARS ENDED DECEMBER 31,
2016
,
2015
AND
2014
1. Nature of Business
Comstock Mining Inc. is a Nevada-based gold and silver exploration, development and production-focused mining company with extensive, contiguous property in the historic Comstock and Silver City mining districts (collectively, the “Comstock District”). The Comstock District is located within the western portion of the Basin and Range Province of Nevada, between Reno and Carson City, Nevada. Our Lucerne Resource area is located in Storey County, Nevada, approximately three miles south of Virginia City, Nevada and 30 miles southeast of Reno, Nevada. Our Dayton Resource area is located in Lyon County, Nevada, approximately six miles south of Virginia City, Nevada. The Company also owns extensive real estate holdings, including but not limited to the Gold Hill Hotel located in Gold Hill, Nevada, just south of Virginia City, the Daney Ranch, located just south of Silver City and
98
acres of land and
257
acre-feet of senior-priority water rights in Silver Springs, Nevada.
As used in the notes to the consolidated financial statements, we refer to Comstock Mining Inc., and its wholly owned subsidiaries as “we,” “us,” “our,” “our Company,” or “the Company.”
We continue expanding our property footprint and creating opportunities for exploration, development and mining. The Company now owns or controls approximately
8,631
acres of mining claims and parcels in the Comstock and Silver City Districts. The acreage is comprised of approximately
2,266
acres of patented claims (private lands) and surface parcels (private lands) and approximately
6,365
acres of unpatented mining claims, which the Bureau of Land Management, (“BLM”) administers.
2. Summary of Significant Accounting Policies
Principles of Consolidation -
The consolidated financial statements include the accounts of Comstock Mining Inc., and its wholly owned subsidiaries: Comstock Mining LLC, Comstock Real Estate Inc. and Comstock Industrial LLC. Inter-company transactions and balances have been eliminated.
Basis of Presentation -
The accompanying consolidated financial statements have been prepared in conformity with accounting principles generally accepted in the United States of America which contemplate continuation of the Company as a going concern.
The Company transitioned into production with the Lucerne Mine in 2012, and ramped up to approximately
20,000
gold-equivalent-ounces of annual production. The Company completed leaching from its existing leach pads in December 2016, and is currently planning the exploration and development of its next two mines, first with its second surface mine in the Dayton and then further developing an underground mine plan for Lucerne.
The Company has recurring net losses from operations and an accumulated deficit of
$212.0 million
as of
December 31, 2016
. For the year ended
December 31, 2016
, the Company incurred a net loss of
$13.0 million
and used net cash of
$2.6 million
in operating activities. The Company’s current capital resources include cash and cash equivalents and other working capital resources, and existing financing arrangements. As of
December 31, 2016
, the Company had cash and cash equivalents of
$0.2 million
, current assets of
$8.0 million
and current liabilities of
$2.4 million
, resulting in working capital of
$5.5 million
.
As further described in Note 10, in January 2017, the Company entered into a refinancing agreement and issued an
11%
Senior Secured Debenture (the “Debenture”) due
2021
in the amount of
$10.7 million
. The Debenture retires substantially all of the Company’s obligations. Until January 1, 2019, interest will be payable in cash and/or in the form of additional Debentures, at the Company's option. Hard Rock Nevada Inc., an employee owned entity, and another related party who is a significant shareholder of the Company participated in the debenture.
In March 2017, the Company entered into a loan commitment agreement which provides up to
$2 million
in borrowing capacity and expires in 2021 with an
11%
interest rate. Principal amounts borrowed under this agreement are not due until 2021. Until January 1, 2019, interest on any borrowings will be payable in cash and/or in the form of additional indebtedness under the agreement, at the Company’s option.
In January and February of 2017, the Company has issued shares under the at-the-market offering program entered into during 2016 (“ATM Agreement”) and received cash proceeds of
$0.3 million
. The Company had
$3.8 million
available to be used under the ATM Agreement as of the date the financial statements were issued.
F-8
While the Company has been successful in the past in obtaining the necessary capital to support its operations, including registered equity financings from its existing shelf registration statement, borrowings, or other means, there is no assurance that the Company will be able to obtain additional equity capital or other financing, if needed. However, the Company believes it will have sufficient funds to sustain its operations during the next 12 months from the date the financial statements were issued as a result of the sources of funding detailed above.
Future operating expenditures above management’s expectations, including exploration and mine development expenditures in excess of amounts to be raised from the issuance of equity under the ATM Agreement or in excess of the
$5.0 million
of services in exchange for stock under the agreement with American Mining and Tunneling, would adversely affect the Company’s results of operations, financial condition and cash flows. If the Company was unable to obtain any necessary additional funds, this could have an immediate material adverse effect on liquidity and could raise substantial doubt about the Company’s ability to continue as a going concern. In such case, the Company could be required to limit or discontinue certain business plans, activities or operations, reduce or delay certain capital expenditures or sell certain assets or businesses. There can be no assurance that the Company would be able to take any such actions on favorable terms, in a timely manner or at all.
Inventories, Stockpiles and Mineralized Material on Leach Pads -
Inventories, including stockpiles and mineralized material on leach pads are carried at the lower of cost or net realizable value. Net realizable value represents the estimated future sales price of the product based on current and long-term metals prices, less the estimated costs to complete production and bring the product to sale. Write-downs of stockpiles, mineralized material on leach pads and inventories to net realizable value are reported as a component of costs applicable to mining revenue. Cost is comprised of production costs for mineralized material produced and processed. Production costs include the costs of materials, costs of processing, direct labor, mine site and processing facility overhead costs, stock-based compensation, and depreciation, amortization and depletion.
Stockpiles
-
Stockpiles represent mineralized material that has been extracted from the mine and is available for further processing. Stockpiles are measured by estimating the number of tons added and removed from the stockpile. Stockpile tonnages are verified by periodic surveys. Costs are allocated to stockpiles based on relative values of material stockpiled and processed using current mining costs incurred up to the point of stockpiling the material, including applicable overhead, depreciation, and depletion relating to mining operations, and removed at each stockpile’s average cost per ton.
Mineralized Material on Leach Pads
-
The Company utilizes a heap leaching process to recover gold from its mineralized material. Under this method, the mineralized material is placed on leach pads where it is treated with a chemical solution that dissolves the gold contained in the material. The resulting gold-bearing solution is further processed in a facility where the gold is recovered. Costs are added to mineralized material on leach pads based on current mining and processing costs, including applicable depreciation relating to mining and processing operations. Costs are transferred from mineralized material on leach pads to subsequent stages of in-process inventories as the gold-bearing solution is processed. The value of such transferred costs of mineralized material on leach pads is based on the average cost per estimated recoverable ounce of gold on the leach pad.
The estimates of recoverable gold on the leach pads are calculated from the quantities of material placed on the leach pads (measured tons added to the leach pads), the grade of material placed on the leach pads (based on assay data) and a recovery percentage.
Although the quantities of recoverable gold placed on the leach pads are reconciled by comparing the quantities and grades of material placed on leach pads to the quantities and grades quantities of gold actually recovered (metallurgical balancing), the nature of the leaching process inherently limits the ability to precisely monitor inventory levels. As a result, the metallurgical balancing process is constantly monitored and estimates are refined based on actual results over time. Variations between actual and estimated quantities resulting from changes in assumptions and estimates that do not result in write-downs to net realizable value are accounted for on a prospective basis.
In-process Inventories
-
In-process inventories represent mineralized materials that are currently in the process of being converted to a saleable product through the Merrill-Crowe process. The value of in-process material is measured based on assays of the material fed into the process and the projected recoveries of material. In-process inventories are valued at the average cost of the material fed into the process attributable to the source material coming from the mines, stockpiles and/or leach pads plus the in-process conversion costs, including applicable depreciation relating to the process facilities incurred to that point in the process.
Finished Goods Inventories
-
Finished goods inventories include gold that has been processed through the Company’s Merrill-Crowe facility and are valued at the average cost of their production.
F-9
The Company completed leaching from its existing leach pads in December 2016, and is currently operating the solution system with the objective of evaporating the remaining solution until the next phase of mining and processing is ready to begin.
Fair Value Measurements -
The fair value of a financial instrument is the amount that could be received upon the sale of an asset or paid to transfer a liability in an orderly transaction between market participants at the measurement date. Financial assets are marked to bid prices and financial liabilities are marked to offer prices. The fair value should be calculated based on assumptions that market participants would use in pricing the asset or liability, not on assumptions specific to the entity. In addition, the fair value of liabilities should include consideration of non-performance risk, including the party’s own credit risk.
Fair value measurements do not include transaction costs. A fair value hierarchy is used to prioritize the quality and reliability of the information used to determine fair values. Categorization within the fair value hierarchy is based on the lowest level of input that is significant to the fair value measurement. The fair value hierarchy is defined into the following three categories:
Level 1: Quoted market prices in active markets for identical assets or liabilities.
Level 2: Observable market-based inputs or unobservable inputs that are corroborated by market data.
Level 3: Unobservable inputs that are not corroborated by market data.
Long-Lived Assets -
We review the carrying amount of our long-lived assets for impairment whenever there are negative indicators of impairment. An asset is considered impaired when estimated future cash flows are less than the carrying amount of the asset. In the event the carrying amount of such asset is not considered recoverable, the asset is adjusted to its fair value. Fair value is generally determined based on discounted future cash flows.
Mineral Rights and Properties -
We defer acquisition costs until we determine the viability of the property. Since we do not have proven and probable reserves as defined by Securities and Exchange Commission (“SEC”) Industry Guide 7, exploration expenditures are expensed as incurred. We expense care and maintenance costs as incurred.
We review the carrying value of our mineral rights and properties for impairment whenever there are negative indicators of impairment. Our estimate of the gold price, mineralized materials, operating capital, and reclamation costs are subject to risks and uncertainties affecting the recoverability of our investment in the mineral claims and properties. Although we have made our best, most current estimate of these factors, it is possible that near term changes could adversely affect estimated net cash flows from our mineral claims and properties and possibly require future asset impairment write-downs.
Where estimates of future net operating cash flows are not available and where other conditions suggest impairment, we assess recoverability of carrying value from other means, including net cash flows generated by the sale of the asset. We use the units-of-production method to deplete the mineral rights and properties.
Properties, Plant and Equipment -
We record properties, plant and equipment at historical cost. We provide depreciation and amortization in amounts sufficient to match the cost of depreciable assets to operations over their estimated service lives or productive value. We capitalize expenditures for improvements that significantly extend the useful life of an asset. We charge expenditures for maintenance and repairs to operations when incurred. Depreciation is computed using the straight-line method over estimated useful lives as follows:
|
Building
|
7 to 15 years
|
|
Vehicles and equipment
|
3 to 7 years
|
|
Processing and laboratory
|
5 to 15 years
|
|
Furniture and fixtures
|
2 to 3 years
|
Reclamation Liabilities and Asset Retirement Obligations -
Minimum standards for site reclamation and closure have been established for us by various government agencies. Asset retirement obligations are recognized when incurred and recorded as liabilities at fair value. The liability is accreted over time through periodic charges to earnings. In addition, the asset retirement cost is capitalized and amortized over the life of the related asset. Reclamation costs are periodically adjusted to reflect changes in the estimated present value resulting from the passage of time and revisions to the estimates of either the timing or amount of the reclamation and abandonment costs. The Company reviews, on an annual basis, unless otherwise deemed necessary, the asset retirement obligation at each mine site.
F-10
Revenue Recognition -
Revenue is recognized from sales when persuasive evidence of an arrangement exists, the price is determinable, the product has been delivered, the title has been transferred to the customer and collection of the sales price is reasonably assured. Gold revenue is recorded at an agreed upon spot price and gold ounce measurement resulting in revenue and a receivable at the time of sale. Gold revenue is recorded net of refining charges and discounts. Sales of by-products (such as silver) are credited to costs applicable to mining revenue. Real estate revenue is recognized as services are provided to customers.
All accounts receivable amounts are due from a single customer. Substantially all mining revenues recorded in the current period also related to the same customer. As gold can be sold through numerous gold market traders worldwide, the Company is not economically dependent on a limited number of customers for the sale of its product.
Stock Issued For Goods and Services -
Common and preferred shares issued for goods and services are valued based upon the fair market value of our common stock or the goods and services received, whichever is the most reliably measurable on the date of issue.
Stock-Based Compensation -
For stock-based transactions, compensation expense is recognized over the requisite service period, which is generally the vesting period, based on the estimated fair value on the grant date of the award.
Loss per Common Share -
Basic net loss per common share is computed by dividing net loss, less the preferred stock dividends, by the weighted average number of common shares outstanding. Dilutive loss per share includes any additional dilution from common stock equivalents, such as stock options and warrants, and convertible instruments, if the impact is not antidilutive. Since the Company incurred net losses for the periods presented, all equity-linked instruments are considered anti-dilutive.
Comprehensive Loss -
There were no components of comprehensive loss other than net loss for the years ended
December 31, 2016
,
2015
and
2014
.
Income Taxes -
The Company’s income tax expense and deferred tax assets and liabilities reflect management’s best assessment of estimated future taxes to be paid. Significant judgments and estimates are required in determining the consolidated income tax expense.
Deferred income taxes arise from temporary differences between the tax and financial statement recognition of revenue and expense. In evaluating the Company’s ability to recover its deferred tax assets, management considers all available positive and negative evidence, including scheduled reversals of deferred tax liabilities, projected future taxable income, tax planning strategies and recent financial operations. In projecting future taxable income, the Company develops assumptions including the amount of future state and federal pretax operating income, the reversal of temporary differences, and the implementation of feasible and prudent tax planning strategies. These assumptions require significant judgment about the forecasts of future taxable income, and are consistent with the plans and estimates that the Company is using to manage the underlying businesses. The Company provides a valuation allowance for deferred tax assets for which the Company does not consider realization of such deferred tax assets to be more likely than not.
Changes in tax laws and rates could also affect recorded deferred tax assets and liabilities in the future. Management is not aware of any such changes that would have a material effect on the Company’s results of operations, cash flows or financial position.
Use of Estimates -
In preparing financial statements in conformity with generally accepted accounting principles, we are required to make estimates and assumptions that affect the reported amounts of assets and liabilities and the disclosure of contingent assets and liabilities at the date of the financial statements and revenues and expenditures during the reported periods. Actual results could differ materially from those estimates. Estimates may include those pertaining to valuation of inventories and mineralized material on leach pads, the estimated useful lives and valuation of properties, plant and equipment, mineral rights and properties, deferred tax assets, convertible preferred stock, derivative assets and liabilities, reclamation liabilities, stock-based compensation and payments, and contingent liabilities.
Recently Issued Accounting Pronouncements –
In October 2016, the Financial Accounting Standards Board (FASB) issued Accounting Standards Update (ASU) 2016-16, Income Taxes (Topic 740). This standard is intended to improve the accounting for the income tax consequences of intra-entity transfers of assets other than inventory. ASU 2016-16 is effective for annual reporting periods beginning after December 15, 2017, including interim reporting periods within those annual reporting periods. The Company is currently evaluating the effect that adopting this new accounting guidance will have on its consolidated results of operations and financial position.
F-11
In March 2016, the FASB issued ASU 2016-09, Compensation - Stock Compensation (Topic 718). This standard is intended to simplify the accounting for several aspects of the accounting for equity-based compensation, including the income tax consequences, classification of awards as either equity or liabilities, and classification on the statement of cash flows. ASU 2016-09 is effective for interim and annual reporting periods beginning after December 15, 2016, and early adoption is permitted. The Company is currently evaluating the effect that adopting this new accounting guidance will have on its consolidated results of operations and financial position.
In February 2016, the FASB issued ASU 2016-02, Leases (Topic 842), to increase transparency and comparability among organizations by recognizing lease assets and lease liabilities on the balance sheet and disclosing key information about leasing arrangements. Topic 842 affects any entity that enters into a lease, with some specified scope exceptions. For public business entities, the amendments in this update are effective for financial statements issued for annual periods beginning after December 15, 2018, and interim periods within those annual periods. Early application is permitted for all entities. The Company is currently evaluating the impact of adopting this standard on its consolidated financial statements, which will require right of use assets and lease liabilities be recorded in the consolidated balance sheet for operating leases.
In August 2014, the FASB issued ASU 2014-15. This ASU requires management to assess an entity’s ability to continue as a going concern by incorporating and expanding upon certain principles that are currently in U.S. auditing standards. Specifically, the ASU (1) provides a definition of the term substantial doubt, (2) requires an evaluation every reporting period including interim periods, (3) provides principles for considering the mitigating effect of management’s plans, (4) requires certain disclosures when substantial doubt is alleviated as a result of consideration of management’s plans, (5) requires an express statement and other disclosures when substantial doubt is not alleviated, and (6) requires an assessment for a period of one year after the date that the financial statements are issued (or available to be issued). This standard is effective for the fiscal years ending after December 15, 2016, and for annual periods and interim periods thereafter. The Company adopted this ASU in the fourth quarter of 2016, which required enhanced disclosure in Note 2.
In May 2014, the FASB issued ASU 2014-09 that introduces a new five-step revenue recognition model that an entity should use to recognize revenue when depicting the transfer of promised goods or services to customers in an amount that reflects the consideration that the entity expects to be entitled in exchange for those goods or services. This ASU also requires disclosures sufficient to enable users to understand the nature, amount, timing, and uncertainty of revenue and cash flows arising from contracts with customers, including qualitative and quantitative disclosures about contracts with customers, significant judgments and changes in judgments, and assets recognized from the costs to obtain or fulfill a contract. This standard is effective for fiscal years beginning after December 15, 2016, including interim periods within that reporting period. The Company is currently evaluating the new guidance to determine the impact it will have on its consolidated financial statements.
In November 2015, the FASB issued ASU 2015-17, Balance Sheet Classification of Deferred Taxes, which eliminates the current requirement to present deferred tax liabilities and assets as current and noncurrent amounts in a classified statement of financial position. Instead, entities will be required to classify all deferred tax assets and liabilities as noncurrent in a statement of financial position. This standard is effective financial statements issued for annual periods beginning after December 15, 2016, and interim periods within those annual periods. Early application is permitted. The Company elected early application of this ASU, which did not have a material impact on the consolidated financial statements.
3. Inventories, Stockpiles and Mineralized Materials on Leach Pads
Inventories, stockpiles and mineralized materials on leach pads at
December 31, 2016
and
2015
consisted of the following:
|
2016
|
2015
|
||||||
|
In-process
|
$
|
—
|
|
$
|
249,130
|
|
|
|
Finished goods
|
—
|
|
201,821
|
|
|||
|
Total inventories
|
$
|
—
|
|
$
|
450,951
|
|
|
|
|
|
|
|||||
|
Stockpiles
|
$
|
—
|
|
$
|
—
|
|
|
|
Mineralized material on leach pads
|
—
|
|
1,322,211
|
|
|||
|
Total stockpiles and mineralized material on leach pads
|
$
|
—
|
|
$
|
1,322,211
|
|
|
Production during 2016 was limited to processing of existing leach pad materials. The Company completed the leaching process from its leach pads in December 2016.
F-12
4. Prepaid Expenses and Other Current Assets
Prepaid expenses at
December 31, 2016
and
2015
consisted of the following:
|
|
2016
|
2015
|
|||||
|
Land and property deposits
|
$
|
1,208,785
|
|
$
|
1,169,285
|
|
|
|
Lease obligation deposit
|
355,920
|
|
231,000
|
|
|||
|
Other
|
321,087
|
|
787,768
|
|
|||
|
Total prepaid expenses and other current assets
|
$
|
1,885,792
|
|
$
|
2,188,053
|
|
|
5. Mineral Rights and Properties, Net
Mineral rights and properties at
December 31, 2016
and
2015
consisted of the following:
|
2016
|
2015
|
||||||
|
Dayton resource area
|
$
|
2,932,226
|
|
$
|
2,932,226
|
|
|
|
Lucerne resource area
|
1,998,896
|
|
1,998,896
|
|
|||
|
Occidental area
|
1,002,172
|
|
1,002,172
|
|
|||
|
Spring Valley area
|
810,000
|
|
810,000
|
|
|||
|
Oest area
|
260,707
|
|
260,707
|
|
|||
|
Northern extension
|
157,205
|
|
157,205
|
|
|||
|
Northern targets
|
121,170
|
|
121,170
|
|
|||
|
Other mineral properties
|
317,404
|
|
317,404
|
|
|||
|
Water rights
|
90,000
|
|
90,000
|
|
|||
|
Accumulated depletion
|
(484,699
|
)
|
(484,699
|
)
|
|||
|
Total mineral rights and properties
|
$
|
7,205,081
|
|
$
|
7,205,081
|
|
|
Mineral rights and properties balances as of
December 31, 2016
, and
2015
, are presented based on the Company’s identified mineral resource areas and exploration targets. During the year ended
December 31, 2016
, the Company did not recognize any depletion expense. During years ended December 31,
2015
and
2014
, the Company recognized depletion expense of approximately
$0.1
million and
$0.2
million, respectively.
6. Properties, Plant and Equipment, Net
Properties, plant and equipment at
December 31, 2016
and
2015
consisted of the following:
|
|
2016
|
2015
|
|||||
|
Land and building
|
$
|
7,827,490
|
|
$
|
11,652,436
|
|
|
|
Vehicle and equipment
|
3,299,143
|
|
10,531,451
|
|
|||
|
Processing and laboratory
|
21,049,497
|
|
21,049,497
|
|
|||
|
Furniture and fixtures
|
755,665
|
|
901,425
|
|
|||
|
|
32,931,795
|
|
44,134,809
|
|
|||
|
Less accumulated depreciation
|
(17,783,228
|
)
|
(17,537,950
|
)
|
|||
|
Total properties, plant and equipment
|
$
|
15,148,567
|
|
$
|
26,596,859
|
|
|
During the years ended
December 31, 2016
,
2015
and
2014
, the Company recognized depreciation expense of
$5.1
million;
$6.4
million; and
$5.7
million, respectively.
F-13
During the year ended
December 31, 2016
, the Company sold land and equipment with a gross book value of approximately
$8.4 million
and accumulated depreciation of approximately
$4.3 million
. The Company recorded a gain on the sale of that land and equipment totaling
$0.4 million
.
Assets Held For Sale
The Company committed to a plan to sell certain land and buildings. As of
December 31, 2016
, the Company had assets with a net book value of
$5.9 million
that met the criteria to be classified as assets held for sale. Those criteria specify that the asset must be available for immediate sale in its present condition (subject only to terms that are usual and customary for sales of such assets), the sale of the asset must be probable, and its transfer expected to qualify for recognition as a completed sale generally within one year. Proceeds from the sale of these assets are required to be used to satisfy obligations due under the terms of the debenture with GF Comstock 2 LP.
7. Reclamation Bond Deposit
The Nevada Revised Statutes and Regulations require a surety bond to be posted for mining projects so that after the completion of such mining projects the sites are left safe, stable and capable of productive post-mining uses. The bond is intended to cover the estimated costs required to safely reclaim the natural environment to the regulatory standards established by the State of Nevada’s Division of Environmental Protection. Accordingly, the Company has a
$7.1 million
reclamation surety bond through the Lexon Surety Group (“Lexon”) with the State of Nevada’s Bureau of Mining Regulation and Reclamation as of
December 31, 2016
. In addition, the Company has a
$0.6 million
reclamation surety bond through Lexon, which includes a
$0.1 million
surety bond with Storey County related to the move of State Route 342 and a
$0.5 million
surety bond with Storey County related to mine reclamation as of
December 31, 2016
. As part of the surety agreement, the Company agreed to pay a
2.0%
annual bonding fee. The total cash collateral, per the surety agreement, was
$2.5 million
at
December 31, 2016
, and
2015
. The total cash collateral is a component of the reclamation bond deposit in the consolidated balance sheets.
The reclamation bond deposit at
December 31, 2016
and
2015
consisted of the following:
|
2016
|
2015
|
||||||
|
Lexon surety bond cash collateral
|
$
|
2,500,000
|
|
$
|
2,500,000
|
|
|
|
Other cash reclamation bond deposits
|
122,544
|
|
142,804
|
|
|||
|
Total reclamation bond deposit
|
$
|
2,622,544
|
|
$
|
2,642,804
|
|
|
8. Long-term Reclamation Liability and Retirement Obligation Asset
The Company is required to mitigate long-term environmental impacts by stabilizing, contouring, re-sloping, and re-vegetating various portions of our site after mining and mineral processing operations are completed. These reclamation efforts are conducted in accordance with plans reviewed and approved by the appropriate regulatory agencies.
We have accrued a long-term liability of
$7.4 million
and
$6.8 million
as of
December 31, 2016
, and
2015
, respectively, for our obligation to reclaim our mine facility based on our most recent reclamation plan, as revised, submitted and approved by the Nevada State Environmental Commission and Division of Environmental Protection. In conjunction with recording the reclamation liability, we recorded a retirement obligation asset that is being amortized over the period of the anticipated land disturbance. Such costs are based on management’s current estimate of then expected amounts for the remediation work, assuming the work is performed in accordance with current laws and regulations. It is reasonably possible that, due to uncertainties associated with the application of laws and regulations by regulatory authorities and changes in reclamation or remediation technology, the ultimate cost of reclamation and remediation could change in the future. We periodically review the accrued reclamation liability for information indicating that our assumptions should change. The accretion of the reclamation liability and the amortization of the retirement obligation asset for the years ended
December 31, 2016
,
2015
, and
2014
, totaled
$1.0 million
,
$1.4 million
,
$1.4 million
, respectively, and were a component of reclamation and exploration expenses in the consolidated statements of operations.
F-14
Following is a reconciliation of the aggregate retirement liability associated with our reclamation plan for the mining projects for the years ended
December 31, 2016
,
2015
and
2014
:
|
|
2016
|
2015
|
2014
|
||||||||
|
Long-term reclamation liability — beginning of period
|
$
|
6,827,568
|
|
$
|
5,908,700
|
|
$
|
5,424,410
|
|
||
|
Additional obligations incurred
|
340,000
|
|
659,295
|
|
140,573
|
|
|||||
|
Accretion of reclamation liability
|
185,778
|
|
259,573
|
|
343,717
|
|
|||||
|
Long-term reclamation liability — end of period
|
$
|
7,353,346
|
|
$
|
6,827,568
|
|
$
|
5,908,700
|
|
||
Following is a reconciliation of the aggregate retirement obligation asset associated with our mining projects for the years ended
December 31, 2016
,
2015
, and
2014
:
|
2016
|
2015
|
2014
|
|||||||||
|
Retirement obligation asset — beginning of period
|
$
|
1,107,120
|
|
$
|
1,619,101
|
|
$
|
2,491,956
|
|
||
|
Additional obligations incurred
|
340,000
|
|
659,295
|
|
140,573
|
|
|||||
|
Amortization of retirement obligation asset
|
(829,994
|
)
|
(1,171,276
|
)
|
(1,013,428
|
)
|
|||||
|
Retirement obligation asset — end of period
|
$
|
617,126
|
|
$
|
1,107,120
|
|
$
|
1,619,101
|
|
||
The increases in the reclamation liability and retirement obligation asset in 2016 is related to the net inflated and discounted increase of the asset and liability as a result of the increase in time before the Company expects to reclaim. In 2015, and 2014, increases were related to County bonding and the expansion of the heap leach facility and related infrastructure.
9. Accrued Expenses
Accrued expenses at
December 31, 2016
, and
2015
, consisted of the following:
|
|
2016
|
2015
|
|||||
|
Accrued Northern Comstock Joint Venture Contribution Obligations
|
$
|
480,833
|
|
$
|
150,833
|
|
|
|
Accrued Board of Directors fees
|
290,600
|
|
251,000
|
|
|||
|
Accrued vendor liabilities
|
121,081
|
|
633,282
|
|
|||
|
Accrued payroll
|
60,735
|
|
174,640
|
|
|||
|
Accrued personal property tax
|
56,895
|
|
115,907
|
|
|||
|
Accrued production royalties
|
7,940
|
|
120,332
|
|
|||
|
Other accrued expenses
|
117,850
|
|
193,532
|
|
|||
|
Total accrued expenses
|
$
|
1,135,934
|
|
$
|
1,639,526
|
|
|
F-15
Long-term debt and capital lease obligations at
December 31, 2016
and
2015
consisted of the following:
|
Note Description
|
2016
|
2015
|
|||||
|
$3,250,000 Note Payable (Silver Springs property) - The note matures on July 25, 2018. Principal to be paid from the proceeds from the sales of the property securing the loan. Interest is paid monthly and accrues at a rate of 9% per annum for the first year post closing, 12.5% per annum for the six months that follow the first anniversary and 14% per annum thereafter.
|
$
|
3,310,851
|
|
$
|
—
|
|
|
|
$5,000,000 Varilease Finance Obligation - Principal, 9% interest and taxes are payable in monthly installments of $247,830 due on or before April 1, 2017. Secured by certain equipment.
|
1,964,882
|
|
3,556,479
|
|
|||
|
$3,677,254 Caterpillar Equipment Consolidated - Principal and interest at 5.7% payable in monthly installments of $29,570 due on or before November 1, 2021.
|
1,540,629
|
|
—
|
|
|||
|
$9,149,943 Notes Payable (Caterpillar Equipment) - Various notes payable with interest consolidated into a new note with Caterpillar Finance on June 27, 2016.
|
—
|
|
2,679,723
|
|
|||
|
$3,824,297 Caterpillar Equipment Capital Lease - Consolidated into a new note with Caterpillar Finance on June 27, 2016.
|
—
|
|
1,652,934
|
|
|||
|
$1,800,000 Note Payable (Daney) - The Company is permitted to settle the note payable in shares of common stock issued in January 2016. Shares issued will be sold by the noteholder in satisfaction of the outstanding principal amount.
|
868,398
|
|
1,139,834
|
|
|||
|
$725,000 Note Payable (Donovan Property) - Principal and interest at 6% payable in monthly installments of $10,075 with final payment due on or before July 31, 2019. Secured by deeds of trust on land and unpatented claims.
|
300,733
|
|
414,389
|
|
|||
|
$1,000,000 Note Payable (V&T) - Principal is payable in monthly installments of $50,409 with a final payment due on April 1, 2017.
|
298,955
|
|
750,000
|
|
|||
|
$300,000 Note Payable (White House) - Principal and interest at 4.5% payable in monthly installments of $1,520 with the final payment due on or before April 1, 2017. Secured by first deed of trust on the land.
|
275,433
|
|
281,139
|
|
|||
|
$340,000 Note Payable (Gold Hill Hotel) - Principal and interest at 4.5% payable in monthly installments of $2,601 with the final payment due on or before April 30, 2026. Secured by first deed of trust on rental property.
|
239,216
|
|
259,173
|
|
|||
|
$2,500,000 Note Payable (Dayton Property "Golden Goose") - The Company is permitted to settle the remaining note payable in shares of common stock. Shares will be sold by the noteholder in satisfaction of the outstanding principal. The remaining principal is due on or before January 31, 2017. Secured by first deed of trust on the land.
|
207,562
|
|
489,212
|
|
|||
|
Notes Payable – Other - Various other notes payable with interest rates between 1.9% and 6.27% payable in monthly installments due on or before October 19, 2019. Secured by first deed of trust on various property owned by the Company.
|
277,636
|
|
474,666
|
|
|||
|
$186,000 Note Payable (Lynch House) - Payable in monthly installments of interest only at 11% with final payment due in December 2017. The Company can extend the note maturity for one year by paying a 3% extension fee. Secured by first deed of trust on property.
|
186,000
|
|
—
|
|
|||
|
$5,000,000 Note Payable (Auramet Facility) - Principal payable in semi-monthly installments of $200,000 with the final payment due on April 30, 2016. Interest at 9.5% paid in advance.
|
—
|
|
1,600,000
|
|
|||
|
Subtotal
|
9,470,295
|
|
13,297,549
|
|
|||
|
|
|
|
|
||||
|
Less current portion
|
(483,669
|
)
|
(8,538,336
|
)
|
|||
|
Long-term debt and capital lease obligations
|
$
|
8,986,626
|
|
$
|
4,759,213
|
|
|
Debt Obligations
A total of
$5.5 million
of current debt has been classified as long term debt at December 31, 2016, as amounts were refinanced on a long term basis in January 2017 with the GF Comstock 2 LP note. See note below.
F-16
GF Comstock 2 LP
On January 13, 2017, the Company issued an
11%
Senior Secured Debenture due 2021 in an aggregate principal amount of
$10,723,000
. The use of proceeds included refinancing substantially all of the Company’s current obligations except the amount due to Caterpillar Finance and the Lynch House note. Total principal is due on January 13, 2021. Interest is payable semi-annually. For the first two years interest will be payable, at the option of the Company, either in cash or in the form of additional Debentures (or a combination thereof). For the third and fourth years interest will be payable only in cash. Hard Rock Nevada Inc., and employee owned entity, and another related party who is a significant shareholder of the Company participated in the debenture.
Silver Springs Property
On July 25, 2016, a wholly-owned subsidiary of the Company purchased
98
acres of land and
257
acre-feet of senior-priority water rights in Silver Springs, Nevada for
$3.2 million
and entered into a Loan Agreement (the “Loan Agreement”) of
$3.3 million
for the purpose of purchasing the real property and water rights. The Loan Agreement was made with GF Comstock 1 LP, a third party. Hard Rock Nevada Inc., an employee owned entity, participated in approximately
$0.2 million
of the loan through GF Comstock 1 LP. The indebtedness under the Loan Agreement was secured by a deed of trust on the property purchased.
The Loan Agreement had a term of
two years
. The indebtedness under the Loan Agreement accrued interest at a rate of
9%
per annum for the first year post-closing,
12.5%
per annum for the six months that follow the first anniversary of the Loan Agreement and
14%
per annum thereafter until such indebtedness was paid in full. Proceeds from the sale of the property securing the loan must be used to repay the indebtedness under the Loan Agreement. In addition to customary remedies for secured indebtedness on real property, the Loan Agreement allowed the lender thereunder to convert the principal amount of the indebtedness into common stock of the Company upon a default. This loan was paid off in full as part of the Debenture financing.
Caterpillar Equipment Facility
On June 27, 2016, the Company completed an agreement with Caterpillar Financial Services Corporation relating to certain finance and lease agreements (the “CAT Agreement”). The Company entered into the CAT Agreement that required the Company to complete the sale of certain financed and leased equipment and modified the payment schedule under the related finance and lease arrangements. Under the terms of the CAT Agreement, the Company paid down its obligations with the net proceeds from the financed and leased equipment sold during the second and third quarters of 2016, with the remaining balance to be paid off from a monthly payment schedule of primarily
$29,570
per month until the amounts have been paid in full. During the months of June, July and August, the Company sold equipment for net proceeds of approximately
$2.1 million
that was applied to principal and interest due on the loan. The note bears an interest rate of
5.7%
.
Daney Ranch Property
On August 31, 2015, the Company entered into a note in the amount of
$1.8 million
for the purchase of land and buildings. The note does not bear interest. Upon entering into the note, the Company issued
1,538,462
shares of common stock to the noteholder as partial payment on the note. In February 2016, an additional
3,000,000
shares of common stock were issued to the noteholder to be sold in satisfaction of the outstanding principal balance. In August 2016, the maturity date was extended to April 29, 2017. To the extent proceeds received by the noteholder from the sale of the shares received are less than the outstanding principal balance; the Company would make a final payment for the difference. This loan was paid off in full as part of the GF Comstock 2 financing.
Dayton Property “Golden Goose”
During 2016, the Company amended the Golden Goose note, extended the maturity to January 2017, and issued
1,000,000
shares of common stock to be sold in partial satisfaction of the outstanding principal balance. To the extent proceeds received by the noteholder from the sale of the shares received are less than the outstanding principal balance; the Company would make a final payment for the difference. This loan was paid off in full as part of the GF Comstock 2 financing.
F-17
Varilease Finance Inc.
On May 12, 2015, the Company entered into a master lease agreement with Varilease Finance Inc. in which the Company obtained capital financing under a sale-leaseback transaction in the amount of
$5 million
. Due to certain types of continuing involvement, the Company was precluded from applying sale leaseback accounting and has accounted for the transaction under the financing method. The Company’s obligations under the Varilease agreement are secured by an interest in the Company’s mining equipment in exchange for
24
monthly payments. Current payments are
$247,830
per month. The monthly payments since lease start will total the cash proceeds of
$5 million
and applicable interest and taxes. During the year ended December 31, 2016, the Company issued
6,617,896
shares of common stock in partial satisfaction of lease payment obligations through the remainder of 2016. To the extent proceeds received by Varilease from the sale of the shares received are less than the lease payments required to be made, the Company would make a final cash payment for the difference. As of December 31, 2016,
1,041,000
shares remain unsold by Varilease and are recorded within prepaid expenses and other current assets. This loan was paid off in full as part of the GF Comstock 2 LP financing and remaining shares sold in satisfaction of debt obligation.
Future maturities of long-term debt are as follows:
|
Years Ending December 31:
|
|
||
|
2017
|
$
|
483,669
|
|
|
2018
|
291,532
|
|
|
|
2019
|
308,590
|
|
|
|
2020
|
8,070,314
|
|
|
|
2021
|
316,190
|
|
|
|
Thereafter
|
—
|
|
|
|
|
$
|
9,470,295
|
|
11. Stockholders’ Equity
Common Stock
In March and April 2016, the Company raised
$4.0
million in gross proceeds (approximately
$3.5
million net of issuance cost) through an underwritten public offering of
11.5 million
shares of common stock at a price per share of
$0.35
under the Company’s Registration Statement on Form S-3.
At-the-Market Offering Program
Effective June 28, 2016, the Company entered into a sales agreement with respect to an at-the-market offering program (“ATM Agreement”) pursuant to which the Company may offer and sell, from time to time at its sole discretion, shares of its common stock, having an aggregate offering price of up to
$5.0 million
. The Company pays the sales agent a commission of
2.5%
of the gross proceeds from the sale of such shares. The Company is not obligated to make any sales of shares under the ATM Agreement, and if it elects to make any sales, the Company can set a minimum sales price for the shares. Following is a reconciliation of the transactions under the ATM Agreement as of
December 31, 2016
:
|
December 31, 2016
|
||||
|
Number of shares sold
|
1,835,300
|
|
||
|
Gross proceeds
|
$
|
522,889
|
|
|
|
Fees
|
14,090
|
|
||
|
Net proceeds
|
$
|
508,799
|
|
|
|
Average price per share
|
$
|
0.28
|
|
|
F-18
Stock-based Incentive Plans
During the year ended
December 31, 2016
,
no
shares were issued under the 2011 Equity Incentive Plan. During the year ended December 31, 2015,
60,000
shares of vested restricted stock were issued under the 2011 Equity Incentive Plan.
Stock-based Dividends
During the year ended December 31, 2015 and 2014, the Company declared and issued
5,670,065
and
2,254,599
shares of common stock with a fair value of
$3.9 million
and
$3.9 million
, respectively, as dividends on outstanding shares of convertible preferred stock.
No
shares of common stock were issued as dividends in the year ended
December 31, 2016
, as a result of the conversion of the Preferred Stock into shares of Common Stock during the year ended December 31, 2015, that eliminated all future stock dividends.
Other Stock-based transactions
During the year ended December 31, 2015, the Company amended an agreement entered into in 2013, with V&T Management LLC, for the purchase of approximately
212
acres of land. The original agreement was valued at
$1.5 million
, including cash and
650,000
in Company restricted common stock. The new terms of the amended agreement revoked the portion of the purchase price in shares and required the remaining balance to be paid in cash. As a result of the amendment,
650,000
restricted shares in common stock were returned to the Company and canceled.
During the year ended
December 31, 2016
, the Company issued
6,617,896
shares of common stock with a fair value of
$2,473,764
to Varilease Finance Inc. The shares were issued in satisfaction of lease payment obligations.
During the year ended
December 31, 2016
, the Company issued
3,000,000
shares of common stock with a fair value of
$1,290,000
to the Daney noteholder as payment on the note.
During the year ended
December 31, 2016
, the Company issued
1,215,124
shares of common stock with a fair value of
$482,526
to Northern Comstock LLC (“Northern Comstock”), a related party of the Company. The shares were issued in satisfaction of an annual capital contribution pursuant to the Northern Comstock operating agreement amendment signed in August 2015.
During the year ended
December 31, 2016
, the Company amended the Golden Goose note to allow for the sale of shares as payment on the remaining note balance and effectively re-issued
1,000,000
shares of common stock with a fair value of
$360,000
to be sold in partial satisfaction of the outstanding principal balance.
During the year ended
December 31, 2016
, the Company closed escrow on the purchases of land and property. The purchases included the issuance of
223,645
shares of common stock with a fair value of
$59,390
.
12. Fair Value Measurements
Assets and Liabilities Measured at Fair Value on a Recurring Basis
The following table presents our assets and liabilities at
December 31, 2016
, which are measured at fair value on a recurring basis:
|
|
|
Fair Value Measurements at December 31, 2016
|
|||||||||||||
|
Total
|
Quoted
Prices
in Active
Markets
(Level 1)
|
Significant
Other
Observable
Inputs
(Level 2)
|
Significant
Unobservable
Inputs
(Level 3)
|
||||||||||||
|
Assets:
|
|||||||||||||||
|
Deposits on financing agreement (Varilease Finance)
|
$
|
124,920
|
|
$
|
124,920
|
|
$
|
—
|
|
$
|
—
|
|
|||
|
Total Assets
|
$
|
124,920
|
|
$
|
124,920
|
|
$
|
—
|
|
$
|
—
|
|
|||
|
Liabilities:
|
|||||||||||||||
|
Note payable (Daney Ranch Property)
|
$
|
868,398
|
|
$
|
868,398
|
|
$
|
—
|
|
$
|
—
|
|
|||
|
Note payable (Dayton Property “Golden Goose”)
|
207,562
|
|
207,562
|
|
—
|
|
—
|
|
|||||||
|
Total Liabilities
|
$
|
1,075,960
|
|
$
|
1,075,960
|
|
$
|
—
|
|
$
|
—
|
|
|||
F-19
The following table presents our liabilities at
December 31, 2015
, which are measured at fair value on a recurring basis:
|
|
|
Fair Value Measurements at December 31, 2015
|
|||||||||||||
|
Total
|
Quoted
Prices
in Active
Markets
(Level 1)
|
Significant
Other
Observable
Inputs
(Level 2)
|
Significant
Unobservable
Inputs
(Level 3)
|
||||||||||||
|
Liabilities:
|
|
|
|
|
|
|
|
|
|||||||
|
Note payable (Daney Ranch Property)
|
$
|
1,139,834
|
|
$
|
—
|
|
$
|
1,139,834
|
|
$
|
—
|
|
|||
|
Total Liabilities
|
$
|
1,139,834
|
|
$
|
—
|
|
$
|
1,139,834
|
|
$
|
—
|
|
|||
During the years ended
December 31, 2016
and
2015
, there were no transfers of assets and liabilities between Level 1, Level 2, or Level 3.
Following is a description of the valuation methodologies used for the Company’s financial instruments measured at fair value on a recurring basis as well as the general classification of such instruments pursuant to the valuation hierarchy.
Deposit on financing agreement (Varilease Finance)
- The deposit is valued as the amount of the proceeds to be received by Varilease Finance from the sale of the remaining
1,041,000
shares of common stock to be sold by the maturity date. The Company calculated the proceeds received for the shares based on the price the noteholder received for those shares. These inputs included a quoted contractual terms and stock price. Because the inputs are quoted and final price, this instrument is classified within Level 1 of the valuation hierarchy.
Notes payable (Daney Ranch Property) -
The note payable is valued as the difference between the
$0.9 million
face amount as of
December 31, 2016
, reduced by the proceeds to be received by the noteholder from the sale of the remaining
3,153,500
shares of common stock to be sold through April 2017 by the noteholder. Subsequent to year end the note holder sold all their shares and the note was eliminated. The Company calculated the proceeds received for the shares based on the price the noteholder received for those shares. These inputs included a quoted contractual terms and stock price. Because the inputs are quoted and final price, this instrument is classified within Level 1 of the valuation hierarchy. For the year ended December 31, 2015, the Company had estimated the proceeds to be received up on the sale of the common stock by the noteholder using the Black-Scholes model with various observable inputs. These inputs included contractual terms, stock price, volatility, dividend yield, and risk free interest rates. Because the inputs were observable market-based inputs, this instrument was classified within Level 2 of the valuation hierarchy.
Note payable (Dayton Property “Golden Goose”) -
The note payable is valued as the difference between the
$0.5 million
face amount, reduced by the proceeds to be received by the noteholder from the sale of the
1,000,000
shares of common stock to be sold by the maturity date of January 2017 by the noteholder. Subsequent to year end, the note holder sold all their shares and the note was eliminated. The Company calculated the proceeds received for the shares based on the price the noteholder received for those shares. These inputs included a quoted contractual terms and stock price. Because the inputs are quoted and final price, this instrument is classified within Level 1 of the valuation hierarchy.
The carrying amount of cash and cash equivalents and trade payables approximates fair value because of the short-term maturity of these financial instruments. At December 31, 2016, and December 31, 2015, the fair value of long-term debt and capital lease obligations approximated
$7.6
million and
$11.9
million, respectively, as determined by borrowing rates estimated to be available to the Company for debt with similar terms and conditions. The fair value of assets and liabilities whose carrying value approximates fair value is determined using Level 2 inputs, with the exception of cash and cash equivalents (Level 1).
F-20
13. Segment Reporting
Our management organizes the Company into
two
operating segments, mining and real estate. Our mining segment consists of all activities and expenditures associated with mining, exploration and mine development. Our real estate segment consists of land, real estate rental properties and the Gold Hill Hotel. We evaluate the performance of our operating segments based on operating income (loss). All intercompany transactions have been eliminated, and intersegment revenues are not significant. Financial information relating to our reportable operating segments and reconciliation to the consolidated totals is as follows:
|
Year Ended
December 31,
|
|||||||||||
|
|
2016
|
2015
|
2014
|
||||||||
|
Revenues
|
|
|
|
|
|
|
|||||
|
Mining
|
$
|
4,944,627
|
|
$
|
18,245,633
|
|
$
|
24,736,929
|
|
||
|
Real estate
|
125,590
|
|
247,217
|
|
846,432
|
|
|||||
|
Total revenues
|
5,070,217
|
|
18,492,850
|
|
25,583,361
|
|
|||||
|
Cost and Expenses
|
|
|
|
|
|
|
|||||
|
Mining
|
$
|
(15,101,138
|
)
|
$
|
(30,575,729
|
)
|
$
|
(33,015,095
|
)
|
||
|
Real estate
|
(182,423
|
)
|
(342,634
|
)
|
(1,260,972
|
)
|
|||||
|
Total cost and expenses
|
(15,283,561
|
)
|
(30,918,363
|
)
|
(34,276,067
|
)
|
|||||
|
Operating Loss
|
|
|
|
|
|
|
|||||
|
Mining
|
$
|
(10,156,511
|
)
|
$
|
(12,330,096
|
)
|
$
|
(8,278,166
|
)
|
||
|
Real estate
|
(56,833
|
)
|
(95,417
|
)
|
(414,540
|
)
|
|||||
|
Total loss from operations
|
(10,213,344
|
)
|
(12,425,513
|
)
|
(8,692,706
|
)
|
|||||
|
Other expense, net
|
(2,751,360
|
)
|
1,971,086
|
|
(946,067
|
)
|
|||||
|
Net loss
|
$
|
(12,964,704
|
)
|
$
|
(10,454,427
|
)
|
$
|
(9,638,773
|
)
|
||
|
Capital Expenditures
|
|
|
|
|
|
|
|||||
|
Mining
|
$
|
340,491
|
|
$
|
7,478,782
|
|
$
|
6,475,782
|
|
||
|
Real estate
|
3,200,000
|
|
14,663
|
|
411,750
|
|
|||||
|
Total capital expenditures
|
$
|
3,540,491
|
|
$
|
7,493,445
|
|
$
|
6,887,532
|
|
||
|
Depreciation, Amortization and Depletion
|
|
|
|
|
|
|
|||||
|
Mining
|
$
|
5,763,293
|
|
$
|
7,607,677
|
|
$
|
6,744,008
|
|
||
|
Real estate
|
130,490
|
|
119,756
|
|
132,314
|
|
|||||
|
Total depreciation, amortization and depletion
|
$
|
5,893,783
|
|
$
|
7,727,433
|
|
$
|
6,876,322
|
|
||
|
|
As of December 31,
|
||||||||||
|
|
2016
|
2015
|
2014
|
||||||||
|
Assets
|
|
|
|
|
|
|
|||||
|
Mining
|
$
|
27,829,802
|
|
$
|
41,886,124
|
|
$
|
45,029,258
|
|
||
|
Real estate
|
6,013,229
|
|
1,326,767
|
|
1,426,614
|
|
|||||
|
|
$
|
33,843,031
|
|
$
|
43,212,891
|
|
$
|
46,455,872
|
|
||
For the years ended
December 31, 2016
and
2015
, substantially all of the mining revenues were attributable to
one
customer.
F-21
14. Net Loss Per Common Share
Basic earnings per share is computed by dividing net loss available to common shareholders by the weighted average number of shares of common stock outstanding during the period. Diluted loss per share reflects the potential dilution that could occur if stock options, warrants, and convertible securities to issue common stock were exercised or converted into common stock. The following is a reconciliation of the numerator and denominator used in the basic and diluted computation of net loss per share:
|
Year Ended
December 31,
|
|||||||||||
|
|
2016
|
2015
|
2014
|
||||||||
|
Numerator:
|
|
|
|
|
|
|
|||||
|
Net loss
|
$
|
(12,964,704
|
)
|
$
|
(10,454,427
|
)
|
$
|
(9,638,773
|
)
|
||
|
Preferred stock dividends
|
—
|
|
(5,452,445
|
)
|
(3,672,785
|
)
|
|||||
|
Loss available to common shareholders
|
$
|
(12,964,704
|
)
|
$
|
(15,906,872
|
)
|
$
|
(13,311,558
|
)
|
||
|
Denominator:
|
|
|
|
|
|
|
|||||
|
Basic weighted average shares outstanding
|
176,624,733
|
|
110,072,486
|
|
78,586,266
|
|
|||||
|
Effect of dilutive securities
|
—
|
|
—
|
|
—
|
|
|||||
|
Diluted weighted average shares outstanding
|
176,624,733
|
|
110,072,486
|
|
78,586,266
|
|
|||||
|
Net loss per common share:
|
|
|
|
|
|
|
|||||
|
Basic
|
$
|
(0.07
|
)
|
$
|
(0.14
|
)
|
$
|
(0.17
|
)
|
||
|
Diluted
|
$
|
(0.07
|
)
|
$
|
(0.14
|
)
|
$
|
(0.17
|
)
|
||
The following table includes the number of common stock equivalent shares that are not included in the computation of diluted loss per share, because the Company has a net loss and the inclusion of such shares would be antidilutive.
|
|
Shares
|
|||||||
|
|
2016
|
2015
|
2014
|
|||||
|
Stock options
|
50,000
|
|
50,000
|
|
50,000
|
|
||
|
Convertible preferred stock
|
—
|
|
—
|
|
53,639,158
|
|
||
|
Warrants
|
—
|
|
—
|
|
312,500
|
|
||
|
Restricted stock
|
140,000
|
|
1,662,000
|
|
1,796,600
|
|
||
|
|
190,000
|
|
1,712,000
|
|
55,798,258
|
|
||
15. Stock-Based Compensation
2011 Equity Incentive Plan
In 2011, the Company adopted the Comstock Mining Inc. 2011 Equity Incentive Plan (the “2011 Plan”). The maximum number of shares of the Company’s common stock that may be delivered pursuant to awards granted under the 2011 Plan is
6,000,000
shares of common stock. The plan provides for the grant of various types of awards, including but not limited to restricted stock (including performance awards), restricted stock units, stock options, and other types of stock-based awards.
Performance-based Restricted Stock
On May 31, 2012, September 15, 2012, September 19, 2013, and February 23, 2015 the Board of Directors granted
755,000
shares,
525,000
,
659,500
, and
60,000
shares respectively, of restricted stock (performance awards) to certain employees under the 2011 Equity Incentive Plan. These awards vest primarily based on specific performance conditions including the validation of both resources (at least measured and indicated and / or proven and probable reserves) at levels of
1,000,000
,
1,500,000
,
F-22
2,000,000
, and
3,250,000
of gold equivalent ounces by an independent third party, completing the first pour from the mining operations, and achieving certain annual mining production rates at levels of
15,000
,
17,500
, and
20,000
of gold equivalent ounces for a period of at least
90
days. Certain of these awards will vest at the latter of the achievement of the aforementioned performance conditions or certain service period requirements, but only if the performance conditions have been met.
The restricted stock fair value was
$2.02
,
$2.98
,
$1.95
and
$0.74
per share, respectively, at the grant dates (with a total grant date fair value of
$1.5
million,
$1.6
million,
$1.3
million and
$44,400
, respectively). The fair value was determined based on the fair value of the underlying common stock at the grant dates. The unvested restricted stock awards expire
five
years after the grant date. Many of these awards were granted in 2011 and have expired unvested. The remaining balance will expire in May of 2017.
Information related to non-vested restricted stock issued under the 2011 Plan is as follows:
|
Number of
Shares
|
Weighted Average
Grant Date
Fair Value
|
|||||
|
Balances at January 1, 2016
|
1,662,000
|
|
$
|
1.92
|
|
|
|
Grants
|
—
|
|
—
|
|
||
|
Vested
|
(54,000
|
)
|
2.20
|
|
||
|
Forfeitures
|
(1,468,000
|
)
|
1.90
|
|
||
|
Balances at December 31, 2016
|
140,000
|
|
$
|
2.02
|
|
|
We recognize compensation expense related to these restricted stock grants over the performance period based on a periodic assessment of the probability that the performance criteria will be achieved. At
December 31, 2016
, the Company has estimated that certain of these performance conditions are probable of being achieved and has therefore recognized compensation expense related to these restricted shares. Additionally, the Company has estimated that certain of these performance conditions are not probable of being achieved and therefore no expense related to those conditions has been recognized.
We recorded stock-based compensation (including restricted stock grants and other common stock grants) as follows:
|
Year Ended
December 31,
|
|||||||||||
|
|
2016
|
2015
|
2014
|
||||||||
|
Costs applicable to mining revenue
|
$
|
—
|
|
$
|
—
|
|
$
|
—
|
|
||
|
Reclamation and exploration expenses
|
—
|
|
—
|
|
—
|
|
|||||
|
General and administrative
|
18,900
|
|
44,400
|
|
169,479
|
|
|||||
|
Real estate operating costs
|
—
|
|
—
|
|
—
|
|
|||||
|
Total
|
$
|
18,900
|
|
$
|
44,400
|
|
$
|
169,479
|
|
||
At
December 31, 2016
, there was no unrecognized compensation expense related to non-vested restricted stock award shares.
Options
Prior to the 2011 Plan, the Company had previously issued options under prior programs. At
December 31, 2016
, the Company had
50,000
outstanding and fully vested employee and director options to acquire shares of common stock. The options outstanding at
December 31, 2016
, have a weighted average remaining contractual life of
1.75
years and a weighted average exercise price of
$4.00
per share. During
2016
, there were no options granted, exercised, or forfeited.
There was no compensation expense recognized for the remaining outstanding options during the years ended December 31,
2016
,
2015
, and
2014
.
F-23
16. Income Taxes
The provision (benefit) for income taxes from continued operations for the years ended
December 31, 2016
,
2015
and
2014
consist of the following:
|
|
2016
|
2015
|
2014
|
||||||||
|
Current:
|
|
|
|
|
|
|
|||||
|
Federal
|
$
|
—
|
|
$
|
—
|
|
$
|
—
|
|
||
|
Deferred:
|
|
|
|
|
|
|
|||||
|
Federal
|
—
|
|
—
|
|
—
|
|
|||||
|
Income taxes provision
|
$
|
—
|
|
$
|
—
|
|
$
|
—
|
|
||
|
Federal statutory rate
|
(34.0
|
)%
|
(34.0
|
)%
|
(34.0
|
)%
|
|||||
|
Change in valuation allowance
|
34.0
|
%
|
33.8
|
%
|
32.0
|
%
|
|||||
|
Other
|
—
|
%
|
0.2
|
%
|
2.0
|
%
|
|||||
|
|
—
|
%
|
—
|
%
|
—
|
%
|
|||||
Deferred income taxes at
December 31, 2016
and
2015
consisted of the following:
|
December 31, 2016
|
December 31, 2015
|
||||||
|
Asset retirement obligation
|
$
|
2,290,315
|
|
$
|
1,944,953
|
|
|
|
Mineral rights and properties, plant, and equipment
|
839,360
|
|
(5,853
|
)
|
|||
|
Mining exploration, development, claims, and permit costs
|
10,705,987
|
|
10,616,416
|
|
|||
|
Net operating loss carryforward
|
53,021,957
|
|
50,333,692
|
|
|||
|
Other
|
869,666
|
|
435,598
|
|
|||
|
Valuation allowance
|
(67,727,285
|
)
|
(63,324,806
|
)
|
|||
|
Total net deferred tax assets
|
$
|
—
|
|
$
|
—
|
|
|
At
December 31, 2016
, the Company had federal net operating losses of approximately
$155.9 million
that will begin to expire in
2023
and could be subject to certain limitations under section 382 of the Internal Revenue Code.
The Company has provided a valuation allowance at
December 31, 2016
and
2015
of
$67.7 million
and
$63.3 million
, respectively, for its net deferred tax assets as it cannot conclude it is more likely than not that they will be realized. The valuation allowance increased by
$4.4 million
,
$3.5 million
, and
$3.1 million
in
2016
,
2015
, and
2014
, respectively.
As of
December 31, 2016
and
2015
, the Company did not have any unrecognized tax benefits. The Company’s policy is to recognize interest and penalties related to income tax matters in income tax expense. The Company currently has no federal or state tax examinations in progress nor has it had any federal or state tax examinations since its inception. The Company is subject to U.S. federal and state income tax examination for tax years 2013 and forward.
F-24
17. Related Party Transactions
Northern Comstock LLC
The Company has an operating agreement with Northern Comstock LLC, an entity controlled by a related party. As part of the operating agreement, the Company obtained the exclusive rights of production and exploration on certain parcels in Storey County, Nevada. The terms of this agreement were amended on August 27, 2015, and September 28, 2015 (the “Amendments”), with the other members of its Northern Comstock LLC joint venture. The Amendments resulted in reduced capital contribution obligations of the Company from
$31.05 million
down to
$9.75 million
. The terms of the Amendments provide that the Company will make monthly cash capital contributions of
$30,000
and annual capital contributions in the amount of
$482,500
payable in stock or cash, at the Company's option, unless the Company has cash or cash equivalents in excess of
$10,500,000
on the date of such payments, wherein the Company would then be required to pay in cash to be made in the form of cash, or in certain circumstances, the Company’s common stock. The number of shares to be delivered is calculated by dividing the amount of the capital contribution by the volume-weighted average closing price of the Company’s common stock on its primary trading market for the previous
20
consecutive trading days prior to such capital contribution. The Operating Agreement also provides for a one-time acceleration of
$812,500
of the capital contributions payable when the Company receives net cash proceeds from sources other than operations that exceed
$6,250,000
. The agreement also includes an ongoing acceleration of the Company’s capital contribution obligations equal to
3%
of the net smelter returns generated by the properties subject to the Northern Comstock LLC joint venture. The Operating Agreement also provides that if the Company defaults in its obligation to make the scheduled capital contributions, then the remaining capital contribution obligations may be converted into the principal amount of a
6%
per annum promissory note payable by the Company on the same schedule as the capital contributions, secured by a mortgage on the properties subject to the Northern Comstock LLC joint venture. The operating agreement requires that these capital contributions commence in October 2015, and end in September 2027, unless prepaid by the Company.
The Company made a payment in stock in the amount of
$482,500
under the new agreement during the year ended
December 31, 2016
. During the year ended December 31,
2016
,
2015
and
2014
, the Company recognized expense of
$0.8 million
,
$0.8
million and
$1.9
million, respectively.
Board of Directors
During the year ended December 31, 2014, the Company paid to Kappes, Cassiday & Associates, a related party of Daniel Kappes, a member of the Board of Directors, for services related to processing consulting. Kappes, Cassiday & Associates received cash payments totaling
$14,667
.
During the year ended December 31, 2014, the Company paid Robert Reseigh, a member of the Board of Directors, cash payments totaling
$15,000
for services related to consulting.
There were no payments made to Kappes, Cassiday & Associates nor Robert Reseigh during 2016 and 2015.
18. Commitments and Contingencies
The Company leases certain properties under operating leases expiring at various dates through 2028. Future minimum annual lease payments under these existing lease agreements are as follows as of
December 31, 2016
:
|
Year Ended December 31,
|
Third Party
Leases
|
Related Party
Leases
|
Total
|
||||||||
|
2017
|
$
|
20,400
|
|
$
|
830,500
|
|
$
|
850,900
|
|
||
|
2018
|
20,400
|
|
818,500
|
|
838,900
|
|
|||||
|
2019
|
22,800
|
|
818,500
|
|
841,300
|
|
|||||
|
2020
|
22,800
|
|
818,500
|
|
841,300
|
|
|||||
|
2021
|
24,000
|
|
818,500
|
|
842,500
|
|
|||||
|
Thereafter
|
48,000
|
|
4,821,000
|
|
4,869,000
|
|
|||||
|
|
$
|
158,400
|
|
$
|
8,925,500
|
|
$
|
9,083,900
|
|
||
F-25
Included in the related party leases above is an operating agreement with Northern Comstock LLC, an entity controlled by a related party. The terms of this agreement provide that the Company will make monthly cash contributions of
$30,000
and annual capital contributions in the amount of
$482,500
to be made in the form of cash, or in certain circumstances, the Company’s common stock.
Expense under operating leases for the years ended
December 31, 2016
,
2015
and
2014
was
$0.9
million,
$0.9
million and
$2.0
million, respectively.
The Company has minimum royalty obligations with certain of its mineral properties and leases. Minimum royalty payments payable were
$53,400
in
2016
. For most of the mineral properties and leases, the Company is subject to a range of royalty obligations once production commences. These royalties range from
0.5%
to
5%
of net smelter revenues (NSR) from minerals produced on the properties with the majority being under
3%
. Some of the factors that will influence the amount of the royalties include ounces extracted and prices of gold. Royalty expense, including both NSR and minimum royalty obligations, was
$33,505
,
$0.2
million, and
$1.0
million for the years ended
2016
,
2015
, and
2014
, respectively.
The Company’s mining and exploration activities are subject to various laws and regulations governing the protection of the environment. These laws and regulations are continually changing and are generally becoming more restrictive. The Company believes its operations are in compliance with applicable laws and regulations in all material respects. The Company has made, and expects to make in the future, expenditures to comply with such laws and regulations, but cannot predict the full amount of such future expenditures.
On January 31, 2014, the Comstock Residents Association (the “CRA”) and two of its members filed a civil action in the Third Judicial District Court of the State of Nevada in and for Lyon County (the “District Court”) against the Lyon County Board of Commissioners (the “Commissioners”) and the Company, asking the Court to reverse the Commissioners’ decision to grant an application for master plan amendment and zone change submitted and approved by the Commissioners on January 2, 2014 (the “Application”).
Prior to the approval of the Application, the master plan designation and zoning precluded mining on certain property of the Company in the area of Silver City, Lyon County. In April 2015, the District Court ruled in favor the Company and the Commissioners. The written Order Denying Petition for Judicial Review was filed and mailed to all parties on June 15, 2015. On July 14, 2015, the CRA and one individual (together “Appellants”) filed a Notice of Appeal of the Court Order, appealing the decision to the Nevada Supreme Court. On December 9, 2015, Appellants filed their Opening Brief in the Nevada Supreme Court, generally repeating the arguments that were made at the District Court. On January 15, 2016, the Company and the Commissioners jointly filed an Answering Brief. Briefing in the Nevada Supreme Court was completed with the Appellants’ filing of a Reply Brief on March 3, 2016. An oral argument before a three judge panel of the Nevada Supreme Court took place on September 14, 2016.
On December 2, 2016, the Nevada Supreme Court entered an order affirming all three of the District Court’s decisions associated with 1) the Commissioners’ discretion and authority for changing master plans and zoning, 2) their compliance with Nevada’s Open Meeting Law and 3) their compliance with Nevada statutory provisions. Specifically, the Supreme Court affirmed the District Court’s conclusions that Lyon County did not abuse its discretion and that it acted with substantial evidence in support of their decision, that the County did not violate Nevada’s Open Meeting Law and that the County did not violate statutory provisions regarding master plans.
The Supreme Court did reverse the District Court’s dismissal of CRA’s claim of a due process violation, concluding that this claim should not have been summarily dismissed and that further proceedings are necessary in the District Court on this single claim. This remaining issue is now back before the District Court in Lyon County for further proceedings. The Company and the Lyon County District Attorney are encouraged by the Supreme Court’s decision and look forward to a positive resolution of the sole remaining issue.
From time to time, we are involved in lawsuits, claims, investigations and proceedings that arise in the ordinary course of business. There are no matters pending that we expect to have a material adverse impact on our business, results of operations, financial condition or cash flows.
F-26
19. Quarterly Results of Operations (Unaudited)
|
|
Quarter Ended
|
||||||||||||||
|
|
March 31, 2016
|
June 30, 2016
|
September 30, 2016
|
December 31, 2016
|
|||||||||||
|
Revenues
|
$
|
2,020,521
|
|
$
|
1,491,276
|
|
$
|
1,134,795
|
|
$
|
423,625
|
|
|||
|
Gross profit/(loss)
(1)
|
552,171
|
|
136,636
|
|
273,870
|
|
(580,694
|
)
|
|||||||
|
Loss from operations
|
(3,829,658
|
)
|
(2,268,327
|
)
|
(1,667,446
|
)
|
(2,447,913
|
)
|
|||||||
|
Net profit (loss)
|
(4,051,395
|
)
|
(2,854,784
|
)
|
(2,193,201
|
)
|
(3,865,324
|
)
|
|||||||
|
Net profit (loss) available to common shareholders
|
(4,051,395
|
)
|
(2,854,784
|
)
|
(2,193,201
|
)
|
(3,865,324
|
)
|
|||||||
|
Basic earnings per common share
|
(0.02
|
)
|
(0.02
|
)
|
(0.01
|
)
|
(0.02
|
)
|
|||||||
|
Diluted earnings per common share
|
(0.02
|
)
|
(0.02
|
)
|
(0.01
|
)
|
(0.02
|
)
|
|||||||
|
Quarter Ended
|
|||||||||||||||
|
March 31, 2015
|
June 30, 2015
|
September 30, 2015
|
December 31, 2015
|
||||||||||||
|
Revenues
|
$
|
6,037,417
|
|
$
|
5,488,291
|
|
$
|
4,345,073
|
|
$
|
2,622,069
|
|
|||
|
Gross profit/(loss)
(1)
|
2,119,479
|
|
2,207,193
|
|
852,213
|
|
2,318,960
|
|
|||||||
|
Loss from operations
|
(1,673,168
|
)
|
(1,178,995
|
)
|
(3,969,659
|
)
|
(5,603,691
|
)
|
|||||||
|
Net loss
|
1,289,114
|
|
(1,509,446
|
)
|
(4,307,358
|
)
|
(5,926,737
|
)
|
|||||||
|
Net loss available to common shareholders
|
390,282
|
|
(2,474,610
|
)
|
(7,952,246
|
)
|
(5,870,298
|
)
|
|||||||
|
Basic earnings per common share
|
0.01
|
|
(0.03
|
)
|
(0.07
|
)
|
(0.05
|
)
|
|||||||
|
Diluted earnings per common share
|
0.01
|
|
(0.03
|
)
|
(0.07
|
)
|
(0.05
|
)
|
|||||||
(1)
Total revenues less costs applicable to mining revenue and real estate operating costs.
20. Subsequent Events
As further described in Note 10, in January 2017, the Company entered into a refinancing agreement and issued an
11%
Senior Secured Debenture (the “Debenture”) due
2021
in the amount of
$10.7 million
. The Debenture retires substantially all of the Company’s obligations. Until January 1, 2019, interest will be payable in cash and/or in the form of additional Debentures, at the Company's option.
The Debenture has a term of four years. For the first two years following the initial issue date, interest on the Debenture will be payable in cash or in the form of additional Debentures to be issued by the Company (valued at face value) or a combination of the two types of consideration, at the Company’s option.
In March 2017, the Company entered into a loan commitment agreement which provides up to
$2 million
in borrowing capacity and expires in 2021 with an
11%
interest rate. Principal amounts borrowed under this agreement are not due until 2021. Until January 1, 2019, interest on any borrowings will be payable in cash and/or in the form of additional indebtedness under the agreement, at the Company’s option.
None.
F-27
Evaluation of Disclosure Controls and Procedures
As of the end of the period covered by this Annual Report, management performed, with the participation of our Principal Executive Officer and our Principal Financial Officer, an evaluation of the effectiveness of our disclosure controls and procedures as defined in Rules 13a-15(e) and 15d-15(e) of the Exchange Act. Our disclosure controls and procedures are designed to ensure that information required to be disclosed in reports that we file or submit under the Exchange Act is recorded, processed, summarized, and reported within the time periods specified in the Exchange Act and SEC’s rules, and that such information is accumulated and communicated to our management, including our Principal Executive Officer, to allow timely decisions regarding required disclosures. There are inherent limitations to the effectiveness of any system of disclosure controls and procedures, including the possibility of human error and the circumvention or overriding of the controls and procedures. Accordingly, even effective disclosure controls and procedures can only provide reasonable assurance of achieving their control objectives. Our Principal Executive Officer concluded that, as of
December 31, 2016
, our disclosure controls and procedures were effective.
Design and Evaluation of Internal Control over Financial Reporting
Our management is responsible for establishing and maintaining adequate internal control over financial reporting as defined in Exchange Act Rule 13a-15(f) and 15d-15(f). Our management assessed the effectiveness of our internal control over financial reporting as of
December 31, 2016
. In making this assessment, management used the criteria for effective internal control over financial reporting described in the “Internal Control-Integrated Framework” (2013) set forth by the Committee of Sponsoring Organizations of the Treadway Commission (COSO). Based on the assessment, management concluded that, as of
December 31, 2016
, our internal control over financial reporting was effective based on those criteria.
Changes in Internal Control Over Financial Reporting
During the quarter ending
December 31, 2016
, there was no change in our internal control over financial reporting that materially affected, or is reasonably likely to materially affect our internal control over financial reporting.
F-28
MANAGEMENT'S REPORT ON INTERNAL CONTROL OVER FINANCIAL REPORTING
Our management is responsible for establishing and maintaining adequate internal control over financial reporting for the Company in accordance with and as defined in Rules 13a-15(f) and 15d-15(f) under the Securities Exchange Act of 1934 (“Exchange Act”). Our internal control over financial reporting is designed to provide reasonable assurance regarding the reliability of financial reporting and the preparation of financial statements for external purposes in accordance with generally accepted accounting principles. Our internal control over financial reporting includes those policies and procedures that:
(i) pertain to the maintenance of records that, in reasonable detail, accurately and fairly reflect the transactions and dispositions of our assets;
(ii) provide reasonable assurance that transactions are recorded as necessary to permit preparation of financial statements; and
(iii) provide reasonable assurance regarding prevention or timely detection of unauthorized transactions.
A material weakness is a deficiency, or a combination of deficiencies, in internal control over financial reporting, such that there is a reasonable possibility that a material misstatement of our annual or interim financial statements will not be prevented or detected on a timely basis.
Management has evaluated the effectiveness of the Company’s internal control over financial reporting as of
December 31, 2016
. Management based its assessment on the framework set forth in COSO’s Internal Control – Integrated Framework (2013) in conjunction with Securities and Exchange Commission Release No. 33-8820 entitled “Commission Guidance Regarding Management’s Report on Internal Control Over Financial Reporting Under Section 13(a) or 15(d) of the Securities and Exchange Commission”. Based on the assessment, management concluded that, as of
December 31, 2016
, our internal control over financial reporting was effective to provide reasonable assurance regarding the reliability of financial reporting and the preparation of financial statements for external purposes in accordance with generally accepted accounting principles in the United States. The concept of reasonable assurance is based on the recognition that there are inherent limitations in all systems of internal control. Because of its inherent limitations, internal control over financial reporting may not prevent or detect misstatements. Also, projections of any evaluation of effectiveness to future periods are subject to the risk that controls may become inadequate because of changes in conditions, or that the degree of compliance with the policies or procedures may deteriorate.
We believe that internal control over financial reporting is effective as of
December 31, 2016
.
/s/ Corrado De Gasperis
Executive Chairman, Chief Executive Officer and President
(Principal Executive Officer)
Item 9B.
Other Information
Judd Merrill was reappointed as Chief Financial Officer on March 7, 2017. He is also the Company’s principal accounting officer and corporate secretary.
F-29
Item 10.
Directors, Executive Officers and Corporate Governance
Directors and Executive Officers
Set forth below is information concerning the age, principal occupation, employment and directorships during the past five years and positions with the Company of each director, and the year in which he first became a director of the Company. Also set forth below is a brief discussion of the specific experience, qualifications, attributes or skills that led to the conclusion that such director should serve as a director of the Company’s business and structure. The Nominating and Governance Committee of the Board reviews at least annually the skills and characteristics for the election of new and continuation of existing directors.
Daniel W. Kappes
; age 71; director since April 2012. Mr. Kappes is a founder and the President of Kappes, Cassiday & Associates (“KCA”). KCA has provided extractive metallurgical services to the international mining industry since 1972, specializing in all aspects of heap leach and cyanide processing, including laboratory testing, project feasibility studies, engineering design, construction, and operations management. KCA has pioneered many of the techniques now employed in heap leaching, and for the past several years has expanded into the design of agitated leach plants and other metallurgical processes. Mr. Kappes is a recognized authority on gold and silver metals heap leaching. In addition to providing engineering and design work on numerous projects, he has directed laboratory and field-testing on several projects that have subsequently become major precious metal mines. Mr. Kappes also has substantial experience in strategic planning, project evaluation and project management.
Mr. Kappes graduated from the Colorado School of Mines with an Engineer of Mines degree and the University of Nevada’s Mackay School of Mines with a Master’s degree in Mine Engineering. Mr. Kappes is and has served as a “Qualified Person” under National Instrument 43-101 and has also presented several technical papers on precious metals heap leaching in his career. He is a registered Professional Mining and Metallurgical Engineer in Nevada, and was named Alumnus of the Year at Mackay in 1995.
William J. Nance
; age 73; director since October 2005. Mr. Nance also serves as the Chairman of the Audit and Finance, Compensation and Nominating and Governance Committees. He is the President and CEO of Century Plaza Printers, Inc., a company he founded in 1979. He has also served as a consultant in the acquisition and disposition of commercial real estate. Mr. Nance is a Certified Public Accountant and, from 1970 to 1976, was employed by Kenneth Leventhal & Company where he specialized in the area of REITS, restructuring of real estate companies, mergers and acquisitions, and most phases of real estate development and financing. Mr. Nance has been a Director of InterGroup since 1984 and of Santa Fe and Portsmouth since May 1996. He holds a Bachelor’s degree in Business Administration from California State University in Los Angeles. Mr. Nance has extensive management experience within a wide range of businesses and brings over 20 years of experience as a director on public company boards.
Robert A. Reseigh
; age 70; director since September 2008. Mr. Reseigh retired from Atkinson Construction Company in 2005, as the Executive Vice President in charge of operations and then worked a technical adviser for the Barnard Construction Company, Inc. until April 2015 and has acted an independent consultant for various mining firms. He has over 40 years of experience in the mining and underground construction industries. Following graduation from the Colorado School of Mines in 1968 with a Master’s degree in Mining Engineering, and service in the U.S. Army, Mr. Reseigh joined Peter Kiewit Sons and progressively held the positions of Project Engineer, Superintendent, Project Manager, and Estimator before being promoted to District Manager, Vice President, and Area Manager. Bob retired from Peter Kiewit after 18 years of service, and joined Atkinson Construction in the capacity of Executive Vice President where he ran the Underground Group for 15 years until 2005.
Mr. Reseigh’s career specialized in underground construction, both domestically and overseas. He is one of the most experienced and knowledgeable individuals in the country in deep shaft and drill and blast tunnel work, having been responsible for in excess of six miles of shaft sinking and 55 miles of tunnel/horizontal mine development in his career. In addition, his work has involved both mine development and heavy civil projects, including subways, outfalls, railroads, dams, pump storage, water and sewer, marine construction, and municipal work. Mr. Reseigh served in executive positions at a large mining company and several construction companies during his professional career. His roles encompassed significant operational management, providing him knowledge and experience in an array of functional areas critical to public companies.
F-30
Corrado De Gasperis
; age 51; director since June 2011, Executive Chairman since September 2015 and President, Chief Executive Officer since April 2010. He brings more than 30 years of experience in manufacturing, industrial metals and mining operational management, project management, financial and information management, restructuring, capital markets and board level governance.
Mr. De Gasperis was formerly the Chief Executive Officer of Barzel Industries Inc. (“Barzel”). Barzel operated a network of 15 manufacturing, processing and distribution facilities in the United States and Canada that offered a wide range of metal solutions to a variety of industries, from construction and industrial manufacturing to transportation, infrastructure development and mining. Mr. De Gasperis resigned from Barzel in September 2009, after Barzel reached an agreement to sell substantially all of its assets in a planned transaction that was consummated in a sale pursuant to Section 363 of the U.S. Bankruptcy Code following a multiple party bidding process with suitors focused on both in-court and out-of-court transactions. Barzel and substantially all of its U.S. and Canadian subsidiaries were purchased for $65 million in cash.
From 2001 to 2005, he served as Chief Financial Officer of GrafTech International Ltd. (“GrafTech”), a global manufacturer of industrial graphite and carbon-based materials, in addition to his duties as Vice President and Chief Information Officer, which he assumed in 2000. He served as Controller of GrafTech from 1998 to 2000. From 1987 to 1998, Mr. De Gasperis was a Certified Public Accountant with KPMG LLP, an international provider of financial advisory services. As a Senior Assurance Manager in the Manufacturing, Retail and Distribution Practice, he served clients such as General Electric Company and Union Carbide Corporation. KPMG announced his admittance, as a Partner, effective July 1, 1998.
Mr. De Gasperis holds a BBA from the Ancell School of Business at Western Connecticut State University, with honors. Mr. De Gasperis is also a founding member and the Chairman of the Board of Directors of the Comstock Foundation for History and Culture, a Director of Comstock Real Estate, Inc., and a Director of Nevada Works, furthering Northern Nevada’s economic development plans. He is also a Member of the NYSE Markets Advisory Committee, the Northern Nevada Development Authority and the Northern Nevada Network. Mr. De Gasperis has served as a director of GBS Gold International Inc., where he was Chairman of the Audit and Governance Committee and the Compensation Committee and a member of the Nominations and Advisory Committees.
Judd B. Merrill
; age 46; Chief Financial Officer and Secretary since February 2015. Mr. Merrill previously served as Chief Accounting Officer since January 2014. Mr. Merrill previously served as our Controller beginning in December 2011 to December 2013. Mr. Merrill brings strong financial planning, treasury and cash management experience in the mining sector in addition to his broader financial accounting, reporting and internal control experience, having worked as Controller of Fronteer Gold Inc. and Assistant Controller at Newmont Mining Corp., both in Nevada. He also worked for Meridian Gold Company and Deloitte & Touche LLP. Mr. Merrill holds a BS in Accounting from Central Washington University and a MBA from the University of Nevada Reno. He is also Certified Public Accountant.
Corporate Governance
We are managed under the direction of the Board of Directors, which has adopted Corporate Governance Guidelines to set forth certain corporate governance practices. The Corporate Governance Guidelines are available on our website at
http://www.comstockmining.com/files/corporate-governance/ComstockMining_CorporateGovernanceGuidelines_20101231.pdf
.
The information contained on our website is not part of this annual report on Form 10-K. These guidelines cover such matters as purpose and powers, Board size and composition, director qualifications, meetings, procedures, management reporting to the Board, director orientation and continuing education programs, director and executive officer compensation, required director responsibilities, director access to officers, employees and others, and discretionary activities that our Board or the appropriate committee should periodically consider undertaking. Each committee is authorized to exercise all power of our Board with respect to matters within the scope of its charter.
F-31
The Corporate Governance Guidelines require, among other things, that:
|
•
|
a majority of the directors shall be independent within the NYSE MKT listing standards;
|
|
•
|
a director shall advise our Nominating and Governance Committee (and receive written confirmation from counsel for the Company that there are no legal or regulatory impediments to such service) prior to accepting an invitation to serve on another public company board;
|
|
•
|
if a member of the Audit and Finance Committee simultaneously serves on an audit committee of more than three public companies, our Board must determine that such simultaneous service would not impair the ability of such member to effectively serve on the Audit and Finance Committee and make disclosure of such determination either in our Annual Report on Form 10-K or on or through our website;
|
|
•
|
our Board shall meet in regular sessions at least four times annually (including telephonic meetings );
|
|
•
|
our independent directors meet on a regular basis as often as necessary to fulfill their responsibilities, including at least annually in executive session without management present; and our Board shall be comprised of that number of directors (but not less than three nor more than nine) as shall be determined from time to time by the Board (with the Board's sense that five to seven directors is the right size for the Board, but that a slightly larger size may be justifiable in order to accommodate the availability of an outstanding candidate).
|
Our Corporate Governance Guidelines and committee charters are not intended to, and do not, expand or increase the duties, liabilities or responsibilities of any director under any circumstance beyond those that a director would otherwise have under applicable laws, rules and regulations in the absence of such Corporate Governance Guidelines or committee charters.
Independence of Directors
The Board of Directors has determined that Messrs. Kappes, Nance and Reseigh are generally “independent” directors within the listing standards of the NYSE MKT and the independence standards of our Corporate Governance Guidelines. Messrs. Reseigh and Nance are also independent within the standards set forth in Rule 10A-3 of the Securities Exchange Act of 1934, as amended (the "Exchange Act").
Generally, in order for a director to be considered “independent” by the Board of Directors, he or she must (1) be free of any relationship that, applying the rules of the NYSE MKT, would preclude a finding of independence and (2) not have any relationship (either directly or as a partner, shareholder or officer of an organization) with us or any of our affiliates or any executive officer of us or any of our affiliates (exclusive of relationships based solely upon investment) that would interfere with the exercise of independent judgment in carrying out the responsibilities of a director. On an annual basis, each director and executive officer is obligated to disclose any transactions with our Company and any of its subsidiaries in which a director or executive officer, or any member of his or her immediate family, have a direct or indirect material interest. In evaluating the materiality of any such relationship, the Board of Directors takes into consideration whether disclosure of the relationship would be required by the proxy rules under the Exchange Act. If disclosure of the relationship is required, the Board of Directors must make a determination that the relationship is not material as a prerequisite to finding that the director is “independent.”
Board of Directors Meetings
The Board of Directors meets on a regularly scheduled basis during the year to review significant developments affecting us and to act on matters requiring Board of Directors’ approval, and may hold special meetings between scheduled meetings when appropriate. During
2016
, the Board of Directors and its committees held 12 meetings of all the committees of the Board of Directors on which the directors then served. The directors attended over 75% of the aggregate of (1) the total number of meetings of all committees of the Board of Directors on which the director then served and (2) the total number of meetings of the Board of Directors.
Board of Directors Leadership Structure and Role in Risk Oversight
Our Company is led by Corrado De Gasperis, who has served as President, and Chief Executive Officer since April 2010 and Executive Chairman since September 2015.
The Board of Directors believes that the current Board leadership structure, in which the roles of Chairman and Chief Executive Officer are held by one person, is appropriate for the Company and its shareholders at this time. The current Board leadership structure is believed to be appropriate because it demonstrates to our employees, suppliers, customers, and other shareholders that the Company is under strong leadership, with a single person setting the tone and having primary responsibility for managing the Company’s operations. The Board will continue to reexamine our corporate governance
F-32
policies and leadership structure on an ongoing basis to ensure that they continue to meet the Company’s needs. The Company will review these policies and may adopt a different approach in the future if circumstances warrant a change.
The Board is responsible for overseeing risk management, and receives periodic reports from management. Management and the Board are focused on the vision for the Company, and enhancing shareholder value, management and strategic planning and oversight of Company operations. We believe that our directors provide effective oversight of the risk management function, especially through dialogue between the Board and our management.
Executive Officers
The Company had two executive officers during
2016
, Mr. De Gasperis, the Executive Chairman, Chief Executive Officer and President of the Company, who serves as the Company’s principal executive officer, and Judd Merrill, who serves as the Company’s Chief Financial Officer, Chief Accounting Officer and Secretary. See Mr. De Gasperis’ and Mr. Merrill’s biographical information under Directors and Executive Officers section of Item 10.
Code of Conduct and Ethics
The Code of Conduct and Ethics applies to all employees, including senior executives, and all directors. It is intended, at a minimum, to comply with the listing standards of the NYSE MKT, the Sarbanes-Oxley Act of 2002 and the SEC rules adopted thereunder. Only our Board or the Audit and Finance Committee may waive the provisions of our Code of Conduct and Ethics for executive officers and directors. Our Code of Conduct and Ethics constitutes a code of ethics for purposes of Item 406 of Regulation S-K, and is posted on our website at www.comstockmining.com.
Board Committees
The Board has established three standing committees (the Audit and Finance Committee, the Compensation Committee and the Nominating and Governance Committee), and periodically establishes other committees, in each case so that certain important matters can be addressed in greater depth than may be possible in a meeting of the entire Board. Under the committee charters described below, members of the three standing committees must be independent directors within the meaning of the listing standards of the NYSE MKT. Further, members of the Audit and Finance Committee must be independent directors within the meaning of the Sarbanes-Oxley Act of 2002 and Rule 10A-3 under the Securities Exchange Act of 1934, must satisfy the expertise requirements of the listing standards of the NYSE MKT and must include at least on "audit committee financial expert" within the meaning of SEC rules. Our Board has determined that the three standing committees currently consist of members who satisfy such requirements.
Audit and Finance Committee
The Audit and Finance Committee assists our Board in discharging and performing its duties and responsibilities with respect to the financial affairs of the Company.
Without limiting the scope of such activities, the Audit and Finance Committee has responsibility to, among other things:
|
•
|
select, retain, determine appropriate compensation of (and provide for payment of such compensation), evaluate and, as appropriate, terminate and replace the independent registered public accounting firm;
|
|
•
|
review and, as appropriate, approve, prior to commencement, all audit and non-audit services to be provided by the independent registered public accounting firm;
|
|
•
|
review regularly with management, the director of internal audits, where applicable, and the independent registered public accounting firm any audit problems or difficulties and management’s responses thereto;
|
|
•
|
resolve or direct the resolution of all material disagreements between management and the independent registered public accounting firm regarding accounting and financial reporting;
|
|
•
|
review with management and the independent registered public accounting firm, among other things, all reports delivered by the independent registered public accounting firm with respect to critical accounting policies and practices used or to be used, alternative treatments of financial information available under generally accepted accounting principles and other material written communications between the independent registered public accounting firm and management
|
|
•
|
review with management major issues regarding auditing, accounting, internal control and financial reporting principles, policies and practices and regulatory and accounting initiatives, and presentation of financial statements,
|
F-33
and major issues as to the adequacy of the internal controls and any special audit steps adopted in light of material control deficiencies;
|
•
|
meet at least once annually with management and the independent registered public accounting firm in separate sessions;
|
|
•
|
review, prior to filing with the SEC, all annual and quarterly reports (and all interim reports on Form 8-K to be filed that contain financial disclosures of similar scope and magnitude as annual reports and quarterly reports).
|
|
•
|
assess at least annually the adequacy of codes of conduct, including codes relating to ethics, integrity, conflicts of interest, confidentiality, public disclosure and insider trading and, as appropriate, adopt changes thereto;
|
|
•
|
direct the establishment and maintenance of procedures for the receipt and retention of, and the treatment of, complaints received regarding accounting, internal control or auditing matters; and
|
|
•
|
direct the establishment and maintenance of procedures for the confidential and anonymous submission by employees of concerns regarding questionable accounting or auditing matters.
|
Members of the Audit and Finance Committee are William Nance, and Robert Reseigh. The Board has determined that each member of the Audit and Finance Committee meets the financial literacy requirements of the NYSE MKT and SEC, and that no members of Audit and Finance Committee violate the prohibition on serving as an Audit and Finance Committee member due to having participated in the preparation of our financial statements at any time during the past three years.. William Nance qualifies as an “audit committee financial expert” as that term is defined in the rules and regulations of the SEC, and therefore meets the NYSE MKT financial sophistication requirement for at least one Audit and Finance Committee member. The designation of William Nance as an “audit committee financial expert” does not impose on him any duties, obligations or liability that are greater than those that are generally imposed on him as a member of our Audit and Finance Committee and the Board, and his designation as an “audit committee financial expert” pursuant to this SEC requirement does not affect the duties, obligations or liability of any other member of our Audit and Finance Committee or the Board.
Compensation Committee
The Compensation Committee assists our Board in discharging and performing its duties with respect to management compensation, succession planning, employee relations and employee benefits, plan administration and director compensation.
Without limiting the scope of such activities, the Compensation Committee shall, among other things:
|
•
|
review and approve annually the goals and objectives relating to the compensation of the Chief Executive Officer, evaluate the performance of the Chief Executive Officer in light of such goals and objectives and annually determine the compensation of the Chief Executive Officer based on such evaluation;
|
|
•
|
review and approve, as appropriate, annually the compensation of the other executive officers and directors and review compensation of other members of senior management and other employees generally;
|
|
•
|
assess organizational systems and plans, including those relating to management development and succession planning;
|
|
•
|
administer stock-based compensation plans and assess compensation arrangements, plans, policies and programs and benefit and welfare plans and programs; and
|
|
•
|
review the Compensation Discussion and Analysis for inclusion in the annual proxy statements or annual report, as the case may be.
|
Members of the Compensation Committee are William Nance (chair) and Robert Reseigh, each of whom satisfies the independence requirements of NYSE MKT and SEC rules and regulations. Each member of our Compensation Committee is a non-employee director, as defined pursuant to Rule 16b-3 promulgated under the Exchange Act, and an outside director, as defined pursuant to Section 162(m) of the Internal Revenue Code of 1986, as amended (the “Internal Revenue Code”).
Compensation Committee Interlocks and Insider Participation
No member of the Compensation Committee was at any time an officer or employee of the Company, nor is any member of the Compensation Committee related to any other member of the Compensation Committee, any other member of the Board of Directors or any executive officer of the Company. No executive officer of the Company served as a director or member of the compensation committee of another entity, one of whose executive officers is a member of the Company’s Compensation Committee.
F-34
The Nominating and Governance Committee
The Nominating and Governance Committee assists our Board in discharging and performing its duties and responsibilities with respect to nomination of directors, selection of committee members, assessment of performance of our Board and other corporate governance matters. Without limiting the scope of such activities, the Nominating and Governance Committee shall, among other things:
|
•
|
review candidates for nomination for election as directors submitted by directors, officers, employees and stockholders; and
|
|
•
|
review at least annually the current directors of our Board to determine whether such individuals are independent under the listing standards of the NYSE MKT and the SEC rules under the Sarbanes-Oxley Act of 2002 (and non-employee directors (as defined under Exchange Act Rule 16b-3) and outside directors (as defined under Internal Revenue Code Section 162 (m))).
|
Members of the Nominating and Governance Committee are William Nance (chair), Daniel Kappes and Robert Reseigh, each of whom satisfies the independence requirements of NYSE MKT and SEC rules and regulations.
Shareholders may communicate with the full Board of Directors (including shareholder nominations), a specified committee of the Board of Directors or a specified individual member of the Board of Directors in writing by mail addressed to Comstock Mining Inc., P.O. Box 1118, Virginia City, Nevada 89440, Attention: Chairman of the Nominating and Governance Committee. The Chairman of the Nominating and Governance Committee and his or her duly authorized agents are responsible for collecting and organizing shareholder communications. Absent a conflict of interest, the Chairman of the Nominating and Governance Committee is responsible for evaluating the materiality of each shareholder communication and determining whether further distribution is appropriate, and, if so, whether to (1) the full Board of Directors, (2) one or more committee members, (3) one or more Board members and/or (4) other individuals or entities. Please note that, pursuant to the terms of the employment agreement of Mr. De Gasperis, the Company agreed to take all actions as may be necessary to elect Mr. De Gasperis as a director of the Company.
Attendance at Annual Meeting
We expect all directors to attend the annual meeting of shareholders each year.
Director Compensation
|
Outstanding Equity Awards at December 31, 2016
|
|||||||||||||||||||||||||||||
|
Option awards
|
Stock awards
|
||||||||||||||||||||||||||||
|
Name
|
Number of securities underlying unexercised options (#) exercisable
|
Number of securities underlying unexercised options (#) unexercisable
|
Equity incentive plan awards: Number of securities underlying unexercised unearned options (#)
|
Option exercise price ($)
|
Option expiration date
|
Number of shares or units of stock that have not vested (#)
|
Market value of shares of units of stock that have not vested ($)
|
Equity incentive plan awards: Number of unearned shares, units or other rights that have not vested (#)
|
Equity incentive plan awards: Market or payout value of unearned shares, units or other rights that have not vested ($)
|
||||||||||||||||||||
|
Daniel Kappes
|
—
|
|
—
|
|
—
|
|
$
|
—
|
|
—
|
—
|
|
$
|
—
|
|
—
|
|
$
|
—
|
|
|||||||||
|
Robert Kopple
|
—
|
|
—
|
|
—
|
|
—
|
|
—
|
—
|
|
—
|
|
—
|
|
—
|
|
||||||||||||
|
William Nance
|
—
|
|
15,000
|
|
—
|
|
4.00
|
|
10/1/2018
|
—
|
|
—
|
|
—
|
|
—
|
|
||||||||||||
|
Robert Reseigh
|
—
|
|
15,000
|
|
—
|
|
4.00
|
|
10/1/2018
|
—
|
|
—
|
|
—
|
|
—
|
|
||||||||||||
F-35
COMPENSATION DISCUSSION AND ANALYSIS
This compensation discussion and analysis explains the material elements of the compensation for our named executive officers.
The Company’s philosophy is to align total compensation of its employees, including the named executive officers, with the achievement of the Company’s goals, most importantly, creating sustainable wealth. The adoption and implementation of compensation programs is intended to support that philosophy and the interest of the Company and its stockholders by providing appropriate forms of cash and stock-based compensation alternatives that strengthen the ability of the Company to attract, motivate and retain employees and others who focus their efforts and abilities on realizing the Company’s objectives, and are in a position to impact the financial and operational performance of the Company.
What are our compensation principles?
The Compensation Committee (for purposes of this Compensation Discussion and Analysis section, the “Committee”) designs and oversees the Company’s compensation policies and approves compensation for our named executive officers. Our goal is to create compensation plans linked to enhancing shareholder value. We strive to align the interests of shareholders with those of employees at all levels of the organization. Our focus is on achieving sustainable results through the systematic and methodical implementation of our strategic plan. These principles are inherently long-term in nature. To accomplish this, our plans are designed to:
|
•
|
Support our business strategy - We align our programs with business strategies focused on long-term growth and enhanced shareholder value. Our compensation plans allow our executives to share in that wealth creation and support an environment that promotes improvement and breakthrough performance.
|
|
•
|
Pay for Performance - A substantial majority of our executive pay is dependent upon the achievement of specific corporate performance goals. As a result, individual performance as it relates to compensation is only relevant insofar as it advances the goals of the Company. Our plans will result in realizing higher compensation when goals are met and lower compensation when goals are not met.
|
|
•
|
Pay Competitively - We establish compensation levels that are designed to meet or exceed the needs of our employees. We also assess them against companies that we believe compete with us for human capital. In this context, we believe we are more than competitive with those competing companies.
|
What are our compensation objectives?
Central to the Company’s goal of wealth creation is the achievement of predictable, sustainable growth of throughput (that is, the rate at which our system generates cash as determined by the constraint in the system (i.e., the system’s “weakest link”) identified by management). Accordingly, it is important to the Company that non-throughput based measurements are eliminated from decision-making or minimized (for example, when required by law). Additionally, we seek to use Statistical Process Control (SPC) on the most critical, interdependent processes to promote stability and predictability in our operations.
In designing our compensation plans, our overreaching objectives are to:
|
•
|
Drive superior throughput-based financial performance - we design programs that encourage our executives to achieve or exceed goals and share in that value creation.
|
|
•
|
Attract, retain and motivate the right people in the right role, within the broader system design - we require independent and interdependent performance and allow our executives to share in the value created based on the system’s performance.
|
|
•
|
Align our executives with shareholders’ long-term interests by building the opportunity for significant ownership of Company stock through our compensation programs, vesting only on the systems achievement of value enhancing performance objectives.
|
|
•
|
Focus on full alignment to the goal of the system, our executives vest only when the systems objectives and goals are achieved. The objectives and the vesting do not vary from the rest of program participants.
|
F-36
Our compensation plans are intended to serve both named executive officers and employees generally. Accordingly, we currently offer two components of compensation as explained below:
Base Compensation
. Base compensation should both reflect the Company’s appreciation of the employee’s competencies (with some but not absolute consideration to the market’s valuation of those competencies) and meet the needs of the employee for stability. The objective should be that base compensation is not only enough to meet the basic needs for employees and their families, but is also enough to take the issue of money-as-a-motivator off the table.
Stock-based Compensation
. We acknowledge the risk that certain stock-based compensation programs could fail to completely satisfy the compensation principles previously described because the various instruments typically used (options, warrants, time-based grants, etc.) may present no real correlation to performance and, in particular, performance against a precisely defined goal and duration. However, we believe that stock-based compensation tied to the achievement of precise goals and the Company’s strategic plan does provide meaningful rewards for stable, measurable progress. Accordingly, we adopted a shareholder approved, equity incentive plan based solely on performance-based vesting.
The following is a summary of the principal features of the 2011 Equity Incentive Plan (the “2011 Plan”) and its operation and is qualified by reference to the full text of the 2011 Plan.
Any employee of Comstock or a subsidiary of Comstock providing services to Comstock or any of its subsidiaries who is specifically identified by the Committee, and any non-employee director of Comstock or any of its subsidiaries is eligible to receive awards under the 2011 Plan. While all of our employees and non-employee directors would be eligible to participate in the 2011 Plan, most awards under the 2011 Plan have been made to our senior officers, managers, and technical and professional personnel.
The maximum number of shares of the Company’s common stock that may be delivered pursuant to awards granted under the 2011 Plan is 6,000,000 shares of common stock. No more than 6,000,000 shares of common stock may be issued under the 2011 Plan or transferred upon exercise or settlement of incentive stock options. Any shares subject to an award under the 2011 Plan that are forfeited or terminated, expire unexercised, lapse or are otherwise canceled in a manner such that the shares of common stock covered by such award are not issued may be used again for awards under the 2011 Plan.
As of
December 31, 2016
,
2,129,200
shares remained available for issuance under the 2011 Plan. All of the awards to date have been made in the form of restricted stock. All unvested restricted stock awards granted under the 2011 Plan are subject to the following vesting requirements:
For stock granted in 2012 and earlier:
|
•
|
the final two-fifths (2/5) of the restricted shares vest on the date of certification by the Committee of the attainment of both (A) the validation through a NI 43-101 of qualified resources (at least measured and indicated) and reserves (proven and probable), in each case including those previously validated, of the Company aggregating 3,250,000 ounces of gold equivalent and (B) the completion of three months (that is, ninety (90) days) of consecutive mining operations at an annual production rate of 20,000 ounces of gold equivalent (the Company produced at greater than this rate in 2014).
|
For stock granted in 2013:
•
Completion of one year of service with the Company (for employees that received stock grants in 2013); and
|
•
|
the final two-fifths (2/5) of the restricted shares vest on the date of certification by the Committee of the attainment of both (A) the validation through a NI 43-101 of qualified resources (at least measured and indicated) and reserves (proven and probable), in each case including those previously validated, of the Company aggregating 3,250,000 ounces of gold equivalent and (B) the completion of three months (that is, ninety (90) days) of consecutive mining operations at an annual production rate of 20,000 ounces of gold equivalent (the Company produced at greater than this rate in 2014)
|
In addition, if a change in control of the Company (as defined in the 2011 Plan) occurs, then the shares would vest immediately and, following the date on which the participant’s employment is terminated by the Company without cause or following the participant’s disability, the portion of the award that would vest upon achieving the next objective shall vest at the time of termination. The unvested awards expire five years after the grant date.
F-37
Who are our named executive officers?
The Company’s named executive officers for
2016
were:
|
Name
|
|
Title
|
|
Corrado De Gasperis
|
|
President & CEO
|
|
Judd Merrill
|
CFO, CAO and Secretary
|
|
How do we assure that our compensation program keeps our named executive officers focused on long-term success?
We assure that our compensation programs keep our named executive officers focused on the long-term success of our Company by making a substantial portion of their long-term pay subject to the achievement of specific, longer-term, strategic, company wide performance objectives and by granting stock-based awards with vesting criteria fully linked with those, longer term, measurable strategic objectives. Moreover, the value of such stock-based awards will likely only increase based on the long-term performance of the Company as compared to other investment alternatives.
How is competitiveness established?
The Committee structures executive compensation so that targeted total cash compensation and longer-term stock based compensation opportunities are competitive with comparable positions at companies that we compete with for human capital, basically mining and construction-type companies based in Nevada. When considering what is competitive for the Company, the Committee considered the complexity of starting up a new, industrial mine, the breakthrough’s required for success, the entrepreneurial and team building competencies needed, the complexities of the regulatory and political environments and the extensive interdependencies required with all stakeholders, including the people required for operating the system. The Company does not use benchmarking against a peer group or otherwise.
In setting
2016
base salaries, target total cash compensation and target total direct compensation, the Committee considered the potential value creation inherent in our stated objectives, the time period required for achieving those objectives and the associated risks.
How is compensation established for our named executive officers?
The Committee does not rely exclusively on existing market data in establishing target levels of compensation. The Committee also does not employ a rigid or formulaic process to set pay levels, but does utilize market data as one of many tools to assist the Committee. In setting compensation levels, the Committee considers the following factors:
|
•
|
market data;
|
|
•
|
each executive’s competency;
|
|
•
|
each executive’s scope of responsibility and impact on the Company’s performance;
|
|
•
|
internal equity - an executive’s compensation relative to his or her peers in the system; and
|
|
•
|
the CEO’s recommendations for his senior team.
|
Each of our named executive officers’ performance is evaluated in light of our overall financial performance and the advancement of our strategic objectives approved by the Committee and the Board of Directors. For 2015, as in past years, the Committee structured a compensation package for our named executive officers comprised of base salary and benefits coupled with long-term incentives (restricted stock grants), which we believe provided an appropriate mix of financial security, wealth sharing.
F-38
Annual Compensation: Base Salaries
Base salary provides our named executive officers with a basic level of financial security and supports the Committee’s objectives in attracting and retaining top talent. Base salary increases for other named executive officers (other than our CEO) are recommended by our CEO and are reviewed and approved by the Committee.
|
Executive Officer
|
|
2016Annual
Base Salary
|
||
|
Corrado De Gasperis
(1)
|
|
$
|
288,000
|
|
|
Judd Merrill
(2)
|
132,000
|
|
||
_____________
(1)
Mr. De Gasperis salary was reduced from $360,000 to $288,000 in conjunction with the Company's efforts to reduce general and administrative expenses.
(2)
Mr. Merrill's salary was reduced from $165,000 to $132,000 in conjunction with the Company's efforts to reduce general and administrative expenses.
The Committee is satisfied that each of the named executive officers’ salary is reasonable and appropriate.
Why did the Committee choose the performance metrics for the 2011 Equity Plan?
At the time the stock awards were granted, the Committee chose to align the vesting of stock awards directly to the achievement of the established goal of the strategic plan approved by the Board in April 2010. The goal of that business plan is to deliver stockholder value by validating qualified resources (measured and indicated) and reserves (proven and probable) of at least 3,250,000 gold equivalent ounces and achieve initial commercial mining with annual production rates of approximately 20,000 gold equivalent ounces. Accordingly, the restricted stock vests fully upon the achievement of both of these stated objectives. If the objectives are not achieved, the stock grant will not vest. In 2013, the Company achieved production rates of more than 20,000 gold equivalent ounces per year. The Committee chose to allow for partial vesting as the Company achieves intermediate objectives towards these goals, as stated above.
Benefits
The Company provides named executive officers with the same benefits provided to other Comstock employees namely, health and dental insurance (Company pays a portion of costs).
Post Termination Payments
We believe that we should provide reasonable severance benefits if an executive’s position is eliminated in the event of a change in control or, in the absence of a change in control, in certain other circumstances. It is our belief that the interests of shareholders are best served if our senior management is focused on the performance of the Company without the distraction and uncertainty that the lack of such protection would invite. We also believe that providing these benefits helps to facilitate the recruitment of talented executives, and that, relative to the overall value of any potential transaction, these potential benefits are appropriately sized.
The employment agreements for Mr. De Gasperis and Mr. Merrill include severance arrangements. For additional information with respect to these arrangements, please see “Employment, Retirement and Severance Plans and Agreements”.
ADDITIONAL INFORMATION
We believe this additional information may assist you in better understanding our compensation practices and principles.
F-39
Role of the Committee and the CEO
The Committee, consisting entirely of independent Directors, is responsible for executive compensation. As part of the compensation-setting process each year, the Committee meets periodically with the CEO to review the Company’s progress toward its stated strategic objectives and receives comments from members of the Board of Directors. The CEO recommends to the Committee the compensation amounts for each of our named executive officers, other than himself.
While the Committee will ask for advice and recommendations from the CEO, the Committee is responsible for executive compensation and as such:
|
•
|
Sets named executive officer base salaries;
|
|
•
|
Reviews the business and financial plan and progress toward strategic goals, performance measures and action plans for our business, which are reviewed by, and subject to approval of, the entire Board of Directors;
|
|
•
|
Reviews annual and long-term performance against goals and objectives;
|
|
•
|
Reviews contractual agreements and benefits, including supplemental retirement and any payments which may be earned upon termination, and makes changes as appropriate;
|
|
•
|
Reviews incentive plan designs, ensures alignment and makes changes as appropriate; and
|
|
•
|
Reviews total compensation to ensure compensation earned by named executive officers is fair and reasonable relative to corporate and individual performance.
|
The Committee is authorized to retain compensation consultants or advisors but does not presently do so. Any such consultant or advisor selected by the Committee would only be selected if the Committee determined that such consultant or advisor is independent from our management pursuant to SEC and NYSE MKT standards.
Deductibility of Compensation
In determining the total compensation of each named executive officer, the Committee considers the tax deductibility of compensation. The Committee believes it is generally in the interests of the Company and our shareholders to provide compensation that is tax deductible by the Company. While the Committee intends that compensation be deductible, there may be instances where potentially non-deductible compensation is justifiably provided to reward executives consistent with our compensation philosophy for each compensation element.
Advisory Vote on Executive Compensation
As required by the Dodd Frank Wall Street Reform and Consumer Protection Act of 2010 and the rules and regulations promulgated by the SEC pursuant thereto, we included a proposal for a non-binding advisory resolution approving the compensation of our named executive officers for
2015
in our proxy statement for our
2016
annual meeting of stockholders. The proposal was overwhelmingly supported by stockholders with approval in excess of 99% (77,465,368 votes in favor and 9,584,207 votes against).
The Committee considered the results of the advisory vote in reviewing our executive compensation program, noting the high level of shareholder support, and elected to continue the same principles and objectives in determining the types and amounts of compensation to be paid to our named executive officers in
2016
. The Committee will continue to focus on responsible executive compensation practices that attract, motivate and retain high performance executives, reward those executives for the achievement of long-term performance and support our other executive compensation objectives.
COMPENSATION COMMITTEE REPORT
The Compensation Committee has reviewed and discussed the Compensation Discussion and Analysis section of this annual report on Form 10-K with management and, based on such review and discussion, recommended to the Board of Directors that it be included in this annual report on Form 10-K.
COMPENSATION COMMITTEE
William J. Nance, Chair
Robert A. Reseigh
March 9, 2017
F-40
The following table sets forth, for the periods indicated, the total compensation for services provided to us by the person who served as our principal executive officer (CEO) and principal financial officer during
2016
, and the other executive officer other than the CEO who served as an executive officer at the end of
2016
who received aggregate compensation exceeding $100,000 during
2016
.
SUMMARY COMPENSATION TABLE
|
Name and Principal Position
|
Year
|
Salary
($)
|
Stock Awards
($)
(1)
|
Option Awards
|
Non-equity incentive Plan Compensation
|
Non-qualified deferred Compensation Earnings
|
All other compensation
|
Total
($)
|
|||||||||||||||||
|
Corrado De Gasperis
|
2016
|
$
|
311,342
|
|
—
|
|
—
|
|
—
|
|
—
|
|
—
|
|
$
|
311,342
|
|
||||||||
|
President and Chief Executive Officer
(2)
|
2015
|
360,000
|
|
—
|
|
—
|
|
—
|
|
—
|
|
—
|
|
360,000
|
|
||||||||||
|
Judd Merrill
|
2016
|
123,430
|
|
—
|
|
—
|
|
—
|
|
—
|
|
—
|
|
123,430
|
|
||||||||||
|
Chief Financial Officer & Chief Accounting Officer
(3)
|
2015
|
162,500
|
|
—
|
|
—
|
|
—
|
|
—
|
|
—
|
|
162,500
|
|
||||||||||
_____________
(1)
Any amounts in the column reflect the aggregate grant date fair value for stock awards computed in accordance with FASB ASC Topic 718. All assumptions made in the valuation of the awards are discussed in note 15. The stock awards vest upon the attainment of performance goals described under the caption “Compensation Discussion and Analysis – Stock-Based Compensation” and reflect the value based on the probable outcome of the performance goals and the amount is the same assuming that the highest level of performance conditions will be achieved.
(2)
Mr. De Gasperis was hired to serve as the Chief Executive Officer and President of the Company effective April 21, 2010 and has been our Executive Chairman since September 2015. Mr. De Gasperis has also served as the Principal Financial Officer since April 21, 2010.
(3)
Mr. Merrill was hired as Controller sin 2011 and became Chief Accounting Officer and Secretary effective January 1, 2014, and Chief Financial Officer effective February 5, 2015.
The terms of each of Mr. De Gasperis and Mr. Merrill's employment agreement is described in detail in Employment, Retirement and Severance Plans and Agreements below.
Current Equity Compensation Program
In 2011, the Company adopted the 2011 Plan. For a description of the 2011 Plan, please see “Compensation Discussion and Analysis - Stock-Based Compensation.” The 2011 Plan replaced the equity plans previously adopted by the Company, including, without limitation, those adopted in 2005 and 2006.
As of
December 31, 2016
, 3,870,800 shares have been issued and outstanding under the program and 3,730,800 shares have vested and
140,000
are unvested. On December 21, 2011, the Board of Directors granted 4,710,000 shares of restricted stock to certain employees under the 2011 Plan. Of these shares, Mr. De Gasperis received a grant of 2,750,000 shares (of which, 1,650,000 shares have vested and 1,100,000 expired) and 75,000 shares (of which 45,000 shares have vested and 30,000 expired) were granted to Mr. Merrill.
Prior Equity Compensation Programs
In 2005, the Company adopted a stock option and incentive plan that was approved by our stockholders in October 2005. That plan expired in June 2011 upon the adoption of the 2011 Plan with no awards having been issued thereunder.
In 2006, the Company adopted another stock option and incentive plan (“2006 Plan”) that was approved by our stockholders in November 2006. The plan provided for a maximum of 4,000,000 shares of common stock to be issued (the shares reflect the adjustment due to the reverse stock split). Under the 2006 Plan, options, stock and other awards could have been granted to employees and non-employee directors. Stock options granted under the 2006 Plan generally vested over three years and
F-41
expired ten years from the date of the grant. Options to purchase an aggregate of 50,000 fully vested options remain outstanding under the 2006 Plan. The 2006 Plan expired upon the adoption of the 2011 Plan.
Employment, Retirement and Severance Plans and Agreements
Corrado De Gasperis Employment Agreement
Mr. De Gasperis was hired to serve as our Chief Executive Officer and President effective April 21, 2010. In connection with his employment, the Company entered into an Employment Agreement with Mr. De Gasperis, which also provided for his election as a director upon closing of the recapitalization and the capital raise transactions in 2010.
Term.
The agreement expired on April 21, 2014 and is automatically extended for additional one-year periods unless notice of termination is provided. If a “change in control” of the Company (as defined in the agreement) occurs and the remaining term of the agreement is less than three years, then the term will be extended to three years beyond the date of the change in control.
Salary and Other Benefits.
Under the agreement, Mr. De Gasperis is entitled to an annual base salary of $360,000. Mr. De Gasperis is entitled to participate in each of our medical, pension or other employee benefit plans generally available to employees. Mr. De Gasperis is also entitled to participate in any of our incentive or compensation plans. The agreement also requires us to adopt a profit sharing plan whereby 10% of net cash profits before principal payments of indebtedness and investments in fixed assets will be set aside for semi-annual payments to employees, no less than 35% of which shall be payable to Mr. De Gasperis. The profit sharing plan has not yet been established.
Equity Awards.
The Company was required to adopt an equity incentive plan with certain terms. The Board adopted the 2011 Plan in June 2011 and granted an award of 2,750,000 shares of restricted stock under the 2011 Plan in December 2011, with the terms described under the caption “Compensation Discussion and Analysis - Stock-Based Compensation.”
Rights on Termination of Employment.
If Mr. De Gasperis employment is terminated without “cause,” if his employment is terminated due to his “disability” or if he resigns for “good reason” (each term as defined in his agreement), subject to his executing a release in our favor, Mr. De Gasperis shall be entitled to:
|
•
|
a lump sum payment of all accrued amounts due to him through the date of his termination;
|
|
•
|
continued base salary for twelve months (or thirty-six months if the termination is during the three year period following a change in control); and
|
|
•
|
continuation of health and life insurance benefits for the longer of the period during which base salary is payable following termination or 18 months (unless he is entitled to participate in the health plan of a new employer).
|
If Mr. De Gasperis’ employment is terminated due to his death, his estate is entitled to the benefits (other than continued life insurance coverage) outlined above.
Upon a termination of Mr. De Gasperis employment for cause or his resignation without good reason, he shall be entitled to a lump sum payment of all amounts due to him through the date of his termination.
Non-Compete. The agreement prohibits Mr. De Gasperis from competing with us during the term of his employment and for one year thereafter.
Judd Merrill’s Employment Agreement
Mr. Merrill was appointed to serve as our Chief Accounting Officer effective January 1, 2014 and Chief Financial Officer effective February 5, 2015 and he is currently our Chief Financial Officer.
Salary and Other Benefits
. Under the agreement, Mr. Merrill is entitled to an annual base salary of $165,000. Mr. Merrill is entitled to participate in each of our medical, pension or other employee benefit plans generally available to employees. Mr. Merrill is also entitled to participate in any of our incentive or compensation plans, including any profit sharing plan contemplated by Mr. Merrill’s employment agreement. The profit sharing plan has not yet been established.
F-42
Restricted Stock Awards.
As referenced under the caption “Compensation Discussion and Analysis - Stock-Based Compensation,” if a change in control of the Company (as defined in the 2011 Plan) occurs, then the shares of restricted stock granted to the named executive would vest immediately and, following the date on which the named executive officer’s employment is terminated by the Company without cause or following his disability, the portion of the award that would vest upon achieving the next objective shall vest at the time of termination. For purposes of the 2011 Plan, change in control occurs, generally, on the following:
|
•
|
the date on which any person or group becomes the beneficial owner of 40% or more of the then issued and outstanding common stock or voting securities of the Company (not including securities held by our employee benefit plans or related trusts or certain acquisitions by John Winfield and his affiliates);
|
|
•
|
the date on which any person or group acquires the right to vote on any matter, by proxy or otherwise, with respect to 40% or more of the then issued and outstanding common stock or voting securities of the Company (not including securities held by our employee benefit plans or related trusts or certain acquisitions by John Winfield and his affiliates);
|
|
•
|
the date, at the end of any two-year period, on which individuals, who at the beginning of such period were directors of the Company, or individuals nominated or elected by a vote of two-thirds of such directors or directors previously so elected or nominated, cease to constitute a majority of our Board;
|
|
•
|
the date on which stockholders of the Company approve a complete liquidation or dissolution of the Company; or
|
|
•
|
the date on which we consummate certain reorganizations, mergers, asset sales or similar transactions.
|
Equity Compensation Plan Information
The following table sets forth information with respect to our common stock that may be issued upon the exercise of stock options under our incentive stock option plans as of
December 31, 2016
.
|
Plan Category
|
(a) Number of Securities to Be Issued Upon Exercise of Outstanding Options, Warrants, and Rights
|
(b) Weighted- Average Exercise Price of Outstanding Options, Warrants, and Rights
|
(c) Number of Securities Remaining Available for Future Issuance Under Equity Compensation Plans (Excluding Securities Reflected in Column (a))
|
|||
|
Equity Compensation Plans Approved by Stockholders
(1)
|
50,000
|
$4.00
|
2,129,200
|
|||
_____________
(1)
The table does not include the
140,000
shares of non-vested restricted stock granted under the 2011 Plan. The equity compensation plans approved by shareholders include the 2011 Plan, under which
2,129,200
shares remain available for issuance, and the option and incentive plan adopted by the Company in 2006, under which no additional awards may be granted.
COMPENSATION OF DIRECTORS
During
2016
, all directors who are not Company employees, except for Mr. John Winfield, who resigned from the Board in September 2015, were authorized to receive shares of the Company’s common stock for their service as a director. Mr. Daniel Kappes, Mr. William Nance and Mr. Robert Reseigh each were authorized to receive 35,000. As of
December 31, 2016
, no shares have been issued. The following table summarizes the directors’ cash compensation for
2016
:
|
Name
|
Fees Earned or Paid in Cash ($)
(1)
|
||
|
Daniel Kappes
|
$
|
42,000
|
|
|
William Nance
|
42,000
|
|
|
|
Robert Reseigh
|
42,000
|
|
|
(1)
No payment included interest.
F-43
Based solely on our review of the forms required by Section 16(a) of the Exchange Act that have been received by us, we believe there has been compliance with all filing requirements applicable to our officers, directors and beneficial owners of greater than 10% of our common stock, except for (i) an August 27, 2015 transactions involving the InterGroup Corporation and John V. Winfield that were not reported until September 4, 2015, Van Den Berg Management I, Inc., which has reported beneficial ownership of 19.47% on Schedule 13G/A as of November 10, 2015, but has not yet filed a Form 3 or Form 4 for its beneficial ownership.
STOCK OWNERSHIP
The following table sets forth, as of
March 6, 2017
, the total number of shares owned beneficially by each of our directors, officers and key employees, individually and as a group, and the present owners of 5% or more of any class of our voting equity securities.
|
Name and Address
(a)
|
Title of class
|
Amount and nature of beneficial ownership
|
Percent of class
(b)
|
|
||||
|
Van Den Berg Management, Inc.
805 Las Cimas Parkway Suite 430
Austin, TX 78746
|
Common Stock
|
30,189,136
|
|
(c)
|
16.1
|
%
|
||
|
John Winfield
|
Common Stock
|
48,165,201
|
|
(d)
|
25.7
|
%
|
||
|
Officers and Directors
|
||||||||
|
William Nance
|
Common Stock
|
190,000
|
|
(e)
|
*
|
|
||
|
Daniel Kappes
|
Common Stock
|
120,199
|
|
*
|
|
|||
|
Robert Reseigh
|
Common Stock
|
115,000
|
|
(f)
|
*
|
|
||
|
Corrado De Gasperis
|
Common Stock
|
1,045,500
|
|
*
|
|
|||
|
All directors and executive officers as a group (5 persons)
|
Common Stock
|
1,470,699
|
|
0.78
|
%
|
|||
_____________
* Less than 1%
|
(a)
|
Unless otherwise indicated, the business address of each person named in the table is c/o of Comstock Mining Inc., P.O. Box 1118, 1200 American Flat Road, Virginia City, NV 89440.
|
|
(b)
|
Applicable percentage of ownership is based on
187,400,075
shares of common stock outstanding as of
March 6, 2017
together with all applicable options and warrants for such stockholder. Beneficial ownership is determined in accordance with the rules of the SEC, and includes voting and investment power with respect to shares. Shares of our common stock subject to options, warrants or other convertible securities exercisable within 60 days after
March 6, 2017
are deemed outstanding for computing the percentage ownership of the person holding such options, warrants or other convertible securities, but are not deemed outstanding for computing the percentage of any other person. Except otherwise noted, the named beneficial owner has the sole voting and investment power with respect to the shares of common stock shown.
|
|
(c)
|
Includes shares of the Company’s common stock owned by various investment advisory clients of Van Den Berg Management, Inc. Based solely on the information contained in the Scheduled 13G Amendment filed with the SEC on February 16, 2016.
|
|
(d)
|
Mr. Winfield is the President, Chief Executive Officer and Chairman of the Board of InterGroup, Santa Fe and Portsmouth and may be deemed to share voting and dispositive power over shares of the Company’s securities owned by each of InterGroup, Santa Fe and Portsmouth. Mr. Winfield has sole voting power over shares of the Company’s securities held by Northern Comstock. The
48,165,201
shares of the Company’s common stock beneficially owned by Mr. Winfield includes (i)
13,937,922
shares of the Company’s common stock held directly by Mr. Winfield, (ii),
13,148,076
shares of the Company’s common stock held by InterGroup, (iii)
8,887,896
shares of the Company’s common stock held by Portsmouth, (iv)
4,533,242
shares of the Company’s common stock held by Santa Fe, (vi)
7,658,065
shares of the Company’s common stock held by Northern Comstock,
|
F-44
|
Amount and nature of beneficial ownership
|
||
|
John Winfield
|
13,937,922
|
|
|
Intergroup Corporation
|
13,148,076
|
|
|
Portsmouth Square Inc
|
8,887,896
|
|
|
Santa Fe Financial Corp
|
4,533,242
|
|
|
Northern Comstock LLC
|
7,658,065
|
|
|
Total
|
48,165,201
|
|
|
(e)
|
Includes 15,000 shares of common stock issuable upon exercise of vested options.
|
|
(f)
|
Includes
15,000
shares of common stock issuable upon exercise of vested options.
|
The Board of Directors has adopted a written related person transaction policy that governs the review, approval or ratification of covered related person transactions. The Audit and Finance Committee manages this policy. The policy generally provides that we may enter into a related person transaction only if:
|
•
|
the Audit and Finance Committee approves or ratifies such transaction in accordance with the guidelines set forth in the policy and the transaction is on terms comparable to those that could be obtained in arm’s length dealings with an unrelated third party; or
|
|
•
|
the transaction is approved by the disinterested members of the Board of Directors; or
|
|
•
|
the transaction involves compensation approved by our Compensation Committee.
|
For information about certain relationships between our director nominees and the Company, please see below:
Northern Comstock LLC
On October 20, 2010, the Company entered into an operating agreement (the “Operating Agreement”) to form Northern Comstock LLC (“Northern Comstock”) with Mr. John Winfield, the Company’s former Chairman and largest shareholder, and an entity controlled by Mr. Winfield, DWC Resources, Inc. (“DWC”). As part of the Operating Agreement, the Company obtained the exclusive rights of production and exploration on certain property formerly owned by DWC in Storey County, Nevada (the “DWC Property”) and two parcels leased by Mr. John Winfield in Storey County, Nevada from the Sutro Tunnel Company (the “Sutro Property”) and Virginia City Ventures (the “VCV Property”).
On August 27, 2015, the Company announced the terms of this agreement were amended on August 27, 2015, and September 28, 2015 (the “Amendments”), with the other members of its Northern Comstock LLC joint venture. The Amendments resulted in reduced capital contribution obligations of the Company from $31.05 million down to $9.75 million. The terms of the Amendments provide that the Company will make monthly cash capital contributions of $30,000 and annual capital contributions in the amount of $482,500 payable in stock or cash, at the Company's option, unless the Company has cash or cash equivalents in excess of $10,500,000 on the date of such payments, wherein the Company would then be required to pay in the form of cash, or in certain circumstances, the Company’s common stock. The number of shares to be delivered is calculated by dividing the amount of the capital contribution by the volume-weighted average closing price of the Company’s common stock on its primary trading market for the previous 20 consecutive trading days prior to such capital contribution. The Operating Agreement also provides for a one-time acceleration of $812,500 of the capital contributions payable when the Company receives net cash proceeds from sources other than operations that exceed $6,250,000. The agreement also includes an ongoing acceleration of the Company’s capital contribution obligations equal to 3% of the net smelter returns generated by the properties subject to the Northern Comstock LLC joint venture. The Operating Agreement also provides that if the Company defaults in its obligation to make the scheduled capital contributions, then the remaining capital contribution obligations may be converted into the principal amount of a 6% per annum promissory note payable by the Company on the same schedule as the capital contributions, secured by a mortgage on the properties subject to the Northern Comstock LLC joint venture. The operating agreement requires that these capital contributions commence in October 2015, and end in September 2027, unless prepaid by the Company.
F-45
Restructuring Agreement
On July 29, 2015, the Company entered into a Restructuring Agreement (the “Restructuring Agreement”), with Northern Comstock, the members of Northern Comstock and other entities affiliated with Mr. Winfield. Pursuant to the Restructuring Agreement, the Company’s shareholders party thereto agreed to consent to the proposed amendments to the Company’s then outstanding convertible preferred stock that resulted in the elimination of certain special voting rights and Board representation rights associated with the Company’s previously outstanding Series A-1 Convertible Preferred Stock and the Company and the other members of Northern Comstock agreed to amend the terms of the First Amendment.
Stockholders' Agreement
On July 29, 2015, the Company entered into a Stockholders’ Agreement (the “Stockholders’ Agreement”), with Mr. Winfield and entities affiliated with Mr. Winfield, pursuant to which the Company is generally prohibited from incurring indebtedness in excess of $5,000,000, subject to certain limited exceptions. The prohibition set forth in the Stockholders’ Agreement is substantially identical to the negative covenant previously contained in the documents governing the Company’s previously outstanding convertible preferred stock.
Item 14.
Principal Accountants Fees and Services
The Audit and Finance Committee of the Board of Directors is composed of two independent directors and operates under a written charter adopted by the Board of Directors. The Audit and Finance Committee approves the selection of our independent registered public accounting firm.
Management is responsible for our disclosure controls, internal controls and the financial reporting process. The independent registered public accounting firm is responsible for performing an independent audit of our consolidated financial statements in accordance with the standards of the Public Company Accounting Oversight Board (United States) and for issuing a report thereon. The Audit and Finance Committee’s primary responsibility is to monitor and oversee these processes and to report thereon to the Board of Directors. In this context, the Audit and Finance Committee has met privately with management and Deloitte & Touche LLP, our independent registered public accounting firm. Deloitte & Touche LLP has had unrestricted access to the Audit and Finance Committee.
The Audit and Finance Committee has discussed with Deloitte & Touche LLP the matters required to be discussed by Statement on Auditing Standards No. 61, as amended (AICPA, Professional Standards, Vol. 1, AU Section 380), as adopted by the Public Company Accounting Oversight Board in Rule 3200T, including the scope of the auditor’s responsibilities and whether there are any significant accounting adjustments or any disagreements with management.
The Audit and Finance Committee also has received the written disclosures and the letter from Deloitte & Touche LLP required by applicable requirements of the Public Company Accounting Oversight Board regarding the independent accountant’s communications with the Audit and Finance Committee concerning independence, and has discussed with Deloitte & Touche LLP that firm’s independence from the Company.
The Audit and Finance Committee has reviewed and discussed the consolidated financial statements with management and Deloitte & Touche LLP. Based on this review and these discussions, the representation of management that the consolidated financial statements were prepared in accordance with generally accepted accounting principles, and the report of Deloitte & Touche LLP to the Audit and Finance Committee, the Audit and Finance Committee recommended that the Board of Directors include the audited consolidated financial statements in our Annual Report on Form 10-K for the year ended
December 31, 2016
filed with the SEC.
The Audit and Finance Committee also reviews with management and the independent registered public accounting firm the results of that firm’s review of the unaudited financial statements that are included in our quarterly reports on Form 10-Q.
Fees Billed by our Auditors
The Audit and Finance Committee reviews the fees charged by our independent registered public accounting firm. During the fiscal years ended
December 31, 2016
and
December 31, 2015
, we were billed the following fees set forth below in connection with services rendered by that firm to us.
F-46
|
2016
|
2015
|
||
|
Deloitte & Touche LLP
|
Deloitte & Touche LLP
|
||
|
Audit Fees
|
$261,000
|
$271,960
|
|
|
Audit-Related Fees
|
26,000
|
26,832
|
|
|
Tax Fees
|
18,907
|
18,531
|
|
|
Total fees
|
$305,907
|
$317,323
|
|
Audit Fees
. Audit fees include professional services rendered by Deloitte & Touche LLP for the audit of our annual financial statements, including its assessment of our internal control over financial reporting for the 2015 audits, and the reviews of the financial statements included in our quarterly reports on Form 10-Q. This category also includes fees for audits provided in connection with statutory filings or services that generally only the principal auditor reasonably can provide to a client, implementation of new financial and accounting reporting standards and consents and assistance with and review of documents filed with the SEC.
Audit-Related Fees
. Audit-related fees include consultation on certain financial accounting and reporting standards and other miscellaneous audit-related fees, such as comfort letters in connection with offerings by the Company.
Tax Fees.
Tax fees include original and amended tax returns, studies supporting tax return amounts as may be required by Internal Revenue Service regulations, claims for refunds, assistance with tax audits and other work directly affecting or supporting the payment of taxes.
Audit and Finance Committee Pre-Approval Policy
The charter of our Audit and Finance Committee provides that the duties and responsibilities of our Audit and Finance Committee include the pre-approval of all audits, audit-related, tax, and other services permitted by law or applicable SEC regulations (including fee and cost ranges) to be performed by our independent auditor. Any pre-approved services that will involve fees or costs exceeding pre-approved levels will also require specific pre-approval by the Audit and Finance Committee. Unless otherwise specified by the Audit and Finance Committee in pre-approving a service, the pre-approval will be effective for the 12-month period following pre-approval. The Audit and Finance Committee will not approve any non-audit services prohibited by applicable SEC regulations or any services in connection with a transaction initially recommended by the independent auditor, the purpose of which may be tax avoidance and the tax treatment of which may not be supported by the Internal Revenue Code and related regulations.
To the extent deemed appropriate, the Audit and Finance Committee may delegate pre-approval authority to the Chairman of the Audit and Finance Committee or any one or more other members of the Audit and Finance Committee provided that any member of the Audit and Finance Committee who has exercised any such delegation must report any such pre-approval decision to the Audit and Finance Committee at its next scheduled meeting. The Audit and Finance Committee will not delegate to management the pre-approval of services to be performed by the independent auditor.
Our Audit and Finance Committee requires that our independent auditor, in conjunction with our Chief Executive Officer and Chief Financial Officer, be responsible for seeking pre-approval for providing services to us and that any request for pre-approval must inform the Audit and Finance Committee about each service to be provided and must provide detail as to the particular service to be provided. Our Audit and Finance Committee Chair and Audit and Finance Committee financial expert is William Nance.
AUDIT COMMITTEE
William J. Nance
Robert A. Reseigh
March 6, 2017
F-47
Item 15.
Exhibits and Financial Statement Schedules.
|
(a)
|
The following documents are filed as part of this Report:
|
|
(1)
|
Financial statements filed as part of this Report:
|
(2) Exhibits filed as part of this Report:
- Schedule II – Valuation and qualifying accounts
YEARS ENDED December 31, 2016, 2015 AND 2014
|
Note Description
|
Balance at
Beginning of Year |
Additions
|
Deductions
|
Balance at End
of Year
|
|||||||||||
|
Year ended December 31, 2016
|
|
|
|
|
|
|
|
||||||||
|
Tax valuation allowance
|
$
|
63,324,806
|
|
$
|
4,402,479
|
|
$
|
—
|
|
$
|
67,727,285
|
|
|||
|
Year ended December 31, 2015
|
|
|
|
|
|
|
|
|
|||||||
|
Tax valuation allowance
|
$
|
59,792,087
|
|
$
|
3,532,719
|
|
$
|
—
|
|
$
|
63,324,806
|
|
|||
|
Year ended December 31, 2014
|
|
|
|
|
|
|
|
|
|||||||
|
Tax valuation allowance
|
$
|
56,712,325
|
|
$
|
3,079,762
|
|
$
|
—
|
|
$
|
59,792,087
|
|
|||
F-48
|
Exhibit
Number
|
Exhibit
|
|
|
|
|
|
|
3.1
|
Articles of Incorporation
|
|
|
|
|
|
|
3.2
|
Amended and Restated Bylaws (previously filed with Securities and Exchange Commission on June 8, 2011 as exhibit 3.2 to the Company’s Current Report on Form 8-K (file number 001-35200/film number 11901161) and incorporated herein by reference)
|
|
|
10.1
|
Comstock Mining Inc. 2011 Equity Incentive Plan (previously filed with the Securities and Exchange Commission on June 29, 2011 as exhibit 10.1 to the Company’s Current Report on Form 8-K (file number 11939736) and incorporated herein by reference)
|
|
|
|
|
|
|
10.3
|
Form of Restricted Stock Agreement (previously filed with the Securities and Exchange Commission on December 23, 2011 as exhibit 10.1 to the Company’s Current Report on Form 8-K (file number 111280520) and incorporated herein by reference)
|
|
|
|
|
|
|
10.5
|
Employment Agreement, dated as of April 21, 2010, between the Company and Corrado De Gasperis (previously filed with the Securities and Exchange Commission on April 26, 2010 as exhibit 10.1 to the Company’s Form 8-K (file number 10769447) and incorporated herein by reference)
|
|
|
10.6
|
Limited Liability Company Operating Agreement of Northern Comstock LLC, dated as of October 19, 2010 (previously filed with the Securities and Exchange Commission on October 21, 2010 as exhibit 10.5 to the Company’s Form 8-K (file number 101134166) and incorporated herein by reference)
|
|
|
|
|
|
|
10.7
|
First Amendment to the Limited Liability Company Operating Agreement of Northern Comstock LLC, dated August 27, 2015 (previously filed with the Securities and Exchange Commission on August 27, 2015 as exhibit 10.1 to the Company's Form 8-K (file number 151077115) and incorporated herein by reference)
|
|
|
10.8
|
Second Amendment to the Limited Liability Company Operating Agreement of Northern Comstock LLC, dated September 28, 2015 (previously filed with the Securities and Exchange Commission on October 23, 2015 as exhibit 10.1 to the Company's Form 10-Q (file number 151173376) and incorporated herein by reference)
|
|
|
10.15
|
Amendment to Employment Agreement dated November 2, 2012 (previously filed with the Securities and Exchange Commission as exhibit 10.14 to the Company’s Annual Report on Form 10-K for the year ended December 31, 2013 (file number 14707727) and incorporated by reference herein)
|
|
|
10.16
|
Amendment to No. 2 To Employment Agreement dated January 31, 2014 (previously filed with the Securities and Exchange Commission as exhibit 10.14 to the Company’s Annual Report on Form 10-K for the year ended December 31, 2013 (file number 14707727) and incorporated by reference herein)
|
|
|
10.23
|
Master Lease Agreement, dated as of May 12, 2015, between Varilease Finance, Inc. and Comstock Mining Inc. (previously filed with the Securities and Exchange Commission on July 21, 2015 as exhibit 10.1 to the Company's Form 10-Q (file number 15996705) and incorporated herein by reference)
|
|
|
10.24
|
Restructuring Agreement, dated as of July 29, 2015, by and among Northern Comstock LLC, Comstock Mining Inc., DWC Resources Inc., The InterGroup Corporation, Santa Fe Financial Corporation, Portsmouth Square, Inc., and John V. Winfield (previously filed with the Securities and Exchange Commission on July 29, 2015 as exhibit 10.1 to the Company's Form 8-K (file number 151011053) and incorporated herein by reference)
|
|
|
10.25
|
Stockholders Agreement, dated as of July 29, 2015, by and among Comstock Mining Inc., Northern Comstock LLC, DWC Resources Inc., The InterGroup Corporation, Santa Fe Financial Corporation, Portsmouth Square, Inc., and John V. Winfield (previously filed with the Securities and Exchange Commission on July 29, 2015 as exhibit 10.2 to the Company's Form 8-K (file number 151011053) and incorporated herein by reference)
|
|
F-49
|
10.26
|
Drilling and Development Services for Common Stock Investment Agreement dated March 28, 2016 (previously filed with the Securities and Exchange Commission on filed on March 30, 2016 as exhibit 10.1 to the Company's Form 8-K (file number 001-35200/film number 161536682) and incorporated by reference herein)
|
|
|
10.27
|
Sales Agreement, dated as of June 28, 2016, between the Company and International Assets Advisory (previously filed with the Securities and Exchange Commission on August 4, 2016 as exhibit 10.1 to the Company's Form 10-Q (file number 001-35200/film number 161805513) and incorporated herein by reference)
|
|
|
10.28
|
Forbearance Agreement, dated as of June 27, 2016, between the Company and Caterpillar Financial Services Corporation (previously filed with the Securities and Exchange Commission on August 4, 2016 as exhibit 10.2 to the Company's Form 10-Q (file number 001-35200/film number 161805513) and incorporated herein by reference)
|
|
|
10.29
|
Loan Agreement, dated as of July 25, 2016, between Comstock Industrial LLC and GF Comstock 1 LP (previously filed with the Securities and Exchange Commission on July 26, 2016 as exhibit 10.1 to the Company’s Form 8-K (file number 001-35200/film number 161782997) and incorporated herein by reference)
|
|
|
10.30
|
Promissory Note, dated as of July 25, 2016, between Comstock Industrial LLC and GF Comstock 1 LP (previously filed with the Securities and Exchange Commission on July 26, 2016 as exhibit 10.2 to the Company’s Form 8-K (file number 001-35200/film number 161782997) and incorporated herein by reference)
|
|
|
10.31
|
Guaranty, dated as of July 25, 2016, among Comstock Mining Inc., Comstock Mining LLC, Comstock Real Estate Inc. and GF Comstock 1 LP (previously filed with the Securities and Exchange Commission on July 26, 2016 as exhibit 10.3 to the Company's Form 8-K (file number 001-35200/film number 161782997) and incorporated herein by reference)
|
|
|
10.32
|
Debenture, dated as of January 13, 2017, between Comstock Mining Inc. and GF Comstock 2 LP (previously filed with the Securities and Exchange Commission on January 17, 2017 as exhibit 10.1 to the Company's Form 8-K (file number 001-35200/film number 17531561) and incorporated herein by reference)
|
|
|
10.33
|
Pledge and Security Agreement, dated as of January 13, 2017, between Comstock Mining Inc. and GF Comstock 2 LP (previously filed with the Securities and Exchange Commission on January 17, 2017 as exhibit 10.3 to the Company's Form 8-K (file number 001-35200/film number 17531561) and incorporated herein by reference)
|
|
|
10.34
|
Form of Deed of Trust (previously filed with the Securities and Exchange Commission on January 17, 2017 as exhibit 10.5 to the Company's Form 8-K (file number 001-35200/film number 17531561) and incorporated herein by reference)
|
|
|
21*
|
|
Subsidiaries
|
|
|
|
|
|
23*
|
|
Consent of Deloitte & Touche LLP
|
|
|
|
|
|
24*
|
|
Powers of Attorney (included on signature page)
|
|
|
|
|
|
31.1*
|
|
Certification of Principal Executive Officer pursuant to Rule 13a-14(a) and Rule 15d-14(a), promulgated under the Securities Exchange Act of 1934, as amended.
|
|
|
|
|
|
31.2*
|
|
Certification of Principal Financial Officer pursuant to Rule 13a-14(a) and Rule 15d-14(a), promulgated under the Securities Exchange Act of 1934, as amended.
|
|
32.1*
|
|
Certification pursuant to 18 U.S.C. Section 1350, as adopted pursuant to Section 906 of the Sarbanes-Oxley Act of 2002
|
|
|
|
|
F-50
|
32.2*
|
|
Certification pursuant to 18 U.S.C. Section 1350, as adopted pursuant to Section 906 of the Sarbanes-Oxley Act of 2002
|
|
95*
|
|
Mine Safety Disclosures
|
|
|
|
|
|
101*
|
|
Interactive Data File (Annual Report on Form 10-K, for the year ended December 31, 2013, furnished in XBRL (eXtensible Business Reporting Language)).
Attached as Exhibit 101 to this report are the following documents formatted in XBRL: (i) the Consolidated Statements of Income for the fiscal years ended December 31, 2015, 2014 and 2013, (ii) the Consolidated Statements of Comprehensive Income for the fiscal years ended December 31, 2015, 2014 and 2013, (iii) the Consolidated Balance Sheets at December 31, 2015 and 2014, (iv) the Consolidated Statements of Changes in Equity for the fiscal years ended December 31, 2015, 2014 and 2013, (v) the Consolidated Statements of Cash Flows for the fiscal years ended December 31, 2015, 2014 and 2013 and (vi) the Notes to Consolidated Financial Statements |
* Filed herewith.
F-51
SIGNATURES
Pursuant to the requirements of Section 13 or 15(d) of the Securities Exchange Act of 1934, the registrant has duly caused this report to be signed on its behalf by the undersigned, thereunto duly authorized.
|
|
COMSTOCK MINING INC.
|
|
|
|
(Registrant)
|
|
|
|
|
|
|
|
By:
|
/s/ Corrado De Gasperis
|
|
|
|
Name: Corrado De Gasperis
|
|
|
|
Title: Executive Chairman, Chief Executive Officer and President (Principal Executive Officer)
|
POWER OF ATTORNEY
KNOW ALL MEN BY THESE PRESENTS, that each individual whose signature appears below hereby constitutes and appoints Corrado De Gasperis as his or her true and lawful agent, proxy and attorney-in-fact, with full power of substitution and resubstitution, for him and in his name, place and stead, in any and all capacities, to (i) act on, sign and file with the Securities and Exchange Commission any and all amendments to this Report together with all schedules and exhibits thereto, (ii) act on, sign and file with the Securities and Exchange Commission any and all exhibits to this Report and any and all exhibits and schedules thereto, (iii) act on, sign and file any and all such certificates, notices, communications, reports, instruments, agreements and other documents as may be necessary or appropriate in connection therewith and (iv) take any and all such actions which may be necessary or appropriate in connection therewith, granting unto such agent, proxy and attorney-in-fact, full power and authority to do and perform each and every act and thing necessary or appropriate to be done, as fully for all intents and purposes as he might or could do in person, and hereby approving, ratifying and confirming all that such agent, proxy and attorney-in-fact, or any of his or their substitute or substitutes may lawfully do or cause to be done by virtue hereof.
Pursuant to the requirements of the Securities Exchange Act of 1934, this report has been signed below by the following persons on behalf of the registrant and in the capacities and on the dates indicated.
|
Signature
|
|
Title
|
|
Date
|
|
|
|
|
|
|
|
/s/ CORRADO DE GASPERIS
|
|
Executive Chairman, Chief Executive Officer and President (principal executive officer)
|
|
March 9, 2017
|
|
Corrado De Gasperis
|
|
|
|
|
|
/s/ DANIEL KAPPES
|
|
Director
|
|
March 9, 2017
|
|
Daniel Kappes
|
|
|
|
|
|
/s/ WILLIAM NANCE
|
|
Director
|
|
March 9, 2017
|
|
William Nance
|
|
|
|
|
|
/s/ ROBERT A. RESEIGH
|
|
Director
|
|
March 9, 2017
|
|
Robert A. Reseigh
|
|
|
|
|
|
/s/ JUDD MERRILL
|
Chief Financial Officer (principal financial officer and principal accounting officer)
|
March 9, 2017
|
||
|
Judd Merrill
|
|
|
|
|
F-52
Exhibit Index
|
Exhibit
Number
|
|
Exhibit
|
|
|
|
|
|
3.1*
|
|
Articles of Incorporation
|
|
3.2
|
|
Amended and Restated Bylaws (previously filed with Securities and Exchange Commission on June 8, 2011 as exhibit 3.2 to the Company’s Current Report on Form 8-K (file number 001-35200/film number 11901161) and incorporated herein by reference)
|
|
|
|
|
|
10.1
|
|
Comstock Mining Inc. 2011 Equity Incentive Plan (previously filed with the Securities and Exchange Commission on June 29, 2011 as exhibit 10.1 to the Company’s Current Report on Form 8-K (file number 001-35200/film number 11939736) and incorporated herein by reference)
|
|
|
|
|
|
10.3
|
|
Form of Restricted Stock Agreement (previously filed with the Securities and Exchange Commission on December 23, 2011 as exhibit 10.1 to the Company’s Current Report on Form 8-K (file number 001-35200/film number 111280520) and incorporated herein by reference)
|
|
|
|
|
|
10.5
|
|
Employment Agreement, dated as of April 21, 2010, between the Company and Corrado De Gasperis (previously filed with the Securities and Exchange Commission on April 26, 2010 as exhibit 10.1 to the Company’s Form 8-K (file number 000-32429/film number 10769447) and incorporated herein by reference)
|
|
|
|
|
|
10.6
|
|
Limited Liability Company Operating Agreement of Northern Comstock LLC, dated as of October 19, 2010 (previously filed with the Securities and Exchange Commission on October 21, 2010 as exhibit 10.5 to the Company’s Form 8-K (file number 000-32429/film number 101134166) and incorporated herein by reference)
|
|
10.7
|
First Amendment to the Limited Liability Company Operating Agreement of Northern Comstock LLC, dated August 27, 2015 (previously filed with the Securities and Exchange Commission on August 27, 2015 as exhibit 10.1 to the Company's Form 8-K (file number 001-35200/film number 151077115) and incorporated herein by reference)
|
|
|
10.8
|
Second Amendment to the Limited Liability Company Operating Agreement of Northern Comstock LLC, dated September 28, 2015 (previously filed with the Securities and Exchange Commission on October 23, 2015 as exhibit 10.1 to the Company's Form 10-Q (file number 001-35200/film number 151173376) and incorporated herein by reference)
|
|
|
|
|
|
|
10.15
|
|
Amendment to Employment Agreement dated November 2, 2012 (previously filed with the Securities and Exchange Commission as exhibit 10.14 to the Company’s Annual Report on Form 10-K for the year ended December 31, 2014 (file number 001-35200/film number 15556703) and incorporated by reference herein)
|
|
10.16
|
|
Amendment to No. 2 to Employment Agreement dated January 31, 2014 (previously filed with the Securities and Exchange Commission as exhibit 10.14 to the Company’s Annual Report on Form 10-K for the year ended December 31, 2014 (file number 001-35200/film number 15556703) and incorporated by reference herein)
|
|
|
|
|
|
10.23
|
Master Lease Agreement, dated as of May 12, 2015, between Varilease Finance, Inc. and Comstock Mining Inc. (previously filed with the Securities and Exchange Commission on July 21, 2015 as exhibit 10.1 to the Company's Form 10-Q (file number 001-35200/film number 15996705) and incorporated herein by reference)
|
|
|
10.24
|
Restructuring Agreement, dated as of July 29, 2015, by and among Northern Comstock LLC, Comstock Mining Inc., DWC Resources Inc., The InterGroup Corporation, Santa Fe Financial Corporation, Portsmouth Square, Inc., and John V. Winfield (previously filed with the Securities and Exchange Commission on July 29, 2015 as exhibit 10.1 to the Company's Form 8-K (file number 001-35200/film number 151011053) and incorporated herein by reference)
|
|
F-53
|
10.25
|
Stockholders Agreement, dated as of July 29, 2015, by and among Comstock Mining Inc., Northern Comstock LLC, DWC Resources Inc., The InterGroup Corporation, Santa Fe Financial Corporation, Portsmouth Square, Inc., and John V. Winfield (previously filed with the Securities and Exchange Commission on July 29, 2015 as exhibit 10.2 to the Company's Form 8-K (file number 001-35200/film number 151011053) and incorporated herein by reference)
|
|
|
10.26
|
Drilling and Development Services for Common Stock Investment Agreement dated March 28, 2016 (previously filed with the Securities and Exchange Commission on filed on March 30, 2016 as exhibit 10.1 to the Company's Form 8-K (file number 001-35200/film number 161536682) and incorporated by reference herein)
|
|
|
10.27
|
Sales Agreement, dated as of June 28, 2016, between the Company and International Assets Advisory (previously filed with the Securities and Exchange Commission on August 4, 2016 as exhibit 10.1 to the Company's Form 10-Q (file number 001-35200/film number 161805513) and incorporated herein by reference)
|
|
|
10.28
|
Forbearance Agreement, dated as of June 27, 2016, between the Company and Caterpillar Financial Services Corporation (previously filed with the Securities and Exchange Commission on August 4, 2016 as exhibit 10.2 to the Company's Form 10-Q (file number 001-35200/film number 161805513) and incorporated herein by reference)
|
|
|
10.29
|
Loan Agreement, dated as of July 25, 2016, between Comstock Industrial LLC and GF Comstock 1 LP (previously filed with the Securities and Exchange Commission on July 26, 2016 as exhibit 10.1 to the Company’s Form 8-K (file number 001-35200/film number 161782997) and incorporated herein by reference)
|
|
|
10.30
|
Promissory Note, dated as of July 25, 2016, between Comstock Industrial LLC and GF Comstock 1 LP (previously filed with the Securities and Exchange Commission on July 26, 2016 as exhibit 10.2 to the Company’s Form 8-K (file number 001-35200/film number 161782997) and incorporated herein by reference)
|
|
|
10.31
|
Guaranty, dated as of July 25, 2016, among Comstock Mining Inc., Comstock Mining LLC, Comstock Real Estate Inc. and GF Comstock 1 LP (previously filed with the Securities and Exchange Commission on July 26, 2016 as exhibit 10.3 to the Company's Form 8-K (file number 001-35200/film number 161782997) and incorporated herein by reference)
|
|
|
10.32
|
Debenture, dated as of January 13, 2017, between Comstock Mining Inc. and GF Comstock 2 LP (previously filed with the Securities and Exchange Commission on January 17, 2017 as exhibit 10.1 to the Company's Form 8-K (file number 001-35200/film number 17531561) and incorporated herein by reference)
|
|
|
10.33
|
Pledge and Security Agreement, dated as of January 13, 2017, between Comstock Mining Inc. and GF Comstock 2 LP (previously filed with the Securities and Exchange Commission on January 17, 2017 as exhibit 10.3 to the Company's Form 8-K (file number 001-35200/film number 17531561) and incorporated herein by reference)
|
|
|
10.34
|
Form of Deed of Trust (previously filed with the Securities and Exchange Commission on January 17, 2017 as exhibit 10.5 to the Company's Form 8-K (file number 001-35200/film number 17531561) and incorporated herein by reference)
|
|
|
21*
|
|
Subsidiaries
|
|
|
|
|
|
23*
|
|
Consent of Deloitte & Touche LLP
|
|
|
|
|
|
24*
|
|
Powers of Attorney (included on signature page)
|
|
|
|
|
|
31.1*
|
|
Certification of Principal Executive Officer pursuant to Rule 13a-14(a) and Rule 15d-14(a), promulgated under the Securities Exchange Act of 1934, as amended.
|
|
31.2*
|
Certification of Principal Financial Officer pursuant to Rule 130-14(a) and Rule 15d-14(a), promulgated under the Securities Exchange Act of 1934, as amended.
|
|
F-54
|
32.1*
|
|
Certification pursuant to 18 U.S.C. Section 1350, as adopted pursuant to Section 906 of the Sarbanes-Oxley Act of 2002
|
|
32.2*
|
|
Certification pursuant to 18 U.S.C. Section 1350, as adopted pursuant to Section 906 of the Sarbanes-Oxley Act of 2002
|
|
|
|
|
|
95*
|
|
Mine Safety Disclosures
|
|
|
|
|
|
101*
|
|
Interactive Data File (Annual Report on Form 10-K, for the year ended December 31, 2013, furnished in XBRL (eXtensible Business Reporting Language)).
Attached as Exhibit 101 to this report are the following documents formatted in XBRL: (i) the Consolidated Statements of Income for the fiscal years ended December 31, 2016, 2015 and 2014, (ii) the Consolidated Statements of Comprehensive Income for the fiscal years ended December 31, 2016, 2015 and 2014, (iii) the Consolidated Balance Sheets at December 31, 2016 and 2015, (iv) the Consolidated Statements of Changes in Equity for the fiscal years ended December 31, 2016, 2015 and 2014, (v) the Consolidated Statements of Cash Flows for the fiscal years ended December 31, 2016, 2015 and 2014 and (vi) the Notes to Consolidated Financial Statements
|
* Filed herewith.
F-55
TABLE OF CONTENTS
Part IItem 1. BusinessItem 1A. Risk FactorsItem 2. PropertiesItem 3. Legal ProceedingsItem 4. Mine Safety DisclosuresPart IIItem 5. Market For Registrant S Common Equity, Related Stockholder Matters and Issuer Purchases Of Equity SecuritiesItem 11. Executive CompensationItem 6. Selected Financial DataItem 7. Management S Discussion and Analysis Of Financial Condition and Results Of OperationsItem 7A. Quantitative and Qualitative Disclosures About Market RiskItem 8. Financial Statements and Supplementary DataItem 9. Changes and Disagreements with Accountants on Accounting and Financial DisclosureItem 9A. Controls and ProceduresItem 9B. Other InformationPart IIIItem 10. Directors, Executive Officers and Corporate GovernanceItem 12. Security Ownership Of Certain Beneficial Owners and Management and Related Stockholder MattersItem 13. Certain Relationships and Related Transactions, and Director IndependenceItem 14. Principal Accountants Fees and ServicesPart IVItem 15. Exhibits and Financial Statement Schedules