COMSTOCK MINING INC.
10-Ks and 10-Qs
|
|
|
|
|
|
|
|
|
|
|
|
|
|
|
|
|
|
|
|
|
|
|
|
|
|
|
|
|
|
|
|
|
|
|
|
|
|
|
|
|
|
|
|
|
|
|
|
|
|
|
|
|
|
|
|
|
|
|
|
|
|
UNITED STATES
SECURITIES AND EXCHANGE COMMISSION
WASHINGTON, D.C. 20549
FORM 10-Q
(Mark One)
|
x
|
QUARTERLY REPORT PURSUANT TO SECTION 13 OR 15(d) OF THE SECURITIES EXCHANGE ACT OF 1934
|
|
For the Quarterly Period Ended
June 30, 2016
or
|
¨
|
TRANSITION REPORT PURSUANT TO SECTION 13 OR 15(d) OF THE SECURITIES EXCHANGE ACT OF 1934
|
|
For the transition period from ______________ to ______________
Commission File No. 001-35200
COMSTOCK MINING INC.
(Exact name of registrant as specified in its charter)
|
NEVADA
(State or other jurisdiction of
incorporation or organization)
|
1040
(Primary Standard Industrial
Classification Code Number)
|
65-0955118
(I.R.S. Employer
Identification No.)
|
||
P.O. Box 1118
Virginia City, NV 89440
(Address of principal executive offices)
(775) 847-5272
(Registrant’s telephone number, including area code)
Indicate by check mark whether the registrant (1) has filed all reports required to be filed by Section 13 or 15(d) of the Securities Exchange Act of 1934 during the preceding 12 months (or for such shorter period that the registrant was required to file such reports), and (2) has been subject to such filing requirements for the past 90 days. Yes
x
No
¨
Indicate by check mark whether the registrant has submitted electronically and posted on its corporate Web site, if any, every Interactive Data File required to be submitted and posted pursuant to Rule 405 of Regulation S-T (§232.405 of this chapter) during the preceding 12 months (or for such shorter period that the registrant was required to submit and post such files). Yes
x
No
¨
Indicate by check mark whether the registrant is a large accelerated filer, an accelerated filer, a non-accelerated filer or a smaller reporting company. See definition of “accelerated filer and large accelerated filer” in Rule 12b-2 of the Exchange Act. (Check one):
Large accelerated filer
¨
Accelerated filer
¨
Non-accelerated filer
¨
Smaller reporting company
x
Indicate by check mark whether the registrant is a shell company (as defined in Rule 12b-2 of the Act). Yes
o
No
x
The number of shares of Common Stock, $0.000666 par value, of the registrant outstanding at
August 2, 2016
was
183,293,252
.
TABLE OF CONTENTS
Cautionary Notice Regarding Forward-Looking Statements
Certain statements contained in this report on Form 10-Q are forward-looking statements within the meaning of Section 27A of the Securities Act of 1933, as amended, and Section 21E of the Securities Exchange Act of 1934, as amended, which are intended to be covered by the safe harbors created thereby. All statements, other than statements of historical facts, are forward-looking statements. The words “believe,” “expect,” “anticipate,” “estimate,” “project,” “plan,” “should,” “intend,” “may,” “will,” “would,” “potential” and similar expressions identify forward-looking statements, but are not the exclusive means of doing so. Forward-looking statements include statements about matters such as: future prices and sales of, and demand for, our products; future industry and market conditions; future changes in our exploration activities, production capacity and operations; future delays or disruptions in construction or production; future exploration, production, operating and overhead costs; future employment and contributions of personnel; and management; tax and interest rates; capital expenditures; nature and timing of restructuring charges and the impact thereof; productivity, business processes, rationalization and other, operational initiatives; investments, acquisition, consulting, operational, tax, financial and capital projects and initiatives; contingencies; environmental compliance and changes in the regulatory environment; and future working capital, costs, revenues, business opportunities, debt levels, cash flows, margins, earnings and growth.
These statements are based on assumptions and assessments made by our management in light of their experience and their perception of historical and current trends, current conditions, possible future developments and other factors they believe to be appropriate. Forward-looking statements are not guarantees, representations or warranties and are subject to risks and uncertainties that could cause actual results, developments and business decisions to differ materially from those contemplated by such forward-looking statements. Some of those risks and uncertainties include the risk factors set forth in this report and our Annual Report on Form 10-K for the fiscal year ended December 31, 2015,
and the following: current global economic and capital market uncertainties; the speculative nature of gold or mineral exploration, including risks of diminishing quantities or grades of qualified resources and reserves; operational or technical difficulties in connection with exploration or mining activities; contests over our title to properties; potential dilution to our stockholders from the conversion of securities that are convertible into or exercisable for shares of our common stock; potential inability to continue to comply with government regulations; adoption of or changes in legislation or regulations adversely affecting our businesses; permitting rejections, constraints or delays; business opportunities that may be presented to, or pursued by, us; changes in the United States or other monetary or fiscal policies or regulations; interruptions in our production capabilities; unexpected equipment failures; fluctuation of prices for gold or certain other commodities (such as silver, zinc, cyanide, water, diesel fuel and electricity); changes in generally accepted accounting principles; geopolitical events; potential inability to implement our business strategies; potential inability to grow revenues organically; potential inability to attract and retain key personnel; interruptions in delivery of critical supplies, equipment and raw materials; assertion of claims, lawsuits and proceedings against us; potential inability to maintain an effective system of internal controls over financial reporting; potential inability or failure to timely file periodic reports with the SEC; potential inability to maintain the listing of our securities on any securities exchange or market; and work stoppages or other labor difficulties. Occurrence of such events or circumstances could have a material effect on our business, financial condition, results of operations or cash flows or the market price of our securities. All subsequent written and oral forward-looking statements by or attributable to us or persons acting on our behalf are expressly qualified in their entirety by these factors. We undertake no obligation to publicly update or revise any forward-looking statement.
2
COMSTOCK MINING INC. AND SUBSIDIARIES
(UNAUDITED)
|
June 30,
2016 |
December 31,
2015 |
||||||
|
ASSETS
|
|||||||
|
CURRENT ASSETS:
|
|||||||
|
Cash and cash equivalents
|
$
|
823,724
|
|
$
|
1,663,170
|
|
|
|
Accounts receivable
|
—
|
|
24,642
|
|
|||
|
Inventories (Note 2)
|
151,379
|
|
450,951
|
|
|||
|
Stockpiles and mineralized material on leach pads (Note 2)
|
343,543
|
|
1,322,211
|
|
|||
|
Assets held for sale, Net (Note 4)
|
4,297,926
|
|
—
|
|
|||
|
Prepaid expenses and other current assets (Note 3)
|
4,646,875
|
|
2,188,053
|
|
|||
|
Total current assets
|
10,263,447
|
|
5,649,027
|
|
|||
|
MINERAL RIGHTS AND PROPERTIES, Net
|
7,205,081
|
|
7,205,081
|
|
|||
|
PROPERTIES, PLANT AND EQUIPMENT, Net (Note 4)
|
17,039,473
|
|
26,596,859
|
|
|||
|
RECLAMATION BOND DEPOSIT
|
2,622,544
|
|
2,642,804
|
|
|||
|
RETIREMENT OBLIGATION ASSET (Note 5)
|
692,123
|
|
1,107,120
|
|
|||
|
OTHER ASSETS
|
12,000
|
|
12,000
|
|
|||
|
TOTAL ASSETS
|
$
|
37,834,668
|
|
$
|
43,212,891
|
|
|
|
LIABILITIES AND STOCKHOLDERS’ EQUITY
|
|||||||
|
CURRENT LIABILITIES:
|
|||||||
|
Accounts payable
|
$
|
932,441
|
|
$
|
1,964,371
|
|
|
|
Accrued expenses (Note 6)
|
1,254,005
|
|
1,639,526
|
|
|||
|
Long-term debt and capital lease obligations – current portion (Note 7)
|
6,498,515
|
|
8,538,336
|
|
|||
|
Total current liabilities
|
8,684,961
|
|
12,142,233
|
|
|||
|
LONG-TERM LIABILITIES:
|
|||||||
|
Long-term debt and capital lease obligations (Note 7)
|
2,069,920
|
|
4,759,213
|
|
|||
|
Long-term reclamation liability (Note 5)
|
6,920,458
|
|
6,827,568
|
|
|||
|
Other liabilities
|
693,359
|
|
724,407
|
|
|||
|
Total long-term liabilities
|
9,683,737
|
|
12,311,188
|
|
|||
|
Total liabilities
|
18,368,698
|
|
24,453,421
|
|
|||
|
COMMITMENTS AND CONTINGENCIES (Note 11)
|
|
|
|
|
|||
|
STOCKHOLDERS’ EQUITY:
|
|||||||
|
Common stock, $.000666 par value, 3,950,000,000 shares authorized,
182,125,752
and
159,917,711
shares issued and outstanding at
June 30, 2016
and
December 31, 2015
, respectively
|
121,296
|
|
106,505
|
|
|||
|
Additional paid-in capital
|
225,314,388
|
|
217,716,500
|
|
|||
|
Accumulated deficit
|
(205,969,714
|
)
|
(199,063,535
|
)
|
|||
|
Total stockholders’ equity
|
19,465,970
|
|
18,759,470
|
|
|||
|
TOTAL LIABILITIES AND STOCKHOLDERS’ EQUITY
|
$
|
37,834,668
|
|
$
|
43,212,891
|
|
|
See accompanying notes to condensed consolidated financial statements.
3
COMSTOCK MINING INC. AND SUBSIDIARIES
(UNAUDITED)
|
Three Months Ended
June 30, |
|||||||
|
2016
|
2015
|
||||||
|
REVENUES
|
|||||||
|
Revenue - mining
|
$
|
1,457,991
|
|
$
|
5,442,027
|
|
|
|
Revenue - real estate
|
33,285
|
|
46,264
|
|
|||
|
Total revenues
|
1,491,276
|
|
5,488,291
|
|
|||
|
COST AND EXPENSES
|
|||||||
|
Costs applicable to mining revenue
|
1,262,316
|
|
3,219,831
|
|
|||
|
Real estate operating costs
|
92,324
|
|
61,267
|
|
|||
|
Exploration and mine development
|
810,916
|
|
530,660
|
|
|||
|
Mine claims and costs
|
273,877
|
|
293,163
|
|
|||
|
Environmental and reclamation
|
357,238
|
|
388,790
|
|
|||
|
Land and road development
|
20,904
|
|
862,246
|
|
|||
|
General and administrative
|
942,028
|
|
1,311,329
|
|
|||
|
Total cost and expenses
|
3,759,603
|
|
6,667,286
|
|
|||
|
LOSS FROM OPERATIONS
|
(2,268,327
|
)
|
(1,178,995
|
)
|
|||
|
OTHER INCOME (EXPENSE)
|
|||||||
|
Interest expense
|
(216,358
|
)
|
(330,451
|
)
|
|||
|
Other income (expense), net
|
(370,099
|
)
|
—
|
|
|||
|
Total other income (expense), net
|
(586,457
|
)
|
(330,451
|
)
|
|||
|
NET INCOME (LOSS) BEFORE INCOME TAXES
|
(2,854,784
|
)
|
(1,509,446
|
)
|
|||
|
INCOME TAXES
|
—
|
|
—
|
|
|||
|
NET INCOME (LOSS)
|
(2,854,784
|
)
|
(1,509,446
|
)
|
|||
|
DIVIDENDS ON CONVERTIBLE PREFERRED STOCK
|
—
|
|
(965,164
|
)
|
|||
|
NET INCOME (LOSS) AVAILABLE TO COMMON SHAREHOLDERS
|
$
|
(2,854,784
|
)
|
$
|
(2,474,610
|
)
|
|
|
Net income (loss) per common share – basic
|
$
|
(0.02
|
)
|
$
|
(0.03
|
)
|
|
|
Net income (loss) per common share – diluted
|
$
|
(0.02
|
)
|
$
|
(0.03
|
)
|
|
|
Weighted average common shares outstanding — basic
|
176,737,416
|
|
82,540,600
|
|
|||
|
Weighted average common shares outstanding — diluted
|
176,737,416
|
|
82,540,600
|
|
|||
See accompanying notes to condensed consolidated financial statements.
4
COMSTOCK MINING INC. AND SUBSIDIARIES
CONDENSED CONSOLIDATED STATEMENTS OF OPERATIONS
(UNAUDITED)
|
Six Months Ended
June 30, |
|||||||
|
2016
|
2015
|
||||||
|
REVENUES
|
|||||||
|
Revenue - mining
|
$
|
3,438,755
|
|
$
|
11,369,201
|
|
|
|
Revenue - real estate
|
73,042
|
|
156,507
|
|
|||
|
Total revenues
|
3,511,797
|
|
11,525,708
|
|
|||
|
COST AND EXPENSES
|
|||||||
|
Costs applicable to mining revenue
|
2,678,237
|
|
6,937,743
|
|
|||
|
Real estate operating costs
|
144,753
|
|
261,294
|
|
|||
|
Exploration and mine development
|
3,438,508
|
|
1,133,854
|
|
|||
|
Mine claims and costs
|
570,310
|
|
714,227
|
|
|||
|
Environmental and reclamation
|
729,934
|
|
1,011,944
|
|
|||
|
Land and road development
|
20,904
|
|
862,246
|
|
|||
|
General and administrative
|
2,027,136
|
|
3,457,234
|
|
|||
|
Total cost and expenses
|
9,609,782
|
|
14,378,542
|
|
|||
|
LOSS FROM OPERATIONS
|
(6,097,985
|
)
|
(2,852,834
|
)
|
|||
|
OTHER INCOME (EXPENSE)
|
|||||||
|
Interest expense
|
(438,095
|
)
|
(554,124
|
)
|
|||
|
Other income (expense), net
|
(370,099
|
)
|
3,186,626
|
|
|||
|
Total other income (expense), net
|
(808,194
|
)
|
2,632,502
|
|
|||
|
NET INCOME (LOSS) BEFORE INCOME TAXES
|
(6,906,179
|
)
|
(220,332
|
)
|
|||
|
INCOME TAXES
|
—
|
|
—
|
|
|||
|
NET INCOME (LOSS)
|
(6,906,179
|
)
|
(220,332
|
)
|
|||
|
DIVIDENDS ON CONVERTIBLE PREFERRED STOCK
|
—
|
|
(1,883,996
|
)
|
|||
|
NET INCOME (LOSS) AVAILABLE TO COMMON SHAREHOLDERS
|
$
|
(6,906,179
|
)
|
$
|
(2,104,328
|
)
|
|
|
Net income (loss) per common share – basic
|
$
|
(0.04
|
)
|
$
|
(0.03
|
)
|
|
|
Net income (loss) per common share – diluted
|
$
|
(0.04
|
)
|
$
|
(0.03
|
)
|
|
|
Weighted average common shares outstanding — basic
|
170,075,960
|
|
82,515,428
|
|
|||
|
Weighted average common shares outstanding — diluted
|
170,075,960
|
|
82,515,428
|
|
|||
See accompanying notes to condensed consolidated financial statements.
5
|
COMSTOCK MINING INC. AND SUBSIDIARIES
(UNAUDITED)
|
|||||||
|
Six Months Ended
June 30, |
|||||||
|
2016
|
2015
|
||||||
|
OPERATING ACTIVITIES:
|
|||||||
|
Net income (loss)
|
$
|
(6,906,179
|
)
|
$
|
(220,332
|
)
|
|
|
Adjustments to reconcile net income (loss) to net cash provided by (used in) operating activities:
|
|||||||
|
Depreciation, amortization and depletion
|
3,355,178
|
|
3,836,092
|
|
|||
|
Stock payments and stock-based compensation
|
336,964
|
|
44,400
|
|
|||
|
Accretion of reclamation liability
|
92,890
|
|
130,653
|
|
|||
|
Gain on sale of properties, plant, and equipment
|
(583,462
|
)
|
77,579
|
|
|||
|
Amortization of debt discounts and issuance costs
|
182,471
|
|
315,735
|
|
|||
|
Payment of interest expense and sales tax with common stock
|
183,900
|
|
—
|
|
|||
|
Loss on payment of debt obligation with common stock
|
150,166
|
|
—
|
|
|||
|
Net change in fair values of derivatives
|
—
|
|
74,271
|
|
|||
|
Changes in operating assets and liabilities:
|
|||||||
|
Accounts receivable
|
24,642
|
|
263,453
|
|
|||
|
Inventories
|
299,572
|
|
83,511
|
|
|||
|
Stockpiles and mineralized material on leach pads
|
978,668
|
|
(105,213
|
)
|
|||
|
Prepaid expenses and other current assets
|
(1,051,816
|
)
|
(690,599
|
)
|
|||
|
Other assets
|
—
|
|
12,941
|
|
|||
|
Accounts payable
|
168,923
|
|
(625,432
|
)
|
|||
|
Accrued expenses and other liabilities
|
(416,569
|
)
|
(2,828,946
|
)
|
|||
|
NET CASH PROVIDED BY (USED IN) OPERATING ACTIVITIES
|
(3,184,652
|
)
|
368,113
|
|
|||
|
INVESTING ACTIVITIES:
|
|||||||
|
Proceeds from sale of properties, plant and equipment
|
1,858,511
|
|
117,065
|
|
|||
|
Purchase of mineral rights and properties, plant and equipment
|
(258,075
|
)
|
(3,750,271
|
)
|
|||
|
Decrease/(increase) in reclamation bond deposit
|
20,260
|
|
(100,000
|
)
|
|||
|
NET CASH PROVIDED BY (USED IN) INVESTING ACTIVITIES
|
1,620,696
|
|
(3,733,206
|
)
|
|||
|
FINANCING ACTIVITIES:
|
|||||||
|
Principal payments on long-term debt and capital lease obligations
|
(3,654,240
|
)
|
(4,579,697
|
)
|
|||
|
Proceeds from long-term debt obligations
|
925,000
|
|
9,419,392
|
|
|||
|
Proceeds from the issuance of common stock
|
4,025,000
|
|
—
|
|
|||
|
Common stock issuance costs
|
(571,250
|
)
|
—
|
|
|||
|
NET CASH PROVIDED BY FINANCING ACTIVITIES
|
724,510
|
|
4,839,695
|
|
|||
|
INCREASE (DECREASE) IN CASH AND CASH EQUIVALENTS
|
(839,446
|
)
|
1,474,602
|
|
|||
|
CASH AND CASH EQUIVALENTS, BEGINNING OF PERIOD
|
1,663,170
|
|
5,308,804
|
|
|||
|
CASH AND CASH EQUIVALENTS, END OF PERIOD
|
$
|
823,724
|
|
$
|
6,783,406
|
|
|
|
SUPPLEMENTAL CASH FLOW INFORMATION:
|
|||||||
|
Cash paid for interest
|
$
|
321,405
|
|
$
|
507,592
|
|
|
|
(Continued)
|
|
||||||
6
|
COMSTOCK MINING INC. AND SUBSIDIARIES
CONDENSED CONSOLIDATED STATEMENTS OF CASH FLOWS
(UNAUDITED)
|
|||||||
|
Six Months Ended
June 30, |
|||||||
|
2016
|
2015
|
||||||
|
Supplemental disclosure of non-cash investing and financing activities:
|
|||||||
|
Additions to reclamation liability and retirement obligation asset
|
$
|
—
|
|
$
|
659,295
|
|
|
|
Issuance of common stock for properties, plant and equipment
|
$
|
—
|
|
$
|
16,049
|
|
|
|
Issuance of common stock for settlement of long-term debt obligations
|
$
|
4,140,029
|
|
$
|
—
|
|
|
|
Dividends paid in common stock (par value)
|
$
|
—
|
|
$
|
1,723
|
|
|
|
Issuance of long-term debt obligations for purchase of mineral rights and properties, plant and equipment
|
$
|
—
|
|
$
|
197,515
|
|
|
|
Vested restricted common stock (par value)
|
$
|
36
|
|
$
|
40
|
|
|
|
Properties, plant and equipment purchases in accounts payable
|
$
|
—
|
|
$
|
42,693
|
|
|
|
Property transferred in satisfaction of accounts payable
|
$
|
1,100,000
|
|
$
|
—
|
|
|
See notes to condensed consolidated financial statements.
7
COMSTOCK MINING INC.
NOTES TO CONDENSED CONSOLIDATED FINANCIAL STATEMENTS
FOR THE PERIOD ENDED
JUNE 30, 2016
(UNAUDITED)
1. Interim Financial Statements
Basis of Presentation
The interim condensed consolidated financial statements of Comstock Mining Inc. ("Comstock", the "Company", "we", "our" or "us") have been prepared in accordance with generally accepted accounting principles for interim financial information and with the instructions to Form 10-Q and Article 10 of Regulation S-X. Accordingly, they do not include all of the information and footnotes required by generally accepted accounting principles for complete financial statements. In our opinion, all adjustments (consisting of normal recurring adjustments) considered necessary for a fair presentation have been included. Operating results for the
three and six
month period ended
June 30, 2016
, are not necessarily indicative of the results that may be expected for the year ending
December 31, 2016
. For further information, refer to the financial statements and footnotes thereto included in our Annual Report on Form 10-K for the fiscal year ended
December 31, 2015
.
During the
three and six
months ended
June 30, 2016
, the Company shipped
1,255
and
2,957
ounces of gold, respectively, resulting in recognized revenue of approximately
$1.5 million
and
$3.4 million
, respectively. During the
three and six
months ended
June 30, 2016
, the Company shipped
22,131
and
51,569
ounces of silver, respectively, for approximately
$0.4 million
and
$0.7 million
, respectively. Silver is accounted for as a by-product credit in costs applicable to mining revenue for financial reporting purposes.
Liquidity and Management Plans
The accompanying unaudited condensed consolidated financial statements have been prepared assuming that the Company will continue as a going concern, which considers the realization of assets and discharge of liabilities in the normal course of business and does not include any adjustments that might result from the outcome of uncertainties noted below.
The Company has recurring net losses from operations and an accumulated deficit of
$206.0 million
at
June 30, 2016
. For the
six
-month period ended
June 30, 2016
, the Company recognized a net loss of
$6.9 million
and used cash in operations of
$3.2 million
. As of
June 30, 2016
, the Company had cash and cash equivalents of
$0.8 million
, current assets of
$10.3 million
and current liabilities of
$8.7 million
, resulting in current assets in excess of current liabilities of approximately
$1.6 million
. On March 31, 2016, the Company completed an underwritten public offering of
10,000,000
shares of its common stock. Gross proceeds to the Company from this offering were approximately
$3.5 million
before deducting underwriting commissions and other offering expenses paid by the Company. On April 13, 2016, the Company also completed the sale of an additional
1,500,000
shares of the Company's common stock for additional gross proceeds of approximately
$525,000
.
The Company’s current capital resources include cash and cash equivalents and other working capital resources, cash generated through operations, assets held for sale and existing financing arrangements including a lease financing agreement and the previously drawn revolving credit facility (the “Revolving Credit Facility”) with Auramet International, LLC (“Auramet”). The Revolving Credit Facility was fully paid on April 1, 2016, from part of the proceeds from the sale of the Company’s common stock on March 31, 2016. Under the Revolving Credit Facility, the Company may have borrowings of up to
$10 million
outstanding at any given time, subject to satisfying certain conditions and obtaining certain consents. The Revolving Credit Facility has a maturity of April 28, 2018, and allows for re-advances on the facility up to the
$10 million
availability. The Company has financed its exploration, development and start up activities principally from the sale of equity securities and, to a lesser extent, debt financing. While the Company has been successful in the past in obtaining the necessary capital to support its operations, including registered equity financings from its existing shelf registration, borrowings or other means, there is no assurance that the Company will be able to obtain additional equity capital or other financing, if needed.
Effective June 28, 2016, the Company entered into a sales agreement with respect to an at-the-market offering program ("ATM Agreement") pursuant to which the Company may offer and sell, from time to time at its sole discretion, shares of its common stock, having an aggregate offering price of up to
$5.0
million. The Company pays the sales agent a commission of
2.5%
of the gross proceeds from the sale of such shares. The Company is not obligated to make any sales of shares under the ATM Agreement, and if it elects to make any sales, the Company can set a minimum sales price for the shares. As of June 30, 2016,
no
shares had been sold pursuant to the ATM Agreement.
8
The Company believes that it will have sufficient funds to sustain its operations during the next 12 months as a result of the sources of funding described above.
Future production rates and gold prices below management’s expectations would adversely affect the Company’s results of operations, financial condition and cash flows. If the Company was unable to obtain any necessary additional funds, this could have an immediate material effect on liquidity
and could raise substantial doubt about the Company’s ability to continue as a going concern. In such case, the Company could be required to limit or discontinue certain business plans, activities or operations, reduce or delay certain capital expenditures or sell certain assets or businesses. There can be no assurance that the Company would be able to take any of such actions on favorable terms, in a timely manner or at all.
Use of Estimates
In preparing financial statements in conformity with generally accepted accounting principles, we are required to make estimates and assumptions that affect the reported amounts of assets and liabilities and the disclosure of contingent assets and liabilities at the date of the financial statements and revenues and expenditures during the reported periods. Actual results could differ materially from those estimates. Estimates may include those pertaining to valuation of inventories, stockpiles and mineralized material on leach pads, the estimated useful lives and valuation of plant and equipment, mineral rights, deferred tax assets, derivative assets and liabilities, reclamation liabilities, stock-based compensation and payments, and contingent liabilities.
Comprehensive Income
The only component of comprehensive loss for the
three and six
months ended
June 30, 2016
and
2015
, was net loss.
Income Taxes
We recognize deferred tax assets and liabilities based on differences between the consolidated financial statement carrying amounts and tax bases of certain recorded assets and liabilities and for tax loss carryforwards. Realization of deferred tax assets is dependent upon our ability to generate sufficient future taxable earnings. Where it is more likely than not that the deferred tax asset will not be realized, we have provided a full valuation allowance. The Company has provided a full valuation allowance at
June 30, 2016
and
December 31, 2015
, for its net deferred tax assets as it cannot conclude it is more likely than not that they will be realized.
Recently Issued Accounting Pronouncements
In March 2016, the Financial Accounting Standards Board (FASB) issued Accounting Standards Update (ASU) 2016-09, Compensation - Stock Compensation (Topic 718). This standard is intended to simplify the accounting for several aspects of the accounting for equity-based compensation, including the income tax consequences, classification of awards as either equity or liabilities, and classification on the statement of cash flows. ASU 2016-09 is effective for interim and annual reporting periods beginning after December 15, 2016 and early adoption is permitted. The Company is currently evaluating the effect that adopting this new accounting guidance will have on its consolidated results of operations and financial position.
In February 2016, the FASB issued ASU 2016-02, Leases (Topic 842), to increase transparency and comparability among organizations by recognizing lease assets and lease liabilities on the balance sheet and disclosing key information about leasing arrangements. Topic 842 affects any entity that enters into a lease, with some specified scope exceptions. For public business entities, the amendments in this update are effective for financial statements issued for annual periods beginning after December 15, 2018, and interim periods within those annual periods. Early application is permitted for all entities. The Company is currently evaluating the impact of adopting this standard on its consolidated financial statements, which will require right of use assets and lease liabilities be recorded in the consolidated balance sheet for operating leases.
9
In May 2014, the FASB issued ASU 2014-09, which introduces a new five-step revenue recognition model in which an entity should recognize revenue to depict the transfer of promised goods or services to customers in an amount that reflects the consideration to which the entity expects to be entitled in exchange for those goods or services. This ASU also requires disclosures sufficient to enable users to understand the nature, amount, timing, and uncertainty of revenue and cash flows arising from contracts with customers, including qualitative and quantitative disclosures about contracts with customers, significant judgments and changes in judgments, and assets recognized from the costs to obtain or fulfill a contract. This standard was originally effective for fiscal years beginning after December 15, 2016. In August 2015, the FASB issued ASU 2015-14, Revenue from Contracts with Customers, which defers the effective date of ASU 2014-09 for all entities by one year to annual reporting periods beginning after December 15, 2017, including interim reporting periods within that reporting period. Earlier application is permitted only as of annual reporting periods beginning after December 15, 2016, including interim reporting periods within that reporting period. In April 2016, the FASB issued ASU 2016-10, Revenue from Contracts with Customers - Identifying Performance Obligations and Licensing, which is an amendment that clarifies the following two aspects of the new five-step revenue recognition model: identifying performance obligations and the licensing implementation guidance. The effective date and transition requirements for the amendments in this update are the same as ASU 2015-014. The Company is currently evaluating the new guidance to determine the impact it will have on its consolidated financial statements.
Reclassifications
Certain reclassifications have been made to the prior period consolidated financial statements to conform to the current period presentation. The Company reclassified its asset retirement obligation expenses from Mining Claims Cost to Environmental and Reclamation line item in the consolidated statements of operations. As a result of this change, Mining Claims Cost line item was reduced by
$364,092
and
$707,134
for the
three and six
months ended June 30, 2015, respectively, and Environmental and Reclamation increased by such amounts.
2. Inventories, Stockpiles and Mineralized Material on Leach Pads
Inventories, stockpiles and mineralized materials on leach pads consisted of the following:
|
June 30, 2016
|
December 31, 2015
|
||||||
|
In-process
|
$
|
151,379
|
|
$
|
249,130
|
|
|
|
Finished goods
|
—
|
|
201,821
|
|
|||
|
Total inventories
|
$
|
151,379
|
|
$
|
450,951
|
|
|
|
Mineralized material on leach pads
|
$
|
343,543
|
|
$
|
1,322,211
|
|
|
|
Total stockpiles and mineralized material on leach pads
|
$
|
343,543
|
|
$
|
1,322,211
|
|
|
|
Total
|
$
|
494,922
|
|
$
|
1,773,162
|
|
|
3. Prepaid Expenses and Other Current Assets
Prepaid expenses and other current assets consisted of the following:
|
|
June 30, 2016
|
December 31, 2015
|
|||||
|
Land and property deposits
|
$
|
1,387,855
|
|
$
|
1,169,285
|
|
|
|
Lease obligation deposits
|
1,759,764
|
|
231,000
|
|
|||
|
Other
|
1,499,256
|
|
787,768
|
|
|||
|
Total prepaid expenses and other current assets
|
$
|
4,646,875
|
|
$
|
2,188,053
|
|
|
10
4. Properties, Plant and Equipment
The Company sold land and equipment with a book value of approximately
$2.4 million
during the
six
months ended
June 30, 2016
, and recorded a gain on the sale of that land and equipment totaling
$0.6 million
. As of June 30, 2016,
$0.7 million
of the proceeds associated with sale had not yet been collected and is recognized as prepaid expenses and other current assets on the balance sheet.
During the three and
six
months ended
June 30, 2016
, the Company recognized depreciation expense of
$1.5 million
and
$2.9 million
, respectively. Depreciation expense for the three and six-month periods ended June 30, 2015, was
$1.6 million
and
$3.2 million
, respectively.
Assets Held For Sale
During the second quarter of 2016, the Company committed to a plan to sell certain mining equipment and land and buildings. As of
June 30, 2016
, the Company had assets with a net book value of
$4.3 million
that met the criteria to be held for sale. Those criteria specify that the asset must be available for immediate sale in its present condition (subject only to terms that are usual and customary for sales of such assets) and the sale of the asset must be probable, and its transfer expected to qualify for recognition as a completed sale, within one year, with certain exceptions.
5. Long-Term Reclamation Liability and Retirement Obligation Asset
Following is a reconciliation of the aggregate reclamation liability associated with our reclamation plan for our mining projects:
|
June 30, 2016
|
December 31, 2015
|
||||||
|
Long-term reclamation liability — beginning of period
|
$
|
6,827,568
|
|
$
|
5,908,700
|
|
|
|
Additional obligations incurred
|
—
|
|
659,295
|
|
|||
|
Accretion of reclamation liability
|
92,890
|
|
259,573
|
|
|||
|
Long-term reclamation liability — end of period
|
$
|
6,920,458
|
|
$
|
6,827,568
|
|
|
Following is a reconciliation of the aggregate retirement obligation asset associated with our reclamation plan for our mining projects:
|
June 30, 2016
|
December 31, 2015
|
||||||
|
Retirement obligation asset — beginning of period
|
$
|
1,107,120
|
|
$
|
1,619,101
|
|
|
|
Additional obligations incurred
|
—
|
|
659,295
|
|
|||
|
Amortization of retirement obligation asset
|
(414,997
|
)
|
(1,171,276
|
)
|
|||
|
Retirement obligation asset — end of period
|
$
|
692,123
|
|
$
|
1,107,120
|
|
|
6. Accrued Expenses
Accrued expenses consisted of the following:
|
|
June 30, 2016
|
December 31, 2015
|
|||||
|
Accrued Board of Directors fees
|
$
|
349,000
|
|
$
|
251,000
|
|
|
|
Accrued production royalties
|
149,035
|
|
120,332
|
|
|||
|
Accrued payroll
|
137,607
|
|
174,640
|
|
|||
|
Accrued vendor liabilities
|
97,389
|
|
633,282
|
|
|||
|
Accrued personal property tax
|
—
|
|
115,907
|
|
|||
|
Other accrued expenses
|
520,974
|
|
344,365
|
|
|||
|
Total accrued expenses
|
$
|
1,254,005
|
|
$
|
1,639,526
|
|
|
11
Long-term debt and capital lease obligations consisted of the following:
|
Note Description
|
June 30, 2016
|
December 31, 2015
|
|||||
|
Note Payable - Caterpillar Equipment Consolidated
1)
|
$
|
3,677,254
|
|
$
|
—
|
|
|
|
Note Payable - Caterpillar Equipment
1)
|
—
|
|
2,679,723
|
|
|||
|
Capital Lease Obligation - Caterpillar Equipment
1)
|
—
|
|
1,652,934
|
|
|||
|
Lease Obligation - Varilease
|
2,674,972
|
|
3,556,479
|
|
|||
|
Note Payable - V&T
|
494,968
|
|
750,000
|
|
|||
|
Note Payable - Donovan Property
|
357,845
|
|
414,389
|
|
|||
|
Note Payable - White House
|
278,318
|
|
281,139
|
|
|||
|
Note Payable - Daney Ranch Property
|
275,849
|
|
1,139,834
|
|
|||
|
Note Payable - Gold Hill Hotel
|
249,306
|
|
259,173
|
|
|||
|
Note Payable - Dayton Property "Golden Goose"
|
175,741
|
|
489,212
|
|
|||
|
Note Payable - Railroad & Gold Property
|
95,154
|
|
110,725
|
|
|||
|
Capital Lease Obligation - Kimball
|
60,582
|
|
104,522
|
|
|||
|
Notes Payable - Other
|
228,446
|
|
259,419
|
|
|||
|
Note Payable - Auramet Facility
|
—
|
|
1,600,000
|
|
|||
|
Subtotal
|
8,568,435
|
|
13,297,549
|
|
|||
|
Less current portion
|
(6,498,515
|
)
|
(8,538,336
|
)
|
|||
|
Long-term portion of long-term debt and capital lease obligations
|
$
|
2,069,920
|
|
$
|
4,759,213
|
|
|
1)
Caterpillar Equipment Note and Caterpillar Equipment Capital Lease balances on December 31, 2015 were consolidated into Caterpillar Equipment Consolidated Note on June 27, 2016. For details see discussion below.
Long-Term Debt Obligations
Caterpillar Equipment Facility and Capital Lease
On June 27, 2016, the Company completed an agreement with Caterpillar Financial Services Corporation relating to certain finance and lease agreements (the "CAT Agreement"). The Company entered into the CAT Agreement which required the Company to complete the sale of certain financed and leased equipment and modified the payment schedule under the related finance and lease arrangements. Under the terms of the CAT Agreement, the Company will pay down its obligations with the net proceeds from the financed and leased equipment required to be sold during the second half of 2016, with any remaining balance to be paid off primarily from a monthly payment schedule of $25,000 per month until the amounts have been paid in full. The net book value of equipment required to be sold under the amended agreement is $1.8 million at June 30, 2016 and is included in assets held for sale, net in the accompanying condensed consolidated balance sheets. The note bears an interest rate of 5.7%. The outstanding obligations in the agreement are approximately $3.67 million. During June 2016, the Company sold equipment for net proceeds of approximately $0.7 million.
12
Auramet Facility
On March 6, 2015, the Company entered into an amended and restated
$5 million
revolving credit facility (the “Revolving Credit Facility”) with Auramet, pursuant to which the Company may borrow up to
$5 million
, subject to satisfying certain conditions and obtaining certain consents. On March 6, 2015, the Company drew
$5 million
(the “Note”), representing cash proceeds of approximately
$4.4 million
, net of prepaid interest and fees of approximately
$0.6 million
. On December 28, 2015, the Company and Auramet agreed to increase the facility up to
$10 million
and extended the facility from the current maturity of February 6, 2017 to April 28, 2018. The indebtedness under the Revolving Credit Facility is secured by a security interest in certain real estate owned by the Company within the Company’s starter mine and a first priority security interest in all personal property of the Company and its wholly-owned subsidiary Comstock Mining, LLC, subject to any existing or future Permitted Liens (as defined under the Revolving Credit Facility). The proceeds from the Note were primarily used for an accelerated construction schedule for rerouting State Route 342, located in the Company’s Lucerne Resource Area, the first phase of which was completed in early June 2015, and the second phase was completed in November 2015. The Note contains a covenant that requires the Company to maintain a minimum liquidity balance of
$1 million
(including cash and cash equivalents, plus
90%
of the value of any doré that has been picked up by a secured carrier but not yet paid for, as of any date of determination). The Note additionally contains customary representations, warranties, affirmative covenants, negative covenants, and events of default, as well as conditions to borrowings.
The note was fully repaid on April 1, 2016, from proceeds from the sale of the Company’s common stock on March 31, 2016.
Daney Ranch Property
On August 31, 2015, the Company entered into a note in the amount of
$1.8 million
for the purchase of land and buildings. The note does not bear interest. Upon entering into the note, the Company issued
1,538,462
shares of common stock to the noteholder as partial payment on the note. In January 2016, the note maturity date was extended for
nine
months to November 2016 and an additional
3,000,000
shares of common stock was issued to the noteholder in satisfaction of the outstanding principal balance. To the extent proceeds received by the noteholder from the sale of the shares received are less than the outstanding principal balance, the Company would make a final payment for the difference.
Dayton Property "Golden Goose"
During 2016, the Company amended the Golden Goose note, extended the maturity to January 2017, and issued
1,000,000
shares of common stock in partial satisfaction of the outstanding principal balance. To the extent proceeds received by the noteholder from the sale of the shares received are less than the outstanding principal balance, the Company would make a final payment for the difference.
Lease Obligations
Varilease Finance Inc.
On May 12, 2015, the Company
entered into a master lease agreement with Varilease Finance Inc. ("Varilease") in which the Company obtained capital financing under a sale-leaseback transaction in the amount of
$5
million. Due to certain types of continuing involvement, the Company was precluded from applying sale-leaseback accounting and has accounted for the transaction under the financing method. The Company's obligations under the Varilease agreement are secured by an interest in the Company's processing equipment in exchange for
24
monthly payments of
$247,830
totaling the cash proceeds of
$5
million and applicable interest. During the six months ended June 30, 2016, the Company issued
6,617,896
shares of common stock in partial satisfaction of lease payment obligations through the remainder of 2016. To the extent proceeds received by Varilease from the sale of the shares received are less than the lease payments required to be made, the Company would make a final cash payment for the difference. The fair value of the shares which have been issued to Varilease but remain unsold as of June 30, 2016 is
$1.5 million
which is recorded in prepaid expenses and other current assets in the accompanying condensed consolidated balance sheets.
8. Stockholders’ Equity
In March 2016, the Company raised
$3.5 million
in gross proceeds (approximately
$3.0 million
net of issuance cost) through an underwritten public offering of
10 million
shares of common stock at a price per share of
$0.35
under the Company’s Registration Statement on Form S-3.
13
In April 2016, the Company raised an additional
$525,000
in gross proceeds through the sale of an additional
1,500,000
shares of common stock at a price per share of
$0.35
to the underwriter of the Company’s public offering of common stock closed in March 2016. The sale was completed pursuant to the underwriter's exercise of the over-allotment option granted in connection with the public offering.
At-the-Market Offering Program
Effective June 28, 2016, the Company entered into a sales agreement with respect to an at-the-market offering program ("ATM Agreement") pursuant to which the Company may offer and sell, from time to time at its sole discretion, shares of its common stock, having an aggregate offering price of up to
$5.0
million. The Company pays the sales agent a commission of
2.5%
of the gross proceeds from the sale of such shares. The Company is not obligated to make any sales of shares under the ATM Agreement, and if it elects to make any sales, the Company can set a minimum sales price for the shares. As of June 30, 2016,
no
shares had been sold pursuant to the ATM Agreement.
9. Fair Value Measurements
The fair value of a financial instrument is the amount that could be received upon the sale of an asset or paid to transfer a liability in an orderly transaction between market participants at the measurement date. Fair value measurements do not include transaction costs. A fair value hierarchy is used to prioritize the quality and reliability of the information used to determine fair values. Categorization within the fair value hierarchy is based on the lowest level of input that is significant to the fair value measurement. The fair value hierarchy is defined into the following three categories:
Level 1: Quoted market prices in active markets for identical assets or liabilities.
Level 2: Observable market-based inputs or unobservable inputs corroborated by market data.
Level 3: Unobservable inputs that are not corroborated by market data.
The following tables presents our liabilities measured at fair value on a recurring basis:
|
Fair Value Measurements at June 30, 2016
|
|||||||||||||||
|
Total
|
Quoted
Prices
in Active
Markets
(Level 1)
|
Significant
Other
Observable
Inputs
(Level 2)
|
Significant
Unobservable
Inputs
(Level 3)
|
||||||||||||
|
Liabilities:
|
|||||||||||||||
|
Note payable (Daney Ranch Property)
|
$
|
275,850
|
|
$
|
—
|
|
$
|
275,850
|
|
$
|
—
|
|
|||
|
Note payable (Dayton Property "Golden Goose")
|
175,741
|
|
—
|
|
175,741
|
|
—
|
|
|||||||
|
Total Liabilities
|
$
|
451,591
|
|
$
|
—
|
|
$
|
451,591
|
|
$
|
—
|
|
|||
|
Fair Value Measurements at December 31, 2015
|
|||||||||||||||
|
Total
|
Quoted
Prices
in Active
Markets
(Level 1)
|
Significant
Other
Observable
Inputs
(Level 2)
|
Significant
Unobservable
Inputs
(Level 3)
|
||||||||||||
|
Liabilities:
|
|||||||||||||||
|
Note payable (Daney Ranch Property)
|
$
|
1,139,834
|
|
$
|
—
|
|
$
|
1,139,834
|
|
$
|
—
|
|
|||
|
Total Liabilities
|
$
|
1,139,834
|
|
$
|
—
|
|
$
|
1,139,834
|
|
$
|
—
|
|
|||
We had no assets measured at fair value on a non-recurring basis at
June 30, 2016
and
December 31, 2015
. During the
six
months ended
June 30, 2016
and twelve months ended
December 31, 2015
, there were no transfers of assets or liabilities between Level 1, Level 2 or Level 3.
14
Note payable (Daney Ranch Property) -
The note payable is valued as the difference between the
$1.8 million
face amount, reduced by the proceeds to be received by the noteholder from the sale of the
4,538,462
shares of common stock to be sold through October 2016 by the noteholder. The Company has estimated the proceeds to be received upon the sale of the common stock by the noteholder using the Black-Scholes model with various observable inputs. These inputs include contractual terms, stock price, volatility, dividend yield, and risk free interest rates. Because the inputs are all observable market-based inputs, this instrument is classified within Level 2 of the valuation hierarchy.
Note payable (Dayton Property "Golden Goose") -
The note payable is valued as the difference between the
$0.5 million
face amount, reduced by the proceeds to be received by the noteholder from the sale of the
1,000,000
shares of common stock to be sold through December 2016 by the noteholder. The Company has estimated the proceeds to be received upon the sale of the common stock by the noteholder using the Black-Scholes model with various observable inputs. These inputs include contractual terms, stock price, volatility, dividend yield, and risk free interest rates. Because the inputs are all observable market-based inputs, this instrument is classified within Level 2 of the valuation hierarchy.
10. Net Income (Loss) Per Common Share
Basic earnings per share are computed by dividing net loss available to common stockholders by the weighted average number of shares of common stock outstanding during the period. Diluted loss per share reflects the potential dilution that could occur if stock options, warrants and convertible securities were exercised or converted into common stock.
The following is a reconciliation of the numerator and denominator used in the basic and diluted computation of net loss per share:
|
Three Months Ended
June 30, |
Six Months Ended
June 30, |
||||||||||||||
|
2016
|
2015
|
2016
|
2015
|
||||||||||||
|
Numerator:
|
|||||||||||||||
|
Net income (loss)
|
$
|
(2,854,784
|
)
|
$
|
(1,509,446
|
)
|
$
|
(6,906,179
|
)
|
$
|
(220,332
|
)
|
|||
|
Preferred stock dividends
|
—
|
|
(965,164
|
)
|
—
|
|
(1,883,996
|
)
|
|||||||
|
Net income (loss) available to common shareholders
|
$
|
(2,854,784
|
)
|
$
|
(2,474,610
|
)
|
$
|
(6,906,179
|
)
|
$
|
(2,104,328
|
)
|
|||
|
Denominator:
|
|||||||||||||||
|
Basic weighted average shares outstanding
|
176,737,416
|
|
82,540,600
|
|
170,075,960
|
|
82,515,428
|
|
|||||||
|
Effect of dilutive securities
|
—
|
|
—
|
|
—
|
|
—
|
|
|||||||
|
Diluted weighted average shares outstanding
|
176,737,416
|
|
82,540,600
|
|
170,075,960
|
|
82,515,428
|
|
|||||||
|
Net income (loss) per common share:
|
|||||||||||||||
|
Basic
|
$
|
(0.02
|
)
|
$
|
(0.03
|
)
|
$
|
(0.04
|
)
|
$
|
(0.03
|
)
|
|||
|
Diluted
|
$
|
(0.02
|
)
|
$
|
(0.03
|
)
|
$
|
(0.04
|
)
|
$
|
(0.03
|
)
|
|||
The following table includes the number of common stock equivalent shares that are not included in the computation of diluted income and (loss) per share, because the inclusion of such shares would be anti-dilutive or certain performance conditions have not been achieved.
|
|
June 30,
|
||||
|
|
2016
|
2015
|
|||
|
Convertible preferred stock
|
—
|
|
53,608,855
|
|
|
|
Stock options and warrants
|
50,000
|
|
50,000
|
|
|
|
Restricted stock
|
1,444,000
|
|
1,796,600
|
|
|
|
|
1,494,000
|
|
55,455,455
|
|
|
15
11. Commitments and Contingencies
The Company has minimum royalty obligations with certain of its mineral properties and leases. For most of the mineral properties and leases, the Company is subject to a range of royalty obligations once production commences. These royalties range from
0.5%
to
5%
of net smelter revenues (NSR) from minerals produced on the properties, with the majority being under
3%
. Some of the factors that will influence the amount of the royalties include ounces extracted and the price of gold.
On March 28, 2016, the Company entered into a Drilling and Development Services for Common Stock Investment Agreement (the "Stock Investment Agreement") between the Company and American Mining & Tunneling, LLC and American Drilling Corp, LLC (collectively "AMT"), pursuant to which the Company agreed to issue up to
9,000,000
shares of the Company's common stock to AMT, in exchange for
$5,000,000
in future underground mine development, drilling and mining services. When the AMT Shares are issued, they will be restricted shares subject to a
six
-month holding period by AMT, during which time the issued AMT Shares may not be sold. AMT has also agreed not to sell the shares at a per share price of less than
$0.56
. The Stock Investment Agreement contains customary representations, warranties and agreements in connection with the issuance of the AMT Shares, and conditions to closing include the Company's obligation to file with NYSE MKT LLC a supplemental listing application relating to the AMT Shares that has been approved by NYSE MKT LLC. As of June 30, 2016,
no
shares had been issued.
The Company’s mining and exploration activities are subject to various laws and regulations governing the protection of the environment. These laws and regulations are continually changing and are generally becoming more restrictive. The Company believes its operations are in compliance with applicable laws and regulations in all material respects. The Company has made, and expects to make in the future, expenditures to comply with such laws and regulations, but cannot predict the full amount of such future expenditures.
From time to time, we are involved in lawsuits, claims, investigations and proceedings that arise in the ordinary course of business. There are no matters pending that we expect to have a material adverse impact on our business, results of operations, financial condition or cash flows.
12. Segment Reporting
Our management organizes the Company into
two
operating segments: mining and real estate. Our mining segment consists of all activities and expenditures associated with mining. Our real estate segment consists of land, real estate rental properties and the Gold Hill Hotel. We evaluate the performance of our operating segments based on operating income (loss). All intercompany transactions have been eliminated, and intersegment revenues are not significant. Financial information relating to our reportable operating segments and reconciliation to the consolidated totals is as follows:
16
|
Three Months Ended
June 30, |
Six Months Ended
June 30, |
||||||||||||||
|
2016
|
2015
|
2016
|
2015
|
||||||||||||
|
Revenue
|
|||||||||||||||
|
Mining
|
$
|
1,457,991
|
|
$
|
5,442,027
|
|
$
|
3,438,755
|
|
$
|
11,369,201
|
|
|||
|
Real estate
|
33,285
|
|
46,264
|
|
73,042
|
|
156,507
|
|
|||||||
|
Total revenue
|
1,491,276
|
|
5,488,291
|
|
3,511,797
|
|
11,525,708
|
|
|||||||
|
Cost and Expenses
|
|||||||||||||||
|
Mining
|
(3,667,279
|
)
|
(6,606,019
|
)
|
(9,465,029
|
)
|
(14,117,248
|
)
|
|||||||
|
Real estate
|
(92,324
|
)
|
(61,267
|
)
|
(144,753
|
)
|
(261,294
|
)
|
|||||||
|
Total cost and expenses
|
(3,759,603
|
)
|
(6,667,286
|
)
|
(9,609,782
|
)
|
(14,378,542
|
)
|
|||||||
|
Operating Loss
|
|||||||||||||||
|
Mining
|
(2,209,288
|
)
|
(1,163,992
|
)
|
(6,026,274
|
)
|
(2,748,047
|
)
|
|||||||
|
Real estate
|
(59,039
|
)
|
(15,003
|
)
|
(71,711
|
)
|
(104,787
|
)
|
|||||||
|
Total loss from operations
|
(2,268,327
|
)
|
(1,178,995
|
)
|
(6,097,985
|
)
|
(2,852,834
|
)
|
|||||||
|
Other income (expense), net
|
(586,457
|
)
|
(330,451
|
)
|
(808,194
|
)
|
2,632,502
|
|
|||||||
|
Net income (loss)
|
$
|
(2,854,784
|
)
|
$
|
(1,509,446
|
)
|
$
|
(6,906,179
|
)
|
$
|
(220,332
|
)
|
|||
|
Depreciation, Depletion and Amortization
|
|||||||||||||||
|
Mining
|
$
|
1,580,201
|
|
$
|
1,890,467
|
|
$
|
3,240,713
|
|
$
|
3,780,575
|
|
|||
|
Real estate
|
82,345
|
|
32,120
|
|
114,465
|
|
55,517
|
|
|||||||
|
Total depreciation, amortization and depletion
|
$
|
1,662,546
|
|
$
|
1,922,587
|
|
$
|
3,355,178
|
|
$
|
3,836,092
|
|
|||
|
Capital Expenditures
|
|||||||||||||||
|
Mining
|
$
|
156,815
|
|
$
|
143,272
|
|
$
|
334,840
|
|
$
|
3,651,623
|
|
|||
|
Real estate
|
2,261,263
|
|
—
|
|
2,261,263
|
|
14,663
|
|
|||||||
|
Total capital expenditures
|
$
|
2,418,078
|
|
$
|
143,272
|
|
$
|
2,596,103
|
|
$
|
3,666,286
|
|
|||
|
As of June 30,
|
As of December 31,
|
||||||
|
2016
|
2015
|
||||||
|
Assets
|
|||||||
|
Mining
|
$
|
34,996,561
|
|
$
|
41,886,124
|
|
|
|
Real estate
|
2,838,107
|
|
1,326,767
|
|
|||
|
Total assets
|
$
|
37,834,668
|
|
$
|
43,212,891
|
|
|
13. Subsequent Events
On July 25, 2016, the Company purchased
98
acres of land and
257
acre-feet of senior priority water rights in Silver Springs, Nevada for
$3.2
million and entered into a Loan Agreement (the “Loan Agreement”) of
$3.25
million for the purpose of purchasing the real property and water rights. The indebtedness under the Loan Agreement is secured by a deed of trust on the property purchased.
17
The Loan Agreement has a term of
two years
. The indebtedness under the Loan Agreement accrues interest at a rate of
9%
per annum for the first year post-closing,
12.5%
per annum for the six months that follow the first anniversary of the Loan Agreement and
14%
per annum thereafter until such indebtedness is paid in full. Proceeds from the sale of the property securing the loan must be used to repay the indebtedness under the Loan Agreement. In addition to customary remedies for secured indebtedness on real property, the Loan Agreement allows the lender thereunder to convert the principal amount of the indebtedness into common stock of the Company upon a default.
18
The following discussion provides information that we believe is relevant to an assessment and understanding of the consolidated results of operations and financial condition of the Company as of and for the
three and six
-month periods ended
June 30, 2016
, as well as our future results. It should be read in conjunction with the condensed consolidated financial statements and accompanying notes also included in this Form 10-Q and our Annual Report on Form 10-K as of, and for the fiscal year ended,
December 31, 2015
.
Overview
Comstock Mining Inc. is a Nevada-based, gold and silver mining company with extensive, contiguous property in the historic Comstock and Silver City mining districts (collectively, the “Comstock District”). The Comstock District is located within the western portion of the Basin and Range Province of Nevada, between Reno and Carson City. We began acquiring properties and developing projects in the Comstock District in 2003. Since then, we have consolidated a substantial portion of the historic Comstock District, secured permits, built an infrastructure and brought exploration projects into production. We also received the 2015 Nevada Excellence in Mine Reclamation award, voted on unanimously by five participating Federal and State of Nevada agencies.
Because of the Comstock District’s historical significance, the geology is well known and has been extensively studied by us, our advisors and many independent researchers. We have expanded our understanding of the geology of the project area through vigorous surface mapping and drill hole logging. The volume of geologic data is immense, and thus far the reliability has been excellent, particularly in the various Lucerne Mine areas. We have amassed a large library of historic data and detailed surface mapping of Comstock District properties and continue to obtain historic information from private and public sources. We use such data in conjunction with information obtained from our current operations, to target geological prospective exploration areas and plan exploratory drilling programs, including expanded surface and underground drilling.
The Company continues evaluating and acquiring properties inside and outside the district expanding its footprint and exploring all of our existing and prospective opportunities for further exploration, development and mining. The near-term goal of our business plan is to maximize intrinsic stockholder value realized, per share, by continuing to acquire mineralized and potentially mineralized properties, exploring, developing and validating qualified resources and reserves (proven and probable) that enable the commercial development of our operations through extended, long-lived mine plans that are economically feasible and socially responsible, including both the Lucerne and Dayton Mine plans, with both surface and underground development opportunities. We also plan to develop longer-term exploration plans for the remaining areas, which include the Spring Valley, Occidental, Northern Extension and Northern Targets areas, subsequent to and in some cases concurrent with the exploration and development of Lucerne and Dayton. Our plans also include the identification, assessment and acquisition of similarly situated gold and silver mining assets.
We achieved initial production and held our first pour of gold and silver on September 29, 2012. We produced approximately 22,925 gold equivalent ounces in 2014 and 18,455 gold equivalent ounces in 2015. That is, we produced 19,601 ounces of gold and 222,416 ounces of silver in 2014 and 15,451 ounces of gold and 221,723 ounces of silver in 2015. During the first
six
months ended
June 30, 2016
, the Company produced
2,957
ounces of gold and
51,569
ounces of silver, that is, approximately
3,621
gold equivalent ounces. The expected recovery rate for gold increased from an estimated 85% to an estimated
87.5%
in the first quarter of 2016 and remained at this rate during the second quarter of 2016.
The Company’s headquarters, technical resources, mine operations and heap leach processing facility are located in Storey County, Nevada, at 1200 American Flat Road, approximately three miles south of Virginia City, Nevada and 30 miles southeast of Reno, Nevada. The Company now owns or controls approximately
8,542
acres of mining claims and parcels in the Comstock and Silver City Districts. The acreage is comprised of approximately
2,242
acres of patented claims (private lands) and surface parcels (private lands) and approximately
6,301
acres of unpatented mining claims, which the Bureau of Land Management (“BLM”) administers.
Our real estate segment owns significant non-mining properties, including the Gold Hill Hotel, the Daney Ranch and other lands, homes and cottages. The Gold Hill Hotel consists of an operating hotel, restaurant and a bar. In 2015, we entered into an agreement to lease the Gold Hill Hotel to independent operators while retaining ownership. The initial term of the lease agreement was effective on April 1, 2015, and ends in March 2020. The tenant may renew the lease for two extended terms of five years each. Lease payments are due in monthly installments.
19
Current Exploration Projects
District-wide
During the second quarter of 2016, the Company expanded its exploration planning to include longer-term exploration targets across the broader Comstock District where multiple miles of additional mineralized strike zones have been identified and added to the Company’s exploration planning activities. This includes the Company's northeastern properties within the Occidental Group, the Northern properties referred to as the Gold Hill Group and the southern portion of the Dayton Resource Area, extending further south into the Spring Valley Group (refer to Figure 1).
During the first half of 2016, the Company focused on exploration and development in the Lucerne Resource area, primarily in the Quartz Porphyry (PQ) and Succor geological target areas, and to a lesser extent the Dayton Resource Area. Lucerne activity included underground core drilling, underground drift (tunnel) development, and underground sampling. Dayton activity included surface and underground sampling. The Company has also developed specific plans for additional infill, development and exploration in the Dayton Resource area and further exploration activities to define the extent of known mineralization in the Succor, Woodville and Chute target areas within the Lucerne Resource Area.
20
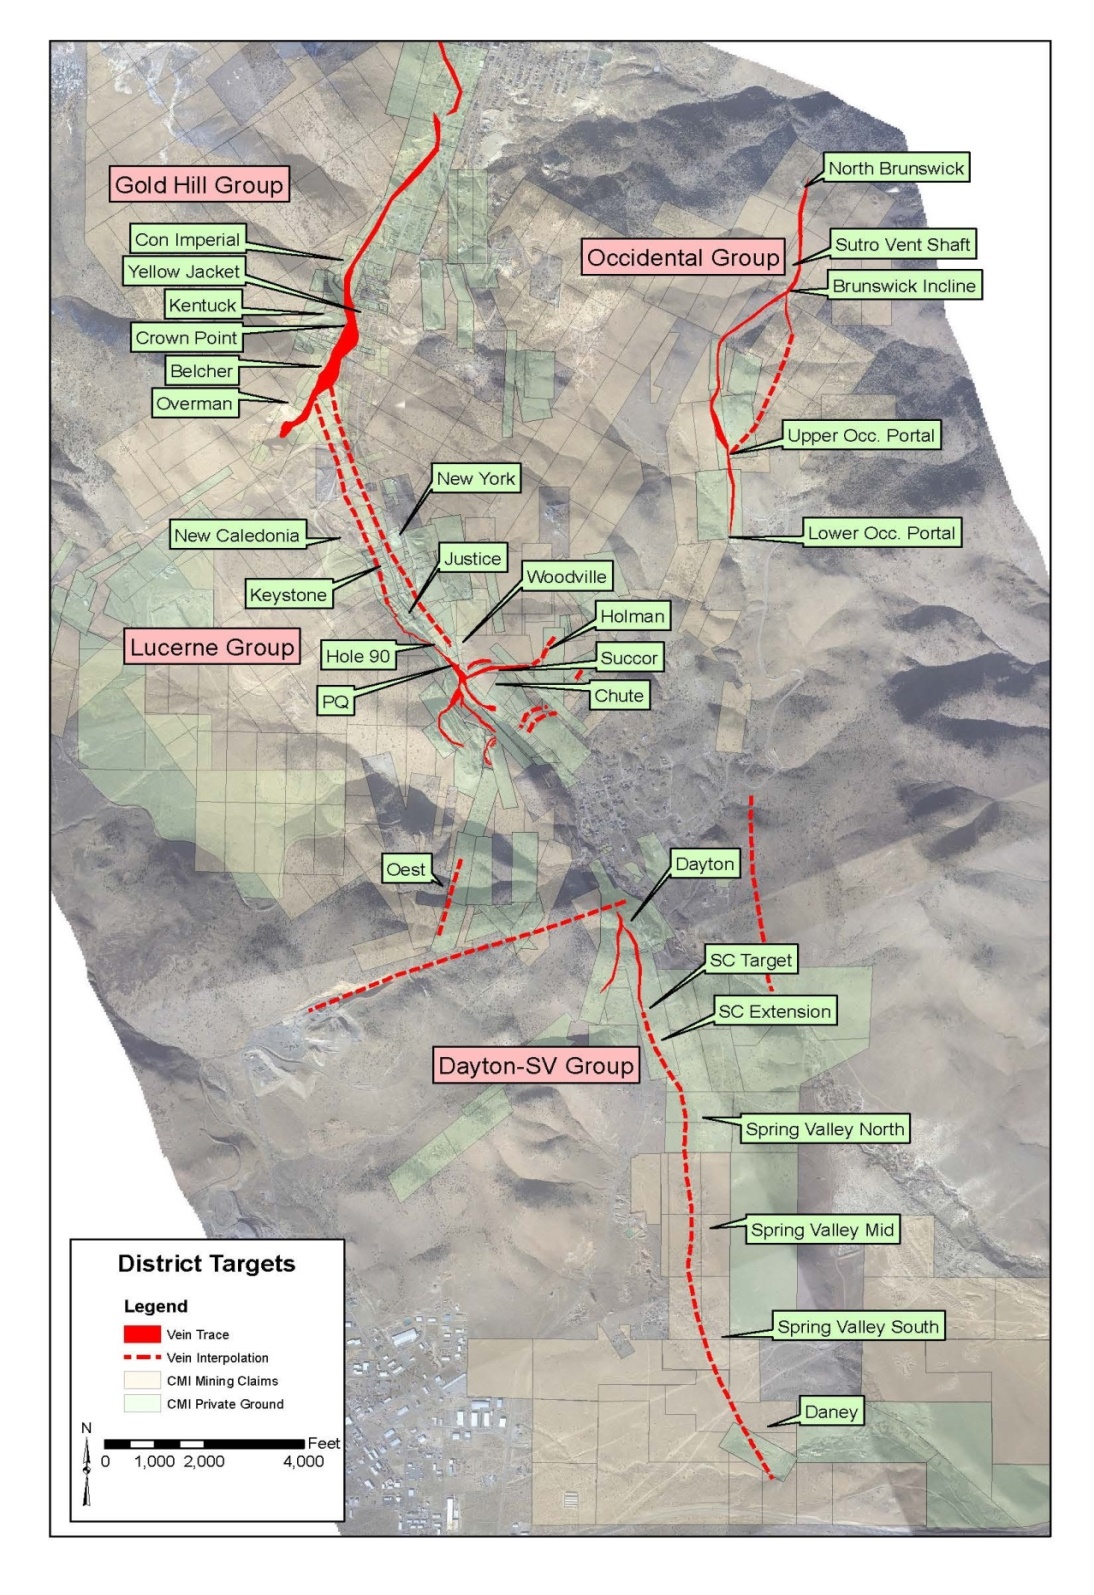
Figure 1 - General overview of priority surface and underground targets.
21
Lucerne Exploration Targets
The Company has designed additional exploration drilling programs within the Lucerne Group. This includes the Succor vein target, the Woodville area and the northern development of the PQ underground. During the first quarter, about 12,380 feet of HQ-3 and NQ core drilling was completed and samples produced from the Harris Drift. The drilling configuration is in the form of ‘fans’ that comprise a group of holes, with each drill bay having two or three fans of drill holes extending into the primary target. The core locations and orientations were specifically designed to infill and expand the areas of known, high-grade mineralization identified from previous surface drilling programs. (Figure 2)

Figure 2 - 3D representation of the Harris Drift showing drill bays, drill fans, and the Succor crosscut.
The Company encountered longer mineralized intercepts (10 to 40 feet thick) from bays 3 through 6 as it moved north of the Silver City/Succor structural intersection and within and bordering the PQ mass. The configuration of the longer and higher grade intercepts occur along the hanging wall contact of the PQ intrusive mass within both the Alta Andesite and PQ host rocks. The intervals show continuity laterally and vertically along the structural contact.
Throughout the PQ drill program, geologic cross sections oriented along the drill fans and level plans on 20 foot spacing were fashioned for the target area. With completion of drilling, core logging and assaying through Drill Bay 6, cross sections and level plans were prepared, reviewed, updated and digitized. The model was further refined as these sections were tied together to form a three-dimensional triangulation using Maptek Vulcan software.
Using the geologic model and assay data as a base, multiple grade shells were produced in the same manner. Starting with cross sections and level plans, the shells were digitized and then refined as they were tied together to form three-dimensional triangulations. These shells form the base of the block model used for internal planning and resource development. (Figure 3)
22
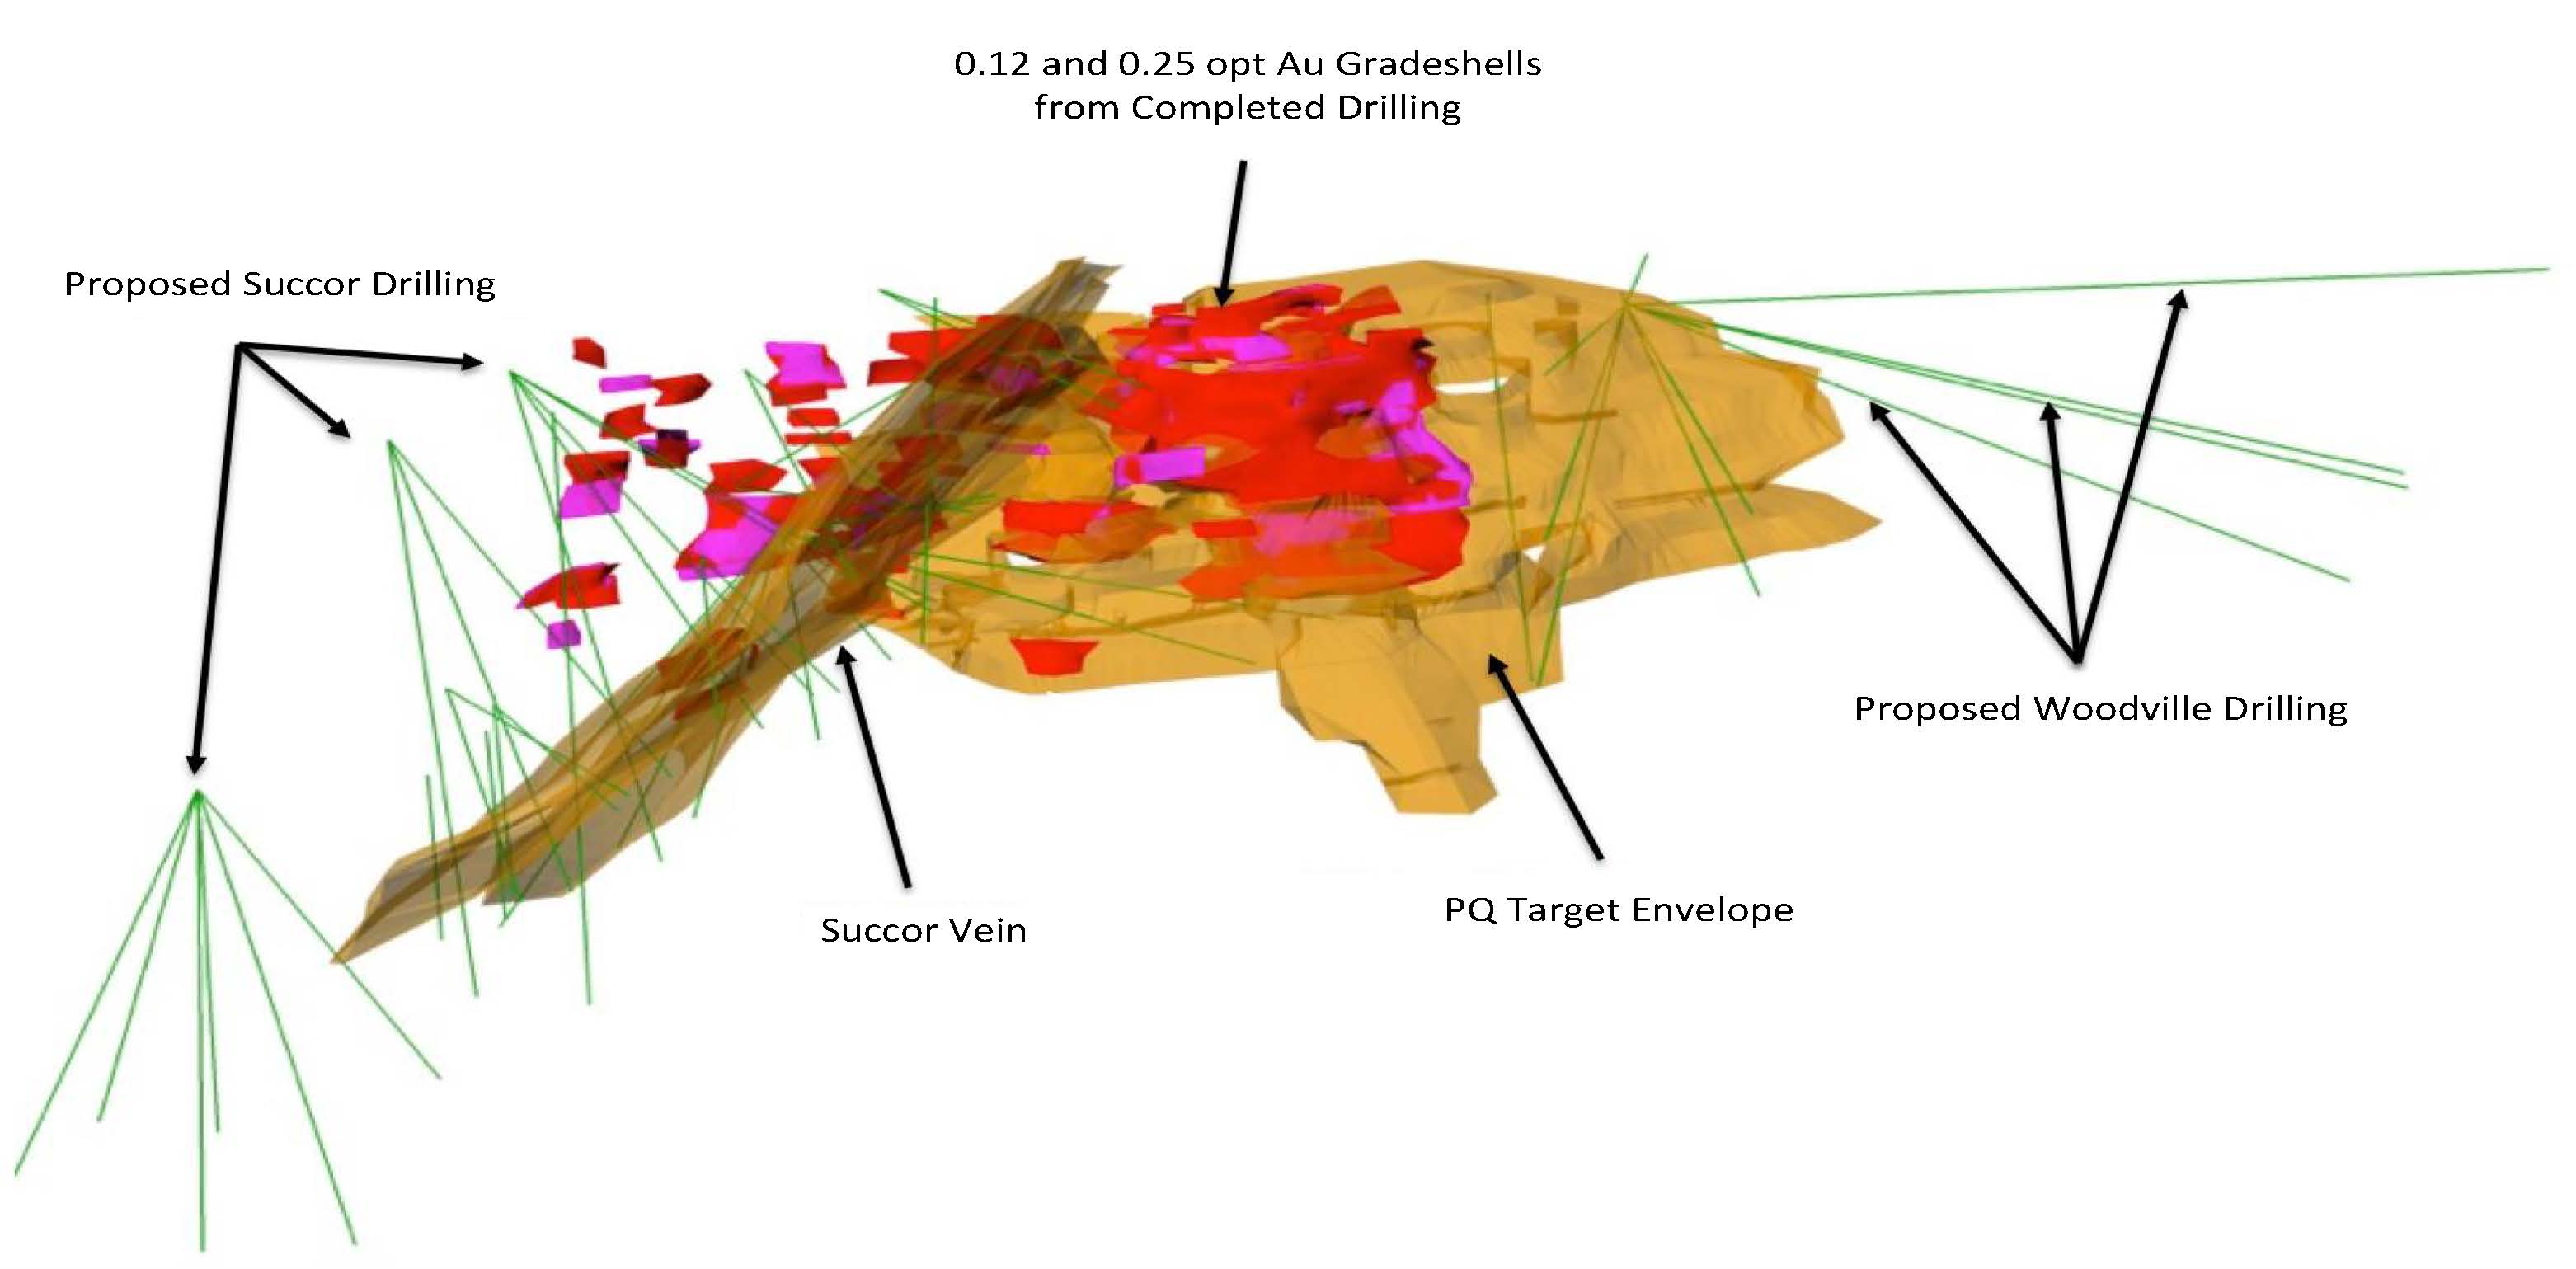
Figure 3 - Current grade shells: colored red for 0.12 opt Au cutoff (averaging 0.31 opt Au) and magenta 0.25 opt Au cutoff (averaging 0.61 opt Au), with PQ, Succor, and Woodville proposed drill programs.
Although the grade intercepts were promising, they did not yet yield sufficient continuity for mining. The Company considers the initial 800 feet of advance within the Harris Drift as a first phase of development toward a longer-term exploration and development objective targeting a three-quarter-mile long mineralized corridor that includes the Lucerne (including the PQ target), Succor, Woodville, and Chute zone systems. (Figure 4) Most of these systems remain open to the north and east and particularly at depth. A second phase of development was completed by advancing a crosscut out of Drill Bay 2 to a total length of 450 feet toward the structural intersection of the Silver City fault zone and Succor vein zone. The design of the crosscut is geared toward favorable underground drilling position. The Succor represents an important target in conjunction with the PQ zone based on its location (perpendicular and adjacent to the PQ), past production history and the results from the Company’s 2011 and 2012 reverse circulation drill programs.
23
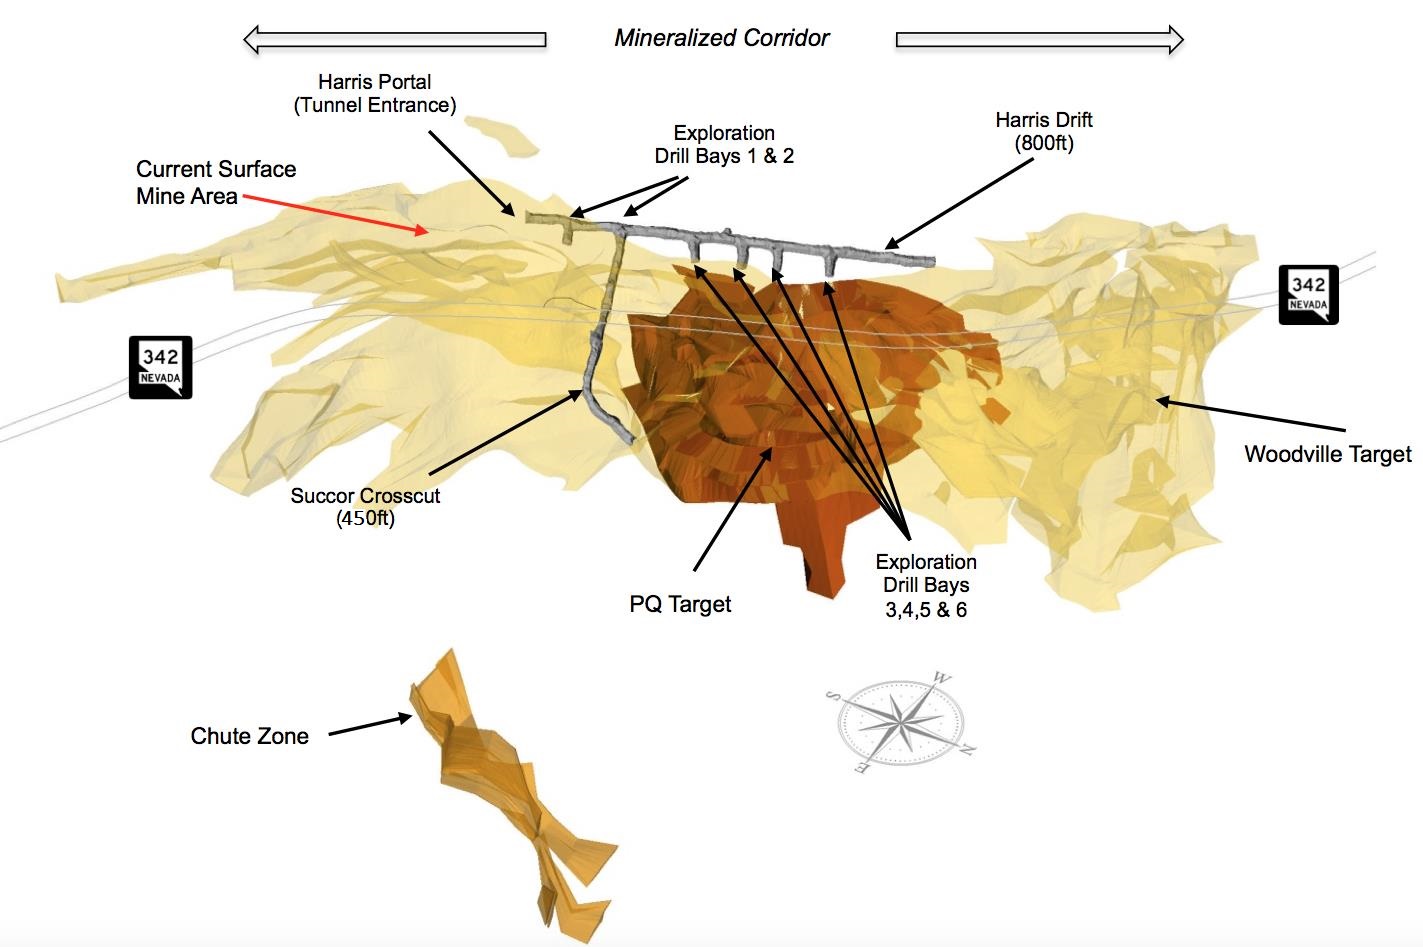
Figure 4 - Underground target areas highlighting the exploration drift and drill bays.
The Succor Vein Target has a strike length of greater than 1000 feet, an average true width of 15 feet and an average dip of 55 degrees. The structure has reported historic mining grades of approximately 0.620 ounces per ton of recovered gold equivalent grade and is open to the east and at depth, along the entire structure. The proposed drill holes shown in Figure 5 are designed to extend the depth of known mineralization identified by surface drilling.
24

Figure 5 - Woodville, PQ, and Succor target areas with proposed Succor target drilling.
Future drill programs are being developed with a phased approach to extend the PQ mineralization and scope the Succor and Woodville targets.
The remaining phases of the road realignment, estimated at approximately $65,000, and Lucerne reclamation activities, including the final waste dump removal, grading and drainage reestablishment are scheduled for completion in the third quarter of 2016.
Dayton Resource Area
The Company plans to conduct definition drilling and geotechnical core programs within the Dayton Resource area. The Dayton southern expansion program includes exploration and definition drilling of targets identified by the conventional percussion drill program, magnetic, IP and resistivity geophysical surveys (Figure 6).
25

Figure 6 - Dayton and Spring Valley Area
26
The geologic and engineering staff also completed underground mapping, sampling, and surveying in a number of historic mine tunnels on and near the Dayton Resource area. Several historic mines operated in the Dayton area, leaving access to multiple structures from underground. Some adits have remained open or have been uncovered by the Company. Where accessible, the workings were and are being inspected and mineralized material sampled. Geologic mapping is also done at this time. Once sampling is completed, the workings are surveyed to model the size and location of the openings as well as locate the samples. The samples are then assayed at the Company’s own metallurgical laboratory for gold and silver.
This underground sampling program has not only provided a wealth of assay information but it has also provided critical information for furthering the geologic understanding of the Dayton. In some cases structures identified on the surface can be traced underground and in other cases structures that do not have obvious surface expression are identified.
Spring Valley
Spring Valley is located south of State Route 341. Limited drilling has identified favorable mineralized zones (see Figure 4 below). The exploration of Spring Valley will include phased drilling programs that will continue southerly from SR341 to the historic Daney mine site (Figure 1), with a total a strike length of approximately 8,000 feet.
Occidental Group
The Occidental vein (a sub parallel vein system to the Comstock) is considered by the Company to be underexplored and is considered a significant exploration target, with historic, high grade production mined near surface in localized pods. The Occidental vein system has a significant strike length of over 7,600 feet on land controlled by the Company. Detailed geologic assessment and mapping is ongoing to best define future drilling and development of this exploration target.
Gold Hill Group
The northern Comstock underground targets of the Gold Hill Group will be prioritized and exploration proposals will follow. Several locations in the Gold Hill Group have been selected to receive additional evaluation.
Production
The Company operates a heap leach based, gold and silver production system, including a zinc-precipitate based Merrill-Crowe processing plant. The Company, under the existing water pollution control permit with the State of Nevada, has the crushing and processing capacity to operate at a rate of up to 4.0 million tons of material crushed and stacked, per annum. The Merrill-Crowe system facilitates that capacity with an operating fluid processing rate of over 1,000 gallons per minute.
During 2014, the Company completed the transition from the Billie the Kid and Hartford patented claims in the Lucerne West-side Mine to the higher-grade Justice and Lucerne patents, also in the Lucerne West-side Mine. During the first and second quarters of 2015, the Company, in preparation for underground development, substantially completed mining of those Lucerne West-side surface patents. Substantially all of the operations for the second half of 2015 were focused on the extraction of the mineralized material contained in historic mine dumps while also completing the realignment of SR-342, establishing a drift into the higher-grade PQ and Woodville targets, and developing those targets towards the establishment of reserves for potential future mining.
The Company substantially completed the extraction and remediation of the historic dump materials during the third quarter of 2015, and stacked the material on the leach pads where the mineralized material continues under solution until the target gold and silver recovery rates have been achieved. The Company stacked over 13,000 tons of mineralized material during May 2016. This additional material, when combined with recent metallurgical yield estimates of approximately 87.5%, increases our estimated recoverable gold ounces remaining on the pad. The Company now expects that the leaching process and resulting gold and silver pours will continue into the
third
quarter of 2016.
27
The following table presents production for the periods ended June 30, 2016 and 2015:
|
2Q 2016
|
1Q 2016
|
YTD 2016
|
2Q 2015
|
1Q 2015
|
YTD 2015
|
|||||||||||||
|
Processing
|
||||||||||||||||||
|
Tons Crushed
|
13,197
|
|
—
|
|
13,197
|
|
211,942
|
|
157,612
|
|
369,554
|
|
||||||
|
Weighted Average Grade Per Ton Au
|
0.025
|
|
—
|
|
0.025
|
|
0.030
|
|
0.039
|
|
0.034
|
|
||||||
|
Weighted Average Grade Per Ton Ag
|
0.436
|
|
—
|
|
0.436
|
|
0.654
|
|
0.734
|
|
0.688
|
|
||||||
|
Estimated Au Ounces Stacked
|
336
|
|
—
|
|
336
|
|
6,438
|
|
6,083
|
|
12,521
|
|
||||||
|
Estimated Ag Ounces Stacked
|
5,758
|
|
—
|
|
5,758
|
|
138,639
|
|
115,689
|
|
254,328
|
|
||||||
|
Estimated Au Equivalent* Ounces Stacked
|
413
|
|
—
|
|
413
|
|
8,344
|
|
7,669
|
|
16,013
|
|
||||||
|
Au Ounces Poured and Sold
|
1,255
|
|
1,702
|
|
2,957
|
|
4,575
|
|
4,695
|
|
9,270
|
|
||||||
|
Ag Ounces Poured and Sold
|
22,131
|
|
29,438
|
|
51,569
|
|
60,112
|
|
56,482
|
|
116,594
|
|
||||||
|
Au Equivalent* Ounces Poured
|
1,548
|
|
2,073
|
|
3,621
|
|
5,400
|
|
5,470
|
|
10,870
|
|
||||||
|
* Au Equivalent ounces = Au ounces (actual) + (Ag ounces (actual) ÷ the ratio of average gold to silver prices)
|
75.09
|
|
79.68
|
|
72.91
|
|
72.37
|
|
72.91
|
|
72.82
|
|
||||||
The following table presents weighted average grades of gold and silver by quarter:
|
Weighted Average per ton Gold
|
Weighted Average per ton Silver
|
|||||
|
Q1, 2014
|
0.024
|
|
0.345
|
|
||
|
Q2, 2014
|
0.034
|
|
0.546
|
|
||
|
Q3, 2014
|
0.026
|
|
0.564
|
|
||
|
Q4, 2014
|
0.039
|
|
0.680
|
|
||
|
2014 YTD
|
0.030
|
|
0.527
|
|
||
|
Q1, 2015
|
0.039
|
|
0.734
|
|
||
|
Q2, 2015
|
0.030
|
|
0.654
|
|
||
|
Q3, 2015
|
0.021
|
|
0.573
|
|
||
|
Q4, 2015
|
0.023
|
|
0.564
|
|
||
|
2015 YTD
|
0.031
|
|
0.659
|
|
||
|
Q1, 2016
|
—
|
|
—
|
|
||
|
Q2, 2016
|
0.025
|
|
0.436
|
|
||
|
2016 YTD
|
0.025
|
|
0.436
|
|
||
During the
second
quarter of
2016
, the Company poured
1,255
ounces of gold and
22,131
ounces of silver. During the
six
months ended
June 30, 2016
, the Company poured
2,957
ounces of gold and
51,569
ounces of silver.
For the three months ended
June 30, 2016
, the Company realized a
$1,204.08
average price per ounce of gold and a
$15.21
average sales price per ounce of silver. In comparison, commodity market prices in the first three months of 2016 averaged
$1,259.35
per ounce of gold and
$16.78
per ounce of silver.
For the
six
months ended
June 30, 2016
, the Company realized a
$1,193.04
average price per ounce of gold and a
$14.58
average sales price per ounce of silver. In comparison, commodity market prices in the first
six
months of
2016
averaged
$1,220.28
per ounce of gold and
$15.80
per ounce of silver.
28
Our Comstock exploration activities include open pit gold and silver test mining. As defined by the Securities Exchange Commission (“SEC”) Industry Guide 7, we have not yet established any proven or probable reserves at our Comstock Lode Project.
Operating Costs
During the first
six
months of
2016
, actual costs applicable to mining revenue were approximately
$3.4 million
,
$2.7 million
net of silver credits, as compared to
$8.9 million
,
$6.9 million
net of silver credits, during the first
six
months of
2015
. This
61%
reduction of net costs applicable to mining revenue is primarily a result of significantly lower labor and processing costs due to the Company’s transition from surface mining to underground exploration and development and higher experienced metallurgical yields. Costs applicable to mining revenue include processing labor, processing maintenance, processing reagents and assaying costs, among others. Costs applicable to mining revenue for the first
six
months of
2016
and
2015
also included depreciation of
$1.3 million
and $3.1 million, respectively.
During the first
six
months of
2016
, the Company focused on reducing non-mining costs, most recently increasing targeted savings in this area from $5.5 million in 2016, as compared to over
$8 million
in
2015
. The Company has aggressively implemented organizational changes consistent with our transition from mining the Lucerne surface mine to growing our resource portfolio and related exploration and development activities toward production-ready mining projects. Accordingly, general and administrative costs and other non-mining costs, including mine claims and land costs, other real estate operating costs and environmental costs have already declined significantly to an annualized rate of over
$8 million
. The Company incurred approximately
$0.3 million
in severance costs during the first
six
months of
2016
, in mining and general and administrative expenses, associated with organizational cost reductions.
Outlook
Production during 2016 is currently limited to processing of existing leach pad materials. Considering the improved estimates of gold and silver recoveries, that is, 87.5% for gold and 59.5% for silver, the current leach cycle will continue well into the
third
quarter, likely through September 2016 or later. All operating costs associated with hauling, crushing and other ancillary activities have been reduced or eliminated as we transition the full organizational focus toward the discovery, development and establishment of reserves from Lucerne and Dayton, for future mining, and the identification, assessment and acquisition of similarly situated gold and silver mining assets. During our exploration and development activities in 2016, we expect to operate with less than 15 employees. General and administrative costs are also expected to continue to decline significantly, resulting in savings in all non-mining costs of over
$8 million
during 2016, as compared to 2015, an increase of 80% over the originally disclosed target of $3 million.
The Company plans to sell non-mining related lands, buildings and water rights, valued at over $10 million, over the next twelve months and resulting in net profit of over $5 million and net cash proceeds of over $7 million. These proceeds will eliminate current debt obligations and strengthen the financial position of the Company. The Company also plans to sell surface mining equipment, no longer required in our mine plans, valued at up to $2 million and significantly reduce the financing obligations associated with Caterpillar Finance. These combined actions should eliminate substantially all of the Company’s debt obligations in the next twelve months.
During the second half of 2016, the Company also plans limited core drilling in Dayton, sufficient to finalize the parameters of a mine plan and commence the permitting for the Dayton Mine. The Company has developed grade shells with higher average grades and believes the Dayton to have economically feasible potential and plans on developing those mine plans in the latter half of 2016. Infill drilling is expected to expand the reserve potential for the Dayton mine plans.
The Company commenced the underground drift tunnel and drilling, associated with the first underground exploration phase of a PQ geological target, in September 2015, and completed drift-sampling, drilling and metallurgical test work of the PQ target during the first quarter. The Succor vein system is being considered as an easterly extension of the first phase of development beyond the high-grade PQ target. This will positively expand the scope of Phase 1 through the second half of 2016. The drift tunnels are designed to conduct an underground exploration program directed at a series of geological targets in the Silver City Branch of the Comstock Lode, including the PQ target, the Succor vein systems and the historic Woodville Bonanza system. These initial targets represent the core of a broader geological corridor. Previous surface drilling in the area, including the Succor-Holman drilling from 2015 had suggested that a greater than 1,000 feet of mineralized strike in the Succor zone, lying generally adjacent to and below the Lucerne Cut, has the potential to yield high-grade gold and silver. The current program has been geared toward defining that potential.
29
Drill results from the PQ drilling continued yielding wider and longer high-grade intercepts. These results were published by press releases issued throughout the first quarter of 2016. The Company also completed a crosscut tunnel, drifting to the Succor vein system. This drift positions the Company for efficient scope drilling from an underground platform that compliments additional scope drilling from the surface, ultimately to confirm the extent of the length and depth of the Succor target. Ultimately, these efforts are designed to develop mine plans of sufficient grade and quantities for longer-lived production plans for the Lucerne mine.
The Company will report the results of the Lucerne and Dayton exploration and development programs as they become available.
Recent Developments
The Company completed a positive restructuring of certain equipment obligations and consummated a forbearance agreement on June 27, 2016 with Caterpillar Financial Services Corporation relating to certain finance and lease agreements (the “Forbearance”). The Company entered into the Forbearance to permit the Company to complete the sale of certain equipment against a modified payment schedule under the related lease arrangements. Under the terms of the Forbearance, the Company will pay down its obligations with the net proceeds from the equipment sold during the second half of 2016, with any remaining balance to be paid off with $25,000 monthly payments until the leases have been paid in full. The Company paid down $738,000 during July 2016, resulting in the total outstanding obligations of approximately $2.9 million as of July 29, 2016.
On June 30, 2016, the Company also entered into an equity facility agreement with International Asset Advisory, LLC, a long-established financing partner, to provide up to $5 million in equity financing from time to time as needed on terms deemed favorable to the Company. This facility is intended solely to enable more efficient access to equity capital markets while we are finalizing our positive debt reduction and asset sale activities.
On July 14, 2016 the Bureau of Land Management (BLM), Sierra Front Field Office, conveyed ownership of approximately 24 acres to Northern Comstock, LLC. The parcel known locally as “Lot 51” is located on the American Flat Road, in Storey County, Nevada. The parcel was established as a lot and patented during the historic mining heyday of the Comstock District. The BLM’s action legally recognizes Lot 51 as private property. This marks the successful completion of a multi-year process to acquire this land from the BLM. Lot No. 51 represents a strategic parcel of land that enables an expanded and efficient haul route from the Lucerne mine.
On July 25, 2016, the Company purchased 98 acres of land and 257 acre-feet of senior priority water rights in Silver Springs, Nevada for $3.2 million and entered into a Loan Agreement (the “Loan Agreement”) of $3.25 million for the purpose of purchasing the real property and water rights. The indebtedness under the Loan Agreement is secured by a deed of trust on the property purchased.
The Loan Agreement has a term of two years. The indebtedness under the Loan Agreement accrues interest at a rate of 9% per annum for the first year post-closing, 12.5% per annum for the six months that follow the first anniversary of the Loan Agreement and 14% per annum thereafter until such indebtedness is paid in full. Proceeds from the sale of the property securing the loan must be used to repay the indebtedness under the Loan Agreement. In addition to customary remedies for secured indebtedness on real property, the Loan Agreement allows the lender thereunder to convert the principal amount of the indebtedness into common stock of the Company upon a default.
On August 1, 2016, the BLM approved a Right-of-Way Amendment for Comstock Mining, LLC. In July 2012 Comstock Mining, LLC submitted an application to the BLM to amend its existing Right-of-Way on the American Flat Road, located in Gold Hill, Storey County. Under the approved Right-of-Way Amendment, Comstock Mining, LLC would be permitted to realign a portion of the American Flat Road to segregate public traffic from haul traffic for public safety. The Lucerne Haul Road, which Comstock Mining, LLC has used since August 2012, would be used exclusively for haul purposes for public safety between the Lucerne Pit and American Flat where a processing facility exists. In order to approve the Right-of-Way Amendment, the BLM first had to complete compliance with the National Historic Preservation Act. This was done in February 2016 with the execution of a Memorandum of Agreement to resolve adverse effects to eight historic properties present. The BLM has also completed compliance with the National Environmental Policy Act by approving an environmental assessment.
30
Equity Raises
In March and April 2016, the Company raised $4.0 million (approximately $3.5 million net of issuance costs) through an underwritten public offering of 11,500,000 shares of common stock at a price per share of
$0.35
.
Comparative Financial Information
The Company had two operating segments as of
June 30, 2016
: mining, and real estate.
The comparative financial information is reflected in the following table:
Three Months Ended:
|
June 30, 2016
|
June 30, 2015
|
Change
|
|||||||||
|
Revenue - mining
|
$
|
1,457,991
|
|
$
|
5,442,027
|
|
$
|
(3,984,036
|
)
|
||
|
Revenue - real estate
|
33,285
|
|
46,264
|
|
(12,979
|
)
|
|||||
|
|
|
||||||||||
|
Costs applicable to mining revenue
|
1,262,316
|
|
3,219,831
|
|
(1,957,515
|
)
|
|||||
|
Real estate operating costs
|
92,324
|
|
61,267
|
|
31,057
|
|
|||||
|
Exploration and mine development
|
810,916
|
|
530,660
|
|
280,256
|
|
|||||
|
Mine claims and costs
|
273,877
|
|
293,163
|
|
(19,286
|
)
|
|||||
|
Environmental and reclamation
|
357,238
|
|
388,790
|
|
(31,552
|
)
|
|||||
|
Land and road development
|
20,904
|
|
862,246
|
|
(841,342
|
)
|
|||||
|
General and administrative
|
942,028
|
|
1,311,329
|
|
(369,301
|
)
|
|||||
|
Loss from operations
|
(2,268,327
|
)
|
(1,178,995
|
)
|
(1,089,332
|
)
|
|||||
|
OTHER INCOME (EXPENSE)
|
|||||||||||
|
Interest expense
|
(216,358
|
)
|
(330,451
|
)
|
114,093
|
|
|||||
|
Other income (expense)
|
(370,099
|
)
|
—
|
|
(370,099
|
)
|
|||||
|
NET INCOME (LOSS)
|
$
|
(2,854,784
|
)
|
$
|
(1,509,446
|
)
|
$
|
(1,345,338
|
)
|
||
Mining revenue in the three months ended
June 30, 2016
was
$1.5 million
. The decrease of
$4.0 million
resulted from lower production and lower average price per ounce of gold realized of
$1,204.08
versus
$1,262.91
for the three months ended
June 30, 2016
and
2015
, respectively. The Company produced
1,255
ounces of gold (and
22,131
ounces of silver), during the three-month period ended
June 30, 2016
, as compared to
4,575
ounces of gold (and
60,112
ounces of silver) in the three-month period of
2015
.
Throughout the three months ended
June 30, 2016
, the Company realized an average price of
$1,204.08
per ounce of gold and a
$15.21
average sales price per ounce of silver. In comparison, commodity market prices in the
second
quarter of
2016
averaged
$1,259.35
per ounce of gold and
$16.78
per ounce of silver.
Costs applicable to mining revenue were
$1.3 million
for the three months ended
June 30, 2016
, including
$0.4 million
of silver credits, as compared to
$3.2 million
for the three months ended
June 30, 2015
, including
$1.0 million
of silver credits. The reduction of
$2.0 million
, of net costs applicable to mining revenue resulted from shifting of the Company's focus from mining to exploration resulting in lower mining and processing costs and the reduction of mining and processing staff.
Exploration and mine development costs increased by approximately
$0.3 million
during the three months ended
June 30, 2016
, as compared to the same period ended
June 30, 2015
. The increase is a result of $0.7 million classification of mining equipment depreciation expense to development activities, offset by lower exploration and development labor costs of $0.2 million and other negotiated reductions in development costs.
Land and road development costs were
$0.9 million
in the second quarter of 2015, due to the road realignment project that was completed in 2015.
31
General and administrative costs decreased by
$0.4 million
second
quarter of
2016
, as compared to
second
quarter of
2015
. The decrease is primarily the result of lower payroll costs of approximately $0.3 million, in line with targeted cost reduction efforts.
Net loss was
$2.9 million
for the three months ended
June 30, 2016
, as compared to a net income of
$1.5 million
for the three months ended
June 30, 2015
. The
$1.3 million
increase in net loss primarily resulted from a
$4.0 million
decrease in revenue, net of a
$2.0 million
decrease in mining and processing costs,
$0.8 million
reduction in Road and Land Development costs and $0.3 million of lower general and administrative costs, offset by a
$0.3 million
increase in development and exploration expenses.
Six Months Ended:
|
June 30, 2016
|
June 30, 2015
|
Change
|
|||||||||
|
Revenue - mining
|
$
|
3,438,755
|
|
$
|
11,369,201
|
|
$
|
(7,930,446
|
)
|
||
|
Revenue - real estate
|
73,042
|
|
156,507
|
|
(83,465
|
)
|
|||||
|
|
|
||||||||||
|
Costs applicable to mining revenue
|
2,678,237
|
|
6,937,743
|
|
(4,259,506
|
)
|
|||||
|
Real estate operating costs
|
144,753
|
|
261,294
|
|
(116,541
|
)
|
|||||
|
Exploration and mine development
|
3,438,508
|
|
1,133,854
|
|
2,304,654
|
|
|||||
|
Mine claims and costs
|
570,310
|
|
714,227
|
|
(143,917
|
)
|
|||||
|
Environmental and reclamation
|
729,934
|
|
1,011,944
|
|
(282,010
|
)
|
|||||
|
Land and road development
|
20,904
|
|
862,246
|
|
(841,342
|
)
|
|||||
|
General and administrative
|
2,027,136
|
|
3,457,234
|
|
(1,430,098
|
)
|
|||||
|
Loss from operations
|
(6,097,985
|
)
|
(2,852,834
|
)
|
(3,245,151
|
)
|
|||||
|
OTHER INCOME (EXPENSE)
|
|||||||||||
|
Interest expense
|
(438,095
|
)
|
(554,124
|
)
|
116,029
|
|
|||||
|
Other income (expense)
|
(370,099
|
)
|
3,186,626
|
|
(3,556,725
|
)
|
|||||
|
NET INCOME (LOSS)
|
$
|
(6,906,179
|
)
|
$
|
(220,332
|
)
|
$
|
(6,685,847
|
)
|
||
Mining revenue in the
six
months ended
June 30, 2016
was
$3.4 million
. The decrease of
$7.9 million
resulted from lower production and lower average price per ounce of gold realized of $
$1,193.04
versus $1,262.91 for the six months ended June 30, 2016 and 2015, respectively. The Company produced
2,957
ounces of gold and
51,569
ounces of silver, during the
six
-month period ended
June 30, 2016
, as compared to
4,575
ounces of gold and
60,112
ounces of silver in the
six
-month period of 2015.
Throughout the
six
months ended
June 30, 2016
, the Company realized an average price of
$1,193.04
per ounce of gold and a
$14.58
average sales price per ounce of silver. In comparison, commodity market prices in the first half of 2016 averaged
$1,220.28
per ounce of gold and
$15.80
per ounce of silver.
Costs applicable to mining revenue were
$2.7 million
for the
six
months ended
June 30, 2016
, including
$0.7 million
of silver credits, as compared to
$6.9 million
for the
six
months ended June 30, 2015, including
$1.9 million
of silver credits. The reduction of
$4.3 million
of net costs applicable to mining revenue resulted from shifting of the Company's focus from mining to exploration resulting in lower mining and processing costs and the reduction of mining and processing staff.
Exploration and mine development costs increased by approximately
$2.3 million
during the
six
months ended
June 30, 2016
, as compared to the same period ended
June 30, 2015
. The increase is a result of costs related to underground exploration activities and the completion of the drift to the Succor vein system in early February 2016 and a $1.4 million classification of mining equipment depreciation expense that was used in development.
Land and road development costs were
$0.9 million
in 2015 due to the road realignment project that was undertaken and successfully completed in 2015.
32
General and administrative costs decreased by
$1.4 million
in the
six
months ended
June 30, 2016
, as compared to the same period of 2015. The decrease is a result of lower payroll costs of approximately $0.6 million, a reduction of net proceeds tax liabilities of approximately $0.2 million and lower legal and consulting fees of approximately $0.1 million, , among other reductions, all in line with the cost reduction programs.
Other income decreased approximately
$3.6 million
in the
six
months ended
June 30, 2016
, as compared to the same period of 2015. The decrease primarily resulted from a reduction in a loss contingency of approximately $3.2 million that was included in other income in the condensed consolidated statements of operations in 2015, and did not recur in 2016.
Net loss was
$6.9 million
for the
six
months ended
June 30, 2016
, as compared to a net loss of
$0.2 million
for the
six
months ended
June 30, 2015
. The
$6.7 million
increase in net loss primarily resulted from a
$7.9 million
decrease in revenue, a $3.1 million decrease in other income, net of
$4.3 million
lower mining and processing costs and
$1.4 million
of lower general and administrative costs, offset by a
$2.3 million
increase in costs resulting from underground and surface exploration and development costs and approximately $0.5 million in other costs including environmental, mine claims and real estate costs.
Liquidity and Capital Resources
Total current assets were
$10.3 million
at
June 30, 2016
, including cash and cash equivalents of
$0.8 million
. Inventories, stockpiles, and mineralized material on leach pad totaled $
0.5 million
.
The Company was an exploration and development company for most of its existence and accordingly has a history of net operating losses. The Company had net losses from operations since 2012, and an accumulated deficit of
$206.0 million
at
June 30, 2016
. For the three-month period ended
June 30, 2016
the Company realized net loss of
$2.9 million
and used
$3.2 million
of cash in operating activities. As of
June 30, 2016
, the Company had current assets of
$10.3 million
(including cash and cash equivalents of
$0.8 million
) and current liabilities of
$8.7 million
.
The Company’s current capital resources include cash and cash equivalents and other working capital resources, cash generated through operations, certain planned, non-mining asset sales with expected net proceeds of over $7 million and existing financing arrangements, including an equity agreement with International Assets Advisory LLC, as agent (“IAA”), whereby the Company may offer and sell shares of the Company’s common stock of up to $5 million and a revolving credit facility (the “Revolving Credit Facility”) with Auramet International, LLC (“Auramet”). While the Company has been successful in the past in obtaining the necessary capital to support its operations, including registered equity financings from its existing shelf registration, borrowings, or other means, there is no assurance that the Company will be able to obtain additional equity or other financing, if needed. The Company believes it will have sufficient funds to sustain operations during the next twelve months as a result of the sources of funding described above.
During the six months ended June 30, 2016, the Company prioritized the continued reduction of non-mining costs including general and administrative, targeting $8.0 million of savings from reduced labor, legal, consulting and other general corporate expenditures, as compared to 2015. The Company incurred approximately $0.3 million in severance costs during the six months ended June 30, 2016, in mining and general and administrative expenses, associated with organizational cost reductions.
The Company plans to sell non-mining related lands, buildings and water rights valued at over $10 million over the next twelve months and with planned net proceeds of over $7 million. These proceeds will eliminate current debt obligations and strengthen the financial position of the Company. The Company also plans to sell surface mining equipment, no longer required in our mine plans, valued at up to $2 million and significantly reducing the financing obligations associated with Caterpillar Finance. These combined actions should eliminate all or substantially all of the Company’s debt obligations in the next twelve months. There is no assurance that the Company will be able to sell such assets on favorable terms, or at all.
33
On June 28, 2016, the Company entered into an agreement with IAA, pursuant to which the Company may offer and sell shares of the Company’s common stock, par value $0.000666 per share, having an aggregate offering price of up to $5 million. Any shares offered and sold will be issued pursuant to the Company’s shelf registration statement on Form S-3 (and the related prospectus) declared effective by the SEC on February 5, 2016, with an expiration date of February 5, 2019. Under the agreement, IAA may sell shares by any method permitted by law and deemed to be an “at-the-market” offering as defined in Rule 415 promulgated under the Securities Act, including sales made directly on the NYSE MKT or on any other existing trading market for the common stock, sales to or through a market maker or sales in privately negotiated transactions. The Company is not obligated to make any sales of shares under the agreement, and if it elects to make any sales, the Company may set a minimum sales price for the shares. The offering of shares pursuant to the Sales Agreement will terminate upon the termination of the Sales Agreement by IAA or the Company, as permitted therein. The Company will pay IAA a commission rate of up to 2.5% of the gross sales price per share sold, subject to an agreed-upon minimum per share commission, and has agreed to reimburse IAA for certain specified expenses in connection with entering into the agreement. The Company also agreed to provide indemnification and contribution to IAA with respect to certain liabilities, including liabilities under the Securities Act. As of June 30, 2016, no shares had been issued.
On March 31, 2016, the Company completed an underwritten public offering of
10,000,000
shares of its common stock. Gross proceeds to the Company from this offering were approximately
$3.5 million
before deducting underwriting commissions and other offering expenses paid by the Company. On April 13, 2016, the Company also completed the sale of an additional 1,500,000 shares of the Company's common stock for additional gross proceeds of approximately $525,000.
On March 6, 2015, the Company reached an agreement to draw on a restated $5 million revolving credit facility (the “Revolving Credit Facility”) with Auramet, pursuant to which the Company may borrow up to $5 million, subject to satisfying certain conditions and obtaining certain consents. On March 6, 2015, the Company drew $5 million representing cash proceeds of approximately $4.4 million, net of prepaid interest of approximately $0.4 million, and other fees of approximately $0.2 million. The proceeds from the Revolving Credit Facility were primarily used for an accelerated construction schedule for rerouting State Route 342, located in the Company’s Lucerne Resource Area, the first phase of which was completed in early June 2015, and the second phase was completed in November 2015. On December 28, 2015, the Company and Auramet agreed to increase the facility up to $10 million and extend the facility from the current maturity of February 6, 2017 to April 28, 2018. On April 1, 2016, the Company fully repaid the outstanding revolving credit facility with a payment of $1.2 million. As of June 30, 2016, there were no outstanding amounts related to this facility. The Company is in compliance with all the required covenants.
Net cash used in operating activities was
$3.2 million
for the
six
months ended
June 30, 2016
, as compared to net cash generated by operating activities of
$0.4 million
for the
six
months ended
June 30, 2015
. The Company's use of cash in operating activities in the first
six
months of
2016
, was primarily driven by Company's expenditures related to underground exploration, including the PQ and Succor targets and operating losses due to lower production. Our positive cash flow from operating activities in the first six months of 2015, was primarily from operating income associated with lower labor, blasting, fuel and equipment rental costs relative to production of mineralized material.
Net cash provided by investing activities was
$1.6 million
for the
six
months ended
June 30, 2016
, primarily from equipment sales of approximately $1.8 million, offset by land and properties deposits of approximately $0.2 million. Net cash used in investing activities for the
six
months ended
June 30, 2015
, was
$3.7 million
, primarily relating to $1.8 million for strategic land purchases and $1.9 million for the design and construction of the heap leach expansion and related infrastructure.
Net cash provided by financing activities for the
six
months ended
June 30, 2016
, was
$0.7 million
, comprised of proceeds of
$3.5 million
from the sale of securities, $0.6 million proceeds from an amended agreement with Auramet International and $0.3 million from proceeds from a short-term note
,
offset by the pay-down of long-term debt obligations of approximately
$3.7 million
. Net cash provided by financing activities for the
six
months ended
June 30, 2015
was
$4.8 million
, comprised of proceeds of $4.4 million from the revolving credit facility and $5.0 million from the Varilease agreement, offset by the pay-down of other long-term debt obligations of approximately $4.6 million.
The accompanying unaudited condensed consolidated financial statements have been prepared assuming the Company will continue as a going concern, which considers the realization of assets and discharge of liabilities in the normal course of business and does not include any adjustments that might result from the outcome of uncertainties noted below.
34
The Company's success depends on its ability to recover precious metals, process them and successfully sell them for more than the cost of production. The Company has limited control over its costs and has no ability to control the market prices. The costs of exploration and production may fluctuate as a result of a number of factors, such as the changing composition of ore grade or mineralized material production, and metallurgy and exploration activities in response to the physical shape and location of the ore body or deposit. In addition, costs are affected by the price of commodities such as fuel and electricity. Such commodities are at times subject to volatile price movements, including increases that could make production unprofitable. A material increase in production costs or a decrease in the price of gold or other minerals could materially affect the Company's ability to generate cash flow.
Mineral exploration, particularly for gold and other precious metals, is highly speculative in nature, involves many risks and frequently is nonproductive. If gold mineralization is discovered, it may take a number of years from the initial phases of drilling until production is possible, if ever, during which time the economic feasibility of production may change. Substantial expenditures are required to establish ore reserves through drilling and analysis, to develop metallurgical processes to extract metal from the ore, and (in the case of new properties) to develop the processing facilities and infrastructure at any site chosen for mineral exploration. There can be no assurance that gold reserves or mineralized material that may be discovered or acquired in the future, if any, will be in sufficient quantities or of adequate grade to justify commercial operations or that the funds required for mineral production operation can be obtained on a timely or reasonable basis, if at all. In addition, mineralized material or reserves that may be identified, if any, will be depleted by production.
The capital expenditures and time required to develop and explore our properties are considerable and changes in costs or construction schedules, delays in such construction or both can adversely affect project economics and expected production and profitability.
On March 28, 2016, the Company entered into a Drilling and Development Services for Common Stock Investment Agreement (the "Stock Investment Agreement") between the Company and American Mining & Tunneling, LLC and American Drilling Corp, LLC (collectively "AMT"), pursuant to which the Company agreed to issue up to 9,000,000 shares of the Company's common stock to AMT in exchange for $5.0 million in exchange for future drilling, mine development and underground mining services in connection with (but not limited to) the Company’s construction of an underground exploration portal, mining infrastructure and development of the Company’s Lucerne and Dayton Mine projects.
Future production rates and gold prices below management’s expectations would adversely affect the Company’s results of operations, financial condition and cash flows. Future asset sales could also take longer than expected. If the Company was unable to obtain any necessary additional funds, this could have an immediate material effect on liquidity
and could raise substantial doubt about the Company’s ability to continue as a going concern. In such case, the Company could be required to limit or discontinue certain business plans, activities or operations, reduce or delay certain capital expenditures or sell certain assets or businesses. There can be no assurance that the Company would be able to take any of such actions on favorable terms, in a timely manner or at all.
Critical Accounting Policies and Estimates
There have not been any material changes to the critical accounting policies and estimates previously disclosed in our Annual Report on Form 10-K for the year ended
December 31, 2015
.
35
ITEM 3.
QUANTITATIVE AND QUALITATIVE DISCLOSURES ABOUT MARKET RISK
Metal Price –
Changes in the market price of gold may significantly affect our profitability and cash flow. Gold prices fluctuate widely due to factors such as; demand, global mine production levels, investor sentiment, central bank reserves, and the value of the U.S. dollar.
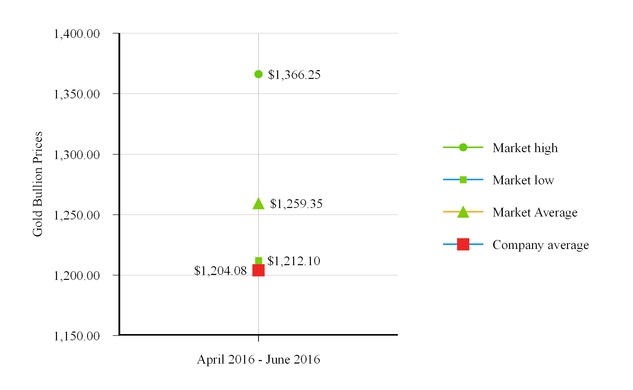
In the
second
quarter of
2016
, Gold Bullion prices averaged approximately
$1,259.35
per ounce, up from a quarterly low close of
$1,212.10
on
May 31, 2016
. Gold has fluctuated from that low to a high of
$1,366.25
during the quarter. Silver prices averaged
$16.78
per ounce, also gaining from a quarterly low of
$14.96
on
April 4, 2016
to a high of over
$18.36
per ounce during the
second
quarter. The outlook for these markets remains mixed, driven primarily by uncertainty over U.S. fiscal and monetary policy.
With the exception of the above, there have been no material changes in the market risks discussed in Item 7A of our Annual Report on Form 10-K.
36
A. Disclosure
Evaluation of Disclosure Controls and Procedures
As of the end of the period covered by this Quarterly Report on Form 10-Q, management performed, with the participation of our Principal Executive Officer and our Principal Financial Officer, an evaluation of the effectiveness of our disclosure controls and procedures as defined in Rules 13a-15(e) and 15d-15(e) of the Securities Exchange Act of 1934 (“Exchange Act”). Our disclosure controls and procedures are designed to ensure that information required to be disclosed in the reports we file or submit under the Exchange Act is recorded, processed, summarized and reported within the time periods specified in the Exchange Act and the SEC’s rules, and that such information is accumulated and communicated to our management, including our Principal Executive Officer and Principal Financial Officer, to allow timely decisions regarding required disclosures. There are inherent limitations to the effectiveness of any system of disclosure controls and procedures, including the possibility of human error and the circumvention or overriding of the controls and procedures. Accordingly, even effective disclosure controls and procedures can only provide reasonable assurance of achieving their control objectives. Each of our Principal Executive Officer and Principal Financial Officer concluded that, as of
June 30, 2016
, our disclosure controls and procedures were effective.
Design and Evaluation of Internal Control over Financial Reporting
Our management is responsible for establishing and maintaining adequate internal control over financial reporting as defined in Exchange Act Rules 13a-15(f) and 15d-15(f). Our management assessed the effectiveness of our internal control over financial reporting as of
June 30, 2016
. In making this assessment, management used the criteria for effective internal control over financial reporting described in the “Internal Control-Integrated Framework” (2013) set forth by the Committee of Sponsoring Organizations of the Treadway Commission (COSO). Based on the assessment, management concluded that, as of
June 30, 2016
, our internal control over financial reporting was effective based on those criteria.
B. Internal Control over Financial Reporting
No change in our internal control over financial reporting, as such term is defined in Exchange Act Rule 13(a)-15, occurred during the fiscal quarter ended
June 30, 2016
, that materially affected or is reasonably likely to materially affect our internal control over financial reporting.
37
Item 1.
Legal Proceedings.
On January 31, 2014, the Comstock Residents Association (the “CRA”) and two of its members filed a civil action in the Third Judicial District Court of the State of Nevada in and for Lyon County (the “District Court”) against the Lyon County Board of Commissioners (the “Commissioners”) and the Company, asking the Court to reverse the Commissioners’ decision to grant an application for master plan amendment and zone change submitted and approved by the Commissioners on January 2, 2014 (the “Application”). Prior to the approval of the Application, the master plan designation and zoning precluded mining on certain property of the Company in the area of Silver City, Lyon County. Generally, the CRA argues, among other things, that the Commissioners should not have approved the Application because the master plan and zoning designations on that property had been in place for more than forty years. In April 2015, the District Court ruled in favor the Company and the Commissioners. The written Order Denying Petition for Judicial Review was filed and mailed to all parties on June 15, 2015. On July 14, 2015, the CRA and one individual (together “Appellants”) filed a Notice of Appeal of the Court Order, appealing the decision to the Nevada Supreme Court. On December 9, 2015, Appellants filed their Opening Brief in the Nevada Supreme Court, generally repeating the arguments that were made at the District Court. On January 15, 2016, the Company and the Commissioners jointly filed an Answering Brief. Briefing in the Nevada Supreme Court was completed with the Appellants’ filing of a Reply Brief on March 3, 2016. On June 7, 2016, the Nevada Supreme Court entered an Order indicating that the matter would be scheduled for an oral argument. As of this date, no oral argument has been scheduled. The Company believes that the Commissioners properly exercised their statutory authority and the Company, in cooperation with the Commissioners and the Lyon County District Attorney, will continue to aggressively oppose the pending appeal.
From time to time, we are involved in lawsuits, claims, investigations and proceedings that arise in the ordinary course of business. There are no matters pending or threatened that we expect to have a material impact on our business, results of operations, financial condition or cash flows.
There have not been any material changes to the risk factors previously disclosed in our Annual Report on Form 10-K for the year ended
December 31, 2015
.
Item 2.
Unregistered Sales of Equity Securities and Use of Proceeds.
During the
six
months ended
June 30, 2016
, the Company issued
3 million
shares of common stock in consideration of a transaction related to the purchase of land near its mining operations, with a fair value of
$1.3 million
.
No underwriters were involved in the foregoing issuances of securities. The offers, sales and issuances of the securities described above were deemed to be exempt from registration under the Securities Act in reliance upon Section 4(2) of the Securities Act. The issuance of stock was a private placement of securities to accredited investors within the meaning of Rule 501 of Regulation D of the Securities Act. Each of the recipients of securities in these transactions had adequate access to information about us through directorships, business or other relationships with the Company.
Item 3.
Defaults Upon Senior Securities.
None.
38
Item 4.
Mine Safety Disclosure.
Pursuant to the Dodd-Frank Wall Street Reform and Consumer Protection Act, and Item 104 of Regulation S-K, we are required to disclose items believed to be violations of the Federal Mine Safety and Health Act of 1977, any health and safety standard, or any regulation, as administered by the Federal Mine Safety and Health Administration. The required information is included in Exhibit 95 to this report.
Item 5.
Other Information.
None.
Item 6.
Exhibits.
The exhibits required to be filed as a part of this Report on Form 10-Q are listed in the Exhibit Index attached hereto, which is incorporated herein by reference.
(1) Financial statements filed as part of this Report:
|
|
|
|
|
|
(2) Exhibits filed as part of this Report:
See Exhibits for which the Exhibit number is noted with an asterisk on the Exhibit Index attached hereto.
39
|
Exhibit
Number
|
Exhibit
|
|
|
10.1*
|
Sales Agreement, dated as of June 30, 2016, between the Company and International Assets Advisory.
|
|
|
10.2*
|
Forbearance Agreement, dated as of June 27, 2016, between the Company and Caterpillar Financial Services Corporation.
|
|
|
31.1*
|
Certification of Principal Executive Officer pursuant to Rule 13a-14(a) and Rule 15d-14(a), promulgated under the Securities Exchange Act of 1934, as amended.
|
|
|
32.1*
|
Certification pursuant to 18 U.S.C. Section 1350, as adopted pursuant to Section 906 of the Sarbanes-Oxley Act of 2002.
|
|
|
95*
|
Mine Safety Disclosures.
|
|
|
101*
|
Interactive Data File (Quarterly Report on Form 10-Q, for the quarterly period ended March 31, 2016, furnished in XBRL (eXtensible Business Reporting Language)).
|
|
|
Attached as Exhibit 101 to this report are the following documents formatted in XBRL: (i) the Condensed Consolidated Balance Sheets at June 30, 2016 and December 31, 2015, (ii) the Condensed Consolidated Statements of Operations for the three and six months ended June 30, 2016 and 2015, (iii) the Condensed Consolidated Statements of Cash Flows for the six months ended June 30, 2016 and 2015 and (iv) the Notes to the Condensed Consolidated Financial Statements, tagged as blocks of text. Users of this data are advised pursuant to Rule 406T of Regulation S-T that this interactive data file is deemed not filed or part of a registration statement or prospectus for purposes of sections 11 or 12 of the Securities Act of 1933, is deemed not filed for purposes of section 18 of the Securities and Exchange Act of 1934, and otherwise is not subject to liability under these sections.
|
||
40
SIGNATURES
Pursuant to the requirements of the Securities Exchange Act of 1934, the registrant has duly caused this report to be signed on its behalf by the undersigned thereunto duly authorized.
|
COMSTOCK MINING, INC.
|
||
|
(Registrant)
|
||
|
Date: August 4, 2016
|
By:
|
/s/ Corrado De Gasperis
|
|
Name: Corrado De Gasperis
|
||
|
Title: President, Chief Executive Officer and Executive Chairman
|
||
41
TABLE OF CONTENTS
Part I Financial InformationItem 1. Financial StatementsItem 2. Management S Discussion and Analysis Of Financial Condition and Results Of OperationsItem 3. Quantitative and Qualitative Disclosures About Market RiskItem 4. Controls and ProceduresPart II - Other InformationItem 1. Legal ProceedingsItem 1A. Risk FactorsItem 2. Unregistered Sales Of Equity Securities and Use Of ProceedsItem 3. Defaults Upon Senior SecuritiesItem 4. Mine Safety DisclosureItem 5. Other InformationItem 6. Exhibits