COMSTOCK MINING INC.
10-Ks and 10-Qs
|
|
|
|
|
|
|
|
|
|
|
|
|
|
|
|
|
|
|
|
|
|
|
|
|
|
|
|
|
|
|
|
|
|
|
|
|
|
|
|
|
|
|
|
|
|
|
|
|
|
|
|
|
|
|
|
|
|
|
|
|
|
UNITED STATES
SECURITIES AND EXCHANGE COMMISSION
WASHINGTON, D.C. 20549
FORM 10-Q
(Mark One)
|
x
|
QUARTERLY REPORT PURSUANT TO SECTION 13 OR 15(d) OF THE SECURITIES EXCHANGE ACT OF 1934
|
|
For the Quarterly Period Ended
June 30, 2017
or
|
¨
|
TRANSITION REPORT PURSUANT TO SECTION 13 OR 15(d) OF THE SECURITIES EXCHANGE ACT OF 1934
|
|
For the transition period from ______________ to ______________
Commission File No. 001-35200

COMSTOCK MINING INC.
(Exact name of registrant as specified in its charter)
|
NEVADA
(State or other jurisdiction of
incorporation or organization)
|
1040
(Primary Standard Industrial
Classification Code Number)
|
65-0955118
(I.R.S. Employer
Identification No.)
|
||
P.O. Box 1118
Virginia City, NV 89440
(Address of principal executive offices)
(775) 847-5272
(Registrant’s telephone number, including area code)
Indicate by check mark whether the registrant (1) has filed all reports required to be filed by Section 13 or 15(d) of the Securities Exchange Act of 1934 during the preceding 12 months (or for such shorter period that the registrant was required to file such reports), and (2) has been subject to such filing requirements for the past 90 days. Yes
x
No
¨
Indicate by check mark whether the registrant has submitted electronically and posted on its corporate Web site, if any, every Interactive Data File required to be submitted and posted pursuant to Rule 405 of Regulation S-T (§232.405 of this chapter) during the preceding 12 months (or for such shorter period that the registrant was required to submit and post such files). Yes
x
No
¨
Indicate by check mark whether the registrant is a large accelerated filer, an accelerated filer, a non-accelerated filer, smaller reporting company, or an emerging growth company. See definition of “large accelerated filer," "accelerated filer,” "smaller reporting company," and "emerging growth company" in Rule 12b-2 of the Exchange Act. (Check one):
|
Large accelerated filer
|
¨
|
Accelerated filer
|
¨
|
|||||||
|
Non-accelerated filer
|
¨
|
(Do not check if a smaller reporting company)
|
||||||||
|
Smaller reporting company
|
x
|
|||||||||
|
Emerging growth company
|
¨
|
|||||||||
If an emerging growth company, indicate by check mark of the registrant has elected not to use the extended transition period for complying with any new or revised financial accounting standards provided pursuant to Section 13(a) of the Exchange Act.
Indicate by check mark whether the registrant is a shell company (as defined in Rule 12b-2 of the Act). Yes
¨
No
x
The number of shares of Common Stock, $0.000666 par value, of the registrant outstanding at
July 28, 2017
was
210,027,045
.
TABLE OF CONTENTS
2
Cautionary Notice Regarding Forward-Looking Statements
Certain statements contained in this report on Form 10-Q are forward-looking statements within the meaning of Section 27A of the Securities Act of 1933, as amended, and Section 21E of the Securities Exchange Act of 1934, as amended. All statements, other than statements of historical facts, are forward-looking statements. The words “believe,” “expect,” “anticipate,” “estimate,” “project,” “plan,” “should,” “intend,” “may,” “will,” “would,” “potential” and similar expressions identify forward-looking statements, but are not the exclusive means of doing so. Forward-looking statements include statements about matters such as: future prices and sales of, and demand for, our products; future industry market conditions; future changes in our mine planning, exploration activities, production capacity and operations; future exploration, production, operating and overhead costs; operational and management restructuring activities; future employment and contributions of personnel; tax and interest rates; capital expenditures and their impact on us; nature and timing of restructuring charges and the impact thereof; productivity, business process, rationalization, investment, joint venture, dilutive capital raising, acquisition, consulting, operational, tax, financial and capital projects and initiatives; contingencies; environmental compliance and changes in the regulatory environment; remediation costs and future working capital, costs, revenues, business opportunities, debt levels, cash flows, margins, earnings and growth.
These statements are based on assumptions and assessments made by our management in light of their experience and their perception of historical and current trends, current conditions, possible future developments and other factors they believe to be appropriate. Forward-looking statements are not guarantees, representations or warranties and are subject to risks and uncertainties, many of which are unforeseeable and beyond our control and could cause actual results, developments and business decisions to differ materially from those contemplated by such forward-looking statements. Some of those risks and uncertainties include the risk factors set forth in this report and our Annual Report on Form 10-K for the fiscal year ended December 31, 2016, and the following: adverse effects of climate changes or natural disasters; global economic and capital market uncertainties; the speculative nature of gold or mineral exploration, including risks of diminishing quantities or grades of qualified resources; operational or technical difficulties in connection with exploration or mining activities; contests over our title to properties; potential dilution to our stockholders from our stock issuances, recapitalization and balance sheet restructuring activities; potential inability to comply with applicable government regulations or law; adoption of or changes in legislation or regulations adversely affecting our businesses; permitting constraints or delays; business opportunities that may be presented to, or pursued by, us; acquisitions, joint ventures, strategic alliances, business combinations, asset sales, and investments that we may be party to in the future; changes in the United States or other monetary or fiscal policies or regulations; interruptions in our production capabilities due to capital constraints; equipment failures; fluctuation of prices for gold or certain other commodities (such as silver, zinc, cyanide, water, diesel fuel and electricity); changes in generally accepted accounting principles; adverse effects of terrorism and geopolitical events; potential inability to implement our business strategies; potential inability to grow revenues; potential inability to attract and retain key personnel; interruptions in delivery of critical supplies, equipment and raw materials due to credit or other limitations imposed by vendors; assertion of claims, lawsuits and proceedings against us; potential inability to satisfy debt and lease obligations; potential inability to maintain an effective system of internal controls over financial reporting; potential inability or failure to timely file periodic reports with the SEC; potential inability to list our securities on any securities exchange or market; inability to maintain the listing of our securities; and work stoppages or other labor difficulties. Occurrence of such events or circumstances could have a material adverse effect on our business, financial condition, results of operations or cash flows or the market price of our securities. All subsequent written and oral forward-looking statements by or attributable to us or persons acting on our behalf are expressly qualified in their entirety by these factors. Except as may be required by securities or other law, we undertake no obligation to publicly update or revise any forward-looking statements, whether as a result of new information, future events, or otherwise.
3
COMSTOCK MINING INC. AND SUBSIDIARIES
(UNAUDITED)
|
June 30,
2017 |
December 31,
2016 |
||||||
|
ASSETS
|
|||||||
|
CURRENT ASSETS:
|
|||||||
|
Cash and cash equivalents
|
$
|
1,031,209
|
|
$
|
184,359
|
|
|
|
Assets held for sale, Net (Note 3)
|
5,905,768
|
|
5,894,220
|
|
|||
|
Prepaid expenses and other current assets (Note 2)
|
346,463
|
|
1,885,792
|
|
|||
|
Total current assets
|
7,283,440
|
|
7,964,371
|
|
|||
|
MINERAL RIGHTS AND PROPERTIES, Net
|
7,205,081
|
|
7,205,081
|
|
|||
|
PROPERTIES, PLANT AND EQUIPMENT, Net (Note 3)
|
14,846,158
|
|
15,148,567
|
|
|||
|
RECLAMATION BOND DEPOSIT
|
2,622,544
|
|
2,622,544
|
|
|||
|
RETIREMENT OBLIGATION ASSET (Note 4)
|
449,936
|
|
617,126
|
|
|||
|
OTHER ASSETS
|
285,342
|
|
285,342
|
|
|||
|
TOTAL ASSETS
|
$
|
32,692,501
|
|
$
|
33,843,031
|
|
|
|
LIABILITIES AND STOCKHOLDERS’ EQUITY
|
|||||||
|
CURRENT LIABILITIES:
|
|||||||
|
Accounts payable
|
$
|
668,586
|
|
$
|
804,551
|
|
|
|
Accrued expenses (Note 5)
|
1,023,898
|
|
1,135,934
|
|
|||
|
Long-term debt– current portion (Note 6)
|
469,360
|
|
483,669
|
|
|||
|
Total current liabilities
|
2,161,844
|
|
2,424,154
|
|
|||
|
LONG-TERM LIABILITIES:
|
|||||||
|
Long-term debt (Note 6)
|
10,934,354
|
|
8,986,626
|
|
|||
|
Long-term reclamation liability (Note 4)
|
7,385,513
|
|
7,353,346
|
|
|||
|
Other liabilities
|
631,272
|
|
662,316
|
|
|||
|
Total long-term liabilities
|
18,951,139
|
|
17,002,288
|
|
|||
|
Total liabilities
|
21,112,983
|
|
19,426,442
|
|
|||
|
COMMITMENTS AND CONTINGENCIES (Note 9)
|
|
|
|
|
|||
|
STOCKHOLDERS’ EQUITY:
|
|||||||
|
Common stock, $.000666 par value, 3,950,000,000 shares authorized,
203,582,419
and
185,363,676
shares issued and outstanding at June 30, 2017 and
December 31, 2016
, respectively
|
135,587
|
|
123,453
|
|
|||
|
Additional paid-in capital
|
229,179,073
|
|
226,321,375
|
|
|||
|
Accumulated deficit
|
(217,735,142
|
)
|
(212,028,239
|
)
|
|||
|
Total stockholders’ equity
|
11,579,518
|
|
14,416,589
|
|
|||
|
TOTAL LIABILITIES AND STOCKHOLDERS’ EQUITY
|
$
|
32,692,501
|
|
$
|
33,843,031
|
|
|
See accompanying notes to condensed consolidated financial statements.
4
COMSTOCK MINING INC. AND SUBSIDIARIES
(UNAUDITED)
|
Three Months Ended
June 30, |
Six Months Ended
June 30, |
||||||||||||||
|
2017
|
2016
|
2017
|
2016
|
||||||||||||
|
REVENUES
|
|||||||||||||||
|
Revenue - mining
|
$
|
—
|
|
$
|
1,457,991
|
|
$
|
—
|
|
$
|
3,438,755
|
|
|||
|
Revenue - real estate
|
27,370
|
|
33,285
|
|
46,664
|
|
73,042
|
|
|||||||
|
Total revenues
|
27,370
|
|
1,491,276
|
|
46,664
|
|
3,511,797
|
|
|||||||
|
COST AND EXPENSES
|
|||||||||||||||
|
Costs applicable to mining revenue
|
914,341
|
|
1,262,316
|
|
1,816,745
|
|
2,678,237
|
|
|||||||
|
Real estate operating costs
|
22,813
|
|
92,324
|
|
39,946
|
|
144,753
|
|
|||||||
|
Exploration and mine development
|
271,137
|
|
810,916
|
|
542,104
|
|
3,438,508
|
|
|||||||
|
Mine claims and costs
|
244,458
|
|
273,877
|
|
508,993
|
|
570,310
|
|
|||||||
|
Environmental and reclamation
|
169,264
|
|
357,238
|
|
517,315
|
|
729,934
|
|
|||||||
|
General and administrative
|
957,034
|
|
962,932
|
|
1,617,897
|
|
2,048,040
|
|
|||||||
|
Total cost and expenses
|
2,579,047
|
|
3,759,603
|
|
5,043,000
|
|
9,609,782
|
|
|||||||
|
LOSS FROM OPERATIONS
|
(2,551,677
|
)
|
(2,268,327
|
)
|
(4,996,336
|
)
|
(6,097,985
|
)
|
|||||||
|
OTHER INCOME (EXPENSE)
|
|||||||||||||||
|
Interest expense
|
(398,854
|
)
|
(216,358
|
)
|
(854,936
|
)
|
(438,095
|
)
|
|||||||
|
Other income (expense), net
|
17,809
|
|
(370,099
|
)
|
144,369
|
|
(370,099
|
)
|
|||||||
|
Total other expense, net
|
(381,045
|
)
|
(586,457
|
)
|
(710,567
|
)
|
(808,194
|
)
|
|||||||
|
LOSS BEFORE INCOME TAXES
|
(2,932,722
|
)
|
(2,854,784
|
)
|
(5,706,903
|
)
|
(6,906,179
|
)
|
|||||||
|
INCOME TAXES
|
—
|
|
—
|
|
—
|
|
—
|
|
|||||||
|
NET LOSS
|
$
|
(2,932,722
|
)
|
$
|
(2,854,784
|
)
|
$
|
(5,706,903
|
)
|
$
|
(6,906,179
|
)
|
|||
|
Net loss per common share – basic
|
$
|
(0.02
|
)
|
$
|
(0.02
|
)
|
$
|
(0.03
|
)
|
$
|
(0.04
|
)
|
|||
|
Net loss per common share – diluted
|
$
|
(0.02
|
)
|
$
|
(0.02
|
)
|
$
|
(0.03
|
)
|
$
|
(0.04
|
)
|
|||
|
Weighted average common shares outstanding — basic
|
193,074,699
|
|
176,373,416
|
|
189,714,279
|
|
170,075,960
|
|
|||||||
|
Weighted average common shares outstanding — diluted
|
193,074,699
|
|
176,373,416
|
|
189,714,279
|
|
170,075,960
|
|
|||||||
See accompanying notes to condensed consolidated financial statements.
5
COMSTOCK MINING INC. AND SUBSIDIARIES
(UNAUDITED)
|
Six Months Ended
June 30, |
|||||||
|
2017
|
2016
|
||||||
|
OPERATING ACTIVITIES:
|
|||||||
|
Net loss
|
$
|
(5,706,903
|
)
|
$
|
(6,906,179
|
)
|
|
|
Adjustments to reconcile net loss to net cash used in operating activities:
|
|||||||
|
Depreciation, amortization and depletion
|
2,255,730
|
|
3,355,178
|
|
|||
|
Stock payments and stock-based compensation
|
—
|
|
336,964
|
|
|||
|
Accretion of reclamation liability
|
32,167
|
|
92,890
|
|
|||
|
Gain on sale of properties, plant, and equipment
|
(17,809
|
)
|
(583,462
|
)
|
|||
|
Amortization of debt discounts and issuance costs
|
208,148
|
|
182,471
|
|
|||
|
Payment of interest expense and sales tax with common stock
|
—
|
|
183,900
|
|
|||
|
Loss on payment of debt obligation with common stock
|
—
|
|
150,166
|
|
|||
|
Net loss on early retirement of long-term debt
|
126,997
|
|
—
|
|
|||
|
Changes in operating assets and liabilities:
|
|||||||
|
Accounts receivable
|
—
|
|
24,642
|
|
|||
|
Inventories
|
—
|
|
299,572
|
|
|||
|
Stockpiles and mineralized material on leach pads
|
—
|
|
978,668
|
|
|||
|
Prepaid expenses and other current assets
|
24,624
|
|
(1,051,816
|
)
|
|||
|
Accounts payable
|
(143,807
|
)
|
168,923
|
|
|||
|
Accrued expenses and other liabilities
|
(393,080
|
)
|
(416,569
|
)
|
|||
|
NET CASH USED IN OPERATING ACTIVITIES
|
(3,613,933
|
)
|
(3,184,652
|
)
|
|||
|
INVESTING ACTIVITIES:
|
|||||||
|
Proceeds from sale of properties, plant and equipment
|
17,809
|
|
1,858,511
|
|
|||
|
Purchase of mineral rights and properties, plant and equipment
|
(117,000
|
)
|
(258,075
|
)
|
|||
|
Decrease in reclamation bond deposit
|
—
|
|
20,260
|
|
|||
|
NET CASH (USED IN) PROVIDED BY INVESTING ACTIVITIES
|
(99,191
|
)
|
1,620,696
|
|
|||
|
FINANCING ACTIVITIES:
|
|||||||
|
Principal payments on long-term debt and capital lease obligations
|
(7,691,454
|
)
|
(3,654,240
|
)
|
|||
|
Proceeds from long-term debt obligations (net of issuance costs)
|
9,405,996
|
|
925,000
|
|
|||
|
Proceeds from the issuance of common stock
|
2,920,253
|
|
4,025,000
|
|
|||
|
Common stock issuance costs
|
(74,821
|
)
|
(571,250
|
)
|
|||
|
NET CASH PROVIDED BY FINANCING ACTIVITIES
|
4,559,974
|
|
724,510
|
|
|||
|
INCREASE (DECREASE) IN CASH AND CASH EQUIVALENTS
|
846,850
|
|
(839,446
|
)
|
|||
|
CASH AND CASH EQUIVALENTS, BEGINNING OF PERIOD
|
184,359
|
|
1,663,170
|
|
|||
|
CASH AND CASH EQUIVALENTS, END OF PERIOD
|
$
|
1,031,209
|
|
$
|
823,724
|
|
|
|
SUPPLEMENTAL CASH FLOW INFORMATION:
|
|||||||
|
Cash paid for interest
|
$
|
646,789
|
|
$
|
321,405
|
|
|
|
Supplemental disclosure of non-cash investing and financing activities:
|
|||||||
|
Payment for purchase of property, plant and equipment with prepaid deposits
|
$
|
1,158,785
|
|
$
|
—
|
|
|
|
Issuance of debt to purchase of property, plant and equipment
|
$
|
247,494
|
|
$
|
—
|
|
|
|
Settlement of long-term debt obligations with prepaid deposits
|
$
|
231,000
|
|
$
|
—
|
|
|
|
Issuance of common stock for settlement of long-term debt obligations
|
$
|
124,920
|
|
$
|
4,140,029
|
|
|
|
Property transferred in satisfaction of accounts payable
|
$
|
—
|
|
$
|
1,100,000
|
|
|
|
Issuance of common stock to purchase properties, plant and equipment
|
$
|
274,400
|
|
$
|
—
|
|
|
|
Debt issuance costs in accounts payable
|
$
|
26,550
|
|
$
|
—
|
|
|
See notes to condensed consolidated financial statements.
6
COMSTOCK MINING INC. AND SUBSIDIARIES
NOTES TO CONDENSED CONSOLIDATED FINANCIAL STATEMENTS
FOR THE PERIOD ENDED
JUNE 30, 2017
(UNAUDITED)
1. Interim Financial Statements
Basis of Presentation
The interim condensed consolidated financial statements of Comstock Mining Inc. and subsidiaries (“Comstock”, the “Company”, “we”, “our” or “us”) have been prepared in accordance with generally accepted accounting principles for interim financial information and with the instructions to Form 10-Q and Article 10 of Regulation S-X. Accordingly, they do not include all of the information and footnotes required by generally accepted accounting principles for complete financial statements. In our opinion, all adjustments (consisting of normal recurring adjustments) considered necessary for a fair presentation have been included. Operating results for the
three and six
-month periods ended
June 30, 2017
, are not necessarily indicative of the results that may be expected for the year ending
December 31, 2017
. For further information, refer to the financial statements and footnotes thereto in our Annual Report on Form 10-K for the fiscal year ended
December 31, 2016
.
Liquidity and Management Plans
The accompanying unaudited condensed consolidated financial statements have been prepared in conformity with accounting principles generally accepted in the United States of America which contemplate continuation of the Company as a going concern.
The Company commenced production with the Lucerne Mine in 2012, and ramped up to approximately
20,000
gold-equivalent-ounces of annual production. The Company completed leaching from its existing leach pads in December 2016, and is currently planning the exploration and development of its next two mines, first with its second surface mine in the Dayton and then further developing the second phase of development and production from the Lucerne Mine.
The Company has recurring net losses from operations and an accumulated deficit of
$217.7 million
at
June 30, 2017
. For the
six
-month period ended
June 30, 2017
, the Company incurred a net loss of
$5.7 million
and used
$3.6 million
of cash in operations. As of
June 30, 2017
, the Company had cash and cash equivalents of
$1.0 million
, current assets of
$7.3 million
and current liabilities of
$2.2 million
, resulting in current working capital of
$5.1 million
.
The Company’s current capital resources include cash and cash equivalents and other working capital resources, along with a loan commitment agreement with
$7.5 million
in unused capacity. The Company also has an at-the-market ("ATM") equity offering program with International Assets Advisory LLC ("IAA"), and an equity purchase agreement (the "Purchase Agreement") with Leviston Resources, LLC ("Leviston"), with aggregate unused capacity of
$9.0 million
. These capital resources are in addition to certain planned non-mining asset sales.
In March 2017, (and amended in June 2017) the Company entered into a loan commitment agreement that provides up to
$7.5 million
in borrowing capacity and expires in 2021 with an
11%
interest rate. Principal amounts borrowed under this agreement are not due until 2021. Until January 1, 2019, interest on any borrowings will be payable in cash and/or in the form of additional indebtedness under the agreement, at the Company’s option.
No
amounts have been borrowed under this agreement and the Company has
$7.0 million
(after consideration of fees due at the time of borrowing) of available borrowing capacity as of June 30, 2017.
As of June 30, 2017, the Company has issued shares under the ATM offering program with IAA and received cash proceeds of
$1.5 million
. The Company had
$3.5 million
available to be used under the ATM Agreement with IAA, as of June 30, 2017.
In April 2017, the Company entered into the “Purchase Agreement” with Leviston for the purchase of up to
$7.25 million
of shares of the Company's common stock from time to time, at the Company’s option, limited to
$750,000
per month, subject to certain volume and pricing restrictions. As of June 30, 2017, the Company has issued shares to Leviston and received cash proceeds of
$1.7 million
. The Company had
$5.5 million
available to be used under the Purchase Agreement as of June 30, 2017.
7
While the Company has been successful in the past in obtaining the necessary capital to support its operations, including registered equity financings from its existing shelf registration statement, borrowings, or other means, there is no assurance that the Company will be able to obtain additional equity capital or other financing, if needed. However, the Company believes it will have sufficient funds to sustain its operations during the next 12 months from the date the financial statements were issued as a result of the sources of funding detailed above.
Future operating expenditures above management’s expectations, including exploration and mine development expenditures in excess of amounts to be raised from the issuance of equity under the ATM Agreement and Purchase Agreement or in excess of the
$5.0 million
of services in exchange for stock under the agreement with American Mining and Tunneling, declines in the market value of properties held for sale, or declines in the share price of the Company's common stock would adversely affect the Company’s results of operations, financial condition and cash flows. If the Company was unable to obtain any necessary additional funds, this could have an immediate material adverse effect on liquidity and could raise substantial doubt about the Company’s ability to continue as a going concern. In such case, the Company could be required to limit or discontinue certain business plans, activities or operations, reduce or delay certain capital expenditures or sell certain assets or businesses. There can be no assurance that the Company would be able to take any such actions on favorable terms, in a timely manner or at all.
Use of Estimates
In preparing financial statements in conformity with generally accepted accounting principles, we are required to make estimates and assumptions that affect the reported amounts of assets and liabilities and the disclosure of contingent assets and liabilities at the date of the financial statements and revenues and expenditures during the reported periods. Actual results could differ materially from those estimates. Estimates may include those pertaining to valuation of plant and equipment, assets held for sale, mineral rights, deferred tax assets, derivative assets and liabilities, reclamation liabilities, stock-based compensation and payments, and contingent liabilities.
Comprehensive Loss
The only component of comprehensive loss for the
three and six
months ended
June 30, 2017
and
2016
, was our net loss.
Income Taxes
We recognize deferred tax assets and liabilities based on differences between the consolidated financial statement carrying amounts and tax basis of certain recorded assets and liabilities and for tax loss carryforwards. Realization of deferred tax assets is dependent upon our ability to generate sufficient future taxable earnings. Where it is more likely than not that the deferred tax asset will not be realized, we have provided a full valuation allowance. The Company has provided a full valuation allowance at
June 30, 2017
and
December 31, 2016
, for its net deferred tax assets as it cannot conclude it is more likely than not that they will be realized.
Recently Issued Accounting Pronouncements
In January 2017, the Financial Accounting Standards Board ("FASB") issued Accounting Standards Update ("ASU") No. 2017-01 - Business Combinations (Topic 805), which clarifies the definition of a business. For accounting and financial reporting purposes, businesses are generally comprised of three elements; inputs, processes, and outputs. Integrated sets of assets and activities capable of providing these three elements may not always be considered a business, and the lack of one of the three elements does not always disqualify the set from being a business. The issuance of ASU No. 2017-01 provides a clarifying screen to determine when a set of assets and activities is not a business. Primarily, the screen requires that when substantially all of the fair value of the gross assets acquired is concentrated in a single identifiable asset or group of similar identifiable assets, the set is not a business. The amendments contained in ASU No. 2017-01 are effective for annual periods beginning after December 15, 2017 and may be early adopted for certain transactions that have occurred before the effective date, but only when the underlying transaction has not been reported in the financial statements that have been issued or made available for issuance. The Company does not believe the implementation of ASU 2017-01 will have a material effect on its financial position, operational results, or cash flows.
In August 2016, the FASB issued ASU 2016-15, Classification of Certain Cash Receipts and Cash Payments (“ASU 2016-15”), which amends ASC 230, Statement of Cash Flows, and the FASB’s standards for reporting cash flows in general-purpose financial statements. The amendments address the diversity in practice related to the classification of certain cash receipts and payments including debt prepayment or debt extinguishment costs. ASU 2016-15 is effective for fiscal years beginning after December 15, 2017, including interim periods within those fiscal years, and early adoption is permitted.
8
The Company is currently evaluating the impact of the adoption of this guidance on the Company’s consolidated financial statements.
In February 2016, the FASB issued ASU 2016-02, Leases (Topic 842), to increase transparency and comparability among organizations by recognizing lease assets and lease liabilities on the balance sheet and disclosing key information about leasing arrangements. Topic 842 affects any entity that enters into a lease, with some specified scope exceptions. For public business entities, the amendments in this update are effective for financial statements issued for annual periods beginning after December 15, 2018, and interim periods within those annual periods. Early application is permitted for all entities. The Company is currently evaluating the impact of adopting this standard on its consolidated financial statements, which will require right of use assets and lease liabilities be recorded in the consolidated balance sheet for operating leases.
In May 2014, the FASB issued ASU 2014-09 (Topic 606) that introduces a new five-step revenue recognition model that an entity should use to recognize revenue when depicting the transfer of promised goods or services to customers in an amount that reflects the consideration that the entity expects to be entitled in exchange for those goods or services. This ASU also requires disclosures sufficient to enable users to understand the nature, amount, timing, and uncertainty of revenue and cash flows arising from contracts with customers, including qualitative and quantitative disclosures about contracts with customers, significant judgments and changes in judgments, and assets recognized from the costs to obtain or fulfill a contract. On July 9, 2015, the FASB deferred the effective date to fiscal years beginning after December 15, 2017, and for interim periods within those fiscal years.
We are in the process of comparing our current revenue recognition policies to the requirements of Topic 606 for each of our revenue categories. While we have not identified material differences in the amount and timing of revenue recognition for the categories we have reviewed to date, our evaluation is not complete and we have not concluded on the overall impacts of adopting Topic 606. We anticipate utilizing the modified retrospective method to adopt the provisions of this standard effective January 1, 2018, which requires us to apply the new revenue standard to (i) all new revenue contracts entered into after January 1, 2018 and (ii) all existing revenue contracts as of January 1, 2018 through a cumulative adjustment to equity. In accordance with this approach, our consolidated revenues for the periods prior to January 1, 2018 will not be revised.
2. Prepaid Expenses and Other Current Assets
Prepaid expenses and other current assets consisted of the following:
|
|
June 30, 2017
|
December 31, 2016
|
|||||
|
Land and property deposits
|
$
|
—
|
|
$
|
1,208,785
|
|
|
|
Lease obligation deposits
|
—
|
|
355,920
|
|
|||
|
Other
|
346,463
|
|
321,087
|
|
|||
|
Total prepaid expenses and other current assets
|
$
|
346,463
|
|
$
|
1,885,792
|
|
|
3. Properties, Plant and Equipment
The Company closed on the purchase of a property at a price of approximately
$1.7 million
during the
six
months ended
June 30, 2017
. The property includes land and buildings next to the Company's current processing facility. The purchase of the property was funded through use of deposits made in prior years, issuance of shares of the Company's common stock, and issuance of debt.
During the three and
six
-month periods ended
June 30, 2017
, the Company recognized depreciation expense of
$1.1 million
and
$2.1 million
, respectively. During the three and six months ended June 30, 2016, the Company recognized depreciation expense of
$1.5 million
and
$2.9 million
, respectively.
Assets Held For Sale
The Company committed to a plan to sell certain land and buildings. As of
June 30, 2017
, the Company had assets with a net book value of
$5.9 million
that met the criteria to be classified as assets held for sale.
9
4. Long-Term Reclamation Liability and Retirement Obligation Asset
Following is a reconciliation of the aggregate reclamation liability associated with our reclamation plan for our mining projects:
|
Six Months
Ended
|
Twelve Months
Ended
|
||||||
|
June 30, 2017
|
December 31, 2016
|
||||||
|
Long-term reclamation liability — beginning of period
|
$
|
7,353,346
|
|
$
|
6,827,568
|
|
|
|
Additional obligations incurred
|
—
|
|
340,000
|
|
|||
|
Accretion of reclamation liability
|
32,167
|
|
185,778
|
|
|||
|
Long-term reclamation liability — end of period
|
$
|
7,385,513
|
|
$
|
7,353,346
|
|
|
Following is a reconciliation of the aggregate retirement obligation asset associated with our reclamation plan for our mining projects:
|
Six Months
Ended
|
Twelve Months
Ended
|
||||||
|
June 30, 2017
|
December 31, 2016
|
||||||
|
Retirement obligation asset — beginning of period
|
$
|
617,126
|
|
$
|
1,107,120
|
|
|
|
Additional obligations incurred
|
—
|
|
340,000
|
|
|||
|
Amortization of retirement obligation asset
|
(167,190
|
)
|
(829,994
|
)
|
|||
|
Retirement obligation asset — end of period
|
$
|
449,936
|
|
$
|
617,126
|
|
|
5. Accrued Expenses
Accrued expenses consisted of the following:
|
|
June 30, 2017
|
December 31, 2016
|
|||||
|
Accrued Northern Comstock Joint Venture
|
$
|
407,083
|
|
$
|
480,833
|
|
|
|
Accrued Board of Directors fees
|
84,000
|
|
290,600
|
|
|||
|
Accrued payroll costs
|
46,266
|
|
60,735
|
|
|||
|
Accrued vendor liabilities
|
94,621
|
|
121,081
|
|
|||
|
Accrued production royalties
|
—
|
|
7,940
|
|
|||
|
Accrued personal property tax
|
113,791
|
|
56,895
|
|
|||
|
Other accrued expenses
|
278,137
|
|
117,850
|
|
|||
|
Total accrued expenses
|
$
|
1,023,898
|
|
$
|
1,135,934
|
|
|
10
Long-term debt consisted of the following:
|
Note Description
|
June 30, 2017
|
December 31, 2016
|
|||||
|
Debenture - (net of discount and deferred issuance costs of $887,913)
|
$
|
9,835,088
|
|
$
|
—
|
|
|
|
Note Payable (Caterpillar Equipment)
|
1,382,626
|
|
1,540,629
|
|
|||
|
Note Payable - (Lynch House)
|
186,000
|
|
186,000
|
|
|||
|
Note Payable (Silver Springs Property)
|
—
|
|
3,310,851
|
|
|||
|
Finance Obligation (Varilease)
|
—
|
|
1,964,882
|
|
|||
|
Note Payable (Daney)
|
—
|
|
868,398
|
|
|||
|
Note Payable (Donovan Property)
|
—
|
|
300,733
|
|
|||
|
Note Payable (V&T)
|
—
|
|
298,955
|
|
|||
|
Note Payable (White House)
|
—
|
|
275,433
|
|
|||
|
Note Payable (Gold Hill Hotel)
|
—
|
|
239,216
|
|
|||
|
Note Payable (Dayton Property "Golden Goose")
|
—
|
|
207,562
|
|
|||
|
Notes Payable - Other
|
—
|
|
277,636
|
|
|||
|
Subtotal
|
11,403,714
|
|
9,470,295
|
|
|||
|
Less current portion
|
(469,360
|
)
|
(483,669
|
)
|
|||
|
Long-term portion of long-term debt
|
$
|
10,934,354
|
|
$
|
8,986,626
|
|
|
Long-Term Debt Obligations
GF Comstock 2 LP
On January 13, 2017, the Company issued an
11%
Senior Secured Debenture (the "Debenture") due 2021 in an aggregate principal amount of
$10,723,000
. The use of proceeds included refinancing substantially all of the Company’s current obligations, except the amount due to Caterpillar Finance and the Lynch House note. This included paying off the Silver Springs property, Varilease and others. The Debenture was issued at a discount of approximately
$568,000
and the Company incurred issuance costs of approximately
$528,000
of which
$26,550
was not paid as of June 30, 2017, and included in accounts payable in the accompanying condensed consolidated balance sheet. The Debenture requires a Make Whole Payment totaling approximately
$688,000
if paid any time prior to or at maturity. Total principal is due on January 13, 2021. The Debenture requires acceleration of payment of accrued interest, principal, and the Make Whole Amount from all net proceeds received upon sale of any assets of the Company.
Interest is payable semi-annually. For the first
two years
, interest will be payable, at the option of the Company, either in cash or in the form of additional Debentures (or a combination thereof). For the third and fourth years interest will be payable only in cash. The Company paid the interest payment for the first six months, in cash, on June 23, 2017.
The Debenture is collateralized by (1) a pledge to
100%
of the equity of the subsidiaries of Comstock Mining Inc., and (2) substantially all of the assets of the Company.
Hard Rock Nevada Inc., and an employee owned entity, and another related party who is a significant shareholder of the Company, participated in this financing.
Loan Commitment
In March 2017 (and amended in June 2017), the Company entered into a loan commitment agreement that provides up to
$7.5 million
in borrowing capacity and expires in 2021 with an
11%
interest rate. Principal amounts borrowed under this agreement are not due until 2021. Until January 1, 2019, interest on any borrowings will be payable in cash and/or in the form of additional indebtedness under the agreement, at the Company’s option.
No
amounts have been borrowed under this agreement and the Company has
$7.0 million
(after consideration of fees due at the time of borrowing) of available borrowing capacity as of
June 30, 2017
.
11
7. Stockholders’ Equity
At-the-Market Offering Program
Effective June 28, 2016, the Company entered into a sales agreement with IAA with respect to an ATM agreement pursuant to which the Company may offer and sell, from time to time at its sole discretion, shares of its common stock, having an aggregate offering price of up to
$5 million
. Effective April 2017, the Company also entered into the Purchase agreement with Leviston for the purchase of up to
$7.25 million
of shares of the Company's common stock from time to time, at the Company's option. The Company is not obligated to make any sales of shares under either the ATM or Purchase agreement, and if it elects to make any sales, the Company can set a minimum sales price for the shares. Following is a reconciliation of the transactions under the ATM and Purchase agreement for the six and twelve month periods ended
June 30, 2017
and
December 31, 2016
respectively:
|
Six Months
Ended
|
Twelve Months
Ended
|
||||||
|
June 30, 2017
|
December 31, 2016
|
||||||
|
Number of shares sold
|
17,238,743
|
|
1,835,300
|
|
|||
|
Gross proceeds
|
$
|
2,670,253
|
|
$
|
522,889
|
|
|
|
Fees
|
$
|
74,821
|
|
$
|
14,090
|
|
|
|
Net proceeds
|
$
|
2,595,432
|
|
$
|
508,799
|
|
|
|
Average price per share
|
$
|
0.155
|
|
$
|
0.280
|
|
|
Excluded from gross proceeds for the six month ended June 30, 2017 above is
$250 thousand
of cash proceeds received on June 29, 2017, for which the corresponding
1,492,626
shares was not issued to the buyer until after June 30, 2017. The
$250 thousand
of cash proceeds are included in the Condensed Consolidated Statement of Cash Flows for the six month ended June 30, 2017 as proceeds from the issuance of common stock.
During the year ended December 31, 2016, the Company closed escrow on the purchases of land and property. The purchases included the issuance of
980,000
shares of common stock with a fair value of
$274,400
.
12
8. Net Loss Per Common Share
Basic earnings per share are computed by dividing net loss available to common stockholders by the weighted average number of shares of common stock outstanding during the period. Diluted loss per share reflects the potential dilution that could occur if stock options and convertible securities were exercised or converted into common stock.
The following is a reconciliation of the numerator and denominator used in the basic and diluted computation of net loss per share:
|
Three Months Ended
June 30, |
Six Months Ended
June 30, |
||||||||||||||
|
2017
|
2016
|
2017
|
2016
|
||||||||||||
|
Numerator:
|
|||||||||||||||
|
Net loss
|
$
|
(2,932,722
|
)
|
$
|
(2,854,784
|
)
|
$
|
(5,706,903
|
)
|
$
|
(6,906,179
|
)
|
|||
|
Denominator:
|
|||||||||||||||
|
Basic and diluted weighted average shares outstanding
|
193,074,699
|
|
176,373,416
|
|
189,714,279
|
|
170,075,960
|
|
|||||||
|
Net loss per common share:
|
|||||||||||||||
|
Basic
|
$
|
(0.02
|
)
|
$
|
(0.02
|
)
|
$
|
(0.03
|
)
|
$
|
(0.04
|
)
|
|||
|
Diluted
|
$
|
(0.02
|
)
|
$
|
(0.02
|
)
|
$
|
(0.03
|
)
|
$
|
(0.04
|
)
|
|||
The following table includes the number of common stock equivalent shares that are not included in the computation of diluted loss per share, because certain performance conditions have not been achieved.
|
|
Three Months Ended
June 30, |
Six Months Ended
June 30, |
|||||||||
|
|
2017
|
2016
|
2017
|
2016
|
|||||||
|
Stock options and warrants
|
50,000
|
|
50,000
|
|
50,000
|
|
50,000
|
|
|||
|
Restricted stock
|
—
|
|
1,662,000
|
|
—
|
|
1,662,000
|
|
|||
|
|
50,000
|
|
1,712,000
|
|
50,000
|
|
1,712,000
|
|
|||
13
9. Commitments and Contingencies
The Company has minimum royalty obligations with certain of its mineral properties and leases. For most of the mineral properties and leases, the Company is subject to a range of royalty obligations once production commences. These royalties range from
0.5%
to
5%
of net smelter revenues (NSR) from minerals produced on the properties, with the majority being under
3%
. Some of the factors that will influence the amount of the royalties include ounces extracted and the price of gold.
The Company’s mining and exploration activities are subject to various laws and regulations governing the protection of the environment. These laws and regulations are continually changing and are generally becoming more restrictive. The Company believes its operations are in compliance with applicable laws and regulations in all material respects. The Company has made, and expects to make in the future, expenditures to comply with such laws and regulations, but cannot predict the full amount of such future expenditures.
On January 31, 2014, the Comstock Residents Association (the “CRA”) and two of its members filed a civil action in the Third Judicial District Court of the State of Nevada in and for Lyon County (the “District Court”) against the Lyon County Board of Commissioners (the “Commissioners”) and the Company, asking the Court to reverse the Commissioners’ decision to grant an application for master plan amendment and zone change submitted and approved by the Commissioners on January 2, 2014 (the “Application”). In April 2015, the District Court ruled in favor the Company and the Commissioners and on December 2, 2016, the Nevada Supreme Court entered an order positively affirming all three of the District Court's decisions associated with 1) the Commissioners' discretion and authority for changing master plans and zoning, 2) their compliance with Nevada's Open Meeting Law and 3) their compliance with Nevada statutory provisions. Specifically, the Supreme Court affirmed the District Court's conclusions that Lyon County did not violate Nevada’s Open Meeting Law and that the County did not violate statutory provisions regarding master plans.
The Supreme Court did reverse the District Court’s dismissal of CRA’s claim of a due process violation, concluding that this claim should not have been summarily dismissed and that further proceedings are necessary in the District Court on this single claim. We are encouraged by the Supreme Court’s decision and together with the Lyon County District Attorney, on March 31, 2017, we filed a motion in the District Court seeking summary judgment on the sole remaining issue. This remaining issue has now been fully briefed and submitted to the District Court in Lyon County for decision.
From time to time, we are involved in lawsuits, claims, investigations and proceedings that arise in the ordinary course of business. There are no matters pending that we expect to have a material adverse impact on our business, results of operations, financial condition or cash flows.
14
10. Segment Reporting
Our management organizes the Company into
two
operating segments: mining and real estate. Our mining segment consists of all activities and expenditures associated with mining. Our real estate segment consists of land, real estate rental properties and the Gold Hill Hotel. We evaluate the performance of our operating segments based on operating income (loss). All intercompany transactions have been eliminated, and inter-segment revenues are not significant. Financial information relating to our reportable operating segments and reconciliation to the consolidated totals is as follows:
|
Three Months Ended
June 30, |
Six Months Ended
June 30, |
||||||||||||||
|
2017
|
2016
|
2017
|
2016
|
||||||||||||
|
Revenue
|
|||||||||||||||
|
Mining
|
$
|
—
|
|
$
|
1,457,991
|
|
$
|
—
|
|
$
|
3,438,755
|
|
|||
|
Real estate
|
27,370
|
|
33,285
|
|
46,664
|
|
73,042
|
|
|||||||
|
Total revenue
|
27,370
|
|
1,491,276
|
|
46,664
|
|
3,511,797
|
|
|||||||
|
Cost and Expenses
|
|||||||||||||||
|
Mining
|
(2,556,234
|
)
|
(3,667,279
|
)
|
(5,003,054
|
)
|
(9,465,029
|
)
|
|||||||
|
Real estate
|
(22,813
|
)
|
(92,324
|
)
|
(39,946
|
)
|
(144,753
|
)
|
|||||||
|
Total cost and expenses
|
(2,579,047
|
)
|
(3,759,603
|
)
|
(5,043,000
|
)
|
(9,609,782
|
)
|
|||||||
|
Operating Income (Loss)
|
|||||||||||||||
|
Mining
|
(2,556,234
|
)
|
(2,209,288
|
)
|
(5,003,054
|
)
|
(6,026,274
|
)
|
|||||||
|
Real estate
|
4,557
|
|
(59,039
|
)
|
6,718
|
|
(71,711
|
)
|
|||||||
|
Total loss from operations
|
(2,551,677
|
)
|
(2,268,327
|
)
|
(4,996,336
|
)
|
(6,097,985
|
)
|
|||||||
|
Other income (expense), net
|
(381,045
|
)
|
(586,457
|
)
|
(710,567
|
)
|
(808,194
|
)
|
|||||||
|
Net loss
|
$
|
(2,932,722
|
)
|
$
|
(2,854,784
|
)
|
$
|
(5,706,903
|
)
|
$
|
(6,906,179
|
)
|
|||
|
Depreciation, Depletion and Amortization
|
|||||||||||||||
|
Mining
|
$
|
1,097,963
|
|
$
|
1,580,201
|
|
$
|
2,249,092
|
|
$
|
3,240,713
|
|
|||
|
Real estate
|
2,465
|
|
82,346
|
|
6,638
|
|
114,465
|
|
|||||||
|
Total depreciation, amortization and depletion
|
$
|
1,100,428
|
|
$
|
1,662,547
|
|
$
|
2,255,730
|
|
$
|
3,355,178
|
|
|||
|
Capital Expenditures
|
|||||||||||||||
|
Mining
|
$
|
117,000
|
|
$
|
156,815
|
|
$
|
1,797,679
|
|
$
|
334,840
|
|
|||
|
Real estate
|
—
|
|
2,261,263
|
|
—
|
|
2,261,263
|
|
|||||||
|
Total capital expenditures
|
$
|
117,000
|
|
$
|
2,418,078
|
|
$
|
1,797,679
|
|
$
|
2,596,103
|
|
|||
|
As of June 30,
|
As of December 31,
|
||||||
|
2017
|
2016
|
||||||
|
Assets
|
|||||||
|
Mining
|
$
|
26,697,135
|
|
$
|
27,829,802
|
|
|
|
Real estate
|
5,995,366
|
|
6,013,229
|
|
|||
|
Total assets
|
$
|
32,692,501
|
|
$
|
33,843,031
|
|
|
15
The following discussion provides information that we believe is relevant to an assessment and understanding of the consolidated results of operations and financial condition of the Company as of and for the
three and six
-month periods ended
June 30, 2017
. It should be read in conjunction with the condensed consolidated financial statements and accompanying notes also included in this Form 10-Q and our Annual Report on Form 10-K as of, and for the fiscal year ended
December 31, 2016
.
Overview
The Company is a Nevada-based, gold and silver mining exploration and development company with extensive, contiguous property in the historic Comstock and Silver City mining districts (collectively, the “Comstock District”). The Comstock District is located within the western portion of the Basin and Range Province of Nevada, between Reno and Carson City. The Company began acquiring properties and developing projects in the Comstock District in 2003. Since then, the Company has consolidated a substantial portion of the historic Comstock District, secured permits, built an infrastructure and brought exploration projects into production.
Because of the Comstock District’s historical significance, the geology is well known and has been extensively studied by us, our advisors and many independent researchers. We have expanded our understanding of the geology of the project area through vigorous surface mapping and drill hole logging. The volume of geologic data is immense, and thus far the reliability has been excellent, particularly in the various Lucerne Mine areas. We have amassed a large library of historic data and detailed surface mapping of Comstock District properties and continue to obtain historic information from private and public sources. We use such data in conjunction with information obtained from our current operations, to target geological prospective exploration areas and plan exploratory drilling programs, including expanded surface and underground drilling.
The Company continues evaluating and acquiring properties inside and outside the district expanding its footprint and exploring all of our existing and prospective opportunities for further exploration, development and mining. The near-term goal of our business plan is to maximize intrinsic stockholder value realized, per share, by continuing to acquire mineralized and potentially mineralized properties, exploring, developing and validating qualified resources and reserves (proven and probable) that enable the commercial development of our operations through extended, long-lived mine plans that are economically feasible and socially responsible. Our goal is to deliver up to $500 million of accretive share value (over $2 per share) by 2020, by acquiring, exploring and developing resources and reserves capable of sustaining production of more than 100,000 gold-equivalent ounces per annum. Our past efforts, especially in 2016, have positioned us for this success. The production targets include both the Lucerne and Dayton Mine plans, with both surface and underground development opportunities. We also have longer-term exploration plans for the remaining areas, which include the Spring Valley, Occidental, Northern Extension and Northern Targets areas.
The Company achieved initial production and held its first pour of gold and silver on September 29, 2012. The Company produced approximately
59,453
ounces of gold and
734,493
ounces of silver between 2012 and 2016. The Company achieved final recovery rates of 89% for gold and 60% for silver.
The Company’s headquarters, technical resources, mine operations and heap leach processing facility are located in Storey County, Nevada, at 1200 American Flat Road, approximately three miles south of Virginia City, Nevada and 30 miles southeast of Reno, Nevada. The Company now owns or controls approximately
8,611
acres of mining claims and parcels in the Comstock and Silver City Districts. The acreage is comprised of approximately
2,266
acres of patented claims (private lands) and surface parcels (private lands) and approximately
6,345
acres of unpatented mining claims, that the Bureau of Land Management (“BLM”) administers.'
16
Current Exploration Projects - District-wide
The Company's long-term plans contemplate the exploration and development of six major geological target areas across the District, which include: the Lucerne, Dayton, Spring Valley, Gold Hill Group (that is, both the Northern Extension and Northern Target areas) and the Occidental. These targets represent over 7 miles of mineralized strike length, with current and historic grades of gold and silver. Refer to Figure 1.

Figure 1 - General overview of priority surface and underground targets.
17
Dayton Resource Area and Spring Valley Targets
The Company plans to advance the Dayton Resource area to full feasibility, with a production ready mine plan within the next two years. The volcanic host rocks and structural controls of the mineralization defined, to date, for the Dayton Resource area are also projected south into the Spring Valley target area. Economic gold mineralization has been intercepted in several wide spaced drill holes conducted during numerous prior Spring Valley drilling programs. Over the past several months, the technical staff has identified multiple drill targets within several specific locations that encompass the Dayton Resource area and potentially extending for an additional 7,500 feet of mineralized strike length, into Spring Valley. The new targets are based on the Company's latest review of previous geophysical studies and current interpretation of the geology. The Dayton and Spring Valley southern expansion programs includes exploration and definition drilling of targets identified by the prior conventional percussion, RC and diamond core drill programs and magnetic, IP and resistivity geophysical surveys (Figure 2).

Figure 2 - Dayton -Spring Valley Magnetic Geophysics
18
Several historic mines operated in the Dayton area, leaving access to multiple structures from underground. Some historic adits have remained open or have been uncovered by the Company. The geologic and engineering team completed underground mapping, sampling, and surveying in a number of historic mine tunnels on and near the Dayton Resource area. Where accessible, the workings were inspected; geology mapped and mineralized material sampled. Once sampling was completed, the workings were surveyed to document the size of the mine workings, the location of the openings and location of the samples. The samples were then assayed at the Company’s in house metallurgical laboratory for gold and silver.
This underground sampling program has provided a wealth of assay information and provided critical information for furthering the geologic understanding of the Dayton area. In some cases structures identified on the surface were traced underground and in other cases new structures were identified underground where surface expressions were absent or obscured.
Ground magnetic geophysical surveys identified a linear anomalous corridor, defined by a series of relative magnetic lows. Altered volcanic host rocks have been intercepted by limited drilling and identified several mineralized zones. Selected drill hole intercepts are highlighted (see Figure 3). Additionally, a wide zone (up to 500 feet wide) beginning at the Dayton resource and continuing southerly, all the way down to the Daney mineralized patent can be traced by following the north/south trending vein swarms (see again, Figure 3). The veins depicted by distinct traces colored red. The increased occurrences and density of the combined structures has been indicative in the Dayton resource to host the higher grades and larger volumes of economic mineralization. This will be part of the exploration model and has generated a multiple drill target environment.
The Dayton exploration program is designed to target the projected trend of known mineralization southerly. The magnetic geophysical survey has been studied and a structural interpretation was developed that illustrates multiple cross cutting structures (colored green) that are oblique to the southerly projected vein trend (colored red). Though rare, due to alluvial cover, the outcropping quartz veins and outcropping crosscutting structures had definitive diagnostic magnetic signatures. The interpretation of the structures and veins were derived by connecting these specific magnetic attributes as identified on each 25 meter spaced survey line. Similar structures have been identified in the Dayton resource area and were found to be important components for the development of economic grades of mineralization. In the Dayton resource area, geologic observations made on the surface and in accessible underground workings have identified the north/south and the crosscutting structures to carry gold and silver values with different silver to gold ratios. Comparisons of selected sample geochemistry, the north/south veins commonly have a higher silver to gold ratio.
The Company also recently completed metallurgical column tests on mineralized material from the Dayton Resource Area that contribute to the advancement of a full feasibility assessment for the mine, updating prior metallurgical test work and the technical resource report published in January 2013. During the second quarter of 2017, the Company conducted column tests of both cyanide and non-cyanide solutions. They established four, full metallurgical column tests, two cyanide and two non-cyanide, running parallel, that supports and advances the feasibility study for establishing proven and probable reserves at the Dayton. The samples were crushed, agglomerated and loaded into four ten-foot columns for leach simulation. These simulations were conducted on-site, in the Company’s metallurgical labs, and are coordinated through Cycladex Inc., (“Cycladex”) a strategic investee, and funded by U.S. National Science Foundation grants.
The Cyanide columns yielded between 82-85% gold in just 25 days. The Company has already designed and established new column tests for the primary purpose of assessing the specific consumption of the new materials and material cost for processing. This is important for assessing ultimate economic feasibility of these solutions. These simulations will also be conducted on-site, in the Company’s metallurgical labs, and are still funded by U.S. National Science Foundation research grants. These updated metallurgical testing compliment extensive metallurgical testing for Dayton that were previously published in 2011.
19
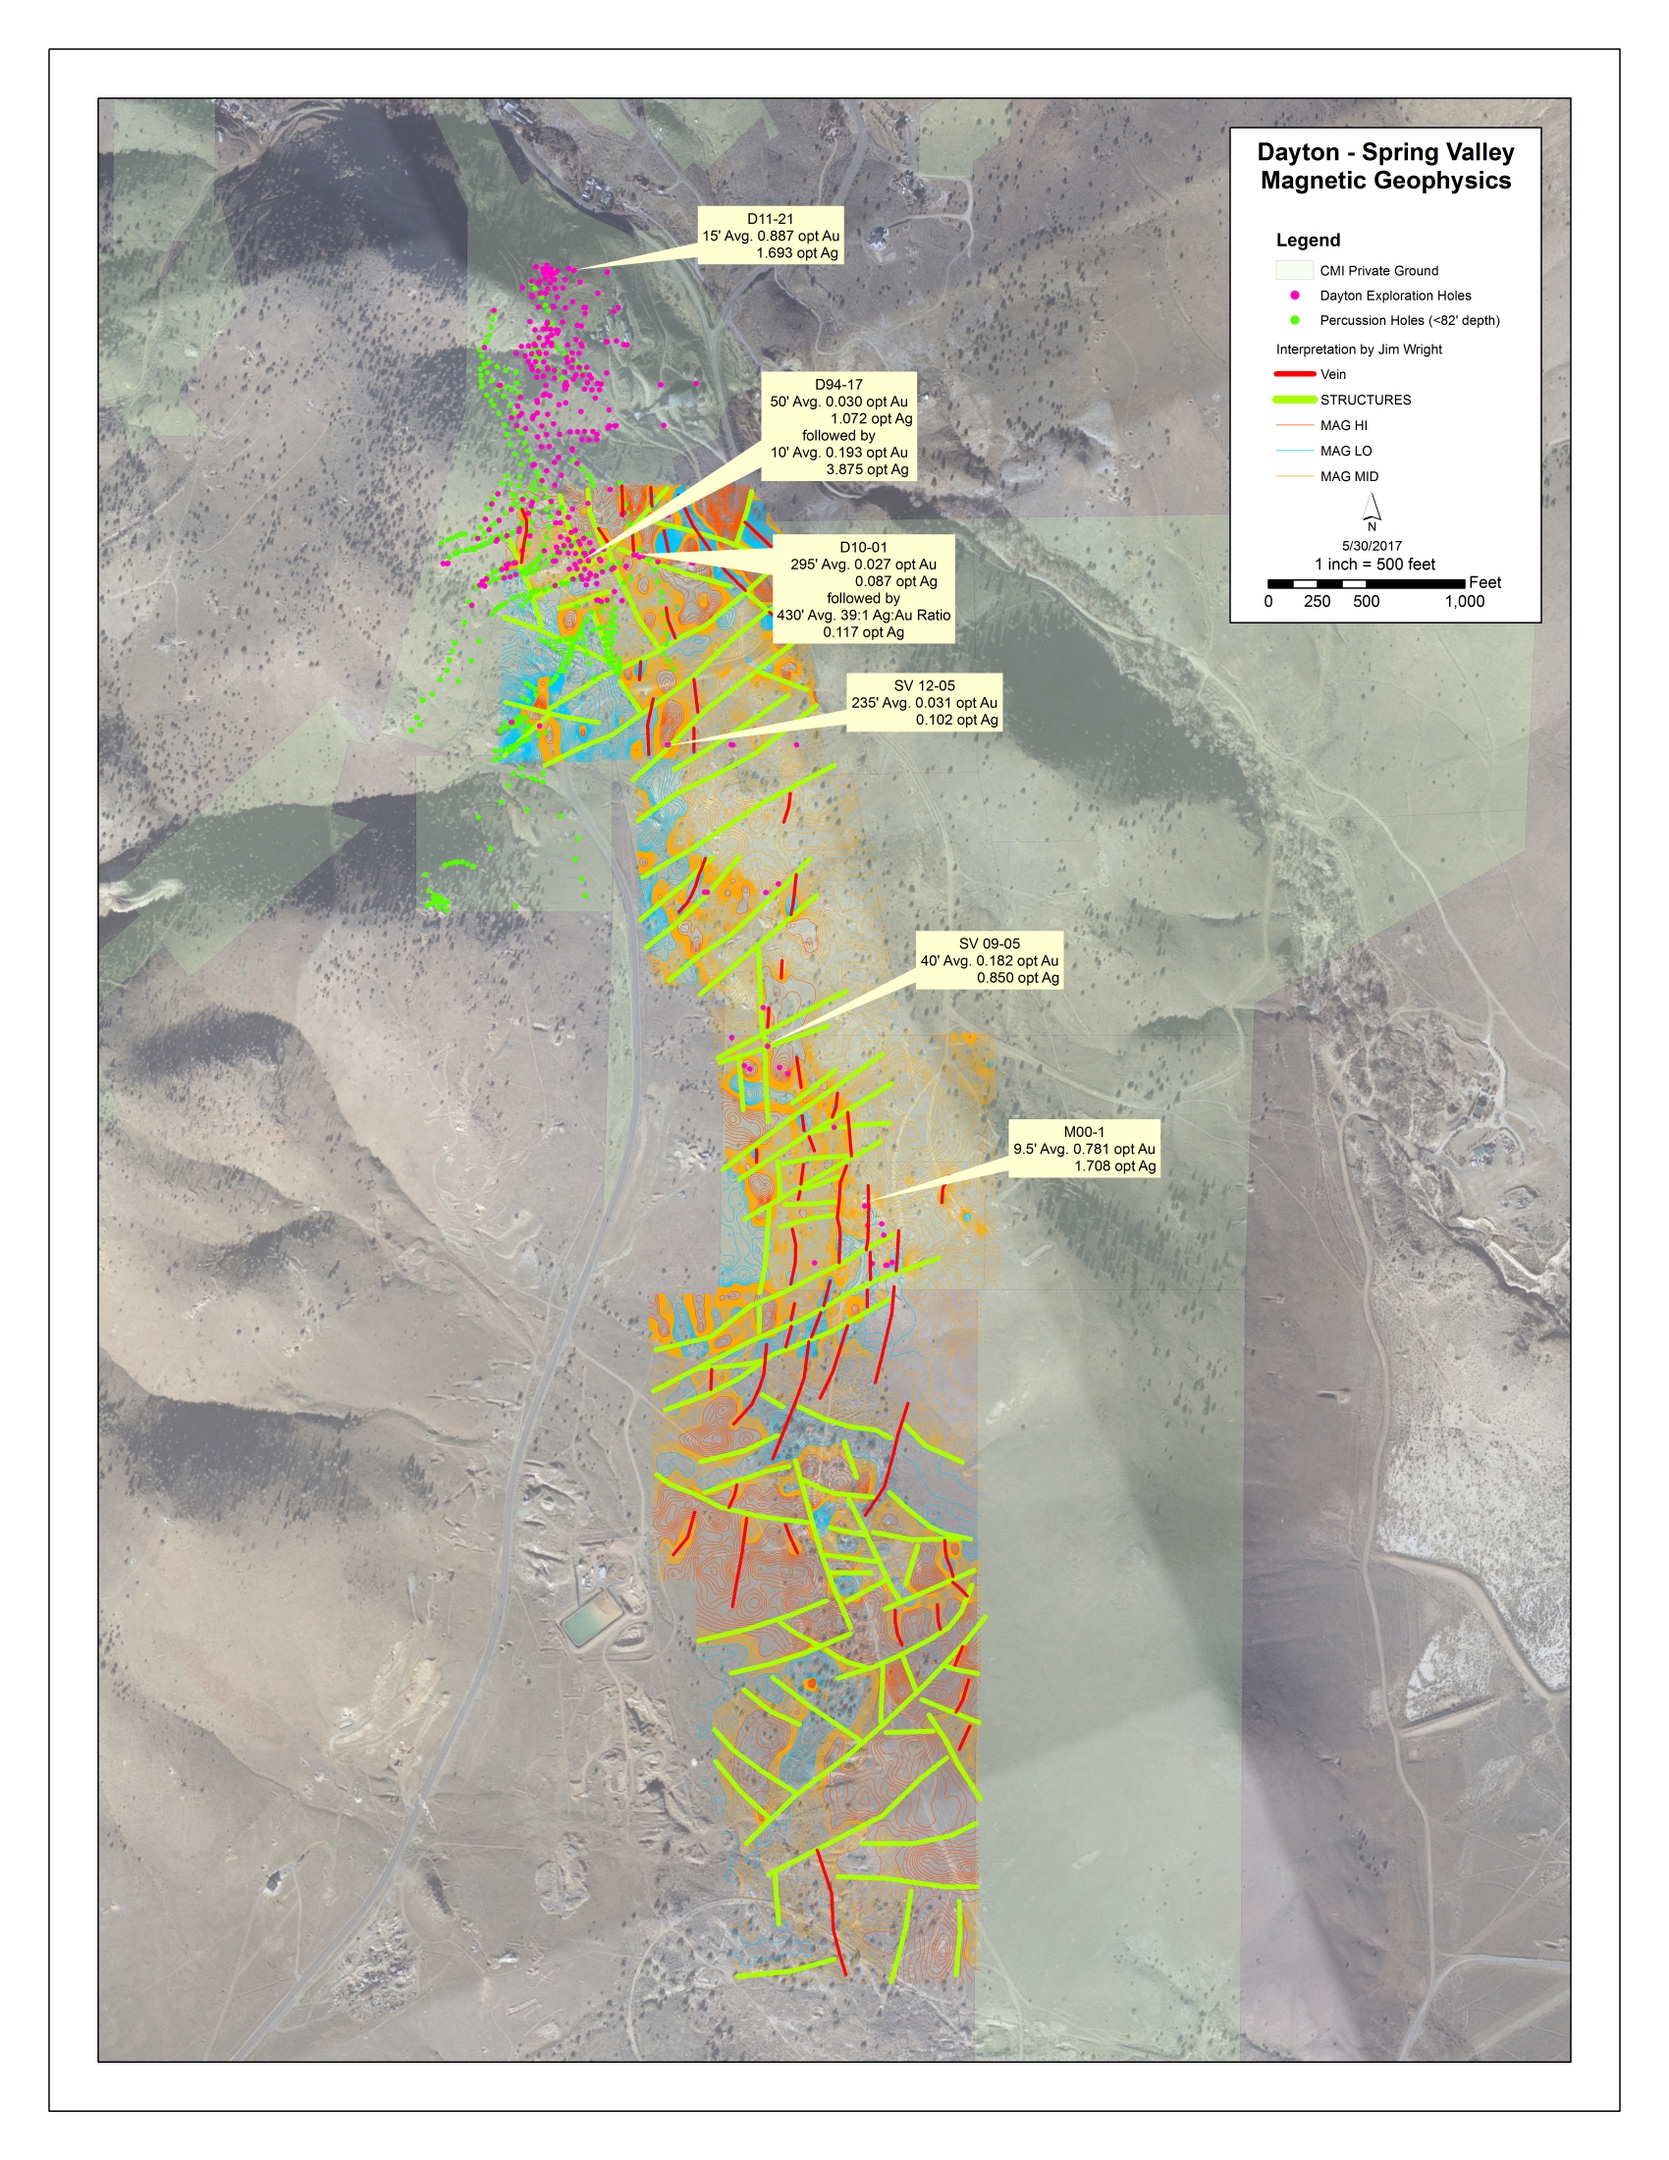
Figure 3 - Dayton and Spring Valley Magnetic Geophysics
20
In house Dayton engineering and mine planning have resulted in profiling various economic pit shells with multiple cutoff grade scenarios. Multiple layout plans for the mine and corresponding processing facilities have been conceptually developed and located on lands 100% privately held by the Company, thus simplifying and shortening the critical permitting chain. A definition drill plan is in place and is permitted. An expanded drill plan is currently being designed and detailed plans will be submitted to the regulatory agencies for permitting.
In addition to infrastructure and drill planning, we performed due diligence assisted by SRK Consulting. The due diligence resulted in confirmation of the scoping level mine plans and agreement on the conceptual processing layout.
The Company plans to conduct definition drilling and geo technical core programs within the Dayton Resource area, as previously described, and advance this area to full feasibility, with a production ready mine plan within the next two years

Figure 4 - Dayton and Spring Valley Target
21
Operating Costs
During the year ended
December 31, 2016
and continuing through the second quarter of 2017, the Company focused on reducing all costs, including mining, exploration and mine development, mine claims, environmental and reclamation as well as all general and administrative costs. The Company has aggressively implemented organizational changes consistent with the transition from mining the Lucerne surface mine to growing our resource portfolio and related exploration, and development activities toward production-ready mining projects. The Company has reduced operation costs in all categories and already is achieving the run rate of those costs for the second half of the year to be $3.5 million, or less than $290,000 per month. The Company is working on additional initiatives for further reducing those costs while fully maintaining our operating and permitted infrastructure, operating expenses for the full year 2017, mainly due to higher expenses associated with restructuring and refinancing activities that are now complete, are anticipated to be $4.5 million, excluding $4.4 million in depreciation and $1.3 million of interest expense. First half and second quarter costs, including real estate operating costs, mine claim and all general and administrative costs were lower, period on period, and are expected to decrease significantly over the last two quarters of 2017, given the relatively higher financing and administrative costs associated with our first quarter 2017 refinancing and also higher environmental costs associated with extreme precipitation during the first six months of 2017. These rain events constituted multiple severe events and required excess water management costs and equipment during the first two quarters, totaling $255,000 that we do not expect to recur. Accordingly, general and administrative costs and other non-mining costs, including mine claims and land costs, other real estate operating costs and environmental costs, have already declined.
Outlook
Our goal is to deliver up to $500 million of accretive share value (over $2 per share) by 2020, by acquiring, joint venturing, exploring and developing resources and reserves capable of sustaining production of more than 100,000 gold-equivalent ounces per annum. Our past efforts, especially during the past 18 months, have positioned us for this success. These production targets include both the Lucerne and Dayton Mine plans, with both surface and underground development opportunities.
Total operating expenses for the second half of 2017 are expected to be $2.1 million, with a sustainable, annual run rate of $3.6 million, including exploration and mine development, mine claims, environmental and reclamation, and general and administrative cost but excluding depreciation and amortization. Interest expense is expected to be approximately $1.3 million. The Company expects to continue operating with approximately 10 employees, including expert land, permitting, geology, engineering and metallurgical professionals.
The Company plans to sell non-mining related lands, buildings and water rights, for expected net cash proceeds of more than $14 million during the next twelve months resulting in net profit of more than $8 million. These proceeds will be free of income taxes and they will first be used to eliminate debt obligations due under the Debenture (including principal, accrued interest, and make whole amounts), and to fund certain exploration activities in Dayton, all while strengthening the financial position of the Company.
During the third quarter of 2017, the Company also plans on announcing mining and metallurgical joint ventures designed to enhance our land positions, accelerate our development activities and reduce our costs. The Company has also commenced and plans on continuing metallurgical testing on Dayton mineralized materials, using both cyanide and non- cyanide alternative solutions to experiment on achieving the highest, most cost efficient processing for the Dayton feasibility assessment. The Company will also commence Reverse Circulation (RC) drilling at the Dayton mine sufficient to finalize the parameters of a mine plan and commence the permitting for the Dayton mine. Infill drilling is expected to significantly expand the reserve potential for the Dayton mine plans. The Company has developed grade shells with higher average grades and believes the Dayton to have economically feasible potential and plans on developing those mine plans toward full feasibility during 2017, and production within the next two years. The Lucerne mine is fully permitted and requires additional drilling and development for advancing feasibility and establishing reserves.
The Company will report the results of the Lucerne and Dayton exploration and development programs as they become available.
22
Equity Raises
During the second quarter of 2017, the Company issued
17,238,743
shares of common stock through the Company’s at-the-market equity offering program and its equity purchase agreement. Gross proceeds from the issuance of shares totaled approximately
$2.6 million
at an average price per share of
$0.155
.
In July 2017, we issued approximately 6.4 million shares for proceeds of approximately $1.1 million, of which $250,000 was received in advance on June 29, 2017.
Comparative Financial Information
The Company had two operating segments as of
June 30, 2017
: mining and real estate.
The comparative financial information is reflected in the following table:
Three Months Ended:
|
June 30, 2017
|
June 30, 2016
|
Change
|
|||||||||
|
Revenue - mining
|
$
|
—
|
|
$
|
1,457,991
|
|
$
|
(1,457,991
|
)
|
||
|
Revenue - real estate
|
27,370
|
|
33,285
|
|
(5,915
|
)
|
|||||
|
|
|
||||||||||
|
Costs applicable to mining revenue
|
914,341
|
|
1,262,316
|
|
(347,975
|
)
|
|||||
|
Real estate operating costs
|
22,813
|
|
92,324
|
|
(69,511
|
)
|
|||||
|
Exploration and mine development
|
271,137
|
|
810,916
|
|
(539,779
|
)
|
|||||
|
Mine claims and costs
|
244,458
|
|
273,877
|
|
(29,419
|
)
|
|||||
|
Environmental and reclamation
|
169,264
|
|
357,238
|
|
(187,974
|
)
|
|||||
|
General and administrative
|
957,034
|
|
962,932
|
|
(5,898
|
)
|
|||||
|
Loss from operations
|
(2,551,677
|
)
|
(2,268,327
|
)
|
(283,350
|
)
|
|||||
|
OTHER INCOME (EXPENSE)
|
|||||||||||
|
Interest expense
|
$
|
(398,854
|
)
|
$
|
(216,358
|
)
|
$
|
(182,496
|
)
|
||
|
Other income (expense)
|
17,809
|
|
(370,099
|
)
|
387,908
|
|
|||||
|
NET LOSS
|
$
|
(2,932,722
|
)
|
$
|
(2,854,784
|
)
|
$
|
(77,938
|
)
|
||
The Company ceased processing material from its leach pad in December 2016, resulting in no mining revenues in the three months ended
June 30, 2017
.
Costs applicable to mining revenue were $0.9 million for the three months
June 30, 2017
, as compared to $1.3 million for the same period ended
June 30, 2016
, that also included $0.4 million of silver credits. The reduction of $0.4 million resulted from lower processing costs and the reduction of substantially all the mining and processing staff consistently with ceasing processing operations in December 2016. Costs for the three months ended
June 30, 2017
, consisted solely of depreciation expense on temporarily idled mining equipment, processing facilities, and heap leach pads.
Exploration and mine development costs decreased by approximately
$0.5 million
during the three months ended
June 30, 2017
, as compared to the same period ended
June 30, 2016
. During the second quarter of 2016, exploration and mine development costs included expenses related to underground exploration and geological assessments for the Lucerne mine development, which did not recur during the second quarter of 2017.
Environmental and reclamation costs decreased by $0.2 million during the three months ended
June 30, 2017
, as compared to the same period ended June 30, 2016, primarily due to the reduction in asset retirement obligation costs and payroll costs slightly offset by higher costs associated with excess weather and associated water management requirements. During the second quarter of 2017, the northern Nevada region where the Company operates experienced multiple severe precipitation events requiring approximately $105,000 in special evaporating, containing and monitoring activities associated with its water pollution control efforts.
23
General and administrative costs remained flat during the
second
quarter of
2017
, as compared to the same period ended
2016
, primarily due to lower payroll costs, in line with targeted cost reduction efforts, somewhat offset by higher diligence costs associated with preparation for and potential joint venture transactions and to a lesser extent, lobbying costs associated with the Nevada legislative session that occurs every two year.
Net loss remained at
$2.9 million
for the three months ended
June 30, 2017
, and
June 30, 2016
. This was primarily due to a $1.5 million decrease in revenue, net of a comparable decrease in all other expenses.
Six Months Ended:
|
June 30, 2017
|
June 30, 2016
|
Change
|
|||||||||
|
Revenue - mining
|
$
|
—
|
|
$
|
3,438,755
|
|
$
|
(3,438,755
|
)
|
||
|
Revenue - real estate
|
46,664
|
|
73,042
|
|
(26,378
|
)
|
|||||
|
Costs applicable to mining revenue
|
1,816,745
|
|
2,678,237
|
|
(861,492
|
)
|
|||||
|
Real estate operating costs
|
39,946
|
|
144,753
|
|
(104,807
|
)
|
|||||
|
Exploration and mine development
|
542,104
|
|
3,438,508
|
|
(2,896,404
|
)
|
|||||
|
Mine claims and costs
|
508,993
|
|
570,310
|
|
(61,317
|
)
|
|||||
|
Environmental and reclamation
|
517,315
|
|
729,934
|
|
(212,619
|
)
|
|||||
|
General and administrative
|
1,617,897
|
|
2,048,040
|
|
(430,143
|
)
|
|||||
|
Loss from operations
|
(4,996,336
|
)
|
(6,097,985
|
)
|
1,101,649
|
|
|||||
|
OTHER INCOME (EXPENSE)
|
|||||||||||
|
Interest expense
|
$
|
(854,936
|
)
|
$
|
(438,095
|
)
|
$
|
(416,841
|
)
|
||
|
Other income (expense)
|
144,369
|
|
(370,099
|
)
|
514,468
|
|
|||||
|
NET LOSS
|
$
|
(5,706,903
|
)
|
$
|
(6,906,179
|
)
|
$
|
1,199,276
|
|
||
The Company ceased processing material from its leach pad in December 2016, resulting in no mining revenues in the six months ended
June 30, 2017
.
Costs applicable to mining revenue were $1.8 million for the six months June 30, 2017, as compared to $2.7 million for the same period ended June 30, 2016. The reduction of $0.9 million resulted from lower processing costs and the reduction of substantially all the mining and processing staff consistent with ceasing processing operations in December 2016. Costs for the six months ended June 30, 2017 consisted solely of depreciation expense on temporarily idled mining equipment, processing facilities, and heap leach pads.
Exploration and mine development costs decreased by approximately $2.9 million during the
six
months ended
June 30, 2017
, as compared to the same period ended
June 30, 2016
. The decrease is a result of higher underground exploration and development costs during the first six months of 2016, including the completion of the crosscut drift from the main PQ drift to the Succor vein system and $1.4 million of depreciation expense associated with equipment used in that development.
General and administrative costs decreased by $0.4 million in the
six
months ended
June 30, 2017
, as compared to the same period of 2016. The decrease is a result of lower payroll and administrative cost reductions, in line with targeted cost reductions.
Net loss was $5.7 million for the
six
months ended
June 30, 2017
, as compared to a net loss of $6.9 million for the
six
months ended
June 30, 2016
. The $1.2 million decrease in net loss primarily resulted from a $3.4 million decrease in revenue, more than offset by a $4.6 million reduction of all other operating expenses, including lower costs in every other category.
24
Liquidity and Capital Resources
Total current assets were
$7.3 million
at
June 30, 2017
. Cash and cash equivalents on hand at
June 30, 2017
, totaled $
1.0 million
. At the beginning of the second quarter the Company entered into an equity purchase agreement with Leviston Resources LLC and filed a prospectus supplement to its existing shelf registration statement for the purchase of up to $3.25 million of the Company’s common stock from time to time, at the Company’s option.
The Company’s current capital resources include cash and cash equivalents and other working capital resources, certain planned, non-mining asset sales with expected net proceeds of over $14 million and existing financing arrangements, including an at-the-market offering program with International Assets Advisory LLC (“IAA”) described below and the Leviston program described above. While the Company has been successful in the past in obtaining the necessary capital to support its operations, including registered equity financings from its existing shelf registration, borrowings, or other means, there is no assurance that the Company will be able to obtain additional equity or other financing, if needed. The Company believes it will have sufficient funds to sustain operations during the next twelve months as a result of the sources of funding described above.
The proceeds from the Company's planned sales of non-mining related lands will eliminate debt obligations and strengthen the financial position of the Company. These actions should eliminate all or substantially all of the Company’s debt obligations in the next twelve months. There is no assurance that the Company will be able to sell such assets on favorable terms, or at all.
Net cash used in operating activities was
$3.6 million
for the
six
months ended
June 30, 2017
, as compared to net cash used in operating activities of
$3.2 million
for the
six
months ended
June 30, 2016
. The Company’s use of cash in operating activities in the first
six
months of
2017
was primarily driven by the Company’s expenditures from mine claims, exploration, environmental and general and administrative. The Company's use of cash in operating activities in the first six months of 2016 was primarily driven by the Company's expenditures related to underground exploration, including the Succor and PQ targets, somewhat offset by a source of cash from working capital, primarily from increases in accounts payable and decreases in inventory and accounts receivable.
Net cash provided by financing activities for the
six
months ended
June 30, 2017
, was
$4.6 million
, comprised of net proceeds of $
2.8 million
from the sale of securities and $9.5 million proceeds from long-term debt obligations
,
offset by the pay-down of long-term debt obligations of approximately
$7.7 million
. Net cash provided by financing activities for the six months ended
June 30, 2016
, was $0.7 million, comprised of net proceeds of $3.4 million from the sale of securities, $0.9 million from long-term debt obligations, offset by the pay-down of long-term debt obligations of approximately $3.6 million.
The accompanying unaudited condensed consolidated financial statements have been prepared in conformity with accounting principles generally accepted in the United States of America which contemplate continuation of the Company as a going concern.
The Company commenced production with the Lucerne Mine in 2012, and ramped up to approximately 20,000 gold-equivalent-ounces of annual production. The Company completed leaching from its existing leach pads in December 2016, and is currently planning the exploration and development of its next two mines, first with its second surface mine in the Dayton and then further developing the second phase of development and production from Lucerne Mine.
The Company has recurring net losses from operations and an accumulated deficit of
$217.7 million
at
June 30, 2017
. For the
six
-month period ended
June 30, 2017
, the Company incurred a net loss of
$5.7 million
and used
$3.6 million
of cash in operations. As of
June 30, 2017
, the Company had cash and cash equivalents of
$1.0 million
, current assets of
$7.3 million
and current liabilities of
$2.2 million
, resulting in current working capital of
$5.1 million
.
The Company's current capital resources include cash and cash equivalents and other working capital resources, along with a loan commitment agreement with $7.0 million in unused capacity. The Company also has an at-the-market ("ATM") equity offering program with International Assets Advisory LLC ("IAA"), and an equity purchase agreement (the "Purchase Agreement") with Leviston Resources, LLC ("Leviston"), with aggregate unused capacity of $9.0 million. These capital resources are in addition to certain, planned, non-mining asset sales.
25
In March 2017 (and amended in June 2017), the Company entered into a loan commitment agreement that provides up to $7.5 million in borrowing capacity and expires in 2021 with an 11% interest rate. Principal amounts borrowed under this agreement are not due until 2021. Until January 1, 2019, interest on any borrowings will be payable in cash and/or in the form of additional indebtedness under the agreement, at the Company’s option. No amounts have been borrowed under this agreement and the Company has $7.0 million (after consideration of fees due at the time of borrowing) of available borrowing capacity as of June 30, 2017.
As of June 30, 2017, the Company has issued shares under the ATM offering program with IAA and received cash proceeds of $1.5 million. The Company had $3.5 million available to be used under the ATM Agreement as of June 30, 2017.
In April 2017, the Company entered into an equity purchase agreement (the “Purchase Agreement”) with Leviston Resources LLC (“Leviston”) for the purchase of up to $7.25 million of shares of the Company's common stock and filed a prospectus supplement to its existing shelf registration statement for the purchase of up to
$3.25 million
of shares of the Company’s common stock from time to time, at the Company’s option, limited to $0.75 million per month, subject to certain volume and pricing restrictions. Program to date, through June 30 2017, the Company has issued shares to Leviston and received cash proceeds of $1.7 million. The Company had $5.5 million available to be used under the Purchase Agreement as of June 30, 2017.
While the Company has been successful in the past in obtaining the necessary capital to support its operations, including registered equity financings from its existing shelf registration statement, borrowings, or other means, there is no assurance that the Company will be able to obtain additional equity capital or other financing, if needed. However, the Company believes it will have sufficient funds to sustain its operations during the next 12 months from the date the financial statements were issued as a result of the sources of funding detailed above.
Future operating expenditures above management’s expectations, including exploration and mine development expenditures in excess of amounts to be raised from the issuance of equity under the ATM Agreement and Purchase Agreement or in excess of the $5.0 million of services in exchange for stock under the agreement with American Mining and Tunneling, declines in the market value of properties held for sale, or declines in the share price of the Company's common stock would adversely affect the Company’s results of operations, financial condition and cash flows. If the Company were unable to obtain any necessary additional funds, this could have an immediate material adverse effect on liquidity and could raise substantial doubt about the Company’s ability to continue as a going concern. In such case, the Company could be required to limit or discontinue certain business plans, activities or operations, reduce or delay certain capital expenditures or sell certain assets or businesses. There can be no assurance that the Company would be able to take any such actions on favorable terms, in a timely manner or at all.
Critical Accounting Policies and Estimates
There have not been any material changes to the critical accounting policies and estimates previously disclosed in our Annual Report on Form 10-K for the year ended
December 31, 2016
.
26
ITEM 3.
QUANTITATIVE AND QUALITATIVE DISCLOSURES ABOUT MARKET RISK
There have been no material changes in the market risks discussed in Item 7A of our Annual Report on Form 10-K.
A. Disclosure
Evaluation of Disclosure Controls and Procedures
As of the end of the period covered by this Quarterly Report on Form 10-Q, management performed, with the participation of our Principal Executive Officer and our Principal Financial Officer, an evaluation of the effectiveness of our disclosure controls and procedures as defined in Rules 13a-15(e) and 15d-15(e) of the Securities Exchange Act of 1934 (“Exchange Act”). Our disclosure controls and procedures are designed to ensure that information required to be disclosed in the reports we file or submit under the Exchange Act is recorded, processed, summarized and reported within the time periods specified in the Exchange Act and the SEC’s rules, and that such information is accumulated and communicated to our management, including our Principal Executive Officer and Principal Financial Officer, to allow timely decisions regarding required disclosures. There are inherent limitations to the effectiveness of any system of disclosure controls and procedures, including the possibility of human error and the circumvention or overriding of the controls and procedures. Accordingly, even effective disclosure controls and procedures can only provide reasonable assurance of achieving their control objectives. Each of our Principal Executive Officer and Principal Financial Officer concluded that, as of
June 30, 2017
, our disclosure controls and procedures were effective.
Design and Evaluation of Internal Control over Financial Reporting
Our management is responsible for establishing and maintaining adequate internal control over financial reporting as defined in Exchange Act Rules 13a-15(f) and 15d-15(f). Our management assessed the effectiveness of our internal control over financial reporting as of
June 30, 2017
. In making this assessment, management used the criteria for effective internal control over financial reporting described in the “Internal Control-Integrated Framework” (2013) set forth by the Committee of Sponsoring Organizations of the Treadway Commission (COSO). Based on the assessment, management concluded that, as of
June 30, 2017
, our internal control over financial reporting was effective based on those criteria.
B. Internal Control over Financial Reporting
No change in our internal control over financial reporting, as such term is defined in Exchange Act Rule 13(a)-15, occurred during the fiscal quarter ended
June 30, 2017
, that materially affected or is reasonably likely to materially affect our internal control over financial reporting.
27
Item 1.
Legal Proceedings.
On January 31, 2014, the Comstock Residents Association (the “CRA”) and two of its members filed a civil action in the Third Judicial District Court of the State of Nevada in and for Lyon County (the “District Court”) against the Lyon County Board of Commissioners (the “Commissioners”) and the Company, asking the Court to reverse the Commissioners’ decision to grant an application for master plan amendment and zone change submitted and approved by the Commissioners on January 2, 2014 (the “Application”). In April 2015, the District Court ruled in favor the Company and the Commissioners and on December 2, 2016, the Nevada Supreme Court entered an order positively affirming all three of the District Court's decisions associated with 1) the Commissioners' discretion and authority for changing master plans and zoning, 2) their compliance with Nevada's Open Meeting Law and 3) their compliance with Nevada statutory provisions. Specifically, the Supreme Court affirmed the District Court's conclusions that Lyon County did not violate Nevada’s Open Meeting Law and that the County did not violate statutory provisions regarding master plans.
The Supreme Court did reverse the District Court’s dismissal of CRA’s claim of a due process violation, concluding that this claim should not have been summarily dismissed and that further proceedings are necessary in the District Court on this single claim. We are encouraged by the Supreme Court’s decision and together with the Lyon County District Attorney we, on March 31, 2017, filed a motion in the District Court seeking summary judgment on the sole remaining issue. This remaining issue has now been fully briefed and submitted to the District Court in Lyon County for decision.
From time to time, we are involved in lawsuits, claims, investigations and proceedings that arise in the ordinary course of business. There are no matters pending or threatened that we expect to have a material impact on business, results of operations, financial condition or cash flows.
There have not been any material changes to the risk factors previously disclosed in our Annual Report on Form 10-K for the year ended
December 31, 2016
.
Item 2.
Unregistered Sales of Equity Securities and Use of Proceeds.
None.
Item 3.
Defaults Upon Senior Securities.
None.
Item 4.
Mine Safety Disclosures.
Pursuant to the Dodd-Frank Wall Street Reform and Consumer Protection Act, and Item 104 of Regulation S-K, we are required to disclose items believed to be violations of the Federal Mine Safety and Health Act of 1977, any health and safety standard, or any regulation, as administered by the Federal Mine Safety and Health Administration. The required information is included in Exhibit 95 to this report.
Item 5.
Other Information.
On May 8, 2017, Judd Merrill tendered notice of his resignation from his position as Chief Financial Officer of the Company, effective as of the close of business on May 19, 2017. Mr. Merrill's departure is not the result of any material disagreement with the Company regarding its operations, policies or practices.
In connection with Mr. Merrill's resignation, the Company appointed Corrado DeGasperis, the Company's Chief Executive Officer, to serve as the Company’s interim Chief Financial Officer and he will assume the duties of Chief Financial Officer, including the role of Principal Financial Officer, until such time as we appoint a permanent replacement Chief Financial Officer.
28
Item 6.
Exhibits.
The exhibits required to be filed as a part of this Report on Form 10-Q are listed in the Exhibit Index attached hereto, which is incorporated herein by reference.
(1) Financial statements filed as part of this Report:
|
|
|
|
|
|
(2) Exhibits filed as part of this Report:
See Exhibits for which the Exhibit number is noted with an asterisk on the Exhibit Index attached hereto.
|
Exhibit
Number
|
Exhibit
|
|
|
31*
|
Certification of Principal Executive Officer pursuant to Rule 13a-14(a) and Rule 15d-14(a), promulgated under the Securities Exchange Act of 1934, as amended.
|
|
|
32*
|
Certification pursuant to 18 U.S.C. Section 1350, as adopted pursuant to Section 906 of the Sarbanes-Oxley Act of 2002.
|
|
|
95*
|
Mine Safety Disclosures.
|
|
|
101*
|
Interactive Data File (Quarterly Report on Form 10-Q, for the quarterly period ended June 30, 2017, furnished in XBRL (extensible Business Reporting Language)).
|
|
|
Attached as Exhibit 101 to this report are the following documents formatted in XBRL: (i) the Condensed Consolidated Balance Sheets at June 30, 2017 and December 31, 2016, (ii) the Condensed Consolidated Statements of Operations for the three and six months ended June 30, 2017 and 2016, (iii) the Condensed Consolidated Statements of Cash Flows for the six months ended June 30, 2017 and 2016 and (iv) the Notes to the Condensed Consolidated Financial Statements, tagged as blocks of text. Users of this data are advised pursuant to Rule 406T of Regulation S-T that this interactive data file is deemed not filed or part of a registration statement or prospectus for purposes of sections 11 or 12 of the Securities Act of 1933, is deemed not filed for purposes of section 18 of the Securities and Exchange Act of 1934, and otherwise is not subject to liability under these sections.
|
||
* Filed herewith.
29
SIGNATURES
Pursuant to the requirements of the Securities Exchange Act of 1934, the registrant has duly caused this report to be signed on its behalf by the undersigned thereunto duly authorized.
|
COMSTOCK MINING, INC.
|
|||
|
(Registrant)
|
|||
|
Date:
|
August 1, 2017
|
By:
|
/s/ Corrado De Gasperis
|
|
Name: Corrado De Gasperis
|
|||
|
Title: President, Chief Executive Officer and Executive Chairman (Principal Executive Officer and Principal Financial Officer)
|
|||
30
TABLE OF CONTENTS
Part I Financial InformationItem 1. Financial StatementsItem 2. Management S Discussion and Analysis Of Financial Condition and Results Of OperationsItem 3. Quantitative and Qualitative Disclosures About Market RiskItem 4. Controls and ProceduresPart II - Other InformationItem 1. Legal ProceedingsItem 1A. Risk FactorsItem 2. Unregistered Sales Of Equity Securities and Use Of ProceedsItem 3. Defaults Upon Senior SecuritiesItem 4. Mine Safety DisclosuresItem 5. Other InformationItem 6. Exhibits