COMSTOCK MINING INC.
10-Ks and 10-Qs
|
|
|
|
|
|
|
|
|
|
|
|
|
|
|
|
|
|
|
|
|
|
|
|
|
|
|
|
|
|
|
|
|
|
|
|
|
|
|
|
|
|
|
|
|
|
|
|
|
|
|
|
|
|
|
|
|
|
|
|
|
|
UNITED STATES
SECURITIES AND EXCHANGE COMMISSION
WASHINGTON, D.C. 20549
FORM 10-Q
(Mark One)
|
x
|
QUARTERLY REPORT PURSUANT TO SECTION 13 OR 15(d) OF THE SECURITIES EXCHANGE ACT OF 1934
|
|
For the Quarterly Period Ended
September 30, 2018
or
|
¨
|
TRANSITION REPORT PURSUANT TO SECTION 13 OR 15(d) OF THE SECURITIES EXCHANGE ACT OF 1934
|
|
For the transition period from ______________ to ______________
Commission File No. 001-35200
COMSTOCK MINING INC.
(Exact name of registrant as specified in its charter)
|
NEVADA
(State or other jurisdiction of
incorporation or organization)
|
1040
(Primary Standard Industrial
Classification Code Number)
|
65-0955118
(I.R.S. Employer
Identification No.)
|
||
P.O. Box 1118
Virginia City, NV 89440
(Address of principal executive offices)
(775) 847-5272
(Registrant’s telephone number, including area code)
Indicate by check mark whether the registrant (1) has filed all reports required to be filed by Section 13 or 15(d) of the Securities Exchange Act of 1934 during the preceding 12 months (or for such shorter period that the registrant was required to file such reports), and (2) has been subject to such filing requirements for the past 90 days. Yes
x
No
¨
Indicate by check mark whether the registrant has submitted electronically and posted on its corporate Web site, if any, every Interactive Data File required to be submitted and posted pursuant to Rule 405 of Regulation S-T (§232.405 of this chapter) during the preceding 12 months (or for such shorter period that the registrant was required to submit and post such files). Yes
x
No
¨
Indicate by check mark whether the registrant is a large accelerated filer, an accelerated filer, a non-accelerated filer, smaller reporting company, or an emerging growth company. See definition of “large accelerated filer," "accelerated filer,” "smaller reporting company," and "emerging growth company" in Rule 12b-2 of the Exchange Act. (Check one):
|
Large accelerated filer
|
¨
|
Accelerated filer
|
¨
|
|||||||
|
Non-accelerated filer
|
x
|
|||||||||
|
Smaller reporting company
|
x
|
|||||||||
|
Emerging growth company
|
¨
|
|||||||||
If an emerging growth company, indicate by check mark of the registrant has elected not to use the extended transition period for complying with any new or revised financial accounting standards provided pursuant to Section 13(a) of the Exchange Act.
Indicate by check mark whether the registrant is a shell company (as defined in Rule 12b-2 of the Act). Yes
¨
No
x
The number of shares of Common Stock, $0.000666 par value, of the registrant outstanding at
October 24, 2018
was
70,852,819
.
TABLE OF CONTENTS
2
Cautionary Notice Regarding Forward-Looking Statements
Certain statements contained in this report on Form 10-Q are forward-looking statements within the meaning of Section 27A of the Securities Act of 1933, as amended, and Section 21E of the Securities Exchange Act of 1934, as amended. All statements, other than statements of historical facts, are forward-looking statements. The words “believe,” “expect,” “anticipate,” “estimate,” “project,” “plan,” “should,” “intend,” “may,” “will,” “would,” “potential” and similar expressions identify forward-looking statements, but are not the exclusive means of doing so. Forward-looking statements include statements about matters such as: future industry market conditions; future explorations or acquisitions; future changes in our exploration activities; future prices and sales of, and demand for, our products; land entitlements and uses; production capacity and operations; operating and overhead costs; future capital expenditures and their impact on us; operational and management changes (including changes in the board of directors); changes in business strategies, planning and tactics; future employment and contributions of personnel, including consultants; future land sales investments, acquisitions, joint ventures, strategic alliances, business combinations, operational, tax, financial and restructuring initiatives; including the nature and timing and accounting for restructuring charges, derivative liabilities and the impact thereof; contingencies; environmental compliance and changes in the regulatory environment; offerings, limitations on sales or offering of equity or debt securities; including asset sales and the redemption of the debenture and associated costs; future working capital, costs, revenues, business opportunities, debt levels, cash flows, margins, earnings and growth
These statements are based on assumptions and assessments made by our management in light of their experience and their perception of historical and current trends, current conditions, possible future developments and other factors they believe to be appropriate. Forward-looking statements are not guarantees, representations or warranties and are subject to risks and uncertainties, many of which are unforeseeable and beyond our control and could cause actual results, developments and business decisions to differ materially from those contemplated by such forward-looking statements. Some of those risks and uncertainties include the risk factors set forth in this report and our Annual Report on Form 10-K for the fiscal year ended December 31, 2017, and the following: adverse effects of climate changes or natural disasters; global economic and capital market uncertainties; the speculative nature of gold or mineral exploration, including risks of diminishing quantities or grades of qualified resources; operational or technical difficulties in connection with exploration or mining activities; contests over our title to properties; potential dilution to our stockholders from our stock issuances, recapitalization and balance sheet restructuring activities; potential inability to comply with applicable government regulations or law; adoption of or changes in legislation or regulations adversely affecting our businesses; permitting constraints or delays; business opportunities that may be presented to, or pursued by, us; acquisitions, joint ventures, strategic alliances, business combinations, asset sales, and investments that we may be party to in the future; changes in the United States or other monetary or fiscal policies or regulations; interruptions in our production capabilities due to capital constraints; equipment failures; fluctuation of prices for gold or certain other commodities (such as silver, zinc, cyanide, water, diesel fuel and electricity); changes in generally accepted accounting principles; adverse effects of terrorism and geopolitical events; potential inability to implement our business strategies; potential inability to grow revenues; potential inability to attract and retain key personnel; interruptions in delivery of critical supplies, equipment and raw materials due to credit or other limitations imposed by vendors; assertion of claims, lawsuits and proceedings against us; potential inability to satisfy debt and lease obligations; potential inability to maintain an effective system of internal controls over financial reporting; potential inability or failure to timely file periodic reports with the SEC; potential inability to list our securities on any securities exchange or market; inability to maintain the listing of our securities; and work stoppages or other labor difficulties. Occurrence of such events or circumstances could have a material adverse effect on our business, financial condition, results of operations or cash flows or the market price of our securities. All subsequent written and oral forward-looking statements by or attributable to us or persons acting on our behalf are expressly qualified in their entirety by these factors. Except as may be required by securities or other law, we undertake no obligation to publicly update or revise any forward-looking statements, whether as a result of new information, future events, or otherwise.
3
COMSTOCK MINING INC. AND SUBSIDIARIES
(UNAUDITED)
|
September 30,
2018 |
December 31,
2017 |
||||||
|
ASSETS
|
|||||||
|
CURRENT ASSETS:
|
|||||||
|
Cash and cash equivalents
|
$
|
1,238,778
|
|
$
|
2,066,718
|
|
|
|
Assets held for sale, Net (Note 2)
|
5,363,403
|
|
5,363,403
|
|
|||
|
Prepaid expenses and other current assets (Note 3)
|
2,376,698
|
|
301,387
|
|
|||
|
Total current assets
|
8,978,879
|
|
7,731,508
|
|
|||
|
MINERAL RIGHTS AND PROPERTIES, Net
|
7,205,081
|
|
7,205,081
|
|
|||
|
PROPERTIES, PLANT AND EQUIPMENT, Net (Note 4)
|
10,376,500
|
|
12,781,733
|
|
|||
|
RECLAMATION BOND DEPOSIT
|
2,622,544
|
|
2,622,544
|
|
|||
|
RETIREMENT OBLIGATION ASSET (Note 5)
|
224,792
|
|
282,745
|
|
|||
|
OTHER ASSETS
|
339,926
|
|
340,302
|
|
|||
|
TOTAL ASSETS
|
$
|
29,747,722
|
|
$
|
30,963,913
|
|
|
|
LIABILITIES AND STOCKHOLDERS’ EQUITY
|
|||||||
|
CURRENT LIABILITIES:
|
|||||||
|
Accounts payable
|
$
|
345,935
|
|
$
|
321,302
|
|
|
|
Accrued expenses (Note 6)
|
1,164,160
|
|
496,651
|
|
|||
|
Long-term debt– current portion (Note 7)
|
304,235
|
|
291,532
|
|
|||
|
Total current liabilities
|
1,814,330
|
|
1,109,485
|
|
|||
|
LONG-TERM LIABILITIES:
|
|||||||
|
Long-term debt (Note 7)
|
8,843,398
|
|
9,971,421
|
|
|||
|
Long-term reclamation liability (Note 8)
|
7,434,913
|
|
7,417,680
|
|
|||
|
Other liabilities
|
553,662
|
|
600,228
|
|
|||
|
Total long-term liabilities
|
16,831,973
|
|
17,989,329
|
|
|||
|
Total liabilities
|
18,646,303
|
|
19,098,814
|
|
|||
|
COMMITMENTS AND CONTINGENCIES (Note 9)
|
|
|
|
|
|||
|
STOCKHOLDERS’ EQUITY:
|
|||||||
|
Preferred Stock; 50,000,000 shares authorized, no shares issued and outstanding
|
—
|
|
—
|
|
|||
|
Common stock, $.000666 par value, 790,000,000 shares authorized, 70,852,819 and 47,236,103
shares issued and outstanding at September 30, 2018 and
December 31, 2017
, respectively
|
47,188
|
|
31,459
|
|
|||
|
Additional paid-in capital
|
240,603,994
|
|
234,438,057
|
|
|||
|
Accumulated deficit
|
(229,549,763
|
)
|
(222,604,417
|
)
|
|||
|
Total stockholders’ equity
|
11,101,419
|
|
11,865,099
|
|
|||
|
TOTAL LIABILITIES AND STOCKHOLDERS’ EQUITY
|
$
|
29,747,722
|
|
$
|
30,963,913
|
|
|
See accompanying notes to condensed consolidated financial statements.
4
COMSTOCK MINING INC. AND SUBSIDIARIES
(UNAUDITED)
|
Three Months Ended
September 30, |
Nine Months Ended
September 30, |
||||||||||||||
|
2018
|
2017
|
2018
|
2017
|
||||||||||||
|
REVENUES
|
|||||||||||||||
|
Revenue - mining
|
$
|
—
|
|
$
|
—
|
|
$
|
—
|
|
$
|
—
|
|
|||
|
Revenue - real estate
|
32,281
|
|
26,960
|
|
83,946
|
|
73,624
|
|
|||||||
|
Total revenues
|
32,281
|
|
26,960
|
|
83,946
|
|
73,624
|
|
|||||||
|
COSTS AND EXPENSES
|
|||||||||||||||
|
Costs applicable to mining revenue
|
717,155
|
|
846,443
|
|
2,174,618
|
|
2,663,188
|
|
|||||||
|
Real estate operating costs
|
12,887
|
|
19,396
|
|
29,858
|
|
59,342
|
|
|||||||
|
Exploration and mine development
|
241,902
|
|
240,020
|
|
700,088
|
|
782,124
|
|
|||||||
|
Mine claims and costs
|
(291,602
|
)
|
235,535
|
|
(20,346
|
)
|
744,528
|
|
|||||||
|
Environmental and reclamation
|
88,612
|
|
152,075
|
|
208,866
|
|
669,390
|
|
|||||||
|
General and administrative
|
801,157
|
|
571,931
|
|
2,355,320
|
|
2,189,828
|
|
|||||||
|
Total costs and expenses
|
1,570,111
|
|
2,065,400
|
|
5,448,404
|
|
7,108,400
|
|
|||||||
|
LOSS FROM OPERATIONS
|
(1,537,830
|
)
|
(2,038,440
|
)
|
(5,364,458
|
)
|
(7,034,776
|
)
|
|||||||
|
OTHER INCOME (EXPENSE)
|
|||||||||||||||
|
Interest expense
|
(340,548
|
)
|
(442,610
|
)
|
(1,054,775
|
)
|
(1,297,546
|
)
|
|||||||
|
Other income (expense)
|
(166,732
|
)
|
(15,961
|
)
|
(526,113
|
)
|
128,409
|
|
|||||||
|
Total other expense, net
|
(507,280
|
)
|
(458,571
|
)
|
(1,580,888
|
)
|
(1,169,137
|
)
|
|||||||
|
LOSS BEFORE INCOME TAXES
|
(2,045,110
|
)
|
(2,497,011
|
)
|
(6,945,346
|
)
|
(8,203,913
|
)
|
|||||||
|
INCOME TAXES
|
—
|
|
—
|
|
—
|
|
—
|
|
|||||||
|
NET LOSS
|
$
|
(2,045,110
|
)
|
$
|
(2,497,011
|
)
|
$
|
(6,945,346
|
)
|
$
|
(8,203,913
|
)
|
|||
|
Net loss per common share – basic
|
$
|
(0.03
|
)
|
$
|
(0.06
|
)
|
$
|
(0.13
|
)
|
$
|
(0.21
|
)
|
|||
|
Net loss per common share – diluted
|
$
|
(0.03
|
)
|
$
|
(0.06
|
)
|
$
|
(0.13
|
)
|
$
|
(0.21
|
)
|
|||
|
Weighted average common shares outstanding — basic
|
58,531,058
|
|
43,598,033
|
|
54,755,753
|
|
39,380,503
|
|
|||||||
|
Weighted average common shares outstanding — diluted
|
58,531,058
|
|
43,598,033
|
|
54,755,753
|
|
39,380,503
|
|
|||||||
See accompanying notes to condensed consolidated financial statements.
5
COMSTOCK MINING INC. AND SUBSIDIARIES
(UNAUDITED)
|
Nine Months Ended
September 30, |
|||||||
|
2018
|
2017
|
||||||
|
OPERATING ACTIVITIES:
|
|||||||
|
Net loss
|
$
|
(6,945,346
|
)
|
$
|
(8,203,913
|
)
|
|
|
Adjustments to reconcile net loss to net cash used in operating activities:
|
|||||||
|
Depreciation, amortization, and depletion
|
2,468,817
|
|
3,263,948
|
|
|||
|
Accretion of reclamation liability
|
17,233
|
|
48,250
|
|
|||
|
Gain on sale of properties, plant, and equipment
|
(26,000
|
)
|
(137,229
|
)
|
|||
|
Amortization of debt discounts and issuance costs
|
282,708
|
|
317,559
|
|
|||
|
Net loss on early retirement of long-term debt
|
164,751
|
|
126,997
|
|
|||
|
Payment-in-kind interest expense
|
437,852
|
|
—
|
|
|||
|
Loss on make-whole liability with Pelen, LLC
|
369,000
|
|
—
|
|
|||
|
Changes in operating assets and liabilities:
|
|||||||
|
Prepaid expenses and other current assets
|
(775,311
|
)
|
(1,551
|
)
|
|||
|
Accounts payable
|
24,633
|
|
(483,112
|
)
|
|||
|
Accrued expenses and other liabilities
|
484,443
|
|
10,614
|
|
|||
|
NET CASH USED IN OPERATING ACTIVITIES
|
(3,497,220
|
)
|
(5,058,437
|
)
|
|||
|
INVESTING ACTIVITIES:
|
|||||||
|
Proceeds from principal payment on note receivable
|
376
|
|
—
|
|
|||
|
Proceeds from sale of properties, plant, and equipment
|
26,000
|
|
911,597
|
|
|||
|
Purchase of properties, plant and equipment
|
(1,055,631
|
)
|
(126,639
|
)
|
|||
|
NET CASH (USED IN) PROVIDED BY INVESTING ACTIVITIES
|
(1,029,255
|
)
|
784,958
|
|
|||
|
FINANCING ACTIVITIES:
|
|||||||
|
Principal payments on long-term debt
|
(2,000,631
|
)
|
(8,639,335
|
)
|
|||
|
Proceeds from long-term debt obligations (net of issuance costs)
|
—
|
|
9,379,446
|
|
|||
|
Proceeds from earn-in option with Tonogold
|
2,000,000
|
|
—
|
|
|||
|
Proceeds from the issuance of common stock
|
3,783,442
|
|
5,861,203
|
|
|||
|
Common stock issuance costs
|
(84,276
|
)
|
(216,116
|
)
|
|||
|
NET CASH PROVIDED BY FINANCING ACTIVITIES
|
3,698,535
|
|
6,385,198
|
|
|||
|
INCREASE (DECREASE) IN CASH AND CASH EQUIVALENTS
|
(827,940
|
)
|
2,111,719
|
|
|||
|
CASH AND CASH EQUIVALENTS, BEGINNING OF PERIOD
|
2,066,718
|
|
184,359
|
|
|||
|
CASH AND CASH EQUIVALENTS, END OF PERIOD
|
$
|
1,238,778
|
|
$
|
2,296,078
|
|
|
|
SUPPLEMENTAL CASH FLOW INFORMATION:
|
|||||||
|
Cash paid for interest
|
$
|
99,092
|
|
$
|
776,846
|
|
|
|
Supplemental disclosure of non-cash investing and financing activities:
|
|||||||
|
Issuance of common stock to pay for common stock issuance costs
|
$
|
245,000
|
|
$
|
200,000
|
|
|
|
Issuance of common stock (in advance of close) to purchase membership interests
|
$
|
585,000
|
|
$
|
—
|
|
|
|
Payment for purchase of property, plant, and equipment with prepaid deposits
|
$
|
—
|
|
$
|
1,158,785
|
|
|
|
Issuance of debt to purchase property, plant, and equipment
|
$
|
—
|
|
$
|
247,494
|
|
|
|
Settlement of long-term debt obligations with prepaid deposits
|
$
|
—
|
|
$
|
231,000
|
|
|
|
Issuance of common stock for settlement of long-term debt obligations
|
$
|
—
|
|
$
|
124,920
|
|
|
|
Issuance of common stock to purchase properties, plant, and equipment
|
$
|
—
|
|
$
|
274,400
|
|
|
|
Issuance of common stock for mineral lease
|
$
|
482,500
|
|
$
|
482,500
|
|
|
See notes to condensed consolidated financial statements.
6
COMSTOCK MINING INC. AND SUBSIDIARIES
NOTES TO CONDENSED CONSOLIDATED FINANCIAL STATEMENTS
FOR THE PERIOD ENDED
SEPTEMBER 30, 2018
(UNAUDITED)
1. Interim Financial Statements
Basis of Presentation
The interim condensed consolidated financial statements of Comstock Mining Inc. and subsidiaries (“Comstock”, the “Company”, “we”, “our” or “us”) have been prepared in accordance with generally accepted accounting principles for interim financial information and with the instructions to Form 10-Q and Article 10 of Regulation S-X. Accordingly, they do not include all of the information and footnotes required by generally accepted accounting principles for complete financial statements. In our opinion, all adjustments (consisting of normal recurring adjustments) considered necessary for a fair presentation have been included. Operating results for the
three and nine
month periods ended
September 30, 2018
, are not necessarily indicative of the results that may be expected for the year ending
December 31, 2018
. For further information, refer to the financial statements and footnotes thereto in our Annual Report on Form 10-K for the fiscal year ended
December 31, 2017
.
Liquidity and Management Plans
The accompanying unaudited condensed consolidated financial statements have been prepared in conformity with generally accepted accounting principles in the United States and contemplates the Company's continuation as a going concern.
On April 3, 2018, the Company received a
$2.0 million
cash payment relating to an option agreement (the “Option Agreement”) with Tonogold Resources Inc. (“Tonogold”). The Company used
$1.4 million
of the proceeds to reduce its indebtedness under the
11%
Senior Secured Debenture (the "Debenture"). In addition, the Option Agreement requires Tonogold to reimburse the Company for certain expenditures associated with the Lucerne Mine Project. The Company has recognized approximately
$1.1 million
in expense reimbursements during the nine months ended September 30, 2018.
The Company commenced production with the Lucerne Mine in 2012, which ramped up to approximately
20,000
gold-equivalent-ounces of annual production. The Company completed leaching from its existing leach pads in December 2016 and is currently planning the exploration and development of its next two mines; first, with its second surface mine in the Dayton Resource area and then further developing, in collaboration through the Option Agreement with Tonogold, the second phase of development and ultimately, a plan for resuming production from the Lucerne Mine.
The Company has recurring net losses from operations and an accumulated deficit of
$229.5 million
at
September 30, 2018
. For the nine month period ended
September 30, 2018
, the Company incurred a net loss of
$6.9 million
and used
$3.5 million
of cash in operations. As of
September 30, 2018
, the Company had cash and cash equivalents of
$1.2 million
, current assets of
$9.0 million
and current liabilities of
$1.8
, resulting in current working capital of
$7.2 million
.
The Company’s current capital resources include cash and cash equivalents and other net working capital resources, along with a loan commitment agreement with
$7.0 million
in unused capacity after consideration of fees due at the time of borrowing. The Company has an existing equity purchase agreement (the "Purchase Agreement") with Leviston Resources, LLC ("Leviston") with unused capacity of
$1.4 million
. These capital resources are in addition to certain planned non-mining asset sales.
While the Company has been successful in the past in obtaining the necessary capital to support its operations, including registered equity financings from its existing shelf registration statement, borrowings, or other means, there is no assurance that the Company will be able to obtain additional equity capital or other financing, if needed. However, the Company believes it will have sufficient funds to sustain its operations during the next 12 months from the date the financial statements were issued as a result of the funding sources detailed above.
7
Future operating expenditures above management’s expectations, including exploration and mine development expenditures in excess of amounts to be raised from the issuance of equity under the Purchase Agreement, declines in the market value of properties held for sale, or declines in the share price of the Company's common stock would adversely affect the Company’s results of operations, financial condition and cash flows. If the Company was unable to obtain any necessary additional funds, this could have an immediate material adverse effect on liquidity and could raise substantial doubt about the Company’s ability to continue as a going concern. In such case, the Company could be required to limit or discontinue certain business plans, activities or operations, reduce or delay certain capital expenditures or sell certain assets or businesses. There can be no assurance that the Company would be able to take any such actions on favorable terms, in a timely manner or at all.
Use of Estimates
In preparing financial statements in conformity with generally accepted accounting principles, we are required to make estimates and assumptions that affect the reported amounts of assets and liabilities and the disclosure of contingent assets and liabilities at the date of the financial statements and revenues and expenditures during the reported periods. Actual results could differ materially from those estimates. Estimates may include those pertaining to estimated useful lives and valuation of properties, plant, and equipment, assets held for sale, mineral rights, deferred tax assets, derivative assets and liabilities, reclamation liabilities, stock-based compensation and payments, and contingent liabilities.
Reverse Stock Split
Effective November 9, 2017, the Company completed a 1-for-5 reverse stock split of its authorized and outstanding common stock, as approved by its Board of Directors. All 2017 common shares and per share amounts set forth herein give effect to this reverse stock split.
Comprehensive Loss
The only component of comprehensive loss for the
three and nine
month periods ended
September 30, 2018
and
2017
, was our net loss.
Income Taxes
We recognize deferred tax assets and liabilities based on differences between the consolidated financial statement carrying amounts and tax basis of certain recorded assets and liabilities and for tax loss carryforwards. Realization of deferred tax assets is dependent upon our ability to generate sufficient future taxable earnings. Where it is more likely than not that the deferred tax asset will not be realized, we have provided a full valuation allowance. The Company has provided a full valuation allowance at
September 30, 2018
and
December 31, 2017
, for its net deferred tax assets because we cannot conclude it is more likely than not that they will be realized.
Recently Issued Accounting Pronouncements
In May 2014, the Financial Accounting Standards Board (“FASB”) issued Accounting Standards Updated (“ASU”) 2014-09 (Topic 606) that introduces a new five-step revenue recognition model that an entity should use to recognize revenue when depicting the transfer of promised goods or services to customers in an amount that reflects the consideration that the entity expects to be entitled in exchange for those goods or services. This ASU also requires disclosures sufficient to enable users to understand the nature, amount, timing, and uncertainty of revenue and cash flows arising from contracts with customers, including qualitative and quantitative disclosures about contracts with customers, significant judgments and changes in judgments, and assets recognized from the costs to obtain or fulfill a contract. We used the modified retrospective method to adopt the provisions of this standard effective January 1, 2018, which required us to apply the new revenue standard to (i) all new revenue contracts entered into after January 1, 2018 and (ii) all existing revenue contracts as of January 1, 2018, through a cumulative adjustment to accumulated deficit. In accordance with this approach, our consolidated revenues for the periods prior to January 1, 2018, were not revised. The Company did not record a cumulative effect adjustment to its beginning accumulated deficit as a result of adoption of Topic 606 as there were no revenue contracts within the scope of Topic 606 as of January 1, 2018.
8
In August 2016, the FASB issued ASU 2016-15, Classification of Certain Cash Receipts and Cash Payments ("ASU 2016-15"), which amends ASC 230, Statement of Cash Flows, and the FASB’s standards for reporting cash flows in general-purpose financial statements. The amendments address the diversity in practice related to the classification of certain cash receipts and payments including debt prepayment or debt extinguishment costs. ASU 2016-15 is effective for fiscal years beginning after December 15, 2017, including interim periods within those fiscal years, and early adoption is permitted. The Company adopted this guidance on January 1, 2018, with no material impact on the Company’s consolidated financial statements.
In February 2016, the FASB issued ASU 2016-02, Leases (Topic 842), to increase transparency and comparability among organizations by recognizing lease assets and lease liabilities on the balance sheet and disclosing key information about leasing arrangements. Topic 842 affects any entity that enters into a lease, with some specified scope exceptions. For public business entities, the amendments in this update are effective for financial statements issued for annual periods beginning after December 15, 2018, and interim periods within those annual periods. Early application is permitted for all entities. The Company is currently evaluating the impact of adopting this standard on its consolidated financial statements, which will require right of use assets and lease liabilities be recorded in the consolidated balance sheet for operating leases.
2. Assets Held For Sale
The Company committed to a plan to sell certain land, buildings, and water rights. As of
September 30, 2018
and December 31, 2017, the Company has assets with a net book value of
$5.4 million
, which met the criteria to be classified as assets held for sale. Those criteria specify that the asset must be available for immediate sale in its present condition (subject only to terms that are usual and customary for sales of such assets), the sale of the asset must be probable, and its transfer expected to qualify for recognition as a completed sale generally within one year. Proceeds from the sale of these assets are required to be used to satisfy obligations due under the terms of the debenture with GF Comstock 2 LP as described in Note 7.
Assets held for sale include:
|
September 30, 2018
|
December 31, 2017
|
||||||
|
Industrial Park (Land and water rights)
|
$
|
2,738,462
|
|
$
|
2,738,462
|
|
|
|
Daney Ranch (Land and buildings)
|
2,146,575
|
|
2,146,575
|
|
|||
|
Gold Hill Hotel (Land and buildings)
|
478,366
|
|
478,366
|
|
|||
|
Total assets held for sale
|
$
|
5,363,403
|
|
$
|
5,363,403
|
|
|
3. Prepaid Expenses and Other Current Assets
Prepaid expenses and other current assets consisted of the following:
|
|
September 30, 2018
|
December 31, 2017
|
|||||
|
Land and property deposits
|
$
|
1,300,000
|
|
$
|
—
|
|
|
|
Surety bond and insurance
|
154,048
|
|
188,485
|
|
|||
|
Reimbursements due from Tonogold
|
599,443
|
|
—
|
|
|||
|
Other
|
323,207
|
|
112,902
|
|
|||
|
Total prepaid expenses and other current assets
|
$
|
2,376,698
|
|
$
|
301,387
|
|
|
9
4. Properties, Plant and Equipment
Properties, plant and equipment consisted of the following:
|
September 30, 2018
|
December 31, 2017
|
||||||
|
Land and building
|
$
|
9,169,605
|
|
$
|
9,169,605
|
|
|
|
Vehicle and equipment
|
2,357,367
|
|
2,414,216
|
|
|||
|
Processing and laboratory
|
21,166,497
|
|
21,166,497
|
|
|||
|
Furniture and fixtures
|
694,164
|
|
755,665
|
|
|||
|
33,387,633
|
|
33,505,983
|
|
||||
|
Less accumulated depreciation
|
(23,011,133
|
)
|
(20,724,250
|
)
|
|||
|
Total properties, plant and equipment
|
$
|
10,376,500
|
|
$
|
12,781,733
|
|
|
During the three and nine month periods ended
September 30, 2018
, the Company recognized depreciation expense of
$0.7 million
and
$2.3 million
, respectively. During the three and nine month periods ended
September 30, 2017
, the Company recognized depreciation expense of
$0.9 million
and
$3.0 million
, respectively.
5. Retirement Obligation Asset
Following is a reconciliation of the aggregate retirement obligation asset associated with our reclamation plan for our mining projects:
|
Nine Months Ended
|
Twelve Months
Ended
|
||||||
|
September 30, 2018
|
December 31, 2017
|
||||||
|
Retirement obligation asset — beginning of period
|
$
|
282,745
|
|
$
|
617,126
|
|
|
|
Additional obligations incurred
|
—
|
|
—
|
|
|||
|
Amortization of retirement obligation asset
|
(57,953
|
)
|
(334,381
|
)
|
|||
|
Retirement obligation asset — end of period
|
$
|
224,792
|
|
$
|
282,745
|
|
|
6. Accrued Expenses
Accrued expenses consisted of the following:
|
|
September 30, 2018
|
December 31, 2017
|
|||||
|
Accrued Northern Comstock Joint Venture
|
$
|
67,708
|
|
$
|
180,833
|
|
|
|
Accrued interest expense
|
235,123
|
|
—
|
|
|||
|
Accrued make-whole for Pelen LLC (Note 13)
|
369,000
|
|
—
|
|
|||
|
Accrued liability for purchase of DTSS (Note 13)
|
250,000
|
|
—
|
|
|||
|
Accrued payroll costs
|
151,623
|
|
57,402
|
|
|||
|
Accrued personal property tax
|
41,250
|
|
84,264
|
|
|||
|
Accrued Board of Directors fees
|
20,000
|
|
84,000
|
|
|||
|
Accrued vendor liabilities
|
—
|
|
75,415
|
|
|||
|
Other accrued expenses
|
29,456
|
|
14,737
|
|
|||
|
Total accrued expenses
|
$
|
1,164,160
|
|
$
|
496,651
|
|
|
The accrued expense for the Northern Comstock Joint Venture represents the difference in timing of expense recognition and required monthly and annual payments to Northern Comstock LLC.
10
Long-term debt consisted of the following:
|
Note Description
|
September 30, 2018
|
December 31, 2017
|
|||||
|
Note Payable (GF Comstock 2) - Payable in semi-annual installments of interest only at 11% with principal and make whole payment due January 2021.
|
$
|
8,872,661
|
|
$
|
10,218,352
|
|
|
|
Caterpillar Equipment Consolidated - Principal and interest at 5.7% payable in monthly installments of $29,570 due on or before November 1, 2021.
|
1,025,872
|
|
1,242,960
|
|
|||
|
Total debt
|
9,898,533
|
|
11,461,312
|
|
|||
|
Less: long-term debt discounts and issuance costs
|
(750,900
|
)
|
(1,198,359
|
)
|
|||
|
Total debt, net of discounts and issuance costs
|
9,147,633
|
|
10,262,953
|
|
|||
|
Less: current maturities
|
(304,235
|
)
|
(291,532
|
)
|
|||
|
Long-term debt, net of discounts and issuance costs
|
$
|
8,843,398
|
|
$
|
9,971,421
|
|
|
Debt Obligations
GF Comstock 2 LP
On January 13, 2017, the Company issued an
11%
Senior Secured Debenture (the "Debenture") to GF Comstock 2 LP due 2021 in an aggregate principal amount of
$10,723,000
. The Debenture is collateralized by (1) substantially all of the assets of the Company, and (2) a pledge of
100%
of the equity of the subsidiaries of Comstock Mining Inc. The use of proceeds included refinancing substantially all of the Company’s current obligations, except the amount due to Caterpillar Finance. The Debenture was issued at a discount of approximately
$568,000
and the Company incurred issuance costs of approximately
$528,000
. The Debenture required an additional "Make Whole" obligation totaling approximately
$688,000
if paid any time prior to or at maturity. At September 30, 2018, the remaining balance on the Make Whole obligation was
$508,599
. Total principal on the Debenture is due on January 13, 2021. The Debenture requires acceleration of payment of accrued interest, principal, and the related Make Whole obligation from all net proceeds received upon the sale of any of the assets of the Company.
Interest is payable semi-annually. For the first
two years
, interest will be payable, at the option of the Company, either in cash or in the form of additional Debentures (or a combination thereof). For the third and fourth years, interest will be payable only in cash. The Company elected to pay the first
two
semi-annual interest payments in cash in June 2017, and December of 2017. In June 2018, the Company elected to make the third payment of
$437,852
, in the form of additional Debentures (Payment in Kind).
Hard Rock Nevada Inc., an employee owned entity, and another related party who is a significant shareholder of the Company, participated in this financing.
Loan Commitment
In March 2017 (and amended in June and September 2017), the Company entered into a loan commitment agreement that provides up to
$7.5 million
in borrowing capacity and expires in 2021 with an
11%
interest rate. Principal amounts borrowed under this agreement would not be due until 2021. Until January 1, 2019, interest on any borrowings will be payable in cash and/or in the form of additional indebtedness under the agreement, at the Company’s option.
No
amounts have been borrowed under this agreement and the Company has
$7.0 million
(after consideration of fees due at the time of borrowing) of available borrowing capacity as of
September 30, 2018
.
11
8. Long-Term Reclamation Liability
Following is a reconciliation of the aggregate reclamation liability associated with our reclamation plan for our mining projects:
|
Nine Months Ended
|
Twelve Months
Ended
|
||||||
|
September 30, 2018
|
December 31, 2017
|
||||||
|
Long-term reclamation liability — beginning of period
|
$
|
7,417,680
|
|
$
|
7,353,346
|
|
|
|
Additional obligations incurred
|
—
|
|
—
|
|
|||
|
Accretion of reclamation liability
|
17,233
|
|
64,334
|
|
|||
|
Long-term reclamation liability — end of period
|
$
|
7,434,913
|
|
$
|
7,417,680
|
|
|
9. Commitments and Contingencies
The Company has minimum royalty obligations with certain of its mineral properties and leases. For most of the mineral properties and leases, the Company is subject to a range of royalty obligations once production commences. These royalties range from
0.5%
to
5%
of net smelter revenues (NSR) from minerals produced on the properties, with the majority being under
3%
. Some of the factors that will influence the amount of the royalties include ounces extracted and the price of gold.
The Company’s mining and exploration activities are subject to various laws and regulations governing the protection of the environment. These laws and regulations are continually changing and are generally becoming more restrictive. The Company believes its operations are in compliance with applicable laws and regulations in all material respects. The Company has made, and expects to make in the future, expenditures to comply with such laws and regulations, but cannot predict the full amount of such future expenditures.
On January 31, 2014, the Comstock Residents Association (the “CRA”) and two of its members filed a civil action in the Third Judicial District Court of the State of Nevada in and for Lyon County (the “District Court”) against the Lyon County Board of Commissioners (the “Commissioners”) and the Company, asking the District Court to reverse the Commissioners’ decision to grant an application for master plan amendment and zone change submitted and approved by the Commissioners on January 2, 2014 (the “Application”).
Prior to the approval of the Application, the master plan designation and zoning precluded mining on certain property of the Company in the area of Silver City, Lyon County. In April 2015, the District Court ruled in favor of the Company and the Commissioners. The written Order Denying Petition for Judicial Review was filed and mailed to all parties on June 15, 2015. On July 14, 2015, the CRA and one individual (together “Appellants”) filed a Notice of Appeal of the Court Order, appealing the decision to the Nevada Supreme Court. On December 9, 2015, Appellants filed their Opening Brief in the Nevada Supreme Court, generally repeating the arguments that were made at the District Court. On January 15, 2016, the Company and the Commissioners jointly filed an Answering Brief. Briefing in the Nevada Supreme Court was completed with the Appellants’ filing of a Reply Brief on March 3, 2016. An oral argument before a three-judge panel of the Nevada Supreme Court took place on September 14, 2016.
On December 2, 2016, the Nevada Supreme Court entered an order affirming all three of the District Court’s decisions associated with 1) the Commissioners’ discretion and authority for changing master plans and zoning, 2) their compliance with Nevada’s Open Meeting Law and 3) their compliance with Nevada statutory provisions. Specifically, the Supreme Court affirmed the District Court’s conclusions that Lyon County did not abuse its discretion and that it acted with substantial evidence in support of their decision, that the County did not violate Nevada’s Open Meeting Law and that the County did not violate statutory provisions regarding master plans.
The Supreme Court did reverse the District Court’s dismissal of CRA’s claim of a due process violation, concluding that this claim should not have been dismissed and that further proceedings are necessary in the District Court on this single claim. The Company and the Commissioners filed a motion for summary judgment with the District Court bases on the evidence in the record and the District Court held a hearing on December 11, 2017. The District Court concluded that the Supreme Court's reversal of CRA's due process claim required that CRA be afforded the opportunity to conduct discovery. Therefore, the District Court has allowed a limited time for CRA to conduct discovery on its due process claim. The Company responded to the CRA discovery request on February 20, 2018 and the District Court held a hearing on April 23, 2018. Additional discovery was allowed by the District Court and has been completed. Briefing on the due process claim was completed on October 17, 2018 and the matter has been submitted for a final ruling from the Court.
12
On July 12, 2018, Precious Royalties LLC (“Precious”) filed a complaint in the First Judicial District Court of the State of Nevada, in Storey County, against the Company, alleging that the Company failed to properly pay Precious a net smelter return royalty in accordance with a settlement agreement dated September 24, 2012 and is seeking
$510,000
in damages. The Company believes that the claims made in this complaint are without merit and the Company intends to vigorously defend this litigation.
From time to time, we are involved in lawsuits, claims, investigations and proceedings that arise in the ordinary course of business. There are no other matters pending that we expect to have a material adverse impact on our business, results of operations, financial condition or cash flows.
10. Stockholders’ Equity
At-the-Market Offering Program
Effective June 2016, the Company entered into a sales agreement with respect to an at-the-market offering program (“ATM Agreement”) pursuant to which the Company may offer and sell, from time to time at its sole discretion, shares of its common stock, having an aggregate offering price of up to
$5 million
. The Company pays the sales agent a commission of
2.5%
of the gross proceeds from the sale of such shares. Final proceeds from this ATM agreement were received in January 2018, and the ATM Agreement was terminated.
Effective April 2017, the Company entered into the Purchase Agreement with Leviston for the purchase of up to
$7.25 million
of shares of the Company's common stock from time to time, at the Company's option. Effective August 2018, the Company and Leviston terminated the Purchase Agreement and no further sales pursuant to that program will be made. At the time of termination, the Company had issued shares with an aggregate purchase price of
$5.3 million
.
Effective August 2018, the Company entered into a Sales Agreement with Leviston Resources for the sale of up to
$2.25 million
of shares of the Company's common stock from time to time, at the Company's option. The Company is not obligated to make any sales of shares under the Sales agreement, and if it elects to make any sales, the Company can set a minimum sales price for the shares. As of September 30, 2018, the Company has issued shares with an aggregrate sales price of
$0.9 million
under the Sales Agreement.
Following is a reconciliation of the transactions under the ATM Agreement, the Purchase Agreement and the Sales Agreement for the nine-month periods ended
September 30, 2018
, and 2017, respectively:
|
Nine Months Ended
|
Nine Months Ended
|
||||||
|
September 30, 2018
|
September 30, 2017
|
||||||
|
Number of shares sold
|
15,762,299
|
|
6,854,160
|
|
|||
|
Gross proceeds
|
$
|
3,333,442
|
|
$
|
5,861,203
|
|
|
|
Fees
|
19,276
|
|
216,116
|
|
|||
|
Net proceeds
|
$
|
3,314,166
|
|
$
|
5,645,087
|
|
|
|
Average price per share
|
$
|
0.21
|
|
$
|
0.86
|
|
|
In August 2018, the Company issued
261,628
shares of Common Stock to Leviston in the amount of
$45,000
as payment for issuance fees. In February 2018, the Company issued
615,605
shares of Common Stock to Leviston in the amount of
$0.2 million
as payment for issuance fees due under the terms of the Purchase Agreement. In April 2017, the Company issued
777,936
shares of Common Stock to Leviston in the amount of
$0.2 million
as payment for issuance fees due under the terms of the Purchase Agreement.
In August 2018, the Company issued
2,774,490
shares of Common Stock with a fair value of
$482,500
as payment of the annual contribution to Northern Comstock, LLC. The transaction had stock issuance fees of
$55,000
, paid to the stock exchange. In August 2017, the Company issued
2,513,021
shares of Common Stock with a fair value of
$482,500
as the payment of the annual contribution to Northern Comstock, LLC.
13
On August 16, 2018, the Company issued
2,727,273
shares of Common Stock in a private placement in the amount of
$450,000
, at a price per share of
$0.165
. The transaction had stock issuance fees of
$10,000
, paid to the stock exchange. The private placement was exempt from the Securities Act pursuant to Section 4(a)(2) of the Securities Act.
11. Net Loss Per Common Share
Basic loss per share is computed by dividing net loss available to common stockholders by the weighted average number of shares of common stock outstanding during the period. Diluted loss per share reflects the potential dilution that could occur if stock options were exercised.
The following is a reconciliation of the numerator and denominator used in the basic and diluted computation of net loss per share:
|
Three Months Ended
September 30, |
Nine Months Ended
September 30, |
||||||||||||||
|
2018
|
2017
|
2018
|
2017
|
||||||||||||
|
Numerator:
|
|||||||||||||||
|
Net loss
|
$
|
(2,045,110
|
)
|
$
|
(2,497,011
|
)
|
(6,945,346
|
)
|
(8,203,913
|
)
|
|||||
|
Denominator:
|
|||||||||||||||
|
Basic and diluted weighted average shares outstanding
|
58,531,058
|
|
43,598,033
|
|
54,755,753
|
|
39,380,503
|
|
|||||||
|
Net loss per common share:
|
|||||||||||||||
|
Basic and Diluted
|
$
|
(0.03
|
)
|
$
|
(0.06
|
)
|
$
|
(0.13
|
)
|
$
|
(0.21
|
)
|
|||
There are
10,000
common stock equivalent shares associated with stock options that are not included in the computation of diluted loss per share because the Company has a net loss and the inclusion of such shares would be antidilutive.
14
12. Segment Reporting
Our management organizes the Company into
two
operating segments: mining and real estate. Our mining segment consists of all activities and expenditures associated with mining. Our real estate segment consists of land, real estate rental properties and the Gold Hill Hotel. We evaluate the performance of our operating segments based on operating income (loss). All intercompany transactions have been eliminated, and inter-segment revenues are not significant. Financial information relating to our reportable operating segments and reconciliation to the consolidated totals is as follows:
|
Three Months Ended
September 30, |
Nine Months Ended
September 30, |
||||||||||||||
|
2018
|
2017
|
2018
|
2017
|
||||||||||||
|
Revenue
|
|||||||||||||||
|
Mining
|
$
|
—
|
|
$
|
—
|
|
$
|
—
|
|
$
|
—
|
|
|||
|
Real estate
|
32,281
|
|
26,960
|
|
83,946
|
|
73,624
|
|
|||||||
|
Total revenue
|
32,281
|
|
26,960
|
|
83,946
|
|
73,624
|
|
|||||||
|
Costs and Expenses
|
|||||||||||||||
|
Mining
|
(1,557,224
|
)
|
(2,046,004
|
)
|
(5,418,546
|
)
|
(7,049,058
|
)
|
|||||||
|
Real estate
|
(12,887
|
)
|
(19,396
|
)
|
(29,858
|
)
|
(59,342
|
)
|
|||||||
|
Total costs and expenses
|
(1,570,111
|
)
|
(2,065,400
|
)
|
(5,448,404
|
)
|
(7,108,400
|
)
|
|||||||
|
Operating Income (Loss)
|
|||||||||||||||
|
Mining
|
(1,557,224
|
)
|
(2,046,004
|
)
|
(5,418,546
|
)
|
(7,049,058
|
)
|
|||||||
|
Real estate
|
19,394
|
|
7,564
|
|
54,088
|
|
14,282
|
|
|||||||
|
Total loss from operations
|
(1,537,830
|
)
|
(2,038,440
|
)
|
(5,364,458
|
)
|
(7,034,776
|
)
|
|||||||
|
Other income (expense), net
|
(507,280
|
)
|
(458,571
|
)
|
(1,580,888
|
)
|
(1,169,137
|
)
|
|||||||
|
Net loss
|
$
|
(2,045,110
|
)
|
$
|
(2,497,011
|
)
|
$
|
(6,945,346
|
)
|
$
|
(8,203,913
|
)
|
|||
|
Depreciation, Amortization, and Depletion
|
|||||||||||||||
|
Mining
|
$
|
1,631,007
|
|
$
|
1,005,754
|
|
$
|
2,461,422
|
|
$
|
3,254,845
|
|
|||
|
Real estate
|
4,930
|
|
2,465
|
|
7,395
|
|
9,103
|
|
|||||||
|
Total depreciation, amortization, and depletion
|
$
|
1,635,937
|
|
$
|
1,008,219
|
|
$
|
2,468,817
|
|
$
|
3,263,948
|
|
|||
|
Capital Expenditures
|
|||||||||||||||
|
Mining
|
$
|
800,000
|
|
$
|
9,639
|
|
$
|
1,305,631
|
|
$
|
1,807,318
|
|
|||
|
Real estate
|
—
|
|
—
|
|
—
|
|
—
|
|
|||||||
|
Total capital expenditures
|
$
|
800,000
|
|
$
|
9,639
|
|
$
|
1,305,631
|
|
$
|
1,807,318
|
|
|||
|
As of September 30,
|
As of December 31,
|
||||||
|
2018
|
2017
|
||||||
|
Assets
|
|||||||
|
Mining
|
$
|
26,898,382
|
|
$
|
25,530,508
|
|
|
|
Real estate
|
2,849,340
|
|
5,433,405
|
|
|||
|
Total assets
|
$
|
29,747,722
|
|
$
|
30,963,913
|
|
|
15
13. Equity Purchase Agreements
Equity purchase agreement with Pelen, LLC
In January of 2018, the Company issued
1,475,410
shares of restricted common stock as initial payment to acquire
25%
of the total membership interests of Pelen, LLC. The purchase of the membership interests will close once the seller of the membership interests has received total cash proceeds of at least
$585,000
either through sale of the restricted common stock received or through additional cash payments made by the Company. If all of the shares of restricted common stock have been sold by the seller of the membership interests and the aggregate proceeds received are less than
$585,000
, then the Company is required to pay the shortfall in either additional shares of the Company’s common stock or cash, at the Company’s election. As of September 30, 2018, the purchase has not closed and the Company has not received legal ownership of the membership interests. The Company has recorded a make-whole liability of
$369,000
at September 30, 2018 representing the value of the shortfall based on the actual sales of shares and the share price as of September 30, 2018. This amount is recorded within accrued expenses in the condensed consolidated balance sheet as of September 30, 2018.
Equity purchase agreement with Downtown Silver Springs, LLC
On May 30, 2018, and amended on September 25, 2018, the Company entered into an agreement for the purchase of
100%
of the membership interests of Downtown Silver Springs, LLC (“DTSS”). DTSS holds an option for the purchase of approximately
160
acres of centrally located land in Silver Springs, Nevada, and separately, holds an option to purchase
350
units of water rights (equaling
392
acre-feet) and
200
units of sewer rights. DTSS has no other assets, no operations, or employees.
The option to purchase the
160
acres of land allows the holder to purchase the land for approximately
$3.2 million
, less payments made of
$115,000
by the sellers of DTSS plus accrued interest of approximately
$369,000
and expires on March 31, 2019. The option to purchase the water and sewer rights allows the holder to purchase the water rights for
$5,800
per acre foot and the sewer rights for
$7,000
per sewer unit and expires on March 31, 2019. The water rights and sewer unit usages are not restricted to the
160
-acre parcel.
The DTSS acquisition was accounted for as an asset acquisition as it was determined that the operations of DTSS do not meet the definition of a business. The Company paid total consideration of
$1.3 million
which consists of (1)
$800,000
cash deposits that will reduce the final purchase price of the land parcel, and (2)
$500,000
cash payments to the former membership interest holders of DTSS (
$250,000
of which was paid in cash during the quarter-ended September 30, 2018, and
$250,000
which is due on or before December 31, 2018). As the options expire on March 31, 2019, the total consideration has been recorded in prepaid expenses and other current assets with the accrued second payment recorded in accrued expenses as of September 30, 2018.
As of September 30, 2018, the Company has made non-refundable deposits of
$800,000
which are recorded in prepaid expenses and other current assets in the condensed consolidated balance sheet. On October 1, 2018, the Company paid a non-refundable deposit of
$250,000
. As of the date of this filing, the Company has made a total of
$1,050,000
of non-refundable deposits towards the purchase of the
160
acres of land.
14. Tonogold Option Agreement
On October 3, 2017, the Company entered into the Option Agreement with Tonogold. Under the terms of the Option Agreement, Tonogold will have the right to participate in certain activities, including but not limited to, engineering, development, drilling and test-work, towards completing a technical and economic feasibility assessment on certain properties within the Company’s Lucerne resource area (the “Lucerne Property”).
Under the terms of the Option Agreement, Tonogold can earn a
51%
interest in the Company’s presently wholly-owned subsidiary, Comstock Mining LLC, which owns the Lucerne Property by meeting certain requirements and financial milestones. These requirements and milestones include: (1) making capital expenditures on the Lucerne Property and related expense reimbursements to the Company of
$20 million
no later than
42
-months following the Commencement Date of April 3, 2018, and (2) making option payments totaling
$2.2 million
to the Company. Tonogold made a
$0.2 million
option payment on October 3, 2017, and a second and final option payment of
$2.0 million
on April 3, 2018. The option payments were both recorded within stockholders' equity as they relate to Tonogold’s right to earn-in to a
51%
interest in Comstock Mining, LLC. The Company used
$1.4 million
of the proceeds received from the option payments to reduce its indebtedness under the Debenture. In addition, the Company has recognized approximately
$1.1 million
in expense reimbursements for the nine months ended September 30, 2018.
16
15. Subsequent Events
On October 5, 2018, the Company received
$546,107
from Tonogold in reimbursement for expenses for the month of August 2018, reducing the balance due to
$53,336
.
On October 18, 2018, the Company reached a new agreement to sell the Daney Ranch for
$3.25 million
, subject to escrow and customary closing conditions, with an anticipated close on November 30, 2018.
The following discussion provides information that we believe is relevant to an assessment and understanding of the consolidated results of operations and financial condition of the Company as of and for the nine month period ended
September 30, 2018
. It should be read in conjunction with the condensed consolidated financial statements and accompanying notes included in this Form 10-Q and our Annual Report on Form 10-K as of, and for the fiscal year ended
December 31, 2017
.
Overview
The Company is a Nevada-based, gold and silver mining exploration, development and production company with extensive, contiguous property in the historic Comstock and Silver City mining districts (collectively, the “Comstock District”) and additional mining, commercial and industrial properties located in Storey and Lyon Counties, Nevada. The Comstock District is located within the western portion of the Basin and Range Province of Nevada, near both Reno and Carson City. The Company has been acquiring properties and developing projects in the Comstock District since 2003. Since then, the Company has consolidated a substantial portion of the historic Comstock District, entitled more productive land uses, secured permits, built an infrastructure and brought exploration projects into production.
The Company and its subsidiaries are headquartered on American Flat Road, in Gold Hill, Nevada and now own or control approximately
9,272
acres of mining claims and parcels in the broader Comstock District and surrounding area. The acreage includes approximately
2,347
acres of patented claims and surface parcels (private lands) and approximately
6,925
acres of unpatented mining claims (public lands), administered by the Bureau of Land Management (“BLM”).
Because of the Comstock District’s historical significance, the geology is well known and has been extensively studied by the Company, our advisors and many independent researchers. We have expanded our understanding of the geology through vigorous surface mapping and drill hole logging. The volume of geologic data is immense, particularly in the Lucerne and Dayton resource areas. We have amassed a large library of historic data and detailed surface mapping of Comstock District properties. We integrate this data with information obtained from our recent mining operations, to target geological prospective exploration areas and plan exploratory drilling programs, including expanded surface and underground drilling.
The Company continues evaluating and acquiring properties, expanding its footprint and evaluating all of our existing and prospective opportunities for further exploration and development. The near-term goal of our business plan is to maximize intrinsic stockholder value realized, per share, by continuing to acquire and develop mineralized and potentially mineralized properties, exploring, developing and validating qualified resources (measured, indicated and inferred) and reserves (proven and probable) that enable the commercial development of our properties through extended, long-lived mine plans that are economically feasible and socially responsible, including mine plans for both the Lucerne and Dayton resource areas, with both surface and underground development opportunities.
Our Lucerne resource area is located in Storey County, Nevada, approximately three miles south of Virginia City and 30 miles southeast of Reno. The Lucerne resource area was host to the Company’s most-recent test mining operations from 2012 through 2015, including heap-leach processing through 2016. The heap processing facility is in American Flat, approximately three quarters of a mile west of the Lucerne mine. From 2012 through 2016, the Company mined and processed approximately 2.6 million tons of mineralized material, and produced 59,515 ounces of gold and 735,252 ounces of silver. The Company did not have any gold or silver production or mining revenue during 2017 or 2018.
During the fourth quarter of 2017, the Company entered into an Option Agreement (the “Option Agreement”) with Tonogold Resources, Inc. (“Tonogold”) where Tonogold has the right to lead engineering, development, drilling and test-work, all towards completing a technical and economic feasibility assessment and ultimately, to earn into a joint venture for the future development and mining of mineral resources on the Lucerne Property.
17
Current Exploration Projects - District-wide
The Company's long-term plans contemplate the exploration and development of specific, identified geological target areas across the District that the Company has grouped into two resource areas: the Lucerne and the Dayton resource areas, and three groups of exploration targets: the Spring Valley, Occidental, and Gold Hill targets. These targets represent over 7 miles of mineralized strike length, with current and historical grades of gold and silver. Refer to Figure 1.

Figure 1 - General Overview of Priority Exploration Targets
18
Lucerne Resource Area
During the fourth quarter of 2017, the Company entered into the Option Agreement that gives Tonogold the right to lead engineering, development, drilling and test-work, towards completing a technical and economic feasibility assessment , to earn into a joint venture for the future development and mining of mineral resources on the Lucerne Property.
After the initial six-month evaluation, Tonogold elected to proceed and paid the Company a $2.0 million payment. The Company immediately used $1.4 million of those proceeds, as required, to pay down its Debenture. Tonogold can now earn a 51% interest in the Lucerne Property, by advancing the Lucerne exploration and development activities and making cumulative capital expenditures on the Lucerne Property of $7.0 million by October 3, 2019, and $20 million (inclusive of the $7.0 million requirement) by April 3, 2021. To date, approximately $3 million has been expended. Tonogold also has the option to purchase 51% of certain property, plant and equipment for a purchase price of $25 million, or, alternatively, enter into a toll processing agreement with the Company. If Tonogold elects the tolling alternative, Comstock would retain 100% ownership and Tonogold would rent the Company’s processing facility, paying the Company a usage fee of $1 million per annum plus $1 per ton processed. Tonogold also has a right of first refusal if the Company, in its sole discretion, elects, to sell the Dayton mining properties.
Tonogold has retained the independent mining advisory firm of Mine Development Associates (MDA) to publish National Instrument 43-101 (“NI-43-101”) compliant, updated resource estimate for the Lucerne Project, expected to be released during the fourth quarter of 2018.
19
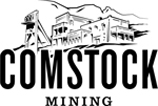
Dayton Resource Area
The Company plans to advance the Dayton Project to full feasibility, with a production ready mine plan within the next two years. The plan includes expanding the current resource at the Dayton resource area and continuing southerly into Spring Valley with incremental expansion programs that include exploration and definition drilling of targets identified by the prior conventional percussion, RC and diamond core drill programs and magnetic, IP and resistivity geophysical surveys (see Figure 2).
The Company has retained the independent mining advisory firm of Behre Dolbear to produce a National Instrument 43-101 (“NI 43-101”) compliant technical report for the Dayton resource area, scheduled for completion in the first quarter of 2019. The reporting scope includes an updated, robust mineral resource estimate, plans for expanding and further developing the mineral resource estimate and most of the prerequisite data for a subsequent Preliminary Economic Assessment (“PEA”). The PEA is the first major step in determining overall economic feasibility for the Dayton project.
The Company previously estimated a mineral resource for Dayton as part of a broader technical report for the Comstock Mine Projects but this Behre Dolbear commissioned technical report represents the first stand-alone NI 43-101 technical report to be published only for the Dayton resource area. Since our last Dayton resource estimate, the Company has:
|
•
|
Increased the Dayton project property position, both mining claims and private land, including more than 350 acres of contiguous private lands suitable for a dedicated mineral processing site;
|
|
•
|
Achieved a landmark Lyon County Master Plan and zoning change that broadened the potential land uses and restored mining as an appropriate use for the historic mining patents;
|
|
•
|
Restored the historic Dayton mine portals for safe exploration of the accessible mine workings;
|
|
•
|
Completed underground geologic mapping of the accessible mine workings and completed underground sampling;
|
|
•
|
Completed significant assaying and other analysis for furthering the geologic interpretation;
|
|
•
|
Identified new, broader mineralized zones and structures;
|
|
•
|
Drilled 408 shallow holes totaling 30,819 feet, identifying new mineralized structures covered by shallow alluvium;
|
|
•
|
Improved, meaningfully, the geologic mapping of the area;
|
|
•
|
Expanded Cycladex trials, a strategic investee, testing their patented, cycladextrin lixiviant, a potential alternative to cyanide heap leaching for our Dayton materials; and
|
|
•
|
Commenced trials with Itronics, Inc., using their KAM-Thio metallurgical recovery processes, another potential alternative to cyanide heap leaching for our Dayton materials.
|
The Company announced assay results from a recently uncovered, high-grade shear zone in the Dayton adit. Systematic channel sampling revealed a 90.8 foot (27.7m) mineralized shear zone, starting 245 feet (74.7m) inside the adit. The results for the entire, 90.8 feet averaged 0.043 opt gold (1.47g/t) and 0.404 opt silver (13.8g/t). The zone included 7.5 feet averaging 0.121 opt gold (4.14g/t) and 0.753 opt silver (25.8g/t). Multi-element assays confirmed the presence of previously-identified, elevated values for additional elements such as Cadmium, Selenium, and Tungsten. Additional drilling is being targeted to determine the lateral and down-dip extents of this mineralization
In-house Dayton engineering and mine planning have resulted in profiling various economic shells with multiple cutoff grade scenarios. Multiple layout plans for the mine and corresponding processing facilities have been conceptually developed and located on lands 100% privately held by the Company, thus simplifying and shortening the critical permitting chain. A definition drill plan is in place and is permitted. An expanded drill plan is currently being designed and detailed plans will be submitted to the regulatory agencies for permitting. In addition to infrastructure and drill planning, we performed due diligence assisted by SRK Consulting in both Reno and Denver offices. The due diligence resulted in confirmation of the scoping level mine plans and agreement on the conceptual processing layout.
The volcanic host rocks and structural controls of the mineralization defined to date for the Dayton resource area are known to continue south into Spring Valley. Potentially economic gold mineralization has been intercepted in several widely spaced holes drilled during prior Spring Valley drilling programs. The technical staff has identified multiple drill targets within several specific locations that encompass the Dayton resource area and Spring Valley. The new targets are based on the Company's latest review of previous geophysical studies and an updated, current interpretation of the geology.
20
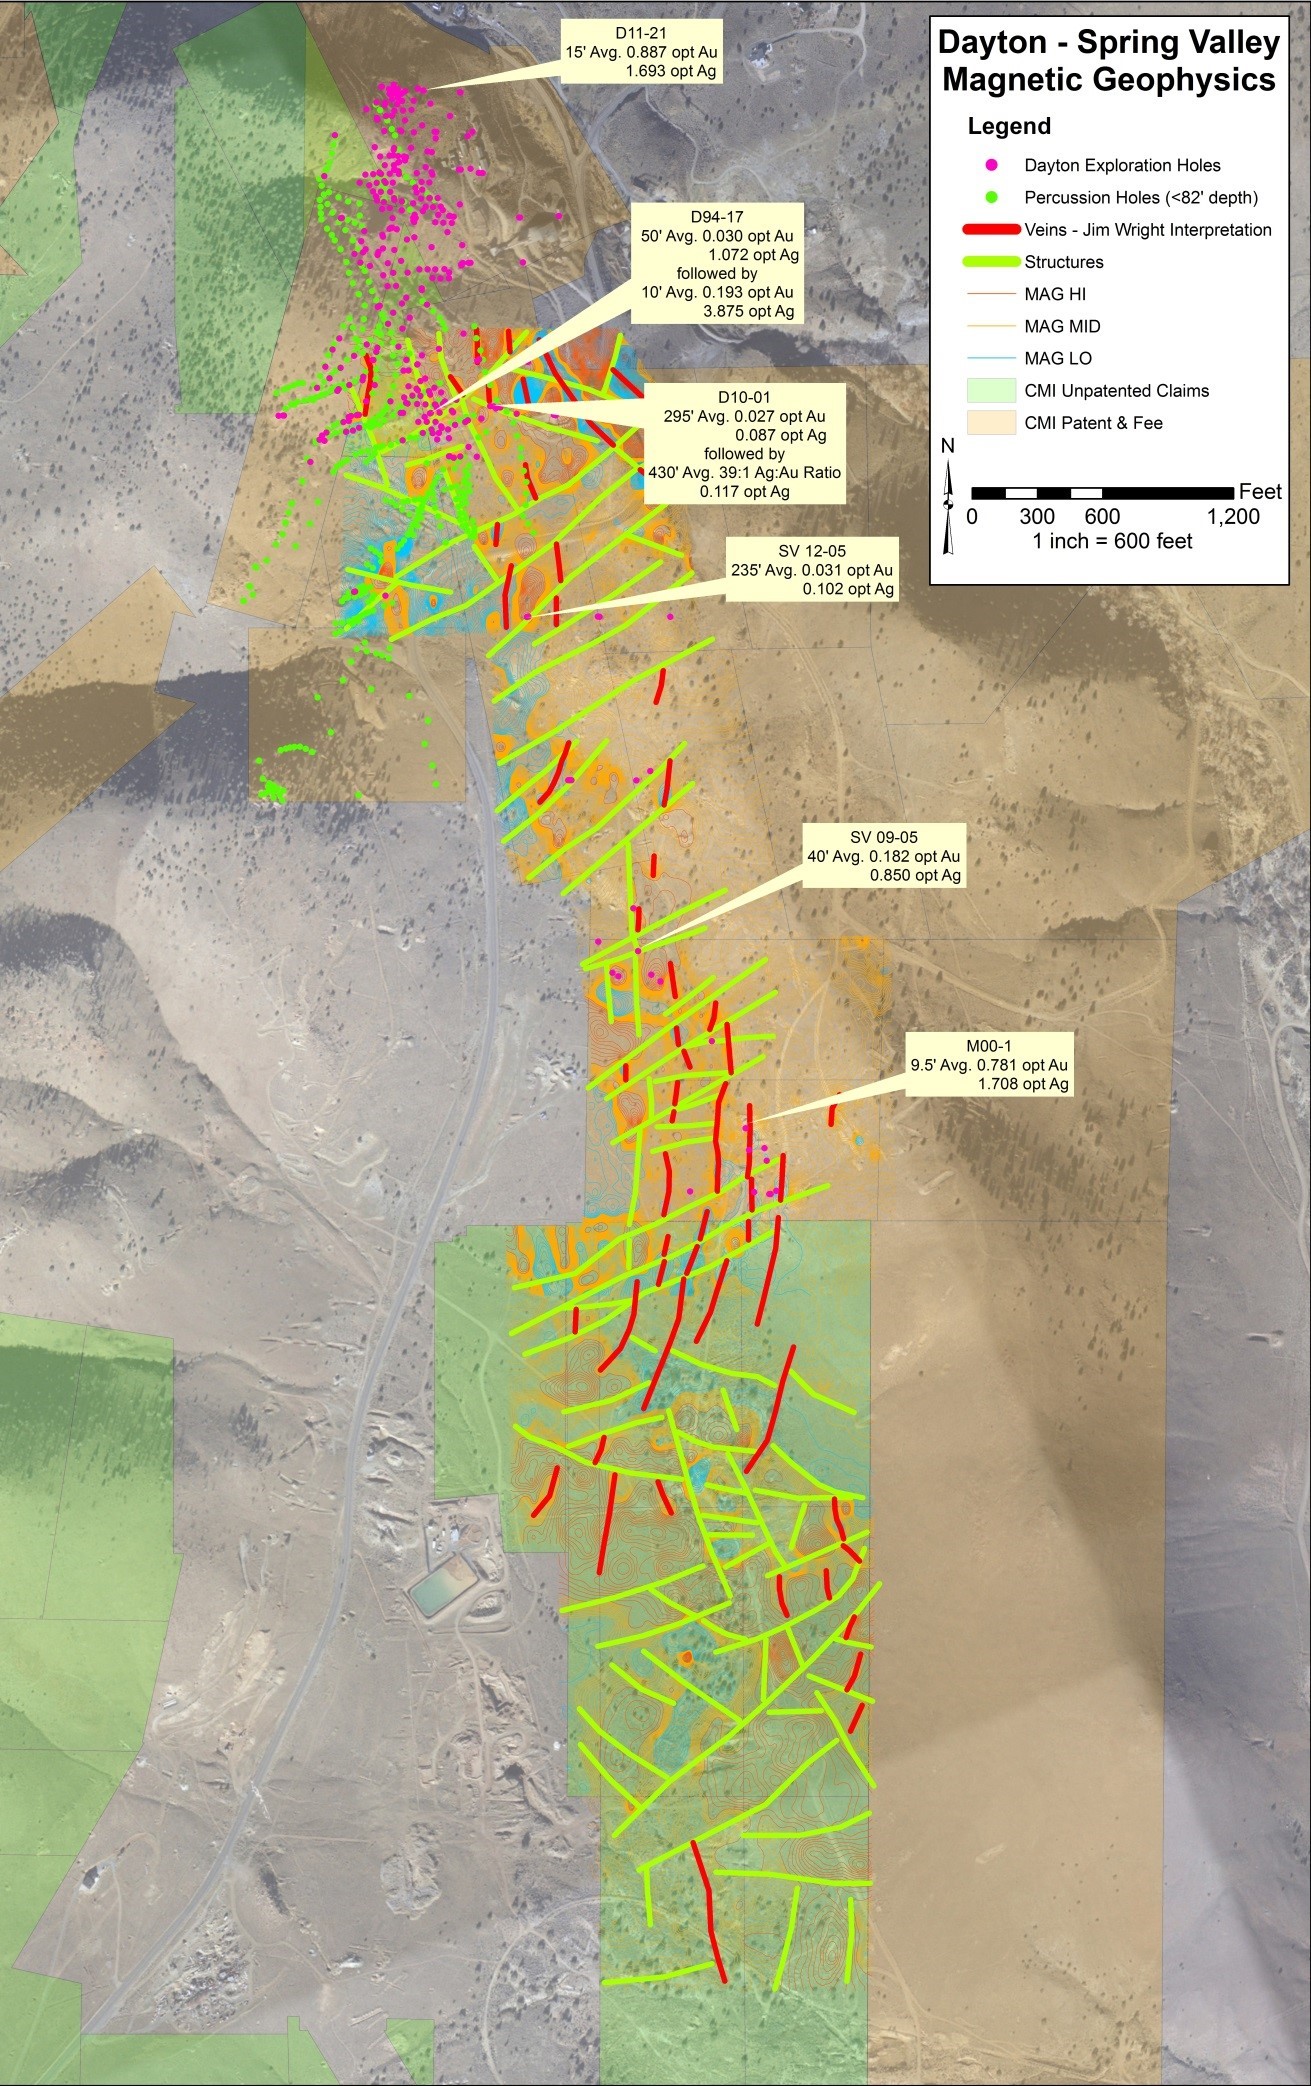
Figure 2 - Dayton and Spring Valley Magnetic Geophysics with Interpreted Veins and Structures
21
Dayton - Spring Valley Group Targets
Spring Valley is located south of the Dayton resource area and south and east of State Route 341. Ground magnetic geophysical surveys identified a linear anomalous corridor, defined by a series of relative magnetic lows. Altered volcanic host rocks have been intercepted by limited drilling and identified several mineralized zones, the global Dayton resource foot print is outlined with reference to the technical report authored by Behre Dolbear in January 2013. The exploration of Spring Valley will include phased drilling programs that will continue southerly from SR341 to the historic Daney mine site (Figure 3), with a potential strike length of approximately 9,600 feet.
The technical staff reviewed historic geologic and geophysical studies and prior drill programs that focused upon the Dayton resource area and extensions south into Spring Valley. The few drill holes that were completed in Spring Valley intercepted altered Miocene volcanic rock known to host the economic mineralization of the Dayton resource. Specific drill holes that encountered highly mineralized zones are highlighted on Figure 2. Collectively, several specific locations were selected and are targeted for future drilling. The Dayton resource area has open ended economic mineralization requiring additional drill holes to delineate the geometry for mine planning. South of the Dayton resource area, the limited drilling coupled with the geophysical interpretation indicates the targeted exploration model extends an additional 8,000 feet (length of geophysical magnetic survey) into Spring Valley.
The zone is further defined by the trace of interpreted north/south trending vein swarms. In the Dayton resource area the increased density of the vein swarms with intersecting cross structures has been indicative to host the higher grades and larger volumes of economic mineralization. This scenario is part of the exploration model and has generated a multiple drill target environment.
Figure 3 - Dayton and Spring Valley Group Targets
22
Dayton Metallurgy
The Dayton mineralized material has been subjected to metallurgical testing by independent laboratories as well as in the Company’s on-site lab. Column tests were conducted by McClelland Laboratories in 2011 on medium grade and high grade composites from the Dayton Pit area, at 1” and ½” crush sizes for each sample. The gold recovery after 154 days averaged 86.7% for gold and 47.4% for silver. The final report stated that at the end of the test, the curves had flattened, but recovery was still increasing.
In early 2018, the Company’s in-house lab ran column tests on bulk samples from three different locations in the Dayton resource area: Glory Hole mid-grade, Glory Hole high-grade, and Dayton Adit. Two columns were loaded from each bulk sample. The recovery after 74 days averaged 84% for gold and 55% for silver. The metal recovery had not stopped after 74 days, but the daily incremental increases were below the Company’s analytical detection limits.
The Company is working with strategic partners to test alternative, greener technologies for processing the mineralized material from the Dayton resource area. This includes trials by Cycladex, Inc., a strategic investee, in part funded by the National Science Foundation, for extensive testing of their patented, cycladextrin lixiviant, a potential alternative to traditional cyanide heap leaching.
The Company has also begun trials with Itronics, Inc., to test their KAM-Thio metallurgical recovery processes as an alternative to cyanide heap leaching for processing the Dayton mineralized material. Previous trials by Itronics showed promising results for recovering substantially all the residual silver from the Company’s previously leached material. The Company delivered a bulk sample of higher-grade, Dayton mineralized material to Itronics in August. Itronics has begun testing with two clear objectives: first, to model the same process flow sheet that they developed for processing the previously leached material, and second, to test the ability of the KAM-Thio liquid to recover significant percentages of gold as well as silver. A final result from the testing will be a proposed processing flow sheet and screening level economics for use in the preliminary economic assessment of the Dayton resource.
The ongoing testing of alternative technologies underpins the Company’s commitment to responsible development of the Dayton resource. A breakthrough with any of these cleaner technologies could result in higher, faster recoveries with reduced waste, as well as a streamlined permitting process and lower long-term reclamation costs.
Pelen-Sutro Tunnel Company Acquisition
In January of 2018, the Company issued
1,475,410
shares of restricted common stock as initial payment to acquire
25%
of the total membership interests of Pelen, LLC. Pelen LLC, is the 100% owner of the historic Sutro Tunnel Company that owns the Town of Sutro, the historic 6-mile Sutro Tunnel, the federal land grants and mining rights spanning 1,000 feet on each side of the 6-mile span, the rights to the tunnel’s water and the patented mining claims and private lands on Gold Hill.
The purchase of the membership interests will close once the seller of the membership interests has received total cash proceeds of at least
$585,000
either through sale of the restricted common stock received or through additional cash payments made by the Company. If all of the shares of restricted common stock have been sold by the seller of the membership interests and the aggregate proceeds received are less than
$585,000
, then the Company is required to pay the shortfall in either additional shares of the Company’s common stock or cash, at the Company’s election.
As of September 30, 2018, the purchase has not closed and the Company has not received legal ownership of the membership interests. The Company has recorded a make-whole liability of
$369,000
at September 30, 2018 representing the value of the shortfall as of September 30, 2018.
23
Operating Costs
Throughout the year ended December 31, 2017, and continuing into 2018, the Company focused on reducing operating costs, including mining, real estate, exploration and mine development, mine claims, environmental and reclamation and general and administrative costs. Operating costs and expenses have declined by about
$1.7 million
when comparing the nine month period ended September 30, 2017, to the nine month period ended September 30, 2018, and the Company expects total year over year savings of approximately $2.0 million when comparing the full year of 2018 to 2017. These savings are in addition to the over $6 million in savings when having compared the full year 2017 to 2016. The Company has aggressively implemented organizational changes consistent with the transition from mining the Lucerne surface mine to growing our resource portfolio and related exploration and development activities toward production-ready mining projects.
The Company established monthly Board of Director compensation at $2,000, established meeting fees of $1,000 per meeting and approved Board Committee Chairpersons payments of $15,000 per year.
Operating expenses for the full year 2018, are anticipated to be $4.2 million, excluding $3.2 million in depreciation and $1.4 million of interest expense.
Outlook
We are positioned and focused on real asset and equity value appreciation for 2018, while concurrently eliminating our debt and growing quality gold and silver resources and reserves throughout this year and next. Our longer-term goal is to deliver up to $500 million of accretive share value by 2020, by acquiring, joint venturing, exploring and developing resources and reserves capable of sustaining production of more than 100,000 gold-equivalent ounces per annum.
Our streamlining in 2017 lowered operating costs in all categories by well over $6 million as compared to 2016, exceeding our targets while still growing our land positions, expanding our entitlements and permitted infrastructure, and maintaining our internal engineering, geological, metallurgical, land and financial competencies. These 2017 actions already have realized an additional
$1.7 million
in annual savings expected to total $2.0 million in annual savings for 2018, as compared to 2017. We are lean and well positioned to grow our resources, our assets and our equity value during 2018.
Tonogold has retained the independent mining advisory firm of Mine Development Associates (MDA) to publish National Instrument 43-101 (“NI-43-101”) compliant, updated resource estimate for the Lucerne Project, expected to be released during the fourth quarter of 2018.
We plan to advance the Dayton Project by updating the resource estimate and providing preliminary economic feasibility and technical reporting in the first quarter of 2019. The plan also includes expanding the current resource at the Dayton and continuing southerly into Spring Valley with incremental expansion programs that include exploration and definition drilling of targets identified by geophysical surveys.
The Company has accelerated its efforts to monetize its non-mining properties. The Gold Hill Hotel and the Daney Ranch are both under contract at sales prices totaling $4 million, during the fourth quarter of 2018. The Company will use all of those proceeds, as required, for paying down its debenture by 45%. The Company also owns a 98 acre Certified Industrial Site adjacent to the Silver Springs Airport. This area continues to be of external interest as industrial, commercial and retail demand continues to develop. We plan on monetizing the remaining non-mining assets in the first half of 2019, eliminating the remaining debt and further strengthening our balance sheet.
Equity Raises
For the three months ended September 30, 2018, the Company issued 9,333,000 shares of common stock through the Company’s equity purchase agreement. Gross proceeds from the issuance of shares totaled approximately $
1.5 million
at an average price per share of
$0.165
.
24
Comparative Financial Information
The Company had two operating segments as of
September 30, 2018
: mining and real estate.
The comparative financial information is reflected in the following table:
Three Months Ended:
|
September 30, 2018
|
September 30, 2017
|
Change
|
|||||||||
|
Revenue - mining
|
$
|
—
|
|
$
|
—
|
|
$
|
—
|
|
||
|
Revenue - real estate
|
32,281
|
|
26,960
|
|
5,321
|
|
|||||
|
|
|
||||||||||
|
Costs applicable to mining revenue
|
717,155
|
|
846,443
|
|
(129,288
|
)
|
|||||
|
Real estate operating costs
|
12,887
|
|
19,396
|
|
(6,509
|
)
|
|||||
|
Exploration and mine development
|
241,902
|
|
240,020
|
|
1,882
|
|
|||||
|
Mine claims and costs
|
(291,602
|
)
|
235,535
|
|
(527,137
|
)
|
|||||
|
Environmental and reclamation
|
88,612
|
|
152,075
|
|
(63,463
|
)
|
|||||
|
General and administrative
|
801,157
|
|
571,931
|
|
229,226
|
|
|||||
|
Loss from operations
|
(1,537,830
|
)
|
(2,038,440
|
)
|
500,610
|
|
|||||
|
OTHER INCOME (EXPENSE)
|
|||||||||||
|
Interest expense
|
(340,548
|
)
|
(442,610
|
)
|
102,062
|
|
|||||
|
Other income (expense)
|
(166,732
|
)
|
(15,961
|
)
|
(150,771
|
)
|
|||||
|
NET LOSS
|
$
|
(2,045,110
|
)
|
$
|
(2,497,011
|
)
|
$
|
451,901
|
|
||
The Company ceased processing material from its leach pad in December 2016, resulting in no mining revenues in the three months ended
September 30, 2018
, and 2017, respectively.
Net loss was
$2.0 million
for the three months ended
September 30, 2018
, as compared to a net loss of
$2.5 million
for the three months ended
September 30, 2017
. The
$0.5 million
decrease was primarily related to a decrease in depreciation expense and $0.7 million in reimbursements recognized from the Tonogold Option Agreement.
Cost applicable to mining revenue decreased by approximately
$0.1 million
during the three months ended
September 30, 2018
, as compared to the same period ended
September 30, 2017
, primarily due to reduced depreciation expenses.
Mine claims and costs decreased by approximately
$0.5 million
during the three months ended
September 30, 2018
, as compared to the same period ended
September 30, 2017
, primarily due to reimbursements paid by Tonogold per the Option Agreement.
General and administrative costs increased by
$0.2 million
during the three months ended
September 30, 2018
, as compared to the same period
September 30, 2017
. In 2017, we recognized approximately
$0.1 million
in gains on the sales of excess vehicles and water rights, which reduced the general and administrative expenses for the comparable prior year period. Otherwise, expenses would have been flat year-over year.
Interest expense decreased by
$0.1 million
during the three months ended
September 30, 2018
, as compared to the same period
September 30, 2017
, primarily due to lower, average principal balances of the debenture and notes payable.
Other expenses increased by
$0.2 million
during the three months ended
September 30, 2018
, as compared to the same period
September 30, 2017
, primarily due to the increase of the make-whole liability accrual for Pelen LLC.
25
Nine Months Ended
:
|
September 30, 2018
|
September 30, 2017
|
Change
|
|||||||||
|
Revenue - mining
|
$
|
—
|
|
$
|
—
|
|
$
|
—
|
|
||
|
Revenue - real estate
|
83,946
|
|
73,624
|
|
10,322
|
|
|||||
|
Costs applicable to mining revenue
|
2,174,618
|
|
2,663,188
|
|
(488,570
|
)
|
|||||
|
Real estate operating costs
|
29,858
|
|
59,342
|
|
(29,484
|
)
|
|||||
|
Exploration and mine development
|
700,088
|
|
782,124
|
|
(82,036
|
)
|
|||||
|
Mine claims and costs
|
(20,346
|
)
|
744,528
|
|
(764,874
|
)
|
|||||
|
Environmental and reclamation
|
208,866
|
|
669,390
|
|
(460,524
|
)
|
|||||
|
General and administrative
|
2,355,320
|
|
2,189,828
|
|
165,492
|
|
|||||
|
Loss from operations
|
(5,364,458
|
)
|
(7,034,776
|
)
|
1,670,318
|
|
|||||
|
OTHER INCOME (EXPENSE)
|
|||||||||||
|
Interest expense
|
(1,054,775
|
)
|
(1,297,546
|
)
|
242,771
|
|
|||||
|
Other income (expense)
|
(526,113
|
)
|
128,409
|
|
(654,522
|
)
|
|||||
|
NET LOSS
|
$
|
(6,945,346
|
)
|
$
|
(8,203,913
|
)
|
$
|
1,258,567
|
|
||
The Company ceased processing material from its leach pad in December 2016, resulting in no mining revenues in the nine months ended
September 30, 2018
and 2017, respectively.
Net loss was
$6.9 million
for the nine months ended
September 30, 2018
, as compared to a net loss of
$8.2 million
for the same period ended
September 30, 2017
. The
$1.3 million
decrease was related to lower expenses, primarily due to lower depreciation expense and lower net operating expense from reimbursements recognized from the Option Agreement.
Cost applicable to mining revenue decrease by approximately
$0.5 million
during the nine months ended
September 30, 2018
, as compared to the same period ended
September 30, 2017
, primarily due to reduced depreciation expenses.
Mine claims and costs decreased by approximately
$0.8 million
during the nine months ended
September 30, 2018
, as compared to the same period ended
September 30, 2017
, primarily due to reimbursements paid by Tonogold per the Option Agreement.
Environmental and reclamation costs decreased by
$0.5 million
during the nine months ended
September 30, 2018
September 30, 2018, as compared to the same period ended
September 30, 2017
, primarily due to reimbursements paid by Tonogold per the Option Agreement and a reduction in asset retirement obligation costs.
General and administrative costs increased by approximately
$0.2 million
during the nine months ended
September 30, 2018
, as compared to the same period
September 30, 2017
. In 2017, we recognized approximately
$0.1 million
in gains on the sales of excess vehicles and water rights, which reduced the general and administrative expenses for the comparable prior year period. Otherwise, expenses would have been flat year-over year.
Interest expense decreased by
$0.2 million
during the nine months ended
September 30, 2018
, as compared to the same period ended
September 30, 2017
, primarily due to lower average principal balances of the debenture and notes payable.
Other expenses increased by
$0.7 million
during the nine months ended
September 30, 2018
, as compared to the same period
September 30, 2017
, primarily due to the increase in the make-whole for Pelen LLC of
$0.4 million
and the increase in the make-whole for the Debenture of
$0.2 million
.
26
Liquidity and Capital Resources
Total current assets are
$9.0 million
at
September 30, 2018
, including cash and cash equivalents on hand of
$1.2 million
. The Company’s current capital resources include these cash and cash equivalents and other working capital resources, certain planned, non-mining asset sales with expected net proceeds of approximately $14 million and other existing financing arrangements.
Net cash used in operating activities was
$3.5 million
for the
nine
months ended
September 30, 2018
, as compared to net cash used in operating activities of
$5.1 million
for the
nine
months ended
September 30, 2017
. The decrease in cash used in operating activities was related to cost savings realized by the Company in non-mining costs and higher reimbursements from the Tonogold Option Agreement. On October 5, 2018, the Company received
$0.5 million
from Tonogold in reimbursement for expenses for the month of August 2018.
Net cash used in investing activities for the
nine
months ended
September 30, 2018
, was
$1.0 million
, as compared to net cash provided byinvesting activities of
$0.8 million
for the nine months ended September 30, 2017, primarily due to deposits made in 2018 relating to the purchase of DTSS LLC and the related purchase of 160 acres of land.
Net cash provided by financing activities for the
nine
months ended
September 30, 2018
, was
$3.7 million
, including $2 million received from Tonogold for the Option Agreement payment, and $
3.7 million
from the issuance of common stock, net of issuance costs. Net cash provided by financing activities for the nine months ended
September 30, 2017
, was
$6.4 million
, including
$5.9 million
from the issuance of common stock, net of issuance costs, and
$9.4 million
from long-term debt obligations, offset by the pay-down of long-term debt obligations of approximately
$8.6 million
.
The accompanying unaudited condensed consolidated financial statements have been prepared in conformity with accounting principles generally accepted in the United States of America and contemplates continuation of the Company as a going concern.
The Company commenced production with the Lucerne Mine in 2012, which ramped up to approximately
20,000
gold-equivalent-ounces of annual production. The Company completed leaching from its existing leach pads in December 2016, and is currently planning the exploration and development of its next two mines, first with its second surface mine in the Dayton Resource area and then further developing, in collaboration through an option agreement with Tonogold, the second phase of development and ultimately, resuming production from the Lucerne Mine.
The Company’s current capital resources include cash and cash equivalents and other net working capital resources, along with a loan commitment agreement with
$7.0 million
in unused capacity after consideration of fees due at the time of borrowing. The Company has an existing equity purchase agreement (the "Purchase Agreement") with Leviston Resources, LLC ("Leviston") with unused capacity of
$1.4 million
. These capital resources are in addition to certain planned non-mining asset sales.
The Company has recurring net losses from operations and an accumulated deficit of
$229.5 million
at
September 30, 2018
. For the
nine
month period ended
September 30, 2018
, the Company incurred a net loss of
$6.9 million
and used
$3.5 million
of cash in operations. As of
September 30, 2018
, the Company had cash and cash equivalents of
$1.2 million
, current assets of
$9.0 million
and current liabilities of
$1.8 million
, resulting in positive net current working capital of
$7.2 million
.
While the Company has been successful in the past in obtaining the necessary capital to support its operations, including registered equity financings from its existing shelf registration statement, borrowings, or other means, there is no assurance that the Company will be able to obtain additional equity capital or other financing, if needed. However, the Company believes it will have sufficient funds to sustain its operations during the next 12 months from the date the financial statements were issued as a result of the funding sources detailed above.
Future operating expenditures above management’s expectations, including exploration and mine development expenditures in excess of amounts to be raised from the issuance of equity under the Purchase Agreement, declines in the market value of properties held for sale, or declines in the share price of the Company's common stock would adversely affect the Company’s results of operations, financial condition and cash flows. If the Company was unable to obtain any necessary additional funds, this could have an immediate material adverse effect on liquidity and could raise substantial doubt about the Company’s ability to continue as a going concern. In such case, the Company could be required to limit or discontinue certain
27
business plans, activities or operations, reduce or delay certain capital expenditures or sell certain assets or businesses. There can be no assurance that the Company would be able to take any such actions on favorable terms, in a timely manner or at all.
Critical Accounting Policies and Estimates
There have not been any material changes to the critical accounting policies and estimates previously disclosed in our Annual Report on Form 10-K for the year ended
December 31, 2017
.
28
ITEM 3.
QUANTITATIVE AND QUALITATIVE DISCLOSURES ABOUT MARKET RISK
There have been no material changes in the market risks discussed in Item 7A of our Annual Report on Form 10-K.
A. Disclosure
Evaluation of Disclosure Controls and Procedures
As of the end of the period covered by this Quarterly Report on Form 10-Q, management performed, with the participation of our Principal Executive Officer and our Principal Financial Officer, an evaluation of the effectiveness of our disclosure controls and procedures as defined in Rules 13a-15(e) and 15d-15(e) of the Securities Exchange Act of 1934 (“Exchange Act”). Our disclosure controls and procedures are designed to ensure that information required to be disclosed in the reports we file or submit under the Exchange Act is recorded, processed, summarized and reported within the time periods specified in the Exchange Act and the SEC’s rules, and that such information is accumulated and communicated to our management, including our Principal Executive Officer and Principal Financial Officer, to allow timely decisions regarding required disclosures. There are inherent limitations to the effectiveness of any system of disclosure controls and procedures, including the possibility of human error and the circumvention or overriding of the controls and procedures. Accordingly, even effective disclosure controls and procedures can only provide reasonable assurance of achieving their control objectives. Our Principal Executive Officer and Principal Financial Officer concluded that, as of
September 30, 2018
, our disclosure controls and procedures were effective.
Design and Evaluation of Internal Control over Financial Reporting
Our management is responsible for establishing and maintaining adequate internal control over financial reporting as defined in Exchange Act Rules 13a-15(f) and 15d-15(f). Our management assessed the effectiveness of our internal control over financial reporting as of
September 30, 2018
. In making this assessment, management used the criteria for effective internal control over financial reporting described in the “Internal Control-Integrated Framework” (2013) set forth by the Committee of Sponsoring Organizations of the Treadway Commission (COSO). Based on the assessment, management concluded that, as of
September 30, 2018
, our internal control over financial reporting was effective based on those criteria.
B. Internal Control over Financial Reporting
No change in our internal control over financial reporting, as such term is defined in Exchange Act Rule 13(a)-15, occurred during the fiscal quarter ended
September 30, 2018
, that materially affected or is reasonably likely to materially affect our internal control over financial reporting.
29
Item 1.
Legal Proceedings.
The Company’s mining and exploration activities are subject to various laws and regulations governing the protection of the environment. These laws and regulations are continually changing and are generally becoming more restrictive. The Company believes its operations are in compliance with applicable laws and regulations in all material respects. The Company has made, and expects to make in the future, expenditures to comply with such laws and regulations, but cannot predict the full amount of such future expenditures.
On January 31, 2014, the Comstock Residents Association (the “CRA”) and two of its members filed a civil action in the Third Judicial District Court of the State of Nevada in and for Lyon County (the “District Court”) against the Lyon County Board of Commissioners (the “Commissioners”) and the Company, asking the District Court to reverse the Commissioners’ decision to grant an application for master plan amendment and zone change submitted and approved by the Commissioners on January 2, 2014 (the “Application”).
Prior to the approval of the Application, the master plan designation and zoning precluded mining on certain property of the Company in the area of Silver City, Lyon County. In April 2015, the District Court ruled in favor the Company and the Commissioners. The written Order Denying Petition for Judicial Review was filed and mailed to all parties on June 15, 2015. On July 14, 2015, the CRA and one individual (together “Appellants”) filed a Notice of Appeal of the Court Order, appealing the decision to the Nevada Supreme Court. On December 9, 2015, Appellants filed their Opening Brief in the Nevada Supreme Court, generally repeating the arguments that were made at the District Court. On January 15, 2016, the Company and the Commissioners jointly filed an Answering Brief. Briefing in the Nevada Supreme Court was completed with the Appellants’ filing of a Reply Brief on March 3, 2016. An oral argument before a three-judge panel of the Nevada Supreme Court took place on September 14, 2016.
On December 2, 2016, the Nevada Supreme Court entered an order affirming all three of the District Court’s decisions associated with 1) the Commissioners’ discretion and authority for changing master plans and zoning, 2) their compliance with Nevada’s Open Meeting Law and 3) their compliance with Nevada statutory provisions. Specifically, the Supreme Court affirmed the District Court’s conclusions that Lyon County did not abuse its discretion and that it acted with substantial evidence in support of their decision, that the County did not violate Nevada’s Open Meeting Law and that the County did not violate statutory provisions regarding master plans.
The Supreme Court did reverse the District Court’s dismissal of CRA’s claim of a due process violation, concluding that this claim should not have been dismissed and that further proceedings are necessary in the District Court on this single claim. The Company and the Commissioners filed a motion for summary judgment with the District Court based on the evidence in the record and the District Court held a hearing on December 11, 2017. The District Court concluded that the Supreme Court's reversal of CRA's due process claim required that CRA be afforded the opportunity to conduct discovery. Therefore, the District Court has allowed a limited time for CRA to conduct discovery on its due process claim, The Company responded to the CRA discovery request on February 20, 2018 and the District Court held a hearing on April 23, 2018. Additional discovery was allowed by the District Court and has been completed. Briefing on the due process claim was completed on October 17, 2018 and the matter has been submitted for a final ruling from the Court.
From time to time, we are involved in lawsuits, claims, investigations and proceedings that arise in the ordinary course of business. There are no other matters pending that we expect to have a material adverse impact on our business, results of operations, financial condition or cash flows.
There have not been any material changes to the risk factors previously disclosed in our Annual Report on Form 10-K for the year ended
December 31, 2017
.
Item 2.
Unregistered Sales of Equity Securities and Use of Proceeds.
On August 16, 2018, the Company issued
2,727,273
shares of Common Stock in a private placement in the amount of
$450,000
, at a price per share of
$0.165
. The use of proceeds were for deposits on land acquisitions and general corporate purposes. The private placement was exempt from the Securities Act pursuant to Section 4(a)(2) of the Securities Act.
30
Item 3.
Defaults Upon Senior Securities.
None.
Item 4.
Mine Safety Disclosures.
Pursuant to the Dodd-Frank Wall Street Reform and Consumer Protection Act, and Item 104 of Regulation S-K, we are required to disclose items believed to be violations of the Federal Mine Safety and Health Act of 1977, any health and safety standard, or any regulation, as administered by the Federal Mine Safety and Health Administration. The required information is included in Exhibit 95 to this report.
Item 5.
Other Information.
None
31
Item 6.
Exhibits.
The exhibits required to be filed as a part of this Report on Form 10-Q are listed in the Exhibit Index attached hereto, which is incorporated herein by reference.
(1) Financial statements filed as part of this Report:
|
|
|
|
|
|
(2) Exhibits filed as part of this Report:
See Exhibits for which the Exhibit number is noted with an asterisk on the Exhibit Index attached hereto.
|
Exhibit
Number
|
Exhibit
|
|
|
31*
|
||
|
32*
|
||
|
95*
|
||
|
101*
|
Interactive Data File (Quarterly Report on Form 10-Q, for the quarterly period ended September 30, 2017, furnished in XBRL (extensible Business Reporting Language)).
|
|
|
Attached as Exhibit 101 to this report are the following documents formatted in XBRL: (i) the Condensed Consolidated Balance Sheets at September 30, 2018 and December 31, 2017, (ii) the Condensed Consolidated Statements of Operations for the six and nine months ended September 30, 2018 and 2017, (iii) the Condensed Consolidated Statements of Cash Flows for the nine months ended September 30, 2018 and 2017 and (iv) the Notes to the Condensed Consolidated Financial Statements, tagged as blocks of text. Users of this data are advised pursuant to Rule 406T of Regulation S-T that this interactive data file is deemed not filed or part of a registration statement or prospectus for purposes of sections 11 or 12 of the Securities Act of 1933, is deemed not filed for purposes of section 18 of the Securities and Exchange Act of 1934, and otherwise is not subject to liability under these sections.
|
||
* Filed herewith.
32
SIGNATURES
Pursuant to the requirements of the Securities Exchange Act of 1934, the registrant has duly caused this report to be signed on its behalf by the undersigned thereunto duly authorized.
|
COMSTOCK MINING, INC.
|
|||
|
(Registrant)
|
|||
|
Date:
|
October 30, 2018
|
By:
|
/s/ Corrado De Gasperis
|
|
Name: Corrado De Gasperis
|
|||
|
Title: President, Chief Executive Officer and Executive Chairman (Principal Executive Officer and Principal Financial Officer)
|
|||
33
TABLE OF CONTENTS
Part I Financial InformationItem 1. Financial StatementsItem 2. Management S Discussion and Analysis Of Financial Condition and Results Of OperationsItem 3. Quantitative and Qualitative Disclosures About Market RiskItem 4. Controls and ProceduresPart II - Other InformationItem 1. Legal ProceedingsItem 1A. Risk FactorsItem 2. Unregistered Sales Of Equity Securities and Use Of ProceedsItem 3. Defaults Upon Senior SecuritiesItem 4. Mine Safety DisclosuresItem 5. Other InformationItem 6. Exhibits