LOWES COMPANIES INC
10-Ks and 10-Qs
|
|
|
|
|
|
|
|
|
|
|
|
|
|
|
|
|
|
|
|
|
|
|
|
|
|
|
|
|
|
|
|
|
|
|
|
|
|
|
|
|
|
|
|
|
|
|
|
|
|
|
|
|
|
|
|
|
|
|
UNITED STATES
SECURITIES AND EXCHANGE COMMISSION
Washington, D.C. 20549
FORM 10-K
(Mark One)
|
x
|
ANNUAL REPORT PURSUANT TO SECTION 13 OR 15(d) OF THE SECURITIES EXCHANGE ACT OF 1934
|
For the fiscal year ended
January 31, 2014
or
|
o
|
TRANSITION REPORT PURSUANT TO SECTION 13 OR 15(d) OF THE SECURITIES EXCHANGE ACT OF 1934
|
For the transition period from ________ to _________
Commission file number
1-7898
LOWE'S
COMPANIES, INC
.
(Exact name of registrant as specified in its charter)
|
NORTH CAROLINA
|
56-0578072
|
|
(State or other jurisdiction of incorporation or organization)
|
(I.R.S. Employer Identification No.)
|
|
1000 Lowe's Blvd., Mooresville, NC
|
28117
|
|
(Address of principal executive offices)
|
(Zip Code)
|
|
|
|
|
Registrant's telephone number, including area code
|
704-758-1000
|
Securities registered pursuant to Section 12(b) of the Act:
|
Title of each class
|
|
Name of each exchange on which registered
|
||
|
Common Stock, $0.50 Par Value
|
|
New York Stock Exchange (NYSE)
|
||
Indicate by check mark if the registrant is a well-known seasoned issuer, as defined in Rule 405 of the Securities Act.
|
x
|
Yes
|
o
|
No
|
Indicate by check mark if the registrant is not required to file reports pursuant to Section 13 or Section 15(d) of the Exchange Act.
|
o
|
Yes
|
x
|
No
|
Indicate by check mark whether the registrant (1) has filed all reports required to be filed by Section 13 or 15(d) of the Securities Exchange Act of 1934 during the preceding 12 months (or for such shorter period that the registrant was required to file such reports), and (2) has been subject to such filing requirements for the past 90 days.
|
x
|
Yes
|
o
|
No
|
Indicate by check mark whether the registrant has submitted electronically and posted on its corporate Web site, if any, every Interactive Data File required to be submitted and posted pursuant to Rule 405 of Regulation S-T (§232.405 of this chapter) during the preceding 12 months (or for such shorter period that the registrant was required to submit and post such files).
|
x
|
Yes
|
o
|
No
|
Indicate by check mark if disclosure of delinquent filers pursuant to Item 405 of Regulation S-K (§229.405 of this chapter) is not contained herein, and will not be contained, to the best of registrant's knowledge, in definitive proxy or information statements incorporated by reference in Part III of this Form 10-K or any amendment to this Form 10-K.
x
Indicate by check mark whether the registrant is a large accelerated filer, an accelerated filer, a non-accelerated filer, or a smaller reporting company. See the definitions of “large accelerated filer,” “accelerated filer,” and “smaller reporting company” in Rule 12b-2 of the Exchange Act. (Check one):
|
Large accelerated filer
x
|
Accelerated filer
o
|
Non-accelerated filer
o
|
Smaller reporting company
o
|
Indicate by check mark whether the registrant is a shell company (as defined in Rule 12b-2 of the Exchange Act).
|
o
|
Yes
|
x
|
No
|
As of
August 2, 2013
, the last business day of the Company's most recent second quarter, the aggregate market value of the registrant’s common stock held by non-affiliates of the registrant was
$47.8 billion
based on the closing sale price as reported on the New York Stock Exchange.
Indicate the number of shares outstanding of each of the registrant's classes of common stock, as of the latest practicable date.
|
CLASS
|
|
OUTSTANDING AT March 28, 2014
|
||
|
Common Stock, $0.50 par value
|
|
1,018,776,409
|
||
DOCUMENTS INCORPORATED BY REFERENCE
|
Document
|
|
Parts Into Which Incorporated
|
||
|
Portions of the Proxy Statement for Lowe’s 2014 Annual Meeting of Shareholders
|
|
Part III
|
||
LOWE’S COMPANIES, INC.
- TABLE OF CONTENTS -
|
|
Page No.
|
||
|
PART I
|
|
||
|
|
Item 1.
|
||
|
|
Item 1A.
|
||
|
|
Item 1B.
|
||
|
|
Item 2.
|
||
|
|
Item 3.
|
||
|
|
Item 4.
|
||
|
|
|
||
|
|
|
|
|
|
PART II
|
|
||
|
|
Item 5.
|
||
|
|
Item 6.
|
||
|
|
Item 7.
|
||
|
|
Item 7A.
|
||
|
|
Item 8.
|
||
|
|
Item 9.
|
||
|
|
Item 9A.
|
||
|
|
Item 9B.
|
||
|
|
|
|
|
|
PART III
|
|
||
|
|
Item 10.
|
||
|
|
Item 11.
|
||
|
|
Item 12.
|
||
|
|
Item 13.
|
||
|
|
Item 14.
|
||
|
|
|
|
|
|
PART IV
|
|
||
|
|
Item 15.
|
||
|
|
|
|
|
|
|
|
||
General Information
Lowe’s Companies, Inc. and subsidiaries (the Company or Lowe’s) is a Fortune® 100 company and the world’s second largest home improvement retailer. As of
January 31, 2014
, Lowe's operated
1,832
home improvement and hardware stores in the United States, Canada and Mexico representing approximately
200 million
square feet of retail selling space.
Our home improvement stores were comprised of 1,717 stores located across 50 U.S. states,
35
stores in Canada and
eight
stores in Mexico. In addition, in August 2013, the Company acquired the majority of the assets of Orchard Supply Hardware (Orchard), a neighborhood hardware and backyard store focused on paint, repair and the backyard (Orchard stores), primarily located in densely populated markets in California. Orchard stores average approximately 36,000 square feet of retail selling space, and generally serve similar customers as the Lowe's home improvement store. As of the acquisition date, Orchard represented less than 2% of the Company's consolidated net sales. As of January 31, 2014, the Company operated 72 Orchard stores located in the U.S.
Lowe’s was incorporated in North Carolina in 1952 and has been publicly held since 1961. The Company’s common stock is listed on the New York Stock Exchange - ticker symbol “LOW”.
See Item 6, “Selected Financial Data”, of this Annual Report on Form 10-K, for historical revenues, profits and identifiable assets. For additional information about the Company’s performance and financial condition, see also Item 7, “Management’s Discussion and Analysis of Financial Condition and Results of Operations”, of this Annual Report on Form 10-K.
Our Promise
We strive to be customers’ first choice for home improvement. Customers expect that we will not only sell the products they need and want, but also deliver a full solution. Our goal is to make the process of home improvement as seamless and simple as possible, while ensuring we remain relevant to our customers. We have several initiatives designed to deliver seamless and simple experiences, which include evolving our sales culture across all selling channels, upgrading and continuously enhancing our information technology infrastructure, and allowing access to customers’ project and product status at all relevant touch points.
Customers, Market and Competition
Our Customers
We serve homeowners, renters and professional customers (Pro customer). Individual homeowners and renters, which represent our retail customers, complete a wide array of projects and vary along the spectrum of do-it-yourself (DIY) and do-it-for-me (DIFM). The Pro customer consists of two broad categories: construction trades; and maintenance, repair & operations.
Our Market
We are among the many businesses, including home centers, paint stores, hardware stores, lumber yards and garden centers, whose revenues are included in the Building Material and Garden Equipment and Supplies Dealers Subsector (444) of the Retail Trade Sector of the North American Industry Classification System (NAICS), the standard used by Federal statistical agencies in classifying business establishments for the purpose of collecting, analyzing, and publishing statistical data related to the U.S. business economy. The total annual revenue reported for businesses included in NAICS 444 in
2013
was $312 billion, which represented an increase of 6.0% from the total amount reported in
2012
. The total annual revenue reported for businesses included in NAICS 444 in
2012
was $294 billion, which represented an increase of 5.4% over the amount reported for
2011
.
NAICS 444 represents less than half of what we consider the total market for our products and services. The broader market in which Lowe’s operates includes home-related sales through a variety of companies beyond those in NAICS 444. These consist of other companies in the retail sector, including mass retailers, home furnishings stores, and online retailers, as well as wholesalers that provide home-related products and services to homeowners, businesses, and the government. Based on our analysis of the most recent comprehensive data available, we estimate the size of the U.S. home improvement market at $637 billion in
2013
, comprised of $481 billion of product sales and $156 billion of installed labor sales.
4
There are many variables that affect consumer demand for the home improvement products and services Lowe’s offers. Key indicators we monitor include real disposable personal income, employment, home prices, and housing turnover. We also monitor demographic and societal trends that shape home improvement industry growth.
|
•
|
Real disposable personal income is projected to grow at a stronger pace in
2014
than in
2013
. The
2013
gain was depressed by tax increases, and dividend and bonus payments that were accelerated in
2012
. Real disposable personal income is forecasted to increase 2.3% in calendar
2014
, up from the 0.7% gain recorded in
2013
, based on the March
2014
Blue Chip Economic Indicators
®
. *
|
|
•
|
The average unemployment rate for
2014
is forecasted to decline to 6.4%, according to the March
2014
Blue Chip Economic Indicators, which would be an improvement from the 7.4% average recorded in
2013
. The unemployment rate should continue to trend lower as the job market continues to expand at a moderate pace.
|
|
•
|
Recent evidence suggests that home prices will continue to increase. In
2013
, home price appreciation improved to an estimated 4.0%, according to the Federal Home Finance Agency index, up from flat growth in
2012
. The gains were driven by increasing demand and lower inventories of homes for sale. Economists generally expect home price growth to moderate in 2014 but remain positive.
|
|
•
|
Housing turnover increased 9.0% in
2013
, according to The National Association of Realtors and U.S. Census Bureau, compared with 9.7% growth in 2012. However, turnover remains 34% below its peak in 2005. Turnover is generally expected to continue to increase in
2014
, though at a more moderate rate.
|
These indicators are important to our business because they impact income available to purchase our products and services, or signal a customer's willingness to engage in home maintenance, repair, and upgrade projects. Currently, these indicators suggest moderately improving consumer demand for the home improvement products and services we sell. However, in the persisting uncertain economic environment, we continue to balance implementation of our long-term growth plans with our near-term focus on improving performance and maintaining adequate liquidity.
Our Competition
The home improvement retailing business includes many competitors. We compete with other home improvement warehouse chains and lumberyards in most of our trade areas. We also compete with traditional hardware, plumbing, electrical and home supply retailers. In addition, we compete with general merchandise retailers, mail order firms, warehouse clubs, online and other specialty retailers. Our customers value reputation, customer experience, quality and price of merchandise, and range and availability of products and services. Location of stores also continues to be a key competitive factor in our industry. However, the increasing use of technology and the simplicity of online shopping also underscore the importance of multi-channel presence as a competitive factor. See further discussion of competition in Item 1A, “Risk Factors”, of this Annual Report on Form 10-K.
Products and Services
Our Products
Product Selection
To meet customers’ varying home improvement needs, we offer a complete line of products for maintenance, repair, remodeling, and decorating. We offer home improvement products in the following categories: Kitchens & Appliances; Lumber & Building Materials; Tools & Hardware; Fashion Fixtures; Rough Plumbing & Electrical; Lawn & Garden; Seasonal Living; Paint; Home Fashions, Storage & Cleaning; Flooring; Millwork; and Outdoor Power Equipment. A typical Lowe's home improvement store stocks approximately 36,000 items, with hundreds of thousands of items available through our Special Order Sales system, Lowes.com, Lowes.ca and ATGstores.com. See Note
17
of the Notes to Consolidated Financial Statements included in Item 8, “Financial Statements and Supplementary Data”, of this Annual Report on Form 10-K for historical revenues by product category for each of the last three fiscal years.
*Blue Chip Economic Indicators
® (ISSN: 0193-4600) is published monthly by Aspen Publishers, 76 Ninth Avenue, New York, NY 10011, a division of Wolters Kluwer Law and Business. Printed in the U.S.A.
5
We are committed to offering a wide selection of national brand-name merchandise complemented by our selection of private brands. In addition, we are dedicated to ensuring product is sourced in a responsible, efficient, and cost effective manner through our supply chain.
National Brand-Name Merchandise
In many product categories, customers look for a brand they know and trust to instill confidence in their purchase. Each Lowe’s home improvement store carries a wide selection of national brand-name merchandise such as Whirlpool
®
appliances and water heaters, GE
®
, LG
®
and Samsung
®
appliances, Stainmaster
®
carpets, Valspar
®
paints and stains, Pella
®
windows and doors, Sylvania
®
light bulbs, Dewalt
®
power tools, Owens Corning
®
roofing, Johns Manville
®
insulation, James Hardie
®
fiber cement siding, Husqvarna
®
outdoor power equipment, Werner
®
ladders and many more. Our merchandise selection provides the retail and Pro customer a one-stop shop for a wide variety of national brand name merchandise needed to complete home improvement, repair, maintenance or construction projects.
Private Brands
Private brands are an important element of our overall portfolio, helping to differentiate the Lowe's shopping experience from the competition. We sell private brands throughout our stores including Tools & Hardware, Seasonal Living, Home Fashions, Storage & Cleaning, Paint, Fashion Fixtures, Flooring, Millwork, Rough Plumbing & Electrical, and Lumber & Building Materials. Some of Lowe’s most important private brands include Kobalt
®
tools, allen+roth
®
home décor products, Blue Hawk
®
home improvement products, Project Source
®
basic value products, Portfolio
®
lighting products, Garden Treasures
®
lawn and patio products, Utilitech
®
electrical and utility products, Reliabilt
®
doors and windows, Aquasource
®
faucets, sinks and toilets, Harbor Breeze
®
ceiling fans, Top Choice
®
lumber products and Iris
®
home automation and management products.
Supply Chain
We source our products from over 7,000 vendors worldwide with no single vendor accounting for more than 6% of total purchases. We believe that alternative and competitive suppliers are available for virtually all of our products. Whenever possible, we purchase directly from manufacturers to provide savings for customers and improve our gross margin.
To efficiently move product from our vendors to our stores and maintain in-stock levels, we own and operate 15 highly-automated Regional Distribution Centers (RDC) in the United States. Through our RDCs, products are received from vendors, stored and picked or cross-docked, and then shipped to our retail locations. On average, each domestic RDC serves approximately 115 stores. We also lease and operate a distribution facility to serve our Canadian stores.
We also operate 15 flatbed distribution centers to distribute merchandise that requires special handling due to size or type of packaging such as lumber, boards, panel products, pipe, siding, ladders and building materials. Additionally, we operate five facilities to support our import and e-commerce businesses and flexible fulfillment capabilities. Flexible fulfillment allows the customer to order parcel post eligible products that are stocked in an RDC, a store, or in a vendor's distribution center, and have them shipped directly to a home or place of business. Most items can be ordered and delivered within two business days at standard shipping rates. We also utilize three third-party transload facilities, which are the first point of receipt for imported products. The transload facilities sort and allocate products to RDCs based on individual store demand and forecasts. In addition, we use warehouse space for other operations.
On average, in fiscal
2013
, approximately 75% of the total dollar amount of stock merchandise we purchased was shipped through our distribution network, while the remaining portion was shipped directly to our stores from vendors.
Our Services
Installed Sales
We offer installation services through independent contractors in many of our product categories, with Flooring, Millwork and Kitchens & Appliances accounting for the majority of installed sales. Our Installed Sales model, which separates selling and project administration tasks, allows our sales associates to focus on project selling, while project managers ensure that the details related to installing the products are efficiently executed. Installed Sales, which includes both product and labor, accounted for approximately 7% of total sales in fiscal
2013
.
ProServices
Lowe’s ProServices is focused on supporting the Pro customer by providing them with the products and services they need to support their business and making it easier for them to shop at Lowe's. ProServices includes a team of employees who are dedicated to supporting the Pro customer-both in the store and at their place of business. In our stores, we have dedicated specialists assigned to answer questions and dedicated loaders to help them get back to their job site quickly. Our Account
6
Executives ProServices develop and manage overall relationships with large regional businesses, home offices, branches of national customers and existing business accounts, and our National Account representatives assist customers doing business with Lowe’s across the country.
To provide value for Pro customers, we offer five key ways to save: our 5% off purchases every day when they use Lowe's proprietary credit; our Lowe's Business Replenishment Program; contractor packs, which provide lower unit pricing for larger quantity purchases; Quote Support Program (QSP), which provides volume pricing on purchases over certain dollar limits; and reduced delivery rates to the job site. Through our Business Replenishment Program, we can keep the Pro customer stocked with the supplies they need, and replenish their stock when and where they need it, no matter where they work. The Pro customer can save time by ordering their supplies online, over the phone, or by fax, and we will have the order ready for in-store pick-up or we can provide delivery directly to their job site or office. In addition, we provide job lot quantities in categories such as Lumber & Building Materials, Tools & Hardware, Rough Plumbing & Electrical, Paint, and Outdoor Power Equipment, that are critical to the success of their business.
Extended Protection Plans and Repair Services
We offer extended protection plans in Kitchens & Appliances, Tools & Hardware, and Outdoor Power Equipment. Lowe’s extended protection plans provide customers with product protection that enhances or extends the manufacturer’s warranty. We provide in-warranty and out-of-warranty repair services for major appliances, outdoor power equipment and tools through our stores or in the home through our Lowe’s Authorized Service Repair Network. Our contact center takes the calls, assesses the problems, and facilitates the resolutions making after-sales service simpler for customers because we manage the entire process.
Credit Financing
We offer a proprietary consumer credit card for retail customers under an agreement with GE Capital Retail Bank. This program provides Lowe's consumer credit cardholders with 5% off their purchases every day. For purchases above $299, customers have their choice of short-term no-interest financing or the 5% off value. For purchases above $3,500, customers have their choice of the following: 5.99% interest for 84 months; short-term no-interest financing; or the 5% off value.
We also offer proprietary credit programs for Pro customers. They include a Lowe’s Business Account, which is ideal for small to medium size businesses and offers minimum monthly payments, and Lowe’s Accounts Receivable, which is ideal for medium to large size businesses that pay in full each month. These programs provide a 5% discount to Pro customers when they use their Lowe’s business credit account. We also offer the Lowe’s Business Rewards Card from American Express®, which also offers 5% off everyday purchases.
For additional information regarding our credit programs, see the summary of our significant accounting policies in Note 1 of the Notes to Consolidated Financial Statements included in Item 8, “Financial Statements and Supplementary Data”, of this Annual Report on Form 10-K.
MyLowes
®
MyLowes is an online tool that makes managing, maintaining and improving homes simpler and more intuitive. Using the capabilities provided by MyLowes, customers can create home profiles, save room dimensions and paint colors, organize owners' manuals and product warranties, create shopping, to-do and wish lists for projects on the horizon, set recurring reminders for common maintenance items and store purchase history from across all Lowe's channels.
Selling Channels
We have multiple channels through which we engage customers and sell our products and services, including in-store, online, on-site and contact centers. Although we sell through all of these channels, our primary channel to fulfill customer orders continues to be our retail home improvement stores. Regardless of the channel through which customers choose to engage with us, we strive to provide them with a seamless experience and an endless aisle of products, enabled by our flexible fulfillment capabilities.
In-Store
Our 1,760 home improvement stores are generally open seven days per week and average approximately 112,000 square feet of retail selling space, plus approximately 32,000 square feet of outdoor garden center selling space. Our stores offer similar products and services, with certain variations based on local market factors. We continue to develop and implement tools to make our sales associates more efficient and to integrate our order management and fulfillment processes. Our home improvement stores have Wi-Fi capabilities that provide customers with internet access, making information available quickly
7
to further simplify the shopping experience. In addition, we also operate 72 Orchard stores that serve similar customers as the Lowe’s home improvement store, but in more densely populated markets.
Online
Through Lowes.com, Lowes.ca, ATGstores.com and mobile applications, we seek to empower consumers by providing a 24/7 shopping experience and help reduce the complexity of product decisions and home improvement projects by providing online product information, customer ratings and reviews, online buying guides and how-to videos and information. These tools help consumers make more informed purchasing decisions and give them confidence as they undertake home improvement projects. Providing mobile technology and applications to customers and to our associates is an important step towards seamless and simple experiences, and allows us to participate in the evolution to mobile technology. In 2013, sales through our online selling channels, which include Lowes.com, Lowes.ca and ATGstores.com, accounted for approximately 2% of our total sales. We also enable customers to choose from a variety of fulfillment options, including buying online and picking up in-store as well as parcel shipment to their homes.
On-Site
We have on-site specialists available to retail and Pro customers to assist them in selecting products and services for their projects. Account Executives ProServices meet with Pro customers at their place of business or on a job site and leverage stores within the area to ensure we meet customer needs for products and resources. Our Project Specialist Exteriors (PSE) program is available in all Lowe’s stores to discuss exterior projects such as roofing, siding, fencing, and windows, whose characteristics lend themselves to an in-home consultative sales approach. In addition, our Project Specialist Interiors (PSI) program is available in certain locations to provide similar consultative services on interior projects such as kitchens and bathrooms.
Contact Centers
Lowe’s has two primary contact centers which are located in Wilkesboro, NC, and Albuquerque, NM. These contact centers provide direct support to Lowe's customers by tendering sales, coordinating purchase deliveries, facilitating repair services, and answering general customer questions via phone, e-mail, social media, or letters.
Employees
As of
January 31, 2014
, we employed approximately 167,000 full-time and 95,000 part-time employees. No employees in the U.S. or Canada are subject to collective bargaining agreements. Certain employees in Mexico are subject to collective bargaining agreements. Management considers its relations with employees to be good.
Seasonality and Working Capital
The retail business in general is subject to seasonal influences, and our business is, to some extent, seasonal. Historically, we have realized the highest volume of sales during our second fiscal quarter (May, June and July) and the lowest volume of sales during our fourth fiscal quarter (November, December and January). Accordingly, our working capital requirements have historically been greater during our fourth fiscal quarter as we build inventory in anticipation of the spring selling season and as we experience lower fourth fiscal quarter sales volumes. We fund our working capital requirements primarily through cash flows generated from operations, but also with short-term borrowings, as needed. For more detailed information, see the Financial Condition, Liquidity and Capital Resources section in Item 7, “Management’s Discussion and Analysis of Financial Condition and Results of Operations”, of this Annual Report on Form 10-K.
Intellectual Property
The name “Lowe’s” is a registered service mark of one of our wholly-owned subsidiaries. We consider this mark and the accompanying name recognition to be valuable to our business. This subsidiary has various additional trademarks, trade names and service marks, many of which are used in our private brand program. The subsidiary also maintains various Internet domain names that are important to our business. We also own registered and unregistered copyrights, and maintain patent portfolios related to some of our products and services and seek to patent or otherwise protect certain innovations that we incorporate into our products, services, or business operations.
Environmental Stewardship
Lowe’s recognizes how efficient operations can help protect the environment and our bottom line. We examine our operations regularly to deliver efficiencies in energy and water use, fuel consumption, and waste and recycling. We also invest in technology that will help us operate our facilities more efficiently and environmentally responsibly. For example, at our
8
recently opened RDC in Rome, Ga., the distribution center was designed to use high-efficiency, light-emitting diode (LED) fixtures for outdoor security lighting.
We strive to deliver products to our stores in a fuel-efficient and an environmentally responsible manner through participation in the SmartWay® Transport Partnership, an innovative program launched by the U.S. Environmental Protection Agency (EPA) in 2004 that promotes cleaner, more fuel-efficient transportation options. Lowe’s received a 2013 SmartWay Excellence Award from the EPA, our fifth consecutive SmartWay honor, for initiatives that resulted in reduced emissions, greater fuel efficiency and less overall highway congestion. We have also increased shipping of products by rail and increased the efficiency of truckload shipments from and to our RDCs.
We continue to take steps to improve our recycling programs and reduce the amount of waste we generate. Through these efforts, we are able to reduce our disposal costs and minimize the impact on the environment of the operation of our stores and other facilities. We also offer convenient recycling for our customers at many of our stores for items such as rechargeable batteries and compact fluorescent light bulbs.
Additionally, we continue to focus on helping consumers reduce their energy and water use and their environmental footprint while saving money when they purchase our products and services. We offer a wide selection of environmentally responsible and energy-efficient products for the home, including ENERGY STAR
®
appliances, WaterSense
®
labeled toilets, paint with no volatile organic compounds (VOC), and indoor and outdoor LED lighting. Through our in-home sales specialists, we offer customers installation of insulation and energy efficient windows.
The EPA honored our long standing-leadership as a retailer of energy-efficient products by awarding Lowe's our fourth consecutive ENERGY STAR Sustained Excellence Award (2010-2013). Lowe’s has received 11 consecutive ENERGY STAR awards (2003-2013), including four ENERGY STAR Partner of the Year awards for educating consumers about the benefits of energy efficiency. In 2013, the EPA WaterSense program also honored Lowe’s long-standing efforts with its first-ever Sustained Excellence Award. The honor represents our fifth consecutive award for employee training, consumer education and national efforts to promote water conservation.
We annually track our carbon footprint and participate in the Carbon Disclosure Project, an independent nonprofit organization hosting the largest database of primary corporate climate change information in the world. To further reduce our footprint, we incorporate energy-efficient technologies and architectural systems into new stores and retrofits of existing stores, such as energy-efficient lighting, white membrane cool roofs and HVAC units that meet or exceed ENERGY STAR qualifications. We also participate in demand response programs where we voluntarily reduce our lighting and HVAC loads during peak demand periods to support electric grid reliability.
For more information on Lowe’s environmental leadership efforts, please visit Lowes.com/SocialResponsibility.
Compliance with Environmental Matters
Our operations are subject to numerous federal, state and local laws and regulations that have been enacted or adopted regulating the discharge of materials into the environment, or otherwise relating to the protection of the environment. These laws and regulations may increase our costs of doing business in a variety of ways, including indirectly through increased energy costs, as utilities, refineries, and other major emitters of greenhouse gases are subjected to additional regulation or legislation that seeks to better control greenhouse gas emissions. We do not anticipate any material capital expenditures during fiscal
2014
for environmental control facilities or other costs of compliance with such laws or regulations.
Reaching Out / Our Community
Lowe’s has a long and proud history of supporting local communities through public education and community improvement projects, beginning with the creation of the Lowe’s Charitable and Educational Foundation in 1957. In 2013, Lowe’s and the Lowe’s Charitable and Educational Foundation contributed nearly $25 million to schools and community organizations in the United States, Canada and Mexico.
Our commitment to improving educational opportunities is best exemplified by our signature education grant program, Lowe’s Toolbox for Education
®
. The program has benefited more than five million
schoolchildren since 2006, funding improvements at 940 schools in 49 states in 2013.
For more than a decade, we’ve been working with national nonprofit partners to strengthen and stabilize neighborhoods in the communities we serve. In 2013, Lowe’s contributed more than $6 million and teamed with Habitat for Humanity and
9
Rebuilding Together to bring housing solutions and hope to families across the country. We also continued to build on our longstanding partnerships with SkillsUSA, the Boys & Girls Clubs of America and The Nature Conservancy to improve communities and build tomorrow’s leaders.
Lowe’s is also committed to helping residents of the communities we serve by being there when we’re needed most - when a natural disaster threatens and in the recovery that follows. In 2013, Lowe’s committed more than $2 million and mobilized hundreds of Lowe’s Heroes (employee volunteers) to help families recover and rebuild in Colorado, Oklahoma, Illinois and other states impacted by disasters. We also surpassed $25 million in donations to the American Red Cross since our partnership began, becoming one of just a few partners to reach that milestone.
For more information on Lowe’s partnerships and latest community improvement projects, visit
Lowes.com/SocialResponsibility
and
LowesInTheCommunity.tumblr.com
.
Available Information
Our annual report on Form 10-K, quarterly reports on Form 10-Q, current reports on Form 8-K and amendments to those reports filed or furnished pursuant to Section 13(a) or 15(d) of the Securities Exchange Act of 1934, as amended, are made available free of charge through our internet website at
www.Lowes.com/investor
, as soon as reasonably practicable after such documents are electronically filed with, or furnished to, the Securities and Exchange Commission (SEC). The public may also read and copy any materials the Company files with the SEC at the SEC’s Public Reference Room at 100 F Street, NE, Washington, DC 20549. Information on the operation of the Public Reference Room may be obtained by calling the SEC at 1-800-SEC-0330. The SEC maintains an Internet site,
www.sec.gov
, that contains reports, proxy and information statements, and other information regarding issuers that file electronically with the SEC.
We have developed a risk management process using periodic surveys, external research, planning processes, risk mapping, analytics and other tools to identify and evaluate the operational, financial, environmental, reputational, strategic and other risks that could adversely affect our business. For more information about our risk management process, which is administered by our Chief Risk Officer and includes developing risk mitigation controls and procedures for the material risks we identify, see the description included in the proxy statement for our annual meeting of shareholders (as defined in Item 10 of Part III of this Annual Report on Form 10-K) under “Board’s Role in the Risk Management Process”.
We describe below all known material risks that could adversely affect our results of operations, financial condition or business prospects. These risk factors may change from time to time and may be amended, supplemented or superseded by updates to the risk factors contained in our future periodic reports on Form 10-K, Form 10-Q and reports on other forms we file with the Securities and Exchange Commission. All forward-looking statements about our future results of operations or other matters made by us in this Annual Report on Form 10-K, in our Annual Report to Lowe’s Shareholders and in our subsequently filed reports to the Securities and Exchange Commission, as well as in our press releases and other public communications, are qualified by the risks described below.
Our sales are dependent upon the health and stability of the general economy.
General economic factors and other conditions, both domestically and internationally, may adversely affect the U.S. economy, the global economy and our financial performance. These include, but are not limited to, periods of slow economic growth or recession, volatility and/or lack of liquidity from time to time in U.S. and world financial markets and the consequent reduced availability and/or higher cost of borrowing to Lowe’s and its customers, slower rates of growth in real disposable personal income, sustained high rates of unemployment, consumer debt levels, increasing fuel and energy costs, inflation or deflation of commodity prices, natural disasters, and acts of both domestic and international terrorism. The sluggish and uneven pace of the recovery from the deep global recession could continue to have an adverse effect on the rate of growth of discretionary spending by consumers and the share of such spending on home improvement products and services.
Adverse changes in economic factors specific to the home improvement industry may negatively impact the rate of growth of our total sales and comparable sales.
Sales of many of our product categories and services are driven by the activity level of home improvement projects. Although the housing market has been strengthened by favorable interest rates and lower home prices, the large number of households that continue to have little available equity, mortgage delinquency and foreclosure rates that remain abnormally high, tighter restrictions on the availability of mortgage financing, slower household formation growth rates, and lower growth in housing turnover through existing home sales, have limited, and may continue to limit, consumers’ discretionary spending, particularly on larger home improvement projects that are important to the growth of our business. Another potential risk to the home
10
improvement industry is the possibility that interest rates will rise as the Federal Reserve System follows through in 2014 and 2015 on its announced plans to gradually withdraw the economic stimulus provided in recent years.
Changes in existing or new laws and regulations or regulatory enforcement priorities could adversely affect our business.
Laws and regulations at the local, regional, state, federal and international levels change frequently, and the changes can impose significant costs and other burdens of compliance on our business and our vendors. Any changes in regulations, the imposition of additional regulations, or the enactment of any new legislation that affect employment/labor, trade, product safety, transportation/logistics, energy costs, health care, cyber-security, tax or environmental issues, could have an adverse impact, directly or indirectly, on our financial condition and results of operations. Changes in enforcement priorities by governmental agencies charged with enforcing existing laws and regulations can increase our cost of doing business. In addition, our contracts with U.S., as well as state and local government entities, are subject to various procurement regulations and other requirements, including audits and investigations, relating to their formation, administration, and performance, and we may be adversely affected by changes in the regulations or negative findings from audits or investigations.
Our business and our reputation could be adversely affected by the failure to protect sensitive customer, employee, vendor or Company information or to comply with evolving regulations relating to our obligation to protect our systems and assets and such information from the threat of cyber-attacks.
Cyber-attacks designed to gain access to sensitive information by breaching mission critical systems of large organizations are constantly evolving, and high profile electronic security breaches leading to unauthorized release of sensitive customer information have occurred recently at a number of major U.S. companies, including several large retailers, despite widespread recognition of the cyber-attack threat and improved data protection methods. While we have invested in the protection of our information technology and maintain what we believe are adequate security procedures and controls over the Company’s records and intellectual property, in addition to financial and other individually identifiable customer, employee and vendor data provided to us, a breach in our systems that results in the unauthorized release of sensitive data could nonetheless occur and have a material adverse effect on our reputation, drive customers away and lead to financial losses from remedial actions, or potential liability, including possible punitive damages. An electronic security breach resulting in the unauthorized release of sensitive data from our information systems could also materially increase the costs we already incur to protect against such risks. In addition, as the regulatory environment relating to retailers and other companies' obligation to protect such sensitive data becomes stricter, a material failure on our part to comply with applicable regulations could subject us to fines or other regulatory sanctions and potentially to lawsuits.
We have many competitors who could take sales and market share from us if we fail to execute our merchandising, marketing and distribution strategies effectively.
We operate in a highly competitive market for home improvement products and services and have numerous large and small, direct and indirect competitors. The competitive environment in which we operate is particularly challenging during periods of slower economic growth and higher unemployment. The principal competitive factors in our industry include location of stores, customer service, quality and price of merchandise and services, in-stock levels, and merchandise assortment and presentation. Our failure to respond effectively to competitive pressures and changes in the markets for home improvement products and services could affect our financial performance. Moreover, changes in the promotional pricing and other practices of our competitors, including the effects of competitor liquidation activities, may impact our results.
Our inability to effectively manage our relationships with selected suppliers of brand name products could negatively impact our business plan and financial results.
We form strategic relationships with selected suppliers to market and develop products under a variety of recognized and respected national brand names. The inability to effectively and efficiently manage and maintain the relationships with these suppliers could negatively impact our business plan and financial results.
Operating internationally presents unique challenges that have required us to adapt our store operations, merchandising, marketing and distribution functions to serve customers in Canada and Mexico and to work effectively with our joint venture partner in Australia.
A significant portion of our anticipated store growth over the next five years will be in Canada and Mexico. We are also in a joint venture with Australia’s largest retailer, Woolworths Limited, to develop a network of home improvement stores for consumers in Australia. Expanding internationally presents unique challenges that may increase the anticipated costs and risks, and slow the anticipated rate, of such expansion.
11
If the domestic or international supply chain for our products is disrupted, our sales and gross margin would be adversely impacted.
We source, stock, and sell products from over 7,000 domestic and international vendors and their ability to reliably and efficiently fulfill our orders is critical to our business success. We source a large number of those products from foreign manufacturers with China continuing to be the dominant import source. Financial instability among key vendors, political instability or labor unrest in source countries, retaliatory trade restrictions imposed by either the United States or a major source country, tariffs, currency exchange rates and transport capacity and costs are beyond our control and could negatively impact our business if they seriously disrupted the movement of products through our supply chain or increased their costs.
Because of our operations in multiple countries, we must comply with multiple laws and regulations that differ substantially from country to country.
If we fail to comply with these laws, rules and regulations, or the manner in which they are interpreted or applied, we may be subject to government enforcement ac
ti
on, litigation, damage to our reputation, civil and criminal liability, damages, fines and penalties, and increased cost of regulatory compliance, any of which could adversely affect our results of operations and financial performance. These laws, rules and regulations include import and export requirements, U.S. laws such as the Foreign Corrupt Practices Act, and local laws prohibiting corrupt payments to governmental officials. Although we have implemented policies and procedures to help ensure compliance with these laws, there can be no assurance that our employees and third parties with whom we do business will not take actions in violation of our policies or laws. We may also be subject to investigations or audits by governmental authorities and regulatory agencies, which can occur in the ordinary course of business or which can result from increased scrutiny from a particular agency towards an industry, country or practice.
If we are unable to secure or develop and implement sufficiently robust new technologies to deliver business process solutions within the appropriate time frame, cost and functionality, our strategic initiatives that are dependent upon these technologies may not be successful.
The success of our strategic initiatives designed to increase our sales and capture a greater percentage of our customers’ expenditures on home improvement projects is dependent in varying degrees on the timely delivery and the functionality of information technology systems to support them. Extended delays or cost overruns in securing, developing and otherwise implementing technology solutions to support the new business initiatives we are developing now, and will be developing in the future, would delay and possibly even prevent us from realizing the projected benefits of those initiatives.
We may be unable to make the transformational changes we are undertaking in our business model.
We are adapting our business model to meet our customers’ changing expectations that we will not only sell them the products and services they need and want, but also deliver better customer experiences. We will offer a cohesive group of products that provide relevant occasion-based solutions and will present them in an inspiring manner. Our strategies require transformational changes to our business model and will require new competencies in some positions, and our employees and independent contractors, such as third-party installers and repair technicians, will not only have to understand non-traditional selling platforms but also commit to fundamental changes in Lowe’s culture and the processes through which they have traditionally interacted with customers. To the extent they are unable or unwilling to make these transformational changes, we may be unable to operationalize our strategic initiatives, which are designed to increase our sales and capture a greater percentage of our customers’ expenditures on home improvement projects. The many challenges our management faces as we adapt our business model also increase the risk that we may not achieve our objectives.
If we fail to hire, train, manage and retain qualified sales associates and specialists with expanded skill sets who can work effectively and collaboratively in an increasingly culturally diverse environment, we could lose sales to our competitors.
Our customers, whether they are homeowners or commercial businesses, expect our sales associates and specialists to be well trained and knowledgeable about the products we sell and the home improvement services we provide. Increasingly, our sales associates and specialists must have expanded skill sets, including, in some instances, the ability to do in-home or telephone sales. In addition, in many of our stores our employees must be able to serve customers whose primary language and cultural traditions are different from their own. A critical challenge we face is attracting and retaining a sufficiently diverse workforce that can deliver a relevant, culturally competent and differentiated experience for a wide variety of culturally diverse customers. Also, as our employees become increasingly culturally diverse, our managers and sales associates must be able to manage and work collaboratively with employees whose primary language and cultural traditions are different from their own.
12
Our financial performance could suffer if we fail to properly maintain our critical information systems or if those systems are seriously disrupted.
An important part of our efforts to achieve efficiencies, cost reductions, and sales and cash flow growth is the maintenance and ongoing improvements of our existing management information systems that support operations such as inventory replenishment, merchandise ordering, transportation, receipt processing and product delivery. Our financial performance could be adversely affected if our management information systems are seriously disrupted or we are unable to maintain, improve, upgrade, and expand our systems.
As customer-facing technology systems become an increasingly important part of our multi-channel sales and marketing strategy, the failure of those systems to perform effectively and reliably could keep us from delivering positive customer experiences.
Access to the internet from computers, tablets, smart phones and other mobile communication devices has empowered our customers and changed the way they shop and how we interact with them. Our website, Lowes.com, is a sales channel for our products, and is also a method of making product, project and other relevant information available to them that impacts our in-store sales. In addition to Lowes.com, we have multiple affiliated websites and mobile apps through which we seek to inspire, inform, cross-sell, establish online communities among and otherwise interact with our customers. Performance issues with these customer-facing technology systems, including temporary outages caused by distributed denial of service or other cyber-attacks, or a complete failure of one or more of them without a disaster recovery plan that can be quickly implemented could quickly destroy the positive benefits they provide to our home improvement business and negatively affect our customers’ perceptions of Lowe’s as a reliable online vendor and source of information about home improvement products and services.
We are subject to payments-related risks that could increase our operating costs, expose us to fraud, subject us to potential liability and potentially disrupt our business.
We accept payments using a variety of methods, including credit card, debit card, credit accounts, gift cards, direct debit from a customer’s bank account, consumer invoicing, and physical bank check. These payment options subject us to compliance requirements. They also subject us to potential fraud by criminal elements seeking to discover and take advantage of security vulnerabilities that may exist in some of these payment systems. For certain payment methods, including credit and debit cards, we pay interchange and other fees, which may increase over time and raise our operating costs and lower profitability. We rely on third parties to provide payment processing services, including the processing of credit cards, debit cards, electronic checks, gift cards, and promotional financing, and it could disrupt our business if these companies become unwilling or unable to provide these services to us. We are also subject to payment card association operating rules, including data security rules, certification requirements, and rules governing electronic funds transfers, which could change or be reinterpreted to make it difficult or impossible for us to comply. If we fail to comply with these rules or requirements, or if our data security systems are breached or compromised, we may be liable for card issuing banks’ costs, subject to fines and higher transaction fees, and lose our ability to accept credit and debit card payments from our customers, process electronic funds transfers, or facilitate other types of online payments, and our business and operating results could be adversely affected. We also offer co-branded credit card programs, which could adversely affect our operating results if terminated.
Failure of a key vendor or service provider that we cannot quickly replace could disrupt our operations and negatively impact our business.
No single vendor of the products we sell accounts for more than 6% of our total purchases, but we rely upon a number of vendors as the sole or primary source of some of the products we sell. We also rely upon many independent service providers for technology solutions and other services that are important to many aspects of our business. If these vendors or service providers fail or are unable to perform as expected and we are unable to replace them quickly, our business could be adversely affected, at least temporarily, until we are able to do so and potentially, in some cases, permanently.
Failure to effectively manage our third party installers could result in increased operational and legal risks.
We use third party installers to provide installation services to our customers, and as the general contractor, are subject to regulatory requirements and risks, applicable to general contractors, including the management of the permitting, licensing and quality of our third party installers. Our failure to effectively manage such requirements and risks could result in lost sales, fines and lawsuits, as well as damage to our reputation, which could negatively affect our business.
Failure to achieve and maintain a high level of product and service quality could damage our image with customers and negatively impact our sales, profitability, cash flows and financial condition.
Product and service quality issues could result in a negative impact on customer confidence in Lowe’s and the Company’s brand image. As a result, Lowe’s reputation as a retailer of high quality products and services, including both national and Lowe’s private brands, could suffer and impact customer loyalty. Additionally, a decline in product and service quality could result in product recalls, product liability and warranty claims.
13
Future litigation or governmental proceedings could result in material adverse consequences, including judgments or settlements.
We are, and in the future will become, involved in lawsuits, regulatory inquiries, and governmental and other legal proceedings arising out of the ordinary course of our business. Some of these proceedings may raise difficult and complicated factual and legal issues and can be subject to uncertainties and complexities. The timing of the final resolutions to lawsuits, regulatory inquiries, and governmental and other legal proceedings is typically uncertain. Additionally, the possible outcomes of, or resolutions to, these proceedings could include adverse judgments or settlements, either of which could require substantial payments. None of the legal proceedings in which we are currently involved, individually or collectively, is considered material.
None.
At
January 31, 2014
, our properties consisted of
1,832
stores in the U.S., Canada and Mexico with a total of approximately
200 million
square feet of selling space. Of the total stores operating at
January 31, 2014
, approximately
86%
are owned, which includes stores on leased land, with the remainder being leased from third parties. We also operate regional distribution centers and other facilities to support distribution and fulfillment, as well as data centers and various support offices. Our executive offices are located in Mooresville, North Carolina.
We are a defendant in legal proceedings considered to be in the normal course of business, none of which, individually or collectively, is considered material.
Not applicable.
14
EXECUTIVE OFFICERS AND CERTAIN SIGNIFICANT EMPLOYEES OF THE REGISTRANT
Set forth below is a list of names and ages of the executive officers and certain significant employees of the registrant indicating all positions and offices with the registrant held by each such person and each person's principal occupations or employment during the past five years. Each executive officer of the registrant is elected by the board of directors at its first meeting after the annual meeting of shareholders and thereafter as appropriate. Each executive officer of the registrant holds office from the date of election until the first meeting of the directors held after the next annual meeting of shareholders or until a successor is elected.
|
Name
|
Age
|
Title
|
||
|
Robert A. Niblock
|
51
|
Chairman of the Board, President and Chief Executive Officer since 2011; Chairman of the Board and Chief Executive Officer, 2006 – 2011.
|
||
|
Maureen K. Ausura
|
58
|
Chief Human Resources Officer since 2012; Executive Vice President, Human Resources, 2011 – 2012; Senior Vice President, Human Resources, 2005 – 2011.
|
||
|
Gregory M. Bridgeford
|
59
|
Chief Customer Officer since 2012, Executive Vice President, Business Development, 2004 – 2012.
|
||
|
Marshall A. Croom
|
53
|
Chief Risk Officer since 2012; Senior Vice President and Chief Risk Officer, 2009 – 2012.
|
||
|
Rick D. Damron
|
51
|
Chief Operating Officer since 2012; Executive Vice President, Store Operations, 2011 – 2012; Senior Vice President, Logistics, 2009 – 2011; Senior Vice President, Store Operations – North Central Division, 2008 – 2009.
|
||
|
Matthew V. Hollifield
|
47
|
Senior Vice President and Chief Accounting Officer since 2005.
|
||
|
Robert F. Hull, Jr.
|
49
|
Chief Financial Officer since 2012; Executive Vice President and Chief Financial Officer since 2004.
|
||
|
Gaither M. Keener, Jr.
|
64
|
Chief Legal Officer, Chief Compliance Officer and Secretary since 2012; Executive Vice President, General Counsel, Secretary and Chief Compliance Officer, 2011 – 2012; Senior Vice President, General Counsel, Secretary and Chief Compliance Officer, 2006 – 2011.
|
||
|
Richard D. Maltsbarger
|
38
|
Business Development Executive since 2012; Senior Vice President, Strategy, 2011– 2012; Vice President, Strategic Planning 2010 – 2011; Vice President, Research, 2006 – 2010.
|
||
|
N. Brian Peace
|
48
|
Corporate Administration Executive since 2012; Senior Vice President, Corporate Affairs, 2006 – 2012.
|
||
|
Paul D. Ramsay
|
49
|
Acting Chief Information Officer since 2014; Senior Vice President, Information Technology, 2011 - 2014; Vice President, Information Technology, Exploration and Production, Hess Corporation, 2010 - 2011; Head of Global Infrastructure and Operations, Hess Corporation, 2005 - 2010
|
||
|
William D. Robinson
|
54
|
Head of International Operations and Development since 2012; Senior Vice President, International Operations and Customer Support Services, 2011 – 2012; Vice President, Store Operations and Special Projects, 2008 – 2010.
|
||
15
Item 5
-
Market for Registrant’s Common Equity, Related Stockholder Matters and Issuer Purchases of Equity Securities
Lowe's common stock is traded on the New York Stock Exchange (NYSE). The ticker symbol for Lowe's is “LOW”. As of
March 28, 2014
, there were
25,932
holders of record of Lowe's common stock. The following table sets forth, for the periods indicated, the high and low sales prices per share of the common stock as reported by the NYSE Composite Tape and the dividends per share declared on the common stock during such periods.
|
|
Fiscal 2013
|
Fiscal 2012
|
|||||||||||||||||||||
|
|
High
|
Low
|
Dividend
|
High
|
Low
|
Dividend
|
|||||||||||||||||
|
1st Quarter
|
$
|
39.98
|
|
$
|
35.86
|
|
$
|
0.16
|
|
$
|
32.29
|
|
$
|
26.58
|
|
$
|
0.14
|
|
|||||
|
2nd Quarter
|
45.30
|
|
38.87
|
|
0.18
|
|
31.37
|
|
24.76
|
|
0.16
|
|
|||||||||||
|
3rd Quarter
|
50.74
|
|
43.52
|
|
0.18
|
|
33.63
|
|
25.34
|
|
0.16
|
|
|||||||||||
|
4th Quarter
|
$
|
52.08
|
|
$
|
45.62
|
|
$
|
0.18
|
|
$
|
39.26
|
|
$
|
31.23
|
|
$
|
0.16
|
|
|||||
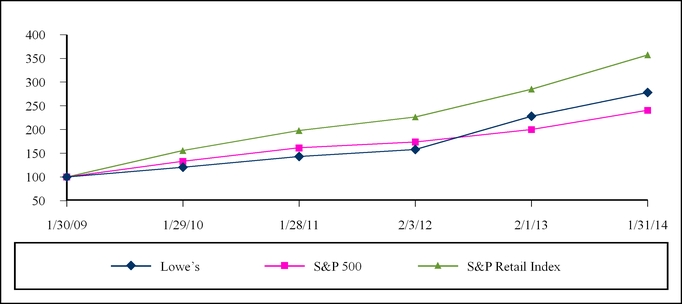
Total Return to Shareholders
The following information in Item 5 of this Annual Report on Form 10-K is not deemed to be “soliciting material” or to be “filed” with the SEC or subject to Regulation 14A or 14C under the Securities Exchange Act of 1934 or to the liabilities of Section 18 of the Securities Exchange Act of 1934, and will not be deemed to be incorporated by reference into any filing under the Securities Act of 1933 or the Securities Exchange Act of 1934, except to the extent we specifically incorporate it by reference into such a filing.
The following table and graph compare the total returns (assuming reinvestment of dividends) of the Company's common stock, the S&P 500 Index and the S&P Retailing Industry Group Index (S&P Retail Index). The graph assumes $100 invested on January 30, 2009 in the Company's common stock and each of the indices.
|
|
1/30/2009
|
|
1/29/2010
|
|
1/28/2011
|
|
2/3/2012
|
|
2/1/2013
|
|
1/31/2014
|
|
|||||||||||
|
Lowe’s
|
$
|
100.00
|
|
$
|
120.52
|
|
$
|
143.18
|
|
$
|
157.72
|
|
$
|
228.08
|
|
$
|
278.16
|
|
|||||
|
S&P 500
|
100.00
|
|
133.14
|
|
161.44
|
|
173.80
|
|
199.98
|
|
240.58
|
|
|||||||||||
|
S&P Retail Index
|
$
|
100.00
|
|
$
|
155.54
|
|
$
|
197.80
|
|
$
|
226.49
|
|
$
|
285.12
|
|
$
|
357.28
|
|
|||||
16
Issuer Purchases of Equity Securities
The following table sets forth information with respect to purchases of the Company’s common stock made during the fourth quarter of
2013
:
|
(In millions, except average
price paid per share)
|
Total Number of
Shares Purchased
1
|
|
Average Price
Paid per Share
|
|
Total Number of Shares Purchased as Part of Publicly Announced Plans or Programs
2
|
|
Dollar Value of Shares that May Yet Be Purchased Under the Plans or Programs
2
|
|
|||||
|
November 2, 2013 – November 29, 2013
3
|
4.5
|
|
$
|
48.38
|
|
4.5
|
|
$
|
2,083
|
|
|||
|
November 30, 2013 – January 3, 2014
|
9.1
|
|
47.95
|
|
9.1
|
|
1,646
|
|
|||||
|
January 4, 2014 – January 31, 2014
|
7.9
|
|
47.92
|
|
7.9
|
|
6,268
|
|
|||||
|
As of January 31, 2014
|
21.5
|
|
$
|
48.03
|
|
21.5
|
|
$
|
6,268
|
|
|||
1
During the fourth quarter of fiscal 2013, the Company repurchased an aggregate of
21.5 million
shares of its common stock. The total number of shares purchased also includes an insignificant number of shares withheld from employees to satisfy either the exercise price of stock options or the statutory withholding tax liability upon the vesting of restricted stock awards.
2
On
February 1, 2013
, the Company's Board of Directors authorized a $5.0 billion share repurchase program with no expiration. As of January 31, 2014, the Company had $1.3 billion remaining available under this authorization. On January 31, 2014, the Company's Board of Directors authorized an additional $5.0 billion of share repurchases with no expiration, increasing the total share repurchases authorized as of fiscal year end January 31, 2014 to $6.3 billion. In fiscal 2014, the Company expects to repurchase shares totaling $3.4 billion through purchases made from time to time either in the open market or through private off market transactions in accordance with SEC regulations.
3
In August 2013, the Company entered into an Accelerated Share Repurchase (ASR) agreement with a third-party financial institution to repurchase $500 million of the Company's common stock. Pursuant to the ASR agreement, the Company paid $500 million to the financial institution and received initial delivery of 9.0 million shares in the third quarter of 2013. In November 2013, the Company finalized the transaction and received an additional 1.5 million shares. The average price paid per share in settlement of the ASR agreement included in the table above was determined with reference to the volume-weighted average price of the Company's common stock over the term of the ASR agreement. See Note 9 to the consolidated financial statements in this report.
|
Selected Statement of Earnings Data
|
||||||||||||||||||||
|
(In millions, except per share data)
|
2013
|
|
2012
|
|
2011
|
|
1
|
2010
|
|
2009
|
|
|||||||||
|
Net sales
|
$
|
53,417
|
|
$
|
50,521
|
|
$
|
50,208
|
|
$
|
48,815
|
|
$
|
47,220
|
|
|||||
|
Gross margin
|
18,476
|
|
17,327
|
|
17,350
|
|
17,152
|
|
16,463
|
|
||||||||||
|
Net earnings
|
2,286
|
|
1,959
|
|
1,839
|
|
2,010
|
|
1,783
|
|
||||||||||
|
Basic earnings per common share
|
2.14
|
|
1.69
|
|
1.43
|
|
1.42
|
|
1.21
|
|
||||||||||
|
Diluted earnings per common share
|
2.14
|
|
1.69
|
|
1.43
|
|
1.42
|
|
1.21
|
|
||||||||||
|
Dividends per share
|
$
|
0.700
|
|
$
|
0.620
|
|
$
|
0.530
|
|
$
|
0.420
|
|
$
|
0.355
|
|
|||||
|
Selected Balance Sheet Data
|
|
|
|
|
|
|
|
|
|
|
||||||||||
|
Total assets
|
$
|
32,732
|
|
$
|
32,666
|
|
$
|
33,559
|
|
$
|
33,699
|
|
$
|
33,005
|
|
|||||
|
Long-term debt, excluding current maturities
|
$
|
10,086
|
|
$
|
9,030
|
|
$
|
7,035
|
|
$
|
6,537
|
|
$
|
4,528
|
|
|||||
1
Fiscal
2011
contained 53 weeks, while all other years contained 52 weeks.
17
The following discussion and analysis summarizes the significant factors affecting our consolidated operating results, financial condition, liquidity and capital resources during the three-year period ended
January 31, 2014
(our fiscal years
2013
,
2012
and
2011
). Fiscal year 2011 contains 53 weeks of operating results compared to fiscal years
2013
and
2012
which contain 52 weeks. Unless otherwise noted, all references herein for the years
2013
,
2012
and
2011
represent the fiscal years ended
January 31, 2014
,
February 1, 2013
and
February 3, 2012
, respectively. We intend for this discussion to provide the reader with information that will assist in understanding our financial statements, the changes in certain key items in those financial statements from year to year, and the primary factors that accounted for those changes, as well as how certain accounting principles affect our financial statements. This discussion should be read in conjunction with our consolidated financial statements and notes to the consolidated financial statements included in this Annual Report on Form 10-K that have been prepared in accordance with accounting principles generally accepted in the United States of America. This discussion and analysis is presented in seven sections:
|
•
|
Executive Overview
|
|
•
|
Operations
|
|
•
|
Lowe’s Business Outlook
|
|
•
|
Financial Condition, Liquidity and Capital Resources
|
|
•
|
Off-Balance Sheet Arrangements
|
|
•
|
Contractual Obligations and Commercial Commitments
|
|
•
|
Critical Accounting Policies and Estimates
|
EXECUTIVE OVERVIEW
Net earnings increased 16.7% to $2.3 billion during fiscal year 2013, and diluted earnings per share increased 26.6% to $2.14. Net sales for 2013 were $53.4 billion, a 5.7% increase over fiscal year 2012. Comparable sales were 4.8%, driven by comparable average ticket increase of 3.2% and a comparable transaction increase of 1.6%.
For 2013, cash flows from operating activities were approximately $4.1 billion, with $940 million used for capital expenditures. Our strong financial position and positive cash flows allowed us to deliver on our commitment to return excess cash to shareholders. During 2013, the company repurchased 86.7 million shares of stock for $3.7 billion and paid $733 million in dividends.
2013 Progress
As of the end of fiscal year 2013, we have substantially completed our initiatives to enhance retail relevance, including Value Improvement, Product Differentiation, and our Store Labor investment. Value Improvement has enhanced our line designs, making them more relevant to each of the markets we serve, and enabled us to maintain better in-stock positions, as well as to simplify deal structures that allow us to offer competitive prices every day. As of the end of fiscal year 2013, we have finished the first round of Value Improvement line reviews and substantially all of the associated resets. Value Improvement is now fully operationalized, which means the improved line review and product reset processes are woven into our everyday business, and we are now better positioned to meet customers’ product needs and drive better inventory productivity.
Product Differentiation has driven excitement in our stores through better display techniques, including our revised end cap strategy, which has allowed us to focus on highly innovative products and significant values and to showcase private and national brands. We also revamped promotional spaces to better promote seasonally relevant, high value items to drive sales and improve the shopping experience. Product Differentiation has been executed in 1,400 stores as of the end of fiscal year 2013 and will be rolled out to the remaining U.S. home improvement stores in the first half of 2014. In addition, as part of our Sales & Operations Planning process, we will continue to look for ways to manage this space in its most productive way.
During 2013, we had also identified an opportunity to better serve customers and close more sales during peak weekday hours by increasing the assistance available in the aisles. In the second half of 2013, we have focused on making the store labor investment more productive by refining our allocation of these hours, by store and by selling department. As we cycle the introduction of the store labor investment in the first quarter of 2014, we expect to obtain greater leverage which will contribute to greater 2014 operating profitability.
2014 Priorities
During 2014, economic forecasts suggest moderately accelerating growth in the home improvement industry. Stronger job and income growth should create a more favorable environment for consumer spending which, coupled with the lagged benefit of
18
the housing recovery, should generate continued growth in the home improvement industry. While credit conditions remain tight relative to the housing boom years, conditions are improving and household finances continue to strengthen, which should also contribute to stronger growth in 2014.
In 2014, we will build on the momentum established in 2013 as we further optimize our business model. We will also continue to focus on three priorities to drive further top-line growth. First, we will use our enhanced Sales & Operations Planning process to improve seasonal planning by market. Second, we will improve our product and service offering for the Pro customer. Third, we will continue building customer experience design capabilities.
Through our Sales & Operations Planning process, we have addressed an opportunity to improve seasonal planning, including the cadence of product introductions, promotions and staffing. While we have always planned and executed these seasons in store, previous planning was completed function-by-function and reconciled to minimize conflicts. Now the process starts earlier and is anchored on the customer mindset for the season. The process more thoroughly considers detailed input from all functions to determine resource allocation, and it enables Lowe’s to provide a consistent message and experience across all selling channels.
We also have an opportunity to better capitalize on the Pro market, which is growing faster than the consumer market. We will do this by enhancing our product and service offering with this important customer, including ensuring we have the types of products and brands Pros demand. We also want to ensure we reach our Pro through multiple channels, whether in the store where we have dedicated specialists assigned to answer questions and dedicated loaders to help them get back to the job quickly, at the Pro’s place of business where our Account Executive ProServices helps regional Maintenance, Repair, and Operations customers order and replenish products across multiple stores, or through our National Account representatives who assist customers doing business with Lowe’s across the country. In the second quarter of 2014, we will re-launch lowesforpros.com which will provide a dedicated platform for Pro customers to purchase online from Lowe’s. This site will also allow Pros to access contract pricing, develop requisition lists and view purchase history and will be enabled for convenient mobile access.
In addition, we have an opportunity to more broadly enhance the customer experience. We are developing a process to coordinate the elements of great occasion-based customer experiences that provide relevant solutions that we will present in an inspiring manner with all selling channels in mind. These experiences must meet three critical criteria: they must be desirable to our target customer; they must be feasible; and they must be viable - something we can deliver in a profitable and sustainable way. In 2014, we will continue building these customer experience design capabilities. We will also introduce a limited number of changes to our stores and website that will become a stage for future experiences.
Our top-line performance improved in 2013 as a result of our focus on cross functional collaboration and consistent execution, along with our strategic initiatives, which allowed us to more fully capitalize on market demand. In 2014, we are focused on improving our profitability, even while investing in key capabilities to drive sales growth. In addition to operationalizing and refining the 2013 initiatives, we will focus on driving more of our revenue growth to the bottom line through expense control and disciplined execution of our plans.
Beyond 2014
Over the longer-term, we remain committed to satisfying customers’ needs whenever and wherever they choose to engage with us and to differentiating with better customer experiences than any other home improvement provider. We have been investing in infrastructure, both systems and processes. Our focus is on transforming our current multi-channel offering to an omni-channel experience with our brand. Through enhanced customer service tools, we expect to improve our associates’ ability to sell seamlessly across channels, to introduce new project management tools, and to expand fulfillment capabilities beyond buy online pick-up in store, or parcel fulfillment of online orders, both of which we do today. We will cultivate personal and simple connections with customers, over and above what we have accomplished to date with MyLowes. These new capabilities are projected to be in market in 2015.
Even as we focus on optimizing our business model, driving profitability, and capitalizing on market opportunities within an improving economy, we are investing in customer experience and omni-channel capabilities to drive future sales growth and to create simpler and differentiated home improvement experiences for customers.
19
OPERATIONS
The following tables set forth the percentage relationship to net sales of each line item of the consolidated statements of earnings, as well as the percentage change in dollar amounts from the prior year. This table should be read in conjunction with the following discussion and analysis and the consolidated financial statements, including the related notes to the consolidated financial statements.
|
|
|
Basis Point Increase / (Decrease) in
Percentage of Net Sales from
Prior Year
1
|
|
Percentage Increase / (Decrease) in
Dollar Amounts
from Prior Year
1
|
|
||||
|
|
2013
|
2012
|
2013 vs. 2012
|
|
2013 vs. 2012
|
|
|||
|
Net sales
|
100.00%
|
100.00%
|
N/A
|
|
5.7
|
%
|
|||
|
Gross margin
|
34.59
|
34.30
|
29
|
|
6.6
|
|
|||
|
Expenses:
|
|
|
|
|
|
||||
|
Selling, general and administrative
|
24.08
|
24.24
|
(16
|
)
|
5.1
|
|
|||
|
Depreciation
|
2.74
|
3.01
|
(27
|
)
|
(4.0
|
)
|
|||
|
Interest - net
|
0.89
|
0.84
|
5
|
|
12.7
|
|
|||
|
Total expenses
|
27.71
|
28.09
|
(38
|
)
|
4.3
|
|
|||
|
Pre-tax earnings
|
6.88
|
6.21
|
67
|
|
17.1
|
|
|||
|
Income tax provision
|
2.60
|
2.33
|
27
|
|
17.7
|
|
|||
|
Net earnings
|
4.28%
|
3.88%
|
40
|
|
16.7
|
%
|
|||
|
EBIT margin
2
|
7.77%
|
7.05%
|
72
|
|
16.6
|
%
|
|||
|
|
|
Basis Point Increase / (Decrease) in
Percentage of Net Sales from Prior Year
1
|
|
Percentage Increase / (Decrease) in
Dollar Amounts
from Prior Year
1
|
|
||||
|
|
2012
|
2011
|
2012 vs. 2011
|
|
2012 vs. 2011
|
|
|||
|
Net sales
|
100.00%
|
100.00%
|
N/A
|
|
0.6
|
%
|
|||
|
Gross margin
|
34.30
|
34.56
|
(26
|
)
|
(0.1
|
)
|
|||
|
Expenses:
|
|
|
|
|
|
|
|||
|
Selling, general and administrative
|
24.24
|
25.08
|
(84
|
)
|
(2.8
|
)
|
|||
|
Depreciation
|
3.01
|
2.95
|
6
|
|
2.9
|
|
|||
|
Interest - net
|
0.84
|
0.74
|
10
|
|
13.9
|
|
|||
|
Total expenses
|
28.09
|
28.77
|
(68
|
)
|
(1.8
|
)
|
|||
|
Pre-tax earnings
|
6.21
|
5.79
|
42
|
|
7.9
|
|
|||
|
Income tax provision
|
2.33
|
2.13
|
20
|
|
10.4
|
|
|||
|
Net earnings
|
3.88%
|
3.66%
|
22
|
|
6.5
|
%
|
|||
|
EBIT margin
2
|
7.05%
|
6.53%
|
52
|
|
8.6
|
%
|
|||
20
|
Other Metrics
|
2013
|
|
2012
|
|
2011
|
|
|||||
|
Comparable sales increase
3, 4
|
4.8
|
%
|
1.4
|
%
|
0.0
|
%
|
|||||
|
Total customer transactions (in millions)
1
|
828
|
|
804
|
|
810
|
|
|||||
|
Average ticket
5
|
$
|
64.52
|
|
$
|
62.82
|
|
$
|
62.00
|
|
||
|
At end of year:
|
|
|
|
|
|
|
|||||
|
Number of stores
6
|
1,832
|
|
1,754
|
|
1,745
|
|
|||||
|
Sales floor square feet (in millions)
|
200
|
|
197
|
|
197
|
|
|||||
|
Average store size selling square feet (in thousands)
7
|
109
|
|
113
|
|
113
|
|
|||||
|
Return on average assets
8
|
6.8
|
%
|
5.7
|
%
|
5.4
|
%
|
|||||
|
Return on average shareholders' equity
9
|
17.7
|
%
|
13.1
|
%
|
10.7
|
%
|
|||||
|
Return on invested capital
10
|
11.5
|
%
|
9.3
|
%
|
8.7
|
%
|
|||||
1
Fiscal years
2013
and
2012
had 52 weeks. Fiscal year
2011
had 53 weeks.
2
EBIT margin, also referred to as operating margin, is defined as earnings before interest and taxes as a percentage of sales.
3
A comparable location is defined as a location that has been open longer than 13 months.
A location that is identified for
relocation is no longer considered comparable one month prior to its relocation. The relocated location must then remain
open longer than 13 months to be considered comparable. A location we have decided to close is no longer considered
comparable as of the beginning of the month in which we announce its closing. Comparable sales include online sales.
4
Comparable sales are based on comparable 52-week periods for
2013
and
2012
and comparable 53-week periods for
2011
.
5
Average ticket is defined as net sales divided by the total number of customer transactions.
6
The number of stores as of fiscal year end 2013 includes 72 stores from the acquisition of the majority of assets of Orchard on August 30, 2013. The average store selling square footage is approximately 36,000 for an Orchard store.
7
Average store size selling square feet is defined as sales floor square feet divided by the number of stores open at the end of
the period. The average Lowe’s home improvement store has approximately 112,000 square feet of retail selling space, while
the average Orchard store has approximately 36,000 square feet of retail selling space.
8
Return on average assets is defined as net earnings divided by average total assets for the last five quarters.
9
Return on average shareholders’ equity is defined as net earnings divided by average shareholders’ equity for the last five
quarters.
10
Return on invested capital is a non-GAAP financial measure. See below for additional information.
Return on Invested Capital
Return on Invested Capital (ROIC) is considered a non-GAAP financial measure. We believe ROIC is a meaningful metric for investors because it measures how effectively the Company uses capital to generate profits.
We define ROIC as trailing four quarters’ net operating profit after tax divided by the average of ending debt and equity for the last five quarters. Although ROIC is a common financial metric, numerous methods exist for calculating ROIC. Accordingly, the method used by our management to calculate ROIC may differ from the methods other companies use to calculate their ROIC. We encourage you to understand the methods used by another company to calculate its ROIC before comparing its ROIC to ours.
We consider return on average debt and equity to be the financial measure computed in accordance with generally accepted accounting principles that is the most directly comparable GAAP financial measure to ROIC. The difference between these two measures is that ROIC adjusts net earnings to exclude tax adjusted interest expense.
The calculation of ROIC, together with a reconciliation to the calculation of return on average debt and equity, the most comparable GAAP financial measure, is as follows:
21
|
(In millions, except percentage data)
|
|
|
|
||||||||
|
Calculation of Return on Invested Capital
|
2013
|
2012
|
2011
|
||||||||
|
Numerator
|
|
|
|
||||||||
|
Net earnings
|
$
|
2,286
|
|
$
|
1,959
|
|
$
|
1,839
|
|
||
|
Plus:
|
|
|
|
|
|
|
|||||
|
Interest expense - net
|
476
|
|
423
|
|
371
|
|
|||||
|
Provision for income taxes
|
1,387
|
|
1,178
|
|
1,067
|
|
|||||
|
Earnings before interest and taxes
|
4,149
|
|
3,560
|
|
3,277
|
|
|||||
|
Less:
|
|
|
|
|
|
|
|||||
|
Income tax adjustment
1
|
1,567
|
|
1,337
|
|
1,203
|
|
|||||
|
Net operating profit after tax
|
$
|
2,582
|
|
$
|
2,223
|
|
$
|
2,074
|
|
||
|
Effective tax rate
|
37.8
|
%
|
37.6
|
%
|
36.7
|
%
|
|||||
|
Denominator
|
|
|
|
|
|
|
|||||
|
Average debt and equity
2
|
$
|
22,510
|
|
$
|
23,921
|
|
$
|
23,940
|
|
||
|
Return on invested capital
|
11.5
|
%
|
9.3
|
%
|
8.7
|
%
|
|||||
|
Calculation of Return on Average Debt and Equity
|
|
|
|||||||||
|
Numerator
|
|
|
|
|
|
|
|||||
|
Net earnings
|
$
|
2,286
|
|
$
|
1,959
|
|
$
|
1,839
|
|
||
|
Denominator
|
|
|
|
|
|
|
|||||
|
Average debt and equity
2
|
$
|
22,510
|
|
$
|
23,921
|
|
$
|
23,940
|
|
||
|
Return on average debt and equity
|
10.2
|
%
|
8.2
|
%
|
7.7
|
%
|
|||||
1
Income tax adjustment is defined as earnings before interest and taxes multiplied by the effective tax rate.
2
Average debt and equity is defined as average debt, including current maturities and short-term borrowings, plus total equity
for the last five quarters.
Fiscal
2013
Compared to Fiscal
2012
Net sales –
Net sales increased 5.7% to $53.4 billion in 2013. Comparable sales increased 4.8% in 2013, driven by a 3.2% increase in comparable average ticket and a 1.6% increase in comparable customer transactions. Performance for the year was strong across product categories as all of our product categories experienced comparable sales increases for the year. During 2013, we experienced comparable sales above the company average in the following product categories: Outdoor Power Equipment, Kitchens & Appliances, Rough Plumbing & Electrical, Flooring, and Fashion Fixtures. Sales to Pro customers also performed well during the year and experienced comparable sales above the company average.
Sales during the year benefited from growth in the home improvement industry where gains in housing turnover and job growth created increased demand. Through our Sales & Operations Planning process, we were able to better capitalize on market demand and drive sales in big ticket categories such as Outdoor Power Equipment, Kitchens & Appliances, and Flooring, which all performed above the company average. Furthermore, we were able to make improvements in our seasonal planning and the timing of product introductions and promotions, which also helped drive sales in these categories.
We continued to realize benefits from our strategic initiatives, with many product categories benefiting from improved line designs and deeper inventory in key items after having completed their Value Improvement resets. In addition, we also saw benefit from our proprietary credit value proposition, which offers customers the choice of 5% off every day or promotional financing.
Gross margin
– Gross margin of 34.59% for 2013 represented a 29 basis point increase from 2012. Gross margin was positively impacted by 45 basis points resulting from our Value Improvement initiative. This was partially offset by a negative impact of 15 basis points as a result of higher penetration of our proprietary credit value proposition, which increased 145 basis points over the prior year and was approximately 25.5% of sales.
22
SG&A
– SG&A expense for 2013 leveraged 16 basis points as a percentage of sales compared to 2012. This was driven by 17 basis points of leverage associated with casualty insurance as we cycled a reduction in the discount rate applied in the prior year. We also experienced nine basis points of leverage due to greater long-lived asset impairments and discontinued project expenses in the prior year and eight basis points of leverage in advertising expense due to higher sales. In addition, we experienced eight basis points of leverage in contract labor expense as a result of lower spending on information technology projects in the current year. These were partially offset by 14 basis points of deleverage associated with incentive compensation due to higher attainment levels and eight basis points of deleverage as a result of reset and remerchandising activity associated with efforts to improve customer experiences. We also experienced eight basis points of deleverage due to higher store repair and maintenance expense.
Depreciation
– Depreciation expense leveraged 27 basis points for
2013
compared to
2012
primarily due to the increase in sales as well as assets becoming fully depreciated. Property, less accumulated depreciation, decreased to
$20.8 billion
at
January 31, 2014
compared to
$21.5 billion
at
February 1, 2013
. At
January 31, 2014
and
February 1, 2013
, we owned
86%
and 89% of our stores, respectively, which included stores on leased land.
Interest – Net
– Net interest expense is comprised of the following:
|
(In millions)
|
2013
|
|
2012
|
|
|||
|
Interest expense, net of amount capitalized
|
$
|
474
|
|
$
|
427
|
|
|
|
Amortization of original issue discount and loan costs
|
6
|
|
5
|
|
|||
|
Interest income
|
(4
|
)
|
(9
|
)
|
|||
|
Interest - net
|
$
|
476
|
|
$
|
423
|
|
|
Net interest expense increased primarily as a result of a favorable tax settlement that resulted in a reduced interest accrual in 2012, in addition to increased expense as a result of the net increase in long-term debt.
Fiscal
2012
Compared to Fiscal
2011
For the purpose of the following discussion, comparable sales, comparable average ticket and comparable customer transactions are based on comparable 52-week periods.
Net sales –
Net sales increased 0.6% to $50.5 billion in 2012. The additional week in 2011 and resulting week shift in 2012 negatively impacted sales comparisons by $692 million, or 1.4%. Comparable sales increased 1.4% in 2012, driven by a 0.9% increase in comparable average ticket and a 0.5% increase in comparable customer transactions. Our key initiatives, Value Improvement and Product Differentiation, drove 40 basis points of the increase in sales. In addition, our proprietary credit value proposition contributed 65 basis points to the increase in sales. Geographically, all operating divisions in the U.S. delivered positive comparable sales for the year as sales performance was well balanced in 2012. Furthermore, we continued to see strength in our Pro Services business, which outperformed the company average.
We experienced comparable sales above the company average in the following product categories during 2012: Outdoor Power Equipment, Paint, Seasonal Living, Tools & Hardware, Rough Plumbing & Electrical, and Home Fashions, Storage & Cleaning. In addition, Fashion Fixtures and Flooring performed at approximately the overall company average. Comparable sales in Outdoor Power Equipment were positively impacted by favorable weather in the first half of the year combined with effective promotions. In addition, storm response efforts associated with Hurricane Sandy also positively impacted comparable sales in Outdoor Power Equipment due to increased generator sales. Comparable sales in Paint were positively impacted by new product offerings and inflation throughout the year.
Comparable sales were below the company average in Millwork, Kitchens & Appliances, Lumber & Building Materials and Lawn & Garden. Difficult comparisons to prior year promotional activity led to decreased comparable sales in Millwork and Kitchens & Appliances. Comparable sales in Lumber & Building Material were negatively impacted by the timing of storm recovery and repair efforts in 2012 as compared to 2011, partially offset by the favorable impact of inflation throughout the year. In addition, comparable sales in Lawn & Garden were negatively impacted by extreme heat and drought conditions in the first half of the year, slightly offset by improved inventory planning and attachment rates in the second half of the year.
Gross margin
– Gross margin of 34.3% for 2012 represented a 26 basis point decrease from 2011, primarily driven by an unfavorable 19 basis point impact related to our proprietary credit value proposition. In addition, we experienced a seven basis point unfavorable impact to margin related to pricing and promotional activity.
23
SG&A
– The 84 basis point decrease in SG&A expense as a percentage of sales from 2011 to 2012 was primarily driven by 81 basis points of leverage due to long-lived asset impairment and other costs associated with the 27 store closures and discontinued projects in 2011. We also experienced approximately 35 basis points of leverage associated with our proprietary credit program, which was driven by increased portfolio income as a result of continued growth in the program. These were partially offset by deleverage of approximately 15 basis points associated with incentive compensation, due to higher attainment levels compared to targets for store-based employees relative to last year. In addition, we experienced nine basis points of deleverage in contract labor associated with information technology projects to improve customer experiences.
Depreciation
– Depreciation expense deleveraged six basis points for
2012
compared to
2011
primarily due to higher depreciation associated with IT capital investments made to improve customer experiences, which have shorter average useful lives. Property, less accumulated depreciation, decreased to
$21.5 billion
at
February 1, 2013
compared to
$22.0 billion
at
February 3, 2012
. At
February 1, 2013
and
February 3, 2012
we owned 89% of our stores, which included stores on leased land.
Interest – Net
– Net interest expense is comprised of the following:
|
(In millions)
|
2012
|
|
2011
|
|
|||
|
Interest expense, net of amount capitalized
|
$
|
427
|
|
$
|
379
|
|
|
|
Amortization of original issue discount and loan costs
|
5
|
|
4
|
|
|||
|
Interest income
|
(9
|
)
|
(12
|
)
|
|||
|
Interest - net
|
$
|
423
|
|
$
|
371
|
|
|
Net interest expense increased primarily as a result of the issuance of $1.0 billion and $2.0 billion of unsecured notes in November 2011 and April 2012, respectively, partially offset by favorable tax settlements that resulted in a reduced interest accrual during 2012.
Income tax provision –
Our
effective income tax rate was
37.6%
in
2012
compared to
36.7%
in
2011
. The lower effective tax rate in 2011 was the result of the recognition of one-time federal employee retention benefits from the federal HIRE (Hiring Incentives to Restore Employment) retention tax credit, as well as the favorable settlement of certain state tax matters in the third quarter of 2011.
LOWE’S BUSINESS OUTLOOK
As of
February 26, 2014
, the date of our fourth quarter
2013
earnings release, we expected total sales in
2014
to increase approximately 5% and comparable sales to increase approximately 4%. We expected to open approximately 15 home improvement stores and five Orchard stores during
2014
. In addition, earnings before interest and taxes as a percentage of sales (operating margin) were expected to increase approximately 65 basis points, and the effective tax rate was expected to be approximately 38.1%. Diluted earnings per share of $2.60 were expected for the fiscal year ending
January 30, 2015
. Our guidance assumed approximately $3.4 billion in share repurchases during
2014
, spread evenly across the four quarters.
FINANCIAL CONDITION, LIQUIDITY AND CAPITAL RESOURCES
Cash Flows
Cash flows from operating activities continued to provide the primary source of our liquidity. The increase in net cash provided by operating activities for 2013 versus 2012 was primarily driven by an increase in net earnings. The increase in net cash used in investing activities for 2013 versus 2012 was driven by a decrease in the net cash flows from purchase and sale of investments and the acquisition of Orchard, partially offset by a decrease in capital expenditures. The decrease in net cash used in financing activities for 2013 was driven primarily by a decrease in cash used to repurchase shares, which included shares repurchased under our share repurchase program and shares withheld from employees to satisfy statutory tax withholding liabilities upon vesting of restricted stock awards, the repayment of unsecured notes that matured in the prior year, and an increase in short-term borrowings in the current year. These were partially offset by a decrease in cash provided by the issuance of long term-debt as a result of the issuance of $1.0 billion of unsecured notes in September 2013 versus the issuance of $2.0 billion of unsecured notes in April 2012.
24
Sources of Liquidity
In addition to our cash flows from operations, liquidity is provided by our short-term borrowing facilities. We have a $1.75 billion senior credit facility that expires in October 2016. The senior credit facility supports our commercial paper program and has a $500 million letter of credit sublimit. Letters of credit issued pursuant to the senior credit facility reduce the amount available for borrowing under its terms. Borrowings made are unsecured and are priced at fixed rates based upon market conditions at the time of funding in accordance with the terms of the senior credit facility. The senior credit facility contains certain restrictive covenants, which include maintenance of a debt leverage ratio as defined by the senior credit facility. We were in compliance with those covenants at
January 31, 2014
. Thirteen banking institutions are participating in the senior credit facility. At
January 31, 2014
we had $386 million of outstanding borrowings under the commercial paper program and no letters of credit under the senior credit facility.
We expect to continue to have access to the capital markets on both short-term and long-term bases when needed for liquidity purposes by issuing commercial paper or new long-term debt. The availability and the borrowing costs of these funds could be adversely affected, however, by a downgrade of our debt ratings or a deterioration of certain financial ratios. The table below reflects our debt ratings by Standard & Poor’s (S&P) and Mood
y’s as of March 31, 2014, whi
ch we are disclosing to enhance understanding of our sources of liquidity and the effect of our ratings on our cost of funds. Although we currently do not expect a downgrade in our debt ratings, our commercial paper and senior debt ratings may be subject to revision or withdrawal at any time by the assigning rating organization, and each rating should be evaluated independently of any other rating.
|
Debt Ratings
|
S&P
|
Moody’s
|
|
|
Commercial Paper
|
A-2
|
P-2
|
|
|
Senior Debt
|
A-
|
A3
|
|
|
Outlook
|
Stable
|
Stable
|
|
We believe that net cash provided by operating and financing activities will be adequate not only for our operating requirements, but also for investments in information technology, investments in our existing stores, expansion plans and acquisitions, if any, and to return cash to shareholders through both dividends and share repurchases over the next 12 months. There are no provisions in any agreements that would require early cash settlement of existing debt or leases as a result of a downgrade in our debt rating or a decrease in our stock price. In addition, we do not have a significant amount of cash held in foreign affiliates that is unavailable to fund domestic operations.
Cash Requirements
Capital expenditures
Our fiscal
2014
capital budget is approximately $1.25 billion, inclusive of approximately $50 million of lease commitments, resulting in a planned net cash outflow of $1.2 billion. Investments in our existing stores are expected to account for approximately 40% of net cash outflow including investments in store equipment, resets and remerchandising. Approximately 30% of the planned net cash outflow is for investments in corporate infrastructure, including enhancements in information technology. Our expansion plans for
2014
consist of approximately 15 new home improvement stores and five new Orchard stores. Nine of the home improvement stores and none of the Orchard stores are expected to be owned. Approximately 13% of the new home improvement stores are expected to be on leased land. Store expansion will account for approximately 30% of the planned net cash outflow.
Debt and capital
In September
2013
, we issued $1.0 billion of unsecured notes in two tranches: $500 million of 3.875% notes maturing in September 2023 and $500 million of 5.0% notes maturing in September 2043. The 2023 and 2043 notes were issued at discounts of approximately $5 million and $9 million, respectively. Interest on these notes is payable semiannually in arrears in March and September of each year until maturity, beginning in March
2014
.
The discounts associated with these issuances, which include the underwriting and issuance discounts, are recorded in long-term debt and are being amortized over the respective terms of the notes.
Dividends declared during fiscal
2013
totaled $741 million. Our dividend payment dates are established such that dividends are paid in the quarter immediately following the quarter in which they are declared. The dividend declared in the fourth quarter of
2013
was paid in fiscal
2014
and totaled $186 million.
25
We have an ongoing share repurchase program that is executed through purchases made from time to time either in the open market or through private off-market transactions. Shares purchased under the repurchase program are retired and returned to authorized and unissued status. On
February 1, 2013
, the Company's Board of Directors authorized a $5.0 billion share repurchase program with no expiration. As of January 31, 2014, the Company had $1.3 billion remaining available under this authorization. On
January 31, 2014
, the Company's Board of Directors authorized an additional $5.0 billion of share repurchases with no expiration, increasing the total share repurchases authorized as of fiscal year end January 31, 2014 to $6.3 billion. In fiscal
2014
, the Company expects to repurchase shares totaling $3.4 billion through purchases made from time to time either in the open market or through private off market transactions in accordance with SEC regulations.
Our ratio of debt to equity plus debt was 47.0% and 39.6% as of
January 31, 2014
, and
February 1, 2013
, respectively.
OFF-BALANCE SHEET ARRANGEMENTS
Other than in connection with executing operating leases, we do not have any off-balance sheet financing that has, or is reasonably likely to have, a material, current or future effect on our financial condition, cash flows, results of operations, liquidity, capital expenditures or capital resources.
CONTRACTUAL OBLIGATIONS AND COMMERCIAL COMMITMENTS
The following table summarizes our significant contractual obligations at
January 31, 2014
:
|
|
Payments Due by Period
|
||||||||||||||||||
|
Contractual Obligations
|
|
Less Than
|
|
1-3
|
|
4-5
|
|
After 5
|
|
||||||||||
|
(In millions)
|
Total
|
|
1 Year
|
|
Years
|
|
Years
|
|
Years
|
|
|||||||||
|
Long-term debt (principal amounts,
|
|
|
|
|
|
|
|
||||||||||||
|
excluding discount)
|
$
|
9,700
|
|
$
|
2
|
|
$
|
1,536
|
|
$
|
751
|
|
$
|
7,411
|
|
||||
|
Long-term debt (interest payments)
|
7,338
|
|
459
|
|
887
|
|
759
|
|
5,233
|
|
|||||||||
|
Capitalized lease obligations
1
|
786
|
|
88
|
|
147
|
|
108
|
|
443
|
|
|||||||||
|
Operating leases
1
|
5,588
|
|
447
|
|
887
|
|
843
|
|
3,411
|
|
|||||||||
|
Purchase obligations
2
|
881
|
|
577
|
|
297
|
|
7
|
|
—
|
|
|||||||||
|
Total contractual obligations
|
$
|
24,293
|
|
$
|
1,573
|
|
$
|
3,754
|
|
$
|
2,468
|
|
$
|
16,498
|
|
||||
|
|
|
|
Amount of Commitment Expiration by Period
|
||||||||||||||||
|
Commercial Commitments
|
|
|
Less Than
|
|
1-3
|
|
4-5
|
|
After 5
|
|
|||||||||
|
(in millions)
|
Total
|
|
1 Year
|
|
Years
|
|
Years
|
|
Years
|
|
|||||||||
|
Letters of Credit
3
|
$
|
64
|
|
$
|
62
|
|
$
|
2
|
|
$
|
—
|
|
$
|
—
|
|
||||
1
Amounts do not include taxes, common area maintenance, insurance or contingent rent because these amounts have
historically been insignificant.
2
Represents commitments related to certain marketing and information technology programs, and purchases of merchandise
inventory.
3
Letters of credit are issued primarily for insurance and construction contracts.
At
January 31, 2014
, our reserve for uncertain tax positions (including penalties and interest) was $69 million, of which $7 million was classified as a current liability and $62 million was classified as a noncurrent liability. At this time, we are unable to make a reasonably reliable estimate of the timing of payments in individual years beyond 12 months due to uncertainties in the timing of the effective settlement of tax positions.
CRITICAL ACCOUNTING POLICIES AND ESTIMATES
The preparation of the consolidated financial statements and notes to consolidated financial statements presented in this Form 10-K requires us to make estimates that affect the reported amounts of assets, liabilities, sales and expenses, and related disclosures of contingent assets and liabilities. We base these estimates on historical results and various other assumptions believed to be reasonable, all of which form the basis for making estimates concerning the carrying values of assets and liabilities that are not readily available from other sources. Actual results may differ from these estimates.
26
Our significant accounting policies are described in Note 1 to the consolidated financial statements. We believe that the following accounting policies affect the most significant estimates and management judgments used in preparing the consolidated financial statements.
Merchandise Inventory
Description
We record an obsolete inventory reserve for the anticipated loss associated with selling inventories below cost. This reserve is based on our current knowledge with respect to inventory levels, sales trends and historical experience. During
2013
, our reserve increased approximately $11 million to
$68 million
as of
January 31, 2014
.
We also record an inventory reserve for the estimated shrinkage between physical inventories. This reserve is based primarily on actual shrinkage results from previous physical inventories. During
2013
, the inventory shrinkage reserve increased approximately $16 million to
$158 million
as of
January 31, 2014
.
In addition, we receive funds from vendors in the normal course of business, principally as a result of purchase volumes, sales, early payments or promotions of vendors’ products. Generally, these vendor funds do not represent the reimbursement of specific, incremental and identifiable costs that we incurred to sell the vendor’s product. Therefore, we treat these funds as a reduction in the cost of inventory as the amounts are accrued, and recognize these funds as a reduction of cost of sales when the inventory is sold. Funds that are determined to be reimbursements of specific, incremental and identifiable costs incurred to sell vendors’ products are recorded as an offset to the related expense.
Judgments and uncertainties involved in the estimate
We do not believe that our merchandise inventories are subject to significant risk of obsolescence in the near term, and we have the ability to adjust purchasing practices based on anticipated sales trends and general economic conditions. However, changes in consumer purchasing patterns or a deterioration in product quality could result in the need for additional reserves. Likewise, changes in the estimated shrink reserve may be necessary, based on the timing and results of physical inventories. We also apply judgment in the determination of levels of non-productive inventory and assumptions about net realizable value.
For vendor funds, we develop accrual rates based on the provisions of the agreements in place. Due to the complexity and diversity of the individual vendor agreements, we perform analyses and review historical purchase trends and volumes throughout the year, adjust accrual rates as appropriate and confirm actual amounts with select vendors to ensure the amounts earned are appropriately recorded. Amounts accrued throughout the year could be impacted if actual purchase volumes differ from projected purchase volumes, especially in the case of programs that provide for increased funding when graduated purchase volumes are met.
Effect if actual results differ from assumptions
We have not made any material changes in the methodology used to establish our inventory valuation or the related reserves for obsolete inventory or inventory shrinkage during the past three fiscal years. We believe that we have sufficient current and historical knowledge to record reasonable estimates for both of these inventory reserves. However, it is possible that actual results could differ from recorded reserves. A 10% change in either the amount of products considered obsolete or the weighted average estimated loss rate used in the calculation of our obsolete inventory reserve would have affected net earnings by approximately $4 million for
2013
. A 10% change in the estimated shrinkage rate included in the calculation of our inventory shrinkage reserve would have affected net earnings by approximately $10 million for
2013
.
We have not made any material changes in the methodology used to recognize vendor funds during the past three fiscal years. If actual results are not consistent with the assumptions and estimates used, we could be exposed to additional adjustments that could positively or negatively impact gross margin and inventory. However, substantially all receivables associated with these activities do not require subjective long-term estimates because they are collected within the following fiscal year. Adjustments to gross margin and inventory in the following fiscal year have historically not been material.
Long-Lived Asset Impairment
Description
We review the carrying amounts of locations whenever certain events or changes in circumstances indicate that the carrying amounts may not be recoverable. When evaluating locations for impairment, our asset group is at an individual location level, as that is the lowest level for which cash flows are identifiable. Cash flows for individual locations do not include an allocation of corporate overhead.
27
We evaluate locations for triggering events relating to long-lived asset impairment on a quarterly basis to determine when a location’s asset carrying values may not be recoverable. For operating locations, our primary indicator that asset carrying values may not be recoverable is consistently negative cash flow for a 12-month period for those locations that have been open in the same location for a sufficient period of time to allow for meaningful analysis of ongoing operating results. Management also monitors other factors when evaluating operating locations for impairment, including individual locations’ execution of their operating plans and local market conditions, including incursion, which is the opening of either other Lowe’s locations or those of a direct competitor within the same market. We also consider there to be a triggering event when there is a current expectation that it is more likely than not that a given location will be closed significantly before the end of its previously estimated useful life.
A potential impairment has occurred if projected future undiscounted cash flows expected to result from the use and eventual disposition of the location’s assets are less than the carrying amount of the assets. When determining the stream of projected future cash flows associated with an individual operating location, management makes assumptions, incorporating local market conditions, about key store variables including sales growth rates, gross margin and controllable expenses, such as store payroll and occupancy expense, as well as asset residual values or lease rates. An impairment loss is recognized when the carrying amount of the operating location is not recoverable and exceeds its fair value.
We use an income approach to determine the fair value of our individual operating locations, which requires discounting projected future cash flows. This involves making assumptions regarding both a location’s future cash flows, as described above, and an appropriate discount rate to determine the present value of those future cash flows. We discount our cash flow estimates at a rate commensurate with the risk that selected market participants would assign to the cash flows. The selected market participants represent a group of other retailers with a market footprint similar in size to ours.
Judgments and uncertainties involved in the estimate
Our impairment evaluations require us to apply judgment in determining whether a triggering event has occurred, including the evaluation of whether it is more likely than not that a location will be closed significantly before the end of its previously estimated useful life. Our impairment loss calculations require us to apply judgment in estimating expected future cash flows, including estimated sales, margin and controllable expenses, and assumptions about market performance for operating locations and estimated selling prices or lease rates for locations identified for closure. We also apply judgment in estimating asset fair values, including the selection of an appropriate discount rate for fair values determined using an income approach.
Effect if actual results differ from assumptions
During 2013, 15 operating locations experienced a triggering event and were evaluated for recoverability. One of the 15 operating locations was determined to be impaired. We recorded impairment losses related to this operating location of $26 million during
2013
, compared to impairment losses on operating locations of $55 million during
2012
.
We have not made any material changes in the methodology used to estimate the future cash flows of operating locations or locations identified for closure during the past three fiscal years. If the actual results are not consistent with the assumptions and judgments we have made in determining whether it is more likely than not that a location will be closed significantly before the end of its useful life or in estimating future cash flows and determining asset fair values, our actual impairment losses could vary positively or negatively from our estimated impairment losses.
Fourteen of the 15 operating locations that experienced a triggering event during
2013
were determined to be recoverable and therefore were not impaired. For 11 of these 14 locations, the expected undiscounted cash flows substantially exceeded the net book value of the location’s assets. For these 11 locations, a 10% reduction in projected sales used to estimate future cash flows at the latest date these operating locations were evaluated for impairment would have resulted in the impairment of four of these locations and increased recognized impairment losses by $39 million.
Three of the operating locations with a net book value of $25 million had expected undiscounted cash flows that exceeded the net book value of its assets by less than a substantial amount. A 10% reduction in projected sales used to estimate future cash flows at the date these operating locations were evaluated for impairment would have resulted in the impairment of these three locations and increased recognized impairment losses by $23 million.
We analyzed other assumptions made in estimating the future cash flows of the operating locations evaluated for impairment, but the sensitivity of those assumptions was not significant to the estimates.
28
Store Closing Lease Obligations
Description
When locations under operating leases are closed, we recognize a liability for the fair value of future contractual obligations associated with the leased location. The fair value of the store closing lease obligation is determined using an expected present value cash flow model incorporating future minimum lease payments, property taxes, utilities, common area maintenance and other ongoing expenses, net of estimated sublease income and other recoverable items, discounted at a credit-adjusted risk free rate. The expected present value cash flow model uses a probability weighted scenario approach that assigns varying cash flows to certain scenarios based on the expected likelihood of outcomes. Estimating the fair value involves making assumptions regarding estimated sublease income by obtaining information from property brokers or appraisers in the specific markets being evaluated. The information includes comparable lease rates of similar assets and assumptions about demand in the market for leasing these assets. Subsequent changes to the liability, including a change resulting from a revision to either the timing or the amount of estimated cash flows, are recognized in the period of the change.
Judgments and uncertainties involved in the estimate
Our store closing lease liability calculations require us to apply judgment in estimating expected future cash flows, primarily related to estimated sublease income, and the selection of an appropriate discount rate.
Effect if actual results differ from assumptions
During
2013
, the Company relocated two stores subject to operating leases. During
2012
, one store was relocated. We recorded $11 million of expense for store closing lease obligations during both
2013
and
2012
. For
2013
, these charges included $5 million related to locations closed or relocated during
2013
and $6 million of adjustments related to previously closed or relocated locations.
We have not made any material changes in the methodology used to estimate the expected future cash flows of closed locations under operating leases during the past three fiscal years. If the actual results are not consistent with the assumptions and judgments we have made in estimating expected future cash flows, our store closing lease obligation losses could vary positively or negatively from our estimated losses. A 10% change in the store closing lease liability would have affected net earnings by approximately $3 million for
2013
.
Self-Insurance
Description
We are self-insured for certain losses relating to workers’ compensation; automobile; general and product liability; extended protection plan; and certain medical and dental claims. Our self-insured retention or deductible, as applicable, is limited to $2 million per occurrence involving workers’ compensation and $3 million per occurrence involving automobile, general or product liability. Additionally, a corridor retention of $2 million per occurrence applies to commercial general liability and product liability claims, subject to a $6 million maximum over a three-year period. We do not have any insurance coverage for self-insured extended protection plan or medical and dental claims. Self-insurance claims filed and claims incurred but not reported are accrued based upon our estimates of the discounted ultimate cost for self-insured claims incurred using actuarial assumptions followed in the insurance industry and historical experience. During
2013
, our self-insurance liability increased approximately $5 million to
$904 million
as of
January 31, 2014
.
Judgments and uncertainties involved in the estimate
These estimates are subject to changes in the regulatory environment; utilized discount rate; projected exposures including payroll, sales and vehicle units; as well as the frequency, lag and severity of claims.
Effect if actual results differ from assumptions
We have not made any material changes in the methodology used to establish our self-insurance liability during the past three fiscal years. Although we believe that we have the ability to reasonably estimate losses related to claims, it is possible that actual results could differ from recorded self-insurance liabilities. A 10% change in our self-insurance liability would have affected net earnings by approximately $56 million for
2013
. A 100 basis point change in our discount rate would have affected net earnings by approximately $21 million for
2013
.
29
Revenue Recognition
Description
See Note 1 to the consolidated financial statements for a discussion of our revenue recognition policies. The following accounting estimates relating to revenue recognition require management to make assumptions and apply judgment regarding the effects of future events that cannot be determined with certainty.
We sell separately-priced extended protection plan contracts under a Lowe’s-branded program for which the Company is ultimately self-insured. The Company recognizes revenues from extended protection plan sales on a straight-line basis over the respective contract term. Extended protection plan contract terms primarily range from one to four years from the date of purchase or the end of the manufacturer’s warranty, as applicable. The Company consistently groups and evaluates extended protection plan contracts based on the characteristics of the underlying products and the coverage provided in order to monitor for expected losses. A loss on the overall contract would be recognized if the expected costs of performing services under the contracts exceeded the amount of unamortized acquisition costs and related deferred revenue associated with the contracts. Deferred revenues associated with the extended protection plan contracts increased $15 million to
$730 million
as of
January 31, 2014
.
We defer revenue and cost of sales associated with settled transactions for which customers have not yet taken possession of merchandise or for which installation has not yet been completed. Revenue is deferred based on the actual amounts received. We use historical gross margin rates to estimate the adjustment to cost of sales for these transactions. During
2013
, deferred revenues associated with these transactions increased $20 million to $461 million as of
January 31, 2014
.
Judgments and uncertainties involved in the estimate
For extended protection plans, there is judgment inherent in our evaluation of expected losses as a result of our methodology for grouping and evaluating extended protection plan contracts and from the actuarial determination of the estimated cost of the contracts. There is also judgment inherent in our determination of the recognition pattern of costs of performing services under these contracts.
For the deferral of revenue and cost of sales associated with transactions for which customers have not yet taken possession of merchandise or for which installation has not yet been completed, there is judgment inherent in our estimates of gross margin rates.
Effect if actual results differ from assumptions
We have not made any material changes in the methodology used to recognize revenue on our extended protection plan contracts during the past three fiscal years. We currently do not anticipate incurring any overall contract losses on our extended protection plan contracts. Although we believe that we have the ability to adequately monitor and estimate expected losses under the extended protection plan contracts, it is possible that actual results could differ from our estimates. In addition, if future evidence indicates that the costs of performing services under these contracts are incurred on other than a straight-line basis, the timing of revenue recognition under these contracts could change. A 10% change in the amount of revenue recognized in
2013
under these contracts would have affected net earnings by approximately $17 million.
We have not made any material changes in the methodology used to reverse net sales and cost of sales related to amounts received for which customers have not yet taken possession of merchandise or for which installation has not yet been completed. We believe we have sufficient current and historical knowledge to record reasonable estimates related to the impact to cost of sales for these transactions. However, if actual results are not consistent with our estimates or assumptions, we may incur additional income or expense. A 10% change in the estimate of the gross margin rates applied to these transactions would have affected net earnings by approximately $8 million in
2013
.
DISCLOSURE REGARDING FORWARD-LOOKING STATEMENTS
We speak throughout this Annual Report on Form 10-K in forward-looking statements about our future, but particularly in “Management’s Discussion and Analysis of Financial Condition and Results of Operations”. The words “believe,” “expect,” “will,” “should,” "suggest", and other similar expressions are intended to identify those forward-looking statements. While we believe our expectations are reasonable, they are not guarantees of future performance. Our actual results could differ substantially from our expectations.
For a detailed description of the risks and uncertainties that we are exposed to, you should read the “Risk Factors” included elsewhere in this Annual Report on Form 10-K to the United States Securities and Exchange Commission. All forward-looking statements speak only as of the date of this report or, in the case of any document incorporated by reference, the date of that
30
document. All subsequent written and oral forward-looking statements attributable to us or any person acting on our behalf are qualified by the cautionary statements in this section and in the “Risk Factors” included elsewhere in this Annual Report on Form 10-K. We do not undertake any obligation to update or publicly release any revisions to forward-looking statements to reflect events, circumstances or changes in expectations after the date of this report.
In addition to the risks inherent in our operations, we are exposed to certain market risks, including changes in interest rates, commodity prices and foreign currency exchange rates.
Interest Rate Risk
Fluctuations in interest rates do not have a material impact on our financial condition and results of operations because our long-term debt is carried at amortized cost and consists of fixed-rate instruments. Therefore, providing quantitative information about interest rate risk is not meaningful for financial instruments.
Commodity Price Risk
We purchase certain commodity products that are subject to price volatility caused by factors beyond our control. We believe that the price volatility of these products is partially mitigated by our ability to adjust selling prices. The selling prices of these commodity products are influenced, in part, by the market price we pay, which is determined by industry supply and demand.
Foreign Currency Exchange Rate Risk
Although we have international operating entities, our exposure to foreign currency exchange rate fluctuations is not material to our financial condition and results of operations.
31
MANAGEMENT’S REPORT ON INTERNAL CONTROL OVER FINANCIAL REPORTING
Management of Lowe’s Companies, Inc. and its subsidiaries is responsible for establishing and maintaining adequate internal control over financial reporting (Internal Control) as defined in Rule 13a-15(f) under the Securities Exchange Act of 1934, as amended. Our Internal Control was designed to provide reasonable assurance to our management and the Board of Directors regarding the reliability of financial reporting and the preparation and fair presentation of published financial statements.
All internal control systems, no matter how well designed, have inherent limitations, including the possibility of human error and the circumvention or overriding of controls. Therefore, even those systems determined to be effective can provide only reasonable assurance with respect to the reliability of financial reporting and financial statement preparation and presentation. Further, because of changes in conditions, the effectiveness may vary over time.
Our management, with the participation of the Chief Executive Officer and Chief Financial Officer, evaluated the effectiveness of our Internal Control as of
January 31, 2014
. In evaluating our Internal Control, we used the criteria set forth by the Committee of Sponsoring Organizations of the Treadway Commission (COSO) in Internal Control—Integrated Framework (1992). Based on our management’s assessment, we have concluded that, as of
January 31, 2014
, our Internal Control is effective.
Under guidelines established by the SEC, companies are permitted to exclude acquisitions from their first assessment of internal control over financial reporting following the date of acquisition. Management’s assessment of the effectiveness of the Company’s internal control over financial reporting excluded Orchard Supply Company, LLC, a wholly owned subsidiary of Lowe's Companies Inc. that consists of the net assets purchased from Orchard Supply Hardware Stores Corporation in August
2013
. Orchard represented 1.4% and 0.4% of the Company’s consolidated total assets and consolidated net sales, respectively, as of and for the year ended
January 31, 2014
. This acquisition is more fully discussed in Note 5 to our Consolidated Financial Statements for fiscal year
2013
.
Deloitte & Touche LLP, the independent registered public accounting firm that audited the financial statements contained in this report, was engaged to audit our Internal Control. Their report appears on page 34.
32
REPORT OF INDEPENDENT REGISTERED PUBLIC ACCOUNTING FIRM
To the Board of Directors and Shareholders of Lowe's Companies, Inc.
Mooresville, North Carolina
We have audited the accompanying consolidated balance sheets of Lowe's Companies, Inc. and subsidiaries (the "Company") as of
January 31, 2014
and
February 1, 2013
, and the related consolidated statements of earnings, comprehensive income, shareholders' equity, and cash flows for each of the three fiscal years in the period ended
January 31, 2014
. Our audits also included the financial statement schedule listed in the Table of Contents at Item 15. These financial statements and financial statement schedule are the responsibility of the Company's management. Our responsibility is to express an opinion on these financial statements and financial statement schedule based on our audits.
We conducted our audits in accordance with the standards of the Public Company Accounting Oversight Board (United States). Those standards require that we plan and perform the audit to obtain reasonable assurance about whether the financial statements are free of material misstatement. An audit includes examining, on a test basis, evidence supporting the amounts and disclosures in the financial statements. An audit also includes assessing the accounting principles used and significant estimates made by management, as well as evaluating the overall financial statement presentation. We believe that our audits provide a reasonable basis for our opinion.
In our opinion, such consolidated financial statements present fairly, in all material respects, the financial position of the Company at
January 31, 2014
and
February 1, 2013
, and the results of its operations and its cash flows for each of the three fiscal years in the period ended
January 31, 2014
, in conformity with accounting principles generally accepted in the United States of America. Also, in our opinion, such financial statement schedule, when considered in relation to the basic consolidated financial statements taken as a whole, presents fairly, in all material respects, the information set forth therein.
We have also audited, in accordance with the standards of the Public Company Accounting Oversight Board (United States), the Company's internal control over financial reporting as of
January 31, 2014
, based on the criteria established in
Internal Control—Integrated Framework (1992)
issued by the Committee of Sponsoring Organizations of the Treadway Commission and our report dated
March 31, 2014
expressed an unqualified opinion on the Company's internal control over financial reporting.
/s/ Deloitte & Touche LLP
Charlotte, North Carolina
March 31, 2014
33
REPORT OF INDEPENDENT REGISTERED PUBLIC ACCOUNTING FIRM
To the Board of Directors and Shareholders of Lowe’s Companies, Inc.
Mooresville, North Carolina
We have audited the internal control over financial reporting of Lowe’s Companies, Inc. and subsidiaries (the "Company") as of
January 31, 2014
, based on criteria established in Internal Control - Integrated Framework (1992) issued by the Committee of Sponsoring Organizations of the Treadway Commission. As described in Management’s Report on Internal Control over Financial Reporting, management excluded from its assessment of internal control over financial reporting at Orchard Supply Company, LLC (Orchard), which was acquired on August 30, 2013 and whose financial statements constitute 1.4% and 0.4% of the Company’s consolidated total assets and consolidated net sales, respectively, as of and for the year ended
January 31, 2014
. Accordingly, our audit did not include the internal control over financial reporting at Orchard. The Company's management is responsible for maintaining effective internal control over financial reporting and for its assessment of the effectiveness of internal control over financial reporting, included in the accompanying Management's Report on Internal Control over Financial Reporting. Our responsibility is to express an opinion on the Company's internal control over financial reporting based on our audit.
We conducted our audit in accordance with the standards of the Public Company Accounting Oversight Board (United States). Those standards require that we plan and perform the audit to obtain reasonable assurance about whether effective internal control over financial reporting was maintained in all material respects. Our audit included obtaining an understanding of internal control over financial reporting, assessing the risk that a material weakness exists, testing and evaluating the design and operating effectiveness of internal control based on the assessed risk, and performing such other procedures as we considered necessary in the circumstances. We believe that our audit provides a reasonable basis for our opinion.
A company's internal control over financial reporting is a process designed by, or under the supervision of, the company's principal executive and principal financial officers, or persons performing similar functions, and effected by the company's board of directors, management, and other personnel to provide reasonable assurance regarding the reliability of financial reporting and the preparation of financial statements for external purposes in accordance with generally accepted accounting principles. A company's internal control over financial reporting includes those policies and procedures that (1) pertain to the maintenance of records that, in reasonable detail, accurately and fairly reflect the transactions and dispositions of the assets of the company; (2) provide reasonable assurance that transactions are recorded as necessary to permit preparation of financial statements in accordance with generally accepted accounting principles, and that receipts and expenditures of the company are being made only in accordance with authorizations of management and directors of the company; and (3) provide reasonable assurance regarding prevention or timely detection of unauthorized acquisition, use, or disposition of the company's assets that could have a material effect on the financial statements.
Because of the inherent limitations of internal control over financial reporting, including the possibility of collusion or improper management override of controls, material misstatements due to error or fraud may not be prevented or detected on a timely basis. Also, projections of any evaluation of the effectiveness of the internal control over financial reporting to future periods are subject to the risk that the controls may become inadequate because of changes in conditions, or that the degree of compliance with the policies or procedures may deteriorate.
In our opinion, the Company maintained, in all material respects, effective internal control over financial reporting as of
January 31, 2014
, based on the criteria established in Internal Control - Integrated Framework (1992) issued by the Committee of Sponsoring Organizations of the Treadway Commission.
We have also audited, in accordance with the standards of the Public Company Accounting Oversight Board (United States), the consolidated financial statements and financial statement schedule as of and for the fiscal year ended
January 31, 2014
of the Company and our report dated
March 31, 2014
expressed an unqualified opinion on those financial statements and financial statement schedule.
/s/ Deloitte & Touche LLP
Charlotte, North Carolina
March 31, 2014
34
Lowe's Companies, Inc.
(In millions, except per share and percentage data)
|
January 31,
2014 |
|
% Sales
|
|
February 1,
2013 |
|
% Sales
|
|
February 3,
2012 |
|
% Sales
|
|
|||||||||
|
Fiscal years ended on
|
||||||||||||||||||||
|
Net sales
|
$
|
53,417
|
|
100.00
|
%
|
$
|
50,521
|
|
100.00
|
%
|
$
|
50,208
|
|
100.00
|
%
|
|||||
|
Cost of sales
|
34,941
|
|
65.41
|
|
33,194
|
|
65.70
|
|
32,858
|
|
65.44
|
|
||||||||
|
Gross margin
|
18,476
|
|
34.59
|
|
17,327
|
|
34.30
|
|
17,350
|
|
34.56
|
|
||||||||
|
Expenses:
|
|
|
|
|
|
|
|
|
|
|
|
|
||||||||
|
Selling, general and administrative
|
12,865
|
|
24.08
|
|
12,244
|
|
24.24
|
|
12,593
|
|
25.08
|
|
||||||||
|
Depreciation
|
1,462
|
|
2.74
|
|
1,523
|
|
3.01
|
|
1,480
|
|
2.95
|
|
||||||||
|
Interest - net
|
476
|
|
0.89
|
|
423
|
|
0.84
|
|
371
|
|
0.74
|
|
||||||||
|
Total expenses
|
14,803
|
|
27.71
|
|
14,190
|
|
28.09
|
|
14,444
|
|
28.77
|
|
||||||||
|
Pre-tax earnings
|
3,673
|
|
6.88
|
|
3,137
|
|
6.21
|
|
2,906
|
|
5.79
|
|
||||||||
|
Income tax provision
|
1,387
|
|
2.60
|
|
1,178
|
|
2.33
|
|
1,067
|
|
2.13
|
|
||||||||
|
Net earnings
|
$
|
2,286
|
|
4.28
|
%
|
$
|
1,959
|
|
3.88
|
%
|
$
|
1,839
|
|
3.66
|
%
|
|||||
|
Basic earnings per common share
|
$
|
2.14
|
|
|
|
$
|
1.69
|
|
|
|
$
|
1.43
|
|
|
|
|||||
|
Diluted earnings per common share
|
$
|
2.14
|
|
|
|
$
|
1.69
|
|
|
|
$
|
1.43
|
|
|
|
|||||
|
Cash dividends per share
|
$
|
0.70
|
|
|
|
$
|
0.62
|
|
|
|
$
|
0.53
|
|
|
|
|||||
Lowe's Companies, Inc.
Consolidated Statements of Comprehensive Income
(In millions, except percentage data)
|
January 31,
2014 |
|
% Sales
|
|
February 1,
2013 |
|
% Sales
|
|
February 3,
2012 |
|
% Sales
|
|
|||||||||
|
Fiscal years ended on
|
||||||||||||||||||||
|
Net earnings
|
$
|
2,286
|
|
4.28
|
%
|
$
|
1,959
|
|
3.88
|
%
|
$
|
1,839
|
|
3.66
|
%
|
|||||
|
Foreign currency translation adjustments - net of tax
|
(68
|
)
|
(0.13
|
)
|
6
|
|
0.01
|
|
(8
|
)
|
(0.02
|
)
|
||||||||
|
Net unrealized investment gains/(losses) - net of tax
|
(1
|
)
|
—
|
|
—
|
|
—
|
|
1
|
|
—
|
|
||||||||
|
Other comprehensive income/(loss)
|
(69
|
)
|
(0.13
|
)
|
6
|
|
0.01
|
|
(7
|
)
|
(0.02
|
)
|
||||||||
|
Comprehensive income
|
$
|
2,217
|
|
4.15
|
%
|
$
|
1,965
|
|
3.89
|
%
|
$
|
1,832
|
|
3.64
|
%
|
|||||
See accompanying notes to consolidated financial statements.
35
Lowe's Companies, Inc.
(In millions, except par value and percentage data)
|
January 31,
2014 |
|
% Total
|
|
February 1,
2013 |
|
% Total
|
|
||||||||
|
|
|||||||||||||||
|
Assets
|
|
|
|
|
|
||||||||||
|
Current assets:
|
|
|
|
|
|
||||||||||
|
Cash and cash equivalents
|
|
$
|
391
|
|
1.2
|
%
|
$
|
541
|
|
1.7
|
%
|
||||
|
Short-term investments
|
|
185
|
|
0.6
|
|
125
|
|
0.4
|
|
||||||
|
Merchandise inventory - net
|
|
9,127
|
|
27.9
|
|
8,600
|
|
26.3
|
|
||||||
|
Deferred income taxes - net
|
|
252
|
|
0.8
|
|
217
|
|
0.7
|
|
||||||
|
Other current assets
|
|
341
|
|
1.0
|
|
301
|
|
0.9
|
|
||||||
|
Total current assets
|
|
10,296
|
|
31.5
|
|
9,784
|
|
30.0
|
|
||||||
|
Property, less accumulated depreciation
|
|
20,834
|
|
63.6
|
|
21,477
|
|
65.7
|
|
||||||
|
Long-term investments
|
|
279
|
|
0.9
|
|
271
|
|
0.8
|
|
||||||
|
Other assets
|
|
1,323
|
|
4.0
|
|
1,134
|
|
3.5
|
|
||||||
|
Total assets
|
|
$
|
32,732
|
|
100.0
|
%
|
$
|
32,666
|
|
100.0
|
%
|
||||
|
Liabilities and shareholders' equity
|
|
|
|
|
|
||||||||||
|
Current liabilities:
|
|
|
|
|
|
||||||||||
|
Short-term borrowings
|
$
|
386
|
|
1.2
|
%
|
$
|
—
|
|
—
|
%
|
|||||
|
Current maturities of long-term debt
|
|
49
|
|
0.1
|
|
47
|
|
0.1
|
|
||||||
|
Accounts payable
|
|
5,008
|
|
15.3
|
|
4,657
|
|
14.3
|
|
||||||
|
Accrued compensation and employee benefits
|
|
785
|
|
2.4
|
|
670
|
|
2.1
|
|
||||||
|
Deferred revenue
|
|
892
|
|
2.7
|
|
824
|
|
2.5
|
|
||||||
|
Other current liabilities
|
|
1,756
|
|
5.4
|
|
1,510
|
|
4.6
|
|
||||||
|
Total current liabilities
|
|
8,876
|
|
27.1
|
|
7,708
|
|
23.6
|
|
||||||
|
Long-term debt, excluding current maturities
|
|
10,086
|
|
30.8
|
|
9,030
|
|
27.6
|
|
||||||
|
Deferred income taxes - net
|
|
291
|
|
0.9
|
|
455
|
|
1.4
|
|
||||||
|
Deferred revenue - extended protection plans
|
|
730
|
|
2.2
|
|
715
|
|
2.2
|
|
||||||
|
Other liabilities
|
|
896
|
|
2.8
|
|
901
|
|
2.8
|
|
||||||
|
Total liabilities
|
|
20,879
|
|
63.8
|
%
|
18,809
|
|
57.6
|
%
|
||||||
|
Commitments and contingencies
|
|
|
|
|
|
||||||||||
|
Shareholders' equity:
|
|
|
|
|
|
||||||||||
|
Preferred stock - $5 par value, none issued
|
|
—
|
|
—
|
|
—
|
|
—
|
|
||||||
|
Common stock - $.50 par value;
|
|
|
|
|
|
||||||||||
|
Shares issued and outstanding
|
|||||||||||||||
|
January 31, 2014
|
1,030
|
||||||||||||||
|
February 1, 2013
|
1,110
|
515
|
|
1.6
|
|
555
|
|
1.7
|
|
||||||
|
Capital in excess of par value
|
|
—
|
|
—
|
|
26
|
|
0.1
|
|
||||||
|
Retained earnings
|
|
11,355
|
|
34.7
|
|
13,224
|
|
40.4
|
|
||||||
|
Accumulated other comprehensive (loss)/income
|
|
(17
|
)
|
(0.1
|
)
|
52
|
|
0.2
|
|
||||||
|
Total shareholders' equity
|
|
11,853
|
|
36.2
|
|
13,857
|
|
42.4
|
|
||||||
|
Total liabilities and shareholders' equity
|
|
$
|
32,732
|
|
100.0
|
%
|
$
|
32,666
|
|
100.0
|
%
|
||||
See accompanying notes to consolidated financial statements.
36
Lowe's Companies, Inc.
Consolidated Statements of Shareholders' Equity
(In millions)
|
Capital in Excess
of Par Value |
|
Retained Earnings
|
|
Accumulated Other Comprehensive
Income/(Loss) |
|
Total
Shareholders' Equity |
|
|||||||||||||||
|
|
Common Stock
|
|||||||||||||||||||||
|
Shares
|
|
Amount
|
|
|||||||||||||||||||
|
Balance January 28, 2011
|
1,354
|
|
$
|
677
|
|
$
|
11
|
|
$
|
17,371
|
|
$
|
53
|
|
$
|
18,112
|
|
|||||
|
Comprehensive income:
|
|
|
|
|
|
|
|
|
|
|
|
|
||||||||||
|
Net earnings
|
|
|
|
|
|
|
1,839
|
|
|
|
|
|
||||||||||
|
Other comprehensive loss
|
|
|
|
|
|
|
|
|
(7
|
)
|
|
|
||||||||||
|
Total comprehensive income
|
|
|
|
|
|
|
|
|
|
|
1,832
|
|
||||||||||
|
Tax effect of non-qualified stock options exercised and restricted stock vested
|
|
|
|
|
(8
|
)
|
|
|
|
|
(8
|
)
|
||||||||||
|
Cash dividends declared, $0.53 per share
|
|
|
|
|
|
|
(672
|
)
|
|
|
(672
|
)
|
||||||||||
|
Share-based payment expense
|
|
|
|
|
106
|
|
|
|
|
|
106
|
|
||||||||||
|
Repurchase of common stock
|
(120
|
)
|
(60
|
)
|
(193
|
)
|
(2,686
|
)
|
|
|
(2,939
|
)
|
||||||||||
|
Issuance of common stock under share-based payment plans
|
7
|
|
4
|
|
98
|
|
|
|
|
|
102
|
|
||||||||||
|
Balance February 3, 2012
|
1,241
|
|
$
|
621
|
|
$
|
14
|
|
$
|
15,852
|
|
$
|
46
|
|
$
|
16,533
|
|
|||||
|
Comprehensive income:
|
|
|
|
|
|
|
|
|
|
|
|
|
||||||||||
|
Net earnings
|
|
|
|
|
|
|
1,959
|
|
|
|
|
|
||||||||||
|
Other comprehensive income
|
|
|
|
|
|
|
|
|
6
|
|
|
|
||||||||||
|
Total comprehensive income
|
|
|
|
|
|
|
|
|
|
|
1,965
|
|
||||||||||
|
Tax effect of non-qualified stock options exercised and restricted stock vested
|
|
|
|
|
12
|
|
|
|
|
|
12
|
|
||||||||||
|
Cash dividends declared, $0.62 per share
|
|
|
|
|
|
|
(708
|
)
|
|
|
(708
|
)
|
||||||||||
|
Share-based payment expense
|
|
|
|
|
97
|
|
|
|
|
|
97
|
|
||||||||||
|
Repurchase of common stock
|
(147
|
)
|
(74
|
)
|
(440
|
)
|
(3,879
|
)
|
|
|
(4,393
|
)
|
||||||||||
|
Issuance of common stock under share-based payment plans
|
16
|
|
8
|
|
343
|
|
|
|
|
|
351
|
|
||||||||||
|
Balance February 1, 2013
|
1,110
|
|
$
|
555
|
|
$
|
26
|
|
$
|
13,224
|
|
$
|
52
|
|
$
|
13,857
|
|
|||||
|
Comprehensive income:
|
|
|
|
|
|
|
|
|
|
|
|
|
||||||||||
|
Net earnings
|
|
|
|
|
|
|
2,286
|
|
|
|
|
|
||||||||||
|
Other comprehensive loss
|
|
|
|
|
|
|
|
|
(69
|
)
|
|
|
||||||||||
|
Total comprehensive income
|
|
|
|
|
|
|
|
|
|
|
2,217
|
|
||||||||||
|
Tax effect of non-qualified stock options exercised and restricted stock vested
|
|
|
|
|
25
|
|
|
|
|
|
25
|
|
||||||||||
|
Cash dividends declared, $0.70 per share
|
|
|
|
|
|
|
(741
|
)
|
|
|
(741
|
)
|
||||||||||
|
Share-based payment expense
|
|
|
|
|
102
|
|
|
|
|
|
102
|
|
||||||||||
|
Repurchase of common stock
|
(88
|
)
|
(44
|
)
|
(312
|
)
|
(3,414
|
)
|
|
|
(3,770
|
)
|
||||||||||
|
Issuance of common stock under share-based payment plans
|
8
|
|
4
|
|
159
|
|
|
|
|
|
163
|
|
||||||||||
|
Balance January 31, 2014
|
1,030
|
|
$
|
515
|
|
$
|
—
|
|
$
|
11,355
|
|
$
|
(17
|
)
|
$
|
11,853
|
|
|||||
See accompanying notes to consolidated financial statements.
37
Lowe's Companies, Inc.
(In millions)
|
January 31,
2014 |
|
February 1,
2013 |
|
February 3,
2012 |
|
||||||
|
Fiscal years ended on
|
|||||||||||
|
Cash flows from operating activities:
|
|
|
|
||||||||
|
Net earnings
|
$
|
2,286
|
|
$
|
1,959
|
|
$
|
1,839
|
|
||
|
Adjustments to reconcile net earnings to net cash provided by operating activities:
|
|
|
|
|
|
|
|||||
|
Depreciation and amortization
|
1,562
|
|
1,623
|
|
1,579
|
|
|||||
|
Deferred income taxes
|
(162
|
)
|
(140
|
)
|
54
|
|
|||||
|
Loss on property and other assets – net
|
64
|
|
83
|
|
456
|
|
|||||
|
Loss on equity method investments
|
52
|
|
48
|
|
12
|
|
|||||
|
Share-based payment expense
|
100
|
|
100
|
|
107
|
|
|||||
|
Changes in operating assets and liabilities:
|
|
|
|
|
|
|
|||||
|
Merchandise inventory – net
|
(396
|
)
|
(244
|
)
|
(33
|
)
|
|||||
|
Other operating assets
|
(5
|
)
|
(87
|
)
|
125
|
|
|||||
|
Accounts payable
|
291
|
|
303
|
|
(5
|
)
|
|||||
|
Other operating liabilities
|
319
|
|
117
|
|
215
|
|
|||||
|
Net cash provided by operating activities
|
4,111
|
|
3,762
|
|
4,349
|
|
|||||
|
Cash flows from investing activities:
|
|
|
|
|
|
|
|||||
|
Purchases of investments
|
(759
|
)
|
(1,444
|
)
|
(1,433
|
)
|
|||||
|
Proceeds from sale/maturity of investments
|
709
|
|
1,837
|
|
2,120
|
|
|||||
|
Capital expenditures
|
(940
|
)
|
(1,211
|
)
|
(1,829
|
)
|
|||||
|
Contributions to equity method investments – net
|
(173
|
)
|
(219
|
)
|
(232
|
)
|
|||||
|
Proceeds from sale of property and other long-term assets
|
75
|
|
130
|
|
52
|
|
|||||
|
Acquisition of business - net
|
(203
|
)
|
—
|
|
(100
|
)
|
|||||
|
Other – net
|
5
|
|
4
|
|
(15
|
)
|
|||||
|
Net cash used in investing activities
|
(1,286
|
)
|
(903
|
)
|
(1,437
|
)
|
|||||
|
Cash flows from financing activities:
|
|
|
|
|
|
|
|||||
|
Net increase in short-term borrowings
|
386
|
|
—
|
|
—
|
|
|||||
|
Net proceeds from issuance of long-term debt
|
985
|
|
1,984
|
|
993
|
|
|||||
|
Repayment of long-term debt
|
(47
|
)
|
(591
|
)
|
(37
|
)
|
|||||
|
Proceeds from issuance of common stock under share-based payment plans
|
165
|
|
349
|
|
100
|
|
|||||
|
Cash dividend payments
|
(733
|
)
|
(704
|
)
|
(647
|
)
|
|||||
|
Repurchase of common stock
|
(3,710
|
)
|
(4,393
|
)
|
(2,937
|
)
|
|||||
|
Other – net
|
(15
|
)
|
22
|
|
(21
|
)
|
|||||
|
Net cash used in financing activities
|
(2,969
|
)
|
(3,333
|
)
|
(2,549
|
)
|
|||||
|
Effect of exchange rate changes on cash
|
(6
|
)
|
1
|
|
(1
|
)
|
|||||
|
Net (decrease)/increase in cash and cash equivalents
|
(150
|
)
|
(473
|
)
|
362
|
|
|||||
|
Cash and cash equivalents, beginning of year
|
541
|
|
1,014
|
|
652
|
|
|||||
|
Cash and cash equivalents, end of year
|
$
|
391
|
|
$
|
541
|
|
$
|
1,014
|
|
||
See accompanying notes to consolidated financial statements.
38
NOTES TO CONSOLIDATED FINANCIAL STATEMENTS
YEARS ENDED
JANUARY 31, 2014
,
FEBRUARY 1, 2013
AND
FEBRUARY 3, 2012
Lowe’s Companies, Inc. and subsidiaries (the Company) is the world's second-largest home improvement retailer and operated
1,832
stores in the United States, Canada and Mexico at
January 31, 2014
. Below are those accounting policies considered by the Company to be significant.
Fiscal Year -
The Company’s fiscal year ends on the Friday nearest the end of January. Fiscal years
2013
and
2012
each contained 52 weeks, and fiscal year 2011 contained 53 weeks. All references herein for the years
2013
,
2012
and
2011
represent the fiscal years ended
January 31, 2014
,
February 1, 2013
, and
February 3, 2012
, respectively.
Principles of Consolidation
- The consolidated financial statements include the accounts of the Company and its wholly-owned or controlled operating subsidiaries. All intercompany accounts and transactions have been eliminated.
Foreign Currency
- The functional currencies of the Company’s international subsidiaries are generally the local currencies of the countries in which the subsidiaries are located. Foreign currency denominated assets and liabilities are translated into U.S. dollars using the exchange rates in effect at the consolidated balance sheet date. Results of operations and cash flows are translated using the average exchange rates throughout the period. The effect of exchange rate fluctuations on translation of assets and liabilities is included as a component of shareholders' equity in accumulated other comprehensive income (loss). Gains and losses from foreign currency transactions, which are included in selling, general and administrative (SG&A) expense, have not been significant.
Use of Estimates
- The preparation of the Company’s financial statements in accordance with accounting principles generally accepted in the United States of America requires management to make estimates that affect the reported amounts of assets, liabilities, sales and expenses, and related disclosures of contingent assets and liabilities. The Company bases these estimates on historical results and various other assumptions believed to be reasonable, all of which form the basis for making estimates concerning the carrying values of assets and liabilities that are not readily available from other sources. Actual results may differ from these estimates.
Cash and Cash Equivalents
- Cash and cash equivalents include cash on hand, demand deposits and short-term investments with original maturities of three months or less when purchased. Cash and cash equivalents are carried at amortized cost on the consolidated balance sheets. The majority of payments due from financial institutions for the settlement of credit card and debit card transactions process within two business days and are, therefore, classified as cash and cash equivalents.
Investments
- As of
January 31, 2014
, investments consisted primarily of money market funds, certificates of deposit, municipal obligations, and municipal floating rate obligations. The Company classifies as investments restricted balances primarily pledged as collateral for the Company’s extended protection plan program. Investments, exclusive of cash equivalents, with a stated maturity date of one year or less from the balance sheet date or that are expected to be used in current operations, are classified as short-term investments. The Company’s trading securities are also classified as short-term investments. All other investments are classified as long-term.
Merchandise Inventory
- Inventory is stated at the lower of cost or market using the first-in, first-out method of inventory accounting. The cost of inventory also includes certain costs associated with the preparation of inventory for resale, including distribution center costs, and is net of vendor funds.
The Company records an inventory reserve for the anticipated loss associated with selling inventories below cost. This reserve is based on management’s current knowledge with respect to inventory levels, sales trends and historical experience. Management does not believe the Company’s merchandise inventories are subject to significant risk of obsolescence in the near term, and management has the ability to adjust purchasing practices based on anticipated sales trends and general economic conditions. However, changes in consumer purchasing patterns could result in the need for additional reserves. The Company also records an inventory reserve for the estimated shrinkage between physical inventories. This reserve is based primarily on actual shrink results from previous physical inventories. Changes in the estimated shrink reserve are made based on the timing and results of physical inventories.
The Company receives funds from vendors in the normal course of business, principally as a result of purchase volumes, sales, early payments or promotions of vendors’ products. Generally, these vendor funds do not represent the reimbursement of specific, incremental and identifiable costs incurred by the Company to sell the vendor’s product. Therefore, the Company
39
treats these funds as a reduction in the cost of inventory as the amounts are accrued, and are recognized as a reduction of cost of sales when the inventory is sold. Funds that are determined to be reimbursements of specific, incremental and identifiable costs incurred to sell vendors’ products are recorded as an offset to the related expense. The Company develops accrual rates for vendor funds based on the provisions of the agreements in place. Due to the complexity and diversity of the individual vendor agreements, the Company performs analyses and reviews historical trends throughout the year and confirms actual amounts with select vendors to ensure the amounts earned are appropriately recorded. Amounts accrued throughout the year could be impacted if actual purchase volumes differ from projected annual purchase volumes, especially in the case of programs that provide for increased funding when graduated purchase volumes are met.
Derivative
Financial Instruments
- The Company occasionally utilizes derivative financial instruments to manage certain business risks. However, the amounts were not material to the Company’s consolidated financial statements in any of the years presented. The Company does not use derivative financial instruments for trading purposes.
Credit Programs
- The majority of the Company’s accounts receivable arises from sales of goods and services to commercial business customers. The Company has an agreement with GE Capital Retail (GECR) under which GECR purchases at face value commercial business accounts receivable originated by the Company and services these accounts. This agreement expires in December 2016, unless terminated sooner by the parties. The Company accounts for these transfers as sales of the accounts receivable. When the Company sells its commercial business accounts receivable, it retains certain interests in those receivables, including the funding of a loss reserve and its obligation related to GECR’s ongoing servicing of the receivables sold. Any gain or loss on the sale is determined based on the previous carrying amounts of the transferred assets allocated at fair value between the receivables sold and the interests retained. Fair value is based on the present value of expected future cash flows, taking into account the key assumptions of anticipated credit losses, payment rates, late fee rates, GECR’s servicing costs and the discount rate commensurate with the uncertainty involved. Due to the short-term nature of the receivables sold, changes to the key assumptions would not materially impact the recorded gain or loss on the sales of receivables or the fair value of the retained interests in the receivables.
Total commercial business accounts receivable sold to GECR were
$2.2 billion
in
2013
,
$1.9 billion
in
2012
and
$1.8 billion
in
2011
. The Company recognized losses of
$38 million
in
2013
,
$30 million
in
2012
and
$31 million
in
2011
on these receivable sales as SG&A expense, which primarily relates to the fair value of the obligations incurred related to servicing costs that are remitted to GECR monthly. At
January 31, 2014
and
February 1, 2013
, the fair value of the retained interests was determined based on the present value of expected future cash flows and was insignificant.
Sales generated through the Company’s proprietary credit cards are not reflected in receivables. Under an agreement with GECR, credit is extended directly to customers by GECR. All credit program-related services are performed and controlled directly by GECR. The Company has the option, but no obligation, to purchase the receivables at the end of the agreement in December 2016. Tender costs, including amounts associated with accepting the Company’s proprietary credit cards, are included in SG&A expense in the consolidated statements of earnings.
The total portfolio of receivables held by GECR, including both receivables originated by GECR from the Company’s proprietary credit cards and commercial business accounts receivable originated by the Company and sold to GECR, approximated
$7.2 billion
at
January 31, 2014
, and
$6.5 billion
at
February 1, 2013
.
Property and Depreciation
- Property is recorded at cost. Costs associated with major additions are capitalized and depreciated. Capital assets are expected to yield future benefits and have original useful lives which exceed one year. The total cost of a capital asset generally includes all applicable sales taxes, delivery costs, installation costs and other appropriate costs incurred by the Company, including interest in the case of self-constructed assets. Upon disposal, the cost of properties and related accumulated depreciation is removed from the accounts, with gains and losses reflected in SG&A expense in the consolidated statements of earnings.
Property consists of land, buildings and building improvements, equipment and construction in progress. Buildings and building improvements includes owned buildings, as well as buildings under capital lease and leasehold improvements. Equipment primarily includes store racking and displays, computer hardware and software, forklifts, vehicles and other store equipment
.
Depreciation is provided over the estimated useful lives of the depreciable assets. Assets are depreciated using the straight-line method. Leasehold improvements and assets under capital lease are depreciated over the shorter of their estimated useful lives or the term of the related lease, which may include one or more option renewal periods where failure to exercise such options would result in an economic penalty in such amount that renewal appears, at the inception of the lease, to be reasonably assured. During the term of a lease, if leasehold improvements are placed in service significantly after the inception of the
40
lease, the Company depreciates these leasehold improvements over the shorter of the useful life of the leasehold assets or a term that includes lease renewal periods deemed to be reasonably assured at the time the leasehold improvements are placed into service. The amortization of these assets is included in depreciation expense in the consolidated financial statements.
Long-Lived Asset Impairment/Exit Activities
-
The carrying amounts of long-lived assets are reviewed whenever certain events or changes in circumstances indicate that the carrying amounts may not be recoverable. A potential impairment has occurred for long-lived assets held-for-use if projected future undiscounted cash flows expected to result from the use and eventual disposition of the assets are less than the carrying amounts of the assets. An impairment loss is recorded for long-lived assets held-for-use when the carrying amount of the asset is not recoverable and exceeds its fair value.
Excess properties that are expected to be sold within the next 12 months and meet the other relevant held-for-sale criteria are classified as long-lived assets held-for-sale. Excess properties consist primarily of retail outparcels and property associated with relocated or closed locations. An impairment loss is recorded for long-lived assets held-for-sale when the carrying amount of the asset exceeds its fair value less cost to sell. A long-lived asset is not depreciated while it is classified as held-for-sale.
For long-lived assets to be abandoned, the Company considers the asset to be disposed of when it ceases to be used. Until it ceases to be used, the Company continues to classify the asset as held-for-use and tests for potential impairment accordingly. If the Company commits to a plan to abandon a long-lived asset before the end of its previously estimated useful life, its depreciable life is re-evaluated.
The Company recorded long-lived asset impairment losses of
$46 million
during
2013
, including
$26 million
for operating locations,
$17 million
for excess properties classified as held-for-use and
$3 million
, including costs to sell, for excess properties classified as held-for-sale. The Company recorded impairment losses of
$77 million
in
2012
, including
$55 million
for operating locations,
$17 million
for excess properties classified as held-for-use and
$5 million
, including costs to sell, for excess properties classified as held-for-sale. The Company recorded long-lived asset impairment of
$388 million
during
2011
, including
$40 million
for operating locations,
$269 million
for locations identified for closure,
$78 million
for excess properties classified as held-for-use and
$1 million
, including costs to sell, for excess properties classified as held-for-sale. Impairment losses are included in SG&A expense in the consolidated statements of earnings. Fair value measurements associated with long-lived asset impairments are further described in Note 2 to the consolidated financial statements.
During 2011, the Company closed 27 underperforming stores across the United States. These decisions were the result of the Company’s realignment of its store operations structure and its continued efforts to focus resources in a manner that would generate the greatest shareholder value. Total impairment losses for locations identified for closure for 2011 relate to these store closings.
The net carrying amount of excess properties that do not meet the held-for-sale criteria is included in other assets (noncurrent) on the consolidated balance sheets and totaled
$204 million
and
$218 million
at
January 31, 2014
and
February 1, 2013
, respectively.
When locations under operating leases are closed, a liability is recognized for the fair value of future contractual obligations, including future minimum lease payments, property taxes, utilities, common area maintenance and other ongoing expenses, net of estimated sublease income and other recoverable items. When the Company commits to an exit plan and communicates that plan to affected employees, a liability is recognized in connection with one-time employee termination benefits. Subsequent changes to the liabilities, including a change resulting from a revision to either the timing or the amount of estimated cash flows, are recognized in the period of change. Expenses associated with exit activities are included in SG&A expense in the consolidated statement of earnings.
Equity Method Investments
- The Company’s investments in certain unconsolidated entities are accounted for under the equity method. The balance of these investments is included in other assets (noncurrent) in the accompanying consolidated balance sheets. The balance is increased to reflect the Company’s capital contributions and equity in earnings of the investees. The balance is decreased to reflect its equity in losses of the investees and for distributions received that are not in excess of the carrying amount of the investments. Equity in earnings and losses of the investees has been immaterial and is included in SG&A expense.
Leases
- For lease agreements that provide for escalating rent payments or free-rent occupancy periods, the Company recognizes rent expense on a straight-line basis over the non-cancellable lease term and option renewal periods where failure to exercise such options would result in an economic penalty in such amount that renewal appears, at the inception of the lease, to be reasonably assured. The lease term commences on the date that the Company takes possession of or controls the physical use of the property. Deferred rent is included in other liabilities (noncurrent) on the consolidated balance sheets.
41
When the Company renegotiates and amends a lease to extend the non-cancellable lease term prior to the date at which it would have been required to exercise or decline a term extension option, the amendment is treated as a new lease. The new lease begins on the date the lease amendment is entered into and ends on the last date of the non-cancellable lease term, as adjusted to include any option renewal periods where failure to exercise such options would result in an economic penalty in such amount that renewal appears, at the inception of the lease amendment, to be reasonably assured. The new lease is classified as operating or capital under the authoritative guidance through use of assumptions regarding residual value, economic life, incremental borrowing rate, and fair value of the leased asset(s) as of the date of the amendment.
Accounts Payable -
The Company has an agreement with a third party to provide an accounts payable tracking system which facilitates participating suppliers’ ability to finance payment obligations from the Company with designated third-party financial institutions. Participating suppliers may, at their sole discretion, make offers to finance one or more payment obligations of the Company prior to their scheduled due dates at a discounted price to participating financial institutions. The Company’s goal in entering into this arrangement is to capture overall supply chain savings, in the form of pricing, payment terms or vendor funding, created by facilitating suppliers’ ability to finance payment obligations at more favorable discount rates, while providing them with greater working capital flexibility.
The Company’s obligations to its suppliers, including amounts due and scheduled payment dates, are not impacted by suppliers’ decisions to finance amounts under this arrangement. However, the Company’s right to offset balances due from suppliers against payment obligations is restricted by this arrangement for those payment obligations that have been financed by suppliers. As of
January 31, 2014
and
February 1, 2013
,
$735 million
and
$665 million
, respectively, of the Company’s outstanding payment obligations had been placed on the accounts payable tracking system, and participating suppliers had financed
$443 million
and
$400 million
, respectively, of those payment obligations to participating financial institutions.
Other Current Liabilities
- Other current liabilities on the consolidated balance sheets consist of:
|
(In millions)
|
January 31, 2014
|
|
February 1, 2013
|
|
|||
|
Self-insurance liabilities
|
$
|
324
|
|
$
|
316
|
|
|
|
Accrued dividends
|
186
|
|
178
|
|
|||
|
Accrued interest
|
153
|
|
136
|
|
|||
|
Sales tax liabilities
|
122
|
|
104
|
|
|||
|
Accrued property taxes
|
121
|
|
112
|
|
|||
|
Other
|
850
|
|
664
|
|
|||
|
Total
|
$
|
1,756
|
|
$
|
1,510
|
|
|
Self-Insurance
- The Company is self-insured for certain losses relating to workers’ compensation, automobile, property, and general and product liability claims. The Company has insurance coverage to limit the exposure arising from these claims. The Company is also self-insured for certain losses relating to extended protection plan and medical and dental claims. Self-insurance claims filed and claims incurred but not reported are accrued based upon management’s estimates of the discounted ultimate cost for self-insured claims incurred using actuarial assumptions followed in the insurance industry and historical experience. Although management believes it has the ability to reasonably estimate losses related to claims, it is possible that actual results could differ from recorded self-insurance liabilities. The total self-insurance liability, including the current and non-current portions, was
$904 million
and
$899 million
at
January 31, 2014
and
February 1, 2013
, respectively.
The Company provides surety bonds issued by insurance companies to secure payment of workers’ compensation liabilities as required in certain states where the Company is self-insured. Outstanding surety bonds relating to self-insurance were
$228 million
and
$216 million
at
January 31, 2014
, and
February 1, 2013
, respectively.
Income Taxes
- The Company establishes deferred income tax assets and liabilities for temporary differences between the tax and financial accounting bases of assets and liabilities. The tax effects of such differences are reflected in the consolidated balance sheets at the enacted tax rates expected to be in effect when the differences reverse. A valuation allowance is recorded to reduce the carrying amount of deferred tax assets if it is more likely than not that all or a portion of the asset will not be realized. The tax balances and income tax expense recognized by the Company are based on management’s interpretation of the tax statutes of multiple jurisdictions.
42
The Company establishes a liability for tax positions for which there is uncertainty as to whether or not the position will be ultimately sustained. The Company includes interest related to tax issues as part of net interest on the consolidated financial statements. The Company records any applicable penalties related to tax issues within the income tax provision.
Shareholders' Equity -
The Company has a share repurchase program that is executed through purchases made from time to time either in the open market or through private market transactions. Shares purchased under the repurchase program are retired and returned to authorized and unissued status. Any excess of cost over par value is charged to additional paid-in capital to the extent that a balance is present. Once additional paid-in capital is fully depleted, remaining excess of cost over par value is charged to retained earnings.
Revenue Recognition -
The Company recognizes revenues, net of sales tax, when sales transactions occur and customers take possession of the merchandise. A provision for anticipated merchandise returns is provided through a reduction of sales and cost of sales in the period that the related sales are recorded. Revenues from product installation services are recognized when the installation is completed. Deferred revenues associated with amounts received for which customers have not yet taken possession of merchandise or for which installation has not yet been completed were
$461 million
and
$441 million
at
January 31, 2014
, and
February 1, 2013
, respectively.
Revenues from stored-value cards, which include gift cards and returned merchandise credits, are deferred and recognized when the cards are redeemed. The liability associated with outstanding stored-value cards was
$431 million
and
$383 million
at
January 31, 2014
, and
February 1, 2013
, respectively, and these amounts are included in deferred revenue on the consolidated balance sheets. The Company recognizes income from unredeemed stored-value cards at the point at which redemption becomes remote. The Company’s stored-value cards have no expiration date or dormancy fees. Therefore, to determine when redemption is remote, the Company analyzes an aging of the unredeemed cards based on the date of last stored-value card use.
Extended Protection Plans
- The Company sells separately-priced extended protection plan contracts under a Lowe’s-branded program for which the Company is ultimately self-insured. The Company recognizes revenue from extended protection plan sales on a straight-line basis over the respective contract term. Extended protection plan contract terms primarily range from one to four years from the date of purchase or the end of the manufacturer’s warranty, as applicable. Changes in deferred revenue for extended protection plan contracts are summarized as follows:
|
(In millions)
|
2013
|
|
2012
|
|
|||
|
Deferred revenue - extended protection plans, beginning of year
|
$
|
715
|
|
$
|
704
|
|
|
|
Additions to deferred revenue
|
294
|
|
251
|
|
|||
|
Deferred revenue recognized
|
(279
|
)
|
(240
|
)
|
|||
|
Deferred revenue - extended protection plans, end of year
|
$
|
730
|
|
$
|
715
|
|
|
Incremental direct acquisition costs associated with the sale of extended protection plans are also deferred and recognized as expense on a straight-line basis over the respective contract term. Deferred costs associated with extended protection plan contracts were
$53 million
and
$95 million
at
January 31, 2014
and
February 1, 2013
, respectively. The Company’s extended protection plan deferred costs are included in other assets (noncurrent) on the consolidated balance sheets. All other costs, such as costs of services performed under the contract, general and administrative expenses and advertising expenses are expensed as incurred.
The liability for extended protection plan claims incurred is included in other current liabilities on the consolidated balance sheets. Changes in the liability for extended protection plan claims are summarized as follows:
|
(In millions)
|
2013
|
|
2012
|
|
|||
|
Liability for extended protection plan claims, beginning of year
|
$
|
20
|
|
$
|
21
|
|
|
|
Accrual for claims incurred
|
114
|
|
102
|
|
|||
|
Claim payments
|
(116
|
)
|
(103
|
)
|
|||
|
Liability for extended protection plan claims, end of year
|
$
|
18
|
|
$
|
20
|
|
|
Cost of Sales and Selling, General and Administrative Expenses -
The following lists the primary costs classified in each major expense category:
43
|
Cost of Sales
|
|
Selling, General and Administrative
|
||||
|
n
|
Total cost of products sold, including:
|
n
|
Payroll and benefit costs for retail and corporate
|
|||
|
-
|
Purchase costs, net of vendor funds;
|
employees;
|
||||
|
-
|
Freight expenses associated with moving
|
n
|
Occupancy costs of retail and corporate facilities;
|
|||
|
merchandise inventories from vendors to
|
n
|
Advertising;
|
||||
|
retail stores;
|
n
|
Costs associated with delivery of products from
|
||||
|
-
|
Costs associated with operating the
|
stores and distribution centers to customers;
|
||||
|
Company's distribution network, including
|
n
|
Third-party, in-store service costs;
|
||||
|
payroll and benefit costs and occupancy
|
n
|
Tender costs, including bank charges, costs
|
||||
|
costs;
|
associated with credit card interchange fees and
|
|||||
|
n
|
Costs of installation services provided;
|
amounts associated with accepting the Company's
|
||||
|
n
|
Costs associated with delivery of products directly
|
proprietary credit cards;
|
||||
|
from vendors to customers by third parties;
|
n
|
Costs associated with self-insured plans, and
|
||||
|
n
|
Costs associated with inventory shrinkage and
|
premium costs for stop-loss coverage and fully
|
||||
|
obsolescence.
|
insured plans;
|
|||||
|
n
|
Costs of services performed under the extended
|
n
|
Long-lived asset impairment losses and gains/losses
|
|||
|
protection plan.
|
on disposal of assets;
|
|||||
|
n
|
Other administrative costs, such as supplies, and
|
|||||
|
travel and entertainment.
|
||||||
Advertising
- Costs associated with advertising are charged to expense as incurred. Advertising expenses were
$811 million
,
$809 million
and
$803 million
in
2013
,
2012
and
2011
, respectively.
Shipping and Handling Costs
- The Company includes shipping and handling costs relating to the delivery of products directly from vendors to customers by third parties in cost of sales. Shipping and handling costs, which include third-party delivery costs, salaries, and vehicle operations expenses relating to the delivery of products from stores and distribution centers to customers, are classified as SG&A expense. Shipping and handling costs included in SG&A expense were
$501 million
,
$457 million
and
$461 million
in
2013
,
2012
and
2011
, respectively.
Store Opening Costs
- Costs of opening new or relocated retail stores, which include payroll and supply costs incurred prior to store opening and grand opening advertising costs, are charged to expense as incurred.
Comprehensive Income
- The Company reports comprehensive income in its consolidated statements of comprehensive income and consolidated statements of shareholders’ equity. Comprehensive income represents changes in shareholders' equity from non-owner sources and is comprised primarily of net earnings plus or minus unrealized gains or losses on available-for-sale securities, as well as foreign currency translation adjustments. Net unrealized gains, net of tax, on available-for-sale securities classified in accumulated other comprehensive income on the consolidated balance sheets were insignificant at
January 31, 2014
,
February 1, 2013
and
February 3, 2012
. The reclassification adjustments for realized gains/losses included in net earnings were insignificant during
2013
,
2012
and
2011
. Net foreign currency translation losses, net of tax, classified in accumulated other comprehensive loss were
$17 million
at
January 31, 2014
. Net foreign currency translation gains, net of tax, classified in accumulated other comprehensive income were
$51 million
and
$45 million
at
February 1, 2013
and
February 3, 2012
, respectively.
Segment Information
- The Company’s home improvement retail operations represent a single reportable segment. Key operating decisions are made at the Company level in order to maintain a consistent retail store presentation. The Company’s home improvement retail stores sell similar products and services, use similar processes to sell those products and services, and sell their products and services to similar classes of customers. In addition, the Company's operations exhibit similar economic characteristics. The amounts of long-lived assets and net sales outside of the U.S. were not significant for any of the periods presented.
Reclassifications
- Certain prior period amounts have been reclassified to conform to current classifications. Certain amounts within the consolidated statements of cash flows have been reclassified, including separately noting cash outflows for acquisition of businesses within the investing section.
44
Fair value is defined as the price that would be received to sell an asset or paid to transfer a liability in an orderly transaction between market participants at the measurement date. The authoritative guidance for fair value measurements establishes a three-level hierarchy, which encourages an entity to maximize the use of observable inputs and minimize the use of unobservable inputs when measuring fair value. The three levels of the hierarchy are defined as follows:
|
•
|
Level 1
-
inputs to the valuation techniques that are quoted prices in active markets for identical assets or liabilities
|
|
•
|
Level 2
-
inputs to the valuation techniques that are other than quoted prices but are observable for the assets or liabilities, either directly or indirectly
|
|
•
|
Level 3
-
inputs to the valuation techniques that are unobservable for the assets or liabilities
|
Assets and Liabilities that are Measured at Fair Value on a Recurring Basis
The following tables present the Company’s financial assets measured at fair value on a recurring basis as of
January 31, 2014
and
February 1, 2013
, classified by fair value hierarchy:
|
|
|
Fair Value Measurements at Reporting Date Using
|
|||||||||||||
|
(In millions)
|
January 31, 2014
|
|
Level 1
|
|
Level 2
|
|
Level 3
|
|
|||||||
|
Available-for-sale securities:
|
|
|
|
|
|||||||||||
|
Money market funds
|
$
|
128
|
|
$
|
128
|
|
$
|
—
|
|
$
|
—
|
|
|||
|
Certificates of deposit
|
21
|
|
21
|
|
—
|
|
—
|
|
|||||||
|
Municipal obligations
|
18
|
|
—
|
|
18
|
|
—
|
|
|||||||
|
Municipal floating rate obligations
|
18
|
|
—
|
|
18
|
|
—
|
|
|||||||
|
Total short-term investments
|
$
|
185
|
|
$
|
149
|
|
$
|
36
|
|
$
|
—
|
|
|||
|
Available-for-sale securities:
|
|
|
|
|
|
|
|
|
|||||||
|
Municipal floating rate obligations
|
$
|
265
|
|
$
|
—
|
|
$
|
265
|
|
$
|
—
|
|
|||
|
Municipal obligations
|
14
|
|
—
|
|
14
|
|
—
|
|
|||||||
|
Total long-term investments
|
$
|
279
|
|
$
|
—
|
|
$
|
279
|
|
$
|
—
|
|
|||
|
|
|
Fair Value Measurements at Reporting Date Using
|
|||||||||||||
|
(In millions)
|
February 1, 2013
|
|
Level 1
|
|
Level 2
|
|
Level 3
|
|
|||||||
|
Available-for-sale securities:
|
|
|
|
|
|||||||||||
|
Money market funds
|
$
|
49
|
|
$
|
49
|
|
$
|
—
|
|
$
|
—
|
|
|||
|
Municipal obligations
|
56
|
|
—
|
|
56
|
|
—
|
|
|||||||
|
Municipal floating rate obligations
|
14
|
|
—
|
|
14
|
|
—
|
|
|||||||
|
Other
|
6
|
|
—
|
|
6
|
|
—
|
|
|||||||
|
Total short-term investments
|
$
|
125
|
|
$
|
49
|
|
$
|
76
|
|
$
|
—
|
|
|||
|
Available-for-sale securities:
|
|
|
|
|
|
|
|
|
|||||||
|
Municipal floating rate obligations
|
$
|
230
|
|
$
|
—
|
|
$
|
230
|
|
$
|
—
|
|
|||
|
Municipal obligations
|
41
|
|
—
|
|
41
|
|
—
|
|
|||||||
|
Total long-term investments
|
$
|
271
|
|
$
|
—
|
|
$
|
271
|
|
$
|
—
|
|
|||
There were no transfers between Levels 1, 2 or 3 during any of the periods presented.
When available, quoted prices were used to determine fair value. When quoted prices in active markets were available, investments were classified within Level 1 of the fair value hierarchy. When quoted prices in active markets were not available, fair values were determined using pricing models, and the inputs to those pricing models were based on observable
45
market inputs. The inputs to the pricing models were typically benchmark yields, reported trades, broker-dealer quotes, issuer spreads and benchmark securities, among others.
Assets and Liabilities that are Measured at Fair Value on a Nonrecurring Basis
For the years ended
January 31, 2014
and
February 1, 2013
, the Company’s only significant assets or liabilities measured at fair value on a nonrecurring basis subsequent to their initial recognition were certain assets subject to long-lived asset impairment.
The Company reviews the carrying amounts of long-lived assets whenever certain events or changes in circumstances indicate that the carrying amounts may not be recoverable. With input from store operations, the Company’s accounting and finance personnel that organizationally report to the chief financial officer, assess the performance of retail stores quarterly against historical patterns and projections of future profitability for evidence of possible impairment. An impairment loss is recognized when the carrying amount of the asset (disposal) group is not recoverable and exceeds its fair value. The Company estimated the fair values of assets subject to long-lived asset impairment based on the Company’s own judgments about the assumptions that market participants would use in pricing the assets and on observable market data, when available. The Company classified these fair value measurements as Level 3.
In the determination of impairment for operating locations, the Company determined the fair values of individual operating locations using an income approach, which required discounting projected future cash flows. When determining the stream of projected future cash flows associated with an individual operating location, management made assumptions, incorporating local market conditions and inputs from store operations, about key variables including the following unobservable inputs: sales growth rates, gross margin, controllable expenses, such as payroll and occupancy expense, and asset residual values. In order to calculate the present value of those future cash flows, the Company discounted cash flow estimates at a rate commensurate with the risk that selected market participants would assign to the cash flows. In general, the selected market participants represented a group of other retailers with a location footprint similar in size to the Company’s.
During
2013
,
15
operating locations experienced a triggering event and were evaluated for recoverability.
One
of the 15 operating locations was determined to be impaired due to a decline in recent cash flow trends and an unfavorable sales outlook, resulting in an impairment loss of
$26 million
. The discounted cash flow model used to estimate the fair value of the impaired operating location assumed average annual sales growth rates ranging from
2.0%
to
5.0%
over the remaining life of the location and applied a discount rate of approximately
6%
.
The remaining
14
operating locations that experienced a triggering event during
2013
were determined to be recoverable and, therefore, were not impaired. For
11
of these 14 locations, the expected undiscounted cash flows substantially exceeded the net book value of the location’s assets. A
10%
reduction in projected sales used to estimate future cash flows at the latest date these
11
operating locations were evaluated for impairment would have resulted in the impairment of
four
of these locations and increased recognized impairment losses by
$39 million
.
Three
of the operating locations with a net book value of
$25 million
had expected undiscounted cash flows that exceeded the net book value of its assets by less than a substantial amount. A
10%
reduction in projected sales used to estimate future cash flows at the date these operating locations were evaluated for impairment would have resulted in the impairment of these
three
locations and increased recognized impairment losses by
$23 million
.
We analyzed other assumptions made in estimating the future cash flows of the operating locations evaluated for impairment, but the sensitivity of those assumptions was not significant to the estimates.
In the determination of impairment for excess properties held-for-use and held-for-sale, which consisted of retail outparcels and property associated with relocated or closed locations, the fair values were determined using a market approach based on estimated selling prices. The Company determined the estimated selling prices by obtaining information from property brokers or appraisers in the specific markets being evaluated or negotiated non-binding offers to purchase. The information obtained from property brokers or appraisers included comparable sales of similar assets and assumptions about demand in the market for these assets.
During
2013
, the Company incurred total impairment charges of
$19 million
for
42
excess property locations. A
10%
reduction in the estimated selling prices for these excess properties at the dates the locations were evaluated for impairment would have increased impairment losses by approximately
$6 million
.
46
The following tables present the Company’s non-financial assets measured at estimated fair value on a nonrecurring basis and the resulting long-lived asset impairment losses included in earnings, excluding costs to sell for excess properties held-for-sale. Because assets subject to long-lived asset impairment were not measured at fair value on a recurring basis, certain fair value measurements presented in the table may reflect values at earlier measurement dates and may no longer represent the fair values at
January 31, 2014
and
February 1, 2013
.
Fair Value Measurements - Nonrecurring Basis
|
|
January 31, 2014
|
February 1, 2013
|
|||||||||||||
|
(In millions)
|
Fair Value
Measurements
|
|
Impairment
Losses
|
|
Fair Value
Measurements
|
|
Impairment
Losses
|
|
|||||||
|
Assets-held-for-use:
|
|
|
|
|
|||||||||||
|
Operating locations
|
$
|
13
|
|
$
|
(26
|
)
|
$
|
19
|
|
$
|
(55
|
)
|
|||
|
Excess properties
|
56
|
|
(17
|
)
|
33
|
|
(17
|
)
|
|||||||
|
Assets-held-for-sale:
|
|
|
|
|
|||||||||||
|
Excess properties
|
4
|
|
(2
|
)
|
8
|
|
(4
|
)
|
|||||||
|
Total
|
$
|
73
|
|
$
|
(45
|
)
|
$
|
60
|
|
$
|
(76
|
)
|
|||
Fair Value of Financial Instruments
The Company’s financial instruments not measured at fair value on a recurring basis include cash and cash equivalents, accounts receivable, accounts payable, accrued liabilities and long-term debt and are reflected in the financial statements at cost. With the exception of long-term debt, cost approximates fair value for these items due to their short-term nature. The fair values of the Company’s unsecured notes classified as Level 1 were estimated using quoted market prices. The fair values of the Company’s mortgage notes classified as Level 2 were estimated using discounted cash flow analyses, based on the future cash outflows associated with these arrangements and discounted using the applicable risk-free borrowing rate.
Carrying amounts and the related estimated fair value of the Company’s long-term debt, excluding capitalized lease obligations, are as follows:
|
|
January 31, 2014
|
February 1, 2013
|
|||||||||||||
|
|
Carrying
|
|
Fair
|
|
Carrying
|
|
Fair
|
|
|||||||
|
(In millions)
|
Amount
|
|
Value
|
|
Amount
|
|
Value
|
|
|||||||
|
Unsecured notes (Level 1)
|
$
|
9,617
|
|
$
|
10,630
|
|
$
|
8,627
|
|
$
|
9,860
|
|
|||
|
Mortgage notes (Level 2)
|
17
|
|
19
|
|
19
|
|
22
|
|
|||||||
|
Long-term debt (excluding capitalized lease obligations)
|
$
|
9,634
|
|
$
|
10,649
|
|
$
|
8,646
|
|
$
|
9,882
|
|
|||
The amortized costs, gross unrealized holding gains and losses, and fair values of the Company’s investment securities classified as available-for-sale at
January 31, 2014
and
February 1, 2013
are as follows:
47
|
|
January 31, 2014
|
||||||||||||||
|
|
Amortized
|
|
Gross Unrealized
|
|
Gross Unrealized
|
|
Fair
|
|
|||||||
|
(In millions)
|
Costs
|
|
Gains
|
|
Losses
|
|
Values
|
|
|||||||
|
Money market funds
|
$
|
128
|
|
$
|
—
|
|
$
|
—
|
|
$
|
128
|
|
|||
|
Certificates of deposit
|
21
|
|
—
|
|
—
|
|
21
|
|
|||||||
|
Municipal obligations
|
18
|
|
—
|
|
—
|
|
18
|
|
|||||||
|
Municipal floating rate obligations
|
18
|
|
—
|
|
—
|
|
18
|
|
|||||||
|
Classified as short-term
|
185
|
|
—
|
|
—
|
|
185
|
|
|||||||
|
Municipal floating rate obligations
|
265
|
|
—
|
|
—
|
|
265
|
|
|||||||
|
Municipal obligations
|
14
|
|
—
|
|
—
|
|
14
|
|
|||||||
|
Classified as long-term
|
279
|
|
—
|
|
—
|
|
279
|
|
|||||||
|
Total
|
$
|
464
|
|
$
|
—
|
|
$
|
—
|
|
$
|
464
|
|
|||
|
|
February 1, 2013
|
||||||||||||||
|
|
Amortized
|
|
Gross Unrealized
|
|
Gross Unrealized
|
|
Fair
|
|
|||||||
|
(In millions)
|
Costs
|
|
Gains
|
|
Losses
|
|
Values
|
|
|||||||
|
Money market funds
|
$
|
49
|
|
$
|
—
|
|
$
|
—
|
|
$
|
49
|
|
|||
|
Municipal obligations
|
56
|
|
—
|
|
—
|
|
56
|
|
|||||||
|
Municipal floating rate obligations
|
14
|
|
—
|
|
—
|
|
14
|
|
|||||||
|
Other
|
6
|
|
—
|
|
—
|
|
6
|
|
|||||||
|
Classified as short-term
|
125
|
|
—
|
|
—
|
|
125
|
|
|||||||
|
Municipal floating rate obligations
|
230
|
|
—
|
|
—
|
|
230
|
|
|||||||
|
Municipal obligations
|
40
|
|
1
|
|
—
|
|
41
|
|
|||||||
|
Classified as long-term
|
270
|
|
1
|
|
—
|
|
271
|
|
|||||||
|
Total
|
$
|
395
|
|
$
|
1
|
|
$
|
—
|
|
$
|
396
|
|
|||
The proceeds from sales of available-for-sale securities were
$276 million
,
$1.1 billion
and
$1.3 billion
for
2013
,
2012
and
2011
, respectively. Gross realized gains and losses on the sale of available-for-sale securities were not significant for any of the periods presented. The investments classified as long-term at
January 31, 2014
, will mature in
one
to
38 years
, based on stated maturity dates.
The Company elected the fair value option for certain investments previously maintained in conjunction with certain employee benefit plans. These investments were reported as trading securities, which were included in short-term investments. The Company had no purchases or sales of these investments in
2013
, and none outstanding at
January 31, 2014
. In
2012
, the Company sold its full portfolio of these investments for proceeds of
$29 million
and recognized gains of
$2 million
. Net unrealized gains/losses for
2011
were not significant. Unrealized gains and losses on trading securities were included in SG&A expense. Cash flows from purchases, sales and maturities of trading securities are included in cash flows from investing activities in the consolidated statements of cash flows based on the nature and purpose for which the securities were acquired.
Short-term and long-term investments include restricted balances pledged as collateral primarily for the Company’s extended protection plan program. At
February 1, 2013
, short-term and long-term investments also included restricted balances pledged as collateral for a portion of the Company’s casualty insurance liability. Restricted balances included in short-term investments were
$162 million
at
January 31, 2014
and
$123 million
at
February 1, 2013
. Restricted balances included in long-term investments were
$268 million
at
January 31, 2014
and
$263 million
at
February 1, 2013
.
48
Property is summarized by major class in the following table:
|
(In millions)
|
Estimated
Depreciable Lives, In Years |
|
January 31, 2014
|
|
February 1, 2013
|
|
|||
|
Cost:
|
|
|
|
|
|||||
|
Land
|
N/A
|
|
$
|
7,016
|
|
$
|
6,986
|
|
|
|
Buildings and building improvements
|
5-40
|
|
17,161
|
|
16,968
|
|
|||
|
Equipment
|
3-15
|
|
10,063
|
|
9,780
|
|
|||
|
Construction in progress
|
N/A
|
|
834
|
|
932
|
|
|||
|
Total cost
|
|
35,074
|
|
34,666
|
|
||||
|
Accumulated depreciation
|
|
(14,240
|
)
|
(13,189
|
)
|
||||
|
Property, less accumulated depreciation
|
|
$
|
20,834
|
|
$
|
21,477
|
|
||
Included in net property are assets under capital lease of
$732 million
, less accumulated depreciation of
$455 million
, at
January 31, 2014
, and
$706 million
, less accumulated depreciation of
$418 million
, at
February 1, 2013
. The related amortization expense for assets under capital lease is included in depreciation expense.
On
August 30, 2013
, the Company acquired the majority of the assets of Orchard Supply Hardware (Orchard), a neighborhood hardware and backyard store, primarily located in densely populated markets in California, for approximately
$207 million
in cash and assumed liabilities. The acquisition provides a smaller store format that allows additional opportunities for growth. Acquisition-related costs were expensed as incurred and were not significant. The aggregate purchase price of this acquisition was preliminarily allocated as follows:
|
(In millions)
|
August 30, 2013
|
||||
|
Purchase Price:
|
|||||
|
Cash paid
|
$
|
207
|
|
||
|
Allocation:
|
|||||
|
Cash acquired
|
4
|
|
|||
|
Merchandise inventory
|
154
|
|
|||
|
Property
|
181
|
|
|||
|
Amortizable intangible assets:
|
|||||
|
Trade name
|
8
|
|
|||
|
Other assets
|
36
|
|
|||
|
Goodwill
|
46
|
|
|||
|
Current liabilities assumed
|
(95
|
)
|
|||
|
Long-term liabilities assumed
|
(127
|
)
|
|||
|
Total
|
$
|
207
|
|
||
The trade name acquired has a useful life of
10 years
. The goodwill of
$46 million
is primarily attributable to the synergies expected to arise after the acquisition. Goodwill is expected to be deductible for tax purposes. Pro forma and historical financial information has not been provided as the acquisition was not material to the consolidated financial statements.
When locations under operating leases are closed, the Company recognizes a liability for the fair value of future contractual obligations, including future minimum lease payments, property taxes, utilities, common area maintenance and other ongoing expenses, net of estimated sublease income and other recoverable items. During
2013
, the Company relocated two stores subject to operating leases. In
2012
, the Company relocated one store subject to an operating lease.
49
Subsequent changes to the liabilities, including a change resulting from a revision to either the timing or the amount of estimated cash flows, are recognized in the period of change. Changes to the accrual for exit activities for
2013
and
2012
are summarized as follows:
|
(In millions)
|
2013
|
|
2012
|
|
|||
|
Accrual for exit activities, balance at beginning of year
|
$
|
75
|
|
$
|
86
|
|
|
|
Additions to the accrual - net
|
11
|
|
11
|
|
|||
|
Cash payments
|
(32
|
)
|
(22
|
)
|
|||
|
Accrual for exit activities, balance at end of year
|
$
|
54
|
|
$
|
75
|
|
|
The Company has a
$1.75 billion
senior credit facility that expires in
October 2016
. The senior credit facility supports the Company’s commercial paper program and has a
$500 million
letter of credit sublimit. Letters of credit issued pursuant to the senior credit facility reduce the amount available for borrowing under its terms. Borrowings made are unsecured and are priced at fixed rates based upon market conditions at the time of funding in accordance with the terms of the senior credit facility. The senior credit facility contains certain restrictive covenants, which include maintenance of a debt leverage ratio as defined by the senior credit facility. The Company was in compliance with those covenants as of
January 31, 2014
.
Thirteen
banking institutions are participating in the senior credit facility. As of
January 31, 2014
, there were
$386 million
of outstanding borrowings under the commercial paper program with a weighted average interest rate of
0.20%
, but there were no outstanding borrowings or letters of credit under the senior credit facility. As of
February 1, 2013
, there were no outstanding borrowings or letters of credit under the senior credit facility and no outstanding borrowings under the Company’s commercial paper program.
|
Debt Category
(In millions) |
Weighted-Average Interest Rate at January 31, 2014
|
|
January 31, 2014
|
|
February 1, 2013
|
|
||||
|
Secured debt:
1
|
|
|
|
|||||||
|
Mortgage notes due through fiscal 2027
|
5.80
|
%
|
$
|
17
|
|
$
|
19
|
|
||
|
Unsecured debt:
|
|
|
|
|
||||||
|
Notes due through fiscal 2018
|
3.88
|
%
|
2,271
|
|
2,269
|
|
||||
|
Notes due fiscal 2019-2023
|
3.79
|
%
|
2,776
|
|
2,280
|
|
||||
|
Notes due fiscal 2024-2028
|
7.01
|
%
|
416
|
|
415
|
|
||||
|
Notes due fiscal 2029-2033
|
6.50
|
%
|
397
|
|
397
|
|
||||
|
Notes due fiscal 2034-2038
2
|
6.06
|
%
|
1,535
|
|
1,535
|
|
||||
|
Notes due fiscal 2039-2043
|
5.09
|
%
|
2,222
|
|
1,731
|
|
||||
|
Capitalized lease obligations due through fiscal 2035
|
|
|
501
|
|
431
|
|
||||
|
Total long-term debt
|
|
|
10,135
|
|
9,077
|
|
||||
|
Less current maturities
|
|
|
(49
|
)
|
(47
|
)
|
||||
|
Long-term debt, excluding current maturities
|
|
|
$
|
10,086
|
|
$
|
9,030
|
|
||
1
Real properties with an aggregate book value of
$64 million
were pledged as collateral at
January 31, 2014
, for secured debt.
2
Amount includes
$100 million
of notes issued in 1997 that may be put at the option of the holder on the 20th anniversary of the issue at par value. None of these notes are currently puttable.
Debt maturities, exclusive of unamortized original issue discounts and capitalized lease obligations, for the next five years and thereafter are as follows: 2014,
$2 million
; 2015,
$508 million
; 2016,
$1.0 billion
; 2017,
$750 million
; 2018,
$1 million
; thereafter,
$7.4 billion
.
The Company’s unsecured notes are issued under indentures that have generally similar terms and, therefore, have been grouped by maturity date for presentation purposes in the table above. The notes contain certain restrictive covenants, none of
50
which is expected to impact the Company’s capital resources or liquidity. The Company was in compliance with all covenants of these agreements at
January 31, 2014
.
In November 2011, the Company issued
$1.0 billion
of unsecured notes in two tranches:
$500 million
of
3.8%
notes maturing in 2021 and
$500 million
of
5.125%
notes maturing in 2041. The 2021 and 2041 notes were issued at discounts of approximately
$3 million
and
$5 million
, respectively. Interest on these notes is payable semiannually in arrears in May and November of each year until maturity, beginning in May 2012.
In April 2012, the Company issued
$2.0 billion
of unsecured notes in three tranches:
$500 million
of
1.625%
notes maturing in April 2017,
$750 million
of
3.12%
notes maturing in April 2022 and
$750 million
of
4.65%
notes maturing in April 2042. The 2017, 2022 and 2042 notes were issued at discounts of approximately
$2 million
,
$4 million
and
$10 million
, respectively. Interest on these notes is payable semiannually in arrears in April and October of each year until maturity, beginning in October 2012.
In September 2013, the Company issued
$1.0 billion
of unsecured notes in two tranches:
$500 million
of
3.875%
notes maturing in September 2023 and
$500 million
of
5.0%
notes maturing in September 2043. The 2023 and 2043 notes were issued at discounts of approximately
$5 million
and
$9 million
, respectively. Interest on these notes is payable semiannually in arrears in March and September of each year until maturity, beginning in March 2014.
The discounts associated with these issuances, which include the underwriting and issuance discounts, are recorded in long-term debt and are being amortized over the respective terms of the notes.
The indentures governing the notes issued in
2013
,
2012
and
2011
contain a provision that allows the Company to redeem the notes at any time, in whole or in part, at specified redemption prices plus accrued interest to the date of redemption. The indentures also contain a provision that allows the holders of the notes to require the Company to repurchase all or any part of their notes if a change of control triggering event occurs. If elected under the change of control provisions, the repurchase of the notes will occur at a purchase price of 101% of the principal amount, plus accrued and unpaid interest, if any, on such notes to the date of purchase. The indentures governing the notes do not limit the aggregate principal amount of debt securities that the Company may issue, nor is the Company required to maintain financial ratios or specified levels of net worth or liquidity. However, the indentures contain various restrictive covenants, none of which is expected to impact the Company’s liquidity or capital resources.
Authorized shares of preferred stock were
5.0 million
(
$5
par value) at
January 31, 2014
and
February 1, 2013
, none of which have been issued. The Board of Directors may issue the preferred stock (without action by shareholders) in one or more series, having such voting rights, dividend and liquidation preferences, and such conversion and other rights as may be designated by the Board of Directors at the time of issuance.
Authorized shares of common stock were
5.6 billion
(
$.50
par value) at
January 31, 2014
and
February 1, 2013
.
The Company has a share repurchase program that is executed through purchases made from time to time either in the open market or through private off-market transactions. Shares purchased under the repurchase program are retired and returned to authorized and unissued status. On February 1, 2013, the Company’s Board of Directors authorized a
$5.0 billion
share repurchase program with no expiration. As of January 31, 2014, the Company had
$1.3 billion
remaining available under this authorization. On January 31, 2014, the Company's Board of Directors authorized an additional
$5.0 billion
repurchase program with no expiration, following which, the Company had available share repurchase authorization of
$6.3 billion
.
During the year ended January 31, 2014, the Company entered into Accelerated Share Repurchase (ASR) agreements with third-party financial institutions to repurchase a total of
55.0 million
shares of the Company's common stock for
$2.25 billion
. At inception, the Company paid the financial institutions using cash on hand and took initial delivery of shares. Under the terms of the ASR agreements, upon settlement, the Company would either receive additional shares from the financial institution or be required to deliver additional shares or cash to the financial institution. The Company controlled its election to either deliver additional shares or cash to the financial institution and was subject to provisions which limited the number of shares the Company would be required to deliver.
The final number of shares received upon settlement of each ASR agreement was determined with reference to the volume-weighted average price of the Company’s common stock over the term of the ASR agreement. The initial repurchase of shares
51
under these agreements resulted in an immediate reduction of the outstanding shares used to calculate the weighted-average common shares outstanding for basic and diluted earnings per share.
These ASR agreements were accounted for as treasury stock transactions and forward stock purchase contracts. The par value of the shares received was recorded as a reduction to common stock with the remainder recorded as a reduction to capital in excess of par value and retained earnings. The forward stock purchase contract was considered indexed to the Company’s own stock and was classified as an equity instrument.
During the year ended
January 31, 2014
, the Company also repurchased shares of its common stock through the open market totaling
31.6 million
shares for a cost of
$1.5 billion
.
The Company also withholds shares from employees to satisfy either the exercise price of stock options exercised or the statutory withholding tax liability resulting from the vesting of restricted stock awards.
Shares repurchased for
2013
and
2012
were as follows:
|
|
2013
|
2012
|
|||||||||||
|
(In millions)
|
Shares
|
|
Cost
1
|
|
Shares
|
|
Cost
1
|
|
|||||
|
Share repurchase program
|
86.6
|
|
$
|
3,732
|
|
145.7
|
|
$
|
4,350
|
|
|||
|
Shares withheld from employees
|
1.0
|
|
38
|
|
1.5
|
|
43
|
|
|||||
|
Total share repurchases
|
87.6
|
|
$
|
3,770
|
|
147.2
|
|
$
|
4,393
|
|
|||
1
Reductions of
$3.4 billion
and
$3.9 billion
were recorded to retained earnings, after capital in excess of par value was depleted, for
2013
and
2012
, respectively.
Overview of Share-Based Payment Plans
The Company has a number of active and inactive equity incentive plans (the Incentive Plans) under which the Company has been authorized to grant share-based awards to key employees and non-employee directors. The Company also has an employee stock purchase plan (the ESPP) that allows employees to purchase Company shares at a discount through payroll deductions. All of these plans contain a nondiscretionary anti-dilution provision that is designed to equalize the value of an award as a result of any stock dividend, stock split, recapitalization, or any other similar equity restructuring.
A total of
169.0 million
shares have been previously authorized for grant to key employees and non-employee directors under all of the Company's Incentive Plans, but only
50.0 million
of those shares were authorized for grants of share-based awards under the Company's currently active Incentive Plans. In addition, a total of
70.0 million
shares have been previously authorized for purchases by employees participating in the ESPP.
At
January 31, 2014
, there were
9.1 million
shares remaining available for grants under the currently active Incentive Plans and
27.2 million
shares remaining available for purchases under the ESPP.
The Company recognized share-based payment expense in SG&A expense in the consolidated statements of earnings totaling
$100 million
in both
2013
and
2012
, and
$107 million
in
2011
. The total associated income tax benefit recognized was
$32 million
,
$33 million
and
$32 million
in
2013
,
2012
and
2011
, respectively.
Total unrecognized share-based payment expense for all share-based payment plans was
$143 million
at
January 31, 2014
, of which
$79 million
will be recognized in 2014,
$51 million
in 2015 and
$13 million
thereafter. This results in these amounts being recognized over a weighted-average period of
1.9 years
.
For all share-based payment awards, the expense recognized has been adjusted for estimated forfeitures where the requisite service is not expected to be provided. Estimated forfeiture rates are developed based on the Company’s analysis of historical forfeiture data for homogeneous employee groups.
52
General terms and methods of valuation for the Company’s share-based awards are as follows:
Stock Options
Stock options have terms of
seven
or
10
years, with one-third of each grant vesting each year for
three years
, and are assigned an exercise price equal to the closing market price of a share of the Company’s common stock on the date of grant. Options are expensed on a straight-line basis over the grant vesting period, which is considered to be the requisite service period.
The fair value of each option grant is estimated on the date of grant using the Black-Scholes option-pricing model. When determining expected volatility, the Company considers the historical performance of the Company’s stock, as well as implied volatility. The risk-free interest rate is based on the U.S. Treasury yield curve in effect at the time of grant, based on the options’ expected term. The expected term of the options is based on the Company’s evaluation of option holders’ exercise patterns and represents the period of time that options are expected to remain unexercised. The Company uses historical data to estimate the timing and amount of forfeitures. The weighted average assumptions used in the Black-Scholes option-pricing model and weighted-average grant date fair value for options granted in
2013
,
2012
and
2011
are as follows:
|
|
2013
|
|
2012
|
|
2011
|
|
|||||
|
Weighted-average assumptions used:
|
|
|
|
||||||||
|
Expected volatility
|
34.2
|
%
|
38.6
|
%
|
39.9
|
%
|
|||||
|
Dividend yield
|
1.45
|
%
|
1.76
|
%
|
1.39
|
%
|
|||||
|
Risk-free interest rate
|
1.31
|
%
|
0.75
|
%
|
1.83
|
%
|
|||||
|
Expected term, in years
|
7.39
|
|
4.41
|
|
4.44
|
|
|||||
|
Weighted-average grant date fair value
|
$
|
12.24
|
|
$
|
7.84
|
|
$
|
7.93
|
|
||
The total intrinsic value of options exercised, representing the difference between the exercise price and the market price on the date of exercise, was approximately
$48 million
,
$84 million
and
$8 million
in
2013
,
2012
and
2011
, respectively.
Transactions related to stock options for the year ended
January 31, 2014
are summarized as follows:
|
Shares
(In thousands) |
|
Weighted-Average
Exercise Price Per Share |
|
Weighted-Average
Remaining Term (In years) |
Aggregate
Intrinsic Value (In thousands) |
|
||||||
|
Outstanding at February 1, 2013
|
8,718
|
|
$
|
26.58
|
|
|||||||
|
Granted
|
2,112
|
|
38.39
|
|
||||||||
|
Canceled, forfeited or expired
|
(260
|
)
|
32.09
|
|
||||||||
|
Exercised
|
(3,214
|
)
|
27.40
|
|
||||||||
|
Outstanding at January 31, 2014
|
7,356
|
|
$
|
29.42
|
|
5.43
|
$
|
124,128
|
|
|||
|
Vested and expected to vest at
|
||||||||||||
|
January 31, 2014
1
|
7,271
|
|
$
|
29.35
|
|
5.40
|
$
|
123,178
|
|
|||
|
Exercisable at January 31, 2014
|
3,071
|
|
$
|
24.88
|
|
3.48
|
$
|
65,749
|
|
|||
1
Includes outstanding vested options as well as outstanding nonvested options after a forfeiture rate is applied.
Restricted Stock Awards
Restricted stock awards are valued at the market price of a share of the Company’s common stock on the date of grant. In general, these awards vest at the end of a
three
year period from the date of grant and are expensed on a straight-line basis over that period, which is considered to be the requisite service period. The Company uses historical data to estimate the timing and amount of forfeitures. The weighted-average grant-date fair value per share of restricted stock awards granted was
$41.78
,
$28.25
and
$25.29
in
2013
,
2012
, and
2011
, respectively. The total fair value of restricted stock awards vested was approximately
$98 million
,
$118 million
and
$61 million
in
2013
,
2012
and
2011
, respectively.
53
Transactions related to restricted stock awards for the year ended
January 31, 2014
are summarized as follows:
|
|
Shares
(In thousands) |
|
Weighted-Average Grant-Date Fair Value Per Share
|
|
||
|
Nonvested at February 1, 2013
|
7,134
|
|
$
|
25.72
|
|
|
|
Granted
|
2,928
|
|
41.78
|
|
||
|
Vested
|
(2,535
|
)
|
23.95
|
|
||
|
Canceled or forfeited
|
(479
|
)
|
29.91
|
|
||
|
Nonvested at January 31, 2014
|
7,048
|
|
$
|
32.74
|
|
|
Deferred Stock Units
Deferred stock units are valued at the market price of a share of the Company’s common stock on the date of grant. For non-employee Directors, these awards vest immediately and are expensed on the grant date. During
2013
,
2012
and
2011
, each non-employee Director was awarded a number of deferred stock units determined by dividing the annual award amount by the fair market value of a share of the Company’s common stock on the award date and rounding up to the next 100 units. The annual award amount used to determine the number of deferred stock units granted to each Director was
$150,000
for
2013
and
$140,000
for both
2012
and
2011
. During
2013
,
36,000
deferred stock units were granted and immediately vested for non-employee Directors. The weighted-average grant-date fair value per share of deferred stock units granted was
$42.11
,
$26.36
and
$24.25
in
2013
,
2012
and
2011
, respectively. The total fair value of deferred stock units vested was
$1.5 million
in
2013
and
$1 million
in
2012
and
2011
. During 2013, no deferred stock units were released as a result of termination of service. At
January 31, 2014
, there were
0.6 million
deferred stock units outstanding, all of which were vested.
Performance Share Units
The Company has issued two types of Performance Share Units - those based on the achievement of targeted Company return on non-cash average assets (RONCAA) and those based on targeted Company improvement in brand differentiation. Performance share units do not have dividend rights. In general, upon the achievement of a minimum threshold,
50%
to
150%
of these awards vest at the end of a
three
year service period from the date of grant based upon achievement of the performance goal specified in the performance share unit agreement.
Performance share units are expensed on a straight-line basis over the requisite service period, based on the probability of achieving the performance goal, with changes in expectations recognized as an adjustment to earnings in the period of the change. If the performance goal is not met, no compensation cost is recognized and any previously recognized compensation cost is reversed. The Company uses historical data to estimate the timing and amount of forfeitures.
RONCAA Awards
Performance share units issued based on the achievement of targeted RONCAA, which is considered a performance condition, are classified as equity awards and are valued at the market price of a share of the Company’s common stock on the date of grant less the present value of dividends expected during the requisite service period. The weighted-average grant-date fair value per unit of performance share units classified as equity awards granted was
$36.48
,
$26.60
and
$25.13
in 2013, 2012 and 2011, respectively. No performance share units vested in
2013
,
2012
or
2011
.
Transactions related to performance share units classified as equity awards for the year ended
January 31, 2014
are summarized as follows:
54
|
|
Units
(In thousands) 1 |
|
Weighted-Average Grant-Date Fair Value Per Unit
|
|
||
|
Nonvested at February 1, 2013
|
730
|
|
$
|
25.42
|
|
|
|
Granted
|
327
|
|
36.48
|
|
||
|
Canceled or forfeited
|
(56
|
)
|
28.82
|
|
||
|
Nonvested at January 31, 2014
|
1,001
|
|
$
|
28.85
|
|
|
Brand Differentiation Awards
Performance share units issued based on targeted Company improvement in brand differentiation, which is not considered a market, performance, or service related condition, are classified as liability awards and are measured at fair value at each reporting date. The awards are valued at the market price of a share of the Company’s common stock at the end of each reporting period less the present value of dividends expected to be issued during the remaining requisite service period. The weighted-average grant-date fair value per unit of performance share units classified as liability awards granted was
$36.48
,
$26.60
and
$25.45
in
2013
,
2012
and
2011
, respectively. No performance share units vested in
2013
,
2012
or
2011
. The total liability for performance share units classified as liability awards at
January 31, 2014
was
$2 million
.
Transactions related to performance share units classified as liability awards for the year ended
January 31, 2014
are summarized as follows:
|
|
Units
(In thousands) 1 |
|
Weighted-Average Grant-Date Fair Value Per Unit
|
|
||
|
Nonvested at February 1, 2013
|
359
|
|
$
|
25.42
|
|
|
|
Granted
|
159
|
|
36.48
|
|
||
|
Canceled or forfeited
|
(25
|
)
|
28.05
|
|
||
|
Nonvested at January 31, 2014
|
493
|
|
$
|
28.85
|
|
|
¹
The number of units presented is based on achieving the targeted performance goals as defined in the performance share unit
agreements. As of
January 31, 2014
, the maximum number of units that could vest under the provisions of the agreements
were
1.5 million
for the RONCAA awards and
0.7 million
units for the brand differentiation awards.
Restricted Stock Units
Restricted stock units do not have dividend rights and are valued at the market price of a share of the Company’s common stock on the date of grant less the present value of dividends expected during the requisite service period. In general, these awards vest at the end of a
three
year period from the date of grant and are expensed on a straight-line basis over that period, which is considered to be the requisite service period. The Company uses historical data to estimate the timing and amount of forfeitures. The weighted-average grant-date fair value per share of restricted stock units granted was
$41.53
,
$27.84
and
$23.97
in
2013
,
2012
and
2011
, respectively. The total fair value of restricted stock units vesting was approximately
$3.4 million
in
2013
. An insignificant amount of restricted stock units vested in
2012
and
2011
.
Transactions related to restricted stock units for the year ended
January 31, 2014
are summarized as follows:
|
|
Shares
(In thousands) |
|
Weighted-Average Grant-Date Fair Value Per Share
|
|
||
|
Nonvested at February 1, 2013
|
206
|
|
$
|
25.40
|
|
|
|
Granted
|
160
|
|
41.53
|
|
||
|
Vested
|
(84
|
)
|
24.32
|
|
||
|
Canceled or forfeited
|
(54
|
)
|
30.15
|
|
||
|
Nonvested at January 31, 2014
|
228
|
|
$
|
35.99
|
|
|
55
ESPP
The purchase price of the shares under the ESPP equals
85%
of the closing price on the date of purchase. The Company’s share-based payment expense per share is equal to
15%
of the closing price on the date of purchase. The ESPP is considered a liability award and is measured at fair value at each reporting date, and the share-based payment expense is recognized over the six-month offering period. During
2013
, the Company issued
2.0 million
shares of common stock and recognized
$13 million
of share-based payment expense pursuant to the plan.
The Company maintains a defined contribution retirement plan for its eligible employees (the 401(k) Plan). Employees are eligible to participate in the 401(k) Plan
six months
after their original date of service. Eligible employees hired or rehired prior to November 1, 2012 were automatically enrolled in the 401(k) Plan at a contribution rate of
1%
of their pre-tax annual compensation unless they elected otherwise. Eligible employees hired or rehired November 1, 2012 or later must make an active election to participate in the 401(k) Plan. The Company makes contributions to the 401(k) Plan each payroll period, based upon a matching formula applied to employee deferrals (the Company Match). Participants are eligible to receive the Company Match pursuant to the terms of the 401(k) Plan. The Company Match varies based on how much the employee elects to defer up to a maximum of
4.25%
of eligible compensation. The Company Match is invested identically to employee contributions and is immediately vested.
The Company maintains a Benefit Restoration Plan to supplement benefits provided under the 401(k) Plan to participants whose benefits are restricted as a result of certain provisions of the Internal Revenue Code of 1986. This plan provides for employee salary deferrals and employer contributions in the form of a Company Match.
The Company maintains a non-qualified deferred compensation program called the Lowe’s Cash Deferral Plan. This plan is designed to permit certain employees to defer receipt of portions of their compensation, thereby delaying taxation on the deferral amount and on subsequent earnings until the balance is distributed. This plan does not provide for Company contributions.
The Company recognized expense associated with employee retirement plans of
$160 million
,
$151 million
and
$150 million
in
2013
,
2012
and
2011
, respectively.
The following is a reconciliation of the federal statutory tax rate to the effective tax rate:
|
|
2013
|
|
2012
|
|
2011
|
|
||
|
Statutory federal income tax rate
|
35.0
|
%
|
35.0
|
%
|
35.0
|
%
|
||
|
State income taxes, net of federal tax benefit
|
2.9
|
|
3.1
|
|
2.8
|
|
||
|
Other, net
|
(0.1
|
)
|
(0.5
|
)
|
(1.1
|
)
|
||
|
Effective tax rate
|
37.8
|
%
|
37.6
|
%
|
36.7
|
%
|
||
The components of the income tax provision are as follows:
|
(In millions)
|
2013
|
|
2012
|
|
2011
|
|
|||||
|
Current:
|
|
|
|
||||||||
|
Federal
|
$
|
1,342
|
|
$
|
1,162
|
|
$
|
891
|
|
||
|
State
|
203
|
|
155
|
|
124
|
|
|||||
|
Total current
|
1,545
|
|
1,317
|
|
1,015
|
|
|||||
|
Deferred:
|
|
|
|
|
|||||||
|
Federal
|
(133
|
)
|
(133
|
)
|
50
|
|
|||||
|
State
|
(25
|
)
|
(6
|
)
|
2
|
|
|||||
|
Total deferred
|
(158
|
)
|
(139
|
)
|
52
|
|
|||||
|
Total income tax provision
|
$
|
1,387
|
|
$
|
1,178
|
|
$
|
1,067
|
|
||
56
The tax effects of cumulative temporary differences that gave rise to the deferred tax assets and liabilities were as follows:
|
(In millions)
|
January 31, 2014
|
|
February 1, 2013
|
|
|||
|
Deferred tax assets:
|
|
|
|||||
|
Self-insurance
|
$
|
384
|
|
$
|
375
|
|
|
|
Share-based payment expense
|
70
|
|
73
|
|
|||
|
Deferred rent
|
80
|
|
80
|
|
|||
|
Net operating losses
|
148
|
|
131
|
|
|||
|
Other, net
|
138
|
|
113
|
|
|||
|
Total deferred tax assets
|
820
|
|
772
|
|
|||
|
Valuation allowance
|
(164
|
)
|
(142
|
)
|
|||
|
Net deferred tax assets
|
656
|
|
630
|
|
|||
|
Deferred tax liabilities:
|
|
|
|||||
|
Property
|
(646
|
)
|
(783
|
)
|
|||
|
Other, net
|
(49
|
)
|
(85
|
)
|
|||
|
Total deferred tax liabilities
|
(695
|
)
|
(868
|
)
|
|||
|
Net deferred tax liability
|
$
|
(39
|
)
|
$
|
(238
|
)
|
|
The Company operates as a branch in various foreign jurisdictions and cumulatively has incurred net operating losses of
$547 million
and
$474 million
as of
January 31, 2014
, and
February 1, 2013
, respectively. The net operating losses are subject to expiration in
2017
through
2033
. Deferred tax assets have been established for these foreign net operating losses in the accompanying consolidated balance sheets. Given the uncertainty regarding the realization of foreign net deferred tax assets, the Company recorded cumulative valuation allowances of
$164 million
and
$142 million
at
January 31, 2014
, and
February 1, 2013
, respectively.
The Company has not provided for deferred income taxes on approximately
$51 million
of undistributed earnings of international subsidiaries because of its intention to indefinitely reinvest these earnings outside the U.S. It is not practicable to determine the income tax liability that would be payable on these earnings. The Company will provide for deferred or current income taxes on such earnings in the period it determines requisite to remit those earnings.
A reconciliation of the beginning and ending balances of unrecognized tax benefits is as follows:
|
(In millions)
|
2013
|
|
2012
|
|
2011
|
|
|||||
|
Unrecognized tax benefits, beginning of year
|
$
|
63
|
|
$
|
146
|
|
$
|
165
|
|
||
|
Additions for tax positions of prior years
|
—
|
|
20
|
|
11
|
|
|||||
|
Reductions for tax positions of prior years
|
—
|
|
(3
|
)
|
(19
|
)
|
|||||
|
Additions based on tax positions related to the current year
|
—
|
|
—
|
|
19
|
|
|||||
|
Settlements
|
(1
|
)
|
(100
|
)
|
(30
|
)
|
|||||
|
Unrecognized tax benefits, end of year
|
$
|
62
|
|
$
|
63
|
|
$
|
146
|
|
||
The amounts of unrecognized tax benefits that, if recognized, would favorably impact the effective tax rate were
$62 million
and
$4 million
as of
January 31, 2014
, and
February 1, 2013
, respectively.
During
2013
, the Company recognized
$6 million
of interest expense and an insignificant decrease in penalties related to uncertain tax positions. As of
January 31, 2014
, the Company had
$6 million
of accrued interest and an insignificant amount of accrued penalties. During
2012
, the Company recognized
$27 million
of interest income and an insignificant decrease in penalties related to uncertain tax positions. As of
February 1, 2013
, the Company had
$12 million
of accrued interest and an insignificant amount of accrued penalties. During
2011
, the Company recognized
$8 million
of interest expense and an insignificant decrease in penalties related to uncertain tax positions.
57
The Company is subject to examination by various foreign and domestic taxing authorities. During 2013, the Company filed amended federal and state tax returns for fiscal years 2008 through 2010 in conjunction with the resolution of items identified under the previous IRS audit cycle for tax years 2004 through 2007. The Company is currently not under audit by the IRS but continues to work on resolving various other federal items identified through the previous audit cycle. It is reasonably possible that the Company will resolve
$62 million
in federal and state related audit items within the next 12 months. There are ongoing U.S. state audits covering tax years
2006
to
2012
. The Company’s Canadian operations are currently under audit by the Canada Revenue Agency for fiscal years
2009
and
2010
. The Company remains subject to income tax examinations for international income taxes for fiscal years
2007
through
2012
. The Company believes appropriate provisions for all outstanding issues have been made for all jurisdictions and all open years.
The Company calculates basic and diluted earnings per common share using the two-class method. Under the two-class method, net earnings are allocated to each class of common stock and participating security as if all of the net earnings for the period had been distributed. The Company’s participating securities consist of share-based payment awards that contain a nonforfeitable right to receive dividends and, therefore, are considered to participate in undistributed earnings with common shareholders.
Basic earnings per common share excludes dilution and is calculated by dividing net earnings allocable to common shares by the weighted-average number of common shares outstanding for the period. Diluted earnings per common share is calculated by dividing net earnings allocable to common shares by the weighted-average number of common shares as of the balance sheet date, as adjusted for the potential dilutive effect of non-participating share-based awards. The following table reconciles earnings per common share for
2013
,
2012
and
2011
:
|
(In millions, except per share data)
|
2013
|
|
2012
|
|
2011
|
|
|||||
|
Basic earnings per common share:
|
|
|
|
||||||||
|
Net earnings
|
$
|
2,286
|
|
$
|
1,959
|
|
$
|
1,839
|
|
||
|
Less: Net earnings allocable to participating securities
|
(16
|
)
|
(14
|
)
|
(15
|
)
|
|||||
|
Net earnings allocable to common shares
|
$
|
2,270
|
|
$
|
1,945
|
|
$
|
1,824
|
|
||
|
Weighted-average common shares outstanding
|
1,059
|
|
1,150
|
|
1,271
|
|
|||||
|
Basic earnings per common share
|
$
|
2.14
|
|
$
|
1.69
|
|
$
|
1.43
|
|
||
|
Diluted earnings per common share:
|
|
|
|
|
|||||||
|
Net earnings
|
$
|
2,286
|
|
$
|
1,959
|
|
$
|
1,839
|
|
||
|
Less: Net earnings allocable to participating securities
|
(16
|
)
|
(14
|
)
|
(15
|
)
|
|||||
|
Net earnings allocable to common shares
|
$
|
2,270
|
|
$
|
1,945
|
|
$
|
1,824
|
|
||
|
Weighted-average common shares outstanding
|
1,059
|
|
1,150
|
|
1,271
|
|
|||||
|
Dilutive effect of non-participating share-based awards
|
2
|
|
2
|
|
2
|
|
|||||
|
Weighted-average common shares, as adjusted
|
1,061
|
|
1,152
|
|
1,273
|
|
|||||
|
Diluted earnings per common share
|
$
|
2.14
|
|
$
|
1.69
|
|
$
|
1.43
|
|
||
Stock options to purchase
1.9 million
,
7.5 million
and
18.2 million
shares of common stock for
2013
,
2012
and
2011
, respectively, were excluded from the computation of diluted earnings per common share because their effect would have been anti-dilutive.
The Company leases facilities and land for certain facilities under agreements with original terms generally of
20
years. The leases generally contain provisions for
four
to
six
renewal options of
five years
each. Some lease agreements also provide for contingent rentals based on sales performance in excess of specified minimums or on changes in the consumer price index. Contingent rentals were not significant for any of the periods presented. The Company subleases certain properties that are not used in its operations. Sublease income was not significant for any of the periods presented.
58
The future minimum rental payments required under operating leases and capitalized lease obligations having initial or remaining non-cancelable lease terms in excess of one year are summarized as follows:
|
(In millions)
Fiscal Year |
Operating
Leases |
|
Capitalized
Lease Obligations |
|
Total
|
|
|||||
|
2014
|
$
|
447
|
|
$
|
88
|
|
$
|
535
|
|
||
|
2015
|
445
|
|
79
|
|
524
|
|
|||||
|
2016
|
442
|
|
68
|
|
510
|
|
|||||
|
2017
|
432
|
|
56
|
|
488
|
|
|||||
|
2018
|
411
|
|
52
|
|
463
|
|
|||||
|
Later years
|
3,411
|
|
443
|
|
3,854
|
|
|||||
|
Total minimum lease payments
|
$
|
5,588
|
|
$
|
786
|
|
$
|
6,374
|
|
||
|
Less amount representing interest
|
(351
|
)
|
|||||||||
|
Present value of minimum lease payments
|
435
|
|
|||||||||
|
Less current maturities
|
(47
|
)
|
|||||||||
|
Present value of minimum lease payments, less current maturities
|
$
|
388
|
|
||||||||
Rental expenses under operating leases were
$421 million
,
$409 million
and
$410 million
in
2013
,
2012
and
2011
, respectively, and were recognized in SG&A expense. Excluded from these amounts are rental expenses associated with closed locations which were recognized as exit costs in the period of closure.
The Company is a defendant in legal proceedings considered to be in the normal course of business, none of which, individually or collectively, are expected to be material to the Company’s financial statements. In evaluating liabilities associated with its various legal proceedings, the Company has accrued for probable liabilities associated with these matters. The amounts accrued were not material to the Company’s consolidated financial statements in any of the years presented. Reasonably possible losses for any of the individual legal proceedings which have not been accrued were not material to the Company’s consolidated financial statements.
As of
January 31, 2014
, the Company had non-cancelable commitments of
$881 million
related to certain marketing and information technology programs, and purchases of merchandise inventory. Payments under these commitments are scheduled to be made as follows: 2014,
$577 million
; 2015,
$272 million
; 2016,
$25 million
; 2017,
$7 million
.
At
January 31, 2014
, the Company held standby and documentary letters of credit issued under banking arrangements which totaled
$64 million
. The majority of the Company’s letters of credit were issued for insurance contracts.
A brother-in-law of the Company’s Chief Customer Officer is a senior officer and shareholder of a vendor that provides millwork and other building products to the Company. The Company purchased products from this vendor in the amount of
$70 million
in
2013
,
$78 million
in
2012
and
$82 million
in
2011
. Amounts payable to this vendor were insignificant at
January 31, 2014
and
February 1, 2013
.
A member appointed to the Company's Board of Directors during fiscal year 2013, also serves on the Board of Directors of a vendor that provides branded consumer packaged goods to the Company. The Company purchased products from this vendor in the amount of
$145 million
in 2013. Amounts payable to this vendor were
$11 million
at January 31, 2014.
59
NOTE
17
: Other Information
Net interest expense is comprised of the following:
|
(In millions)
|
2013
|
|
2012
|
|
2011
|
|
|||||
|
Long-term debt
|
$
|
431
|
|
$
|
418
|
|
$
|
341
|
|
||
|
Capitalized lease obligations
|
40
|
|
37
|
|
38
|
|
|||||
|
Interest income
|
(4
|
)
|
(9
|
)
|
(12
|
)
|
|||||
|
Interest capitalized
|
(4
|
)
|
(4
|
)
|
(10
|
)
|
|||||
|
Interest on tax uncertainties
|
6
|
|
(27
|
)
|
8
|
|
|||||
|
Other
|
7
|
|
8
|
|
6
|
|
|||||
|
Interest - net
|
$
|
476
|
|
$
|
423
|
|
$
|
371
|
|
||
Supplemental disclosures of cash flow information:
|
(In millions)
|
2013
|
|
2012
|
|
2011
|
|
|||||
|
Cash paid for interest, net of amount capitalized
|
$
|
454
|
|
$
|
444
|
|
$
|
361
|
|
||
|
Cash paid for income taxes, net
|
$
|
1,505
|
|
$
|
1,404
|
|
$
|
914
|
|
||
|
Non-cash investing and financing activities:
|
|
|
|
|
|||||||
|
Non-cash property acquisitions, including assets acquired under capital lease
|
$
|
15
|
|
$
|
101
|
|
$
|
202
|
|
||
|
Cash dividends declared but not paid
|
$
|
186
|
|
$
|
178
|
|
$
|
174
|
|
||
Sales by product category:
|
|
2013
|
2012
1
|
2011
1
|
|||||||||||||||||
|
(Dollars in millions)
|
Total Sales
|
|
%
|
Total Sales
|
|
%
|
Total Sales
|
|
%
|
|||||||||||
|
Kitchens & Appliances
|
$
|
7,570
|
|
14
|
%
|
$
|
7,010
|
|
14
|
%
|
$
|
7,136
|
|
14
|
%
|
|||||
|
Lumber & Building Materials
|
6,534
|
|
12
|
|
6,227
|
|
12
|
|
6,287
|
|
12
|
|
||||||||
|
Tools & Hardware
|
5,865
|
|
11
|
|
5,633
|
|
11
|
|
5,540
|
|
11
|
|
||||||||
|
Fashion Fixtures
|
5,270
|
|
10
|
|
4,957
|
|
10
|
|
4,948
|
|
10
|
|
||||||||
|
Rough Plumbing & Electrical
|
4,799
|
|
9
|
|
4,460
|
|
9
|
|
4,466
|
|
9
|
|
||||||||
|
Lawn & Garden
|
4,478
|
|
8
|
|
4,392
|
|
9
|
|
4,410
|
|
9
|
|
||||||||
|
Seasonal Living
|
3,497
|
|
7
|
|
3,332
|
|
7
|
|
3,238
|
|
6
|
|
||||||||
|
Paint
|
3,477
|
|
7
|
|
3,308
|
|
6
|
|
3,218
|
|
6
|
|
||||||||
|
Home Fashions, Storage & Cleaning
|
3,154
|
|
6
|
|
3,033
|
|
6
|
|
3,002
|
|
6
|
|
||||||||
|
Flooring
|
3,060
|
|
6
|
|
2,857
|
|
6
|
|
2,858
|
|
6
|
|
||||||||
|
Millwork
|
2,919
|
|
5
|
|
2,787
|
|
5
|
|
2,897
|
|
6
|
|
||||||||
|
Outdoor Power Equipment
|
2,224
|
|
4
|
|
2,042
|
|
4
|
|
1,912
|
|
4
|
|
||||||||
|
Other
|
570
|
|
1
|
|
483
|
|
1
|
|
296
|
|
1
|
|
||||||||
|
Totals
|
$
|
53,417
|
|
100
|
%
|
$
|
50,521
|
|
100
|
%
|
$
|
50,208
|
|
100
|
%
|
|||||
1
Certain prior period amounts have been reclassified to conform to current product category classifications.
60
SUPPLEMENTARY DATA
Selected Quarterly Data (UNAUDITED)
The following table summarizes the quarterly consolidated results of operations for
2013
and
2012
:
|
|
2013
|
||||||||||||||
|
(In millions, except per share data)
|
First
|
|
Second
|
|
Third
|
|
Fourth
|
|
|||||||
|
Net sales
|
$
|
13,088
|
|
$
|
15,711
|
|
$
|
12,957
|
|
$
|
11,660
|
|
|||
|
Gross margin
|
4,555
|
|
5,397
|
|
4,481
|
|
4,042
|
|
|||||||
|
Net earnings
|
540
|
|
941
|
|
499
|
|
306
|
|
|||||||
|
Basic earnings per common share
|
0.49
|
|
0.88
|
|
0.47
|
|
0.29
|
|
|||||||
|
Diluted earnings per common share
|
$
|
0.49
|
|
$
|
0.88
|
|
$
|
0.47
|
|
$
|
0.29
|
|
|||
|
|
2012
|
||||||||||||||
|
(In millions, except per share data)
|
First
|
|
Second
|
|
Third
|
|
Fourth
|
|
|||||||
|
Net sales
|
$
|
13,153
|
|
$
|
14,249
|
|
$
|
12,073
|
|
$
|
11,046
|
|
|||
|
Gross margin
|
4,564
|
|
4,834
|
|
4,143
|
|
3,785
|
|
|||||||
|
Net earnings
|
527
|
|
747
|
|
396
|
|
288
|
|
|||||||
|
Basic earnings per common share
|
0.43
|
|
0.64
|
|
0.35
|
|
0.26
|
|
|||||||
|
Diluted earnings per common share
|
$
|
0.43
|
|
$
|
0.64
|
|
$
|
0.35
|
|
$
|
0.26
|
|
|||
None.
The Company's management, with the participation of the Chief Executive Officer and Chief Financial Officer, has evaluated the effectiveness of the Company’s “disclosure controls and procedures”, (as such term is defined in Rule 13a-15(e) promulgated under the Securities Exchange Act of 1934, as amended, (the Exchange Act)). Based upon their evaluation, the Chief Executive Officer and Chief Financial Officer concluded that, as of the end of the period covered by this report, the Company’s disclosure controls and procedures were effective for the purpose of ensuring that the information required to be disclosed in the reports that the Company files or submits under the Exchange Act with the Securities and Exchange Commission (the SEC) (1) is recorded, processed, summarized and reported within the time periods specified in the SEC’s rules and forms, and (2) is accumulated and communicated to the Company’s management, including its principal executive and principal financial officers, as appropriate to allow timely decisions regarding required disclosure.
Management’s report on internal control over financial reporting (as such term is defined in Rule 13a-15(f) under the Exchange Act) and the report of Deloitte & Touche LLP, the Company’s independent registered public accounting firm, are included in Item 8 of this Annual Report on Form 10-K.
In addition, no change in the Company’s internal control over financial reporting occurred during the fiscal fourth quarter ended
January 31, 2014
that has materially affected, or is reasonably likely to materially affect, the Company’s internal control over financial reporting.
None.
61
Information required by this item is furnished by incorporation by reference to all information under the captions entitled, “Proposal One: Election of Directors,” “Information Concerning Experience, Qualifications, Attributes and Skills of the Nominees,” “Information about the Board of Directors and Committees of the Board,” and “Section 16(a) Beneficial Ownership Reporting Compliance” included in the definitive Proxy Statement which will be filed pursuant to Regulation 14A, with the SEC within 120 days after the fiscal year ended
January 31, 2014
(the Proxy Statement). The information required by this item with respect to our executive officers appears in Part I of this Annual Report on Form 10-K under the caption, “Executive Officers and Certain Significant Employees of the Registrant”.
All employees of the Company, including its Chief Executive Officer, Chief Financial Officer and Chief Accounting Officer are required to abide by the Lowe's Companies, Inc. and Subsidiaries Code of Business Conduct and Ethics (the Code). The Code is designed to ensure that the Company's business is conducted in a legal and ethical manner. The Code covers all areas of professional conduct including compliance with laws and regulations, conflicts of interest, fair dealing among customers and suppliers, corporate opportunity, confidential information, insider trading, employee relations and accounting complaints. A full text of the Code can be found at www.Lowes.com, under the “About Lowe’s,” “Investors” and “Governance - Code of Ethics” captions. You can also obtain a copy of the complete Code by contacting Investor Relations at 1-800-813-7613.
We will disclose information pertaining to amendments or waivers to provisions of our Code that apply to our principal executive officer, principal financial officer, principal accounting officer or persons performing similar functions and that relate to the elements of our Code enumerated in the SEC rules and regulations by posting this information on our website at www.Lowes.com. The information on our website is not a part of this Annual Report and is not incorporated by reference in this report or any of our other filings with the SEC.
Information required by this item is furnished by incorporation by reference to all information under the captions entitled, “Executive Officer Compensation,” “Compensation Committee Interlocks and Insider Participation" and “Information about the Board of Directors and Committees of the Board – Compensation of Directors” included in the Proxy Statement.
Information required by this item is furnished by incorporation by reference to all information under the captions entitled, “Security Ownership of Certain Beneficial Owners and Management” and “Equity Compensation Plan Information” included in the Proxy Statement.
Information required by this item is furnished by incorporation by reference to all information under the captions entitled, “Related-Party Transactions” and “Information about the Board of Directors and Committees of the Board – Director Independence” included in the Proxy Statement.
Information required by this item is furnished by incorporation by reference to all information under the caption entitled, “Audit Matters – Fees Paid to the Independent Registered Public Accounting Firm” included in the Proxy Statement.
62
a) 1.
Financial Statements
See the following items and page numbers appearing in Item 8 of this Annual Report on Form 10-K:
|
|
|
|
Page No.
|
|
|
|
||
|
|
|
|
|
|
|
|
||
|
|
|
|
|
|
|
|
||
|
|
|
|
|
|
|
|
||
|
|
|
|
|
|
|
|
||
|
|
|
|
|
|
|
|
||
|
|
|
|
|
|
|
|
||
63
2.
Financial Statement Schedule
SCHEDULE II - VALUATION AND QUALIFYING ACCOUNTS AND RESERVES
|
(In Millions)
|
Balance at beginning of period
|
|
Charges to costs
and expenses
|
|
|
Deductions
|
|
|
Balance at
end of period
|
|
|||||||||
|
January 31, 2014:
|
|
|
|
|
|
|
|||||||||||||
|
Reserve for loss on obsolete inventory
|
$
|
57
|
|
$
|
11
|
|
(1)
|
$
|
—
|
|
|
$
|
68
|
|
|||||
|
Reserve for inventory shrinkage
|
142
|
|
325
|
|
|
(309
|
)
|
(2)
|
158
|
|
|||||||||
|
Reserve for sales returns
|
59
|
|
—
|
|
(1
|
)
|
(3)
|
58
|
|
||||||||||
|
Deferred tax valuation allowance
|
142
|
|
22
|
|
(4)
|
—
|
|
|
164
|
|
|||||||||
|
Self-insurance liabilities
|
899
|
|
1,164
|
|
|
(1,159
|
)
|
(5)
|
904
|
|
|||||||||
|
Reserve for exit activities
|
75
|
|
11
|
|
|
(32
|
)
|
(6)
|
54
|
|
|||||||||
|
February 1, 2013:
|
|
|
|
|
|
|
|||||||||||||
|
Reserve for loss on obsolete inventory
|
$
|
47
|
|
$
|
10
|
|
(1)
|
$
|
—
|
|
|
$
|
57
|
|
|||||
|
Reserve for inventory shrinkage
|
141
|
|
316
|
|
|
(315
|
)
|
(2)
|
142
|
|
|||||||||
|
Reserve for sales returns
|
56
|
|
3
|
|
(3)
|
—
|
|
|
59
|
|
|||||||||
|
Deferred tax valuation allowance
|
101
|
|
41
|
|
(4)
|
—
|
|
|
142
|
|
|||||||||
|
Self-insurance liabilities
|
864
|
|
1,164
|
|
|
(1,129
|
)
|
(5)
|
899
|
|
|||||||||
|
Reserve for exit activities
|
86
|
|
11
|
|
|
(22
|
)
|
(6)
|
75
|
|
|||||||||
|
February 3, 2012:
|
|
|
|
|
|
|
|
|
|
|
|||||||||
|
Reserve for loss on obsolete inventory
|
$
|
39
|
|
$
|
8
|
|
(1)
|
$
|
—
|
|
|
$
|
47
|
|
|||||
|
Reserve for inventory shrinkage
|
127
|
|
308
|
|
|
(294
|
)
|
(2)
|
141
|
|
|||||||||
|
Reserve for sales returns
|
52
|
|
4
|
|
(3)
|
—
|
|
|
56
|
|
|||||||||
|
Deferred tax valuation allowance
|
99
|
|
2
|
|
(4)
|
—
|
|
|
101
|
|
|||||||||
|
Self-insurance liabilities
|
835
|
|
1,126
|
|
|
(1,097
|
)
|
(5)
|
864
|
|
|||||||||
|
Reserve for exit activities
|
12
|
|
98
|
|
|
(24
|
)
|
(6)
|
86
|
|
|||||||||
(1)
Represents the net increase/(decrease) in the required reserve based on the Company’s evaluation of obsolete inventory.
(2)
Represents the actual inventory shrinkage experienced at the time of physical inventories.
(3)
Represents the net increase/(decrease) in the required reserve based on the Company’s evaluation of anticipated merchandise returns.
(4)
Represents an increase in the required reserve based on the Company’s evaluation of deferred tax assets.
(5)
Represents claim payments for self-insured claims.
(6)
Represents lease payments and adjustments, net of sublease income, and payments for one-time employee termination benefits.
64
3.
Exhibits
|
Exhibit
|
|
Incorporated by Reference
|
||||||||
|
Number
|
Exhibit Description
|
Form
|
File No.
|
Exhibit
|
Filing Date
|
|||||
|
3.1
|
Restated Charter of Lowe's Companies, Inc.
|
10-Q
|
001-07898
|
3.1
|
September 1, 2009
|
|||||
|
3.2
|
Bylaws of Lowe's Companies, Inc., as amended and restated.
|
8-K
|
001-07898
|
3.1
|
August 27, 2012
|
|||||
|
4.1
|
Indenture, dated as of April 15, 1992, between the Company and The Bank of New York, as successor trustee.
|
S-3
|
033-47269
|
4.1
|
April 16, 1992
|
|||||
|
4.2
|
Amended and Restated Indenture, dated as of December 1, 1995, between the Company and The Bank of New York, as successor trustee.
|
8-K
|
001-07898
|
4.1
|
December 15, 1995
|
|||||
|
4.3
|
Form of the Company's 6 7/8% Debentures due February 15, 2028.
|
8-K
|
001-07898
|
4.2
|
February 20, 1998
|
|||||
|
4.4
|
First Supplemental Indenture, dated as of February 23, 1999, to the Amended and Restated Indenture, dated as of December 1, 1995, between the Company and The Bank of New York, as successor trustee.
|
10-K
|
001-07898
|
10.13
|
April 19, 1999
|
|||||
|
4.5
|
Form of the Company's 6 1/2% Debentures due March 15, 2029.
|
10-K
|
001-07898
|
10.19
|
April 19, 1999
|
|||||
|
4.6
|
Third Supplemental Indenture, dated as of October 6, 2005, to the Amended and Restated Indenture, dated as of December 1, 1995, between the Company and The Bank of New York, as trustee, including as exhibits thereto a form of the Company's 5.0% Notes maturing in October 2015 and a form of the Company's 5.5% Notes maturing in October 2035.
|
10-K
|
001-07898
|
4.5
|
April 3, 2007
|
|||||
|
4.7
|
Fourth Supplemental Indenture, dated as of October 10, 2006, to the Amended and Restated Indenture, dated as of December 1, 1995, between the Company and The Bank of New York Trust Company, N.A., as trustee, including as exhibits thereto a form of the Company's 5.4% Notes maturing in October 2016 and a form of the Company's 5.8% Notes maturing in October 2036.
|
S-3 (POSASR)
|
333-137750
|
4.5
|
October 10, 2006
|
|||||
65
|
Exhibit
|
|
Incorporated by Reference
|
||||||||
|
Number
|
Exhibit Description
|
Form
|
File No.
|
Exhibit
|
Filing Date
|
|||||
|
4.8
|
Fifth Supplemental Indenture, dated as of September 11, 2007, to the Amended and Restated Indenture, dated as of December 1, 1995, between the Company and The Bank of New York Trust Company, N.A., as trustee, including as exhibits thereto a form of the Company's 6.1% Notes maturing in September 2017 and a form of the Company's 6.65% Notes maturing in September 2037.
|
8-K
|
001-07898
|
4.1
|
September 11, 2007
|
|||||
|
4.9
|
Sixth Supplemental Indenture, dated as of April 15, 2010, to the Amended and Restated Indenture, dated as of December 1, 1995, between the Company and The Bank of New York Mellon Trust Company, N.A., as trustee, including as exhibits thereto a form of the Company's 4.625% Notes maturing in April 2020 and a form of the Company's 5.8% Notes maturing in April 2040.
|
8-K
|
001-07898
|
4.1
|
April 15, 2010
|
|||||
|
4.10
|
Seventh Supplemental Indenture, dated as of November 22, 2010, to the Amended and Restated Indenture, dated as of December 1, 1995, between the Company and The Bank of New York Mellon Trust Company, N.A., as trustee, including as exhibits thereto a form of the Company's 2.125% Notes maturing in April 2016 and a form of the Company's 3.75% Notes maturing in April 2021.
|
8-K
|
001-07898
|
4.1
|
November 22, 2010
|
|||||
|
4.11
|
Eighth Supplemental Indenture, dated as of November 23, 2011, to the Amended and Restated Indenture, dated as of December 1, 1995, between the Company and The Bank of New York Mellon Trust Company, N.A., as trustee, including as exhibits thereto a form of the Company’s 3.8% Notes maturing in November 2021 and a form of the Company’s 5.125% Notes maturing in November 2041.
|
8-K
|
001-07898
|
4.1
|
November 23, 2011
|
|||||
|
4.12
|
Ninth Supplemental Indenture, dated as of April 23, 2012, to the Amended and Restated Indenture, dated as of December 1, 1995, between the Company and The Bank of New York Mellon Trust Company, N.A., as trustee, including as exhibits thereto a form of the Company’s 1.625% Notes maturing in April 2017, a form of the Company’s 3.12% Notes maturing in April 2022, and a form of the Company's 4.65% Notes maturing in April 2042.
|
8-K
|
001-07898
|
4.1
|
April 23, 2012
|
|||||
66
|
Exhibit
|
|
Incorporated by Reference
|
||||||||
|
Number
|
Exhibit Description
|
Form
|
File No.
|
Exhibit
|
Filing Date
|
|||||
|
4.13
|
Tenth Supplemental Indenture, dated as of September 11, 2013, to the Amended and Restated Indenture, dated as of December 1, 1995, between the Company and The Bank of New York Mellon Trust Company, N.A., as trustee, including as exhibits thereto a form of the Company’s 3.875% Notes maturing in September 2023 and a form of the Company’s 5.0% Notes maturing in September 2043.
|
8-K
|
001-07898
|
4.1
|
September 11, 2013
|
|||||
|
4.14
|
Second Amended and Restated Credit Agreement, dated as of October 25, 2011.
|
8-K
|
001-07898
|
10.1
|
October 28, 2011
|
|||||
|
10.1
|
Lowe's Companies, Inc. Directors' Deferred Compensation Plan, effective July 1, 1994. *
|
10-Q
|
001-07898
|
10.1
|
December 2, 2008
|
|||||
|
10.2
|
Amendment No. 1 to the Lowe's Companies, Inc. Directors' Deferred Compensation Plan, effective July 1, 1994. *
|
10-K
|
001-07898
|
10.21
|
March 30, 2010
|
|||||
|
10.3
|
Lowe's Companies Employee Stock Purchase Plan - Stock Options for Everyone, as amended and restated effective June 1, 2012.*
|
DEF 14A
|
001-07898
|
Appendix B
|
April 13, 2012
|
|||||
|
10.4
|
Lowe's Companies, Inc. 1997 Incentive Plan.*
|
S-8
|
333-34631
|
4.2
|
August 29, 1997
|
|||||
|
10.5
|
Amendments to the Lowe's Companies, Inc. 1997 Incentive Plan dated January 25, 1998.*
|
10-K
|
001-07898
|
10.16
|
April 19, 1999
|
|||||
|
10.6
|
Amendments to the Lowe's Companies, Inc. 1997 Incentive Plan dated September 17, 1998 (also encompassing as Exhibit I thereto the Lowe's Companies, Inc. Deferred Compensation Program).*
|
10-K
|
001-07898
|
10.17
|
April 19, 1999
|
|||||
|
10.7
|
Amendment No. 1 to the Lowe’s Companies, Inc. Deferred Compensation Program.*
|
10-K
|
001-07898
|
10.25
|
March 29, 2011
|
|||||
|
10.8
|
Amendment No. 2 to the Lowe's Companies, Inc. Deferred Compensation Program.*
|
10-K
|
001-07898
|
10.22
|
March 31, 2009
|
|||||
|
10.9
|
Lowe's Companies Benefit Restoration Plan, as amended and restated as of January 1, 2008.*
|
10-Q
|
001-07898
|
10.2
|
December 12, 2007
|
|||||
67
|
Exhibit
|
|
Incorporated by Reference
|
||||||||
|
Number
|
Exhibit Description
|
Form
|
File No.
|
Exhibit
|
Filing Date
|
|||||
|
10.10
|
Amendment No. 1 to the Lowe’s Companies Benefit Restoration Plan, as amended and restated as of January 1, 2008.*
|
10-K
|
001-07898
|
10.10
|
March 29, 2011
|
|||||
|
10.11
|
Amendment No. 2 to the Lowe's Companies Benefit Restoration Plan, as amended and restated as of January 1, 2008.*
|
10-K
|
001-07898
|
10.11
|
March 29, 2011
|
|||||
|
10.12
|
Amendment No. 3 to the Lowe's Companies Benefit Restoration Plan, as amended and restated as of January 1, 2008.*
|
10-Q
|
001-07898
|
10.1
|
December 1, 2011
|
|||||
|
10.13
|
Amendment No. 4 to the Lowe's Companies Benefit Restoration Plan, as amended and restated as of January 1, 2008. *
|
10-Q
|
001-07898
|
10.1
|
September 4, 2012
|
|||||
|
10.14
|
Amendment No. 5 to the Lowe's Companies Benefit Restoration Plan, as amended and restated as of January 1, 2008.*
|
10-Q
|
001-07898
|
10.1
|
December 3, 2013
|
|||||
|
10.15
|
Form of the Company's Management Continuity Agreement for Tier I Senior Officers.*
|
10-Q
|
001-07898
|
10.2
|
September 4, 2012
|
|||||
|
10.16
|
Form of the Company's Management Continuity Agreement for Tier II Senior Officers.*
|
10-Q
|
001-07898
|
10.2
|
September 3, 2008
|
|||||
|
10.17
|
Lowe's Companies Cash Deferral Plan.*
|
10-Q
|
001-07898
|
10.1
|
June 4, 2004
|
|||||
|
10.18
|
Amendment No. 1 to the Lowe's Companies Cash Deferral Plan.*
|
10-Q
|
001-07898
|
10.1
|
December 12, 2007
|
|||||
|
10.19
|
Amendment No. 2 to the Lowe's Companies Cash Deferral Plan.*
|
10-Q
|
001-07898
|
10.2
|
December 1, 2010
|
|||||
|
10.20
|
Lowe's Companies, Inc. Amended and Restated Directors' Stock Option and Deferred Stock Unit Plan.*
|
8-K
|
001-07898
|
10.1
|
June 3, 2005
|
|||||
|
10.21
|
Form of Lowe's Companies, Inc. Deferred Stock Unit Agreement for Directors.*
|
8-K
|
001-07898
|
10.2
|
June 3, 2005
|
|||||
|
10.22
|
Form of Lowe's Companies, Inc. Restricted Stock Award Agreement.*
|
10-Q
|
001-07898
|
10.1
|
September 1, 2005
|
|||||
|
10.23
|
Form of Lowe's Companies, Inc. Performance Share Unit Award Agreement.*
|
10-Q
|
001-07898
|
10.1
|
May 31, 2011
|
|||||
68
|
Exhibit
|
|
Incorporated by Reference
|
||||||||
|
Number
|
Exhibit Description
|
Form
|
File No.
|
Exhibit
|
Filing Date
|
|||||
|
10.24
|
Lowe's Companies, Inc. 2011 Annual Incentive Plan.*
|
DEF 14A
|
001-07898
|
Appendix B
|
April 11, 2011
|
|||||
|
10.25
|
Lowe's Companies, Inc. 2006 Long Term Incentive Plan.*
|
DEF 14A
|
001-07898
|
Appendix B
|
April 10, 2009
|
|||||
|
10.26
|
Form of Lowe’s Companies, Inc. 2006 Long-Term Incentive Plan Non-Qualified Stock Option Agreement.*
|
10-K
|
001-07898
|
10.24
|
March 29, 2011
|
|||||
|
12.1
|
Statement Re Computation of Ratio of Earnings to Fixed Charges. ‡
|
|
|
|
|
|||||
|
|
|
|
|
|
|
|||||
|
21.0
|
List of Subsidiaries. ‡
|
|
|
|
|
|||||
|
|
|
|
|
|
|
|||||
|
23.0
|
Consent of Deloitte & Touche LLP. ‡
|
|
|
|
|
|||||
|
|
|
|
|
|
|
|||||
|
31.1
|
Certification Pursuant to Section 302 of the Sarbanes-Oxley Act of 2002.‡
|
|
|
|
|
|||||
|
|
|
|
|
|
|
|||||
|
31.2
|
Certification Pursuant to Section 302 of the Sarbanes-Oxley Act of 2002.‡
|
|
|
|
|
|||||
|
|
|
|
|
|
|
|||||
|
32.1
|
Certification Pursuant to 18 U.S.C. Section 1350, as Adopted Pursuant to Section 906 of the Sarbanes-Oxley Act of 2002.†
|
|
|
|
|
|||||
|
|
|
|
|
|
|
|||||
|
32.2
|
Certification Pursuant to 18 U.S.C. Section 1350, as Adopted Pursuant to Section 906 of the Sarbanes-Oxley Act of 2002.†
|
|
|
|
|
|||||
|
|
|
|
|
|
|
|||||
|
99.1
|
Restated Lowe's Companies, Inc. 401(k) Plan.*‡
|
|
|
|
|
|||||
|
|
|
|
|
|
|
|||||
|
101.INS
|
XBRL Instance Document.‡
|
|
|
|
|
|||||
|
|
|
|
|
|
|
|||||
|
101.SCH
|
XBRL Taxonomy Extension Schema Document.‡
|
|
|
|
|
|||||
|
|
|
|
|
|
|
|||||
|
101.CAL
|
XBRL Taxonomy Extension Calculation Linkbase Document.‡
|
|
|
|
|
|||||
|
|
|
|
|
|
|
|||||
|
101.DEF
|
XBRL Taxonomy Extension Definition Linkbase Document.‡
|
|
|
|
|
|||||
|
|
|
|
|
|
|
|||||
|
101.LAB
|
XBRL Taxonomy Extension Label Linkbase Document.‡
|
|
|
|
|
|||||
|
|
|
|
|
|
|
|||||
69
|
Exhibit
|
|
Incorporated by Reference
|
||||||||
|
Number
|
Exhibit Description
|
Form
|
File No.
|
Exhibit
|
Filing Date
|
|||||
|
101.PRE
|
XBRL Taxonomy Extension Presentation Linkbase Document.‡
|
|
|
|
|
|||||
|
|
|
|
|
|
|
|||||
|
*
|
Management contract or compensatory plan or arrangement required to be filed as an exhibit to this form.
|
|||||||||
|
‡
|
Filed herewith.
|
|
|
|
|
|||||
|
†
|
Furnished herewith.
|
|
|
|
|
|||||
70
SIGNATURES
Pursuant to the requirements of Section 13 or 15(d) of the Securities Exchange Act of 1934, the Registrant has duly caused this report to be signed on its behalf by the undersigned, thereunto duly authorized.
|
|
|
LOWE’S COMPANIES, INC.
|
|
|
|
(Registrant)
|
|
|
|
|
|
March 31, 2014
|
|
By: /s/ Robert A. Niblock
|
|
Date
|
|
Robert A. Niblock
|
|
|
|
Chairman of the Board, President and Chief Executive Officer
|
|
|
|
|
|
March 31, 2014
|
|
By: /s/ Robert F. Hull, Jr.
|
|
Date
|
|
Robert F. Hull, Jr.
|
|
|
|
Chief Financial Officer
|
|
|
|
|
|
March 31, 2014
|
|
By: /s/ Matthew V. Hollifield
|
|
Date
|
|
Matthew V. Hollifield
|
|
|
|
Senior Vice President and Chief Accounting Officer
|
71
Pursuant to the requirements of the Securities Exchange Act of 1934, this report on Form 10-K has been signed below by the following persons on behalf of the registrant and in the capacities and on the dates indicated. Each of the directors of the registrant whose signature appears below hereby appoints Robert F. Hull, Jr., Matthew V. Hollifield and Gaither M. Keener, Jr., and each of them severally, as his or her attorney-in-fact to sign in his or her name and behalf, in any and all capacities stated below, and to file with the Securities and Exchange Commission any and all amendments to this report on Form 10-K, making such changes in this report on Form 10-K as appropriate, and generally to do all such things in their behalf in their capacities as directors and/or officers to enable the registrant to comply with the provisions of the Securities Exchange Act of 1934, and all requirements of the Securities and Exchange Commission.
|
/s/ Robert A. Niblock
|
Chairman of the Board, President,
Chief Executive Officer and Director
|
March 31, 2014
|
|
Robert A. Niblock
|
|
Date
|
|
/s/ Raul Alvarez
|
Director
|
March 31, 2014
|
|
Raul Alvarez
|
|
Date
|
|
|
|
|
|
/s/ David W. Bernauer
|
Director
|
March 31, 2014
|
|
David W. Bernauer
|
|
Date
|
|
|
|
|
|
/s/ Leonard L. Berry
|
Director
|
March 31, 2014
|
|
Leonard L. Berry
|
|
Date
|
|
/s/ Angela F. Braly
|
Director
|
March 31, 2014
|
|
Angela F. Braly
|
Date
|
|
|
|
|
|
|
/s/ Peter C. Browning
|
Director
|
March 31, 2014
|
|
Peter C. Browning
|
|
Date
|
|
|
|
|
|
/s/ Richard W. Dreiling
|
Director
|
March 31, 2014
|
|
Richard W. Dreiling
|
|
Date
|
|
|
|
|
|
/s/ Dawn E. Hudson
|
Director
|
March 31, 2014
|
|
Dawn E. Hudson
|
|
Date
|
|
|
|
|
|
/s/ Robert L. Johnson
|
Director
|
March 31, 2014
|
|
Robert L. Johnson
|
|
Date
|
|
|
|
|
|
/s/ Marshall O. Larsen
|
Director
|
March 31, 2014
|
|
Marshall O. Larsen
|
|
Date
|
|
|
|
|
|
/s/ Richard K. Lochridge
|
Director
|
March 31, 2014
|
|
Richard K. Lochridge
|
|
Date
|
|
|
|
|
|
/s/ Eric C. Wiseman
|
Director
|
March 31, 2014
|
|
Eric C. Wiseman
|
|
Date
|
72
TABLE OF CONTENTS
Part IItem 1 - BusinessItem 1A - Risk FactorsItem 1B - Unresolved Staff CommentsItem 2 - PropertiesItem 3 - Legal ProceedingsItem 4 - Mine Safety DisclosuresPart IIItem 5 - Market For Registrant S Common Equity, Related Stockholder Matters and Issuer Purchases Of Equity SecuritiesItem 6 - Selected Financial DataItem 7 - Management's Discussion and Analysis Of Financial Condition and Results Of OperationsItem 7A - Quantitative and Qualitative Disclosures About Market RiskItem 8 - Financial Statements and Supplementary DataNote 1: Summary Of Significant Accounting PoliciesNote 2: Fair Value MeasurementsNote 3: InvestmentsNote 4: Property and Accumulated DepreciationNote 5: AcquisitionsNote 6: Exit ActivitiesNote 7: Short-term Borrowings and Lines Of CreditNote 8: Long-term DebtNote 9: Shareholders' EquityNote 10: Accounting For Share-based PaymentNote 11: Employee Retirement PlansNote 12: Income TaxesNote 13: Earnings Per ShareNote 14: LeasesNote 15: Commitments and ContingenciesNote 16: Related PartiesNote 17 : Other InformationItem 9 - Changes in and Disagreements with Accountants on Accounting and Financial DisclosureItem 9A - Controls and ProceduresItem 9B - Other InformationPart IIIItem 10 - Directors, Executive Officers and Corporate GovernanceItem 11 - Executive CompensationItem 12 - Security Ownership Of Certain Beneficial Owners and Management and Related Stockholder MattersItem 13 - Certain Relationships and Related Transactions, and Director IndependenceItem 14 - Principal Accountant Fees and ServicesPart IVItem 15 Exhibits and Financial Statement Schedules