LOWES COMPANIES INC
10-Ks and 10-Qs
|
|
|
|
|
|
|
|
|
|
|
|
|
|
|
|
|
|
|
|
|
|
|
|
|
|
|
|
|
|
|
|
|
|
|
|
|
|
|
|
|
|
|
|
|
|
|
|
|
|
|
|
|
|
|
|
|
|
|
UNITED STATES
SECURITIES AND EXCHANGE COMMISSION
Washington, D.C. 20549
FORM 10-K
(Mark One)
|
x
|
ANNUAL REPORT PURSUANT TO SECTION 13 OR 15(d) OF THE SECURITIES EXCHANGE ACT OF 1934
|
For the fiscal year ended
February 2, 2018
or
|
o
|
TRANSITION REPORT PURSUANT TO SECTION 13 OR 15(d) OF THE SECURITIES EXCHANGE ACT OF 1934
|
For the transition period from ________ to _________
Commission file number
1-7898
LOWE’S
COMPANIES, INC
.
(Exact name of registrant as specified in its charter)
|
NORTH CAROLINA
|
56-0578072
|
|
|
(State or other jurisdiction of incorporation or organization)
|
(I.R.S. Employer Identification No.)
|
|
|
1000 Lowe’s Blvd., Mooresville, NC
|
28117
|
|
|
(Address of principal executive offices)
|
(Zip Code)
|
|
|
Registrant’s telephone number, including area code
|
704-758-1000
|
|
|
Securities registered pursuant to Section 12(b) of the Act:
|
||
|
Title of each class
|
Name of each exchange on which registered
|
|
|
Common Stock, $0.50 Par Value
|
New York Stock Exchange (NYSE)
|
|
Indicate by check mark if the registrant is a well-known seasoned issuer, as defined in Rule 405 of the Securities Act.
x
Yes
o
No
Indicate by check mark if the registrant is not required to file reports pursuant to Section 13 or Section 15(d) of the Exchange Act.
o
Yes
x
No
Indicate by check mark whether the registrant (1) has filed all reports required to be filed by Section 13 or 15(d) of the Securities Exchange Act of 1934 during the preceding 12 months (or for such shorter period that the registrant was required to file such reports), and (2) has been subject to such filing requirements for the past 90 days.
x
Yes
o
No
Indicate by check mark whether the registrant has submitted electronically and posted on its corporate Web site, if any, every Interactive Data File required to be submitted and posted pursuant to Rule 405 of Regulation S-T (§232.405 of this chapter) during the preceding 12 months (or for such shorter period that the registrant was required to submit and post such files).
x
Yes
o
No
Indicate by check mark if disclosure of delinquent filers pursuant to Item 405 of Regulation S-K (§229.405 of this chapter) is not contained herein, and will not be contained, to the best of registrant’s knowledge, in definitive proxy or information statements incorporated by reference in Part III of this Form 10-K or any amendment to this Form 10-K.
x
Indicate by check mark whether the registrant is a large accelerated filer, an accelerated filer, a non-accelerated filer, smaller reporting company, or an emerging growth company. See the definitions of “large accelerated filer,” “accelerated filer,” “smaller reporting company,” and “emerging growth company” in Rule 12b-2 of the Exchange Act.
|
Large accelerated filer
ý
|
Accelerated filer
o
|
|
|
Non-accelerated filer
o
|
Smaller reporting company
o
|
|
|
Emerging growth company
o
|
||
If an emerging growth company, indicate by check mark if the registrant has elected not to use the extended transition period for complying with any new or revised financial accounting standards provided pursuant to Section 13(a) of the Exchange Act.
o
Indicate by check mark whether the registrant is a shell company (as defined in Rule 12b-2 of the Exchange Act).
o
Yes
x
No
As of
August 4, 2017
, the last business day of the Company’s most recent second quarter, the aggregate market value of the registrant’s common stock held by non-affiliates of the registrant was
$65.6 billion
based on the closing sale price as reported on the New York Stock Exchange.
Indicate the number of shares outstanding of each of the registrant’s classes of common stock, as of the latest practicable date.
|
CLASS
|
OUTSTANDING AT 3/29/2018
|
|
|
Common Stock, $0.50 par value
|
825,766,281
|
|
DOCUMENTS INCORPORATED BY REFERENCE
|
Document
|
Parts Into Which Incorporated
|
|
|
Portions of the Proxy Statement for Lowe’s 2018 Annual Meeting of Shareholders
|
Part III
|
|
LOWE’S COMPANIES, INC.
- TABLE OF CONTENTS -
|
Page No.
|
|||
|
PART I
|
|||
|
Item 1.
|
|||
|
Item 1A.
|
|||
|
Item 1B.
|
|||
|
Item 2.
|
|||
|
Item 3.
|
|||
|
Item 4.
|
|||
|
PART II
|
|||
|
Item 5.
|
|||
|
Item 6.
|
|||
|
Item 7.
|
|||
|
Item 7A.
|
|||
|
Item 8.
|
|||
|
Item 9.
|
|||
|
Item 9A.
|
|||
|
Item 9B.
|
|||
|
PART III
|
|||
|
Item 10.
|
|||
|
Item 11.
|
|||
|
Item 12.
|
|||
|
Item 13.
|
|||
|
Item 14.
|
|||
|
PART IV
|
|||
|
Item 15.
|
|||
|
Item 16.
|
|||
General Information
Lowe’s Companies, Inc. and subsidiaries (the Company or Lowe’s) is a Fortune® 50 company and the world’s second largest home improvement retailer. As of
February 2, 2018
, Lowe’s operated
2,152
home improvement and hardware stores, representing approximately
215 million
square feet of retail selling space. These operations were comprised of
1,839
stores located across 50 U.S. states, including
99
Orchard Supply Hardware (Orchard) stores, as well as
303
stores in Canada, and
10
stores in Mexico.
The Canadian stores include RONA inc. (RONA) which was acquired by Lowe’s in 2016. RONA operates
240
stores in Canada as of
February 2, 2018
, as well as services approximately
242
dealer-owned stores. The RONA stores represent various complementary store formats operating under various banners.
Lowe’s was incorporated in North Carolina in 1952 and has been publicly held since 1961. The Company’s common stock is listed on the New York Stock Exchange - ticker symbol “LOW”.
See Item 6, “Selected Financial Data”, of this Annual Report on Form 10-K (Annual Report), for historical revenues, profits and identifiable assets. For additional information about the Company’s performance and financial condition, see also Item 7, “Management’s Discussion and Analysis of Financial Condition and Results of Operations”, of this Annual Report. Financial information about our geographic areas is included in Note 1, “Summary of Significant Accounting Policies”, of the Notes to the Consolidated Financial Statements included in Item 8, “Financial Statements and Supplementary Data”, of this Annual Report.
Customers, Market and Competition
Our Customers
We serve homeowners, renters, and professional customers (Pro customers). Individual homeowners and renters complete a wide array of projects and vary along the spectrum of do-it-yourself (DIY) and do-it-for-me (DIFM). The Pro customer consists of two broad categories: construction trades; and maintenance, repair & operations.
Our Market
The U.S. market remains our predominant market, accounting for approximately 92% of consolidated sales for the fiscal year ended
February 2, 2018
. We are among the many businesses, including home centers, paint stores, hardware stores, lumber yards and garden centers, whose revenues are included in the Building Material and Garden Equipment and Supplies Dealers Subsector (444) of the Retail Trade Sector of the North American Industry Classification System (NAICS), the standard used by Federal statistical agencies in classifying business establishments for the purpose of collecting, analyzing, and publishing statistical data related to the U.S. business economy.
NAICS 444 represents roughly half of what we consider the total U.S. market for our products and services. The broader market in which Lowe’s operates includes home-related sales through a variety of companies beyond those in NAICS 444. These consist of other companies in the retail sector, including mass retailers, home goods specialty stores, and online retailers, as well as wholesalers that provide home-related products and services to homeowners, businesses, and the government.
There are many variables that affect consumer demand for the home improvement products and services Lowe’s offers. Key indicators we monitor include real disposable personal income, employment, home prices, and housing turnover. We also monitor demographic and societal trends that shape home improvement industry growth.
Our Competition
The home improvement industry includes a broad competitive landscape. We compete with other national and international home improvement warehouse chains and lumberyards in most of our trade areas. We also compete with traditional hardware, plumbing, electrical, home supply retailers, and maintenance and repair organizations. In addition, we compete with general merchandise retailers, warehouse clubs, and online and other specialty retailers as well as service providers that install home
4
improvement products. Location of stores continues to be a key competitive factor in our industry; however, the increasing use of technology and the simplicity of online shopping also underscore the importance of omni-channel capabilities as a competitive factor. We differentiate ourselves from our competitors by providing better customer experiences while delivering superior value in products and service. See further discussion of competition in Item 1A, “Risk Factors”, of this Annual Report.
Products and Services
Our Products
Product Selection
To meet customers’ varying home improvement needs, we offer a complete line of products for maintenance, repair, remodeling, and decorating. We offer home improvement products in the following categories: Lumber & Building Materials, Tools & Hardware, Appliances, Fashion Fixtures, Rough Plumbing & Electrical, Seasonal & Outdoor Living, Lawn & Garden, Paint, Millwork, Flooring, and Kitchens. A typical Lowe’s-branded home improvement store stocks approximately 39,000 items, with hundreds of thousands of additional items available through our Special Order Sales system and various online selling channels. See Note
16
of the Notes to Consolidated Financial Statements included in Item 8, “Financial Statements and Supplementary Data”, of this Annual Report for historical revenues by product category for each of the last three fiscal years.
We are committed to offering a wide selection of national brand-name merchandise complemented by our selection of private brands. In addition, we are dedicated to ensuring the products we sell are sourced in a socially responsible, efficient, and cost effective manner.
National Brand-Name Merchandise
In many product categories, customers look for a familiar and trusted national brand to instill confidence in their purchase. Lowe’s home improvement stores carry a wide selection of national brand-name merchandise such as Whirlpool
®
, GE
®
, LG
®
, and Samsung
®
appliances, Stainmaster
®
carpets, Sherwin-Williams
®
paints and stains, Valspar
®
paints and stains, Pella
®
windows and doors, Pergo
®
hardwood flooring, Dewalt
®
power tools, Hitachi
®
pneumatic tools, Weber
®
grills, Char-Broil
®
grills, Owens Corning
®
insulation and roofing, GAF
®
roofing, James Hardie
®
fiber cement siding, Marshalltown
®
masonry tools and concrete, Husqvarna
®
outdoor power equipment, John Deere
®
riding lawn mowers, Werner
®
ladders, Quoizel
®
lighting, Nest
®
products and many more. In 2017, we added brand name merchandise such as A. O. Smith
®
water heaters, SharkBite
®
plumbing products, and Norton
®
abrasives to our portfolio. Our merchandise selection provides the retail and Pro customer a one-stop shop for a wide variety of national brand-name merchandise needed to complete home improvement, repair, maintenance, or construction projects.
Private Brands
Private brands are an important element of our overall portfolio, helping to provide significant value and coordinated style across core categories. We sell private brands in several of our product categories. Some of Lowe’s most important private brands include Kobalt
®
tools, allen+roth
®
home décor products, Blue Hawk
®
home improvement products, Project Source
®
basic value products, Portfolio
®
lighting products, Garden Treasures
®
lawn and patio products, Utilitech
®
electrical and utility products, Reliabilt
®
doors and windows, Aquasource
®
faucets, sinks and toilets, Harbor Breeze
®
ceiling fans, Top Choice
®
lumber products and Iris
®
home automation and management products.
Supply Chain
We source our products from vendors worldwide and believe that alternative and competitive suppliers are available for virtually all of our products. Whenever possible, we purchase directly from manufacturers to provide savings for customers and improve our gross margin.
To efficiently move product from our vendors to our stores and maintain in-stock levels, we own and operate distribution facilities that enable products to be received from vendors, stored and picked, or cross-docked, and then shipped to our retail locations or directly to customers. These facilities include 15 highly-automated Regional Distribution Centers (RDC) in the United States. On average, each domestic RDC serves approximately 118 stores. We also own and operate eight distribution centers, including four lumber yards, to serve our Canadian market, and we lease and operate a distribution facility to serve our Orchard stores. Additionally, we have a service agreement with a third-party logistics provider to manage a distribution facility to serve our stores in Mexico.
In addition to the RDCs, we also operate coastal holding facilities, transload facilities, appliance distribution centers, and flatbed distribution centers. The flatbed distribution centers distribute merchandise that requires special handling due to size or type of packaging such as lumber, boards, panel products, pipe, siding, ladders, and building materials. Collectively, our
5
facilities enable our import and e-commerce, as well as parcel post eligible products, to get to their destination as efficiently as possible. Most parcel post items can be ordered by a customer and delivered within two business days at standard shipping rates.
In fiscal
2017
, on average, approximately 80% of the total dollar amount of stock merchandise we purchased was shipped through our distribution network, while the remaining portion was shipped directly to our stores from vendors.
Our Services
Installed Sales
We offer installation services through independent contractors in many of our product categories, with Appliances, Flooring, Kitchens, Lumber & Building Materials, and Millwork accounting for the majority of installed sales. Our Installed Sales model, which separates selling and project administration tasks, allows our sales associates to focus on project selling, while project managers ensure that the details related to installing the products are efficiently executed. Installed Sales, which includes both product and labor, accounted for approximately 7% of total sales in fiscal
2017
.
Extended Protection Plans and Repair Services
We offer extended protection plans for various products within the Appliances, Kitchens, Fashion Fixtures, Millwork, Rough Plumbing & Electrical, Seasonal & Outdoor Living, and Tools & Hardware categories. These protection plans provide customers with product protection that enhances or extends coverage previously offered by the manufacturer’s warranty, and provides additional customer friendly benefits that go beyond the scope of a manufacturer’s warranty. The protection plans provide in-warranty and out-of-warranty repair services for major appliances, outdoor power equipment, tools, grills, fireplaces, air conditioners, water heaters, and other eligible products through our stores or in the home through the Lowe’s Authorized Service Repair Network. We offer replacement plans for products in most of these categories when priced below $300, or otherwise specified category specific price points. Our contact center takes customers’ calls, assesses the problems, and facilitates resolutions, making after-sales service easier for our customers by managing the entire process.
Selling Channels
We are continuing to enhance our omni-channel capabilities, which allows our customers to move from channel to channel with simple and seamless transitions even within the same transaction. For example, for many projects, more than half of our customers conduct research online before making an in-store purchase. For purchases made on Lowes.com, customers may pick up their purchase in-store, have their purchase delivered from a store, or have their purchase parcel shipped. In addition, flexible fulfillment options are available for in-store purchases and those made through the contact center. Regardless of the channels through which customers choose to engage with us, we strive to provide them with a seamless experience across channels and an endless aisle of products, enabled by our flexible fulfillment capabilities. Our ability to sell products in-store, online, on-site, or through our contact centers speaks to our ability to leverage our existing infrastructure with the omni-channel capabilities we continue to introduce.
In-Store
Our 1,813 Lowe’s-branded home improvement stores, inclusive of 1,740 in the U.S.,
63
in Canada and
10
in Mexico, are generally open seven days per week and average approximately 112,000 square feet of retail selling space, plus approximately 32,000 square feet of outdoor garden center selling space. The
240
RONA stores operate under various complementary store formats that address target customers and occasions. In addition, we operate
99
Orchard hardware stores located throughout California, Oregon, and Florida that also serve home improvement customers and average approximately 36,000 square feet of retail selling space. Our home improvement stores in the U.S. and Canada offer similar products and services, with certain variations based on local market factors; however, Orchard stores are primarily focused on paint, repair, and backyard products. We continue to develop and implement tools to make our sales associates more efficient and to integrate our order management and fulfillment processes. Our home improvement stores have Wi-Fi capabilities that provide customers with internet access, making information available quickly to further simplify the shopping experience.
Online
Through our websites and mobile applications, we seek to empower consumers by providing a 24/7 shopping experience, online product information, customer ratings and reviews, online buying guides and how-to videos and other information. These tools help consumers make more informed purchasing decisions and give them increased confidence to undertake home improvement projects. We enable customers to choose from a variety of fulfillment options, including buying online and picking up in-store as well as delivery or parcel shipment to their homes.
6
In addition, our LowesForPros.com online tool allows for easy online ordering for our Pro customers, and their choice of in-store pick-up or delivery, saving them time and money.
On-Site
We have on-site specialists available for retail and Pro customers to assist them in selecting products and services for their projects. Our Account Executives ProServices meet with Pro customers at their place of business or on a job site and leverage stores within the area to ensure we meet customer needs for products and resources. Our Project Specialist Exteriors (PSE) program is available in all U.S. Lowe’s home improvement stores to discuss exterior projects such as roofing, siding, fencing, and windows, whose characteristics lend themselves to an in-home consultative sales approach. In addition, our Project Specialist Interiors (PSI) program is also available in all U.S. Lowe’s home improvement stores to provide similar consultative services on interior projects such as kitchens and bathrooms.
Contact Centers
Lowe’s operates three contact centers which are located in Wilkesboro, NC, Albuquerque, NM, and Indianapolis, IN. These contact centers help Lowe’s enable an omni-channel customer experience by providing the ability to tender sales, coordinate deliveries, manage after-sale installations, facilitate repair services for Appliances and Outdoor Power Equipment, and answer
general customer questions via phone, mail, e-mail, live chat, and social media.
Employees
As of
February 2, 2018
, we employed approximately 200,000 full-time and 110,000 part-time employees. Our employees in Mexico, and certain employees in Canada, are subject to collective bargaining agreements. No other employees are subject to collective bargaining agreements. Management considers its relations with employees to be good.
Seasonality and Working Capital
The retail business in general is subject to seasonal influences, and our business is, to some extent, seasonal. Historically, we have realized the highest volume of sales during our second fiscal quarter (May, June and July) and the lowest volume of sales during our fourth fiscal quarter (November, December and January). Accordingly, our working capital requirements have historically been greater during our fourth fiscal quarter as we build inventory in anticipation of the spring selling season and as we experience lower fourth fiscal quarter sales volumes. We fund our working capital requirements primarily through cash flows generated from operations, but also with short-term borrowings, as needed. For more detailed information, see the Financial Condition, Liquidity and Capital Resources section in Item 7, “Management’s Discussion and Analysis of Financial Condition and Results of Operations”, of this Annual Report.
Intellectual Property
The name “Lowe’s” is a registered service mark of one of our wholly-owned subsidiaries. We consider this mark and the accompanying name recognition to be valuable to our business. This subsidiary and other wholly owned subsidiaries own
and maintain various additional registered and unregistered trademarks, trade names and service marks, including but not limited to retail names “RONA”, “Reno Depot”, and “Orchard Supply Hardware”, online retail name “The Mine”, and private brand product names “Kobalt” and “allen+roth”. These subsidiaries also maintain various Internet domain names that are important to our business, and we also own registered and unregistered copyrights. In addition, we maintain patent portfolios related to some of our products and services and seek to patent or otherwise protect certain innovations that we incorporate into our products, services, or business operations.
Environmental Stewardship
As a purpose-driven, principles-based company, Lowe’s is committed to leveraging our time, talents and resources to growing in a way that makes our world better, makes our communities stronger, and makes people want to connect with us as their partner in home improvement.
In 2017, our Sustainability & Product Stewardship Council, led by senior executives, enhanced our Corporate Social Responsibility Strategy. Our strategy focuses on responsible sourcing, safer and more eco-friendly product offerings, maintaining a diverse, healthy, engaged and skilled workforce, supporting our local communities and operating ethically and responsibly.
We want our customers to feel good about the high-quality products they choose at Lowe’s. Our products are selected very
7
carefully, beginning with our sourcing decisions. We care about how our thousands of products are created and about the people who make them. Through collaboration and established management systems, we monitor our suppliers’ practices to ensure we are securing high quality products from suppliers who protect worker rights and the environment. We are also bringing innovative, efficient and eco-certified products into our portfolio-products that provide health and environmental benefits-to meet the needs of an increasing set of customers who prefer these types of products. In 2017, we crafted vision statements and began identifying 2025 goals to guide our future decisions.
We are committed to preserving our shared home, Earth, through sustainable practices and conservation at a local level. Our retail stores require significant amounts of electricity to operate lighting, HVAC and other energy-consuming items, while the transportation of our products from suppliers, to distribution centers to stores requires fuel. We are actively working to manage and reduce energy and fuel usage. At a local level, store waste can add up-cardboard, broken appliances, wood pallets, and more. We recycle these through national and regional partners and provide in-store recycling centers for our customers to bring in certain items. Footprint reduction activities result in cost savings, healthier communities and a better world.
Each year, Lowe’s participates in the Carbon Disclosure Project to track our carbon footprint. In 2017, Lowe’s externally verified its greenhouse gas emissions data collection and analysis to validate our findings and increase confidence in our reporting. In 2017, 100 retail locations upgraded to interior light-emitting diode (LED) lighting. In 2017, we also replaced 100 aging HVAC units with high-efficiency units and added Variable Fan Drive systems in over 300 stores. During the execution of the HVAC initiative, the facilities team was able to recycle over four million pounds of materials, preventing valuable resources from going to landfill.
Lowe’s is committed to promoting sustainable practices in the transportation industry. We collaborate with the Environmental Protection Agency’s SmartWay program to reduce transportation emissions by creating incentives for freight contractors to improve efficiency, and are proud to be the only retailer to achieve the Environmental Protection Agency SmartWay Excellence Award nine years in a row.
Managing our water resources is essential in regions experiencing drought conditions. In 2017, we completed our rollout of HydroPoint irrigation technology that combines real-time weather data with site-specific information to reduce water consumption and save on utility costs. The HydroPoint systems are now deployed to approximately 925 locations, covering all stores with operable irrigation systems.
For more information about Lowe’s environmental efforts, please visit
Lowes.com/SocialResponsibility
.
Investing in Our Communities
Lowe’s has a long and proud history of supporting local communities through volunteerism as well as public education and community improvement projects, beginning with the creation of the Lowe’s Charitable and Educational Foundation in 1957. In 2017, Lowe’s employees contributed approximately 200,000 hours to Lowe’s Heroes volunteer projects, with 100% participation from Lowe’s U.S. stores. Lowe’s and the Lowe’s Charitable and Educational Foundation donated approximately $39 million to schools and community organizations in the United States, Canada, and Mexico, including but not limited to the following actions discussed below.
Our commitment to improving educational opportunities is best exemplified by our signature education grant program, Lowe’s Toolbox for Education
®
, and 2017 marked the program’s 12-year anniversary. In 2017, Lowe’s Toolbox for Education
®
provided approximately $6.5 million in grants and since inception has provided funding improvements at nearly 13,000 schools, benefiting more than seven million children.
Each year, we work with national nonprofit partners to strengthen and stabilize neighborhoods in the communities we serve. In 2017, Lowe’s contributed $7 million and teamed with Habitat for Humanity and Rebuilding Together to provide housing solutions in partnership with families across the country. We also continued to build on our longstanding partnerships with the Boys & Girls Clubs of America, SkillsUSA, The Nature Conservancy, and Keep America Beautiful to improve communities and build tomorrow’s leaders.
Lowe’s is also committed to helping residents of the communities we serve by being there when we’re needed most - when a natural disaster threatens and in the recovery that follows. In 2017, Lowe’s contributed more than $2.5 million and mobilized hundreds of employee volunteers to help families recover from disasters across the United States. We also supported our employees affected by the many natural disasters this year by doubling the company match of the Employee Relief Fund after Harvey made landfall. Together, Lowe’s and our generous employees raised over $3.1 million this year which has helped over 2,500 employees in need.
8
For more information on Lowe’s partnerships and latest community improvement projects, visit
Lowes.com/SocialResponsibility
.
Available Information
Our Annual Report, quarterly reports on Form 10-Q, current reports on Form 8-K and amendments to those reports filed or furnished pursuant to Section 13(a) or 15(d) of the Securities Exchange Act of 1934, as amended, are made available free of charge through our internet website at
www.Lowes.com/investor
, as soon as reasonably practicable after such documents are electronically filed with, or furnished to, the Securities and Exchange Commission (SEC). The public may also read and copy any materials the Company files with the SEC at the SEC’s Public Reference Room at 100 F Street, NE, Washington, DC 20549. Information on the operation of the Public Reference Room may be obtained by calling the SEC at 1-800-SEC-0330. The SEC maintains an Internet site,
www.sec.gov
, that contains reports, proxy and information statements, and other information regarding issuers that file electronically with the SEC.
We have developed a risk management process using periodic surveys, external research, planning processes, risk mapping, analytics and other tools to identify and evaluate the operational, financial, environmental, reputational, strategic and other risks that could adversely affect our business. For more information about our risk management framework, which is administered by our Chief Financial Officer and includes developing risk mitigation controls and procedures for the material risks we identify, see the description included in the definitive Proxy Statement for our 2018 annual meeting of shareholders (as defined in Item 10 of Part III of this Annual Report) under “Information About the Board of Directors and Committees of the Board - Board Meetings, Committees of the Board and Board Leadership Structure - Board’s Role in the Risk Management Process.”
We describe below certain risks that could adversely affect our results of operations, financial condition, business reputation or business prospects. These risk factors may change from time to time and may be amended, supplemented or superseded by updates to the risk factors contained in our future periodic reports on Form 10-K, Form 10-Q and reports on other forms we file with the Securities and Exchange Commission. All forward-looking statements about our future results of operations or other matters made by us in this Annual Report, in our Annual Report to Lowe’s Shareholders and in our subsequently filed reports to the Securities and Exchange Commission, as well as in our press releases and other public communications, are qualified by the risks described below.
You should read these risk factors in conjunction with “Management’s Discussion and Analysis of Financial Condition and Results of Operations” in Item 7 and our consolidated financial statements and related notes in Item 8. There also may be other factors that we cannot anticipate or that are not described in this Annual Report generally because we do not currently perceive them to be material. Those factors could cause results to differ materially from our expectations.
We may be unable to adapt our business concept in a rapidly evolving retail environment to address the changing shopping habits, demands and demographics of our customers, or realize the intended benefits of organizational change initiatives.
The home improvement retail environment, like the retail environment generally, is rapidly evolving, and adapting our business concept to respond to our customers’ changing shopping habits and demands and their changing demographics is critical to our future success. Our success is dependent on our ability to identify and respond to the economic, social, style and other trends that affect demographic and consumer preferences in a variety of our merchandise categories and service offerings. Customers’ expectations about how they wish to research, purchase and receive products and services have also evolved. It is difficult to predict the mix of products and services that our customers will demand. Failure to identify such trends, adapt our business concept, and implement change, growth, and productivity initiatives successfully could negatively affect our relationship with our customers, the demand for the home improvement products and services we sell, the rate of growth of our business, our market share, and results of operations.
We may not be able to realize the benefits of our strategic initiatives focused on omni-channel sales and marketing presence if we fail to deliver the capabilities required to execute on them.
Our interactions with customers has evolved into an omni-channel experience as they increasingly are using computers, tablets, mobile phones and other devices to shop in our stores and online and provide feedback and public commentary about all aspects of our business. Omni-channel retail is quickly evolving, and we must anticipate and meet our customers’ expectations and counteract new developments and technology investments by our competitors. Our customer-facing technology systems must appeal to our customers, function as designed and provide a consistent customer experience. The success of our strategic initiatives to adapt our business concept to our customers’ changing shopping habits and demands and changing demographics
9
will require us to deliver large, complex programs requiring more integrated planning, initiative prioritization and program sequencing. These initiatives will require new competencies in many positions, and our management, employees and contractors will have to adapt and learn new skills and capabilities. To the extent they are unable or unwilling to make these transformational changes, we may be unable to realize the full benefits of our strategic initiatives and expand our relevant market access. Our results of operations, financial condition or business prospects could also be adversely affected if we fail to provide a consistent experience for our customers, regardless of sales channel, if our technology systems do not meet our customers’ expectations, if we are unable to counteract new developments and innovations implemented by our competitors, or if we are unable to attract, retain, and manage the talent succession of additional personnel at various levels of the Company who have the skills and capabilities we need to implement our strategic initiatives and drive the changes that are essential to successfully adapting our business concept in the rapidly changing retail environment.
Our business and our reputation could be adversely affected by cybersecurity incidents and the failure to protect customer, employee, vendor or Company information or to comply with evolving regulations relating to our obligation to protect our systems, assets and such information.
Cyber-attacks and tactics designed to gain access to and exploit sensitive information by breaching mission critical systems of large organizations are constantly evolving, and high profile security breaches leading to unauthorized release of sensitive customer information have occurred in recent years with increasing frequency at a number of major U.S. companies, including several large retailers, despite widespread recognition of the cyber-attack threat and improved data protection methods. As with many other retailers, we receive and store certain personal information about our customers, employees and vendors. Additionally, we use third-party service providers for certain services, such as authentication, content delivery, back-office support and other functions, and we provide such third-party service providers with personal information necessary for the services concerned. Despite our continued vigilance and investment in information security, we or our third-party service providers cannot guarantee that we or they are able to adequately anticipate or prevent a breach in our or their systems that results in the unauthorized access to, destruction, misuse or release of personal information or other sensitive data. It can be difficult to preempt or detect ever-evolving forms of cyber-attacks. If a ransomware attack occurs, it is possible that we could be prevented from accessing our own data. Our or our service providers’ information security may also be compromised because of human errors, including by employees, or system errors. Our and our service providers’ systems are additionally vulnerable to a number of other causes, such as power outages, computer viruses, technology system failures or catastrophic events. In the event that our systems are breached or damaged for any reason, we may also suffer loss or unavailability of data and interruptions to our business operations while such breach or damage is being remedied. Should these events occur, the unauthorized disclosure, loss or unavailability of data and disruption to our business may have a material adverse effect on our reputation, drive existing and potential customers away and lead to financial losses from remedial actions, or potential liability, including possible litigation and punitive damages. A security breach resulting in the unauthorized release of data from our or our third-party service providers’ information systems could also materially increase the costs we already incur to protect against such risks and require dedication of substantial resources to manage the aftermath of such a breach. Data privacy and cybersecurity laws in the United States and internationally are constantly changing, and in the United States alone, we may be subject to regulation at both the federal and state level. In order to maintain our compliance with such laws as they come to fruition, we may sustain increased costs in order to continually evaluate our policies and processes and adapt to new requirements that are or become applicable to us. As the regulatory environment relating to retailers’ and other companies’ obligation to protect personal information becomes stricter, a material failure on our part to comply with applicable regulations could subject us to fines, other regulatory sanctions or government investigation, and potentially to lawsuits brought by private individuals, regulators or states’ attorney general.
We could be adversely affected by the failure to adequately protect and maintain our intellectual property rights or claims by third parties that we infringe their intellectual property rights.
Our proprietary rights in our trademarks, trade names, service marks, domain names, copyrights, patents, trade secrets and other intellectual property rights are valuable assets of our business. We rely on a combination of trademark law, patent law, copyright law, trade secret protections and contractual arrangements, such as nondisclosure and confidentiality agreements, to protect our proprietary rights. Maintenance and, when necessary, enforcement of our intellectual property rights require expenditure of financial and managerial resources, and despite our efforts, we may not always be able to effectively protect all of such rights. We may not be able to prevent or even discover every instance of unauthorized third party uses of our intellectual property or dilution of our brand names, such as when a third party uses trademarks that are identical or similar to our own. Additionally, our trade secrets are vulnerable to public disclosure by our own employees or as a result of a breach of or damage to our systems, which could result in theft of our proprietary property. We may also be subject to intellectual property infringement lawsuits, brought by third parties against us claiming that our operations, products or services infringe third party rights (whether meritorious or not), including patent and trademark rights, which can be time consuming and costly to defend or settle and may cause significant diversion of management attention and result in substantial monetary damages, injunctive orders against us, unfavorable royalty-bearing licensing agreements or bad publicity.
10
We are subject to payments-related risks that could increase our operating costs, expose us to fraud, subject us to potential liability and potentially disrupt our business.
We accept payments using a variety of methods, including credit cards, debit cards, credit accounts, our private label and co-branded credit cards, gift cards, direct debit from a customer’s bank account, consumer invoicing and physical bank checks, and we may offer different payment options over time. These payment options subject us to many compliance requirements, including, but not limited to, compliance with payment card association operating rules, including data security rules, certification requirements, rules governing electronic funds transfers and Payment Card Industry Data Security Standards. They also subject us to potential fraud by criminal elements seeking to discover and take advantage of security vulnerabilities that may exist in some of these payment systems. For certain payment methods, including credit and debit cards, we pay interchange and other fees, which may increase over time and raise our operating costs and lower profitability. We rely on third parties to provide payment processing services, including the processing of credit cards, debit cards, electronic checks, gift cards and promotional financing, and it could disrupt our business if these companies become unwilling or unable to provide these services to us. If we fail to comply with these rules or requirements, or if our data security systems are breached or compromised, we may be liable for card issuing banks’ costs, subject to fines and higher transaction fees, and lose our ability to accept credit and debit card payments from our customers, process electronic funds transfers, or facilitate other types of online payments, and our business and operating results could be adversely affected.
As customer-facing technology systems become an increasingly important part of our omni-channel sales and marketing strategy, the failure of those systems to perform effectively and reliably could keep us from delivering positive customer experiences.
Access to the Internet from computers, tablets, smart phones and other mobile communication devices has empowered our customers and changed the way they shop and how we interact with them. Our websites, including Lowes.com and Lowesforpros.com, are a sales channel for our products, and are also a method of making product, project and other relevant information available to our customers that impacts our in-store sales. Additionally, we have multiple affiliated websites and mobile apps through which we seek to inspire, inform, cross-sell, establish online communities among and otherwise interact with our customers. Performance issues with these customer-facing technology systems, including temporary outages caused by distributed denial of service, ransomware or other cyber-attacks, or a complete failure of one or more of them without a disaster recovery plan that can be quickly implemented, could quickly destroy the positive benefits they provide to our home improvement business and negatively affect our customers’ perceptions of Lowe’s as a reliable online vendor and source of information about home improvement products and services.
If we fail to hire, train, manage and retain qualified sales associates and specialists with expanded skill sets or corporate support staff with the capabilities of delivering on strategic objectives, we could lose sales to our competitors, and our labor costs, resulting from operations or the execution of corporate strategies, could be negatively affected.
Our customers, whether they are homeowners, renters or commercial businesses, expect our sales associates and specialists to be well trained and knowledgeable about the products we sell and the home improvement services we provide. We compete with other retailers for many of our sales associates and specialists, and we invest significantly in them with respect to training and development to strive for high engagement. Increasingly, our sales associates and specialists must have expanded skill sets, including, in some instances, the ability to do in-home or telephone sales. A critical challenge we face is attracting and retaining a sufficiently diverse workforce that can deliver relevant, culturally competent and differentiated experiences for a wide variety of culturally diverse customers. In fact, in many of our stores, our employees must be able to serve customers whose primary language and cultural traditions are different from their own. Additionally, in order to deliver on the omni-channel expectations of our customers, we rely on the specialized training and capabilities of corporate support staff which are broadly sought after by our competitors. If we are unable to hire, train, manage and retain qualified sales associates and specialists, the quality of service we provide to our customers may decrease and our results of operations could be negatively affected. Furthermore, our ability to meet our labor needs while controlling our costs is subject to a variety of external factors, including wage rates, the availability of and competition for talent, health care and other benefit costs, our brand image and reputation, changing demographics, and adoption of new or revised employment and labor laws and regulations. Periodically, we are subject to labor organizing efforts, and if we become subject to collective bargaining agreements in the future, it could adversely affect how we operate our business and adversely affect our labor costs and our ability to retain a qualified workforce.
If we do not successfully manage the transition associated with the retirement of our Chief Executive Officer and the appointment of a new Chief Executive Officer, it could be viewed negatively by our customers and shareholders and could have an adverse impact on our business.
On March 26, 2018, we announced that Robert A. Niblock plans to retire as Chairman of the Board, President and Chief Executive Officer after a 25-year career with the Company. The board of directors has initiated a search for his successor, and in the interim Mr. Niblock will remain in his current role. Such leadership transitions can be inherently difficult to manage, and
11
an inadequate transition may cause disruption to our business, including to our relationships with our customers, suppliers, vendors and employees. It may also make it more difficult to hire and retain key employees.
Positively and effectively managing our public image and reputation is critical to our business success, and, if our public image and reputation are damaged, it could negatively impact our relationships with our customers, vendors and store associates and specialists and, consequently, our business and results of operations.
Our public image and reputation are critical to ensuring that our customers shop at Lowe’s, our vendors want to do business with Lowe’s and our sales associates and specialists want to work for Lowe’s. We must continue to manage, preserve and grow Lowe’s public image and reputation. Any negative incident can erode trust and confidence quickly, and adverse publicity about us could damage our reputation and brand image, undermine our customers’ confidence, reduce demand for our products and services, affect our relationships with current and future vendors, impact our results of operations and affect our ability to retain and recruit store associates and specialists. The significant expansion in the use of social media over recent years has compounded the potential scope of the negative publicity that could be generated by such negative incidents.
Strategic transactions, such as our acquisition of RONA and Maintenance Supply Headquarters, involve risks, and we may not realize the expected benefits because of numerous uncertainties and risks.
We regularly consider and enter into strategic transactions, including mergers, acquisitions, joint ventures, investments and other growth, market and geographic expansion strategies, with the expectation that these transactions will result in increases in sales, cost savings, synergies and other various benefits. Our ability to deliver the expected benefits from any strategic transaction is subject to numerous uncertainties and risks, including our ability to integrate personnel, labor models, financial, IT and other systems successfully; disruption of our ongoing business and distraction of management; hiring additional management and other critical personnel; and increasing the scope, geographic diversity and complexity of our operations. Effective internal controls are necessary to provide reliable and accurate financial reports, and the integration of businesses may create complexity in our financial systems and internal controls and make them more difficult to manage. Integration of businesses into our internal control system could cause us to fail to meet our financial reporting obligations. Additionally, any impairment of goodwill or other assets acquired or divested in a strategic transaction or charges to earnings associated with any strategic transaction, may materially reduce our earnings. Our shareholders may react unfavorably to our strategic transactions. We may not realize any anticipated benefits from such transactions, we may be exposed to additional liabilities of any acquired business or joint venture and we may be exposed to litigation in connection with the strategic transaction. Further, we may finance these strategic transactions by incurring additional debt, which could increase leverage or impact our ability to access capital in the future.
Failure to achieve and maintain a high level of product and service quality could damage our image with customers and negatively impact our sales, profitability, cash flows and financial condition.
Product and service quality issues could result in a negative impact on customer confidence in Lowe’s and our brand image. If our product and service offerings do not meet applicable safety standards or our customers’ expectations regarding safety or quality, we could experience lost sales and increased costs and be exposed to legal, financial and reputational risks. Actual, potential or perceived product safety concerns could expose us to litigation, as well as government enforcement action, and result in costly product recalls and other liabilities. As a result, Lowe’s reputation as a retailer of high quality products and services, including both national and Lowe’s private brands, could suffer and impact customer loyalty.
We have many competitors who could take sales and market share from us if we fail to execute our merchandising, marketing and distribution strategies effectively, or if they develop a substantially more effective or lower cost means of meeting customer needs, resulting in a negative impact on our business and results of operations.
We operate in a highly competitive market for home improvement products and services and have numerous large and small, direct and indirect competitors. The principal competitive factors in our industry include convenience, customer service, quality and price of merchandise and services, in-stock levels, and merchandise assortment and presentation. We face growing competition from online and omni-channel retailers who have a similar product or service offering. Customers are increasingly able to quickly comparison shop and determine real-time product availability and price using digital tools. Our failure to respond effectively to competitive pressures and changes in the markets for home improvement products and services could affect our financial performance. Moreover, changes in the promotional pricing and other practices of our competitors, including the effects of competitor liquidation activities, may impact our results.
Our inability to effectively and efficiently manage and maintain our relationships with selected suppliers of brand name products could negatively impact our business operations and financial results.
We form strategic relationships with selected suppliers to market and develop products under a variety of recognized and respected national and international brand names. We also have relationships with certain suppliers to enable us to sell proprietary products which differentiate us from other retailers. The inability to effectively and efficiently manage and maintain our relationships with these suppliers could negatively impact our business operations and financial results.
12
Failure of a key vendor or service provider that we cannot quickly replace could disrupt our operations and negatively impact our business, financial condition and results of operations.
We rely upon a number of vendors as the sole or primary source of some of the products we sell. We also rely upon many independent service providers for technology solutions and other services that are important to many aspects of our business. Many of these vendors and service providers have certain products or specialized skills needed to support our business concept and our strategies. If these vendors or service providers discontinue operations or are unable to perform as expected or if we fail to manage them properly or we are unable to replace them quickly, our business could be adversely affected, at least temporarily, until we are able to replace them.
If our domestic or international supply chain or our fulfillment network for our products is ineffective or disrupted for any reason, or if these operations are subject to trade policy changes, our results of operations could be adversely affected.
We source, stock and sell products from domestic and international vendors, and their ability to reliably and efficiently fulfill our orders is critical to our business success. We source a large number of our products from foreign manufacturers, with China being the dominant import source. The current United States administration has signaled the possibility of major changes in certain tax and trade policies, tariffs and other regulations affecting trade between the United States and other countries, such as the imposition of additional tariffs or duties on imported products and the exit or renegotiation of certain trade agreements, including the North American Free Trade Act and the rules of the World Trade Organization. While it is not possible to predict whether or when any such changes will occur or what form they may take, because we source a large percentage of our merchandise from outside the United States, major changes in tax or trade policies, tariffs or trade relations could adversely affect our business, results of operations, effective income tax rate, liquidity and net income. In addition, other countries may change their business and trade policies in anticipation of or in response to increased import tariffs and other changes in United States trade policy and regulations.
Financial instability among key vendors, political instability and labor unrest in source countries or elsewhere in our supply chain, changes in the total costs in our supply chain (fuel, labor and currency exchange rates), port labor disputes and security, the outbreak of pandemics, weather-related events, natural disasters, work stoppages, shipping capacity restraints, changes in trade policy, retaliatory trade restrictions imposed by either the United States or a major source country, tariffs or duties, fluctuations in currency exchange rates and transport availability, capacity and costs are beyond our control and could negatively impact our business if they seriously disrupted the movement of products through our supply chain or increased their costs. Additionally, as we add fulfillment capabilities or pursue strategies with different fulfillment requirements, our fulfillment network becomes increasingly complex and operating it becomes more challenging. If our fulfillment network does not operate properly or if a vendor fails to deliver on its commitments, we could experience delays in inventory, increased delivery costs or merchandise out-of-stocks that could lead to lost sales and decreased customer confidence, and adversely affect our results of operations.
Failure to effectively manage our third-party installers could result in increased operational and legal risks and negatively impact our business, financial condition and results of operations.
We use third-party installers to provide installation services to our customers, and, as the general contractor, we are subject to regulatory requirements and risks applicable to general contractors, including the management of the permitting, licensing and quality of our third-party installers. Our failure to effectively manage such requirements, the third-party installers, and our internal processes regarding installation services could result in lost sales, fines and lawsuits, as well as damage to our reputation, which could negatively affect our business.
Operating internationally presents unique challenges, including some that have required us to adapt our store operations, merchandising, marketing and distribution functions to serve customers in Canada and Mexico. Our business and results of operations could be negatively affected if we are unable to effectively address these challenges.
We expect continued store growth over the next five years in Canada and Mexico. Expanding internationally presents unique challenges that may increase the anticipated costs and risks, and slow the anticipated rate, of such expansion. Our future operating results in these countries or in other countries or regions in which we currently operate or may operate in the future could be negatively affected by a variety of factors, including unfavorable political or economic factors, adverse tax consequences, volatility in foreign currency exchange rates, increased difficulty in enforcing intellectual property rights, costs and difficulties of managing international operations, challenges with identifying and contracting with local suppliers and other risks created as a result of differences in culture, laws and regulations. These factors could restrict our ability to operate our international businesses profitably and therefore have a negative impact on our results of operations and financial position. In addition, our reported results of operations and financial position could also be negatively affected by exchange rates when the activities and balances of our foreign operations are translated into U.S. dollars for financial reporting purposes.
13
We must comply with various and multiple laws and regulations that differ substantially in each area where we operate. Changes in existing or new laws and regulations or regulatory enforcement priorities, or our inability to comply with such laws and regulations, could adversely affect our business, financial condition and results of operations.
Laws and regulations at the local, regional, state, federal and international levels change frequently, and the changes can impose significant costs and other burdens of compliance on our business and our vendors. If we fail to comply with these laws, rules and regulations, or the manner in which they are interpreted or applied, we may be subject to government enforcement action, litigation, damage to our reputation, civil and criminal liability, damages, fines and penalties, and increased cost of regulatory compliance, any of which could adversely affect our results of operations and financial performance. These laws, rules and regulations include, but are not limited to, import and export requirements, U.S. laws such as the Foreign Corrupt Practices Act, and local laws prohibiting corrupt payments to governmental officials. Although we have implemented policies and procedures to help ensure compliance with these laws, rules and regulations, there can be no certainty that our employees and third parties with whom we do business will not take actions in violation of our policies or laws. Many of these laws, rules and regulations are complex, evolving and are subject to varying interpretations and enforcement actions. Any changes in regulations, the imposition of additional regulations, or the enactment of any new legislation could have an adverse impact, directly or indirectly, on our financial condition and results of operations. We may also be subject to investigations or audits by governmental authorities and regulatory agencies as a result of enforcing existing laws and regulations or changes in enforcement priorities, which can occur in the ordinary course of business or which can result from increased scrutiny from a particular agency towards an industry, country or practice.
Future litigation or governmental proceedings could result in material adverse consequences, including judgments or settlements, negatively affecting our business, financial condition and results of operations.
We are, and in the future will become, involved in lawsuits, regulatory inquiries, and governmental and other legal proceedings arising out of the ordinary course of our business. Some of these proceedings may raise difficult and complicated factual and legal issues and can be subject to uncertainties and complexities. The timing of the final resolutions to lawsuits, regulatory inquiries, and governmental and other legal proceedings is typically uncertain. Additionally, the possible outcomes of, or resolutions to, these proceedings could include adverse judgments or settlements, either of which could require substantial payments. Furthermore, defending against these proceedings may require a diversion of management’s attention and resources. None of the legal proceedings in which we are currently involved, individually or collectively, is considered material.
Our financial performance could be adversely affected if our management information systems are seriously disrupted or we fail to properly maintain, improve, upgrade and expand those systems.
Our efforts to provide an omni-channel experience for our customers include investing in, maintaining and making ongoing improvements of our existing management information systems that support operations, such as sales, inventory replenishment, merchandise ordering, project design and execution, transportation, receipt processing and fulfillment. Our systems are subject to damage or interruption as a result of catastrophic events, power outages, viruses, malicious attacks, and telecommunications failures, and as a result we may incur significant expense, data loss as well as an erosion of customer confidence. Additionally, we continually make investments in our systems which may introduce disruption. Our financial performance could be adversely affected if our management information systems are seriously disrupted or we fail to properly maintain, improve, upgrade and expand those systems.
Liquidity and access to capital rely on efficient, rational and open capital markets and are dependent on Lowe’s credit strength. Our inability to access capital markets could negatively affect our business, financial performance and results of operations.
We have relied on the public debt markets to fund portions of our capital investments and the commercial paper market and bank credit facilities to fund our working capital needs. Our access to these markets depends on our strong credit ratings, the overall condition of debt capital markets and our operating performance. Disruption in the financial markets or an erosion of our credit strength or declines on our credit rating could impact negatively our ability to meet capital requirements or fund working capital needs.
Our sales are dependent upon the health and stability of the general economy. Adverse changes in economic factors specific to the home improvement industry may negatively impact the rate of growth of our total sales and comparable sales.
Many U.S. and global economic factors may adversely affect our financial performance. These include, but are not limited to, periods of slow economic growth or recession, decreasing housing turnover or home price appreciation, volatility and/or lack of liquidity from time to time in U.S. and world financial markets and the consequent reduced availability and/or higher cost of borrowing to Lowe’s and its customers, slower rates of growth in real disposable personal income that could affect the rate of growth in consumer spending, high rates of unemployment, consumer debt levels, fluctuations in fuel and energy costs, inflation or deflation of commodity prices, natural disasters, and acts of both domestic and international terrorism. Sales of many of our product categories and services are driven by the activity level of home improvement projects. Adverse development in these factors could result in a decrease in home improvement activity which could reduce demand for our products and services.
14
None.
At
February 2, 2018
, our properties consisted of
2,152
stores in the U.S., Canada, and Mexico with a total of approximately
215 million
square feet of selling space. Of the total stores operating at
February 2, 2018
, approximately
79%
are owned, which includes stores on leased land, with the remainder being leased from third parties. We also operate regional distribution centers and other facilities to support distribution and fulfillment, as well as data centers and various support offices. Our executive offices are located in Mooresville, North Carolina.
The Company is from time to time a party to various lawsuits, claims and other legal proceedings that arise in the ordinary course of business. With respect to such lawsuits, claims and proceedings, the Company records reserves when it is probable a liability has been incurred and the amount of loss can be reasonably estimated. The Company does not believe that any of these proceedings, individually or in the aggregate, would be expected to have a material adverse effect on its results of operations, financial position, or cash flows. The Company maintains liability insurance for certain risks that are subject to certain self-insurance limits.
Not applicable.
15
EXECUTIVE OFFICERS OF THE REGISTRANT
Set forth below is a list of names and ages of the executive officers of the registrant indicating all positions and offices with the registrant held by each such person and each person’s principal occupations or employment during the past five years. Each executive officer of the registrant is elected by the board of directors. Each executive officer of the registrant holds office from the date of election until a successor is elected or until his or her death, resignation or removal.
On March 26, 2018, we announced that Robert A. Niblock plans to retire as Chairman of the Board, President and Chief Executive Officer after a 25-year career with the Company. The board of directors has initiated a search for his successor, and in the interim Mr. Niblock will remain in his current role.
|
Name
|
Age
|
Title
|
||
|
Robert A. Niblock
|
55
|
Chairman of the Board, President and Chief Executive Officer since 2011.
|
||
|
Marshall A. Croom
|
57
|
Chief Financial Officer since March 2017; Chief Risk Officer, 2012 – March 2017.
|
||
|
Matthew V. Hollifield
|
51
|
Senior Vice President and Chief Accounting Officer since 2005.
|
||
|
Richard D. Maltsbarger
|
42
|
Chief Operating Officer since February 2018; Chief Development Officer and President of International, 2015 –
February 2018; Chief Development Officer, 2014 – 2015; Business Development Executive, 2012 – 2014.
|
||
|
Ross W. McCanless
|
60
|
Chief Legal Officer and Secretary since 2017; Chief Legal Officer, Secretary and Chief Compliance Officer, 2016 –
2017; General Counsel, Secretary and Chief Compliance Officer, 2015 – 2016; Chief Legal Officer, Extended Stay America, Inc. and ESH Hospitality, Inc., 2013 – 2014; Chief Legal Officer, HVM, L.L.C., 2012 – 2013.
|
||
|
Michael P. McDermott
|
48
|
Chief Customer Officer since 2016; Chief Merchandising Officer, 2014 – 2016; Senior Vice President and General Merchandising Manager – Building and Maintenance, 2013 – 2014; Sales Leader – Appliances, General Electric Company, 2011 – 2013.
|
||
|
N. Brian Peace
|
52
|
Corporate Administration Executive since 2012.
|
||
|
Paul D. Ramsay
|
53
|
Chief Information Officer since 2014; Senior Vice President, Information Technology, 2011 – 2014.
|
||
|
Jennifer L. Weber
|
51
|
Chief Human Resources Officer since 2016; Executive Vice President, External Affairs and Strategic Policy, Duke Energy Corporation, 2014 – 2016; Executive Vice President and Chief Human Resources Officer, Duke Energy Corporation, 2011 – 2014.
|
||
16
Item 5
-
Market for Registrant’s Common Equity, Related Stockholder Matters and Issuer Purchases of Equity Securities
Lowe’s common stock is traded on the New York Stock Exchange (NYSE). The ticker symbol for Lowe’s is “LOW”. As of
March 29, 2018
, there were 22,926 holders of record of Lowe’s common stock. The following table sets forth, for the periods indicated, the high and low sales prices per share of the common stock as reported by the NYSE Composite Tape and the dividends per share declared on the common stock during such periods.
|
Fiscal 2017
|
Fiscal 2016
|
||||||||||||||||||||||
|
High
|
Low
|
Dividend
|
High
|
Low
|
Dividend
|
||||||||||||||||||
|
1st Quarter
|
$
|
86.00
|
|
$
|
72.11
|
|
$
|
0.35
|
|
$
|
77.63
|
|
$
|
62.62
|
|
$
|
0.28
|
|
|||||
|
2nd Quarter
|
86.25
|
|
71.58
|
|
0.41
|
|
83.65
|
|
74.56
|
|
0.35
|
|
|||||||||||
|
3rd Quarter
|
82.74
|
|
70.76
|
|
0.41
|
|
82.68
|
|
66.71
|
|
0.35
|
|
|||||||||||
|
4th Quarter
|
108.98
|
|
77.14
|
|
0.41
|
|
76.47
|
|
64.87
|
|
0.35
|
|
|||||||||||
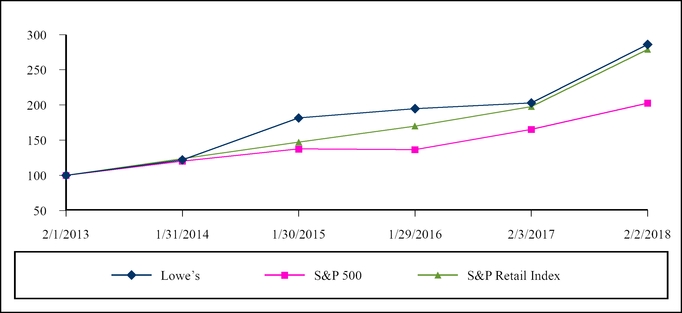
Total Return to Shareholders
The following information in Item 5 of this Annual Report is not deemed to be “soliciting material” or to be “filed” with the SEC or subject to Regulation 14A or 14C under the Securities Exchange Act of 1934 or to the liabilities of Section 18 of the Securities Exchange Act of 1934, and will not be deemed to be incorporated by reference into any filing under the Securities Act of 1933 or the Securities Exchange Act of 1934, except to the extent we specifically incorporate it by reference into such a filing.
The following table and graph compare the total returns (assuming reinvestment of dividends) of the Company’s common stock, the S&P 500 Index (S&P 500) and the S&P Retailing Industry Group Index (S&P Retail Index). The graph assumes $100 invested on
February 1, 2013
in the Company’s common stock and each of the indices.
|
2/1/2013
|
|
1/31/2014
|
|
1/30/2015
|
|
1/29/2016
|
|
2/3/2017
|
|
2/2/2018
|
|
||||||||||||
|
Lowe’s
|
$
|
100.00
|
|
$
|
121.96
|
|
$
|
181.46
|
|
$
|
194.85
|
|
$
|
202.83
|
|
$
|
286.15
|
|
|||||
|
S&P 500
|
100.00
|
|
120.30
|
|
137.42
|
|
136.50
|
|
165.26
|
|
202.66
|
|
|||||||||||
|
S&P Retail Index
|
$
|
100.00
|
|
$
|
123.90
|
|
$
|
147.13
|
|
$
|
170.01
|
|
$
|
197.77
|
|
$
|
278.96
|
|
|||||
17
Issuer Purchases of Equity Securities
The following table sets forth information with respect to purchases of the Company’s common stock made during the fourth quarter of fiscal
2017
:
|
Total Number of
Shares Purchased
1
|
|
Average Price
Paid per Share
|
|
Total Number of Shares Purchased as Part of Publicly Announced Plans or Programs
2
|
|
Dollar Value of Shares that May Yet Be Purchased Under the Plans or Programs
2
|
|
||||||
|
November 4, 2017 – December 1, 2017
|
1,677,589
|
|
$
|
79.14
|
|
1,677,580
|
|
$
|
1,943,395,179
|
|
|||
|
December 2, 2017 – January 5, 2018
|
931
|
|
88.59
|
|
—
|
|
1,943,395,179
|
|
|||||
|
January 6, 2018 – February 2, 2018
|
570
|
|
103.70
|
|
—
|
|
6,943,395,179
|
|
|||||
|
As of February 2, 2018
|
1,679,090
|
|
$
|
79.16
|
|
1,677,580
|
|
$
|
6,943,395,179
|
|
|||
|
1
|
The total number of shares purchased includes shares withheld from employees to satisfy either the exercise price of stock options or the statutory withholding tax liability upon the vesting of share-based awards.
|
|
2
|
On January 27, 2017, the Company announced that its Board of Directors authorized a
$5.0 billion
repurchase program with no expiration. On January 26, 2018, the Company announced that its Board of Directors authorized an additional $5.0 billion of share repurchases with no expiration.
|
|
Selected Statement of Earnings Data
(In millions, except per share data)
|
2017
|
|
2016
1, 2
|
|
2015
|
|
2014
|
|
2013
|
|
|||||||||
|
Net sales
|
$
|
68,619
|
|
$
|
65,017
|
|
$
|
59,074
|
|
$
|
56,223
|
|
$
|
53,417
|
|
||||
|
Gross margin
|
23,409
|
|
22,464
|
|
20,570
|
|
19,558
|
|
18,476
|
|
|||||||||
|
Operating income
|
6,586
|
|
5,846
|
|
4,971
|
|
4,792
|
|
4,149
|
|
|||||||||
|
Net earnings
|
3,447
|
|
3,093
|
|
2,546
|
|
2,698
|
|
2,286
|
|
|||||||||
|
Basic earnings per common share
|
4.09
|
|
3.48
|
|
2.73
|
|
2.71
|
|
2.14
|
|
|||||||||
|
Diluted earnings per common share
|
4.09
|
|
3.47
|
|
2.73
|
|
2.71
|
|
2.14
|
|
|||||||||
|
Dividends per share
|
$
|
1.58
|
|
$
|
1.33
|
|
$
|
1.07
|
|
$
|
0.87
|
|
$
|
0.70
|
|
||||
|
Selected Balance Sheet Data
|
|||||||||||||||||||
|
Total assets
|
$
|
35,291
|
|
$
|
34,408
|
|
$
|
31,266
|
|
$
|
31,721
|
|
$
|
32,471
|
|
||||
|
Long-term debt, excluding current maturities
|
$
|
15,564
|
|
$
|
14,394
|
|
$
|
11,545
|
|
$
|
10,806
|
|
$
|
10,077
|
|
||||
|
1
|
Fiscal 2016 contained 53 weeks, while all other years contained 52 weeks.
|
2
Fiscal 2016 includes the acquisition of RONA inc. See Note 2 to the consolidated financial statements included in this Annual Report.
18
The following discussion and analysis summarizes the significant factors affecting our consolidated operating results, financial condition, liquidity and capital resources during the three-year period ended
February 2, 2018
(our fiscal years
2017
,
2016
and
2015
). Fiscal year 2016 contains 53 weeks of operating results compared to fiscal years 2017 and 2015 which contain 52 weeks. Unless otherwise noted, all references herein for the years
2017
,
2016
and
2015
represent the fiscal years ended
February 2, 2018
,
February 3, 2017
and
January 29, 2016
, respectively. We intend for this discussion to provide the reader with information that will assist in understanding our financial statements, the changes in certain key items in those financial statements from year to year, and the primary factors that accounted for those changes, as well as how certain accounting principles affect our financial statements. This discussion should be read in conjunction with our consolidated financial statements and notes to the consolidated financial statements included in this Annual Report that have been prepared in accordance with accounting principles generally accepted in the United States of America. This discussion and analysis is presented in six sections:
|
•
|
Executive Overview
|
|
•
|
Operations
|
|
•
|
Financial Condition, Liquidity and Capital Resources
|
|
•
|
Off-Balance Sheet Arrangements
|
|
•
|
Contractual Obligations and Commercial Commitments
|
|
•
|
Critical Accounting Policies and Estimates
|
EXECUTIVE OVERVIEW
Net sales for
2017
were
$68.6 billion
, a
5.5%
increase over fiscal year
2016
. The increase in total sales was driven primarily by an increase in comparable sales, the addition of RONA in May of 2016, new stores, and the acquisition of Maintenance Supply Headquarters in June 2017, partially offset by the 53
rd
week impacts in the prior year. Comparable sales increased
4.0%
, driven by a comparable average ticket increase of 4.1% and a comparable transaction decrease of 0.1%. RONA, new stores, and Maintenance Supply Headquarters contributed 2.2%, 0.7% and 0.3%, respectively, to the sales growth for
2017
. The 53
rd
week in 2016 and resulting week shift negatively impacted 2017 sales growth by 1.3%. Net earnings increased
11.5%
to
$3.4 billion
. Diluted earnings per common share increased
17.9%
in fiscal year 2017 to
$4.09
from
$3.47
in
2016
. Adjusting
2017
and
2016
amounts for certain significant discrete items not originally contemplated in the business outlooks for those respective years, adjusted diluted earnings per common share increased
10.0%
in fiscal year
2017
to
$4.39
from
$3.99
in
2016
(see discussion on non-GAAP financial measures beginning on page 22).
For
2017
, cash flows from operating activities were approximately
$5.1 billion
, with
$1.1 billion
used for capital expenditures. Continuing to deliver on our commitment to return excess cash to shareholders, the Company repurchased
39.1 million
shares of stock through the share repurchase program for
$3.1 billion
and paid
$1.3 billion
in dividends during the year.
During the year, we focused on investing in capabilities to support the DIY, DIFM, and Pro customers’ needs and expanding our home improvement reach. We made further progress on advancing our customer service capabilities through our omni-channel assets, empowering customers across the most relevant moments of their project journey. We leveraged our investments in Lowes.com to provide an upgraded online shopping experience and advanced our online platform by making it easier for customers to engage with our in-home Project Specialists and request services online. Our Project Specialists represent a critical element of our omni-channel offering and a differentiated capability in capturing project demand for the DIFM customer. In addition, we continued to build upon our strong foundation with the Pro customer by focusing on our breadth and depth of inventory, portfolio of brands, and enhancing digital focus on LowesForPros.com. The acquisition of Maintenance Supply Headquarters during 2017, in addition to the Central Wholesalers, Inc. acquisition in the prior year, will provide an opportunity to improve and expand our ability to serve the multi-family housing industry. We also continued to make progress on the integration of RONA, including the roll-out of Appliances to approximately 100 locations as well as further optimizing our shared supplier relationships and procurement efforts. During 2017, we converted five RONA stores to a Lowe’s-branded store as part of our initiative to convert certain larger format locations, where we are combining the best elements of Lowe’s store experience, merchandising, and brands with RONA’s strong Pro offerings.
While we are pleased with the strategic milestones we achieved this year, we are actively working to improve conversion, gross margin, and inventory management to ensure greater success in the future. We will be taking the necessary actions to transform our supply chain, better empower our associates through training programs and the re-engineering of key processes such as Pick Up In Store and centralized project quoting, and continue to deliver compelling product experiences.
19
In 2018, we look to capitalize on a strong macroeconomic environment and see an opportunity to invest incremental cash flow from corporate tax reform to accelerate our strategic priorities. We will be focusing our investments on the following six strategic areas to build upon our strong foundation which will be instrumental to further strengthening our competitiveness and enhancing our position as the omni-channel project authority:
|
•
|
We are focusing on leveraging analytics to know the customer and their homes better, understanding their plans and designing better solutions to help them navigate their project journey.
|
|
•
|
We are improving how we engage, connecting with customers and associates through relevant tools and personalized messages through our enhanced marketing management platform. We will better empower our associates by deploying more user-friendly interfaces allowing our associates to better serve customers.
|
|
•
|
We are expanding our fulfillment options to better serve customers’ needs and expectations including investing in a new direct fulfillment center which will allow for the expansion of our online product offering and faster parcel shipping, investing in delivery capacity to meet increased demand, and advancing our Pick Up In Store experience to allow customers and our installation service providers to pick up products quickly.
|
|
•
|
We are continuing to deliver compelling product experiences to provide inspiration and personalized choices through a combination of strategic brands and differentiated store experiences.
|
|
•
|
We are investing to improve the Pro experience in order to grow our Pro sales and expand our market share including building on our strength with the maintenance, repair & operations customer and increasing relevance with specialty trades and repair/re-modelers.
|
|
•
|
We are providing a differentiated service offering for the DIFM customer, delivering complete home improvement project solutions through our in-home sales platform.
|
Through these six strategic areas, we are focusing our resources on what is most relevant to the customer, building the capabilities required to deliver simple and seamless omni-channel experiences for DIY, DIFM, and Pro customers and engaging them in the moments that matter most.
20
OPERATIONS
The following tables set forth the percentage relationship to net sales of each line item of the consolidated statements of earnings, as well as the percentage change in dollar amounts from the prior year. This table should be read in conjunction with the following discussion and analysis and the consolidated financial statements, including the related notes to the consolidated financial statements.
|
Basis Point Increase / (Decrease) in
Percentage of Net Sales from
Prior Year
1
|
|
Percentage Increase / (Decrease) in Dollar Amounts from Prior Year
1
|
|
||||||
|
2017
|
2016
|
2017 vs. 2016
|
|
2017 vs. 2016
|
|
||||
|
Net sales
|
100.00%
|
100.00%
|
N/A
|
|
5.5
|
%
|
|||
|
Gross margin
|
34.11
|
34.55
|
(44
|
)
|
4.2
|
|
|||
|
Expenses:
|
|||||||||
|
Selling, general and administrative
|
22.40
|
23.27
|
(87
|
)
|
1.6
|
|
|||
|
Depreciation and amortization
|
2.11
|
2.29
|
(18
|
)
|
(2.8
|
)
|
|||
|
Operating income
|
9.60
|
8.99
|
61
|
|
12.6
|
|
|||
|
Interest - net
|
0.92
|
0.99
|
(7
|
)
|
(2.0
|
)
|
|||
|
Loss on extinguishment of debt
|
0.68
|
—
|
68
|
|
N/A
|
|
|||
|
Pre-tax earnings
|
8.00
|
8.00
|
—
|
|
5.5
|
|
|||
|
Income tax provision
|
2.98
|
3.24
|
(26
|
)
|
(3.2
|
)
|
|||
|
Net earnings
|
5.02%
|
4.76%
|
26
|
|
11.5
|
%
|
|||
|
Basis Point Increase / (Decrease) in
Percentage of Net Sales from Prior Year
1
|
|
Percentage Increase / (Decrease) in Dollar Amounts from Prior Year
1
|
|
||||||
|
2016
|
2015
|
2016 vs. 2015
|
|
2016 vs. 2015
|
|
||||
|
Net sales
|
100.00%
|
100.00%
|
N/A
|
|
10.1
|
%
|
|||
|
Gross margin
|
34.55
|
34.82
|
(27
|
)
|
9.2
|
|
|||
|
Expenses:
|
|||||||||
|
Selling, general and administrative
|
23.27
|
23.88
|
(61
|
)
|
7.2
|
|
|||
|
Depreciation and amortization
|
2.29
|
2.53
|
(24
|
)
|
(0.3
|
)
|
|||
|
Operating income
|
8.99
|
8.41
|
58
|
|
17.6
|
|
|||
|
Interest - net
|
0.99
|
0.93
|
6
|
|
16.9
|
|
|||
|
Pre-tax earnings
|
8.00
|
7.48
|
52
|
|
17.7
|
|
|||
|
Income tax provision
|
3.24
|
3.17
|
7
|
|
12.6
|
|
|||
|
Net earnings
|
4.76%
|
4.31%
|
45
|
|
21.5
|
%
|
|||
|
1
|
The fiscal year ended February 3, 2017 had 53 weeks. The fiscal years ended February 2, 2018 and January 29, 2016 had 52 weeks.
|
21
|
Other Metrics
|
2017
|
|
2016
|
|
2015
|
|
|||||
|
Comparable sales increase
2
|
4.0
|
%
|
4.2
|
%
|
4.8
|
%
|
|||||
|
Total customer transactions (in millions)
1
|
953
|
|
945
|
|
878
|
|
|||||
|
Average ticket
3
|
$
|
72.00
|
|
$
|
68.83
|
|
$
|
67.26
|
|
||
|
At end of year:
|
|||||||||||
|
Number of stores
4
|
2,152
|
|
2,129
|
|
1,857
|
|
|||||
|
Sales floor square feet (in millions)
|
215
|
|
213
|
|
202
|
|
|||||
|
Average store size selling square feet (in thousands)
5
|
100
|
|
100
|
|
109
|
|
|||||
|
Return on average assets
6
|
9.5
|
%
|
8.9
|
%
|
7.8
|
%
|
|||||
|
Return on average shareholders’ equity
7
|
59.2
|
%
|
44.4
|
%
|
28.8
|
%
|
|||||
|
Return on invested capital
8
|
18.8
|
%
|
15.8
|
%
|
14.1
|
%
|
|||||
|
1
|
The fiscal year ended February 3, 2017 had 53 weeks. The fiscal years ended February 2, 2018 and January 29, 2016 had 52 weeks.
|
|
2
|
A comparable location is defined as a location that has been open longer than 13 months. A location that is identified for relocation is no longer considered comparable in the month of its relocation. The relocated location must then remain open longer than 13 months to be considered comparable. A location we have decided to close is no longer considered comparable as of the beginning of the month in which we announce its closing. Acquired locations are included in the comparable sales calculation beginning in the first full month following the first anniversary of the date of the acquisition. Comparable sales include online sales, which positively impacted fiscal 2017 by approximately 120 basis points. The comparable store sales calculation for fiscal 2016 included in the preceding table was calculated using sales for a comparable 53-week period.
|
|
3
|
Average ticket is defined as net sales divided by the total number of customer transactions.
|
|
4
|
The number of stores as of February 3, 2017 includes 245 stores acquired in the acquisition of RONA.
|
|
5
|
Average store size selling square feet is defined as sales floor square feet divided by the number of stores open at the end of the period. The average Lowe’s-branded home improvement store has approximately 112,000 square feet of retail selling space.
|
|
6
|
Return on average assets is defined as net earnings divided by average total assets for the last five quarters.
|
|
7
|
Return on average shareholders’ equity is defined as net earnings divided by average shareholders’ equity for the last five quarters.
|
|
8
|
Return on invested capital is a non-GAAP financial measure. See below for additional information and a reconciliation to the most comparable GAAP measure.
|
Non-GAAP Financial Measures
Return on Invested Capital
Return on Invested Capital (ROIC) is calculated using a non-GAAP financial measure. We believe ROIC is a meaningful metric for investors because it represents management’s measure of how effectively the Company is using capital to generate profits. Although ROIC is a common financial metric, numerous methods exist for calculating ROIC. Accordingly, the method used by our management to calculate ROIC may differ from the methods other companies use to calculate their ROIC. We encourage you to understand the methods used by another company to calculate its ROIC before comparing its ROIC to ours.
We define ROIC as trailing four quarters’ net operating profit after tax (NOPAT) divided by the average of ending debt and equity for the last five quarters. NOPAT is a non-GAAP financial measure, and net earnings is considered to be the most comparable GAAP financial measure to NOPAT. The calculation of ROIC, together with a reconciliation of NOPAT to net earnings, the most comparable GAAP financial measure, is as follows:
22
|
(In millions, except percentage data)
|
2017
|
|
2016
|
|
2015
|
|
|||||
|
Calculation of Return on Invested Capital
|
|||||||||||
|
Numerator
|
|||||||||||
|
Net earnings
|
$
|
3,447
|
|
$
|
3,093
|
|
$
|
2,546
|
|
||
|
Plus:
|
|||||||||||
|
Interest expense - net
|
633
|
|
645
|
|
552
|
|
|||||
|
Loss on extinguishment of debt
|
464
|
|
—
|
|
—
|
|
|||||
|
Provision for income taxes
|
2,042
|
|
2,108
|
|
1,873
|
|
|||||
|
Net operating profit
|
6,586
|
|
5,846
|
|
4,971
|
|
|||||
|
Less:
|
|||||||||||
|
Income tax adjustment
1
|
2,450
|
|
2,370
|
|
2,058
|
|
|||||
|
Net operating profit after tax
|
$
|
4,136
|
|
$
|
3,476
|
|
$
|
2,913
|
|
||
|
Denominator
|
|||||||||||
|
Average debt and equity
2
|
$
|
21,999
|
|
$
|
21,958
|
|
$
|
20,693
|
|
||
|
Return on invested capital
|
18.8
|
%
|
15.8
|
%
|
14.1
|
%
|
|||||
|
1
|
Income tax adjustment is defined as net operating profit multiplied by the effective tax rate, which was
37.2%
,
40.5%
, and
42.4%
for
2017
,
2016
, and
2015
, respectively.
|
|
2
|
Average debt and equity is defined as average debt, including current maturities and short-term borrowings, plus total equity for the last five quarters.
|
Adjusted Diluted Earnings Per Share
Adjusted diluted earnings per share is considered a non-GAAP financial measure. The Company believes this non-GAAP financial measure provides useful insight for analysts and investors in evaluating what management considers the Company’s core financial performance. Adjusted diluted earnings per share excludes the impact of certain discrete items not contemplated in the Company’s business outlooks for 2017, 2016, and 2015. Unless otherwise noted, the income tax effect of these adjustments is calculated using the marginal rates for the respective periods.
Adjusted diluted earnings per share should not be considered an alternative to, or more meaningful indicator of, the Company’s diluted earnings per common share as prepared in accordance with GAAP. The Company’s methods of determining this non-GAAP financial measure may differ from the method used by other companies for this or similar non-GAAP financial measures. Accordingly, these non-GAAP measures may not be comparable to the measures used by other companies.
23
|
2017
|
2016
|
2015
|
|||||||||||||||||||||||||||
|
Pre-Tax Earnings
|
Tax
|
Net Earnings
|
Pre-Tax Earnings
|
Tax
|
Net Earnings
|
Pre-Tax Earnings
|
Tax
|
Net Earnings
|
|||||||||||||||||||||
|
Diluted earnings per share, as reported
|
$
|
4.09
|
|
$
|
3.47
|
|
$
|
2.73
|
|
||||||||||||||||||||
|
Non-GAAP Adjustments - per share impacts
|
|||||||||||||||||||||||||||||
|
Impact of tax reform
1
|
—
|
|
0.02
|
|
0.02
|
|
—
|
|
—
|
|
—
|
|
—
|
|
—
|
|
—
|
|
|||||||||||
|
One-time cash bonus attributable to tax reform
2
|
0.08
|
|
(0.03
|
)
|
0.05
|
|
—
|
|
—
|
|
—
|
|
—
|
|
—
|
|
—
|
|
|||||||||||
|
Gain on sale of interest in Australian joint venture
3
|
(0.11
|
)
|
—
|
|
(0.11
|
)
|
—
|
|
—
|
|
—
|
|
—
|
|
—
|
|
—
|
|
|||||||||||
|
Loss on extinguishment of debt
4
|
0.55
|
|
(0.21
|
)
|
0.34
|
|
—
|
|
—
|
|
—
|
|
—
|
|
—
|
|
—
|
|
|||||||||||
|
Severance-related costs
5
|
—
|
|
—
|
|
—
|
|
0.09
|
|
(0.03
|
)
|
0.06
|
|
—
|
|
—
|
|
—
|
|
|||||||||||
|
IRC Section 987 charge
6
|
—
|
|
—
|
|
—
|
|
—
|
|
0.04
|
|
0.04
|
|
—
|
|
—
|
|
—
|
|
|||||||||||
|
Premium paid to acquire noncontrolling interest
7
|
—
|
|
—
|
|
—
|
|
—
|
|
—
|
|
0.02
|
|
—
|
|
—
|
|
—
|
|
|||||||||||
|
Net gain on foreign currency hedge
8
|
—
|
|
—
|
|
—
|
|
(0.09
|
)
|
0.04
|
|
(0.05
|
)
|
—
|
|
—
|
|
—
|
|
|||||||||||
|
Australian joint venture impairment
9
|
—
|
|
—
|
|
—
|
|
0.33
|
|
—
|
|
0.33
|
|
0.56
|
|
—
|
|
0.56
|
|
|||||||||||
|
Project write-offs
10
|
—
|
|
—
|
|
—
|
|
0.11
|
|
(0.04
|
)
|
0.07
|
|
—
|
|
—
|
|
—
|
|
|||||||||||
|
Orchard Supply Hardware goodwill and long-lived asset impairment
11
|
—
|
|
—
|
|
—
|
|
0.08
|
|
(0.03
|
)
|
0.05
|
|
—
|
|
—
|
|
—
|
|
|||||||||||
|
Adjusted diluted earnings per share
|
$
|
4.39
|
|
$
|
3.99
|
|
$
|
3.29
|
|
||||||||||||||||||||
|
1
|
Represents the net impact related to the passage of the Tax Cuts and Jobs Act of 2017.
|
|
2
|
Represents the one-time cash bonus for eligible hourly employees attributable to the passage of the Tax Cuts and Jobs Act of 2017.
|
|
3
|
Represents the gain from the sale of the Company’s interest in its Australian joint venture with Woolworths. This gain had no impact on the Company’s income tax provision due to the reduction of a previously established deferred tax valuation allowance.
|
|
4
|
Represents the loss on extinguishment of debt in connection with a $1.6 billion cash tender offer.
|
|
5
|
Represents the costs associated with the Company’s organizational changes in the stores, distribution centers, and corporate offices.
|
|
6
|
Represents tax charge primarily related to the issuance of Internal Revenue Code Section 987 final and temporary regulations in 2016.
|
|
7
|
Represents the premium paid to RONA’s preferred shareholders. Under the two-class method, the premium paid was deducted from net earnings to compute net earnings allocable to common shareholders.
|
|
8
|
Represents the net settlement of a foreign currency hedge entered into in advance of the Company’s acquisition of RONA during 2016.
|
|
9
|
Represents impairment charges related to the Company’s Australian joint venture with Woolworths. The charge had no impact on the Company’s income tax provision due to the establishment of a full deferred tax valuation allowance.
|
|
10
|
Represents charges recognized in 2016 for projects canceled as a part of the Company’s ongoing review of strategic initiatives.
|
|
11
|
Represents impairment charges associated with the Company’s Orchard Supply Hardware operations as part of a strategic reassessment of this business during 2016.
|
Fiscal
2017
Compared to Fiscal
2016
For the purpose of the following discussion, comparable store sales, comparable store average ticket and comparable store customer transactions are based upon comparable 52-week periods.
Net Sales –
Net sales
increased
5.5%
to
$68.6 billion
in
2017
. The increase in total sales was driven by 4.0% comparable sales growth, the addition of RONA during the second quarter of 2016 (2.2%), new stores (0.7%), and the acquisition of Maintenance Supply Headquarters (0.3%), partially offset by the impact of the 53rd week in 2016 and resulting week shift in 2017 (1.3%). RONA retail sales are included in comparable sales beginning in Q2 2017. The comparable sales increase of
4.0%
in
2017
was driven primarily by a 4.1% increase in comparable average ticket offset by a 0.1% decrease in comparable customer transactions. Comparable sales during each quarter of the fiscal year, as reported, were 1.9% in the first quarter, 4.5% in the second quarter, 5.7% in the third quarter, and 4.1% in the fourth quarter.
24
All of our product categories experienced comparable sales increases for the year. During
2017
, we experienced comparable sales increases above the company average in Appliances, Lumber & Building Materials, Rough Plumbing & Electrical, and Tools & Hardware. Strong brand and service advantages in Appliances, as well as our continued investment in customer experience both in-store and online, drove strong comparable sales during the year. Lumber & Building Materials benefited from an increased demand for hurricane-related products, an increase in Pro demand, and inflation. We also achieved strong comparable sales in Rough Plumbing & Electrical and Tools & Hardware driven by continued improvements in brand relevance and demand from the Pro customer. Geographically, all of our 14 U.S. regions experienced positive comparable store sales.
During the fourth quarter of
2017
, we experienced comparable sales increases in nine of 11 product categories, as well as flat comparable sales in Lawn & Garden and Fashion Fixtures. Comparable sales increases were above the company average in Appliances, Lumber & Building Materials, Rough Plumbing & Electrical, and Tools & Hardware. Strong brand and service advantages in Appliances, as well as our continued investment in customer experience both in-store and online, drove double digit comparable sales during the quarter. We achieved strong comparable sales in Lumber & Building materials driven by continued recovery efforts from Hurricane Irma and Harvey, inflation, and strong demand from the Pro customer. Our holiday performance combined with our strategy to serve demand for critical items customers needed during colder temperatures and winter storms drove performance in Rough Plumbing & Electrical and Tools & Hardware. Geographically, 13 of 14 U.S. regions experienced increases in comparable sales.
Gross Margin
– Gross margin of
34.11%
for
2017
represented a
44
basis point
decrease
from
2016
. Gross margin was negatively impacted approximately 25 basis points due to competitive actions, approximately 10 basis points due to mix of products sold, and approximately 10 basis points due to damaged, clearance and non-productive inventory.
During the fourth quarter of
2017
, gross margin of
33.73%
decreased
68
basis points as a percentage of sales. Gross margin was negatively impacted approximately 45 basis points due to rate pressures associated with damaged, clearance and non-productive inventory, as well as competitive actions, and inflation in lumber. In addition, gross margin was negatively impacted by approximately 10 basis points due to mix of products sold and approximately 10 basis points due to higher shrink rates.
SG&A
– SG&A expense for
2017
leveraged
87
basis points as a percentage of sales compared to
2016
. This was primarily driven by 59 basis points of leverage attributable to the prior year non-cash impairment charge related to the investment in the Australian joint venture and the current year sale of our interest in the Australian joint venture, 27 basis points of leverage in operating salaries, 15 basis points of leverage primarily due to the prior year write-off of canceled technology-enabled projects, and 12 basis points of leverage associated with goodwill and long-lived asset impairments related to Orchard operations in the prior year. These were partially offset by 13 basis points of deleverage in outside delivery due to shifting a portion of our deliveries to third party providers in order to meet increased demand in Appliances, 12 basis points of deleverage due to the prior year settlement of the foreign currency option contract entered into in advance of the RONA acquisition, and 10 basis points of deleverage in risk insurance.
For the fourth quarter of
2017
, SG&A expense
deleveraged
29
basis points as a percentage of sales compared to the fourth quarter of 2016. This was primarily driven by 42 basis points of deleverage due to the one-time Tax Reform bonus, 21 basis points of deleverage in outside delivery due to a shift in our delivery strategy, and 14 basis points of deleverage in advertising as a result of our efforts to amplify consumer messaging. These were partially offset by 53 basis points of leverage associated with severance and related costs in the prior year for organizational changes in the stores, distribution centers, and corporate offices, 32 basis points in incentive compensation due to lower attainment levels compared to the prior year, and 21 basis points of leverage in employee insurance costs. Certain other costs also deleveraged as a result of the week shift related to the 53
rd
week in the prior fiscal year.
Depreciation and Amortization
– Depreciation and amortization expense
leveraged
18
basis points for
2017
compared to
2016
primarily due to the increase in sales and assets becoming fully depreciated partially offset by the incremental expense due to the acquisition of Maintenance Supply Headquarters. Property, less accumulated depreciation, decreased to
$19.7 billion
at
February 2, 2018
, compared to
$19.9 billion
at
February 3, 2017
. As of
February 2, 2018
and
February 3, 2017
, we owned
79%
of our stores, which included stores on leased land.
Depreciation and amortization expense for the fourth quarter of 2017 was flat compared to the prior year.
25
Interest – Net
– Net interest expense is comprised of the following:
|
(In millions)
|
2017
|
|
2016
|
|
|||
|
Interest expense, net of amount capitalized
|
$
|
638
|
|
$
|
647
|
|
|
|
Amortization of original issue discount and loan costs
|
11
|
|
10
|
|
|||
|
Interest income
|
(16
|
)
|
(12
|
)
|
|||
|
Interest - net
|
$
|
633
|
|
$
|
645
|
|
|
Net interest expense decreased in 2017 primarily as a result of the cash tender offer to purchase and retire $1.6 billion aggregate principal amount of our outstanding notes, the payoff of scheduled debts at maturity, and the favorable settlement of accrued interest related to uncertain tax issues. These were partially offset by the issuance of unsecured notes in April 2016 and May 2017, respectively.
Loss on Extinguishment of Debt -
During the first quarter of 2017, we repurchased and retired $1.6 billion aggregate principal amount of our outstanding debt resulting in a loss on extinguishment of debt of $464 million.
Income Tax Provision
- Our effective income tax rate was
37.2%
in
2017
compared to
40.5%
in
2016
. During 2017, the Company was impacted by the passage of the Tax Cuts and Job Act (the Tax Act), which provided a reduction in the statutory Federal rate from 35% to 21%. The effective date of January 1, 2018, resulted in the usage of a blended rate for the year of 33.7% for the Company. The new rate of 21% was applied against the Company’s deferred balances resulting in a decrease of its overall deferred tax assets. The rate was also impacted by the one-time repatriation tax enacted under Internal Revenue Code Section 965. In 2016, final and temporary regulations were issued under Internal Revenue Code Section 987, which negatively impacted the Company’s income tax rate due to the adjustment of deferred tax assets associated with cumulative currency translation adjustments related to certain of the Company’s international operations. In addition, the Company recorded a deferred tax asset related to the investment in the Australian joint venture with Woolworths associated with the non-cash impairment charges that occurred during both 2016 and 2015. The deferred tax asset associated with these losses was offset with the establishment of a full valuation allowance due to the fact the benefit of these losses can only be realized to the extent the Company has available capital gains for offset, and no present or future capital gains have been identified through which this deferred tax asset can be realized.
Our effective income tax rates were 41.3% and 40.3% for the three months ended
February 2, 2018
, and
February 3, 2017
, respectively. The increase in the effective income tax rate is primarily due to the enactment of the Tax Act effective January 1, 2018. The federal rate was lowered from 35% to 21% as part of the Tax Act, which resulted in a tax benefit of $58 million for the year. The Company remeasured its deferred tax assets and liabilities using the new federal rate, which led to a one-time tax expense of approximately $56 million to reduce the Company’s overall federal deferred tax asset. In addition, the Company recorded a $22 million provisional tax expense for the one-time transition tax on unrepatriated earnings of foreign subsidiaries.
Fiscal
2016
Compared to Fiscal
2015
For the purpose of the following discussion, comparable store sales, comparable store average ticket and comparable store customer transactions are based upon comparable 53-week periods.
Net Sales –
Net sales increased 10.1% to $65.0 billion in 2016. The increase in total sales was driven by an increase in comparable sales, the addition of RONA, the 53
rd
week, and new stores. The addition of RONA and the 53
rd
week contributed 3.8% and 1.6%, respectively, to the sales growth for 2016. The comparable sales increase of 4.2% in 2016 was driven by a 2.5% increase in comparable average ticket and a 1.6% increase in comparable customer transactions. Comparable sales during each quarter of the fiscal year, as reported, were 7.3% in the first quarter, 2.0% in the second quarter, 2.7% in the third quarter, and 5.1% in the fourth quarter.
All of our product categories experienced comparable sales increases for the year. During 2016, we experienced comparable sales increases above the company average in Lumber & Building Materials, Appliances, Tools & Hardware, and Lawn & Garden. Performance in Lumber & Building Materials and Tools & Hardware was driven by strong demand from the Pro customer. Tools & Hardware also benefited from customers’ positive response to our continued enhancements in product assortment and brand relevance. Strong brand and service advantages in Appliances, as well as our continued investment in customer experience both in-store and online, drove solid comparable sales during the year. An extended outdoor selling season as a result of favorable weather conditions, positively impacted sales within Lawn & Garden. Geographically, all of our 14 U.S. regions experienced increases in comparable store sales, with the strongest results in the South and Northwest.
26
During the fourth quarter of 2016, we experienced comparable sales increases in all of our product categories, with comparable sales increases above the company average in Appliances, Kitchens, Lawn & Garden, Lumber & Building Materials, and Rough Plumbing & Electrical. Strong brand and service advantages in Appliances as well as our successful Holiday events drove solid comparable sales during the quarter. Performance in Kitchens was driven by our strategy to focus on the entire Kitchen project, investment in project specialists, and targeted promotions. We experienced strength in several outdoor project categories, including Lawn & Garden, Lumber & Building Materials, and Rough Plumbing & Electrical. Warmer weather, particularly in the South and West, drove strong demand for outdoor projects in Lawn & Garden. Lumber & Building Materials benefited from continued recovery efforts from Hurricane Matthew and Louisiana flooding, as well as strong performance with the Pro customer.
Gross Margin
– Gross margin of 34.55% for 2016 represented a 27 basis point decrease from 2015. The change was primarily driven by 23 basis points decrease due to purchase price adjustments to RONA’s opening inventory balance, and 11 basis points decrease due to targeted promotional activity, partially offset by 9 basis points increase due to cost reductions associated with Value Improvement efforts.
During the fourth quarter of 2016, gross margin of 34.41% decreased 25 basis points as a percentage of sales. Gross margin was negatively impacted 25 basis points by the RONA business, primarily driven by purchase price adjustments to their opening inventory balance and mix of business.
SG&A
– SG&A expense for 2016 leveraged 61 basis points as a percentage of sales compared to 2015. This was primarily driven by 45 basis points of net leverage associated with impairment charges recorded during 2016 versus 2015 relating to our Australian joint venture with Woolworths. We experienced 15 basis points of leverage associated with incentive compensation, 14 basis points in employee insurance costs, and 12 basis points related to the settlement of the foreign currency option contract entered into in anticipation of the RONA acquisition. This was partially offset by 15 basis points of deleverage associated with the write-off of cancelled technology-enabled projects as part of an ongoing review of our strategic initiatives and 12 basis points associated with severance and related costs for organizational changes in the stores, distribution centers, and corporate offices.
During the fourth quarter of 2016, SG&A expense leveraged 445 basis points as a percentage of sales due primarily to 403 basis points of leverage associated with a non-cash impairment charge resulting from our decision to exit our Australian joint venture recorded in the fourth quarter of the prior year. We experienced 59 basis points of leverage in benefits primarily related to incentive compensation due to lower attainment levels compared to the same quarter of the prior year. These were partially offset by 53 basis points of deleverage associated with separation events for organizational changes in the stores, distribution centers, and corporate offices. Store environment, operating salaries, and certain other costs also leveraged as a result of sales growth.
Depreciation and Amortization
– Depreciation and amortization expense leveraged 24 basis points for 2016 compared to 2015 primarily due to the increase in sales from the 53rd week, partially offset by incremental expense due to the acquisition of RONA. Property, less accumulated depreciation, increased to $19.9 billion at February 3, 2017, compared to $19.6 billion at January 29, 2016. As of February 3, 2017, and January 29, 2016, we owned 79% and 86% of our stores, respectively, which included stores on leased land.
Interest – Net
– Net interest expense is comprised of the following:
|
(In millions)
|
2016
|
|
2015
|
|
|||
|
Interest expense, net of amount capitalized
|
$
|
647
|
|
$
|
548
|
|
|
|
Amortization of original issue discount and loan costs
|
10
|
|
8
|
|
|||
|
Interest income
|
(12
|
)
|
(4
|
)
|
|||
|
Interest - net
|
$
|
645
|
|
$
|
552
|
|
|
Net interest expense increased due primarily to an increase in total debt compared to the prior year.
Income Tax Provision
- Our effective income tax rate was 40.5% in 2016 compared to 42.4% in 2015. During 2016, the Company was impacted by the issuance of the U.S. Internal Revenue Service Internal Revenue Code Section 987, which negatively impacted the income tax rate due to the adjustment of deferred tax assets associated with
cumulative currency translation adjustments related to certain of the Company’s international operations. In addition, the Company recorded a deferred tax asset related to the investment in the Australian joint venture with Woolworths associated with the non-cash impairment charges that occurred during both 2016 and 2015. The deferred tax asset associated with these losses was offset
27
with the establishment of a full valuation allowance due to the fact the benefit of these losses can only be realized to the extent the Company has available capital gains for offset, and no present or future capital gains have been identified through which this deferred tax asset can be realized.
Our effective income tax rates were 40.3% and 96.1% for the three months ended February 3, 2017 and January 29, 2016, respectively, due to the same factors that impacted the income tax provision in the year.
FINANCIAL CONDITION, LIQUIDITY AND CAPITAL RESOURCES
Sources of Liquidity
Cash flows from operations, supplemented with our short-term and long-term borrowings, have been sufficient to fund our operations while allowing us to make strategic investments that will grow our business, and to return excess cash to shareholders in the form of dividends and share repurchases. We believe that our sources of liquidity will continue to be adequate to fund our operations and investments to grow our business, pay dividends, and fund our share repurchases over the next 12 months.
Cash Flows Provided by Operating Activities
|
(In millions)
|
2017
|
|
2016
|
|
2015
|
|
|||||
|
Net cash provided by operating activities
|
$
|
5,065
|
|
$
|
5,617
|
|
$
|
4,784
|
|
||
Cash flows from operating activities continued to provide the primary source of our liquidity. The decrease in net cash provided by operating activities for
2017
, when compared to
2016
, was driven primarily by changes in working capital and was partially offset by an increase in net earnings, adjusted for non-cash expenses.
The increase in net cash provided by operating activities for
2016
, when compared to
2015
, was driven primarily by an increase in net earnings, adjusted for non-cash expenses, and improved working capital management.
We are forecasting cash flows from operations of approximately $6.5 billion for 2018, which includes $750 million of expected incremental cash flow benefit related to the enactment of the Tax Cuts and Jobs Act of 2017.
Cash Flows Used in Investing Activities
|
(In millions)
|
2017
|
|
2016
|
|
2015
|
|
|||||
|
Net cash used in investing activities
|
$
|
(1,441
|
)
|
$
|
(3,361
|
)
|
$
|
(1,343
|
)
|
||
Net cash used in investing activities primarily consist of transactions related to capital expenditures and business acquisitions.
Capital expenditures
Our capital expenditures generally consist of investments in our existing stores, expansion plans, corporate programs, and our existing distribution network. Capital expenditures were $1.1 billion in 2017, and $1.2 billion in 2016 and 2015. The following table provides the allocation of capital expenditures for
2017
,
2016
, and
2015
:
|
2017
|
|
2016
|
|
2015
|
|
|||
|
Existing stores
|
40
|
%
|
35
|
%
|
45
|
%
|
||
|
Total expansion
|
35
|
%
|
40
|
%
|
30
|
%
|
||
|
Corporate programs
|
20
|
%
|
20
|
%
|
20
|
%
|
||
|
Existing distribution network
|
5
|
%
|
5
|
%
|
5
|
%
|
||
28
Our
2018
capital expenditures forecast is approximately $1.7 billion. The increase in our forecast, relative to historical capital expenditures, is primarily attributable to incremental cash flow benefit related to the enactment of the Tax Cuts and Jobs Act of 2017. The following table provides the allocation of our fiscal 2018 capital expenditures forecast:
|
2018
|
|
||
|
Strategic initiatives, including information technology and supply chain
|
45
|
%
|
|
|
Existing store investments, including store equipment, technology enhancements, and remerchandising
|
40
|
%
|
|
|
New stores
|
15
|
%
|
|
Business Acquisitions
We continue to seek compelling strategic investment opportunities to further expand our home improvement reach. In 2017, we paid $509 million, net of cash received, to acquire Maintenance Supply Headquarters, which is expected to enable us to deepen and broaden our relationship with the Pro customer and better serve their needs. In 2016, we used $2.3 billion, net of cash received, to acquire RONA, which enabled us to accelerate our growth strategy in the Canadian home improvement market. See Note
2
to the consolidated financial statements included herein for additional information regarding our business acquisitions.
Cash Flows Used in Financing Activities
|
(In millions)
|
2017
|
|
2016
|
|
2015
|
|
|||||
|
Net cash used in financing activities
|
$
|
(3,607
|
)
|
$
|
(2,092
|
)
|
$
|
(3,493
|
)
|
||
Net cash used in financing activities primarily consist of transactions related to our short-term borrowings, long-term debt, share repurchases, and cash dividend payments.
Short-term Borrowing Facilities
We have an unsecured revolving credit agreement with a syndicate of banks (the 2016 Credit Facility) which provides for borrowings up to $1.75 billion and supports our commercial paper program. The amount available to be drawn under the 2016 Credit Facility is reduced by the amount of borrowings under our commercial paper program. All of our short-term borrowings in
2017
,
2016
, and
2015
were under the commercial paper program. Our commercial paper program, along with cash flows generated from operations, is typically utilized during our fourth fiscal quarter to build inventory in anticipation of the spring selling season. The following table includes additional information related to our short-term borrowings for
2017
,
2016
, and
2015
:
|
(In millions, except for interest rate data)
|
2017
|
|
2016
|
|
2015
|
|
|||||
|
Amount outstanding at year-end
|
$
|
1,137
|
|
$
|
510
|
|
$
|
43
|
|
||
|
Maximum amount outstanding at any month-end
|
$
|
1,137
|
|
$
|
658
|
|
$
|
91
|
|
||
|
Weighted-average interest rate of short-term borrowings outstanding
|
1.85
|
%
|
1.01
|
%
|
0.60
|
%
|
|||||
The 2016 Credit Facility expires in November 2021 and contains customary representations, warranties, and covenants. We were in compliance with those covenants at
February 2, 2018
. Subject to obtaining commitments from the lenders and satisfying other conditions specified in the 2016 Credit Facility, the Company may increase the aggregate availability by an additional $500 million. See Note
6
to the consolidated financial statements included herein for additional information regarding our short-term borrowings.
Long-term Debt
The following table includes additional information related to the Company’s long-term debt for
2017
,
2016
, and
2015
:
|
(In millions)
|
2017
|
|
2016
|
|
2015
|
|
|||||
|
Net proceeds from issuance of long-term debt
|
$
|
2,968
|
|
$
|
3,267
|
|
$
|
1,718
|
|
||
|
Repayment of long-term debt
|
$
|
(2,849
|
)
|
$
|
(1,173
|
)
|
$
|
(552
|
)
|
||
29
In 2017, we paid approximately $2.0 billion to purchase $1.6 billion of our higher coupon notes prior to maturity in connection with a cash tender offer. We issued $3.0 billion of unsecured notes to fund the tender offer, finance current year maturities, and for other general corporate purposes, which included share repurchases, capital expenditures, strategic investments, and working capital needs.
In 2016, we issued $3.3 billion of unsecured notes to fund the acquisition of RONA, finance current year maturities, and for other general corporate purposes, which included share repurchases, capital expenditures, strategic investments, and working capital needs.
In 2015, we issued $1.75 billion of unsecured notes to finance current year maturities, and for other general corporate purposes, which included share repurchases, capital expenditures, strategic investments, and working capital needs.
Our ratio of debt to capital (equity plus debt) was 74.3% and 70.9% as of
February 2, 2018
, and
February 3, 2017
, respectively.
See Note
7
to the consolidated financial statements included herein for additional information related to our long-term debt.
Share Repurchases
We have an ongoing share repurchase program, authorized by the Company’s Board of Directors, that is executed through purchases made from time to time either in the open market or through private off-market transactions. We also withhold shares from employees to satisfy tax withholding liabilities. Shares repurchased are retired and returned to authorized and unissued status. The following table provides, on a settlement date basis, the total number of shares repurchased, average price paid per share, and the total amount paid for share repurchases for
2017
,
2016
, and
2015
:
|
(In millions, except per share data)
|
2017
|
|
2016
|
|
2015
|
|
|||||
|
Total amount paid for share repurchases
|
$
|
3,192
|
|
$
|
3,595
|
|
$
|
3,925
|
|
||
|
Total number of shares repurchased
|
39.9
|
|
48.0
|
|
55.1
|
|
|||||
|
Average price paid per share
|
$
|
80.01
|
|
$
|
74.89
|
|
$
|
71.21
|
|
||
As of
February 2, 2018
, we had
$6.9 billion
remaining under our share repurchase program with no expiration date. We expect to repurchase shares totaling $2.5 billion in 2018. See Note
8
to the consolidated financial statements included herein for additional information regarding share repurchases.
Dividends
In 2017, we increased our quarterly dividend payment 17% to $0.41 per share. Our dividend payment dates are established such that dividends are paid in the quarter immediately following the quarter in which they are declared. The following table provides additional information related to our dividend payments for
2017
,
2016
, and
2015
:
|
(In millions, except per share data and percentage data)
|
2017
|
|
2016
|
|
2015
|
|
|||||
|
Total cash dividend payments
|
$
|
1,288
|
|
$
|
1,121
|
|
$
|
957
|
|
||
|
Dividends paid per share
|
$
|
1.52
|
|
$
|
1.26
|
|
$
|
1.02
|
|
||
|
Dividend payout ratio
|
37
|
%
|
36
|
%
|
38
|
%
|
|||||
30
Capital Resources
We expect to continue to have access to the capital markets on both short-term and long-term bases when needed for liquidity purposes by issuing commercial paper or new long-term debt. The availability and the borrowing costs of these funds could be adversely affected, however, by a downgrade of our debt ratings or a deterioration of certain financial ratios. The table below reflects our debt ratings by Standard & Poor’s (S&P) and Moody’s as of
April 2, 2018
, which we are disclosing to enhance understanding of our sources of liquidity and the effect of our ratings on our cost of funds. Our debt ratings have enabled, and should continue to enable, us to refinance our debt as it becomes due at favorable rates in capital markets. Although we currently do not expect a downgrade in our debt ratings, our commercial paper and senior debt ratings may be subject to revision or withdrawal at any time by the assigning rating organization, and each rating should be evaluated independently of any other rating.
|
Debt Ratings
|
S&P
|
Moody’s
|
|
|
Commercial Paper
|
A-2
|
P-2
|
|
|
Senior Debt
|
A-
|
A3
|
|
|
Outlook
|
Stable
|
Stable
|
|
There are no provisions in any agreements that would require early cash settlement of existing debt or leases as a result of a downgrade in our debt rating or a decrease in our stock price. In addition, we do not believe it will be necessary to repatriate significant cash and cash equivalents and short-term investments held in foreign affiliates to fund domestic operations.
OFF-BALANCE SHEET ARRANGEMENTS
Other than in connection with executing operating leases, we do not have any off-balance sheet financing that has, or is reasonably likely to have, a current or future material effect on our financial condition, cash flows, results of operations, liquidity, capital expenditures or capital resources.
CONTRACTUAL OBLIGATIONS AND COMMERCIAL COMMITMENTS
The following table summarizes our significant contractual obligations at
February 2, 2018
:
|
Payments Due by Period
|
|||||||||||||||||||
|
Contractual Obligations
(in millions)
|
Total
|
|
Less Than 1 Year
|
|
1-3 Years
|
|
4-5 Years
|
|
After 5 Years
|
|
|||||||||
|
Long-term debt (principal amounts, excluding discount and debt issuance costs)
|
$
|
15,114
|
|
$
|
251
|
|
$
|
1,551
|
|
$
|
1,790
|
|
$
|
11,522
|
|
||||
|
Long-term debt (interest payments)
|
9,283
|
|
577
|
|
1,109
|
|
1,005
|
|
6,592
|
|
|||||||||
|
Capitalized lease obligations
1, 2
|
1,491
|
|
108
|
|
254
|
|
178
|
|
951
|
|
|||||||||
|
Operating leases
1
|
5,837
|
|
666
|
|
1,199
|
|
1,002
|
|
2,970
|
|
|||||||||
|
Purchase obligations
3
|
1,069
|
|
537
|
|
478
|
|
54
|
|
—
|
|
|||||||||
|
Total contractual obligations
|
$
|
32,794
|
|
$
|
2,139
|
|
$
|
4,591
|
|
$
|
4,029
|
|
$
|
22,035
|
|
||||
|
Amount of Commitment Expiration by Period
|
|||||||||||||||||||
|
Commercial Commitments
(in millions)
|
Total
|
|
Less Than 1 Year
|
|
1-3 Years
|
|
4-5 Years
|
|
After 5 Years
|
|
|||||||||
|
Letters of Credit
4
|
$
|
63
|
|
$
|
63
|
|
$
|
—
|
|
$
|
—
|
|
$
|
—
|
|
||||
|
1
|
Amounts do not include taxes, common area maintenance, insurance, or contingent rent because these amounts have historically been insignificant.
|
|
2
|
Amounts include imputed interest and residual values.
|
|
3
|
Purchase obligations include agreements to purchase goods or services that are enforceable, are legally binding, and specify all significant terms, including fixed or minimum quantities to be purchased; fixed, minimum or variable price provisions; and the approximate timing of the transaction. Our purchase obligations include firm commitments related to certain marketing and information technology programs, as well as purchases of merchandise inventory.
|
|
4
|
Letters of credit are issued primarily for insurance and construction contracts.
|
31
CRITICAL ACCOUNTING POLICIES AND ESTIMATES
The preparation of the consolidated financial statements and notes to consolidated financial statements presented in this Annual Report requires us to make estimates that affect the reported amounts of assets, liabilities, sales and expenses, and related disclosures of contingent assets and liabilities. We base these estimates on historical results and various other assumptions believed to be reasonable, all of which form the basis for making estimates concerning the carrying values of assets and liabilities that are not readily available from other sources. Actual results may differ from these estimates.
Our significant accounting policies are described in Note 1 to the consolidated financial statements. We believe that the following accounting policies affect the most significant estimates and management judgments used in preparing the consolidated financial statements.
Merchandise Inventory
Description
We record an obsolete inventory reserve for the anticipated loss associated with selling inventories below cost. This reserve is based on our current knowledge with respect to inventory levels, sales trends and historical experience. During
2017
, our reserve
increased
approximately
$18 million
to
$77 million
as of
February 2, 2018
.
We also record an inventory reserve for the estimated shrinkage between physical inventories. This reserve is based primarily on actual shrinkage results from previous physical inventories. During
2017
, the inventory shrinkage reserve
increased
approximately
$23 million
to
$212 million
as of
February 2, 2018
.
In addition, we receive funds from vendors in the normal course of business, principally as a result of purchase volumes, sales, early payments or promotions of vendors’ products. Generally, these vendor funds do not represent the reimbursement of specific, incremental and identifiable costs that we incurred to sell the vendor’s product. Therefore, we treat these funds as a reduction in the cost of inventory as the amounts are accrued, and recognize these funds as a reduction of cost of sales when the inventory is sold. Funds that are determined to be reimbursements of specific, incremental and identifiable costs incurred to sell vendors’ products are recorded as an offset to the related expense.
Judgments and uncertainties involved in the estimate
We do not believe that our merchandise inventories are subject to significant risk of obsolescence in the near term, and we have the ability to adjust purchasing practices based on anticipated sales trends and general economic conditions. However, changes in consumer purchasing patterns or a deterioration in product quality could result in the need for additional reserves. Likewise, changes in the estimated shrink reserve may be necessary, based on the timing and results of physical inventories. We also apply judgment in the determination of levels of obsolete inventory and assumptions about net realizable value.
For vendor funds, we develop accrual rates based on the provisions of the agreements in place. Due to the complexity and diversity of the individual vendor agreements, we perform analyses and review historical purchase trends and volumes throughout the year, adjust accrual rates as appropriate and confirm actual amounts with select vendors to ensure the amounts earned are appropriately recorded. Amounts accrued throughout the year could be impacted if actual purchase volumes differ from projected purchase volumes, especially in the case of programs that provide for increased funding when graduated purchase volumes are met.
Effect if actual results differ from assumptions
We have not made any material changes in the methodology used to establish our inventory valuation or the related reserves for obsolete inventory or inventory shrinkage during the past three fiscal years. We believe that we have sufficient current and historical knowledge to record reasonable estimates for both of these inventory reserves. However, it is possible that actual results could differ from recorded reserves. A 10% change in either the amount of products considered obsolete or the weighted average estimated loss rate used in the calculation of our obsolete inventory reserve would have affected net earnings by approximately $4 million for
2017
. A 10% change in the estimated shrinkage rate included in the calculation of our inventory shrinkage reserve would have affected net earnings by approximately $13 million for
2017
.
We have not made any material changes in the methodology used to recognize vendor funds during the past three fiscal years. If actual results are not consistent with the assumptions and estimates used, we could be exposed to additional adjustments that could positively or negatively impact gross margin and inventory. However, substantially all receivables associated with these activities do not require subjective long-term estimates because they are collected within the following fiscal year. Adjustments to gross margin and inventory in the following fiscal year have historically not been material.
32
Long-Lived Asset Impairment
Description
We review the carrying amounts of locations whenever certain events or changes in circumstances indicate that the carrying amounts may not be recoverable. When evaluating locations for impairment, our asset group is at an individual location level, as that is the lowest level for which cash flows are identifiable. Cash flows for individual locations do not include an allocation of corporate overhead.
We evaluate locations for triggering events relating to long-lived asset impairment on a quarterly basis to determine when a location’s asset carrying values may not be recoverable. For operating locations, our primary indicator that asset carrying values may not be recoverable is consistently negative cash flow for a 12-month period for those locations that have been open in the same location for a sufficient period of time to allow for meaningful analysis of ongoing operating results. Management also monitors other factors when evaluating operating locations for impairment, including individual locations’ execution of their operating plans and local market conditions, including incursion, which is the opening of either other Lowe’s locations or those of a direct competitor within the same market. We also consider there to be a triggering event when there is a current expectation that it is more likely than not that a given location will be closed significantly before the end of its previously estimated useful life.
A potential impairment has occurred if projected future undiscounted cash flows expected to result from the use and eventual disposition of the location’s assets are less than the carrying amount of the assets. When determining the stream of projected future cash flows associated with an individual operating location, management makes assumptions, incorporating local market conditions, about key store variables including sales growth rates, gross margin and controllable expenses, such as store payroll and occupancy expense, as well as asset residual values or lease rates. An impairment loss is recognized when the carrying amount of the operating location is not recoverable and exceeds its fair value.
We use an income approach to determine the fair value of our individual operating locations, which requires discounting projected future cash flows. This involves making assumptions regarding both a location’s future cash flows, as described above, and an appropriate discount rate to determine the present value of those future cash flows. We discount our cash flow estimates at a rate commensurate with the risk that selected market participants would assign to the cash flows. The selected market participants represent a group of other retailers with a market footprint similar in size to ours.
Judgments and uncertainties involved in the estimate
Our impairment evaluations for long-lived assets require us to apply judgment in determining whether a triggering event has occurred, including the evaluation of whether it is more likely than not that a location will be closed significantly before the end of its previously estimated useful life. Our impairment loss calculations require us to apply judgment in estimating expected future cash flows, including estimated sales, margin, and controllable expenses, assumptions about market performance for operating locations, and estimated selling prices or lease rates for locations identified for closure. We also apply judgment in estimating asset fair values, including the selection of an appropriate discount rate for fair values determined using an income approach.
Effect if actual results differ from assumptions
A 10% reduction in projected sales used to estimate future cash flows for operating locations that experienced a triggering event would not have had a significant impact to impairment losses recognized during 2017.
We have not made any material changes in the methodology used to estimate the future cash flows of operating locations or locations identified for closure during the past three fiscal years. If the actual results are not consistent with the assumptions and judgments we have made in determining whether it is more likely than not that a location will be closed significantly before the end of its useful life or in estimating future cash flows and determining asset fair values, our actual impairment losses could vary positively or negatively from our estimated impairment losses.
Goodwill
Description
Goodwill is not amortized but is evaluated for impairment at least annually on the first day of the fourth quarter or whenever events or changes in circumstances indicate that it is more likely than not that the carrying amount may not be recoverable. We test for goodwill impairment at the reporting unit level, which is one level below the operating segment level. The evaluation begins with a qualitative assessment to determine whether a quantitative impairment test is necessary. If, after assessing qualitative factors, we determine it is more likely than not that the fair value of the reporting unit is less than the carrying amount, then the two-step goodwill impairment test is necessary.
33
The first step of the goodwill impairment test used to identify potential impairment, compares the fair value of a reporting unit with its carrying amount, including goodwill. Fair value represents the price a market participant would be willing to pay in a potential sale of the reporting unit and is based on discounted future cash flows. If the fair value exceeds carrying value, then no goodwill impairment has occurred. If the carrying value of the reporting unit exceeds its fair value, a second step is required to measure possible goodwill impairment loss. The second step includes hypothetically valuing the tangible and intangible assets and liabilities of the reporting unit as if the reporting unit had been acquired in a business combination. Then, the implied fair value of the reporting unit’s goodwill is compared to the carrying value of that goodwill. If the carrying value of the reporting unit’s goodwill exceeds the implied fair value of the goodwill, we recognize an impairment loss in an amount equal to the excess, not to exceed the carrying value.
Judgments and uncertainties involved in the estimate
The determination of the fair value of the reporting units requires us to make significant estimates and assumptions, including store growth rates, existing store sales growth rates, forecasting expenses and selecting appropriate discount rates.
Effect if actual results differ from assumptions
The carrying value of goodwill as of
February 2, 2018
, was
$1.3 billion
. We do not believe there is a reasonable likelihood that there will be a material change in the future estimates or assumptions we use to test for impairment losses on goodwill. However, if actual results are not consistent with our estimates or assumptions, we may be exposed to an impairment charge that could be material.
Self-Insurance
Description
We are self-insured for certain losses relating to workers’ compensation, automobile, general and product liability, extended protection plan, and certain medical and dental claims. Our self-insured retention or deductible, as applicable, is limited to $2 million per occurrence involving workers’ compensation, $5 million per occurrence involving general or product liability, and $10 million per occurrence involving automobile. We do not have any insurance coverage for self-insured extended protection plan or medical and dental claims. Self-insurance claims filed and claims incurred but not reported are accrued based upon our estimates of the discounted ultimate cost for self-insured claims incurred using actuarial assumptions followed in the insurance industry and historical experience. During
2017
, our self-insurance liability
increased
approximately
$59 million
to
$890 million
as of
February 2, 2018
.
Judgments and uncertainties involved in the estimate
These estimates are subject to changes in the regulatory environment, utilized discount rate, projected exposures including payroll, sales and vehicle units, as well as the frequency, lag and severity of claims.
Effect if actual results differ from assumptions
We have not made any material changes in the methodology used to establish our self-insurance liability during the past three fiscal years. Although we believe that we have the ability to reasonably estimate losses related to claims, it is possible that actual results could differ from recorded self-insurance liabilities. A 10% change in our self-insurance liability would have affected net earnings by approximately $56 million for
2017
. A 100 basis point change in our discount rate would have affected net earnings by approximately $19 million for
2017
.
Revenue Recognition
Description
See Note 1 to the consolidated financial statements for a discussion of our revenue recognition policies. The following accounting estimates relating to revenue recognition require management to make assumptions and apply judgment regarding the effects of future events that cannot be determined with certainty.
We sell separately-priced extended protection plan contracts under a Lowe’s-branded program for which the Company is ultimately self-insured. The Company recognizes revenues from extended protection plan sales on a straight-line basis over the respective contract term. Extended protection plan contract terms primarily range from one to four years from the date of purchase or the end of the manufacturer’s warranty, as applicable. The Company consistently groups and evaluates extended protection plan contracts based on the characteristics of the underlying products and the coverage provided in order to monitor for expected losses. A loss on the overall contract would be recognized if the expected costs of performing services under the contracts exceeded the amount of unamortized acquisition costs and related deferred revenue associated with the contracts.
34
Deferred revenues associated with the extended protection plan contracts increased $40 million to
$803 million
as of
February 2, 2018
.
We defer revenue and cost of sales associated with settled transactions for which customers have not yet taken possession of merchandise or for which installation has not yet been completed. Revenue is deferred based on the actual amounts received. We use historical gross margin rates to estimate the adjustment to cost of sales for these transactions. During
2017
, deferred revenues associated with these transactions increased $76 million to $831 million as of
February 2, 2018
.
Judgments and uncertainties involved in the estimate
For extended protection plans, there is judgment inherent in our evaluation of expected losses as a result of our methodology for grouping and evaluating extended protection plan contracts and from the actuarial determination of the estimated cost of the contracts. There is also judgment inherent in our determination of the recognition pattern of costs of performing services under these contracts.
For the deferral of revenue and cost of sales associated with transactions for which customers have not yet taken possession of merchandise or for which installation has not yet been completed, there is judgment inherent in our estimates of gross margin rates.
Effect if actual results differ from assumptions
We have not made any material changes in the methodology used to recognize revenue on our extended protection plan contracts during the past three fiscal years. We currently do not anticipate incurring any overall contract losses on our extended protection plan contracts. Although we believe that we have the ability to adequately monitor and estimate expected losses under the extended protection plan contracts, it is possible that actual results could differ from our estimates. In addition, if future evidence indicates that the costs of performing services under these contracts are incurred on other than a straight-line basis, the timing of revenue recognition under these contracts could change. A 10% change in the amount of revenue recognized in
2017
under these contracts would have affected net earnings by approximately $23 million.
We have not made any material changes in the methodology used to reverse net sales and cost of sales related to amounts received for which customers have not yet taken possession of merchandise or for which installation has not yet been completed. We believe we have sufficient current and historical knowledge to record reasonable estimates related to the impact to cost of sales for these transactions. However, if actual results are not consistent with our estimates or assumptions, we may incur additional income or expense. A 10% change in the estimate of the gross margin rates applied to these transactions would have affected net earnings by approximately $12 million in
2017
.
DISCLOSURE REGARDING FORWARD-LOOKING STATEMENTS
We speak throughout this Annual Report in forward-looking statements about our future, but particularly in “Management’s Discussion and Analysis of Financial Condition and Results of Operations”. The words “believe,” “expect,” “will,” “should,” “suggest,” and other similar expressions are intended to identify those forward-looking statements. While we believe our expectations are reasonable, they are not guarantees of future performance. Our actual results could differ materially from our expectations.
For a detailed description of the risks and uncertainties that we are exposed to, you should read Item 1A, “Risk Factors” included elsewhere in this Annual Report. All forward-looking statements speak only as of the date of this Annual Report or, in the case of any document incorporated by reference, the date of that document. All subsequent written and oral forward-looking statements attributable to us or any person acting on our behalf are qualified by the cautionary statements in this section and in Item 1A, “Risk Factors” included elsewhere in this Annual Report. We do not undertake any obligation to update or publicly release any revisions to forward-looking statements to reflect events, circumstances or changes in expectations after the date of this Annual Report.
In addition to the risks inherent in our operations, we are exposed to certain market risks, including changes in interest rates, commodity prices and foreign currency exchange rates.
35
Interest Rate Risk
Fluctuations in interest rates do not have a material impact on our financial condition and results of operations because our long-term debt is carried at amortized cost and consists primarily of fixed-rate instruments. Therefore, providing quantitative information about interest rate risk is not meaningful for our financial instruments.
Commodity Price Risk
We purchase certain commodity products that are subject to price volatility caused by factors beyond our control. We believe that the price volatility of these products is partially mitigated by our ability to adjust selling prices. The selling prices of these commodity products are influenced, in part, by the market price we pay, which is determined by industry supply and demand.
Foreign Currency Exchange Rate Risk
Although we have international operating entities, our exposure to foreign currency rate fluctuations is not material to our financial condition and result of operations.
36
MANAGEMENT’S REPORT ON INTERNAL CONTROL OVER FINANCIAL REPORTING
Management of Lowe’s Companies, Inc. and its subsidiaries is responsible for establishing and maintaining adequate internal control over financial reporting (Internal Control) as defined in Rule 13a-15(f) under the Securities Exchange Act of 1934, as amended. Our Internal Control was designed to provide reasonable assurance to our management and the Board of Directors regarding the reliability of financial reporting and the preparation and fair presentation of published financial statements.
All internal control systems, no matter how well designed, have inherent limitations, including the possibility of human error and the circumvention or overriding of controls. Therefore, even those systems determined to be effective can provide only reasonable assurance with respect to the reliability of financial reporting and financial statement preparation and presentation. Further, because of changes in conditions, the effectiveness may vary over time.
Our management, with the participation of the Chief Executive Officer and Chief Financial Officer, evaluated the effectiveness of our Internal Control as of
February 2, 2018
. In evaluating our Internal Control, we used the criteria set forth by the Committee of Sponsoring Organizations of the Treadway Commission (COSO) in Internal Control—Integrated Framework (2013). Based on our management’s assessment, we have concluded that, as of
February 2, 2018
, our Internal Control is effective.
Under guidelines established by the SEC, companies are permitted to exclude acquisitions from their first assessment of internal control over financial reporting following the date of acquisition. Management’s assessment of the effectiveness of the Company’s internal control over financial reporting excluded Maintenance Supply Headquarters, a wholly owned subsidiary of Lowe’s Companies Inc. that consisted of the net assets purchased from Maintenance Supply Headquarters in June 2017. Maintenance Supply Headquarters represented 1.5% and 0.3% of the Company’s consolidated total assets and consolidated net sales, respectively, as of and for the year ended
February 2, 2018
. This acquisition is more fully discussed in Note 2 to our Consolidated Financial Statements for fiscal year 2017.
Deloitte & Touche LLP, the independent registered public accounting firm that audited the financial statements contained in this Annual Report, was engaged to audit our Internal Control. Their report appears on page 39.
37
REPORT OF INDEPENDENT REGISTERED PUBLIC ACCOUNTING FIRM
To the Board of Directors and Shareholders of Lowe’s Companies, Inc.
Opinion on the Financial Statements
We have audited the accompanying consolidated balance sheets of Lowe’s Companies, Inc. and subsidiaries (the “Company”) as of
February 2, 2018
and
February 3, 2017
, the related consolidated statements of earnings, comprehensive income, shareholders’ equity, and cash flows for each of the three fiscal years in the period ended
February 2, 2018
, and the related notes and the schedule listed in the Index at Item 15 (collectively referred to as the “financial statements”). In our opinion, the financial statements present fairly, in all material respects, the financial position of the Company as of
February 2, 2018
and
February 3, 2017
, and the results of its operations and its cash flows for each of the three fiscal years in the period ended
February 2, 2018
in conformity with accounting principles generally accepted in the United States of America.
We have also audited, in accordance with the standards of the Public Company Accounting Oversight Board (United States) (PCAOB), the Company's internal control over financial reporting as of
February 2, 2018
, based on criteria established in
Internal Control - Integrated Framework (2013)
issued by the Committee of Sponsoring Organizations of the Treadway Commission and our report dated
April 2, 2018
, expressed an unqualified opinion on the Company's internal control over financial reporting.
Basis for Opinion
These financial statements are the responsibility of the Company's management. Our responsibility is to express an opinion on the Company's financial statements based on our audits. We are a public accounting firm registered with the PCAOB and are required to be independent with respect to the Company in accordance with the U.S. federal securities laws and the applicable rules and regulations of the Securities and Exchange Commission and the PCAOB.
We conducted our audits in accordance with the standards of the PCAOB. Those standards require that we plan and perform the audit to obtain reasonable assurance about whether the financial statements are free of material misstatement, whether due to error or fraud. Our audits included performing procedures to assess the risks of material misstatement of the financial statements, whether due to error or fraud, and performing procedures that respond to those risks. Such procedures included examining, on a test basis, evidence regarding the amounts and disclosures in the financial statements. Our audits also included evaluating the accounting principles used and significant estimates made by management, as well as evaluating the overall presentation of the financial statements. We believe that our audits provide a reasonable basis for our opinion.
/s/ DELOITTE & TOUCHE LLP
Charlotte, North Carolina
April 2, 2018
We have served as the Company's auditor since 1962.
38
REPORT OF INDEPENDENT REGISTERED PUBLIC ACCOUNTING FIRM
To the Board of Directors and Shareholders of Lowe’s Companies, Inc.
Opinion on Internal Control over Financial Reporting
We have audited the internal control over financial reporting of Lowe’s Companies, Inc. and subsidiaries (the “Company”) as of
February 2, 2018
, based on criteria established in
Internal Control - Integrated Framework (2013)
issued by the Committee of Sponsoring Organizations of the Treadway Commission (COSO). In our opinion, the Company maintained, in all material respects, effective internal control over financial reporting as of
February 2, 2018
, based on criteria established in
Internal Control - Integrated Framework (2013)
issued by COSO.
We have also audited, in accordance with the standards of the Public Company Accounting Oversight Board (United States) (PCAOB), the consolidated financial statements and financial statement schedule as of and for the fiscal year ended
February 2, 2018
of the Company and our report dated
April 2, 2018
, expressed an unqualified opinion on those financial statements.
As described in Management’s Report on Internal Control over Financial Reporting, management excluded from its assessment the internal control over financial reporting at Maintenance Supply Headquarters, which was acquired on June 23, 2017 and whose financial statements constitute 1.5% and 0.3% of the Company’s consolidated total assets and consolidated net sales, respectively, as of and for the fiscal year ended
February 2, 2018
. Accordingly, our audit did not include the internal control over financial reporting at Maintenance Supply Headquarters.
Basis for Opinion
The Company’s management is responsible for maintaining effective internal control over financial reporting and for its assessment of the effectiveness of internal control over financial reporting, included in the accompanying Management’s Report on Internal Control over Financial Reporting. Our responsibility is to express an opinion on the Company’s internal control over financial reporting based on our audit. We are a public accounting firm registered with the PCAOB and are required to be independent with respect to the Company in accordance with the U.S. federal securities laws and the applicable rules and regulations of the Securities and Exchange Commission and the PCAOB.
We conducted our audit in accordance with the standards of the PCAOB. Those standards require that we plan and perform the audit to obtain reasonable assurance about whether effective internal control over financial reporting was maintained in all material respects. Our audit included obtaining an understanding of internal control over financial reporting, assessing the risk that a material weakness exists, testing and evaluating the design and operating effectiveness of internal control based on the assessed risk, and performing such other procedures as we considered necessary in the circumstances. We believe that our audit provides a reasonable basis for our opinion.
Definition and Limitations of Internal Control over Financial Reporting
A company’s internal control over financial reporting is a process designed to provide reasonable assurance regarding the reliability of financial reporting and the preparation of financial statements for external purposes in accordance with generally accepted accounting principles. A company’s internal control over financial reporting includes those policies and procedures that (1) pertain to the maintenance of records that, in reasonable detail, accurately and fairly reflect the transactions and dispositions of the assets of the company; (2) provide reasonable assurance that transactions are recorded as necessary to permit preparation of financial statements in accordance with generally accepted accounting principles, and that receipts and expenditures of the company are being made only in accordance with authorizations of management and directors of the company; and (3) provide reasonable assurance regarding prevention or timely detection of unauthorized acquisition, use, or disposition of the company’s assets that could have a material effect on the financial statements.
Because of its inherent limitations, internal control over financial reporting may not prevent or detect misstatements. Also, projections of any evaluation of effectiveness to future periods are subject to the risk that controls may become inadequate because of changes in conditions, or that the degree of compliance with the policies or procedures may deteriorate.
/s/ DELOITTE & TOUCHE LLP
Charlotte, North Carolina
April 2, 2018
39
Lowe’s Companies, Inc.
(In millions, except per share and percentage data)
|
February 2, 2018
|
|
% Sales
|
|
February 3, 2017
|
|
% Sales
|
|
January 29, 2016
|
|
% Sales
|
|
|||||||||
|
Fiscal years ended on
|
||||||||||||||||||||
|
Net sales
|
$
|
68,619
|
|
100.00
|
%
|
$
|
65,017
|
|
100.00
|
%
|
$
|
59,074
|
|
100.00
|
%
|
|||||
|
Cost of sales
|
45,210
|
|
65.89
|
|
42,553
|
|
65.45
|
|
38,504
|
|
65.18
|
|
||||||||
|
Gross margin
|
23,409
|
|
34.11
|
|
22,464
|
|
34.55
|
|
20,570
|
|
34.82
|
|
||||||||
|
Expenses:
|
||||||||||||||||||||
|
Selling, general and administrative
|
15,376
|
|
22.40
|
|
15,129
|
|
23.27
|
|
14,105
|
|
23.88
|
|
||||||||
|
Depreciation and amortization
|
1,447
|
|
2.11
|
|
1,489
|
|
2.29
|
|
1,494
|
|
2.53
|
|
||||||||
|
Operating income
|
6,586
|
|
9.60
|
|
5,846
|
|
8.99
|
|
4,971
|
|
8.41
|
|
||||||||
|
Interest - net
|
633
|
|
0.92
|
|
645
|
|
0.99
|
|
552
|
|
0.93
|
|
||||||||
|
Loss on extinguishment of debt
|
464
|
|
0.68
|
|
—
|
|
—
|
|
—
|
|
—
|
|
||||||||
|
Pre-tax earnings
|
5,489
|
|
8.00
|
|
5,201
|
|
8.00
|
|
4,419
|
|
7.48
|
|
||||||||
|
Income tax provision
|
2,042
|
|
2.98
|
|
2,108
|
|
3.24
|
|
1,873
|
|
3.17
|
|
||||||||
|
Net earnings
|
$
|
3,447
|
|
5.02
|
%
|
$
|
3,093
|
|
4.76
|
%
|
$
|
2,546
|
|
4.31
|
%
|
|||||
|
Basic earnings per common share
|
$
|
4.09
|
|
$
|
3.48
|
|
$
|
2.73
|
|
|||||||||||
|
Diluted earnings per common share
|
$
|
4.09
|
|
$
|
3.47
|
|
$
|
2.73
|
|
|||||||||||
|
Cash dividends per share
|
$
|
1.58
|
|
$
|
1.33
|
|
$
|
1.07
|
|
|||||||||||
Lowe’s Companies, Inc.
Consolidated Statements of Comprehensive Income
(In millions, except percentage data)
|
February 2, 2018
|
|
% Sales
|
|
February 3, 2017
|
|
% Sales
|
|
January 29, 2016
|
|
% Sales
|
|
|||||||||
|
Fiscal years ended on
|
||||||||||||||||||||
|
Net earnings
|
$
|
3,447
|
|
5.02
|
%
|
$
|
3,093
|
|
4.76
|
%
|
$
|
2,546
|
|
4.31
|
%
|
|||||
|
Foreign currency translation adjustments - net of tax
|
251
|
|
0.37
|
|
154
|
|
0.23
|
|
(291
|
)
|
(0.49
|
)
|
||||||||
|
Other comprehensive income/(loss)
|
251
|
|
0.37
|
|
154
|
|
0.23
|
|
(291
|
)
|
(0.49
|
)
|
||||||||
|
Comprehensive income
|
$
|
3,698
|
|
5.39
|
%
|
$
|
3,247
|
|
4.99
|
%
|
$
|
2,255
|
|
3.82
|
%
|
|||||
See accompanying notes to consolidated financial statements.
40
Lowe’s Companies, Inc.
(In millions, except par value)
|
February 2, 2018
|
|
February 3, 2017
|
|
||||||
|
Assets
|
|||||||||
|
Current assets:
|
|||||||||
|
Cash and cash equivalents
|
$
|
588
|
|
$
|
558
|
|
|||
|
Short-term investments
|
102
|
|
100
|
|
|||||
|
Merchandise inventory - net
|
11,393
|
|
10,458
|
|
|||||
|
Other current assets
|
689
|
|
884
|
|
|||||
|
Total current assets
|
12,772
|
|
12,000
|
|
|||||
|
Property, less accumulated depreciation
|
19,721
|
|
19,949
|
|
|||||
|
Long-term investments
|
408
|
|
366
|
|
|||||
|
Deferred income taxes - net
|
168
|
|
222
|
|
|||||
|
Goodwill
|
1,307
|
|
1,082
|
|
|||||
|
Other assets
|
915
|
|
789
|
|
|||||
|
Total assets
|
$
|
35,291
|
|
$
|
34,408
|
|
|||
|
Liabilities and shareholders’ equity
|
|||||||||
|
Current liabilities:
|
|||||||||
|
Short-term borrowings
|
$
|
1,137
|
|
$
|
510
|
|
|||
|
Current maturities of long-term debt
|
294
|
|
795
|
|
|||||
|
Accounts payable
|
6,590
|
|
6,651
|
|
|||||
|
Accrued compensation and employee benefits
|
747
|
|
790
|
|
|||||
|
Deferred revenue
|
1,378
|
|
1,253
|
|
|||||
|
Other current liabilities
|
1,950
|
|
1,975
|
|
|||||
|
Total current liabilities
|
12,096
|
|
11,974
|
|
|||||
|
Long-term debt, excluding current maturities
|
15,564
|
|
14,394
|
|
|||||
|
Deferred revenue - extended protection plans
|
803
|
|
763
|
|
|||||
|
Other liabilities
|
955
|
|
843
|
|
|||||
|
Total liabilities
|
29,418
|
|
27,974
|
|
|||||
|
Commitments and contingencies
|
|
|
|||||||
|
Shareholders’ equity:
|
|||||||||
|
Preferred stock - $5 par value, none issued
|
—
|
|
—
|
|
|||||
|
Common stock - $.50 par value;
|
|
|
|
|
|||||
|
Shares issued and outstanding
|
|||||||||
|
February 2, 2018
|
830
|
||||||||
|
February 3, 2017
|
866
|
415
|
|
433
|
|
||||
|
Capital in excess of par value
|
22
|
|
—
|
|
|||||
|
Retained earnings
|
5,425
|
|
6,241
|
|
|||||
|
Accumulated other comprehensive income/(loss)
|
11
|
|
(240
|
)
|
|||||
|
Total shareholders’ equity
|
5,873
|
|
6,434
|
|
|||||
|
Total liabilities and shareholders’ equity
|
$
|
35,291
|
|
$
|
34,408
|
|
|||
See accompanying notes to consolidated financial statements.
41
Lowe’s Companies, Inc.
Consolidated Statements of Shareholders’ Equity
(In millions)
|
Common Stock
|
Capital in Excess
of Par Value |
|
Retained Earnings
|
|
Accumulated Other Comprehensive
Income/(Loss) |
|
Total Lowe’s Companies, Inc.
Shareholders’ Equity |
|
Noncontrolling
Interest |
|
Total
Equity |
|
||||||||||||||||||
|
Shares
|
|
Amount
|
|
|||||||||||||||||||||||||||
|
Balance January 30, 2015
|
960
|
|
$
|
480
|
|
$
|
—
|
|
$
|
9,591
|
|
$
|
(103
|
)
|
$
|
9,968
|
|
$
|
—
|
|
$
|
9,968
|
|
|||||||
|
Net earnings
|
2,546
|
|
2,546
|
|
2,546
|
|
||||||||||||||||||||||||
|
Other comprehensive loss
|
(291
|
)
|
(291
|
)
|
(291
|
)
|
||||||||||||||||||||||||
|
Tax effect of non-qualified stock options exercised and restricted stock vested
|
61
|
|
61
|
|
61
|
|
||||||||||||||||||||||||
|
Cash dividends declared, $1.07 per share
|
(991
|
)
|
(991
|
)
|
(991
|
)
|
||||||||||||||||||||||||
|
Share-based payment expense
|
112
|
|
112
|
|
112
|
|
||||||||||||||||||||||||
|
Repurchase of common stock
|
(54
|
)
|
(27
|
)
|
(298
|
)
|
(3,553
|
)
|
(3,878
|
)
|
(3,878
|
)
|
||||||||||||||||||
|
Issuance of common stock under share-based payment plans
|
4
|
|
2
|
|
125
|
|
127
|
|
127
|
|
||||||||||||||||||||
|
Balance January 29, 2016
|
910
|
|
$
|
455
|
|
$
|
—
|
|
$
|
7,593
|
|
$
|
(394
|
)
|
$
|
7,654
|
|
$
|
—
|
|
$
|
7,654
|
|
|||||||
|
Net earnings
|
3,091
|
|
3,091
|
|
2
|
|
3,093
|
|
||||||||||||||||||||||
|
Other comprehensive income
|
154
|
|
154
|
|
154
|
|
||||||||||||||||||||||||
|
Tax effect of non-qualified stock options exercised and restricted stock vested
|
57
|
|
57
|
|
57
|
|
||||||||||||||||||||||||
|
Cash dividends declared, $1.33 per share
|
(1,169
|
)
|
(1,169
|
)
|
(1,169
|
)
|
||||||||||||||||||||||||
|
Share-based payment expense
|
104
|
|
104
|
|
104
|
|
||||||||||||||||||||||||
|
Repurchase of common stock
|
(48
|
)
|
(24
|
)
|
(279
|
)
|
(3,274
|
)
|
(3,577
|
)
|
(3,577
|
)
|
||||||||||||||||||
|
Issuance of common stock under share-based payment plans
|
4
|
|
2
|
|
136
|
|
138
|
|
138
|
|
||||||||||||||||||||
|
Noncontrolling interest resulting from acquisition
|
—
|
|
109
|
|
109
|
|
||||||||||||||||||||||||
|
Dividends paid to noncontrolling interest holders
|
—
|
|
(2
|
)
|
(2
|
)
|
||||||||||||||||||||||||
|
Purchase of noncontrolling interest
|
(18
|
)
|
(18
|
)
|
(109
|
)
|
(127
|
)
|
||||||||||||||||||||||
|
Balance February 3, 2017
|
866
|
|
$
|
433
|
|
$
|
—
|
|
$
|
6,241
|
|
$
|
(240
|
)
|
$
|
6,434
|
|
$
|
—
|
|
$
|
6,434
|
|
|||||||
|
Net earnings
|
3,447
|
|
3,447
|
|
3,447
|
|
||||||||||||||||||||||||
|
Other comprehensive income
|
251
|
|
251
|
|
251
|
|
||||||||||||||||||||||||
|
Cash dividends declared, $1.58 per share
|
(1,324
|
)
|
(1,324
|
)
|
(1,324
|
)
|
||||||||||||||||||||||||
|
Share-based payment expense
|
99
|
|
99
|
|
99
|
|
||||||||||||||||||||||||
|
Repurchase of common stock
|
(40
|
)
|
(20
|
)
|
(215
|
)
|
(2,939
|
)
|
(3,174
|
)
|
(3,174
|
)
|
||||||||||||||||||
|
Issuance of common stock under share-based payment plans
|
4
|
|
2
|
|
138
|
|
140
|
|
140
|
|
||||||||||||||||||||
|
Balance February 2, 2018
|
830
|
|
$
|
415
|
|
$
|
22
|
|
$
|
5,425
|
|
$
|
11
|
|
$
|
5,873
|
|
$
|
—
|
|
$
|
5,873
|
|
|||||||
See accompanying notes to consolidated financial statements.
42
Lowe’s Companies, Inc.
(In millions)
|
February 2, 2018
|
|
February 3, 2017
|
|
January 29, 2016
|
|
||||||
|
Fiscal years ended on
|
|||||||||||
|
Cash flows from operating activities:
|
|||||||||||
|
Net earnings
|
$
|
3,447
|
|
$
|
3,093
|
|
$
|
2,546
|
|
||
|
Adjustments to reconcile net earnings to net cash provided by operating activities:
|
|||||||||||
|
Depreciation and amortization
|
1,540
|
|
1,590
|
|
1,587
|
|
|||||
|
Deferred income taxes
|
53
|
|
28
|
|
(68
|
)
|
|||||
|
Loss on property and other assets - net
|
40
|
|
143
|
|
30
|
|
|||||
|
Loss on extinguishment of debt
|
464
|
|
—
|
|
—
|
|
|||||
|
(Gain) loss on cost method and equity method investments
|
(82
|
)
|
302
|
|
594
|
|
|||||
|
Share-based payment expense
|
99
|
|
90
|
|
117
|
|
|||||
|
Changes in operating assets and liabilities:
|
|||||||||||
|
Merchandise inventory – net
|
(791
|
)
|
(178
|
)
|
(582
|
)
|
|||||
|
Other operating assets
|
250
|
|
(183
|
)
|
(34
|
)
|
|||||
|
Accounts payable
|
(92
|
)
|
653
|
|
524
|
|
|||||
|
Other operating liabilities
|
137
|
|
79
|
|
70
|
|
|||||
|
Net cash provided by operating activities
|
5,065
|
|
5,617
|
|
4,784
|
|
|||||
|
Cash flows from investing activities:
|
|||||||||||
|
Purchases of investments
|
(981
|
)
|
(1,192
|
)
|
(934
|
)
|
|||||
|
Proceeds from sale/maturity of investments
|
1,114
|
|
1,254
|
|
884
|
|
|||||
|
Capital expenditures
|
(1,123
|
)
|
(1,167
|
)
|
(1,197
|
)
|
|||||
|
Contributions to equity method investments – net
|
—
|
|
—
|
|
(125
|
)
|
|||||
|
Proceeds from sale of property and other long-term assets
|
45
|
|
37
|
|
57
|
|
|||||
|
Purchases of derivative instruments
|
—
|
|
(103
|
)
|
—
|
|
|||||
|
Proceeds from settlement of derivative instruments
|
—
|
|
179
|
|
—
|
|
|||||
|
Acquisition of business - net
|
(509
|
)
|
(2,356
|
)
|
—
|
|
|||||
|
Other – net
|
13
|
|
(13
|
)
|
(28
|
)
|
|||||
|
Net cash used in investing activities
|
(1,441
|
)
|
(3,361
|
)
|
(1,343
|
)
|
|||||
|
Cash flows from financing activities:
|
|||||||||||
|
Net change in short-term borrowings
|
625
|
|
466
|
|
43
|
|
|||||
|
Net proceeds from issuance of long-term debt
|
2,968
|
|
3,267
|
|
1,718
|
|
|||||
|
Repayment of long-term debt
|
(2,849
|
)
|
(1,173
|
)
|
(552
|
)
|
|||||
|
Proceeds from issuance of common stock under share-based payment plans
|
139
|
|
139
|
|
125
|
|
|||||
|
Cash dividend payments
|
(1,288
|
)
|
(1,121
|
)
|
(957
|
)
|
|||||
|
Repurchase of common stock
|
(3,192
|
)
|
(3,595
|
)
|
(3,925
|
)
|
|||||
|
Other – net
|
(10
|
)
|
(75
|
)
|
55
|
|
|||||
|
Net cash used in financing activities
|
(3,607
|
)
|
(2,092
|
)
|
(3,493
|
)
|
|||||
|
Effect of exchange rate changes on cash
|
13
|
|
(11
|
)
|
(9
|
)
|
|||||
|
Net increase/(decrease) in cash and cash equivalents
|
30
|
|
153
|
|
(61
|
)
|
|||||
|
Cash and cash equivalents, beginning of year
|
558
|
|
405
|
|
466
|
|
|||||
|
Cash and cash equivalents, end of year
|
$
|
588
|
|
$
|
558
|
|
$
|
405
|
|
||
See accompanying notes to consolidated financial statements.
43
NOTES TO CONSOLIDATED FINANCIAL STATEMENTS
YEARS ENDED
FEBRUARY 2, 2018
,
FEBRUARY 3, 2017
AND
JANUARY 29, 2016
NOTE
1
: Summary of Significant Accounting Policies
Lowe’s Companies, Inc. and subsidiaries (the Company) is the world’s second-largest home improvement retailer and operated
2,152
stores in the United States, Canada, and Mexico at
February 2, 2018
. Below are those accounting policies considered by the Company to be significant.
Fiscal Year -
The Company’s fiscal year ends on the Friday nearest the end of January. Fiscal years 2017 and 2015 each contained 52 weeks and fiscal 2016 contained 53 weeks. All references herein for the years
2017
,
2016
, and
2015
represent the fiscal years ended
February 2, 2018
,
February 3, 2017
, and
January 29, 2016
, respectively.
Principles of Consolidation
- The consolidated financial statements include the accounts of the Company and its wholly-owned or controlled operating subsidiaries. All intercompany accounts and transactions have been eliminated.
Foreign Currency
- The functional currencies of the Company’s international subsidiaries are generally the local currencies of the countries in which the subsidiaries are located. Foreign currency denominated assets and liabilities are translated into U.S. dollars using the exchange rates in effect at the balance sheet date. Results of operations and cash flows are translated using the average exchange rates throughout the period. The effect of exchange rate fluctuations on translation of assets and liabilities is included as a component of shareholders’ equity in accumulated other comprehensive income/loss. Gains and losses from foreign currency transactions are included in selling, general and administrative (SG&A) expense.
Use of Estimates
- The preparation of the Company’s financial statements in accordance with accounting principles generally accepted in the United States of America requires management to make estimates that affect the reported amounts of assets, liabilities, sales and expenses, and related disclosures of contingent assets and liabilities. The Company bases these estimates on historical results and various other assumptions believed to be reasonable, all of which form the basis for making estimates concerning the carrying values of assets and liabilities that are not readily available from other sources. Actual results may differ from these estimates.
Cash and Cash Equivalents
- Cash and cash equivalents include cash on hand, demand deposits, and short-term investments with original maturities of three months or less when purchased. Cash and cash equivalents are carried at amortized cost on the consolidated balance sheets. The majority of payments due from financial institutions for the settlement of credit card and debit card transactions process within two business days and are, therefore, classified as cash and cash equivalents.
Investments
- Investments generally consist of money market funds, municipal obligations, certificates of deposit, and municipal floating rate obligations, all of which are classified as available-for-sale. Available-for-sale securities are recorded at fair value, and unrealized gains and losses are recorded, net of tax, as a component of accumulated other comprehensive income/loss. Gross unrealized gains and losses were insignificant at
February 2, 2018
and
February 3, 2017
.
The proceeds from sales of available-for-sale securities were
$523 million
,
$505 million
, and
$394 million
for
2017
,
2016
, and
2015
, respectively. Gross realized gains and losses on the sale of available-for-sale securities were not significant for any of the periods presented.
Investments with a stated maturity date of one year or less from the balance sheet date or that are expected to be used in current operations are classified as short-term investments. All other investments are classified as long-term. Investments classified as long-term at
February 2, 2018
, will mature in
one
to
37
years, based on stated maturity dates.
The Company classifies as investments restricted balances primarily pledged as collateral for the Company’s extended protection plan program. Restricted balances included in short-term investments were
$86 million
at
February 2, 2018
, and
$81 million
at
February 3, 2017
. Restricted balances included in long-term investments were
$381 million
at
February 2, 2018
, and
$354 million
at
February 3, 2017
.
Merchandise Inventory
- The majority of the Company’s inventory is stated at the lower of cost and net realizable value using the first-in, first-out method of inventory accounting. Inventory for certain subsidiaries representing approximately
10%
and
8%
of the consolidated inventory balances as of
February 2, 2018
and
February 3, 2017
, respectively, are stated at lower of cost and net realizable value using other inventory methods, including the weighted average cost method and the retail inventory method. The cost of inventory includes certain costs associated with the preparation of inventory for resale, including distribution center costs, and is net of vendor funds.
44
The Company records an inventory reserve for the anticipated loss associated with selling inventories below cost. This reserve is based on management’s current knowledge with respect to inventory levels, sales trends, and historical experience. Management does not believe the Company’s merchandise inventories are subject to significant risk of obsolescence in the near term, and management has the ability to adjust purchasing practices based on anticipated sales trends and general economic conditions. However, changes in consumer purchasing patterns could result in the need for additional reserves. The Company also records an inventory reserve for the estimated shrinkage between physical inventories. This reserve is based primarily on actual shrink results from previous physical inventories. Changes in the estimated shrink reserve are made based on the timing and results of physical inventories.
The Company receives funds from vendors in the normal course of business, principally as a result of purchase volumes, sales, early payments, or promotions of vendors’ products. Generally, these vendor funds do not represent the reimbursement of specific, incremental, and identifiable costs incurred by the Company to sell the vendor’s product. Therefore, the Company treats these funds as a reduction in the cost of inventory, and are recognized as a reduction of cost of sales when the inventory is sold. Funds that are determined to be reimbursements of specific, incremental, and identifiable costs incurred to sell vendors’ products are recorded as an offset to the related expense. The Company develops accrual rates for vendor funds based on the provisions of the agreements in place. Due to the complexity and diversity of the individual vendor agreements, the Company performs analyses and reviews historical trends throughout the year and confirms actual amounts with select vendors to ensure the amounts earned are appropriately recorded. Amounts accrued throughout the year could be impacted if actual purchase volumes differ from projected annual purchase volumes, especially in the case of programs that provide for increased funding when graduated purchase volumes are met.
Credit Programs
- The Company has an agreement with Synchrony Bank (Synchrony), formerly GE Capital Retail, under which Synchrony purchases at face value commercial business accounts receivable originated by the Company and services these accounts. This agreement expires in December 2023, unless terminated sooner by the parties. The Company primarily accounts for these transfers as sales of the accounts receivable. When the Company transfers its commercial business accounts receivable, it retains certain interests in those receivables, including the funding of a loss reserve and its obligation related to Synchrony’s ongoing servicing of the receivables sold. Any gain or loss on the sale is determined based on the previous carrying amounts of the transferred assets allocated at fair value between the receivables sold and the interests retained. Fair value is based on the present value of expected future cash flows, taking into account the key assumptions of anticipated credit losses, payment rates, late fee rates, Synchrony’s servicing costs, and the discount rate commensurate with the uncertainty involved. Due to the short-term nature of the receivables sold, changes to the key assumptions would not materially impact the recorded gain or loss on the sales of receivables or the fair value of the retained interests in the receivables.
Total commercial business accounts receivable sold to Synchrony were
$3.1 billion
in
2017
,
$2.8 billion
in
2016
, and
$2.6 billion
in
2015
. The Company recognized losses of
$39 million
in
2017
,
$32 million
in
2016
, and
$36 million
in
2015
on these receivable sales as SG&A expense, which primarily relates to the fair value of obligations related to servicing costs that are remitted to Synchrony monthly. At
February 2, 2018
and
February 3, 2017
, the fair value of the retained interests was determined based on the present value of expected future cash flows and was insignificant.
Sales generated through the Company’s proprietary credit cards are not reflected in receivables. Under an agreement with Synchrony, credit is extended directly to customers by Synchrony. All credit program-related services are performed and controlled directly by Synchrony. The Company has the option, but no obligation, to purchase the receivables at the end of the agreement in December 2023. Tender costs, including amounts associated with accepting the Company’s proprietary credit cards, are included in SG&A expense in the consolidated statements of earnings.
The total portfolio of receivables held by Synchrony, including both receivables originated by Synchrony from the Company’s proprietary credit cards and commercial business accounts receivable originated by the Company and sold to Synchrony, approximated
$10.2 billion
at
February 2, 2018
, and
$9.6 billion
at
February 3, 2017
.
Property and Depreciation
- Property is recorded at cost. Costs associated with major additions are capitalized and depreciated. Capital assets are expected to yield future benefits and have original useful lives which exceed one year. The total cost of a capital asset generally includes all applicable sales taxes, delivery costs, installation costs, and other appropriate costs incurred by the Company, including interest in the case of self-constructed assets. Upon disposal, the cost of properties and related accumulated depreciation is removed from the accounts, with gains and losses reflected in SG&A expense in the consolidated statements of earnings.
Property consists of land, buildings and building improvements, equipment, and construction in progress. Buildings and building improvements includes owned buildings, as well as buildings under capital lease and leasehold improvements.
45
Equipment primarily includes store racking and displays, computer hardware and software, forklifts, vehicles, and other store equipment
.
Depreciation is provided over the estimated useful lives of the depreciable assets. Assets are depreciated using the straight-line method. Leasehold improvements and assets under capital lease are depreciated over the shorter of their estimated useful lives or the term of the related lease, which may include one or more option renewal periods where failure to exercise such options would result in an economic penalty in such amount that renewal appears, at the inception of the lease, to be reasonably assured. During the term of a lease, if leasehold improvements are placed in service significantly after the inception of the lease, the Company depreciates these leasehold improvements over the shorter of the useful life of the leasehold assets or a term that includes lease renewal periods deemed to be reasonably assured at the time the leasehold improvements are placed into service. The amortization of these assets is included in depreciation expense in the consolidated financial statements.
Long-Lived Asset Impairment/Exit Activities
-
The carrying amounts of long-lived assets are reviewed whenever certain events or changes in circumstances indicate that the carrying amounts may not be recoverable. A potential impairment has occurred for long-lived assets held-for-use if projected future undiscounted cash flows expected to result from the use and eventual disposition of the assets are less than the carrying amounts of the assets. An impairment loss is recorded for long-lived assets held-for-use when the carrying amount of the asset is not recoverable and exceeds its fair value.
Excess properties that are expected to be sold within the next 12 months and meet the other relevant held-for-sale criteria are classified as long-lived assets held-for-sale. Excess properties consist primarily of retail outparcels and property associated with relocated or closed locations. An impairment loss is recorded for long-lived assets held-for-sale when the carrying amount of the asset exceeds its fair value less cost to sell. A long-lived asset is not depreciated while it is classified as held-for-sale.
For long-lived assets to be abandoned, the Company considers the asset to be disposed of when it ceases to be used. Until it ceases to be used, the Company continues to classify the asset as held-for-use and tests for potential impairment accordingly. If the Company commits to a plan to abandon a long-lived asset before the end of its previously estimated useful life, its depreciable life is re-evaluated.
Impairment losses are included in SG&A expense in the consolidated statements of earnings. Fair value measurements associated with long-lived asset impairments are further described in Note
4
to the consolidated financial statements.
When locations under operating leases are closed, a liability is recognized for the fair value of future contractual obligations, including future minimum lease payments, property taxes, utilities, common area maintenance, and other ongoing expenses, net of estimated sublease income and other recoverable items. When the Company commits to an exit plan and communicates that plan to affected employees, a liability is recognized in connection with one-time employee termination benefits. Subsequent changes to the liabilities, including a change resulting from a revision to either the timing or the amount of estimated cash flows, are recognized in the period of change. Expenses associated with exit activities are included in SG&A expense in the consolidated statement of earnings. Amounts accrued for exit activities were not material for any of the periods presented.
Goodwill
- Goodwill is the excess of the purchase price over the fair value of identifiable assets acquired, less liabilities assumed, in a business combination. The Company reviews goodwill for impairment at the reporting unit level, which is one level below the operating segment level. Goodwill is not amortized but is evaluated for impairment at least annually on the first day of the fourth quarter or whenever events or changes in circumstances indicate that it is more likely than not that the carrying amount may not be recoverable. The evaluation begins with a qualitative assessment to determine whether a quantitative impairment test is necessary. If, after assessing qualitative factors, we determine it is more likely than not that the fair value of the reporting unit is less than the carrying amount, then the two-step goodwill impairment test is necessary.
The first step of the goodwill impairment test used to identify potential impairment compares the fair value of a reporting unit with its carrying amount, including goodwill. Fair value represents the price a market participant would be willing to pay in a potential sale of the reporting unit and is based on discounted future cash flows. If the fair value exceeds carrying value, then no goodwill impairment has occurred. If the carrying value of the reporting unit exceeds its fair value, a second step is required to measure possible goodwill impairment loss. The second step includes hypothetically valuing the tangible and intangible assets and liabilities of the reporting unit as if the reporting unit had been acquired in a business combination. Then, the implied fair value of the reporting unit’s goodwill is compared to the carrying value of that goodwill. If the carrying value of the reporting unit’s goodwill exceeds the implied fair value of the goodwill, an impairment loss is recognized in an amount equal to the excess, not to exceed the carrying value.
46
A reporting unit is an operating segment or a business unit one level below that operating segment, for which discrete financial information is prepared and regularly reviewed by segment management. Goodwill is allocated to the following reporting units: U.S. Home Improvement, Orchard Supply Hardware (Orchard), Canada - Retail, and Canada - Distribution.
The changes in the carrying amount of goodwill for
2017
,
2016
, and
2015
were as follows:
|
(In millions)
|
2017
|
|
2016
|
|
2015
|
|
|||||
|
Goodwill, balance at beginning of year
|
$
|
1,082
|
|
$
|
154
|
|
$
|
154
|
|
||
|
Acquisitions
1
|
160
|
|
1,015
|
|
—
|
|
|||||
|
Impairment
|
—
|
|
(46
|
)
|
—
|
|
|||||
|
Other adjustments
2
|
65
|
|
(41
|
)
|
—
|
|
|||||
|
Goodwill, balance at end of year
|
$
|
1,307
|
|
$
|
1,082
|
|
$
|
154
|
|
||
|
1
|
Goodwill recorded for 2017 acquisitions relates to Maintenance Supply Headquarters. Goodwill recorded for 2016 acquisitions primarily relates to RONA. See Note 2 for additional information regarding these acquisitions.
|
|
2
|
Other adjustments primarily consist of changes in the goodwill balance as a result of foreign currency translation.
|
During the third quarter of fiscal year 2016, due to a strategic reassessment of the Orchard operations, the Company determined potential indicators of impairment within the reporting unit existed, and quantitatively evaluated the Orchard reporting unit for impairment. The Company classified this fair value measurement as Level 3. See Note 4 for additional information on the Company’s fair value measurements. The Company performed a discounted cash flow analysis for the Orchard reporting unit. The discounted cash flow model included management assumptions for expected sales growth, expansion plans, capital expenditures, and overall operational forecasts. The analysis led to the conclusion that the goodwill allocated to the Orchard reporting unit had no implied value. Accordingly, the full carrying value of
$46 million
relating to Orchard goodwill was impaired during the third quarter of 2016.
Gross carrying amounts and cumulative goodwill impairment losses are as follows:
|
February 2, 2018
|
February 3, 2017
|
||||||||||||||
|
(In millions)
|
Gross Carrying Amount
|
|
Cumulative Impairment
|
|
Gross Carrying Amount
|
|
Cumulative Impairment
|
|
|||||||
|
Goodwill
|
$
|
1,354
|
|
$
|
(47
|
)
|
$
|
1,129
|
|
$
|
(47
|
)
|
|||
Equity Method Investments
- The Company’s investments in certain unconsolidated entities are accounted for under the equity method. The balance of these investments is included in other assets (noncurrent) in the accompanying consolidated balance sheets. The balance is increased to reflect the Company’s capital contributions and equity in earnings of the investees. The balance is decreased for its equity in losses of the investees, for distributions received that are not in excess of the carrying amount of the investments, and for any other than temporary impairment losses recognized. Equity method investments were not significant as of
February 2, 2018
and
February 3, 2017
. The Company’s equity in earnings and losses of the investees are included in SG&A expense, and were not significant for any of the periods presented.
Equity method investments are evaluated for impairment whenever events or changes in circumstances indicate that a decline in value has occurred that is other than temporary. Evidence considered in this evaluation includes, but would not necessarily be limited to, the financial condition and near-term prospects of the investee, recent operating trends and forecasted performance of the investee, market conditions in the geographic area or industry in which the investee operates and the Company’s strategic plans for holding the investment in relation to the period of time expected for an anticipated recovery of its carrying value. Investments that are determined to have a decline in value deemed to be other than temporary are written down to estimated fair value. The Company’s other than temporary impairment losses are included in SG&A expense, and were not significant for
2017
and
2016
. See Note
3
for additional information on the other than temporary impairment loss the Company recognized in
2015
, related to its investment in the Australian joint venture.
Leases
- For lease agreements that provide for escalating rent payments or free-rent occupancy periods, the Company recognizes rent expense on a straight-line basis over the non-cancellable lease term and option renewal periods where failure to exercise such options would result in an economic penalty in such amount that renewal appears, at the inception of the lease, to be reasonably assured. The lease term commences on the date that the Company takes possession of or controls the physical use of the property. Deferred rent is included in other liabilities (noncurrent) on the consolidated balance sheets.
47
When the Company renegotiates and amends a lease to extend the non-cancellable lease term prior to the date at which it would have been required to exercise or decline a term extension option, the amendment is treated as a new lease. The new lease begins on the date the lease amendment is entered into and ends on the last date of the non-cancellable lease term, as adjusted to include any option renewal periods where failure to exercise such options would result in an economic penalty in such amount that renewal appears, at the inception of the lease amendment, to be reasonably assured. The new lease is classified as operating or capital under the authoritative guidance through use of assumptions regarding residual value, economic life, incremental borrowing rate, and fair value of the leased asset(s) as of the date of the amendment.
Accounts Payable -
The Company has an agreement with a third party to provide an accounts payable tracking system which facilitates participating suppliers’ ability to finance payment obligations from the Company with designated third-party financial institutions. Participating suppliers may, at their sole discretion, make offers to finance one or more payment obligations of the Company prior to their scheduled due dates at a discounted price to participating financial institutions. The Company’s goal in entering into this arrangement is to capture overall supply chain savings, in the form of pricing, payment terms, or vendor funding, created by facilitating suppliers’ ability to finance payment obligations at more favorable discount rates, while providing them with greater working capital flexibility.
The Company’s obligations to its suppliers, including amounts due and scheduled payment dates, are not impacted by suppliers’ decisions to finance amounts under this arrangement. However, the Company’s right to offset balances due from suppliers against payment obligations is restricted by this arrangement for those payment obligations that have been financed by suppliers. The Company’s outstanding payment obligation placed on the accounts payable tracking system were
$1.6 billion
as of
February 2, 2018
and
February 3, 2017
, and participating suppliers had financed
$1.1 billion
and
$1.0 billion
, respectively, of those payment obligations to participating financial institutions.
Other Current Liabilities
- Other current liabilities on the consolidated balance sheets consist of:
|
(In millions)
|
February 2, 2018
|
|
February 3, 2017
|
|
|||
|
Self-insurance liabilities
|
$
|
347
|
|
$
|
327
|
|
|
|
Accrued dividends
|
340
|
|
304
|
|
|||
|
Accrued interest
|
184
|
|
194
|
|
|||
|
Sales tax liabilities
|
144
|
|
210
|
|
|||
|
Accrued property taxes
|
109
|
|
108
|
|
|||
|
Other
|
826
|
|
832
|
|
|||
|
Total
|
$
|
1,950
|
|
$
|
1,975
|
|
|
Self-Insurance
- The Company is self-insured for certain losses relating to workers’ compensation, automobile, property, and general and product liability claims. The Company has insurance coverage to limit the exposure arising from these claims. The Company is also self-insured for certain losses relating to extended protection plan and medical and dental claims. Self-insurance claims filed and claims incurred but not reported are accrued based upon management’s estimates of the discounted ultimate cost for self-insured claims incurred using actuarial assumptions followed in the insurance industry and historical experience. Although management believes it has the ability to reasonably estimate losses related to claims, it is possible that actual results could differ from recorded self-insurance liabilities. The total self-insurance liability, including the current and non-current portions, was
$890 million
and
$831 million
at
February 2, 2018
, and
February 3, 2017
, respectively.
The Company provides surety bonds issued by insurance companies to secure payment of workers’ compensation liabilities as required in certain states where the Company is self-insured. Outstanding surety bonds relating to self-insurance were
$238 million
and
$243 million
at
February 2, 2018
, and
February 3, 2017
, respectively.
Income Taxes
- The Company establishes deferred income tax assets and liabilities for temporary differences between the tax and financial accounting bases of assets and liabilities. The tax effects of such differences are reflected in the consolidated balance sheets at the enacted tax rates expected to be in effect when the differences reverse. A valuation allowance is recorded to reduce the carrying amount of deferred tax assets if it is more likely than not that all or a portion of the asset will not be realized. The tax balances and income tax expense recognized by the Company are based on management’s interpretation of the tax statutes of multiple jurisdictions.
The Company establishes a liability for tax positions for which there is uncertainty as to whether or not the position will be ultimately sustained. The Company includes interest related to tax issues as part of net interest on the consolidated financial statements. The Company records any applicable penalties related to tax issues within the income tax provision.
48
Shareholders’ Equity -
The Company has a share repurchase program that is executed through purchases made from time to time either in the open market or through private market transactions. Shares purchased under the repurchase program are retired and returned to authorized and unissued status. Any excess of cost over par value is charged to additional paid-in capital to the extent that a balance is present. Once additional paid-in capital is fully depleted, remaining excess of cost over par value is charged to retained earnings.
Revenue Recognition -
The Company recognizes revenues, net of sales tax, when sales transactions occur and customers take possession of the merchandise. A provision for anticipated merchandise returns is provided through a reduction of sales and cost of sales in the period that the related sales are recorded. Revenues from product installation services are recognized when the installation is completed. Deferred revenues associated with amounts received for which customers have not yet taken possession of merchandise or for which installation has not yet been completed were
$831 million
and
$755 million
at
February 2, 2018
, and
February 3, 2017
, respectively.
Revenues from stored-value cards, which include gift cards and returned merchandise credits, are deferred and recognized when the cards are redeemed. The liability associated with outstanding stored-value cards was
$547 million
and
$498 million
at
February 2, 2018
, and
February 3, 2017
, respectively, and these amounts are included in deferred revenue on the consolidated balance sheets. The Company recognizes income from unredeemed stored-value cards at the point at which redemption becomes remote. The Company’s stored-value cards have no expiration date or dormancy fees. Therefore, to determine when redemption is remote, the Company analyzes an aging of the unredeemed cards based on the date of last stored-value card use. The amount of revenue recognized from unredeemed stored-value cards for which redemption was deemed remote was not significant for
2017
,
2016
, and
2015
.
Extended Protection Plans
- The Company sells separately-priced extended protection plan contracts under a Lowe’s-branded program for which the Company is ultimately self-insured. The Company recognizes revenue from extended protection plan sales on a straight-line basis over the respective contract term. Extended protection plan contract terms primarily range from one to four years from the date of purchase or the end of the manufacturer’s warranty, as applicable. Changes in deferred revenue for extended protection plan contracts are summarized as follows:
|
(In millions)
|
2017
|
|
2016
|
|
2015
|
|
|||||
|
Deferred revenue - extended protection plans, beginning of year
|
$
|
763
|
|
$
|
729
|
|
$
|
730
|
|
||
|
Additions to deferred revenue
|
408
|
|
387
|
|
350
|
|
|||||
|
Deferred revenue recognized
|
(368
|
)
|
(353
|
)
|
(351
|
)
|
|||||
|
Deferred revenue - extended protection plans, end of year
|
$
|
803
|
|
$
|
763
|
|
$
|
729
|
|
||
Incremental direct acquisition costs associated with the sale of extended protection plans are also deferred and recognized as expense on a straight-line basis over the respective contract term. Deferred costs associated with extended protection plan contracts were
$19 million
and
$18 million
at
February 2, 2018
, and
February 3, 2017
, respectively. The Company’s extended protection plan deferred costs are included in other assets (noncurrent) on the consolidated balance sheets. All other costs, such as costs of services performed under the contract, general and administrative expenses, and advertising expenses are expensed as incurred.
The liability for extended protection plan claims incurred is included in other current liabilities on the consolidated balance sheets and was not material in any of the years presented. Expenses for claims are recognized when incurred and totaled
$161 million
,
$141 million
, and
$127 million
for
2017
,
2016
, and
2015
, respectively.
49
Cost of Sales and Selling, General and Administrative Expenses -
The following lists the primary costs classified in each major expense category:
|
Cost of Sales
|
Selling, General and Administrative
|
|
|
n
Total cost of products sold, including:
- Purchase costs, net of vendor funds;
- Freight expenses associated with moving merchandise inventories from vendors to selling locations;
- Costs associated with operating the Company’s distribution network, including payroll and benefit costs and occupancy costs;
n
Costs of installation services provided;
n
Costs associated with delivery of products directly from vendors to customers by third parties;
n
Costs associated with inventory shrinkage and obsolescence;
n
Costs of services performed under the extended protection plan.
|
n
Payroll and benefit costs for retail and corporate employees;
n
Occupancy costs of retail and corporate facilities;
n
Advertising;
n
Costs associated with delivery of products from stores and distribution centers to customers;
n
Third-party, in-store service costs;
n
Tender costs, including bank charges, costs associated with credit card interchange fees and amounts associated with accepting the Company’s proprietary credit cards;
n
Costs associated with self-insured plans, and premium costs for stop-loss coverage and fully insured plans;
n
Long-lived asset impairment losses and gains/losses on disposal of assets;
n
Other administrative costs, such as supplies, and travel and entertainment.
|
|
Advertising
- Costs associated with advertising are charged to expense as incurred. Advertising expenses were
$968 million
,
$893 million
, and
$769 million
in
2017
,
2016
, and
2015
, respectively.
Shipping and Handling Costs
- The Company includes shipping and handling costs relating to the delivery of products directly from vendors to customers by third parties in cost of sales. Shipping and handling costs, which include third-party delivery costs, salaries, and vehicle operations expenses relating to the delivery of products from stores and distribution centers to customers, are classified as SG&A expense. Shipping and handling costs included in SG&A expense were
$841 million
,
$700 million
and
$607 million
in
2017
,
2016
, and
2015
, respectively.
Store Opening Costs
- Costs of opening new or relocated retail stores, which include payroll and supply costs incurred prior to store opening and grand opening advertising costs, are charged to expense as incurred.
Comprehensive Income
- The Company reports comprehensive income in its consolidated statements of comprehensive income and consolidated statements of shareholders’ equity. Comprehensive income represents changes in shareholders’ equity from non-owner sources and is comprised of net earnings adjusted primarily for foreign currency translation adjustments. Net foreign currency translation gains, net of tax, classified in accumulated other comprehensive income were
$11 million
at
February 2, 2018
. Net foreign currency translation losses, net of tax, classified in accumulated other comprehensive loss were
$240 million
, and
$394 million
at
February 3, 2017
and
January 29, 2016
, respectively.
Segment Information
- The Company’s home improvement retail operations represent a single reportable segment. Key operating decisions are made at the Company level in order to maintain a consistent retail store presentation. The Company’s home improvement retail and hardware stores sell similar products and services, use similar processes to sell those products and services, and sell their products and services to similar classes of customers. In addition, the Company’s operations exhibit similar long-term economic characteristics. The amounts of long-lived assets and net sales outside of the U.S. were approximately
9.8%
and
7.8%
, respectively, at
February 2, 2018
. The amounts of long-lived assets and net sales outside of the U.S. were approximately
8.7%
and
5.7%
, respectively, at
February 3, 2017
. The amounts of long-lived assets and net sales outside of the U.S. were not significant at
January 29, 2016
.
Accounting Pronouncements Recently Adopted
- Effective February 4, 2017, the Company adopted Accounting Standards Update (ASU 2016-09),
Compensation-Stock Compensation (Topic 718): Improvements to Employee Share-Based Payment Accounting
. All excess tax benefits or deficiencies related to share-based payments are recognized in the provision for income taxes, which has increased the volatility within our provision for income taxes, as these amounts were previously reported within equity. As a result of the adoption, we have recognized
$37 million
of excess tax benefits in our provision for income taxes for the fiscal year ended February 2, 2018. The recognition of these benefits contributed
$0.04
to diluted earnings per share for the fiscal year ended February 2, 2018. Excess tax benefits were historically reflected as a financing activity in the statements of cash flows, and after adoption, are included within operating activities. Cash paid to tax authorities by the
50
Company when directly withholding shares for tax purposes continues to be classified as a financing activity in the statement of cash flows. Share-based payment expense continues to reflect estimated forfeitures of share-based payment awards. The Company has adopted the applicable provisions of the ASU prospectively.
Accounting Pronouncements Not Yet Adopted
- In January 2017, the Financial Accounting Standards Board (FASB) issued Accounting Standards Update (ASU) 2017-04,
Intangibles-Goodwill and Other (Topic 350)
. The ASU eliminates Step 2 of the goodwill impairment test, which requires determining the fair value of assets acquired or liabilities assumed in a business combination. Under the amendments in this update, a goodwill impairment test is performed by comparing the fair value of the reporting unit with its carrying amount. An entity should recognize an impairment charge for the amount by which the carrying amount exceeds the reporting unit’s fair value; however, the loss recognized should not exceed the total amount of goodwill allocated to that reporting unit. This ASU is effective for annual periods beginning after December 15, 2019, and interim periods within those annual periods, with early adoption permitted. The adoption of this guidance by the Company is not expected to have a material impact on its consolidated financial statements.
In February 2016, the FASB issued ASU 2016-02,
Leases (Topic 842)
. The guidance in this ASU supersedes the leasing guidance in Topic 840,
Leases
. Under the new guidance, lessees are required to recognize lease assets and lease liabilities on the balance sheet for those leases previously classified as operating leases. For leases with a term of 12 months or less, a lessee is permitted to make an accounting policy election by class of underlying asset not to recognize lease assets and lease liabilities. If a lessee makes this election, it should recognize lease expense for such leases generally on a straight-line basis over the lease term. This ASU is effective for fiscal years beginning after December 15, 2018, and interim periods within those fiscal years, with early adoption permitted. The Company is currently evaluating the impact of adopting this ASU on its consolidated financial statements but expects the ASU to have a material impact on its financial position, as a result of the requirement to recognize right-of-use assets and lease liabilities on the Company’s consolidated balance sheets.
In May 2014, the FASB issued ASU 2014-09,
Revenue from Contracts with Customers
. The ASU is a comprehensive new revenue recognition model that requires a company to recognize revenue to depict the transfer of goods or services to customers in an amount that reflects the consideration to which the entity expects to be entitled in exchange for those goods or services. In addition, the ASU has expanded disclosure requirements regarding revenue. In August 2015, the FASB issued ASU 2015-14, which deferred the effective date of the ASU to fiscal years beginning after December 15, 2017, and interim periods within those fiscal years. Early adoption is permitted for fiscal years beginning after December 15, 2016. Companies may use either a full retrospective or a modified retrospective approach to adopt this ASU.
The Company will adopt this ASU in the first quarter of fiscal 2018, using a modified retrospective approach to adoption. Based on the Company’s assessment of the standard and its subsequent related amendments and interpretations, the standard will not materially affect our consolidated financial statements. The Company has determined the adoption of the guidance will impact the timing of recognition of its stored value card breakage. Currently, breakage is recognized using the remote method and will be recognized using the proportional method upon adoption of the guidance. The Company will also change the presentation of the sales return reserve on the consolidated balance sheet, as it is currently reported on a net basis, as well as change the timing of how installation services are recognized. In addition, the Company has evaluated its principal versus agent conclusions relating to certain arrangements with third parties and concluded there are no significant changes impacting the presentation of revenue on a gross or net basis. The Company is currently still evaluating any impacts the standard has relating to the classification of profit sharing income earned in connection with our private label credit card programs which is currently included in SG&A. The Company has not identified any significant modifications to existing systems or material changes in the Company’s internal controls over financial reporting. The adoption of the ASU will result in increased footnote disclosure requirements.
NOTE
2
: Acquisitions
Maintenance Supply Headquarters
On June 23, 2017, the Company completed its acquisition of Maintenance Supply Headquarters, a leading distributor of maintenance, repair and operations (MRO) products serving the multifamily housing industry. The acquisition is expected to enable the Company to deepen and broaden its relationship with Pro customers and better serve their needs. The aggregate cash purchase price of this acquisition was
$513 million
and is included in the investing section of the consolidated statements of cash flows, net of the cash acquired. Acquisition-related costs were expensed as incurred and were not significant.
51
The following table summarizes the preliminary purchase price allocation:
|
(In millions)
|
June 23, 2017
|
||
|
Allocation:
|
|||
|
Cash acquired
|
$
|
4
|
|
|
Merchandise inventory
|
68
|
|
|
|
Other current assets
|
36
|
|
|
|
Property
|
12
|
|
|
|
Goodwill
|
160
|
|
|
|
Other assets
|
260
|
|
|
|
Accounts payable
|
(18
|
)
|
|
|
Other current liabilities
|
(9
|
)
|
|
|
Net assets acquired
|
$
|
513
|
|
Intangible assets acquired totaled
$259 million
, and include a trademark of
$34 million
with a useful life of
15 years
and a customer list of
$225 million
with a useful life of
20 years
, each of which are included in other assets in the accompanying consolidated balance sheets. The goodwill of
$160 million
is primarily attributable to the synergies expected to arise after the acquisition and is deductible for tax purposes.
Pro forma and historical financial information has not been provided as the acquisition was not material to the consolidated financial statements.
RONA
On May 20, 2016, the Company acquired all of the issued and outstanding common shares of RONA for
C$24
per share in cash. In addition, as part of the transaction, borrowings under RONA’s revolving credit facility were settled in full at the closing of the acquisition, and the facility was eliminated. Total cash consideration to acquire the equity and settle the debt was
C$3.1 billion
(
$2.4 billion
) and is included in the investing section of the consolidated statements of cash flows. RONA is one of Canada’s largest retailers and distributors of hardware, building materials, home renovation, and gardening products. The acquisition is expected to enable the Company to accelerate its growth strategy by significantly expanding its presence in the Canadian home improvement market. Acquisition-related costs were expensed as incurred and were not significant.
The following represents the aggregate purchase price allocation which includes purchase accounting adjustments made during the measurement period:
|
(In millions)
|
May 20, 2016
|
||
|
Purchase price:
|
|||
|
Cash paid to common shareholders
|
$
|
1,999
|
|
|
Cash paid to debt holders
|
368
|
|
|
|
Total cash paid
|
$
|
2,367
|
|
|
Allocation:
|
|||
|
Cash acquired
|
$
|
83
|
|
|
Accounts receivable
|
260
|
|
|
|
Merchandise inventory
|
814
|
|
|
|
Property
|
897
|
|
|
|
Goodwill
|
971
|
|
|
|
Other assets
|
437
|
|
|
|
Other current liabilities
|
(619
|
)
|
|
|
Long-term liabilities
|
(367
|
)
|
|
|
Noncontrolling interest
|
(109
|
)
|
|
|
Net assets acquired
|
$
|
2,367
|
|
52
The intangible assets acquired totaled
$310 million
, and include trademarks of
$204 million
with a weighted average useful life of
15
years and dealer relationships of
$106 million
with a weighted average useful life of
20 years
, which are included in other assets in the accompanying consolidated balance sheets. The goodwill of
$971 million
is primarily attributable to the synergies expected to arise after the acquisition. Goodwill of approximately
$107 million
is expected to be deductible for tax purposes.
The transaction included the assumption by Lowe’s of unsecured debentures held by RONA of approximately
C$118 million
(
$91 million
) as of the acquisition date. The debentures matured and were settled in October 2016.
As of the acquisition date,
6.9 million
preferred shares of RONA remained outstanding. The total fair value of the shares and Lowe’s corresponding noncontrolling interest was
$109 million
, which was determined based on the closing market price of RONA’s preferred shares on the acquisition date. During the fourth fiscal quarter of 2016, the Company acquired all of the remaining noncontrolling interest in RONA by paying RONA’s preferred shareholders approximately
$127 million
, which represented an
$18 million
premium in excess of the carrying amount of the noncontrolling interest. See Note
12
to the consolidated financial statements for information regarding the impact of this transaction to the Company’s earnings per share calculation.
Pro forma and historical financial information has not been provided as the acquisition was not material to the consolidated financial statements. In addition, net earnings attributable to the noncontrolling interest was not significant for any of the reporting periods presented.
NOTE
3
: Investment in Australian Joint Venture
In the fourth quarter of fiscal year 2015, the Company announced its decision to exit the Australian joint venture investment with Woolworths Limited (Woolworths) and recorded a
$530 million
impairment of its equity method investment due to a determination that there was a decrease in value that was other than temporary. The Company owned a one-third share in the joint venture, Hydrox Holdings Pty Ltd. (Hydrox), which operated Masters Home Improvement stores and Home Timber and Hardware Group’s retail stores and wholesale distribution in Australia. As a result of this decision to exit, Woolworths was required to purchase the Company’s one-third share at its fair value as of January 18, 2016. The process for the two parties agreeing on fair value is prescribed in the Joint Venture Agreement. The $530 million non-cash impairment charge recorded in fiscal 2015 was based on the Company’s estimate of the value of its portion of the overall joint venture fair value as of January 18, 2016.
During the third quarter of fiscal year 2016, Woolworths claimed a unilateral termination of the joint venture agreement, and executed other agreements to initiate the wind down of Hydrox without the Company’s approval as required under the joint venture agreement. Due to this, Lowe’s concluded that under applicable accounting standards, the investment should be
accounted for as a cost method investment going forward. As a result of this determination, accumulated foreign currency translation adjustments of
$208 million
were reclassified from accumulated other comprehensive loss into the carrying value of the cost method investment. In addition, the unilateral actions of Woolworths to begin the liquidation of Hydrox, represented a triggering event requiring the Company to evaluate the cost method investment for impairment. Management determined that the requirements for determining impairment were met, and leveraged wind down cash flow projections in determining the estimated fair value of the entity as of October 28, 2016. The value was determined using an income approach based upon the expected future cash flows generated from the settlement of assets and liabilities inclusive of inventory, property, payables, lease liabilities and employee entitlements. As a result, the Company recorded a
$290 million
non-cash impairment charge during the third quarter of fiscal 2016 to reflect its estimated portion of the overall joint venture fair value in wind down. The Company classified this fair value measurement as Level 3. See Note 4 for additional information on the Company’s fair value measurements.
Following the impairment recorded in the third quarter of fiscal 2016, the Company considered the amount due under the joint venture agreement, which was based on the fair value as of January 18, 2016 on a going concern basis, to exceed the recorded amount of the investment, which was based on an estimated current fair value in wind down. This claim for additional value under the joint venture agreement above and beyond any amounts expected to be received through the wind down process, represented a contingent asset whereby the Company would recognize any amounts as they were realized.
During the second quarter of fiscal 2017, the Company completed the sale of our interest in the Australian joint venture with Woolworths and received proceeds of
$199 million
, which is included in cash flows from investing activities in the accompanying consolidated statements of cash flows. The proceeds from the sale exceeded the carrying value of the investment and resulted in a gain of
$96 million
. The carrying value prior to the sale reflected the non-cash impairment charges
53
taken in fiscal years 2015 and 2016. The gain is included in selling, general and administrative expense in the accompanying consolidated statements of current and retained earnings.
NOTE
4
: Fair Value Measurements
Fair value is defined as the price that would be received to sell an asset or paid to transfer a liability in an orderly transaction between market participants at the measurement date. The authoritative guidance for fair value measurements establishes a three-level hierarchy, which encourages an entity to maximize the use of observable inputs and minimize the use of unobservable inputs when measuring fair value. The three levels of the hierarchy are defined as follows:
|
•
|
Level 1
-
inputs to the valuation techniques that are quoted prices in active markets for identical assets or liabilities
|
|
•
|
Level 2
-
inputs to the valuation techniques that are other than quoted prices but are observable for the assets or liabilities, either directly or indirectly
|
|
•
|
Level 3
-
inputs to the valuation techniques that are unobservable for the assets or liabilities
|
Assets and Liabilities that are Measured at Fair Value on a Recurring Basis
The Company’s available-for-sale securities represented the only significant assets measured at fair value on a recurring basis for the fiscal years ended
February 2, 2018
and
February 3, 2017
. The following table presents the Company’s financial assets measured at fair value on a recurring basis. The fair values of these instruments approximated amortized costs.
|
Fair Value Measurements at
|
|||||||||
|
(In millions)
|
Measurement Level
|
February 2, 2018
|
|
February 3, 2017
|
|
||||
|
Available-for-sale securities:
|
|||||||||
|
Money market funds
|
Level 1
|
$
|
86
|
|
$
|
81
|
|
||
|
Certificates of deposit
|
Level 1
|
16
|
|
15
|
|
||||
|
Municipal obligations
|
Level 2
|
—
|
|
4
|
|
||||
|
Total short-term investments
|
$
|
102
|
|
$
|
100
|
|
|||
|
Available-for-sale securities:
|
|||||||||
|
Municipal floating rate obligations
|
Level 2
|
$
|
407
|
|
$
|
359
|
|
||
|
Certificates of deposit
|
Level 1
|
1
|
|
2
|
|
||||
|
Municipal obligations
|
Level 2
|
—
|
|
5
|
|
||||
|
Total long-term investments
|
$
|
408
|
|
$
|
366
|
|
|||
There were no transfers between Levels 1, 2 or 3 during any of the periods presented.
When available, quoted prices were used to determine fair value. When quoted prices in active markets were available, investments were classified within Level 1 of the fair value hierarchy. When quoted prices in active markets were not available, fair values were determined using pricing models, and the inputs to those pricing models were based on observable market inputs. The inputs to the pricing models were typically benchmark yields, reported trades, broker-dealer quotes, issuer spreads and benchmark securities, among others.
Assets and Liabilities that are Measured at Fair Value on a Nonrecurring Basis
For the fiscal year ended
February 2, 2018
, the Company had no significant measurements of assets and liabilities at fair value on a nonrecurring basis subsequent to their initial recognition. For the fiscal year ended
February 3, 2017
, the Company’s only significant assets or liabilities measured at fair value on a nonrecurring basis subsequent to their initial recognition were goodwill (see Note 1 to the consolidated financial statements included herein for additional information regarding this fair value measurement), certain cost method investments (see Note 3 to the consolidated financial statements included herein for additional information regarding this fair value measurement), and certain long-lived assets.
Long-lived assets
The Company reviews the carrying amounts of long-lived assets whenever certain events or changes in circumstances indicate that the carrying amounts may not be recoverable. With input from retail store operations, the Company’s accounting and
54
finance personnel that organizationally report to the chief financial officer, assess the performance of retail stores quarterly against historical patterns and projections of future profitability for evidence of possible impairment. An impairment loss is recognized when the carrying amount of the asset (disposal) group is not recoverable and exceeds its fair value. The Company estimated the fair values of assets subject to long-lived asset impairment based on the Company’s own judgments about the assumptions that market participants would use in pricing the assets and on observable market data, when available. The Company classified these fair value measurements as Level 3.
In the determination of impairment for operating locations, the Company determined the fair values of individual operating locations using an income approach, which required discounting projected future cash flows. When determining the stream of projected future cash flows associated with an individual operating location, management made assumptions, incorporating local market conditions and inputs from retail store operations, the highest and best use, and about key variables including the following unobservable inputs: sales growth rates, gross margin, controllable expenses, such as payroll and occupancy expense, and asset residual values. In order to calculate the present value of those future cash flows, the Company discounted cash flow estimates at a rate commensurate with the risk that selected market participants would assign to the cash flows. In general, the selected market participants represented a group of other retailers with a location footprint similar in size to the Company’s.
In the determination of impairment for excess properties held-for-use and held-for-sale, which consisted of retail outparcels and property associated with relocated or closed locations, the fair values were determined using a market approach based on estimated selling prices. The Company determined the estimated selling prices by obtaining information from property brokers or appraisers in the specific markets being evaluated or negotiated non-binding offers to purchase. The information obtained from property brokers or appraisers included comparable sales of similar assets and assumptions about demand in the market for these assets.
The following table presents the Company’s assets measured at estimated fair value on a nonrecurring basis and the resulting impairment losses included in earnings, excluding costs to sell for excess properties held-for-sale. Because these assets subject to impairment were not measured at fair value on a recurring basis, certain fair value measurements presented in the table may reflect values at earlier measurement dates and may no longer represent the fair values at
February 3, 2017
.
Fair Value Measurements - Nonrecurring Basis
|
February 3, 2017
|
|||||||
|
(In millions)
|
Fair Value Measurements
|
|
Impairment Losses
|
|
|||
|
Assets-held-for-use:
|
|||||||
|
Operating locations
|
$
|
3
|
|
$
|
(34
|
)
|
|
|
Excess properties
|
18
|
|
(9
|
)
|
|||
|
Goodwill (Note 1)
|
—
|
|
(46
|
)
|
|||
|
Other assets:
|
|||||||
|
Cost method investments (Note 3)
|
103
|
|
(290
|
)
|
|||
|
Total
|
$
|
124
|
|
$
|
(379
|
)
|
|
Fair Value of Financial Instruments
The Company’s financial instruments not measured at fair value on a recurring basis include cash and cash equivalents, accounts receivable, accounts payable, accrued liabilities, and long-term debt and are reflected in the financial statements at cost. With the exception of long-term debt, cost approximates fair value for these items due to their short-term nature. The fair values of the Company’s unsecured notes were estimated using quoted market prices. The fair values of the Company’s mortgage notes were estimated using discounted cash flow analyses, based on the future cash outflows associated with these arrangements and discounted using the applicable incremental borrowing rate.
55
Carrying amounts and the related estimated fair value of the Company’s long-term debt, excluding capitalized lease obligations, are as follows:
|
February 2, 2018
|
February 3, 2017
|
||||||||||||||
|
(In millions)
|
Carrying Amount
|
|
Fair Value
|
|
Carrying Amount
|
|
Fair Value
|
|
|||||||
|
Unsecured notes (Level 1)
|
$
|
14,961
|
|
$
|
15,608
|
|
$
|
14,321
|
|
$
|
15,305
|
|
|||
|
Mortgage notes (Level 2)
|
6
|
|
7
|
|
7
|
|
7
|
|
|||||||
|
Long-term debt (excluding capitalized lease obligations)
|
$
|
14,967
|
|
$
|
15,615
|
|
$
|
14,328
|
|
$
|
15,312
|
|
|||
NOTE
5
: Property and Accumulated Depreciation
Property is summarized by major class in the following table:
|
(In millions)
|
Estimated
Depreciable Lives, In Years |
|
February 2, 2018
|
|
February 3, 2017
|
|
|||
|
Cost:
|
|
|
|||||||
|
Land
|
N/A
|
|
$
|
7,414
|
|
$
|
7,329
|
|
|
|
Buildings and building improvements
|
5-40
|
|
18,521
|
|
18,147
|
|
|||
|
Equipment
|
2-15
|
|
10,475
|
|
10,978
|
|
|||
|
Construction in progress
|
N/A
|
|
530
|
|
464
|
|
|||
|
Total cost
|
|
36,940
|
|
36,918
|
|
||||
|
Accumulated depreciation
|
|
(17,219
|
)
|
(16,969
|
)
|
||||
|
Property, less accumulated depreciation
|
|
$
|
19,721
|
|
$
|
19,949
|
|
||
Included in net property are assets under capital lease of
$724 million
, less accumulated depreciation of
$273 million
, at
February 2, 2018
, and
$696 million
, less accumulated depreciation of
$269 million
, at
February 3, 2017
. The related amortization expense for assets under capital lease is included in depreciation expense. The Company recognized depreciation expense of
$1.4 billion
in
2017
and
$1.5 billion
in
2016
and
2015
.
NOTE
6
: Short-Term Borrowings
The Company has a
$1.75 billion
unsecured revolving credit agreement (the 2016 Credit Facility) with a syndicate of banks that expires in
November 2021
. Subject to obtaining commitments from the lenders and satisfying other conditions specified in the 2016 Credit Facility, we may increase the aggregate availability by an additional
$500 million
. The 2016 Credit Facility supports our commercial paper program. Borrowings under our commercial paper program reduce the amount available for borrowing under its terms. The 2016 Credit Facility contains customary representations, warranties, and covenants for a transaction of this type. The Company was in compliance with those covenants at
February 2, 2018
.
Outstanding borrowings under the Company’s commercial paper program were
$1.1 billion
, with a weighted average interest rate of
1.85%
, as of
February 2, 2018
, and
$510 million
, with a weighted average interest rate of
1.01%
, as of
February 3, 2017
. There were
no
outstanding borrowings under the 2016 Credit Facility as of
February 2, 2018
or
February 3, 2017
.
56
NOTE
7
: Long-Term Debt
|
Debt Category
(In millions) |
Weighted-Average Interest Rate at February 2, 2018
|
|
February 2, 2018
|
|
February 3, 2017
|
|
||||
|
Secured debt:
|
||||||||||
|
Mortgage notes due through fiscal 2027
1
|
5.38
|
%
|
$
|
6
|
|
$
|
7
|
|
||
|
Unsecured debt:
|
||||||||||
|
Notes due through fiscal 2022
|
3.05
|
%
|
3,577
|
|
4,324
|
|
||||
|
Notes due fiscal 2023-2027
|
3.17
|
%
|
4,636
|
|
3,143
|
|
||||
|
Notes due fiscal 2028-2032
|
6.67
|
%
|
563
|
|
696
|
|
||||
|
Notes due fiscal 2033-2037
|
5.96
|
%
|
897
|
|
1,536
|
|
||||
|
Notes due fiscal 2038-2042
|
4.95
|
%
|
1,119
|
|
1,731
|
|
||||
|
Notes due fiscal 2043-2047
|
4.08
|
%
|
4,169
|
|
2,891
|
|
||||
|
Capitalized lease obligations due through fiscal 2041
|
891
|
|
861
|
|
||||||
|
Total long-term debt
|
15,858
|
|
15,189
|
|
||||||
|
Less current maturities
|
(294
|
)
|
(795
|
)
|
||||||
|
Long-term debt, excluding current maturities
|
$
|
15,564
|
|
$
|
14,394
|
|
||||
|
1
|
Real properties with an aggregate book value of
$26 million
were pledged as collateral at
February 2, 2018
, for secured debt.
|
Debt maturities, exclusive of unamortized original issue discounts, unamortized debt issuance costs, and capitalized lease obligations, for the next five years and thereafter are as follows: 2018,
$251 million
; 2019,
$1.1 billion
; 2020,
$500 million
; 2021,
$1.0 billion
; 2022,
$765 million
; thereafter,
$11.5 billion
.
The Company’s unsecured notes are issued under indentures that generally have similar terms and, therefore, have been grouped by maturity date for presentation purposes in the table above. The notes contain certain restrictive covenants, none of which are expected to impact the Company’s capital resources or liquidity. The Company was in compliance with all covenants of these agreements at
February 2, 2018
.
Unsecured notes issued during 2015 were as follows:
|
Issue Date
|
Principal Amount (in millions)
|
Maturity Date
|
Fixed vs. Floating
|
Interest Rate
|
Discount (in millions)
|
|||||||||
|
September 2015
|
$
|
250
|
|
September 2018
|
Floating
|
Floating
|
$
|
1
|
|
|||||
|
September 2015
|
$
|
750
|
|
September 2025
|
Fixed
|
3.375%
|
$
|
8
|
|
|||||
|
September 2015
|
$
|
750
|
|
September 2045
|
Fixed
|
4.375%
|
$
|
24
|
|
|||||
The floating rate notes issued in 2015 will bear interest at a floating rate, reset quarterly, equal to the
three-month LIBOR
plus
0.600%
(
2.174%
as of February 2, 2018). Interest on these floating rate notes is payable quarterly in arrears in March, June, September, and December of each year until maturity. Interest on the fixed rate notes issued in 2015 is payable semiannually in arrears in March and September of each year until maturity.
Unsecured notes issued during 2016 were as follows:
|
Issue Date
|
Principal Amount (in millions)
|
Maturity Date
|
Fixed vs. Floating
|
Interest Rate
|
Discount (in millions)
|
|||||||||
|
April 2016
|
$
|
250
|
|
April 2019
|
Floating
|
Floating
|
$
|
1
|
|
|||||
|
April 2016
|
$
|
350
|
|
April 2019
|
Fixed
|
1.150%
|
$
|
1
|
|
|||||
|
April 2016
|
$
|
1,350
|
|
April 2026
|
Fixed
|
2.500%
|
$
|
12
|
|
|||||
|
April 2016
|
$
|
1,350
|
|
April 2046
|
Fixed
|
3.700%
|
$
|
19
|
|
|||||
The floating rate notes issued in 2016 will bear interest at a floating rate, reset quarterly, equal to the
three-month LIBOR
plus
0.240%
(
1.960%
as of February 2, 2018). Interest on these floating rate notes is payable quarterly in arrears in April, July,
57
October, and January of each year until maturity. Interest on the fixed rate notes issued in 2016 is payable semiannually in arrears in April and October of each year until maturity.
Unsecured notes issued during 2017 were as follows:
|
Issue Date
|
Principal Amount (in millions)
|
Maturity Date
|
Fixed vs. Floating
|
Interest Rate
|
Discount (in millions)
|
|||||||||
|
May 2017
|
$
|
1,500
|
|
May 2027
|
Fixed
|
3.100%
|
$
|
9
|
|
|||||
|
May 2017
|
$
|
1,500
|
|
May 2047
|
Fixed
|
4.050%
|
$
|
23
|
|
|||||
Interest on the notes issued in 2017 is payable semiannually in arrears in May and November of each year until maturity.
The discounts associated with these issuances, which include the underwriting and issuance discounts, are recorded in long-term debt and are being amortized over the respective terms of the notes using the effective interest method.
The indentures governing the fixed rate notes issued in 2017, 2016, and 2015, contain a provision that allows the Company to redeem the notes at any time, in whole or in part, at specified redemption prices plus accrued interest to the date of redemption. We do not have the right to redeem the floating rate notes issued in 2016 and 2015 prior to maturity. The indentures also contain a provision that allows the holders of the notes to require the Company to repurchase all or any part of their notes if a change of control triggering event (as defined in the indentures) occurs. If elected under the change of control provisions, the repurchase of the notes will occur at a purchase price of
101%
of the principal amount, plus accrued and unpaid interest on such notes to the date of purchase, if any. The indentures governing the notes do not limit the aggregate principal amount of debt securities that the Company may issue and do not require the Company to maintain specified financial ratios or levels of net worth or liquidity. However, the indenture includes various restrictive covenants, none of which is expected to impact the Company’s liquidity or capital resources.
During 2017, the Company completed a cash tender offer to purchase and retire
$1.6 billion
combined aggregate principal amount of its outstanding notes and recognized a loss on extinguishment of debt of
$464 million
.
NOTE
8
: Shareholders’ Equity
Authorized shares of preferred stock were
5.0 million
(
$5
par value) at
February 2, 2018
, and
February 3, 2017
, none of which have been issued. The Board of Directors may issue the preferred stock (without action by shareholders) in one or more series, having such voting rights, dividend and liquidation preferences, and such conversion and other rights as may be designated by the Board of Directors at the time of issuance.
Authorized shares of common stock were
5.6 billion
(
$.50
par value) at
February 2, 2018
, and
February 3, 2017
.
The Company has a share repurchase program that is executed through purchases made from time to time either in the open market or through private off-market transactions. Shares purchased under the repurchase program are retired and returned to authorized and unissued status. On January 27, 2017, the Company’s Board of Directors authorized a
$5.0 billion
share repurchase under the program with no expiration, which was announced on the same day. On January 26, 2018, the Company’s Board of Directors authorized an additional
$5.0 billion
share repurchase under the program with no expiration, which was announced on the same day. As of
February 2, 2018
, the Company had
$6.9 billion
remaining under the program.
During the year ended
February 2, 2018
, the Company entered into Accelerated Share Repurchase (ASR) agreements with third-party financial institutions to repurchase a total of
15.7 million
shares of the Company’s common stock for
$1.3 billion
. At inception, the Company paid the financial institutions using cash on hand and took initial delivery of shares. Under the terms of the ASR agreements, upon settlement, the Company would either receive additional shares from the financial institution or be required to deliver additional shares or cash to the financial institution. The Company controlled its election to either deliver additional shares or cash to the financial institution and was subject to provisions which limited the number of shares the Company would be required to deliver.
The final number of shares received upon settlement of each ASR agreement was determined with reference to the volume-weighted average price of the Company’s common stock over the term of the ASR agreement. The initial repurchase of shares under these agreements resulted in an immediate reduction of the outstanding shares used to calculate the weighted-average common shares outstanding for basic and diluted earnings per share.
58
These ASR agreements were accounted for as treasury stock transactions and forward stock purchase contracts. The par value of the shares received was recorded as a reduction to common stock with the remainder recorded as a reduction to capital in excess of par value and retained earnings. The forward stock purchase contracts were considered indexed to the Company’s own stock and were classified as equity instruments.
During the year ended
February 2, 2018
, the Company also repurchased shares of its common stock through the open market totaling
23.4 million
shares for a cost of
$1.8 billion
.
The Company also withholds shares from employees to satisfy either the exercise price of stock options exercised or the statutory withholding tax liability resulting from the vesting of restricted stock awards and performance share units.
Shares repurchased for
2017
and
2016
were as follows:
|
2017
|
2016
|
||||||||||||
|
(In millions)
|
Shares
|
|
Cost
1
|
|
Shares
|
|
Cost
1
|
|
|||||
|
Share repurchase program
|
39.1
|
|
$
|
3,133
|
|
46.7
|
|
$
|
3,500
|
|
|||
|
Shares withheld from employees
|
0.5
|
|
41
|
|
1.0
|
|
77
|
|
|||||
|
Total share repurchases
|
39.6
|
|
$
|
3,174
|
|
47.7
|
|
$
|
3,577
|
|
|||
|
1
|
Reductions of
$2.9 billion
and
$3.3 billion
were recorded to retained earnings, after capital in excess of par value was depleted, for
2017
and
2016
, respectively.
|
NOTE
9
: Accounting for Share-Based Payments
Overview of Share-Based Payment Plans
The Company has a number of active and inactive equity incentive plans (the Incentive Plans) under which the Company has been authorized to grant share-based awards to key employees and non-employee directors. The Company also has an employee stock purchase plan (the ESPP) that allows employees to purchase Company shares at a discount through payroll deductions. All of these plans contain a nondiscretionary anti-dilution provision that is designed to equalize the value of an award as a result of any stock dividend, stock split, recapitalization, or any other similar equity restructuring.
A total of
199.0 million
shares have been previously authorized for grant to key employees and non-employee directors under all of the Company’s Incentive Plans, but only
80.0 million
of those shares were authorized for grants of share-based awards under the Company’s currently active Incentive Plans. In addition, a total of
70.0 million
shares have been previously authorized for purchases by employees participating in the ESPP.
At
February 2, 2018
, there were
33.5 million
shares remaining available for grants under the currently active Incentive Plans and
21.9 million
shares remaining available for purchases under the ESPP.
The Company recognized share-based payment expense within SG&A expense in the consolidated statements of earnings of
$99 million
,
$90 million
, and
$117 million
in
2017
,
2016
and
2015
respectively. The total associated income tax benefit recognized was
$31 million
,
$29 million
and
$38 million
in
2017
,
2016
and
2015
, respectively.
Total unrecognized share-based payment expense for all share-based payment plans was
$118 million
at
February 2, 2018
, of which
$69 million
will be recognized in 2018,
$43 million
in 2019 and
$6 million
thereafter. This results in these amounts being recognized over a weighted-average period of
1.7 years
.
For all share-based payment awards, the expense recognized has been adjusted for estimated forfeitures where the requisite service is not expected to be provided. Estimated forfeiture rates are developed based on the Company’s analysis of historical forfeiture data for homogeneous employee groups.
59
General terms and methods of valuation for the Company’s share-based awards are as follows:
Stock Options
Stock options have terms of
seven
or
10
years, with one-third of each grant vesting each year for
three years
, and are assigned an exercise price equal to the closing market price of a share of the Company’s common stock on the date of grant. Options are expensed on a straight-line basis over the grant vesting period, which is considered to be the requisite service period.
The fair value of each option grant is estimated on the date of grant using the Black-Scholes option-pricing model. When determining expected volatility, the Company considers the historical volatility of the Company’s stock price, as well as implied volatility. The risk-free interest rate is based on the U.S. Treasury yield curve in effect at the time of grant, based on the options’ expected term. The expected term of the options is based on the Company’s evaluation of option holders’ exercise patterns and represents the period of time that options are expected to remain unexercised. The Company uses historical data to estimate the timing and amount of forfeitures. The weighted average assumptions used in the Black-Scholes option-pricing model and weighted-average grant date fair value for options granted in
2017
,
2016
, and
2015
are as follows:
|
2017
|
|
2016
|
|
2015
|
|
||||||
|
Weighted-average assumptions used:
|
|||||||||||
|
Expected volatility
|
23.6
|
%
|
24.0
|
%
|
31.3
|
%
|
|||||
|
Dividend yield
|
1.68
|
%
|
1.66
|
%
|
1.69
|
%
|
|||||
|
Risk-free interest rate
|
2.14
|
%
|
1.42
|
%
|
1.99
|
%
|
|||||
|
Expected term, in years
|
6.43
|
|
6.44
|
|
7.00
|
|
|||||
|
Weighted-average grant date fair value
|
$
|
18.30
|
|
$
|
15.00
|
|
$
|
20.27
|
|
||
The total intrinsic value of options exercised, representing the difference between the exercise price and the market price on the date of exercise, was approximately
$77 million
,
$73 million
and
$68 million
in
2017
,
2016
and
2015
, respectively.
Transactions related to stock options for the year ended
February 2, 2018
are summarized as follows:
|
Shares
(In thousands) |
|
Weighted-Average Exercise Price Per Share
|
|
Weighted-Average Remaining Term (In years)
|
Aggregate Intrinsic Value (In thousands)
|
|
||||||
|
Outstanding at February 3, 2017
|
4,239
|
|
$
|
49.84
|
|
|||||||
|
Granted
|
394
|
|
82.44
|
|
||||||||
|
Canceled, forfeited or expired
|
(131
|
)
|
67.55
|
|
||||||||
|
Exercised
|
(1,687
|
)
|
37.72
|
|
||||||||
|
Outstanding at February 2, 2018
|
2,815
|
|
$
|
60.84
|
|
7.14
|
$
|
114,479
|
|
|||
|
Vested and expected to vest at February 2, 2018
1
|
2,764
|
|
$
|
60.54
|
|
7.10
|
$
|
113,200
|
|
|||
|
Exercisable at February 2, 2018
|
1,784
|
|
$
|
52.55
|
|
6.29
|
$
|
87,318
|
|
|||
|
1
|
Includes outstanding vested options as well as outstanding nonvested options after a forfeiture rate is applied.
|
Restricted Stock Awards
Restricted stock awards are valued at the market price of a share of the Company’s common stock on the date of grant. In general, these awards vest at the end of a
three
-year period from the date of grant and are expensed on a straight-line basis over that period, which is considered to be the requisite service period. The Company uses historical data to estimate the timing and amount of forfeitures. The weighted-average grant-date fair value per share of restricted stock awards granted was
$82.41
,
$71.35
and
$69.44
in
2017
,
2016
, and
2015
, respectively. The total fair value of restricted stock awards vesting was approximately
$71 million
,
$151 million
and
$144 million
in
2017
,
2016
and
2015
, respectively.
60
Transactions related to restricted stock awards for the year ended
February 2, 2018
are summarized as follows:
|
Shares
(In thousands) |
|
Weighted-Average Grant-Date Fair Value Per Share
|
|
|||
|
Nonvested at February 3, 2017
|
2,681
|
|
$
|
64.22
|
|
|
|
Granted
|
473
|
|
82.41
|
|
||
|
Vested
|
(910
|
)
|
53.87
|
|
||
|
Canceled or forfeited
|
(348
|
)
|
67.03
|
|
||
|
Nonvested at February 2, 2018
|
1,896
|
|
$
|
73.21
|
|
|
Deferred Stock Units
Deferred stock units are valued at the market price of a share of the Company’s common stock on the date of grant. For non-employee Directors, these awards vest immediately and are expensed on the grant date. During
2017
,
2016
and
2015
, each non-employee Director was awarded a number of deferred stock units determined by dividing the annual award amount by the fair market value of a share of the Company’s common stock on the award date and rounding up to the next 100 units. The annual award amount used to determine the number of deferred stock units granted to each Director was
$175,000
for
2017
, and
$150,000
for
2016
and
2015
. During
2017
,
22,000
deferred stock units were granted and immediately vested for non-employee Directors. The weighted-average grant-date fair value per share of deferred stock units granted was
$80.22
,
$80.35
and
$69.98
in
2017
,
2016
and
2015
, respectively. The total fair value of deferred stock units vested was
$1.8 million
in
2017
, and
$1.5 million
in
2016
and
2015
. During
2017
,
no
fully vested deferred stock units were released as a result of termination of service. At
February 2, 2018
, there were
0.4 million
deferred stock units outstanding, all of which were vested.
Performance Share Units
The Company issues performance share units classified as equity awards. Expense is recognized on a straight-line basis over the requisite service period, based on the probability of achieving the performance condition, with changes in expectations recognized as an adjustment to earnings in the period of the change. Compensation cost is not recognized for performance share units that do not vest because service or performance conditions are not satisfied and any previously recognized compensation cost is reversed. Performance share units do not have dividend rights. The Company uses historical data to estimate the timing and amount of forfeitures.
The Company’s performance share units are classified as equity and contain performance and service conditions that must be satisfied for an employee to earn the right to benefit from the award. The performance condition is primarily based on the achievement of the Company’s target return on non-cash average assets (RONCAA). These awards are valued at the market price of a share of the Company’s common stock on the date of grant less the present value of dividends expected during the requisite service period.
In fiscal 2016, the Company began issuing performance share units that contain a market condition modifier, in addition to having a performance and service condition. The performance condition for these awards continues to be based primarily on the achievement of the Company’s RONCAA targets. The market condition is based on the Company’s total shareholder return (TSR) compared to the median TSR of companies listed in the S&P 500 Index over a three year performance period. The Company used a Monte-Carlo simulation to determine the grant date fair value for these awards, which takes into consideration the possible outcomes pertaining to the TSR market condition. The weighted-average assumptions used in the Monte Carlo simulations for these awards granted in 2017 and 2016 are as follows:
|
2017
|
|
2016
|
|
||
|
Weighted-average assumptions used:
|
|||||
|
Expected volatility
|
20.8
|
%
|
21.4
|
%
|
|
|
Dividend yield
|
1.62
|
%
|
1.53
|
%
|
|
|
Risk-free interest rate
|
1.46
|
%
|
0.88
|
%
|
|
|
Expected term, in years
|
2.83
|
|
2.82
|
|
|
61
In general,
0%
to
200%
of the Company’s performance share units vest at the end of a
three
year service period from the date of grant based upon achievement of the performance condition, or a combination of the performance and market conditions, specified in the performance share unit agreement.
The weighted-average grant-date fair value per unit of performance share units classified as equity awards granted was
$91.50
,
$77.58
and
$71.52
in
2017
,
2016
and
2015
, respectively. The total fair value of performance share units vesting was approximately
$31 million
,
$24 million
, and
$25 million
in
2017
,
2016
, and
2015
, respectively.
Transactions related to performance share units classified as equity awards for the year ended
February 2, 2018
are summarized as follows:
|
Units
(In thousands) 1 |
|
Weighted-Average Grant-Date Fair Value Per Unit
|
|
|||
|
Nonvested at February 3, 2017
|
723
|
|
$
|
65.30
|
|
|
|
Granted
|
273
|
|
91.50
|
|
||
|
Vested
|
(253
|
)
|
47.29
|
|
||
|
Canceled or forfeited
|
(45
|
)
|
77.42
|
|
||
|
Nonvested at February 2, 2018
|
698
|
|
$
|
81.31
|
|
|
|
¹
|
The number of units presented is based on achieving the targeted performance goals as defined in the performance share unit agreements. As of
February 2, 2018
, the maximum number of nonvested units that could vest under the provisions of the agreements was
1.3 million
for the RONCAA awards.
|
Restricted Stock Units
Restricted stock units do not have dividend rights and are valued at the market price of a share of the Company’s common stock on the date of grant less the present value of dividends expected during the requisite service period. In general, these awards vest at the end of a
three
-year period from the date of grant and are expensed on a straight-line basis over that period, which is considered to be the requisite service period. The Company uses historical data to estimate the timing and amount of forfeitures. The weighted-average grant-date fair value per share of restricted stock units granted was
$75.44
,
$67.26
and
$66.24
in
2017
,
2016
and
2015
, respectively. The total fair value of restricted stock units vesting was approximately
$5.6 million
,
$7.7 million
, and
$3.5 million
in
2017
,
2016
and
2015
, respectively.
Transactions related to restricted stock units for the year ended
February 2, 2018
are summarized as follows:
|
|
Shares
(In thousands) |
|
Weighted-Average Grant-Date Fair Value Per Share
|
|
||
|
Nonvested at February 3, 2017
|
323
|
|
$
|
62.85
|
|
|
|
Granted
|
85
|
|
75.44
|
|
||
|
Vested
|
(72
|
)
|
50.42
|
|
||
|
Canceled or forfeited
|
(59
|
)
|
66.29
|
|
||
|
Nonvested at February 2, 2018
|
277
|
|
$
|
69.21
|
|
|
ESPP
The purchase price of the shares under the ESPP equals
85%
of the closing price on the date of purchase. The Company’s share-based payment expense per share is equal to
15%
of the closing price on the date of purchase. The ESPP is considered a liability award and is measured at fair value at each reporting date, and the share-based payment expense is recognized over the six-month offering period. The Company issued
1.1 million
shares of common stock in 2017 and
1.3 million
shares of common stock in 2016 and 2015 and recognized
$13 million
,
$15 million
, and
$14 million
of share-based payment expense pursuant to the plan in 2017, 2016, and 2015, respectively.
62
NOTE
10
: Employee Retirement Plans
The Company maintains a defined contribution retirement plan for eligible employees (the 401(k) Plan). Eligible employees may participate in the 401(k) Plan
six months
after their original date of service. Eligible employees hired or rehired prior to November 1, 2012, were automatically enrolled in the 401(k) Plan at a contribution rate of
1%
of their pre-tax annual compensation unless they elected otherwise. Eligible employees hired or rehired November 1, 2012, or later must make an active election to participate in the 401(k) Plan. The Company makes contributions to the 401(k) Plan each payroll period, based upon a matching formula applied to employee deferrals (the Company Match). Participants are eligible to receive the Company Match pursuant to the terms of the 401(k) Plan. The Company Match varies based on how much the employee elects to defer up to a maximum of
4.25%
of eligible compensation. The Company Match is invested identically to employee contributions and is immediately vested.
The Company maintains a Benefit Restoration Plan to supplement benefits provided under the 401(k) Plan to participants whose benefits are restricted as a result of certain provisions of the Internal Revenue Code of 1986. This plan provides for employee salary deferrals and employer contributions in the form of a Company Match.
The Company maintains a non-qualified deferred compensation program called the Lowe’s Cash Deferral Plan. This plan is designed to permit certain employees to defer receipt of portions of their compensation, thereby delaying taxation on the deferral amount and on subsequent earnings until the balance is distributed. This plan does not provide for Company contributions.
The Company recognized expense associated with these employee retirement plans of
$174 million
,
$180 million
and
$155 million
in
2017
,
2016
and
2015
, respectively.
NOTE
11
: Income Taxes
The following is a reconciliation of the federal statutory tax rate to the effective tax rate:
|
2017
|
|
2016
|
|
2015
|
|
|||
|
Statutory federal income tax rate
1
|
33.7
|
%
|
35.0
|
%
|
35.0
|
%
|
||
|
State income taxes, net of federal tax benefit
|
2.9
|
|
3.6
|
|
3.6
|
|
||
|
Valuation allowance - Australian joint venture
|
(0.6
|
)
|
2.0
|
|
4.2
|
|
||
|
Other, net
|
1.2
|
|
(0.1
|
)
|
(0.4
|
)
|
||
|
Effective tax rate
|
37.2
|
%
|
40.5
|
%
|
42.4
|
%
|
||
1
The Company utilized a blended rate in 2017 due to the Tax Cuts and Job Act enacted on December 22, 2017.
The components of the income tax provision are as follows:
|
(In millions)
|
2017
|
|
2016
|
|
2015
|
|
|||||
|
Current:
|
|||||||||||
|
Federal
|
$
|
1,734
|
|
$
|
1,824
|
|
$
|
1,688
|
|
||
|
State
|
252
|
|
275
|
|
248
|
|
|||||
|
Total current
1
|
1,986
|
|
2,099
|
|
1,936
|
|
|||||
|
Deferred:
|
|||||||||||
|
Federal
|
60
|
|
6
|
|
(59
|
)
|
|||||
|
State
|
(4
|
)
|
3
|
|
(4
|
)
|
|||||
|
Total deferred
1
|
56
|
|
9
|
|
(63
|
)
|
|||||
|
Total income tax provision
|
$
|
2,042
|
|
$
|
2,108
|
|
$
|
1,873
|
|
||
|
1
|
Amounts applicable to foreign income taxes were insignificant for all periods presented.
|
63
The tax effects of cumulative temporary differences that gave rise to the deferred tax assets and liabilities were as follows:
|
(In millions)
|
February 2, 2018
|
|
February 3, 2017
|
|
|||
|
Deferred tax assets:
|
|||||||
|
Self-insurance
|
$
|
238
|
|
$
|
352
|
|
|
|
Share-based payment expense
|
36
|
|
69
|
|
|||
|
Deferred rent
|
66
|
|
78
|
|
|||
|
Impairment of investment
|
—
|
|
381
|
|
|||
|
Capital loss carryforwards
|
225
|
|
—
|
|
|||
|
Net operating losses
|
213
|
|
174
|
|
|||
|
Other, net
|
124
|
|
175
|
|
|||
|
Total deferred tax assets
|
902
|
|
1,229
|
|
|||
|
Valuation allowance
|
(475
|
)
|
(578
|
)
|
|||
|
Net deferred tax assets
|
427
|
|
651
|
|
|||
|
Deferred tax liabilities:
|
|||||||
|
Property
|
(264
|
)
|
(417
|
)
|
|||
|
Other, net
|
(23
|
)
|
(34
|
)
|
|||
|
Total deferred tax liabilities
|
(287
|
)
|
(451
|
)
|
|||
|
Net deferred tax asset
|
$
|
140
|
|
$
|
200
|
|
|
On December 22, 2017, the U.S. government enacted the Tax Cuts and Job Act (Tax Act). Among other provisions, the Tax Act lowered the corporate federal income tax rate from 35% to 21%, and effectively changed the U.S. corporate income tax system from a worldwide tax system to a territorial tax system. In addition, the Tax Act established a one-time transition tax on certain unrepatriated earnings of foreign subsidiaries and added a new provision for a tax on global intangible low-taxed income (GILTI). The Company has made an accounting policy election to record the U.S. income tax effect of future GILTI inclusions in the period in which they arise. The Tax Act could be amended or subjected to technical correction, which could change the financial impacts recorded at February 2, 2018, or expected to be recorded in future periods.
Also on December 22, 2017, the Securities and Exchange Commission issued Staff Accounting Bulletin (SAB 118) which provided guidance on accounting for the impact of the Tax Act. SAB 118 provides for a measurement period, that cannot extend beyond one year from the law’s enactment date, to determine and report a provisional impact of certain income tax effects of the Tax Act that were incomplete under ASC 740 as of year-end.
As a result of the Tax Act, the Company utilized a blended statutory tax rate of
33.7%
for 2017 in accordance with Section 15 of the Internal Revenue Code. This blended rate resulted in a tax benefit of
$58 million
for the year. The Company recorded a
$56 million
provisional tax expense for the measurement of its U.S. net deferred tax assets at the newly enacted corporate rate and a
$22 million
provisional tax expense for the one-time transition tax on unrepatriated earnings of foreign subsidiaries. While the Company made reasonable estimates of the impact of the reduction in the corporate rate and the deemed repatriation transition tax, the final impact may differ due to subsequent legislative action changes in interpretations and assumptions as well as the issuance of additional guidance from the Internal Revenue Service and state taxing authorities. The Company will continue to gather additional information to determine the concluding impact.
As of February 2, 2018, the Company reported a deferred tax asset of
$225 million
, for the capital loss realized in 2017 for U.S. federal income tax purposes related to the exit from the Company’s joint venture investment in Australia. Since no present or future capital gains have been identified through which the asset can be realized, the Company has a full valuation allowance against the deferred tax asset. For U.S. federal tax purposes, this loss has a five-year carryforward period expiring at the end of fiscal 2022. As of February 3, 2017, the Company reported a deferred tax asset and full valuation allowance of
$381 million
related to its intention to exit the Company’s joint venture investment in Australia.
In December 2016, the U.S. Treasury Department and the U.S. Internal Revenue Service issued final and temporary regulations under Internal Revenue Code Section 987 (the Regulations). The Regulations provide guidance on the taxation of foreign
64
currency gains and losses arising from qualified business units that operate in a currency other than the currency of their owner. As a result of the newly enacted guidance, net deferred tax assets were reduced by
$11 million
in 2017 and
$33 million
in 2016.
The Company operates as a branch in various foreign jurisdictions and cumulatively has incurred net operating losses of
$720 million
and
$640 million
as of
February 2, 2018
, and
February 3, 2017
, respectively. These net operating losses are subject to expiration in
2018
through
2037
. Deferred tax assets have been established for these foreign net operating losses in the accompanying consolidated balance sheets. Given the uncertainty regarding the realization of the foreign net deferred tax assets, the Company recorded cumulative valuation allowances of
$234 million
and
$197 million
as of
February 2, 2018
, and
February 3, 2017
, respectively.
A reconciliation of the beginning and ending balances of unrecognized tax benefits is as follows:
|
(In millions)
|
2017
|
|
2016
|
|
2015
|
|
|||||
|
Unrecognized tax benefits, beginning of year
|
$
|
6
|
|
$
|
3
|
|
$
|
7
|
|
||
|
Additions for tax positions of prior years
|
—
|
|
3
|
|
—
|
|
|||||
|
Reductions for tax positions of prior years
|
(2
|
)
|
—
|
|
(2
|
)
|
|||||
|
Settlements
|
(1
|
)
|
—
|
|
(2
|
)
|
|||||
|
Reductions due to a lapse in applicable statute of limitations
|
(3
|
)
|
—
|
|
—
|
|
|||||
|
Unrecognized tax benefits, end of year
|
$
|
—
|
|
$
|
6
|
|
$
|
3
|
|
||
The amounts of unrecognized tax benefits that, if recognized, would favorably impact the effective tax rate were
$5 million
as of February 3, 2017, and
$2 million
as of January 29, 2016.
The Company recognized
$3 million
of interest income,
$2 million
of interest expense, and
$1 million
of interest income related to uncertain tax positions during
2017
,
2016
, and
2015
, respectively. The Company had
no
accrued interest related to uncertain tax positions as of February 2, 2018 and
$3 million
as of
February 3, 2017
.
Penalties recognized related to uncertain tax positions were insignificant for
2017
,
2016
, and
2015
. Accrued penalties were also insignificant as of
February 2, 2018
and
February 3, 2017
.
The Company is subject to examination by various foreign and domestic taxing authorities. There are ongoing U.S. state audits covering tax years
2011
to
2016
. An audit of the Company’s Canadian operations by the Canada Revenue Agency for fiscal years
2012
and
2013
is on-going. The Company remains subject to income tax examinations for international income taxes for fiscal years
2012
through
2016
. The Company believes appropriate provisions for all outstanding issues have been made for all jurisdictions and all open years.
Note
12
: Earnings Per Share
The Company calculates basic and diluted earnings per common share using the two-class method. Under the two-class method, net earnings are allocated to each class of common stock and participating security as if all of the net earnings for the period had been distributed. The Company’s participating securities consist of share-based payment awards that contain a nonforfeitable right to receive dividends and, therefore, are considered to participate in undistributed earnings with common shareholders.
65
Basic earnings per common share excludes dilution and is calculated by dividing net earnings allocable to common shares by the weighted-average number of common shares outstanding for the period. Diluted earnings per common share is calculated by dividing net earnings allocable to common shares by the weighted-average number of common shares as of the balance sheet date, as adjusted for the potential dilutive effect of non-participating share-based awards. The following table reconciles earnings per common share for
2017
,
2016
and
2015
:
|
(In millions, except per share data)
|
2017
|
|
2016
|
|
2015
|
|
|||||
|
Basic earnings per common share:
|
|||||||||||
|
Net earnings attributable to Lowe's Companies, Inc.
|
$
|
3,447
|
|
$
|
3,091
|
|
$
|
2,546
|
|
||
|
Less: Net earnings allocable to participating securities
|
(11
|
)
|
(11
|
)
|
(12
|
)
|
|||||
|
Less: Premium paid to acquire noncontrolling interest
|
—
|
|
(18
|
)
|
—
|
|
|||||
|
Net earnings allocable to common shares, basic
|
$
|
3,436
|
|
$
|
3,062
|
|
$
|
2,534
|
|
||
|
Weighted-average common shares outstanding
|
839
|
|
880
|
|
927
|
|
|||||
|
Basic earnings per common share
|
$
|
4.09
|
|
$
|
3.48
|
|
$
|
2.73
|
|
||
|
Diluted earnings per common share:
|
|||||||||||
|
Net earnings attributable to Lowe's Companies, Inc.
|
$
|
3,447
|
|
$
|
3,091
|
|
$
|
2,546
|
|
||
|
Less: Net earnings allocable to participating securities
|
(11
|
)
|
(11
|
)
|
(12
|
)
|
|||||
|
Less: Premium paid to acquire noncontrolling interest
|
—
|
|
(18
|
)
|
—
|
|
|||||
|
Net earnings allocable to common shares, diluted
|
$
|
3,436
|
|
$
|
3,062
|
|
$
|
2,534
|
|
||
|
Weighted-average common shares outstanding
|
839
|
|
880
|
|
927
|
|
|||||
|
Dilutive effect of non-participating share-based awards
|
1
|
|
1
|
|
2
|
|
|||||
|
Weighted-average common shares, as adjusted
|
840
|
|
881
|
|
929
|
|
|||||
|
Diluted earnings per common share
|
$
|
4.09
|
|
$
|
3.47
|
|
$
|
2.73
|
|
||
As discussed in Note
2
to the consolidated financial statements, the Company paid RONA’s preferred shareholders a premium to acquire the remaining noncontrolling interest in RONA during the fourth quarter of fiscal 2016. The premium paid was accounted for as a capital transaction and as such, no loss was recognized in the Company’s consolidated financial statements. However, the premium paid represents a return on investment to RONA’s preferred shareholders and is not available to common shareholders. Therefore, the premium paid to acquire the remaining noncontrolling interest is reflected in the table above as a deduction from net earnings to compute net earnings allocable to common shares.
Stock options to purchase
0.5 million
,
1.0 million
and
0.3 million
shares of common stock for
2017
,
2016
and
2015
, respectively, were excluded from the computation of diluted earnings per common share because their effect would have been anti-dilutive.
NOTE
13
: Leases
The Company leases facilities and land for certain facilities under agreements with original terms generally of
20 years
. The leases generally contain provisions for
four
to
six
renewal options of
five years
each. Some lease agreements also provide for contingent rentals based on sales performance in excess of specified minimums or on changes in the consumer price index. Contingent rentals were not significant for any of the periods presented. The Company subleases certain properties that are not used in its operations. Sublease income was not significant for any of the periods presented.
66
The future minimum rental payments required under operating leases and capitalized lease obligations having initial or remaining non-cancelable lease terms in excess of one year are summarized as follows:
|
(In millions)
Fiscal Year |
Operating Leases
|
|
Capitalized Lease Obligations
|
|
Total
|
|
|||||
|
2018
|
$
|
666
|
|
$
|
108
|
|
$
|
774
|
|
||
|
2019
|
626
|
|
166
|
|
792
|
|
|||||
|
2020
|
573
|
|
88
|
|
661
|
|
|||||
|
2021
|
526
|
|
91
|
|
617
|
|
|||||
|
2022
|
476
|
|
87
|
|
563
|
|
|||||
|
Later years
|
2,970
|
|
951
|
|
3,921
|
|
|||||
|
Total minimum lease payments
|
$
|
5,837
|
|
$
|
1,491
|
|
$
|
7,328
|
|
||
|
Less amount representing interest
|
(600
|
)
|
|||||||||
|
Present value of minimum lease payments
|
891
|
|
|||||||||
|
Less current maturities
|
(45
|
)
|
|||||||||
|
Present value of minimum lease payments, less current maturities
|
$
|
846
|
|
||||||||
Rental expenses under operating leases were
$626 million
,
$549 million
and
$473 million
in
2017
,
2016
and
2015
, respectively, and were recognized within SG&A expense. Excluded from these amounts are rental expenses associated with closed locations which were recognized as exit costs in the period of closure.
NOTE
14
: Commitments and Contingencies
The Company is, from time to time, party to various legal proceedings considered to be in the normal course of business, none of which, individually or in the aggregate, are expected to be material to the Company’s financial statements. In evaluating liabilities associated with its various legal proceedings, the Company has accrued for probable liabilities associated with these matters. The amounts accrued were not material to the Company’s consolidated financial statements in any of the years presented. Reasonably possible losses for any of the individual legal proceedings which have not been accrued were not material to the Company’s consolidated financial statements.
As of
February 2, 2018
, the Company had non-cancelable commitments of
$1.1 billion
related to certain marketing and information technology programs, and purchases of merchandise inventory. Payments under these commitments are scheduled to be made as follows: 2018,
$537 million
; 2019,
$318 million
; 2020,
$160 million
; 2021,
$51 million
; 2022,
$3 million
; thereafter,
$0 million
.
At
February 2, 2018
, the Company held standby and documentary letters of credit issued under banking arrangements which totaled
$63 million
. The majority of the Company’s letters of credit were issued for insurance contracts.
NOTE
15
: Related Parties
A member of the Company’s Board of Directors also serves on the Board of Directors of a vendor that provides branded consumer packaged goods to the Company. The Company purchased products from this vendor in the amount of
$149 million
in
2017
,
$124 million
in
2016
, and
$153 million
in
2015
. Amounts payable to this vendor were insignificant at
February 2, 2018
and
February 3, 2017
.
A member of the Company’s Board of Directors also serves on the Board of Directors of a vendor that provides certain services to the Company related to health and welfare benefit plans. The Company made payments to this vendor in the amount of
$14 million
in
2017
,
$59 million
in
2016
, and
$58 million
in
2015
. Amounts payable to this vendor were insignificant at
February 2, 2018
and
February 3, 2017
.
67
NOTE
16
: Other Information
Net interest expense is comprised of the following:
|
(In millions)
|
2017
|
|
2016
|
|
2015
|
|
|||||
|
Long-term debt
|
$
|
582
|
|
$
|
583
|
|
$
|
505
|
|
||
|
Capitalized lease obligations
|
56
|
|
53
|
|
42
|
|
|||||
|
Interest income
|
(16
|
)
|
(12
|
)
|
(4
|
)
|
|||||
|
Interest capitalized
|
(5
|
)
|
(4
|
)
|
(3
|
)
|
|||||
|
Interest on tax uncertainties
|
(3
|
)
|
2
|
|
(1
|
)
|
|||||
|
Other
|
19
|
|
23
|
|
13
|
|
|||||
|
Interest - net
|
$
|
633
|
|
$
|
645
|
|
$
|
552
|
|
||
Supplemental disclosures of cash flow information:
|
(In millions)
|
2017
|
|
2016
|
|
2015
|
|
|||||
|
Cash paid for interest, net of amount capitalized
|
$
|
654
|
|
$
|
619
|
|
$
|
535
|
|
||
|
Cash paid for income taxes, net
|
$
|
1,673
|
|
$
|
2,217
|
|
$
|
2,055
|
|
||
|
Non-cash investing and financing activities:
|
|||||||||||
|
Non-cash property acquisitions, including assets acquired under capital lease
|
$
|
97
|
|
$
|
86
|
|
$
|
102
|
|
||
|
Cash dividends declared but not paid
|
$
|
340
|
|
$
|
304
|
|
$
|
255
|
|
||
Sales by product category:
|
2017
|
2016
|
2015
|
||||||||||||||||||
|
(Dollars in millions)
|
Total Sales
|
|
%
|
|
Total Sales
|
|
%
|
|
Total Sales
|
|
%
|
|
||||||||
|
Lumber & Building Materials
|
$
|
9,508
|
|
14
|
%
|
$
|
8,505
|
|
13
|
%
|
$
|
7,007
|
|
12
|
%
|
|||||
|
Appliances
|
7,696
|
|
11
|
|
7,037
|
|
11
|
|
6,477
|
|
11
|
|
||||||||
|
Seasonal & Outdoor Living
|
7,165
|
|
10
|
|
6,996
|
|
11
|
|
6,623
|
|
11
|
|
||||||||
|
Tools & Hardware
|
6,713
|
|
10
|
|
6,359
|
|
10
|
|
5,686
|
|
10
|
|
||||||||
|
Fashion Fixtures
|
6,429
|
|
9
|
|
6,303
|
|
10
|
|
5,806
|
|
10
|
|
||||||||
|
Rough Plumbing & Electrical
|
6,149
|
|
9
|
|
5,741
|
|
9
|
|
5,203
|
|
9
|
|
||||||||
|
Paint
|
5,321
|
|
8
|
|
5,183
|
|
8
|
|
4,742
|
|
8
|
|
||||||||
|
Millwork
|
5,308
|
|
8
|
|
5,236
|
|
8
|
|
4,957
|
|
8
|
|
||||||||
|
Lawn & Garden
|
5,251
|
|
8
|
|
5,109
|
|
8
|
|
4,732
|
|
8
|
|
||||||||
|
Flooring
|
4,363
|
|
6
|
|
4,227
|
|
6
|
|
3,887
|
|
7
|
|
||||||||
|
Kitchens
|
3,644
|
|
5
|
|
3,532
|
|
5
|
|
3,276
|
|
5
|
|
||||||||
|
Other
|
1,072
|
|
2
|
|
789
|
|
1
|
|
678
|
|
1
|
|
||||||||
|
Totals
|
$
|
68,619
|
|
100
|
%
|
$
|
65,017
|
|
100
|
%
|
$
|
59,074
|
|
100
|
%
|
|||||
NOTE
17
: Derivative Instruments
In February 2016, the Company entered into an option to purchase
3.2 billion
Canadian dollars in order to manage the foreign currency exchange rate risk on the consideration to be paid for the RONA acquisition. This option contract was not accounted for as a hedging instrument, and gains and losses resulting from changes in fair value and settlement were included in selling, general and administrative expense in the accompanying consolidated statements of current and retained earnings. The cash flows related to this option were included within investing activities in the accompanying consolidated statements of cash flows.
68
The premium paid for the foreign currency exchange option contract was
$103 million
. The option contract was settled during the second quarter of fiscal year 2016 for
$179 million
, resulting in a total realized gain of
$76 million
for the year ended February 3, 2017.
The Company’s other derivative instruments, and related activity, were not material in any of the periods presented.
69
SUPPLEMENTARY DATA
Selected Quarterly Data (UNAUDITED)
The following table summarizes the quarterly consolidated results of operations for
2017
and
2016
:
|
2017
|
|||||||||||||||
|
(In millions, except per share data)
|
First
1
|
|
Second
2
|
|
Third
|
|
Fourth
3
|
|
|||||||
|
Net sales
|
$
|
16,860
|
|
$
|
19,495
|
|
$
|
16,770
|
|
$
|
15,494
|
|
|||
|
Gross margin
|
5,800
|
|
6,670
|
|
5,713
|
|
5,226
|
|
|||||||
|
Net earnings
|
602
|
|
1,419
|
|
872
|
|
554
|
|
|||||||
|
Basic earnings per common share
|
0.70
|
|
1.68
|
|
1.05
|
|
0.67
|
|
|||||||
|
Diluted earnings per common share
|
$
|
0.70
|
|
$
|
1.68
|
|
$
|
1.05
|
|
$
|
0.67
|
|
|||
|
2016
|
|||||||||||||||
|
(In millions, except per share data)
|
First
4
|
|
Second
5
|
|
Third
6
|
|
Fourth
7, 8
|
|
|||||||
|
Net sales
|
$
|
15,234
|
|
$
|
18,260
|
|
$
|
15,739
|
|
$
|
15,784
|
|
|||
|
Gross margin
|
5,337
|
|
6,288
|
|
5,407
|
|
5,432
|
|
|||||||
|
Net earnings
|
884
|
|
1,167
|
|
379
|
|
663
|
|
|||||||
|
Basic earnings per common share
|
0.98
|
|
1.32
|
|
0.43
|
|
0.74
|
|
|||||||
|
Diluted earnings per common share
|
$
|
0.98
|
|
$
|
1.31
|
|
$
|
0.43
|
|
$
|
0.74
|
|
|||
|
1
|
The first quarter of fiscal 2017 includes a $464 million loss on extinguishment of debt in connection with a $1.6 billion cash tender offer.
|
|
2
|
The second quarter of fiscal 2017 includes a $96 million gain from the sale of the Company’s interest in its Australian joint venture with Woolworths.
|
|
3
|
The fourth quarter of fiscal 2017 includes the $20 million net impact associated with the Tax Cuts and Jobs Act of 2017 and $66 million from a one-time cash bonus to eligible hourly employees attributable to the passage of the Tax Cuts and Jobs Act of 2017.
|
|
4
|
The first quarter of fiscal 2016 includes a $160 million unrealized gain associated with a foreign currency hedge entered into in advance of the RONA acquisition.
|
|
5
|
The second quarter of fiscal 2016 includes a $84 million loss from the Company settling its foreign currency hedge entered into in advance of the RONA acquisition.
|
|
6
|
The third quarter of fiscal 2016 includes the following: $290 million resulting from impairment associated with the wind down of the Company’s investment in the Australian joint venture with Woolworths; $96 million related to a write-off for projects that were canceled as part of the Company’s ongoing review of strategic initiatives in an effort to focus on critical projects that will drive desired outcomes; and $76 million related to goodwill and long-lived asset impairments associated with the Company’s Orchard operations as part of a strategic reassessment of this business.
|
|
7
|
The fourth quarter of fiscal 2016 includes the following: $84 million for severance-related costs associated with the Company’s productivity efforts; $32 million resulting from a tax charge primarily related to the issuance of final Internal Revenue Code Section 987 regulations in December 2016.
|
|
8
|
The fourth quarter of fiscal 2016 contained an additional week.
|
None.
The Company’s management, with the participation of the Chief Executive Officer and Chief Financial Officer, has evaluated the effectiveness of the Company’s “disclosure controls and procedures”, (as such term is defined in Rule 13a-15(e) promulgated under the Securities Exchange Act of 1934, as amended, (the Exchange Act)). Based upon their evaluation, the Chief Executive Officer and Chief Financial Officer concluded that, as of the end of the period covered by this Annual Report,
70
the Company’s disclosure controls and procedures were effective for the purpose of ensuring that the information required to be disclosed in the reports that the Company files or submits under the Exchange Act with the Securities and Exchange Commission (the SEC) (1) is recorded, processed, summarized and reported within the time periods specified in the SEC’s rules and forms, and (2) is accumulated and communicated to the Company’s management, including its principal executive and principal financial officers, as appropriate to allow timely decisions regarding required disclosure.
Management’s report on internal control over financial reporting (as such term is defined in Rule 13a-15(f) under the Exchange Act) and the report of Deloitte & Touche LLP, the Company’s independent registered public accounting firm, are included in Item 8 of this Annual Report.
In addition, no change in the Company’s internal control over financial reporting occurred during the fiscal fourth quarter ended
February 2, 2018
that has materially affected, or is reasonably likely to materially affect, the Company’s internal control over financial reporting.
None.
71
The information required by this item with respect to our executive officers appears in Part I of this Annual Report under the heading, “Executive Officers of the Registrant”. The other information required by this item is furnished by incorporation by reference to the information under the headings “Proposal 1: Election of Directors”, “Information About the Board of Directors and Committees of the Board”, “Section 16(a) Beneficial Ownership Reporting Compliance”, and “Additional Information - Shareholder Proposals for the 2019 Annual Meeting” in the definitive Proxy Statement for the 2018 annual meeting of shareholders, which will be filed with the SEC within 120 days after the fiscal year ended
February 2, 2018
(the Proxy Statement).
We have adopted a written code of business conduct and ethics, which is intended to qualify as a “code of ethics” within the meaning of Item 406 of Regulation S-K of the Exchange Act, which we refer to as the Lowe’s Code of Business Conduct and Ethics (the Code). The Code applies to all employees of the Company, including our principal executive officer, principal financial officer, principal accounting officer or persons performing similar functions. The Code is designed to ensure that the Company’s business is conducted in a legal and ethical manner. The Code covers all areas of professional conduct, including compliance with laws and regulations, conflicts of interest, fair dealing among customers and suppliers, corporate opportunity, confidential information, insider trading, employee relations, and accounting complaints. The full text of the Code can be found on our website at www.Lowes.com, under the “About Lowe’s”, “Investor Relations”, and “Governance - Code of Business Conduct and Ethics” headings. You can also obtain a copy of the complete Code by contacting Investor Relations at 1-800-813-7613.
We will disclose information pertaining to amendments or waivers to provisions of the Code that apply to our principal executive officer, principal financial officer, principal accounting officer or persons performing similar functions and that relate to any element of the Code enumerated in the SEC rules and regulations by posting this information on our website at www.Lowes.com. The information on our website is not a part of this Annual Report and is not incorporated by reference in this report or any of our other filings with the SEC.
The information required by this item is furnished by incorporation by reference to the information under the headings “Information About the Board of Directors and Committees of the Board – Compensation of Directors”, “Compensation Discussion and Analysis”, “Compensation Tables”, and “Compensation Committee Interlocks and Insider Participation” in the Proxy Statement.
The information required by this item is furnished by incorporation by reference to the information under the headings “Security Ownership of Certain Beneficial Owners and Management” and “Equity Compensation Plan Information” in the Proxy Statement.
The information required by this item is furnished by incorporation by reference to the information under the headings “Information About the Board of Directors and Committees of the Board – Director Independence”, “Related Person Transactions”, and “Appendix A: Categorical Standards for Determination of Director Independence” in the Proxy Statement.
The information required by this item is furnished by incorporation by reference to the information under the heading “Audit Matters – Fees Paid to the Independent Registered Public Accounting Firm” in the Proxy Statement.
72
a) 1.
Financial Statements
See the following items and page numbers appearing in Item 8 of this Annual Report:
|
Page No.
|
||
73
2.
Financial Statement Schedule
SCHEDULE II - VALUATION AND QUALIFYING ACCOUNTS AND RESERVES
|
(In millions)
|
Balance at beginning of period
|
|
Charges to costs
and expenses
|
|
Deductions
|
|
Balance at end of period
|
|
|||||||||||
|
February 2, 2018:
|
|||||||||||||||||||
|
Reserve for loss on obsolete inventory
|
$
|
59
|
|
$
|
18
|
|
1
|
$
|
—
|
|
$
|
77
|
|
||||||
|
Reserve for inventory shrinkage
|
189
|
|
456
|
|
(433
|
)
|
2
|
212
|
|
||||||||||
|
Reserve for sales returns
|
71
|
|
—
|
|
—
|
|
71
|
|
|||||||||||
|
Deferred tax valuation allowance
|
578
|
|
—
|
|
(103
|
)
|
4
|
475
|
|
||||||||||
|
Self-insurance liabilities
|
831
|
|
1,547
|
|
(1,488
|
)
|
5
|
890
|
|
||||||||||
|
Reserve for exit activities
|
66
|
|
19
|
|
(25
|
)
|
6
|
60
|
|
||||||||||
|
February 3, 2017:
|
|||||||||||||||||||
|
Reserve for loss on obsolete inventory
|
$
|
46
|
|
$
|
13
|
|
1
|
$
|
—
|
|
$
|
59
|
|
||||||
|
Reserve for inventory shrinkage
|
171
|
|
397
|
|
(379
|
)
|
2
|
189
|
|
||||||||||
|
Reserve for sales returns
|
66
|
|
5
|
|
3
|
—
|
|
71
|
|
||||||||||
|
Deferred tax valuation allowance
|
447
|
|
131
|
|
4
|
—
|
|
578
|
|
||||||||||
|
Self-insurance liabilities
|
883
|
|
1,418
|
|
(1,470
|
)
|
5
|
831
|
|
||||||||||
|
Reserve for exit activities
|
67
|
|
47
|
|
(48
|
)
|
6
|
66
|
|
||||||||||
|
January 29, 2016:
|
|||||||||||||||||||
|
Reserve for loss on obsolete inventory
|
$
|
52
|
|
$
|
—
|
|
$
|
(6
|
)
|
1
|
$
|
46
|
|
||||||
|
Reserve for inventory shrinkage
|
162
|
|
345
|
|
(336
|
)
|
2
|
171
|
|
||||||||||
|
Reserve for sales returns
|
65
|
|
1
|
|
3
|
—
|
|
66
|
|
||||||||||
|
Deferred tax valuation allowance
|
170
|
|
277
|
|
4
|
—
|
|
447
|
|
||||||||||
|
Self-insurance liabilities
|
905
|
|
1,357
|
|
(1,379
|
)
|
5
|
883
|
|
||||||||||
|
Reserve for exit activities
|
53
|
|
34
|
|
(20
|
)
|
6
|
67
|
|
||||||||||
|
1
|
Represents the net increase/(decrease) in the required reserve based on the Company’s evaluation of obsolete inventory.
|
|
2
|
Represents the actual inventory shrinkage experienced at the time of physical inventories.
|
|
3
|
Represents the net increase in the required reserve based on the Company’s evaluation of anticipated merchandise returns.
|
|
4
|
Represents an increase/(decrease) in the required reserve based on the Company’s evaluation of deferred tax assets.
|
|
5
|
Represents claim payments for self-insured claims.
|
|
6
|
Represents lease payments, net of sublease income.
|
74
3.
Exhibits
|
Exhibit Number
|
Incorporated by Reference
|
|||||||||
|
Exhibit Description
|
Form
|
File No.
|
Exhibit
|
Filing Date
|
||||||
|
2.1
|
10-K
|
001-07898
|
2.1
|
March 29, 2016
|
||||||
|
3.1
|
10-Q
|
001-07898
|
3.1
|
September 1, 2009
|
||||||
|
3.2
|
8-K
|
001-07898
|
3.1
|
May 31, 2016
|
||||||
|
4.1
|
8-K
|
001-07898
|
4.1
|
December 15, 1995
|
||||||
|
4.2
|
8-K
|
001-07898
|
4.2
|
February 20, 1998
|
||||||
|
4.3
|
10-K
|
001-07898
|
10.13
|
April 19, 1999
|
||||||
|
4.4
|
10-K
|
001-07898
|
10.19
|
April 19, 1999
|
||||||
|
4.5
|
10-K
|
001-07898
|
4.5
|
April 3, 2007
|
||||||
|
4.6
|
S-3 (POSASR)
|
333-137750
|
4.5
|
October 10, 2006
|
||||||
75
|
Exhibit Number
|
Incorporated by Reference
|
|||||||||
|
Exhibit Description
|
Form
|
File No.
|
Exhibit
|
Filing Date
|
||||||
|
4.7
|
8-K
|
001-07898
|
4.1
|
September 11, 2007
|
||||||
|
4.8
|
8-K
|
001-07898
|
4.1
|
April 15, 2010
|
||||||
|
4.9
|
8-K
|
001-07898
|
4.1
|
November 22, 2010
|
||||||
|
4.10
|
8-K
|
001-07898
|
4.1
|
November 23, 2011
|
||||||
|
4.11
|
8-K
|
001-07898
|
4.1
|
April 23, 2012
|
||||||
76
|
Exhibit Number
|
Incorporated by Reference
|
|||||||||
|
Exhibit Description
|
Form
|
File No.
|
Exhibit
|
Filing Date
|
||||||
|
4.12
|
8-K
|
001-07898
|
4.1
|
September 11, 2013
|
||||||
|
4.13
|
8-K
|
001-07898
|
4.1
|
September 10, 2014
|
||||||
|
4.14
|
8-K
|
001-07898
|
4.1
|
September 16, 2015
|
||||||
|
4.15
|
8-K
|
001-07898
|
4.1
|
April 20, 2016
|
||||||
|
4.16
|
8-K
|
001-07898
|
4.1
|
May 3, 2017
|
||||||
77
|
Exhibit Number
|
Incorporated by Reference
|
|||||||||
|
Exhibit Description
|
Form
|
File No.
|
Exhibit
|
Filing Date
|
||||||
|
4.17
|
8-K
|
001-07898
|
10.1
|
November 28, 2016
|
||||||
|
10.1
|
10-Q
|
001-07898
|
10.1
|
December 2, 2008
|
||||||
|
10.2
|
10-K
|
001-07898
|
10.21
|
March 30, 2010
|
||||||
|
10.3
|
DEF 14A
|
001-07898
|
Appendix B
|
April 13, 2012
|
||||||
|
10.4
|
S-8
|
333-34631
|
4.2
|
August 29, 1997
|
||||||
|
10.5
|
10-K
|
001-07898
|
10.16
|
April 19, 1999
|
||||||
|
10.6
|
10-K
|
001-07898
|
10.17
|
April 19, 1999
|
||||||
|
10.7
|
10-K
|
001-07898
|
10.25
|
March 29, 2011
|
||||||
|
10.8
|
10-K
|
001-07898
|
10.22
|
March 31, 2009
|
||||||
|
10.9
|
10-Q
|
001-07898
|
10.2
|
December 12, 2007
|
||||||
|
10.10
|
10-K
|
001-07898
|
10.10
|
March 29, 2011
|
||||||
|
10.11
|
10-K
|
001-07898
|
10.11
|
March 29, 2011
|
||||||
78
|
Exhibit Number
|
Incorporated by Reference
|
|||||||||
|
Exhibit Description
|
Form
|
File No.
|
Exhibit
|
Filing Date
|
||||||
|
10.12
|
10-Q
|
001-07898
|
10.1
|
December 1, 2011
|
||||||
|
10.13
|
10-Q
|
001-07898
|
10.1
|
September 4, 2012
|
||||||
|
10.14
|
10-Q
|
001-07898
|
10.1
|
December 3, 2013
|
||||||
|
10.15
|
10-K
|
001-07898
|
10.1
|
March 31, 2015
|
||||||
|
10.16
|
10-K
|
001-07898
|
10.16
|
April 4, 2017
|
||||||
|
10.17
|
10-Q
|
001-07898
|
10.1
|
September 3, 2008
|
||||||
|
10.18
|
10-Q
|
001-07898
|
10.2
|
September 4, 2012
|
||||||
|
10.19
|
10-Q
|
001-07898
|
10.2
|
September 3, 2008
|
||||||
|
10.20
|
10-Q
|
001-07898
|
10.1
|
June 4, 2004
|
||||||
|
10.21
|
10-Q
|
001-07898
|
10.1
|
December 12, 2007
|
||||||
|
10.22
|
10-Q
|
001-07898
|
10.2
|
December 1, 2010
|
||||||
|
10.23
|
8-K
|
001-07898
|
10.1
|
June 3, 2005
|
||||||
|
10.24
|
8-K
|
001-07898
|
10.2
|
June 3, 2005
|
||||||
|
10.25
|
10-Q
|
001-07898
|
10.1
|
May 31, 2011
|
||||||
79
|
Exhibit Number
|
Incorporated by Reference
|
|||||||||
|
Exhibit Description
|
Form
|
File No.
|
Exhibit
|
Filing Date
|
||||||
|
10.26
|
10-K
|
001-07898
|
10.27
|
April 4, 2017
|
||||||
|
10.27
|
10-K
|
001-07898
|
10.28
|
April 4, 2017
|
||||||
|
10.28
|
DEF 14A
|
001-07898
|
Appendix C
|
April 11, 2016
|
||||||
|
10.29
|
10-K
|
001-07898
|
10.24
|
March 29, 2011
|
||||||
|
10.30
|
10-Q
|
001-07898
|
10.1
|
June 6, 2017
|
||||||
|
12.1
|
||||||||||
|
21.1
|
||||||||||
|
23.1
|
||||||||||
|
24.1
|
||||||||||
|
31.1
|
||||||||||
|
31.2
|
||||||||||
|
32.1
|
||||||||||
80
|
Exhibit Number
|
Incorporated by Reference
|
|||||||||
|
Exhibit Description
|
Form
|
File No.
|
Exhibit
|
Filing Date
|
||||||
|
32.2
|
||||||||||
|
99.1
|
||||||||||
|
101.INS
|
XBRL Instance Document.‡
|
|||||||||
|
|
|
|||||||||
|
101.SCH
|
XBRL Taxonomy Extension Schema Document.‡
|
|||||||||
|
101.CAL
|
XBRL Taxonomy Extension Calculation Linkbase Document.‡
|
|||||||||
|
|
|
|||||||||
|
101.DEF
|
XBRL Taxonomy Extension Definition Linkbase Document.‡
|
|||||||||
|
|
|
|||||||||
|
101.LAB
|
XBRL Taxonomy Extension Label Linkbase Document.‡
|
|||||||||
|
101.PRE
|
XBRL Taxonomy Extension Presentation Linkbase Document.‡
|
|||||||||
|
(1)
|
Schedules have been omitted pursuant to Item 601 (b)(2) of Regulation S-K. Lowe’s Companies, Inc. agrees to furnish supplementally to the Securities and Exchange Commission a copy of any omitted schedule upon request.
|
|||||||||
|
*
|
Indicates a management contract or compensatory plan or arrangement.
|
|||||||||
|
‡
|
Filed herewith.
|
|||||||||
|
†
|
Furnished herewith.
|
|||||||||
None.
81
SIGNATURES
Pursuant to the requirements of Section 13 or 15(d) of the Securities Exchange Act of 1934, the registrant has duly caused this report to be signed on its behalf by the undersigned, thereunto duly authorized.
|
LOWE’S COMPANIES, INC.
|
||
|
(Registrant)
|
||
|
April 2, 2018
|
By: /s/ Robert A. Niblock
|
|
|
Date
|
Robert A. Niblock
Chairman of the Board, President and Chief Executive Officer
|
|
|
April 2, 2018
|
By: /s/ Marshall A. Croom
|
|
|
Date
|
Marshall A. Croom
Chief Financial Officer
|
|
|
April 2, 2018
|
By: /s/ Matthew V. Hollifield
|
|
|
Date
|
Matthew V. Hollifield
Senior Vice President and Chief Accounting Officer
|
|
82
Pursuant to the requirements of the Securities Exchange Act of 1934, this report has been signed below by the following persons on behalf of the registrant and in the capacities and on the dates indicated. Each of the directors of the registrant whose signature appears below hereby appoints Marshall A. Croom, Matthew V. Hollifield and Ross W. McCanless, and each of them severally, as his or her attorney-in-fact to sign in his or her name and behalf, in any and all capacities stated below, and to file with the Securities and Exchange Commission any and all amendments to this report, making such changes in this report as appropriate, and generally to do all such things on their behalf in their capacities as directors and/or officers to enable the registrant to comply with the provisions of the Securities Exchange Act of 1934, and all requirements of the Securities and Exchange Commission.
|
/s/ Robert A. Niblock
|
Chairman of the Board, President,
Chief Executive Officer and Director
|
April 2, 2018
|
|
Robert A. Niblock
|
|
Date
|
|
/s/ Raul Alvarez
|
Director
|
April 2, 2018
|
|
Raul Alvarez
|
|
Date
|
|
/s/ David H. Batchelder
|
Director
|
April 2, 2018
|
|
David H. Batchelder
|
Date
|
|
|
|
|
|
|
/s/ Angela F. Braly
|
Director
|
April 2, 2018
|
|
Angela F. Braly
|
|
Date
|
|
/s/ Sandra B. Cochran
|
Director
|
April 2, 2018
|
|
Sandra B. Cochran
|
Date
|
|
|
|
|
|
|
/s/ Laurie Z. Douglas
|
Director
|
April 2, 2018
|
|
Laurie Z. Douglas
|
|
Date
|
|
|
|
|
|
/s/ Richard W. Dreiling
|
Director
|
April 2, 2018
|
|
Richard W. Dreiling
|
|
Date
|
|
|
|
|
|
/s/ Robert L. Johnson
|
Director
|
April 2, 2018
|
|
Robert L. Johnson
|
|
Date
|
|
|
|
|
|
/s/ Marshall O. Larsen
|
Director
|
April 2, 2018
|
|
Marshall O. Larsen
|
|
Date
|
|
|
|
|
|
/s/ James H. Morgan
|
Director
|
April 2, 2018
|
|
James H. Morgan
|
|
Date
|
|
|
|
|
|
/s/ Bertram L. Scott
|
Director
|
April 2, 2018
|
|
Bertram L. Scott
|
|
Date
|
|
/s/ Lisa W. Wardell
|
Director
|
April 2, 2018
|
|
Lisa W. Wardell
|
Date
|
|
|
/s/ Eric C. Wiseman
|
Director
|
April 2, 2018
|
|
Eric C. Wiseman
|
Date
|
|
83
TABLE OF CONTENTS
Part IItem 1 - BusinessItem 1A - Risk FactorsItem 1B - Unresolved Staff CommentsItem 2 - PropertiesItem 3 - Legal ProceedingsItem 4 - Mine Safety DisclosuresPart IIItem 5 - Market For Registrant S Common Equity, Related Stockholder Matters and Issuer Purchases Of Equity SecuritiesItem 6 - Selected Financial DataItem 7 - Management S Discussion and Analysis Of Financial Condition and Results Of OperationsItem 7A - Quantitative and Qualitative Disclosures About Market RiskItem 8 - Financial Statements and Supplementary DataNote 1 : Summary Of Significant Accounting PoliciesNote 2 : AcquisitionsNote 3 : Investment in Australian Joint VentureNote 4 : Fair Value MeasurementsNote 5 : Property and Accumulated DepreciationNote 6 : Short-term BorrowingsNote 7 : Long-term DebtNote 8 : Shareholders EquityNote 9 : Accounting For Share-based PaymentsNote 10 : Employee Retirement PlansNote 11 : Income TaxesNote 12 : Earnings Per ShareNote 13 : LeasesNote 14 : Commitments and ContingenciesNote 15 : Related PartiesNote 16 : Other InformationNote 17 : Derivative InstrumentsItem 9 - Changes in and Disagreements with Accountants on Accounting and Financial DisclosureItem 9A - Controls and ProceduresItem 9B - Other InformationPart IIIItem 10 - Directors, Executive Officers and Corporate GovernanceItem 11 - Executive CompensationItem 12 - Security Ownership Of Certain Beneficial Owners and Management and Related Stockholder MattersItem 13 - Certain Relationships and Related Transactions, and Director IndependenceItem 14 - Principal Accountant Fees and ServicesPart IVItem 15 Exhibits and Financial Statement SchedulesItem 16 Form 10-k Summary