|
|
|
|
|
|
|
|
|
|
|
|
|
|
|
|
|
|
|
|
|
|
|
|
|
|
|
|
|
|
|
|
|
|
|
|
|
|
|
|
|
|
|
|
|
|
|
|
|
|
|
|
|
|
|
|
Table of Contents
| þ |
QUARTERLY REPORT PURSUANT TO SECTION 13 OR 15(d) OF THE SECURITIES EXCHANGE
ACT OF 1934 |
| o |
TRANSITION REPORT PURSUANT TO SECTION 13 OR 15(d) OF THE SECURITIES EXCHANGE
ACT OF 1934 |
| Delaware | 20-3717839 | |
| (State or other jurisdiction of | (I.R.S. Employer | |
| incorporation or organization) | Identification No.) |
(Address of Principal Executive Offices) (Zip Code)
(Registrant’s telephone number, including area code)
þ Yes o No
| Large accelerated filer o | Accelerated filer o | Non-accelerated filer þ | Smaller reporting company o | |||
| (Do not check if a smaller reporting company) |
o Yes þ No
| Item Number | Page | |||||||
|
|
||||||||
|
|
||||||||
|
|
||||||||
| 1 | ||||||||
|
|
||||||||
| 2 | ||||||||
|
|
||||||||
| 3 | ||||||||
|
|
||||||||
| 4 | ||||||||
|
|
||||||||
| 6 | ||||||||
|
|
||||||||
| 24 | ||||||||
|
|
||||||||
| 47 | ||||||||
|
|
||||||||
| 49 | ||||||||
|
|
||||||||
| 51 | ||||||||
|
|
||||||||
| 51 | ||||||||
|
|
||||||||
| 51 | ||||||||
|
|
||||||||
| 51 | ||||||||
|
|
||||||||
| 51 | ||||||||
|
|
||||||||
| 51 | ||||||||
|
|
||||||||
| 51 | ||||||||
|
|
||||||||
| 51 | ||||||||
|
|
||||||||
| 53 | ||||||||
| EX-31.1 | ||||||||
| EX-31.2 | ||||||||
| EX-32.1 | ||||||||
| EX-32.2 | ||||||||
| EX-101 INSTANCE DOCUMENT | ||||||||
| EX-101 SCHEMA DOCUMENT | ||||||||
| EX-101 CALCULATION LINKBASE DOCUMENT | ||||||||
| EX-101 LABELS LINKBASE DOCUMENT | ||||||||
| EX-101 PRESENTATION LINKBASE DOCUMENT | ||||||||
| EX-101 DEFINITION LINKBASE DOCUMENT | ||||||||
i
Table of Contents
ii
Table of Contents
| Three Months Ended | Six Months Ended | |||||||||||||||
| June 30, | June 30, | |||||||||||||||
| 2011 | 2010 | 2011 | 2010 | |||||||||||||
|
REVENUES:
|
||||||||||||||||
|
Commissions
|
$ | 459,882 | $ | 420,169 | $ | 911,759 | $ | 809,141 | ||||||||
|
Advisory fees
|
264,289 | 215,146 | 508,376 | 421,476 | ||||||||||||
|
Asset-based fees
|
90,504 | 77,436 | 180,327 | 148,886 | ||||||||||||
|
Transaction and other fees
|
68,755 | 68,132 | 142,504 | 135,495 | ||||||||||||
|
Interest income, net of operating interest expense
|
5,110 | 4,906 | 10,252 | 9,777 | ||||||||||||
|
Other
|
5,456 | 4,372 | 14,647 | 8,792 | ||||||||||||
|
|
||||||||||||||||
|
Net revenues
|
893,996 | 790,161 | 1,767,865 | 1,533,567 | ||||||||||||
|
|
||||||||||||||||
|
EXPENSES:
|
||||||||||||||||
|
Commissions and advisory fees
|
624,687 | 547,296 | 1,219,365 | 1,052,158 | ||||||||||||
|
Compensation and benefits
|
81,410 | 74,822 | 165,552 | 148,397 | ||||||||||||
|
Promotional
|
14,789 | 11,294 | 34,325 | 25,644 | ||||||||||||
|
Depreciation and amortization
|
18,407 | 22,110 | 36,572 | 47,700 | ||||||||||||
|
Occupancy and equipment
|
12,394 | 11,745 | 27,919 | 23,763 | ||||||||||||
|
Professional services
|
12,489 | 13,468 | 22,653 | 23,267 | ||||||||||||
|
Brokerage, clearing and exchange
|
9,401 | 9,242 | 19,050 | 17,582 | ||||||||||||
|
Communications and data processing
|
8,906 | 8,290 | 17,588 | 16,816 | ||||||||||||
|
Regulatory fees and expenses
|
6,372 | 6,529 | 12,944 | 12,677 | ||||||||||||
|
Travel and entertainment
|
3,218 | 3,224 | 7,021 | 5,620 | ||||||||||||
|
Restructuring charges
|
4,814 | 4,622 | 5,351 | 8,571 | ||||||||||||
|
Other
|
3,476 | 3,229 | 6,162 | 8,030 | ||||||||||||
|
|
||||||||||||||||
|
Total operating expenses
|
800,363 | 715,871 | 1,574,502 | 1,390,225 | ||||||||||||
|
Non-operating interest expense
|
18,154 | 27,683 | 36,326 | 52,019 | ||||||||||||
|
Loss on extinguishment of debt
|
— | 37,979 | — | 37,979 | ||||||||||||
|
|
||||||||||||||||
|
Total expenses
|
818,517 | 781,533 | 1,610,828 | 1,480,223 | ||||||||||||
|
|
||||||||||||||||
|
INCOME BEFORE PROVISION FOR INCOME TAXES
|
75,479 | 8,628 | 157,037 | 53,344 | ||||||||||||
|
PROVISION FOR INCOME TAXES
|
29,972 | 628 | 62,531 | 19,790 | ||||||||||||
|
|
||||||||||||||||
|
NET INCOME
|
$ | 45,507 | $ | 8,000 | $ | 94,506 | $ | 33,554 | ||||||||
|
|
||||||||||||||||
|
EARNINGS PER SHARE (Note 13):
|
||||||||||||||||
|
Basic
|
$ | 0.41 | $ | 0.09 | $ | 0.86 | $ | 0.38 | ||||||||
|
|
||||||||||||||||
|
Diluted
|
$ | 0.40 | $ | 0.08 | $ | 0.82 | $ | 0.33 | ||||||||
|
|
||||||||||||||||
1
Table of Contents
| June 30, | December 31, | |||||||
| 2011 | 2010 | |||||||
|
ASSETS
|
||||||||
|
Cash and cash equivalents
|
$ | 681,471 | $ | 419,208 | ||||
|
Cash and securities segregated under federal and other regulations
|
225,888 | 373,634 | ||||||
|
Receivables from:
|
||||||||
|
Clients, net of allowance of $656 at June 30, 2011 and $655 at December 31, 2010
|
288,185 | 271,051 | ||||||
|
Product sponsors, broker-dealers and clearing organizations
|
160,345 | 203,332 | ||||||
|
Others, net of allowances of $7,356 at June 30, 2011 and $6,796 at December 31, 2010
|
187,285 | 169,391 | ||||||
|
Securities owned:
|
||||||||
|
Trading(1)
|
9,740 | 9,259 | ||||||
|
Held-to-maturity
|
11,651 | 9,563 | ||||||
|
Securities borrowed
|
11,550 | 8,391 | ||||||
|
Income taxes receivable
|
18,060 | 144,041 | ||||||
|
Fixed assets, net of accumulated depreciation and amortization of $292,384 at June 30,
2011 and $276,501 at December 31, 2010
|
81,274 | 78,671 | ||||||
|
Goodwill
|
1,329,234 | 1,293,366 | ||||||
|
Intangible assets, net of accumulated amortization of $191,949 at June 30, 2011 and
$172,726 at December 31, 2010
|
558,488 | 560,077 | ||||||
|
Debt issuance costs, net of accumulated amortization of $16,652 at June 30, 2011 and
$14,106 at December 31, 2010
|
21,165 | 23,711 | ||||||
|
Other assets
|
78,453 | 82,472 | ||||||
|
|
||||||||
|
Total assets
|
$ | 3,662,789 | $ | 3,646,167 | ||||
|
|
||||||||
|
LIABILITIES AND STOCKHOLDERS’ EQUITY
|
||||||||
|
LIABILITIES:
|
||||||||
|
Drafts payable
|
$ | 137,787 | $ | 182,489 | ||||
|
Payables to clients
|
414,808 | 383,289 | ||||||
|
Payables to broker-dealers and clearing organizations
|
37,139 | 39,070 | ||||||
|
Accrued commissions and advisory fees payable
|
111,336 | 130,408 | ||||||
|
Accounts payable and accrued liabilities
|
161,676 | 154,586 | ||||||
|
Unearned revenue
|
64,078 | 53,618 | ||||||
|
Interest rate swaps
|
2,836 | 7,281 | ||||||
|
Securities sold but not yet purchased — at fair value
|
4,061 | 4,821 | ||||||
|
Senior credit facilities
|
1,339,653 | 1,386,639 | ||||||
|
Deferred income taxes — net
|
125,959 | 130,211 | ||||||
|
|
||||||||
|
Total liabilities
|
2,399,333 | 2,472,412 | ||||||
|
|
||||||||
|
STOCKHOLDERS’ EQUITY:
|
||||||||
|
Common stock, $.001 par value; 600,000,000 shares authorized; 110,125,404 shares
issued at June 30, 2011 and 108,714,757 shares issued and outstanding at December
31, 2010
|
110 | 109 | ||||||
|
Additional paid-in capital
|
1,123,739 | 1,051,722 | ||||||
|
Treasury stock, at cost — 2,283,854 shares at June 30, 2011 and 0 shares at December
31, 2010
|
(79,568 | ) | — | |||||
|
Accumulated other comprehensive loss
|
(1,751 | ) | (4,496 | ) | ||||
|
Retained earnings
|
220,926 | 126,420 | ||||||
|
|
||||||||
|
Total stockholders’ equity
|
1,263,456 | 1,173,755 | ||||||
|
|
||||||||
|
Total liabilities and stockholders’ equity
|
$ | 3,662,789 | $ | 3,646,167 | ||||
|
|
||||||||
| (1) Includes $900 and $1,010 pledged to clearing organizations at June 30, 2011 and December 31, 2010, respectively. | ||
2
Table of Contents
| Accumulated | ||||||||||||||||||||||||||||||||||||
| Additional | Other | Total | ||||||||||||||||||||||||||||||||||
| Common Stock | Paid-In | Treasury Stock | Stockholder | Comprehensive | Retained | Stockholders’ | ||||||||||||||||||||||||||||||
| Shares | Amount | Capital | Shares | Amount | Loans | Loss | Earnings | Equity | ||||||||||||||||||||||||||||
|
BALANCE — December 31, 2009
|
94,215 | $ | 87 | $ | 679,277 | — | $ | — | $ | (499 | ) | $ | (11,272 | ) | $ | 183,282 | $ | 850,875 | ||||||||||||||||||
|
Comprehensive income:
|
||||||||||||||||||||||||||||||||||||
|
Net income
|
33,554 | 33,554 | ||||||||||||||||||||||||||||||||||
|
Unrealized gain on
interest rate swaps, net
of tax expense of $1,761
|
4,673 | 4,673 | ||||||||||||||||||||||||||||||||||
|
|
||||||||||||||||||||||||||||||||||||
|
Total comprehensive income
|
38,227 | |||||||||||||||||||||||||||||||||||
|
Exercise of stock options
|
26 | 51 | 51 | |||||||||||||||||||||||||||||||||
|
Excess tax benefits from
share-based compensation
|
226 | 226 | ||||||||||||||||||||||||||||||||||
|
Stockholder loans
|
448 | 448 | ||||||||||||||||||||||||||||||||||
|
Share-based compensation
|
7,568 | 7,568 | ||||||||||||||||||||||||||||||||||
|
Issuance of common stock
|
20 | 468 | 468 | |||||||||||||||||||||||||||||||||
|
|
||||||||||||||||||||||||||||||||||||
|
BALANCE — June 30, 2010
|
94,261 | $ | 87 | $ | 687,590 | — | $ | — | $ | (51 | ) | $ | (6,599 | ) | $ | 216,836 | $ | 897,863 | ||||||||||||||||||
|
|
||||||||||||||||||||||||||||||||||||
|
BALANCE — December 31, 2010
|
108,715 | $ | 109 | $ | 1,051,722 | — | $ | — | $ | — | $ | (4,496 | ) | $ | 126,420 | $ | 1,173,755 | |||||||||||||||||||
|
Comprehensive income:
|
||||||||||||||||||||||||||||||||||||
|
Net income
|
94,506 | 94,506 | ||||||||||||||||||||||||||||||||||
|
Unrealized gain on
interest rate swaps, net
of tax expense of $1,700
|
2,745 | 2,745 | ||||||||||||||||||||||||||||||||||
|
|
||||||||||||||||||||||||||||||||||||
|
Total comprehensive income
|
97,251 | |||||||||||||||||||||||||||||||||||
|
Treasury stock purchases
|
(2,284 | ) | (79,568 | ) | (79,568 | ) | ||||||||||||||||||||||||||||||
|
Exercise of stock options
|
1,410 | 1 | 6,971 | 6,972 | ||||||||||||||||||||||||||||||||
|
Excess tax benefits from
share-based compensation
|
55,847 | 55,847 | ||||||||||||||||||||||||||||||||||
|
Share-based compensation
|
9,199 | 9,199 | ||||||||||||||||||||||||||||||||||
|
|
||||||||||||||||||||||||||||||||||||
|
BALANCE — June 30, 2011
|
110,125 | $ | 110 | $ | 1,123,739 | (2,284 | ) | $ | (79,568 | ) | $ | — | $ | (1,751 | ) | $ | 220,926 | $ | 1,263,456 | |||||||||||||||||
|
|
||||||||||||||||||||||||||||||||||||
3
Table of Contents
| Six Months Ended | ||||||||
| June 30, | ||||||||
| 2011 | 2010 | |||||||
|
CASH FLOWS FROM OPERATING ACTIVITIES:
|
||||||||
|
Net income
|
$ | 94,506 | $ | 33,554 | ||||
|
Adjustments to reconcile net income to net cash provided by operating activities:
|
||||||||
|
Noncash items:
|
||||||||
|
Depreciation and amortization
|
36,572 | 47,700 | ||||||
|
Amortization of debt issuance costs
|
2,546 | 2,350 | ||||||
|
Excess tax benefits from share-based compensation
|
(55,847 | ) | (226 | ) | ||||
|
Share-based compensation
|
9,199 | 7,568 | ||||||
|
Impairment of fixed assets
|
— | 840 | ||||||
|
Loss on extinguishment of debt
|
— | 37,979 | ||||||
|
Provision for bad debts
|
799 | 281 | ||||||
|
Deferred income tax provision
|
(5,952 | ) | (17,519 | ) | ||||
|
Impairment of intangible assets
|
1,716 | — | ||||||
|
Lease abandonment
|
414 | — | ||||||
|
Loan forgiveness
|
756 | 2,788 | ||||||
|
Other
|
245 | 552 | ||||||
|
Changes in operating assets and liabilities:
|
||||||||
|
Cash and securities segregated under federal and other regulations
|
147,746 | 31,358 | ||||||
|
Receivables from clients
|
(17,135 | ) | (8,558 | ) | ||||
|
Receivables from product sponsors, broker-dealers and clearing organizations
|
42,987 | 1,692 | ||||||
|
Receivables from others
|
(18,675 | ) | (9,759 | ) | ||||
|
Securities owned
|
(231 | ) | (3,250 | ) | ||||
|
Securities borrowed
|
(3,159 | ) | 3,297 | |||||
|
Other assets
|
(17,397 | ) | (5,877 | ) | ||||
|
Drafts payable
|
(44,702 | ) | 6,471 | |||||
|
Payables to clients
|
31,519 | (76,140 | ) | |||||
|
Payables to broker-dealers and clearing organizations
|
(1,931 | ) | 6,664 | |||||
|
Accrued commissions and advisory fees payable
|
(19,072 | ) | 11,191 | |||||
|
Accounts payable and accrued liabilities
|
(26,716 | ) | (9,057 | ) | ||||
|
Unearned revenue
|
10,460 | 9,090 | ||||||
|
Income taxes receivable/payable
|
181,828 | (18,553 | ) | |||||
|
Securities sold but not yet purchased
|
(760 | ) | (1,412 | ) | ||||
|
|
||||||||
|
Net cash provided by operating activities
|
349,716 | 53,024 | ||||||
|
|
||||||||
4
Table of Contents
| Six Months Ended | ||||||||
| June 30, | ||||||||
| 2011 | 2010 | |||||||
|
CASH FLOWS FROM INVESTING ACTIVITIES:
|
||||||||
|
Capital expenditures
|
$ | (12,500 | ) | $ | (3,652 | ) | ||
|
Purchase of securities classified as held-to-maturity
|
(3,782 | ) | (2,008 | ) | ||||
|
Proceeds from maturity of securities classified as held-to-maturity
|
1,650 | 3,350 | ||||||
|
Acquisitions (Note 3)
|
(37,184 | ) | — | |||||
|
Deposits of restricted cash
|
(3,040 | ) | (3,016 | ) | ||||
|
Release of restricted cash
|
18,546 | 2,605 | ||||||
|
|
||||||||
|
Net cash used in investing activities
|
(36,310 | ) | (2,721 | ) | ||||
|
|
||||||||
|
CASH FLOWS FROM FINANCING ACTIVITIES:
|
||||||||
|
Repayment of senior credit facilities
|
(46,986 | ) | (5,598 | ) | ||||
|
Proceeds from senior credit facilities
|
— | 566,700 | ||||||
|
Redemption of subordinated notes
|
— | (579,563 | ) | |||||
|
Payment of debt issuance costs
|
— | (7,181 | ) | |||||
|
Payment of deferred transaction costs
|
— | (1,259 | ) | |||||
|
Purchase of treasury stock
|
(66,976 | ) | — | |||||
|
Proceeds from stock options exercised
|
6,972 | 51 | ||||||
|
Excess tax benefits from share-based compensation
|
55,847 | 226 | ||||||
|
Issuance of common stock
|
— | 468 | ||||||
|
|
||||||||
|
Net cash used in financing activities
|
(51,143 | ) | (26,156 | ) | ||||
|
|
||||||||
|
NET INCREASE IN CASH AND CASH EQUIVALENTS
|
262,263 | 24,147 | ||||||
|
CASH AND CASH EQUIVALENTS — Beginning of period
|
419,208 | 378,594 | ||||||
|
|
||||||||
|
CASH AND CASH EQUIVALENTS — End of period
|
$ | 681,471 | $ | 402,741 | ||||
|
|
||||||||
|
SUPPLEMENTAL DISCLOSURES OF CASH FLOW INFORMATION:
|
||||||||
|
Interest paid
|
$ | 36,362 | $ | 54,436 | ||||
|
|
||||||||
|
Income taxes paid
|
$ | 29,870 | $ | 56,201 | ||||
|
|
||||||||
|
NONCASH DISCLOSURES:
|
||||||||
|
Pending settlement of treasury stock purchases
|
$ | 12,592 | $ | — | ||||
|
|
||||||||
|
Capital expenditures purchased through short-term credit
|
$ | 3,506 | $ | 1,224 | ||||
|
|
||||||||
|
Increase in unrealized gain on interest rate swaps, net of tax expense
|
$ | 2,745 | $ | 4,673 | ||||
|
|
||||||||
|
Discount on proceeds from senior credit facilities recorded as debt issuance costs
|
$ | — | $ | 13,300 | ||||
|
|
||||||||
5
Table of Contents
6
Table of Contents
7
Table of Contents
| CCP | NRP | Total | ||||||||||
|
Goodwill
|
$ | 23,294 | $ | 12,574 | $ | 35,868 | ||||||
|
Accounts receivable
|
770 | — | 770 | |||||||||
|
Other assets
|
190 | — | 190 | |||||||||
|
Intangibles
|
7,550 | 11,800 | 19,350 | |||||||||
|
Fixed assets(1)
|
3,950 | — | 3,950 | |||||||||
|
Accounts payable and accrued liabilities
|
(1,993 | ) | (190 | ) | (2,183 | ) | ||||||
|
|
||||||||||||
|
Net assets acquired
|
$ | 33,761 | $ | 24,184 | $ | 57,945 | ||||||
|
|
||||||||||||
| (1) | Fixed assets acquired from CCP relate primarily to internally developed software, which amortizes over 5 years. |
| CCP | NRP | Total | ||||||||||
|
Cash payments, net of cash acquired
|
$ | 19,969 | $ | 17,215 | $ | 37,184 | ||||||
|
Cash placed in escrow
|
2,250 | 3,669 | 5,919 | |||||||||
|
Contingent consideration
|
11,542 | 3,300 | 14,842 | |||||||||
|
|
||||||||||||
|
Total purchase price
|
$ | 33,761 | $ | 24,184 | $ | 57,945 | ||||||
|
|
||||||||||||
8
Table of Contents
|
Amortization
Period |
Amount
Assigned |
|||||||
|
CCP
|
||||||||
|
Client relationships
|
15.0 years | $ | 7,550 | |||||
|
|
||||||||
|
|
||||||||
|
NRP
|
||||||||
|
Client relationships
|
11.0 years | 4,730 | ||||||
|
Advisor relationships
|
9.0 years | 4,080 | ||||||
|
Product sponsor relationships
|
4.0 years | 2,990 | ||||||
|
|
||||||||
|
Total intangible assets acquired from NRP
|
$ | 11,800 | ||||||
|
|
||||||||
| Accrued | Accrued | Total | ||||||||||||||||||||||
| Balance at | Balance at | Expected | ||||||||||||||||||||||
| December 31, | Costs | June 30, | Restructuring | |||||||||||||||||||||
| 2010 | Incurred(1) | Payments | Non-cash | 2011 | Costs | |||||||||||||||||||
|
Conversion and transfer costs
|
$ | — | $2,544 | $(2,114 | ) | $ | — | $ 430 | $ 28,650 | |||||||||||||||
|
Contract termination fees
|
— | 394 | — | — | 394 | 11,400 | ||||||||||||||||||
|
Advisor retention and related benefits
|
— | 325 | (305 | ) | (20 | ) | — | 7,000 | ||||||||||||||||
|
Asset impairments
|
— | 1,716 | — | (1,716 | ) | — | 5,600 | |||||||||||||||||
|
|
||||||||||||||||||||||||
|
Total
|
$ | — | $4,979 | $(2,419 | ) | $ | (1,736 | ) | $ 824 | $ 52,650 | ||||||||||||||
|
|
||||||||||||||||||||||||
| (1) At June 30, 2011, costs incurred represent the total cumulative costs incurred. | ||
9
Table of Contents
| • | Level 1 — Quoted prices in active markets for identical assets or liabilities. |
| • | Level 2 — Observable inputs other than quoted prices included in Level 1, such as quoted prices for similar assets and liabilities in active markets; quoted prices for identical or similar assets and liabilities in markets that are not active; or other inputs that are observable or can be corroborated by observable market data. |
| • | Level 3 — Unobservable inputs that are supported by little or no market activity and that are significant to the fair value of the assets or liabilities. This includes certain pricing models, discounted cash flow methodologies and similar techniques that use significant unobservable inputs. |
10
Table of Contents
| Quoted | ||||||||||||||||
| Prices in | ||||||||||||||||
| Active | Significant | |||||||||||||||
| Markets for | Other | Significant | ||||||||||||||
| Identical | Observable | Unobservable | ||||||||||||||
| Assets | Inputs | Inputs | Fair Value | |||||||||||||
| (Level 1) | (Level 2) | (Level 3) | Measurements | |||||||||||||
|
At June 30, 2011:
|
||||||||||||||||
|
Assets
|
||||||||||||||||
|
Cash equivalents
|
$ | 516,357 | $ | — | $ | — | $ | 516,357 | ||||||||
|
Securities owned — trading:
|
||||||||||||||||
|
Money market funds
|
529 | — | — | 529 | ||||||||||||
|
Mutual funds
|
7,399 | — | — | 7,399 | ||||||||||||
|
Equity securities
|
74 | — | — | 74 | ||||||||||||
|
Debt securities
|
— | 838 | — | 838 | ||||||||||||
|
U.S. treasury obligations
|
900 | — | — | 900 | ||||||||||||
|
Total securities owned — trading
|
8,902 | 838 | — | 9,740 | ||||||||||||
|
|
||||||||||||||||
|
Other assets
|
22,819 | — | — | 22,819 | ||||||||||||
|
|
||||||||||||||||
|
Total assets at fair value
|
$ | 548,078 | $ | 838 | $ | — | $ | 548,916 | ||||||||
|
|
||||||||||||||||
|
Liabilities
|
||||||||||||||||
|
Securities sold but not yet purchased:
|
||||||||||||||||
|
Mutual funds
|
$ | 3,313 | $ | — | $ | — | $ | 3,313 | ||||||||
|
Equity securities
|
162 | — | — | 162 | ||||||||||||
|
Debt securities
|
— | 135 | — | 135 | ||||||||||||
|
Certificates of deposit
|
— | 451 | — | 451 | ||||||||||||
|
|
||||||||||||||||
|
Total securities sold but not yet purchased
|
3,475 | 586 | — | 4,061 | ||||||||||||
|
|
||||||||||||||||
|
Interest rate swaps
|
— | 2,836 | — | 2,836 | ||||||||||||
|
Accounts payable and accrued liabilities
|
— | — | 15,111 | 15,111 | ||||||||||||
|
|
||||||||||||||||
|
Total liabilities at fair value
|
$ | 3,475 | $ | 3,422 | $ | 15,111 | $ | 22,008 | ||||||||
|
|
||||||||||||||||
|
Six Months Ended June 30, 2011
(in thousands):
|
|
Fair value at December 31, 2010
|
$ | — | ||
|
Issuances of contingent consideration
|
16,842 | |||
|
Total unrealized losses included in earnings
|
269 | |||
|
Payments
|
(2,000 | ) | ||
|
|
||||
|
Fair value at June 30, 2011
|
$ | 15,111 | ||
|
|
||||
11
Table of Contents
| Quoted | ||||||||||||||||
| Prices in | ||||||||||||||||
| Active | Significant | |||||||||||||||
| Markets for | Other | Significant | ||||||||||||||
| Identical | Observable | Unobservable | ||||||||||||||
| Assets | Inputs | Inputs | Fair Value | |||||||||||||
| (Level 1) | (Level 2) | (Level 3) | Measurements | |||||||||||||
|
At December 31, 2010:
|
||||||||||||||||
|
Assets
|
||||||||||||||||
|
Cash equivalents
|
$ | 279,048 | $ | — | $ | — | $ | 279,048 | ||||||||
|
Securities owned — trading:
|
||||||||||||||||
|
Money market funds
|
316 | — | — | 316 | ||||||||||||
|
Mutual funds
|
7,300 | — | — | 7,300 | ||||||||||||
|
Equity securities
|
17 | — | — | 17 | ||||||||||||
|
Debt securities
|
— | 516 | — | 516 | ||||||||||||
|
U.S. treasury obligations
|
1,010 | — | — | 1,010 | ||||||||||||
|
Certificates of deposit
|
— | 100 | — | 100 | ||||||||||||
|
|
||||||||||||||||
|
Total securities owned — trading
|
8,643 | 616 | — | 9,259 | ||||||||||||
|
|
||||||||||||||||
|
Other assets
|
17,175 | — | — | 17,175 | ||||||||||||
|
|
||||||||||||||||
|
Total assets at fair value
|
$ | 304,866 | $ | 616 | $ | — | $ | 305,482 | ||||||||
|
|
||||||||||||||||
|
Liabilities
|
||||||||||||||||
|
Securities sold but not yet purchased:
|
||||||||||||||||
|
Mutual funds
|
$ | 4,563 | $ | — | $ | — | $ | 4,563 | ||||||||
|
Equity securities
|
204 | — | — | 204 | ||||||||||||
|
Debt securities
|
— | 54 | — | 54 | ||||||||||||
|
|
||||||||||||||||
|
Total securities sold but not yet purchased
|
4,767 | 54 | — | 4,821 | ||||||||||||
|
|
||||||||||||||||
|
Interest rate swaps
|
— | 7,281 | — | 7,281 | ||||||||||||
|
|
||||||||||||||||
|
Total liabilities at fair value
|
$ | 4,767 | $ | 7,335 | $ | — | $ | 12,102 | ||||||||
|
|
||||||||||||||||
| Gross | ||||||||||||
| Amortized | Unrealized | |||||||||||
| Cost | Gains | Fair Value | ||||||||||
|
At June 30, 2011:
|
||||||||||||
|
U.S. government notes
|
$ | 11,651 | $ 50 | $ | 11,701 | |||||||
|
|
||||||||||||
|
|
||||||||||||
|
At December 31, 2010:
|
||||||||||||
|
U.S. government notes
|
$ | 9,563 | $ 69 | $ | 9,632 | |||||||
|
|
||||||||||||
| Within 1 Year | 1-3 Years | Total | ||||||||||
|
U.S. government notes — at amortized cost
|
$ 7,373 | $ 4,278 | $ | 11,651 | ||||||||
|
|
||||||||||||
|
U.S. government notes — at fair value
|
$ 7,394 | $ 4,307 | $ | 11,701 | ||||||||
|
|
||||||||||||
12
Table of Contents
|
Balance at December 31, 2010
|
$ | 1,293,366 | ||
|
Acquisition of CCP (Note 3)
|
23,294 | (1) | ||
|
Acquisition of NRP (Note 3)
|
12,574 | (1) | ||
|
|
||||
|
Balance at June 30, 2011
|
$ | 1,329,234 | ||
|
|
||||
| (1) | This is a provisional amount and is subject to change (see Note 3). |
| Weighted | Gross | Net | ||||||||||||||
| Average Life | Carrying | Accumulated | Carrying | |||||||||||||
| Remaining | Value | Amortization | Value | |||||||||||||
|
At June 30, 2011:
|
||||||||||||||||
|
Definite-lived intangible assets:
|
||||||||||||||||
|
Advisor and financial institution relationships
|
13.8 | $ | 460,788 | $ | (129,410 | ) | $ | 331,378 | ||||||||
|
Product sponsor relationships
|
14.4 | 234,920 | (61,453 | ) | 173,467 | |||||||||||
|
Client relationships
|
13.4 | 14,910 | (1,086 | ) | 13,824 | |||||||||||
|
|
||||||||||||||||
|
Total definite-lived intangible assets
|
$ | 710,618 | $ | (191,949 | ) | $ | 518,669 | |||||||||
|
|
||||||||||||||||
|
Indefinite-lived intangible assets:
|
||||||||||||||||
|
Trademark and trade name
|
39,819 | |||||||||||||||
|
|
||||||||||||||||
|
Total intangible assets
|
$ | 558,488 | ||||||||||||||
|
|
||||||||||||||||
|
At December 31, 2010:
|
||||||||||||||||
|
Definite-lived intangible assets:
|
||||||||||||||||
|
Advisor and financial institution relationships
|
$ | 458,424 | $ | (116,687 | ) | $ | 341,737 | |||||||||
|
Product sponsor relationships
|
231,930 | (55,255 | ) | 176,675 | ||||||||||||
|
Client relationships
|
2,630 | (784 | ) | 1,846 | ||||||||||||
|
|
||||||||||||||||
|
Total definite-lived intangible assets
|
$ | 692,984 | $ | (172,726 | ) | $ | 520,258 | |||||||||
|
|
||||||||||||||||
|
Indefinite-lived intangible assets:
|
||||||||||||||||
|
Trademark and trade name
|
39,819 | |||||||||||||||
|
|
||||||||||||||||
|
Total intangible assets
|
$ | 560,077 | ||||||||||||||
|
|
||||||||||||||||
|
2011 — remainder
|
$ | 19,819 | ||
|
2012
|
39,190 | |||
|
2013
|
38,329 | |||
|
2014
|
38,053 | |||
|
2015
|
37,172 | |||
|
Thereafter
|
346,106 | |||
|
|
||||
|
Total
|
$ | 518,669 | ||
|
|
||||
13
Table of Contents
14
Table of Contents
| June 30, 2011 | December 31, 2010 | |||||||||||||||||||
| Interest | Interest | |||||||||||||||||||
| Maturity | Balance | Rate | Balance | Rate | ||||||||||||||||
|
Senior secured term loan:
|
||||||||||||||||||||
|
Hedged with interest rate swaps
|
6/28/2013 | $ | 65,000 | 2.00 | %(1) | $ | 210,000 | 2.05 | %(5) | |||||||||||
|
Unhedged:
|
||||||||||||||||||||
|
2013 Term Loans
|
6/28/2013 | 239,074 | 1.94 | %(2) | 104,739 | 2.01 | %(6) | |||||||||||||
|
2015 Term Loans
|
6/25/2015 | 479,435 | 4.25 | %(3) | 496,250 | 4.25 | %(7) | |||||||||||||
|
2017 Term Loans
|
6/28/2017 | 556,144 | 5.25 | %(4) | 575,650 | 5.25 | %(8) | |||||||||||||
|
|
||||||||||||||||||||
|
Total borrowings
|
1,339,653 | 1,386,639 | ||||||||||||||||||
|
Less current borrowings (maturities within 12
months)
|
13,971 | 13,971 | ||||||||||||||||||
|
|
||||||||||||||||||||
|
Long-term borrowings — net of current portion
|
$ | 1,325,682 | $ | 1,372,668 | ||||||||||||||||
|
|
||||||||||||||||||||
| (1) | As of June 30, 2011, the variable interest rate for the hedged portion of the 2013 Term Loans is based on the three-month LIBOR of 0.25%, plus the applicable interest rate margin of 1.75%. | |
| (2) | As of June 30, 2011, the variable interest rate for the unhedged portion of the 2013 Term Loans is based on the one-month LIBOR of 0.19%, plus the applicable interest rate margin of 1.75%. | |
| (3) | As of June 30, 2011, the variable interest rate for the unhedged portion of the 2015 Term Loans is based on the greater of the one-month LIBOR of 0.19% or 1.50%, plus the applicable interest rate margin of 2.75%. | |
| (4) | As of June 30, 2011, the variable interest rate for the unhedged portion of the 2017 Term Loans is based on the greater of the one-month LIBOR of 0.19% or 1.50%, plus the applicable interest rate margin of 3.75%. | |
| (5) | As of December 31, 2010, the variable interest rate for the hedged portion of the 2013 Term Loans is based on the three-month LIBOR of 0.30%, plus the applicable interest rate margin of 1.75%. | |
| (6) | As of December 31, 2010, the variable interest rate for the unhedged portion of the 2013 Term Loans is based on the one-month LIBOR of 0.26%, plus the applicable interest rate margin of 1.75%. | |
| (7) | As of December 31, 2010, the variable interest rate for the unhedged portion of the 2015 Term Loans is based on the greater of the one-month LIBOR of 0.26% or 1.50%, plus the applicable interest rate margin of 2.75%. | |
| (8) | As of December 31, 2010, the variable interest rate for the unhedged portion of the 2017 Term Loans is based on the greater of the one-month LIBOR of 0.26% or 1.50%, plus the applicable interest rate margin of 3.75%. |
15
Table of Contents
|
2011 — remainder
|
$ | 6,986 | ||
|
2012
|
13,971 | |||
|
2013
|
310,117 | |||
|
2014
|
10,800 | |||
|
2015
|
467,735 | |||
|
Thereafter
|
530,044 | |||
|
|
||||
|
Total
|
$ | 1,339,653 | ||
|
|
||||
|
2011 — remainder
|
$ | 15,348 | ||
|
2012
|
25,049 | |||
|
2013
|
15,948 | |||
|
2014
|
9,304 | |||
|
2015
|
7,030 | |||
|
Thereafter
|
7,693 | |||
|
|
||||
|
Total(1)
|
$ | 80,372 | ||
|
|
||||
| (1) | Minimum payments have not been reduced by minimum sublease rental income of $6.4 million due in the future under noncancellable subleases. |
16
Table of Contents
17
Table of Contents
| 2011 | 2010 | |||||||
|
Expected life (in years)
|
6.50 | 6.50 | ||||||
|
Expected stock price volatility
|
48.61 | % | 50.30 | % | ||||
|
Expected dividend yield
|
— | — | ||||||
|
Fair value of options
|
$ | 17.54 | $ | 12.31 | ||||
|
Risk-free interest rate
|
2.58 | % | 2.79 | % | ||||
18
Table of Contents
| 2011 | 2010 | |||||||
|
Expected life (in years)
|
9.82 | 9.70 | ||||||
|
Expected stock price volatility
|
49.54 | % | 53.18 | % | ||||
|
Expected dividend yield
|
— | — | ||||||
|
Fair value of options
|
$ | 23.09 | $ | 25.40 | ||||
|
Risk-free interest rate
|
3.50 | % | 3.18 | % | ||||
| Weighted- | ||||||||||||||||
| Average | ||||||||||||||||
| Weighted- | Remaining | Aggregate | ||||||||||||||
| Number | Average | Contractual | Intrinsic | |||||||||||||
| of | Exercise | Term | Value | |||||||||||||
| Shares | Price | (Years) | (In thousands) | |||||||||||||
|
Outstanding — December 31, 2010
|
10,279,052 | $ | 18.12 | |||||||||||||
|
Granted
|
603,312 | 34.10 | ||||||||||||||
|
Exercised
|
(1,401,211 | ) | 4.73 | |||||||||||||
|
Forfeited and expired
|
(323,997 | ) | 26.29 | |||||||||||||
|
|
||||||||||||||||
|
Outstanding — June 30, 2011
|
9,157,156 | $ | 20.94 | 6.84 | $ | 121,558 | ||||||||||
|
|
||||||||||||||||
|
Exercisable — June 30, 2011
|
3,957,985 | $ | 12.03 | 4.59 | $ | 87,788 | ||||||||||
|
|
||||||||||||||||
| Outstanding | Exercisable | |||||||||||||||||||
| Weighted- | Weighted- | Weighted- | ||||||||||||||||||
| Total | Average | Average | Average | |||||||||||||||||
| Number of | Remaining | Exercise | Number of | Exercise | ||||||||||||||||
| Range of Exercise Prices | Shares | Life (Years) | Price | Shares | Price | |||||||||||||||
|
At June 30, 2011:
|
||||||||||||||||||||
|
$1.35 — $2.38
|
2,142,833 | 2.56 | $ | 1.68 | 2,142,833 | $ | 1.68 | |||||||||||||
|
$10.30 — $19.74
|
797,549 | 7.45 | 18.46 | 261,337 | 17.58 | |||||||||||||||
|
$21.60 — $22.08
|
1,926,425 | 7.92 | 22.02 | 522,195 | 21.90 | |||||||||||||||
|
$23.02 — $27.80
|
2,049,769 | 7.07 | 26.52 | 1,031,620 | 27.11 | |||||||||||||||
|
$30.00 — $34.79
|
2,240,580 | 9.52 | 34.19 | — | — | |||||||||||||||
|
|
||||||||||||||||||||
|
|
9,157,156 | 6.83 | $ | 20.94 | 3,957,985 | $ | 12.03 | |||||||||||||
|
|
||||||||||||||||||||
19
Table of Contents
| Weighted Average | ||||||||
| Number of | Grant-Date | |||||||
| Shares | Fair Value | |||||||
|
Nonvested at January 1, 2011
|
10,692 | $ 28.30 | ||||||
|
Granted
|
12,104 | 33.05 | ||||||
|
Vested
|
— | — | ||||||
|
Forfeited
|
— | — | ||||||
|
|
||||||||
|
Nonvested at June 30, 2011
|
22,796 | $ 30.82 | ||||||
|
|
||||||||
20
Table of Contents
| For the Three | For the Six | |||||||||||||||
| Months Ended | Months Ended | |||||||||||||||
| June 30, | June 30, | |||||||||||||||
| 2011 | 2010 | 2011 | 2010 | |||||||||||||
|
Basic earnings per share:
|
||||||||||||||||
|
Net income, as reported
|
$ | 45,507 | $ | 8,000 | $ | 94,506 | $ | 33,554 | ||||||||
|
Less: allocation of undistributed earnings to stock units
|
(582 | ) | (130 | ) | (1,212 | ) | (544 | ) | ||||||||
|
|
||||||||||||||||
|
Net income, for computing basic earnings per share
|
$ | 44,925 | $ | 7,870 | $ | 93,294 | $ | 33,010 | ||||||||
|
|
||||||||||||||||
|
Diluted earnings per share:
|
||||||||||||||||
|
Net income, as reported
|
$ | 45,507 | $ | 8,000 | $ | 94,506 | $ | 33,554 | ||||||||
|
Less: allocation of undistributed earnings to stock units
|
(561 | ) | (113 | ) | (1,167 | ) | (477 | ) | ||||||||
|
|
||||||||||||||||
|
Net income, for computing diluted earnings per share
|
$ | 44,946 | $ | 7,887 | $ | 93,339 | $ | 33,077 | ||||||||
|
|
||||||||||||||||
| For the Three | For the Six | |||||||||||||||
| Months Ended | Months Ended | |||||||||||||||
| June 30, | June 30, | |||||||||||||||
| 2011 | 2010 | 2011 | 2010 | |||||||||||||
|
Basic weighted average number of shares outstanding
|
109,055 | 86,812 | 108,932 | 86,806 | ||||||||||||
|
Dilutive common share equivalents
|
4,095 | 12,675 | 4,223 | 12,442 | ||||||||||||
|
|
||||||||||||||||
|
Diluted weighted average number of shares outstanding
|
113,150 | 99,487 | 113,155 | 99,248 | ||||||||||||
|
|
||||||||||||||||
| For the Three | For the Six | |||||||||||||||
| Months Ended | Months Ended | |||||||||||||||
| June 30, | June 30, | |||||||||||||||
| 2011 | 2010 | 2011 | 2010 | |||||||||||||
|
Basic earnings per share
|
$ | 0.41 | $ | 0.09 | $ | 0.86 | $ | 0.38 | ||||||||
|
Diluted earnings per share
|
$ | 0.40 | $ | 0.08 | $ | 0.82 | $ | 0.33 | ||||||||
21
Table of Contents
| Minimum | ||||||||||||
| Net | Net Capital | Excess Net | ||||||||||
| Capital | Required | Capital | ||||||||||
|
LPL Financial LLC
|
$ | 92,999 | $ | 6,412 | $ | 86,587 | ||||||
|
UVEST Financial Services Group, Inc.
|
$ | 23,781 | $ | 1,283 | $ | 22,498 | ||||||
22
Table of Contents
23
Table of Contents
24
Table of Contents
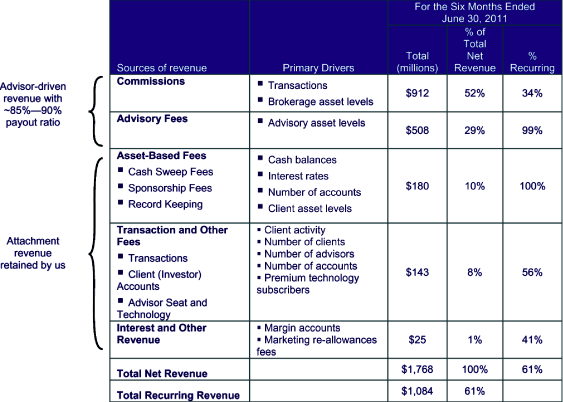
| • | Commissions and Advisory Fees. Transaction-based commissions and advisory fees both represent advisor-generated revenue, generally 85-90% of which is paid to advisors. | |
| Commissions. Transaction-based commission revenues represent gross commissions generated by our advisors, primarily from commissions earned on the sale of various financial products such as fixed and variable annuities, mutual funds, general securities, fixed income, alternative investments and insurance and can vary from period to period based on the overall economic environment, number of trading days in the reporting period and investment activity of our advisors’clients. We also earn trailing commission type revenues (a commission that is paid over time, such as 12(b)-1 fees) on mutual funds and variable annuities held by clients of our advisors. Trail commissions are recurring in nature and are earned based on the current market value of investment holdings. | ||
| Advisory Fees. Advisory fee revenues represent fees charged by us and our advisors to their clients based on the value of advisory assets. Advisory fees are typically billed to clients quarterly, in advance, and are recognized as revenue ratably during the quarter. The value of the assets in the advisory account or the billing date determines the amount billed, and accordingly, the revenues earned in the following three month period. The majority of our accounts are billed using values as of the last business day of the quarter. Some of our advisors conduct their advisory business through separate entities by establishing their own Registered Investment Advisor (“RIA”) pursuant to the Investment Advisers Act of 1940, rather than using our corporate registered RIA. These stand-alone RIAs engage us for technology, clearing, regulatory and custody services, as well as access to our investment advisory platforms. The fee-based production generated by the stand-alone RIA is earned by the advisor, and accordingly not included in our advisory fee revenue. We charge fees to stand-alone RIAs including administrative fees based on the value of assets within these advisory accounts. Such fees are included within asset-based fees and transaction and other fees, as described below. |
25
Table of Contents
| • | Asset-Based Fees. Asset-based fees are comprised of fees from cash sweep programs, our financial product manufacturer sponsorship programs, and omnibus processing and networking services. Pursuant to contractual arrangements, uninvested cash balances in our advisors’ client accounts are swept into either insured deposit accounts at various banks or third-party money market funds, for which we receive fees, including administrative and record-keeping fees based on account type and the invested balances. In addition, we receive fees from certain financial product manufacturers in connection with sponsorship programs that support our marketing and sales-force education and training efforts. We also earn fees on mutual fund assets for which we provide administrative and record-keeping services. Our networking fees represent fees paid to us by mutual fund and annuity product manufacturers in exchange for administrative and record-keeping services that we provide to clients of our advisors. Networking fees are correlated to the number of positions we administer, not the value of assets under administration. | |
| • | Transaction and Other Fees. Revenues earned from transaction and other fees primarily consist of transaction fees and ticket charges, subscription fees, Individual Retirement Account (“IRA”) custodian fees, contract and license fees, conference fees and small/inactive account fees. We charge fees to our advisors and their clients for executing transactions in brokerage and fee-based advisory accounts. We earn subscription fees for the software and technology services provided to our advisors and on IRA custodial services that we provide for their client accounts. We charge monthly administrative fees to our advisors. We charge fees to financial product manufacturers for participating in our training and marketing conferences and fees to our advisors and their clients for accounts that do not meet certain specified thresholds of size or activity. In addition, we host certain advisor conferences that serve as training, sales and marketing events in our first and third fiscal quarters and as a result, we anticipate higher transaction and other fees resulting from the collection of revenues from sponsors and advisors, in comparison to other periods. | |
| • | Interest and Other Revenue. Other revenue includes marketing re-allowances from certain financial product manufacturers as well as interest income from client margin accounts and cash equivalents, net of operating interest expense, and other items. |
| • | Production Expenses. Production expenses are comprised of the following: gross commissions and advisory fees that are earned and paid out to advisors based on the sale of various products and services; production bonuses for achieving certain levels of production; recognition of share-based compensation expense from stock options and warrants granted to advisors and financial institutions based on the fair value of the awards at each interim reporting period; amounts designated by advisors as deferred commissions in a non-qualified deferred compensation plan that are marked to market at each interim reporting period; and brokerage, clearing and exchange fees. We refer to these expenses as the production “payout”. Substantially all of the production payout is variable and correlated to the revenues generated by each advisor. | |
| • | Compensation and Benefits Expense. Compensation and benefits expense includes salaries and wages and related employee benefits and taxes for our employees (including share-based compensation), as well as compensation for temporary employees and consultants. | |
| • | General and Administrative Expenses. General and administrative expenses include promotional fees, occupancy and equipment, communications and data processing, regulatory fees, travel and entertainment and professional services. We host certain advisor conferences that serve as training, sales and marketing events in our first and third fiscal quarters and as a result, we anticipate higher general and administrative expenses in comparison to other periods. | |
| • | Depreciation and Amortization Expense. Depreciation and amortization expense represents the benefits received for using long-lived assets. Those assets represent significant intangible assets established through our acquisitions, as well as fixed assets which include internally developed software, hardware, leasehold improvements and other equipment. | |
| • | Restructuring Charges. Restructuring charges represent expenses incurred as a result of our 2009 consolidation of Associated Securities Corp., Mutual Service Corporation and Waterstone Financial Group, Inc. (together, the “Affiliated Entities”) and our 2011 consolidation of UVEST Financial Services Group, Inc. (“UVEST”). |
26
Table of Contents
| • | Other Expenses. Other expenses include bank fees, other taxes, bad debt expense and other miscellaneous expenses. |
| June 30, | ||||||||||||
| 2011 | 2010 | % Change | ||||||||||
| (unaudited) | ||||||||||||
|
Business Metrics
|
||||||||||||
|
Advisors(1)
|
12,660 | 12,066 | 4.9% | |||||||||
|
Advisory and brokerage assets (in billions)(2)
|
$ | 340.8 | $ | 276.9 | 23.1% | |||||||
|
Advisory assets under management (in billions)(3)
|
$ | 103.2 | $ | 78.9 | 30.8% | |||||||
|
Net new advisory assets (in billions)(4)
|
$ | 6.8 | $ | 3.9 | 74.4% | |||||||
|
Insured cash account balances (in billions)(3)
|
$ | 13.2 | $ | 11.8 | 11.9% | |||||||
|
Money market account balances (in billions)(3)
|
$ | 8.2 | $ | 7.2 | 13.9% | |||||||
| For the Three | For the Six | |||||||||||||||
| Months Ended | Months Ended | |||||||||||||||
| June 30, | June 30, | |||||||||||||||
| 2011 | 2010 | 2011 | 2010 | |||||||||||||
| (unaudited) | ||||||||||||||||
|
Financial Metrics
|
||||||||||||||||
|
Revenue growth from prior period
|
13.1 | % | 18.1 | % | 15.3 | % | 16.9 | % | ||||||||
|
Recurring revenue as a % of net revenue(5)
|
62.4 | % | 59.3 | % | 61.3 | % | 59.7 | % | ||||||||
|
Gross margin (in millions)(6)
|
$ | 259.9 | $ | 233.6 | $ | 529.5 | $ | 463.8 | ||||||||
|
Gross margin as a % of net revenue(6)
|
29.1 | % | 29.6 | % | 29.9 | % | 30.2 | % | ||||||||
|
Net income (in millions)
|
$ | 45.5 | $ | 8.0 | $ | 94.5 | $ | 33.6 | ||||||||
|
Adjusted EBITDA (in millions)
|
$ | 123.0 | $ | 109.9 | $ | 247.3 | $ | 215.3 | ||||||||
|
Adjusted Earnings (in millions)
|
$ | 58.8 | $ | 46.4 | $ | 118.2 | $ | 87.5 | ||||||||
|
Earnings per share — diluted
|
$ | 0.40 | $ | 0.08 | $ | 0.82 | $ | 0.33 | ||||||||
|
Adjusted Earnings per share — diluted
|
$ | 0.52 | $ | 0.47 | $ | 1.04 | $ | 0.88 | ||||||||
| (1) | Advisors are defined as those investment professionals who are licensed to do business with our broker-dealer subsidiaries. | |
| (2) | Advisory and brokerage assets are comprised of assets that are custodied, networked and non-networked and reflect market movement in addition to new assets, inclusive of new business development and net of attrition. | |
| (3) | Advisory assets under management, insured cash account balances and money market account balances are components of advisory and brokerage assets. | |
| (4) | Represents net new advisory assets that are custodied in our fee-based advisory platforms during the six months ended June 30, 2011. Net new advisory assets for the three months ended June 30, 2011 and 2010 were $3.1 billion and $2.4 billion, respectively. | |
| (5) | Recurring revenue is derived from sources such as advisory fees, asset-based fees, trailing commission fees, fees related to our cash sweep programs, interest earned on margin accounts and technology and service fees. | |
| (6) | Gross margin is calculated as net revenues less production expenses. Production expenses consist of the following expense categories from our unaudited condensed consolidated statements of operations: (i) commissions and advisory fees and (ii) brokerage, clearing and exchange. All other expense categories, including depreciation and amortization, are considered general and administrative in nature. Because our gross margin amounts do not include any depreciation and amortization expense, our gross margin amounts may not be comparable to those of others in our industry. |
27
Table of Contents
| • | because non-cash equity grants made to employees at a certain price and point in time do not necessarily reflect how our business is performing at any particular time, share-based compensation expense is not a key measure of our operating performance and | |
| • | because costs associated with acquisitions and the resulting integrations, debt refinancing, restructuring and conversions and equity issuance and related offering costs can vary from period to period and transaction to transaction, expenses associated with these activities are not considered a key measure of our operating performance. |
| • | as a measure of operating performance; | ||
| • | for planning purposes, including the preparation of budgets and forecasts; | ||
| • | to allocate resources to enhance the financial performance of our business; | ||
| • | to evaluate the effectiveness of our business strategies; | ||
| • | in communications with our board of directors concerning our financial performance and | ||
| • | as a factor in determining employee and executive bonuses |
| • | Adjusted EBITDA does not reflect all cash expenditures, future requirements for capital expenditures or contractual commitments | ||
| • | Adjusted EBITDA does not reflect changes in, or cash requirements for, working capital needs and | ||
| • | Adjusted EBITDA does not reflect the significant interest expense, or the cash requirements necessary to service interest or principal payments, on our debt | ||
| • | Adjusted EBITDA can differ significantly from company to company depending on long-term strategic decisions regarding capital structure, the tax jurisdictions in which companies operate and capital investments, limiting its usefulness as a comparative measure |
28
Table of Contents
| For the Three | For the Six | |||||||||||||||
| Months Ended | Months Ended | |||||||||||||||
| June 30, | June 30, | |||||||||||||||
| 2011 | 2010 | 2011 | 2010 | |||||||||||||
| (unaudited) | ||||||||||||||||
|
Net income
|
$ | 45,507 | $ | 8,000 | $ | 94,506 | $ | 33,554 | ||||||||
|
Interest expense
|
18,154 | 27,683 | 36,326 | 52,019 | ||||||||||||
|
Income tax expense
|
29,972 | 628 | 62,531 | 19,790 | ||||||||||||
|
Amortization of purchased intangible assets and software(1)
|
9,686 | 10,938 | 19,223 | 25,049 | ||||||||||||
|
Depreciation and amortization of all other fixed assets
|
8,721 | 11,172 | 17,349 | 22,651 | ||||||||||||
|
|
||||||||||||||||
|
EBITDA
|
112,040 | 58,421 | 229,935 | 153,063 | ||||||||||||
|
EBITDA Adjustments:
|
||||||||||||||||
|
Share-based compensation expense(2)
|
3,427 | 2,239 | 7,287 | 4,775 | ||||||||||||
|
Acquisition and integration related expenses(3)
|
1,548 | 3,377 | 2,964 | 3,517 | ||||||||||||
|
Restructuring and conversion costs(4)
|
4,599 | 5,619 | 5,434 | 13,598 | ||||||||||||
|
Debt amendment and extinguishment costs(5)
|
— | 38,484 | — | 38,605 | ||||||||||||
|
Equity issuance and related offering costs
|
1,349 | 1,687 | 1,641 | 1,687 | ||||||||||||
|
Other(6)
|
34 | 37 | 67 | 76 | ||||||||||||
|
|
||||||||||||||||
|
Total EBITDA Adjustments
|
10,957 | 51,443 | 17,393 | 62,258 | ||||||||||||
|
|
||||||||||||||||
|
Adjusted EBITDA
|
$ | 122,997 | $ | 109,864 | $ | 247,328 | $ | 215,321 | ||||||||
|
|
||||||||||||||||
| (1) | Represents amortization of intangible assets and software as a result of our purchase accounting adjustments from our merger transaction in 2005 and our various acquisitions. | |
| (2) | Represents share-based compensation expense related to vested stock options awarded to employees and non-executive directors based on the grant date fair value under the Black-Scholes valuation model. | |
| (3) | Represents acquisition and integration costs resulting from various acquisitions. | |
| (4) | Represents organizational restructuring charges and conversion and other related costs incurred resulting from the 2009 consolidation of the Affiliated Entities and the 2011 consolidation of UVEST. | |
| (5) | Represents debt amendment costs incurred in 2010 for amending and restating our credit agreement to establish a new term loan tranche and to extend the maturity of an existing tranche on our senior credit facilities. | |
| (6) | Represents other taxes. |
29
Table of Contents
| • | because non-cash equity grants made to employees at a certain price and point in time do not necessarily reflect how our business is performing at any particular time, share-based compensation expense is not a key measure of our operating performance; | ||
| • | because costs associated with acquisitions and related integrations, debt refinancing, restructuring and conversions, and equity issuance and related offering costs can vary from period to period and transaction to transaction, expenses associated with these activities are not considered a key measure of our operating performance and | ||
| • | because amortization expenses can vary substantially from company to company and from period to period depending upon each company’s financing and accounting methods, the fair value and average expected life of acquired intangible assets and the method by which assets were acquired, the amortization of intangible assets obtained in acquisitions are not considered a key measure in comparing our operating performance. |
| • | Adjusted Earnings and Adjusted Earnings per share do not reflect our cash expenditures, or future requirements for capital expenditures or contractual commitments; | ||
| • | Adjusted Earnings and Adjusted Earnings per share do not reflect changes in, or cash requirements for, our working capital needs and | ||
| • | Other companies in our industry may calculate Adjusted Earnings and Adjusted Earnings per share differently than we do, limiting their usefulness as comparative measures. |
30
Table of Contents
| For the Three | For the Six | |||||||||||||||
| Months Ended | Months Ended | |||||||||||||||
| June 30, | June 30, | |||||||||||||||
| 2011 | 2010 | 2011 | 2010 | |||||||||||||
| (unaudited) | ||||||||||||||||
|
Net income
|
$ | 45,507 | $ | 8,000 | $ | 94,506 | $ | 33,554 | ||||||||
|
After-Tax:
|
||||||||||||||||
|
EBITDA Adjustments(1)
|
||||||||||||||||
|
Share-based compensation expense(2)
|
2,677 | 1,870 | 5,578 | 3,880 | ||||||||||||
|
Acquisition and integration related expenses
|
955 | 2,052 | 1,829 | 2,137 | ||||||||||||
|
Restructuring and conversion costs
|
2,838 | 3,415 | 3,353 | 8,238 | ||||||||||||
|
Debt amendment and extinguishment costs
|
— | 23,387 | — | 23,460 | ||||||||||||
|
Equity issuance and related offering costs
|
832 | 1,025 | 1,012 | 1,025 | ||||||||||||
|
Other
|
21 | 22 | 41 | 46 | ||||||||||||
|
|
||||||||||||||||
|
Total EBITDA Adjustments
|
7,323 | 31,771 | 11,813 | 38,786 | ||||||||||||
|
|
||||||||||||||||
|
Amortization of purchased intangible assets and software(1)
|
5,977 | 6,647 | 11,861 | 15,177 | ||||||||||||
|
|
||||||||||||||||
|
Adjusted Earnings
|
$ | 58,807 | $ | 46,418 | $ | 118,180 | $ | 87,517 | ||||||||
|
|
||||||||||||||||
|
Adjusted Earnings per share(3)
|
$ | 0.52 | $ | 0.47 | $ | 1.04 | $ | 0.88 | ||||||||
|
Weighted average shares outstanding — diluted(4)
|
113,150 | 99,487 | 113,155 | 99,248 | ||||||||||||
| (1) | EBITDA Adjustments and amortization of purchased intangible assets and software have been tax effected using a federal rate of 35.0% and the applicable effective state rate which was 3.30% for the three and six month periods ended June 30, 2011, and 4.23% and 4.32% for the corresponding periods in 2010, net of the federal tax benefit. In April 2010, a step up in basis of $89.1 million for internally developed software that was established at the time of the 2005 merger transaction became fully amortized, resulting in lower balances of intangible assets that are amortized. | |
| (2) | Represents the after-tax expense of non-qualified stock options in which we receive a tax deduction upon exercise, and the full expense impact of incentive stock options granted to employees that have vested and qualify for preferential tax treatment and conversely, we do not receive a tax deduction. Share-based compensation for vesting of incentive stock options was $1.5 million and $1.3 million, respectively, for the three months ended June 30, 2011 and 2010, and $2.8 million and $2.5 million for the six months ended June 30, 2011 and 2010, respectively. | |
| (3) | Represents Adjusted Earnings divided by weighted average number of shares outstanding on a fully diluted basis. Set forth is a reconciliation of earnings per share on a fully diluted basis as calculated in accordance with GAAP to Adjusted Earnings per share: |
| For the Three | For the Six | |||||||||||||||
| Months Ended | Months Ended | |||||||||||||||
| June 30, | June 30, | |||||||||||||||
| 2011 | 2010 | 2011 | 2010 | |||||||||||||
| (unaudited) | ||||||||||||||||
|
Earnings per share — diluted
|
$ | 0.40 | $ | 0.08 | $ | 0.82 | $ | 0.33 | ||||||||
|
Adjustment for allocation of undistributed earnings to stock units
|
0.01 | — | 0.01 | 0.01 | ||||||||||||
|
After-Tax:
|
||||||||||||||||
|
EBITDA Adjustments per share
|
0.06 | 0.32 | 0.11 | 0.39 | ||||||||||||
|
Amortization of purchased intangible assets and software per share
|
0.05 | 0.07 | 0.10 | 0.15 | ||||||||||||
|
|
||||||||||||||||
|
Adjusted Earnings per share
|
$ | 0.52 | $ | 0.47 | $ | 1.04 | $ | 0.88 | ||||||||
|
|
||||||||||||||||
| (4) | Weighted average shares outstanding on a fully diluted basis increased from 99.2 million shares for the six months ended June 30, 2010 to 113.2 million shares for the six months ended June 30, 2011, due primarily to the successful completion of our Initial Public Offering (“IPO”) in the fourth quarter of 2010. The increase is attributed to the release of the restriction of approximately 7.4 million shares of common stock upon closing of our IPO in the fourth quarter of 2010, the issuance of approximately 1.5 million shares of common stock by the Company pursuant to the over-allotment option granted to the underwriters in connection with the IPO, and shares that were issued upon exercise of options by selling stockholders in connection with the IPO, net of any shares retired to satisfy the exercise price in a cashless exercise. |
31
Table of Contents
| For the Three | For the Six | |||||||||||||||||||||||
| Months Ended | Months Ended | |||||||||||||||||||||||
| June 30, | June 30, | |||||||||||||||||||||||
| 2011 | 2010 | % Change | 2011 | 2010 | % Change | |||||||||||||||||||
| (unaudited) | (unaudited) | |||||||||||||||||||||||
|
Adjusted Earnings
|
$ | 58,807 | $ | 46,418 | $ | 118,180 | $ | 87,517 | ||||||||||||||||
|
Weighted average shares
outstanding — diluted as of June 30,
2011
|
113,150 | 113,150 | 113,155 | 113,155 | ||||||||||||||||||||
|
|
||||||||||||||||||||||||
|
Pro-forma Adjusted Earnings per share
|
$ | 0.52 | $ | 0.41 | 26.8% | $ | 1.04 | $ | 0.77 | 35.1% | ||||||||||||||
|
|
||||||||||||||||||||||||
32
Table of Contents
33
Table of Contents
| Three Months Ended | Six Months Ended | |||||||||||||||||||||
| June 30, | June 30, | |||||||||||||||||||||
| 2011 | 2010 | % Change | 2011 | 2010 | % Change | |||||||||||||||||
| (In thousands) | (In thousands) | |||||||||||||||||||||
|
Revenues
|
||||||||||||||||||||||
|
Commissions
|
$ | 459,882 | $ | 420,169 | 9.5 | % | $ | 911,759 | $ | 809,141 | 12.7 | % | ||||||||||
|
Advisory fees
|
264,289 | 215,146 | 22.8 | % | 508,376 | 421,476 | 20.6 | % | ||||||||||||||
|
Asset-based fees
|
90,504 | 77,436 | 16.9 | % | 180,327 | 148,886 | 21.1 | % | ||||||||||||||
|
Transaction and other fees
|
68,755 | 68,132 | 0.9 | % | 142,504 | 135,495 | 5.2 | % | ||||||||||||||
|
Other
|
10,566 | 9,278 | 13.9 | % | 24,899 | 18,569 | 34.1 | % | ||||||||||||||
|
|
||||||||||||||||||||||
|
Net revenues
|
893,996 | 790,161 | 13.1 | % | 1,767,865 | 1,533,567 | 15.3 | % | ||||||||||||||
|
|
||||||||||||||||||||||
|
Expenses
|
||||||||||||||||||||||
|
Production
|
634,088 | 556,538 | 13.9 | % | 1,238,415 | 1,069,740 | 15.8 | % | ||||||||||||||
|
Compensation and benefits
|
81,410 | 74,822 | 8.8 | % | 165,552 | 148,397 | 11.6 | % | ||||||||||||||
|
General and administrative
|
58,168 | 54,550 | 6.6 | % | 122,450 | 107,787 | 13.6 | % | ||||||||||||||
|
Depreciation and amortization
|
18,407 | 22,110 | (16.7 | )% | 36,572 | 47,700 | (23.3 | )% | ||||||||||||||
|
Restructuring charges
|
4,814 | 4,622 | 4.2 | % | 5,351 | 8,571 | (37.6 | )% | ||||||||||||||
|
Other
|
3,476 | 3,229 | 7.6 | % | 6,162 | 8,030 | (23.3 | )% | ||||||||||||||
|
|
||||||||||||||||||||||
|
Total operating expenses
|
800,363 | 715,871 | 11.8 | % | 1,574,502 | 1,390,225 | 13.3 | % | ||||||||||||||
|
|
||||||||||||||||||||||
|
Non-operating interest expense
|
18,154 | 27,683 | (34.4 | )% | 36,326 | 52,019 | (30.2 | )% | ||||||||||||||
|
Loss on extinguishment of debt
|
— | 37,979 | * | — | 37,979 | * | ||||||||||||||||
|
|
||||||||||||||||||||||
|
Total expenses
|
818,517 | 781,533 | 4.7 | % | 1,610,828 | 1,480,223 | 8.8 | % | ||||||||||||||
|
|
||||||||||||||||||||||
|
Income before provision for income taxes
|
75,479 | 8,628 | * | 157,037 | 53,344 | 194.4 | % | |||||||||||||||
|
Provision for income taxes
|
29,972 | 628 | * | 62,531 | 19,790 | * | ||||||||||||||||
|
|
||||||||||||||||||||||
|
Net income
|
$ | 45,507 | $ | 8,000 | * | $ | 94,506 | $ | 33,554 | 181.7 | % | |||||||||||
|
|
||||||||||||||||||||||
| 2011 | % Total | 2010 | % Total | Change | % Change | ||||||||||||||||||
|
Variable annuities
|
$ | 201,496 | 43.8 | % | $ | 172,755 | 41.1 | % | $ | 28,741 | 16.6 | % | |||||||||||
|
Mutual funds
|
130,933 | 28.5 | % | 117,254 | 27.9 | % | 13,679 | 11.7 | % | ||||||||||||||
|
Fixed annuities
|
36,703 | 8.0 | % | 39,202 | 9.3 | % | (2,499 | ) | (6.4 | )% | |||||||||||||
|
Alternative investments
|
26,467 | 5.7 | % | 26,179 | 6.2 | % | 288 | 1.1 | % | ||||||||||||||
|
Equities
|
24,466 | 5.3 | % | 25,034 | 6.0 | % | (568 | ) | (2.3 | )% | |||||||||||||
|
Fixed income
|
22,019 | 4.8 | % | 20,943 | 5.0 | % | 1,076 | 5.1 | % | ||||||||||||||
|
Insurance
|
16,945 | 3.7 | % | 18,216 | 4.4 | % | (1,271 | ) | (7.0 | )% | |||||||||||||
|
Other
|
853 | 0.2 | % | 586 | 0.1 | % | 267 | 45.6 | % | ||||||||||||||
|
|
|||||||||||||||||||||||
|
Total commission revenue
|
$ | 459,882 | 100.0 | % | $ | 420,169 | 100.0 | % | $ | 39,713 | 9.5 | % | |||||||||||
|
|
|||||||||||||||||||||||
34
Table of Contents
| 2011 | % Total | 2010 | % Total | Change | % Change | |||||||||||||||||||
|
Variable annuities
|
$ | 396,573 | 43.5 | % | $ | 328,447 | 40.6 | % | $ | 68,126 | 20.7 | % | ||||||||||||
|
Mutual funds
|
249,090 | 27.3 | % | 232,255 | 28.7 | % | 16,835 | 7.2 | % | |||||||||||||||
|
Fixed annuities
|
79,454 | 8.7 | % | 73,090 | 9.0 | % | 6,364 | 8.7 | % | |||||||||||||||
|
Alternative investments
|
54,443 | 6.0 | % | 46,197 | 5.7 | % | 8,246 | 17.8 | % | |||||||||||||||
|
Equities
|
52,302 | 5.7 | % | 49,140 | 6.1 | % | 3,162 | 6.4 | % | |||||||||||||||
|
Fixed income
|
45,502 | 5.0 | % | 41,955 | 5.2 | % | 3,547 | 8.5 | % | |||||||||||||||
|
Insurance
|
32,886 | 3.6 | % | 36,894 | 4.6 | % | (4,008 | ) | (10.9 | )% | ||||||||||||||
|
Other
|
1,509 | 0.2 | % | 1,163 | 0.1 | % | 346 | 29.8 | % | |||||||||||||||
|
|
||||||||||||||||||||||||
|
Total commission revenue
|
$ | 911,759 | 100.0 | % | $ | 809,141 | 100.0 | % | $ | 102,618 | 12.7 | % | ||||||||||||
|
|
||||||||||||||||||||||||
| For the Three | For the Six | |||||||||||||||
| Months Ended | Months Ended | |||||||||||||||
| June 30, | June 30, | |||||||||||||||
| 2011 | 2010 | 2011 | 2010 | |||||||||||||
|
Beginning of period
|
$ | 99.7 | $ | 81.0 | $ | 93.0 | $ | 77.2 | ||||||||
|
Net new advisory assets
|
3.1 | 2.4 | 6.8 | 3.9 | ||||||||||||
|
Market impacts
|
0.4 | (4.5 | ) | 3.4 | (2.2 | ) | ||||||||||
|
|
||||||||||||||||
|
End of period
|
$ | 103.2 | $ | 78.9 | $ | 103.2 | $ | 78.9 | ||||||||
|
|
||||||||||||||||
35
Table of Contents
36
Table of Contents
37
Table of Contents
38
Table of Contents
| Six Months Ended | ||||||||
| June 30, | ||||||||
| 2011 | 2010 | |||||||
| (In thousands) | ||||||||
|
Net cash flows provided by (used in):
|
||||||||
|
Operating activities
|
$ | 349,716 | $ | 53,024 | ||||
|
Investing activities
|
(36,310 | ) | (2,721 | ) | ||||
|
Financing activities
|
(51,143 | ) | (26,156 | ) | ||||
|
|
||||||||
|
Net increase in cash and cash equivalents
|
262,263 | 24,147 | ||||||
|
Cash and cash equivalents — beginning of period
|
419,208 | 378,594 | ||||||
|
|
||||||||
|
Cash and cash equivalents — end of period
|
$ | 681,471 | $ | 402,741 | ||||
|
|
||||||||
39
Table of Contents
| Release on the | ||||||||||||
| Restriction of | ||||||||||||
| Shares of Common | Stock Option and | |||||||||||
| Stock | Warrant Exercises | Total | ||||||||||
|
Tax deduction available
|
$ 221,982 | $ 382,990 | $ | 604,972 | ||||||||
|
Tax benefit expected to be realized
|
87,072 | 150,228 | 237,300 | |||||||||
|
Tax benefit recorded in 2010 as income tax
receivables on the consolidated statements of
financial condition
|
(87,072 | ) | (57,474 | ) | (144,546 | ) | ||||||
|
Tax benefit utilized in the fourth quarter of
2010 by not making a quarterly payment
|
— | (37,534 | ) | (37,534 | ) | |||||||
|
Tax benefit utilized in the first six months
of 2011 by utilization of NOLs to reduce
income taxes payable
|
— | (42,819 | ) | (42,819 | ) | |||||||
|
|
||||||||||||
|
Total tax benefits realized as of June 30, 2011
|
(87,072 | ) | (137,827 | ) | (224,899 | ) | ||||||
|
|
||||||||||||
|
Tax benefit expected to be utilized through
the use of NOLs from tax deductions resulting
from the IPO
|
$ — | $ 12,401 | $ | 12,401 | ||||||||
|
|
||||||||||||
40
Table of Contents
41
Table of Contents
| • | 50% (percentage will be reduced to 25% if our total leverage ratio is 5.00 or less and to 0% if our total leverage ratio is 4.00 or less) of our annual excess cash flow (as defined in our senior secured credit agreement) adjusted for, among other things, changes in our net working capital; | |
| • | 100% of the net cash proceeds of all nonordinary course asset sales or other dispositions of property, if we do not reinvest or commit to reinvest those proceeds in assets to be used in our business or to make certain other permitted investments within 15 months as long as such reinvestment is completed within 180 days; and | |
| • | 100% of the net cash proceeds of any incurrence of debt, other than proceeds from debt permitted under the senior secured credit agreement. |
| • | incur additional indebtedness; | ||
| • | create liens; | ||
| • | enter into sale and leaseback transactions; | ||
| • | engage in mergers or consolidations; | ||
| • | sell or transfer assets; |
42
Table of Contents
| • | pay dividends and distributions or repurchase our capital stock; | ||
| • | make investments, loans or advances; | ||
| • | prepay certain subordinated indebtedness; | ||
| • | engage in certain transactions with affiliates; | ||
| • | amend material agreements governing certain subordinated indebtedness; and | ||
| • | change our lines of business. |
| June 30, 2011 | December 31, 2010 | |||||||||||||||
| Covenant | Actual | Covenant | Actual | |||||||||||||
| Financial Ratio | Requirement | Ratio | Requirement | Ratio | ||||||||||||
|
Leverage Test (Maximum)
|
3.25 | 2.03 | 3.70 | 2.64 | ||||||||||||
|
Interest Coverage (Minimum)
|
2.95 | 6.42 | 2.60 | 4.81 | ||||||||||||
43
Table of Contents
| June 30, | December 31, | |||||||
| 2011 | 2010 | |||||||
| (unaudited) | ||||||||
|
Net income (loss)
|
$ | 4,090 | $ | (56,862 | ) | |||
|
Interest expense
|
74,714 | 90,407 | ||||||
|
Income tax expense
|
10,754 | (31,987 | ) | |||||
|
Amortization of purchased intangible assets and software(1)
|
37,832 | 43,658 | ||||||
|
Depreciation and amortization of all other fixed assets
|
37,077 | 42,379 | ||||||
|
|
|
|||||||
|
EBITDA
|
164,467 | 87,595 | ||||||
|
EBITDA Adjustments:
|
||||||||
|
Share-based compensation expense(2)
|
12,941 | 10,429 | ||||||
|
Acquisition and integration related expenses(3)
|
12,016 | 12,569 | ||||||
|
Restructuring and conversion costs(4)
|
14,671 | 22,835 | ||||||
|
Debt amendment and extinguishment costs(5)
|
28 | 38,633 | ||||||
|
Equity issuance and related offering costs(6)
|
240,856 | 240,902 | ||||||
|
Other(7)
|
141 | 150 | ||||||
|
|
|
|||||||
|
Total EBITDA Adjustments
|
280,653 | 325,518 | ||||||
|
|
|
|||||||
|
Adjusted EBITDA
|
445,120 | 413,113 | ||||||
|
Pro-forma adjustments(8)
|
— | — | ||||||
|
|
|
|||||||
|
Credit Agreement Adjusted EBITDA
|
$ | 445,120 | $ | 413,113 | ||||
|
|
|
|||||||
| (1) | Represents amortization of intangible assets and software as a result of our purchase accounting adjustments from our merger transaction in 2005 and various acquisitions. | |
| (2) | Represents share-based compensation expense related to vested stock options awarded to employees and non-executive directors based on the grant date fair value under the Black-Scholes valuation model. | |
| (3) | Represents acquisition and integration costs resulting from various acquisitions. Included in the trailing twelve months ended June 30, 2011 and December 31, 2010, are $8.9 million of expenditures for certain legal settlements that have not been resolved with the indemnifying party. See Litigation in Note 11 of our unaudited condensed consolidated financial statements for further discussion on legal settlements. | |
| (4) | Represents organizational restructuring charges and conversion and other related costs incurred resulting from the 2009 consolidation of the Affiliated Entities and the 2011 consolidation of UVEST. | |
| (5) | Represents debt amendment costs incurred in 2010 for amending and restating our credit agreement to establish a new term loan tranche and to extend the maturity of an existing tranche on our senior credit facilities, and debt extinguishment costs to redeem our subordinated notes, as well as certain professional fees incurred. | |
| (6) | Represents equity issuance and related offering costs. Upon closing of the IPO in the fourth quarter of 2010, the restriction on approximately 7.4 million shares of common stock issued to advisors under our Fifth Amended and Restated 2000 Stock Bonus Plan was released. Accordingly, we recorded a share-based compensation charge of $222.0 million, representing the offering price of $30.00 per share multiplied by 7.4 million shares. | |
| (7) | Represents excise and other taxes. | |
| (8) | Credit Agreement Adjusted EBITDA excludes pro forma general and administrative expenditures from acquisitions, as defined under the terms our senior secured credit agreement. There were no such adjustments for the twelve month periods ended June 30, 2011 and December 31, 2010. |
44
Table of Contents
| Payments Due by Period | ||||||||||||||||||||
| < 1 | 1-3 | 3-5 | > 5 | |||||||||||||||||
| Total | Year | Years | Years | Years | ||||||||||||||||
| (In thousands) | ||||||||||||||||||||
|
Leases and other obligations(1)
|
$ | 80,372 | $ | 30,130 | $ | 31,229 | $ | 14,745 | $ | 4,268 | ||||||||||
|
Senior secured term loan facilities(2)
|
1,339,653 | 13,971 | 322,503 | 476,035 | 527,144 | |||||||||||||||
|
Commitment fee on revolving line of credit(3)
|
2,409 | 1,261 | 1,148 | — | — | |||||||||||||||
|
Variable interest payments: (4)
|
||||||||||||||||||||
|
2013 Loan (Hedged)
|
1,315 | 1,315 | — | — | — | |||||||||||||||
|
2013 Loan (Unhedged)
|
10,534 | 4,685 | 5,849 | — | — | |||||||||||||||
|
2015 Loan (Unhedged)
|
80,805 | 20,635 | 40,510 | 19,660 | — | |||||||||||||||
|
2017 Loan (Unhedged)
|
172,300 | 29,568 | 58,048 | 56,892 | 27,792 | |||||||||||||||
|
Interest rate swap agreement(5)
|
3,045 | 3,045 | — | — | — | |||||||||||||||
|
|
||||||||||||||||||||
|
Total contractual cash obligations
|
$ | 1,690,433 | $ | 104,610 | $ | 459,287 | $ | 567,332 | $ | 559,204 | ||||||||||
|
|
||||||||||||||||||||
| (1) | Minimum payments have not been reduced by minimum sublease rental income of $6.4 million due in the future under noncancelable subleases. Note 11 of our unaudited condensed consolidated financial statements provides further detail on operating lease obligations and obligations under noncancelable service contracts. | |
| (2) | Represents principal payments on our senior secured term loan facilities. See Note 9 of our unaudited condensed consolidated financial statements for further detail. | |
| (3) | Represents commitment fees for unused borrowings on our senior secured revolving line of credit facility. See Note 9 of our unaudited condensed consolidated financial statements for further detail. | |
| (4) | Our senior secured term loan facilities bear interest at floating rates. Variable interest payments are shown assuming the applicable LIBOR rates at June 30, 2011 remain unchanged. See Note 9 of our unaudited condensed consolidated financial statements for further detail. | |
| (5) | Represents fixed interest payments net of variable interest received on our interest rate swap agreements. See Note 10 of our unaudited condensed consolidated financial statements for further detail. |
45
Table of Contents
46
Table of Contents
| Outstanding at | Annual Impact of an Interest Rate Increase of | |||||||||||||||||||
| Variable Interest | 10 Basis | 25 Basis | 50 Basis | 100 Basis | ||||||||||||||||
| Senior Secured Term Loans | Rates | Points | Points | Points | Points | |||||||||||||||
| (In thousands) | ||||||||||||||||||||
|
|
||||||||||||||||||||
|
2013 Term Loan (Hedged)(1)
|
$ | 65,000 | $ | — | $ | — | $ | — | $ | — | ||||||||||
|
2013 Term Loan (Unhedged)(2)
|
239,074 | 238 | 595 | 1,189 | 2,379 | |||||||||||||||
|
2015 Term Loan (Unhedged)(3)
|
479,435 | — | — | — | — | |||||||||||||||
|
2017 Term Loan (Unhedged)(3)
|
556,144 | — | — | — | — | |||||||||||||||
|
|
|
|||||||||||||||||||
|
Variable Rate Debt Outstanding
|
$ | 1,339,653 | $ | 238 | $ | 595 | $ | 1,189 | $ | 2,379 | ||||||||||
|
|
|
|||||||||||||||||||
47
Table of Contents
| (1) | Represents the portion of our 2013 Term Loan that is hedged by interest rate swap agreements, which have been designated as cash flow hedges against specific payments due on the 2013 Term Loan. Accordingly, any interest rate differential is reflected in an adjustment to interest expense over the term of the interest rate swap agreements. The variable interest rate for the hedged portion of our 2013 Term Loan is based on the three-month LIBOR of 0.25%, plus the applicable interest rate margin of 1.75%. | |
| (2) | Represents the unhedged portion of our 2013 Term Loan outstanding at June 30, 2011. The variable interest rate for the unhedged portion of our 2013 Term Loan is based on the one-month LIBOR of 0.19%, plus the applicable interest rate margin of 1.75%. | |
| (3) | The variable interest rate for our 2015 Term Loan and our 2017 Term Loan is based on the greater of the one-month LIBOR of 0.19% or 1.50%, plus an applicable interest rate margin. |
| Annualized Increase or Decrease of Income | ||||||
| Federal Reserve Effective Federal Funds Rate | Before Taxes per One Basis Point Change | |||||
| (Dollars in thousands) | ||||||
|
|
||||||
| 0.00% - 0.25% |
|
$ | 1,300 | |||
| 0.26% - 1.25% |
|
600 | ||||
| 1.26% - 2.50% |
|
300 | ||||
| > 2.50% |
|
— |
48
Table of Contents
49
Table of Contents
50
Table of Contents
| Total Number | Approximate | |||||||||||||||
| of Shares | Dollar Value of | |||||||||||||||
| Purchased as | Shares That May | |||||||||||||||
| Total Number | Part of Publicly | Yet Be | ||||||||||||||
| of Shares | Average Price | Announced | Purchased Under | |||||||||||||
| Period | Purchased | Paid per Share | Program | the Program(1) | ||||||||||||
|
May 26, 2011 through May 31, 2011
|
262,114 | $ | 35.39 | 262,114 | $ | 70,723,626 | ||||||||||
|
June 1, 2011 through June 30, 2011
|
2,021,740 | $ | 34.77 | 2,021,740 | $ | 432,112 | ||||||||||
|
|
||||||||||||||||
|
Total
|
2,283,854 | $ | 34.84 | 2,283,854 | $ | 432,112 | ||||||||||
|
|
||||||||||||||||
| (1) | On May 25, 2011, the Board of Directors approved a share repurchase program pursuant to which the Company may repurchase up to $80.0 million of its issued and outstanding shares of common stock through May 31, 2013. The purchases will be effected in open market transactions with the timing of purchases and the amount of stock purchased determined at the discretion of the Company’s management. |
|
3.1
|
Amended and Restated Certificate of Incorporation (previously filed as Exhibit 3.1 to the registration statement on Form S-1 (File Number 333-167325) on July 9, 2010, and incorporated herein by reference, | |
|
3.2
|
Second Amended and Restated Bylaws (previously filed as Exhibit 3.1 to the Current Report on Form 8-K (File Number 000-52609) on July 23, 2010 and incorporated herein by reference, | |
|
31.1
|
Certification of the Chief Executive Officer pursuant to Rule 13a-14(a) (filed herewith). | |
|
31.2
|
Certification of the Chief Financial Officer pursuant to Rule 13a-14(a) (filed herewith). | |
|
32.1
|
Certification of the Chief Executive Officer pursuant to 18 U.S.C. Section 1350, as adopted pursuant to Section 906 of the Sarbanes-Oxley Act of 2002 (furnished herewith). | |
|
32.2
|
Certification of the Chief Financial Officer pursuant to 18 U.S.C. Section 1350, as adopted pursuant to Section 906 of the Sarbanes-Oxley Act of 2002 (furnished herewith). | |
|
|
||
|
101.INS
|
XBRL Instance Document | |
|
101.SCH
|
XBRL Taxonomy Extension Schema | |
|
101.CAL
|
XBRL Taxonomy Extension Calculation |
51
Table of Contents
|
101.LAB
|
XBRL Taxonomy Extension Label | |
|
101.PRE
|
XBRL Taxonomy Extension Presentation |
52
Table of Contents
|
LPL Investment Holdings Inc.
|
||||
| Date: August 3, 2011 | By: | /s/ Mark S. Casady | ||
| Mark S. Casady | ||||
| Chairman and Chief Executive Officer | ||||
| Date: August 3, 2011 | By: | /s/ Robert J. Moore | ||
| Robert J. Moore | ||||
| Chief Financial Officer | ||||
53