LIVEPERSON INC
10-Ks and 10-Qs
|
|
|
|
|
|
|
|
|
|
|
|
|
|
|
|
|
|
|
|
|
|
|
|
|
|
|
|
|
|
|
|
|
|
|
|
|
|
|
|
|
|
|
|
|
|
|
|
|
|
|
|
|
|
|
|
UNITED STATES
SECURITIES AND EXCHANGE COMMISSION
Washington, D.C. 20549
FORM 10-K
|
ý
|
ANNUAL REPORT PURSUANT TO SECTION 13 OR 15(d)
OF THE SECURITIES EXCHANGE ACT OF 1934
|
|||
For the Fiscal Year Ended
December 31, 2016
OR
|
o
|
TRANSITION REPORT PURSUANT TO SECTION 13 OR 15(d)
OF THE SECURITIES EXCHANGE ACT OF 1934 |
|||
For the Transition Period from to
Commission File Number 000-30141
LIVEPERSON, INC.
(Exact Name of Registrant As Specified in Its Charter)
|
Delaware
|
13-3861628
|
|
|
(State of Incorporation)
|
(I.R.S. Employer
Identification Number)
|
|
475 Tenth Avenue, 5th Floor
New York, New York 10018
(Address of Principal Executive Offices) (Zip Code)
(212) 609-4200
(Registrant’s Telephone Number, Including Area Code)
Securities registered pursuant to Section 12(b) of the Act:
|
Title of Each Class
|
Name of Each Exchange on Which Registered
|
|
|
Common Stock, par value $0.001 per share
|
The NASDAQ Stock Market LLC
|
|
Securities registered pursuant to Section 12(g) of the Act:
None
Indicate by check mark if the registrant is a well-known seasoned issuer, as defined in Rule 405 of the Securities Act. Yes
o
No
ý
Indicate by check mark if the registrant is not required to file reports pursuant to Section 13 or Section 15(d) of the Act. Yes
o
No
ý
Indicate by check mark whether the registrant: (1) has filed all reports required to be filed by Section 13 or 15(d) of the Securities Exchange Act of 1934 during the preceding 12 months (or for such shorter period that the registrant was required to file such reports), and (2) has been subject to such filing requirements for the past 90 days. Yes
ý
No
o
Indicate by check mark whether the registrant has submitted electronically and posted on its corporate Web site, if any, every Interactive Data File required to be submitted and posted pursuant to Rule 405 of Regulation S-T during the preceding 12 months (or for such shorter period that the registrant was required to submit and post such files). Yes
ý
No
o
Indicate by check mark if disclosure of delinquent filers pursuant to Item 405 of Regulation S-K is not contained herein, and will not be contained, to the best of registrant’s knowledge, in definitive proxy or information statements incorporated by reference in Part III of this Form 10-K or any amendment to this Form 10-K.
o
Indicate by check mark whether the registrant is a large accelerated filer, an accelerated filer, a non-accelerated filer, or a smaller reporting company. See definition of “large accelerated filer,” “accelerated filer” and “smaller reporting company” in Rule 12b-2 of the Exchange Act. (Check one).
|
Large accelerated filer
o
|
Accelerated filer
ý
|
Non-accelerated filer
o
|
Smaller reporting company
o
|
Indicate by check mark whether the registrant is a shell company (as defined in Rule 12b-2 of the Exchange Act).Yes
o
No
ý
The aggregate market value of the voting common stock held by non-affiliates of the registrant as of June 30, 2016 (the last business day of the registrant’s most recently completed second fiscal quarter) was approximately $334,703,334 (computed by reference to the last reported sale price on The Nasdaq Global Select Market on that date). The registrant does not have any non-voting common stock outstanding.
On February 28, 2017, 58,299,557 shares of the registrant’s common stock were outstanding.
DOCUMENTS INCORPORATED BY REFERENCE
Portions of the registrant’s definitive proxy statement for the 2016 Annual Meeting of Stockholders, which we plan to file subsequent to the date hereof, are incorporated by reference into Items 10, 11, 12, 13 and 14 of Part III of this Form 10-K.
LIVEPERSON, INC.
2016
ANNUAL REPORT ON FORM 10-K
TABLE OF CONTENTS
|
Page
|
||
|
PART I
|
||
|
Item 1.
|
Business
|
|
|
Item 1A.
|
Risk Factors
|
|
|
Item 1B.
|
Unresolved Staff Comments
|
|
|
Item 2.
|
Properties
|
|
|
Item 3.
|
Legal Proceedings
|
|
|
Item 4.
|
Mine Safety Disclosures
|
|
|
PART II
|
||
|
|
||
|
Item 5.
|
Market for Registrant’s Common Equity, Related Stockholder Matters and Issuer Purchases of Equity Securities
|
|
|
Item 6.
|
Selected Consolidated Financial Data
|
|
|
Item 7.
|
Management’s Discussion and Analysis of Financial Condition and Results of Operations
|
|
|
Item 7A.
|
Quantitative and Qualitative Disclosures About Market Risk
|
|
|
Item 8.
|
Consolidated Financial Statements and Supplementary Data
|
|
|
Item 9.
|
Changes in and Disagreements With Accountants on Accounting and Financial Disclosure
|
|
|
Item 9A.
|
Controls and Procedures
|
|
|
Item 9B.
|
Other Information
|
|
|
PART III
|
||
|
Item 10.
|
Directors, Executive Officers and Corporate Governance
|
|
|
Item 11.
|
Executive Compensation
|
|
|
Item 12.
|
Security Ownership of Certain Beneficial Owners and Management and Related Stockholder Matters
|
|
|
Item 13.
|
Certain Relationships and Related Transactions, and Director Independence
|
|
|
Item 14.
|
Principal Accountant Fees and Services
|
|
|
PART IV
|
||
|
Item 15.
|
Exhibits and Financial Statement Schedules
|
|
|
Item 16.
|
Form 10-K Summary
|
|
i
CAUTIONARY STATEMENT CONCERNING FORWARD-LOOKING STATEMENTS
STATEMENTS IN THIS REPORT ABOUT LIVEPERSON, INC. THAT ARE NOT HISTORICAL FACTS ARE FORWARD-LOOKING STATEMENTS BASED ON OUR CURRENT EXPECTATIONS, ASSUMPTIONS, ESTIMATES AND PROJECTIONS ABOUT LIVEPERSON AND OUR INDUSTRY. THESE FORWARD-LOOKING STATEMENTS ARE SUBJECT TO RISKS AND UNCERTAINTIES THAT COULD CAUSE ACTUAL FUTURE EVENTS OR RESULTS TO DIFFER MATERIALLY FROM SUCH STATEMENTS. THESE FORWARD-LOOKING STATEMENTS ARE BASED ON OUR CURRENT EXPECTATIONS, WHICH MAY NOT PROVE TO BE ACCURATE. MANY OF THESE STATEMENTS ARE FOUND IN THE “BUSINESS” AND “MANAGEMENT’S DISCUSSION AND ANALYSIS OF FINANCIAL CONDITION AND RESULTS OF OPERATIONS” SECTIONS OF THIS FORM 10-K. WHEN USED IN THIS FORM 10-K, THE WORDS “ESTIMATES,” “EXPECTS,” “ANTICIPATES,” “PROJECTS,” “PLANS,” “INTENDS,” “BELIEVES” AND VARIATIONS OF SUCH WORDS OR SIMILAR EXPRESSIONS ARE INTENDED TO IDENTIFY FORWARD-LOOKING STATEMENTS. ALL FORWARD-LOOKING STATEMENTS, INCLUDING, WITHOUT LIMITATION, OUR EXAMINATION OF HISTORICAL OPERATING TRENDS, ARE BASED UPON OUR CURRENT EXPECTATIONS AND VARIOUS ASSUMPTIONS. OUR EXPECTATIONS, BELIEFS AND PROJECTIONS ARE EXPRESSED IN GOOD FAITH, AND WE BELIEVE THERE IS A REASONABLE BASIS FOR THEM, BUT WE CANNOT ASSURE YOU THAT OUR EXPECTATIONS, BELIEFS AND PROJECTIONS WILL BE REALIZED. ANY SUCH FORWARD-LOOKING STATEMENTS ARE MADE PURSUANT TO THE SAFE HARBOR PROVISIONS OF THE PRIVATE SECURITIES LITIGATION REFORM ACT OF 1995. IT IS ROUTINE FOR OUR INTERNAL PROJECTIONS AND EXPECTATIONS TO CHANGE AS THE YEAR OR EACH QUARTER IN THE YEAR PROGRESS, AND THEREFORE IT SHOULD BE CLEARLY UNDERSTOOD THAT THE INTERNAL PROJECTIONS AND BELIEFS UPON WHICH WE BASE OUR EXPECTATIONS MAY CHANGE PRIOR TO THE END OF EACH QUARTER OR THE YEAR. ALTHOUGH THESE EXPECTATIONS MAY CHANGE, WE ARE UNDER NO OBLIGATION TO INFORM YOU IF THEY DO. ACTUAL EVENTS OR RESULTS MAY DIFFER MATERIALLY FROM THOSE CONTAINED IN THE PROJECTIONS OR FORWARD-LOOKING STATEMENTS. IMPORTANT FACTORS THAT COULD CAUSE OUR ACTUAL RESULTS TO DIFFER MATERIALLY FROM THE FORWARD-LOOKING STATEMENTS WE MAKE IN THIS FORM 10-K ARE SET FORTH IN THIS FORM 10-K, INCLUDING THE FACTORS DESCRIBED IN THE SECTION ENTITLED “ITEM 1A — RISK FACTORS.” IF ANY OF THESE RISKS OR UNCERTAINTIES MATERIALIZE, OR IF ANY OF OUR UNDERLYING ASSUMPTIONS ARE INCORRECT, OUR ACTUAL RESULTS MAY DIFFER SIGNIFICANTLY FROM THE RESULTS THAT WE EXPRESS IN OR IMPLY BY ANY OF OUR FORWARD-LOOKING STATEMENTS. WE DO NOT UNDERTAKE ANY OBLIGATION TO REVISE THESE FORWARD-LOOKING STATEMENTS TO REFLECT FUTURE EVENTS OR CIRCUMSTANCES.
ii
Overview
LivePerson, Inc. (“LivePerson”, the “Company”, “we” or “our”) is a leading provider of mobile and online business messaging solutions that power digital communication between brands and consumers. LiveEngage, the Company’s enterprise-class, cloud-based platform, enables businesses to create a meaningful connection with consumers via messaging. As consumers have reoriented their digital lives around the smartphone, messaging apps have become their preferred communication channel to connect with each other. LivePerson allows brands to align with this new consumer preference, and deploy messaging at scale for customer care and sales, instead of demanding that consumers use email or call a 1-800 number.
LiveEngage was designed to securely deploy messaging at scale for brands with tens of millions of customers and many thousands of customer care agents. Key benefits include a sophisticated proactive targeting engine and a robust suite of text and mobile messaging, real-time chat messaging, content delivery, customer sentiment, and cobrowsing offerings that power intelligent digital engagement with consumers. LiveEngage powers conversations across each of a brand’s primary digital channels, including mobile apps, mobile and desktop web browsers, social media and third-party consumer messaging platforms. More than 18,000 businesses, including Citibank, EE, IBM, Orbitz, PNC, The Home Depot and T-Mobile employ our technology to keep pace with rising customer service expectations and to align with preferences for digital communication channels.
According to our internal measures, during 2016, we monitored an average of 2.7 billion visitor sessions per month across our customers’ websites. LivePerson combines this session data with other historical, behavioral, and operational information to develop insights into each step of a consumer’s journey, and to optimize campaign outcomes for sales and service transactions.
LivePerson’s products, coupled with our domain knowledge, industry expertise and professional services, have been proven to maximize the effectiveness of consumer engagement. Our business solutions deliver measurable return on investment by enabling our customers to:
|
•
|
increase consumer satisfaction, improve the overall digital experience, and enhance retention and loyalty, while reducing customer service costs;
|
|
•
|
lower operating costs in the contact center by deflecting costly phone and email interactions and improving agent efficiency;
|
|
•
|
increase mobile app retention and engagement by providing a connected messaging experience and turning an app into an engaging support app;
|
|
•
|
maintain a valued connection with consumers via mobile devices, either through native applications, websites, text messages, or third-party messaging platforms.
|
|
•
|
accelerate sales cycles, increase conversion rates, increase average order value and reduce abandonment by intelligently engaging website visitors;
|
|
•
|
leverage spending that drives visitor traffic by increasing visitor conversions;
|
|
•
|
refine and improve performance by understanding which initiatives deliver the highest rate of return; and
|
|
•
|
increase lead generation by providing a single messaging platform that engages consumers through advertisements and listings on branded and third-party websites.
|
As a “cloud computing” or software-as-a-service (SaaS) provider, LivePerson provides solutions on a hosted basis. This model offers significant benefits over premise-based software, including lower up-front costs, faster implementation, lower total cost of ownership, scalability, cost predictability, and simplified upgrades. Organizations that adopt a fully-hosted, multi-tenant architecture that is maintained by LivePerson eliminate the majority of the time, server infrastructure costs, and IT resources required to implement, maintain, and support traditional on-premise software.
Our consumer services offering is an online marketplace that connects independent service providers (Experts) who provide information and knowledge for a fee via mobile and online messaging with individual consumers (Users). Users seek assistance and advice in various categories including personal counseling and coaching, computers and programming, education and tutoring, spirituality and religion, and other topics.
LivePerson was incorporated in the State of Delaware in November 1995 and the LivePerson service was introduced in November 1998. In April 2000, the company completed an initial public offering and is currently traded on The NASDAQ Global Select Market and the Tel Aviv Stock Exchange. LivePerson is headquartered in New York City, with U.S. offices in Alpharetta (Georgia), and international offices in Amsterdam, Berlin, London, Mannheim, Melbourne, Milan, Paris, Ra'anana (Israel), Reading (UK), and Tokyo.
1
Market Opportunity
LivePerson's LiveEngage platform offers a sophisticated intelligence engine and suite of text and mobile messaging, real-time chat messaging, content delivery, customer sentiment and cobrowsing offerings to proactively engage with consumers through mobile apps, mobile and desktop websites and social media. These brand-to-consumer messaging capabilities provide an alternative channel of communication to calling a 1-800 number and empower brands to run business campaigns on their websites that engage consumers via messaging.
Historically, brands have predominately promoted calling the 1-800 number as the primary means of contact with consumers. According to a 2013 IBM report, approximately 270 billion calls are made to contact centers each year. We believe that in order to align with consumer communication preferences, improve the customer experience and reduce contact center costs, brands will increasingly promote messaging as an alternative to voice, and that LivePerson will benefit from this communication shift. Based on internal measurements, LivePerson has powered more than one billion real-time chat messaging conversations since its founding. We believe that messaging may now be nearing an inflection point, as brands are expanding beyond real-time chat messaging to also embrace text and mobile messaging. Evidence of this potential inflection point materialized in 2016, when LivePerson’s first enterprise customers began connecting with consumers at scale via text and mobile messaging on LiveEngage.
Industry reports suggest challenges with the traditional channel of calling 1-800 numbers. Roughly 50% of calls to 1-800 numbers go unresolved, according to IBM, and a 2014 Harris Interactive survey found that “81% of all consumers agree that it is frustrating to be tied to a phone or computer to wait for customer service help.” Research by enterprise analytics firm Mattersight, reinforces this view, with 74% of consumers feeling that call centers are getting worse or at best staying the same. The risk of poor customer service is material, according to Harris Interactive, which found that 89% of consumers will leave and go to a competitor due to bad customer experiences.
We believe that digital messaging has surpassed voice as the consumer's preferred channel of communication. WhatsApp and Facebook users combined send more than 60 billion messages a day, and, according to Portio Research, people worldwide were estimated to send an estimated 23 billion text messages a day in 2015. The International Smartphone Mobility Report by mobile data tracking firm Infomate found that U.S. smartphone users send and receive five times as many texts as compared to phone calls each day. In total, Americans spend about 26 minutes a day texting, as compared to six minutes a day on voice calls. A survey by transportation booking app, Hailo, found that making phone calls has dropped to the sixth most popular use of a mobile device, behind sending messages, receiving messages, checking email, surfing the Web, and using the alarm clock. The adoption of messaging has not been constrained to younger generations. According to Experian Marketing Services, adults 55 and older send and receive an average of nearly 500 text messages a month.
We believe consumer preference has shifted to messaging versus voice because it saves time and sustains a continuous connection with the other party. Individuals can send and respond to messages when it suits their need, as opposed to dedicating blocks of time to making voice calls. According to Forrester Research's Customer Experience Survey, 73% of US online adults say that valuing their time is the most important thing a company can do to provide them with good service. A RingCentral survey supports this view: “At least 78% of consumers who text wish they could have a text conversation with a business.” An Amdocs global consumer survey had a similar finding, with 76% of consumers stating they would rather use a mobile app than call the contact center.
Messaging also presents a potential cost savings benefit to brands versus voice, as skilled agents can typically manage multiple text-based conversations simultaneously, but only one voice call at a time.
As e-commerce continues to become more mainstream, LivePerson also anticipates stronger demand for intelligent business campaigns that target consumers with messaging on our customers' websites.
According to Forrester Research “74% of U.S. and 65% of European online adults now regularly shop online,” and “28% of online sales now flow through mobile devices.” According to Goldman Sachs, by 2018, there will be roughly as much global mobile commerce ($626 billion) as there was global e-commerce in 2013. Forrester estimates that U.S. online retail sales reached $334 billion in 2015, or 10% of all sales, up from $263 billion or 8% of sales in 2013. E-commerce is projected to climb at a 10% compound annual growth rate to $480 billion in 2019.
Although brands are investing to capture their share of visitors on the Web, spending to capture sales from those visitors attracted to their sites has lagged and conversion rates have stagnated. According to an eConsultancy report, for every $92 spent by retailers to attract a visitor to their website, approximately $1 is spent on efforts to convert each visitor. We believe that conversion rates can be improved through optimized on-site engagement, and that this represents an opportunity for our messaging solutions on both desktop and mobile channels. According to Forrester Research, 53% of customers are likely to abandon their online purchases if they can't find quick answers to their questions. LivePerson customers have demonstrated increases in website sales of greater than 20% and boosts in average order value by as much as 35%, while lowering the cost of engagement relative to voice or email. A 2013 Customer Service Benchmark by eDigitalResearch also found that “live chat has the highest satisfaction levels for any customer service channel, with 73%, compared with 61% for email and 44% for phone.”
2
These drivers are likely a key factor in the steady uptake of campaign-based messaging. According to Forrester Research, chat adoption by consumers has increased to 65% in 2015 from 38% in 2009.
We believe that LiveEngage, LivePerson’s enterprise-class, cloud-based platform, will enable LivePerson to deliver increased value to brands as the software is purpose built for messaging in mobile and online channels, designed for ease of use, and features robust real-time reporting, role-based real-time analytics, predictive intelligence, and innovations in customer satisfaction and connection measurement. In our view, the LiveEngage platform, in concert with our enterprise references, best-in-class scalability and security, domain knowledge, global footprint, consulting organization and customer value managers, uniquely positions LivePerson to optimize the effectiveness of real-time, campaign-based messaging and create a viable alternative to the traditional channel of calling the 1-800 number.
Strategy
The key elements of LivePerson’s business solutions strategy include:
Strengthening Our Position in both Existing and New Markets and Growing Our Recurring Revenue Base.
LivePerson plans to continue to develop its market position by increasing its customer base, and expanding within its installed base. We will continue to focus primarily on key target markets: automotive, financial services, retail, technology, telecommunications, and travel/hospitality within both our enterprise and mid-market sectors, as well as the small business (SMB) sector. Healthcare, insurance, real estate and energy utilities are new target industries and natural extensions of our primary target markets. We plan to leverage our new LiveEngage platform to replace a portion of calls traditionally made to 1-800 numbers with text and mobile messaging, and to increase adoption of real-time, campaign-based messaging across our customer’s online properties. We intend to collaborate with our large installed customer base to optimize the value and effectiveness that brands derive from our services. We are also focused on strengthening our recurring revenue stream by signing larger, long-term, and more strategic deals.
Fuel Increased Usage by Expanding our Engagement Tools and Offering Platform Pricing.
In 2011, we began expanding on our market leading real-time chat messaging product by adding new technologies that augment digital consumer engagement, including targeted content delivery and transcript analytics. In 2014, we introduced LiveEngage, whereby we seamlessly integrated into a single platform an expanded suite of mobile and online business messaging technologies, including traditional desktop chat messaging, mobile chat messaging, content delivery, analytics, cobrowse, PCI, customer sentiment, and mobile messaging via in-app, SMS, browser-based search and Facebook Messenger. LiveEngage delivers rich, contextually aware targeting and personalized experiences across mobile and desktop devices. We also began offering a new platform pricing model, which provides brands access to our entire suite of messaging technologies across their entire agent pool for a pre-negotiated cost per interaction. We believe this model is more attractive and will lead to increased usage versus our historic approach of requiring brands to negotiate each agent seat and product license separately. In late 2016, we began launching product programs designed to promote usage of our broader suite of capabilities for targeted customers.
Leverage Partners to Enhance our Offering.
In addition to developing our own applications, we continue to cultivate a partner eco-system capable of offering additional applications and services to our customers. For example, in 2015 we integrated LiveEngage with one of the leading consumer messaging platforms. In 2016 we integrated LiveEngage with one of the leading mobile search ad extensions, enabling consumers to initiate SMS messaging conversations with brands directly out of their mobile search results. We have also integrated LiveEngage with several artificial intelligence/bots vendors. In addition, we have opened up access to our platform and our products with application programming interfaces (APIs) that allow third parties to develop on top of our platform. Customers and partners can utilize these APIs to build our capabilities into their own applications and to enhance our applications with their services.
Maintaining Market Leadership in Technology and Security Expertise.
As described above, we are devoting significant resources to creating new products and enabling technologies designed to accelerate innovation and delivery of new products and technologies to our customer base. We evaluate emerging technologies and industry standards and continually update our technology in order to retain our leadership position in each market we serve. We monitor legal and technological developments in the area of information security and confidentiality to ensure our policies and procedures meet or exceed the demands of the world’s largest and most demanding corporations. We believe that these efforts will allow us to effectively anticipate changing customer and consumer requirements in our rapidly evolving industry.
International Presence.
LivePerson is focused on expanding its international revenue contribution, which increased to 34% of total revenue in 2016, from 33% in 2015, despite approximately $3.5 million of adverse foreign currency exchange impact. LivePerson generated positive results from previous investments in direct sales and services personnel in the United Kingdom and Western Europe. We also continued to focus on expanding our presence in the Asia Pacific region, leveraging our relationships with partners such as NTT Solco, a subsidiary of telecom firm NTT Docomo and Information Services International-Dentsu, Ltd. (ISID).
Continuing to Build Brand Recognition.
As a pioneer of brand-to-consumer digital messaging, LivePerson enjoys strong brand recognition and credibility. Our focus on creating meaningful connections among employees, with our customers, and
3
between brands and their consumers, is a key component of our culture and our market strategy. We strategically target decision makers and influencers within key vertical markets, leveraging customer successes to generate increased awareness and demand for brand-to-consumer messaging. In addition, we continue to develop relationships with the media, industry analysts and relevant business associations to enhance awareness of our leadership within the industry. Our brand name is also visible to both business users and consumers. When a consumer messages a customer care professional on a brand’s website, our brand name is usually displayed on the dialog messaging window. We believe that this high-visibility placement will continue to create brand awareness for our solutions.
Increasing the Value of Our Service to Our Customers.
We believe the introduction of LiveEngage marks the most important product launch in our history, as it empowers brands to deploy messaging at scale for customer care and sales, instead of demanding that consumers use email or call a 1-800 number. Furthermore, our platform strategy makes available the full suite of LivePerson’s capabilities through a single solution. In addition, the open architecture of LiveEngage will enable LivePerson to rapidly add new capabilities either directly or through partners. For example, we see opportunities for additional efficiencies in the contact center through the integration of artificial intelligence and bots. Because we directly manage the server infrastructure, we can make new features available to our customers immediately upon release, without customer or end-user installation of software or hardware. Our strategy is to continue to enhance the LiveEngage messaging platform and to leverage the substantial amount of mobile and online consumer data we collect, with the aim of increasing agent efficiency, decreasing customer care costs, improving the customer experience and increasing customer lifetime value.
Evaluating Strategic Alliances and Acquisitions When Appropriate.
We have successfully integrated several acquisitions over the past decade. While we have in the past, and may from time to time in the future, engage in discussions regarding acquisitions or strategic transactions or to acquire other companies that can accelerate our growth or broaden our product offerings, we currently have no binding commitments with respect to any future acquisitions or strategic transactions.
Products and Services
LivePerson’s hosted platforms power intelligent messaging on mobile apps, mobile and desktop web browsers, social media and third-party consumer messaging platforms. Our business-to-business services are all managed from a single user interface. By supplying a complete, unified consumer view, our solutions enable businesses to deliver a relevant, timely, personalized, and seamless consumer experience for heads of digital and customer care, as well as e-commerce, marketing, and contact center executives. In addition to product offerings, LivePerson provides professional services and value-added business consulting to support complete deployment and optimization of our enterprise solutions.
LiveEngage.
LiveEngage, LivePerson’s enterprise-class, cloud-based engagement platform, delivers rich, contextually aware targeting, actionable insights and personalized experiences, empowering businesses to get the most out of their existing online, mobile and social platforms. The platform, which was designed for heads of digital and customer care, as well as e-commerce, marketing, and contact center executives, combines sophisticated mobile and online engagement technology with robust business intelligence and big data to produce compelling, measurable results by intelligently engaging consumers based on a real-time understanding of consumer needs. Potential benefits of LiveEngage include increased agent efficiency, decreased customer care costs, improved customer experiences, higher conversion rates and increased customer lifetime value.
LiveEngage mobile and messaging technologies are built to provide meaningful connections between brands and consumers, from any mobile, online or messaging application. LiveEngage seamlessly integrates a suite of mobile and online business messaging technologies, including traditional desktop chat messaging, mobile chat messaging, content delivery, analytics, cobrowse, PCI, customer sentiment, and mobile messaging via in-app, SMS, browser-based search and Facebook Messenger. A specific messaging software development kit is available to completely customize and incorporate into any brand’s app. The LiveEngage messaging API also provides the option to bring messaging from any third party apps, such as Facebook or text messages, directly into the LiveEngage platform.
LiveEngage enables the combination of real time on-site data and off-site behavioral data, with a broad set of historical and operational data. Proprietary analytics utilize this data to target end users with compelling engagement options at any step in the conversion funnel and throughout the customer lifecycle. LiveEngage enables customers to maximize online revenue opportunities, improve conversion rates and reduce shopping cart abandonment by proactively engaging the right visitor, using the right channel, at the right time. Our solution identifies segments of website visitors who demonstrate the highest propensity to convert, and engages them in real-time with relevant content and offers, helping to generate incremental sales. LiveEngage also reduces costs in the contact center relative to voice, by identifying consumers who may be struggling with their self-help experience, and proactively connecting them to a live consumer care specialist, who can manage several conversations at once. This comprehensive solution blends a proven value-based methodology with an active rules-based engagement engine and deep domain expertise to increase first contact resolution, improve consumer satisfaction, and reduce attrition rates.
Professional Services.
The mission of our Professional Services team is to help customers optimize the performance of our products in order to drive incremental value through their online sales and/or service channel(s). This talented group utilizes their deep domain expertise and years of hands-on experience to provide customers with detailed analyses and measurements of
4
their LivePerson deployment that drive strategies and decisions on how to optimize the chat channel and broaden intelligent engagement of their consumers. Deliverables of the team include scorecards that measure and chart performance trends, analyses and recommendations for web design and process improvement, transcript reviews to discover both voice of the consumer insight and agent improvement opportunities, custom training of call center agents and management, and ongoing management of chat programs to ensure alignment with current business practices and objectives. The team’s value-added methodology and approach to guiding customers towards chat channel optimization is an important component of the LivePerson offering, and gives our customers a competitive advantage in the online world.
Consumer Offering.
Our consumer services offering is an online marketplace that connects independent service providers (Experts) who provide information and knowledge for a fee via mobile and online messaging with individual consumers (Users). Users seek assistance and advice in various categories including personal counseling and coaching, computers and programming, education and tutoring, spirituality and religion, and other topics.
Customers
Our business operations customer base includes Fortune 500 companies, dedicated Internet businesses, a broad range of online merchants, as well as numerous SMBs, automotive dealers, universities, libraries, government agencies and not-for-profit organizations. Our solutions benefit organizations of all sizes conducting business or communicating with consumers through mobile and online. We plan to continue to focus on key target markets: automotive, financial services, retail, technology, telecommunications, and travel/hospitality industries, within the United States and Canada, Latin America, Europe and the Asia-Pacific region.
No single customer accounted for or exceeded 10% of our total revenue in
2016
, 2015 or 2014.
Sales and Marketing
Sales
We sell our business products and services by leveraging a common methodology through both direct and indirect sales channels.
Our sales process focuses on how our solutions and industry expertise deliver financial and operational value that support our customers’ strategic initiatives. Our mobile and online messaging solutions are targeted at business executives whose primary responsibility is optimization of customer care or optimizing a consumer’s journey across the brand’s digital properties. Our proactive customer care solutions enable organizations to provide effective consumer service by deflecting costly phone calls and emails to the more cost efficient mobile and online messaging channel. We focus on the value that our solutions deliver in the form of increased agent efficiency, reduced contact center costs, increased customer satisfaction, improved customer lifetime value, maximized digital consumer acquisition, and optimized website and mobile business outcomes. LivePerson supports any organization with a company-wide strategic initiative to improve the overall mobile and online consumer experience.
Our focus on creating meaningful connections among employees, with our customers, and between our customers and their consumers, is a key component of our culture and our market strategy. Our unique culture permeates all facets of our organization. We were recognized in 2015 by Crain’s as one of “NYC’s best places to work,” and received a SmartCEO Corporate Culture Award from SmartCEO Magazine for our distinct culture of “creating meaningful connections.”
Enterprise and large mid-market.
Our field organization is structured to align the Company's resources with targeted market segments. We target large mid-market and enterprise businesses primarily with direct sales and customer success teams. In late 2016, we increased our emphasis on large enterprise customers and prospects. Across the globe we are targeting a select group of brands, many of them already customers, that hold the power to transform customer care. These enterprises have thousands of agents in their contact centers and collectively connect with billions of consumers each year. We leverage thought leadership and related events to showcase our leadership in mobile and online messaging and highlight our successes with existing reference customers.
For our large and more complex customers, our sales methodology often begins with research and discovery meetings that enable us to develop a deep understanding of the value drivers and key performance metrics of a prospective customer. We then present an analytical review detailing how our solutions and industry expertise can affect these value drivers and metrics. Once we validate solution capabilities and prove financial return on investment, we transition to a program management model wherein we work hand-in-hand with the customer, providing detailed analysis, measurements and recommendations that help optimize their performance and ensure ongoing program success.
Small business and small mid-market.
We target small business and small mid-market customers with a mix of direct, online self-service and third-party partner channels. Our customer acquisition strategy centers on leveraging customer word-of-
5
mouth, our leading brand name, online marketing and partnerships. We also leverage marketing programs and partner resources to promote increased usage and product adoption within these customers.
Indirect Sales.
Resources within our organization are focused on developing partnerships to generate revenues via referral partnerships and indirect sales through channel partners. By maximizing market coverage via partners who provide lead referrals and complementary products and services, we believe this channel supports revenue opportunities without incurring the costs associated with traditional direct sales.
Customer Support
Our Professional Services group provides deployment support and ongoing business consulting to enterprise and mid-market customers and maintains involvement throughout the engagement lifecycle. All LivePerson customers have access to 24/7 help desk services through messaging, chat, and technical support ticketing.
Marketing
Our marketing efforts in support of our business operations are organized around the needs, trends and characteristics of our existing and prospective customer base. Our deep relationship with existing customers fosters continuous feedback and critical data analysis, thereby allowing us to develop and refine marketing programs that drive adoption across multiple customer segments. We have a global team, spread across key geographies that is focused on marketing our brand, products and services to executives responsible for the digital channel and consumer service operations of their organization.
Our main focus is on the automotive, financial services, retail, technology, telecommunications, and travel/hospitality industries. Our integrated marketing strategy is focused on driving demand, building customer and consumer advocacy, driving adoption of our LiveEngage platform, and supporting key areas of business, especially large enterprise, but including small business, international and the channel. We aim to achieve this by delivering high-touch, small group events for senior executives, to educate them on messaging and the transformational ways that digital communication can help their business. We also market our software via high-level thought leadership campaigns, industry event participation, personalized lead generation campaigns to reach potential and existing customers using mediums such as paid and organic search, direct email and mail, industry- and category-specific tradeshows and events, and telemarketing.
Our marketing strategy also encompasses a strategic communications approach that integrates public relations, social media, and analyst/influencer relations. We are focused on using those channels to communicate our brand value, to those key stakeholders, to increase overall brand and technology awareness. Communications seek to highlight key customer success stories, and promote executive thought leadership via contributed content, speaking opportunities and press interviews, to raise LivePerson’s profile and reinforce our position as an industry leader.
Competition
The markets for mobile and online business messaging, and digital engagement technology are intensely competitive, rapidly changing and characterized by aggressive marketing, pricing pressure, evolving industry standards, rapid technology developments and frequent new product introductions. We believe that competition will continue to increase as our current competitors increase the sophistication of their offerings and as new participants enter the market, which may cause additional pricing pressure. If we are unable to accurately anticipate technology developments and continue to innovate in the markets in which we compete, or our competitors are more successful than us at developing compelling new products and services or at attracting and retaining customers, we may lose revenue and market share and our operating results could be adversely affected.
We have current and potential competition from providers of messaging and digital engagement solutions that enable companies to engage and connect with their consumer customers, as well as technology providers that offer customer relationship management and contact center solutions. We have current and potential competitors in many different industries, including:
|
•
|
technology or service providers offering or powering competing digital engagement, contact center, communications or customer relationship management solutions such as, eGain, Genesys, Oracle, Salesforce.com, TouchCommerce (now part of Nuance) and Twilio;
|
|
•
|
service providers that offer basic messaging products or services with limited functionality free of charge or at significantly reduced entry level prices;
|
|
•
|
social media, social listening, messaging, artificial intelligence, bots, e-commerce, and/or data and data analytics companies, such as Facebook, Google, and WeChat, which may leverage their existing or future capabilities and consumer relationships to offer competing B2B solutions;
|
|
•
|
customers that develop and manage their messaging solutions in-house; and
|
|
•
|
companies that provide cross-category and vertical-specific advice, such as About.com, UpWork and Yahoo Answers.
|
6
In addition, many of our current and potential competitors have substantial competitive advantages, such as greater brand recognition, significantly larger financial, marketing, and resource and development budgets, access to larger customer and/or consumer bases, larger and more established marketing and distribution relationships, and/or more diverse product and service offerings. As a result, these competitors may be able to respond more quickly and effectively than we can to any change in the general market acceptance of messaging services or any new or changing opportunities, technologies, standards, pricing strategies or customer requirements. Also, because of these advantages, potential customers may select a competitor’s products and services, even if our services are more effective. For all of these reasons, we may not be able to compete successfully against our current and future competitors.
Technology
Three key technological features distinguish the LivePerson services:
|
•
|
We support our customers through a secure, scalable server infrastructure. In North America, our primary servers are hosted in a fully-secured, top-tier, third-party server center located in the Mid-Atlantic United States, and are supported by a top-tier backup server facility located in the Western United States. In Europe, our primary servers are hosted in a fully-secured, top-tier, third-party server center located in the United Kingdom and are supported by a top-tier backup server facility located in The Netherlands. In the Asia Pacific region, our primary and backup servers are hosted in fully-secured, top-tier, third-party server centers located in Australia. Nearly all of our larger customers outside of the United States are hosted within our UK- and Australia-based facilities. By managing our servers directly, we maintain greater flexibility and control over the production environment allowing us to be responsive to customer needs and to continue to provide a superior level of service. Utilizing advanced network infrastructure and protocols, our network, hardware and software are designed to accommodate our customers’ demand for secure, high-quality 24/7 service, including during peak times such as the holiday shopping season.
|
|
•
|
As a hosted service, we are able to add additional capacity and new features quickly and efficiently. This has enabled us to provide these benefits simultaneously to our entire customer base. In addition, it allows us to maintain a relatively short development and implementation cycle.
|
|
•
|
As a SaaS provider, we focus on the development of tightly integrated software design and network architecture. We dedicate significant resources to designing our software and network architecture based on the fundamental principles of security, reliability and scalability.
|
Software Design.
Our software design is based on client-server architecture. As a SaaS provider, LiveEngage customers and visitors to our customers’ websites require only a standard Web browser and do not need to download software from LivePerson in order to interact with our customers’ operators or to use the LivePerson services. We also provide APIs that enable our customers and third-parties to integrate LiveEngage with custom designed applications.
Network Architecture.
The software underlying our services is integrated with scalable and reliable network architecture. Our network is scalable; we do not need to add new hardware or network capacity for each new LivePerson customer. This network architecture is hosted in co-location facilities with redundant network connections, servers and other infrastructure, enabling superior availability. Our backup server infrastructure housed at separate locations provides our primary hosting facilities with effective disaster recovery capability. We maintain the highest level of compliance with standards such as SOC2 and PCI. For increased security, through a multi-layered approach, we use advanced firewall architecture and industry-leading encryption standards and employ third-party experts to further validate our systems’ security. We also enable our customers to further encrypt their sensitive data using more advanced encryption algorithms.
Government Regulation
We and our customers are subject to a number of laws and regulations in the United States and abroad, including laws related to conducting business on the Internet, such as laws regarding privacy, data protection, information security, cybersecurity, restrictions or technological requirements regarding the collection, use, storage, protection or transfer of consumer data, content, consumer protection, internet (or net) neutrality, advertising, electronic contracts, taxation, provision of online payment services (including credit card processing), and intellectual property rights, which are continuously evolving and developing. Because our services are accessible worldwide, certain foreign jurisdictions may claim that we are required to comply with their laws, even if we don’t have a local entity, employees or infrastructure. Often, foreign data protection, privacy, and other laws and regulations are more restrictive than those in the United States. The scope and interpretation of the laws and other obligations that apply to us, including those related to user privacy and data security, are often uncertain and may be conflicting, particularly laws and obligations outside the United States. There is a risk that these laws may be interpreted and applied differently in any given jurisdiction in a manner that is not consistent with our current practices, which could cause us to incur substantial cost and could negatively impact our brand, reputation and business.
7
U.S. and international privacy laws and regulations are evolving and changing, are subject to differing interpretations, may be costly to comply with, and may be inconsistent among countries and jurisdictions or conflict with other rules. As we expand our operations in these countries, our liability exposure and the complexity and cost of compliance with data and privacy requirements will likely increase. Any failure by us to comply with our posted privacy policies, applicable federal, state or international privacy-related or data protection laws and regulations, or the privacy commitments contained in our contracts, could result in proceedings against us by governmental entities, customers, consumers, watchdog groups or others, which could have a material adverse effect on our business, financial condition and results of operations. In addition, the increased attention focused upon liability issues as a result of lawsuits and legislative proposals could harm our reputation or otherwise impact the growth of our business.
Laws and practices regarding handling and use of personal and other information by companies have come under increased public scrutiny, and governmental entities, consumer agencies and consumer advocacy groups have called for increased regulation and changes in industry practices. For example, in December 2015, following the conclusion of the “trilogue” meetings between the European Parliament, the Council of the European Union, and the European Commission, an agreement was announced with respect to a new EU data protection framework, the General Data Protection Regulation (“GDPR”), which will become effective in May 2018 and will apply across the European Union. The GDPR will replace the current EU Data Protection Directive and will impose significantly greater compliance burdens on companies with users and/or operations in the European Union and provides for considerable fines up to the higher of 20 million Euros and 4% of global annual revenue for noncompliance. One material change is that data processors (as that term is defined by applicable EU data protection law) have direct obligations, including implementing technical and organizational measures, and enhanced notification rules. The GDPR also imposes certain technological requirements that may impact the conduct of our business and how data protection is addressed in our customer and vendor agreements. The European Union has also released a proposed Regulation on Privacy and Electronic Communications (e-Privacy Regulation) to replace the EU’s current Privacy and Electronic Communications Directive (e-Privacy Directive) to, among other things, better align with the GDPR, to amend the current e-Privacy Directive’s rules on the use of cookies and other tracking technologies, and to harmonize across current EU member state e-privacy data protection laws. Compliance with changes in laws and regulations related to privacy may require significant cost, limit the use and adoption of our services, and require material changes in our business practices that result in reduced revenue. Noncompliance could result in material fines and penalties or governmental orders requiring us to change our data practices, which could damage our reputation and harm our business.
Additionally, as Internet commerce continues to evolve, regulation by federal, state and foreign governments or agencies in the areas of data privacy and data security is likely to increase. For instance, the EU-US Safe Harbor program (“EU Safe Harbor”), which provided a valid legal basis for transfers of personal data from Europe to the United States, was invalidated on October 6, 2015, which has had a significant impact on the transfer of data from the European Union to U.S. companies, including us. The European Union and the United States recently agreed to a new framework called the EU-US Privacy Shield (“EU Privacy Shield”) that provides a mechanism for companies to transfer data from EU member states to the United States and that LivePerson certified to in September 2016. Similarly, a new Swiss-U.S. Privacy Shield (“Swiss Privacy Shield”) has recently been announced that will replace the former Swiss-U.S. Safe Harbor (“Swiss Safe Harbor”). The new EU Privacy Shield requirements could impact our business and result in substantial expense and require changes to our operations, and the EU Privacy Shield is subject to an annual review that could result in changes to our obligations. We may also have to require some of our vendors who process personal data to take on additional privacy and security obligations, and some may refuse, causing us to incur potential disruption and expense related to our business processes. If our policies and practices, or those of our vendors, are, or are perceived to be, insufficient or if our members and customers have concerns regarding the transfer of data from the European Union to the United States, we could be subject to enforcement actions or investigations by EU Data Protection Authorities or lawsuits by private parties, member engagement could decline and our business could be negatively impacted.
The EU Privacy Shield and other frameworks may be challenged by regulators and/or private parties and reviewed by the European courts, which may lead to uncertainty about the legal basis for data transfers outside the EU. Ongoing legal reviews may result in burdensome or inconsistent requirements affecting the location and movement of our customer and internal employee data as well as the management of that data. Compliance may require changes in services, business practices, or internal systems that result in increased costs, lower revenue, reduced efficiency, or greater difficulty in competing with foreign-based firms. Failure to comply with existing or new rules may result in significant penalties or orders to stop the alleged noncompliant activity.
While there are other legally recognized mechanisms, such as standard Model Contractual Clauses, that we believe allow for the lawful transfer of EU personal data to the United States these mechanisms have also been subjected to regulatory or judicial scrutiny and may be invalidated or evolve to include new legal requirements that could have an impact on how we move data between and among countries and regions in which we operate, which could affect how we provide our services or adversely impact our financial results.
In addition to government activity, privacy advocacy and other industry groups have established or may establish new self-regulatory standards that may place additional burdens on us. If our privacy practices are deemed unacceptable by watchdog groups or privacy advocates, such groups may take measures that harm our business by, for example, disparaging our reputation
8
and our business, which may have a material adverse effect on our results of operations and financial condition. In addition, privacy concerns may cause Internet users to avoid online sites that collect various forms of data or to resist providing the data necessary to allow our customers to use our services effectively. Even the perception of security and privacy concerns, whether or not valid, could inhibit sales and market acceptance of our products and services.
Businesses using our products and services may collect data from their website users. Various federal, state and foreign government bodies and agencies impose laws regarding collection, use and retention of data from website visitors. We offer our customers a variety of data security procedures and practices, such as encryption for data at rest and masking algorithms for sensitive data prior to transfer to our database, in an effort to protect information. Changes to applicable laws and how they are interpreted relating to data security and other consumer protection areas could significantly increase the cost to us and our customers of regulatory compliance and could negatively impact our business.
For instance, some states in the United States have enacted legislation designed to protect consumer privacy by prohibiting the distribution of “spyware” over the Internet. Such legislation typically focuses on restricting the proliferation of software that, when installed on an end user’s computer, is used to intentionally and deceptively take control of the end user’s machine. We do not believe that the data monitoring methods that we employ constitute “spyware” or are prohibited by applicable laws. However, federal, state and foreign laws and regulations, many of which can be enforced by government entities or private parties, are constantly evolving and can be subject to significant changes in application and interpretation. If, for example, the scope of the previously mentioned “spyware” legislation were changed to include web analytics, such legislation could apply to the technology we use and potentially restrict our ability to conduct our business.
In addition, regulatory authorities and governments around the world are considering a number of legislative and regulatory proposals concerning privacy, collection and use of website visitor data, data storage, data protection, the "right to be forgotten," content regulation, cybersecurity, government access to personal information, online advertising, email and other categories of electronic spam, and other matters that may be applicable to our business. Compliance with these laws may require substantial investment or may be technologically challenging for us. For example, some jurisdictions, including the United States, are considering whether the collection of anonymous data may invade the privacy of website visitors. If laws or regulations are enacted that limit data collection or use practices related to anonymous data, we and/or our customers may be required to obtain the express consent of web visitors in order for our technology to perform certain basic functions that are based on the collection and use of technical data. Requirements that a website must first obtain consent from its web visitors before using our technology could reduce the amount and value of the services we provide to customers, which might impede sales and/or cause some existing customers to discontinue using our services.
It is also likely that, as our business grows and evolves, an increasing portion of our business shifts to mobile, and our solutions are offered and used in a greater number of countries, we will become subject to laws and regulations in additional jurisdictions. We could need to expend considerable effort and resources to develop new product features and/or procedures to comply with any such legal requirements. It is difficult to predict how existing laws will apply to our business and what new laws and legal obligations we may become subject to. If we are not able to comply with these laws or other legal obligations, or if we become liable under them, we may be forced to implement material changes to our business practices, delay release of new and enhanced services and expend substantial resources, which would negatively affect our business, financial condition and results of operations. In addition, any increased attention focused on liability issues, or as a result of regulatory fines or lawsuits, could harm our reputation or otherwise impact the growth of our business. Any costs incurred as a result of this potential liability could harm our business and operating results.
The Company monitors pending legislation and regulatory initiatives to ascertain relevance, analyze impact and develop strategic direction surrounding regulatory trends and developments. Due to shifting economic and political conditions, tax policies or rates in various jurisdictions may be subject to significant change. A range of other proposed or existing laws and new interpretations of existing laws could have an impact on our business. For example:
Government agencies and regulators have reviewed, are reviewing and will continue to review, the personal data handling practices of companies doing business online, including privacy and security policies and practices. This review may result in new laws or the promulgation of new regulations or guidelines that may apply to our products and services. For example, the State of California and other states have passed laws relating to disclosure of companies’ practices with regard to Do-Not-Track signals from Internet browsers, the ability to delete information of minors, and new data breach notification requirements. California has also adopted privacy guidelines with respect to mobile applications. Outside the European Union and the United States, a number of countries have adopted or are considering privacy laws and regulations that may result in significant greater compliance burdens. Existing and proposed laws and regulations regarding cybersecurity and monitoring of online behavioral data, such as the proposed “Do Not Track” regulations, regulations aimed at restricting certain targeted advertising practices and collection and use of data from mobile devices, and other proposed online privacy legislation could potentially apply to some of our current or planned products and services. Existing and proposed laws and regulations related to email and other categories of electronic spam could impact the delivery of commercial email and other electronic communications by us or on behalf of customers using our services.
9
The U.S. Federal Trade Commission, or FTC, in particular has aggressively investigated and brought enforcement actions against companies that fail to comply with their privacy or data security commitments to consumers, or fail to comply with regulations or statutes such as the Children’s Online Privacy Protection Act. Any investigation or review of our practices may require us to make changes to our products and policies, which could harm our business. Currently there are many proposals by lawmakers and industry groups in this area, both in the United States and overseas, which address the collection, maintenance and use of personal information, web browsing and geolocation data, and establish data security and breach notification requirements. Further, regulators and industry groups have also released self-regulatory principles and guidelines for various data privacy and security practices. Given that this is an evolving and unsettled area of regulation, the imposition of any new significant restrictions or technological requirements could have a negative impact on our business.
We might unintentionally violate such laws now and in the future; such laws or their interpretation or application may be modified; and new laws may be enacted in the future. Any such developments could subject us to legal liability exposure, and harm our business, operating results and financial condition.
Intellectual Property and Proprietary Rights
We rely on a combination of patent, copyright, trade secret, trademark and other common law protections in the United States and other jurisdictions, as well as confidentiality requirements and contractual provisions, to protect our proprietary technology, processes and other intellectual property. We own a portfolio of patents and patent applications in the United States and internationally and regularly file patent applications to protect intellectual property that we believe is important to our business, including intellectual property related to digital engagement technology and web and mobile based consumer-facing services. We believe the duration of our patents is adequate relative to the expected lives of our products and services. We pursue the registration of our domain names, trademarks and trade names in the United States and in certain locations outside the United States. We also own copyrights, including in our software, publications and other documents authored by us. These intellectual property rights are important to our business and marketing efforts. We seek to protect our intellectual property rights by relying on federal, state, and common law rights, including registration, or otherwise in the United States and certain foreign jurisdictions, as well as contractual restrictions. However, we believe that factors such as the technological and creative skills of our personnel, new service developments, frequent enhancements and reliable maintenance are more essential to establishing and maintaining a competitive advantage. Others may develop technologies that are similar or superior to our technology. We enter into confidentiality and other written agreements (including invention assignment agreements) with our employees, consultants, customers, potential customers, strategic partners, and other third parties, and through these and other written agreements, we attempt to control access to and distribution of our software, documentation and other proprietary information. Despite our efforts to protect our proprietary rights, third parties may, in an unauthorized manner, attempt to use, copy or otherwise obtain and market or distribute our intellectual property rights or technology or otherwise develop a service with the same functionality as our services. Policing unauthorized use of our services and intellectual property rights is difficult, and we cannot be certain that the steps we have taken will prevent misappropriation of our technology or intellectual property rights, particularly in foreign countries where we do business, where our services are sold or used, where the laws may not protect proprietary rights as fully as do the laws of the United States or where enforcement of laws protecting proprietary rights is not common or effective.
Substantial litigation regarding intellectual property rights exists in the software industry. In the ordinary course of our business, our services and/or our customers' use of our services have been and may be increasingly subject to third-party infringement claims as claims by non-practicing entities become more prevalent and as the number of competitors in our industry segment grows and the functionality of services in different industry segments overlaps. Some of our competitors in the market for digital engagement technology and/or web and mobile based consumer-facing services or other third parties may have filed or may intend to file patent applications covering aspects of their technology and have asserted or may assert claims against us. Any claims alleging infringement of third-party intellectual property rights could require us to spend significant amounts in litigation (even if the claim is invalid), distract management from other tasks of operating our business, pay substantial damage awards, prevent us from selling our products, delay delivery of our services, develop non-infringing software, technology, business processes, systems or other intellectual property (none of which might be successful), or limit our ability to use the intellectual property that is the subject of any of these claims, unless we enter into license agreements with the third parties (which may be costly, unavailable on commercially reasonable terms, or not available at all). Therefore, any such claims could have a material adverse effect on our business, results of operations, cash flows and financial condition.
The duration of the protection afforded to our intellectual property depends on the type of property in question, the laws and regulations of the relevant jurisdiction and the terms of its license agreements with others. With respect to our trademarks and trade names, trademark laws and rights are generally territorial in scope and limited to those countries where a mark has been registered or protected. While trademark registrations may generally be maintained in effect for as long as the mark is in use in the respective jurisdictions, there may be occasions where a mark or title is not registrable or protectable or cannot be used in a particular country. In addition, a trademark registration may be cancelled or invalidated if challenged by others based on certain use requirements or other limited grounds. The duration of property rights in trademarks, service marks and tradenames in the United States, whether registered or not, is predicated on our continued use.
10
Employees
As of December 31,
2016
, we had 985 full-time employees. Our employees are not covered by collective bargaining agreements. We believe our relations with our employees are satisfactory.
Segments and Geographic Areas
Information about segment and geographic revenue is set forth in Note 3 of the Notes to Consolidated Financial Statements included in Part II, Item 8 of this Annual Report on Form 10-K. For a discussion of the risks attendant to foreign operations, see the information under the heading “Risk Factors” under the caption “We may be unsuccessful in expanding our operations internationally and/or into direct-to-consumer services due to additional regulatory requirements, tax liabilities, currency exchange rate fluctuations and other risks, which could adversely affect our results of operations.” For a discussion of revenue, net income and total assets, see Item 8 of this Annual Report on Form 10-K.
Website Access to Reports
We make available, free of charge, on our website (
www.liveperson.com
), our annual reports on Form 10-K, our quarterly reports on Form 10-Q and our current reports on Form 8-K and amendments to those reports filed or furnished pursuant to Sections 13(a) or 15(d) of the Securities Exchange Act of 1934 as soon as reasonably practicable after we have electronically filed such material with, or furnished it to, the Securities and Exchange Commission.
The Company’s web site address provided above is not intended to function as a hyperlink, and the information on the Company’s web site is not and should not be considered part of this Annual Report on Form 10-K and is not incorporated by reference herein.
The following are certain of the important risk factors that could cause, or contribute to causing, our actual operating results to differ materially from those indicated, expected or suggested by forward-looking statements made in this Annual Report on Form 10-K or presented elsewhere by management from time to time. The risks described below are not the only ones we face. Additional risks not presently known to us, or that we currently deem immaterial, may become important factors that impair our business operations. Prospective and existing investors are strongly urged to carefully consider the various cautionary statements and risks set forth in this report and other public filings before deciding to purchase, hold or sell our common stock.
Risks Related to Our Business
Our quarterly revenue and operating results may fluctuate significantly, which may cause a substantial decline in the trading price of our common stock.
We have in the past incurred, and may in the future incur, losses and experience negative cash flows, either or both of which may be significant and may cause our quarterly revenue and operating results to fluctuate significantly. These fluctuations may result from a variety of factors, many of which are outside of our control. Some of the important factors that may cause our revenue and operating results to fluctuate include:
|
•
|
our ability to attract and retain new customers;
|
|
•
|
our ability to retain and increase sales to existing customers;
|
|
•
|
our customers’ demand for our services and business success;
|
|
•
|
consumer demand for our services;
|
|
•
|
the introduction of new services by us or our competitors;
|
|
•
|
changes in our pricing models or policies or the pricing policies of our current and future competitors;
|
|
•
|
continued adoption by companies of mobile and cloud-based messaging solutions;
|
|
•
|
continued adoption by experts and consumers of web-based advice services;
|
|
•
|
our ability to avoid and/or manage service interruptions, disruptions, or security incidents;
|
|
•
|
exposure to foreign currency exchange rate fluctuations; and
|
|
•
|
the amount and timing of capital expenditures and other costs related to operation and expansion of our business, including those related to acquisitions.
|
11
Our revenue and operating results may also fluctuate significantly in the future due to the following factors that are entirely outside of our control:
|
•
|
economic conditions specific to the Internet, electronic commerce and cloud computing; and
|
|
•
|
general, regional and/or global economic and political conditions.
|
As a result, comparing our operating results on a period-to-period basis may not be meaningful. You should not rely upon these comparisons or our past results as indicators of our future performance. Due to the foregoing factors, it is possible that our operating results in one or more future quarters may fall below the expectations of securities analysts and investors or below any guidance we may provide to the market. If this occurs, the trading price of our common stock could decline significantly.
The markets in which we participate are highly competitive, and we may lose customers and revenue if we are not able to innovate or effectively compete.
The markets for mobile and online business messaging and digital engagement technology are intensely competitive, rapidly changing and characterized by aggressive marketing, pricing pressure, evolving industry standards, rapid technology developments and frequent new product introductions, resulting in the need to continually invest significant resources in research and development. We believe that competition will continue to increase as our current competitors increase the sophistication of their offerings and as new participants enter the market, which may cause additional pricing pressure. If we are unable to accurately anticipate technology developments and continue to innovate in the markets in which we compete, or our competitors are more successful than us at developing compelling new products and services or at attracting and retaining customers, we may lose revenue and market share and our operating results could be adversely affected.
We have current and potential competition from providers of messaging and digital engagement solutions that enable companies to engage and connect with their consumer customers, as well as technology providers that offer customer relationship management and contact center solutions. We have current and potential competitors in many different industries and from companies that range from large and established companies to smaller companies and emerging start-ups, including:
|
•
|
technology or service providers offering or powering competing digital engagement, contact center, communications or customer relationship management solutions, such as eGain, Genesys, Oracle, Salesforce.com,TouchCommerce (now part of Nuance) and Twilio;
|
|
•
|
service providers that offer basic messaging products or services with limited functionality free of charge or at significantly reduced entry level prices ;
|
|
•
|
social media, social listening, messaging, artificial intelligence, bots, e-commerce, and/or data and data analytics companies, such as Facebook, Google and WeChat, which may leverage their existing or future capabilities and consumer relationships to offer competing solutions;
|
|
•
|
customers that develop and manage and their messaging solutions in-house; and
|
|
•
|
companies that provide cross-category and vertical-specific advice, such as About.com, UpWork and Yahoo Answers.
|
In addition, many of our current and potential competitors have substantial competitive advantages, such as greater brand recognition, significantly larger financial, marketing, and resource and development budgets, access to larger customer and/or consumer bases, larger and more established marketing and distribution relationships, and/or more diverse product and service offerings. As a result, these competitors may be able to respond more quickly and effectively than we can to any change in the general market acceptance of messaging services or any new or changing opportunities, technologies, standards, pricing strategies or customer requirements. Also, because of these advantages, potential customers may select a competitor’s products and services, even if our services are more effective. For all of these reasons, we may not be able to compete successfully against our current and future competitors.
The success of our business depends on retention of existing customers and their purchase of additional services, the migration of existing customers to our new platform, and attracting new customers and new consumer users of our consumer services.
Our customers typically subscribe for our services for a twelve month term and may have no obligation to renew their subscription after expiration of the twelve month term. In some cases, our agreements are terminable or may terminate upon 30 to 90 days’ notice without penalty. If a significant number of our customers, or any one customer to whom we provide a significant amount of services, were to terminate services, reduce the amount of services purchased, or fail to purchase additional services, our results of operations may be negatively and materially affected. Dissatisfaction with the nature or quality of our services could also lead customers to terminate our service. In addition, in 2014 we introduced LiveEngage, our first offering that integrates all of our messaging technologies into a single platform. If we are unable to continue to timely and effectively migrate our existing customers to the new platform, or if existing customers are reluctant or unwilling to migrate, we may lose customers and/or have increased costs related to duplicate infrastructure, and our revenue and operating results could be negatively impacted.
We depend on monthly fees and interaction-based fees from our services for substantially all of our revenue. As part of our strategy, we are increasingly offering customers subscriptions with interaction-based fees. While this interaction-based fee model has demonstrated success in our business to date, it could potentially produce greater variability in our revenue as revenue
12
in this model is impacted by the number of interactions that our customers generate through use of our products. Because of the historically small amount of services sold in initial orders, we depend significantly on the growth of our customer base and sales to new customers and sales of additional services to our existing customers. Our revenue could decline unless we are able to obtain additional customers or alternate revenue sources.
Our results of operations may be adversely impacted due to our exposure to foreign currency exchange rate fluctuations.
We conduct business in currencies other than the U.S. dollar in Europe, Australia, Japan and Israel. As we continue to expand our international operations we become more exposed to the effects of fluctuations in currency exchange rates. As a result of the expanding size and scope of our international operations, our currency rate fluctuation risk associated with the exchange rate movement of the U.S. dollar has increased.
Since we conduct business in currencies other than the U.S. dollar but report our financial results in U.S. dollars, fluctuations in currency exchange rates could adversely affect our results of operations. For example, during
2016
we experienced a foreign currency exchange impact of approximately 1% percent, or approximately $3.5 million if held in constant currency, to our revenue. Fluctuations in the value of the U.S. dollar relative to other foreign currencies could materially affect our revenue, cost of revenue and operating expenses, and result in foreign currency transaction gains and losses. In January 2015, we began hedging a portion of our foreign currency exchange rate exposure; however, significant fluctuations in exchange rates between the U.S. dollar and foreign currencies may nonetheless adversely affect our net income (loss). We may seek to enter into additional hedging transactions in the future or to use financial instruments, such as derivative financial instruments, to mitigate risk, but we may be unable to enter into them successfully, on acceptable terms or at all. Additionally, these programs rely on our ability to forecast accurately and could expose us to additional risks that could adversely affect our financial condition and results of operations. We cannot predict whether or not we will incur foreign exchange losses in the future. To the extent the international component of our revenues grows, our results of operations will become more sensitive to foreign exchange rate fluctuations.
Our business is subject to a variety of U.S. and international laws and regulations regarding privacy and data protection, and increased public scrutiny of privacy and security issues could result in increased government regulation, industry standards and other legal obligations that could adversely affect our business.
We collect, process, store and use personal data and other information generated during mobile and online messaging between brands and consumers and between experts and consumers. We post our privacy policies and practices on our websites and we also often include privacy commitments in our contracts. Our business is subject to numerous federal, state and international laws and regulations regarding privacy, data protection, personal information, security, data collection, storage, use and transfer, and the use of cookies and similar tracking technologies. To the extent that additional legislation regarding user privacy is enacted, such as legislation governing the collection and use of information regarding Internet or mobile users through the use of cookies or similar technologies, the effectiveness of our services could be impaired by restricting us from collecting or using information that may be valuable to our customers and/or exposing us to lawsuits or regulatory investigations. The foregoing could have a material adverse effect our business, results of operations and financial condition.
The scope of U.S. and international privacy laws and regulations is evolving and changing, subject to differing interpretations, may be costly to comply with, and may be inconsistent among countries and jurisdictions or conflict with other rules. As we expand our operations in these countries, our liability exposure and the complexity and cost of compliance with data and privacy requirements will likely increase. Any failure by us to comply with our posted privacy policies, applicable federal, state or international privacy-related or data protection laws and regulations, or the privacy commitments contained in our contracts, could result in proceedings against us by governmental entities, customers, consumers, watchdog groups or others, which could have a material adverse effect on our business, financial condition and results of operations. In addition, the increased attention focused upon liability issues as a result of lawsuits and legislative proposals could harm our reputation or otherwise impact the growth of our business.
Laws and practices regarding handling and use of personal and other information by companies have come under increased public scrutiny, and governmental entities, consumer agencies and consumer advocacy groups have called for increased regulation and changes in industry practices. For example, in December 2015, following the conclusion of the “trilogue” meetings between the European Parliament, the Council of the European Union, and the European Commission, an agreement was announced with respect to a new EU data protection framework, the General Data Protection Regulation (“GDPR”), which will become effective in May 2018 and will apply across the European Union.. The GDPR will replace the current EU Data Protection Directive and will impose significantly greater compliance burdens on companies with users and/or operations in the European Union and provides for considerable fines up to the higher of 20 million Euros and 4% of global annual revenue for noncompliance. One material change is that data processors (as that term is defined by applicable EU data protection law) have direct obligations, including implementing technical and organizational measures, and enhanced notification rules. The GDPR also imposes certain technological requirements that may impact the conduct of our business and how data protection is addressed in our customer and vendor agreements. The European Union has also released a proposed Regulation on Privacy and Electronic Communications (e-Privacy Regulation) to replace the EU’s Privacy and Electronic Communications Directive (e-Privacy Directive) to, among
13
other things, better align with the GDPR, to amend the current e-Privacy Directive’s rules on the use of cookies and other tracking technologies, and to harmonize across current EU member state e-privacy data protection laws. Compliance with changes in laws and regulations related to privacy may require significant cost, limit the use and adoption of our services, and require material changes in our business practices that result in reduced revenue. Noncompliance could result in material fines and penalties or governmental orders requiring us to change our data practices, which could damage our reputation and harm our business.
Additionally, as Internet commerce continues to evolve, regulation by federal, state and foreign governments or agencies in the areas of data privacy and data security is likely to increase. For instance, the EU-US Safe Harbor program (“EU Safe Harbor”), which provided a valid legal basis for transfers of personal data from Europe to the United States, was invalidated on October 6, 2015, which has had a significant impact on the transfer of data from the European Union to U.S. companies, including us. The European Union and the United States recently agreed to a new framework called the EU-US Privacy Shield (“EU Privacy Shield”) that provides a mechanism for companies to transfer data from EU member states to the United States and that LivePerson certified to in September 2016. Similarly, a new Swiss-U.S. Privacy Shield (“Swiss Privacy Shield”) has recently been announced that will replace the former Swiss-U.S. Safe Harbor (“Swiss Safe Harbor”). The new EU Privacy Shield requirements could impact our business and result in substantial expense and require changes to our operations, and the EU Privacy Shield is subject to an annual review that could result in changes to our obligations. We may also have to require some of our vendors who process personal data to take on additional privacy and security obligations, and some may refuse, causing us to incur potential disruption and expense related to our business processes. If our policies and practices, or those of our vendors, are, or are perceived to be, insufficient or if our members and customers have concerns regarding the transfer of data from the European Union to the United States, we could be subject to enforcement actions or investigations by EU Data Protection Authorities or lawsuits by private parties, member engagement could decline and our business could be negatively impacted.
The EU Privacy Shield and other frameworks may be challenged by regulators and/or private parties and reviewed by the European courts, which may lead to uncertainty about the legal basis for data transfers outside the EU. Ongoing legal reviews may result in burdensome or inconsistent requirements affecting the location and movement of our customer and internal employee data as well as the management of that data. Compliance may require changes in services, business practices, or internal systems that result in increased costs, lower revenue, reduced efficiency, or greater difficulty in competing with foreign-based firms. Failure to comply with existing or new rules may result in significant penalties or orders to stop the alleged noncompliant activity.
While there are other legally recognized mechanisms, such as standard Model Contractual Clauses, that we believe allow for the lawful transfer of EU personal data to the United States, these mechanisms have also been subjected to regulatory or judicial scrutiny and may be invalidated or evolve to include new legal requirements that could have an impact on how we move data between and among countries and regions in which we operate, which could affect how we provide our services or adversely impact our financial results.
In addition to government activity, privacy advocacy and other industry groups have established or may establish new self-regulatory standards that may place additional burdens on us. If our privacy practices are deemed unacceptable by watchdog groups or privacy advocates, such groups may take measures that harm our business by, for example, disparaging our reputation and our business, which may have a material adverse effect on our results of operations and financial condition. In addition, privacy concerns may cause Internet users to avoid online sites that collect various forms of data or to resist providing the data necessary to allow our customers to use our services effectively. Even the perception of security and privacy concerns, whether or not valid, could inhibit sales and market acceptance of our products and services.
Our business is subject to a variety of U.S. and foreign laws, and existing, new and developing regulatory or other legal requirements could subject us to claims or materially impact our business.
We and our customers are subject to a number of laws and regulations in the United States and abroad, including laws related to conducting business on the Internet, such as laws regarding privacy, data protection, information security, cybersecurity, restrictions or technological requirements regarding the collection, use, storage, protection or transfer of consumer data, content, consumer protection, internet (or net) neutrality, advertising, electronic contracts, taxation, provision of online payment services (including credit card processing), and intellectual property rights, which are continuously evolving and developing. Because our services are accessible worldwide, certain foreign jurisdictions may claim that we are required to comply with their laws, even if we don’t have a local entity, employees or infrastructure. Often, foreign data protection, privacy, and other laws and regulations are more restrictive than those in the United States. The scope and interpretation of the laws and other obligations that apply to us, including those related to user privacy and data security, are often uncertain and may be conflicting, particularly laws and obligations outside the United States. There is a risk that these laws may be interpreted and applied differently in any given jurisdiction in a manner that is not consistent with our current practices, which could cause us to incur substantial cost and could negatively impact our brand, reputation and business.
Businesses using our products and services may collect data from their website users. Various federal, state and foreign government bodies and agencies impose laws regarding collection, use and retention of data from website visitors. We offer our customers a variety of data security procedures and practices, such as encryption for data at rest and masking algorithms for
14
sensitive data prior to transfer to our database, in an effort to protect information. Changes to applicable laws and how they are interpreted relating to data security and other consumer protection areas could significantly increase the cost to us and our customers of regulatory compliance and could negatively impact our business.
For instance, some states in the United States have enacted legislation designed to protect consumer privacy by prohibiting the distribution of “spyware” over the Internet. Such legislation typically focuses on restricting the proliferation of software that, when installed on an end user’s computer, is used to intentionally and deceptively take control of the end user’s machine. We do not believe that the data monitoring methods that we employ constitute “spyware” or are prohibited by applicable laws. However, federal, state and foreign laws and regulations, many of which can be enforced by government entities or private parties, are constantly evolving and can be subject to significant changes in application and interpretation. If, for example, the scope of the previously mentioned “spyware” legislation were changed to include web analytics, such legislation could apply to the technology we use and potentially restrict our ability to conduct our business.
In addition, regulatory authorities and governments around the world are considering a number of legislative and regulatory proposals concerning privacy, collection and use of website visitor data, data storage, data protection, the “right to be forgotten,” content regulation, cybersecurity, government access to personal information, online advertising, email and other categories of electronic spam, and other matters that may be applicable to our business. Compliance with these laws may require substantial investment or may be technologically challenging for us. For example, some jurisdictions, including the United States, are considering whether the collection of anonymous data may invade the privacy of website visitors. If laws or regulations are enacted that limit data collection or use practices related to anonymous data, we and/or our customers may be required to obtain the express consent of web visitors in order for our technology to perform certain basic functions that are based on the collection and use of technical data. Requirements that a website must first obtain consent from its web visitors before using our technology could reduce the amount and value of the services we provide to customers, which might impede sales and/or cause some existing customers to discontinue using our services.
It is also likely that, as our business grows and evolves, an increasing portion of our business shifts to mobile, and our solutions are offered and used in a greater number of countries, we will become subject to laws and regulations in additional jurisdictions. We could need to expend considerable effort and resources to develop new product features and/or procedures to comply with any such legal requirements. It is difficult to predict how existing laws will apply to our business and what new laws and legal obligations we may become subject to. If we are not able to comply with these laws or other legal obligations, or if we become liable under them, we may be forced to implement material changes to our business practices, delay release of new and enhanced services and expend substantial resources, which would negatively affect our business, financial condition and results of operations. In addition, any increased attention focused on liability issues, or as a result of regulatory fines or lawsuits, could harm our reputation or otherwise impact the growth of our business. Any costs incurred as a result of this potential liability could harm our business and operating results.
The Company monitors pending legislation and regulatory initiatives to ascertain relevance, analyze impact and develop strategic direction surrounding regulatory trends and developments. Due to shifting economic and political conditions, tax policies or rates in various jurisdictions may be subject to significant change. A range of other proposed or existing laws and new interpretations of existing laws could have an impact on our business. For example:
Government agencies and regulators have reviewed, are reviewing and will continue to review, the personal data handling practices of companies doing business online, including privacy and security policies and practices. This review may result in new laws or the promulgation of new regulations or guidelines that may apply to our products and services. For example, the State of California and other states have passed laws relating to disclosure of companies’ practices with regard to Do-Not-Track signals from Internet browsers, the ability to delete information of minors, and new data breach notification requirements. California has also adopted privacy guidelines with respect to mobile applications. Outside the European Union and the United States, a number of countries have adopted or are considering privacy laws and regulations that may result in significant greater compliance burdens. Existing and proposed laws and regulations regarding cybersecurity and monitoring of online behavioral data, such as the proposed “Do Not Track” regulations, regulations aimed at restricting certain targeted advertising practices and collection and use of data from mobile devices, new and existing tools that allow consumers to block online advertising and other content, and other proposed online privacy legislation could potentially apply to some of our current or planned products and services. Existing and proposed laws and regulations related to email and other categories of electronic spam could impact the delivery of commercial email and other electronic communications by us or on behalf of customers using our services.
The FTC in particular has aggressively investigated and brought enforcement actions against companies that fail to comply with their privacy or data security commitments to consumers, or fail to comply with regulations or statutes such as the Children's Online Privacy Protection Act. Any investigation or review of our practices may require us to make changes to our products and policies, which could harm our business. Currently there are many proposals by lawmakers and industry groups in this area, both in the United States and overseas, which address the collection, maintenance and use of personal information, web browsing and geolocation data, and establish data security and breach notification requirements. Further, regulators and industry groups have also released self-regulatory principles and guidelines for various data privacy and security practices. Given that this is an evolving
15
and unsettled area of regulation, the imposition of any new significant restrictions or technological requirements could have a negative impact on our business.
If we are unable to effectively operate on mobile devices, our business could be adversely affected.
The number of people who access the Internet and complete transactions over the Internet through devices other than desktop computers, including smartphones, handheld tablets and mobile phones, has increased dramatically in the past few years and is projected to continue to increase. To address these developments, we continue to extend our products and services to support messaging on mobile phone and tablet applications belonging to our company and our customers. If the mobile solutions we have developed do not meet our customers’ needs or the needs of their website visitors, are not widely adopted by our customers and consumers, or create new risks related to privacy and security, we may fail to retain existing customers and we may have difficulty attracting new customers, and also be subject to investigations, litigation or reputational harm. If we are unable to rapidly innovate and grow mobile revenue, or if we incur excessive expenses in this effort, our financial performance and ability to continue to grow overall revenue may be negatively affected.
Additionally, our mobile phone and tablet applications and those of our customers depend on their interoperability with popular mobile operating systems, networks and standards that we and they do not control, such as Android and iOS operating systems, and any changes in such systems and terms of service that degrade the functionality of our solutions or give preferential treatment to competitive products could adversely affect our revenue. We may not be successful in developing products that operate effectively with these technologies, systems, networks or standards. As new devices and platforms are continually being released, it is difficult to predict the challenges we may encounter in developing versions of our solutions for use on these alternative devices.
Failures or security breaches in our services or systems, those of our third party providers, or in the websites of our customers, including those resulting from cyber-attacks, security vulnerabilities, defects or errors, could harm our business.
Our products and services involve the storage and transmission of proprietary information and personal data related to or customers and their users, and experts and consumers, and theft and security breaches expose us to a risk of loss of this information, improper use and disclosure of this information, litigation, and potential liability. We experience cyber-attacks of varying degrees on a regular basis. Our security measures may also be breached due to employee or other error, intentional malfeasance and other third party acts, and system errors or vulnerabilities, including vulnerabilities of our third party vendors, or customers, or otherwise. Any such breach or unauthorized access, or attempts by outside parties to fraudulently induce employees, users, vendors or customers to disclose sensitive information in order to gain access to our data or data of our customers, users, experts or consumers, including, but not limited to, individual personal information and financial credit or debit card data that is protected by law or contract, could result in significant legal and financial exposure, damage to our reputation, and a loss of confidence in the security of our products and services that could potentially have an adverse effect on our business.
While we continue to expand our focus on this issue and are taking measures to safeguard our products and services from cybersecurity threats and vulnerabilities in desktop computers, mobile phones, smartphones and handheld devices, cyber-attacks and other security incidents continue to evolve in sophistication and frequency. Because the techniques used to obtain unauthorized access, disable or degrade service, or sabotage systems, are constantly evolving in sophisticated ways to avoid detection and often are not recognized until launched against a target, it may be difficult or impossible for us to anticipate or identify these techniques or to implement adequate preventative measures. And while technological advancements enable more data and processes, such as mobile computing and mobile payments, they also increase the risk that cyber-attacks and other security incidents will occur. A significant cyber-attack or other security incident involving our, our service providers’ or our customers’ systems could result in material harm to our brand and reputation, our ability to deliver our services or retain customers, and expose us to lawsuits, regulatory investigations, and significant damages, fines or penalties.
In addition, our customers may authorize third party access to their customer data located in our cloud environment. Because we do not control the transmissions between customer authorized third parties, or the processing of such data by customer authorized third parties, we cannot ensure the integrity or security of such transmissions or processing. Because our services are responsible for critical communication between our customers and consumers, any security failures, defects or errors in our components, materials or software or those used by our customers could have an adverse impact on us, on our customers and on the end users of their websites. Such adverse impact could include a decrease in demand for our services, damage to our reputation and to our customer relationships, legal exposure, and other financial liability or harm to our business.
Industry-specific regulation is evolving and unfavorable industry-specific laws, regulations or interpretive positions could harm our business.
Our customers and potential customers do business in a variety of industries, including financial services, the public sector, healthcare and telecommunications. Regulators in certain industries have adopted and may in the future adopt regulations or interpretive positions regarding the use of cloud computing and other outsourced services. The costs of compliance with, and other burdens imposed by, industry-specific laws, regulations and interpretive positions may limit our customers’ use and adoption of our services and reduce overall demand. For example, some financial services regulators have imposed guidelines for use of
16
cloud computing services that mandate specific controls or that require financial services providers to obtain regulatory approval prior to outsourcing certain functions. If we are unable to comply with these guidelines or controls, or if our customers are unable to obtain regulatory approval to use our service where required, our business may be harmed. In addition, an inability to satisfy the standards of certain third-party certification bodies that our customers may expect, such as the Payment Card Industry (PCI) Data Security Standards, may have an adverse impact on our business. If we are unable in the future to achieve or maintain these industry-specific certifications or comply with other similar requirements or standards that are relevant to our customers, our business and our revenue may be adversely impacted.
In some cases, industry-specific laws, regulations or interpretive positions may also apply directly to us as a service provider. Any failure or perceived failure by us to comply with such requirements could have a material adverse impact on our business and results of operations.
Downturns in the global economic environment or in particular industries in which our sales are concentrated may adversely affect our business and results of operations.
The United States and other global economies have experienced in the past and could in the future experience economic downturn that affects all sectors of the economy, particularly in the financial services and retail industries, resulting in declines in economic growth and consumer confidence, increases in unemployment rates and uncertainty about economic stability. Further, there is increased uncertainty regarding social, political, immigration and trade policies in the United States, which could impact our global operations and our business. Global credit and financial markets have in the past experienced extreme disruptions, including diminished liquidity and credit availability and rapid fluctuations in market valuations. Our business has been affected by these conditions in the past and could be similarly impacted in the future by any downturn in global economic conditions.
Our business is, and will continue to be, dependent on sales to customers in the telecommunications, financial services, retail, automotive, real estate and technology industries. A downturn in one or more of these industries could have a material adverse effect on our business, liquidity, results of operations, financial condition and cash flows. In the event that industry conditions deteriorate in one or more of these industries, we could experience, among other things, cancellation or non-renewal of existing contracts, reduced demand for our products and reduced sales. It could be difficult to predict the timing, strength or duration of any economic slowdown or subsequent economic recovery, either relating to the global economic environment or to the particular industries in which our sales are concentrated, which, in turn, could make it more challenging for us to forecast our operating results, make business decisions and identify risks that may adversely affect our business, sources and uses of cash, financial condition and results of operations.
Weak economic conditions may also cause our customers to experience difficulty in supporting their current operations and implementing their business plans. Our customers may reduce their spending on our services, may not be able to discharge their payment and other obligations to us, may experience difficulty raising capital, or may elect to scale back the resources they devote to customer service and/or sales and marketing technology, including services such as ours. Economic conditions may also lead consumers and businesses to postpone spending, which may cause our customers to decrease or delay their purchases of our products and services. If economic conditions deteriorate for us or our customers, we could be required to record charges relating to restructuring costs or the impairment of assets, may not be able to collect receivables on a timely basis, and our business, financial condition and results of operations could be materially adversely affected.
Economic conditions and regulatory changes caused by the United Kingdom’s likely exit from the European Union could negatively impact our business.
The United Kingdom (“U.K.”) held a referendum on June 23, 2016 on its membership in the European Union (“E.U.”), in which a majority of U.K. voters voted to exit the E.U. (commonly referred to as “Brexit”). The referendum was advisory, and the terms of any withdrawal are subject to a negotiation period that could last at least two years after the government of the U.K. formally initiates a withdrawal process. These negotiations will determine the future terms of the U.K.’s relationship with the E.U., including the terms of trade between the U.K. and the E.U.
The announcement of Brexit has resulted in significant volatility in global stock market and currency exchange rate fluctuations that resulted in strengthening of the U.S. dollar relative to other foreign currencies in which we conduct business. The announcement of Brexit and likely withdrawal of the U.K. from the E.U. has also created global economic uncertainty, which may cause our customers to closely monitor their costs and reduce their spending budgets. This could negatively impact our business, including affecting our relationships with our existing and future customers, suppliers and employees, which could have a negative impact on our business, prospects, results of operations, financial condition and cash flows.
The effects of Brexit will depend on any agreements the U.K. makes to retain access to E.U. markets either during a transitional period or more permanently. The measures could potentially disrupt the markets we serve and the tax jurisdictions in which we operate and adversely change tax benefits or liabilities in these or other jurisdictions, and may cause us to lose customers, suppliers and/or employees. In addition, Brexit could lead to legal uncertainty and potentially divergent national laws and
17
regulations as the U.K. determines which E.U. laws to replace or replicate. Any of these effects of Brexit, among others, could negatively impact our prospects, business, financial condition and results of operations.
Our business depends significantly on our ability to retain our key personnel, attract new personnel, and manage attrition.
Our success depends largely on the continued services of our senior management team. The loss of one or more members of senior management could have a material adverse effect on our business, results of operations and financial condition. We are also substantially dependent on the continued service of other key personnel, including key sales executives responsible for revenue generation and key development personnel accountable for product and service innovation and timely development and delivery of upgrades and enhancements to our existing products and services. Changes to senior management and key employees could also lead to additional unplanned losses of key employees. The loss of key employees could seriously harm our ability to release new products and services and upgrade existing products and services on a timely basis, which could significantly help our competitors.
In the technology industry, there is substantial competition for key personnel, including skilled engineers, sales executives and operations personnel. We may not be able to successfully recruit, integrate and retain qualified personnel in the future, which could harm our business. If our retention and recruitment efforts are ineffective, employee turnover could increase and our ability to provide services to our customers would be materially and adversely affected. Furthermore, the requirement to expense stock options may discourage us from granting the size or type of stock option awards that job candidates may require in order to join our company.
In addition, we may not be able to outsource certain functions. We expect to evaluate our needs and the performance of our staff on a periodic basis, and may choose to make adjustments in the future. If the size of our staff is significantly reduced, either by our choice or otherwise, it may become more difficult for us to manage existing, or establish new, relationships with customers and other counter-parties, or to expand and improve our service offerings. It may also become more difficult for us to implement changes to our business plan or to respond promptly to opportunities in the marketplace. Further, it may become more difficult for us to devote personnel resources necessary to maintain or improve existing systems, including our financial and managerial controls, billing systems, reporting systems and procedures. Thus, any significant amount of staff attrition could cause our business and financial results to suffer.
If we do not successfully integrate past or potential future acquisitions, we may not realize the expected business or financial benefits and our business could adversely impacted.
As part of our business strategy, we have made and will continue to make acquisitions to add complementary businesses, products, technologies, revenue and intellectual property rights. We have made a number of acquisitions during the past decade, including three in 2014. In November 2014, we acquired Contact At Once!, LLC, a software company with a cloud-based platform that instantly connects consumers with businesses through instant messaging, text messaging, chat, social media and video over the internet for consumer-to-business sales conversions. In June 2014, we acquired Synchronite LLC, a German based start-up that provides co-browsing technology, and in March 2014, we acquired NexGraph, LLC, a company focused on analytic solutions.
Acquisitions and investments involve numerous risks to us, including:
|
•
|
potential failure to achieve the expected benefits of the combination or acquisition;
|
|
•
|
inability to generate sufficient revenue to offset acquisition or investment cost;
|
|
•
|
difficulties in integrating operations, technologies, products and personnel;
|
|
•
|
diversion of financial and management resources from efforts related to existing operations;
|
|
•
|
risks of entering new markets in which we have little or no experience or where competitors may have stronger market positions;
|
|
•
|
potential loss of our existing key employees or key employees of the company we acquire;
|
|
•
|
inability to maintain relationships with customers and partners of the acquired business
|
|
•
|
use of alternative investment or compensation structures;
|
|
•
|
potential unknown liabilities associated with the acquired businesses; and
|
|
•
|
the tax effects of any such acquisitions.
|
These difficulties could disrupt our ongoing business, expose us to unexpected costs, distract our management and employees, increase our expenses and adversely affect our results of operations. Furthermore, we may incur debt or issue equity securities to pay for any future acquisitions. The issuance of equity securities could be dilutive to our existing stockholders.
18
We may be unsuccessful in expanding our operations internationally and/or into direct-to-consumer services due to additional regulatory requirements, tax liabilities, currency exchange rate fluctuations and other risks, which could adversely affect our results of operations.
We opened an office in France in 2015, an office in Italy in 2014, and offices in Germany, Japan and the Netherlands in 2013, and we also have operations in the United Kingdom, Australia and Israel. We have also continued to invest in global e-commerce initiatives and in acquisitions. For example, in November 2014, we acquired “Contact At Once!, LLC” a software company with a cloud-based platform that instantly connects consumers with businesses through instant messaging, text messaging, chat, social media and video over the internet for consumer-to-business sales conversions. In 2014 we also acquired Synchronite LLC, a German based start-up that provides co-browsing technology, and NexGraph, LLC, a company focused on analytic solutions. Our ability to continue to expand into international markets and in the online consumer market involves various risks, including the possibility that returns on such investments will not be achieved in the near future, or ever, and the difficulty of competing in markets with which we are unfamiliar.
Our international operations and direct-to-consumer services may also fail due to other risks inherent in foreign and/or online consumer operations, including:
|
•
|
varied, unfamiliar, unclear and changing legal and regulatory restrictions, including different legal and regulatory standards applicable to Internet services, communications, privacy, and data protection;
|
|
•
|
difficulties in staffing and managing foreign operations;
|
|
•
|
differing intellectual property laws that may not provide sufficient protection for our intellectual property;
|
|
•
|
adverse tax consequences or additional tax liabilities;
|
|
•
|
difficulty in addressing country-specific business requirements and regulations;
|
|
•
|
fluctuations in currency exchange rates;
|
|
•
|
strains on financial and other systems to properly administer VAT and other taxes;
|
|
•
|
different consumer preferences and requirements in specific international markets; and
|
|
•
|
international legal, compliance, political, regulatory or systemic restrictions, or other international governmental scrutiny, applicable to United States companies with sales and operations in foreign countries, including, but not limited to, possible compliance issues involving the U.S. Foreign Corrupt Practices Act, the U.K. Bribery Act, and similar laws in other jurisdictions.
|
Our current and any future international expansion plans will require management attention and resources and may be unsuccessful. We may find it impossible or prohibitively expensive to continue expand internationally or we may be unsuccessful in our attempt to do so, and our results of operations could be adversely impacted. In addition, violations of any foreign laws or regulations could result in fines, criminal sanctions against us, our officers or our employees, prohibitions on the conduct of our business and damage to our reputation.
19
We may be liable if third parties access or misappropriate confidential or personal data from our systems or services.
The dialogue transcripts of the text-based chats, email interactions and other interactions between our customers and their users may include information, such as personal contact and demographic information. Although we employ and continually test and update our security measures to protect this information from unauthorized access, it is still possible that our security measures could be breached and such a breach could result in unauthorized access to our customers’ data or our data, including our intellectual property and other confidential business information. Because the techniques employed by hackers to obtain unauthorized access or to sabotage systems change frequently and are becoming more sophisticated in circumventing security measures and avoiding detection, we may be unable to anticipate all techniques or to implement adequate preventative measures. Any security breach could result in disclosure of our trade secrets or disclosure of confidential customer, supplier or employee data. If third parties were able to penetrate our network security or otherwise misappropriate personal data relating to our customers’ Internet users or the text of customer service inquiries, our competitive position may be harmed and we could be subject to liability. In the event of a security incident, we could be liable for compliance with a myriad of breach notification laws at the state, federal and international level, which may cause business disruption and extensive notification costs, and could lead to penalties, government investigations and lawsuits for compliance failures. We may as a result of a security incident be deemed out of compliance with United States federal and state laws, international laws, or contractual commitments, and we may be subject to government investigations, lawsuits, fines, criminal penalties, statutory damages, and other costs to respond to breach or security incidents, which could have a material adverse effect on our business, results of operations and financial condition. We may incur significant costs to protect against the threat of security breaches or to mitigate the harm and alleviate problems caused by such breaches. Furthermore, certain software and services that we use to operate our business are hosted and/or operated by third parties or integrated with our systems. If these services were to be interrupted or their security breached, our business operations could be similarly disrupted and we could be exposed to liability and costly investigations or litigation.
The need to physically secure and securely transmit and store confidential information online has historically been a significant barrier to e-commerce and online communications and will accelerate as a consumer and regulatory focus and concern. Any publicized compromise of security could deter people from using online services such as the ones we offer or from using them to conduct transactions, which involve transmitting confidential information. Because our success depends on the general acceptance and reputation of our services and electronic commerce, we may incur significant costs to protect against the threat of security breaches or to alleviate problems caused by these breaches.
We provide service level commitments to certain customers. If we do not meet these contractual commitments, we could be obligated to provide credits or refunds or face contract terminations, which could adversely affect our revenue and harm our reputation.
As is common for many cloud service providers, we offer service level commitments in certain of our customer contracts, primarily related to uptime of our service. If we are unable to meet the stated service level commitments or suffer periods of downtime that exceed the periods allowed under our customer contracts, whether due to downtime caused by us or our third-party service providers, we may be contractually obligated to provide these customers with service credits and/or pay financial penalties, which could significantly impact our revenue. In addition, even if our contracts provide otherwise, these customers may attempt to terminate their contracts and/or pursue other legal remedies. Recurring or extended service outages could also cause damage to our reputation and result in substantial customer dissatisfaction or loss, which could adversely affect our current and future revenue and operating results.
We are dependent on technology systems and third-party content that are beyond our control.
The success of our services depends in part on our customers’ online services as well as the Internet connections of visitors to websites, both of which are outside of our control. As a result, it may be difficult to identify the source of problems if they occur. In the past, we have experienced problems related to connectivity which has resulted in slower than normal response times to Internet user chat requests and messages and interruptions in service. Our services rely both on the Internet and on our connectivity vendors for data transmission. Therefore, even when connectivity problems are not caused by our services, our customers or Internet users may attribute the problem to us. This could diminish our brand and harm our business, divert the attention of our technical personnel from our product development efforts or cause significant customer relations problems.
In addition, we rely in part on third-party service providers and other third parties for various services, including, but not limited, to Internet connectivity, network infrastructure hosting, security and maintenance, and software and hardware from a variety of vendors. These providers may experience problems that result in slower than normal response times and/or interruptions in service. If we are unable to continue utilizing the third-party services that support our web hosting and infrastructure or if our services experience interruptions or delays due to third party providers, our reputation and business could be harmed, and we may be exposed to legal and reputational risk, and significant remediation costs.
We also rely on the security of our third party providers to protect our proprietary information and information of our customers. Information technology system failures, including a breach of our or our third party providers’ data security, could disrupt our ability to function in the normal course of business by potentially causing, among other things, an unintentional
20
disclosure of customer information or loss of information. Additionally, despite our security procedures or those of our third party providers, information systems may be vulnerable to threats such as computer hacking, cyber-terrorism or other unauthorized attempts by third parties to access, obtain, modify or delete our or our customers’ data. Any such breach could have a material adverse effect on our operating results and our reputation as a provider of business collaboration and communications solutions and could subject us to significant penalties and negative publicity, as well as government investigations and claims for damages or injunctive relief under state, federal and foreign laws or contractual agreements.
We also depend on third parties for hardware and software, and our consumer services depend on third parties for content. Such products and content could contain defects or inaccurate information. Problems arising from our use of such hardware or software or third party content could require us to incur significant costs or divert the attention of our technical or other personnel from our product development efforts or to manage issues related to content. To the extent any such problems require us to replace such hardware or software we may not be able to do so on acceptable terms, if at all.
Our products and services may infringe upon intellectual property rights of third parties and any infringement could require us to incur substantial costs and may distract our management.
We have had patent and other infringement lawsuits filed against us claiming that certain of our products and services infringe third party intellectual property rights, and we are subject to the future risk of additional third party claims alleging infringement against us or against our customers for use of our products and services. Many of our customer and partner contracts, including certain suppliers, contain indemnification obligations requiring us to indemnify our customers from certain claims against them or arising from the use of our services. Substantial litigation regarding intellectual property rights exists in the software industry. In the ordinary course of our business, our services and/or our customers’ use of our services may be increasingly subject to third-party infringement claims as claims by non-practicing entities become more prevalent and the number of competitors in our industry segment grows and the functionality of services in different industry segments overlaps. Some of our competitors in the market for digital engagement technology, and/or web and mobile based consumer-facing services or other third parties may have filed or may intend to file patent applications covering aspects of their technology and have asserted or may assert claims against us. Any claims alleging infringement of third-party intellectual property rights could require us to spend significant amounts in litigation (even if the claim is invalid), distract management from other tasks of operating our business, pay substantial damage awards, prevent us from selling our products, delay delivery of our services, require the development of non-infringing software, technology, business processes, systems or other intellectual property (none of which might be successful), or limit our ability to use the intellectual property that is the subject of any of these claims, unless we enter into license agreements with the third parties (which may be costly, unavailable on commercially reasonable terms, or not available at all). Therefore, any such claims could have a material adverse effect on our business, results of operations, cash flows and financial condition.
Our business and prospects would suffer if we are unable to protect and enforce our intellectual property rights.
Our success and ability to compete depend, in part, upon the protection of our intellectual property rights relating to the technology underlying our services. We rely on a combination of patent, copyright, trade secret, trademark and other common law protections in the United States and other jurisdictions, as well as confidentiality requirements and contractual provisions, to protect our proprietary technology, processes and other intellectual property. We own a portfolio of patents and patent applications in the United States and internationally and regularly file patent applications to protect intellectual property that we believe is important to our business, including intellectual property related to digital engagement technology, and/or web and mobile based consumer-facing services. We believe the duration of our patents is adequate relative to the expected lives of our products and services. We pursue the registration of our domain names, trademarks and trade names in the United States and in certain locations outside the United States. We also own copyrights, including in our software, publications and other documents authored by us. These intellectual property rights are important to our business and marketing efforts. We seek to protect our intellectual property rights by relying on federal, state, and common law rights, including registration, or otherwise in the United States and certain foreign jurisdictions, as well as contractual restrictions. However, we believe that factors such as the technological and creative skills of our personnel, new service developments, frequent enhancements and reliable maintenance are more essential to establishing and maintaining a competitive advantage. Others may develop technologies that are similar or superior to our technology. We enter into confidentiality and other written agreements (including invention assignment agreements) with our employees, consultants, customers, potential customers, strategic partners, and other third parties, and through these and other written agreements, we attempt to control access to and distribution of our software, documentation and other proprietary information. Despite our efforts to protect our proprietary rights, third parties may, in an unauthorized manner, attempt to use, copy or otherwise obtain and market or distribute our intellectual property rights or technology or otherwise develop a service with the same functionality as our services. Policing unauthorized use of our services and intellectual property rights is difficult, and we cannot be certain that the steps we have taken will prevent misappropriation of our technology or intellectual property rights, particularly in foreign countries where we do business, where our services are sold or used, where the laws may not protect proprietary rights as fully as do the laws of the United States or where enforcement of laws protecting proprietary rights is not common or effective.
21
The duration of the protection afforded to our intellectual property depends on the type of property in question, the laws and regulations of the relevant jurisdiction and the terms of its license agreements with others. With respect to our trademarks and trade names, trademark laws and rights are generally territorial in scope and limited to those countries where a mark has been registered or protected. While trademark registrations may generally be maintained in effect for as long as the mark is in use in the respective jurisdictions, there may be occasions where a mark or title is not registrable or protectable or cannot be used in a particular country. In addition, a trademark registration may be cancelled or invalidated if challenged by others based on certain use requirements or other limited grounds. The duration of property rights in trademarks, service marks and tradenames in the United States, whether registered or not, is predicated on our continued use.
It is possible that:
|
•
|
any issued patent or patents issued in the future may not be broad enough to protect our intellectual property rights;
|
|
•
|
any issued patent or any patents issued in the future could be successfully challenged by one or more third parties, which could result in our loss of the right to prevent others from exploiting the inventions claimed in the patents;
|
|
•
|
current and future competitors may independently develop similar technologies, duplicate our services or design around any patents we may have; and
|
|
•
|
effective intellectual property protection may not be available in every country in which we do business, where our services are sold or used, where the laws may not protect proprietary rights as fully as do the laws of the United States or where enforcement of laws protecting proprietary rights is not common or effective.
|
Further, to the extent that the invention described in any United States patent was made public prior to the filing of the patent application, we may not be able to obtain patent protection in certain foreign countries. We also rely upon copyright, trade secret, trademark and other common law in the United States and other jurisdictions, as well as confidentiality procedures and contractual provisions, to protect our proprietary technology, processes and other intellectual property. Any steps we might take may not be adequate to protect against infringement and misappropriation of our intellectual property by third parties. Similarly, third parties may be able to independently develop similar or superior technology, processes or other intellectual property. Third parties may register marks that are confusingly similar to the trademarks or services marks that we have used in the United States and our failure to monitor foreign registrations or mark usage may impact out rights in certain trademarks or services marks. Policing unauthorized use of our services and intellectual property rights is difficult, and we cannot be certain that the steps we have taken will prevent misappropriation of our technology or intellectual property rights, particularly in foreign countries where we do business, where our services are sold or used, where the laws may not protect proprietary rights as fully as do the laws of the United States or where enforcement of laws protecting proprietary rights is not common or effective. The unauthorized reproduction or other misappropriation of our intellectual property rights could enable third parties to benefit from our technology without paying us for it. If this occurs, our business, results of operations and financial condition could be materially and adversely affected. In addition, disputes concerning the ownership or rights to use intellectual property could be costly and time-consuming to litigate, may distract management from operating our business and may result in our loss of significant rights.
We may be subject to legal liability and/or negative publicity for the services provided to consumers via our technology platforms.
Our technology platforms enable representatives of our customers as well as individual service providers to communicate with consumers and other persons seeking information or advice on the Internet. The law relating to the liability of online platform providers such as us for the activities of users of their online platforms is often challenged in the United States and internationally. We may be unable to prevent users of our technology platforms from providing negligent, unlawful or inappropriate advice, information or content via our technology platforms, or from behaving in an unlawful manner, and we may be subject to allegations of civil or criminal liability for negligent, fraudulent, unlawful or inappropriate activities carried out by users of our technology platforms.
Claims could be made against online services companies under both United States and foreign law, such as fraud, defamation, libel, invasion of privacy, negligence, data breach, copyright or trademark infringement, or other theories based on the nature and content of the materials disseminated by users of our technology platforms. In addition, domestic and foreign legislation has been proposed that could prohibit or impose liability for the transmission over the Internet of certain types of information. Our defense of any of these actions could be costly and involve significant time and attention of our management and other resources.
The Digital Millennium Copyright Act, or DMCA, is intended, among other things, to reduce the liability of online service providers for listing or linking to third party web properties that include materials that infringe copyrights or rights of others. Additionally, portions of The Communications Decency Act, or CDA, are intended to provide statutory protections to online service providers who distribute third party content. A safe harbor for copyright infringement is also available under the DMCA to certain online service providers that provide specific services, if the providers take certain affirmative steps as set forth in the DMCA. Important questions regarding the safe harbor under the DMCA and the CDA have yet to be litigated, and we cannot guarantee that we will meet the safe harbor requirements of the DMCA or of the CDA. If we are not covered by a safe harbor, for any reason, we could be exposed to claims, which could be costly and time-consuming to defend.
22
Our consumer service allows consumers to provide feedback regarding service providers. Although all such feedback is generated by users and not by us, claims of defamation or other injury could be made against us for content posted on our websites. Our liability for such claims may be higher in jurisdictions outside the United States where laws governing Internet transactions are unsettled.
If we become liable for information provided by our users and carried via our service in any jurisdiction in which we operate, we could be directly harmed and we may be forced to implement new measures to reduce our exposure to this liability. In addition, the increased attention focused upon liability issues as a result of these lawsuits and legislative proposals could harm our reputation or otherwise impact the growth of our business. Any costs incurred as a result of this potential liability could harm our business.
In addition, negative publicity and user sentiment generated as a result of fraudulent or deceptive conduct by users of our technology platforms could damage our reputation, reduce our ability to attract new users or retain our current users, and diminish the value of our brand.
In the future, we may be required to spend substantial resources to take additional protective measures or discontinue certain service offerings, either of which could harm our business. Any costs incurred as a result of potential liability relating to the sale of unlawful services or the unlawful sale of services could harm our business.
In addition to legislation and regulations relating to privacy and data security and collection, we may be subject to consumer protection laws that are enforced by regulators such as the FTC and private parties, and include statutes that regulate the collection and use of information for marketing purposes. Any new legislation or regulations regarding the Internet, software sales or export and/or the cloud or Software-as-a-Service industry, and/or the application of existing laws and regulations to the Internet, software sales or export and/or the cloud or Software-as-a-Service industry, could create new legal or regulatory burdens on our business that could have a material adverse effect on our business, results of operations and financial condition. Additionally, as we operate outside the United States, the international regulatory environment relating to the Internet, software sales or export, and/or the Software-as-a-Service industry could have a material adverse effect on our business, results of operations and financial condition.
Technological or other defects could disrupt or negatively impact our services, which could harm our business and reputation.
We face risks related to the technological capabilities of our services. We expect the number of interactions between our customers’ operators and Internet users over our system to increase significantly as we expand our customer base. Our network hardware and software may not be able to accommodate this additional volume. Additionally, we must continually upgrade our software to improve the features and functionality of our services in order to be competitive in our markets. If future versions of our software contain undetected errors, our business could be harmed. If third-party content is flawed, our business could be harmed. As a result of software upgrades at LivePerson, our customer sites have, from time to time, experienced slower than normal response times and interruptions in service. If we experience system failures or degraded response times, our reputation and brand could be harmed. We may also experience technical problems in the process of installing and initiating the LivePerson services on new web hosting services. These problems, if not remedied, could harm our business.
Our services also depend on complex software which may contain defects, particularly when we introduce new versions onto our servers. We may not discover software defects that affect our new or current services or enhancements until after they are deployed. It is possible that, despite testing by us, defects may occur in the software. These defects could result in:
|
•
|
damage to our reputation;
|
|
•
|
lost sales;
|
|
•
|
delays in or loss of market acceptance of our products; and
|
|
•
|
unexpected expenses and diversion of resources to remedy errors.
|
Our products are complex, and errors, failures or “bugs” may be difficult to correct.
Our products are complex, integrating hardware, software and elements of a customers’ existing infrastructure. Despite quality assurance testing conducted prior to the release of our products our software may contain “bugs” that are difficult to detect and fix. Any such issues could interfere with the expected operation of a solution, which might negatively impact customer satisfaction, reduce sales opportunities or affect gross margins. Depending upon the size and scope of any such issue, remediation may have a negative impact on our business. Our inability to cure an application or product defect, should one occur, could result in the failure of an application or product line, damage to our reputation, litigation and/or product reengineering expenses. Our insurance may not cover or may be insufficient to cover expenses associated with such events.
23
The non-payment or late payment of amounts due to us from a significant number of customers may negatively impact our financial condition or make it difficult to forecast our revenues accurately.
During
2016
, we increased our allowance for doubtful accounts from
$1.2 million
to approximately
$1.7 million
, principally due to analysis of the accounts receivable aging. During 2015, we decreased our allowance for doubtful accounts by $0.1 million to approximately $1.2 million, principally due to an increase in write-offs compared to 2014. A large proportion of receivables are due from larger corporate customers that typically have longer payment cycles. As a result of increasingly long payment cycles, we have faced increased difficulty in predicting our operating results for any given period, and have experienced significant unanticipated fluctuations in our revenues from period to period. Any failure to achieve anticipated revenues in a period could cause our stock price to decline.
Our services are subject to payment-related risks.
For certain payment methods, including credit and debit cards, we pay interchange and other fees, which may increase over time and raise our operating costs and lower our profit margins. We rely on third parties to provide payment processing services, including the processing of credit cards, debit cards and it could disrupt our business if these companies become unwilling or unable to provide these services to us. We are also subject to payment card association operating rules, certification requirements and rules governing electronic funds transfers, which could change or be reinterpreted to make it difficult or impossible for us to comply. If we fail to comply with these rules or requirements, we may be subject to fines and higher transaction fees and lose our ability to accept credit and debit card payments from our customers or facilitate other types of online payments, and our business and operating results could be adversely affected.
Through our consumer-facing platform, we facilitate online transactions between individual service providers who provide online advice and information to consumers. In connection with these services, we accept payments using a variety of methods, such as credit card, debit card and PayPal. These payments are subject to “chargebacks” when consumers dispute payments they have made to us. Chargebacks can occur whether or not services were properly provided. Susceptibility to chargebacks puts a portion of our revenue at risk. We take measures to manage our risk relative to chargebacks and to recoup properly charged fees, however, if we are unable to successfully manage this risk our business and operating results could be adversely affected. As we offer new payment options to our users, we may be subject to additional regulations, compliance requirements, and fraud.
We are also subject to a number of other laws and regulations relating to money laundering, international money transfers, privacy and information security and electronic fund transfers. If we were found to be in violation of applicable laws or regulations, we could be subject to civil and criminal penalties or forced to cease our payments services business.
Delays in our implementation cycles could have an adverse effect on our results of operations.
Certain of our products require some implementation services, including but not limited to, training our customers. We have historically experienced a lag between signing a customer contract and recognizing revenue from that customer. Although this lag has typically ranged from 30 to 90 days, it may take more time between contract signing and recognizing revenue in certain situations. If we experience delays in implementation or do not meet project milestones in a timely manner, we could be obligated to devote more customer support, engineering and other resources to a particular project. If new or existing customers cancel or have difficulty deploying our products or require significant amounts of our professional services, support, or customized features, revenue recognition could be canceled or delayed and our costs could increase, which could negatively impact our operating results.
If our goodwill or amortizable intangible assets become impaired, we may be required to record a significant charge to earnings.
Under accounting principles generally accepted in the United States, we review our amortizable intangible assets for impairment when events or changes in circumstances indicated that the carrying value may not be recoverable. We review our goodwill for impairment at least annually and when events or changes in circumstances indicate that the carrying value may not be recoverable. Factors that may be considered a change in circumstances indicating that the carrying value of our goodwill or amortizable intangible assets may not be recoverable include a decline in stock price and market capitalization, reduced future cash flow estimates, and slower growth rates in our industry. Based on our annual review for
2016
, we determined that it is not more-likely that the fair value of the reporting units is less than their carrying amount. However, future assessments may yield a different result, and from time to time, we may be required to record a significant charge to earnings in our consolidated financial statements during the period in which any impairment of our goodwill is determined, resulting in a negative impact on our results of operations.
There are inherent limitations on the effectiveness of our controls.
We do not expect that our disclosure controls or our internal control over financial reporting will prevent or detect all errors and all fraud. A control system, no matter how well-designed and operated, can provide only reasonable, not absolute, assurance that the control system’s objectives will be met. The design of a control system must reflect the fact that resource constraints exist, and the benefits of controls must be considered relative to their costs. Further, because of the inherent limitations in all control
24
systems, no evaluation of controls can provide absolute assurance that misstatements due to error or fraud will not occur or that all control issues and instances of fraud, if any, have been detected. The design of any system of controls is based in part on certain assumptions about the likelihood of future events, and there can be no assurance that any design will succeed in achieving its stated goals under all potential future conditions. Projections of any evaluation of the effectiveness of controls to future periods are subject to risks. Over time, controls may become inadequate due to changes in conditions or deterioration in the degree of compliance with policies or procedures. If our controls become inadequate, we could fail to meet our financial reporting obligations, our reputation may be adversely affected, our business and operating results could be harmed, and the market price of our stock could decline.
In the past, we have experienced losses, we had an accumulated deficit of
$144.9 million
as of December 31,
2016
and we may incur losses in the future.
We have in the past incurred, and we may in the future, incur losses and experience negative cash flow, either or both of which may be significant. We recorded net losses from inception through the year ended December 31, 2003. We recorded net income for the years ended December 31, 2004 through 2007 and 2009 through 2012, while we recorded net losses for the years ended December 31, 2008, and 2013 through 2016. We recorded a net loss of
$25.9 million
for the year ended December 31,
2016
. As of December 31,
2016
, our accumulated deficit was approximately
$144.9 million
. We cannot assure you that we can sustain or increase profitability on a quarterly or annual basis in the future. Failure to maintain profitability may materially and adversely affect the market price of our common stock.
With the recent volatility in the capital markets, there is a risk that we could suffer a loss of principal in our cash and cash equivalents and short term investments and suffer a reduction in our interest income or in our return on investments.
As of December 31,
2016
, we had
$50.9 million
in cash and cash equivalents. We regularly invest excess funds from our cash and cash equivalents in short-term money market funds. We currently hold no mortgaged-backed or auction rate securities. However, some of our investments are subject to general credit, liquidity, market and interest rate risks, which may be exacerbated by the ongoing uncertainty in the United States and global credit markets that have affected various sectors of the financial markets and caused global credit and liquidity issues. In the future, these market risks associated with our investment portfolio may harm the results of our operations, liquidity and financial condition. Although we believe we have chosen a more cautious portfolio designed to preserve our existing cash position, it may not adequately protect the value of our investments. Furthermore, this more cautious portfolio is unlikely to provide us with any significant interest income in the near term.
Capital needs necessary to execute our business strategy could increase substantially and we may not be able to secure additional financing to execute this strategy.
To the extent that we require additional funds to support our operations or the expansion of our business, or to pay for acquisitions, we may need to sell additional equity, issue debt or convertible securities or obtain credit facilities through financial institutions. In the past, we have obtained financing principally through the sale of preferred stock, common stock and warrants. If additional funds are raised through the issuance of debt or preferred equity securities, these securities could have rights, preferences and privileges senior to holders of common stock, and could have terms that impose restrictions on our operations. If additional funds are raised through the issuance of additional equity or convertible securities, our stockholders could suffer dilution. We cannot assure you that additional funding, if required, will be available to us in amounts or on terms acceptable to us. If sufficient funds are not available or are not available on acceptable terms, our ability to fund any potential expansion, take advantage of acquisition opportunities, develop or enhance our services or products, or otherwise respond to competitive pressures would be significantly limited. Those limitations would materially and adversely affect our business, results of operations, cash flows and financial condition.
Failure to license necessary third party software for use in our products and services, or failure to successfully integrate third party software, could cause delays or reductions in our sales, or errors or failures of our service.
We license third party software that we plan to incorporate into our products and services. In the future, we might need to license other software to enhance our products and meet evolving customer requirements. These licenses may not continue to be available on commercially reasonable terms or at all. Some of this technology could be difficult to replace once integrated. The loss of, or inability to obtain, these licenses could result in delays or reductions of our applications until we identify, license and integrate or develop equivalent software, and new licenses could require us to pay higher royalties. If we are unable to successfully license and integrate third party technology, we could experience a reduction in functionality and/or errors or failures of our products, which may reduce demand for our products and services.
Third-party licenses may expose us to increased risks, including risks associated with the integration of new technology, the impact of new technology integration on our existing technology, open source software disclosure risks, the diversion of resources from the development of our own proprietary technology, and our inability to generate revenue from new technology sufficient to offset associated acquisition and maintenance costs.
25
Our reputation depends, in part, on factors which are partially or entirely outside of our control.
Our services typically appear under the LivePerson brand or as a LivePerson-branded icon on our customers’ websites. The customer service operators who respond to the inquiries of our customers’ Internet users are employees or agents of our customers; they are not our employees. The experts who respond to the inquiries of Internet users are independent consultants or agents of our customers; they are not our employees. As a result, we are not able to control the actions of these operators or experts. In addition, an Internet user may not know that the operator or expert is not a LivePerson employee. If an Internet user were to have a negative experience in a LivePerson-powered real-time dialogue, it is possible that this experience could be attributed to us, which could diminish our brand and harm our business. Finally, we believe the success of our business services is aided by the prominent placement of the chat icon on a customer’s website, over which we also have no control.
Because we recognize revenue from subscriptions for our service over the term of the subscription, declines in business may not be immediately reflected in our operating results.
We generally recognize revenue from customers ratably over the terms of their subscription agreements, which are typically 12 or more months. As a result, much of the revenue we report in each quarter is the result of subscription agreements entered into during previous quarters. Consequently, a decline in new or renewed subscriptions or cancellations of existing subscriptions in any one quarter may not be reflected in our revenue results for that quarter. Any such decline, however, could negatively affect our revenue in future quarters. Our subscription model also makes it difficult for us to rapidly increase our revenue through additional sales in any period, because revenue from new customers and additional revenue from existing customers is generally recognized over the applicable subscription term, rather than instantaneously.
Our sales cycles can be lengthy, and the timing of sales can be difficult to predict, which may cause our operating results to vary significantly.
The sales cycle for our products can be several months or more and varies substantially from customer to customer, particularly for sales to enterprise customers. Because we sell complex, integrated solutions, it can take many months to close sales as customers evaluate our product offering against available alternatives and define their requirements. We are often required to expend substantial time, effort, and money educating potential customers them about the value of our offerings. The increasingly complex needs of our customers can contribute to a longer sales cycle.
Additionally, our quarterly sales have historically reflected an uneven pattern in which a disproportionate percentage of a quarter’s total sales occur in the last month, weeks and days of each quarter. These patterns make prediction of revenue especially difficult and uncertain and increase the risk of unanticipated variations in our results of operations. As a result, we are not always able to precisely predict the quarter in which expected sales will occur. In addition, historically a large portion of our revenue has derived from large orders from large clients. Consequently, delays in the closing of sales, especially from large clients, could have a material impact on the timing of revenue and results of operations.
Political, economic and military conditions in Israel could negatively impact our Israeli operations
Our product development staff, help desk and online sales support operations are located in Israel. As of December 31, 2016, we had 412 full-time employees in Israel. Although substantially all of our sales to date have been made to customers outside Israel, we are directly influenced by the political, economic and military conditions affecting Israel. Since the establishment of the State of Israel in 1948, a number of armed conflicts have taken place between Israel and its neighboring countries. Any hostilities involving Israel or the interruption or curtailment of trade between Israel and its trading partners could adversely affect our operations and results of operations. During the summer of 2006, Israel was engaged in an armed conflict with Hezbollah, a Lebanese Islamist Shiite militia group and political party, and since March 2011, there has been a civil war in Syria, Israel’s neighboring country to the north. Occasionally, violence from Syria has spilled over across Israel’s border, and Israel has responded militarily several times since the onset of the civil war. During November 2012 and July 2014, Israel was engaged in an armed conflict with Hamas, a militia group and political party which controls the Gaza Strip. These conflicts involved missile strikes against civilian targets in various parts of Israel, including areas in which our employees are located, and negatively affected business conditions in Israel. Any armed conflicts, terrorist activities or political instability in the region could adversely affect business conditions and could harm our results of operations.
Parties with whom we do business may sometimes decline to travel to Israel during periods of heightened unrest or tension, forcing us to make alternative arrangements when necessary in order to meet our business partners face to face. In addition, the political and security situation in Israel may result in parties with whom we have agreements involving performance in Israel claiming that they are not obligated to perform their commitments under those agreements pursuant to force majeure provisions in such agreements.
Recent popular uprisings in various countries in the Middle East and northern Africa are affecting the political stability of those countries. This instability may lead to deterioration of the political and trade relationships that exist between the State of Israel and these countries, as well as potentially affecting the global economy and marketplace through changes in oil and gas prices. In addition, Iran has publicly threatened to attack Israel. Iran is also believed to have a strong influence among extremist
26
groups in the region, such as Hamas in the Gaza Strip and Hezbollah in Lebanon. Additionally, a violent jihadist group named Islamic State of Iraq and Levant, commonly referred to as ISIS, is involved in hostilities in Iraq and Syria and have been growing in influence. Although ISIS’s activities have not directly affected the political and economic conditions in Israel, ISIS’s stated purpose is to take control of the Middle East, including Israel. These situations may potentially escalate in the future to violent events which may negatively affect Israel and us.
Further, in the past, the State of Israel and Israeli companies have been subjected to economic boycotts. Several countries still restrict business with the State of Israel and with Israeli companies. Additional countries may impose restrictions on doing business with Israel and companies that have operations in Israel if hostilities in the region continue or intensify. Such restrictions may seriously limit our ability to sell our products to customers in those countries. Further, shifting economic and political conditions in the United States and in other countries may result in changes in how the United States and other countries conduct business and other relations with Israel, which may have an adverse impact on our Israeli operations and a material adverse impact on our business.
Our commercial insurance may not cover losses that could occur as a result of events associated with the security situation in the Middle East. Any losses or damages incurred by us could have a material adverse effect on our business. Armed conflicts or political instability in the region could negatively affect our business and could harm our results of operations.
Continued hostilities between Israel and its neighbors and any future armed conflict, terrorist activity or political instability in the region could adversely affect our operations in Israel and adversely affect the market price of our common stock. In addition, escalation of tensions or violence might require more widespread military reserve service by some of our Israeli employees and might result in a significant downturn in the economic or financial condition of Israel, either of which could have a material adverse effect on our operations in Israel and our business.
Our reported financial results may be adversely affected by changes in accounting principles generally accepted in the United States.
Accounting principles generally accepted in the United States are subject to interpretation by the FASB, the American Institute of Certified Public Accountants, the SEC, and various bodies formed to promulgate and interpret appropriate accounting principles. A change in these principles or interpretations could have a significant effect on our reported financial results, and could affect the reporting of transactions completed before the announcement of a change.
We cannot assure our stockholders that our current or future stock repurchase programs will enhance/has enhanced long-term stockholder value and stock repurchases could increase the volatility of the price of our common stock and will diminish our cash reserves.
On December 10, 2012, the Company’s Board of Directors approved a stock repurchase program through June 30, 2014. Under the stock repurchase program, the Company is authorized to repurchase shares of its common stock, in the open market or privately negotiated transactions, at times and prices considered appropriate by the Board of Directors depending upon prevailing market conditions and other corporate considerations. On March 13, 2014, the Company's Board of Directors increased the aggregate purchase price of the stock repurchase program from $30.0 million to $40.0 million. On July 23, 2014, the Company's Board of Directors extended the expiration date of the program out to December 31, 2014 and also increased the aggregate purchase price of the stock repurchase program from $40.0 million to $50.0 million. On March 5, 2015, the Company's Board of Directors extended the expiration date of the program out to December 31, 2016. On February 16, 2016, the Company's Board of Directors increased the aggregate purchase price of the stock repurchase program from $50.0 million to $64.0 million. On November 21, 2016, the Company's Board of Directors increased the aggregate purchase price of the stock repurchase program from
$64.0 million
to
$74.0 million
and extended the expiration date of the program out to December 31, 2017. The timing and actual number of shares repurchased depend on a variety of factors including the timing of open trading windows, price, corporate and regulatory requirements, and other market conditions. The program may be suspended or discontinued at any time without prior notice. Repurchases pursuant to our stock repurchase program could affect our stock price and increase its volatility. The existence of a stock repurchase program could also cause our stock price to be higher than it would be in the absence of such a program and could potentially reduce the market liquidity for our stock. Additionally, our stock repurchase program will diminish our cash reserves, which could impact our ability to pursue possible future strategic opportunities and acquisitions and could result in lower overall returns on our cash balances. There can be no assurance that any stock repurchases will enhance stockholder value because the market price of our common stock may decline below the levels at which we repurchased shares of stock. Although our stock repurchase program is intended to enhance long-term stockholder value, short-term stock price fluctuations could reduce the program’s effectiveness. As of December 31, 2016, approximately
$20.1 million
remained available for purchase under the program.
27
Our business is subject to the risks of earthquakes, fires, floods and other natural catastrophic events and to interruption by man-made problems such as terrorism or computer viruses.
Our systems and operations are vulnerable to damage or interruption from earthquakes, fires, floods, hurricanes, other acts of nature, power losses, telecommunications failures, terrorist attacks, acts of war, human errors, break-ins, cyber-attacks or failures, pandemics or other public health crises, or similar events. For example, a significant natural disaster, such as an earthquake, fire or flood, could have a material adverse impact on our business, operating results and financial condition, and our insurance coverage may be insufficient to compensate us for losses that may occur. In addition, acts of terrorism could cause disruptions in our business or the economy as a whole. Our principal executive offices are located in New York City and our largest office is located in Israel, each of which regions has experienced acts of terrorism in the past. Our servers may also be vulnerable to computer viruses, break-ins, cyber-attacks, such as coordinated denial-of-service attacks or ransomware, or other failures, and similar disruptions from unauthorized tampering with our computer systems, which could lead to interruptions, delays, loss of critical data or the unauthorized disclosure of confidential customer data. Although we have implemented security measures and disaster recovery capabilities, there can be no assurance that we will not suffer from business interruption, or unavailability or loss of data, as a result of any such events. As we rely heavily on our servers, computer and communications systems and the internet to conduct our business and provide high quality service to our customers, such disruptions could negatively impact our ability to run our business, result in loss of existing or potential customers and increased expenses, and/or have an adverse effect on our reputation and the reputation of our products and services, any of which would adversely affect our operating results and financial condition.
Risks Related to Our Industry
Future regulation of the Internet may slow our growth, resulting in decreased demand for our services and increased costs of doing business.
State, federal and foreign regulators could adopt laws and regulations that impose additional burdens on companies that conduct business online or that adversely affect the growth or use of the Internet. For example, these laws and regulations could discourage communication by e-mail or other web-based communications, particularly targeted e-mail of the type facilitated by our services, which could reduce demand for our services. Laws or regulations that affect the use of the Internet, including but not limited to laws affecting net neutrality could also decrease demand for our services and increase our costs. Further, regulatory focus on data privacy, data security and consumer protection continues to expand on a worldwide basis and is becoming more complex, which will increase the risks to our business on reputational, operational, and compliance bases.
The continued growth and development of the market for online services may prompt calls for more stringent consumer protection laws or laws that will inhibit the use of Internet-based communications or the information contained in these communications or the ways in which information may be collected, stored, used and transferred in the course of providing services. For example, in the United States, the CAN-SPAM Act regulates the transmission and content of commercial emails, and, among other things, obligates the sending of such emails to provide recipients with the ability to opt-out or unsubscribe and other requirements; and the Children’s Online Privacy Protection Act regulates the ability of certain online services to collect or use certain categories of information from children under age 13 absent parental consent. The adoption of any additional laws or regulations, or changes to existing laws or regulations, may decrease the expansion of the Internet. A decline in the growth of the Internet, particularly as it relates to online communication, could decrease demand for our services and increase our costs of doing business, or otherwise harm our business. Any new legislation or regulations, application of laws and regulations from jurisdictions whose laws do not currently apply to our business, or application of existing laws and regulations to the Internet and other online services could increase our costs and harm our growth.
We may be unable to respond to the rapid technological change and changing customer preferences in the online sales, marketing, customer service, and/or online consumer services industries and this may harm our business.
If we are unable, for technological, legal, financial or other reasons, to adapt in a timely manner to changing market conditions in the online sales, marketing, customer service and/or e-commerce industry or our customers’ or Internet users’ requirements or preferences, our business, results of operations and financial condition would be materially and adversely affected. Business on the Internet is characterized by rapid technological change. In addition, the market for online sales, marketing, customer service and expert advice solutions is relatively new. Sudden changes in customer and Internet user requirements and preferences, frequent new product and service introductions embodying new technologies, such as broadband communications, and the emergence of new industry and regulatory standards and practices such as but not limited to data privacy and security standards could render the LivePerson services and our proprietary technology and systems obsolete. The rapid evolution of these products and services will require that we continually improve the performance, features and reliability of our services. Our success will depend, in part, on our ability to:
|
•
|
enhance the features and performance of our services;
|
|
•
|
develop and offer new services that are valuable to companies doing business online as well as Internet users; and
|
28
|
•
|
respond to technological advances and emerging industry and regulatory standards and practices in a cost-effective and timely manner.
|
If any of our new services, including upgrades to our current services, do not meet our customers’ or Internet users’ expectations, we could lose customers and our business may be harmed. Updating our technology may require significant additional capital expenditures and could materially and adversely affect our business, results of operations and financial condition.
If new services require us to grow rapidly, this could place a significant strain on our managerial, operational, technical and financial resources. In order to manage our growth, we could be required to implement new or upgraded operating and financial systems, procedures and controls. Our failure to expand our operations in an efficient manner could cause our expenses to grow, our revenue to decline or grow more slowly than expected and could otherwise have a material adverse effect on our business, results of operations and financial condition.
We depend on the continued viability of the infrastructure of the Internet.
To the extent that the Internet continues to experience growth in the number of users and frequency of use by consumers resulting in increased bandwidth demands, we cannot assure you that the infrastructure for the Internet will be able to support the demands placed upon it. The Internet has experienced outages and delays as a result of damage to portions of its infrastructure. Outages or delays could adversely affect online sites, email and the level of traffic on the Internet. The Internet is also subject to continued and ongoing cyber-attacks and related conduct, which affect all online businesses. We also depend on Internet service providers that provide our customers and Internet users with access to the LivePerson services. In the past, users have experienced difficulties due to system failures unrelated to our service. In addition, the Internet could lose its viability due to delays in the adoption of new standards and protocols required to handle increased levels of Internet activity. Insufficient availability of telecommunications services to support the Internet also could result in slower response times and negatively impact use of the Internet generally, and our customers’ sites (including the LivePerson dialogue windows) in particular. If the infrastructure of the Internet does not effectively support the growth of the Internet, we may not maintain profitability and our business, results of operations and financial condition will suffer.
We are dependent on the continued growth and acceptance of the Internet as a medium for commerce, and the related expansion of the Internet infrastructure.
We cannot be sure that a sufficiently broad base of consumers will continue to use the Internet for commerce. Convincing our customers to use our mobile and online messaging solutions to communicate with consumers may be difficult. The continuation of the Internet as a viable commercial marketplace is subject to a number of factors, including:
|
•
|
concerns about transaction security or security problems such as “viruses” and “worms” or hackers;
|
|
•
|
concerns about cybersecurity attacks or the security of confidential information online;
|
|
•
|
continued growth in the number of users;
|
|
•
|
continued development of the necessary technological infrastructure;
|
|
•
|
development of enabling technologies;
|
|
•
|
uncertain and increasing government regulation; and
|
|
•
|
the development of complementary services and products.
|
Risks Related to Our Common Stock
Our stock price has been, and may continue to be, highly volatile, which could reduce the value of your investment and subject us to litigation.
The price of our common stock has fluctuated significantly in the past and may continue to be highly volatile, with extreme price and volume fluctuations. Our trading price could fluctuate substantially in the future, including in response to the following factors, some of which are beyond our control:
|
•
|
quarterly variations in our operating results or those of our competitors;
|
|
•
|
earnings announcements that are not in line with analyst expectations;
|
|
•
|
changes in recommendations or financial estimates by securities analysts;
|
|
•
|
announcements or rumors about mergers or strategic acquisitions by us or by our competitors;
|
|
•
|
announcements about customer additions and cancellations or failure to complete significant sales;
|
|
•
|
changes in market valuations of companies that investors believe are comparable to us;
|
|
•
|
additions or departures of key personnel; and
|
|
•
|
general economic, political and market conditions, such as recessions, political unrest or terrorist attacks, or in the specific locations where we operate, such as the United States, Israel and the United Kingdom.
|
In addition, extreme price and volume fluctuations in the stock markets generally, and in the markets for technology companies in particular, could cause the market price for our common stock to decline. In the past, companies that have experienced
29
volatility in the market price of their stock have been the subject of securities class action litigation. We may in the future be the target of similar litigation, which could result in substantial costs and distract management’s attention and resources.
Our common stock is traded on more than one market and this may result in price variations.
Our common stock is currently traded on the NASDAQ Global Select Market and the Tel Aviv Stock Exchange (“TASE”). Trading in our common stock on these markets takes place in different currencies (U.S. dollars on the NASDAQ and New Israeli Shekels on the TASE) and at different times (due to different time zones, trading days and public holidays in the United States and Israel). The trading prices of our common stock on these two markets may differ due to these and other factors. Any decrease in the trading price of our common stock on one of these markets could cause a decrease in the trading price of our common stock on the other market. Differences in trading prices on the two markets could negatively impact our trading price.
If our officers, directors and largest stockholders choose to act together, they may be able to significantly influence our management and operations, acting in their own best interest and not necessarily those of our other stockholders.
As of December 31, 2016, our executive officers, directors and holders of 5% or more of our outstanding common stock and their affiliates in the aggregate beneficially owned approximately 42% of our outstanding common stock. As a result, these stockholders, acting together, have the ability to significantly influence all matters requiring approval by our stockholders, including the election of directors and approval of significant corporate transactions. Our executive officers, directors and principal stockholders could also delay or prevent a change in control. The interests of this group of stockholders may not always coincide with the company’s interests or the interests of other stockholders, and they may act in a manner that advances their best interests and not necessarily those of our other stockholders.
Future sales of substantial amounts of our common stock may negatively affect our stock price.
If we or our stockholders sell substantial amounts of our common stock, including shares issuable upon the exercise of outstanding options and warrants, in the public market, or if the market perceives that these sales might occur, the market price of our common stock could fall. These sales also might make it more difficult for us to sell equity securities in the future at a time and price that we deem appropriate. No prediction can be made as to the effect, if any, that market sales of our common stock will have on the market price of our common stock.
Provisions in our charter documents and Delaware law could discourage, delay or prevent a takeover that stockholders may consider favorable.
Provisions in our amended and restated certificate of incorporation and amended and restated bylaws may have the effect of discouraging, delaying or preventing a change in control or changes in our management that stockholders may deem advantageous. These provisions include the following:
|
•
|
Our board of directors is divided into three classes, with each class serving three-year staggered terms, which prevents stockholders from electing an entirely new board of directors at any annual meeting.
|
|
•
|
Vacancies on our board of directors may only be filled by a vote of a majority of directors then in office, even if less than a quorum.
|
|
•
|
Our amended and restated certificate of incorporation prohibits cumulative voting in the election of directors or any other matters. This limits the ability of minority stockholders to elect director candidates.
|
|
•
|
Our stockholders may only act at a duly called annual or special meeting and may not act by written consent.
|
|
•
|
Stockholders must provide advance notice to nominate individuals for election to our board of directors or to propose other matters that can be acted upon at a stockholders’ meeting.
|
|
•
|
We require super-majority voting by stockholders to amend certain provisions in our amended and restated certificate of incorporation and to amend our amended and restated bylaws.
|
|
•
|
Our amended and restated bylaws expressly authorize a super-majority of the board of directors to amend our amended and restated bylaws.
|
As a Delaware corporation, we are also subject to Section 203 of the Delaware General Corporation Law, which generally prohibits a Delaware corporation from engaging in any of a broad range of business combinations with an interested stockholder for a period of three years following the date on which the stockholder became an interested stockholder, unless certain conditions are met. This anti-takeover provision defenses could discourage, delay or prevent a change in control of our company, whether or not it is desired by or beneficial to our stockholders, which in turn could have a material adverse effect on the market price of our common stock.
None.
30
Our corporate headquarters are located in New York City, where we lease approximately 37,000 square feet of office space under a lease that expires in 2020. We also lease office space of approximately 68,000 square feet in Raanana, Israel, for research and development, sales and support under leases that expire in 2018, of approximately 40,000 square feet in Alpharetta, Georgia, for sales and support under a lease that expires in 2024; and approximately 7,300 square feet in Reading, United Kingdom, for marketing, sales and support under a lease that expires in 2019.
As of December 31, 2016, we also lease office space for marketing, sales and support of approximately 40,000 square feet in various locations in the United States, Europe, Asia and Australia. In addition, we have data centers in the United States, Europe and Australia pursuant to various lease agreements. We believe that our current facilities properties are in good condition and are adequate to meet our current needs. If required, we believe that we will be able to obtain suitable additional space on commercially reasonable terms.
We previously filed an intellectual property suit against [24]7 Customer, Inc. in the Southern District of New York on March 6, 2014 seeking damages on the grounds that [24]7 reverse engineered and misappropriated our technology to develop competing products and misused our business information. Discovery in the New York case is in process. On June 22, 2015, [24]7 Customer, Inc. filed suit against us in the Northern District of California alleging patent infringement. On December 7, 2015, [24]7 Customer Inc. filed a second patent infringement suit against us, also in the Northern District of California. On January 5, 2016, the two California cases were consolidated for all pre-trial purposes. On March 9, 2017, the Court for the Southern District of New York in the Company's case against [24]7 granted the parties’ joint request to voluntarily transfer the Southern District of New York case to the Northern District of California for consolidation with the referenced California cases. We believe the claims filed by [24]7 Customer Inc. are entirely without merit and intend to defend them vigorously.
We routinely assess all of our litigation and threatened litigation as to the probability of ultimately incurring a liability, and record our best estimate of the ultimate loss in situations where we assess the likelihood of loss as probable.
From time to time, we are involved in or subject to legal, administrative and regulatory proceedings, claims, demands and investigations arising in the ordinary course of business, including direct claims brought by or against us with respect to intellectual property, contracts, employment and other matters, as well as claims brought against our customers for whom we have a contractual indemnification obligation. We accrue for a liability when it is both probable that a liability has been incurred and the amount of the loss can be reasonably estimated. Significant judgment is required in both the determination of probability and the determination as to whether a loss is reasonably estimable. In addition, in the event we determine that a loss is not probable, but is reasonably possible, and it becomes possible to develop what we believe to be a reasonable range of possible loss, then we will include disclosure related to such matter as appropriate and in compliance with ASC 450. The accruals or estimates, if any, resulting from the foregoing analysis, are reviewed at least quarterly and adjusted to reflect the impact of negotiations, settlements, rulings, advice of legal counsel and other information and events pertaining to a particular matter. To the extent there is a reasonable possibility that the losses could exceed the amounts already accrued, we will, as applicable, adjust the accrual in the period the determination is made, disclose an estimate of the additional loss or range of loss, indicate that the estimate is immaterial with respect to our financial statements as a whole or, if the amount of such adjustment cannot be reasonably estimated, disclose that an estimate cannot be made.
From time to time, third parties assert claims against us regarding intellectual property rights, privacy issues and other matters arising in the ordinary course of business. Although we cannot be certain of the outcome of any litigation or the disposition of any claims, nor the amount of damages and exposure, if any, that we could incur, we currently believe that the final disposition of all existing matters will not have a material adverse effect on our business, results of operations, financial condition or cash flows. In addition, in the ordinary course of our business, we are also subject to periodic threats of lawsuits, investigations and claims. Regardless of the outcome, litigation can have an adverse impact on us because of defense and settlement costs, diversion of management resources and other factors.
Not Applicable.
Price Range of Common Stock
The principal United States market on which our common stock is traded is The NASDAQ Global Select Market under the symbol LPSN. Our shares of common stock are also traded on the Tel Aviv Stock Exchange.
31
The following table sets forth, for each full quarterly period within the two most recent fiscal years, the high and low sales prices (in U.S. dollars per share) of our common stock as reported or quoted on The NASDAQ Global Select Market:
|
High
|
Low
|
||||||
|
Year ended December 31, 2016:
|
|||||||
|
First Quarter
|
$
|
6.82
|
|
$
|
4.10
|
|
|
|
Second Quarter
|
$
|
7.20
|
|
$
|
5.69
|
|
|
|
Third Quarter
|
$
|
8.50
|
|
$
|
6.26
|
|
|
|
Fourth Quarter
|
$
|
8.65
|
|
$
|
7.45
|
|
|
|
Year ended December 31, 2015:
|
|
|
|
|
|||
|
First Quarter
|
$
|
13.66
|
|
$
|
10.24
|
|
|
|
Second Quarter
|
$
|
10.49
|
|
$
|
8.53
|
|
|
|
Third Quarter
|
$
|
10.16
|
|
$
|
7.56
|
|
|
|
Fourth Quarter
|
$
|
8.24
|
|
$
|
6.75
|
|
|
Holders
As of February 21, 2017, there were approximately 127 holders of record of our common stock.
Dividends
We have not declared or paid any cash dividends on our capital stock since our inception. We intend to retain earnings, if any, to finance the operation and expansion of our business and do not anticipate paying any cash dividends in the foreseeable future.
Issuer Purchases of Equity Securities
A summary of the Company's repurchase activity for the three months ended
December 31, 2016
is as follows:
|
Period
|
Total Number of Shares Purchased
(1) (2)
|
Average Price Paid per Share
(1) (2)
|
Total Number of Shares Purchased as Part of Publicly Announced Plans or Programs
(1) (2)
|
Approximate Dollar Value of Shares that May Yet Be Purchased Under the Plans or Programs
(1) (2) (3)
|
||||||||||
|
$
|
14,329,958
|
|
||||||||||||
|
10/1/2016 - 10/31/2016
|
—
|
|
$
|
—
|
|
—
|
|
14,329,958
|
|
|||||
|
11/1/2016 - 11/30/2016
|
—
|
|
—
|
|
—
|
|
14,329,958
|
|
||||||
|
12/1/2016 - 12/31/2016
|
491,000
|
|
8.53
|
|
491,000
|
|
20,136,441
|
|
||||||
|
Total
|
491,000
|
|
$
|
8.53
|
|
491,000
|
|
$
|
20,136,441
|
|
||||
|
(1)
|
On December 10, 2012, the Company announced that its Board of Directors approved a stock repurchase program through June 30, 2014. Under the stock repurchase program, the Company was authorized to repurchase shares of the Company's common stock, in the open market or privately negotiated transactions, at times and prices considered appropriate by the Board of Directors depending upon prevailing market conditions and other corporate considerations.
|
|
(2)
|
As of June 30, 2014, approximately $1.1 million remained available for purchases under the program as in effect at that time. On July 23, 2014, the Company's Board of Directors extended the expiration date of the program out to December 31, 2014 and also increased the aggregate purchase price of the stock repurchase program from
$40.0 million
to
$50.0 million
. On March 5, 2015, the Company's Board of Directors extended the expiration date of the program out to December 31, 2016. As of December 31, 2015, approximately $6.1 million remained available for purchases under the program. On February 16, 2016, the Company's Board of Directors increased the aggregate purchase price of the stock repurchase program by an additional $14.0 million. On November 21, 2016, the Company's Board of Directors increased the aggregate purchase price of the stock repurchase program from
$64.0 million
to
$74.0 million
and extended the expiration date of the program out to December 31, 2017.
|
|
(3)
|
Transaction fees related to the share purchases are deducted from the total remaining allowable expenditure amount.
|
32
Stock Performance Graph
The graph depicted below compares the annual percentage changes in the LivePerson’s cumulative total stockholder return with the cumulative total return of the Standard & Poor’s SmallCap 600 Index and the Standard & Poor’s Information Technology Index.
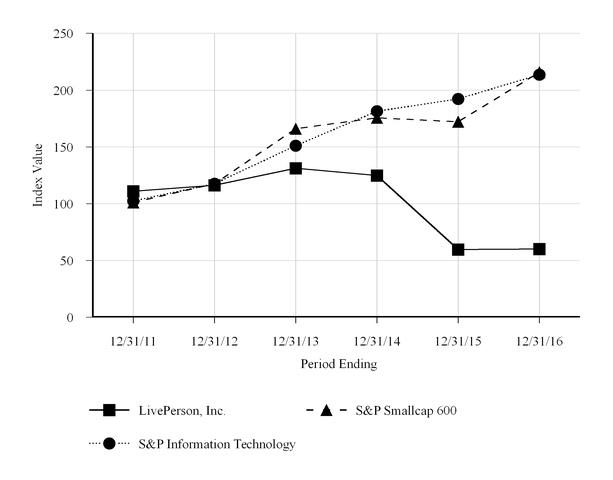
|
(1)
|
The graph covers the period from December 31, 2011 to December 31, 2016.
|
|
(2)
|
The graph assumes that $100 was invested at the market close on December 31, 2011 in LivePerson’s Common Stock, in the Standard & Poor’s SmallCap 600 Index and in the Standard & Poor’s Information Technology Index, and that all dividends were reinvested. No cash dividends have been declared on LivePerson’s Common Stock.
|
|
(3)
|
Stockholder returns over the indicated period should not be considered indicative of future stockholder returns.
|
Notwithstanding anything to the contrary set forth in any of our previous or future filings under the Securities Act of 1933, as amended, or the Securities Exchange Act of 1934, as amended, that might incorporate by reference this Annual Report on Form 10-K or future filings made by the Company under those statutes, the Stock Performance Graph above is not deemed filed with the Securities and Exchange Commission, is not deemed soliciting material and shall not be deemed incorporated by reference into any of those prior filings or into any future filings made by us under those statutes, except to the extent that we specifically incorporate such information by reference into a previous or future filing, or specifically requests that such information be treated as soliciting material, in each case under those statutes.
33
The selected consolidated financial data with respect to our consolidated balance sheets as of December 31,
2016
and
2015
and the related consolidated statements of operations for the years ended December 31,
2016
,
2015
and
2014
have been derived from our audited consolidated financial statements which are included herein. The selected financial data with respect to our balance sheets as of December 31,
2014
,
2013
and
2012
and the related statements of operations for the years ended December 31,
2013
and
2012
have been derived from our audited financial statements which are not included herein. Due to our acquisitions of CAO!, Synchronite and NexGraph in 2014, and Engage, LookIO and Amadesa in 2012, we believe that comparisons of our operating results with each other, or with those of prior periods, may not be meaningful. The following selected consolidated financial data should be read in conjunction with the consolidated financial statements and the notes thereto and the information contained in Item 7, “Management’s Discussion and Analysis of Financial Condition and Results of Operations.”
|
Year Ended December 31,
|
|||||||||||||||||||
|
2016
|
2015
|
2014
|
2013
|
2012
|
|||||||||||||||
|
(In Thousands, Except Share and per Share Data)
|
|||||||||||||||||||
|
Consolidated Statement of Operations Data:
|
|||||||||||||||||||
|
Revenue
|
$
|
222,779
|
|
$
|
239,012
|
|
$
|
209,931
|
|
$
|
177,805
|
|
$
|
157,409
|
|
||||
|
Costs and expenses:
|
|||||||||||||||||||
|
Cost of revenue
|
63,161
|
|
70,310
|
|
52,703
|
|
42,555
|
|
35,579
|
|
|||||||||
|
Sales and marketing
|
89,529
|
|
94,728
|
|
83,253
|
|
62,488
|
|
49,614
|
|
|||||||||
|
General and administrative
|
43,046
|
|
37,171
|
|
40,192
|
|
39,968
|
|
31,606
|
|
|||||||||
|
Product development
|
40,198
|
|
38,974
|
|
37,329
|
|
36,397
|
|
30,051
|
|
|||||||||
|
Restructuring costs
|
2,369
|
|
3,384
|
|
—
|
|
—
|
|
—
|
|
|||||||||
|
Amortization of purchased intangibles
|
3,885
|
|
4,873
|
|
1,621
|
|
871
|
|
218
|
|
|||||||||
|
Total costs and expenses
|
242,188
|
|
249,440
|
|
215,098
|
|
182,279
|
|
147,068
|
|
|||||||||
|
(Loss) income from operations
|
(19,409
|
)
|
(10,428
|
)
|
(5,167
|
)
|
(4,474
|
)
|
10,341
|
|
|||||||||
|
Other (expense) income
|
(530
|
)
|
(202
|
)
|
(322
|
)
|
337
|
|
376
|
|
|||||||||
|
(Loss) income before provision for (benefit from) income taxes
|
(19,939
|
)
|
(10,630
|
)
|
(5,489
|
)
|
(4,137
|
)
|
10,717
|
|
|||||||||
|
Provision for (benefit from) income taxes
|
5,934
|
|
15,814
|
|
1,859
|
|
(638
|
)
|
4,362
|
|
|||||||||
|
Net (loss) income
|
$
|
(25,873
|
)
|
$
|
(26,444
|
)
|
$
|
(7,348
|
)
|
$
|
(3,499
|
)
|
$
|
6,355
|
|
||||
|
Net (loss) income per share of common stock:
|
|||||||||||||||||||
|
Basic
|
$
|
(0.46
|
)
|
$
|
(0.47
|
)
|
$
|
(0.13
|
)
|
$
|
(0.06
|
)
|
$
|
0.11
|
|
||||
|
Diluted
|
$
|
(0.46
|
)
|
$
|
(0.47
|
)
|
$
|
(0.13
|
)
|
$
|
(0.06
|
)
|
$
|
0.11
|
|
||||
|
Weighted-average shares used to compute net (loss) income per share:
|
|||||||||||||||||||
|
Basic
|
56,063,777
|
|
56,452,408
|
|
54,478,754
|
|
54,725,236
|
|
55,292,597
|
|
|||||||||
|
Diluted
|
56,063,777
|
|
56,452,408
|
|
54,478,754
|
|
54,725,236
|
|
57,131,041
|
|
|||||||||
|
Other Financial and Operational Data:
|
|||||||||||||||||||
|
Adjusted EBITDA
(1)
|
$
|
19,198
|
|
$
|
21,244
|
|
$
|
22,672
|
|
$
|
18,767
|
|
$
|
29,999
|
|
||||
|
Adjusted net (loss) income
(2)
|
$
|
(7,688
|
)
|
$
|
8,927
|
|
$
|
5,068
|
|
$
|
9,278
|
|
$
|
14,084
|
|
||||
(1) We define adjusted EBITDA as net (loss) income before provision for (benefit from) income taxes, other (expense) income, net, depreciation and amortization, stock-based compensation, restructuring costs, acquisition costs and other non-recurring charges. Please see
“
Adjusted EBITDA
”
below for more information and for a reconciliation of adjusted EBITDA to net (loss) income, the most directly comparable financial measure calculated and presented in accordance with U.S. generally accepted accounting principles, or GAAP.
(2) We define adjusted net income as net (loss) income excluding amortization, stock-based compensation, restructuring costs, acquisition costs, deferred tax asset valuation allowance, other non-recurring charges and the related income tax effect of these adjustments. Please see
“
Adjusted Net Income
”
below for more information and for a reconciliation of adjusted net income to net (loss) income, the most directly comparable financial measure calculated and presented in accordance with U.S. generally accepted accounting principles, or GAAP.
34
Stock-based compensation included in the statements of operations above was as follows (amounts in thousands):
|
Year Ended December 31,
|
|||||||||||||||||||
|
2016
|
2015
|
2014
|
2013
|
2012
|
|||||||||||||||
|
Cost of revenue
|
$
|
429
|
|
$
|
1,396
|
|
$
|
1,492
|
|
$
|
1,954
|
|
$
|
1,579
|
|
||||
|
Sales and marketing
|
2,515
|
|
3,088
|
|
3,399
|
|
2,851
|
|
2,878
|
|
|||||||||
|
General and administrative
|
3,304
|
|
3,692
|
|
3,809
|
|
4,148
|
|
3,294
|
|
|||||||||
|
Product development
|
3,488
|
|
3,638
|
|
3,606
|
|
3,555
|
|
2,964
|
|
|||||||||
|
Total stock-based compensation
|
$
|
9,736
|
|
$
|
11,814
|
|
$
|
12,306
|
|
$
|
12,508
|
|
$
|
10,715
|
|
||||
|
As of December 31,
|
|||||||||||||||||||
|
2016
|
2015
|
2014
|
2013
|
2012
|
|||||||||||||||
|
(In Thousands)
|
|||||||||||||||||||
|
Consolidated Balance Sheet Data:
|
|||||||||||||||||||
|
Cash and cash equivalents
|
$
|
50,889
|
|
$
|
48,803
|
|
$
|
49,372
|
|
$
|
91,906
|
|
$
|
103,339
|
|
||||
|
Working capital
|
17,468
|
|
39,122
|
|
34,954
|
|
88,877
|
|
100,593
|
|
|||||||||
|
Total assets
|
219,638
|
|
226,194
|
|
239,817
|
|
205,090
|
|
208,576
|
|
|||||||||
|
Total stockholders’ equity
|
138,476
|
|
165,305
|
|
180,337
|
|
159,053
|
|
170,243
|
|
|||||||||
Adjusted EBITDA and Adjusted Net Income
To provide investors with additional information regarding our financial results, we have disclosed adjusted EBITDA and adjusted net income which are non-GAAP financial measures. The tables below present a reconciliation of adjusted EBITDA and adjusted net income to net (loss) income, the most directly comparable GAAP financial measures.
We have included adjusted EBITDA and adjusted net income in this Annual Report on Form 10-K because these are key measures used by our management and board of directors to understand and evaluate our core operating performance and trends, to prepare and approve our annual budget and to develop short and long-term operational plans. In particular, the exclusion of certain expenses in calculating adjusted EBITDA and adjusted net income can provide a useful measure for period-to-period comparisons of our core business. Additionally, adjusted EBITDA is a key financial measure used by the compensation committee of our board of directors in connection with the payment of bonuses to our executive officers. Accordingly, we believe that adjusted EBITDA and adjusted net income provide useful information to investors and others in understanding and evaluating our operating results in the same manner as our management and board of directors.
Our use of adjusted EBITDA has limitations as an analytical tool, and you should not consider it in isolation or as a substitute for analysis of our results as reported under GAAP. Some of these limitations are:
|
•
|
although depreciation and amortization are non-cash charges, the assets being depreciated and amortized may have to be replaced in the future, and adjusted EBITDA does not reflect cash capital expenditure requirements for such replacements or for new capital expenditure requirements;
|
|
•
|
adjusted EBITDA does not reflect changes in, or cash requirements for, our working capital needs;
|
|
•
|
adjusted EBITDA does not consider the potentially dilutive impact of equity-based compensation;
|
|
•
|
adjusted EBITDA does not consider the impact of acquisition costs;
|
|
•
|
adjusted EBITDA does not consider the impact of restructuring costs;
|
|
•
|
adjusted EBITDA does not consider the impact of other non-recurring costs;
|
|
•
|
adjusted EBITDA does not reflect tax payments that may represent a reduction in cash available to us; and
|
|
•
|
other companies, including companies in our industry, may calculate adjusted EBITDA differently, which reduces its usefulness as a comparative measure.
|
Because of these limitations, you should consider adjusted EBITDA alongside other financial performance measures, including various cash flow metrics, net (loss) income and our other GAAP results. The following table presents a reconciliation of adjusted EBITDA for each of the periods indicated (amounts in thousands):
35
|
Year Ended December 31,
|
|||||||||||||||||||
|
2016
|
2015
|
2014
|
2013
|
2012
|
|||||||||||||||
|
Reconciliation of Adjusted EBITDA:
|
|||||||||||||||||||
|
Net (loss) income
|
$
|
(25,873
|
)
|
$
|
(26,444
|
)
|
$
|
(7,348
|
)
|
$
|
(3,499
|
)
|
$
|
6,355
|
|
||||
|
Amortization of purchased intangibles
|
6,673
|
|
8,040
|
|
5,090
|
|
2,643
|
|
580
|
|
|||||||||
|
Stock-based compensation
|
9,736
|
|
11,814
|
|
12,306
|
|
12,508
|
|
10,715
|
|
|||||||||
|
Contingent earn-out adjustments
|
—
|
|
(3,680
|
)
|
—
|
|
—
|
|
—
|
|
|||||||||
|
Restructuring costs
|
2,369
|
|
(1)
|
3,384
|
|
(2)
|
—
|
|
—
|
|
—
|
|
|||||||
|
Depreciation
|
12,011
|
|
12,114
|
|
9,071
|
|
8,090
|
|
7,329
|
|
|||||||||
|
Other non-recurring costs
|
7,818
|
|
(3)
|
—
|
|
—
|
|
—
|
|
—
|
|
||||||||
|
Provision for (benefit from) income taxes
|
5,934
|
|
15,814
|
|
1,859
|
|
(638
|
)
|
4,362
|
|
|||||||||
|
Acquisition costs
|
—
|
|
—
|
|
1,372
|
|
—
|
|
1,034
|
|
|||||||||
|
Other expense (income), net
|
530
|
|
202
|
|
322
|
|
(337
|
)
|
(376
|
)
|
|||||||||
|
Adjusted EBITDA
|
$
|
19,198
|
|
$
|
21,244
|
|
$
|
22,672
|
|
$
|
18,767
|
|
$
|
29,999
|
|
||||
Our use of adjusted net income has limitations as an analytical tool, and you should not consider it in isolation or as a substitute for analysis of our results as reported under GAAP. Some of these limitations are:
|
•
|
although amortization are non-cash charges, the assets being amortized may have to be replaced in the future, and adjusted net income does not reflect cash capital expenditure requirements for such replacements or for new capital expenditure requirements;
|
|
•
|
adjusted net income does not consider the potentially dilutive impact of equity-based compensation;
|
|
•
|
adjusted net income does not consider the impact of acquisition costs;
|
|
•
|
adjusted net income does not consider the impact of restructuring costs;
|
|
•
|
adjusted net income does not consider the impact of other non-recurring costs;
|
|
•
|
adjusted net income does not consider the potentially dilutive impact of deferred tax asset valuation allowance; and
|
|
•
|
other companies, including companies in our industry, may calculate adjusted net income differently, which reduces its usefulness as a comparative measure.
|
36
Because of these limitations, you should consider adjusted net income alongside other financial performance measures, including various cash flow metrics, net (loss) income and our other GAAP results. The following table presents a reconciliation of adjusted net income for each of the periods indicated (amounts in thousands):
|
Year Ended December 31,
|
||||||||||||||||||||
|
2016
|
2015
|
2014
|
2013
|
2012
|
||||||||||||||||
|
Reconciliation of Adjusted Net (Loss) Income
|
||||||||||||||||||||
|
Net (loss) income
|
$
|
(25,873
|
)
|
$
|
(26,444
|
)
|
$
|
(7,348
|
)
|
$
|
(3,499
|
)
|
$
|
6,355
|
|
|||||
|
Amortization of purchased intangibles
|
6,673
|
|
8,040
|
|
5,090
|
|
2,643
|
|
580
|
|
||||||||||
|
Stock-based compensation
|
9,736
|
|
11,814
|
|
12,306
|
|
12,508
|
|
10,715
|
|
||||||||||
|
Contingent earn-out adjustments
|
—
|
|
(3,680
|
)
|
—
|
|
—
|
|
—
|
|
||||||||||
|
Deferred tax asset valuation allowance
|
692
|
|
15,820
|
|
||||||||||||||||
|
Restructuring costs
|
2,369
|
|
(1)
|
3,384
|
|
(2)
|
—
|
|
—
|
|
—
|
|
||||||||
|
Other non-recurring costs
|
8,134
|
|
(4)
|
—
|
|
—
|
|
—
|
|
—
|
|
|||||||||
|
Acquisition costs
|
—
|
|
—
|
|
1,372
|
|
—
|
|
1,034
|
|
||||||||||
|
Income tax effect of non-GAAP items
|
(9,419
|
)
|
(5)
|
(7
|
)
|
(6)
|
(6,352
|
)
|
(6)
|
(2,374
|
)
|
(6)
|
(4,600
|
)
|
(6)
|
|||||
|
Adjusted net (loss) income
|
$
|
(7,688
|
)
|
$
|
8,927
|
|
$
|
5,068
|
|
$
|
9,278
|
|
$
|
14,084
|
|
|||||
(1)
Includes severance costs of $1.6 million, wind down costs of legacy platform of $1.2 million and a benefit of $0.4 million of cash collected on previously written off bad debt for the twelve months ended December 31, 2016.
(2)
Includes approximately $1.7 million of termination costs associated with a large customer contract that ended in 2015 and $1.7 million of severance and other associated costs for the twelve months ended December 31, 2016.
(3)
Includes litigation costs of $4.7 million, write off of technology licenses of $2.6 million, and severance costs of $0.5 million for the twelve months ended December 31, 2016.
(4)
Includes litigation costs of $4.7 million, write off of technology licenses of $2.6 million, severance costs of $0.5 million, and write off of office facility depreciation of $0.3 million for the twelve months ended December 31, 2016.
(5)
The Company's non-GAAP income tax effect for the current period uses a long-term projected tax rate of 35%.
(6)
The Company's non-GAAP income tax effect was based on the effective tax rate, excluding discrete items.
37
General
You should read the following discussion of our financial condition and results of operations in conjunction with the financial statements and the notes thereto included elsewhere in this report. The following discussion contains forward-looking statements that reflect our plans, estimates and beliefs. Our actual results could differ materially from those discussed in the forward-looking statements. Factors that could cause or contribute to these differences include those discussed below and elsewhere in this report, particularly in "Risk Factors."
Overview
LivePerson was incorporated in the State of Delaware in November 1995 and the LivePerson service was introduced in November 1998. We are a leading provider of mobile and online business messaging technologies that power digital communication between brands and consumers. LiveEngage, the Company’s enterprise-class, cloud-based platform, enables businesses to create a meaningful connection with consumers by offering messaging as a preferred channel of communication. Messaging diminishes the need to rely on outdated email systems or call a 1-800 number. Brands leverage LiveEngage’s sophisticated intelligence engine and suite of text and mobile messaging, real-time chat messaging, content delivery, and cobrowsing offerings to proactively engage with consumers through mobile apps, mobile and desktop web browsers, social media and third-party consumer messaging platforms. More than 18,000 businesses, including Citibank, EE, IBM, Orbitz, PNC, The Home Depot and T-Mobile employ our technology to keep pace with rising customer service expectations and to align with preferences for digital communication channels.
We are organized into two operating segments: Business and Consumer. The Business segment enables brands to leverage LiveEngage’s sophisticated intelligence engine to connect with consumers through an integrated suite of mobile and online business messaging technologies. The Consumer segment facilitates online transactions between independent service providers (“Experts”) and individual consumers (“Users”) seeking information and knowledge for a fee via mobile and online messaging.
In order to sustain growth in these segments, our strategy is to expand our position as the leading provider of online and mobile messaging solutions that facilitate meaningful connection and expert advice. To accomplish this, we are focused on the following current initiatives:
|
•
|
Strengthening Our Position in both Existing and New Markets and Growing Our Recurring Revenue Base.
LivePerson plans to continue to develop its market position by increasing its customer base, and expanding within its installed base. We will continue to focus primarily on key target markets: automotive, financial services, retail, technology, telecommunications, and travel/hospitality within both our enterprise and midmarket sectors, as well as the small business (SMB) sector. Healthcare, insurance, real estate and energy utilities are new target industries and natural extensions of our primary target markets. We plan to leverage our new LiveEngage platform to replace a portion of calls traditionally made to 1-800 numbers with text and mobile messaging, and to increase adoption of intelligent business campaigns across our customer's online properties that target consumers with real-time messaging. We intend to collaborate with our large installed customer base to optimize the value and effectiveness that brands derive from our services. We are also focused on strengthening our recurring revenue stream by signing larger, long-term, and more strategic deals which empower brands to run business campaigns on their websites that engage consumers via messaging
|
|
•
|
Fuel Increased Usage by Expanding our Engagement Tools and Offering Platform Pricing.
In 2011, we began expanding on our market leading real-time chat messaging product by adding new technologies that augment digital consumer engagement, including targeted content delivery and transcript analytics. In 2014, we introduced LiveEngage, whereby we seamlessly integrated into a single platform an expanded suite of mobile and online business messaging technologies, including traditional desktop chat messaging, mobile chat messaging, content delivery, analytics, cobrowse, PCI, customer sentiment, and mobile messaging via in-app, SMS, browser-based search and Facebook Messenger. LiveEngage delivers rich, contextually aware targeting and personalized experiences across mobile and desktop devices. We also began offering a new platform pricing model, which provides brands access to our entire suite of messaging technologies across their entire agent pool for a pre-negotiated cost per interaction. We believe this model is more attractive and will lead to increased usage versus our historic approach of requiring brands to negotiate each agent seat and product license separately. In late 2016, we began launching product programs designed to promote usage of our broader suite of capabilities for targeted customers.
|
|
•
|
Leverage Partners to Enhance our Offering.
In addition to developing our own applications, we continue to cultivate a partner eco-system capable of offering additional applications and services to our customers. For example, in 2015 we integrated LiveEngage with one of the leading consumer messaging platforms and in 2016 we integrated LiveEngage with one of the leading mobile search ad extensions. We have also integrated LiveEngage with several artificial intelligence/bots vendors. In addition, we have opened up access to our platform and our products with application programming interfaces (APIs) that allow third parties to develop on top of our platform. Customers and partners can utilize these APIs to build our capabilities into their own applications and to enhance our applications with their services.
|
38
|
•
|
Maintaining Market Leadership in Technology and Security Expertise.
As described above, we are devoting significant resources to creating new products and enabling technologies designed to accelerate innovation and delivery of new products and technologies to our customer base. We evaluate emerging technologies and industry standards and continually update our technology in order to retain our leadership position in each market we serve. We monitor legal and technological developments in the area of information security and confidentiality to ensure our policies and procedures meet or exceed the demands of the world’s largest and most demanding corporations. We believe that these efforts will allow us to effectively anticipate changing customer and consumer requirements in our rapidly evolving industry.
|
|
•
|
International Presence.
LivePerson is focused on expanding its international revenue contribution, which increased to 34% of total revenue in 2016, from 33% in 2015, despite approximately $3.5 million of adverse foreign currency exchange impact. LivePerson generated positive results from previous investments in direct sales and services personnel in the United Kingdom and Western Europe. We also continued to focus on expanding our presence in the Asia Pacific region, leveraging our relationships with partners such as NTT Solco, a subsidiary of telecom firm NTT Docomo and Information Services International-Dentsu, Ltd. (ISID).
|
|
•
|
Continuing to Build Brand Recognition.
As a pioneer of brand-to-consumer digital messaging, LivePerson enjoys strong brand recognition and credibility. Our focus on creating meaningful connections among employees, with our customers, and between brands and their consumers, is a key component of our culture and our market strategy. We strategically target decision makers and influencers within key vertical markets, leveraging customer successes to generate increased awareness and demand for brand-to-consumer messaging. In addition, we continue to develop relationships with the media, industry analysts and relevant business associations to enhance awareness of our leadership within the industry. Our brand name is also visible to both business users and consumers. When a consumer messages a customer care professional on a brand’s website, our brand name is usually displayed on the dialog messaging window. We believe that this high-visibility placement will continue to create brand awareness for our solutions.
|
|
•
|
Increasing the Value of Our Service to Our Customers.
We believe the introduction of LiveEngage marks the most important product launch in our history, as it empowers brands to deploy messaging at scale for customer care and sales, instead of demanding that consumers use email or call a 1-800 number. Furthermore, our platform strategy makes available the full suite of LivePerson’s capabilities through a single solution. In addition, the open architecture of LiveEngage will enable LivePerson to rapidly add new capabilities either directly or through partners. For example, we see opportunities for additional efficiencies in the contact center through the integration of artificial intelligence and bots. Because we directly manage the server infrastructure, we can make new features available to our customers immediately upon release, without customer or end-user installation of software or hardware. Our strategy is to continue to enhance the LiveEngage messaging platform and to leverage the substantial amount of mobile and online consumer data we collect, with the aim of increasing agent efficiency, decreasing customer care costs, improving the customer experience and increasing customer lifetime value.
|
|
•
|
Evaluating Strategic Alliances and Acquisitions When Appropriate.
We have successfully integrated several acquisitions over the past decade. While we have in the past, and may from time to time in the future, engage in discussions regarding acquisitions or strategic transactions or to acquire other companies that can accelerate our growth or broaden our product offerings, we currently have no binding commitments with respect to any future acquisitions or strategic transactions.
|
Key Metrics
Financial overview of the three and twelve months ended
December 31, 2016
compared to the comparable periods in
2015
are as follows:
|
•
|
Revenue decreased
5%
and
7%
to
$56.1 million
and
$222.8 million
in the three and twelve months ended
December 31, 2016
, respectively, from
$59.2 million
and $
239.0 million
in the comparable periods in
2015
.
|
|
•
|
Revenue from our Business segment decreased
6%
and
8%
to $
51.9 million
and $
206.5 million
in the three and twelve months ended
December 31, 2016
, respectively, from $
55.2 million
and $
223.8 million
in the comparable periods in
2015
.
|
|
•
|
Gross profit margin increased to
73%
and
72%
in the three and twelve months ended
December 31, 2016
from
70%
and
71%
in the comparable periods in
2015
.
|
|
•
|
Cost and expenses increased
4%
and decreased
3%
to $
64.4 million
and $
242.2 million
in the three and twelve months ended
December 31, 2016
, respectively, from $
61.6 million
and $
249.4 million
in the comparable periods in
2015
.
|
|
•
|
Net loss decreased to $
9.6 million
and $
25.9 million
in the three and twelve months ended
December 31, 2016
, respectively, from net loss of
$20.9 million
and
$26.4 million
for the three and twelve months ended
December 31, 2015
, respectively.
|
|
•
|
Trailing-twelve-month average revenue per enterprise and mid-market customer was greater than $200,000 in 2016, as compared to $197,000 in 2015. The trailing-twelve-month revenue figures are pro forma to exclude contributions from a previously disclosed customer contract that ended in the second quarter of 2015.
|
39
|
•
|
Customer renewal rate for enterprise and mid-market customers was 83% and 84% over the trailing twelve months ended
December 31, 2016
and
2015
, respectively.
|
Revenue
The majority of our revenue is generated from monthly service revenues and related professional services from the sale of the LivePerson services. We charge a monthly fee, which varies by service and customer usage. The majority of our larger customers also pay a professional services fee related to implementation and ongoing optimization services. A large proportion of our revenue from new customers comes from large corporations. These companies typically have more significant implementation requirements and more stringent data security standards. Such customers also have more sophisticated data analysis and performance reporting requirements, and are likely to engage our professional services organization to provide such analysis and reporting on a recurring basis.
Revenue from our Business segment accounted for
93%
,
94%
, and 92% of total revenue for the year ended
December 31, 2016
,
2015
, and
2014
, respectively. Revenue attributable to our monthly hosted Business services accounted for 89% of total Business revenue for the year ended
December 31, 2016
. Revenue attributable to our monthly hosted Business services accounted for 90% and 89% of total Business revenue for the years ended
December 31, 2015
and
2014
, respectively. Our service agreements typically have twelve month terms and, in some cases, are terminable or may terminate upon 30 to 90 days’ notice without penalty. Given the time required to schedule training for our customers’ operators and our customers’ resource constraints, we have historically experienced a lag between signing a customer contract and recognizing revenue from that customer. Although this lag has typically ranged from 30 to 90 days, it may take more time between contract signing and recognizing revenue in certain situations.
Revenue from our Consumer segment is generated from online transactions between Experts and Users is recognized net of Expert fees and accounted for approximately
7%
,
6%
, and 8% of total revenue for the years ended
December 31, 2016
,
2015
, and
2014
, respectively.
We also have entered into contractual arrangements that complement our direct sales force and online sales efforts. These are primarily with call center service companies, pursuant to which LivePerson is paid a commission based on revenue generated by these service companies from our referrals. To date, revenue from such commissions has not been material.
Costs and Expenses
Our cost of revenue consists of:
|
•
|
compensation costs relating to employees who provide customer support and implementation services to our customers;
|
|
•
|
outside labor provider costs;
|
|
•
|
compensation costs relating to our network support staff;
|
|
•
|
depreciation of certain hardware and software;
|
|
•
|
allocated occupancy costs and related overhead;
|
|
•
|
the cost of supporting our infrastructure, including expenses related to server leases, infrastructure support costs and Internet connectivity;
|
|
•
|
the credit card fees and related payment processing costs associated with the consumer and SMB services; and
|
|
•
|
amortization of certain intangibles.
|
Our sales and marketing expenses consist of compensation and related expenses for sales personnel and marketing personnel, online marketing, allocated occupancy costs and related overhead, advertising, sales commissions, public relations, promotional materials, travel expenses and trade show exhibit expenses.
Our general and administrative expenses consist primarily of compensation and related expenses for executive, accounting, legal, information technology and human resources personnel, allocated occupancy costs and related overhead, litigation, professional fees, provision for doubtful accounts and other general corporate expenses.
Our product development expenses consist primarily of compensation and related expenses for product development personnel, allocated occupancy costs and related overhead, outsourced labor and expenses for testing new versions of our software. Product development expenses are charged to operations as incurred.
During
2016
, we increased our allowance for doubtful accounts from
$1.2 million
to approximately
$1.7 million
, principally due to analysis of the accounts receivable aging. During
2015
, we decreased our allowance for doubtful accounts by approximately $
0.1 million
to approximately
$1.2 million
, principally due to an increase in write-offs compared to 2014. A large proportion of receivables are due from larger corporate customers that typically have longer payment cycles. We base our allowance for doubtful accounts on specifically identified credit risks of customers, historical trends and other information that we believe
40
to be reasonable. We base our allowance for doubtful accounts on specifically identified credit risks of customers, historical trends and other information that we believe to be reasonable. We adjust our allowance for doubtful accounts when accounts previously reserved have been collected.
Non-Cash Compensation Expense
The net non-cash compensation amounts for the years ended
December 31, 2016
,
2015
and
2014
consist of (amounts in thousands):
|
|
2016
|
2015
|
2014
|
|||||||||
|
Stock-based compensation expense
|
$
|
9,736
|
|
$
|
11,814
|
|
$
|
12,306
|
|
|||
Results of Operations
The Company is organized into two operating segments: Business and Consumer. The Business segment enables brands to leverage LiveEngage’s sophisticated intelligence engine to connect with consumers through an integrated suite of mobile and online business messaging technologies. The Consumer segment facilitates online transactions between Experts and Users seeking information and knowledge for a fee via real-time chat.
The following tables set forth our results of operations for the periods presented and as a percentage of our revenues for those periods. The period-to-period comparison of financial results is not necessarily indicative of future results.
|
Year Ended December 31,
|
||||||||
|
2016
|
2015
|
2014
|
||||||
|
(as a percentage of revenue)
|
||||||||
|
Consolidated Statements of Operations Data:
(1)
|
||||||||
|
Revenue
|
100
|
%
|
100
|
%
|
100
|
%
|
||
|
Costs and expenses:
|
|
|
|
|
|
|||
|
Cost of revenue
|
28
|
%
|
29
|
%
|
25
|
%
|
||
|
Sales and marketing
|
40
|
%
|
40
|
%
|
40
|
%
|
||
|
General and administrative
|
19
|
%
|
16
|
%
|
19
|
%
|
||
|
Product development
|
18
|
%
|
16
|
%
|
18
|
%
|
||
|
Restructuring costs
|
1
|
%
|
1
|
%
|
—
|
%
|
||
|
Amortization of purchased intangibles
|
2
|
%
|
2
|
%
|
1
|
%
|
||
|
Total costs and expenses
|
109
|
%
|
104
|
%
|
102
|
%
|
||
|
Loss from operations
|
(9
|
)%
|
(4
|
)%
|
(2
|
)%
|
||
|
Other (expense) income, net
|
—
|
%
|
—
|
%
|
—
|
%
|
||
|
Loss before provision for income taxes
|
(9
|
)%
|
(4
|
)%
|
(3
|
)%
|
||
|
Provision for income taxes
|
3
|
%
|
7
|
%
|
1
|
%
|
||
|
Net loss
|
(12
|
)%
|
(11
|
)%
|
(4
|
)%
|
||
|
(1)
Certain items may not total due to rounding.
|
||||||||
Revenue
|
Year Ended December 31,
|
Year Ended December 31,
|
||||||||||||||||||||
|
2016
|
2015
|
% Change
|
2015
|
2014
|
% Change
|
||||||||||||||||
|
(in thousands)
|
(in thousands)
|
||||||||||||||||||||
|
Revenue by Segment:
|
|||||||||||||||||||||
|
Business
|
$
|
206,521
|
|
$
|
223,803
|
|
(8
|
)%
|
$
|
223,803
|
|
$
|
193,302
|
|
16
|
%
|
|||||
|
Consumer
|
16,258
|
|
15,209
|
|
7
|
%
|
15,209
|
|
16,629
|
|
(9
|
)%
|
|||||||||
|
Total
|
$
|
222,779
|
|
$
|
239,012
|
|
(7
|
)%
|
$
|
239,012
|
|
$
|
209,931
|
|
14
|
%
|
|||||
41
Our business revenue growth has traditionally been driven by a mix of revenue from new customers as well as expansion from existing customers. Business revenue decreased by
8%
to
$206.5 million
for the year ended
December 31, 2016
, from
$223.8 million
for the year ended
December 31, 2015
. This decrease is primarily attributable to revenue from existing customers of approximately $22.5 million, net of cancellations, and revenue that is variable based on interactions and usage in the amount of $5.3 million. This is partially offset by increases in revenue from new customers of approximately $10.0 million and from professional services of approximately $0.5 million. Overall decrease in business revenue is primarily attributable to delays in anticipated upsells and in increases in cancellations from existing customers. This is a reflection of the rapid pace of migrations from our old platform to LiveEngage, and the migration commitments we have seen in recent months, as customers typically prefer to complete upgrades before expanding services. Additionally, there was also a foreign exchange impact primarily tied to the British pound. Business revenue increased by
16%
to $
223.8 million
for the year ended
December 31, 2015
, from $
193.3 million
for the year ended
December 31, 2014
. The increase is primarily attributable to revenue from new customers of approximately $33.7 million, revenue that is variable based on interactions and usage in the amount of $5.4 million and revenue from professional services of approximately $2.6 million; offset in part by a decrease in revenue from existing customers in the amount of approximately $11.2 million, net of cancellations.
Consumer
revenue increased by
7%
to $
16.3 million
for the year ended
December 31, 2016
, from the year ended
December 31, 2015
. This increase is primarily attributable to an increase in chat minutes, along with an increase in gross fees and a decrease in fees we charge experts. Consumer
revenue decreased by
9%
to $
15.2 million
for the year ended
December 31, 2015
, from the year ended
December 31, 2014
. This decrease is primarily attributable to decrease in chat minutes partially offset by an increase in fees we charge experts.
Cost of Revenue - Business
Cost of revenue consists of compensation costs relating to employees who provide customer service to our customers, compensation costs relating to our network support staff, the cost of supporting our server and network infrastructure, and allocated occupancy costs and related overhead.
|
Year Ended December 31,
|
Year Ended December 31,
|
||||||||||||||||||||
|
2016
|
2015
|
% Change
|
2015
|
2014
|
% Change
|
||||||||||||||||
|
($ in thousands)
|
($ in thousands)
|
||||||||||||||||||||
|
Cost of revenue - Business
|
$
|
60,352
|
|
$
|
67,901
|
|
(11
|
)%
|
$
|
67,901
|
|
$
|
50,192
|
|
35
|
%
|
|||||
|
Percentage of total revenue
|
27
|
%
|
28
|
%
|
28
|
%
|
24
|
%
|
|||||||||||||
|
Headcount (at period end)
|
236
|
|
286
|
|
(17
|
)%
|
286
|
|
301
|
|
(5
|
)%
|
|||||||||
Cost of revenue decreased by
11%
to $
60.4 million
in
2016
, from $
67.9 million
in
2015
. This decrease in expense is primarily attributable to a decrease in salary and related employee expenses of approximately $1.6 million, a decrease in business services and outsourced subcontracted labor of approximately $4.8 million, and a decrease in depreciation and amortization of fixed assets of approximately $1.5 million. The decrease in cost of revenue was tied to our ability to operationalize cost savings by moving brands off legacy platform and realigning our go-to-market strategy around LiveEngage.
Cost of revenue increased by
35%
to $
67.9 million
in
2015
, from $
50.2 million
in
2014
. This increase in expense is primarily attributable to an increase in outside labor provider fees of approximately $11.0 million, an increase in primary and backup server facilities and allocated overhead related to costs of supporting our server and network infrastructure of approximately $2.5 million, an increase in depreciation of fixed assets of approximately $2.4 million, and an increase in total compensation and related costs for additional and existing customer service and network operations personnel in the amount of approximately $1.5 million. This increase in cost of revenue was driven primarily by increased investment in enhancing our business continuity capabilities at our hosting facilities. Additionally, data collection and storage costs have increased in support of expanded scope and quality of the analytical reporting to our customers.
Cost of Revenue - Consumer
Cost of revenue consists of compensation costs relating to employees who provide customer service to Experts and Users, compensation costs relating to our network support staff, the cost of supporting our server and network infrastructure, credit card and transaction processing fees and related costs, and allocated occupancy costs and related overhead.
42
|
Year Ended December 31,
|
Year Ended December 31,
|
||||||||||||||||||||
|
2016
|
2015
|
% Change
|
2015
|
2014
|
% Change
|
||||||||||||||||
|
($ in thousands)
|
($ in thousands)
|
||||||||||||||||||||
|
Cost of revenue - Consumer
|
$
|
2,809
|
|
$
|
2,409
|
|
17
|
%
|
$
|
2,409
|
|
$
|
2,511
|
|
(4
|
)%
|
|||||
|
Percentage of total revenue
|
1
|
%
|
1
|
%
|
1
|
%
|
1
|
%
|
|||||||||||||
|
Headcount (at period end)
|
16
|
|
17
|
|
(6
|
)%
|
17
|
|
16
|
|
6
|
%
|
|||||||||
Cost of revenue increased by
17%
to
$2.8 million
in
2016
, from
$2.4 million
in
2015
. This is primarily attributable to an increase in backup server facilities of approximately $0.6 million, an increase in business services and outsourced labor of approximately $0.2 million, an increase in depreciation of approximately $0.2 million, and an increase of credit card processing fees of approximately $0.2 million. This is partially offset by a decrease in salary of approximately $0.8 million. Cost of revenue remained relatively flat for the years ended December 31,
2015
and
2014
.
Sales and Marketing - Business
Our sales and marketing expenses consist of compensation and related expenses for sales and marketing personnel, as well as advertising, public relations, trade show exhibit expenses and allocated occupancy costs and related overhead.
|
Year Ended December 31,
|
Year Ended December 31,
|
||||||||||||||||||||
|
2016
|
2015
|
% Change
|
2015
|
2014
|
% Change
|
||||||||||||||||
|
($ in thousands)
|
($ in thousands)
|
||||||||||||||||||||
|
Sales and Marketing - Business
|
$
|
82,063
|
|
$
|
87,975
|
|
(7
|
)%
|
$
|
87,975
|
|
$
|
77,118
|
|
14
|
%
|
|||||
|
Percentage of total revenue
|
37
|
%
|
37
|
%
|
37
|
%
|
37
|
%
|
|||||||||||||
|
Headcount (at period end)
|
310
|
|
324
|
|
(4
|
)%
|
324
|
|
355
|
|
(9
|
)%
|
|||||||||
Sales and marketing expenses decreased by
7%
to $
82.1 million
in
2016
, from $
88.0 million
in
2015
. This decrease is primarily attributable to a decrease in salary and related employee expenses of approximately $7.1 million and a decrease in marketing expenses of approximately $1.1 million. This is partially offset by an increase in business services and outsourced labor of approximately $3.0 million. The decrease in sales and marketing expenses is part of the realignment on our go-to-market strategy around LiveEngage in 2016. Our outreach efforts are primarily focused on a few hundred of the world's largest brands. This approach enables LivePerson to run a leaner, nimbler field organization.
Sales and marketing expenses increased by
14%
to $
88.0 million
in
2015
, from $
77.1 million
in
2014
. This increase is primarily attributable to an increase in compensation and related costs for additional and existing sales and marketing personnel of approximately $5.8 million, an increase in allocated occupancy costs and related overhead in the amount of approximately $3.3 million, and an increase in advertising, public relations and trade show exhibit expenses of approximately $0.6 million. The increase relates to our continued investment in our marketing and sales capabilities. The increase in expense as compared to our revenue growth is primarily related to the investment in our global sales team, global expansion and continuing advertising of the LiveEngage product. The increase also relates to our continued efforts to enhance our brand recognition and increase sales lead activity.
Sales and Marketing — Consumer
Our sales and marketing expenses consist of compensation and related expenses for marketing personnel, as well as online promotion and trade show exhibit expenses and allocated occupancy costs and related overhead.
|
Year Ended December 31,
|
Year Ended December 31,
|
||||||||||||||||||||
|
2016
|
2015
|
% Change
|
2015
|
2014
|
% Change
|
||||||||||||||||
|
($ in thousands)
|
($ in thousands)
|
||||||||||||||||||||
|
Sales and Marketing - Consumer
|
$
|
7,466
|
|
$
|
6,753
|
|
11
|
%
|
$
|
6,753
|
|
$
|
6,135
|
|
10
|
%
|
|||||
|
Percentage of total revenue
|
3
|
%
|
3
|
%
|
3
|
%
|
3
|
%
|
|||||||||||||
|
Headcount (at period end)
|
11
|
|
9
|
|
22
|
%
|
9
|
|
8
|
|
13
|
%
|
|||||||||
Sales and marketing expenses increased by
11%
to $
7.5 million
in
2016
, from $
6.8 million
in
2015
. This increase is primarily attributable to an increase in advertising and online expenses of approximately $0.7 million.
Sales and marketing expenses increased by
10%
to $
6.8 million
in
2015
, from $
6.1 million
in
2014
. This increase is primarily attributable to an increase in advertising and online expenses of approximately $0.3 million and an increase in compensation and related costs for additional and existing sales and marketing personnel of approximately $0.3 million.
43
General and Administrative
Our general and administrative expenses consist primarily of compensation and related expenses for executive, accounting, legal, information technology, human resources and administrative personnel, professional fees and other general corporate expenses.
|
Year Ended December 31,
|
Year Ended December 31,
|
||||||||||||||||||||
|
2016
|
2015
|
% Change
|
2015
|
2014
|
% Change
|
||||||||||||||||
|
($ in thousands)
|
($ in thousands)
|
||||||||||||||||||||
|
General and administrative
|
$
|
43,046
|
|
$
|
37,171
|
|
16
|
%
|
$
|
37,171
|
|
$
|
40,192
|
|
(8
|
)%
|
|||||
|
Percentage of total revenue
|
19
|
%
|
16
|
%
|
16
|
%
|
19
|
%
|
|||||||||||||
|
Headcount (at period end)
|
112
|
|
115
|
|
(3
|
)%
|
115
|
|
125
|
|
(8
|
)%
|
|||||||||
General and administrative expenses increased by
16%
to $
43.0 million
in
2016
, from $
37.2 million
in
2015
. This increase is primarily attributable to an increase in allocated occupancy costs, related overhead, information technology and other general corporate expenses of approximately $5.0 million. Furthermore, there were litigation costs of $4.7 million and a write off of technology licenses of $2.6 million in 2016. This is partially offset by a decrease in business services and outsourced labor of approximately $4.1 million and a decrease in salary and related employee expenses of approximately $2.2 million.
General and administrative expenses decreased by
8%
to $
37.2 million
in
2015
, from $
40.2 million
in
2014
. This decrease is primarily attributable to a decrease in allocated occupancy costs, related overhead, and other general corporate expenses in the amount of approximately $7.2 million. This is partially offset by increases in salary and related employee expenses of $2.6 million, outsourcing and other business services expenses of $0.8 million, and information technology expenses of $0.8 million.
Product Development
Our product development expenses consist primarily of compensation and related expenses for product development personnel as well as allocated occupancy costs and related overhead and outsourced labor and expenses for testing new versions of our software.
|
Year Ended December 31,
|
Year Ended December 31,
|
||||||||||||||||||||
|
2016
|
2015
|
% Change
|
2015
|
2014
|
% Change
|
||||||||||||||||
|
($ in thousands)
|
($ in thousands)
|
||||||||||||||||||||
|
Product development
|
$
|
40,198
|
|
$
|
38,974
|
|
3
|
%
|
$
|
38,974
|
|
$
|
37,329
|
|
4
|
%
|
|||||
|
Percentage of total revenue
|
18
|
%
|
16
|
%
|
16
|
%
|
18
|
%
|
|||||||||||||
|
Headcount (at period end)
|
300
|
|
253
|
|
19
|
%
|
253
|
|
253
|
|
—
|
%
|
|||||||||
Product development costs increased by
3%
to $
40.2 million
in
2016
, from $
39.0 million
in
2015
. This increase is primarily attributable to an increase in compensation and related costs for additional and existing product development personnel of approximately $1.2 million as a result of our increased efforts to expand our product offerings and an increase in allocated occupancy costs and related overhead in the amount of approximately $0.6 million. We are increasing our investment in new product development efforts to expand future product offerings. We are also investing in partner programs that enable third-parties to develop value-added software applications for our existing and future customers.
Product development costs increased by
4%
to $
39.0 million
in
2015
, from $
37.3 million
in
2014
. This increase is primarily attributable to an increase in compensation and related costs for additional and existing product development personnel of approximately $0.9 million as a result of our increased efforts to expand our product offerings and an increase in outsourced labor expense of approximately $0.4 million. We are increasing our investment in new product development efforts to expand future product offerings. We are also investing in partner programs that enable third-parties to develop value-added software applications for our existing and future customers.
44
Restructuring Costs
|
Year Ended December 31,
|
Year Ended December 31,
|
||||||||||||||||||||
|
2016
|
2015
|
% Change
|
2015
|
2014
|
% Change
|
||||||||||||||||
|
($ in thousands)
|
($ in thousands)
|
||||||||||||||||||||
|
Restructuring Costs
|
$
|
2,369
|
|
$
|
3,384
|
|
(30
|
)%
|
$
|
3,384
|
|
$
|
—
|
|
100
|
%
|
|||||
|
Percentage of total revenue
|
1
|
%
|
1
|
%
|
1
|
%
|
—
|
%
|
|||||||||||||
We incurred $
2.4 million
of restructuring costs in
2016
. Restructuring costs were due to approximately $1.6 million of severance and other associated costs and approximately $1.2 million of wind down costs related to shutting down the legacy platform. This was partially offset by a benefit of $0.4 million of cash collected on previously written off bad debt for the year ended December 31,
2016
.
We incurred
$3.4 million
of restructuring costs in
2015
. Restructuring costs were due to approximately $1.7 million of termination costs primarily due to outside labor provider fees associated with a large customer contract that ended, and approximately $1.7 million of severance and other associated costs.
Amortization of Purchased Intangibles
|
Year Ended December 31,
|
Year Ended December 31,
|
||||||||||||||||||||
|
2016
|
2015
|
% Change
|
2015
|
2014
|
% Change
|
||||||||||||||||
|
($ in thousands)
|
($ in thousands)
|
||||||||||||||||||||
|
Amortization of purchased intangibles
|
$
|
3,885
|
|
$
|
4,873
|
|
(20
|
)%
|
$
|
4,873
|
|
$
|
1,621
|
|
201
|
%
|
|||||
|
Percentage of total revenue
|
2
|
%
|
2
|
%
|
2
|
%
|
1
|
%
|
|||||||||||||
Amortization expense for purchased intangibles decreased by
20%
to $
3.9 million
in
2016
, from $
4.9 million
in
2015
and increased by
201%
to $
4.9 million
in
2015
, from $
1.6 million
in
2014
. The variance in
2016
was primarily attributable the decrease in amortization of Engage and Look.Io of approximately $0.4 million and the decrease in CAO intangible assets of approximately $0.6 million. The variance in
2015
was primarily attributable to our 2014 acquisitions of CAO!, Synchronite, NexGraph, and our investments in technology licenses. Additional amortization expense in the amount of
$2.8 million
,
$3.2 million
, and
$3.5 million
was included in cost of revenue for the years ended December 31,
2016
,
2015
and
2014
, respectively.
Other (Expense) Income, net
Other income, net primarily consists of interest income on cash and cash equivalents, investment income and financial (expense) income which is a result of currency rate fluctuations associated with exchange rate movement of the U.S. dollar against the New Israeli Shekel, Pound Sterling, Japanese Yen, AUS dollar and the Euro.
|
Year Ended December 31,
|
Year Ended December 31,
|
||||||||||||||||||||
|
2016
|
2015
|
% Change
|
2015
|
2014
|
% Change
|
||||||||||||||||
|
($ in thousands)
|
($ in thousands)
|
||||||||||||||||||||
|
Other (expense) income, net
|
$
|
(530
|
)
|
$
|
(202
|
)
|
162
|
%
|
$
|
(202
|
)
|
$
|
(322
|
)
|
(37
|
)%
|
|||||
Financial expense increased $0.3 million in
2016
compared to
2015
.
Investment income decreased by $0.7 million in
2015
compared to
2014
primarily due to a decrease in income earned on the investment in technology licenses purchased during 2014. Financial income increased $0.6 million in 2015 compared to 2014.
Provision for Income Taxes
|
Year Ended December 31,
|
Year Ended December 31,
|
||||||||||||||||||||
|
2016
|
2015
|
% Change
|
2015
|
2014
|
% Change
|
||||||||||||||||
|
($ in thousands)
|
($ in thousands)
|
||||||||||||||||||||
|
Provision for income taxes
|
$
|
5,934
|
|
$
|
15,814
|
|
(62
|
)%
|
$
|
15,814
|
|
$
|
1,859
|
|
751
|
%
|
|||||
Income tax expense decreased $
9.9 million
resulting in a tax expense of $
5.9 million
for the year ended
December 31, 2016
, compared to $
15.8 million
for the year ended
December 31, 2015
. Our consolidated effective tax rate was impacted by the statutory income tax rates applicable to each of the jurisdictions in which we operate. The decrease was a result of the valuation
45
allowance established in 2015 for a significant portion of our deferred tax asset on our balance sheet as it was determined to be more likely than not that we would not realize a portion of our deferred tax asset.
Income tax expense increased $
14.0 million
resulting in a tax expense of $
15.8 million
for the year ended
December 31, 2015
, compared to $
1.9 million
for the year ended December 31,
2014
. Our consolidated effective tax rate was impacted by the statutory income tax rates applicable to each of the jurisdictions in which we operate. The increase was a result of a valuation allowance established for a significant portion of our deferred tax asset on our balance sheet as it was determined to be more likely than not that we would not realize a portion of our deferred tax asset.
Net Loss
We had a net loss of $
25.9 million
in
2016
compared to a net loss of $
26.4 million
in
2015
. Revenue decreased approximately $
16.2 million
while operating expenses decreased by approximately $
7.3 million
, the provision for income taxes decreased approximately $
9.9 million
, and other expense increased by $
0.3 million
, contributing to a net decrease in net loss of approximately $
0.6 million
.
We had a net loss of $
26.4 million
in
2015
compared to a net loss of $
7.3 million
in
2014
. Revenue increased approximately $
29.1 million
while operating expenses increased by approximately $
34.3 million
and the provision for (benefit from) income taxes increased approximately $
14.0 million
contributing to a net increase in net loss of approximately $
19.1 million
.
Quarterly Results of Operations Data
The following table sets forth, for the periods indicated, the Company’s financial information for the eight most recent quarters ended
December 31, 2016
. In the Company’s opinion, this unaudited information has been prepared on a basis consistent with the annual consolidated financial statements and includes all adjustments, consisting only of normal recurring adjustments, necessary for a fair presentation of the unaudited information for the periods presented. This information should be read in conjunction with the consolidated financial statements, including the related notes, included herein.
|
For the Three Months Ended
|
|||||||||||||||||||||||||||||||
|
Dec. 31, 2016
|
Sept. 30,
2016 |
June 30,
2016 |
March 31,
2016 |
Dec. 31, 2015
|
Sept. 30,
2015 |
June 30,
2015 |
March 31,
2015 |
||||||||||||||||||||||||
|
(in thousands, except share and per share data)
|
|||||||||||||||||||||||||||||||
|
Consolidated Statements of Operations Data:
|
|||||||||||||||||||||||||||||||
|
Revenue
|
$
|
56,118
|
|
$
|
54,518
|
|
$
|
56,679
|
|
$
|
55,464
|
|
$
|
59,151
|
|
$
|
60,757
|
|
$
|
59,334
|
|
$
|
59,770
|
|
|||||||
|
Costs and Expenses:
|
|||||||||||||||||||||||||||||||
|
Cost of revenue
|
14,952
|
|
14,837
|
|
17,508
|
|
15,864
|
|
17,779
|
|
18,225
|
|
(1)
|
18,052
|
|
(1)
|
16,254
|
|
|||||||||||||
|
Sales and marketing
|
21,698
|
|
22,067
|
|
23,088
|
|
22,676
|
|
22,766
|
|
23,286
|
|
24,382
|
|
24,294
|
|
|||||||||||||||
|
General and administrative
|
13,287
|
|
10,069
|
|
10,161
|
|
9,529
|
|
10,014
|
|
6,587
|
|
(1)
|
10,306
|
|
(1)
|
10,164
|
|
|||||||||||||
|
Product development
|
10,770
|
|
9,495
|
|
10,719
|
|
9,214
|
|
9,498
|
|
9,567
|
|
10,109
|
|
9,800
|
|
|||||||||||||||
|
Restructuring costs
|
2,753
|
|
(384
|
)
|
—
|
|
—
|
|
396
|
|
—
|
|
2,988
|
|
—
|
|
|||||||||||||||
|
Amortization of purchased intangibles
|
931
|
|
1,013
|
|
1,017
|
|
924
|
|
1,189
|
|
1,193
|
|
1,178
|
|
1,313
|
|
|||||||||||||||
|
Total costs and expenses
|
64,391
|
|
57,097
|
|
62,493
|
|
58,207
|
|
61,642
|
|
58,858
|
|
67,015
|
|
61,825
|
|
|||||||||||||||
|
(Loss) income from operations
|
(8,273
|
)
|
(2,579
|
)
|
(5,814
|
)
|
(2,743
|
)
|
(2,491
|
)
|
1,899
|
|
(7,681
|
)
|
(2,055
|
)
|
|||||||||||||||
|
Other income (expense) income
|
(395
|
)
|
(123
|
)
|
(646
|
)
|
634
|
|
169
|
|
(369
|
)
|
229
|
|
(231
|
)
|
|||||||||||||||
|
(Loss) income before provision for (benefit from) income taxes
|
(8,668
|
)
|
(2,702
|
)
|
(6,460
|
)
|
(2,109
|
)
|
(2,322
|
)
|
1,530
|
|
(7,452
|
)
|
(2,286
|
)
|
|||||||||||||||
|
Provision for (benefit from) income taxes
|
897
|
|
3,177
|
|
1,306
|
|
554
|
|
18,535
|
|
(395
|
)
|
(2,098
|
)
|
(228
|
)
|
|||||||||||||||
|
Net (loss) income
|
$
|
(9,565
|
)
|
$
|
(5,879
|
)
|
$
|
(7,766
|
)
|
$
|
(2,663
|
)
|
$
|
(20,857
|
)
|
$
|
1,925
|
|
$
|
(5,354
|
)
|
$
|
(2,058
|
)
|
|||||||
|
Net (loss) income per share of common stock:
|
|||||||||||||||||||||||||||||||
|
Basic
|
(0.17
|
)
|
(0.10
|
)
|
(0.14
|
)
|
(0.05
|
)
|
(0.37
|
)
|
0.03
|
|
(0.09
|
)
|
(0.04
|
)
|
|||||||||||||||
|
Diluted
|
(0.17
|
)
|
(0.10
|
)
|
(0.14
|
)
|
(0.05
|
)
|
(0.37
|
)
|
0.03
|
|
(0.09
|
)
|
(0.04
|
)
|
|||||||||||||||
|
Weighted-average shares used to compute net (loss) income per share
|
|||||||||||||||||||||||||||||||
|
Basic
|
55,861,872
|
|
56,047,645
|
|
55,965,525
|
|
56,386,003
|
|
56,497,544
|
|
56,525,647
|
|
56,491,989
|
|
56,291,383
|
|
|||||||||||||||
|
Diluted
|
55,861,872
|
|
56,047,645
|
|
55,965,525
|
|
56,386,003
|
|
56,497,544
|
|
57,084,437
|
|
56,491,989
|
|
56,291,383
|
|
|||||||||||||||
(1) Decreases in the fair value of contingent consideration of $1.9 million and $0.5 million for the quarters ended September 30, 2015 and June 30, 2015, respectively, have been reclassified to general and administrative expenses from cost of revenue to conform to full year presentation.
46
Liquidity and Capital Resources
|
December 31,
|
|||||||
|
2016
|
2015
|
||||||
|
(in thousands)
|
|||||||
|
Consolidated Statements of Cash Flows Data:
|
|||||||
|
Cash flows provided by operating activities
|
$
|
24,560
|
|
$
|
21,831
|
|
|
|
Cash flows used in investing activities
|
(11,452
|
)
|
(18,539
|
)
|
|||
|
Cash flows used in financing activities
|
(7,068
|
)
|
(1,887
|
)
|
|||
As of
December 31, 2016
, we had approximately
$50.9 million
in cash and cash equivalents, an increase of approximately $
2.1 million
from
December 31, 2015
. This increase is primarily attributable to cash provided by operating activities of approximately
$24.6 million
and proceeds from issuance of common stock of approximately
$2.9 million
. This was partially offset by cash used in investing activities of approximately $
11.5 million
, the repurchase of common stock of approximately $
10.0 million
and the effect of foreign exchange rate changes on cash and cash equivalents.
Net cash provided by operating activities was $
24.6 million
in the year ended
December 31, 2016
and consisted primarily of non-cash expenses related to stock-based compensation, amortization of purchased intangibles, depreciation, and impairment on investments. Furthermore, there were increases in deferred revenue due to more of our customers moving to cash payments in advance on annual billings, accrued expenses and decreases in prepaid expenses and other current assets. This was partially offset by net loss and an increase in accounts receivable. Net cash provided by operating activities was $
21.8 million
in the year ended
December 31, 2015
and consisted primarily of net loss, non-cash expenses related to stock-based compensation, amortization of purchased intangibles, depreciation, deferred tax and change in fair value of contingent consideration. This was partially offset by an increase in accounts receivable and a decrease in accounts payable.
Net cash used in investing activities was $
11.5 million
in the year ended
December 31, 2016
and was due primarily to the purchase of fixed assets for our co-location facilities and purchases of intangibles. This was partially offset by a decrease in cash held as collateral. Net cash used in investing activities was $
18.5 million
in the year ended
December 31, 2015
and was due primarily to the purchase of fixed assets for our co-location facilities and increase in cash held as collateral by $5.4 million.
Net cash used in financing activities was $
7.1 million
in the year ended
December 31, 2016
and consisted primarily of the repurchase of our common stock offset in part by the proceeds from the issuance of common stock in connection with the exercise of stock options. Net cash used in financing activities was $
1.9 million
in the year ended
December 31, 2015
and consisted primarily of the repurchase of our common stock and acquisition related payments offset in part by the proceeds from the issuance of common stock in connection with the exercise of stock options by employees.
We have incurred significant expenses to develop our technology and services, to hire employees in our customer service, sales, marketing and administration departments, and for the amortization of purchased intangible assets, as well as non-cash compensation costs. Historically, we incurred significant quarterly net losses from inception through June 30, 2003, significant negative cash flows from operations in our quarterly periods from inception through December 31, 2002 and negative cash flows from operations of $0.1 million in the quarterly period ended March 31, 2004. We also incurred a net loss and negative cash flow from operations in the quarterly period ended March 31, 2014, June 30, 2014, March 31, 2015, June 30, 2015, December 31, 2015, and March 31, 2016. We incurred a net loss in the quarterly periods ended June 30, 2013, September 30, 2013, December 31, 2013, September 30, 2014, December 31, 2014, March 31, 2015, June 30, 2015, December 31, 2015, March 31, 2016, June 30, 2016, September 30, 2016, and December 31, 2016. As of
December 31, 2016
, we had an accumulated deficit of approximately $
144.9 million
.
We anticipate that our current cash and cash equivalents will be sufficient to satisfy our working capital and capital requirements for at least the next 12 months. However, we cannot assure you that we will not require additional funds prior to such time, and we would then seek to sell additional equity or debt securities through public financings, or seek alternative sources of financing. We cannot assure you that additional funding will be available on favorable terms, when needed, if at all. If we are unable to obtain any necessary additional financing, we may be required to further reduce the scope of our planned sales and marketing and product development efforts, which could materially adversely affect our business, financial condition and operating results. In addition, we may require additional funds in order to fund more rapid expansion, to develop new or enhanced services or products, or to invest in or acquire complementary businesses, technologies, services or products.
Contractual Obligations and Commitments
We do not have any special purposes entities, and other than operating leases, which are described below we do not engage in off-balance sheet financing arrangements.
47
We lease facilities and certain equipment under agreements accounted for as operating leases. These leases generally require us to pay all executory costs such as maintenance and insurance. Rental expense for operating leases for the years ended
December 31, 2016
,
2015
and 2014, was approximately
$10.0 million
,
$9.9 million
and
$9.4 million
, respectively.
As of
December 31, 2016
, our principal commitments were approximately
$28.6 million
under various operating leases, of which approximately
$8.9 million
is due in
2017
. We currently expect that our principal commitments for the year ending December 31,
2017
will not exceed approximately $10.0 million in the aggregate.
Our contractual obligations at
December 31, 2016
are summarized as follows (amounts in thousands):
|
Payments Due by Period
|
|||||||||||||||||||
|
Contractual Obligations
|
Total
|
Less Than
1 Year
|
1 – 3 Years
|
3 – 5 Years
|
More Than
5 Years
|
||||||||||||||
|
Operating leases
|
$
|
28,574
|
|
$
|
8,889
|
|
$
|
13,953
|
|
$
|
2,914
|
|
$
|
2,818
|
|
||||
|
Total
|
$
|
28,574
|
|
$
|
8,889
|
|
$
|
13,953
|
|
$
|
2,914
|
|
$
|
2,818
|
|
||||
Capital Expenditures
In
2016
, we incurred costs related to the continued expansion of our co-location facilities of approximately $7.6 million. Our total capital expenditures are not currently expected to exceed $ 14.5 million in
2017
. We anticipate that our current cash and cash equivalents and cash from operations will be sufficient to fund these capital expenditures.
Indemnifications
We enter into service and license agreements in the ordinary course of business. Pursuant to some of these agreements, we agree to indemnify certain customers from and against certain types of claims and losses suffered or incurred by them as a result of using our products.
We also have agreements whereby our executive officers and directors are indemnified for certain events or occurrences while the officer or director is, or was serving, at our request in such capacity. The maximum potential amount of future payments we could be required to make under these indemnification agreements is unlimited; however, we have a directors and officers insurance policy that reduces our exposure and enables us to recover a portion of any future amounts paid. As a result of our insurance policy coverage, we believe the estimated fair value of these indemnification agreements is minimal. Currently, we have no liabilities recorded for these agreements as of
December 31, 2016
.
Critical Accounting Policies and Estimates
Our consolidated financial statements are prepared in conformity with accounting principles generally accepted in the United States of America. As such, we are required to make certain estimates, judgments and assumptions that management believes are reasonable based upon the information available. We base these estimates on our historical experience, future expectations and various other assumptions that we believe to be reasonable under the circumstances, the results of which form the basis for our judgments that may not be readily apparent from other sources. These estimates and assumptions affect the reported amounts of assets and liabilities and the disclosure of contingent assets and liabilities at the dates of the consolidated financial statements and the reported amounts of revenue and expenses during the reporting periods.
We believe that the assumptions and estimates associated with revenue recognition, stock-based compensation, accounts receivable, the valuation of goodwill and intangible assets, income taxes and legal contingencies have the greatest potential impact on our consolidated financial statements. We evaluate these estimates on an ongoing basis. Actual results could differ from those estimates under different assumptions or conditions, and any differences could be material. For further information on all of our significant accounting policies, see Note 1 of the Notes to Consolidated Financial Statements under Item 8.
Revenue Recognition
The majority of our revenue is generated from monthly service revenues and related professional services from the sale of the LivePerson services. Because we provide our application as a service, we follow the provisions of ASC 605-10-S99, “Revenue Recognition” and ASC 605-25, “Revenue Recognition with Multiple-Element Arrangements.” We charge a monthly fee, which varies by type of service, the level of customer usage and website traffic, and in some cases, the number of orders placed via our online engagement solutions.
For certain of our larger customers, we may provide call center labor through an arrangement with one or more of several qualified vendors. For most of these customers, we pass the fee we incur with the labor provider and our fee for the hosted services through to our customers in the form of a fixed fee for each order placed via our online engagement solutions. For these Pay for Performance (“PFP”) arrangements, in accordance with ASC 605-45, “Principal Agent Considerations,” we record revenue for transactions in which we act as an agent on a net basis, and revenue for transactions in which we act as a principal on a gross basis.
48
We also sell certain of the LivePerson services directly via Internet download. These services are marketed as LiveEngage for small to medium-sized businesses (“SMBs”), and are paid for almost exclusively by credit card. Credit card payments accelerate cash flow and reduce our collection risk, subject to the merchant bank's right to hold back cash pending settlement of the transactions. Sales of LiveEngage may occur with or without the assistance of an online sales representative, rather than through face-to-face or telephone contact that is typically required for traditional direct sales.
We recognize monthly service revenue based upon the fee charged for the LivePerson services, provided that there is persuasive evidence of an arrangement, no significant obligations remain, collection of the resulting receivable is probable and the amount of fees to be paid is fixed or determinable. Our service agreements typically have twelve month terms and, in some cases, are terminable or may terminate upon 30 to 90 days’ notice without penalty. When professional service fees add value to the customer on a standalone basis, we recognize professional service fees upon completion of services. This guidance establishes a selling price hierarchy for determining the selling price of a deliverable, which is based on: (a) vendor-specific objective evidence; (b) third-party evidence; or (c) estimates. If a professional services arrangement does not qualify for separate accounting, we recognize the fees, and the related labor costs, ratably over the contracted period.
For revenue from our Consumer segment generated from online transactions between Experts and Users, we recognize revenue net of Expert fees in accordance with ASC 605-45, “Principal Agent Considerations,” due primarily to the fact that the Expert is the primary obligor. Additionally, we perform as an agent without any risk of loss for collection, and are not involved in selecting the Expert or establishing the Expert’s fee. We collect a fee from the consumer and retain a portion of the fee, and then remit the balance to the Expert. Revenue from these transactions is recognized when there is persuasive evidence of an arrangement, no significant obligations remain, collection of the resulting receivable is probable and the amount of fees to be paid is fixed or determinable.
Stock-Based Compensation
We follow ASC 718-10, “Stock Compensation,” which addresses the accounting for transactions in which an entity exchanges its equity instruments for goods or services, with a primary focus on transactions in which an entity obtains employee services in share-based payment transactions. ASC 718-10 requires measurement of the cost of employee services received in exchange for an award of equity instruments based on the grant-date fair value of the award (with limited exceptions). Incremental compensation costs arising from subsequent modifications of awards after the grant date must be recognized.
As of
December 31, 2016
, there was approximately $
7.1 million
of total unrecognized compensation cost related to nonvested stock options. That cost is expected to be recognized over a weighted average period of approximately
1.9
years. As of
December 31, 2016
, there was approximately $
9.3 million
of total unrecognized compensation cost related to nonvested restricted stock units. That cost is expected to be recognized over a weighted average period of approximately
2.8
years.
Accounts Receivable
We perform ongoing credit evaluations of our customers’ financial condition (except for customers who purchase the LivePerson services by credit card via Internet download) and have established an allowance for doubtful accounts based upon factors surrounding the credit risk of customers, historical trends and other information that we believe to be reasonable, although they may change in the future. If there is a deterioration of a customer’s credit worthiness or actual write-offs are higher than our historical experience, our estimates of recoverability for these receivables could be adversely affected. Although our large number of customers limits our concentration of credit risk, we do have several large customers. If we experience a significant write-off from one of these large customers, it could have a material adverse impact on our consolidated financial statements. No single customer accounted for or exceeded 10% of our total revenue in
2016
,
2015
or
2014
. No single customer accounted for or exceeded 10% of our total accounts receivable in
2016
and
2015
. One customer accounted for approximately
22%
of accounts receivable at Decembers 31, 2014. During
2016
, we increased our allowance for doubtful accounts from
$1.2 million
to approximately
$1.7 million
, principally due to analysis of the accounts receivable aging.
A large proportion of receivables are due from larger corporate customers that typically have longer payment cycles.
Goodwill
In accordance with ASC 350, “Goodwill and Other Intangible Assets,” goodwill and indefinite-lived intangible assets are not amortized, but reviewed for impairment upon the occurrence of events or changes in circumstances that would reduce the fair value below its carrying amount. Goodwill is required to be tested for impairment at least annually. In September 2011, the FASB issued ASU No. 2011-08, Intangibles — Goodwill and Other (Topic 350). ASU 2011-08 permits an entity to first assess qualitative factors to determine whether it is “more likely than not” that the fair value of a reporting unit is less than its carrying amount as a basis for determining whether it is necessary to perform the two-step goodwill impairment test described in Topic 350. The more-likely-than-not threshold is defined as having a likelihood of more than 50%. If it is determined that the fair value of a reporting unit is more likely than not to be less than its carrying value (including unrecognized intangible assets) than it is necessary to perform the second step of the goodwill impairment test. The second step of the goodwill impairment test is judgmental in nature and often involves the use of significant estimates and assumptions. Similarly, estimates and assumptions are used in
49
determining the fair value of other intangible assets. These estimates and assumptions could have a significant impact on whether or not an impairment charge is recognized and also the magnitude of any such charge. We perform internal valuation analyses and consider other market information that is publicly available. Estimates of fair value are primarily determined using discounted cash flows and market comparisons. These approaches use significant estimates and assumptions including projected future cash flows (including timing), discount rates reflecting the risk inherent in future cash flows, perpetual growth rates, determination of appropriate market comparables and the determination of whether a premium or discount should be applied to comparables.
We evaluate for goodwill impairment annually at September 30
th
. At the end of the third quarter of
2016
, we determined that it was not more-likely that the fair value of the reporting units is less than their carrying amount. Accordingly, we did not perform the two-step goodwill impairment test.
Impairment of Long-Lived Assets
In accordance with ASC 360-10, “Accounting for the Impairment or Disposal of Long-Lived Assets,” long-lived assets, such as property, plant and equipment and purchased intangibles subject to amortization are reviewed for impairment whenever events or changes in circumstances indicate that the carrying value of an asset may not be recoverable. The amount of any impairment is measured as the difference between the carrying value and the fair value of the impaired asset. During the year ended
December 31, 2016
, the Company determined certain long-lived assets related to the legacy platform and purchased intangibles of technology licenses to be impaired. The write-off of net book value of these assets, of approximately $0.2 million and $2.6 million, was included in restructuring costs and general and administrative expenses, respectively.
Income Taxes
Income taxes are accounted for under the asset and liability method. Under this method, deferred tax assets and liabilities are recognized for the future tax consequences attributable to differences between the financial statement carrying amounts of existing assets and liabilities and their respective tax bases and operating loss and tax credit carryforwards. Deferred tax assets and liabilities are measured using enacted tax rates expected to apply to taxable income in the years in which those temporary differences are expected to be recovered or settled. In assessing the realizability of deferred tax assets, management considers whether it is more likely than not that some portion or all of the deferred tax assets will be realized. The ultimate realization of deferred tax assets is dependent upon the generation of future taxable income during the periods in which those temporary differences are expected to become deductible. We consider the scheduled reversal of deferred tax liabilities, projected future taxable income and tax planning strategies in making this assessment. We include interest accrued on the underpayment of income taxes in interest expense and penalties, if any, related to unrecognized tax benefits in general and administrative expenses. We recorded a valuation allowance as we considered our cumulative loss in recent years as a significant piece of negative evidence. During the year ended December 31,
2016
, the valuation allowance recorded was
$12.1 million
.
Legal Contingencies
We are subject to legal proceedings and litigation arising in the ordinary course of business. Periodically, we evaluate the status of each legal matter and assess our potential financial exposure. If the potential loss from any legal proceeding or litigation is considered probable and the amount can be reasonably estimated, we accrue a liability for the estimated loss. Significant judgment is required to determine the probability of a loss and whether the amount of the loss is reasonably estimable. The outcome of any proceeding is not determinable in advance. As a result, the assessment of a potential liability and the amount of accruals recorded are based only on the information available at the time. As additional information becomes available, we reassess the potential liability related to the legal proceeding or litigation, and may revise our estimates. Any revisions could have a material effect on our results of operations. See Note 13, Legal Matters, of the Notes to the Consolidated Financial Statements under Item 8 for additional information on our legal proceedings and litigation.
Recently Issued Accounting Standards
In January 2017, the Financial Accounting Standards Board (“FASB”) issued Accounting Standards Update No. 2017-04, "Intangibles —Goodwill and Other (Topic 350): Simplifying the Test for Goodwill Impairment" (“ASU 2017-04”). This update addresses concerns over the cost and complexity of the two-step goodwill impairment test. The amendments in this update remove the second step of the test. An entity will apply a one-step quantitative test and record the amount of goodwill impairment as the excess of a reporting unit's carrying amount over its fair value, not to exceed the total amount of goodwill allocated to the reporting unit. The new guidance does not amend the optional qualitative assessment of goodwill impairment. ASU 2017-04 is effective for financial statements issued for annual periods beginning after December 15, 2019, and interim periods within those annual periods. We do not expect the adoption of ASU 2017-04 to have a material effect on our financial position, results of operations or cash flows.
50
In January 2017, the FASB issued Accounting Standards Update No. 2017-01, "Business Combinations (Topic 805): Clarifying the Definition of a Business" (“ASU 2017-01”). This update clarifies the definition of a business with the objective of adding guidance to assist entities with evaluating whether transactions should be accounted for as acquisitions (or disposals) of businesses. The amendments in this update provide a screen to determine when a set is not a business. If the screen is not met, it (1) requires that to be considered a business, a set must include, at a minimum, an input and a substantive process that together significantly contribute to the ability to create output and (2) removes the evaluation of whether a market participant could replace the missing elements. ASU 2017-01 is effective for financial statements issued for annual periods beginning after December 15, 2017, and interim periods within those annual periods. We do not expect the adoption of ASU 2017-01 to have a material effect on our financial position, results of operations or cash.
In March 2016, the FASB issued Accounting Standards Update No. 2016-09, “Compensation -Stock Compensation (Topic 718): Improvements to Employee Share-Based Payment Accounting” (“ASU 2016-09”). This update is intended to improve the accounting for employee share-based payments and affects all organizations that issue share-based payment awards to their employees. Several aspects of the accounting for share-based payment award transactions are simplified, including:(a) income tax consequences; (b) classification of awards as either equity or liabilities; and(c)classification on the statement of cash flows. ASU 2016-09 is effective for financial statements issued for annual periods beginning after December 15, 2016.We do not expect the adoption of ASU 2016-09 to have a material effect on our financial position, results of operations or cash flows.
In February 2016, the FASB issued Accounting Standards Update No. 2016-02, "Leases" ("ASU 2016-02"). ASU 2016-02 requires lessees to recognize the following for all leases (with the exception of short-term leases) at the commencement date: a lease liability, which is a lessee‘s obligation to make lease payments arising from a lease, measured on a discounted basis; and a right-of-use asset, which is an asset that represents the lessee’s right to use, or control the use of, a specified asset for the lease term. Under the new guidance, lessor accounting is largely unchanged. Certain targeted improvements were made to align, where necessary, lessor accounting with the lessee accounting model and Topic 606, Revenue from Contracts with Customers. The new lease guidance also simplified the accounting for sale and leaseback transactions primarily because lessees must recognize lease assets and lease liabilities. Lessees will no longer be provided with a source of off-balance sheet financing. Lessees (for capital and operating leases) and lessors (for sales-type, direct financing, and operating leases) must apply a modified retrospective transition approach for leases existing at, or entered into after, the beginning of the earliest comparative period presented in the financial statements. The modified retrospective approach would not require any transition accounting for leases that expired before the earliest comparative period presented. Lessees and lessors may not apply a full retrospective transition approach. ASU 2016-02 is effective for financial statements issued for annual periods beginning after December 15, 2018. While we are currently assessing the impact ASU 2016-02 will have on our consolidated financial statements, we expect the primary impact to our consolidated financial position upon adoption will be the recognition, on a discounted basis, of our minimum commitments under non-cancelable operating leases on our consolidated balance sheets resulting in the recording of right of use assets and lease obligations. Our current minimum commitments under noncancelable operating leases are disclosed in Note 10.
In May 2014, the FASB issued Accounting Standards Update No. 2014-09, Revenue from Contracts with Customers (“ASU 2014-09”), which supersedes most existing revenue recognition guidance under GAAP. The core principle of ASU 2014-09 is to recognize revenues when promised goods or services are transferred to customers in an amount that reflects the consideration to which an entity expects to be entitled for those goods or services. ASU 2014-09 defines a five step process to achieve this core principle and, in doing so, more judgment and estimates may be required within the revenue recognition process than are required under existing GAAP. The standard is effective for annual periods beginning after December 15, 2017, and interim periods therein, using either of the following transition methods: (i) a full retrospective approach reflecting the application of the standard in each prior reporting period with the option to elect certain practical expedients, or (ii) a retrospective approach with the cumulative effect of initially adopting ASU 2014-09 recognized at the date of adoption (which includes additional footnote disclosures). In March 2016, the FASB issued implementation guidance that clarified the considerations in principal versus agent determination. In April 2016, FASB issued guidance that clarified identifying performance obligations and licensing implementation guidance contained in the new revenue recognition standard. In May 2016, FASB issued guidance that addresses narrow-scope improvements to the guidance on collectability, noncash consideration, and completed contracts at transition. In December 2016, FASB issued guidance to make minor corrections or minor improvements to the Codification that are not expected to have a significant effect on current accounting practice or create a significant administrative cost to most entities. The current revenue policy meets five core principles of ASU 2014-09 and we currently capitalize the contract costs over the contracted period also in accordance with ASU 2014-09. We are still analyzing the impact of this new ASU, but based on our work to date we believe that the current revenue recognition policy currently in place already depicts the transfer of promised goods or services to customers in an amount that reflects the consideration to which we expect to be entitled in exchange for those goods or services and as a result the adoption of this ASU is not expected to have a material impact on our financial statements.
51
Currency Rate Fluctuations
As a result of the scope of our Israeli operations, there is currency rate fluctuation risk associated with the exchange rate movement of the U.S. dollar against the New Israeli Shekel (“NIS”). For the year ended
December 31, 2016
, the U.S dollar depreciated as compared to the NIS by an average of 1% as compared to December 31,
2015
. For the year ended
December 31, 2016
, expenses generated by our Israeli operations totaled approximately $58.8 million. During
2016
, we hedged our foreign currency risk exposure relating to the NIS. We actively monitor the movement of the U.S. dollar against the NIS, Pound Sterling, Euro, AUS dollar and Japanese Yen and have considered the use of financial instruments, including but not limited to derivative financial instruments, which could mitigate such risk. If we determine that our risk of exposure materially exceeds the potential cost of derivative financial instruments, we may in the future enter in to these types of investments. The functional currency of our wholly-owned Israeli subsidiaries, LivePerson Ltd. (formerly HumanClick Ltd.) and Kasamba Ltd., is the U.S. dollar; the functional currency of our operations in the United Kingdom is the Pound Sterling; the functional currency of our operations in the Netherlands, Germany, France and Italy is the Euro; the functional currency of our operations in Australia is the Australian Dollar; the functional currency of our operations in Japan is the Japanese Yen.
Collection Risk
Our accounts receivable are subject, in the normal course of business, to collection risks. We regularly assess these risks and have established policies and business practices to protect against the adverse effects of collection risks. During
2016
, we increased our allowance for doubtful accounts from
$1.2 million
to approximately
$1.7 million
, principally due to analysis of the accounts receivable aging. During
2015
, we decreased our allowance for doubtful accounts by approximately $
0.1 million
to approximately
$1.2 million
, principally due to an decrease in write-offs compared to 2014. A large proportion of receivables are due from larger corporate customers that typically have longer payment cycles. We base our allowance for doubtful accounts on specifically identified credit risks of customers, historical trends and other information that we believe to be reasonable.
Interest Rate Risk
Our investments consist of cash and cash equivalents. Therefore, changes in the market’s interest rates do not affect in any material respect the value of the investments as recorded by us.
Inflation Rate Risk
We do not believe that inflation has had a material effect on our business, financial conditions or results of operations. If our costs were to become subject to significant inflationary pressures, we may not be able to fully offset such higher costs through price increases. Our inability or failure to do so could harm our business, financial condition and results of operations.
52
INDEX
|
Page
|
|
|
Report of BDO USA, LLP, Independent Registered Public Accounting Firm
|
|
|
Consolidated Balance Sheets as of December 31, 2016 and 2015
|
|
|
Consolidated Statements of Operations for each of the years ended December 31, 2016, 2015 and 2014
|
|
|
Consolidated Statements of Comprehensive Loss for each of the years ended December 31, 2016, 2015 and 2014
|
|
|
Consolidated Statements of Stockholders’ Equity for each of the years ended December 31, 2016, 2015 and 2014
|
|
|
Consolidated Statements of Cash Flows for each of the years ended December 31, 2016, 2015 and 2014
|
|
|
Notes to Consolidated Financial Statements
|
|
53
REPORT OF INDEPENDENT REGISTERED PUBLIC ACCOUNTING FIRM
To the Board of Directors and Stockholders
LivePerson, Inc.
New York, New York
We have audited the accompanying consolidated balance sheets of LivePerson, Inc. as of
December 31, 2016
and
2015
and the related consolidated statements of operations, comprehensive loss, stockholders’ equity, and cash flows for each of the three years in the period ended
December 31, 2016
. These consolidated financial statements are the responsibility of the Company’s management. Our responsibility is to express an opinion on these consolidated financial statements based on our audits.
We conducted our audits in accordance with the standards of the Public Company Accounting Oversight Board (United States). Those standards require that we plan and perform the audit to obtain reasonable assurance about whether the consolidated financial statements are free of material misstatement. An audit includes examining, on a test basis, evidence supporting the amounts and disclosures in the consolidated financial statements, assessing the accounting principles used and significant estimates made by management, as well as evaluating the overall consolidated financial statement presentation. We believe that our audits provide a reasonable basis for our opinion.
In our opinion, the consolidated financial statements referred to above present fairly, in all material respects, the financial position of LivePerson, Inc. at
December 31, 2016
and
2015
, and the results of its operations and its cash flows for each of the three years in the period ended
December 31, 2016
, in conformity with accounting principles generally accepted in the United States of America.
We also have audited, in accordance with the standards of the Public Company Accounting Oversight Board (United States), LivePerson, Inc.’s internal control over financial reporting as of
December 31, 2016
, based on criteria established in Internal Control — Integrated Framework (2013) issued by the Committee of Sponsoring Organizations of the Treadway Commission (“COSO”) and our report dated
March 10, 2017
expressed an unqualified opinion thereon.
/s/ BDO USA, LLP
New York, New York
March 10, 2017
54
LIVEPERSON, INC.
(IN THOUSANDS)
|
December 31,
|
|||||||
|
2016
|
2015
|
||||||
|
ASSETS
|
|||||||
|
CURRENT ASSETS:
|
|||||||
|
Cash and cash equivalents
|
$
|
50,889
|
|
$
|
48,803
|
|
|
|
Cash held as collateral
|
3,962
|
|
5,409
|
|
|||
|
Accounts receivable, net of allowance for doubtful accounts of $1,732 and $1,184, in 2016 and 2015, respectively
|
31,823
|
|
30,388
|
|
|||
|
Prepaid expenses and other current assets
|
5,477
|
|
9,327
|
|
|||
|
Deferred tax assets, net
|
—
|
|
455
|
|
|||
|
Total current assets
|
92,151
|
|
94,382
|
|
|||
|
Property and equipment, net
|
28,397
|
|
24,129
|
|
|||
|
Intangibles, net
|
16,510
|
|
24,619
|
|
|||
|
Goodwill
|
80,245
|
|
80,322
|
|
|||
|
Deferred tax assets, net
|
773
|
|
785
|
|
|||
|
Other assets
|
1,562
|
|
1,957
|
|
|||
|
Total assets
|
$
|
219,638
|
|
$
|
226,194
|
|
|
|
LIABILITIES AND STOCKHOLDERS’ EQUITY
|
|||||||
|
CURRENT LIABILITIES:
|
|||||||
|
Accounts payable
|
$
|
7,288
|
|
$
|
7,102
|
|
|
|
Accrued expenses and other current liabilities
|
40,250
|
|
34,296
|
|
|||
|
Deferred revenue
|
27,145
|
|
13,862
|
|
|||
|
Total current liabilities
|
74,683
|
|
55,260
|
|
|||
|
Other liabilities
|
3,147
|
|
3,270
|
|
|||
|
Deferred tax liability
|
3,332
|
|
2,359
|
|
|||
|
Total liabilities
|
81,162
|
|
60,889
|
|
|||
|
Commitments and contingencies (See Note 10)
|
|
|
|
|
|||
|
STOCKHOLDERS' EQUITY:
|
|||||||
|
Common stock
|
58
|
|
57
|
|
|||
|
Additional paid-in capital
|
289,524
|
|
286,856
|
|
|||
|
Treasury stock
|
(2
|
)
|
(1
|
)
|
|||
|
Accumulated deficit
|
(144,944
|
)
|
(119,071
|
)
|
|||
|
Accumulated other comprehensive loss
|
(6,160
|
)
|
(2,536
|
)
|
|||
|
Total stockholders’ equity
|
138,476
|
|
165,305
|
|
|||
|
Total liabilities and stockholders’ equity
|
$
|
219,638
|
|
$
|
226,194
|
|
|
See notes to consolidated financial statements.
55
LIVEPERSON, INC.
(IN THOUSANDS, EXCEPT SHARE AND PER SHARE DATA)
|
Year Ended December 31,
|
|||||||||||
|
2016
|
2015
|
2014
|
|||||||||
|
Revenue
|
$
|
222,779
|
|
$
|
239,012
|
|
$
|
209,931
|
|
||
|
Costs and expenses:
(1) (2) (3)
|
|||||||||||
|
Cost of revenue
|
63,161
|
|
70,310
|
|
52,703
|
|
|||||
|
Sales and marketing
|
89,529
|
|
94,728
|
|
83,253
|
|
|||||
|
General and administrative
|
43,046
|
|
37,171
|
|
40,192
|
|
|||||
|
Product development
|
40,198
|
|
38,974
|
|
37,329
|
|
|||||
|
Restructuring costs
|
2,369
|
|
3,384
|
|
—
|
|
|||||
|
Amortization of purchased intangibles
|
3,885
|
|
4,873
|
|
1,621
|
|
|||||
|
Total costs and expenses
|
242,188
|
|
249,440
|
|
215,098
|
|
|||||
|
Loss from operations
|
(19,409
|
)
|
(10,428
|
)
|
(5,167
|
)
|
|||||
|
Other (expense) income, net
|
(530
|
)
|
(202
|
)
|
(322
|
)
|
|||||
|
Loss before provision for income taxes
|
(19,939
|
)
|
(10,630
|
)
|
(5,489
|
)
|
|||||
|
Provision for income taxes
|
5,934
|
|
15,814
|
|
1,859
|
|
|||||
|
Net loss
|
$
|
(25,873
|
)
|
$
|
(26,444
|
)
|
$
|
(7,348
|
)
|
||
|
Net loss per share of common stock:
|
|||||||||||
|
Basic
|
$
|
(0.46
|
)
|
$
|
(0.47
|
)
|
$
|
(0.13
|
)
|
||
|
Diluted
|
$
|
(0.46
|
)
|
$
|
(0.47
|
)
|
$
|
(0.13
|
)
|
||
|
Weighted-average shares used to compute net loss income per share:
|
|||||||||||
|
Basic
|
56,063,777
|
|
56,452,408
|
|
54,478,754
|
|
|||||
|
Diluted
|
56,063,777
|
|
56,452,408
|
|
54,478,754
|
|
|||||
|
(1)
Amounts include stock compensation expense, as follows:
|
|||||||||||
|
Cost of revenue
|
$
|
429
|
|
$
|
1,396
|
|
$
|
1,492
|
|
||
|
Sales and marketing
|
2,515
|
|
3,088
|
|
3,399
|
|
|||||
|
General and administrative
|
3,304
|
|
3,692
|
|
3,809
|
|
|||||
|
Product development
|
3,488
|
|
3,638
|
|
3,606
|
|
|||||
|
(2)
Amounts include depreciation expense, as follows:
|
|||||||||||
|
Cost of revenue
|
$
|
8,234
|
|
$
|
9,091
|
|
$
|
6,658
|
|
||
|
Sales and marketing
|
1,315
|
|
1,232
|
|
871
|
|
|||||
|
General and administrative
|
1,418
|
|
893
|
|
820
|
|
|||||
|
Product development
|
1,044
|
|
898
|
|
722
|
|
|||||
|
(3)
Amounts include amortization of purchased intangibles, as follows:
|
|||||||||||
|
Cost of revenue
|
$
|
2,788
|
|
$
|
3,167
|
|
$
|
3,469
|
|
||
See notes to consolidated financial statements.
56
LIVEPERSON, INC.
CONSOLIDATED STATEMENTS OF COMPREHENSIVE LOSS
(IN THOUSANDS)
|
Year Ended December 31,
|
|||||||||||
|
2016
|
2015
|
2014
|
|||||||||
|
Net loss
|
$
|
(25,873
|
)
|
$
|
(26,444
|
)
|
$
|
(7,348
|
)
|
||
|
Foreign currency translation adjustment
|
(3,624
|
)
|
(1,398
|
)
|
(795
|
)
|
|||||
|
Comprehensive loss
|
$
|
(29,497
|
)
|
$
|
(27,842
|
)
|
$
|
(8,143
|
)
|
||
See notes to consolidated financial statements.
57
LIVEPERSON, INC.
CONSOLIDATED STATEMENTS OF STOCKHOLDERS’ EQUITY
(IN THOUSANDS, EXCEPT SHARE DATA)
|
Common Stock
|
Treasury Stock
|
Additional
Paid-in
Capital
|
Accumulated
Deficit
|
Accumulated
Other Comprehensive
Loss
|
|||||||||||||||||||||||||
|
Shares
|
Amount
|
Shares
|
Amount
|
Total
|
|||||||||||||||||||||||||
|
Balance at December 31, 2013
|
54,484,760
|
|
$
|
54
|
|
—
|
|
$
|
—
|
|
$
|
244,621
|
|
$
|
(85,279
|
)
|
$
|
(343
|
)
|
$
|
159,053
|
|
|||||||
|
Issuance of common stock in connection with CAO! acquisition
|
1,627,753
|
|
2
|
|
—
|
|
—
|
|
20,121
|
|
—
|
|
—
|
|
20,123
|
|
|||||||||||||
|
Common stock issued upon exercise of stock options
|
1,097,543
|
|
1
|
|
—
|
|
—
|
|
7,882
|
|
—
|
|
—
|
|
7,883
|
|
|||||||||||||
|
Stock-based compensation
|
—
|
|
—
|
|
—
|
|
—
|
|
12,306
|
|
—
|
|
—
|
|
12,306
|
|
|||||||||||||
|
Common stock issued under Employee Stock Purchase Plan
|
142,064
|
|
1
|
|
—
|
|
—
|
|
1,430
|
|
—
|
|
—
|
|
1,431
|
|
|||||||||||||
|
Common stock repurchase
|
(650,789
|
)
|
(1
|
)
|
(544,396
|
)
|
(1
|
)
|
(12,978
|
)
|
—
|
|
—
|
|
(12,980
|
)
|
|||||||||||||
|
Tax benefit from exercise of employee stock options
|
—
|
|
—
|
|
—
|
|
—
|
|
664
|
|
—
|
|
—
|
|
664
|
|
|||||||||||||
|
Net loss
|
—
|
|
—
|
|
—
|
|
—
|
|
—
|
|
(7,348
|
)
|
—
|
|
(7,348
|
)
|
|||||||||||||
|
Other comprehensive loss
|
—
|
|
—
|
|
—
|
|
—
|
|
—
|
|
—
|
|
(795
|
)
|
(795
|
)
|
|||||||||||||
|
Balance at December 31, 2014
|
56,701,331
|
|
57
|
|
(544,396
|
)
|
(1
|
)
|
274,046
|
|
(92,627
|
)
|
(1,138
|
)
|
180,337
|
|
|||||||||||||
|
Common stock issued upon exercise of stock options
|
645,531
|
|
—
|
|
—
|
|
—
|
|
2,904
|
|
—
|
|
—
|
|
2,904
|
|
|||||||||||||
|
Stock-based compensation
|
—
|
|
—
|
|
—
|
|
—
|
|
11,814
|
|
—
|
|
—
|
|
11,814
|
|
|||||||||||||
|
Common stock issued under Employee Stock Purchase Plan
|
170,857
|
|
—
|
|
—
|
|
—
|
|
1,497
|
|
—
|
|
—
|
|
1,497
|
|
|||||||||||||
|
Common stock repurchase
|
(142,812
|
)
|
—
|
|
(277,360
|
)
|
—
|
|
(4,202
|
)
|
—
|
|
—
|
|
(4,202
|
)
|
|||||||||||||
|
Tax benefit from exercise of employee stock options
|
—
|
|
—
|
|
—
|
|
—
|
|
797
|
|
—
|
|
—
|
|
797
|
|
|||||||||||||
|
Net loss
|
—
|
|
—
|
|
—
|
|
—
|
|
—
|
|
(26,444
|
)
|
—
|
|
(26,444
|
)
|
|||||||||||||
|
Other comprehensive loss
|
—
|
|
—
|
|
—
|
|
—
|
|
—
|
|
—
|
|
(1,398
|
)
|
(1,398
|
)
|
|||||||||||||
|
Balance at December 31, 2015
|
57,374,907
|
|
57
|
|
(821,756
|
)
|
(1
|
)
|
286,856
|
|
(119,071
|
)
|
(2,536
|
)
|
165,305
|
|
|||||||||||||
|
Common stock issued upon exercise of stock options
|
324,502
|
|
—
|
|
—
|
|
—
|
|
1,806
|
|
—
|
|
—
|
|
1,806
|
|
|||||||||||||
|
Common stock issued upon vesting of restricted stock units
|
393,504
|
|
1
|
|
—
|
|
—
|
|
—
|
|
—
|
|
—
|
|
1
|
|
|||||||||||||
|
Stock-based compensation
|
—
|
|
—
|
|
—
|
|
—
|
|
9,736
|
|
—
|
|
—
|
|
9,736
|
|
|||||||||||||
|
Common stock issued under Employee Stock Purchase Plan
|
183,534
|
|
—
|
|
—
|
|
—
|
|
1,092
|
|
—
|
|
—
|
|
1,092
|
|
|||||||||||||
|
Common stock repurchase
|
—
|
|
—
|
|
(1,518,349
|
)
|
(1
|
)
|
(9,966
|
)
|
—
|
|
—
|
|
(9,967
|
)
|
|||||||||||||
|
Net loss
|
—
|
|
—
|
|
—
|
|
—
|
|
—
|
|
(25,873
|
)
|
—
|
|
(25,873
|
)
|
|||||||||||||
|
Other comprehensive loss
|
—
|
|
—
|
|
—
|
|
—
|
|
—
|
|
—
|
|
(3,624
|
)
|
(3,624
|
)
|
|||||||||||||
|
Balance at December 31, 2016
|
58,276,447
|
|
$
|
58
|
|
(2,340,105
|
)
|
$
|
(2
|
)
|
$
|
289,524
|
|
$
|
(144,944
|
)
|
$
|
(6,160
|
)
|
$
|
138,476
|
|
|||||||
See notes to consolidated financial statements.
58
LIVEPERSON, INC.
(IN THOUSANDS, EXCEPT SHARE DATA)
See notes to consolidated financial statements.
|
Year Ended December 31,
|
|||||||||||
|
2016
|
2015
|
2014
|
|||||||||
|
OPERATING ACTIVITIES:
|
|||||||||||
|
Net loss
|
$
|
(25,873
|
)
|
$
|
(26,444
|
)
|
$
|
(7,348
|
)
|
||
|
Adjustments to reconcile net loss to net cash provided by operating activities:
|
|||||||||||
|
Stock-based compensation expense
|
9,736
|
|
11,814
|
|
12,306
|
|
|||||
|
Depreciation
|
12,011
|
|
12,114
|
|
9,071
|
|
|||||
|
Impairment on investments
|
2,600
|
|
—
|
|
—
|
|
|||||
|
Amortization of tenant allowance
|
(180
|
)
|
—
|
|
—
|
|
|||||
|
Amortization of purchased intangibles
|
6,673
|
|
8,040
|
|
5,090
|
|
|||||
|
Change in fair value of contingent consideration
|
—
|
|
(3,680
|
)
|
—
|
|
|||||
|
Provision for doubtful accounts, net
|
1,831
|
|
2,361
|
|
1,843
|
|
|||||
|
Deferred income taxes
|
1,852
|
|
14,456
|
|
(1,736
|
)
|
|||||
|
Changes in operating assets and liabilities, net of acquisitions:
|
|||||||||||
|
Accounts receivable
|
(3,265
|
)
|
(1,368
|
)
|
(1,354
|
)
|
|||||
|
Prepaid expenses and other current assets
|
3,845
|
|
724
|
|
(4,056
|
)
|
|||||
|
Other assets
|
196
|
|
130
|
|
614
|
|
|||||
|
Accounts payable
|
185
|
|
(1,916
|
)
|
(1,528
|
)
|
|||||
|
Accrued expenses and other current liabilities
|
2,982
|
|
1,193
|
|
576
|
|
|||||
|
Deferred revenue
|
13,283
|
|
1,869
|
|
2,710
|
|
|||||
|
Other liabilities
|
(1,316
|
)
|
2,538
|
|
(515
|
)
|
|||||
|
Net cash provided by operating activities
|
24,560
|
|
21,831
|
|
15,673
|
|
|||||
|
INVESTING ACTIVITIES:
|
|||||||||||
|
Purchases of property and equipment, including capitalized software
|
(12,344
|
)
|
(12,980
|
)
|
(10,589
|
)
|
|||||
|
Payments for acquisitions and intangible assets, net of cash acquired
|
(555
|
)
|
(150
|
)
|
(40,871
|
)
|
|||||
|
Cash held as collateral
|
1,447
|
|
(5,409
|
)
|
—
|
|
|||||
|
Investment in technology licenses
|
—
|
|
—
|
|
(3,451
|
)
|
|||||
|
Net cash used in investing activities
|
(11,452
|
)
|
(18,539
|
)
|
(54,911
|
)
|
|||||
|
FINANCING ACTIVITIES:
|
|||||||||||
|
Repurchase of common stock
|
(9,967
|
)
|
(4,202
|
)
|
(12,980
|
)
|
|||||
|
Excess tax benefit from the exercise of employee stock options
|
—
|
|
797
|
|
664
|
|
|||||
|
Payments related to contingent consideration
|
—
|
|
(2,883
|
)
|
—
|
|
|||||
|
Proceeds from issuance of common stock in connection with the exercise of options
|
2,899
|
|
4,401
|
|
9,314
|
|
|||||
|
Net cash used in financing activities
|
(7,068
|
)
|
(1,887
|
)
|
(3,002
|
)
|
|||||
|
EFFECT OF FOREIGN EXCHANGE RATE CHANGES ON CASH AND CASH EQUIVALENTS
|
(3,954
|
)
|
(1,974
|
)
|
(294
|
)
|
|||||
|
CHANGE IN CASH AND CASH EQUIVALENTS
|
2,086
|
|
(569
|
)
|
(42,534
|
)
|
|||||
|
CASH AND CASH EQUIVALENTS - Beginning of the year
|
48,803
|
|
49,372
|
|
91,906
|
|
|||||
|
CASH AND CASH EQUIVALENTS - End of the year
|
$
|
50,889
|
|
$
|
48,803
|
|
$
|
49,372
|
|
||
|
SUPPLEMENTAL DISCLOSURE OF OTHER CASH FLOW INFORMATION:
|
|||||||||||
|
Cash paid for income taxes
|
$
|
424
|
|
$
|
1,882
|
|
$
|
4,386
|
|
||
|
SUPPLEMENTAL DISCLOSURE OF NON CASH INVESTING AND FINANCING ACTIVITIES:
|
|||||||||||
|
Purchase of property and equipment recorded in accounts payable
|
$
|
2,497
|
|
$
|
1,926
|
|
$
|
964
|
|
||
|
Leasehold improvements funded by landlord
|
$
|
1,440
|
|
$
|
326
|
|
$
|
—
|
|
||
|
Issuance of 1,627,753 shares of common stock in connection with the acquisition of CAO! on November 7, 2014
|
$
|
—
|
|
$
|
—
|
|
$
|
20,121
|
|
||
|
Contingent earn-out in connection with the acquisition of CAO! recorded in accrued expenses
|
$
|
—
|
|
$
|
—
|
|
$
|
4,220
|
|
||
|
Contingent earn-out in connection with the acquisition of Synchronite recorded in accrued expenses
|
$
|
—
|
|
$
|
—
|
|
$
|
1,810
|
|
||
59
LIVEPERSON, INC.
NOTES TO CONSOLIDATED FINANCIAL STATEMENTS
1. Description of Business and Summary of Significant Accounting Policies
LivePerson, Inc. (the “Company” or “LivePerson”) was incorporated in the State of Delaware in November 1995 and the LivePerson service was introduced in November 1998. In April 2000, the Company completed an initial public offering and is currently traded on the NASDAQ Global Select Market and the Tel Aviv Stock Exchange. LivePerson is headquartered in New York City with an U.S. office in Alpharetta (Georgia), and international offices in Amsterdam, Berlin, London, Mannheim, Melbourne, Milan, Paris, Ra'anana (Israel), Reading (UK), and Tokyo.
LivePerson provides mobile and online business messaging solutions that power digital communication between brands and consumers. LiveEngage, the Company’s enterprise-class, cloud-based platform, enables businesses to create a meaningful connection with consumers via messaging. As consumers have reoriented their digital lives around the smartphone, messaging apps have become their preferred communication channel to connect with each other. LivePerson allows brands to align with this new consumer preference, and deploy messaging at scale for customer care and sales, instead of demanding that consumers use email or call a 1-800 number.
LiveEngage was designed to securely deploy messaging at scale for brands with tens of millions of customers and many thousands of customer care agents. Key benefits include a sophisticated proactive targeting engine and a robust suite of text and mobile messaging, real-time chat messaging, content delivery, customer sentiment, and cobrowsing offerings that power intelligent digital engagement with consumers. LiveEngage powers conversations across each of a brand’s primary digital channels, including mobile apps, mobile and desktop web browsers, social media and third-party consumer messaging platforms.
LivePerson optimizes campaign outcomes for sales and service transaction by combining website visitor data with other historical, behavioral, and operational information to develop insights into each step of a consumer’s journey. LivePerson’s products, coupled with its domain knowledge, industry expertise and consulting services, have been proven to maximize the effectiveness of consumer engagement.
The Company’s primary revenue source is from the sale of LivePerson services to businesses of all sizes. The Company also offers an online marketplace that connects independent service providers (“Experts”) who provide information and knowledge for a fee via real-time chat with individual consumers (“Users”).
Principles of Consolidation
The consolidated financial statements reflect the operations of LivePerson and its wholly-owned subsidiaries. All significant intercompany balances and transactions have been eliminated in consolidation.
Reclassification
For comparability, certain 2014 and 2015 amounts have been reclassified where appropriate, to conform to the financial presentation in 2016.
Use of Estimates
The preparation of the consolidated financial statements in accordance with accounting principles generally accepted in the United States of America (“GAAP”) requires the Company’s management to make a number of estimates and assumptions relating to the reported amounts of assets and liabilities, the disclosure of contingent assets and liabilities at the date of the consolidated financial statements and the reported amounts of revenue and expenses during the period. Significant items subject to such estimates and assumptions include revenue recognition, stock-based compensation, accounts receivable, the valuation of goodwill and intangible assets, income taxes and legal contingencies. Actual results could differ from those estimates.
Concentration of Credit Risk
Financial instruments that potentially subject the Company to significant concentrations of credit risk consist primarily of cash and cash equivalents and accounts receivable which approximate fair value at
December 31, 2016
because of the short-term nature of these instruments. The Company invests its cash and cash equivalents with financial institutions that it believes are of high quality, and the Company performs periodic evaluations of these instruments and the relative credit standings of the institutions with which it invests. At certain times, the Company’s cash balances with any one financial institution may exceed Federal Deposit Insurance Corporation insurance limits. The Company believes it mitigates its risk by depositing its cash balances with high credit, quality financial institutions.
The Company’s customers are located primarily in the United States. The Company performs ongoing credit evaluations of its customers’ financial condition (except for customers who purchase the LivePerson services by credit card via Internet
60
LIVEPERSON, INC.
NOTES TO CONSOLIDATED FINANCIAL STATEMENTS
1. Description of Business and Summary of Accounting Policies (Continued)
download) and has established an allowance for doubtful accounts based upon factors surrounding the credit risk of customers, historical trends and other information. Concentration of credit risk is limited due to the Company’s large number of customers.
No
single customer accounted for or exceeded
10%
of revenue in
2016
,
2015
or
2014
.
No
single customer accounted for or exceeded
10%
of the Company's total accounts receivable in
2016
and
2015
.
Foreign Currency Translation
The Company's operations are conducted in various countries around the world and the financial statements of its foreign subsidiaries are reported in the applicable foreign currencies (functional currencies). Financial information is translated from the applicable functional currency to the U.S. dollar (the reporting currency) for inclusion in the Company's consolidated financial statements. Income, expenses and cash flows are translated at weighted average exchange rates prevailing during the fiscal period, and assets and liabilities are translated at fiscal period-end exchange rates. Resulting translation adjustments are included as a component of accumulated other comprehensive income (loss) in stockholders' equity. Foreign exchange transaction gain or losses are included in Other Income, net in the accompanying consolidated statements of operations.
Cash and Cash Equivalents
The Company considers all highly liquid securities with original maturities of
3 months
or less when acquired to be cash equivalents. Cash equivalents, which primarily consist of money market funds, are recorded at cost, which approximates fair value.
Accounts Receivable
Accounts receivable are recorded at the invoiced amount and do not bear interest. The allowance for doubtful accounts is the Company’s best estimate of the amount of probable credit losses in the Company’s existing accounts receivable. The Company determines the allowance based on historical write-off experience. The Company reviews its allowance for doubtful accounts monthly. Past due balances over 90 days and over a specified amount are reviewed individually for collectability. All other balances are reviewed on a pooled basis. Account balances are charged off against the allowance after all means of collection have been exhausted and the potential for recovery is considered remote. The Company does not have any off-balance sheet credit exposure related to its customers. The activity in the allowance for for doubtful accounts is as follows (amounts in thousands):
|
Year Ended December 31,
|
Beginning Balance
|
Additions
Charged to
Costs and
Expenses
|
Deductions /
Write-Offs
|
Ending Balance
|
|||||||||||
|
2014
|
$
|
1,165
|
|
$
|
1,337
|
|
$
|
(1,227
|
)
|
$
|
1,275
|
|
|||
|
2015
|
$
|
1,275
|
|
$
|
2,361
|
|
$
|
(2,452
|
)
|
$
|
1,184
|
|
|||
|
2016
|
$
|
1,184
|
|
$
|
1,831
|
|
$
|
(1,283
|
)
|
$
|
1,732
|
|
|||
Property and Equipment
Property and equipment are stated at cost, net of accumulated depreciation. Depreciation is calculated using the straight-line method over the estimated useful lives of the related assets, generally
three
to
five
years for equipment and software. Leasehold improvements are depreciated using the straight-line method over the shorter of the lease term or the estimated useful life of the asset. Depreciation expense totaled
$12.0 million
,
$12.1 million
, and
$9.1 million
for the years ended
December 31, 2016
,
2015
and
2014
, respectively.
Internal-Use Software Development Costs
In accordance with the Financial Accounting Standards Board (“FASB”) Accounting Standards Codification (“ASC”) 350-40, Internal-Use Software, the Company capitalizes its costs to develop its internal use software when preliminary development efforts are successfully completed, management has authorized and committed project funding, and it is probable that the project will be completed and the software will be used as intended. These costs are included in property and equipment in the Company's consolidated balance sheets and are amortized on a straight-line basis over the estimated useful life of the related asset, which approximates
three
years. Costs incurred prior to meeting these criteria, together with costs incurred for training and maintenance, are expensed as incurred.
The Company capitalized internal-use software costs of $
3.7 million
, $
2.4 million
, and $
2.5 million
for the years ended
December 31, 2016
,
2015
and
2014
, respectively.
61
LIVEPERSON, INC.
NOTES TO CONSOLIDATED FINANCIAL STATEMENTS
1. Description of Business and Summary of Accounting Policies (Continued)
Goodwill and Intangible Assets
In accordance with ASC 350, Goodwill and Other Intangible Assets, goodwill and indefinite-lived intangible assets are not amortized, but reviewed for impairment upon the occurrence of events or changes in circumstances that would reduce the fair value below its carrying amount. Goodwill is required to be tested for impairment at least annually. In September 2011, the FASB issued ASU No. 2011-8, “Intangibles — Goodwill and Other (Topic 350).” ASU 2011-8 permits an entity to first assess qualitative factors to determine whether it is “more likely than not” that the fair value of a reporting unit is less than its carrying amount as a basis for determining whether it is necessary to perform the two-step goodwill impairment test described in Topic 350. The more-likely-than-not threshold is defined as having a likelihood of more than 50%. If it is determined that the fair value of a reporting unit is more likely than not to be less than its carrying value (including unrecognized intangible assets) then it is necessary to perform the second step of the goodwill impairment test. The second step of the goodwill impairment test is judgmental in nature and often involves the use of significant estimates and assumptions. Similarly, estimates and assumptions are used in determining the fair value of other intangible assets. These estimates and assumptions could have a significant impact on whether or not an impairment charge is recognized and also the magnitude of any such charge. The Company performs internal valuation analyses and considers other market information that is publicly available. Estimates of fair value are primarily determined using discounted cash flows and market comparisons. These approaches use significant estimates and assumptions including projected future cash flows (including timing), discount rates reflecting the risk inherent in future cash flows, perpetual growth rates, determination of appropriate market comparables and the determination of whether a premium or discount should be applied to comparables.
ASC 350-10 also requires that intangible assets with estimable useful lives be amortized over their respective estimated useful lives to their estimated residual values, and reviewed for impairment in accordance with ASC 360-10-35, “Accounting for Impairment or Disposal of Long-Lived Assets.”
The Company evaluates for goodwill impairment annually at September 30
th
and at the end of the third quarter of
2016
, the Company determined that it was not more-likely that the fair value of the reporting units is less than their carrying amount. Accordingly, the Company did not perform the two-step goodwill impairment test on both the Company's Business and Consumer segments. The Company assessed qualitative facts while summarizing the totality of events and circumstances and considered the extent to which adverse events or circumstances could affect the reporting unit's fair value as well as the consideration of positive and mitigating events and circumstances that would affect the determination of whether it was more likely than not that the fair value of a reporting unit is less than its carrying amount.
Impairment of Long-Lived Assets
In accordance with ASC 360-10, “Accounting for the Impairment or Disposal of Long-lived Assets,” long-lived assets, such as property, plant and equipment and purchased intangibles subject to amortization are reviewed for impairment whenever events or changes in circumstances indicate that the carrying value of an asset may not be recoverable. The amount of any impairment is measured as the difference between the carrying value and the fair value of the impaired asset. During
December 31, 2016
, the Company determined certain long-lived assets related to the legacy platform and purchased intangibles of technology licenses to be impaired. The net book value of these assets, of approximately
$0.2 million
and
$2.6 million
, was included in restructuring costs and general and administrative expenses, respectively.
Fair Value of Financial Instruments
The fair value of a financial instrument is the amount at which the instrument could be exchanged in a current transaction between willing parties. Cash and cash equivalents, accounts receivable, security deposits and accounts payable carrying amounts approximate fair value because of the short maturity of these instruments.
Revenue Recognition
The majority of the Company’s revenue is generated from monthly service revenues and related professional services from the sale of the LivePerson services. Because the Company provides its application as a service, the Company follows the provisions of FASB Accounting Standards Codification (“ASC”) 605-10-S99, “Revenue Recognition” and ASC 605-25, “Revenue Recognition with Multiple-Element Arrangements.” The Company charges a monthly, quarterly or annual fee, which varies by type of service, the level of customer usage and website traffic, and in some cases, the number of orders placed via the Company’s online engagement solutions.
For certain of the Company’s larger customers, the Company may provide call center labor through an arrangement with one or more of several qualified vendors. For most of these customers, the Company passes the fee it incurs with the labor provider and its fee for the hosted services through to its customers in the form of a fixed fee for each order placed via the Company’s online engagement solutions. For these Pay for Performance (“PFP”) arrangements, in accordance with ASC 605-45, “Principal Agent
62
LIVEPERSON, INC.
NOTES TO CONSOLIDATED FINANCIAL STATEMENTS
1. Description of Business and Summary of Accounting Policies (Continued)
Considerations,” the Company records revenue for transactions in which it acts as an agent on a net basis, and revenue for transactions in which it acts as a principal on a gross basis.
The Company also sells certain of the LivePerson services directly via Internet download. These services are marketed as LiveEngage for small to medium-sized businesses (“SMBs”), and are paid for almost exclusively by credit card. Credit card payments accelerate cash flow and reduce the Company’s collection risk, subject to the merchant bank's right to hold back cash pending settlement of the transactions. Sales of LiveEngage may occur with or without the assistance of an online sales representative, rather than through face-to-face or telephone contact that is typically required for traditional direct sales.
The Company recognizes monthly service revenue based upon the fee charged for the LivePerson services, provided that there is persuasive evidence of an arrangement, no significant Company obligations remain, collection of the resulting receivable is probable and the amount of fees to be paid is fixed or determinable. The Company’s service agreements typically have
12
month terms and, in some cases, are terminable or may terminate upon
30
to
90
days’ notice without penalty. When professional service fees add value to the customer on a standalone basis, the Company recognizes professional service fees upon completion of services and customer acceptance. This guidance establishes a selling price hierarchy for determining the selling price of a deliverable, which is based on: (a) vendor-specific objective evidence; (b) third-party evidence; or (c) best estimated selling price. If a professional services arrangement does not qualify for separate accounting, the Company recognizes the fees, and the related labor costs, ratably over the contracted period.
For revenue from our Consumer segment generated from online transactions between Experts and Users, the Company recognizes revenue net of the Expert fees in accordance with ASC 605-45, “Principal Agent Considerations,” due primarily to the fact that the Expert is the primary obligor. Additionally, the Company performs as an agent without any risk of loss for collection, and is not involved in selecting the Expert or establishing the Expert’s fee. The Company collects a fee from the User and retains a portion of the fee, and then remits the balance to the Expert. Revenue from these transactions is recognized when there is persuasive evidence of an arrangement, no significant Company obligations remain, collection of the resulting receivable is probable and the amount of fees to be paid is fixed and determinable.
Advertising Costs
The Company expenses the cost of advertising and promoting its services as incurred. Such costs totaled approximately
$10.9 million
,
$10.7 million
, and
$9.7 million
for the years ended
December 31, 2016
,
2015
and
2014
, respectively.
Stock-based Compensation
In accordance with ASC Topic 718 -10, "Stock Compensation", the Company measures stock based awards at fair value and recognizes compensation expense for all share-based payment awards made to its employees and directors, including employee stock options.
The Company estimates the fair value of stock options granted using the Black-Scholes valuation model. This model requires the Company to make estimates and assumptions including, among other things, estimates regarding the length of time an employee will retain vested stock options before exercising them, the estimated volatility of its common stock price and the number of options that will be forfeited prior to vesting. The fair value is then recognized on a straight line basis over the requisite service period of the award, which is generally
four
years. Changes in these estimates and assumptions can materially affect the determination of the fair value of the stock-based compensation and consequently, the related amount recognized in the consolidated statement of operations.
Deferred Rent
The Company records rent expense on a straight-line basis over the term of the related lease. The difference between the rent expense recognized for financial reporting purposes and the actual payments made in accordance with the lease agreement is recognized as deferred rent liability included in other liabilities on the Company’s consolidated balance sheets.
Income Taxes
Income taxes are accounted for under the asset and liability method. Under this method, deferred tax assets and liabilities are recognized for the future tax consequences attributable to differences between the financial statement carrying amounts of existing assets and liabilities and their respective tax bases and operating loss and tax credit carryforwards. Deferred tax assets and liabilities are measured using enacted tax rates expected to apply to taxable income in the years in which those temporary differences are expected to be recovered or settled. The effect on deferred tax assets and liabilities of a change in tax rates is recognized in results of operations in the period that the tax change occurs. Valuation allowances are established, when necessary, to reduce deferred tax assets to the amount expected to be realized.
63
LIVEPERSON, INC.
NOTES TO CONSOLIDATED FINANCIAL STATEMENTS
1. Description of Business and Summary of Accounting Policies (Continued)
Comprehensive Loss
In accordance with ASC 220, Comprehensive Income, the Company reports by major components and as a single total, the change in its net assets during the period from non-owner sources. Comprehensive income (loss) consists of net income (loss), and accumulated other comprehensive income (loss), which includes certain changes in equity that are excluded from net income (loss). The Company’s comprehensive loss for all periods presented is related to the effect of foreign currency translation.
Recently Issued Accounting Standards
In January 2017, the Financial Accounting Standards Board (“FASB”) issued Accounting Standards Update No. 2017-04, "Intangibles —Goodwill and Other (Topic 350): Simplifying the Test for Goodwill Impairment" (“ASU 2017-04”). This update addresses concerns over the cost and complexity of the two-step goodwill impairment test. The amendments in this update remove the second step of the test. An entity will apply a one-step quantitative test and record the amount of goodwill impairment as the excess of a reporting unit's carrying amount over its fair value, not to exceed the total amount of goodwill allocated to the reporting unit. The new guidance does not amend the optional qualitative assessment of goodwill impairment. ASU 2017-04 is effective for financial statements issued for annual periods beginning after December 15, 2019, and interim periods within those annual periods. The Company does not expect the adoption of ASU 2017-04 to have a material effect on its financial position, results of operations or cash flows.
In January 2017, the FASB issued Accounting Standards Update No. 2017-01, "Business Combinations (Topic 805): Clarifying the Definition of a Business" (“ASU 2017-01”). This update clarifies the definition of a business with the objective of adding guidance to assist entities with evaluating whether transactions should be accounted for as acquisitions (or disposals) of businesses. The amendments in this update provide a screen to determine when a set is not a business. If the screen is not met, it (1) requires that to be considered a business, a set must include, at a minimum, an input and a substantive process that together significantly contribute to the ability to create output and (2) removes the evaluation of whether a market participant could replace the missing elements. ASU 2017-01 is effective for financial statements issued for annual periods beginning after December 15, 2017, and interim periods within those annual periods. The Company does not expect the adoption of ASU 2017-01 to have a material effect on its financial position, results of operations or cash flows.
In March 2016, the FASB issued Accounting Standards Update No. 2016-09, “Compensation -Stock Compensation (Topic 718): Improvements to Employee Share-Based Payment Accounting” (“ASU 2016-09”). This update is intended to improve the accounting for employee share-based payments and affects all organizations that issue share-based payment awards to their employees. Several aspects of the accounting for share-based payment award transactions are simplified, including:(a) income tax consequences; (b) classification of awards as either equity or liabilities; and(c)classification on the statement of cash flows. ASU 2016-09 is effective for financial statements issued for annual periods beginning after December 15, 2016. The Company does not expect the adoption of ASU 2016-09 to have a material effect on its financial position, results of operations or cash flows.
On February 2016, the FASB issued Accounting Standards Update No. 2016-02, "Leases" ("ASU 2016-02"). ASU 2016-02 requires lessees to recognize the following for all leases (with the exception of short-term leases) at the commencement date: a lease liability, which is a lessee‘s obligation to make lease payments arising from a lease, measured on a discounted basis; and a right-of-use asset, which is an asset that represents the lessee’s right to use, or control the use of, a specified asset for the lease term. Under the new guidance, lessor accounting is largely unchanged. Certain targeted improvements were made to align, where necessary, lessor accounting with the lessee accounting model and Topic 606, Revenue from Contracts with Customers. The new lease guidance also simplified the accounting for sale and leaseback transactions primarily because lessees must recognize lease assets and lease liabilities. Lessees will no longer be provided with a source of off-balance sheet financing. Lessees (for capital and operating leases) and lessors (for sales-type, direct financing, and operating leases) must apply a modified retrospective transition approach for leases existing at, or entered into after, the beginning of the earliest comparative period presented in the financial statements. The modified retrospective approach would not require any transition accounting for leases that expired before the earliest comparative period presented. Lessees and lessors may not apply a full retrospective transition approach. ASU 2016-02 is effective for financial statements issued for annual periods beginning after December 15, 2018. While the Company is currently assessing the impact ASU 2016-02 will have on the consolidated financial statements, the Company expects the primary impact to its consolidated financial position upon adoption will be the recognition, on a discounted basis, of its minimum commitments under non-cancelable operating leases on the consolidated balance sheets resulting in the recording of right of use assets and lease obligations. The Company's current minimum commitments under noncancelable operating leases are disclosed in Note 10.
In May 2014, the FASB issued Accounting Standards Update No. 2014-09, Revenue from Contracts with Customers (“ASU 2014-09”), which supersedes most existing revenue recognition guidance under GAAP. The core principle of ASU 2014-09 is to recognize revenues when promised goods or services are transferred to customers in an amount that reflects the consideration
64
LIVEPERSON, INC.
NOTES TO CONSOLIDATED FINANCIAL STATEMENTS
1. Description of Business and Summary of Accounting Policies (Continued)
to which an entity expects to be entitled for those goods or services. ASU 2014-09 defines a five step process to achieve this core principle and, in doing so, more judgment and estimates may be required within the revenue recognition process than are required under existing GAAP. The standard is effective for annual periods beginning after December 15, 2017, and interim periods therein, using either of the following transition methods: (i) a full retrospective approach reflecting the application of the standard in each prior reporting period with the option to elect certain practical expedients, or (ii) a retrospective approach with the cumulative effect of initially adopting ASU 2014-09 recognized at the date of adoption (which includes additional footnote disclosures). In March 2016, the FASB issued implementation guidance that clarified the considerations in principal versus agent determination. In April 2016, FASB issued guidance that clarified identifying performance obligations and licensing implementation guidance contained in the new revenue recognition standard. In May 2016, FASB issued guidance that addresses narrow-scope improvements to the guidance on collectability, noncash consideration, and completed contracts at transition. In December 2016, FASB issued guidance to make minor corrections or minor improvements to the Codification that are not expected to have a significant effect on current accounting practice or create a significant administrative cost to most entities. The Company's current revenue policy meets five core principles of ASU 2014-09 and the Company currently capitalizes the contract costs over the contracted period also in accordance with ASU 2014-09. The Company is still analyzing the impact of this ASU, but based on the current work to date the Company believes that the current revenue recognition policy currently in place already depicts the transfer of promised goods or services to customers in an amount that reflects the consideration to which the Company expects to be entitled in exchange for those goods or services and as a result the adoption of this ASU is not expected to have a material impact on the Company's financial statements.
2. Net Loss per Share
The Company calculates earnings per share (“EPS”) in accordance with the provisions of ASC 260-10 and the guidance of SEC Staff Accounting Bulletin (“SAB”) No. 98. Under ASC 260-10, basic EPS excludes dilution for common stock equivalents and is computed by dividing net income or loss attributable to common shareholders by the weighted average number of common shares outstanding for the period. All options, warrants or other potentially dilutive instruments issued for nominal consideration are required to be included in the calculation of basic and diluted net income attributable to common stockholders. Diluted EPS is calculated using the treasury stock method and reflects the potential dilution that could occur if securities or other contracts to issue common stock were exercised or converted into common stock and resulted in the issuance of common stock.
Diluted net loss per common share for the year ended
December 31, 2016
does not include the effect of options to purchase
8,956,932
shares of common stock awards as the effect of their inclusion is anti-dilutive. Diluted net income per common share for the year ended
December 31, 2015
does not include the effect of options to purchase
10,345,356
shares of common stock awards as the effect of their inclusion is anti-dilutive. Diluted net income per common share for the year ended
December 31, 2014
does not include the effect of options to purchase
10,769,149
shares of common stock awards as the effect of their inclusion is anti-dilutive.
A reconciliation of shares used in calculating basic and diluted earnings per share follows:
|
Year Ended December 31,
|
||||||||
|
2016
|
2015
|
2014
|
||||||
|
Basic
|
56,063,777
|
|
56,452,408
|
|
54,478,754
|
|
||
|
Effect of assumed exercised options
|
—
|
|
—
|
|
—
|
|
||
|
Diluted
|
56,063,777
|
|
56,452,408
|
|
54,478,754
|
|
||
3. Segment Information
The Company accounts for its segment information in accordance with the provisions of ASC 280-10, “Segment Reporting.” ASC 280-10 establishes annual and interim reporting standards for operating segments of a company. ASC 280-10 requires disclosures of selected segment-related financial information about products, major customers, and geographic areas based on the Company’s internal accounting methods. The Company is organized into
two
operating segments for purposes of making operating decisions and assessing performance. The Business segment facilitates real-time online interactions — chat, voice and content delivery across multiple channels and screens for global corporations of all sizes. The Consumer segment facilitates online transactions between Experts and Users and sells its services to consumers. The chief operating decision-maker evaluates performance, makes operating decisions, and allocates resources based on the operating income of each segment. The reporting segments follow the same accounting polices used in the preparation of the Company’s consolidated financial statements which
65
LIVEPERSON, INC.
NOTES TO CONSOLIDATED FINANCIAL STATEMENTS
3. Segment Information - (Continued)
are described in the summary of significant accounting policies. The Company allocates cost of revenue, sales and marketing and amortization of purchased intangibles to the segments, but it does not allocate product development expenses, general and administrative expenses and income tax expense because management does not use this information to measure performance of the operating segments. There are currently no intersegment sales. Additionally, assets are not available for review by segment and therefore no segment asset disclosure is presented.
Summarized financial information by segment for the year ended
December 31, 2016
, based on the Company’s internal financial reporting system utilized by the Company’s chief operating decision maker, follows (amounts in thousands):
|
Business
|
Consumer
|
Corporate
|
Consolidated
|
||||||||||||
|
Revenue:
|
|||||||||||||||
|
Hosted services – Business
|
$
|
183,551
|
|
$
|
—
|
|
$
|
—
|
|
$
|
183,551
|
|
|||
|
Hosted services – Consumer
|
—
|
|
16,258
|
|
—
|
|
16,258
|
|
|||||||
|
Professional services
|
22,970
|
|
—
|
|
—
|
|
22,970
|
|
|||||||
|
Total revenue
|
206,521
|
|
16,258
|
|
—
|
|
222,779
|
|
|||||||
|
Cost of revenue
|
60,352
|
|
2,809
|
|
—
|
|
63,161
|
|
|||||||
|
Sales and marketing
|
82,063
|
|
7,466
|
|
—
|
|
89,529
|
|
|||||||
|
Amortization of purchased intangibles
|
3,885
|
|
—
|
|
—
|
|
3,885
|
|
|||||||
|
Unallocated corporate expenses
|
—
|
|
—
|
|
85,613
|
|
85,613
|
|
|||||||
|
Operating income (loss)
|
$
|
60,221
|
|
$
|
5,983
|
|
$
|
(85,613
|
)
|
$
|
(19,409
|
)
|
|||
Summarized financial information by segment for the year ended
December 31, 2015
, based on the Company’s internal financial reporting system utilized by the Company’s chief operating decision maker, follows (amounts in thousands):
|
Business
|
Consumer
|
Corporate
|
Consolidated
|
||||||||||||
|
Revenue:
|
|||||||||||||||
|
Hosted services – Business
|
$
|
200,576
|
|
$
|
—
|
|
$
|
—
|
|
$
|
200,576
|
|
|||
|
Hosted services – Consumer
|
—
|
|
15,209
|
|
—
|
|
15,209
|
|
|||||||
|
Professional services
|
23,227
|
|
—
|
|
—
|
|
23,227
|
|
|||||||
|
Total revenue
|
223,803
|
|
15,209
|
|
—
|
|
239,012
|
|
|||||||
|
Cost of revenue
|
67,901
|
|
2,409
|
|
—
|
|
70,310
|
|
|||||||
|
Sales and marketing
|
87,975
|
|
6,753
|
|
—
|
|
94,728
|
|
|||||||
|
Amortization of purchased intangibles
|
4,873
|
|
—
|
|
—
|
|
4,873
|
|
|||||||
|
Unallocated corporate expenses
|
—
|
|
—
|
|
79,529
|
|
79,529
|
|
|||||||
|
Operating income (loss)
|
$
|
63,054
|
|
$
|
6,047
|
|
$
|
(79,529
|
)
|
$
|
(10,428
|
)
|
|||
Summarized financial information by segment for the year ended
December 31, 2014
, based on the Company’s internal financial reporting system utilized by the Company’s chief operating decision maker, follows (amounts in thousands):
|
Business
|
Consumer
|
Corporate
|
Consolidated
|
||||||||||||
|
Revenue:
|
|||||||||||||||
|
Hosted services – Business
|
$
|
172,783
|
|
$
|
—
|
|
$
|
—
|
|
$
|
172,783
|
|
|||
|
Hosted services – Consumer
|
—
|
|
16,629
|
|
—
|
|
16,629
|
|
|||||||
|
Professional services
|
20,519
|
|
—
|
|
—
|
|
20,519
|
|
|||||||
|
Total revenue
|
193,302
|
|
16,629
|
|
—
|
|
209,931
|
|
|||||||
|
Cost of revenue
|
50,192
|
|
2,511
|
|
—
|
|
52,703
|
|
|||||||
|
Sales and marketing
|
77,118
|
|
6,135
|
|
—
|
|
83,253
|
|
|||||||
|
Amortization of purchased intangibles
|
1,621
|
|
—
|
|
|
|
1,621
|
|
|||||||
|
Unallocated corporate expenses
|
—
|
|
—
|
|
77,521
|
|
77,521
|
|
|||||||
|
Operating income (loss)
|
$
|
64,371
|
|
$
|
7,983
|
|
$
|
(77,521
|
)
|
$
|
(5,167
|
)
|
|||
66
LIVEPERSON, INC.
NOTES TO CONSOLIDATED FINANCIAL STATEMENTS
3. Segment Information - (Continued)
Geographic Information
The Company is domiciled in the United States and has international operations in the United Kingdom, Asia-Pacific, Latin America and Western Europe, particularly France and Germany. The following table presents the Company's revenues attributable to domestic and foreign operations for the years ended (amounts in thousands):
|
December 31,
|
|||||||||||
|
2016
|
2015
|
2014
|
|||||||||
|
United States
|
$
|
146,733
|
|
$
|
159,539
|
|
$
|
138,533
|
|
||
|
Other Americas
(1)
|
6,818
|
|
12,296
|
|
10,508
|
|
|||||
|
Total Americas
|
153,551
|
|
171,835
|
|
149,041
|
|
|||||
|
EMEA
(2) (4)
|
50,511
|
|
51,548
|
|
44,506
|
|
|||||
|
APAC
(3)
|
18,717
|
|
15,629
|
|
16,384
|
|
|||||
|
Total revenue
|
$
|
222,779
|
|
$
|
239,012
|
|
$
|
209,931
|
|
||
(1)
Canada, Latin America and South America
(2)
Europe, the Middle East and Africa (“EMEA”)
(3)
Asia-Pacific (“APAC”)
(4)
Includes revenues from the United Kingdom of
$35.3 million
and
$38.2 million
for the twelve months ended December 31, 2016 and 2015, respectively.
The following table presents the Company's long-lived assets by geographic region for the years ended (amounts in thousands):
|
December 31,
|
|||||||
|
2016
|
2015
|
||||||
|
United States
|
$
|
93,845
|
|
$
|
96,362
|
|
|
|
Israel
|
13,940
|
|
16,393
|
|
|||
|
Australia
|
9,496
|
|
8,290
|
|
|||
|
Netherlands
|
7,495
|
|
8,285
|
|
|||
|
Other
(1)
|
2,711
|
|
2,482
|
|
|||
|
Total long-lived assets
|
$
|
127,487
|
|
$
|
131,812
|
|
|
(1)
United Kingdom, Germany, Japan, France, and Italy
4. Property and Equipment
The following table presents the detail of property and equipment for the periods presented (amounts in thousands):
|
December 31,
|
|||||||
|
2016
|
2015
|
||||||
|
Computer equipment and software
|
$
|
82,477
|
|
$
|
67,631
|
|
|
|
Furniture, equipment and building improvements
|
15,027
|
|
13,761
|
|
|||
|
97,504
|
|
81,392
|
|
||||
|
Less: accumulated depreciation
|
(69,107
|
)
|
(57,263
|
)
|
|||
|
Total
|
$
|
28,397
|
|
$
|
24,129
|
|
|
In accordance with its policy, the Company reviews the estimated useful lives of its fixed assets on an ongoing basis. This review indicated that the actual lives of certain co-location assets were longer than the estimated useful lives used for depreciation purposes in the Company's financial statements. As a result, effective August 1, 2016, the Company changed its estimates of the useful lives of its co-location assets to better reflect the estimated periods during which these assets will remain in service. The estimated useful lives of the co-location assets that previously averaged
three
years were increased to an average of
four
years. The effect of this change in estimate was to reduce depreciation expense and net loss for the twelve months ended
67
LIVEPERSON, INC.
NOTES TO CONSOLIDATED FINANCIAL STATMENTS
4. Property and Equipment - (Continued)
December 31, 2016 by
$1.0 million
and decrease basic and diluted loss per share by
$0.02
. Aggregate depreciation expense for property and equipment was
$12.0 million
,
$12.1 million
and
$9.1 million
for the years ended December 31,
2016
,
2015
and
2014
, respectively.
5. Goodwill and Intangible Assets
Goodwill
The changes in the carrying amount of goodwill for the year ended
December 31, 2016
are as follows (amounts in thousands):
|
Business
|
Consumer
|
Total
|
|||||||||
|
Balance as of December 31, 2015
|
$
|
72,298
|
|
$
|
8,024
|
|
$
|
80,322
|
|
||
|
Adjustments to goodwill:
|
|||||||||||
|
Foreign exchange adjustments
|
(77
|
)
|
—
|
|
(77
|
)
|
|||||
|
Balance as of December 31, 2016
|
$
|
72,221
|
|
$
|
8,024
|
|
$
|
80,245
|
|
||
The changes in the carrying amount of goodwill for the year ended
December 31, 2015
are as follows (amounts in thousands):
|
Business
|
Consumer
|
Total
|
|||||||||
|
Balance as of December 31, 2014
|
$
|
72,824
|
|
$
|
8,024
|
|
$
|
80,848
|
|
||
|
Adjustments to goodwill:
|
|||||||||||
|
Foreign exchange adjustments
|
(526
|
)
|
—
|
|
(526
|
)
|
|||||
|
Balance as of December 31, 2015
|
$
|
72,298
|
|
$
|
8,024
|
|
$
|
80,322
|
|
||
The total accumulated goodwill impairment charges are
$23.5 million
through December 31,
2016
.
No
impairment was recognized for the years ended December 31,
2016
,
2015
and 2014.
Intangible Assets
Intangible assets are summarized as follows (see Note 7) (amounts in thousands):
|
|
December 31, 2016
|
||||||||||||
|
|
Gross
Carrying
Amount
|
|
Accumulated
Amortization
|
|
Net Carrying Amount
|
|
Weighted
Average
Amortization
Period
|
||||||
|
Amortizing intangible assets:
|
|
|
|
|
|
|
|
|
|
|
|||
|
Technology
|
$
|
28,018
|
|
$
|
(19,736
|
)
|
|
$
|
8,282
|
|
|
4.7 years
|
|
|
Customer relationships
|
16,009
|
|
(8,857
|
)
|
|
7,152
|
|
|
5.8 years
|
||||
|
Trade names
|
1,295
|
|
(1,277
|
)
|
|
18
|
|
|
2.6 years
|
||||
|
Non-compete agreements
|
1,446
|
|
(1,220
|
)
|
|
226
|
|
|
1.7 years
|
||||
|
Patents
|
1,180
|
|
(376
|
)
|
|
804
|
|
|
11.0 years
|
||||
|
Other
|
263
|
|
(235
|
)
|
|
28
|
|
|
3.0 years
|
||||
|
Total
|
$
|
48,211
|
|
|
$
|
(31,701
|
)
|
|
$
|
16,510
|
|
|
|
68
LIVEPERSON, INC.
NOTES TO CONSOLIDATED FINANCIAL STATEMENTS
5. Goodwill and Intangible Assets - (Continued)
|
December 31, 2015
|
|||||||||||||
|
Gross
Carrying
Amount
|
Accumulated
Amortization
|
Net Carrying Amount
|
Weighted
Average
Amortization
Period
|
||||||||||
|
Amortizing intangible assets:
|
|||||||||||||
|
Technology
|
$
|
28,005
|
|
$
|
(15,723
|
)
|
$
|
12,282
|
|
4.7 years
|
|||
|
Customer relationships
|
16,008
|
|
(6,873
|
)
|
9,135
|
|
5.8 years
|
||||||
|
Trade names
|
1,287
|
|
(1,250
|
)
|
37
|
|
2.6 years
|
||||||
|
Non-compete agreements
|
1,446
|
|
(936
|
)
|
510
|
|
1.7 years
|
||||||
|
Patents
|
3,440
|
|
(848
|
)
|
2,592
|
|
9.3 years
|
||||||
|
Other
|
312
|
|
(249
|
)
|
63
|
|
3.0 years
|
||||||
|
Total
|
$
|
50,498
|
|
$
|
(25,879
|
)
|
$
|
24,619
|
|
|
|||
Amortization expense is calculated over the estimated useful life of the asset. Aggregate amortization expense for intangible assets was $
6.7 million
, $
8.0 million
and $
5.1 million
for the years ended
December 31, 2016
,
2015
and
2014
, respectively. For the years ended
December 31, 2016
,
2015
and
2014
, a portion of this amortization is included in cost of revenue. Estimated amortization expense for the next five years are as follows (amounts in thousands):
|
Estimated Amortization Expense
|
||||
|
2017
|
$
|
4,598
|
|
|
|
2018
|
2,550
|
|
||
|
2019
|
2,343
|
|
||
|
2020
|
2,146
|
|
||
|
2021
|
1,945
|
|
||
|
Thereafter
|
2,928
|
|
||
|
Total
|
$
|
16,510
|
|
|
6. Accrued Liabilities and Other Current Liabilities
The following table presents the detail of accrued liabilities and other current liabilities for the periods presented (amounts in thousands):
|
December 31,
|
|||||||
|
2016
|
2015
|
||||||
|
Payroll and other employee related costs
|
$
|
15,468
|
|
$
|
14,107
|
|
|
|
Professional services, consulting and other vendor fees
|
15,277
|
|
11,745
|
|
|||
|
Unrecognized tax benefits
|
4,240
|
|
3,519
|
|
|||
|
Sales commissions
|
3,312
|
|
4,522
|
|
|||
|
Contingent earn-out (Note 7 and 8)
|
210
|
|
377
|
|
|||
|
Other
|
1,743
|
|
26
|
|
|||
|
Total
|
$
|
40,250
|
|
$
|
34,296
|
|
|
69
LIVEPERSON, INC.
NOTES TO CONSOLIDATED FINANCIAL STATEMENTS
7. Acquisitions
Synchronite LLC
On
June 2, 2014
, the Company acquired Synchronite LLC (“Synchronite”), a German based start-up that provides co-browsing technology. The transaction was accounted for under the purchase method of accounting and, accordingly, the operating results of Synchronite were included in the Company’s consolidated results of operations from the date of acquisition.
The allocation of the total purchase price of approximately
$4.1 million
was based upon the estimated fair value of Synchronite's net tangible and identifiable intangible assets as of the date of acquisition. The total acquisition costs incurred were approximately
$0.4 million
and are included in general and administrative expenses in the Company’s consolidated statements of operations. Of the total purchase price,
$45,000
was allocated to the net book values of the acquired assets and assumed liabilities. The historical carrying amounts of such assets and liabilities approximated their fair values. All receivables acquired are expected to be collectible. The purchase price includes approximately
$2.7 million
of goodwill and approximately
$1.5 million
of intangible assets. The goodwill will be deductible for tax purposes. The intangible assets are being amortized over their expected period of benefit. The purchase price includes
$1.8 million
of potential earn-out consideration for the shareholders if complete product integration is achieved. The earn-out is payable in shares of LivePerson common stock and cash. The Company recorded the contingent earn-out as part of the purchase price. In accordance with ASC 480, the Company has classified this amount as a liability and the amount is included in accrued expenses in the
December 31, 2016
consolidated balance sheet, due to the variable number of shares that will be issued if and when the targets are achieved. During the year ended December 31, 2015, the Company made
$1.6 million
of payments. The ending balance at December 31,
2016
is
$0.2 million
. The Company will continue to assess the earn-out calculation in future periods and any future adjustments will affect operating income.
Contact At Once!, LLC
On
November 7, 2014
, the Company acquired Contact At Once!, LLC (“CAO!”), a software company with a cloud-based platform that instantly connects consumers with businesses through instant messaging, text messaging, chat, social media and video over the internet for consumer-to-business sales conversions. The transaction was accounted for under the purchase method of accounting and, accordingly, the operating results of CAO! were included in the Company’s consolidated results of operations from the date of acquisition.
The allocation of the total purchase price of approximately
$67.0 million
, which includes approximately
$42.8 million
in cash, approximately
$20.0 million
in shares of common stock and approximately
$4.2 million
of potential earn-out consideration in cash, was based upon the estimated fair value of CAO!'s net tangible and identifiable intangible assets as of the date of acquisition. The historical carrying amounts of such assets and liabilities approximated their fair values. All receivables acquired are expected to be collectible. The purchase price included approximately
$45.1 million
of goodwill and approximately
$20.4 million
of intangible assets. The goodwill will be deductible for tax purposes. The intangible assets are being amortized over their expected period of benefit. The purchase price includes
$4.2 million
of potential earn-out consideration for the shareholders if certain targeted financial, strategic and integration objectives is achieved. The earn-out is payable in cash. The Company recorded the contingent earn-out as part of the purchase price. During the year ended December 31, 2015, the Company assessed this earn-out and recorded a
$3.2 million
fair value re-measurement adjustment, which was recorded in loss from operations as a decrease in general and administrative expenses. During the year ended
December 31, 2016
, the Company made cash payments of
$0.2 million
. There is no remaining liability included in accrued expenses relating to this contingent earn-out as of
December 31, 2016
.
8. Fair Value Measurements
The Company measures its cash equivalents at fair value based on an expected exit price as defined by the authoritative guidance on fair value measurements, which represents the amount that would be received on the sale of an asset or paid to transfer a liability, as the case may be, in an orderly transaction between market participants. As such, fair value may be based on assumptions that market participants would use in pricing an asset or liability. The authoritative guidance on fair value measurements establishes a consistent framework for measuring fair value on either a recurring or nonrecurring basis whereby inputs, used in valuation techniques, are assigned a hierarchical level. The following are the hierarchical levels of inputs to measure fair value:
|
•
|
Level 1: Observable inputs that reflect quoted prices (unadjusted) for identical assets or liabilities in active markets.
|
|
•
|
Level 2: Inputs reflect: quoted prices for identical assets or liabilities in markets that are not active; quoted prices for similar assets or liabilities in active markets; inputs other than quoted prices that are observable for the assets
|
70
LIVEPERSON, INC.
NOTES TO CONSOLIDATED FINANCIAL STATEMENTS
8. Fair Value Measurements - (continued)
or liabilities; or inputs that are derived principally from or corroborated by observable market data by correlation or other means.
|
•
|
Level 3: Unobservable inputs reflecting the Company’s assumptions incorporated in valuation techniques used to determine fair value. These assumptions are required to be consistent with market participant assumptions that are reasonably available.
|
Financial Assets and Liabilities
The carrying amount of cash, accounts receivable, and accounts payable approximate their fair value due to their short-term nature. The Company's assets and liabilities that are measured at fair value on a recurring basis, by level, within the fair value hierarchy as of
December 31, 2016
and
December 31, 2015
, are summarized as follows (amounts in thousands). The Company’s restricted cash balance of
$4.0 million
at
December 31, 2016
and
$5.4 million
at December 31,
2015
is not held in a money market account and is not included in the following table.
|
December 31, 2016
|
December 31, 2015
|
||||||||||||||||||||||||||||||
|
Level 1
|
Level 2
|
Level 3
|
Total
|
Level 1
|
Level 2
|
Level 3
|
Total
|
||||||||||||||||||||||||
|
Assets:
|
|||||||||||||||||||||||||||||||
|
Cash equivalents:
|
|||||||||||||||||||||||||||||||
|
Money market funds
|
$
|
3,076
|
|
$
|
—
|
|
$
|
—
|
|
$
|
3,076
|
|
$
|
4,059
|
|
$
|
—
|
|
$
|
—
|
|
$
|
4,059
|
|
|||||||
|
Foreign currency derivative contracts
|
—
|
|
108
|
|
—
|
|
108
|
|
—
|
|
102
|
|
—
|
|
102
|
|
|||||||||||||||
|
Total assets
|
$
|
3,076
|
|
$
|
108
|
|
$
|
—
|
|
$
|
3,184
|
|
$
|
4,059
|
|
$
|
102
|
|
$
|
—
|
|
$
|
4,161
|
|
|||||||
|
Liabilities:
|
|||||||||||||||||||||||||||||||
|
Contingent earn-out
|
$
|
—
|
|
$
|
—
|
|
$
|
210
|
|
$
|
210
|
|
$
|
—
|
|
$
|
—
|
|
$
|
377
|
|
$
|
377
|
|
|||||||
|
Foreign currency derivative contracts
|
—
|
|
66
|
|
—
|
|
66
|
|
—
|
|
310
|
|
—
|
|
310
|
|
|||||||||||||||
|
Total liabilities
|
$
|
—
|
|
$
|
66
|
|
$
|
210
|
|
$
|
276
|
|
$
|
—
|
|
$
|
310
|
|
$
|
377
|
|
$
|
687
|
|
|||||||
In determining fair value, the Company utilizes valuation techniques that maximize the use of observable inputs and minimize the use of unobservable inputs to the extent possible as well as considers counterparty credit risk in its assessment of fair value. Observable or market inputs reflect market data obtained from independent sources, while unobservable inputs reflect the Company's assumptions based on the best information available.
The Company's money market funds are measured at fair value on a recurring basis based on quoted market prices in active markets and are classified as level 1 within the fair value hierarchy. The Company's contingent earn-out liability and foreign currency derivative contracts are measured at fair value on a recurring basis and are classified as level 3 and level 2, respectively, within the fair value hierarchy. On a nonrecurring basis, the Company uses fair value measures when analyzing asset impairment. Long-lived tangible assets are reviewed for impairment whenever events or changes in circumstances indicate that the carrying amount of an asset may not be recoverable. If it is determined such indicators are present and the review indicates that the assets will not be fully recoverable, based on undiscounted estimated cash flows over the remaining amortization periods, their carrying values are reduced to estimated fair value. The Company uses an income approach and inputs that constitute level 3. During the third quarter of each year, the Company evaluates goodwill for impairment at the reporting unit level. The Company uses qualitative factors in accordance with ASU No. 2011-08 to determine whether it is "more likely than not" that the fair value of a reporting unit is less than its carrying amount as a basis for determining whether it is necessary to perform the two-step goodwill impairment test. This measurement is classified based on level 3 input.
During the twelve months ended
December 31, 2015
, the contingent earn-out decreased by
$4.1 million
in connection with the acquisition of CAO! due to both re-measurement to fair value of
$3.2 million
and cash payments of
$0.9 million
. The contingent earnout was also decreased by
$0.9 million
in connection with the Engage acquisition and by
$1.6 million
in connection with the acquisition of Synchronite due to both re-measurement to fair value and cash payments. During the twelve months ended
December 31, 2016
, the contingent earnout was decreased by
$0.2 million
in connection with the acquisition of CAO! due to cash payments. The contingent earn-out amounts are recorded in accrued expense on the consolidated balance sheets as they are payable in
2017
. The contingent earn-out relating to Engage was based on the potential earn-out consideration if certain revenue targets are achieved. There was no remaining contingent earn-out in connection with the acquisition of Engage as of
December 31, 2016
. The contingent earn-out relating to Synchronite is based on the fulfillment of a complete product integration and a minimum number of “Co-Browse” interactions per month. There was
$0.2 million
of contingent earn-out remaining in connection with the
71
LIVEPERSON, INC.
NOTES TO CONSOLIDATED FINANCIAL STATEMENTS
8. Fair Value Measurements - (continued)
acquisition of Synchronite as of
December 31, 2016
. There was
no
remaining contingent earn-out in connection with the acquisition of CAO! as of
December 31, 2016
.
The changes in fair value of the Level 3 liabilities are as follows (amounts in thousands):
|
Contingent Earn-Out
|
|||||||
|
December 31,
|
|||||||
|
2016
|
2015
|
||||||
|
Balance, Beginning of year
|
$
|
377
|
|
$
|
6,940
|
|
|
|
Cash payment
|
(167
|
)
|
(2,883
|
)
|
|||
|
Changes in fair value
|
—
|
|
(3,680
|
)
|
|||
|
Balance, End of year
|
$
|
210
|
|
$
|
377
|
|
|
Derivative Financial Instruments
The Company is exposed to foreign exchange risks that are managed in part by using derivative financial instruments. Beginning in
January 2015
, the Company entered into foreign currency forward contracts related to risks associated with foreign operations. The Company does not use derivatives for trading purposes and at
December 31, 2016
has no derivatives that are designated as fair value hedges. Derivatives are recorded at their estimated fair values based upon Level 2 inputs. Derivatives designated and effective as cash flow hedges are reported as a component of other comprehensive income and reclassified to earnings in the same periods in which the hedged transactions impact earnings. Gains and losses related to derivatives not meeting the requirements of hedge accounting and the portion of derivatives related to hedge ineffectiveness are recognized in current earnings.
In accordance with the foreign currency forward contracts, the Company was required to pledge cash as collateral security to be maintained at the bank. The collateral shall remain in control of the lender, and these funds can be used to satisfy the outstanding obligation. Accordingly, the Company had cash at the bank of approximately $
4.0 million
at
December 31, 2016
and is recorded as cash held as collateral in current assets.
The following summarizes certain information regarding the Company’s outstanding foreign currency derivative contracts related primarily to intercompany receivables and payables for the periods presented (in thousands):
|
As of December 31, 2016
|
As of December 31, 2015
|
||||||
|
Notional amount of foreign currency derivative contracts
|
$
|
44,438
|
|
$
|
43,431
|
|
|
|
Fair value of foreign currency derivatives contracts
|
42
|
|
(208
|
)
|
|||
The fair value of the Company’s derivative instruments is summarized below (in thousands):
|
Fair Value of Derivative Instruments
|
||||||||
|
Balance Sheet Location
|
As of December 31, 2016
|
As of December 31, 2015
|
||||||
|
Derivative Assets
|
||||||||
|
Derivatives not designated as hedging instruments:
|
||||||||
|
Foreign currency derivatives
contracts
|
Prepaid expenses and other current assets
|
$
|
108
|
|
102
|
|
||
|
Derivative Liabilities
|
||||||||
|
Derivatives not designated as hedging instruments:
|
||||||||
|
Foreign currency derivatives
contracts |
Accrued expenses and other liabilities
|
$
|
66
|
|
310
|
|
||
The following summarizes certain information regarding the Company’s derivatives that are not designated or are not effective as hedges (in thousands):
72
LIVEPERSON, INC.
NOTES TO CONSOLIDATED FINANCIAL STATEMENTS
8. Fair Value Measurements - (continued)
|
Gain (losses) on Derivative Instruments Recognized in Income Statement
|
||||||||
|
Income Statement Location
|
December 31, 2016
|
December 31, 2015
|
||||||
|
Foreign currency derivatives contracts
|
Other (Expense) Income, net
|
$
|
73
|
|
(54
|
)
|
||
9. Investments
In
February 2014
, the Company purchased technology licenses and consulting services at fair value from a company in the amount of
$3.5 million
. The Company received access to this company's patents as well as certain consulting services. During the year ended
December 31, 2014
, the Company allocated approximately
$2.8 million
to intangible assets, which is being amortized over the life of the patents. The remaining amount was allocated to other assets. During the year ended December 31, 2016, the Company determined the investment was impaired and wrote off approximately
$0.6 million
that was allocated to other assets and
$2.0 million
that represented remaining net book value in intangible assets.
10. Commitments and Contingencies
Contractual Obligations
The Company leases facilities and certain equipment under agreements accounted for as operating leases. These leases generally require the Company to pay all executory costs such as maintenance and insurance. Rental expense for operating leases for the years ended
December 31, 2016
,
2015
and
2014
was approximately
$10.0 million
,
$9.9 million
and
$9.5 million
, respectively.
Future minimum lease payments under non-cancellable operating leases (with an initial or remaining lease terms in excess of one year) are as follows (amounts in thousands):
|
Year Ending December 31,
|
Operating
Leases
|
|||
|
2017
|
$
|
8,889
|
|
|
|
2018
|
8,239
|
|
||
|
2019
|
5,714
|
|
||
|
2020
|
1,656
|
|
||
|
2021
|
1,258
|
|
||
|
Thereafter
|
2,818
|
|
||
|
Total minimum lease payments
|
$
|
28,574
|
|
|
Employee Benefit Plans
The Company has a 401(k) defined contribution plan covering all eligible employees. The Company provides for employer matching contributions equal to
50%
of employee contributions, up to the lesser of
5%
of eligible compensation or
$6,000
. Matching contributions are deposited in to the employees 401(k) account and are subject to
5
year graded vesting. Salaries and related expenses include
$1.3 million
,
$1.3 million
and
$0.9 million
of employer matching contributions for the years ended
December 31, 2016
,
2015
and
2014
, respectively.
Indemnifications
The Company enters into service and license agreements in its ordinary course of business. Pursuant to some of these agreements, the Company agrees to indemnify certain customers from and against certain types of claims and losses suffered or incurred by them as a result of using the Company’s products.
The Company also has agreements whereby its executive officers and directors are indemnified for certain events or occurrences while the officer or director is, or was serving, at the Company’s request in such capacity. The maximum potential amount of future payments the Company could be required to make under these indemnification agreements is unlimited; however, the Company has a directors and officers insurance policy that reduces its exposure and enables the Company to recover a portion of any future amounts paid. As a result of its insurance policy coverage, the Company believes the estimated fair value of these indemnification agreements is minimal. Currently, the Company has no liabilities recorded for these agreements as of
December 31, 2016
.
73
LIVEPERSON, INC.
NOTES TO CONSOLIDATED FINANCIAL STATEMENTS
11. Stockholders' Equity
Common Stock
At
December 31, 2016
, there were
100,000,000
shares of common stock authorized, and
58,276,447
shares issued and outstanding. As of
December 31, 2015
, there were
100,000,000
shares of common stock authorized, and
57,374,907
shares issued and outstanding. The par value for common shares is $
0.001
.
Preferred Stock
As of
December 31, 2016
and
2015
, there were
5,000,000
shares of preferred stock authorized, and zero shares issued and outstanding. The par value for preferred shares is $
0.001
.
Stock Repurchase Program
On December 10, 2012, the Company’s Board of Directors approved a stock repurchase program through June 30, 2014. Under the stock repurchase program, the Company is authorized to repurchase shares of its common stock, in the open market or privately negotiated transactions, at times and prices considered appropriate by the Board of Directors depending upon prevailing market conditions and other corporate considerations. On March 13, 2014, the Company's Board of Directors increased the aggregate purchase price of the stock repurchase program from $
30.0 million
to $
40.0 million
. On July 23, 2014, the Company's Board of Directors increased the aggregate purchase price of the stock repurchase program from $
40.0 million
to
$50.0 million
. On February 16, 2016, the Company's Board of Directors increased the aggregate purchase price of the total stock repurchase program by an additional
$14.0 million
. On November 21, 2016, the Company's Board of Directors increased the aggregate purchase price of the stock repurchase program from
$64.0 million
to
$74.0 million
and extended the expiration date of the program out to December 31, 2017. There were
1,518,349
shares repurchased under this program during 2016 which were recorded in treasury stock at par on the consolidated balance sheets as of December 31, 2016. As of December 31, 2016, approximately
$20.1 million
remained available for purchase under the program.
Stock-Based Compensation
The Company follows FASB ASC 718-10, “Stock Compensation,” which addresses the accounting for transactions in which an entity exchanges its equity instruments for goods or services, with a primary focus on transactions in which an entity obtains employee services in share-based payment transactions. ASC 718-10 requires measurement of the cost of employee services received in exchange for an award of equity instruments based on the grant-date fair value of the award (with limited exceptions). Incremental compensation costs arising from subsequent modifications of awards after the grant date must be recognized.
The per share weighted average fair value of stock options granted during the years ended
December 31, 2016
,
2015
and
2014
was $
3.10
, $
4.45
, and $
5.15
, respectively. The fair value of each option grant is estimated on the date of grant using the Black-Scholes option-pricing model with the following weighted average assumptions for the years ended
December 31, 2016
,
2015
and
2014
:
|
December 31,
|
|||||
|
2016
|
2015
|
2014
|
|||
|
Dividend yield
|
—%
|
—%
|
—%
|
||
|
Risk-free interest rate
|
1.0% – 1.8%
|
1.3% – 1.7%
|
1.5% – 1.7%
|
||
|
Expected life (in years)
|
5.0
|
5.0
|
5.0
|
||
|
Historical volatility
|
46.8% – 48.2%
|
47.4% – 49.7%
|
49.6% – 53.7%
|
||
A description of the methods used in the significant assumptions used to estimate the fair value of stock-based-based compensation awards follows:
Dividend yield –
The Company uses
0%
as it has never issued dividends and does not anticipate issuing dividends in the near term.
Risk-free interest rate –
The Company uses the market yield on U.S. Treasury securities at
five
years with constant maturity, representing the current expected life of stock options in years.
Expected life –
The Company uses historical data to estimate the expected life of a stock option.
Historical volatility –
The Company uses a trailing
five
year from grant date to determine volatility.
74
LIVEPERSON, INC.
NOTES TO CONSOLIDATED FINANCIAL STATEMENTS
11. Stockholders' Equity - (continued)
Stock Option Plans
During 1998, the Company established the Stock Option and Restricted Stock Purchase Plan (the “1998 Plan”). Under the 1998 Plan, the Board of Directors could issue incentive stock options or nonqualified stock options to purchase up to
5,850,000
shares of common stock. The 2000 Stock Incentive Plan (the “2000 Plan”) succeeded the 1998 Plan. Under the 2000 Plan, the options which had been outstanding under the 1998 Plan were incorporated in the 2000 Plan increasing the number of shares available for issuance under the plan by approximately
4,150,000
, thereby reserving for issuance
10,000,000
shares of common stock in the aggregate.
The Company established the 2009 Stock Incentive Plan (as amended and restated, the “2009 Plan”) as a successor to the 2000 Plan. Under the 2009 Plan, the options which had been outstanding under the 2000 Plan were incorporated into the 2009 Plan and the Company increased the number of shares available for issuance under the plan by
6,000,000
. The Company amended the 2009 Stock Incentive Plan (the “Amended 2009 Plan”) effective June 7, 2012. The Amended 2009 Plan increased the number of shares authorized for issuance under the plan by an additional
4,250,000
, thereby reserving for issuance
23,817,744
shares of common stock in the aggregate. Options to acquire common stock granted thereunder have
10
-year terms. As of
December 31, 2016
, approximately
2.4 million
shares of common stock were reserved for issuance under the 2009 Plan (taking into account all option exercises through
December 31, 2016
).
Employee Stock Purchase Plan
In June 2010, our stockholders approved the 2010 Employee Stock Purchase Plan with
1,000,000
shares of common stock initially reserved for issuance. As of
December 31, 2016
, approximately
197,000
shares of common stock were reserved for issuance under the Employee Stock Purchase Plan (taking into account all share purchases through
December 31, 2016
).
Stock Option Activity
A summary of the Company’s stock option activity and weighted average exercise prices follows:
|
Stock Option Activity
|
Weighted Average Remaining Contractual Term (in years)
|
Aggregate Intrinsic Value (in thousands)
|
||||||||||
|
Options (in thousands)
|
Weighted
Average Exercise Price |
|||||||||||
|
Balance outstanding at December 31, 2013
|
9,724
|
|
$
|
10.86
|
|
|||||||
|
Granted
|
3,827
|
|
11.04
|
|
||||||||
|
Exercised
|
(1,098
|
)
|
7.10
|
|
||||||||
|
Cancelled or expired
|
(1,684
|
)
|
12.70
|
|
||||||||
|
Balance outstanding at December 31, 2014
|
10,769
|
|
$
|
10.95
|
|
7.01
|
$
|
38,752
|
|
|||
|
Options vested and expected to vest
|
9,043
|
|
$
|
10.89
|
|
6.69
|
$
|
33,566
|
|
|||
|
Options exercisable at December 31, 2014
|
4,737
|
|
$
|
10.01
|
|
5.28
|
$
|
22,083
|
|
|||
|
Balance outstanding at December 31, 2014
|
10,769
|
|
$
|
10.95
|
|
|||||||
|
Granted
|
857
|
|
10.06
|
|
||||||||
|
Exercised
|
(646
|
)
|
4.41
|
|
||||||||
|
Cancelled or expired
|
(1,837
|
)
|
12.22
|
|
||||||||
|
Balance outstanding at December 31, 2015
|
9,144
|
|
$
|
11.05
|
|
6.66
|
$
|
2,117
|
|
|||
|
Options vested and expected to vest
|
8,356
|
|
$
|
11.08
|
|
6.49
|
$
|
2,117
|
|
|||
|
Options exercisable at December 31, 2015
|
5,401
|
|
$
|
10.95
|
|
5.60
|
$
|
2,117
|
|
|||
|
Balance outstanding at December 31, 2015
|
9,144
|
|
$
|
11.05
|
|
|||||||
|
Granted
|
635
|
|
7.32
|
|
||||||||
|
Exercised
|
(325
|
)
|
5.66
|
|
||||||||
|
Cancelled or expired
|
(1,685
|
)
|
11.49
|
|
||||||||
|
Balance outstanding at December 31, 2016
|
7,769
|
|
$
|
10.88
|
|
6.05
|
$
|
2,641
|
|
|||
|
Options vested and expected to vest
|
7,348
|
|
$
|
11.00
|
|
5.90
|
$
|
2,529
|
|
|||
|
Options exercisable at December 31, 2016
|
5,580
|
|
$
|
11.31
|
|
5.27
|
$
|
2,347
|
|
|||
75
LIVEPERSON, INC.
NOTES TO CONSOLIDATED FINANCIAL STATEMENTS
11. Stockholders' Equity - (continued)
The total fair value of stock options exercised during the years ended
December 31, 2016
and
2015
was approximately
$1.1 million
and
$1.7 million
, respectively. As of
December 31, 2016
, there was approximately
$7.1 million
of total unrecognized compensation cost related to nonvested share-based compensation arrangements. That cost is expected to be recognized over a weighted average period of approximately
1.9
years.
The following table summarizes information about outstanding and vested stock options as of
December 31, 2016
:
|
Options Outstanding
|
Options Exercisable
|
|||||||||||||||
|
Range of Exercise Prices
|
Number of Shares Outstanding (in thousands)
|
Weighted-Average Remaining Contractual Life (Years)
|
Weighted-Average Exercise Price
|
Number of Shares (in thousands)
|
Weighted-Average Exercise Price
|
|||||||||||
|
$1.79 - $7.02
|
1,006
|
|
3.55
|
$
|
5.04
|
|
839
|
|
$
|
4.79
|
|
|||||
|
$7.04 - $9.24
|
1,340
|
|
7.31
|
8.51
|
|
717
|
|
8.93
|
|
|||||||
|
$9.34 - $10.05
|
864
|
|
7.50
|
9.79
|
|
559
|
|
9.77
|
|
|||||||
|
$10.13 - $10.13
|
977
|
|
7.15
|
10.13
|
|
500
|
|
10.13
|
|
|||||||
|
$10.31 - $12.32
|
891
|
|
5.51
|
11.21
|
|
654
|
|
11.46
|
|
|||||||
|
$12.46 - $13.28
|
1,115
|
|
5.13
|
13.11
|
|
969
|
|
13.11
|
|
|||||||
|
$13.34 - $16.98
|
1,205
|
|
6.23
|
15.27
|
|
971
|
|
15.70
|
|
|||||||
|
$17.88 - $17.88
|
60
|
|
5.43
|
17.88
|
|
60
|
|
17.88
|
|
|||||||
|
$18.09 - $18.09
|
306
|
|
5.57
|
18.09
|
|
306
|
|
18.09
|
|
|||||||
|
$18.24 - $18.24
|
5
|
|
5.58
|
18.24
|
|
5
|
|
18.24
|
|
|||||||
|
7,769
|
|
6.05
|
$
|
10.88
|
|
5,580
|
|
$
|
11.31
|
|
||||||
Restricted Stock Unit Activity
A summary of the Company’s restricted stock units (“RSUs”) activity and weighted average exercise prices follows:
|
Restricted Stock Unit Activity
|
||||||||||
|
Number of Shares (in thousands)
|
Weighted Average
Grant Date Fair Value (Per Share)
|
Aggregate Fair Value (in thousands)
|
||||||||
|
Balance outstanding at December 31, 2014
|
—
|
|
$
|
—
|
|
$
|
—
|
|
||
|
Awarded
|
1,257
|
|
10.31
|
|
—
|
|
||||
|
Released
|
—
|
|
—
|
|
—
|
|
||||
|
Forfeited
|
(55
|
)
|
10.31
|
|
8,110
|
|
||||
|
Non-vested and outstanding at December 31, 2015
|
1,202
|
|
$
|
10.31
|
|
$
|
6,220
|
|
||
|
Balance outstanding at December 31, 2015
|
1,202
|
|
$
|
10.31
|
|
$
|
6,220
|
|
||
|
Awarded
|
571
|
|
6.32
|
|
—
|
|
||||
|
Released
|
(394
|
)
|
10.31
|
|
—
|
|
||||
|
Forfeited
|
(191
|
)
|
10.01
|
|
—
|
|
||||
|
Non-vested and outstanding at December 31, 2016
|
1,188
|
|
$
|
8.44
|
|
$
|
8,968
|
|
||
|
Expected to vest
|
903
|
|
$
|
8.76
|
|
$
|
6,817
|
|
||
RSUs granted to employees generally vest over a
four
-year period. As of
December 31, 2016
, total unrecognized compensation cost, adjusted for estimated forfeitures, related to nonvested RSUs was approximately $
9.3 million
and the weighted-average remaining vesting period was
2.8
years.
76
LIVEPERSON, INC.
NOTES TO CONSOLIDATED FINANCIAL STATEMENTS
12. Income Taxes
Income taxes are accounted for under the asset and liability method. Under this method, deferred tax assets and liabilities are recognized for the future tax consequences attributable to differences between the financial statement carrying amounts of existing assets and liabilities and their respective tax bases and operating loss and tax credit carryforwards. Deferred tax assets and liabilities are measured using enacted tax rates expected to apply to taxable income in the years in which those temporary differences are expected to be recovered or settled. In assessing the realizability of deferred tax assets, management considers whether it is more likely than not that some portion or all of the deferred tax assets will be realized. The ultimate realization of deferred tax assets is dependent upon the generation of future taxable income during the periods in which those temporary differences are expected to become deductible. Management considers the scheduled reversal of deferred tax liabilities, projected future taxable income and tax planning strategies in making this assessment. The Company includes interest accrued on the underpayment of income taxes in interest expense and penalties, if any, related to unrecognized tax benefits in general and administrative expenses. The Company recorded a valuation allowance against its U.S. deferred tax asset as it considered its cumulative loss in recent years as a significant piece of negative evidence. Since valuation allowances are evaluated on a jurisdiction by jurisdiction basis, we believe that the deferred tax assets related to LivePerson UK, Engage Australia, Kasamba Israel and LivePerson LTD Israel are “more likely than not” to be realized as these jurisdictions have positive cumulative pre-tax book income after adjusting for permanent and onetime items. During the year ended December 31,
2016
, the valuation recorded was
$12.1 million
.
Under Section 382 of the Internal Revenue Code of 1986, as amended, the Company’s use of its federal net operating loss (“NOL”) carryforwards may be limited if the Company experiences an ownership change, as defined in Section 382. Such an annual limitation could result in the expiration of the net operating loss carryforwards before utilization. As of
December 31, 2016
, the Company had approximately
$16.6 million
of federal NOL carryforwards available to offset future taxable income. Included in this amount is
$5.1 million
of federal NOL carryovers from the Company’s acquisition of Proficient. These carryforwards expire in various years through 2027.
The domestic and foreign components of loss before provision for income taxes consist of the following (amounts in thousands):
|
Year Ended December 31,
|
|||||||||||
|
2016
|
2015
|
2014
|
|||||||||
|
United States
|
$
|
(40,774
|
)
|
$
|
(16,362
|
)
|
$
|
(12,933
|
)
|
||
|
Israel
|
15,622
|
|
2,257
|
|
4,614
|
|
|||||
|
United Kingdom
|
2,345
|
|
1,564
|
|
1,612
|
|
|||||
|
Netherlands
|
3,104
|
|
1,919
|
|
1,462
|
|
|||||
|
Australia
|
(2,774
|
)
|
(565
|
)
|
(513
|
)
|
|||||
|
Germany
|
2,085
|
|
327
|
|
172
|
|
|||||
|
Other
(1)
|
453
|
|
230
|
|
97
|
|
|||||
|
$
|
(19,939
|
)
|
$
|
(10,630
|
)
|
$
|
(5,489
|
)
|
|||
|
(1)
Includes Japan, Italy, and France
|
|||||||||||
No additional provision has been made for U.S. income taxes on the undistributed earnings of its Israeli subsidiary, LivePerson Ltd. (formerly HumanClick Ltd.), as such earnings have been taxed in the U.S. and accumulated earnings of the Company’s other foreign subsidiaries are immaterial through
December 31, 2016
.
77
LIVEPERSON, INC.
NOTES TO CONSOLIDATED FINANCIAL STATEMENTS
12. Income Taxes - (continued)
The provision for income taxes consists of the following (amounts in thousands):
|
Year Ended December 31,
|
|||||||||||
|
2016
|
2015
|
2014
|
|||||||||
|
Current income taxes:
|
|||||||||||
|
U.S. Federal
|
$
|
1,829
|
|
$
|
(524
|
)
|
$
|
155
|
|
||
|
State and local
|
27
|
|
309
|
|
186
|
|
|||||
|
Foreign
|
2,226
|
|
1,573
|
|
3,254
|
|
|||||
|
Total current income taxes
|
4,082
|
|
1,358
|
|
3,595
|
|
|||||
|
Deferred income taxes:
|
|||||||||||
|
U.S. Federal
|
841
|
|
13,791
|
|
(1,194
|
)
|
|||||
|
State and local
|
99
|
|
876
|
|
41
|
|
|||||
|
Foreign
|
912
|
|
(211
|
)
|
(583
|
)
|
|||||
|
Total deferred income taxes
|
1,852
|
|
14,456
|
|
(1,736
|
)
|
|||||
|
Total provision for income taxes
|
$
|
5,934
|
|
$
|
15,814
|
|
$
|
1,859
|
|
||
The difference between the total income taxes computed at the federal statutory rate and the provision for income taxes consists of the following:
|
Year Ended December 31,
|
||||||||
|
2016
|
2015
|
2014
|
||||||
|
Federal Statutory Rate
|
34.00
|
%
|
34.00
|
%
|
34.00
|
%
|
||
|
State taxes, net of federal benefit
|
3.24
|
%
|
0.35
|
%
|
(2.74
|
)%
|
||
|
Non-deductible expenses – ISO
|
(1.85
|
)%
|
(8.57
|
)%
|
(14.68
|
)%
|
||
|
Non-deductible expenses – Other
|
(0.88
|
)%
|
(2.20
|
)%
|
(4.17
|
)%
|
||
|
Foreign tax rate differential
|
0.89
|
%
|
(12.41
|
)%
|
(46.50
|
)%
|
||
|
Change in valuation allowance
|
(53.55
|
)%
|
(148.24
|
)%
|
—
|
%
|
||
|
Return to provision true-up adjustment
|
(9.22
|
)%
|
—
|
%
|
—
|
%
|
||
|
Other
|
(2.42
|
)%
|
(11.15
|
)%
|
0.23
|
%
|
||
|
Total provision for income taxes
|
(29.79
|
)%
|
(148.22
|
)%
|
(33.86
|
)%
|
||
78
LIVEPERSON, INC.
NOTES TO CONSOLIDATED FINANCIAL STATEMENTS
12. Income Taxes - (continued)
The effects of temporary differences and tax loss carryforwards that give rise to significant portions of federal deferred tax assets and deferred tax liabilities at
December 31, 2016
and
2015
are presented below (amounts in thousands):
|
Year Ended December 31,
|
|||||||
|
2016
|
2015
|
||||||
|
Deferred tax assets:
|
|||||||
|
Net operating loss carryforwards
|
$
|
6,186
|
|
$
|
2,243
|
|
|
|
Accounts payable and accrued expenses
|
4,906
|
|
5,017
|
|
|||
|
Non-cash compensation
|
12,541
|
|
10,034
|
|
|||
|
Intangibles amortization
|
6,151
|
|
3,826
|
|
|||
|
Allowance for doubtful accounts
|
447
|
|
274
|
|
|||
|
Intangibles related to acquisitions
|
118
|
|
—
|
|
|||
|
Total deferred tax assets
|
30,349
|
|
21,394
|
|
|||
|
Less valuation allowance
|
(27,881
|
)
|
(15,820
|
)
|
|||
|
Deferred tax assets, net of valuation allowance
|
2,468
|
|
5,574
|
|
|||
|
Deferred tax liabilities:
|
|||||||
|
Plant and equipment
|
(1,695
|
)
|
(2,973
|
)
|
|||
|
Intangibles related to acquisitions
|
—
|
|
(1,361
|
)
|
|||
|
Goodwill amortization and contingent earn-out adjustments
|
(3,332
|
)
|
(2,359
|
)
|
|||
|
Total deferred tax liabilities
|
(5,027
|
)
|
(6,693
|
)
|
|||
|
Net deferred (liabilities)/assets
|
$
|
(2,559
|
)
|
$
|
(1,119
|
)
|
|
ASC Topic 740-10 clarifies the accounting for uncertainty in income taxes recognized in the financial statements in accordance with other provisions contained within this guidance. This topic prescribes a recognition threshold and a measurement attribute for the financial statement recognition and measurement of tax positions taken or expected to be taken in a tax return. For those benefits to be recognized, a tax position must be more likely than not to be sustained upon examination by the taxing authorities. The amount recognized is measured as the largest amount of benefit that is greater than
50%
likely of being realized upon ultimate audit settlement. The Company had unrecognized tax benefits of
$4.2 million
and
$3.5 million
as of
December 31, 2016
and
2015
, respectively.
A reconciliation of the beginning and ending amount of unrecognized tax benefits is as follows (in thousands):
|
Year Ended December 31,
|
|||||||
|
2016
|
2015
|
||||||
|
Unrecognized tax benefits balance at January 1
|
$
|
3,519
|
|
$
|
2,320
|
|
|
|
Gross increase for tax positions of prior years
|
200
|
|
—
|
|
|||
|
Gross increase for tax positions of current years
|
700
|
|
1,199
|
|
|||
|
Decrease due to expiration of statue
|
(179
|
)
|
—
|
|
|||
|
Gross unrecognized tax benefits at December 31
|
$
|
4,240
|
|
$
|
3,519
|
|
|
The tax years subject to examination by major tax jurisdictions include the years
2011
and forward for U.S states and New York City, the years
2012
and forward for U.S. Federal, and the years
2012
and forward for certain foreign jurisdictions.
13. Legal Matters
The Company previously filed an intellectual property suit against [24]7 Customer, Inc. in the Southern District of New York on
March 6, 2014
seeking damages on the grounds that [24]7 reverse engineered and misappropriated the Company's technology to develop competing products and misused the Company's business information. Discovery in the New York case is in process. On
June 22, 2015
, [24]7 Customer, Inc. filed suit against the Company in the Northern District of California alleging patent infringement. On
December 7, 2015
, [24]7 Customer Inc. filed a second patent infringement suit against the Company, also in the Northern District of California. On
January 5, 2016
, the two California cases were consolidated for all pre-trial purposes. On March 9, 2017, the Court for the Southern District of New York in the Company's case against [24]7 granted the parties’ joint request to voluntarily transfer the Southern District of New York case to the Northern District of California for consolidation with
79
LIVEPERSON, INC.
NOTES TO CONSOLIDATED FINANCIAL STATEMENTS
13. Legal Matters - (Continued)
the referenced California cases. The Company believes the claims filed by [24]7 Customer Inc. are entirely without merit and intends to defend them vigorously.
The Company routinely assesses all of its litigation and threatened litigation as to the probability of ultimately incurring a liability, and records its best estimate of the ultimate loss in situations where the Company assesses the likelihood of loss as probable.
From time to time, the Company is involved in or subject to legal, administrative and regulatory proceedings, claims, demands and investigations arising in the ordinary course of business, including direct claims brought by or against the Company with respect to intellectual property, contracts, employment and other matters, as well as claims brought against the Company’s customers for whom the Company has a contractual indemnification obligation. The Company accrues for a liability when it is both probable that a liability has been incurred and the amount of the loss can be reasonably estimated. Significant judgment is required in both the determination of probability and the determination as to whether a loss is reasonably estimable. In addition, in the event the Company determines that a loss is not probable, but is reasonably possible, and it becomes possible to develop what the Company believes to be a reasonable range of possible loss, then the Company will include disclosure related to such matter as appropriate and in compliance with ASC 450. The accruals or estimates, if any, resulting from the foregoing analysis, are reviewed at least quarterly and adjusted to reflect the impact of negotiations, settlements, rulings, advice of legal counsel and other information and events pertaining to a particular matter. To the extent there is a reasonable possibility that the losses could exceed the amounts already accrued, the Company will, as applicable, adjust the accrual in the period the determination is made, disclose an estimate of the additional loss or range of loss, indicate that the estimate is immaterial with respect to its financial statements as a whole or, if the amount of such adjustment cannot be reasonably estimated, disclose that an estimate cannot be made.
From time to time, third parties assert claims against the Company regarding intellectual property rights, privacy issues and other matters arising in the ordinary course of business. Although the Company cannot be certain of the outcome of any litigation or the disposition of any claims, nor the amount of damages and exposure, if any, that the Company could incur, the Company currently believes that the final disposition of all existing matters will not have a material adverse effect on our business, results of operations, financial condition or cash flows. In addition, in the ordinary course of business, the Company is also subject to periodic threats of lawsuits, investigations and claims. Regardless of the outcome, litigation can have an adverse impact on the Company because of defense and settlement costs, diversion of management resources and other factors.
80
LIVEPERSON, INC.
NOTES TO CONSOLIDATED FINANCIAL STATEMENTS
|
14.
|
Restructuring Costs
|
The Company’s restructuring costs relate to wind-down and severance costs associated with re-prioritizing and reallocating resources to focus on areas showing high growth potential, as well as the termination of a large customer contract. The expense associated with this restructuring was approximately
$2.8 million
, offset partially by a benefit of approximately
$0.4 million
due to the cash collection of a previously written off bad debt during the year ended
December 31, 2016
and is classified in the consolidated statements of operations as restructuring costs. The expense associated with this restructuring was approximately
$3.4 million
during the twelve months ended December 31,
2015
and is classified in the consolidated statements of operations as restructuring costs. The restructuring liability was approximately
$2.6 million
and
$1.3 million
as of
December 31, 2016
and
2015
and is classified as accrued expenses and other current liabilities on the consolidated balance sheets.
The following table presents the detail of the liability for the Company’s restructuring charges for the periods presented (amounts in thousands):
|
December 31, 2016
|
December 31, 2015
|
||||||
|
Balance, Beginning of the year
|
$
|
1,328
|
|
$
|
—
|
|
|
|
Contract termination costs
|
—
|
|
427
|
|
|||
|
Severance and other associated costs
|
1,585
|
|
901
|
|
|||
|
Cash payments
|
(1,328
|
)
|
—
|
|
|||
|
Wind down costs of legacy platform
|
966
|
|
—
|
|
|||
|
Balance, End of year
|
$
|
2,551
|
|
$
|
1,328
|
|
|
The following table presents the detail of expenses for the Company’s restructuring charges for the periods presented (amounts in thousands):
|
Year Ended December 31, 2016
|
Year Ended December 31, 2015
|
||||||
|
Contract termination benefit
|
$
|
(384
|
)
|
$
|
1,745
|
|
|
|
Severance and other associated costs
|
1,585
|
|
1,639
|
|
|||
|
Wind down costs of legacy platform
|
1,168
|
|
—
|
|
|||
|
Total restructuring costs
|
$
|
2,369
|
|
$
|
3,384
|
|
|
81
Not Applicable.
Management’s Annual Report on Internal Control Over Financial Reporting
Our management, including the Chief Executive Officer and Chief Financial Officer, is responsible for establishing and maintaining adequate internal control over financial reporting, as that term is defined in Rule 13a-15(f) promulgated under the Exchange Act. Our internal control system is designed to provide reasonable assurance to our management and Board of Directors regarding the preparation and fair presentation of published financial statements. Our management, including the Chief Executive Officer and Chief Financial Officer, evaluated the effectiveness of our internal control over financial reporting as of
December 31, 2016
based on the framework established in “Internal Control — Integrated Framework (2013),” issued by the Committee of Sponsoring Organizations of the Treadway Commission (COSO). Based on its evaluation, our management, including the Chief Executive Officer and Chief Financial Officer, concluded that as of
December 31, 2016
, our internal control over financial reporting was effective based on those criteria.
The effectiveness of our internal control over financial reporting as of
December 31, 2016
has been audited by BDO USA, LLP, an independent registered public accounting firm. Their attestation is included herein.
Limitations of the Effectiveness of Internal Control
A control system, no matter how well conceived and operated, can only provide reasonable, not absolute, assurance that the objectives of the internal control system are met. Because of the inherent limitations of any internal control system, no evaluation of controls can provide absolute assurance that all control issues, if any, have been detected.
Changes in Internal Control over Financial Reporting
There were no changes in our internal control over financial reporting during the quarter ended
December 31, 2016
identified in connection with the evaluation thereof by our management, including the Chief Executive Officer and Chief Financial Officer, that have materially affected, or are reasonably likely to materially affect, our internal control over financial reporting.
Evaluation of Disclosure Controls and Procedures
Our management, including the Chief Executive Officer and Chief Financial Officer, evaluated the effectiveness of our “disclosure controls and procedures,” as that term is defined in Rule 13a-15(e) promulgated under the Exchange Act, as of
December 31, 2016
. Based on that evaluation, the Chief Executive Officer and Chief Financial Officer concluded that our disclosure controls and procedures were effective as of
December 31, 2016
to ensure that the information we are required to disclose in the reports that we file or submit under the Exchange Act is recorded, processed, summarized and reported, within the time periods specified in the Securities and Exchange Commission’s rules and forms, and to ensure that such information is accumulated and communicated to our management, including the Chief Executive Officer and Chief Financial Officer, as appropriate to allow timely decisions regarding required disclosure.
82
REPORT OF INDEPENDENT REGISTERED PUBLIC ACCOUNTING FIRM
To the Board of Directors and Stockholders
LivePerson, Inc.
New York, New York
We have audited LivePerson, Inc.’s internal control over financial reporting as of December 31, 2016, based on criteria established in
Internal Control - Integrated Framework (2013)
issued by the Committee of Sponsoring Organizations of the Treadway Commission (the COSO criteria). LivePerson, Inc.’s management is responsible for maintaining effective internal control over financial reporting and for its assessment of the effectiveness of internal control over financial reporting, included in the accompanying “Item 9A, Management’s Annual Report on Internal Control Over Financial Reporting.” Our responsibility is to express an opinion on the company’s internal control over financial reporting based on our audit.
We conducted our audit in accordance with the standards of the Public Company Accounting Oversight Board (United States). Those standards require that we plan and perform the audit to obtain reasonable assurance about whether effective internal control over financial reporting was maintained in all material respects. Our audit included obtaining an understanding of internal control over financial reporting, assessing the risk that a material weakness exists, and testing and evaluating the design and operating effectiveness of internal control based on the assessed risk. Our audit also included performing such other procedures as we considered necessary in the circumstances. We believe that our audit provides a reasonable basis for our opinion.
A company’s internal control over financial reporting is a process designed to provide reasonable assurance regarding the reliability of financial reporting and the preparation of financial statements for external purposes in accordance with generally accepted accounting principles. A company’s internal control over financial reporting includes those policies and procedures that (1) pertain to the maintenance of records that, in reasonable detail, accurately and fairly reflect the transactions and dispositions of the assets of the company; (2) provide reasonable assurance that transactions are recorded as necessary to permit preparation of financial statements in accordance with generally accepted accounting principles, and that receipts and expenditures of the company are being made only in accordance with authorizations of management and directors of the company; and (3) provide reasonable assurance regarding prevention or timely detection of unauthorized acquisition, use, or disposition of the company’s assets that could have a material effect on the financial statements.
Because of its inherent limitations, internal control over financial reporting may not prevent or detect misstatements. Also, projections of any evaluation of effectiveness to future periods are subject to the risk that controls may become inadequate because of changes in conditions, or that the degree of compliance with the policies or procedures may deteriorate.
In our opinion, LivePerson, Inc. maintained, in all material respects, effective internal control over financial reporting as of
December 31, 2016
, based on the COSO criteria.
We also have audited, in accordance with the standards of the Public Company Accounting Oversight Board (United States), the consolidated balance sheets of LivePerson, Inc. as of
December 31, 2016
and
2015
, and the related consolidated statements of operations, comprehensive loss, stockholders’ equity, and cash flows for each of the three years in the period ended
December 31, 2016
and our report dated
March 10, 2017
expressed an unqualified opinion thereon.
/s/ BDO USA, LLP
New York, New York
March 10, 2017
83
None.
The information required by this Item 10 is incorporated by reference to the sections captioned “Matters to be Considered at Annual Meeting — Election of Directors,” “Executive Officers,” “Board Committees and Meetings — Audit Committee,” “Codes of Conduct and Corporate Governance Documents” and “Section 16(a) Beneficial Ownership Reporting Compliance” in the definitive proxy statement for our
2017
Annual Meeting of Stockholders.
There have been no changes to the procedures by which stockholders may recommend nominees to our Board of Directors since our last disclosure of such procedures, which appeared in the definitive proxy statement for our
2016
Annual Meeting of Stockholders.
We have adopted a Code of Ethics that applies to our Chief Executive Officer, who is our principal executive officer, and other senior financial officers. Our Code of Ethics is available at:
www.liveperson.com
under “Investor Relations / Corporate Governance.”
The Company’s web site address provided above is not intended to function as a hyperlink, and the information on the Company’s web site is not and should not be considered part of this Annual Report on Form 10-K and is not incorporated by reference herein.
The Company will post on this website any amendments to our Code of Ethics.
The information required by this Item 11 is incorporated by reference to the sections captioned “Compensation Discussion and Analysis,” “Compensation Committee Report” (which information shall be deemed furnished in this Annual Report on Form 10-K), “Executive and Director Compensation” and “Compensation Committee Interlocks and Insider Participation” in the definitive proxy statement for our
2017
Annual Meeting of Stockholders.
The information required by this Item 12 is incorporated by reference to the sections captioned “Ownership of Securities” and “Potential Payments Upon Termination or Change-in-Control” in the definitive proxy statement for our
2017
Annual Meeting of Stockholders.
The following table provides certain information regarding the common stock authorized for issuance under our equity compensation plans, as of
December 31, 2016
:
|
Plan Category
|
Number of
Securities to Be
Issued Upon
Exercise of
Outstanding
Options, (a)
|
Weighted-Average
Exercise Price of
Outstanding
Options, Warrants
and Rights (b)
|
Number of
Securities
Remaining
Available for Future
Issuance Under
Equity
Compensation
Plans
(2)
(c)
|
|||||||
|
Equity compensation plans approved by stockholders
(1)
|
11,988,434
|
|
$
|
10.88
|
|
2,437,598
|
|
|||
|
Equity compensation plans not approved by stockholders
|
—
|
|
$
|
—
|
|
—
|
|
|||
|
Total
|
11,988,434
|
|
$
|
10.88
|
|
2,437,598
|
|
|||
|
(1)
|
Our equity compensation plans which were approved by our stockholders are the 2009 Stock Incentive Plan and the 2010 Employee Stock Purchase Plan.
|
|
(2)
|
Excludes securities reflected in column (a). Also see Note 11 to our consolidated financial statements.
|
84
The information required by this Item 13 is incorporated by reference to the sections captioned “Certain Relationships and Related Transactions” and “Director Independence” in the definitive proxy statement for our
2017
Annual Meeting of Stockholders.
The information required by this Item 14 is incorporated by reference to the section captioned “Independent Registered Public Accounting Firm Fees and Pre-Approval Policies and Procedures” in the definitive proxy statement for our
2017
Annual Meeting of Stockholders.
The following documents are filed as part of this Annual Report on Form 10-K:
|
1.
|
Financial Statements.
|
Incorporated by reference to the index of consolidated financial statements included in Item 8 of this Annual Report on Form 10-K.
|
2.
|
Financial Statements Schedules.
|
None.
|
3.
|
Exhibits.
|
Incorporated by reference to the Exhibit Index immediately preceding the exhibits attached to this Annual Report on Form 10-K.
None.
SIGNATURES
Pursuant to the requirements of Section 13 or 15(d) of the Securities Exchange Act of 1934, as amended, the Registrant has duly caused this report to be signed on its behalf by the undersigned, thereunto duly authorized, on
March 10, 2017
.
|
LIVEPERSON, INC.
|
||
|
By:
|
/s/ Robert P. LoCascio
|
|
|
Name: Robert P. LoCascio
|
||
|
Title: Chief Executive Officer
|
||
Pursuant to the requirements of the Securities Exchange Act of 1934, as amended, this report has been signed below by the following persons on behalf of the Registrant and in the capacities indicated on
March 10, 2017
.
85
|
Signature
|
Title(s)
|
|
|
/s/Robert P. LoCascio
|
Chief Executive Officer and Chairman of the Board of Directors
|
|
|
Robert P. LoCascio
|
(Principal Executive Officer)
|
|
|
/s/ Daniel R. Murphy
|
Chief Financial Officer
|
|
|
Daniel R. Murphy
|
(Principal Financial Officer)
|
|
|
/s/ Peter Block
|
Director
|
|
|
Peter Block
|
||
|
/s/ Kevin C. Lavan
|
Director
|
|
|
Kevin C. Lavan
|
||
|
/s/ Jill Layfield
|
Director
|
|
|
Jill Layfield
|
||
|
/s/ David Vaskevitch
|
Director
|
|
|
David Vaskevitch
|
||
|
/s/ William G. Wesemann
|
Director
|
|
|
William G. Wesemann
|
||
86
EXHIBIT INDEX
|
Number
|
Description
|
|
|
2.1
|
Agreement and Plan of Merger, dated as of June 22, 2006, among LivePerson, Inc., Soho Acquisition Corp., Proficient Systems, Inc. and Gregg Freishtat as Shareholders’ Representative (incorporated by reference to the identically numbered exhibit in the Current Report on Form 8-K filed on June 22, 2006)
|
|
|
3.1
|
Fourth Amended and Restated Certificate of Incorporation (incorporated by reference to the identically-numbered exhibit to LivePerson’s Annual Report on Form 10-K for the fiscal year ended December 31, 2000 and filed March 30, 2001 (the “2000 Form 10-K”))
|
|
|
3.2
|
Second Amended and Restated Bylaws, as amended (incorporated by reference to the identically-numbered exhibit to the 2000 Form 10-K)
|
|
|
4.1
|
Specimen common stock certificate (incorporated by reference to the identically-numbered exhibit to LivePerson’s Registration Statement on Form S-1, as amended (Registration No. 333-96689) (“Registration No. 333-96689”))
|
|
|
4.2
|
Second Amended and Restated Registration Rights Agreement, dated as of January 27, 2000, by and among LivePerson, the several persons and entities named on the signature pages thereto as Investors, and Robert LoCascio (incorporated by reference to the identically-numbered exhibit to Registration No. 333-96689)
|
|
|
10.1(a)*
|
2009 Stock Incentive Plan (incorporated by reference to Exhibit 99.1 to LivePerson’s Registration Statement on Form S-8 filed on June 9, 2009) and Forms of Grant Agreements under the 2009 Stock Incentive Plan (incorporated by reference to Exhibit 10.1 to LivePerson’s Quarterly Report on Form 10-Q filed on May 6, 2011)
|
|
|
10.1(b)*
|
2009 Stock Incentive Plan (amended and restated as of June 7, 2012) (incorporated by reference to Exhibit 99.1 to LivePerson’s Current Report on Form 8-K filed on June 8, 2012)
|
|
|
10.2*
|
LivePerson, Inc. 2010 Employee Stock Purchase Plan (incorporated by reference to Exhibit 99.1 to the LivePerson’s Registration Statement on Form S-8 filed on August 19, 2010)
|
|
|
10.3*
|
Employment Agreement between LivePerson and Robert P. LoCascio, dated as of January 1, 1999 (incorporated by reference to Exhibit 10.1 to Registration No. 333-96689)
|
|
|
10.4(a)*
|
Employment Agreement between LivePerson and Timothy E. Bixby, dated as of June 23, 1999 (incorporated by reference to Exhibit 10.3 to Registration No. 333-96689)
|
|
|
10.4(b)*
|
Modification to Employment Agreement between LivePerson and Timothy E. Bixby, dated as of April 1, 2003 (incorporated by reference to Exhibit 10.2.1 to LivePerson’s Quarterly Report on Form 10-Q for the quarter ended June 30, 2003 and filed August 13, 2003)
|
|
|
10.4(c)*
|
Separation Agreement and General Release between LivePerson and Timothy E. Bixby, dated as of November 2, 2010 (incorporated by reference to Exhibit 10.4(c) to LivePerson’s Annual Report on Form 10-K for the year ended December 31, 2010 and filed March 15, 2011)
|
|
|
10.5*
|
Agreement between LivePerson and Dan Murphy, dated as of March 27, 2011 (incorporated by reference to Exhibit 10.5 to LivePerson’s Annual Report on Form 10-K for the year ended December 31, 2011 and filed March 13, 2012)
|
|
|
10.6*
|
Form of Indemnification Agreement entered into with Executive Officers and Directors of LivePerson (incorporated by reference to Exhibit 10.6 to LivePerson’s Annual Report on Form 10-K for the year ended December 31, 2011 and filed March 13, 2012)
|
|
|
10.7*
|
Agreement between LivePerson and Eli Campo, dated as of December 22, 2006 (incorporated by reference to Exhibit 10.7 to LivePerson’s Annual Report on Form 10-K for the year ended December 31, 2011 and filed March 13, 2012)
|
|
|
10.8*
|
Agreement between LivePerson and Monica L. Greenberg, dated as of October 25, 2006 (incorporated by reference to Exhibit 10.8 to LivePerson’s Annual Report on Form 10-K for the year ended December 31, 2011 and filed March 13, 2012)
|
|
|
10.9*
|
Agreement between LivePerson and Michael Kovach, dated as of November 6, 2009 (incorporated by reference to Exhibit 10.9 to LivePerson’s Annual Report on Form 10-K for the year ended December 31, 2011 and filed March 13, 2012)
|
|
87
|
10.10*
|
Incentive Plan (incorporated by reference to Exhibit 10.1 to LivePerson’s Current Report on Form 8-K filed on April 28, 2011)
|
|
|
10.11*
|
Separation Agreement General Release between LivePerson and Eli Campo, dated as of December 16, 2013 (incorporated by reference to Exhibit 10.1 to LivePerson's Quarterly Report on Form 10-Q filed on May 9, 2014).
|
|
|
10.12*
|
Employment Agreement between LivePerson and Eran Vanounou, dated as of February 22, 2014(incorporated by reference to Exhibit 10.2 to LivePerson's Quarterly Report on Form 10-Q filed on May 9, 2014).
|
|
|
10.13
|
Agreement and Plan Merger, dated as of November 5, 2014, among LivePerson, Inc. Catalyst Lightning LLC, Contact At Once!, LLC and Fulcrum Growth Fund II QP, LLC (incorporated by reference to Exhibit 2.1 to LivePerson's Current Report on Form 8-K filed on November 12, 2014).
|
|
|
10.14
|
Employment agreement between LivePerson and Dustin Dean, dated February 25, 2015 (incorporated by reference to Exhibit 10.1 to LivePerson's Quarterly Report on Form 10-Q filed on May 11, 2015).
|
|
|
10.15
|
Amendment to the employment agreement between LivePerson and Dustin Dean, dated March 27, 2015 (incorporated by reference to Exhibit 10.1 to LivePerson's Quarterly Report on Form 10-Q filed on May 11, 2015).
|
|
|
21.1
|
Subsidiaries
|
|
|
23.1
|
Consent of BDO USA, LLP
|
|
|
31.1
|
Certification by Chief Executive Officer pursuant to Exchange Act Rule 13a-14(a), as adopted pursuant to Section 302 of the Sarbanes-Oxley Act of 2002
|
|
|
31.2
|
Certification by Chief Financial Officer pursuant to Exchange Act Rule 13a-14(a), as adopted pursuant to Section 302 of the Sarbanes-Oxley Act of 2002
|
|
|
32.1**
|
Certification by Chief Executive Officer pursuant to 18 U.S.C. Section 1350, as adopted pursuant to Section 906 of the Sarbanes-Oxley Act of 2002
|
|
|
32.2**
|
Certification by Chief Financial Officer pursuant to 18 U.S.C. Section 1350, as adopted pursuant to Section 906 of the Sarbanes-Oxley Act of 2002
|
|
|
101.INS†
|
XBRL Instance Document
|
|
|
101.SCH†
|
XBRL Taxonomy Extension Schema Document
|
|
|
101.CAL†
|
XBRL Taxonomy Extension Calculation Linkbase Document
|
|
|
101.DEF†
|
XBRL Taxonomy Extension Definition Linkbase Document
|
|
|
101.LAB†
|
XBRL Taxonomy Extension Label Linkbase Document
|
|
|
101.PRE†
|
XBRL Taxonomy Extension Presentation Linkbase Document
|
|
|
*
|
Management contract or compensatory plan or arrangement
|
|
**
|
The certifications attached as Exhibit 32.1 and Exhibit 32.2 accompany the Annual Report on Form 10-K pursuant to Section 906 of the Sarbanes-Oxley Act of 2002 and shall not be deemed “filed” by the Company for purposes of Section 18 of the Securities Exchange Act of 1934, as amended.
|
|
†
|
Pursuant to applicable securities laws and regulations, the Registrant is deemed to have complied with the reporting obligation relating to the submission of interactive data files in such exhibits and is not subject to liability under any anti-fraud provisions of the federal securities laws as long as the Registrant has made a good faith attempt to comply with the submission requirements and promptly amends the interactive data files after becoming aware that the interactive data files fail to comply with the submission requirements. These interactive data files are deemed not filed or part of a registration statement or prospectus for purposes of sections 11 or 12 of the Securities Act of 1933, as amended, are deemed not filed for purposes of section 18 of the Securities Exchange Act of 1934, as amended, and otherwise are not subject to liability under these sections.
|
88
TABLE OF CONTENTS
Part IItem 1. BusinessItem 1A. Risk FactorsItem 1B. Unresolved Staff CommentsItem 2. PropertiesItem 3. Legal ProceedingsItem 4. Mine Safety DisclosuresPart IIItem 5. Market For Registrant S Common Equity, Related Stockholder Matters and Issuer Purchases Of Equity SecuritiesItem 6. Selected Consolidated Financial DataItem 7. Management S Discussion and Analysis Of Financial Condition and Results Of OperationsItem 7A. Quantitative and Qualitative Disclosures About Market RiskItem 8. Consolidated Financial Statements and Supplementary DataItem 9. Changes in and Disagreements with Accountants on Accounting and Financial DisclosureItem 9A. Controls and ProceduresItem 9B. Other InformationPart IIIItem 10. Directors, Executive Officers and Corporate GovernanceItem 11. Executive CompensationItem 12. Security Ownership Of Certain Beneficial Owners and Management and Related Stockholder MattersItem 13. Certain Relationships and Related Transactions, and Director IndependenceItem 14. Principal Accountant Fees and ServicesPart IVItem 15. Exhibits and Financial Statement SchedulesItem 16. Form 10-k Summary