LOUISIANA-PACIFIC CORP
10-Ks and 10-Qs
|
|
|
|
|
|
|
|
|
|
|
|
|
|
|
|
|
|
|
|
|
|
|
|
|
|
|
|
|
|
|
|
|
|
|
|
|
|
|
|
|
|
|
|
|
|
|
|
|
|
|
|
|
|
|
|
UNITED STATES
SECURITIES AND EXCHANGE COMMISSION
Washington, D.C. 20549
_____________________________
FORM 10-K
Annual Report Pursuant to Section 13 or 15(d)
of the Securities Exchange Act of 1934
|
For the fiscal year ended
|
|
Commission File Number
|
|
December 31, 2012
|
1-7107
|
|
_____________________________
Louisiana-Pacific Corporation
(Exact name of registrant as specified in its charter)
|
Delaware
|
|
93-0609074
|
|
(State of Incorporation)
|
|
(I.R.S. Employer
Identification No.)
|
|
414 Union Street, Suite 2000
Nashville, TN 37219
|
|
615-986-5600
|
|
(Address of principal executive offices)
|
|
Registrant’s telephone number
(including area code)
|
Securities registered pursuant to Section 12(b) of the Act:
|
Title of Each Class
|
|
Name of Each Exchange on Which Registered
|
|
Common Stock, $1 par value
|
|
New York Stock Exchange
|
|
Preferred Stock Purchase Rights
|
|
New York Stock Exchange
|
Securities registered pursuant to Section 12(g) of the Act: None
_____________________________
Indicate by check mark if the registrant is a well-known seasoned issuer as defined in Rule 405 of the Securities Act. Yes
ý
No
¨
Indicate by check mark if the registrant is not required to file reports pursuant to Section 13 or Section 15(d) of the Act. Yes
¨
No
ý
Indicate by check mark whether the registrant (1) has filed all reports required to be filed by Section 13 or 15(d) of the Securities Exchange Act of 1934 during the preceding 12 months (or for such shorter period that the registrant was required to file such reports), and (2) has been subject to such filing requirements for the past 90 days. Yes
ý
No
¨
Indicate by check mark whether the registrant has submitted electronically and posted on its corporate Web site, if any, every Interactive Data File required to be submitted and posted pursuant to Rule 405 of Regulation S-T (§ 232.405 of this chapter) during the preceding 12 months (or for such shorter period that the registrant was required to submit and post such files). Yes
ý
No
¨
Indicate by check mark if disclosure of delinquent filers pursuant to Item 405 of Regulation S-K is not contained herein, and will not be contained, to the best of registrant’s knowledge, in definitive proxy or information statements incorporated by reference in Part III of this Form 10-K or any amendment to this Form 10-K.
¨
Indicate by check mark if the registrant is a large accelerated filer, an accelerated filer, a non-accelerated filer or a smaller reporting company. See definitions of “accelerated filer,” “large accelerated filer” and “smaller reporting company” in Rule 12b-2 of the Exchange Act (Check one):
Large accelerated filer
ý
Accelerated filer
¨
Non-accelerated filer
¨
Smaller reporting company
¨
Indicate by check mark whether the registrant is a shell company (as defined in Rule 12b-2 of the Exchange Act): Yes
¨
No
ý
State the aggregate market value of the voting and non-voting common equity held by non-affiliates computed by reference to the price at which the common equity was sold, or the average bid and asked price of such common equity, as of the last business day of the registrant’s most recently completed second fiscal quarter:
$1,446,786,000
Indicate the number of shares outstanding of each of the registrant’s classes of common stock as of the latest practicable date:
139,293,137
shares of Common Stock, $1 par value, outstanding as of
February 28, 2013
.
Documents Incorporated by Reference
Definitive Proxy Statement for 2013 Annual Meeting: Part III
Except as otherwise specified and unless the context otherwise requires, references to “LP”, the “Company”, “we”, “us”, and “our” refer to Louisiana-Pacific Corporation and its subsidiaries.
ABOUT FORWARD-LOOKING STATEMENTS
Section 27A of the Securities Act of 1933 and Section 21E of the Securities Exchange Act of 1934 provide a “safe harbor” for forward-looking statements to encourage companies to provide prospective information about their businesses and other matters as long as those statements are identified as forward-looking and are accompanied by meaningful cautionary statements identifying important factors that could cause actual results to differ materially from those discussed in the statements. This report contains, and other reports and documents filed by us with the Securities and Exchange Commission may contain, forward-looking statements. These statements are or will be based upon the beliefs and assumptions of, and on information available to, our management.
The following statements are or may constitute forward-looking statements: (1) statements preceded by, followed by or that include words like “may,” “will,” “could,” “should,” “believe,” “expect,” “anticipate,” “intend,” “plan,” “estimate,” “potential,” “continue” or “future” or the negative or other variations thereof and (2) other statements regarding matters that are not historical facts, including without limitation, plans for product development, forecasts of future costs and expenditures, possible outcomes of legal proceedings, capacity expansion and other growth initiatives and the adequacy of reserves for loss contingencies.
Factors that could cause actual results to differ materially from those expressed or implied by the forward-looking statements include, but are not limited to the following:
|
•
|
changes in general economic conditions;
|
|
•
|
changes in the cost and availability of capital;
|
|
•
|
changes in the level of home construction activity;
|
|
•
|
changes in competitive conditions and prices for our products;
|
|
•
|
changes in the relationship between supply of and demand for building products;
|
|
•
|
changes in the relationship between supply of and demand for raw materials, including wood fiber and resins, used in manufacturing our products;
|
|
•
|
changes in the cost of and availability of energy, primarily natural gas, electricity and diesel fuel;
|
|
•
|
changes in other significant operating expenses;
|
|
•
|
changes in exchange rates between the U.S. dollar and other currencies, particularly the Canadian dollar, Australian dollar, EURO, Brazilian
real
and the Chilean
peso
;
|
|
•
|
changes in general and industry-specific environmental laws and regulations;
|
|
•
|
changes in tax laws, and interpretations thereof;
|
|
•
|
changes in circumstances giving rise to environmental liabilities or expenditures;
|
|
•
|
the resolution of existing and future product-related litigation and other legal proceedings; and
|
|
•
|
acts of public authorities, war, civil unrest, natural disasters, fire, floods, earthquakes, inclement weather and other matters beyond our control.
|
In addition to the foregoing and any risks and uncertainties specifically identified in the text surrounding forward-looking statements, any statements in the reports and other documents filed by us with the Commission that warn of risks or uncertainties associated with future results, events or circumstances identify important factors that could cause actual results, events and circumstances to differ materially from those reflected in the forward-looking statements.
ABOUT THIRD-PARTY INFORMATION
In this report, we rely on and refer to information regarding industry data obtained from market research, publicly available information, industry publications, U.S. government sources and other third parties. Although we believe the information is reliable, we cannot guarantee the accuracy or completeness of the information and have not independently verified it.
1
|
ITEM 1.
|
Business
|
General
Our company, founded in 1973 and headquartered in Nashville, Tennessee, is a leading manufacturer of building products. As of
December 31, 2012
, we had approximately
3,900
employees. We currently own 21 modern, strategically located facilities in the U.S. and Canada, two facilities in Chile and one facility in Brazil. We also operate three facilities through joint ventures, for which we are the exclusive provider of product distribution for North America and participate in a joint venture operation that produces cellulose insulation in multiple facilities. Our focus is on delivering innovative, high-quality commodity and specialty building products to retail, wholesale, home building and industrial customers. Our products are used primarily in new home construction, repair and remodeling, and manufactured housing.
Business Segments
We operate in four segments: North America Oriented Strand Board (OSB); Siding; Engineered Wood Products (EWP); and South America. In general, our businesses are affected by the level of housing starts; the level of home repairs; the availability and cost of financing; changes in industry capacity; changes in the prices we pay for raw materials and energy; changes in foreign exchange rates (primarily the Canadian dollar, Chilean Peso and Brazilian Real); and other operating costs.
OSB
Our OSB segment manufactures and distributes OSB structural panel products.
OSB is an innovative, affordable and environmentally smart product made from wood strands arranged in layers and bonded with resin. OSB serves many of the same uses as plywood, including roof decking, sidewall sheathing and floor underlayment, but can be produced at a significantly lower cost. Land use regulations, endangered species and environmental concerns have resulted in reduced supplies and higher costs for domestic timber, causing many plywood mills to close or divert their production to other uses. OSB has replaced most of the volume lost from these mills. It is estimated for
2012
that OSB accounted for approximately
58%
of the structural panel consumption in North America with plywood accounting for the remainder. We estimate that the overall North American structural panel market (based upon
2012
housing starts) was
27.9 billion
square feet with the OSB market comprising an estimated
16.3 billion
square feet of this market. Based upon our production in
2012
of
3.7 billion
square feet (including our joint venture OSB mill with Canfor Corporation and OSB produced in our siding segment), we estimate that we account for
22%
of the North American OSB market and
13%
of the overall North American structural panel market. We believe we have the largest installed capacity and are one of the most efficient producers of OSB in North America.
Siding
Our siding offerings fall into two categories: SmartSide
®
siding products and related accessories; and CanExel siding and accessory products. Our SmartSide
®
products consist of a full line of wood-based sidings, trim, soffit and fascia. These products have quality and performance characteristics similar to solid wood at more attractive prices due to lower raw material and production costs. Our CanExel siding and accessory product offerings include a number of pre-finished lap and trim products in a variety of patterns and textures.
Additionally, minor amounts of commodity OSB are produced and sold in this segment.
Engineered Wood Products
Our Engineered Wood Products (EWP) segment manufactures and distributes laminated veneer lumber (LVL), I-Joists, laminated strand lumber (LSL) and other related products. This segment also includes the sale of I-Joist produced by our joint venture with Resolute Forest Products (formerly AbitibiBowater) and LVL sold under a contract manufacturing arrangement. We believe that in North America we are one of the top three producers (including our joint venture production) of I-Joists, LVL and LSL. A plywood mill associated with our LVL operations in British Columbia is also included in this segment.
We believe that our engineered I-joists, which are used primarily in residential and commercial flooring and roofing systems and other structural applications, are stronger, lighter and straighter than conventional lumber joists.
2
Our LVL and LSL are high-grade, value-added structural products used in applications where extra strength and quality is required, such as headers and beams.
South America
Our South American segment manufactures and distributes OSB and siding products in South America and certain export markets. This segment also distributes and sells related products to augment the transition to wood frame construction. We believe we are the only producer of OSB in South America.
Other Products
Our other products category includes our decorative moulding and our joint venture that produces cellulose insulation. Additionally, our other products category includes our remaining timber and timberlands, and other minor products, services and closed operations.
Sales, Marketing and Distribution
Our sales and marketing efforts are primarily focused on traditional two-step distribution, professional building products dealers, home centers, third-party wholesale buying groups and other retailers. The wholesale distribution channel includes a variety of specialized and broad-line wholesale distributors and dealers focused primarily on the supply of products for use by professional builders and contractors. The retail distribution channel includes large retail chains catering to the do-it-yourself (DIY) and repair and remodeling markets as well as smaller independent retailers.
Customers
We seek to maintain a broad customer base and a balanced approach to national distribution through both wholesale and retail channels. In
2012
, our top ten customers accounted for approximately
46%
of our sales. Because a significant portion of our sales are from OSB, a commodity product sold primarily on the basis of price and availability, we are not dependent on any one customer. Our principal customers include the following:
|
•
|
Wholesale distribution companies, which supply building materials to retailers on a regional, state or local basis;
|
|
•
|
Two-step distributors, who provide building materials to smaller retailers, contractors and others;
|
|
•
|
Building materials professional dealers, that specialize in sales to professional builders, remodeling firms and trade contractors that are involved in residential home construction and light commercial building;
|
|
•
|
Retail home centers, that provide access to consumer markets with a broad selection of home improvement materials and increasingly serve professional builders, remodelers and trade contractors; and
|
|
•
|
Manufactured housing and shed producers, who design, construct and distribute prefabricated residential and light commercial structures, including fully manufactured, modular and panelized structures, for consumer and professional markets.
|
Seasonality
Our business is subject to seasonal variances, with demand for many of our products tending to be greater during the building season, which generally occurs in the second and third quarters in North America and the fourth and first quarters in South America. From time to time, we engage in promotional activities designed to stimulate demand for our products, such as reducing our selling prices and providing extended payment terms, particularly at times when demand is otherwise relatively soft. We do this in an effort to better balance our inventory levels with demand, manage the logistics of our product shipments, allow our production facilities to run efficiently, be competitive, and/or obtain initial orders from customers.
Competitors / Competition
3
The building products industry is highly competitive. We compete internationally with several thousand forest and building products firms, ranging from very large, fully integrated firms to smaller enterprises that may manufacture only one or a few items. We also compete less directly with firms that manufacture substitutes for wood building products. Some competitors have substantially greater financial and other resources than we do that could, in some instances, give them a competitive advantage over us.
In terms of our commodity OSB, we compete based upon price, quality and availability of products. In terms of our specialty products, including EWP, siding and various value added OSB products, we compete based upon price, quality, and availability of products as well as performance features offered.
Raw Materials
Wood fiber is the primary raw material used in most of our operations, and the primary source of wood fiber is timber. The primary end-markets for timber harvested in the U.S. are manufacturers who supply: (1) the housing market, where it is used in the construction of new housing and the repair and remodeling of existing housing; (2) the pulp and paper market; (3) commercial and industrial markets; (4) export markets; and (5) emerging biomass energy production markets. The supply of timber is limited by access to timber and by the availability of timberlands. The availability of timberlands, in turn, is limited by several factors, including forest management policies, alternate uses of land, and loss to urban or suburban real estate development.
In Canada, we harvest enough timber annually under long-term harvest rights with various Canadian governments and other third parties to support our Canadian production facilities.
We purchase approximately
75%
of our wood fiber requirements on the open market, through either private cutting contracts or purchased wood arrangements. Our remaining wood fiber requirements (
25%
) are fulfilled through government contracts, principally in Canada. Because wood fiber is subject to commodity pricing, the cost of various types of timber that we purchase in the market has at times fluctuated greatly due to weather, governmental, economic or other industry conditions. However, our mills are generally located in areas that are in close proximity to large and diverse supplies of timber. Our mills generally have the ability to procure wood fiber at competitive prices from third-party sources.
In addition to wood fiber, we use a significant quantity of various resins in our manufacturing processes. Resin product costs are influenced by changes in the prices of raw materials used to produce resin, primarily petroleum products, as well as competing demand for resin products. Currently, we purchase the majority of our resin from three major suppliers and believe our relationships with those suppliers to be good. However there can be no assurance that pricing or availability of resins will not be impacted based upon competing demand.
While the majority of our energy requirements are generated at our plants through the conversion of wood waste, we also purchase substantial amounts of energy in our operations, primarily electricity and natural gas. Energy prices have experienced significant volatility in recent years, particularly in deregulated markets. We attempt to mitigate our exposure to energy price changes through the selective use of long-term supply agreements.
Environmental Compliance
Our operations are subject to many environmental laws and regulations governing, among other things, discharges of pollutants and other emissions on or into land, water and air, the disposal of hazardous substances or other contaminants, the remediation of contamination and the restoration and reforestation of timberlands. In addition, certain environmental laws and regulations impose liability and responsibility on present and former owners, operators or users of facilities and sites for contamination at such facilities and sites without regard to causation or knowledge of contamination. Compliance with environmental laws and regulations can significantly increase the costs of our operations and otherwise result in significant costs and expenses. In some cases, plant closures can result in more onerous compliance requirements becoming applicable to a facility or a site. Violations of environmental laws and regulations can subject us to additional costs and expenses, including defense costs and
4
expenses and civil and criminal penalties. We cannot assure you that the environmental laws and regulations to which we are subject will not become more stringent, or be more stringently implemented or enforced, in the future.
During 2012, the U.S. Environmental Protection Agency (EPA) finalized the Clean Air Act pollution standards. We estimate that we will be required to make capital expenditures in the range of $3 million to $13 million over the next six years to comply with such standards.
Our policy is to comply fully with all applicable environmental laws and regulations. We devote significant management attention to achieving full compliance. In addition, from time to time, we undertake construction projects for environmental control equipment or incur other environmental costs that extend an asset’s useful life, improve its efficiency or improve the marketability of certain properties.
Additional information concerning environmental matters is set forth under item 3, Legal Proceedings, and in Note 18 of the Notes to the financial statements included in item 8 of this report.
Employees
We employ approximately
3,900
people, about
1,000
of whom are members of unions, primarily in Canada. We consider our relationship with our employees generally to be good. While we do not currently anticipate any work stoppage, there can be no assurance that work stoppages will not occur.
Available Information
We file annual reports on Form 10-K, quarterly reports on Form 10-Q, current reports on Form 8-K, proxy statements and other information with the Securities and Exchange Commission (“SEC”). Our SEC filings are available to the public over the Internet at the SEC’s website at
http://www.sec.gov
. You may also read and copy any document we file at the SEC’s public reference room at 100 F Street, NE., Washington, D.C. 20549. You may obtain information on the operation of the SEC’s public reference room in Washington, D.C. by calling the SEC at 1-800-SEC-0330.
In addition, we will make available our annual reports on Form 10-K, quarterly reports on Form 10-Q, current reports on Form 8-K and amendments to those reports filed or furnished pursuant to Section 13(a) or 15(d) of the Exchange Act through our internet website at
http://www.lpcorp.com
as soon as reasonably practicable after we electronically file such material with, or furnish it to, the SEC.
5
Segment and Price Trend Data
The following table sets forth, for each of the last three years: (1) our production volumes; (2) the estimated average wholesale price of OSB sold in the United States; and (3) our logs procured by source. In addition, information concerning our: (1) consolidated net sales by business segment; (2) consolidated profit (loss) by business segment; (3) identifiable assets by segment; (4) depreciation, amortization and cost of timber harvested; (5) capital expenditures; and (6) geographic segment information is included at Note 24 of the Notes to the financial statements included in item 8 of this report and information concerning our sales by product line is included in item 7 of this report.
Product Information Summary
For Years Ended December 31
(Dollar amounts in millions, except per unit)
|
2012
|
2011
|
2010
|
|||||||||
|
PRODUCTION VOLUMES
(1)
|
|||||||||||
|
OSB,
3
/
8
” basis, million square feet
(2)
|
3,660
|
|
3,311
|
|
3,207
|
|
|||||
|
South America OSB, million cubic meters
|
458
|
|
379
|
|
382
|
|
|||||
|
Wood-based siding,
3
/
8
” basis, million square feet
|
923
|
|
774
|
|
756
|
|
|||||
|
Engineered I-joists, million lineal feet
|
63
|
|
56
|
|
66
|
|
|||||
|
Laminated veneer lumber and laminated strand lumber, thousand cubic feet
|
6,633
|
|
6,339
|
|
5,859
|
|
|||||
|
COMMODITY PRODUCT PRICE TRENDS
(3)
|
|||||||||||
|
OSB, MSF,
7
/
16
” span rating (North Central price)
|
$
|
271
|
|
$
|
186
|
|
$
|
220
|
|
||
|
OSB, MSF,
7
/
16
” span rating (Western Canada price)
|
$
|
269
|
|
$
|
154
|
|
$
|
214
|
|
||
|
OSB, MSF,
7
/
16
” span rating (Southwest price)
|
$
|
260
|
|
$
|
172
|
|
$
|
210
|
|
||
|
% LOGS BY SOURCES
(4)
|
|||||||||||
|
Private cutting contracts
|
8
|
%
|
8
|
%
|
10
|
%
|
|||||
|
Government contracts
|
26
|
%
|
24
|
%
|
27
|
%
|
|||||
|
Purchased logs
|
67
|
%
|
68
|
%
|
63
|
%
|
|||||
|
Total volumes—million board feet
|
1,467
|
|
1,342
|
|
1,135
|
|
|||||
|
(1)
|
Includes purchases of products from our joint ventures or purchased under contract manufacturing arrangements.
|
|
(2)
|
Includes production at both our commodity and specialty mills in North America.
|
|
(3)
|
Prices represent yearly averages stated in dollars per thousand square feet (MSF). Source:
Random Lengths
.
|
|
(4)
|
Stated as a percentage of total log volume.
|
6
|
ITEM 1A.
|
Risk Factors
|
You should be aware that the occurrence of any of the events described in this Risk Factors section and elsewhere in this report or in any other of our filings with the SEC could have a material adverse effect on our business, financial position, results of operations and cash flows. In evaluating us, you should consider carefully, among other things, the risks described below and the matters described in “About Forward-Looking Statements.”
Cyclical industry conditions and commodity pricing have and may continue to adversely affect our financial condition and results of operations
. Our operating results reflect the general cyclical pattern of the building products industry. Demand for our products correlates to a significant degree to the level of residential construction activity in North America, which historically has been characterized by significant cyclicality. This cyclicality is influenced by a number of factors, including the supply of new and existing homes on the market, the level of unemployment, , longer-term interest rates, and mortgage foreclosure rates. The cyclicality is also influenced by the availability of mortgage financing, which is currently more restrictive than normal and which could be adversely affected by the implementation of one or more proposals to eliminate or reduce the mortgage market roles of or levels of support for government-sponsored enterprises such as Federal National Mortgage Association and the Federal Home Loan Mortgage Corporation. A significant increase in longer-term interest rates, a prolonged decline in the availability of mortgage financing, or the occurrence of other events that reduce levels of residential construction activity could have a material adverse effect on our financial condition, results of operations and cash flows. Our primary product, OSB, and a significant portion of our raw materials are globally traded commodity products. In addition, our products are subject to competition from manufacturers worldwide. Historical prices for our products have been volatile, and we, like other participants in the building products industry, have limited influence over the timing and extent of price changes for our products. Product pricing is significantly affected by the relationship between supply and demand in the building products industry. Product supply is influenced primarily by fluctuations in available manufacturing capacity. Demand is affected by the state of the economy in general and a variety of other factors. The level of new residential construction activity and home repair and remodeling activity primarily affects the demand for our building products. Demand is also subject to fluctuations due to changes in economic conditions, interest rates, population growth, weather conditions and other factors. We are not able to predict with certainty market conditions and selling prices for our products. In this competitive environment with so many variables for which we do not control, we cannot assure you that prices for our products will not decline from current levels. A prolonged and severe weakness in the markets for one or more of our principal products, particularly OSB, could seriously harm our financial condition and results of operations and our ability to satisfy our cash requirements, including the payment of interest and principal on our debt.
We have a high degree of product concentration.
OSB accounted for about
56%
,
47%
and
51%
of our North American sales in
2012
,
2011
and
2010
and we expect OSB sales to continue to account for a substantial portion of our revenues and profits in the future. Concentration of our business in the OSB market further increases our sensitivity to commodity pricing and price volatility. In this competitive environment with so many variables for which we do not control, we cannot assure you that pricing for OSB or our other products will not decline from current levels.
Intense competition in the building products industry could prevent us from increasing or sustaining our net sales and profitability.
The markets for our products are highly competitive. Our competitors range from very large, fully integrated forest and building products firms to smaller firms that may manufacture only one or a few types of products. We also compete less directly with firms that manufacture substitutes for wood building products. Many of our competitors have greater financial and other resources than we do, and certain of the mills operated by our competitors may be lower-cost producers than the mills operated by us.
Our results of operations may be harmed by potential shortages of raw materials and increases in raw material costs.
The most significant raw material used in our operations is wood fiber. We currently obtain about
75%
of our wood fiber requirements in the open market. Wood fiber is subject to commodity pricing, which fluctuates on the basis of market factors over which we have no control. In addition, the cost of various types of wood fiber that we purchase in the market has at times fluctuated greatly because of governmental, economic or
7
industry conditions, and may be affected by increased demand resulting from initiatives to increase the use of biomass materials in the production of heat, power, biobased products and biofuels. In addition to wood fiber, we also use a significant quantity of various resins in our manufacturing processes. Resin product costs are influenced by changes in the prices or availability of raw materials used to produce resins, primarily petroleum products, as well as demand for and availability of resin products. Selling prices of our products have not always increased in response to raw material cost increases. We are unable to determine to what extent, if any, we will be able to pass any future raw material cost increases through to our customers through product price increases. Our inability to pass increased costs through to our customers could have a material adverse effect on our financial condition, results of operations and cash flows.
Many of the Canadian forestlands from which we obtain wood fiber also are subject to the constitutionally protected treaty or common-law rights of the aboriginal peoples of Canada. Most of British Columbia is not covered by treaties and, as a result, the claims of British Columbia’s aboriginal peoples relating to forest resources are largely unresolved, although many aboriginal groups are actively engaged in treaty discussions with the governments of British Columbia and Canada. Final or interim resolution of claims brought by aboriginal groups are expected to result in additional restrictions on the sale or harvest of timber and may increase operating costs and affect timber supply and prices in Canada.
We depend on our senior management team and other key employees, and significant attrition within our management team could adversely affect our business.
Our success depends in part on our ability to attract, retain and motivate senior management and other key employees. Achieving this objective may be difficult due to many factors, including fluctuations in global economic and industry conditions, competitors’ hiring practices, cost reduction activities, and the effectiveness of our compensation programs. Competition for qualified personnel can be very intense. We must continue to recruit, retain and motivate senior management and other key employees sufficient to maintain our current business and support our future projects. A loss of any such personnel, or the inability to recruit and retain qualified personnel in the future, could have an adverse effect on our business, financial condition and results of operations.
Our operations require substantial capital
. Capital expenditures for expansion or replacement of existing facilities or equipment or to comply with future changes in environmental laws and regulations may be substantial. Although we maintain our production equipment with regular periodic and scheduled maintenance, we cannot assure you that key pieces of equipment in our various production processes will not need to be repaired or replaced or that we will not incur significant additional costs associated with environmental compliance. The costs of repairing or replacing such equipment and the associated downtime of the affected production line could have a material adverse effect on our financial condition, results of operations and cash flow. If for any reason we are unable to provide for our operating needs, capital expenditures and other cash requirements on economic terms, we could experience a material adverse effect on our business, financial condition, results of operations and cash flows.
Our pension and health care costs are subject to numerous factors which could cause these costs to change
. We have defined benefit pension plans covering substantially all U.S. and Canadian employees. We provide retiree health care benefits to certain of our U.S. salaried and certain hourly employees. Our pension costs are dependent upon numerous pension plan provisions that are subject to interpretations and factors resulting from actual plan experience and assumptions of future experience. Pension plan assets are primarily made up of equity and fixed income investments. Fluctuations in actual equity market returns; changes in general interest rates and changes in the number of retirees may result in increased pension costs in future periods. Likewise, changes in assumptions regarding current discount rates and expected rates of return on plan assets could also increase pension and health care costs. Although we froze our U.S. defined benefit plan in January 2010 in terms of future service credits, we continue to be subject to market risk on pension plan assets as well as discount rates on long-term obligations. Significant adverse changes in the factors affecting our pension and health care costs could adversely affect our cash flows, financial condition and results of operations.
Our pension plans are currently underfunded, and over time we will be required to make cash payments to the plans, reducing the cash available for our business.
We record a liability associated with our pension plans equal to the excess of the benefit obligation over the fair value of plan assets. The benefit liability recorded under the
8
provisions of Accounting Standards Codification (ASC) 715, “Compensation—Retirement Benefits,” at
December 31, 2012
was
$92.7 million
. Although we expect to have no obligation to fund our plans in 2013, we continually reassess the amount and timing of any discretionary contributions. Regardless of whether we make a discretionary contribution in 2013, over the next several years we may make contributions to the plans that are likely to be material. The amount of such contributions will depend upon a number of factors, principally the actual earnings and changes in values of plan assets and changes in interest rates.
A portion of our operations are conducted by joint ventures that we cannot operate solely for our benefit.
We conduct a portion of our operations through joint ventures. In joint ventures we share ownership and management of a company with one or more parties who may or may not have the same goals, strategies, priorities or resources as we do. In general, joint ventures are intended to be operated for the benefit of all co-owners, rather than for our exclusive benefit. Operating a business as a joint venture often requires additional organizational formalities as well as time-consuming procedures for sharing information and making decisions. In joint ventures, we are required to pay more attention to our relationship with our co-owners as well as with the joint venture, and if a co-owner changes, our relationship may be adversely affected. In addition, the benefits from a successful joint venture are shared among the co-owners, so that we do not receive all the benefits from our joint ventures.
We depend on third parties for transportation services and increases in costs and the availability of transportation could materially and adversely affect our business and operations.
Our business depends on the transportation of a large number of products, both domestically and internationally. We rely primarily on third parties for transportation of the products we manufacture and/or distribute as well as for delivery of our raw materials. In particular, a significant portion of the goods we manufacture and raw materials we use are transported by railroad or trucks, which are highly regulated. If any of our third-party transportation providers were to fail to deliver the goods we manufacture or distribute in a timely manner, we may be unable to sell those products at full value or at all. Similarly, if any of these providers were to fail to deliver raw materials to us in a timely manner, we may be unable to manufacture our products in response to customer demand. In addition, if any of these third parties were to cease operations or cease doing business with us, we may be unable to replace them at reasonable cost. Any failure of a third-party transportation provider to deliver raw materials or finished products in a timely manner could harm our reputation, negatively affect our customer relationships and have a material adverse effect on our financial condition and results of operation. In addition, an increase in transportation rates or fuel surcharges could materially and adversely affect our sales and profitability.
We are subject to significant environmental regulation and environmental compliance expenditures and liabilities.
Our businesses are subject to many environmental laws and regulations, particularly with respect to discharges of pollutants and other emissions on or into land, water and air, and the disposal and remediation of hazardous substances or other contaminants and the restoration and reforestation of timberlands. Compliance with these laws and regulations is a significant factor in our business. We have incurred and expect to continue to incur significant expenditures to comply with applicable environmental laws and regulations. Moreover, some or all of the environmental laws and regulations to which we are subject could become more stringent in the future. Our failure to comply with applicable environmental laws and regulations and permit requirements could result in civil or criminal fines or penalties or enforcement actions, including regulatory or judicial orders enjoining or curtailing operations or requiring corrective measures, installation of pollution control equipment or remedial actions.
Some environmental laws and regulations impose liability and responsibility on present and former owners, operators or users of facilities and sites for contamination at such facilities and sites without regard to causation or knowledge of contamination. In addition, we occasionally evaluate various alternatives with respect to our facilities, including possible dispositions or closures. Investigations undertaken in connection with these activities may lead to discoveries of contamination that must be remediated, and closures of facilities may trigger compliance requirements that are not applicable to operating facilities. Consequently, we cannot assure you that existing or future circumstances or developments with respect to contamination will not require significant expenditures by us.
We are involved in various environmental matters, product liability and other legal proceedings. The outcome of these matters and proceedings and the magnitude of related costs and liabilities are subject to uncertainties.
The conduct of our business involves the use of hazardous substances and the generation of contaminants and pollutants.
9
In addition, the end-users of many of our products are members of the general public. We currently are or from time to time in the future may be involved in a number of environmental matters and legal proceedings, including legal proceedings involving anti-trust, warranty or non-warranty product liability claims, negligence and other claims, including claims for wrongful death, personal injury and property damage alleged to have arisen out of the use by others of our or our predecessors’ products or the release by us or our predecessors of hazardous substances. Environmental matters and legal matters and proceedings, including class action settlements relating to certain of our products, have in the past caused and in the future may cause us to incur substantial costs. We have established contingency reserves in our consolidated financial statements with respect to the estimated costs of existing environmental matters and legal proceedings to the extent that our management has determined that such costs are both probable and reasonably estimable as to amount. However, such reserves are based upon various estimates and assumptions relating to future events and circumstances, all of which are subject to inherent uncertainties. We regularly monitor our estimated exposure to environmental and litigation loss contingencies and, as additional information becomes known, may change our estimates significantly. However, no estimate of the range of any such change can be made at this time. We may incur costs in respect of existing and future environmental matters and legal proceedings as to which no contingency reserves have been established. We cannot assure you that we will have sufficient resources available to satisfy the related costs and expenses associated with these matters and proceedings.
Settlements of tax exposures may exceed the amounts we have established for known estimated tax exposures.
We maintain reserves for known estimated tax exposures in federal, state and international jurisdictions and uncertain tax positions. Significant income tax exposures may include potential challenges to intercompany pricing and loans, the treatment of financing, acquisition and disposition transactions, the use of hybrid entities and other matters. These exposures are settled primarily through the closure of audits with the taxing jurisdictions and, on occasion, through the judicial process, either of which may produce a result inconsistent with past estimates. We believe that we have established appropriate reserves for estimated exposures; however, if actual results differ materially from our estimates we could experience a material adverse effect on our financial condition, results of operations and cash flows. In addition, our deferred tax liabilities include substantial amounts related to installment sales of timber lands in 1998 and 2003 for which we have previously monetized most of the installment receivable. As a result of these monetizations, we will be required to fund these liabilities from sources other than such installments, potentially including such tax loss and credit carryovers as may then be available.
Fluctuations in foreign currency exchange rates could result in currency exchange losses and reductions in stockholder’s equity.
A significant portion of our operations are conducted through foreign subsidiaries. The functional currency for our Canadian subsidiary is the U.S. dollar. The financial statements of this foreign subsidiary are remeasured into U.S. dollars using the historical exchange rate for property, plant and equipment, timber and timberlands, equity and certain other non-monetary assets and liabilities and related depreciation and amortization on these assets and liabilities. These transaction and translation gains or losses are recorded in foreign exchange gains (losses) in the income statement. The functional currency of our Chilean subsidiary is the Chilean
peso
and the functional currency in our Brazil subsidiary is the Brazilian
real
. Translation adjustments, which are based upon the exchange rate at the balance sheet date for assets and liabilities and the weighted average rate for the income statement, are recorded in the Accumulated Comprehensive Income (Loss) section of Stockholders’ Equity. Therefore, changes in the Canadian dollar, the Chilean
peso
or the Brazilian
real
relative to the U.S. dollar may have a material adverse effect on our financial condition and results of operations.
Our ability to service our indebtedness, to refinance our indebtedness or to fund our other liquidity needs is subject to various risks.
Our ability to make scheduled payments on and to refinance our indebtedness depends on and is subject to our financial and operating performance, which in turn is affected by general and regional economic, financial, competitive, business and other factors, including the availability of financing in the banking and capital markets as well as the other risks described herein. In particular, demand for our products correlates to a significant degree to the level of residential construction activity in North America, which historically has been characterized by significant cyclicality. Over the last several years, housing starts remained below “normal” levels. This reduced level of building was caused, in part, by an increase in the inventory of homes for sale, a more restrictive mortgage market and a slowed economy. There can be no assurance as to when, or if the housing market, will rebound to “normal levels”. We have experienced significant losses from operations and significant net cash
10
used in operating activities in recent periods. Accordingly, we cannot assure you that our business will generate sufficient cash flows from operations or that future borrowings will be available to us in an amount sufficient to enable us to service our debt, to refinance our debt or to fund our other liquidity needs. If we are unable to service our debt obligations or to fund our other liquidity needs, we could be forced to curtail our operations, reorganize our capital structure or liquidate some or all of our assets in a manner that could cause the holders of our securities to experience a partial or total loss of their investment in us.
We have not independently verified the results of third-party research or confirmed assumptions or judgments upon which it may be based, and the forecasted and other forward-looking information contained therein is subject to inherent uncertainties.
We refer in this report and other documents that we file with the SEC to historical, forecasted and other forward-looking information published by sources such as
RISI, FEA, Random Lengths
and the U.S. Census Bureau that we believe to be reliable. However, we have not independently verified this information and, with respect to the forecasted and forward-looking information, have not independently confirmed the assumptions and judgments upon which it is based. Forecasted and other forward looking information is necessarily based on assumptions regarding future occurrences, events, conditions and circumstances and subjective judgments relating to various matters, and is subject to inherent uncertainties. Actual results may differ materially from the results expressed or implied by, or based upon, such forecasted and forward-looking information.
Initiatives to Upgrade Our Information Technology Infrastructure Involve Many Risks.
We regularly implement business process improvement initiatives to optimize our performance. Our current initiatives include plans to further standardize the business processes and technology that support our strategies through implementation of an new software solution over the next few years. We may experience difficulties as we transition to these new or upgraded systems and processes, including loss of data and decreases in productivity as our personnel become familiar with new systems. In addition, transitioning to these new or upgraded systems requires significant capital investments and personnel resources. Difficulties in implementing new or upgraded information systems or significant system failures could disrupt our operations and have a material adverse effect on our business, financial condition, results of operations or cash flows. In addition, we will experience significant changes in our internal controls over financial reporting as our implementation progresses. If we are unable to manage these changes successfully, our ability to timely and accurately process transactions and report our results of operations could be adversely affected.
|
ITEM 1B.
|
Unresolved Staff Comments
|
None.
11
ITEM 2.
Properties
Information regarding our principal properties and facilities is set forth in the following tables. Information regarding production capacities is based on normal operating rates and normal production mixes under current market conditions, taking into account known constraints such as log supply. Market conditions, fluctuations in log supply, and the nature of current orders may cause actual production rates and mixes to vary significantly from the production rates and mixes shown.
ORIENTED STRAND BOARD
Oriented Strand Board Panel Plants
1
10
plants—
4,955 million
square feet annual capacity,
3
/
8
” basis
|
|
Square feet
in millions
|
|
|
Carthage, TX
|
500
|
|
|
Chambord, Quebec, Canada
2
|
470
|
|
|
Dawson Creek, BC, Canada
2
|
380
|
|
|
Hanceville, AL
|
410
|
|
|
Jasper, TX
|
475
|
|
|
Maniwaki, Quebec, Canada
|
650
|
|
|
Roxboro, NC
|
500
|
|
|
Sagola, MI
|
410
|
|
|
Swan Valley, Manitoba, Canada
|
410
|
|
|
Thomasville, AL
2
|
750
|
|
SIDING
Siding and Specialty Plants
6
plants—
1,320 million
square feet annual capacity,
3
/
8
” basis
|
|
Square feet
in millions
|
|
|
Newberry, MI
|
150
|
|
|
Hayward, WI
3
|
475
|
|
|
Tomahawk, WI
|
140
|
|
|
Two Harbors, MN
|
155
|
|
|
Roaring River, NC
|
300
|
|
|
East River, Nova Scotia, Canada
|
100
|
|
ENGINEERED WOOD PRODUCTS
I-joist Plants
4
1 plant—
80 million
lineal feet annual capacity
|
1 to 3 shifts per day, 5 days per week
|
Lineal feet
in millions
|
|
|
Red Bluff, CA
|
80
|
|
12
LVL Plants
2 plants—
9,400 thousand
cubic feet annual capacity
|
|
Cubic feet
in thousands
|
|
|
Golden, BC, Canada
|
4,800
|
|
|
Wilmington, NC
|
4,600
|
|
LSL Plant
1 plant—
7,000 thousand
cubic feet annual capacity
|
|
Cubic feet
in thousands
|
|
|
Houlton, ME
|
7,000
|
|
SOUTH AMERICAN OPERATIONS
3
plants—
680 million
square feet annual capacity.
3
/
8
” basis
|
|
Square feet
in millions
|
|
|
Panguipulli, Chile
|
130
|
|
|
Lautaro, Chile
|
160
|
|
|
Ponta Grossa, Brazil
|
390
|
|
OTHER
5
Plastic Mouldings Plant
1 plant—
300 million
lineal feet annual capacity
|
|
Lineal feet
in millions
|
|
|
Middlebury, IN
|
300
|
|
_______________
|
1
|
In addition to the plants described, our 50/50 joint venture with Canfor Corporation owns and operates a plant in Ft. St. John, British Columbia, Canada, that has an annual production capacity of 820 million square feet of OSB. LP currently intends to acquire the remaining interest in the plant in 2013.
|
|
2
|
Facility indefinitely curtailed as of
December 31, 2012
, however LP currently plans to resume operations at the Thomasville, AL facility in mid 2013.
|
|
3
|
The Hayward, WI siding facility produces both commodity OSB and SmartSide siding.
|
|
4
|
In addition to the plant described, our 50/50 joint venture with Resolute Forest Products owns and operates a plant in St. Prime, Quebec, Canada and a plant in La Rouche, Quebec, Canada. The combined annual production capacity of these facilities is 140 million lineal feet.
|
|
5
|
The above table does not reflect the 7 cellulose insulation facilities that are operated by U.S. GreenFiber, LLC, our 50/50 joint venture with Casella Waste Systems.
|
13
CANADIAN TIMBERLAND LICENSE AGREEMENTS
|
Location
|
Acres
|
|
|
British Columbia
|
9,100,000
|
|
|
Manitoba
|
8,930,000
|
|
|
Nova Scotia
|
800,000
|
|
|
Quebec
|
27,700,000
|
|
|
Total timberlands under license agreements in Canada
|
46,530,000
|
|
We also have timber-cutting rights on
21,416
acres on government and privately owned timberlands in the U.S.
Our Canadian subsidiary has arrangements with four Canadian provincial governments which give our subsidiary the right to harvest a volume of wood off public land from defined forest areas under supply and forest management agreements, long-term pulpwood agreements, and various other timber licenses. The acreage noted above is the gross amount of the licenses and is not reflective of the amount of timber acreage that we currently manage. We also obtain wood from private parties in certain cases where the provincial governments require us to obtain logs from private parties prior to harvesting from the licenses to meet our raw materials needs. The timberland licenses above do not include the timber we have under license associated with our joint venture OSB mill with Canfor Corporation located in British Columbia.
14
ITEM 3.
Legal Proceedings
Certain environmental matters and legal proceedings are discussed below.
ENVIRONMENTAL MATTERS
We are involved in a number of environmental proceedings and activities, and may be wholly or partially responsible for known or unknown contamination existing at a number of other sites at which we have conducted operations or disposed of wastes. Based on the information currently available, management believes that any fines, penalties or other costs or losses resulting from these matters will not have a material adverse effect on our financial position, results of operations, cash flows or liquidity.
ARS LITIGATION
On July 31, 2009, LP filed suit in the United States District Court for the Northern District of California captioned, Louisiana Pacific Corporation v. Money Market 1 Institutional Investment Dealer; Merrill Lynch & Co.,
Inc.; Merrill Lynch, Pierce, Fenner & Smith Incorporated; and Deutsche Bank Securities Inc. (Civil Action No.09cv3529). Merrill Lynch caused this case to be transferred to the United States District Court for the Southern District of New York (Civil Action No. 09 MD 2030) where Merrill Lynch had multiple similar cases pending as a result of a Multi-District Litigation Panel ruling. This matter arose out of LP's acquisition of certain ARS structured and underwritten by Merrill Lynch and Deutsche Bank with an approximate par value of $145.9 million. In the lawsuit, LP alleges that the defendants made misrepresentations and omissions of material facts in connection with the issuance of and the auctions for the ARS which constitute a violation of both state and federal securities laws, as well as common law fraud. LP seeks recovery of compensatory damages, rescission of the purchase of the securities at par value, consequential damages, punitive damages, attorneys' fees and any other damages the court deems appropriate under the circumstances.
On February 15, 2012, the Court granted Merrill Lynch's motion to dismiss the case against Merrill Lynch. LP plans to appeal that decision at an appropriate time. Cases against MM1 remain pending in the Northern District of California and the Southern District of New York. LP is seeking default judgement against MM1 in both cases.
On November 30, 2012, we entered into a settlement agreement and mutual release with Deutsche Bank Securities Inc, (DBSI) relating to the case against DBSI. Pursuant to the agreement, DBSI, without admitting any liability or wrong-doing, paid to us the sum of $20 million, we dismissed the legal proceedings against DBSI with prejudice, and we and DBSI released the other from all claims and liabilities arising out of the sale and purchase of the auction rate securities and the related legal proceedings.
HARDBOARD TRIM LITIGATION
We were named in four putative class action lawsuits filed against us in United States District Courts during the first quarter of 2012 related to nontreated hardboard trim product formerly manufactured at our Roaring River, North Carolina hardboard plant: Brown v. Louisiana-Pacific Corporation., Case No. 4:12-CV-00102-RP-TJS (S.D. Iowa) (filed March 8, 2012, as a state-wide putative class); Holbrook v. Louisiana-Pacific Corporation, et al., Case No. 3:12-CV-00484-JGC (N.D. Ohio) (filed February 28, 2012, as a state-wide putative class); Bristol Village Inc. v. Louisiana-Pacific Corporation, et al., Case No. 1:12-CV-00263 (W.D.N.Y.) (filed March 30, 2012, as a state-wide putative class or, alternatively, as a nation-wide putative class) and Prevett v. Louisiana-Pacific, Case No. 6:12-CV-348-ORL-18-KRS (M.D. Fla) (filed March 5, 2012, as a state-wide putative class). The Prevett v. Louisiana Pacific lawsuit was voluntarily dismissed by the plaintiffs on May 31, 2012. This lawsuit was replaced by Riley v. Louisiana-Pacific, Case No. 6:12-CV-00837-18 (M.D. Fla) (filed June 4, 2012 as a state-wide putative class). A fifth lawsuit, Eugene Lipov v. Louisiana-Pacific, Case 1:12-CV-00439- JTN (W.D. Mich) (filed May 3, 2012) was filed as a statewide putative class action in the second quarter of 2012. These lawsuits follow two state-wide putative class action lawsuits previously filed against LP in United States District Courts: Ellis, et al. v. Louisiana-Pacific Corp., Case No. 3:11-CV-191 (W.D.N.C.); and Hart, et al. v. Louisiana-Pacific Corp., Case No. 2:08-CV-00047
15
(E.D.N.C.). The Ellis case was dismissed by the District Court, and affirmed by the United States Court of Appeals for the Fourth Circuit on November 2, 2012, and the Hart case has been certified by the District Court as a class action.
Plaintiffs moved to combine pretrial matters through a Multidistrict Litigation (MDL) motion, filed as In Re: Louisiana-Pacific Corporation Trimboard Siding Marketing, Sales Practice and Products Liability Litigation MDL No. 2366 (U.S. Judicial Panel on Multidistrict Litigation) seeking to transfer all cases to the Eastern District of North Carolina. Louisiana-Pacific objected to the MDL motion and on June 11, 2012, the MDL Panel denied plaintiffs Motion to Transfer. Subsequently, the Holbrook case was dismissed by the District Court on August 29, 2012 and has been appealed by the plaintiffs to the United States Court of Appeals for the Sixth Circuit.
The plaintiffs in these lawsuits seek to certify classes consisting of all persons that own structures within the respective states in which the lawsuit were filed (or, in some cases, within the United States) on which the hardboard trim in question is installed. The plaintiffs seek unspecified damages and injunctive and other relief under various state law theories, including negligence, violations of consumer protection laws, and breaches of implied and express warranties, fraud, and unjust enrichment. While some individual owners of structures within the putative classes may have valid warranty claims, we believe that the claims asserted on a class basis are without merit and we intend to defend these matters vigorously. We have established warranty reserves for the hardboard trim in question pursuant to our normal business practices, and we do not believe that the resolution of these lawsuits will have a material effect on our financial condition, results of operations, cash flows or liquidity.
OTHER PROCEEDINGS
LP is party to other legal proceedings. Based on the information currently available, LP believes that the resolution of such proceedings will not have a material adverse effect on its financial position, results of operations, cash flows or liquidity.
CONTINGENCY RESERVES
We maintain reserves for the estimated cost of the legal and environmental matters referred to above. However, as with any estimate, there is uncertainty of predicting the outcomes of claims and litigation and environmental investigations and remediation efforts that could cause actual costs to vary materially from current estimates. Due to various uncertainties, we cannot predict to what degree actual payments will exceed the recorded liabilities related to these matters. However, it is possible that, in either the near term or the longer term, revised estimates or actual payments will significantly exceed the recorded liabilities.
For information regarding our financial statement reserves for the estimated costs of the environmental and legal matters referred to above, see Note 18 of the Notes to financial statements included in item 8 in this report.
ITEM 4.
Mine Safety Disclosures
N/A
16
|
ITEM 5.
|
Market for Registrant’s Common Equity, Related Stockholder Matters and Issuer Purchases of Equity Securities
|
The common stock of LP is listed on the New York Stock Exchange with the ticker symbol “LPX.” The Dow-Jones newspaper quotations symbol for the common stock is “LaPac.” Information regarding the high and low sales prices for the common stock for each quarter of the last two years is as follows:
|
1ST QTR
|
2ND QTR
|
3RD QTR
|
4TH QTR
|
||||||||||||
|
HIGH AND LOW STOCK PRICES
|
|||||||||||||||
|
2012 High
|
$
|
10.18
|
|
$
|
11.00
|
|
$
|
15.50
|
|
$
|
19.34
|
|
|||
|
Low
|
$
|
7.66
|
|
$
|
7.81
|
|
$
|
9.87
|
|
$
|
12.50
|
|
|||
|
2011 High
|
$
|
11.57
|
|
$
|
10.66
|
|
$
|
8.50
|
|
$
|
8.21
|
|
|||
|
Low
|
$
|
9.26
|
|
$
|
7.25
|
|
$
|
5.10
|
|
$
|
4.63
|
|
|||
As of
February 28, 2013
, there were approximately
8,763
holders of record of our common stock. No dividends were paid in
2012
or
2011
. Our ability to pay dividends in the future is subject to limitations set forth in the agreement governing our bank credit facility and the indenture governing our Senior Notes due in 2020.
ISSUER PURCHASES OF EQUITY SECURITIES
None.
17
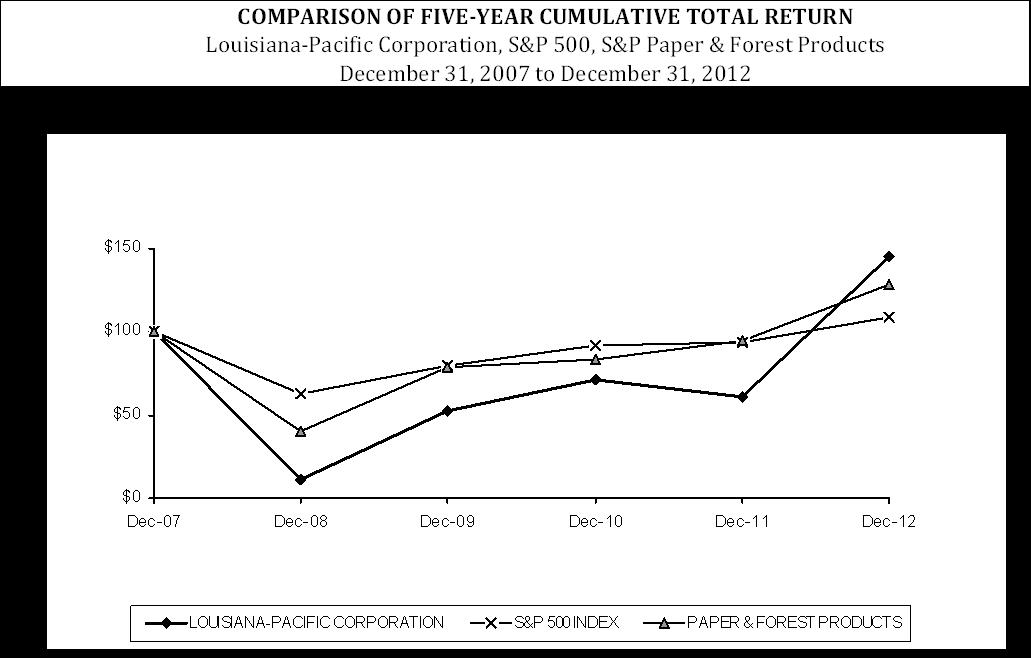
PERFORMANCE GRAPH
The following graph compares the total cumulative return to investors, including dividends paid (assuming reinvestment of dividends) and appreciation or depreciation in stock price, from an investment in LP Common Stock for the period December 31, 2007 through
December 31, 2012
, to the total cumulative return to investors from the Standard & Poor’s 500 Stock Index and the Standard & Poor’s Paper and Forest Products Index for the same period. Stockholders are cautioned that the graph shows the returns to investors only as of the dates noted and may not be representative of the returns for any other past or future period.
|
Dec-07
|
Dec-08
|
Dec-09
|
Dec-10
|
Dec-11
|
Dec-12
|
||||||||||||||||||
|
LOUISIANA-PACIFIC CORPORATION
|
$
|
100
|
|
$
|
12
|
|
$
|
52
|
|
$
|
71
|
|
$
|
61
|
|
$
|
145
|
|
|||||
|
S&P 500 INDEX
|
$
|
100
|
|
$
|
63
|
|
$
|
80
|
|
$
|
92
|
|
$
|
94
|
|
$
|
109
|
|
|||||
|
PAPER & FOREST PRODUCTS
|
$
|
100
|
|
$
|
40
|
|
$
|
79
|
|
$
|
83
|
|
$
|
95
|
|
$
|
128
|
|
|||||
18
ITEM 6.
Selected Financial Data
|
Dollar amounts in millions, except per share
|
2012
|
2011
|
2010
1
|
2009
|
2008
|
||||||||||||||
|
Year ended December 31
|
|||||||||||||||||||
|
SUMMARY INCOME STATEMENT DATA
|
|||||||||||||||||||
|
Net sales
|
$
|
1,715.8
|
|
$
|
1,356.9
|
|
$
|
1,383.6
|
|
$
|
1,061.0
|
|
$
|
1,379.2
|
|
||||
|
Income (loss) from continuing operations before cumulative effect of change in accounting principle
|
32.1
|
|
(171.9
|
)
|
(32.2
|
)
|
(116.5
|
)
|
(563.1
|
)
|
|||||||||
|
Loss from discontinued operations
|
(3.3
|
)
|
(9.2
|
)
|
(6.4
|
)
|
(5.3
|
)
|
(13.7
|
)
|
|||||||||
|
Net income (loss)
|
28.8
|
|
(181.1
|
)
|
(38.6
|
)
|
(121.8
|
)
|
(576.8
|
)
|
|||||||||
|
Net income (loss) attributed to Louisiana-Pacific Corporation
|
28.8
|
|
(181.3
|
)
|
(39.0
|
)
|
(120.9
|
)
|
(576.6
|
)
|
|||||||||
|
Income (loss) from continuing operations before cumulative effect of change in accounting principle per share—basic
|
$
|
0.23
|
|
$
|
(1.29
|
)
|
$
|
(0.25
|
)
|
$
|
(1.06
|
)
|
$
|
(5.47
|
)
|
||||
|
Net income (loss) per share—basic
|
$
|
0.21
|
|
$
|
(1.36
|
)
|
$
|
(0.30
|
)
|
$
|
(1.11
|
)
|
$
|
(5.60
|
)
|
||||
|
Income (loss) from continuing operations before cumulative effect of change in accounting principle per share—diluted
|
$
|
0.22
|
|
$
|
(1.29
|
)
|
$
|
(0.25
|
)
|
$
|
(1.06
|
)
|
$
|
(5.47
|
)
|
||||
|
Net income (loss) per share—diluted
|
$
|
0.20
|
|
$
|
(1.36
|
)
|
$
|
(0.30
|
)
|
$
|
(1.11
|
)
|
$
|
(5.60
|
)
|
||||
|
Average shares of common stock outstanding (millions)
|
|||||||||||||||||||
|
Basic
|
137.1
|
|
133.2
|
|
129.1
|
|
108.5
|
|
102.9
|
|
|||||||||
|
Diluted
|
142.6
|
|
133.2
|
|
129.1
|
|
108.5
|
|
102.9
|
|
|||||||||
|
Cash dividends declared per common share
|
$
|
—
|
|
$
|
—
|
|
$
|
—
|
|
$
|
—
|
|
$
|
0.30
|
|
||||
|
SUMMARY BALANCE SHEET INFORMATION
|
|||||||||||||||||||
|
Total assets
|
$
|
2,331.0
|
|
$
|
2,139.9
|
|
$
|
2,410.6
|
|
$
|
2,620.3
|
|
$
|
2,601.6
|
|
||||
|
Long-term debt, excluding current portion
|
$
|
782.7
|
|
$
|
715.9
|
|
$
|
714.5
|
|
$
|
706.3
|
|
$
|
841.3
|
|
||||
|
Contingency reserves, excluding current portion
|
$
|
12.8
|
|
$
|
17.2
|
|
$
|
25.9
|
|
$
|
30.8
|
|
$
|
30.5
|
|
||||
|
Stockholders’ equity
|
$
|
1,033.8
|
|
$
|
1,000.9
|
|
$
|
1,217.8
|
|
$
|
1,253.5
|
|
$
|
1,224.2
|
|
||||
_______________
|
1
|
As of January 1, 2010, LP adopted guidance codified under ASC Topic 860, “Transfers and Servicing” (ASC 860) which eliminated the concept of a qualifying special-purpose entity (QSPE) for accounting purposes.
|
19
ITEM 7.
Management’s Discussion and Analysis of Financial Condition and Results of Operations
OVERVIEW
General
Our products are used primarily in new home construction, repair and remodeling, and manufactured housing. We also market and sell our products in light industrial and commercial construction and we have a modest export business. Our manufacturing facilities are primarily located in the U.S. and Canada, but we also operate two facilities in Chile and one facility in Brazil.
To serve these markets, we operate in four segments: North America Oriented Strand Board (OSB); Siding; Engineered Wood Products (EWP); and South America. OSB is the most significant segment, accounting for
47%
of continuing sales in
2012
,
40%
in
2011
and
44%
in
2010
.
OSB is sold as a commodity for which sales prices fluctuate daily based on market factors over which we have little or no control. We cannot predict whether the prices of our products will remain at current levels, increase or decrease in the future.
During 2012, we experienced an increase in demand for all of our products as the overall housing market continued to improve from the severe weakness experienced in prior years.
Factors Affecting Our Results
Revenues and Operating Costs.
We derive our revenues from sales of our products. The unit volumes of products sold and the prices at which sales are made determine the amount of our revenues. These volumes and prices are affected by the overall level of demand for, and supply of, products of the type we sell and comparable or substitute products, and by competitive conditions.
Our operating results reflect the relationship between the amount of our revenues and our costs of production and other operating costs and expenses. Our costs of production are affected by, among other factors, costs of raw materials (primarily wood fiber and various petroleum-based resins) and energy costs, which in turn are affected by the overall market supply of and demand for these manufacturing inputs.
Demand for Building Products
Demand for our products correlates to a significant degree to the level of residential construction activity in North America, which historically has been characterized by significant cyclicality. This activity can be further delineated into three areas: (1) new home construction; (2) repair and remodeling; and (3) manufactured housing.
New Home Construction
. Demand for our products correlates to a significant degree to the level of new home construction activity in North America, which historically has been characterized by significant cyclicality. The U.S. Census Bureau reported that actual single and multi-family housing starts in 2012 were about
29%
higher than 2011, which were about
4%
higher than such housing starts in 2010. However when comparing 2012 housing starts to the average of the last ten years as reported by the U.S. Census Bureau, 2012 housing starts were about
43%
lower than that average. We believe that the reduced level of building is due to the continued high levels of unemployment, delayed household formations due to the sluggish economy, foreclosure activity and a more restrictive mortgage market.
While near term residential construction is constrained in the U.S., positive long-term fundamentals exist. Increased immigration, the changing age distribution of the population, the high number of adults living with their parents and historically low interest rates are expected to lead to more household formations. The chart below, which is based on data published by U.S. Census Bureau, provides a graphical summary of new housing starts for single and multi-family in the U.S. showing actual and rolling five and ten year averages for housing starts in thousands.
20
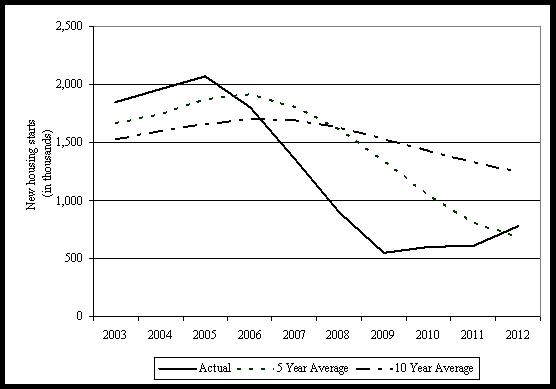
Repair and Remodeling
. Demand for building materials to support home improvement projects is largely tied to the size and age of the existing housing stock in North America and consumer confidence. In this regard, the 1970s and 1980s had some of the highest levels of building activity. This puts these homes at an age of approximately 30-40 years, which has been shown to be consistent with the highest per home expenditure rate on repair and remodeling. With the rise in the number and scale of home improvement stores in North America, individuals now have ready and convenient access to obtain the building materials needed for repair and remodeling, as well as increased access to installation services. Although this market weakened in 2010 and 2011 due to reduced home sales and reduced financing to fund repair and remodeling expenditures, it did not decline as significantly as new home construction activity.
Manufactured Housing
. Over the last several years, manufactured housing has suffered. There are several factors that have led to the decline in the number of manufactured housing units produced, including a lack of available financing, increased ability of potential customers to purchase site-built starter homes and financial difficulties at some of the larger manufactured housing producers.
Supply of Building Products
OSB is a commodity product, and it is, along with all of our products, subject to competition from manufacturers worldwide. Product supply is influenced primarily by fluctuations in available manufacturing capacity and imports. According to FEA (Forest Economic Advisors, LLC), total North American OSB annual production capacity is projected to increase by approximately
2.9 billion
square feet in the period from 2013 to 2016 while plywood production capacity is projected to increase by
370 million
square feet for the same period. According to FEA, OSB accounted for approximately
65%
of North American structural panel production capacity in 2012, with plywood accounting for the remainder. Going forward, it is expected that OSB will continue to capture market share from plywood. FEA forecasts, as of December 2012, that OSB will comprise approximately
66%
of the structural panel market by 2016. The chart below, which is based on data and forecasts published by FEA, depicts past and forecasted North America structural wood production capacities in billions of square feet.
21
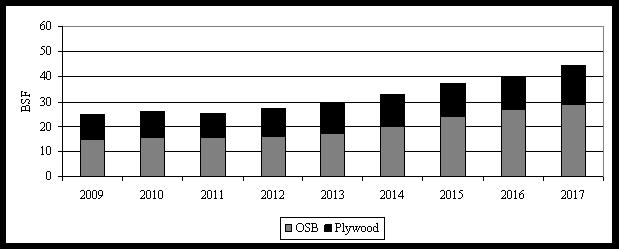
Putting Demand and Supply Together
As noted above, demand for building products is influenced by the general economy, demographics and need for housing. In the case of OSB, generally, lower demand coupled with higher production capacity will result in lower pricing. The chart below, as calculated by FEA (as of December 2012), shows the demand capacity (demand divided by supply) for OSB in 2008 through 2012 as well as FEA’s forecast through 2016 based upon estimated future demand and supply.
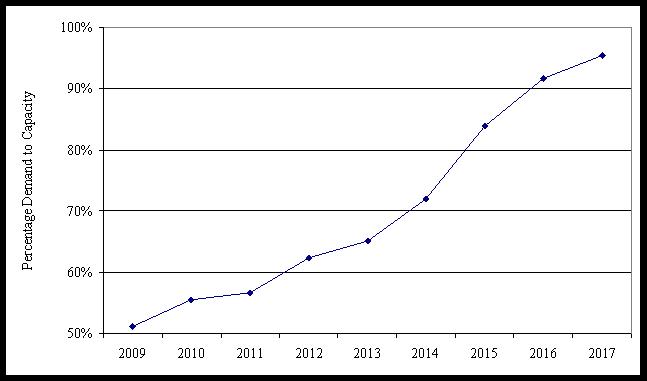
Product Pricing.
Historical prices for our products have been volatile, and we, like other participants in the building products industry, have limited influence over the timing and extent of price changes for our products. The estimated average North Central wholesale price for OSB (per thousand square feet 7/16” basis) from 2005 through 2012, as published by
Random Lengths
, an industry publication, is presented below. FEA’s forecast (as of December 2012) for average North Central wholesale pricing for OSB (per thousand square feet 7/16” basis) through 2016 is also shown.
22
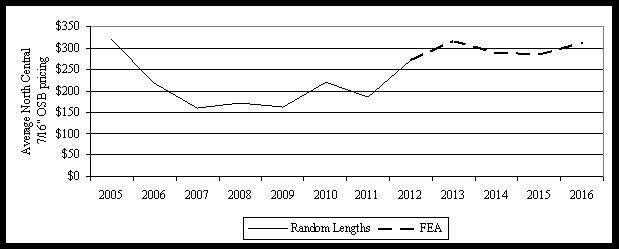
Implementation of System Upgrade
During 2012, we conducted a thorough review of our business to assess our current information systems. After extensive study and analysis, we determined that a system upgrade was required. We do anticipate that this system upgrade will provide us benefits in terms of reporting and data analysis in addition to upgrading our aging systems. We anticipate the cost of implementation, both capital and expense, to be approximately $30 million which will consisting primarily of software and hardware costs, system integrator costs, labor costs, and data migration. We anticipate completing the first stage of the systems upgrade in early 2014.
23
CRITICAL ACCOUNTING POLICIES AND SIGNIFICANT ESTIMATES
A discussion of our significant accounting policies and significant accounting estimates and judgments is presented in Note 1 of the Notes to the financial statements in item 8 of this report. Throughout the preparation of the financial statements, we employ significant judgments in the application of accounting principles and methods. These judgments are primarily related to the assumptions used to arrive at various estimates. For 2012, these significant accounting estimates and judgments include:
Legal Contingencies.
Our estimates of loss contingencies for legal proceedings are based on various judgments and assumptions regarding the potential resolution or disposition of the underlying claims and associated costs. In making judgments and assumptions regarding legal contingencies for ongoing class action settlements, we consider, among other things, discernible trends in the rate of claims asserted and related damage estimates and information obtained through consultation with statisticians and economists, including statistical analysis of potential outcomes based on experience to date and the experience of third parties who have been subject to product-related claims judged to be comparable. Due to the numerous variables associated with these judgments and assumptions, both the precision and reliability of the resulting estimates of the related loss contingencies are subject to substantial uncertainties. We regularly monitor our estimated exposure to these contingencies and, as additional information becomes known, may change our estimates significantly.
Environmental Contingencies
. Our estimates of loss contingencies for environmental matters are based on various judgments and assumptions. These estimates typically reflect judgments and assumptions relating to the probable nature, magnitude and timing of required investigation, remediation and/or monitoring activities and the probable cost of these activities, and in some cases reflect judgments and assumptions relating to the obligation or willingness and ability of third parties to bear a proportionate or allocated share of the cost of these activities, including third parties who purchased assets from us subject to environmental liabilities. We consider the ability of third parties to pay their apportioned cost when developing our estimates. In making these judgments and assumptions related to the development of our loss contingencies, we consider, among other things, the activity to date at particular sites, information obtained through consultation with applicable regulatory authorities and third-party consultants and contractors and our historical experience at other sites that are judged to be comparable. Due to the numerous variables associated with these judgments and assumptions, and the effects of changes in governmental regulation and environmental technologies, both the precision and reliability of the resulting estimates of the related contingencies are subject to substantial uncertainties. We regularly monitor our estimated exposure to environmental loss contingencies and, as additional information becomes known, may change our estimates significantly. At
December 31, 2012
, we excluded from our estimates approximately
$2.2 million
of potential environmental liabilities that we estimate will be allocated to third parties pursuant to existing and anticipated future cost sharing arrangements.
Impairment of Long-Lived Assets.
We review the long-lived assets held and used by us (primarily property, plant and equipment and timber and timberlands) for impairment when events or changes in circumstances indicate that the carrying amount of assets may not be recoverable. We consider the necessity of undertaking such a review at least quarterly, and also when certain events or changes in circumstances occur. Events and changes in circumstances that may necessitate such a review include, but are not limited to: a significant decrease in the market price of a long-lived asset or group of long-lived assets; a significant adverse change in the extent or manner in which a long-lived asset or group of long-lived assets is being used or in its physical condition; a significant adverse change in legal factors or in the business climate that could affect the value of a long-lived asset or group of long-lived assets, including an adverse action or assessment by a regulator; an accumulation of costs significantly in excess of the amount originally expected for the acquisition or construction of a long-lived asset or group of long-lived assets; current-period operating or cash flow loss combined with a history of operating or cash flow losses or a projection or forecast that demonstrates continuing losses associated with the use of a long-lived asset or group of long-lived assets; and current expectation that, more likely than not, a long-lived asset or group of long-lived assets will be sold or otherwise disposed of significantly before the end of its previously estimated useful life. Identifying these events and changes in circumstances, and assessing their impact on the appropriate valuation of the affected assets under accounting principles generally accepted in the U.S., requires us to make judgments, assumptions and estimates.
24
In general, for assets held and used in our operations, impairments are recognized when the carrying amount of the long-lived asset or groups of long-lived assets is not recoverable and exceeds the fair value of the asset or group of assets. The carrying amount of a long-lived asset or groups of long-lived assets is not recoverable if it exceeds the sum of the undiscounted cash flows expected to result from the use and eventual disposition of the assets or group of assets. The key assumptions in estimating these cash flows relate to future production volumes, pricing of commodity or specialty products and future estimates of expenses to be incurred as reflected in our long-range internal planning models. Our assumptions regarding pricing are based upon the average pricing over the commodity cycle (generally five years) due to the inherent volatility of commodity product pricing, and reflect our assessment of information gathered from industry research firms, research reports published by investment analysts and other published forecasts. Our assumptions regarding expenses reflect our expectation that we will continue to reduce production costs to offset inflationary impacts.
When impairment is indicated for assets held and used in our operations, the book values of the affected assets are written down to their estimated fair value, which is generally based upon discounted future cash flows associated with the affected assets. When impairment is indicated for assets to be disposed of, the book values of the affected assets are written down to their estimated fair value, less estimated selling costs. Consequently, a determination to dispose of particular assets can require us to estimate the net sales proceeds expected to be realized upon such disposition, which may be less than the estimated undiscounted future net cash flows associated with such assets prior to such determination, and thus require an impairment charge. In situations where we have experience in selling assets of a similar nature, we may estimate net sales proceeds on the basis of that experience. In other situations, we hire independent appraisers to estimate net sales proceeds.
Due to the numerous variables associated with our judgments and assumptions relating to the valuation of assets in these circumstances, and the effects of changes in circumstances affecting these valuations, both the precision and reliability of the resulting estimates of the related impairment charges are subject to substantial uncertainties and, as additional information becomes known, we may change our estimates significantly.
Income Taxes.
The determination of the provision for income taxes, and the resulting current and deferred tax assets and liabilities, involves significant management judgment, and is based upon information and estimates available to management at the time of such determination. The final income tax liability to any taxing jurisdiction with respect to any calendar year will ultimately be determined long after our financial statements have been published for that year. We maintain reserves for known estimated tax exposures in federal, state and international jurisdictions; however, actual results may differ materially from our estimates.
Judgment is also applied in determining whether deferred tax assets will be realized in full or in part. When we consider it to be more likely than not that all or some portion of a deferred tax asset will not be realized, a valuation allowance is established for the amount of the deferred tax asset that is estimated not to be realizable. As of
December 31, 2012
, we had established valuation allowances against certain deferred tax assets, primarily related to state and foreign carryovers of net operating losses, credits and capital losses. We have not established valuation allowances against other deferred tax assets based upon tax strategies implemented or deferred tax liabilities which we anticipate to reverse within the carry forward period. Accordingly, changes in facts or circumstances affecting the likelihood of realizing a deferred tax asset could result in the need to record additional valuation allowances.
Pension Plans
. Most of our U.S. employees and many of our Canadian employees participate in defined benefit pension plans sponsored by LP. We account for the consequences of our sponsorship of these plans in accordance with accounting principles generally accepted in the U.S., which require us to make actuarial assumptions that are used to calculate the related assets, liabilities and expenses recorded in our financial statements. While we believe we have a reasonable basis for these assumptions, which include assumptions regarding long-term rates of return on plan assets, life expectancies, rates of increase in salary levels, rates at which future values should be discounted to determine present values and other matters, the amounts of our pension related assets, liabilities and expenses recorded in our financial statements would differ if we used other assumptions. See further discussion related to pension plans below under the heading “Defined Benefit Pension Plans” and in Note 13 of the Notes to the financial statements included in item 8 of this report.
25
Workers’ Compensation
. We are self insured for most of our U.S. employees’ workers compensation claims. We account for these plans in accordance with accounting principles generally accepted in the U.S., which require us to make actuarial assumptions that are used to calculate the related assets, liabilities and expenses recorded in our financial statements. While we believe we have a reasonable basis for these assumptions, which include assumptions regarding rates at which future values should be discounted to determine present values, expected future health care costs and other matters, the amounts of our liabilities and related expenses recorded in our financial statements would differ if we used other assumptions.
Warranty Obligations.
Customers are provided with a limited warranty against certain defects associated with our products for periods of up to fifty years. We estimate the costs to be incurred under these warranties and record a liability in the amount of such costs at the time product revenue is recognized. Factors that affect our warranty liability include the historical and anticipated rates of warranty claims and the cost of resolving such. We periodically assess the adequacy of our recorded warranty liability for each product and adjust the amounts as necessary. While we believe we have a reasonable basis for these assumptions, actual warranty costs in the future could differ from our estimates.
NON-GAAP FINANCIAL MEASURES
In evaluating our business, we utilize several non-GAAP financial measures. A non-GAAP financial measure is generally defined by the SEC as one that purports to measure historical or future financial performance, financial position or cash flows, but excludes or includes amounts that would not be so excluded or included under applicable GAAP guidance. In this report on Form 10-K, we disclose earnings (loss) from continuing operations before interest expense, taxes, depreciation and amortization (“EBITDA from continuing operations”) which is a non-GAAP financial measure. Additionally, we disclose Adjusted EBITDA from continuing operations which further adjusts EBITDA from continuing operations to exclude stock based compensation expense, (gain) loss on sales or impairment of long lived assets, other operating charges and credits, other-than-temporary investment impairment, (gain) loss on early debt extinguishment, investment income and realized gain on sale of long-term investments and goodwill impairment. Neither EBITDA from continuing operations nor Adjusted EBITDA from continuing operations is a substitute for the GAAP measure of net income or operating cash flows or for any other GAAP measures of operating performance or liquidity.
We have included EBITDA from continuing operations and Adjusted EBITDA from continuing operations in this report on Form 10-K because we use them as important supplemental measures of our performance and believe that they are frequently used by securities analysts, investors and other interested persons in the evaluation of companies in our industry, some of which present EBITDA when reporting their results. We use EBITDA from continuing operations and Adjusted EBITDA from continuing operations to evaluate our performance as compared to other companies in our industry that have different financing and capital structures and/or tax rates. It should be noted that companies calculate EBITDA and Adjusted EBITDA differently and, therefore, our EBITDA and Adjusted EBITDA measures may not be comparable to EBITDA and Adjusted EBITDA reported by other companies. Our EBITDA and Adjusted EBITDA measures have material limitations as performance measures because they exclude interest expense, income tax (benefit) expense and depreciation and amortization which are necessary to operate our business or which we otherwise incur or experience in connection with the operation of our business.
The following table presents significant items by operating segment and reconciles results from continuing operations to EBITDA from continuing operations and Adjusted EBITDA from continuing operations:
26
|
(Dollar amounts in millions)
|
OSB
|
Siding
|
EWP
|
South America
|
Other
|
Corporate
|
Total
|
||||||||||||||
|
Year Ended December 31, 2012
|
|||||||||||||||||||||
|
Sales
|
$
|
814.1
|
|
$
|
500.9
|
|
$
|
213.4
|
|
$
|
168.8
|
|
$
|
37.4
|
|
$
|
(18.8
|
)
|
$
|
1,715.8
|
|
|
Depreciation and amortization
|
33.1
|
|
15.5
|
|
11.0
|
|
12.0
|
|
0.6
|
|
1.7
|
|
73.9
|
|
|||||||
|
Cost of sales and selling and administrative
|
663.1
|
|
418.0
|
|
215.8
|
|
138.8
|
|
38.6
|
|
58.2
|
|
1,532.5
|
|
|||||||
|
Loss on sales of and impairments of long-lived assets
|
—
|
|
—
|
|
—
|
|
—
|
|
—
|
|
4.9
|
|
4.9
|
|
|||||||
|
Other operating credits and charges, net
|
—
|
|
—
|
|
—
|
|
—
|
|
—
|
|
(2.9
|
)
|
(2.9
|
)
|
|||||||
|
Total operating costs
|
696.2
|
|
433.5
|
|
226.8
|
|
150.8
|
|
39.2
|
|
61.9
|
|
1,608.4
|
|
|||||||
|
Income (loss) from operations
|
117.9
|
|
67.4
|
|
(13.4
|
)
|
18.0
|
|
(1.8
|
)
|
(80.7
|
)
|
107.4
|
|
|||||||
|
Total non-operating expense
|
—
|
|
—
|
|
—
|
|
—
|
|
—
|
|
(69.4
|
)
|
(69.4
|
)
|
|||||||
|
Income before income taxes and equity in (income) loss of unconsolidated affiliates
|
117.9
|
|
67.4
|
|
(13.4
|
)
|
18.0
|
|
(1.8
|
)
|
(150.1
|
)
|
38.0
|
|
|||||||
|
Provision for income taxes
|
—
|
|
—
|
|
—
|
|
—
|
|
—
|
|
7.6
|
|
7.6
|
|
|||||||
|
Equity in (income) loss of unconsolidated affiliates
|
(6.1
|
)
|
—
|
|
0.5
|
|
—
|
|
3.9
|
|
—
|
|
(1.7
|
)
|
|||||||
|
Income (loss) from continuing operations
|
$
|
124.0
|
|
$
|
67.4
|
|
$
|
(13.9
|
)
|
$
|
18.0
|
|
$
|
(5.7
|
)
|
$
|
(157.7
|
)
|
$
|
32.1
|
|
|
Reconciliation of income (loss) from continuing operations to EBITDA from continuing operations
|
|||||||||||||||||||||
|
Income (loss) from continuing operations
|
$
|
124.0
|
|
$
|
67.4
|
|
$
|
(13.9
|
)
|
$
|
18.0
|
|
$
|
(5.7
|
)
|
$
|
(157.7
|
)
|
$
|
32.1
|
|
|
Provision for income taxes
|
—
|
|
—
|
|
—
|
|
—
|
|
—
|
|
7.6
|
|
7.6
|
|
|||||||
|
Interest expense, net of capitalized interest
|
—
|
|
—
|
|
—
|
|
—
|
|
—
|
|
49.3
|
|
49.3
|
|
|||||||
|
Depreciation and amortization
|
33.1
|
|
15.5
|
|
11.0
|
|
12.0
|
|
0.6
|
|
1.7
|
|
73.9
|
|
|||||||
|
EBITDA from continuing operations
|
157.1
|
|
82.9
|
|
(2.9
|
)
|
30.0
|
|
(5.1
|
)
|
(99.1
|
)
|
162.9
|
|
|||||||
|
Stock based compensation expense
|
0.9
|
|
0.5
|
|
0.5
|
|
—
|
|
—
|
|
6.5
|
|
8.4
|
|
|||||||
|
Early debt extinguishment
|
—
|
|
—
|
|
—
|
|
—
|
|
—
|
|
52.2
|
|
52.2
|
|
|||||||
|
Gain on settlement of litigation related to ARS
|
—
|
|
—
|
|
—
|
|
—
|
|
—
|
|
(20.0
|
)
|
(20.0
|
)
|
|||||||
|
Loss on sales of and impairments of long-lived assets
|
—
|
|
—
|
|
—
|
|
—
|
|
—
|
|
4.9
|
|
4.9
|
|
|||||||
|
Other operating credits and charges, net
|
—
|
|
—
|
|
—
|
|
—
|
|
—
|
|
(2.9
|
)
|
(2.9
|
)
|
|||||||
|
Investment income
|
—
|
|
—
|
|
—
|
|
—
|
|
—
|
|
(14.8
|
)
|
(14.8
|
)
|
|||||||
|
Depreciation included in equity in (income) loss of unconsolidated affiliates
|
8.3
|
|
—
|
|
0.5
|
|
—
|
|
3.8
|
|
—
|
|
12.6
|
|
|||||||
|
Adjusted EBITDA from continuing operations
|
$
|
166.3
|
|
$
|
83.4
|
|
$
|
(1.9
|
)
|
$
|
30.0
|
|
$
|
(1.3
|
)
|
$
|
(73.2
|
)
|
$
|
203.3
|
|
27
|
(Dollar amounts in millions)
|
OSB
|
Siding
|
EWP
|
South America
|
Other
|
Corporate
|
Total
|
||||||||||||||
|
Year Ended December 31, 2011
|
|||||||||||||||||||||
|
Sales
|
$
|
542.0
|
|
$
|
429.8
|
|
$
|
203.3
|
|
$
|
144.9
|
|
$
|
39.4
|
|
$
|
(2.5
|
)
|
$
|
1,356.9
|
|
|
Depreciation and amortization
|
36.3
|
|
15.5
|
|
12.6
|
|
11.6
|
|
0.8
|
|
2.1
|
|
78.9
|
|
|||||||
|
Cost of sales and selling and administrative
|
554.7
|
|
372.3
|
|
206.2
|
|
121.7
|
|
38.7
|
|
61.8
|
|
1,355.4
|
|
|||||||
|
Gain on sales of and impairments of long-lived assets
|
—
|
|
—
|
|
—
|
|
—
|
|
—
|
|
73.9
|
|
73.9
|
|
|||||||
|
Other operating credits and charges, net
|
—
|
|
—
|
|
—
|
|
—
|
|
—
|
|
(11.2
|
)
|
(11.2
|
)
|
|||||||
|
Total operating costs
|
591.0
|
|
387.8
|
|
218.8
|
|
133.3
|
|
39.5
|
|
126.6
|
|
1,497.0
|
|
|||||||
|
Income (loss) from operations
|
(49.0
|
)
|
42.0
|
|
(15.5
|
)
|
11.6
|
|
(0.1
|
)
|
(129.1
|
)
|
(140.1
|
)
|
|||||||
|
Total non-operating expense
|
—
|
|
—
|
|
—
|
|
—
|
|
—
|
|
(44.0
|
)
|
(44.0
|
)
|
|||||||
|
Income (loss) before income taxes and equity in loss of unconsolidated affiliates
|
(49.0
|
)
|
42.0
|
|
(15.5
|
)
|
11.6
|
|
(0.1
|
)
|
(173.1
|
)
|
(184.1
|
)
|
|||||||
|
Benefit for income taxes
|
—
|
|
—
|
|
—
|
|
—
|
|
—
|
|
(39.1
|
)
|
(39.1
|
)
|
|||||||
|
Equity in loss of unconsolidated affiliates
|
14.5
|
|
—
|
|
—
|
|
—
|
|
12.4
|
|
—
|
|
26.9
|
|
|||||||
|
Income (loss) from continuing operations
|
$
|
(63.5
|
)
|
$
|
42.0
|
|
$
|
(15.5
|
)
|
$
|
11.6
|
|
$
|
(12.5
|
)
|
$
|
(134.0
|
)
|
$
|
(171.9
|
)
|
|
Reconciliation of income (loss) from continuing operations to EBITDA from continuing operations
|
|||||||||||||||||||||
|
Income (loss) from continuing operations
|
$
|
(63.5
|
)
|
$
|
42.0
|
|
$
|
(15.5
|
)
|
$
|
11.6
|
|
$
|
(12.5
|
)
|
$
|
(134.0
|
)
|
$
|
(171.9
|
)
|
|
Benefit for income taxes
|
—
|
|
—
|
|
—
|
|
—
|
|
—
|
|
(39.1
|
)
|
(39.1
|
)
|
|||||||
|
Interest expense, net of capitalized interest
|
—
|
|
—
|
|
—
|
|
—
|
|
—
|
|
56.9
|
|
56.9
|
|
|||||||
|
Depreciation and amortization
|
36.3
|
|
15.5
|
|
12.6
|
|
11.6
|
|
0.8
|
|
2.1
|
|
78.9
|
|
|||||||
|
EBITDA from continuing operations
|
(27.2
|
)
|
57.5
|
|
(2.9
|
)
|
23.2
|
|
(11.7
|
)
|
(114.1
|
)
|
(75.2
|
)
|
|||||||
|
Stock based compensation expense
|
0.8
|
|
0.5
|
|
0.5
|
|
—
|
|
—
|
|
6.0
|
|
7.8
|
|
|||||||
|
Loss on sales of and impairments of long-lived assets
|
—
|
|
—
|
|
—
|
|
—
|
|
—
|
|
73.9
|
|
73.9
|
|
|||||||
|
Other operating credits and charges, net
|
—
|
|
—
|
|
—
|
|
—
|
|
—
|
|
(11.2
|
)
|
(11.2
|
)
|
|||||||
|
Other than temporary asset impairment
|
—
|
|
—
|
|
—
|
|
—
|
|
—
|
|
14.8
|
|
14.8
|
|
|||||||
|
Investment income
|
—
|
|
—
|
|
—
|
|
—
|
|
—
|
|
(28.7
|
)
|
(28.7
|
)
|
|||||||
|
Depreciation included in equity in loss of unconsolidated affiliates
|
8.3
|
|
—
|
|
0.5
|
|
—
|
|
4.6
|
|
—
|
|
13.4
|
|
|||||||
|
Adjusted EBITDA from continuing operations
|
$
|
(18.1
|
)
|
$
|
58.0
|
|
$
|
(1.9
|
)
|
$
|
23.2
|
|
$
|
(7.1
|
)
|
$
|
(59.3
|
)
|
$
|
(5.2
|
)
|
28
|
(Dollar amounts in millions)
|
OSB
|
Siding
|
EWP
|
South America
|
Other
|
Corporate
|
Total
|
||||||||||||||
|
Year Ended December 31, 2010
|
|||||||||||||||||||||
|
Sales
|
$
|
602.7
|
|
$
|
427.8
|
|
$
|
192.0
|
|
$
|
124.7
|
|
$
|
42.9
|
|
$
|
(6.5
|
)
|
$
|
1,383.6
|
|
|
Depreciation and amortization
|
37.4
|
|
18.1
|
|
13.1
|
|
10.0
|
|
1.1
|
|
2.3
|
|
82.0
|
|
|||||||
|
Cost of sales and selling and administrative
|
537.7
|
|
358.4
|
|
199.3
|
|
107.5
|
|
39.2
|
|
64.6
|
|
1,306.7
|
|
|||||||
|
Loss on sales of and impairments of long-lived assets
|
—
|
|
—
|
|
—
|
|
—
|
|
—
|
|
2.4
|
|
2.4
|
|
|||||||
|
Other operating credits and charges, net
|
—
|
|
—
|
|
—
|
|
—
|
|
—
|
|
0.1
|
|
0.1
|
|
|||||||
|
Total operating costs
|
575.1
|
|
376.5
|
|
212.4
|
|
117.5
|
|
40.3
|
|
69.4
|
|
1,391.2
|
|
|||||||
|
Income (loss) from operations
|
27.6
|
|
51.3
|
|
(20.4
|
)
|
7.2
|
|
2.6
|
|
(75.9
|
)
|
(7.6
|
)
|
|||||||
|
Total non-operating expense
|
—
|
|
—
|
|
—
|
|
—
|
|
—
|
|
(40.3
|
)
|
(40.3
|
)
|
|||||||
|
Income (loss) before income taxes and equity in loss of unconsolidated affiliates
|
27.6
|
|
51.3
|
|
(20.4
|
)
|
7.2
|
|
2.6
|
|
(116.2
|
)
|
(47.9
|
)
|
|||||||
|
Benefit for income taxes
|
—
|
|
—
|
|
—
|
|
—
|
|
—
|
|
(22.1
|
)
|
(22.1
|
)
|
|||||||
|
Equity in loss of unconsolidated affiliates
|
1.8
|
|
—
|
|
0.9
|
|
—
|
|
3.7
|
|
—
|
|
6.4
|
|
|||||||
|
Income (loss) from continuing operations
|
$
|
25.8
|
|
$
|
51.3
|
|
$
|
(21.3
|
)
|
$
|
7.2
|
|
$
|
(1.1
|
)
|
$
|
(94.1
|
)
|
$
|
(32.2
|
)
|
|
Reconciliation of income (loss) from continuing operations to EBITDA from continuing operations
|
|||||||||||||||||||||
|
Income (loss) from continuing operations
|
$
|
25.8
|
|
$
|
51.3
|
|
$
|
(21.3
|
)
|
$
|
7.2
|
|
$
|
(1.1
|
)
|
$
|
(94.1
|
)
|
$
|
(32.2
|
)
|
|
Benefit for income taxes
|
—
|
|
—
|
|
—
|
|
—
|
|
—
|
|
(22.1
|
)
|
(22.1
|
)
|
|||||||
|
Interest expense, net of capitalized interest
|
—
|
|
—
|
|
—
|
|
—
|
|
—
|
|
63.9
|
|
63.9
|
|
|||||||
|
Depreciation and amortization
|
37.4
|
|
18.1
|
|
13.1
|
|
10.0
|
|
1.1
|
|
2.3
|
|
82.0
|
|
|||||||
|
EBITDA from continuing operations
|
$
|
63.2
|
|
$
|
69.4
|
|
$
|
(8.2
|
)
|
$
|
17.2
|
|
$
|
—
|
|
$
|
(50.0
|
)
|
$
|
91.6
|
|
|
Stock based compensation expense
|
1.0
|
|
0.6
|
|
0.6
|
|
—
|
|
—
|
|
6.6
|
|
8.8
|
|
|||||||
|
Loss on sales of and impairments of long-lived assets
|
—
|
|
—
|
|
—
|
|
—
|
|
—
|
|
2.4
|
|
2.4
|
|
|||||||
|
Other operating credits and charges, net
|
—
|
|
—
|
|
—
|
|
—
|
|
—
|
|
0.1
|
|
0.1
|
|
|||||||
|
Other than temporary asset impairment
|
—
|
|
—
|
|
—
|
|
—
|
|
—
|
|
17.0
|
|
17.0
|
|
|||||||
|
Investment income
|
—
|
|
—
|
|
—
|
|
—
|
|
—
|
|
(38.4
|
)
|
(38.4
|
)
|
|||||||
|
Depreciation included in equity in loss of unconsolidated affiliates
|
8.4
|
|
—
|
|
—
|
|
—
|
|
9.7
|
|
—
|
|
18.1
|
|
|||||||
|
Adjusted EBITDA from continuing operations
|
$
|
72.6
|
|
$
|
70.0
|
|
$
|
(7.6
|
)
|
$
|
17.2
|
|
$
|
9.7
|
|
$
|
(62.3
|
)
|
$
|
99.6
|
|
29
RESULTS OF OPERATIONS
We reported net income attributable to LP of
$28.8 million
(
$0.20
per diluted share) in
2012
, which was comprised of income from continuing operations attributed to LP of
$32.1 million
(
$0.22
per diluted share) and a loss from discontinued operations of
$3.3 million
(
$0.02
per diluted share). This compares to a net loss attributable to LP of
$181.3 million
(
$1.36
per diluted share) in
2011
, which was comprised of a loss from continuing operations attributed to LP of
$172.1 million
(
$1.29
per diluted share) and a loss from discontinued operations of
$9.2 million
(
$0.07
per diluted share). We reported a net loss attributable to LP of
$39.0 million
(
$0.30
per diluted share) in
2010
, which was comprised of loss from continuing operations attributed to LP of
$32.6 million
(
$0.25
per diluted share) and a loss from discontinued operations of
$6.4 million
(
$0.05
per diluted share).
Net sales in 2012 were
$1.7 billion
, an increase of
26%
from 2011 net sales of
$1.4 billion
. Net sales in 2011 as compared to 2010 were lower by
2%
. Sales in 2012 were positively impacted by increases in OSB selling prices relative to 2011 and 2010.
Our results of operations for each of our segments are discussed below, as are results of operations for the “other” category which comprises other products that are not individually significant. See Note 24 of the Notes to the financial statements included in item 8 of this report for further information regarding our segments.
OSB
Our OSB segment manufactures and distributes OSB structural panel products in North America and certain export markets. OSB is an innovative, affordable and environmentally smart product made from wood strands arranged in layers and bonded with resin. We believe we are the largest and one of the most efficient producers of OSB in North and South America.
According to FEA, it is estimated for
2012
that OSB accounted for approximately
58%
of the structural panel consumption in North America with plywood accounting for the remainder. We estimate that the overall North American structural panel market (based upon 2012 housing starts) was
27.9 billion
square feet with the OSB market comprising an estimated
16.3 billion
square feet of this market. Based upon our production in 2012 of
3.7 billion
square feet (including our joint venture OSB mill with Canfor Corporation as well as OSB produced in our siding segment), we estimate that we account for
22%
of the North American OSB market and
13%
of the overall North American structural panel market.
To enhance our industry leading position in the OSB business, we plan to: (1) leverage our expertise in OSB to capitalize on new opportunities for revenue growth through new product lines; (2) improve net realizations relative to weighted-average OSB regional pricing; (3) reduce costs and improve throughput and recovery by continuing to focus on efficiency, raw materials cost reductions and logistics; and (4) manage our capacity to meet our customers' expected needs for OSB demand.
OSB is manufactured through the use of wood strands arranged in layers and bonded with resins and wax. Significant cost inputs to produce OSB and approximate breakdown percentages for the year ended
December 31, 2012
include wood (
31%
), resin and wax (
23%
), labor and burden (
15%
), utilities (
6%
) and manufacturing and other (
25%
).
Segment sales, operating profits (losses) and adjusted EBITDA from continuing operations for this segment were as follows:
|
Dollar amounts in millions
|
|
|
|
Increase (decrease)
|
|||||||||||||
|
Year ended December 31,
|
2012
|
2011
|
2010
|
2012 - 2011
|
2011 - 2010
|
||||||||||||
|
Sales
|
$
|
814.1
|
|
$
|
542.0
|
|
$
|
602.7
|
|
50
|
%
|
(10
|
)%
|
||||
|
Operating profits (losses)
|
$
|
124.0
|
|
$
|
(63.5
|
)
|
$
|
25.8
|
|
295
|
%
|
(346
|
)%
|
||||
|
Adjusted EBITDA from continuing operations
|
$
|
166.3
|
|
$
|
(18.1
|
)
|
$
|
72.6
|
|
1,019
|
%
|
(125
|
)%
|
||||
30
Percent changes in average sales prices and unit shipments for the year ended 2012 compared to 2011 and 2011 compared to 2010 were as follows:
|
|
2012 versus 2011
|
2011 versus 2010
|
|||||||||
|
|
Average Net
Selling Price
|
Unit
Shipments
|
Average Net
Selling Price
|
Unit
Shipments
|
|||||||
|
OSB
|
36
|
%
|
12
|
%
|
(15
|
)%
|
4
|
%
|
|||
2012 compared to 2011
OSB prices increased compared to the corresponding period in 2011. The increase in OSB prices was likely due to strengthening of the relationship between regional supply and demand based upon currently operating facilities across the industry. The increase in selling prices favorably impacted operating results and adjusted EBITDA from continuing operations by approximately
$201 million
for 2012 as compared to 2011. Sales volumes increased due to the improved housing market as well as continued movement into industrial applications and increased exports. As of
December 31, 2012
, three of our OSB mills were indefinitely curtailed. We currently plan to restart one of such mills in 2013.
2011 compared to 2010
OSB prices decreased compared to the corresponding period of 2010. The decrease in OSB prices was likely due to weakening of the relationship between supply and demand based upon currently operating facilities across the industry. The decrease in selling price unfavorably impacted operating results and adjusted EBITDA from continuing operations by approximately
$91 million
for 2011 as compared to 2010. Sales volumes increased as we continue to move into industrial applications as well as increasing our exports. To continue to balance supply and demand, during 2011, we announced the indefinite curtailment of our Dawson Creek, British Columbia, Canada OSB mill. Including this mill, three of our OSB mills were indefinitely curtailed as of
December 31, 2011
.
Siding
Our siding segment produces and markets wood-based siding and related accessories and commodity OSB products. We believe that we are a leading wood composite exterior siding producer in North America. We manufacture exterior siding and other cladding products for the residential and commercial building markets. Additionally, we are seeking to optimize our current capacity by extending the hardboard lifecycle through innovative new products and features.
Our strategy is to drive product innovation by utilizing our technological expertise in wood and wood composites to better address the needs of our customers. We intend to increase our product offerings and production capacity of higher margin, value-added products through the addition of lower cost plants or the conversion of OSB plants from commodity structural panel production to OSB-based exterior siding products.
Segment sales, operating profits and adjusted EBITDA from continuing operations for this segment were as follows:
|
Dollar amounts in millions
|
|
|
|
Increase (decrease)
|
|||||||||||||
|
Year ended December 31,
|
2012
|
2011
|
2010
|
2012 – 2011
|
2011 – 2010
|
||||||||||||
|
Sales
|
$
|
500.9
|
|
$
|
429.8
|
|
$
|
427.8
|
|
17
|
%
|
—
|
%
|
||||
|
Operating profits
|
$
|
67.4
|
|
$
|
42.0
|
|
$
|
51.3
|
|
60
|
%
|
(18
|
)%
|
||||
|
Adjusted EBITDA from continuing operations
|
$
|
83.4
|
|
$
|
58.0
|
|
$
|
70.0
|
|
44
|
%
|
(17
|
)%
|
||||
Sales in this segment by product line were as follows:
31
|
Dollar amount in millions
|
|
|
|
Increase (decrease)
|
|||||||||||||
|
Year ended December 31,
|
2012
|
2011
|
2010
|
2012 – 2011
|
2011 – 2010
|
||||||||||||
|
SmartSide
®
siding
|
$
|
398.0
|
|
$
|
341.5
|
|
$
|
324.2
|
|
17
|
%
|
5
|
%
|
||||
|
Commodity OSB
|
46.1
|
|
31.5
|
|
38.6
|
|
46
|
%
|
(18
|
)%
|
|||||||
|
CanExel siding and other hardboard related products
|
56.8
|
|
56.8
|
|
65.0
|
|
—
|
%
|
(13
|
)%
|
|||||||
|
Total
|
$
|
500.9
|
|
$
|
429.8
|
|
$
|
427.8
|
|
||||||||
Percent changes in average sales prices and unit shipments for the year ended 2012 compared to 2011 and 2011 compared to 2010 are as follows:
|
|
2012 versus 2011
|
2011 versus 2010
|
|||||||||
|
|
Average Net
Selling Price
|
Unit
Shipments
|
Average Net
Selling Price
|
Unit
Shipments
|
|||||||
|
SmartSide
®
siding
|
2
|
%
|
15
|
%
|
3
|
%
|
3
|
%
|
|||
|
Commodity OSB
|
37
|
%
|
—
|
%
|
(15
|
)%
|
(10
|
)%
|
|||
|
CanExel siding
|
1
|
%
|
(2
|
)%
|
9
|
%
|
(21
|
)%
|
|||
2012 compared to 2011
Siding sales volumes increased in our SmartSide
®
siding line due to continued penetration in several key focus markets including retail, repair and remodel markets and sheds. Sales prices in our SmartSide siding product as compared to the prior year increased due primarily to changes in product mix as well as a price increase implemented at the beginning of the second quarter of 2012. The price increase was implemented to offset increases in raw material costs.
Sales volumes declined slightly in our Canexel siding lines due to our distributors balancing supply and demand and lower shipments to Europe. Sales prices were flat between years.
Sales prices increased for our commodity OSB products as described in the discussion of our OSB segment above. The increase in selling price favorably impacted operating results and adjusted EBITDA from continuing operations by approximately
$11 million
for 2012 as compared to 2011.
Overall, the increases in operating results for our siding segment for 2012 as compared to 2011 was due to increased OSB pricing and higher sales volumes in our SmartSide
®
siding line.
2011 compared to 2010
Siding sales volumes increased in our SmartSide
®
siding line due to continued penetration in several key focus markets, including retail (primarily driven by increases in the repair and remodel markets) and sheds. Sales prices in our SmartSide
®
siding product line for 2011 as compared to 2010 increased due to sales price increase announced in the first quarter of 2011.
Sales volumes declined in our CanExel siding lines due to slight weakening in the Canadian housing market and lower shipments to Europe. Sales prices increased in 2011 as compared 2010 due to the impact of the strengthening Canadian dollar as a majority of these sales are made in Canada and changes in product mix.
Sales prices declined for our commodity OSB products as described in the discussion of our OSB segment above. The decrease in selling price unfavorably impacted operating results and adjusted EBITDA from continuing operations by approximately
$5 million
for 2011 as compared to 2010.
Overall, the decline in operating results for our siding segment for 2011 as compared to 2010 was primarily due to reduced OSB pricing, reduced volumes in our CanExel product line and raw material pricing increases that were partially offset by higher sales prices in both our SmartSide
®
and Canexel product lines.
32
Engineered Wood Products
Our EWP segment manufactures and distributes LVL, I-Joists, LSL and other related products. This segment also includes the sale of I-Joist and LVL products produced by our joint venture with Resolute Forest Products (formerly AbitibiBowater) and under a sales and marketing arrangement with Murphy Plywood. Included in this segment is a plywood mill, which primarily produces plywood as a by-product from the LVL production process.
Our strategy is to strengthen our brand name recognition in the EWP market by enhancing our product mix and quality, providing superior technical support to our customers and leveraging our sales and marketing relationships to cross-sell our EWP products. Additionally, we are seeking to drive costs down by rationalizing our production capacity across geographic areas and improving operating efficiencies in our manufacturing facilities.
Segment sales, operating profits (losses) and adjusted EBITDA from continuing operations for this segment were as follows:
|
Dollar amount in millions
|
|
|
|
Increase (decrease)
|
|||||||||||||
|
Year ended December 31,
|
2012
|
2011
|
2010
|
2012 – 2011
|
2011 – 2010
|
||||||||||||
|
Sales
|
$
|
213.4
|
|
$
|
203.3
|
|
$
|
192.0
|
|
5
|
%
|
6
|
%
|
||||
|
Operating losses
|
$
|
(13.9
|
)
|
$
|
(15.5
|
)
|
$
|
(21.3
|
)
|
10
|
%
|
27
|
%
|
||||
|
Adjusted EBITDA from continuing operations
|
$
|
(1.9
|
)
|
$
|
(1.9
|
)
|
$
|
(7.6
|
)
|
—
|
%
|
75
|
%
|
||||
Sales in this segment by product line were as follows:
|
Dollar amount in millions
|
|
|
|
Increase (decrease)
|
|||||||||||||
|
Year ended December 31,
|
2012
|
2011
|
2010
|
2012 – 2011
|
2011 – 2010
|
||||||||||||
|
LVL / LSL
|
$
|
104.7
|
|
$
|
103.3
|
|
$
|
92.2
|
|
1
|
%
|
12
|
%
|
||||
|
I-joist
|
69.8
|
|
62.6
|
|
70.4
|
|
12
|
%
|
(11
|
)%
|
|||||||
|
Related products
|
38.9
|
|
37.4
|
|
29.4
|
|
4
|
%
|
27
|
%
|
|||||||
|
Total
|
$
|
213.4
|
|
$
|
203.3
|
|
$
|
192.0
|
|
||||||||
Percent changes in average sales prices and unit shipments for the year ended 2012 compared to 2011 and 2011 compared to 2010 are as follows:
|
|
2012 versus 2011
|
2011 versus 2010
|
|||||||||
|
|
Average Net
Selling Price
|
Unit
Shipments
|
Average Net
Selling Price
|
Unit
Shipments
|
|||||||
|
LVL/LSL
|
(1
|
)%
|
4
|
%
|
1
|
%
|
9
|
%
|
|||
|
I-joist
|
1
|
%
|
11
|
%
|
3
|
%
|
(15
|
)%
|
|||
2012 compared to 2011
Sales volumes increased in LVL/LSL and I-joist due to increased demand in the U.S. housing market with offsetting reductions in exports. Net average selling prices remained relatively flat in both product lines.
Improvements in our results of operations for 2012 as compared to the prior year are primarily related to reduced depreciation at our LSL facility due to an impairment recorded in the third quarter of 2011.
33
2011 compared to 2010
Sales volumes increased in LVL/LSL based upon significant increases in exports, while sales volumes declined in I-joist due to lower U.S. and Canadian demand, which more than offset increases in export sales. Net average selling prices increased in all product lines due to price increases implemented during 2011.
Results of operations for 2011 as compared to the prior year improved due to continued improvements in our LSL facility as well as higher sales volumes of LVL/LSL.
South America
Our South America segment manufactures and distributes OSB structural panel and siding products in South America. We operate in two geographic areas of South America, Chile and Brazil.
|
Dollar amount in millions
|
|
|
|
Increase (decrease)
|
|||||||||||||
|
Year ended December 31,
|
2012
|
2011
|
2010
|
2012 – 2011
|
2011 – 2010
|
||||||||||||
|
Sales
|
$
|
168.8
|
|
$
|
144.9
|
|
$
|
124.7
|
|
16
|
%
|
16
|
%
|
||||
|
Operating profits
|
$
|
18.0
|
|
$
|
11.6
|
|
$
|
7.2
|
|
55
|
%
|
61
|
%
|
||||
|
Adjusted EBITDA from continuing operations
|
$
|
30.0
|
|
$
|
23.2
|
|
$
|
17.2
|
|
29
|
%
|
35
|
%
|
||||
Sales in this segment by production location were as follows:
|
Dollar amount in millions
|
|
|
|
Increase (decrease)
|
|||||||||||||
|
Year ended December 31,
|
2012
|
2011
|
2010
|
2012 – 2011
|
2011 – 2010
|
||||||||||||
|
Chile
|
$
|
112.6
|
|
$
|
89.3
|
|
$
|
79.5
|
|
26
|
%
|
12
|
%
|
||||
|
Brazil
|
56.2
|
|
55.6
|
|
45.2
|
|
1
|
%
|
23
|
%
|
|||||||
|
Total
|
$
|
168.8
|
|
$
|
144.9
|
|
$
|
124.7
|
|
||||||||
Percent changes in average sales prices and unit shipments for the year ended 2012 compared to 2011 and 2011 compared to 2010 are as follows:
|
|
2012 versus 2011
|
2011 versus 2010
|
|||||||||
|
|
Average Net
Selling Price
|
Unit
Shipments
|
Average Net
Selling Price
|
Unit
Shipments
|
|||||||
|
Chile
|
8
|
%
|
19
|
%
|
(1
|
)%
|
27
|
%
|
|||
|
Brazil
|
(7
|
)%
|
12
|
%
|
8
|
%
|
16
|
%
|
|||
2012 compared to 2011
In our Chilean operations, sales volumes increased due to continued penetration in local markets. Sales volumes in Brazil increased due to increased penetration in local markets as well as continued increases in exports to China. Changes in price are due to the impact of the fluctuations in the Chilean peso and Brazil real relative to the U.S. dollar as a majority of these sales are in local markets. In terms of changes in sales price based upon local relative currencies, we realized increases in average net selling prices in Chile and Brazil of 10% and 9%, respectively in 2012 as compared to 2011.
2011 compared to 2010
In our Chilean operations, sales volumes increased due to continued demand associated with rebuilding efforts after the Chilean earthquake as well as continued penetration in local markets. Sales volumes in Brazil increased due to increased penetration in local markets as well as increasing exports to China. Changes in price for both areas were primarily driven by the fluctuation in the exchange rates.
34
Other
Our other products category includes our moulding business and our joint venture that produces and sells cellulose insulation. This category also includes our remaining timber and timberlands and other minor products, services and closed operations which are not classified as discontinued operations.
Category sales, operating profits (losses) and adjusted EBITDA from continuing operations for this category were as follows:
|
Dollar amount in millions
|
|
|
|
Increase (decrease)
|
|||||||||||||
|
Year ended December 31,
|
2012
|
2011
|
2010
|
2012 – 2011
|
2011 – 2010
|
||||||||||||
|
Sales
|
$
|
37.4
|
|
$
|
39.4
|
|
$
|
42.9
|
|
(5
|
)%
|
(8
|
)%
|
||||
|
Operating losses
|
$
|
(5.7
|
)
|
$
|
(12.5
|
)
|
$
|
(1.1
|
)
|
54
|
%
|
1,036
|
%
|
||||
|
Adjusted EBITDA from continuing operations
|
$
|
(1.3
|
)
|
$
|
(7.1
|
)
|
$
|
9.7
|
|
82
|
%
|
(173
|
)%
|
||||
Sales in this category by product line were as follows:
|
Dollar amount in millions
|
|
|
|
Increase (decrease)
|
|||||||||||||
|
Year ended December 31,
|
2012
|
2011
|
2010
|
2012 – 2011
|
2011 – 2010
|
||||||||||||
|
Mouldings
|
$
|
24.6
|
|
$
|
28.3
|
|
$
|
32.2
|
|
(13
|
)%
|
(12
|
)%
|
||||
|
Other
|
12.8
|
|
11.1
|
|
10.7
|
|
15
|
%
|
4
|
%
|
|||||||
|
Total
|
$
|
37.4
|
|
$
|
39.4
|
|
$
|
42.9
|
|
||||||||
2012 compared to 2011
Sales in our moulding business were lower due to decreased activity with a specific retail customer, with sales in our other operations remaining relatively flat. Overall, operating results associated with these activities were negatively impacted by the performance of our moulding business which was offset by improvements in our U.S. Greenfiber joint venture.
2011 compared to 2010
Sales in our moulding business were lower due to decreased activity in the retail markets, with sales in our other operations remaining relatively flat. Included in these results is a $5.6 million goodwill impairment charge recorded on our joint ventures books. Overall, operating results associated with these activities were negatively impacted by the performance of our moulding business and our U.S. Greenfiber joint venture.
GENERAL CORPORATE AND OTHER EXPENSE, NET
Net general corporate expense was
$78.7 million
in 2012 as compared to
$66.4 million
in 2011 and
$73.4 million
in 2010. General corporate and other expenses primarily consist of corporate overhead such as wages and benefits for corporate personnel, professional fees, insurance, travel costs, non-product specific marketing and other expenses. The increase in 2012 as compared to 2011 was due to higher accruals under the management incentive program as well as increased legal costs. The decrease in 2011 as compared to 2010 was due to lower accruals under the management incentive program as well as continued cost containment. During 2011, we did not pay any management incentives.
OTHER OPERATING CREDITS AND CHARGES, NET
For a discussion of other operating credits and charges, net, see Notes 1 and 16 of the Notes to the financial statements included in item 8 of this report.
35
GAIN (LOSS) ON SALES OF AND IMPAIRMENTS OF LONG-LIVED ASSETS
For a discussion of gain (loss) on sales of and impairments of long-lived assets, see Notes 1 and 17 of the Notes to the financial statements included in item 8 of this report.
NON-OPERATING INCOME (EXPENSE)
In 2012, net non-operating expense was
$69.4 million
compared to
$44.0 million
in 2011 and
$40.3 million
in 2010. Components of non-operating income (expenses) were as follows:
|
|
Year ended December 31,
|
||||||||||
|
Dollar amounts in millions
|
2012
|
2011
|
2010
|
||||||||
|
Interest expense
|
$
|
(48.0
|
)
|
$
|
(54.4
|
)
|
$
|
(60.8
|
)
|
||
|
Amortization of debt charges
|
(1.5
|
)
|
(2.6
|
)
|
(3.1
|
)
|
|||||
|
Capitalized interest
|
0.2
|
|
0.1
|
|
—
|
|
|||||
|
Interest expense, net of capitalized interest
|
(49.3
|
)
|
(56.9
|
)
|
(63.9
|
)
|
|||||
|
Investment income
|
13.0
|
|
13.3
|
|
18.0
|
|
|||||
|
Realized gains from the sales of investments
|
—
|
|
15.2
|
|
19.0
|
|
|||||
|
SERP market adjustments
|
1.8
|
|
0.2
|
|
1.4
|
|
|||||
|
Investment income
|
14.8
|
|
28.7
|
|
38.4
|
|
|||||
|
Other than temporary impairment
|
—
|
|
(14.8
|
)
|
(17.0
|
)
|
|||||
|
Foreign currency gains (losses)
|
(2.7
|
)
|
(1.0
|
)
|
2.2
|
|
|||||
|
Gain on settlement of litigation related to ARS
|
20.0
|
|
—
|
|
—
|
|
|||||
|
Early debt extinguishment
|
(52.2
|
)
|
—
|
|
—
|
|
|||||
|
Other non-operating expense
|
(34.9
|
)
|
(1.0
|
)
|
2.2
|
|
|||||
|
Total non-operating income (expense)
|
$
|
(69.4
|
)
|
$
|
(44.0
|
)
|
$
|
(40.3
|
)
|
||
EQUITY IN EARNINGS OF UNCONSOLIDATED AFFILIATES
We participate in several joint venture arrangements. These include: (1) a joint venture with Casella Waste Management Systems, Inc. to produce cellulose insulation; (2) a joint venture with Canfor Corporation to construct and operate an OSB mill in British Columbia; and (3) a joint venture with Resolute Forest Products to construct and operate two I-joist facilities in Quebec.
In 2000, we and Casella Waste Management Systems, Inc., each contributed most of the assets of our respective cellulose insulation operations to a joint venture, U.S. GreenFiber, LLC (GreenFiber). Pursuant to the joint venture agreement, each company owns 50% of GreenFiber. GreenFiber elected to be treated as a partnership for income tax purposes and therefore the entity is not taxed directly. The results of this operation are included within Other Products.
In 2003, we and Canfor Corporation, entered into a joint venture to construct and operate an 820 million square foot OSB facility in British Columbia, Canada. Pursuant to the joint venture agreement, each company owns 50% of the venture, with LP being responsible for all North America sales from this facility. The results of this operation are included in our OSB segment. In 2012, we announced our intent to acquire the 50% interest owned by Canfor Corporation in 2013.
36
In 2002, we entered into a joint venture with Resolute Forest Products to construct and operate an I-joist facility in Eastern Canada. Pursuant to the joint venture agreement, each company owns 50% of the venture. Subsequently, the joint venture constructed and commenced operating a second I-joist facility in Eastern Canada. The results of these operations are included in the EWP segment.
DISCONTINUED OPERATIONS
Included in discontinued operations for
2012
,
2011
and
2010
are the carrying costs of mills that have been closed and divested and related warranty costs associated with such facilities. These operations include residual losses of mills divested in past years and associated warranty and other liabilities associated with these operations.
2012 compared to 2011
Included in the loss on discontinued operations for 2012 is an increase in our warranty reserves associated with discontinued products of
$3.6 million
as well as residual costs associated with mills that have been previously discontinued and sold.
2011 compared to 2010
Included in the loss on discontinued operations for 2011 is an increase in our warranty reserves associated with discontinued products of
$12.0 million
as well as residual costs associated with mills that have been previously discontinued and sold.
INCOME TAXES
We recorded a tax provision in continuing operations of
$7.6 million
in 2012, income tax benefit in continuing operations of
$39.1 million
in 2011 and
$22.1 million
in 2010. For 2012, the primary difference between the U.S. statutory rate of 35% and the effective rate on our continuing operations relates to state income taxes, the effect of foreign tax rates and adjustments to previously recorded deferred tax liabilities.
For 2011, the primary difference between the U.S. statutory rate of 35% and the effective rate on our continuing operations relates to increases in valuation allowances due to net operating loss carry forwards in various jurisdictions, increases in our reserves related to uncertain tax positions associated with our foreign debt structure and the impact of a non-deductible asset impairment included in Greenfiber's operating results.
We paid
$1.6 million
of cash taxes and received
$1.9 million
in cash tax refunds in 2012 and expect to receive
$1.8 million
in related refunds from prior years in 2013.
DEFINED BENEFIT PENSION PLANS
We maintain several qualified and non-qualified defined benefit pension plans in the U.S. and Canada that cover a substantial portion of our employees. The measurement of liabilities related to these plans is based on management’s interpretation of the applicable plan provisions and assumptions related to future events, including expected return on plan assets and rate of compensation increases. The discount rate reflects the rate at which benefits could be effectively settled on the measurement date. The projected payment for each year is discounted using the rates specified by the yield curve. The sum of these discounted payments is the benefit obligation. The discount rate disclosed is the single rate applied to all projected payments that creates an equivalent obligation. Actual pension plan asset investment performance will either reduce or increase unamortized pension losses at the end of any fiscal year, which ultimately affects future pension costs. See Note 13 of the Notes to the financial statements included in item 8 of this report for further information on these plans.
The table below quantifies the approximate impact on our plans, as of December 31, 2012, of a one-half percentage point decrease in our assumptions for discount rate and expected return on assets, holding other assumptions constant:
37
|
Dollars in millions
|
|
||
|
Increase in annual costs for 2013:
|
|||
|
Discount rate
|
$
|
0.7
|
|
|
Expected long-term rate of return
|
$
|
1.3
|
|
|
Increase in projected benefit obligation:
|
|||
|
Discount rate
|
$
|
21.2
|
|
For our U.S. plans, we used a long term rate of return assumption of 7.25% and 7.5% for 2012 and 2011 to calculate the net periodic pension costs. For our Canadian plans, we used a long-term rate of return assumption of 4.5% to 5.5% to calculate 2012 and 2011 net periodic pension costs. For 2012, our net periodic pension cost was
$8.4 million
and we estimate for 2013, our net periodic pension cost will be
$7.5 million
. This estimate assumes that we will have no curtailment or settlement expenses in 2013. If a settlement or curtailment does occur in 2013, this estimate may change significantly. We estimate in 2013, we will contribute approximately
$1.9 million
to our defined benefit pension plans.
LEGAL AND ENVIRONMENTAL MATTERS
For a discussion of legal and environmental matters involving us and the potential impact thereof on our financial position, results of operations and cash flows, see Item 3 in this report as well as Note 18 in the Notes to the financial statements included in item 8 of this report.
LIQUIDITY AND CAPITAL RESOURCES
Overview
Our principal sources of liquidity are existing cash and investment balances, cash generated by our operations and our ability to borrow under such credit facilities as we may have in effect from time to time. We may also from time to time issue and sell equity, debt or hybrid securities or engage in other capital market transactions.
Our principal uses of liquidity are paying the costs and expenses associated with our operations, servicing outstanding indebtedness and making capital expenditures. We may also from time to time prepay or repurchase outstanding indebtedness, acquire assets or businesses that are complementary to our operations. Any such repurchases may be commenced, suspended, discontinued or resumed, and the method or methods of effecting any such repurchases may be changed, at any time or from time to time without prior notice.
Operating Activities
During
2012
, we generated
$111.8 million
of cash in from operations as compared to using
$40.2 million
of cash in operations in
2011
. This change reflects improved results of operations for 2012. During
2012
, we received tax refunds of
$0.3 million
(net of payments). As of December 31, 2012, our trade receivables increased about $15 million in 2012 of which the balance was 99% current, which is comparable with prior years with no substantial changes in terms of sales. Our trade accounts payable increased by
$12.5 million
from the prior year primarily due to the increases in inventory and our salary and wages payable increased by
$11.0 million
due to expected management incentive payouts as well as timing on payroll. During 2012, we made
$1.4 million
in contingency payments and
$11.6 million
in warranty payments.
During
2011
, we used
$40.2 million
of cash from operations as compared to generating
$47.8 million
of cash from operations in 2010. This change was related to increased operating losses, higher inventories and lower tax refunds. During 2011, we received tax refunds of
$25.0 million
(net of payments). Trade receivables are relatively flat between 2011 and 2010. As of
December 31, 2011
, our trade receivables balance was 99% current, which is comparable with prior years with no substantial changes in terms of sales. Non-trade receivables decreased by
$1.6 million
due to lower interest receivables due to principal payments received during 2011. Our trade accounts payable increased by
$4.8 million
from the prior year primarily due to the increases in inventory and our salary and wages payable declined by
$7.4 million
due to reduction in expected management incentive payouts. During 2011, we made
$2.3 million
in contingency payments and
$12.9 million
in warranty payments.
38
During 2010, we generated
$47.8 million
of cash from operations as compared to
$60.8 million
in 2009. The decrease in cash provided from operations was related to higher inventories and higher pension payments and lower tax refunds, as partially offset by lower operating losses. During 2010, we received tax refunds of
$45.7 million
(net of payments). Trade receivables increased by
$8.8 million
due to higher sales in December of 2010 as compared to 2009. As of December 31, 2010, our trade receivables balance was 99% current, which is comparable with prior years with no substantial changes in terms of sales. Non-trade receivables decreased by
$1.8 million
due to lower interest receivables due to payments received during 2010. Our accounts payable increased from the prior year primarily due to the increases in inventory as well as changes in our funding of our employee benefit programs. During 2010, we made
$9.8 million
in contingency payments and
$14.6 million
in warranty payments.
Investing Activities
During 2012, we generated
$21.5 million
in cash from investing activities. Capital expenditures for 2012 were
$31.2 million
, primarily related to maintenance capital, initial costs associated with our software upgrade and minor capital related to our announced expansion in South America. Additionally, we received distributions from our joint ventures of
$12.7 million
. We also received
$9.2 million
on the sale of assets and received
$0.8 million
in cash no longer required to collaterize certain long-term obligations. We also received
$20.0 million
from the settlement of litigation related to ARS and
$10.0 million
for the notes receivable from asset sales. Additionally, included in accounts payable is
$4.1 million
related to capital expenditures that had not yet been paid as of December 31, 2012.
During 2011, we generated
$7.7 million
in cash from investing activities. Capital expenditures for 2011 were
$21.4 million
, primarily related to maintenance capital. Additionally, we funded our joint ventures
$9.6 million
. We received
$19.1 million
on the sale of investments with maturities in excess of 90 days. We also received
$1.3 million
on the sale of assets and received
$18.3 million
in cash no longer required to collaterize certain long-term obligations. Additionally, included in accounts payable is
$0.8 million
related to capital expenditures that had not yet been paid as of December 31, 2011.
During 2010, we generated $120.3 million in cash from investing activities. Capital expenditures for 2010 were $14.5 million, primarily related to maintenance capital. Additionally, our joint ventures refunded $4.9 million in advances made in past years. We received $21.8 million on the sale of investments with maturities in excess of 90 days. We received $115.1 million in principal payments on our notes receivable from asset sales. We also received $3.3 million on the sale of assets and used $10.3 million in cash to collaterize certain long-term obligations. Additionally, included in accounts payable is $1.2 million related to capital expenditures that had not yet been paid as of December 31, 2010.
Capital expenditures in 2013 are expected not to exceed $75 million related to projects critical for continuing operations. Additionally, we plan expenditures of $70 million associated with our planned acquisition of the remaining interest in the Peace Valley OSB mill and $10 million in capital associated our systems upgrade.
Financing Activities
In 2012, net cash provided from financing activities was
$92.1 million
. During 2012, we issued $350.0 million of 7.5% Senior Notes due 2020, and used approximately $248.6 million of the proceeds of this issuance to fully retire our Senior Secured Notes due in 2017 and pay related transaction costs and expenses. We also received
$1.3 million
from the sale of common stock under equity plans.
In 2011, net cash used in financing activities was
$15.7 million
. During 2011, we redeemed the 25% non-controlling interest in our Brazilian OSB operation for
$24.0 million
. In connection with this redemption, we borrowed
$10.0 million
under a Brazilian export financing facility established to facilitate the redemption. As part of our ongoing cost reduction activities, we renegotiated our Chilean loan which required us to pay a financing fee of
$1.0 million
and allowed us to release our restricted cash associated with letters of credit supporting Chilean borrowings and lower the interest rate on this loan. We also paid
$0.5 million
of financing fees in connection with amendments to our asset-based revolving credit facility.
In 2010, net cash used in financing activities was
$174.3 million
. During 2010, we repaid
$173.7 million
in long-term debt which was comprised of $113.4 million of long-term debt associated with our limited recourse notes payable and $60.2 million of Senior Notes due in August of 2010.
39
CREDIT AGREEMENTS
We have a credit facility which provides for a committed asset-based borrowing capacity of up to $100 million, with a $60 million sublimit for U.S. letters of credit and a $10 million sublimit for Canadian letters of credit. The credit facility is scheduled to end in October 2016.
The availability of credit under the credit facility is subject to a borrowing base, which is calculated based on certain percentages of accounts receivable and inventory and at any given time may limit the amount of borrowings and letters of credit otherwise available under the facility. In addition, the credit facility contains a covenant requiring us to maintain a fixed charge coverage ratio of at least 1.1 to 1.0 at any time that our unused borrowing base capacity after adjustment to exclude certain past due trade payables falls below $15 million. This covenant effectively precludes us from using all or a portion of the last $15 million of our unused borrowing base capacity, if, before or immediately after such use, we would not satisfy the minimum fixed charge coverage ratio. The credit facility allows us to pledge, as security for our reimbursement obligations in respect of letters of credit issued under the facility, cash collateral in an amount not less than 105% of the stated amount of such letters of credit. The above-described preclusion to our utilization of $15 million of the capacity otherwise available under the facility does not apply to such cash collateralized letters of credit. At December 31, 2012, we had $100 million of borrowing base capacity under the facility and no borrowings outstanding under the facility. Under this facility at December 31, 2012, were $9.0 million in letters of credit which were collateralized by $10 million of cash. Based upon our available cash balances, we do not currently anticipate using this facility except to obtain and maintain letters of credit.
Subject to certain exceptions, obligations under the credit facility are secured by, among other things, a first-priority lien on our present and future receivables, inventory and certain general intangibles and are guaranteed by certain of our subsidiaries.
The credit facility contains customary covenants applicable to us and our subsidiaries, other than certain unrestricted subsidiaries, including certain financial covenants as well as restrictions on, among other things, our ability to: incur debt; incur liens; declare or make distributions to our stockholders; make loans and investments; repay debt; enter into mergers, acquisitions and other business combinations; form or acquire subsidiaries; amend or modify our governing documents; enter into hedging arrangements; engage in other businesses other than our business as currently conducted; and enter into transactions with affiliates. The credit facility also contains customary events of default, the occurrence of which could result in the acceleration of our obligation to repay the indebtedness outstanding thereunder.
Obligations under the indenture governing our Senior Notes due 2020 are unsecured and not presently guaranteed by any of our subsidiaries. The indenture contains customary covenants applicable to us and our subsidiaries, other than certain unrestricted subsidiaries, including restrictions on actions and activities that are restricted under the credit facility. The indenture also contains customary events of default, the occurrence of which could result in acceleration of our obligations to repay the indebtedness outstanding thereunder.
As part of our refinancing strategy, LP Chile entered into a term loan agreement with Banco de Credito e Inversiones for UF 943,543.7391 (equivalent to $39 million at the time of inception). The loan agreement has a term of 10 years with semi-annual principal payments beginning in June of 2012. The loan bears interest at UF plus 3.9% per annum, and is secured by a first priority security interest in substantially all of the real property owned by LP Chile. The loan contains various restrictive covenants and requires the maintenance by LP Chile of a debt to equity ratio of less than or equal to 1. If LP Chile is late in making payments, LP Chile will also be required to maintain a ratio of net debt to earnings before interest, taxes, depreciation and amortization (EBITDA) of less than or equal to 2.5 and a ratio of EBITDA to financial costs of at least 3. The loan agreement also contains customary events of default, the occurrence of which could result in acceleration of our obligations to repay the indebtedness outstanding thereunder. Since this loan is denominated in other than U.S. dollars, the balance fluctuates based upon changes in the underlying currency rates. As of
December 31, 2012
, the balance of this loan was
$39.3 million
.
40
OTHER LIQUIDITY MATTERS
As of
December 31, 2012
, we had
$2.0 million
(
$23.4 million
, par value) of principal invested in auction rate securities (ARS). The ARS held by us are securities with long-term nominal maturities for which the interest rates were historically reset through a Dutch auction each month.
We review our marketable securities routinely for other-than-temporary impairment. The primary factors LP uses to determine if an impairment charge must be recorded because a decline in value of the security is other-than-temporary include (i) whether the fair value of the investment is significantly below its cost basis, (ii) the financial condition of the issuer of the security (including its credit rating), (iii) the length of time that the cost of the security has exceeded its fair value and (iv) LP’s intent and ability to retain the investment for a period of time sufficient to allow for any anticipated recovery in market value.
During 2011, we sold
$38.1 million
(par value) of our ARS for
$19.1 million
plus accrued interest. In connection with this transaction, we recorded a gain on sale of securities of
$15.2 million
, which represents a recovery of losses previously recorded as an Other-than-temporary impairment.
During 2010, we sold
$35.3 million
(par value) of our ARS for
$21.8 million
plus accrued interest. In connection with this transaction, we recorded a gain on sale of securities of
$19.0 million
, which represents a recovery of losses previously recorded as an Other-than-temporary impairment.
The estimated market value of our ARS holdings at
December 31, 2012
was
$2.0 million
, which reflects a
$21.4 million
adjustment to the par value of
$23.4 million
. We intend to continue to offer our ARS at auction and to consider other options, including alternative buyers and other potential transactions. We do not currently require our ARS to be liquidated in order to fund our day-to-day operations and we are prepared to hold them until maturity, if necessary.
If uncertainties in the credit and capital markets continue, these markets deteriorate further or we experience any ratings downgrades on any investments in our portfolio (including on ARS), we may incur additional impairments to our investment portfolio, which could negatively affect our financial condition, results of operations and cash flow.
Contingency Reserves
Contingency reserves, which represent an estimate of future cash needs for various contingencies (principally, payments for environmental reserves), totaled
$14.8 million
at
December 31, 2012
, of which
$2.0 million
is estimated to be payable within one year. As with all accounting estimates, there is inherent uncertainty concerning the reliability and precision of such estimates. As described above and in Note 18 of the Notes to the financial statements included in item 8 of this report, the amounts ultimately paid in resolving these contingencies could exceed the current reserves by a material amount.
Contractual Obligations
The table below summarizes our contractual obligations as of
December 31, 2012
over the next several years. See discussion above concerning provisions that could accelerate the due dates on our long-term debt.
|
Dollars amounts in millions
|
Payments due by period
|
||||||||||||||||||
|
Contractual obligations
|
2013
|
2014
|
2015
|
2016
|
2017
|
||||||||||||||
|
Long-term debt
1
|
$
|
131.6
|
|
$
|
38.0
|
|
$
|
37.6
|
|
$
|
37.3
|
|
$
|
37.0
|
|
||||
|
Operating leases
|
4.2
|
|
3.7
|
|
3.2
|
|
2.4
|
|
1.7
|
|
|||||||||
|
Purchase obligations
2
|
—
|
|
—
|
|
—
|
|
—
|
|
—
|
|
|||||||||
|
Other long-term obligations
3
|
2.0
|
|
—
|
|
—
|
|
—
|
|
—
|
|
|||||||||
|
Total contractual cash obligations
|
$
|
137.8
|
|
$
|
41.7
|
|
$
|
40.8
|
|
$
|
39.7
|
|
$
|
38.7
|
|
||||
_______________
41
|
1
|
Includes expected interest payments as well as debt maturities.
|
|
2
|
The majority of our purchase obligations are take-or-pay contracts made in the ordinary course of business related to raw materials and utility contracts. Other significant items included in the above table reflect purchase obligations related to legally binding commitments for capital projects. Purchase orders made in the ordinary course of business are excluded from the above table and are cancelable without significant penalty.
|
|
3
|
Represents other long-term liability amounts reflected in our consolidated balance sheet that have known payment streams including items such as pension contributions. Current pension funding regulations require LP to contribute $1-$2 million in 2013 to its defined benefit pension plans, and we have included $2 million in the table above. Future years are not estimable due to the large number of factors involved in determining minimum pension funding.
|
|
4
|
Uncertain tax positions have been excluded from the above table as it is not reasonably possible to estimate when these may need to be paid. As of December 31, 2012, the amount of uncertain tax positions excluded from the above table is $49.9 million.
|
Other Financing Arrangements
In connection with the sale of southern timber and timberlands in 2003, we received $26 million in cash and $410 million in notes receivable from the purchasers of such timber and timberlands. In order to borrow funds in a cost-effective manner, LP issued $368.7 million of senior debt in 2003 in a private placement to unrelated third parties. Both the notes receivable and notes payable mature in 2018. The notes payable are supported by a bank letter of credit. LP’s reimbursement obligations under the letter of credit are secured by the notes receivable. In general, the creditors under this arrangement have no recourse to LP’s assets, other than the notes receivable. However, under certain circumstances, LP may be liable for certain liabilities (including liabilities associated with the marketing or remarketing of the notes payable and reimbursement obligations, which are fully cash collateralized under the letter of credit supporting the notes payable) in an amount not to exceed 10% of the aggregate principal amount of the notes receivable. LP’s maximum exposure in this regard was approximately $41 million as of December 31, 2012 and December 31, 2011. The notes receivable are classified as long-term “Notes receivable from asset sales” and the notes payable are classified as long-term debt on the financial statements included in item 8 of this report.
In connection with the sales of timberlands in California in 1997 and 1998, we received notes from the purchasers totaling $403.8 million. The notes receivable were monetized through the issuance of notes payable in a private placement secured by the notes. Proceeds from the notes receivable from the purchasers are used to fund payments required for the notes payable. To date, all installments under these notes have been received and the corresponding installments under the notes payable have been paid. The next installment is due in 2013. The notes receivable are classified as "Current portion of Notes receivable from asset sales" and "Long-term notes receivable from asset sales” and the notes payable are classified as the "Current portion of limited recourse notes payable" and long-term debt on the financial statements included in item 8 of this report.
POTENTIAL IMPAIRMENTS
We continue to review several mills and investments for potential impairments. Management currently believes we have adequate support for the carrying value of each of these assets based upon the anticipated cash flows that result from our estimates of future demand, pricing and production costs assuming certain levels of planned capital expenditures. As of
December 31, 2012
, there were no indications of impairment for the asset grouping that included the company's indefinitely curtailed facilities. As of
December 31, 2012
, the estimated fair values of LP's facilities that have not been indefinitely curtailed were substantially in excess of their carrying value, which supported the conclusion that no impairment is necessary for those facilities. However, if demand and pricing for the relevant products continues at levels significantly below cycle average demand and pricing, or should LP decide to invest capital in alternative projects, it is possible that impairment charges will be required. See Note 3 of the Notes to the financial statements included in item 8 of this report for impairment charges recorded in the periods presented.
We also review from time to time possible dispositions of various assets in light of current and anticipated economic and industry conditions, our strategic plan and other relevant factors. Because a determination to dispose
42
of particular assets can require management to make assumptions regarding the transaction structure of the disposition and to estimate the net sales proceeds, which may be less than previous estimates of undiscounted future net cash flows, we may be required to record impairment charges in connection with decisions to dispose of assets.
PROSPECTIVE ACCOUNTING PRONOUNCEMENTS
See Note 1 for discussion of prospective accounting pronouncements in the Notes to the financial statements included in item 8 of this report.
43
ITEM 7A.
Quantitative and Qualitative Disclosures about Market Risk
A portion of our outstanding debt bears interest at variable rates and accordingly is sensitive to changes in interest rates. Interest rate changes would result in gains or losses in the market value of our debt portfolio due to differences in market interest rates and the rates at the inception of the debt agreements. Offsetting the variable rate debt are variable rate notes receivable from asset sales. Based upon the balances of the variable rate notes receivable from asset sales and the variable rate debt at
December 31, 2012
, a 100 basis point interest change would impact pre-tax net income and cash flows by
$3.7 million
annually.
Our international operations have exposure to foreign currency rate risks, primarily due to fluctuations in the Canadian dollar, Brazilian real and the Chilean peso. Although we have in the past entered into foreign exchange contracts associated with certain of our indebtedness and may continue to enter into foreign exchange contracts associated with major equipment purchases to manage a portion of the foreign currency rate risk, we historically have not entered into material currency rate hedges with respect to our exposure from operations, although we may do so in the future.
Some of our products are sold as commodities and therefore sales prices fluctuate daily based on market factors over which we have little or no control. The most significant commodity product we sell is OSB. Based upon an assumed North America annual production capacity in the OSB segment of
5.0 billion
square feet (3/8” basis) or
4.2 billion
square feet (7/16” basis), a $1 change in the annual average price per thousand square feet on 7/16” basis would change annual pre-tax profits by approximately
$4.2 million
.
We historically have not entered into material commodity futures and swaps, although we may do so in the future.
44
ITEM 8.
Financial Statements and Supplementary Data
REPORT OF INDEPENDENT REGISTERED PUBLIC ACCOUNTING FIRM
To the Board of Directors and Stockholders of
Louisiana-Pacific Corporation
We have audited the accompanying consolidated balance sheets of Louisiana-Pacific Corporation and subsidiaries (the "Company") as of December 31, 2012 and 2011, and the related consolidated statements of income, comprehensive income, stockholders' equity, and cash flows for each of the three years in the period ended December 31, 2012. These financial statements are the responsibility of the Company's management. Our responsibility is to express an opinion on these financial statements based on our audits.
We conducted our audits in accordance with the standards of the Public Company Accounting Oversight Board (United States). Those standards require that we plan and perform the audit to obtain reasonable assurance about whether the financial statements are free of material misstatement. An audit includes examining, on a test basis, evidence supporting the amounts and disclosures in the financial statements. An audit also includes assessing the accounting principles used and significant estimates made by management, as well as evaluating the overall financial statement presentation. We believe that our audits provide a reasonable basis for our opinion.
In our opinion, such consolidated financial statements present fairly, in all material respects, the financial position of Louisiana-Pacific Corporation and subsidiaries as of December 31, 2012 and 2011, and the results of their operations and their cash flows for each of the three years in the period ended December 31, 2012, in conformity with accounting principles generally accepted in the United States of America.
We have also audited, in accordance with the standards of the Public Company Accounting Oversight Board (United States), the Company's internal control over financial reporting as of December 31, 2012, based on the criteria established in
Internal Control-Integrated Framework
issued by the Committee of Sponsoring Organizations of the Treadway Commission and our report dated
February 28, 2013
expressed an unqualified opinion on the Company's internal control over financial reporting.
/s/ DELOITTE & TOUCHE LLP
Nashville, Tennessee
February 28, 2013
45
Dollar amounts in millions
|
|
|||||||
|
|
December 31,
|
||||||
|
|
2012
|
2011
|
|||||
|
ASSETS
|
|||||||
|
Current assets:
|
|||||||
|
Cash and cash equivalents
|
$
|
560.9
|
|
$
|
340.0
|
|
|
|
Receivables, net of allowance for doubtful accounts of $1.1 million and $1.1 million at December 31, 2012 and 2011
|
80.9
|
|
65.1
|
|
|||
|
Income tax receivable
|
1.8
|
|
3.5
|
|
|||
|
Inventories
|
209.8
|
|
163.6
|
|
|||
|
Prepaid expenses and other current assets
|
6.0
|
|
5.7
|
|
|||
|
Deferred income taxes
|
12.3
|
|
17.0
|
|
|||
|
Current portion of notes receivable from asset sales
|
91.4
|
|
10.0
|
|
|||
|
Assets held for sale
|
32.5
|
|
51.9
|
|
|||
|
Total current assets
|
995.6
|
|
656.8
|
|
|||
|
Timber and timberlands
|
40.1
|
|
45.5
|
|
|||
|
Property, plant and equipment, at cost:
|
|||||||
|
Land, land improvements and logging roads, net of road amortization
|
116.8
|
|
120.6
|
|
|||
|
Buildings
|
280.5
|
|
265.5
|
|
|||
|
Machinery and equipment
|
1,642.1
|
|
1,636.5
|
|
|||
|
Construction in progress
|
22.2
|
|
5.5
|
|
|||
|
2,061.6
|
|
2,028.1
|
|
||||
|
Accumulated depreciation
|
(1,310.8
|
)
|
(1,245.9
|
)
|
|||
|
Net property, plant and equipment
|
750.8
|
|
782.2
|
|
|||
|
Notes receivable from asset sales
|
432.2
|
|
523.5
|
|
|||
|
Investments in and advances to affiliates
|
68.6
|
|
79.1
|
|
|||
|
Deferred debt costs
|
9.2
|
|
8.9
|
|
|||
|
Long-term investments
|
2.0
|
|
0.7
|
|
|||
|
Restricted cash
|
12.0
|
|
12.9
|
|
|||
|
Intangible assets, net of amortization
|
0.6
|
|
1.4
|
|
|||
|
Other assets
|
14.9
|
|
24.9
|
|
|||
|
Long-term deferred tax asset
|
5.0
|
|
4.0
|
|
|||
|
Total assets
|
$
|
2,331.0
|
|
$
|
2,139.9
|
|
|
See Notes to the Financial Statements.
46
|
Consolidated Balance Sheets (Continued)
Dollar amounts in millions, except per share
|
|||||||
|
|
December 31,
|
||||||
|
|
2012
|
2011
|
|||||
|
LIABILITIES AND STOCKHOLDERS’ EQUITY
|
|||||||
|
Current liabilities:
|
|||||||
|
Current portion of long-term debt
|
$
|
7.8
|
|
$
|
5.3
|
|
|
|
Current portion of limited recourse notes payable
|
90.0
|
|
7.9
|
|
|||
|
Accounts payable and accrued liabilities
|
139.5
|
|
122.3
|
|
|||
|
Current portion of contingency reserves
|
2.0
|
|
4.0
|
|
|||
|
Total current liabilities
|
239.3
|
|
139.5
|
|
|||
|
Long-term debt, excluding current portion
|
782.7
|
|
715.9
|
|
|||
|
Deferred income taxes
|
93.6
|
|
106.0
|
|
|||
|
Contingency reserves, excluding current portion
|
12.8
|
|
17.2
|
|
|||
|
Other long-term liabilities
|
168.8
|
|
160.4
|
|
|||
|
Stockholders’ equity:
|
|||||||
|
Preferred stock, $1 par value, 15,000,000 shares authorized, no shares issued
|
—
|
|
—
|
|
|||
|
Common stock, $1 par value, 200,000,000 shares authorized, 150,423,999 and 149,818,301 shares issued
|
150.4
|
|
149.8
|
|
|||
|
Additional paid-in capital
|
533.6
|
|
549.9
|
|
|||
|
Retained earnings
|
710.6
|
|
681.8
|
|
|||
|
Treasury stock, 11,889,468 shares and 12,678,360 shares, at cost
|
(252.9
|
)
|
(274.4
|
)
|
|||
|
Accumulated comprehensive loss
|
(107.9
|
)
|
(106.2
|
)
|
|||
|
Total stockholders’ equity
|
1,033.8
|
|
1,000.9
|
|
|||
|
Total liabilities and stockholders’ equity
|
$
|
2,331.0
|
|
$
|
2,139.9
|
|
|
See Notes to the Financial Statements.
47
Dollar amounts in millions, except per share
|
|
Year ended December 31,
|
||||||||||
|
|
2012
|
2011
|
2010
|
||||||||
|
Net sales
|
$
|
1,715.8
|
|
$
|
1,356.9
|
|
$
|
1,383.6
|
|
||
|
Operating costs and expenses:
|
|||||||||||
|
Cost of sales
|
1,403.1
|
|
1,244.2
|
|
1,187.9
|
|
|||||
|
Depreciation and amortization
|
73.9
|
|
78.9
|
|
82.0
|
|
|||||
|
Selling and administrative
|
129.4
|
|
111.2
|
|
118.8
|
|
|||||
|
Loss on sale or impairment of long lived assets
|
4.9
|
|
73.9
|
|
2.4
|
|
|||||
|
Other operating credits and charges, net
|
(2.9
|
)
|
(11.2
|
)
|
0.1
|
|
|||||
|
Total operating costs and expenses
|
1,608.4
|
|
1,497.0
|
|
1,391.2
|
|
|||||
|
Income (loss) from operations
|
107.4
|
|
(140.1
|
)
|
(7.6
|
)
|
|||||
|
Non-operating income (expense):
|
|||||||||||
|
Interest expense, net of capitalized interest
|
(49.3
|
)
|
(56.9
|
)
|
(63.9
|
)
|
|||||
|
Investment income
|
14.8
|
|
28.7
|
|
38.4
|
|
|||||
|
Other-than-temporary investment impairment
|
—
|
|
(14.8
|
)
|
(17.0
|
)
|
|||||
|
Other non-operating income (expense)
|
(34.9
|
)
|
(1.0
|
)
|
2.2
|
|
|||||
|
Total non-operating income (expense)
|
(69.4
|
)
|
(44.0
|
)
|
(40.3
|
)
|
|||||
|
Income (loss) before income taxes and equity in (income) loss of unconsolidated affiliates
|
38.0
|
|
(184.1
|
)
|
(47.9
|
)
|
|||||
|
Provision (benefit) for income taxes
|
7.6
|
|
(39.1
|
)
|
(22.1
|
)
|
|||||
|
Equity in (income) loss of unconsolidated affiliates
|
(1.7
|
)
|
26.9
|
|
6.4
|
|
|||||
|
Income (loss) from continuing operations
|
32.1
|
|
(171.9
|
)
|
(32.2
|
)
|
|||||
|
Loss from discontinued operations before tax
|
(4.3
|
)
|
(14.2
|
)
|
(10.4
|
)
|
|||||
|
Benefit for income taxes
|
(1.0
|
)
|
(5.0
|
)
|
(4.0
|
)
|
|||||
|
Loss from discontinued operations
|
(3.3
|
)
|
(9.2
|
)
|
(6.4
|
)
|
|||||
|
Net income (loss)
|
28.8
|
|
(181.1
|
)
|
(38.6
|
)
|
|||||
|
Less: Net income attributed to non-controlling interest
|
—
|
|
0.2
|
|
0.4
|
|
|||||
|
Net income (loss) attributed to Louisiana-Pacific Corporation
|
$
|
28.8
|
|
$
|
(181.3
|
)
|
$
|
(39.0
|
)
|
||
|
Amounts attributed to LP Corporation common shareholders:
|
|||||||||||
|
Income (loss) from continuing operations, net of tax
|
$
|
32.1
|
|
$
|
(172.1
|
)
|
$
|
(32.6
|
)
|
||
|
Loss from discontinued operations, net of tax
|
(3.3
|
)
|
(9.2
|
)
|
(6.4
|
)
|
|||||
|
$
|
28.8
|
|
$
|
(181.3
|
)
|
$
|
(39.0
|
)
|
|||
|
Basic net income (loss) per share:
|
|||||||||||
|
Income (loss) per share from continuing operations
|
$
|
0.23
|
|
$
|
(1.29
|
)
|
$
|
(0.25
|
)
|
||
|
Loss per share from discontinued operations
|
(0.02
|
)
|
(0.07
|
)
|
(0.05
|
)
|
|||||
|
Net income (loss) per share
|
$
|
0.21
|
|
$
|
(1.36
|
)
|
$
|
(0.30
|
)
|
||
|
Diluted net earnings (loss) per share:
|
|||||||||||
|
Income (loss) per share from continuing operations
|
$
|
0.22
|
|
$
|
(1.29
|
)
|
$
|
(0.25
|
)
|
||
|
Loss per share from discontinued operations
|
(0.02
|
)
|
(0.07
|
)
|
(0.05
|
)
|
|||||
|
Net income (loss) per share
|
$
|
0.20
|
|
$
|
(1.36
|
)
|
$
|
(0.30
|
)
|
||
|
Average shares of common stock used to compute net loss per share:
|
|||||||||||
|
Basic
|
137.1
|
|
133.2
|
|
129.1
|
|
|||||
|
Diluted
|
142.6
|
|
133.2
|
|
129.1
|
|
|||||
See Notes to the Financial Statements.
48
Consolidated Statements of Comprehensive Income
Dollar amounts in millions
|
|
Year ended December 31,
|
||||||||||
|
|
2012
|
2011
|
2010
|
||||||||
|
Net income (loss)
|
$
|
28.8
|
|
$
|
(181.1
|
)
|
$
|
(38.6
|
)
|
||
|
Other comprehensive income (loss), net of tax
|
|||||||||||
|
Foreign currency translation adjustments
|
0.6
|
|
(12.4
|
)
|
9.0
|
|
|||||
|
Unrealized gains (losses) on derivative financial instruments
|
(0.7
|
)
|
0.7
|
|
(0.2
|
)
|
|||||
|
Unrealized gains (losses) on securities, net of reversals
|
0.8
|
|
(6.3
|
)
|
(4.9
|
)
|
|||||
|
Defined benefit pension and post retirement plans:
|
|||||||||||
|
Amortization of prior service cost
|
0.2
|
|
0.2
|
|
0.2
|
|
|||||
|
Net loss
|
(8.1
|
)
|
(26.8
|
)
|
(9.2
|
)
|
|||||
|
Amortization of net loss
|
4.2
|
|
3.1
|
|
1.7
|
|
|||||
|
Pension settlement
|
1.3
|
|
—
|
|
—
|
|
|||||
|
Exchange (loss) gain on remeasurement
|
—
|
|
0.3
|
|
(0.3
|
)
|
|||||
|
Other comprehensive loss, net of tax
|
(1.7
|
)
|
(41.2
|
)
|
(3.7
|
)
|
|||||
|
Net income attributable to non-controlling interest
|
—
|
|
(0.2
|
)
|
(0.4
|
)
|
|||||
|
Foreign currency translation adjustments attributed to non-controlling interest
|
—
|
|
(1.0
|
)
|
(1.3
|
)
|
|||||
|
Comprehensive income (loss)
|
$
|
27.1
|
|
$
|
(223.5
|
)
|
$
|
(44.0
|
)
|
||
See Notes to the Financial Statements.
49
Dollar amounts in millions
|
|
Year ended December 31,
|
||||||||||
|
|
2012
|
2011
|
2010
|
||||||||
|
CASH FLOWS FROM OPERATING ACTIVITIES
|
|||||||||||
|
Net income (loss)
|
$
|
28.8
|
|
$
|
(181.1
|
)
|
$
|
(38.6
|
)
|
||
|
Adjustments to reconcile net income (loss) to net cash provided by (used in) operating activities:
|
|||||||||||
|
Depreciation and amortization
|
73.9
|
|
78.9
|
|
82.0
|
|
|||||
|
(Income) loss from unconsolidated affiliates
|
(1.7
|
)
|
26.9
|
|
6.4
|
|
|||||
|
Other operating credits and charges, net
|
(2.9
|
)
|
(11.2
|
)
|
(1.2
|
)
|
|||||
|
(Gain) loss on sale or impairment of long-lived assets
|
4.9
|
|
73.9
|
|
(1.2
|
)
|
|||||
|
Gain on settlement of litigation related to ARS
|
(20.0
|
)
|
—
|
|
—
|
|
|||||
|
Loss on early debt extinguishment
|
52.2
|
|
—
|
|
—
|
|
|||||
|
Realized gain on sale of long term investments
|
—
|
|
(15.2
|
)
|
(19.0
|
)
|
|||||
|
Other-than-temporary impairment of investments
|
—
|
|
14.8
|
|
17.0
|
|
|||||
|
Stock-based compensation related to stock plans
|
8.4
|
|
7.8
|
|
8.8
|
|
|||||
|
Exchange loss on remeasurement
|
3.4
|
|
0.1
|
|
0.9
|
|
|||||
|
Cash settlements of contingencies
|
(1.4
|
)
|
(2.3
|
)
|
(9.8
|
)
|
|||||
|
Cash settlements of warranties, net of accruals
|
(5.1
|
)
|
0.4
|
|
(3.4
|
)
|
|||||
|
Pension (payments) expense, net
|
8.4
|
|
(6.3
|
)
|
(8.2
|
)
|
|||||
|
Non-cash interest expense, net
|
4.8
|
|
8.4
|
|
5.3
|
|
|||||
|
Other adjustments, net
|
0.2
|
|
3.4
|
|
2.1
|
|
|||||
|
Increase in receivables
|
(15.0
|
)
|
(0.7
|
)
|
(0.9
|
)
|
|||||
|
Decrease in income tax receivables
|
1.7
|
|
15.2
|
|
34.0
|
|
|||||
|
Increase in inventories
|
(44.5
|
)
|
(15.1
|
)
|
(8.5
|
)
|
|||||
|
(Increase) decrease in prepaid expenses
|
0.3
|
|
(0.2
|
)
|
1.2
|
|
|||||
|
Increase (decrease) in accounts payable and accrued liabilities
|
11.7
|
|
(5.4
|
)
|
(2.8
|
)
|
|||||
|
Increase (decrease) in deferred income taxes
|
3.7
|
|
(32.5
|
)
|
(16.3
|
)
|
|||||
|
Net cash provided by (used in) operating activities
|
111.8
|
|
(40.2
|
)
|
47.8
|
|
|||||
|
CASH FLOWS FROM INVESTING ACTIVITIES
|
|||||||||||
|
Property, plant, and equipment additions
|
(31.2
|
)
|
(21.4
|
)
|
(14.5
|
)
|
|||||
|
Proceeds from asset sales
|
9.2
|
|
1.3
|
|
3.3
|
|
|||||
|
Investment in and advances to joint ventures
|
12.7
|
|
(9.6
|
)
|
4.9
|
|
|||||
|
Proceeds from settlement of litigation related to ARS
|
20.0
|
|
—
|
|
—
|
|
|||||
|
Receipt of proceeds from notes receivable
|
10.0
|
|
—
|
|
115.1
|
|
|||||
|
Proceeds from sale of investments
|
—
|
|
19.1
|
|
21.8
|
|
|||||
|
Decrease (increase) in restricted cash under letters of credit/credit facility
|
0.8
|
|
18.3
|
|
(10.3
|
)
|
|||||
|
Net cash provided by investing activities
|
21.5
|
|
7.7
|
|
120.3
|
|
|||||
|
CASH FLOWS FROM FINANCING ACTIVITIES
|
|||||||||||
|
Borrowings of long-term debt
|
350.2
|
|
10.0
|
|
—
|
|
|||||
|
Repayment of long-term debt
|
(253.1
|
)
|
(0.2
|
)
|
(173.7
|
)
|
|||||
|
Payments made under revolving credit lines and short-term notes payable
|
—
|
|
—
|
|
(0.4
|
)
|
|||||
|
Redemption of redeemable non-controlling interest
|
—
|
|
(24.0
|
)
|
—
|
|
|||||
|
Payment of debt issuance fees
|
(6.3
|
)
|
(1.5
|
)
|
(0.1
|
)
|
|||||
|
Sale of common stock under equity plans
|
1.3
|
|
—
|
|
—
|
|
|||||
|
Other financing activities, net
|
—
|
|
—
|
|
(0.1
|
)
|
|||||
|
Net cash provided by (used in) financing activities
|
92.1
|
|
(15.7
|
)
|
(174.3
|
)
|
|||||
|
Effect of exchange rate on cash and cash equivalents
|
(4.5
|
)
|
(1.1
|
)
|
1.4
|
|
|||||
|
Net increase (decrease) in cash and cash equivalents
|
220.9
|
|
(49.3
|
)
|
(4.8
|
)
|
|||||
|
Cash and cash equivalents at beginning of year
|
340.0
|
|
389.3
|
|
394.1
|
|
|||||
|
Cash and cash equivalents at end of year
|
$
|
560.9
|
|
$
|
340.0
|
|
$
|
389.3
|
|
||
See Notes to the Financial Statements.
50
Consolidated Statements of Stockholders’ Equity
Dollar and share amounts in millions, except per share amounts
|
|
Common Stock
|
Treasury Stock
|
Additional
Paid-In
Capital
|
Retained
Earnings
|
Accumulated
Comprehensive
Loss
|
Total
Stockholders’
Equity
|
Redeemable
Non
Controlling
Interest
|
||||||||||||||||||||||||||
|
|
Shares
|
Amount
|
Shares
|
Amount
|
|||||||||||||||||||||||||||||
|
Balance as of December 31, 2009
|
139.7
|
|
$
|
139.7
|
|
13.1
|
|
$
|
(286.1
|
)
|
$
|
562.4
|
|
$
|
902.1
|
|
$
|
(64.6
|
)
|
$
|
1,253.5
|
|
$
|
21.1
|
|
||||||||
|
Net income (loss)
|
|
|
|
|
|
(39.0
|
)
|
|
(39.0
|
)
|
0.4
|
|
|||||||||||||||||||||
|
Issuance of shares for employee stock plans and stock-based compensation
|
|
|
(0.2
|
)
|
6.2
|
|
0.8
|
|
|
|
7.0
|
|
|
||||||||||||||||||||
|
Amortization of restricted stock grants
|
|
|
|
|
1.7
|
|
|
|
1.7
|
|
|
||||||||||||||||||||||
|
Issuance and exercise of stock warrants in connection with debt issuance
|
5.1
|
|
5.1
|
|
|
|
(5.1
|
)
|
|
|
—
|
|
|
||||||||||||||||||||
|
Tax cost of employee stock plan transactions
|
|
|
|
|
(0.4
|
)
|
|
|
(0.4
|
)
|
|
||||||||||||||||||||||
|
Other comprehensive loss
|
|
|
|
|
|
|
(5.0
|
)
|
(5.0
|
)
|
1.3
|
|
|||||||||||||||||||||
|
Balance as of December 31, 2010
|
144.8
|
|
144.8
|
|
12.9
|
|
(279.9
|
)
|
559.4
|
|
863.1
|
|
(69.6
|
)
|
1,217.8
|
|
22.8
|
|
|||||||||||||||
|
Net income (loss)
|
|
|
|
|
|
(181.3
|
)
|
|
(181.3
|
)
|
0.2
|
|
|||||||||||||||||||||
|
Issuance of shares for employee stock plans and stock-based compensation
|
|
|
(0.2
|
)
|
5.5
|
|
|
|
|
|
5.5
|
|
|
||||||||||||||||||||
|
Amortization of restricted stock grants
|
|
|
|
|
1.3
|
|
|
|
1.3
|
|
|
||||||||||||||||||||||
|
Exercise of stock warrants
|
5.0
|
|
5.0
|
|
|
|
(5.0
|
)
|
|
|
—
|
|
|
||||||||||||||||||||
|
Tax cost of employee stock plan transactions
|
|
|
|
|
(0.6
|
)
|
|
|
(0.6
|
)
|
|
||||||||||||||||||||||
|
Redemption of redeemable non-controlling interest
|
(5.2
|
)
|
5.6
|
|
0.4
|
|
(24.0
|
)
|
|||||||||||||||||||||||||
|
Other comprehensive loss
|
|
|
|
|
|
|
(42.2
|
)
|
(42.2
|
)
|
1.0
|
|
|||||||||||||||||||||
|
Balance as of December 31, 2011
|
149.8
|
|
149.8
|
|
12.7
|
|
(274.4
|
)
|
549.9
|
|
681.8
|
|
(106.2
|
)
|
1,000.9
|
|
—
|
|
|||||||||||||||
|
Net income
|
|
|
|
|
|
|
|
|
|
|
28.8
|
|
|
|
28.8
|
|
—
|
|
|||||||||||||||
|
Issuance of shares for employee stock plans and stock-based compensation
|
|
|
|
|
(0.8
|
)
|
21.5
|
|
(23.8
|
)
|
|
|
|
|
(2.3
|
)
|
|
|
|||||||||||||||
|
Amortization of restricted stock grants
|
|
|
|
|
|
|
|
|
8.1
|
|
|
|
|
|
8.1
|
|
|
|
|||||||||||||||
|
Exercise of stock warrants
|
0.6
|
|
0.6
|
|
|
|
|
|
(0.6
|
)
|
|
|
|
|
—
|
|
|
|
|||||||||||||||
|
Other comprehensive loss
|
|
|
|
|
|
|
|
|
|
|
|
|
(1.7
|
)
|
(1.7
|
)
|
—
|
|
|||||||||||||||
|
Balance as of December 31, 2012
|
150.4
|
|
$
|
150.4
|
|
11.9
|
|
$
|
(252.9
|
)
|
$
|
533.6
|
|
$
|
710.6
|
|
$
|
(107.9
|
)
|
$
|
1,033.8
|
|
$
|
—
|
|
||||||||
See Notes to the Financial Statements
51
NOTES TO THE FINANCIAL STATEMENTS
|
1.
|
SUMMARY OF SIGNIFICANT ACCOUNTING POLICIES
|
Nature of Operations
Louisiana-Pacific Corporation and its subsidiaries (collectively LP or the Company) are principally engaged in the manufacture of building products. In addition to its U.S. operations, the Company also maintains manufacturing facilities in Canada, Chile and Brazil through foreign subsidiaries and joint ventures. The principal customers for the Company’s building products are retail home centers, manufactured housing producers, distributors and wholesalers in North America and South America, with sales to Asia, Australia and Europe.
See Note 24 below for further information regarding LP’s products and segments.
Use of Estimates in the Preparation of Financial Statements
The preparation of financial statements in conformity with accounting principles generally accepted in the U.S. requires management to make estimates and assumptions that affect the reported amounts of assets and liabilities and disclosure of contingent assets and liabilities at the date of the financial statements and the reported amounts of revenues and expenses during the reporting period. Actual results could differ from those estimates. See discussion of specific estimates in this Note under the headings “Asset Impairments,” and “Other Operating Credits and Charges, Net” and in the Notes entitled “Income Taxes,” “Retirement Plans and Postretirement Benefits,” “Stockholders’ Equity,” “Other Operating Credits and Charges, Net,” “Gain (Loss) on Sale of and Impairment of Long-Lived Assets, Net” and “Contingencies.”
Consolidation
The consolidated financial statements include the accounts of LP and its majority-owned subsidiaries after elimination of intercompany transactions. The equity method of accounting is used for joint ventures and investments in associated companies over which LP has significant influence but does not have effective control. Significant influence is deemed to exist generally when the Company has an ownership interest in the voting stock of an investee of between
20 percent
and
50 percent
. LP’s equity in the income and losses of these investments is recorded in “Equity in loss of unconsolidated affiliates” on the Consolidated Statements of Income. See Note 8 for further discussion of these investments and advances. Where our ownership interest is less than
100 percent
but more than
50 percent
, the outside shareholders’ interests are shown as non-controlling interest. See Note 19 for further discussion of this investment.
LP consolidates a variable interest entity (VIE) when it has a controlling financial interest in the VIE and is thus determined to be the VIE's primary beneficiary. LP currently consolidates its interest in LP Pinewood which was established in 2003 in connection with the sale of LP's southern timberlands. LP has notes receivable of
$410.0 million
(see Note 6) and notes payable of
$368.7 million
(see Note 12) recorded in the balance sheet related to LP's interest in the VIE. For further information regarding the details of the relationship of the assets and liabilities and the recourse provisions of the consolidated VIE see Note 12.
LP also has a variable interest in its Canfor-LP and Abitibi-LP equity method investees but is not considered to be the primary beneficiary. See Note 8 for further information on these investments.
Earnings per Share
Basic earnings per share are based on the weighted-average number of shares of common stock outstanding. Diluted earnings per share are based upon the weighted-average number of shares of common stock outstanding plus all potentially dilutive securities that were assumed to be converted into common shares at the beginning of the period under the treasury stock method. This method requires that the effect of potentially dilutive common stock equivalents (employee stock options, stock settled stock appreciation rights, incentive shares, performance shares and warrants) be excluded from the calculation of diluted earnings per share for the periods in which losses from continuing operations are reported because the effect is anti-dilutive. The following table sets forth the computation of basic and diluted earnings per share:
52
|
|
Year ended December 31,
|
||||||||||
|
Dollar and share amounts in millions, except per share amounts
|
2012
|
2011
|
2010
|
||||||||
|
Numerator:
|
|||||||||||
|
Income (loss) attributed to LP common shares:
|
|||||||||||
|
Income (loss) from continuing operations
|
$
|
32.1
|
|
$
|
(172.1
|
)
|
$
|
(32.6
|
)
|
||
|
Loss from discontinued operations
|
(3.3
|
)
|
(9.2
|
)
|
(6.4
|
)
|
|||||
|
Net income (loss)
|
$
|
28.8
|
|
$
|
(181.3
|
)
|
$
|
(39.0
|
)
|
||
|
Denominator:
|
|||||||||||
|
Basic—weighted average common shares outstanding
|
137.1
|
|
133.2
|
|
129.1
|
|
|||||
|
Dilutive effect of employee stock plans
|
2.3
|
|
—
|
|
—
|
|
|||||
|
Dilutive effect of stock warrants
|
3.2
|
|
—
|
|
—
|
|
|||||
|
Diluted shares outstanding
|
142.6
|
|
133.2
|
|
129.1
|
|
|||||
|
Basic earnings per share:
|
|||||||||||
|
Income (loss) from continuing operations
|
$
|
0.23
|
|
$
|
(1.29
|
)
|
$
|
(0.25
|
)
|
||
|
Loss from discontinued operations
|
(0.02
|
)
|
(0.07
|
)
|
(0.05
|
)
|
|||||
|
Net income (loss) per share
|
$
|
0.21
|
|
$
|
(1.36
|
)
|
$
|
(0.30
|
)
|
||
|
Diluted earnings per share:
|
|||||||||||
|
Income (loss) from continuing operations
|
$
|
0.22
|
|
$
|
(1.29
|
)
|
$
|
(0.25
|
)
|
||
|
Loss from discontinued operations
|
(0.02
|
)
|
(0.07
|
)
|
(0.05
|
)
|
|||||
|
Net income (loss) per share
|
$
|
0.20
|
|
$
|
(1.36
|
)
|
$
|
(0.30
|
)
|
||
Stock options, warrants and stock settled stock appreciation rights (SSARs) related to approximately
5.3 million
common shares were considered not in-the-money for purposes of LP's earnings per share calculation for the year ended
December 31, 2012
. Stock options, warrants and stock settled stock appreciation rights (SSARs) related to approximately
7.1 million
and
9.1 million
common shares for the years ended
December 31, 2011
and
2010
were considered anti-dilutive for purposes of LP’s earnings per share calculation due to LP’s loss position in continuing operations.
Cash and Cash Equivalents
Cash and cash equivalents consist of money market investments with an initial maturity of three months or less. Such investments are stated at cost, which approximates market value.
Investments
LP’s long-term investments are classified as available-for-sale and are reported at estimated fair value. LP may invest in securities including U.S. treasury notes, bank obligations, corporate obligations, auction rate securities and commercial paper. Under LP’s investment criteria at purchase, bank and corporate obligations carry a rating of at least A-1 and commercial paper must have the highest rating obtainable from one or more rating agencies. Unrealized gains and losses, net of tax, on these investments are reported as a separate component of “Accumulated comprehensive loss” in Stockholders’ Equity until realized. Impairment losses are charged to income for other-than-temporary declines in fair value. Realized gains and losses (including impairments) are recorded in “Investment income” in the Consolidated Statements of Income. For purposes of computing realized gains and losses, cost is identified on a specific identification basis. See Note 2 for further discussion.
Fair Value of Financial Instruments
LP has, where appropriate, estimated the fair value of financial instruments. These fair value amounts may be significantly affected by the assumptions used, including the discount rate and estimates of cash flows. Accordingly,
53
the estimates presented are not necessarily indicative of the amounts that could be realized in a current market exchange.
Inventory
Inventories are valued at the lower of cost or market. Inventory costs include materials, labor and operating overhead. The LIFO (last-in, first-out) method is used for a minor portion of the Company’s log inventories with the remaining inventories valued at FIFO (first-in, first-out) or average cost. See Note 5 for further discussion.
Timber and Timberlands
Timber and timberlands is comprised of timber deeds and allocations of purchase price to Canadian timber harvesting licenses. Timber deeds are transactions in which LP purchases timber, but not the underlying land. The cost of timber deeds are capitalized in timber and timberlands and charged to cost of timber harvested as the volume is removed. Timber that has been severed but has not yet been delivered to a facility is included in timber and timberlands. The values associated with timber licenses were allocated in the purchase price allocations for both Le Groupe Forex (Forex) and the assets of Evans Forest Products. These licenses have a life of twenty to twenty-five years. These licenses are amortized on a straight-line basis over the life of the license as the licenses are utilized. Cost of timber harvested also includes the amortization of the timber licenses. See Note 7 for further discussion.
Assets Held for Sale
Over the last several years, LP has adopted and implemented plans to sell selected assets in order to improve its operating results. LP is required to classify assets held for sale which are not part of a discontinued business separately on the face of the financial statements outside of “Property, plant and equipment”. As of
December 31, 2012
and
2011
, LP included three OSB mills and various non-operating sites in its held for sale category. See Note 3 for discussion of impairments recorded on these assets to reduce carrying value to estimated sales prices less estimated selling costs. The current book values of assets held for sale by category is as follows:
|
Dollar amounts in millions
|
December 31,
|
||||||
|
2012
|
2011
|
||||||
|
Property, plant and equipment, at cost:
|
|||||||
|
Land, land improvements and logging roads, net of road amortization
|
$
|
10.0
|
|
$
|
13.1
|
|
|
|
Buildings
|
17.1
|
|
22.9
|
|
|||
|
Machinery and equipment
|
140.8
|
|
178.3
|
|
|||
|
167.9
|
|
214.3
|
|
||||
|
Accumulated depreciation
|
(135.4
|
)
|
(162.4
|
)
|
|||
|
Net property, plant and equipment
|
$
|
32.5
|
|
$
|
51.9
|
|
|
LP believes that the net realizable sales value of the aforementioned assets exceeds their carrying values.
Property, Plant and Equipment
Property, plant and equipment, including capitalized interest, are recorded at cost. Depreciation for financial statement purposes is provided principally using the units of production method for machinery and equipment which amortizes the cost of equipment over the estimated units that will be produced during its useful life. Provisions for depreciation of buildings, land improvements and the remaining machinery and equipment have been computed using straight-line rates based on the estimated service lives. The effective straight-line lives for the principal classes of property range from three to twenty years.
Logging road construction costs are capitalized and included in land and land improvements. These costs are amortized as the timber volume adjacent to the road system is harvested.
54
LP capitalizes interest on borrowed funds during construction periods. Capitalized interest is charged to machinery and equipment accounts and amortized over the lives of the related assets. Capitalized interest totaled
$0.2 million
in
2012
. There was no capitalized interest during
2011
and 2010 due to LP’s reduced capital programs.
Potential Impairments
Long-lived assets to be held and used by LP (primarily property, plant and equipment and timber and timberlands) are reviewed for impairment when events or changes in circumstances indicate that the carrying amount of the assets may not be recoverable. When impairment is indicated, the book values of the assets are written down to their estimated fair value as calculated by the expected discounted cash flow or estimated net sales price. See Note 3 for impairment charges recorded in the periods presented. Also see Note 17 for a discussion of charges in
2012
,
2011
and
2010
related to impairments of property, plant and equipment. Long-lived assets that are held for sale are written down to the estimated sales proceeds less cost to sell unless the estimated net proceeds exceed the carrying value.
LP continues to review certain operations and investments for potential impairments. LP’s management currently believes it has adequate support for the carrying value of each of these operations and investments based upon the anticipated cash flows that result from estimates of future demand, pricing and production costs assuming certain levels of planned capital expenditures. As of
December 31, 2012
, there were no indications of impairment for the asset grouping that included the company's indefinitely curtailed facilities. As of
December 31, 2012
, the estimated fair values of LP's facilities that have not been indefinitely curtailed were substantially in excess of their carrying value, which supported the conclusion that no impairment is necessary for those facilities. However, if demand and pricing for the relevant products continues at levels significantly below cycle average demand and pricing, or should LP decide to invest capital in alternative projects, it is possible that impairment charges will be required.
Income Taxes
LP accounts for income taxes under an asset and liability approach that requires the recognition of deferred tax assets and liabilities for the expected future tax consequences of events that have been recognized in LP’s financial statements or tax returns. In estimating future tax consequences, LP generally considers all expected future events other than the enactment of changes in tax laws or rates and future income. The effect on deferred tax assets and liabilities of a change in tax rates will be recognized as income or expense in the period that includes the enactment date. Additionally, deferred tax assets are reduced by a valuation allowance when it is more likely than not that some portion of the deferred tax assets will not be realized.
LP recognizes liabilities for uncertain tax positions through a two step process. The first step is to the evaluate the tax position for recognition by determining if the weight of the available evidence indicates that it is more likely than not that the position will be sustained on audit, including resolution of related appeals or litigation process, if any. The second step requires LP to estimate and measure the tax benefit as the largest amount that is more than 50% likely to be realized upon ultimate settlement. It is inherently difficult and subjective to estimate such amounts, as LP must determine the probability for various outcomes. LP evaluates these uncertain tax provisions when new information becomes available. These revaluations are based upon factors including, but not limited to, changes in circumstances, changes in tax law, successful settlement of issues under audit and new audit activity. Such a change in recognition or measurement could result in the recognition of a tax benefit or an increase to the related provision.
LP classifies interest related to income taxes liabilities or uncertain tax positions as interest expense or interest income and, if applicable, penalties are recognized as a component of income tax expense.
See Note 10 for further discussion of deferred taxes.
Stock-Based Compensation
LP recognizes the cost of employee services received in exchange for awards of equity instruments, such as stock options, performance shares, restricted stock or restricted stock units and stock settled stock appreciation rights (SSAR), based upon the fair value of those awards at the date of grant over the requisite service period. LP generally uses the Black-Scholes-Merton (Black-Scholes) option pricing model to determine the fair value of the stock option
55
and SSAR awards. Stock-based compensation plans, related expenses and assumptions used in the Black-Scholes option pricing model are more fully described in Note 14. The fair market value of performance share awards are determined based on the fair value as of the date of grant times the number of shares adjusted for the weighted probability of the attainment of the relevant performance goals.
Derivative Financial Instruments
To reduce foreign currency exchange and interest rate risks, LP occasionally utilizes derivative financial instruments, which include forward exchange, options and futures contracts. For the years ended
December 31, 2012
,
2011
and
2010
, LP did not enter into any material derivative financial contracts. U.S. GreenFiber, LLC (GreenFiber), a fifty percent owned joint venture between LP and Casella Waste Management, Inc. (accounted for under the equity method of accounting), entered into a swap contract for the purchase of raw materials. As of
December 31, 2012
, GreenFiber recognized
$1.2 million
in “Other comprehensive income” to adjust these contracts to fair market value and, accordingly, LP has recorded its share,
$0.7 million
, in LP’s “Other comprehensive income.” Additionally, LP has provided deferred taxes of
$0.2 million
associated with this swap.
Foreign Currency Translation
The functional currency for the Company’s Canadian subsidiaries is the U.S. dollar; however the books and records for these subsidiaries are maintained in the Canadian dollar. The financial statements of these foreign subsidiaries are remeasured into U.S. dollars using the historical exchange rate for property, plant and equipment, timber and timberlands, goodwill, and certain other non-monetary assets and related depreciation and amortization on these assets and liabilities. LP uses the exchange rate at the balance sheet date for the remaining assets and liabilities, including deferred taxes. A weighted-average exchange rate is used for each period for revenues and expenses. These transaction gains or losses are recorded in “Other non-operating income (expense)” on the Consolidated Statements of Income.
The functional currencies of LP’s Chilean, Brazil and Peru subsidiaries are the Chilean peso, Brazilian real and Peruvian nuevo sol and their books and records are maintained in the local currency. Translation adjustments, which are based upon the exchange rate at the balance sheet date for assets and liabilities and the weighted-average rate for the income statement, are recorded in “Accumulated comprehensive loss” in Stockholders’ equity.
Intangible Assets
Intangible assets with finite useful lives are amortized generally on a straight-line basis over the periods benefited. Impairment of the investment is evaluated when factors indicate impairment may exist.
Restricted Cash
In accordance with LP’s credit facilities, discussed at Note 12, LP has established restricted cash accounts. As of
December 31, 2012
, a portion of the restricted cash secures outstanding letters of credit under LP’s U.S. and Canadian credit facilities.
Revenue Recognition
Revenue is recognized when customers receive products and title has passed. The following criteria are used to determine that title has passed: (1) persuasive evidence of an arrangement exists; (2) delivery has occurred or services have been rendered; (3) the price to the buyer is fixed or determinable; and (4) the collection is reasonably assured.
During
2012
, LP's top ten customers accounted for approximately
46%
of its sales, with its largest customer, Home Depot, Inc. accounting for
10%
. During
2011
, LP’s top ten customers accounted for approximately
48%
of its sales and no customer accounted for more than
10%
. During
2010
, LP’s top ten customers accounted for approximately
49%
of its sales, with its largest customer, Taiga Building Products, Ltd. accounting for
11%
.
56
Pricing and Sales Incentives
LP records estimated reductions to revenue for customer programs and incentive offerings, including pricing arrangements, promotions and other volume-based incentives, at the date revenue is recognized. Some of these incentives are negotiated up front with the customer and are redeemable only if the customer achieves a specified cumulative level of sales (measured in dollars or units) or sales increase. Under these incentive programs, at the time of sale, LP estimates the anticipated rebate to be paid based upon forecasted sales levels. These forecasts are updated on a regular basis. If the forecasted sales for a customer change significantly, the accrual for rebates is adjusted to reflect the revised estimate.
Asset Retirement Obligations
LP records the fair value of the legal obligations and the conditional obligations to retire and remove long-lived assets in the period which the obligation is incurred. These obligations primarily consist of monitoring costs on closed landfills, timber reforestation obligations associated with LP’s timber licenses in Canada and certain site restoration costs. When the related liability is initially recorded, LP capitalizes the cost by increasing the carrying amount of the related long-lived asset. Over time, the liability is accreted to its settlement value and the capitalized cost is depreciated over the useful life of the related asset. Upon settlement of the liability, LP recognizes a gain or loss for any difference between the settlement amount and the liability recorded. See Note 15 for further discussion.
Deferred Debt Costs
Deferred debt costs are amortized over the life of the related debt using a straight line basis which approximates the effective interest method. If the debt is retired early, the related unamortized deferred financing costs are written off in the period the debt is retired to other non-operating income (expense). During 2012,
$4.5 million
of deferred debt costs were written off in association with the early debt extinguishment. LP amortized deferred debt costs of
$1.5 million
,
$2.6 million
and
$3.1 million
for the years ended
December 31, 2012
,
2011
and
2010
. See Note 11 for further discussion.
Other Operating Credits and Charges, Net
LP classifies significant amounts that management considers unrelated to ongoing core operating activities as “Other operating credits and charges, net” in the Consolidated Statements of Income. Such items include, but are not limited to, amounts related to restructuring charges (including severance charges), charges to establish and maintain litigation or environmental reserves, prior year inventory profit adjustments, retirement charges and gains or losses from settlements with governmental or other organizations. Due to the nature of these items, amounts in the income statement can fluctuate from year to year. The determination of which items are considered significant and unrelated to core operations is based upon management’s judgment. See Note 16 for a discussion of specific amounts in
2012
,
2011
and
2010
.
Retirement Benefits
LP is required to use actuarial methods and assumptions in the valuation of defined benefit obligations and the determination of expense. Difference between actual and expected results or changes in the values of the obligations and plan assets are not recognized in earnings as they occur but, rather, systematically and gradually over subsequent periods. Prior to January 1, 2010, the cost of retiree benefits was recognized over the employees’ service period. As of January 1, 2010, LP froze the U.S. defined benefit plan and accordingly changed the method of accounting for such amounts to be amortized over the period until retirement as opposed to the estimated service period. The change in this method lengthened the amortization period for U.S. plans. See Note 13 for further information.
57
Comprehensive Income
Comprehensive income consists of net income (loss) and other gains and losses affecting shareholders’ equity that are excluded from net income (loss), including foreign currency translation adjustments, prior service costs and credits, transition assets or obligations associated with pension or other post retirement benefits that have not been recognized as components of net periodic benefit costs, net unrealized gains or losses on securities, and unrealized gains and losses on financial instruments qualifying for cash flow hedge accounting, and is presented in the accompanying Consolidated Statements of Comprehensive Income. See Note 23 for further discussion.
|
2.
|
INVESTMENTS
|
Short-term and long-term investments held by LP are debt securities designated as available for sale and are reported at fair market value using the specific identification method. The following table summarizes unrealized gains and losses related to these investments as of
December 31, 2012
and
December 31, 2011
:
|
Dollar amounts in millions
|
Amortized Cost
|
Gross Unrealized Gains
|
Gross Unrealized Losses
|
Fair Value
|
|||||||||||
|
December 31, 2012
|
|||||||||||||||
|
Auction rate securities
|
$
|
0.3
|
|
$
|
1.7
|
|
$
|
—
|
|
$
|
2.0
|
|
|||
|
Total marketable securities
|
$
|
0.3
|
|
$
|
1.7
|
|
$
|
—
|
|
$
|
2.0
|
|
|||
|
December 31, 2011
|
|||||||||||||||
|
Auction rate securities
|
$
|
0.3
|
|
$
|
0.4
|
|
$
|
—
|
|
$
|
0.7
|
|
|||
|
Total marketable securities
|
$
|
0.3
|
|
$
|
0.4
|
|
$
|
—
|
|
$
|
0.7
|
|
|||
As of
December 31, 2012
, LP had
$2.0 million
(
$23.4 million
, par value) invested in auction rate securities (ARS). The ARS held by LP are securities with long-term nominal maturities for which the interest rates are reset through a Dutch auction each month. LP’s investments in ARS represent interests in collateralized debt obligations supported by pools of residential and commercial mortgages, bank trust preferred notes and other securities.
During
2011
, LP sold
$38.1 million
(par value) of its ARS in an open market transaction for
$19.1 million
. LP recorded a gain on sale of securities of
$15.2 million
, which represents a recovery of losses previously recorded as an “Other-than-temporary impairment”.
During
2010
, LP sold
$35.3 million
(par value) of its ARS pursuant to a tender offer for
$21.8 million
plus accrued interest. LP recorded a gain on sale of securities of
$19.0 million
, which represented a recovery of losses previously recorded as an "Other-than-temporary impairment".
LP reviews its marketable securities routinely for other-than-temporary impairment. The primary factors LP used to determine if an impairment charge must be recorded, because a decline in value of the security is other than temporary, include (i) whether the fair value of the investment is significantly below its cost basis, (ii) the financial condition of the issuer of the security (including its credit rating) and the underlying collateral, (iii) the length of time that the cost of the security has exceeded its fair value and (iv) LP’s intent and ability to retain the investment for a period of time sufficient to allow for any anticipated recovery in market value.
The contractual maturities of debt securities classified as available for sale at
December 31, 2012
were as follows:
58
|
Dollar amounts in millions
|
2012
|
||||||
|
Amortized
Cost
|
Fair
Value
|
||||||
|
Due in one year or less
|
$
|
—
|
|
$
|
—
|
|
|
|
Due in more than one year
|
0.3
|
|
2.0
|
|
|||
|
Total marketable securities
|
$
|
0.3
|
|
$
|
2.0
|
|
|
Proceeds from sales and maturities of investments for the years ended December 2011 and
2010
, totaled
$19.1 million
, and
$21.8 million
. There were no purchases of short-term and long-term investments for the years ended
December 31, 2012
,
2011
, and
2010
. During
2012
,
2011
and
2010
, LP did not own any short-term investments. Net unrealized gains and losses on derivative instruments are reported as a separate component of “Accumulated comprehensive loss” in Stockholders’ equity.
During
2012
, LP's ARS litigation with Deutsche Bank Securities, Inc. was settled, which resulted in a gain of
$20.0 million
recorded in non-operating income (expense). (See Note 11 for further discussion)
|
3.
|
FAIR VALUE MEASUREMENTS
|
Fair value is defined as the exchange price that would be received for an asset or paid to transfer a liability (an exit price) in the principal or most advantageous market for the asset or liability in an orderly transaction between market participants on the measurement date. The fair value hierarchy requires an entity to maximize the use of observable inputs and minimize the use of unobservable inputs when measuring fair value. LP is required to classify these financial assets and liabilities into two groups: recurring—measured on a periodic basis and non-recurring—measured on an as needed basis.
There are three levels of inputs that may be used to measure fair value:
|
Level 1
|
Unadjusted quoted prices in active markets that are accessible at the measurement date for identical, unrestricted assets or liabilities.
|
|
Level 2
|
Quoted prices for similar assets or liabilities in active markets; quoted prices for identical or similar assets or liabilities in inactive markets; or valuations based on models where the significant inputs are observable or can be corroborated by observable market data.
|
|
Level 3
|
Valuations based on models where significant inputs are not observable. Unobservable inputs are used when little or no market data is available and reflect the Company’s own assumptions about the assumptions market participants would use.
|
Assets measured at fair value on a recurring basis as of
December 31, 2012
and
2011
is summarized in the following tables.
|
Dollar amounts in millions
|
December 31,
2012
|
Quoted Prices in
Active Markets
for Identical
Assets
(Level 1)
|
Significant
Other Observable
Inputs
(Level 2)
|
Significant
Unobservable
Inputs
(Level 3)
|
|||||||||||
|
Available for sale securities
|
$
|
2.0
|
|
$
|
—
|
|
$
|
—
|
|
$
|
2.0
|
|
|||
|
Trading securities
|
1.7
|
|
1.7
|
|
—
|
|
—
|
|
|||||||
|
Total
|
$
|
3.7
|
|
$
|
1.7
|
|
$
|
—
|
|
$
|
2.0
|
|
|||
59
|
Dollar amounts in millions
|
December 31,
2011
|
Quoted Prices in
Active Markets
for Identical
Assets
(Level 1)
|
Significant
Other Observable
Inputs
(Level 2)
|
Significant
Unobservable
Inputs
(Level 3)
|
|||||||||||
|
Available for sale securities
|
$
|
0.7
|
|
$
|
—
|
|
$
|
—
|
|
$
|
0.7
|
|
|||
|
Trading securities
|
2.7
|
|
2.7
|
|
—
|
|
—
|
|
|||||||
|
Total
|
$
|
3.4
|
|
$
|
2.7
|
|
$
|
—
|
|
$
|
0.7
|
|
|||
Due to the lack of observable market quotations on a portion of LP’s auction rate securities (ARS) portfolio, LP evaluates the structure of its ARS holdings and current market estimates of fair value, including fair value estimates from issuing banks that rely exclusively on Level 3 inputs. These inputs include those that are based on expected cash flow streams and collateral values, including assessments of counterparty credit quality, default risk underlying the security, discount rates and overall capital market liquidity. The valuation of LP’s ARS investment portfolio is subject to uncertainties that are difficult to predict. Factors that may impact LP’s valuation include changes to credit ratings of the securities as well as to the underlying assets supporting those securities, rates of default of the underlying assets, underlying collateral value, discount rates, counterparty risk and ongoing strength and quality of market credit and liquidity.
Trading securities consist of rabbi trust financial assets which are recorded in other assets in LP’s consolidated balance sheets. The rabbi trust holds assets attributable to the elections of certain management employees to defer the receipt of a portion of their compensation. The assets of the rabbi trust are invested in mutual funds and are reported at fair value based on active market quotations, which represent Level 1 inputs.
The following table summarizes assets measured at fair value on a recurring basis using significant unobservable inputs (Level 3) during the periods ended
December 31, 2012
and
2011
.
|
Dollar amounts in millions
|
Available for
sale securities
|
||
|
Balance at December 31, 2010
|
$
|
11.6
|
|
|
Sale of ARS
|
(19.7
|
)
|
|
|
Total realized/unrealized gains (losses)
|
|||
|
Included in investment income
|
15.2
|
|
|
|
Included in other comprehensive income
|
(6.4
|
)
|
|
|
Balance at December 31, 2011
|
0.7
|
|
|
|
Sale of ARS
|
—
|
|
|
|
Total realized/unrealized gains (losses)
|
|||
|
Included in investment income
|
—
|
|
|
|
Included in other comprehensive income
|
1.3
|
|
|
|
Balance at December 31, 2012
|
$
|
2.0
|
|
|
The amount of total losses for the period included in net loss attributable to the fair value of changes in assets still held at December 31, 2011
|
$
|
—
|
|
|
The amount of total losses for the period included in net loss attributable to the fair value of changes in assets still held at December 31, 2012
|
$
|
—
|
|
Carrying amounts reported on the balance sheet for cash, cash equivalents, receivables and accounts payable approximate fair value due to the short-term maturity of these instruments.
LP reviews the carrying values of long-lived assets to be held and used, for the impairment wherever events or changes in circumstances indicate possible impairment. An impairment loss is recognized when a long-lived asset's carrying value is not recoverable (given assumptions on housing starts and growth rates) and exceeds estimated fair value.
60
During the year ended
December 31, 2012
, LP recognized an impairment charge of
$4.4 million
on an OSB mill in Quebec, Canada, held for sale based upon a change in the plan for their sale and to reduce their carrying value to the fair value which is estimated by the selling price less selling costs of
$15.0 million
. The valuation of these assets was determined using level two inputs under the market approach.
During the year ended
December 31, 2011
, LP determined that an impairment review was required of its LSL facility located in Houlton, Maine due to continued operating losses which were driven by the significant reductions in current and forecasted housing starts. As a result of this review, LP recognized a pre-tax, non-cash impairment charge of
$62.0 million
. The estimated fair value of long-lived assets was calculated based on the income approach using the discounted probability of weighted cash flows taking into account current expectations for asset utilization, housing starts and the remaining useful life of related assets. In addition, liquidation values were considered where appropriate, as well as indicated values from divestiture activities. These assets are included in LP's property, plant and equipment (long-lived assets) which are held and used.
During the year ended
December 31, 2011
, LP recorded an impairment charge of
$6.9 million
on various assets held for sale to reduce their carrying value to the estimated sales price less estimated selling costs. The valuation of these assets was determined based using level two inputs under the market approach. Also, LP recorded an impairment charge of
$4.9 million
on assets no longer used.
During the year ended
December 31, 2010
, LP recorded an impairment of
$0.9 million
to reduce the carrying value of assets held and used to their net realizable value. The valuation of these assets was determined using level two inputs under the market approach.
During the year ended
December 31, 2010
, LP recorded an other-than-temporary impairment charge of
$17.0 million
to reduce the carrying value of an equity method investment to the estimated sales price. This sales price was based upon LP’s decision (based upon decisions by its joint venture partner) to sell this investment. The estimated net sales price of this investment was below the then current book value and therefore impairment was required. The valuation of these assets was determined using level two inputs under the market approach. During the year end
December 31, 2011
, this sale process was not completed. The joint venture's financial results continued to deteriorate and it was required to complete an impairment analysis of its goodwill. As part of this analysis, LP determined that LP's current book value exceed the enterprise (fair value) of the investment by
$14.8 million
. The valuation of these assets was determined using level three inputs under the market approach. The enterprise value was calculated based on the income approach using the discounted cash flows taking into account current expectations for asset utilization, housing starts and the remaining useful life of related assets. In addition, liquidation values were considered where appropriate.
|
4.
|
RECEIVABLES
|
Receivables consist of the following:
|
|
December 31,
|
||||||
|
Dollar amounts in millions
|
2012
|
2011
|
|||||
|
Trade receivables
|
$
|
76.0
|
|
$
|
55.9
|
|
|
|
Interest receivables
|
0.8
|
|
1.2
|
|
|||
|
Other receivables
|
5.2
|
|
9.1
|
|
|||
|
Allowance for doubtful accounts
|
(1.1
|
)
|
(1.1
|
)
|
|||
|
$
|
80.9
|
|
$
|
65.1
|
|
||
Other receivables at
December 31, 2012
and
2011
primarily consist of short-term notes receivable, settlements, Canadian sales tax receivables and other items.
|
5.
|
INVENTORIES
|
Inventories consist of the following (work-in-process is not material):
61
|
|
December 31,
|
||||||
|
Dollar amounts in millions
|
2012
|
2011
|
|||||
|
Logs
|
$
|
37.6
|
|
$
|
26.5
|
|
|
|
Other raw materials
|
17.7
|
|
18.6
|
|
|||
|
Finished products
|
142.7
|
|
109.6
|
|
|||
|
Supplies
|
12.8
|
|
9.5
|
|
|||
|
LIFO reserve
|
(1.0
|
)
|
(0.6
|
)
|
|||
|
Total
|
$
|
209.8
|
|
$
|
163.6
|
|
|
During
2011
, liquidation of LIFO layers reduced cost of sales by $
0.1 million
.
|
6.
|
NOTES RECEIVABLE FROM ASSET SALES
|
Notes receivable from asset sales are related to transactions that occurred during 1997, 1998 and 2003. The 1997 and 1998 notes receivable provide collateral for LP’s limited recourse notes payable and the 2003 notes receivable provide collateral for LP’s non-recourse notes payable (see Note 12). LP monitors the collectability of these notes on a regular basis.
|
Dollar amounts in millions
|
Interest Rate
2012
|
December 31,
|
|||||||
|
2012
|
2011
|
||||||||
|
Notes receivable (unsecured), matured 2012, interest rates fixed
|
5.6
|
%
|
$
|
—
|
|
$
|
9.9
|
|
|
|
Notes receivable (secured), maturing 2013-2018, interest rates fixed
|
7.1 – 7.3%
|
|
113.6
|
|
113.6
|
|
|||
|
Notes receivable (secured), maturing 2018, interest rate variable
|
410.0
|
|
410.0
|
|
|||||
|
Total
|
523.6
|
|
533.5
|
|
|||||
|
Current portion
|
91.4
|
|
10.0
|
|
|||||
|
Long-term portion
|
$
|
432.2
|
|
$
|
523.5
|
|
|||
The weighted average interest rate for all notes receivable from asset sales at
December 31, 2012
and
2011
was approximately
2.0%
and
2.1%
. The notes mature as follows:
|
Dollar amounts in millions
|
|
||
|
Year ended December 31,
|
|||
|
2013
|
$
|
91.4
|
|
|
2014
|
—
|
|
|
|
2015
|
—
|
|
|
|
2016
|
—
|
|
|
|
2017
|
—
|
|
|
|
2018 and after
|
432.2
|
|
|
|
Total
|
$
|
523.6
|
|
LP estimates that the fair value of these notes at
December 31, 2012
and
2011
was approximately $
531.9 million
and $
543.3 million
.
62
|
7.
|
OTHER INTANGIBLE ASSETS
|
LP has recorded other intangible assets in its Consolidated Balance Sheets, as follows:
|
|
December 31,
|
||||||
|
Dollar amounts in millions
|
2012
|
2011
|
|||||
|
Timber licenses (recorded as part of Timber and Timberlands)
|
$
|
36.6
|
|
$
|
38.1
|
|
|
|
Customer relationships, net of amortization
|
0.5
|
|
1.3
|
|
|||
|
Other
|
0.1
|
|
0.1
|
|
|||
|
Total
|
$
|
37.2
|
|
$
|
39.5
|
|
|
Included in the balance of timber and timberlands are values allocated to Canadian forest licenses in the purchase price allocations for both Le Groupe Forex (Forex) and the assets of Evans Forest Products. The initial value of these licenses was
$77.6 million
. These licenses have a life of twenty to twenty-five years.
Customer relationships are amortized on a straight line basis over the estimated period of economic benefit, generally five years. Initial value of these relationships was deemed to be
$3.9 million
.
Amortization of the above intangible asset over the next five years is as follows:
|
Dollar amounts in millions
|
|
||
|
Year ended December 31,
|
|||
|
2013
|
$
|
1.4
|
|
|
2014
|
0.9
|
|
|
|
2015
|
1.6
|
|
|
|
2016
|
1.6
|
|
|
|
2017
|
1.6
|
|
|
|
8.
|
INVESTMENTS IN AND ADVANCES TO AFFILIATES
|
LP has investments in affiliates that are accounted for under the equity method based upon the specific terms of the agreement as well as advances to affiliates. The significant components of these investments and advances are as follows:
At
December 31, 2012
LP’s significant equity method investees, its approximate ownership interest and principal business activity in each investee were as follows:
|
Ownership %
|
|||
|
U.S. GreenFiber
|
50%
|
Established to manufacture and sell cellulose insulation products.
|
|
|
Abitibi—LP
|
50%
|
Established to construct and operate jointly owned I-Joist facilities in Quebec, Canada.
|
|
|
Canfor—LP
|
50%
|
Established to construct and operate a jointly owned OSB facility in British Columbia, Canada.
|
|
These investments do not meet the Regulation S-X significance test requiring the inclusion of the separate investee financial statements; however based upon the aggregation requirements under S-X, aggregated summarized financial information is required as follows:
63
|
|
Year ended December 31,
|
||||||||||
|
Dollar amounts in millions
|
2012
|
2011
|
2010
|
||||||||
|
Net sales
|
$
|
238.9
|
|
$
|
188.6
|
|
$
|
241.9
|
|
||
|
Net income (loss)
|
$
|
3.4
|
|
$
|
(53.7
|
)
|
$
|
(12.8
|
)
|
||
|
|
As of December 31,
|
|
|||||||||
|
Current assets
|
$
|
54.5
|
|
$
|
50.0
|
|
|||||
|
Long term assets
|
146.8
|
|
168.9
|
|
|||||||
|
Total assets
|
$
|
201.3
|
|
$
|
218.9
|
|
|||||
|
Total liabilities
|
$
|
41.4
|
|
$
|
41.4
|
|
|||||
|
Equity
|
159.9
|
|
177.5
|
|
|||||||
|
Total liabilities and equity
|
$
|
201.3
|
|
$
|
218.9
|
|
|||||
LP sells products and raw materials and purchases products for resale from the Abitibi-LP and Canfor-LP entities. LP eliminates profits on these sales and purchases, to the extent the inventory has not been sold through to third parties, on the basis of its 50% interest. For the years ended
December 31, 2012
,
2011
and
2010
, LP sold
$8.7 million
,
$6.0 million
and
$5.6 million
of products to Abitibi-LP and purchased
$37.9 million
,
$33.6 million
and
$39.6 million
of I-joists from Abitibi-LP. LP also purchased
$148.0 million
,
$92.9 million
and
$109.5 million
of OSB from Canfor-LP for the years ended
December 31, 2012
,
2011
and
2010
.
Included in LP’s Consolidated Balance Sheets at
December 31, 2012
and
2011
are
$1.4 million
and
$0.5 million
in accounts receivable and
$6.7 million
and
$2.3 million
in accounts payable due from and to these affiliates.
During the year ended
December 31, 2011
, LP was required to record an other than temporary impairment of its equity investment in U.S. Greenfiber as LP's current book value exceed the enterprise (fair) value of the investment by
$14.8 million
. See Note 3 included in this report for additional details.
|
9.
|
ACCOUNTS PAYABLE AND ACCRUED LIABILITIES
|
Accounts payable and accrued liabilities were as follows:
|
|
December 31,
|
||||||
|
Dollar amounts in millions
|
2012
|
2011
|
|||||
|
Accounts payable
|
$
|
71.1
|
|
$
|
58.6
|
|
|
|
Salaries and wages payable
|
32.9
|
|
21.9
|
|
|||
|
Taxes other than income taxes
|
5.0
|
|
4.4
|
|
|||
|
Current portion of warranty reserves
|
12.0
|
|
12.0
|
|
|||
|
Accrued interest
|
2.5
|
|
10.3
|
|
|||
|
Other accrued liabilities
|
16.0
|
|
15.0
|
|
|||
|
Income taxes payable
|
—
|
|
0.1
|
|
|||
|
Total Accounts payable and accrued liabilities
|
$
|
139.5
|
|
$
|
122.3
|
|
|
Other accrued liabilities at
December 31, 2012
and
2011
primarily consist of accrued rent, accrued rebates, timber liabilities, current portion of worker compensation liabilities and other items. Additionally, included in accounts payable is
$4.1 million
related to capital expenditures that had not yet been paid as of December 31, 2012.
64
|
10.
|
INCOME TAXES
|
Income (loss) from continuing operations before income taxes consists of the following:
|
|
Year ended December 31,
|
||||||||||
|
Dollar amounts in millions
|
2012
|
2011
|
2010
|
||||||||
|
Domestic
|
$
|
34.2
|
|
$
|
(149.4
|
)
|
$
|
(36.4
|
)
|
||
|
Foreign
|
5.5
|
|
(61.6
|
)
|
(17.9
|
)
|
|||||
|
Total
|
$
|
39.7
|
|
$
|
(211.0
|
)
|
$
|
(54.3
|
)
|
||
The following presents the components of LP’s income tax provision (benefit) from continuing operations.
|
|
Year ended December 31,
|
||||||||||
|
Dollar amounts in millions
|
2012
|
2011
|
2010
|
||||||||
|
Current tax provision (benefit):
|
|||||||||||
|
U.S. federal
|
$
|
13.2
|
|
$
|
(0.9
|
)
|
$
|
(1.1
|
)
|
||
|
State and local
|
0.6
|
|
(1.3
|
)
|
1.1
|
|
|||||
|
Foreign
|
0.9
|
|
(8.6
|
)
|
(13.4
|
)
|
|||||
|
Net current tax provision (benefit)
|
14.7
|
|
(10.8
|
)
|
(13.4
|
)
|
|||||
|
Deferred tax provision (benefit):
|
|||||||||||
|
U.S. federal
|
(7.3
|
)
|
(39.7
|
)
|
(6.7
|
)
|
|||||
|
State and local
|
—
|
|
(6.1
|
)
|
(3.6
|
)
|
|||||
|
Foreign
|
(0.3
|
)
|
(11.4
|
)
|
2.5
|
|
|||||
|
Net valuation allowance increase (decrease)
|
0.5
|
|
28.9
|
|
(0.9
|
)
|
|||||
|
Net deferred tax benefit
|
(7.1
|
)
|
(28.3
|
)
|
(8.7
|
)
|
|||||
|
Total income tax provision (benefit)
|
$
|
7.6
|
|
$
|
(39.1
|
)
|
$
|
(22.1
|
)
|
||
LP received income tax refunds during
2012
,
2011
and
2010
of
$1.9 million
,
$25.8 million
and
$51.4 million
and paid cash taxes of
$1.6 million
,
$0.8 million
and
$5.7 million
. Included in the Consolidated Balance Sheet at
December 31, 2012
and
2011
are income tax receivables of
$1.8 million
and
$3.5 million
.
The income tax effects of LP’s share of the income or loss of U.S. GreenFiber and Canfor-LP OSB Limited Partnership in
2012
,
2011
and
2010
are recorded in “Provision (benefit) for income taxes” on the Consolidated Statements of Income, while LP’s share of such pre-tax income is recorded in “Equity in (income) loss of unconsolidated affiliates”.
The tax effects of significant temporary differences creating deferred tax (assets) and liabilities at
December 31
were as follows:
65
|
|
December 31,
|
||||||
|
Dollar amounts in millions
|
2012
|
2011
|
|||||
|
Property, plant and equipment
|
$
|
148.5
|
|
$
|
160.9
|
|
|
|
Timber and timberlands
|
10.4
|
|
11.4
|
|
|||
|
Inventories
|
(6.9
|
)
|
(12.4
|
)
|
|||
|
Accrued liabilities
|
(78.9
|
)
|
(81.5
|
)
|
|||
|
Benefit of capital loss and NOL carryovers
|
(187.0
|
)
|
(171.7
|
)
|
|||
|
Benefit of federal & state tax credit carryovers
|
(13.2
|
)
|
(24.4
|
)
|
|||
|
Installment sale gain deferral
|
163.0
|
|
166.7
|
|
|||
|
Market value write down of ARS
|
(8.9
|
)
|
(8.9
|
)
|
|||
|
Other
|
(1.4
|
)
|
(4.2
|
)
|
|||
|
Valuation allowance
|
50.7
|
|
49.1
|
|
|||
|
Net deferred tax liabilities
|
$
|
76.3
|
|
$
|
85.0
|
|
|
|
Balance sheet classification
|
|||||||
|
Current deferred tax asset
|
$
|
(12.3
|
)
|
$
|
(17.0
|
)
|
|
|
Long-term deferred tax asset
|
(5.0
|
)
|
(4.0
|
)
|
|||
|
Long-term deferred tax liability
|
93.6
|
|
106.0
|
|
|||
|
$
|
76.3
|
|
$
|
85.0
|
|
||
The
$187 million
of benefit relating to capital loss and net operating loss (NOL) carryovers included in the above table at
December 31, 2012
consists of
$77.4 million
for federal NOL carryovers which will begin to expire in
2028
,
$32.8 million
(net of federal taxes) for state NOL carryovers and
$0.7 million
for state capital losses which will expire in various years 2013 through
2032
,
$63.6 million
for Canadian NOL carryovers which will expire starting in
2029
and
$12.5 million
for Canadian capital loss carryovers which may be carried forward indefinitely. At
December 31, 2012
, LP has recorded valuation allowances of
$15.4 million
related to state NOL carryover benefit;
$0.7 million
related to state capital loss carryover;
$20.7 million
related to Canadian NOL carryover;
$11.3 million
against the Canadian capital loss benefit;
$1.0 million
against the state tax credit carryovers and
$1.6 million
related to other items.
LP periodically reviews the need for valuation allowances against deferred tax assets and recognizes these deferred tax assets to the extent that the realization is more likely than not. Based upon review of earnings history and trends, tax planning strategies already implemented, reversal of deferred tax liabilities and the relevant expiration of carry forwards, LP believes that the valuation allowances provided are appropriate. If future years’ earnings differs from the estimates used to establish these valuation allowances, LP may be required to record an adjustment resulting in an impact on tax expense for that period.
As a result of certain realization requirements of ASC 718
Compensation --
Stock Compensation,
the table of deferred tax assets and liabilities shown above does not include certain deferred tax assets as of December 31, 2012 that arose directly from tax deductions related to amounts of equity compensation that are greater than the compensation recognized for financial reporting. Equity will be increased by
$3.7 million
if and when such deferred tax assets are ultimately realized. LP uses tax law ordering when determining when excess tax benefits have been realized. For
2011
and
2010
, a current tax cost of
$0.6 million
and
$0.4 million
was recognized as a reduction of additional paid in capital arising from tax deductions related to amounts of equity compensation that were less than the compensation recognized for financial reporting.
U.S. taxes have not been provided on approximately
$45.6 million
of undistributed earnings of LP’s foreign subsidiaries, which under existing law are not subject to U.S. tax until distributed as dividends. These earnings have been, and are intended to be, indefinitely reinvested in LP’s foreign operations. Determination of the amount of any unrecognized income tax liability on this temporary difference is not practical because of the complexities of the
66
hypothetical calculation. Furthermore, any taxes paid to the foreign governments on these earnings may be used, in whole or in part, as credits against the U.S. tax on any dividends distributed from such earnings.
The following table summarizes the differences between the statutory U.S. federal and effective income tax rates on continuing operations:
|
|
Year ended December 31,
|
|||||||
|
|
2012
|
2011
|
2010
|
|||||
|
U.S. Federal tax rate
|
35
|
%
|
(35
|
)%
|
(35
|
)%
|
||
|
State and local income taxes
|
2
|
|
(3
|
)
|
(6
|
)
|
||
|
Effect of non-deductible goodwill impairments
|
—
|
|
—
|
|
9
|
|
||
|
Adjustments to previously recorded deferred tax liabilities
|
(12
|
)
|
—
|
|
—
|
|
||
|
Uncertain tax positions
|
(1
|
)
|
5
|
|
—
|
|
||
|
Effect of foreign tax rates / foreign exchange
|
(3
|
)
|
—
|
|
(11
|
)
|
||
|
Valuation allowance
|
1
|
|
13
|
|
(1
|
)
|
||
|
Other, net
|
(3
|
)
|
1
|
|
4
|
|
||
|
Effective tax rate (%)
|
19
|
%
|
(19
|
)%
|
(40
|
)%
|
||
LP and its domestic subsidiaries are subject to U.S. federal income tax as well as income taxes of multiple state jurisdictions. Its foreign subsidiaries are subject to income tax in Canada, Chile, Peru and Brazil. During 2011, the U.S. Internal Revenue Service initiated an audit of tax years 2007 through 2009 for which field work has been completed. LP has protested certain proposed adjustments and requested review by the IRS Appeals Office. All U.S. federal audits of prior years have been completed. LP settled various state income tax audits during 2012 and is subject to various state and local income tax examinations for the tax years 2007 through 2011. Canadian federal income tax returns have been audited and effectively settled through 2004 and no examinations are currently in progress. Quebec provincial audits have been effectively settled through 2011. During 2012, LP settled the audit of tax years 2008 through 2010 with the Chilean Tax Office and an audit of tax year 2011 was initiated.
In accordance with the accounting for uncertain tax positions, the following is a tabular reconciliation of the total amount of unrecognized tax benefits at the beginning and end of the years presented:
|
|
December 31,
|
||||||||||
|
Dollar amounts in millions
|
2012
|
2011
|
2010
|
||||||||
|
Beginning balance
|
$
|
23.5
|
|
$
|
11.3
|
|
$
|
13.0
|
|
||
|
Increases:
|
|||||||||||
|
Tax positions taken in current year
|
0.1
|
|
—
|
|
—
|
|
|||||
|
Tax positions taken in prior years
|
33.9
|
|
12.9
|
|
0.7
|
|
|||||
|
Decreases:
|
|||||||||||
|
Tax positions taken in current year
|
—
|
|
(0.3
|
)
|
(0.7
|
)
|
|||||
|
Tax positions taken in prior years
|
(7.4
|
)
|
(0.2
|
)
|
—
|
|
|||||
|
Settlements during the year
|
(0.2
|
)
|
(0.2
|
)
|
(1.7
|
)
|
|||||
|
Ending balance
|
$
|
49.9
|
|
$
|
23.5
|
|
$
|
11.3
|
|
||
Included in the above balances at
December 31, 2012
and
2011
is
$11.9 million
and
$12.4 million
of tax benefits that, if recognized, would affect LP’s effective tax rate. LP accrued interest of
$1.8 million
and
$1.2 million
during
2012
and
2011
, and in total LP has recognized a liability of
$5.5 million
and
$3.7 million
for accrued interest related to its uncertain tax positions as of
December 31, 2012
and
2011
. At this point, it is not possible to reasonably estimate whether the unrecognized tax benefit will change significantly within the next twelve months.
67
|
11.
|
NON-OPERATING INCOME (EXPENSE)
|
Included in LP’s Consolidated Statements of Income is a non-operating expense of
$69.4 million
,
$44.0 million
and
$40.3 million
for the years ended
December 31, 2012
,
2011
and
2010
. This expense is comprised of the following components:
|
|
Year ended December 31,
|
||||||||||
|
Dollar amounts in millions
|
2012
|
2011
|
2010
|
||||||||
|
Interest expense
|
$
|
(48.0
|
)
|
$
|
(54.4
|
)
|
$
|
(60.8
|
)
|
||
|
Amortization of debt charges
|
(1.5
|
)
|
(2.6
|
)
|
(3.1
|
)
|
|||||
|
Capitalized interest
|
0.2
|
|
0.1
|
|
—
|
|
|||||
|
Interest expense, net of capitalized interest
|
(49.3
|
)
|
(56.9
|
)
|
(63.9
|
)
|
|||||
|
Investment income
|
13.0
|
|
13.3
|
|
18.0
|
|
|||||
|
Realized gains from the sales of investments
|
—
|
|
15.2
|
|
19.0
|
|
|||||
|
SERP market adjustments
|
1.8
|
|
0.2
|
|
1.4
|
|
|||||
|
Investment income
|
14.8
|
|
28.7
|
|
38.4
|
|
|||||
|
Other than temporary impairment
|
—
|
|
(14.8
|
)
|
(17.0
|
)
|
|||||
|
Foreign currency gains (losses)
|
(2.7
|
)
|
(1.0
|
)
|
2.2
|
|
|||||
|
Gain on settlement of litigation related to ARS
|
20.0
|
|
—
|
|
—
|
|
|||||
|
Early debt extinguishment
|
(52.2
|
)
|
—
|
|
—
|
|
|||||
|
Other non-operating expense
|
(34.9
|
)
|
(1.0
|
)
|
2.2
|
|
|||||
|
Total non-operating expense
|
$
|
(69.4
|
)
|
$
|
(44.0
|
)
|
$
|
(40.3
|
)
|
||
For the year ended
December 31, 2012
, LP recognized a gain of
$20.0 million
from the settlement of its ARS litigation with Deutsche Bank Securities, Inc.
For the year ended
December 31, 2011
, LP recorded an impairment charge of
$14.8 million
associated with an equity investment in a joint venture to reduce the carrying value of this investment to it estimated fair value. See Note 3 for further discussion of this impairment and Note 8 for discussion of the investment.
For the year ended
December 31, 2010
, LP recorded an impairment charge of
$17.0 million
associated with the anticipated sale of an equity investment in a joint venture to reduce the carrying value of this investment to it estimated fair value. See Note 3 for further discussion of this impairment and Note 8 for discussion of the investment.
68
|
12.
|
|
|
|
Interest
Rate 2012
|
December 31,
|
||||||||
|
Dollar amounts in millions
|
2012
|
2011
|
||||||||
|
Debentures:
|
||||||||||
|
Senior secured notes, maturing 2017, interest rates fixed
|
13
|
%
|
$
|
—
|
|
$
|
189.6
|
|
||
|
Senior secured notes, maturing 2020, interest rates fixed
|
7.5
|
%
|
350.0
|
|
—
|
|
||||
|
Bank credit facilities:
|
||||||||||
|
Chilean term credit facility, maturing 2019, interest rates fixed
|
UF+3.9%
|
|
39.3
|
|
40.5
|
|
||||
|
Brazilian export financing facility, maturing 2017, interest rates fixed
|
6.65
|
%
|
10.0
|
|
10.0
|
|
||||
|
Limited recourse notes payable:
|
||||||||||
|
Senior notes, payable 2012, interest rates fixed
|
7.1
|
%
|
—
|
|
7.9
|
|
||||
|
Senior notes, payable 2013-2018, interest rates fixed
|
7.1 – 7.3%
|
|
112.0
|
|
112.0
|
|
||||
|
Other financing:
|
||||||||||
|
Non-recourse notes payable 2018, interest rates variable
|
0.2
|
%
|
368.7
|
|
368.7
|
|
||||
|
Other
|
0.5
|
|
0.4
|
|
||||||
|
Total
|
880.5
|
|
729.1
|
|
||||||
|
Less: current portion
|
(97.8
|
)
|
(13.2
|
)
|
||||||
|
Net long-term portion
|
$
|
782.7
|
|
$
|
715.9
|
|
||||
LP believes the carrying amounts of its variable rate long-term debt approximates fair market value. LP estimated the limited recourse notes payable to have a fair value of approximately
$114 million
and
$122 million
at
December 31, 2012
and
2011
. LP estimated the senior secured notes maturing in 2020 to have a fair value of
$397 million
at
December 31, 2012
based upon market quotations. LP believes the carrying amounts of the Chilean term credit facility as well as the Brazil export facility approximates fair market value based upon current interest rates with similar remaining maturities.
In 1997, LP issued
$47.9 million
of senior notes in a private placement to institutional investors. The remaining
$7.9 million
of notes matured in 2012. They were secured by the final
$9.9 million
of notes receivable from Sierra Pacific Industries. Both the notes payable and notes receivable were paid in full at maturity.
LP issued
$348.6 million
of senior notes in June 1998 in a private placement to institutional investors. The remaining
$112.0 million
of notes mature in principal amounts of
$90.0 million
in 2013 and
$22.0 million
in 2018. The notes are secured by
$113.7 million
of notes receivable from Green Diamond Resource Company (Green Diamond). Pursuant to the terms of the notes payable, in the event of a default by Green Diamond, LP would be liable to pay only
10%
of the indebtedness represented by the notes payable.
LP issued
$368.7 million
of senior notes in 2003 in a private placement to unrelated third parties. The notes mature in 2018. The notes are supported by a bank letter of credit. LP’s reimbursement obligations under the letter of credit are secured by
$410.0 million
in notes receivable from assets sales. In general, the creditors under this arrangement have no recourse to LP’s assets, other than the notes receivable. However, under certain circumstances, LP may be liable for certain liabilities (including liabilities associated with the marketing or remarketing of the notes payable and reimbursement obligations, which are fully cash collateralized, under the letter of credit supporting the notes payable) in an amount not to exceed
10%
of the aggregate principle amount of the notes receivable.
LP has a credit facility which provides for a committed asset-based borrowing capacity of up to
$100 million
, with a
$60 million
sublimit for U.S. letters of credit and a
$10 million
sublimit for Canadian letters of credit. In October 2011, LP entered into an amendment to its credit facility which (1) extends the maturity from September 10, 2012 to October 14, 2016, (2) decreases the interest rate payable for certain types of loans, (3) permits LP to include in its borrowing base certain inventory that was previously excluded, (4) increases LP's flexibility to incur and
69
prepay certain debt and (5) provides that the credit facility lenders' second priority liens on certain assets of LP and its subsidiaries that secure certain indebtedness of LP and its subsidiaries to other parties on a first priority basis will be automatically released in connection with the repayment of such other indebtedness.
The availability of credit under the credit facility is subject to a borrowing base, which is calculated based on certain percentages of accounts receivable and inventory and at any given time may limit the amount of borrowings and letters of credit otherwise available under the facility. In addition, the credit facility contains a covenant requiring us to maintain a fixed charge coverage ratio of at least
1.1
to
1.0
at any time that our unused borrowing base capacity after adjustment to exclude certain past due trade payables falls below
$15 million
. At
December 31, 2012
, LP had
$91.0 million
of unused borrowing base capacity under the credit facility. The credit facility allows LP to pledge, as security for its reimbursement obligations in respect of letters of credit issued under the facility, cash collateral in an amount not less than
105%
of the of the stated amount of such letters of credit. The above-described preclusion to LP’s utilization of
$15 million
of the capacity otherwise available under the facility does not apply to such cash collateralized letters of credit. At
December 31, 2012
, LP had no borrowings outstanding under the facility. Outstanding under this facility at
December 31, 2012
, were
$9.0 million
in letters of credit which were collateralized by
$10.0 million
of cash. Based upon LP’s available cash balances, LP does not currently anticipate using this facility except to obtain and maintain letters of credit.
The credit facility contains customary covenants applicable to LP and its subsidiaries, other than certain unrestricted subsidiaries, including certain financial covenants as well as restrictions on, among other things, our ability to: incur debt; incur liens; declare or make distributions to our stockholders; make loans and investments; repay debt; enter into mergers, acquisitions and other business combinations; form or acquire subsidiaries; amend or modify our governing documents; enter into hedging arrangements; engage in other businesses other than our business as currently conducted; and enter into transactions with affiliates. The credit facility also contains customary events of default, the occurrence of which could result in the acceleration of our obligation to repay the indebtedness outstanding.
Obligations under the indenture governing our Senior Notes due 2020 are unsecured and not presently guaranteed by any of our subsidiaries. The indenture contains customary covenants applicable to us and our subsidiaries, other than certain unrestricted subsidiaries, including restrictions on actions and activities that are restricted under the credit facility. The indenture also contains customary events of default, the occurrence of which could result in acceleration of our obligations to repay the indebtedness outstanding thereunder.
In December 2009, LP Chile entered into a term loan agreement with Banco de Credito e Inversiones for UF
943,543.7391
(equivalent to
$39 million
at the time of inception). The loan will be repaid in
16
semi-annual principal payments that began in June 2012 and end in December 2019. The loan bears interest at UF plus
3.90%
per annum, and is partially secured by a first priority security interest in substantially all of the real property owned by LP Chile. The loan contains various restrictive covenants and requires the maintenance by LP Chile of a debt to equity ratio of less than or equal to
1
. If LP Chile is late in making payments, it will also be required to maintain a ratio of net debt to earnings before interest, taxes, depreciation and amortization (EBITDA) of less than or equal to
2.5
and a ratio of EBITDA to financial costs of at least
3
. The loan agreement also contains customary events of default, the occurrence of which could result in acceleration of LP’s obligations to repay the indebtedness outstanding. Any increases or decreases in the loan balance shown are related to the change in the underlying foreign currency exchange rates, the UF or principal payments. LP made principal payments of
$5.5 million
during 2012 which was offset by a UF change of
$1.0 million
plus the impact of foreign currency exchange rates of
$3.2 million
.
In August 2011, LP entered into an export financing loan agreement with a Brazilian bank. This loan is to be repaid in
10
equal semi-annual payments beginning in January 2013 and ending July 2017.
In May 2012, LP issued
$350.0 million
of
7.5%
Senior Notes due 2020. LP used a portion of the proceeds to fully retire the remaining balance outstanding on the Senior Secured Notes due in 2017. In connection with this repurchase, LP recorded a loss on early debt extinguishment of
$52.2 million
which included
$4.5 million
associated with the unamortized financing costs associated with the Senior Secured Notes. On or after June 1, 2016, LP may, at its option on one or more occasions, redeem all or any portion of the Notes at specified redemption rates.
70
Obligations under the indenture governing LP's Senior Notes due 2020 are unsecured and not presently guaranteed by any of its subsidiaries. The indenture contains customary covenants applicable to LP and its subsidiaries, other than certain unrestricted subsidiaries, including restrictions on actions and activities that are restricted under the credit facility. The indenture also contains customary events of default, the occurrence of which could result in acceleration of LP's obligations to repay the indebtedness outstanding thereunder.
The weighted average interest rate for all long-term debt at
December 31, 2012
and
2011
was approximately
4.2
percent and
5.5
percent. Required repayment of principal for long-term debt is as follows:
|
Dollar amounts in millions
|
|
||
|
Year ended December 31,
|
|||
|
2013
|
$
|
97.8
|
|
|
2014
|
7.6
|
|
|
|
2015
|
7.6
|
|
|
|
2016
|
7.6
|
|
|
|
2017
|
7.6
|
|
|
|
2018 and after
|
752.3
|
|
|
|
Total
|
$
|
880.5
|
|
Cash paid during
2012
,
2011
and
2010
for interest (net of capitalized interest) was
$50.1 million
,
$56.6 million
and
$57.0 million
.
|
13.
|
RETIREMENT PLANS AND POSTRETIREMENT BENEFITS
|
LP sponsors various defined benefit and defined contribution retirement plans that provide retirement benefits to substantially all of its employees. Most regularly scheduled employees are eligible to participate in these plans except those covered by a collective bargaining agreement, unless the collective bargaining agreement specifically allows for participation in LP’s plans. LP contributes to a multiemployer plan for certain employees covered by collective bargaining agreements. LP also provides other post retirement benefits consisting primarily of healthcare benefits to certain retirees who meet age and service requirements.
Defined Benefit Plans
Pension benefits are earned generally based upon years of service and compensation during active employment. Contributions to the qualified defined benefit pension plans are based on actuarial calculations of amounts to cover current service costs and amortization of prior service costs over periods ranging up to
20 years
. LP contributes additional funds as necessary to maintain desired funding levels.
Benefit accruals under our most significant plans, which account for approximately
80%
of the assets and
82%
of the benefit obligations in the tables below, had been credited at the rate of
4%
of eligible compensation with an interest credit based upon the 30-year U.S. Treasury rate. The Company discontinued providing contribution credits effective January 1, 2010 to these plans. The remaining defined benefit pension plans (primarily in Canada) use a variety of benefit formulas.
LP also maintains a Supplemental Executive Retirement Plan (SERP), an unfunded, non-qualified defined benefit plan intended to provide supplemental retirement benefits to key executives. Benefits are generally based on compensation in the years immediately preceding normal retirement. LP has established a grantor trust that provides funds for the benefits payable under the SERP. The assets of the grantor trust are invested in corporate-owned life insurance policies. At
December 31, 2012
and
2011
, the trust assets were valued at
$8.8 million
and
$16.7 million
and are included in “Other assets” on the Consolidated Balance Sheets. LP did not contribute to this trust in 2012 or 2011. During the year ended
December 31, 2012
, LP paid its retiring CEO his accumulated SERP liability of
$10.4 million
through the use of the assets included in the grantor trust. In connection with this distribution, LP recorded a plan settlement charge of
$2.2 million
.
71
The components of LP’s net periodic pension costs and the assumptions related to those costs consisted of the following:
|
|
Year ended December 31,
|
||||||||||
|
Dollar amounts in millions
|
2012
|
2011
|
2010
|
||||||||
|
Service cost
|
$
|
3.7
|
|
$
|
2.9
|
|
$
|
2.8
|
|
||
|
Interest cost
|
14.6
|
|
15.9
|
|
16.5
|
|
|||||
|
Expected return on plan assets
|
(16.8
|
)
|
(18.2
|
)
|
(18.2
|
)
|
|||||
|
Amortization of prior service cost and net transition asset
|
0.3
|
|
0.3
|
|
0.3
|
|
|||||
|
Amortization of net actuarial loss
|
6.6
|
|
4.6
|
|
2.7
|
|
|||||
|
Net periodic pension cost
|
$
|
8.4
|
|
$
|
5.5
|
|
$
|
4.1
|
|
||
|
Loss (gain) due to settlement
|
$
|
2.2
|
|
$
|
—
|
|
$
|
0.2
|
|
||
|
Discount rate
|
4.41
|
%
|
5.12
|
%
|
5.95
|
%
|
|||||
|
Rate of compensation increase
|
0.7
|
%
|
0.6
|
%
|
0.6
|
%
|
|||||
|
Expected return on plan assets
|
6.87
|
%
|
7.04
|
%
|
7.17
|
%
|
|||||
Other changes in plan assets and benefit obligations recognized in other comprehensive income:
|
|
Year ended December 31,
|
||||||||||
|
Dollar amounts in millions
|
2012
|
2011
|
2010
|
||||||||
|
Net actuarial (gain) loss
|
$
|
11.3
|
|
$
|
43.2
|
|
$
|
13.1
|
|
||
|
Amortization of net actuarial loss
|
(6.6
|
)
|
(4.6
|
)
|
(2.7
|
)
|
|||||
|
Amortization of prior service cost
|
(0.3
|
)
|
(0.3
|
)
|
(0.4
|
)
|
|||||
|
Settlement
|
(2.2
|
)
|
—
|
|
—
|
|
|||||
|
Foreign exchange rate changes
|
—
|
|
(0.1
|
)
|
0.2
|
|
|||||
|
Total recognized in OCI
|
$
|
2.2
|
|
$
|
38.2
|
|
$
|
10.2
|
|
||
LP calculates the net periodic pension cost for a given fiscal year based upon assumptions developed at the end of the previous fiscal year. LP made the decision in the fourth quarter of 2008 to freeze future contribution credits as of January 1, 2010 to its qualified U.S. defined benefit pension plans. The decrease in net periodic pension cost from 2009 to 2010 was attributable to the decrease in service cost and a decrease in the amount of net actuarial loss amortized due to the lengthening of the amortization period based upon the frozen U.S. plans. LP recognized settlement charges of
$2.2 million
related to the LP SERP pension plan associated with the retirement of LP's previous CEO.
The expected long-term rate of return on plan assets reflects the weighted-average expected long-term rates of return for the broad categories of investments currently held in the plans (adjusted for expected changes), based on historical rates of return for each broad category, as well as factors that may constrain or enhance returns in the broad categories in the future. The expected long-term rate of return on plan assets is adjusted when there are fundamental changes in expected returns in one or more broad asset categories and when the weighted-average mix of assets in the plans changes significantly.
The projected benefit obligation is the actuarial present value of benefits attributable to employee service rendered to date, including the effects of estimated salary increases. The benefit plan obligation, funded status and the assumptions related to the obligations as of the measurement date for each year presented as of December 31 follow:
72
|
|
December 31,
|
||||||
|
Dollar amounts in millions
|
2012
|
2011
|
|||||
|
Change in benefit obligation:
|
|||||||
|
Beginning of year balance
|
$
|
339.3
|
|
$
|
316.2
|
|
|
|
Service cost
|
3.7
|
|
2.9
|
|
|||
|
Interest cost
|
14.6
|
|
15.9
|
|
|||
|
Actuarial (gain)/loss
|
23.1
|
|
23.4
|
|
|||
|
Curtailments/settlements
|
(2.2
|
)
|
—
|
|
|||
|
Foreign exchange rate changes
|
1.3
|
|
(1.5
|
)
|
|||
|
Benefits paid
|
(27.8
|
)
|
(17.6
|
)
|
|||
|
End of year balance
|
$
|
352.0
|
|
$
|
339.3
|
|
|
|
Change in assets (fair value):
|
|||||||
|
Beginning of year balance
|
$
|
247.1
|
|
$
|
255.2
|
|
|
|
Actual return on plan assets
|
26.4
|
|
(1.7
|
)
|
|||
|
Employer contribution
|
12.6
|
|
11.9
|
|
|||
|
Foreign exchange rate changes
|
1.0
|
|
(0.7
|
)
|
|||
|
Benefits paid
|
(27.8
|
)
|
(17.6
|
)
|
|||
|
End of year balance
|
$
|
259.3
|
|
$
|
247.1
|
|
|
|
Funded status
|
$
|
(92.7
|
)
|
$
|
(92.2
|
)
|
|
|
Weighted average assumptions for obligations as of measurement date
|
|||||||
|
Discount rate for obligations
|
3.78
|
%
|
4.41
|
%
|
|||
|
Rate of compensation increase
|
0.64
|
%
|
0.61
|
%
|
|||
The table above reflects contribution for the year ended December 31, 2012 which include the
$10.4 million
of assets used from the guarantor fund in payment of the SERP liability related to the retirement of LP's former CEO as noted above.
The amounts recognized in LP’s Consolidated Balance Sheets as of December 31 consist of the following:
|
Dollar amounts in millions
|
2012
|
2011
|
|||||
|
Noncurrent pension assets, included in “Other assets”
|
$
|
0.4
|
|
$
|
1.0
|
|
|
|
Current pension liabilities, included in “Accounts payable and accrued liabilities”
|
(0.2
|
)
|
(0.2
|
)
|
|||
|
Noncurrent pension liabilities, included in “Other long-term liabilities”
|
(92.9
|
)
|
(93.0
|
)
|
|||
|
Total
|
$
|
(92.7
|
)
|
$
|
(92.2
|
)
|
|
|
Amounts recognized in other comprehensive income—pre-tax
|
|||||||
|
Net actuarial loss
|
$
|
156.0
|
|
$
|
153.2
|
|
|
|
Prior service cost
|
0.4
|
|
0.7
|
|
|||
|
Total
|
$
|
156.4
|
|
$
|
153.9
|
|
|
The total accumulated benefit obligation for all pension plans as of
December 31, 2012
and
2011
was
$346.0 million
and
$334.0 million
.
The accumulated benefit obligation and fair value of plan assets for pension plans with accumulated benefit obligations in excess of plan assets were
$331.7 million
and
$244.6 million
at
December 31, 2012
and
$320.8 million
and
$232.9 million
at
December 31, 2011
. The projected benefit obligations and fair value of plan assets of
73
plans with projected benefit obligations in excess of plan assets were
$337.7 million
and
$244.6 million
at
December 31, 2012
and
$326.1 million
and
$232.9 million
at
December 31, 2011
.
The amounts of accumulated other comprehensive income that is expected to be amortized as expense during 2013 is:
|
Dollar amounts in millions
|
|
||
|
Net actuarial loss
|
$
|
7.2
|
|
|
Prior service cost
|
0.3
|
|
|
|
Total
|
$
|
7.5
|
|
LP expects to contribute approximately
$1.9 million
to its pension plans in 2013.
The benefits expected to be paid from the benefit plans, which reflect expected future service, are as follows:
|
Dollar amounts in millions
|
|
||
|
Year
|
|||
|
2013
|
$
|
18.1
|
|
|
2014
|
25.5
|
|
|
|
2015
|
20.0
|
|
|
|
2016
|
20.5
|
|
|
|
2017
|
23.6
|
|
|
|
2018 – 2022
|
112.5
|
|
|
These estimated benefit payments are based upon assumptions about future events. Actual benefit payments may vary significantly from these estimates.
Asset allocation targets are established based upon the long-term returns and volatility characteristics of the investment classes and recognize the benefits of diversification and the profits of the plans’ liabilities. The actual and target allocations at the measurement dates are as follows:
|
Target
Allocation
2012
|
Actual
Allocation
|
|||||||
|
2012
|
2011
|
|||||||
|
Asset category
|
||||||||
|
Equity securities
|
36.8
|
%
|
36.4
|
%
|
50.6
|
%
|
||
|
Debt securities
|
37.3
|
|
37.8
|
|
23.6
|
|
||
|
Real estate
|
8.0
|
|
5.8
|
|
5.9
|
|
||
|
Other, including cash and cash equivalents
|
17.9
|
|
20.0
|
|
19.9
|
|
||
|
Total
|
100.0
|
%
|
100.0
|
%
|
100.0
|
%
|
||
LP’s investment policies for the defined benefit pension plans provide target asset allocations by broad categories of investment and ranges of acceptable allocations. These policies are set by an administrative committee with the goal of maximizing long-term investment returns within acceptable levels of volatility and risk. LP’s U.S. plans include real estate, hedge funds and real return investment strategies to increase returns and reduce volatility. LP’s plans do not currently invest directly in derivative securities, although such investments may be considered in the future to increase returns and/or reduce volatility. To the extent the expected return on plan assets varies from the actual return, an actuarial gain or loss results.
74
The fair value of LP’s pension plan assets at
December 31, 2012
and
December 31, 2011
, fair value asset categories and the level of inputs as defined in Note 3 are as follows:
|
Dollar amounts in millions
Asset Category
|
December 31, 2012
|
Quoted Prices
in Active
Markets for
Identical
Assets
(Level 1)
|
Significant
Observable
Inputs
(Level 2)
|
Significant
Unobservable
Inputs
(Level 3)
|
|||||||||||
|
Equity investment funds:
(a)
|
|||||||||||||||
|
Domestic stock funds
|
$
|
54.6
|
|
$
|
25.0
|
|
$
|
29.6
|
|
$
|
—
|
|
|||
|
International stock funds
|
39.6
|
|
12.1
|
|
27.5
|
|
—
|
|
|||||||
|
Fixed income investment funds:
(b)
|
|||||||||||||||
|
Domestic bond funds
|
52.2
|
|
52.2
|
|
—
|
|
—
|
|
|||||||
|
International bond funds
|
34.0
|
|
—
|
|
34.0
|
|
—
|
|
|||||||
|
Diversified real asset funds
|
11.8
|
|
11.8
|
|
—
|
|
—
|
|
|||||||
|
Real estate funds
(c)
|
15.2
|
|
—
|
|
—
|
|
15.2
|
|
|||||||
|
Multi-strategy funds
(d)
|
49.5
|
|
—
|
|
—
|
|
49.5
|
|
|||||||
|
Cash & cash equivalents
|
2.4
|
|
—
|
|
2.4
|
|
—
|
|
|||||||
|
Total
|
$
|
259.3
|
|
$
|
101.1
|
|
$
|
93.5
|
|
$
|
64.7
|
|
|||
|
Dollar amounts in millions
Asset Category
|
December 31, 2011
|
Quoted Prices
in Active
Markets for
Identical
Assets
(Level 1)
|
Significant
Observable
Inputs
(Level 2)
|
Significant
Unobservable
Inputs
(Level 3)
|
|||||||||||
|
Equity investment funds:
(a)
|
|||||||||||||||
|
Domestic stock funds
|
$
|
78.4
|
|
$
|
47.0
|
|
$
|
31.4
|
|
$
|
—
|
|
|||
|
International stock funds
|
46.4
|
|
23.2
|
|
23.2
|
|
—
|
|
|||||||
|
Fixed income investment funds:
(b)
|
|
|
|||||||||||||
|
Domestic bond funds
|
26.5
|
|
26.5
|
|
—
|
|
—
|
|
|||||||
|
International bond funds
|
31.6
|
|
|
|
31.6
|
|
—
|
|
|||||||
|
Real estate funds
(c)
|
14.5
|
|
—
|
|
—
|
|
14.5
|
|
|||||||
|
Multi-strategy funds
(d)
|
46.4
|
|
—
|
|
—
|
|
46.4
|
|
|||||||
|
Cash & cash equivalents
|
3.3
|
|
0.3
|
|
3.0
|
|
—
|
|
|||||||
|
Total
|
$
|
247.1
|
|
$
|
97.0
|
|
$
|
89.2
|
|
$
|
60.9
|
|
|||
|
(a)
|
Equity investments include investments in funds that are primarily invested in large capitalization U.S. and international equity securities and a mutual fund.
|
|
(b)
|
Fixed income investments include investments in funds that are primarily invested in a diversified portfolio of investment grade U.S. and international debt securities.
|
|
(c)
|
Real estate investments are primarily invested in U.S. commercial real estate.
|
|
(d)
|
The multi-strategy funds invest in various hedge funds of fund strategies.
|
Level 1 investments are valued based on active market quotations.
Level 2 investments are valued based on the unit prices quoted by the funds, representing the fair value of underlying investments.
75
Due to the lack of observable market quotations on real estate and multi-strategy funds, LP evaluates their structure and current market estimates of fair value, including fair value estimates from the funds that rely exclusively on Level 3 inputs. These inputs include those that are based on expected cash flow streams and property values, including assessments of overall market liquidity. The valuations are subject to uncertainties that are difficult to predict.
The following table summarizes assets measured at fair value on a recurring basis using significant unobservable inputs (Level 3) during the period.
|
Dollar amounts in millions
|
Multi-Strategy
Funds
|
Real Estate
|
Total
|
||||||||
|
Balance at January 1, 2011
|
$
|
45.4
|
|
$
|
13.9
|
|
$
|
59.3
|
|
||
|
Total unrealized gains (losses)
|
0.8
|
|
1.2
|
|
2.0
|
|
|||||
|
Net income
|
—
|
|
(0.6
|
)
|
(0.6
|
)
|
|||||
|
Management fees
|
0.2
|
|
—
|
|
0.2
|
|
|||||
|
Balance at December 31, 2011
|
$
|
46.4
|
|
$
|
14.5
|
|
$
|
60.9
|
|
||
|
Total unrealized gains (losses)
|
$
|
3.1
|
|
$
|
1.0
|
|
$
|
4.1
|
|
||
|
Net income
|
—
|
|
(0.3
|
)
|
(0.3
|
)
|
|||||
|
Management fees
|
—
|
|
—
|
|
—
|
|
|||||
|
Balance at December 31, 2012
|
$
|
49.5
|
|
$
|
15.2
|
|
$
|
64.7
|
|
||
Defined Contribution Plans
LP also sponsors defined contribution plans in the U.S. and Canada. In the U.S., these plans are primarily 401(k) plans for hourly and salaried employees that allow for pre-tax employee deferrals and a company match of up to
3.5%
of an employee’s eligible wages (subject to certain limits). Effective January 2009, LP discontinued its company match feature for its U.S. plans. Effective January 1, 2010, LP reinstated a match of up to
2%
of an employee’s eligible wages. Under the profit sharing feature of these plans, LP may elect to contribute a discretionary amount as a percentage of eligible wages. Included in the assets of the 401(k) and profit sharing plans are
3.0 million
shares of LP common stock that represented approximately
21.2%
of the total market value of plan assets at
December 31, 2012
.
In Canada, LP sponsors both defined contribution plans and Registered Retirement Savings Plans for hourly and salaried employees that allow for pre-tax employee deferrals. LP provides a base contribution of
2.5%
of eligible earnings and matches
50%
of an employee’s deferrals up to a maximum of
3%
of each employee’s eligible earnings (subject to certain limits).
Expenses related to defined contribution plans and the multiemployer plan in
2012
,
2011
and
2010
were
$5.2 million
,
$5.5 million
and
$4.2 million
.
Other Benefit Plans
LP has several plans that provide postretirement benefits other than pensions, primarily for salaried employees in the U.S. and certain groups of Canadian employees. The funded status at
December 31, 2012
and
2011
was
$9.7 million
and
$8.5 million
. Net expense related to these plans was not significant in
2012
or
2011
.
Effective August 16, 2004, LP adopted the Louisiana-Pacific Corporation 2004 Executive Deferred Compensation Plan (the Plan). Pursuant to the Plan, certain management employees are eligible to defer up to
90%
of their regular salary and annual cash incentives that exceed the limitation as set forth by the Internal Revenue Service. Each plan participant is fully vested in all employee deferred compensation and earnings credited associated with employee contributions. Employer contributions and associated earnings vest over periods not
76
exceeding
five years
. The liability under this plan amounted to
$1.5 million
and
$2.1 million
at
December 31, 2012
and
December 31, 2011
and is included in “Other long-term liabilities” on LP’s Consolidated Balance Sheets.
14. STOCKHOLDERS' EQUITY
Preferred Stock
The Company is authorized to issue up to
15,000,000
shares of preferred stock at
$1.00
par value. At
December 31, 2012
, no shares of preferred stock have been issued; however,
2,000,000
shares of Series A Junior Participating Preferred Stock have been reserved for issuance in connection with the Company’s Shareholder Rights Plan. Additional series of preferred stock may be designated and the related rights and preferences fixed by action of the Board of Directors.
Shareholder Rights Plan
In May 2008, the Board of Directors approved a shareholder rights plan and declared a dividend of one preferred share purchase right for each outstanding share of common stock. Each right represents the right to purchase one-hundredth of a share of Preferred Stock, at an exercise price of
$100.00
,
subject to adjustment. The rights are only exercisable ten days after a person or group acquires, or commences a tender or exchange offer to acquire, beneficial ownership of
15%
or more of the Company’s outstanding common stock.
Subject to the terms of the shareholder rights plan and the discretion of the Board of Directors, each right would entitle the holder to purchase a number of additional shares of common stock of LP having a total market value of twice the exercise price of each right. The rights expire in June 2018, but can be redeemed by action of the Board of Directors prior to that time at
$0.01
per right.
Warrants
During 2009, LP issued warrants to purchase
18,395,963
shares of LP common stock at an exercise price of
$1.39
per share subject to mandatory cashless exercise provisions. During the years ended
December 31, 2012
and
December 31, 2011
, warrant exercises resulted in the issuances of
605,798
and
4,981,305
shares. At
December 31, 2012
, the remaining outstanding warrants were exercisable to purchase approximately
3,211,707
shares. The warrants (at date of grant) were valued based upon Black-Scholes option pricing model using expected stock price volatility of
53%
; no expected dividends; risk-free interest rate of
2.6%
; and an expected life of
8
years, which resulted in a fair value per share of
$0.72
.
Common Stock Plans
At
December 31, 2012
, LP had stock-based employee compensation plans as described below. The total compensation expense related to all of LP’s stock-based compensation plans was
$8.4 million
for the year ended
December 31, 2012
;
$7.8 million
for the year ended
December 31, 2011
and
$8.8 million
for the year ended
December 31, 2010
.
LP recognizes these compensation costs net of an estimated forfeiture rate and recognizes the compensation costs for only those shares expected to vest on a straight-line basis over the requisite service period of the award, which is generally the vesting term of three years. LP estimated the forfeiture rate for
2012
,
2011
and
2010
based on its historical experience during the preceding three years. During 2010, LP changed the service requirement for future awards for its then current Chief Executive Officer which allowed awards to vest regardless of service period. For these awards, LP is required to expense the entire amount of the award as of the date of grant.
Stock Compensation Plans
LP grants options and stock settled stock appreciation rights (SSARs) to key employees and directors to purchase LP common stock. On exercise or issuance, LP generally issues these shares from treasury. The options and SSARs are granted at market price at the date of grant. For employees, options and SSARs become exercisable over three years and expire ten years after the date of grant. For directors, these options become exercisable in
10%
increments every three months, starting three months after the date of grant, and expire ten years after the date of grant. At
December 31, 2012
,
3.4 million
shares were available under the current stock award plans for stock-based
77
awards. The following table sets out the weighted average assumptions used to estimate the fair value of the options and SSARs granted using the Black-Scholes option-pricing model:
|
2012
|
2011
|
2010
|
|||||||||
|
Expected stock price volatility
|
64
|
%
|
64
|
%
|
59
|
%
|
|||||
|
Expected dividend yield
|
—
|
%
|
—
|
%
|
—
|
%
|
|||||
|
Risk-free interest rate
|
0.7
|
%
|
2.1
|
%
|
2.4
|
%
|
|||||
|
Expected life of options (in years)
|
5.1
|
|
5.2
|
|
5.1
|
|
|||||
|
Weighted average fair value of options and SSARs granted
|
$
|
4.75
|
|
$
|
5.59
|
|
$
|
3.73
|
|
||
Expected Stock Price Volatility:
The fair values of stock-based payments were valued using the Black-Scholes valuation method with a volatility factor based on LP’s historical stock prices.
Expected Dividend Yield:
The Black-Scholes valuation model calls for a single expected dividend yield as an input. This is determined based upon current annual dividend as of the date of grant compared to the grant price.
Risk-Free Interest Rate:
LP bases the risk-free interest rate used in the Black-Scholes valuation method on U.S. Treasury issues with an equivalent term. Where the expected term of LP’s stock-based awards do not correspond with the terms for which interest rates are quoted, LP performed a straight-line interpolation to determine the rate from the available maturities.
Expected Life of Options:
Expected life represents the period that LP’s stock-based awards are expected to be outstanding and was determined based on historical experience of similar awards, giving consideration to the contractual terms of the stock-based awards, vesting schedules and expectations of future employee behavior as influenced by changes to the terms of its stock-based awards.
Estimated Pre-vesting Forfeitures:
When estimating forfeitures, LP considers voluntary termination behavior as well as workforce reduction programs.
The following table summarizes stock options and SSARs outstanding as of
December 31, 2012
as well as activity during the three year period then ended.
|
Share amounts in thousands
|
Options/
SSARs
|
Weighted
Average
Exercise Price
|
Weighted
Average
Contractual
Term (in years)
|
Aggregate
Intrinsic
Value
(in millions)
|
|||||||||
|
Options outstanding at January 1, 2010
|
6,611
|
|
$
|
13.99
|
|
||||||||
|
Options granted
|
1,160
|
|
$
|
7.05
|
|
||||||||
|
Options exercised
|
(83
|
)
|
$
|
2.17
|
|
||||||||
|
Options canceled
|
(108
|
)
|
$
|
11.36
|
|
||||||||
|
Options outstanding at December 31, 2010
|
7,580
|
|
$
|
13.10
|
|
||||||||
|
Options granted
|
834
|
|
$
|
10.06
|
|
||||||||
|
Options exercised
|
(18
|
)
|
$
|
4.93
|
|
||||||||
|
Options canceled
|
(81
|
)
|
$
|
15.88
|
|
||||||||
|
Options outstanding at December 31, 2011
|
8,315
|
|
$
|
12.78
|
|
||||||||
|
Options granted
|
971
|
|
$
|
8.85
|
|
||||||||
|
Options exercised
|
(751
|
)
|
$
|
6.24
|
|
||||||||
|
Options canceled
|
(60
|
)
|
$
|
16.69
|
|
||||||||
|
Options outstanding at December 31, 2012
|
8,475
|
|
$
|
12.88
|
|
5.8
|
|
$
|
64.7
|
|
|||
|
Vested and expected to vest at December 31, 2012
(1)
|
8,051
|
|
$
|
—
|
|
—
|
|
$
|
61.4
|
|
|||
|
Options exercisable at December 31, 2012
|
6,622
|
|
$
|
14.01
|
|
5.0
|
|
$
|
45.3
|
|
|||
78
_______________
|
(1)
|
Options or SSARS expected to vest based upon historical forfeiture rate
|
The aggregate intrinsic value in the table above represents the total pre-tax intrinsic value (the difference between LP’s closing stock price on the last trading day of
2012
and the exercise price, multiplied by the number of in-the-money options and SSARs) that would have been received by the holders had all holders exercised their awards on
December 31, 2012
. This amount changes based on the market value of LP’s stock as reported by the New York Stock Exchange.
As of
December 31, 2012
, there was
$3.8 million
of total unrecognized compensation costs related to stock options and SSARs. These costs are expected to be recognized over a weighted-average period of
1.4
years. LP recognized
$3.7 million
,
$3.9 million
and
$4.9 million
in compensation expense associated with these awards for the years ended
December 31, 2012
,
2011
and
2010
.
Incentive Share Awards
LP has granted incentive share stock awards (restricted stock units) to certain key employees as allowed under the current stock award plans. The awards entitle the participant to receive a specified number of shares of LP common stock at no cost to the participant. Awards granted under this plan vest three years from the date of grant. The market value of these grants approximates the fair value. LP recorded compensation expense related to these awards in
2012
,
2011
and
2010
of
$2.3 million
,
$2.3 million
and
$1.9 million
. As of
December 31, 2012
, there was
$2.7 million
of total unrecognized compensation cost related to unvested incentive share awards. This expense will be recognized over a weighted-average period of
1.1
years.
The following table summarizes incentive share awards outstanding as of
December 31, 2012
as well as activity during the three year period then ended.
|
Shares
|
Weighted
Average
Contractual
Term (in years)
|
Aggregate
Intrinsic
Value
(in millions)
|
|||||||
|
Incentive share awards outstanding at January 1, 2010
|
570,569
|
|
|||||||
|
Incentive shares awards granted
|
400,907
|
|
|||||||
|
Incentive share awards vested
|
(4,236
|
)
|
|||||||
|
Incentive share awards canceled
|
(11,304
|
)
|
|||||||
|
Incentive share awards outstanding at December 31, 2010
|
955,936
|
|
|||||||
|
Incentive shares awards granted
|
336,816
|
|
|||||||
|
Incentive share awards vested
|
(121,500
|
)
|
|||||||
|
Incentive share awards canceled
|
(58,384
|
)
|
|||||||
|
Incentive share awards outstanding at December 31, 2011
|
1,112,868
|
|
|||||||
|
Incentive shares awards granted
|
330,426
|
|
|||||||
|
Incentive share awards vested
|
(407,909
|
)
|
|||||||
|
Incentive share awards canceled
|
(74,997
|
)
|
|||||||
|
Incentive share awards outstanding at December 31, 2012
|
960,388
|
|
1.1
|
|
$
|
18.6
|
|
||
|
Vested and expected to vest at December 31, 2012
(1)
|
912,369
|
|
1.1
|
|
$
|
17.6
|
|
||
|
Incentive share awards exercisable at December 31, 2012
|
—
|
|
—
|
|
—
|
|
|||
_______________
|
(1)
|
Incentive shares expected to vest based upon historical forfeitures rate
|
Restricted Stock
79
LP grants restricted stock to certain senior executive employees. The shares vest three years from the date of grant. During the vesting period, the participants have voting rights and receive dividends, but the shares may not be sold, assigned, transferred, pledged or otherwise encumbered. Additionally, granted but unvested shares are forfeited upon termination of employment. The fair value of the restricted shares on the date of the grant is amortized ratably over the vesting period which is generally three years. As of
December 31, 2012
, there was
$2.0 million
of total unrecognized compensation costs related to restricted stock. This expense will be recognized over the next
1.1
years.
The following table summarizes restricted stock awards outstanding as of
December 31, 2012
as well as activity during the three year period then ended.
|
Number
of Shares
|
Weighted Average
Grant Date
Fair Value
|
|||||
|
Restricted stock awards outstanding at January 1, 2010
|
665,521
|
|
$
|
8.02
|
|
|
|
Restricted stock awards granted
|
210,536
|
|
7.00
|
|
||
|
Restrictions lapsing
|
(77,320
|
)
|
22.99
|
|
||
|
Restricted stock awards canceled
|
(15,448
|
)
|
5.93
|
|
||
|
Restricted stock awards at December 31, 2010
|
783,289
|
|
6.31
|
|
||
|
Restricted stock awards granted
|
149,239
|
|
10.14
|
|
||
|
Restrictions lapsing
|
(171,800
|
)
|
15.27
|
|
||
|
Restricted stock awards canceled
|
—
|
|
—
|
|
||
|
Restricted stock awards at December 31, 2011
|
760,728
|
|
5.04
|
|
||
|
Restricted stock awards granted
|
202,009
|
|
8.85
|
|
||
|
Restrictions lapsing
|
(405,750
|
)
|
2.17
|
|
||
|
Restricted stock awards canceled
|
—
|
|
—
|
|
||
|
Restricted stock awards at December 31, 2012
|
556,987
|
|
$
|
8.51
|
|
|
LP recorded compensation expense related to these awards in
2012
,
2011
and
2010
of
$1.5 million
,
$1.3 million
, and
$1.7 million
.
LP annually grants to each director restricted stock or restricted stock units. As of
December 31, 2012
, LP has
394,358
shares (or restricted stock units) outstanding under this program. Compensation expense recognized in
2012
related to these grants was
$0.3 million
.
Performance Share Awards
In connection with Mr. Stevens' appointment to Chief Executive Officer on
May 4, 2012
, he was awarded
300,000
performance shares. This award was granted pursuant to the terms of LP's 1997 Incentive Stock Award Plan. If pre-determined market-based performance goals are met, shares of LP's stock will be issued to Mr. Stevens based upon a pre-determined vesting schedule based upon the required service periods. The fair market value of this award was determined based on the fair value as of the date of grant times the number of shares adjusted for the weighted probability of the attainment of certain performance goals. LP recorded compensation expense related to these awards of
$0.2 million
in
2012
. As of December 31, 2012, there was
$1.1 million
of total unrecognized compensation expense related to this award. This expense will be recognized over the next
3.3
years.
Phantom Stock
Beginning in 2011, LP annually grants phantom stock units to its directors. The awards are considered liability awards. The director does not receive rights of a shareholder, nor is any stock transfered. The units will be paid in cash at the end of the five year vesting period. The value of one unit is based on the market value of one share of common stock on the vesting date. The cost of the grants is recognized over the vesting period and is included in stock-based compensation expense. As of
December 31, 2012
, LP had phantom stock units covering
75,816
shares outstanding under this program. LP recorded compensation expense related to these awards of
$0.4 million
in
2012
.
80
15. ASSET RETIREMENT OBLIGATIONS
The activity in LP’s asset retirement obligation liability for
2012
and
2011
is summarized in the following table. These are included in “Other long-term liabilities” in the Consolidated Balance Sheets.
|
Dollar amounts in millions
|
Year ended December 31,
|
||||||
|
2012
|
2011
|
||||||
|
Beginning balance
|
$
|
7.4
|
|
$
|
7.0
|
|
|
|
Accretion expense
|
0.8
|
|
0.4
|
|
|||
|
Accrued to expense during the year
|
0.5
|
|
0.4
|
|
|||
|
Payments made
|
(0.4
|
)
|
(0.4
|
)
|
|||
|
Ending balance
|
$
|
8.3
|
|
$
|
7.4
|
|
|
16. OTHER OPERATING CREDITS AND CHARGES, NET
The major components of “Other operating credits and charges, net” in the Consolidated Statements of Income for the years ended December 31 are reflected in the table below and described in the paragraphs following the table:
|
Dollar amounts in millions
|
Year ended December 31,
|
||||||||||
|
2012
|
2011
|
2010
|
|||||||||
|
Adjustment related to prior year inventory
|
$
|
(1.5
|
)
|
$
|
—
|
|
$
|
—
|
|
||
|
Severance
|
(0.5
|
)
|
(1.1
|
)
|
—
|
|
|||||
|
Adjustments to retirement accounts
|
(3.8
|
)
|
—
|
|
—
|
|
|||||
|
Additions to litigation reserves
|
—
|
|
—
|
|
(2.2
|
)
|
|||||
|
Reductions, net of additions, to product related contingency reserves
|
5.0
|
|
11.5
|
|
2.5
|
|
|||||
|
Reductions, net of additions, to product related warranty reserves
|
1.8
|
|
0.4
|
|
—
|
|
|||||
|
Additions to environmental related contingency reserves
|
—
|
|
(0.9
|
)
|
—
|
|
|||||
|
Timber related reserves
|
0.8
|
|
1.5
|
|
—
|
|
|||||
|
Other
|
1.1
|
|
(0.2
|
)
|
(0.4
|
)
|
|||||
|
$
|
2.9
|
|
$
|
11.2
|
|
$
|
(0.1
|
)
|
|||
2012
During 2012, LP recorded a
$2.9 million
gain in "Other operating credits and charges, net". The components of the net charges include:
|
•
|
a loss of
$1.5 million
related to a prior year inventory adjustment;
|
|
•
|
a loss of
$0.5 million
associated with severance related to an indefinitely curtailed OSB mill in British Columbia, Canada and other positions primarily related to the mill;
|
|
•
|
a loss of
$3.8 million
consisting of
$2.2 million
related to SERP settlement associated with the retirement of LP's previous CEO and
$1.6 million
related to termination indemnities in South America;
|
|
•
|
a gain of
$5.0 million
related to a reduction in product related contingency reserves associated with the national hardboard class action settlement (see Note 18 for further discussion);
|
|
•
|
a gain of
$1.8 million
consisting of a loss of
$1.0 million
for additions to warranty reserves associated with Canexel products sold in Europe in prior years, a loss of
$0.8 million
for additions to warranty reserves associated with a discontinued line of OSB siding and a gain of
$3.6 million
related to a reduction in hardboard siding trim warranty reserve; and
|
|
•
|
a gain of
$0.8 million
related to reductions in reforestation liabilities associated with LP's Canadian timber obligations.
|
81
82
2011
During 2011, LP recorded a
$11.2 million
gain in “Other operating credits and charges, net”. The components of the net credits include:
|
•
|
a loss of
$1.1 million
associated with severance related to an indefinitely curtailed OSB mill in British Columbia, Canada and other positions;
|
|
•
|
a gain of
11.5 million
related to a reduction in product related contingency reserves associated with the national hardboard class action settlement (see Note 18 for further discussion);
|
|
•
|
a gain of
$1.5 million
related to reductions in reforestation liabilities associated with LP's Canadian timber obligations;
|
|
•
|
a loss of
0.9 million
related to an increase in environmental reserves associated with a site that is held for sale; and
|
|
•
|
a gain of
$0.4 million
related to reductions in our warranty reserves.
|
2010
During 2010, LP recorded a
$0.1 million
loss in “Other operating credits and charges, net”. The components of the net charges include:
|
•
|
a loss of
$1.0 million
associated with an assessment in connection with one of its indefinitely curtailed OSB mills;
|
|
•
|
a loss of
$2.2 million
associated with LP’s settlement of an anti-trust litigation matter;
|
|
•
|
a gain of
$2.5 million
related to a reduction in product related contingency reserves associated with the national hardboard class action settlement (see Note 18 for further discussion); and
|
|
•
|
a gain of
$0.5 million
associated with the reduction of certain liabilities associated with the acquisition of Le Groupe Forex.
|
Severance
Over the course of the last three years, LP has entered into several restructuring plans in an effort to sell selected businesses and reduce overall expenses. The detail of the severance accrual and related expense and payments for the last three years is as follows:
|
Dollar amounts in millions
|
Year ended December 31,
|
||||||||||
|
2012
|
2011
|
2010
|
|||||||||
|
Beginning balance
|
$
|
1.5
|
|
$
|
0.6
|
|
$
|
2.1
|
|
||
|
Charged to expense, continuing operations
|
1.0
|
|
1.9
|
|
0.5
|
|
|||||
|
Payments
|
(1.8
|
)
|
(1.0
|
)
|
(2.0
|
)
|
|||||
|
Ending balance
|
$
|
0.7
|
|
$
|
1.5
|
|
$
|
0.6
|
|
||
The balance of the accrued severance is included in “Accounts payable and accrued liabilities” on the Consolidated Balance Sheets. The balance as of
December 31, 2012
is payable under contract through 2013. For the year ended
December 31, 2012
, severance expense is primarily related to OSB segment or general and corporate expenses.
17. LOSS ON SALE OR IMPAIRMENT OF LONG-LIVED ASSETS
The major components of “Loss on sale or impairment of long-lived assets” in the Consolidated Statements of Income for the years ended December 31 are reflected in the table below and are described in the paragraphs following the table:
83
|
Dollar amounts in millions
|
Year ended December 31,
|
||||||||||
|
2012
|
2011
|
2010
|
|||||||||
|
Impairment charges on long-lived assets
|
$
|
(4.4
|
)
|
$
|
(74.0
|
)
|
$
|
(2.4
|
)
|
||
|
Gain (loss) on sale of other long-lived assets
|
(0.5
|
)
|
0.1
|
|
—
|
|
|||||
|
$
|
(4.9
|
)
|
$
|
(73.9
|
)
|
$
|
(2.4
|
)
|
|||
2012
During 2012, LP recorded a loss on sale of and impairment of long-lived assets of
$4.9 million
. This net loss includes the following item:
|
•
|
a of
$4.4 million
charge related to the impairment of assets associated with an OSB mill in Quebec, Canada, included in assets held for sale, based upon a change in the plan of their sale of various assets held for sale to reduce their carrying value to the estimated selling price less selling costs.
|
2011
During 2011, LP recorded a loss on sale of and impairment of long-lived assets of
$73.9 million
. This net loss includes the following items:
|
•
|
a loss of
$62.0 million
associated with the impairment review of its LSL facility in Houlton, Maine;
|
|
•
|
a loss of
$12.0 million
associated with assets held and used or held for sale; and
|
|
•
|
a gain of
0.1 million
associated with the sale of non-operating sites.
|
2010
During 2010, LP recorded a loss on sale of and impairment of long-lived assets of
$2.4 million
. This net loss includes the following items:
|
•
|
a loss of
$0.9 million
associated with the valuation of certain road systems in Canada; and
|
|
•
|
a loss of
$1.5 million
associated with assets held and used or held for sale.
|
18. CONTINGENCIES
LP maintains reserves for various contingent liabilities as follows:
|
|
December 31,
|
||||||
|
Dollar amounts in millions
|
2012
|
2011
|
|||||
|
Environmental reserves
|
$
|
14.1
|
|
$
|
15.0
|
|
|
|
Hardboard siding reserves
|
0.7
|
|
6.2
|
|
|||
|
Total contingencies
|
14.8
|
|
21.2
|
|
|||
|
Current portion
|
(2.0
|
)
|
(4.0
|
)
|
|||
|
Long-term portion
|
$
|
12.8
|
|
$
|
17.2
|
|
|
LP’s estimates of its loss contingencies are based on various assumptions and judgments. Due to the numerous uncertainties and variables associated with these assumptions and judgments, both the precision and reliability of the resulting estimates of the related contingencies are subject to substantial uncertainties. LP regularly monitors its estimated exposure to contingencies and, as additional information becomes known, may change its estimates significantly. While no estimate of the range of any such change can be made at this time, the amount that LP may ultimately pay in connection with these matters could materially exceed, in either the near term or the longer term, the amounts accrued to date. LP’s estimates of its loss contingencies do not reflect potential future recoveries from insurance carriers except to the extent that recovery may from time to time be deemed probable as a result of an insurer’s agreement to payment terms.
84
Environmental Proceedings
LP is involved in a number of environmental proceedings and activities, and may be wholly or partially responsible for known or unknown contamination existing at a number of other sites at which it has conducted operations or disposed of wastes. Based on the information currently available, management believes that any fines, penalties or other costs or losses resulting from these matters will not have a material effect on the financial position, results of operations, cash flows or liquidity of LP.
LP maintains a reserve for undiscounted estimated environmental loss contingencies. This reserve is primarily for estimated future costs of remediation of hazardous or toxic substances at numerous sites currently or previously owned by the Company. LP’s estimates of its environmental loss contingencies are based on various assumptions and judgments, the specific nature of which varies in light of the particular facts and circumstances surrounding each environmental loss contingency. These estimates typically reflect assumptions and judgments as to the probable nature, magnitude and timing of required investigation, remediation and/or monitoring activities and the probable cost of these activities, and in some cases reflect assumptions and judgments as to the obligation or willingness and ability of third parties to bear a proportionate or allocated share of the cost of these activities. Due to the numerous uncertainties and variables associated with these assumptions and judgments, and the effects of changes in governmental regulation and environmental technologies, both the precision and reliability of the resulting estimates of the related contingencies are subject to substantial uncertainties. LP regularly monitors its estimated exposure to environmental loss contingencies and, as additional information becomes known, may change its estimates significantly. However, no estimate of the range of any such change can be made at this time.
In those instances in which LP’s estimated exposure reflects actual or anticipated cost-sharing arrangements with third parties, LP does not believe that it will be exposed to additional material liability as a result of non-performance by such third parties. There are three forms of cost-sharing arrangements under which costs are apportioned to others and are therefore not reflected in LP’s environmental reserves. The amounts involved, the number of sites and a description of each are as follows:
|
•
|
Approximately
$2.2 million
of costs, relating to three sites, pursuant to formal cost-sharing arrangements between LP and one or more third parties.
|
|
•
|
Approximately
$2.7 million
of costs, related to four transactions each covering multiple sites, pursuant to agreements contained in purchase and sale documents where LP has sold an asset to a third party and that third party has assumed responsibility for all or a portion of any remediation costs required for the sold asset.
|
|
•
|
Approximately
$0.2 million
of costs, related to one site undergoing cleanup pursuant to federal or state environmental laws, where multiple parties are involved.
|
LP considers the financial condition of third parties subject to the cost-sharing arrangements discussed above in determining the amounts to be reflected in LP’s environmental reserves. In addition, LP is a party to clean-up activities at two additional sites for which LP does not believe that the failure of a third party to discharge its allocated responsibility would significantly increase LP’s financial responsibility based on the manner in which financial responsibility has been, or is expected to be, allocated.
LP’s estimates of its environmental loss contingencies do not reflect potential future recoveries from insurance carriers except to the extent that recovery may from time to time be deemed probable as a result of a carrier’s agreement to payment terms.
The activity in LP’s reserve for estimated environmental loss contingency reserves for the last three years is summarized in the following table.
85
|
|
Year ended December 31,
|
||||||||||
|
Dollar amounts in millions
|
2012
|
2011
|
2010
|
||||||||
|
Beginning balance
|
$
|
15.0
|
|
$
|
14.3
|
|
$
|
14.7
|
|
||
|
Adjusted to expense (income) during the year
|
0.7
|
|
1.5
|
|
0.3
|
|
|||||
|
Payments made
|
(1.6
|
)
|
(0.8
|
)
|
(0.7
|
)
|
|||||
|
Ending balance
|
$
|
14.1
|
|
$
|
15.0
|
|
$
|
14.3
|
|
||
During
2012
,
2011
and
2010
, LP adjusted its reserves at a number of sites to reflect current estimates of remediation costs.
ABT Hardboard Siding Matters
Between 1995 and 1999, ABT Building Products Corporation (“ABT”), ABTco, Inc., a wholly owned subsidiary of ABT (“ABTco” and, together with ABT, the “ABT Entities”), Abitibi-Price Corporation (“Abitibi”), a predecessor of ABT, and certain affiliates of Abitibi (the “Abitibi Affiliates” and, together with Abitibi, the “Abitibi Entities”) were named as defendants in numerous class action and non-class action proceedings brought on behalf of various persons or purported classes of persons (including nationwide classes in the United States and Canada) who own or have purchased or installed hardboard siding manufactured or sold by the defendants. In general, the plaintiffs in these actions have claimed unfair business practices, breach of warranty, fraud, misrepresentation, negligence, and other theories related to alleged defects, deterioration, or other failure of such hardboard siding, and seek unspecified compensatory, punitive, and other damages (including consequential damage to the structures on which the siding was installed), attorneys’ fees and other relief.
LP acquired ABT in February 1999 and ABT was merged into LP in January of 2001. On September 21, 2000, the Circuit Court of Choctaw County, Alabama, under the caption
Foster, et al. v. ABTco, Inc., ABT Building Products Corporation, Abitibi-Price, Inc. and Abitibi-Price Corporation
(No. CV95-151-M), approved a settlement agreement among the defendants and attorneys representing a nationwide class composed of all persons who own or formerly owned homes or, subject to limited exceptions, other buildings or structures on which hardboard siding manufactured by the defendants was installed between May 15, 1975 and May 15, 2000. Except for approximately 30 persons who timely opted out, the settlement includes and binds all members of the settlement class and resolves all claims asserted in the various proceedings described above. Under the settlement agreement, class members will have twenty-five years after their siding was installed to file a claim.
Under the settlement agreement, the defendants will be entitled to elect to make an offer of settlement to an eligible claimant based on the information set forth in the claim submitted by such claimant, and such claimant will be entitled to accept or reject the offer. If an eligible claimant declines the offer, or if no offer is made, such claimant will be entitled to a payment based on an independent inspection. Such payments will be based on a specified dollar amount (calculated on the basis of statewide averages and ranging from $2.65 to $6.21, depending upon the state) per square foot of covered siding that has experienced specified types of damage, subject to reduction based on the age of the damaged siding and any failure to paint the damaged siding within stated intervals (except in the case of damaged siding installed on mobile homes, as to which a uniform 50% reduction will apply in all circumstances). If applicable, payments under the settlement will also be subject to reduction to reflect any warranty payments or certain other payments previously recovered by a claimant on account of the damaged siding. Under the settlement agreement, LP (as a successor to ABT) will be required to pay the expenses of administering the settlement and certain other costs.
ABT and Abitibi were parties to an agreement of an allocation of liability with respect to claims related to siding sold prior to October 22, 1992. On June 13, 2001, in exchange for a cash payment from Abitibi of approximately
$19.0 million
which was received in July 2001, LPC, a wholly owned subsidiary of LP, agreed to accept a transfer of all of Abitibi’s rights and obligations under the settlement agreement and the allocation agreement; and LP and LPC agreed to indemnify and hold harmless Abitibi from any cost or liability arising from its sale of hardboard siding in the United States. From the date of the agreement, Abitibi has no further rights, obligations or liabilities under either the class action settlement agreement or the allocation agreement. All such rights, obligations and liabilities have been assigned to and accepted and assumed by LPC.
86
During
2010
, LP increased its reserves in connection with this class action settlement. The additional reserves reflect revised estimates of undiscounted future claim payments and related administrative costs. During
2011
and
2012
, LP decreased its reserves in connection with this settlement due to reductions in claims activity. LP believes that the reserve balance at
December 31, 2012
will be adequate to cover future payments to claimants and related administrative costs. However, it is possible that additional charges may be required in the future.
The activity in the portion of LP’s loss contingency reserves relating to hardboard siding contingencies for the last three years is summarized in the following table. Included in this table for
2012
and
2011
are reimbursements received by LP from an insurance company for a portion of the claims payments and administrative costs covered under a court judgment related to production and sales of the specific products for specific years.
|
|
Year ended December 31,
|
||||||||||
|
Dollar amounts in millions
|
2012
|
2011
|
2010
|
||||||||
|
Beginning balance
|
$
|
6.2
|
|
$
|
17.8
|
|
$
|
24.2
|
|
||
|
Accrued (reversed) to expense
|
(5.0
|
)
|
(10.7
|
)
|
(2.5
|
)
|
|||||
|
Claims reimbursement
|
—
|
|
0.6
|
|
1.0
|
|
|||||
|
Payments made for claims
|
(0.4
|
)
|
(1.1
|
)
|
(3.6
|
)
|
|||||
|
Payments made for administrative costs
|
(0.1
|
)
|
(0.4
|
)
|
(1.3
|
)
|
|||||
|
Ending balance
|
$
|
0.7
|
|
$
|
6.2
|
|
$
|
17.8
|
|
||
Antitrust Litigation
On December 1, 2008, LP was named as one of a number of defendants in Bailey Lumber & Supply and 84 Lumber Company v. Georgia-Pacific Corporation et. al. (Civil Action No. 1:08cv1394) filed in the United States District Court for the Southern District of Mississippi Southern Division. The plaintiffs, who opted out of a class action settlement of substantially identical claims that was implemented in 2008, seek treble damages alleged to have resulted from a conspiracy among the defendants to fix, raise, maintain and stabilize the prices at which OSB and Plywood are sold in the United States during the period of 2002 into 2006, in violation of Section 1 of the Sherman Act, 15 U.S.C. §1, together with costs and attorneys’ fees. LP believed that the claims asserted were without merit. However, LP decided that in order to limit the risks and costs associated with a prolonged trial schedule, it would settle this lawsuit. LP accrued and paid the settlements in 2010.
Other Proceedings
LP and its subsidiaries are parties to other legal proceedings. Based on the information currently available, management believes that the resolution of such proceedings will not have a material adverse effect on the financial position, results of operations, cash flows or liquidity of LP.
19. NON-CONTROLLING INTEREST
In May 2008, LP completed the initial phase of its purchase of a
75%
ownership interest in Massisa OSB Industria e Comercio S.A., which operates OSB assets located in Ponta Grossa, Brazil. The purchase was made through LP Brasil Participacoes Ltda., a former limited liability company and indirect subsidiary of LP. The non controlling ownership was subject to a put and call option that became exercisable in 2011, was being accounted for as a redeemable non controlling interest and was accreted over the life of the put and call to the estimated price which was the greater of
$18.5 million
plus interest plus the greater of
$2.0 million
or
25%
of related working capital or a multiple of earnings before interest and taxes (subject to certain adjustments). The purchase price in 2008 was approximately
$56.5 million
(including expenses). LP took over operations in November 2008.
In June 2011, LP purchased the remaining
25%
ownership of LP Brazil from Massisa for a payment of
$24.0 million
. Subsequent to the purchase, LP incurred
$10.0 million
of long term export financing debt in connection with the purchase and used a portion of the proceeds to repay interim borrowing incurred to fund a portion of the purchase price.
87
20. COMMITMENTS AND CONTINGENT LIABILITIES
LP is primarily self-insured for workers’ compensation and employee health care liability costs. Self-insurance liabilities for workers’ compensation are determined based upon a valuation performed by an actuarial firm. The estimate of future workers’ compensation liabilities incorporates loss development and an estimate associated with incurred but not yet reported claims. These claims are discounted. Self-insurance liabilities for employee health costs are determined actuarially based upon claims filed and estimated claims incurred but not yet reported. These claims are not discounted.
The Company and its subsidiaries lease certain office, manufacturing, warehousing and other plant sites and equipment. The leases generally provide for the lessee to pay taxes, maintenance, insurance and certain other operating costs of the leased properties.
At
December 31, 2012
, future minimum annual rent commitments are as follows:
|
Dollar amounts in millions
|
|
||
|
Year ended December 31,
|
|
||
|
2013
|
$
|
3.1
|
|
|
2014
|
2.6
|
|
|
|
2015
|
2.5
|
|
|
|
2016
|
2.1
|
|
|
|
2017
|
1.7
|
|
|
|
2018 and thereafter
|
7.8
|
|
|
|
Total
|
$
|
19.8
|
|
As of
December 31, 2012
, LP has entered into non-cancelable subleases for a portion of its corporate headquarters in Nashville, Tennessee. Minimum annual rent commitments have not been reduced by minimum sublease rentals of
$1.2 million
(in total for all years) due in the future. Rental expense for operating leases amounted to
$8.3 million
,
$9.5 million
and
$9.6 million
in
2012
,
2011
and
2010
.
21. GUARANTEES AND INDEMNIFICATIONS
LP is a party to contracts in which LP agrees to indemnify third parties for certain liabilities that arise out of or relate to the subject matter of the contract. In some cases, this indemnity extends to related liabilities arising out of the negligence of the indemnified parties, but usually excludes any liabilities caused by gross negligence or willful misconduct of the indemnified parties. LP cannot estimate the potential amount of future payments under these agreements until events arise that would trigger the liability.
Additionally, in connection with certain sales of assets and divestures of businesses, LP has agreed to indemnify the buyer and related parties for certain losses or liabilities incurred by the buyer or such related parties with respect to (1) the representations and warranties made to the buyer by LP in connection with the sales and (2) liabilities related to the pre-closing operations of the assets sold. Indemnities related to pre-closing operations generally include environmental liabilities, tax liabilities and other liabilities not assumed by the buyer.
Indemnities related to the pre-closing operations of sold assets normally do not represent added liabilities for LP, but simply serve to protect the buyer from potential liability associated with the obligations that existed (known and unknown) at the time of the sale. LP records accruals for those pre-closing obligations that are considered probable and estimable. LP is required to record a liability for the fair value of the guarantees that are entered into subsequent to December 31, 2002. LP has not accrued any additional amounts as a result of the indemnity agreements summarized below as LP believes the fair value of the guarantees entered into after December 31, 2002 is not material.
|
•
|
In connection with various sales of LP’s timberlands, LP has agreed to indemnify various buyers with respect to losses resulting from breaches of limited representations and warranties contained in these
|
88
agreements. These indemnities generally are capped at a maximum potential liability and have an unspecified duration.
|
•
|
In connection with the sale of LP’s two inter-related interior hardboard facilities to Decorative Panels International Inc. in 2004, LP provided a 10-year indemnity for unknown environmental claims, capped at
$4.0 million
with a
$0.3 million
deductible. This indemnity will expire in May 2014.
|
|
•
|
In connection with the sale by LP Canada Pulp Ltd (LPCP) of its pulp mill in Chetwynd, BC, Canada to Tembec, Ltd in October 2002, LP provided an indemnity of unspecified duration provided by LPCP for liabilities arising out of pre-closing operations. These indemnities, which do not extend to environmental liabilities, are capped at
C$15.0 million
in the aggregate.
|
LP also has various other indemnities that are individually and in the aggregate immaterial.
LP will record a liability related to specific indemnification when future payment is probable and the amount is estimable.
Additionally, LP offers warranties on the sale of most of its products and records an accrual for estimated future claims. Such accruals are based upon historical experience and management’s estimate of the level of future claims. The activity in warranty reserves for the last three years is summarized in the following table.
|
|
Year ended December 31,
|
||||||||||
|
Dollar amounts in millions
|
2012
|
2011
|
2010
|
||||||||
|
Beginning balance
|
$
|
30.3
|
|
$
|
29.5
|
|
$
|
32.9
|
|
||
|
Accrued to expense during the year
|
4.5
|
|
13.7
|
|
11.2
|
|
|||||
|
Credited to other operating credits and charges
|
(1.8
|
)
|
—
|
|
—
|
|
|||||
|
Payments made
|
(11.6
|
)
|
(12.9
|
)
|
(14.6
|
)
|
|||||
|
Total warranty reserves
|
21.4
|
|
30.3
|
|
29.5
|
|
|||||
|
Current portion
|
(12.0
|
)
|
(12.0
|
)
|
(10.0
|
)
|
|||||
|
Long term portion
|
$
|
9.4
|
|
$
|
18.3
|
|
$
|
19.5
|
|
||
The current portion of the warranty reserve is included in “Accounts payable and accrued liabilities” and the long-term portion is included in “Other long-term liabilities” on the Consolidated Balance Sheets.
LP increased the warranty reserves related to discontinued composite decking products by
$12 million
in 2011 and
$5.2 million
in 2010. The additional reserves reflect revised estimates of future claim payments based upon an increase in decking warranty claims related to a specific operation and specific time period. During the fourth quarter of 2008, LP established a voluntary recall of the affected decking. During the second quarter of 2009, LP established a formal recall program under the Consumer Products Safety Board requirements for these products. No additional reserve increase was required in connection with the establishment of the formal program. LP continues to monitor warranty and other claims associated with these products and with the recall program (see Note 18) and believe as of
December 31, 2012
that the reserves associated with these matters are adequate.
During 2012, LP increased the warranty reserve related to it discontinued vinyl siding products by
$3.6 million
. LP had increased this warranty reserve in 2010. The changes to the reserve reflected revised estimates of future claims.
LP believes that the warranty reserve balances at
December 31, 2012
are adequate to cover future warranty payments. However, it is possible that additional charges may be required.
22. DISCONTINUED OPERATIONS
Over the last several years, LP has adopted and implemented plans to sell selected businesses and assets in order to improve its operating results. For all periods presented, these operations include residual losses of mills divested in past years and associated warranty and other liabilities associated with these operations.
89
Included in the operating losses of discontinued operations for the year ended December 31, 2012 is an increase in warranty reserves of
$3.6 million
associated with products previously discontinued based upon increases in warranty claim activity during the year ended
December 31, 2012
.
Included in the operating losses of discontinued operations for the year ended December 31, 2011 is an increase in warranty reserves of
$12.0 million
associated with products previously discontinued based upon significant increases in warranty claim activity during the year ended
December 31, 2011
.
Included in the operating losses of discontinued operations for the year ended December 31, 2010 is an increase in warranty reserves of
$7.1 million
associated with products previously discontinued based upon significant increases in recent warranty claim activity.
23. ACCUMULATED COMPREHENSIVE LOSS
Accumulated comprehensive loss consists of cumulative translation adjustments, unrealized gains (losses) on certain derivative instruments and pension and post retirement adjustments. The table below breaks down these balances, net of tax:
|
Dollar amounts in millions
|
Foreign
currency
translation
adjustments
|
Pension
adjustments
|
Unrealized
gain (loss)
on
derivative
instruments
|
Unrealized
gain (loss)
on investments
|
Other
|
Total
|
|||||||||||||||||
|
Balance at December 31, 2009
|
$
|
(8.1
|
)
|
$
|
(65.6
|
)
|
$
|
(0.1
|
)
|
$
|
11.4
|
|
$
|
(2.2
|
)
|
$
|
(64.6
|
)
|
|||||
|
Activity
|
7.7
|
|
(7.6
|
)
|
(0.2
|
)
|
(4.9
|
)
|
—
|
|
(5.0
|
)
|
|||||||||||
|
Balance at December 31, 2010
|
(0.4
|
)
|
(73.2
|
)
|
(0.3
|
)
|
6.5
|
|
(2.2
|
)
|
(69.6
|
)
|
|||||||||||
|
Activity
|
(7.8
|
)
|
(22.8
|
)
|
0.7
|
|
(6.3
|
)
|
(0.4
|
)
|
(36.6
|
)
|
|||||||||||
|
Balance at December 31, 2011
|
(8.2
|
)
|
(96.0
|
)
|
0.4
|
|
0.2
|
|
(2.6
|
)
|
(106.2
|
)
|
|||||||||||
|
Activity
|
0.6
|
|
(3.0
|
)
|
(0.7
|
)
|
0.8
|
|
0.6
|
|
(1.7
|
)
|
|||||||||||
|
Balance at December 31, 2012
|
$
|
(7.6
|
)
|
$
|
(99.0
|
)
|
$
|
(0.3
|
)
|
$
|
1.0
|
|
$
|
(2.0
|
)
|
$
|
(107.9
|
)
|
|||||
Foreign currency translation adjustments exclude income tax expense (benefit) given that these adjustments arise out of the translation of assets into the reporting currency that is separate from the taxable income and is deemed to be reinvested for an indefinite period of time. The pension adjustments included income tax benefit of
$0.9 million
,
$14.1 million
and
$3.0 million
in
2012
,
2011
and
2010
.
24. SEGMENT INFORMATION
LP operates in four segments: Oriented Strand Board (OSB); Siding; Engineered Wood Products (EWP) and South America. LP’s business units have been aggregated into these four segments based upon the similarity of economic characteristics, customers and distribution methods. LP’s results of operations are summarized below for each of these segments separately as well as for the “other” category which comprises other products that are not individually significant. Segment information was prepared in accordance with the same accounting principles as those described in Note 1. In the current year, the Company recast the prior year presentation of its reportable segments to show South American operations as a separate segment based upon the attainment of certain thresholds as defined by the Financial Accounting Standards Board (“FASB”). LP evaluates the performance of its business segments based upon operating profits excluding other operating credits and charges, net, gain (loss) on sales of and impairments of long-lived assets, general corporate and other expenses, translation gains and losses, interest and income taxes.
The OSB segment includes OSB products produced in North America. The siding segment includes Smart Side
®
siding products; Canexel siding products; and other related products. The engineered wood products segment includes laminated veneer lumber and laminated strand lumber; I-joists; plywood; and other related products. The South America segment includes products produced and or sold (generally OSB) in South America.
90
Information about LP’s product segments is as follows:
|
|
Year ended December 31,
|
||||||||||
|
Dollar amounts in millions
|
2012
|
2011
|
2010
|
||||||||
|
SALES BY BUSINESS SEGMENT
|
|||||||||||
|
OSB
|
$
|
814.1
|
|
$
|
542.0
|
|
$
|
602.7
|
|
||
|
Siding
|
500.9
|
|
429.8
|
|
427.8
|
|
|||||
|
Engineered Wood Products
|
213.4
|
|
203.3
|
|
192.0
|
|
|||||
|
South America
|
168.8
|
|
144.9
|
|
124.7
|
|
|||||
|
Other products
|
37.4
|
|
39.4
|
|
42.9
|
|
|||||
|
Intersegment Sales
|
(18.8
|
)
|
(2.5
|
)
|
(6.5
|
)
|
|||||
|
Total sales
|
$
|
1,715.8
|
|
$
|
1,356.9
|
|
$
|
1,383.6
|
|
||
|
PROFIT (LOSS) BY BUSINESS SEGMENT
|
|||||||||||
|
OSB
|
$
|
124.0
|
|
$
|
(63.5
|
)
|
$
|
25.8
|
|
||
|
Siding
|
67.4
|
|
42.0
|
|
51.3
|
|
|||||
|
Engineered Wood Products
|
(13.9
|
)
|
(15.5
|
)
|
(21.3
|
)
|
|||||
|
South America
|
18.0
|
|
11.6
|
|
7.2
|
|
|||||
|
Other products
|
(5.7
|
)
|
(12.5
|
)
|
(1.1
|
)
|
|||||
|
Other operating credits and charges, net
|
2.9
|
|
11.2
|
|
(0.1
|
)
|
|||||
|
Gain (loss) on sales of and impairments of long-lived assets
|
(4.9
|
)
|
(73.9
|
)
|
(2.4
|
)
|
|||||
|
General corporate and other expense, net
|
(78.7
|
)
|
(66.4
|
)
|
(73.4
|
)
|
|||||
|
Investment income
|
14.8
|
|
28.7
|
|
38.4
|
|
|||||
|
Interest expense, net of capitalized interest
|
(49.3
|
)
|
(56.9
|
)
|
(63.9
|
)
|
|||||
|
Other-than-temporary investment impairment
|
—
|
|
(14.8
|
)
|
(17.0
|
)
|
|||||
|
Other non-operating income (expense)
|
(34.9
|
)
|
(1.0
|
)
|
2.2
|
|
|||||
|
Income (loss) from continuing operations before taxes
|
39.7
|
|
(211.0
|
)
|
(54.3
|
)
|
|||||
|
Provision (benefit) for income taxes
|
7.6
|
|
(39.1
|
)
|
(22.1
|
)
|
|||||
|
Income (loss) from continuing operations
|
$
|
32.1
|
|
$
|
(171.9
|
)
|
$
|
(32.2
|
)
|
||
|
|
Year ended December 31,
|
||||||||||
|
|
2012
|
2011
|
2010
|
||||||||
|
DEPRECIATION AND AMORTIZATION
|
|||||||||||
|
OSB
|
$
|
33.1
|
|
$
|
36.3
|
|
$
|
37.4
|
|
||
|
Siding
|
15.5
|
|
15.5
|
|
18.1
|
|
|||||
|
Engineered Wood Products
|
11.0
|
|
12.6
|
|
13.1
|
|
|||||
|
South America
|
12.0
|
|
11.6
|
|
10.0
|
|
|||||
|
Other products
|
0.6
|
|
0.8
|
|
1.1
|
|
|||||
|
Non-segment related
|
1.7
|
|
2.1
|
|
2.3
|
|
|||||
|
Total depreciation and amortization
|
$
|
73.9
|
|
$
|
78.9
|
|
$
|
82.0
|
|
||
|
CAPITAL EXPENDITURES
|
|||||||||||
|
OSB
|
$
|
10.1
|
|
$
|
8.9
|
|
$
|
7.1
|
|
||
|
Siding
|
8.7
|
|
5.9
|
|
5.6
|
|
|||||
91
|
Engineered Wood Products
|
2.5
|
|
2.0
|
|
0.4
|
|
|||||
|
South America
|
4.6
|
|
2.7
|
|
1.1
|
|
|||||
|
Other products
|
0.9
|
|
0.2
|
|
—
|
|
|||||
|
Non-segment related
|
4.4
|
|
1.7
|
|
0.3
|
|
|||||
|
Total capital expenditures
|
$
|
31.2
|
|
$
|
21.4
|
|
$
|
14.5
|
|
||
Information concerning identifiable assets by segment is as follows:
|
Dollar amounts in millions
|
December 31,
|
||||||
|
2012
|
2011
|
||||||
|
IDENTIFIABLE ASSETS
|
|||||||
|
OSB
|
$
|
532.0
|
|
$
|
525.6
|
|
|
|
Siding
|
178.1
|
|
167.1
|
|
|||
|
Engineered Wood Products
|
136.5
|
|
141.4
|
|
|||
|
South America
|
168.1
|
|
156.6
|
|
|||
|
Other products
|
25.2
|
|
33.6
|
|
|||
|
Non-segment related
|
1,291.1
|
|
1,115.6
|
|
|||
|
Total assets
|
$
|
2,331.0
|
|
$
|
2,139.9
|
|
|
Non-segment related assets include long-term notes receivable, cash and cash equivalents, short-term and long-term investments, corporate assets, assets held for sale and other items.
Information concerning LP’s geographic segments is as follows:
92
|
|
Year ended December 31,
|
||||||||||
|
Dollar amounts in millions
|
2012
|
2011
|
2010
|
||||||||
|
GEOGRAPHIC SEGMENTS
|
|||||||||||
|
Total Sales—Point of origin
|
|||||||||||
|
U.S.
|
$
|
1,342
|
|
$
|
991
|
|
$
|
1,015
|
|
||
|
Canada
|
331
|
|
280
|
|
314
|
|
|||||
|
South America
|
164
|
|
145
|
|
125
|
|
|||||
|
Intersegment sales
|
(121
|
)
|
(59
|
)
|
(70
|
)
|
|||||
|
Total Sales
|
$
|
1,716
|
|
$
|
1,357
|
|
$
|
1,384
|
|
||
|
Operating profit (loss)
|
|||||||||||
|
U.S.
|
$
|
169
|
|
$
|
14
|
|
$
|
55
|
|
||
|
Canada
|
3
|
|
(64
|
)
|
—
|
|
|||||
|
South America
|
18
|
|
12
|
|
7
|
|
|||||
|
Other operating credits and charges, net and gain (loss) on sales of and impairments of long-lived assets
|
(2
|
)
|
(63
|
)
|
(3
|
)
|
|||||
|
General corporate expense, other-than-temporary investment impairment, loss on early debt extinguishment, realized gain on long term investments, translation gains (losses) and interest, net
|
(148
|
)
|
(110
|
)
|
(113
|
)
|
|||||
|
40
|
|
(211
|
)
|
(54
|
)
|
||||||
|
Provision (benefit) for income taxes
|
8
|
|
(39
|
)
|
(22
|
)
|
|||||
|
Income (loss) from continuing operations
|
$
|
32
|
|
$
|
(172
|
)
|
$
|
(32
|
)
|
||
|
IDENTIFIABLE TANGIBLE LONG LIVED ASSETS
|
|||||||||||
|
U.S.
|
$
|
540
|
|
$
|
576
|
|
$
|
683
|
|
||
|
Canada
|
144
|
|
158
|
|
172
|
|
|||||
|
South America
|
100
|
|
107
|
|
127
|
|
|||||
|
Total assets
|
$
|
784
|
|
$
|
841
|
|
$
|
982
|
|
||
93
Interim Financial Results (unaudited)
|
|
1ST QTR
|
2ND QTR
|
3RD QTR
|
4TH QTR
|
|||||||||||||||||||||||||||
|
(Dollars in millions, except per share)
|
2012
|
2011
|
2012
|
2011
|
2012
|
2011
|
2012
|
2011
|
|||||||||||||||||||||||
|
QUARTERLY DATA
|
|||||||||||||||||||||||||||||||
|
Net sales
|
$
|
361.5
|
|
$
|
331.7
|
|
$
|
427.8
|
|
$
|
362.4
|
|
$
|
467.8
|
|
$
|
350.6
|
|
$
|
458.7
|
|
$
|
312.2
|
|
|||||||
|
Income (loss) from continuing operations before taxes, equity in (income) loss of unconsolidated affiliates
|
(10.6
|
)
|
(26.4
|
)
|
(45.5
|
)
|
(33.9
|
)
|
37.3
|
|
(74.2
|
)
|
56.8
|
|
(49.6
|
)
|
|||||||||||||||
|
Income (loss) from continuing operations
|
(11.2
|
)
|
(22.9
|
)
|
(37.2
|
)
|
(32.9
|
)
|
31.4
|
|
(59.3
|
)
|
49.1
|
|
(56.8
|
)
|
|||||||||||||||
|
Net income (loss)
|
$
|
(11.3
|
)
|
$
|
(22.9
|
)
|
$
|
(37.3
|
)
|
$
|
(35.4
|
)
|
$
|
31.3
|
|
$
|
(65.6
|
)
|
$
|
46.1
|
|
$
|
(57.2
|
)
|
|||||||
|
Income (loss) from continuing operations per share—basic
|
$
|
(0.08
|
)
|
$
|
(0.18
|
)
|
$
|
(0.27
|
)
|
$
|
(0.25
|
)
|
$
|
0.23
|
|
$
|
(0.44
|
)
|
$
|
0.35
|
|
$
|
(0.42
|
)
|
|||||||
|
Income (loss) from continuing operations per share—diluted
|
$
|
(0.08
|
)
|
$
|
(0.18
|
)
|
$
|
(0.27
|
)
|
$
|
(0.25
|
)
|
$
|
0.22
|
|
$
|
(0.44
|
)
|
$
|
0.34
|
|
$
|
(0.42
|
)
|
|||||||
|
Net income (loss) per share—basic
|
$
|
(0.08
|
)
|
$
|
(0.18
|
)
|
$
|
(0.27
|
)
|
$
|
(0.27
|
)
|
$
|
0.23
|
|
$
|
(0.49
|
)
|
$
|
0.33
|
|
$
|
(0.42
|
)
|
|||||||
|
Net income (loss) per share—diluted
|
$
|
(0.08
|
)
|
$
|
(0.18
|
)
|
$
|
(0.27
|
)
|
$
|
(0.27
|
)
|
$
|
0.22
|
|
$
|
(0.49
|
)
|
$
|
0.32
|
|
$
|
(0.42
|
)
|
|||||||
|
Cash dividends per share
|
—
|
|
—
|
|
—
|
|
—
|
|
—
|
|
—
|
|
—
|
|
—
|
|
|||||||||||||||
|
SALES BY SEGMENT:
|
|||||||||||||||||||||||||||||||
|
OSB
|
$
|
149.0
|
|
$
|
132.1
|
|
$
|
194.9
|
|
$
|
140.6
|
|
$
|
226.6
|
|
$
|
138.8
|
|
$
|
243.1
|
|
$
|
130.6
|
|
|||||||
|
Siding
|
113.1
|
|
106.2
|
|
137.0
|
|
118.6
|
|
134.1
|
|
112.0
|
|
116.7
|
|
93.0
|
|
|||||||||||||||
|
Engineered wood products
|
48.6
|
|
48.3
|
|
51.7
|
|
53.6
|
|
61.5
|
|
54.9
|
|
51.6
|
|
46.4
|
|
|||||||||||||||
|
South America
|
42.4
|
|
35.3
|
|
42.7
|
|
39.5
|
|
42.0
|
|
36.3
|
|
41.7
|
|
33.8
|
|
|||||||||||||||
|
Other
|
10.0
|
|
10.5
|
|
10.7
|
|
10.4
|
|
9.1
|
|
9.5
|
|
7.5
|
|
9.1
|
|
|||||||||||||||
|
Intersegment sales
|
(1.6
|
)
|
(0.7
|
)
|
(9.2
|
)
|
(0.3
|
)
|
(5.5
|
)
|
(0.9
|
)
|
(1.9
|
)
|
(0.7
|
)
|
|||||||||||||||
|
Total net sales
|
$
|
361.5
|
|
$
|
331.7
|
|
$
|
427.8
|
|
$
|
362.4
|
|
$
|
467.8
|
|
$
|
350.6
|
|
$
|
458.7
|
|
$
|
312.2
|
|
|||||||
|
PROFIT (LOSS) BY BUSINESS SEGMENT
|
|||||||||||||||||||||||||||||||
|
OSB
|
$
|
(0.3
|
)
|
$
|
(9.1
|
)
|
$
|
17.0
|
|
$
|
(22.9
|
)
|
$
|
49.3
|
|
$
|
(16.0
|
)
|
$
|
58.0
|
|
$
|
(15.5
|
)
|
|||||||
|
Siding
|
16.8
|
|
12.7
|
|
19.4
|
|
11.3
|
|
20.3
|
|
11.8
|
|
11.0
|
|
6.2
|
|
|||||||||||||||
|
Engineered wood products
|
(2.8
|
)
|
(5.5
|
)
|
(3.4
|
)
|
(3.2
|
)
|
(3.0
|
)
|
(3.2
|
)
|
(4.6
|
)
|
(3.6
|
)
|
|||||||||||||||
|
South America
|
3.1
|
|
3.6
|
|
3.6
|
|
4.2
|
|
4.5
|
|
2.3
|
|
6.8
|
|
1.5
|
|
|||||||||||||||
|
Other
|
(0.7
|
)
|
(0.7
|
)
|
(1.9
|
)
|
(2.0
|
)
|
(2.0
|
)
|
(3.2
|
)
|
(1.2
|
)
|
(6.6
|
)
|
|||||||||||||||
|
Other operating credits and charges, net
|
0.2
|
|
0.8
|
|
(0.2
|
)
|
0.6
|
|
(1.2
|
)
|
9.8
|
|
4.1
|
|
—
|
|
|||||||||||||||
|
Loss on sale of and impairment of long-lived assets
|
(0.1
|
)
|
(5.5
|
)
|
(0.1
|
)
|
(2.5
|
)
|
(4.3
|
)
|
(65.0
|
)
|
(0.4
|
)
|
(0.9
|
)
|
|||||||||||||||
|
General corporate and other expenses, net
|
(20.1
|
)
|
(17.8
|
)
|
(18.2
|
)
|
(16.5
|
)
|
(18.1
|
)
|
(15.2
|
)
|
(22.4
|
)
|
(16.9
|
)
|
|||||||||||||||
|
Non-operating income (expense)
|
(0.1
|
)
|
1.8
|
|
(54.8
|
)
|
0.6
|
|
0.4
|
|
(4.0
|
)
|
19.6
|
|
0.6
|
|
|||||||||||||||
|
Other-than-temporary investment impairment
|
—
|
|
—
|
|
—
|
|
—
|
|
—
|
|
—
|
|
—
|
|
(14.8
|
)
|
|||||||||||||||
|
Investment income
|
4.2
|
|
4.0
|
|
3.4
|
|
3.5
|
|
4.1
|
|
16.7
|
|
3.1
|
|
4.5
|
|
|||||||||||||||
|
Interest expense, net of capitalized interest
|
(12.6
|
)
|
(14.0
|
)
|
(13.1
|
)
|
(14.4
|
)
|
(10.7
|
)
|
(14.2
|
)
|
(12.9
|
)
|
(14.3
|
)
|
|||||||||||||||
|
Income (loss) from operations before taxes
|
(12.4
|
)
|
(29.7
|
)
|
(48.3
|
)
|
(41.3
|
)
|
39.3
|
|
(80.2
|
)
|
61.1
|
|
(59.8
|
)
|
|||||||||||||||
|
Provision (benefit) for income taxes
|
(1.2
|
)
|
(6.8
|
)
|
(11.1
|
)
|
(8.4
|
)
|
7.9
|
|
(20.9
|
)
|
12.0
|
|
(3.0
|
)
|
|||||||||||||||
|
Income (loss) from continuing operations
|
$
|
(11.2
|
)
|
$
|
(22.9
|
)
|
$
|
(37.2
|
)
|
$
|
(32.9
|
)
|
$
|
31.4
|
|
$
|
(59.3
|
)
|
$
|
49.1
|
|
$
|
(56.8
|
)
|
|||||||
94
Included in “Other operating credits and charges, net” and “(Gain) loss on sale or impairment of long-lived assets” for continuing operations are the following:
In the first quarter of 2012, LP recorded a loss of
$0.3 million
associated with severance related to an indefinitely curtailed OSB mill in British Columbia, Canada as well as a reversal of a
$0.5 million
loss associated with an assessment related to one of its indefinitely curtailed OSB mills.
In the third quarter of 2012, LP recorded a loss of
$1.0 million
related to an increase in product related warranty reserves associated with Canexel products sold in Europe in prior years; a loss of
$4.4 million
related to the impairment of assets associated with an OSB mill in Quebec, Canada, held for sale based upon a change in the plan of their sale to reduce their carrying value to the estimated selling price less selling costs.
In the fourth quarter of
2012
, LP recognized a gain of
$20.0 million
from the settlement of its ARS litigation with Deutsche Bank Securities, Inc.; a loss of
$1.5 million
related to a prior year inventory adjustment; a loss
$3.8 million
consisting of
$2.2 million
related to SERP curtailment associated with the retirement of LP's previous CEO and
$1.6 million
related to termination indemnities in South America; a gain of
$5.0 million
related to a reduction in product related contingency reserves associated with the national hardboard class action settlement; a gain of
$3.6 million
is related to a reduction in hardboard siding trim reserve and a loss of
$0.8 million
for additions to warranty reserves associated with a discontinued line of OSB siding.
In the first quarter of 2011, LP recorded a gain of
$0.8 million
associated with an action against a previous claim inspector associated with LP's hardboard class action for various states.
In the second quarter of 2011, LP recorded a gain of
$1.5 million
related to reductions in reforestation liabilities associated with LP's Canadian timber obligations and an increase of
$0.9 million
in environmental reserves associated with a facility currently held for sale.
In the third quarter of 2011, LP recorded a loss of
$0.4 million
associated with severance related to an indefinitely curtailed OSB mill in British Columbia, Canada. Additionally, LP recorded a gain of
$10.7 million
related to a reduction in product related contingency reserves associated with the national hardboard class action settlement.
In the fourth quarter of 2011, LP recorded an other than temporary impairment of an equity investment of
$14.8 million
.
See Notes 16 and 17 for further discussion on the other operating charges and credits, net and the gains and losses on sale of and impairment of long-lived assets mentioned above.
95
ITEM 9.
Changes in and Disagreements with Accountants on Accounting and Financial Disclosure
None
ITEM 9A.
Controls and Procedures
Evaluation of Disclosure Controls and Procedures
As of
December 31, 2012
, our Chief Executive Officer and Chief Financial Officer carried out, with the participation of the Company’s Disclosure Practices Committee and the Company’s management, an evaluation of the effectiveness of our disclosure controls and procedures, as defined in Rule 13a-15(e) under the Securities Exchange Act (Act). Based upon this evaluation, the Chief Executive Officer and Chief Financial Officer have concluded that the Company’s disclosure controls and procedures are effective to provide reasonable assurance that material information required to be disclosed by us in reports we file under the Act is recorded, processed, summarized and reported within the time periods specified in the SEC rules and forms and that information required to be disclosed by us in the reports we file or submit under the Act is accumulated and communicated to our management, including our Chief Executive Officer and Chief Financial Officer, as appropriate to allow timely decisions regarding required disclosure.
Changes in Internal Control over Financial Reporting
There were no changes in LP’s internal control over financial reporting that occurred during LP’s most recently completed fiscal quarter that have materially affected, or are reasonably likely to materially affect, the Company’s internal control over financial reporting.
Management’s Report on Internal Control Over Financial Reporting
The Company’s management is responsible for establishing and maintaining adequate internal control over financial reporting, as defined in the Exchange Act Rule 13a-15(f). The Company’s management conducted an assessment of the Company’s internal control over financial reporting based on the framework established by the Committee of Sponsoring Organizations of the Treadway Commission in
Internal Control—Integrated Framework.
Based on this assessment, the Company’s management has concluded that, as of December 31, 2012, the Company’s internal control over financial reporting is effective. The Company’s independent registered public accounting firm, Deloitte & Touche LLP, has audited the Company’s consolidated financial statements and has issued an attestation report the Company’s internal control over financial reporting, as stated in their report included herein.
The certifications of LP’s Chief Executive Officer and Chief Financial Officer required under Section 302 of the Sarbanes-Oxley Act have been filed as Exhibits 31.1 and 31.2 to this report. Additionally, in 2012 LP’s Chief Executive Officer certified to the New York Stock Exchange (“NYSE”) that he was not aware of any violation by LP of the NYSE corporate governance listing standards.
96
REPORT OF INDEPENDENT REGISTERED PUBLIC ACCOUNTING FIRM
To the Board of Directors and Stockholders of
Louisiana-Pacific Corporation
We have audited the internal control over financial reporting of Louisiana-Pacific Corporation
and subsidiaries (the "Company") as of December 31, 2012, based on criteria established in
Internal Control - Integrated Framework
issued by the Committee of Sponsoring Organizations of the Treadway Commission. The Company's management is responsible for maintaining effective internal control over financial reporting and for its assessment of the effectiveness of internal control over financial reporting, included in the accompanying
Management's Report on Internal Control over Financial Reporting
. Our responsibility is to express an opinion on the Company's internal control over financial reporting based on our audit.
We conducted our audit in accordance with the standards of the Public Company Accounting Oversight Board (United States). Those standards require that we plan and perform the audit to obtain reasonable assurance about whether effective internal control over financial reporting was maintained in all material respects. Our audit included obtaining an understanding of internal control over financial reporting, assessing the risk that a material weakness exists, testing and evaluating the design and operating effectiveness of internal control based on the assessed risk, and performing such other procedures as we considered necessary in the circumstances. We believe that our audit provides a reasonable basis for our opinion.
A company's internal control over financial reporting is a process designed by, or under the supervision of, the company's principal executive and principal financial officers, or persons performing similar functions, and effected by the company's board of directors, management, and other personnel to provide reasonable assurance regarding the reliability of financial reporting and the preparation of financial statements for external purposes in accordance with generally accepted accounting principles. A company's internal control over financial reporting includes those policies and procedures that (1) pertain to the maintenance of records that, in reasonable detail, accurately and fairly reflect the transactions and dispositions of the assets of the company; (2) provide reasonable assurance that transactions are recorded as necessary to permit preparation of financial statements in accordance with generally accepted accounting principles, and that receipts and expenditures of the company are being made only in accordance with authorizations of management and directors of the company; and (3) provide reasonable assurance regarding prevention or timely detection of unauthorized acquisition, use, or disposition of the company's assets that could have a material effect on the financial statements.
Because of the inherent limitations of internal control over financial reporting, including the possibility of collusion or improper management override of controls, material misstatements due to error or fraud may not be prevented or detected on a timely basis. Also, projections of any evaluation of the effectiveness of the internal control over financial reporting to future periods are subject to the risk that the controls may become inadequate because of changes in conditions, or that the degree of compliance with the policies or procedures may deteriorate.
In our opinion, the Company maintained, in all material respects, effective internal control over financial reporting as of December 31, 2012, based on the criteria established in
Internal Control - Integrated Framework
issued by the Committee of Sponsoring Organizations of the Treadway Commission.
We have also audited, in accordance with the standards of the Public Company Accounting Oversight Board (United States), the consolidated financial statements as of and for the year ended December 31, 2012 of the Company and our report dated
February 28, 2013
expressed an unqualified opinion on those financial statements.
/s/ DELOITTE & TOUCHE LLP
Nashville, Tennessee
February 28, 2013
97
ITEM 10.
Directors and Executive Officers of the Registrant
Information regarding LP’s directors is incorporated herein by reference to the material included under the caption “Item 1—Election of Directors” in the definitive proxy statement to be filed by LP for its 2013 annual meeting of stockholders (the “2013 Proxy Statement”). Information regarding compliance with Section 16(a) of the Securities Exchange Act of 1934 is incorporated herein by reference to the material included under the caption “Section 16(a) Beneficial Ownership Reporting Compliance” in the 2013 Proxy Statement. Information regarding LP’s audit committee is incorporated herein by reference to the material included under the captions “Board and Committee Meetings,” “Finance and Audit Committee” and “Audit Committee Financial Experts” in the 2013 Proxy Statement.
Information regarding each of LP’s executive officers as of
February 28, 2013
, including employment history for the past five years, is set forth below:
|
Name
|
Age
|
Title
|
|
|
Curtis M. Stevens
|
60
|
Chief Executive Officer
|
|
|
Sallie B. Bailey
|
53
|
Executive Vice President, CFO
|
|
|
Richard S. Olszewski
|
56
|
Executive Vice President, Sales and Marketing and South America
|
|
|
Jeffrey N. Wagner
|
58
|
Executive Vice President, OSB
|
|
|
W. Bradley Southern
|
53
|
Senior Vice President, Siding
|
|
|
Brian E. Luoma
|
50
|
Senior Vice President, EWP
|
|
Curtis M. Stevens
has been Chief Executive Officer since May 2012 and was previously Executive Vice President, Chief Operating Officer since December 2011 and Executive Vice President, Administration and Chief Financial Officer from May 2002 to December 2011. He previously served as Vice President, Treasurer and Chief Financial Officer from September 1997 to April 2002.
Sallie B Bailey
has been Executive Vice President, Chief Financial Officer since December 2011. She previously served as Vice President and Chief Financial Officer of Ferro Corporation from 2007 through 2010 and previously Senior Vice President, Finance and Controller of Timken Company.
Richard S. Olszewski
has been Executive Vice President, Sales and Marketing since September 2007. Previously he was Vice President of the Fasson Roll Division, North America, a division of Avery Dennison Corporation.
Jeffrey N. Wagner
has been Executive Vice President of OSB since May 2006 and previously Vice President OSB since November 2004. He served as Vice President, Forest Resources, Supply Management and Logistics from 2003 to 2004. Previously, Mr. Wagner served as Director of Supply Management.
W. Bradley Southern
has been Senior Vice President, Siding since May 2012 and previous Vice President of Specialty Operations since 2004.
Brian E. Luoma
has been Senior Vice President, EWP since May 2012 and previous Vice President of EWP since 2006.
In January 2004, the Board adopted a Code of Ethics applicable to LP’s principal executive officer, principal financial officer and principal accounting officer. The Code of Ethics is disclosed at LP’s website at www.lpcorp.com.
In January 2005, the Board adopted revised charters for the Nominating Committee and the Compensation Committee and also adopted a Code of Business Conduct and Ethics and Corporate Governance Guidelines, each of which is disclosed at LP’s website at www.lpcorp.com.
98
ITEM 11.
Executive Compensation
Information regarding executive compensation is incorporated herein by reference to the material under the captions “Compensation of Executive Officers,” and “Directors’ Compensation,” in the 2013 Proxy Statement.
ITEM 12.
Security Ownership of Certain Beneficial Owners and Management and Related Stockholder Matters
Information regarding security ownership of certain beneficial owners and management and LP’s existing equity compensation plans and arrangements is incorporated herein by reference to the material under the captions “Holders of Common Stock” and “Equity Compensation Plan Information” in the 2013 Proxy Statement.
ITEM 13.
Certain Relationships and Related Transactions, and Director Independence
There are no transactions of the type required to be disclosed by Item 404(a) of Regulation S-K.
Information regarding transactions with related persons and director independence is incorporated herein by reference to the material under the captions “Nominees,” “Continuing Directors,” “ Principles of Corporate Governance,” “Audit Committee Financial Experts” and “Related Person Transactions” in the 2013 Proxy Statement.
ITEM 14.
Principal Accountant Fees and Services
Information regarding fees and services provided by LP’s principal accountant and the LP Audit Committee’s pre-approval policies and procedures relating thereto is incorporated herein by reference to the material under the caption “Pre-Approval of Audit and Permissible Non-Audit Services of Independent Auditor” in the 2013 Proxy Statement. In November 2006, the Board adopted a revised charter for the Audit Committee which is disclosed at LP’s website at www.lpcorp.com.
99
ITEM 15.
Exhibits and Financial Statement Schedules
A. Financial Statements and Financial Statement Schedules
The following financial statements of LP are included in this report:
Consolidated Balance Sheets—
December 31, 2012
, and
2011
.
Consolidated Statements of Income—years ended
December 31, 2012
,
2011
, and
2010
.
Consolidated Statements of Comprehensive Income—years ended
December 31, 2012
,
2011
and
2010
.
Consolidated Statements of Cash Flows—years ended
December 31, 2012
,
2011
,
2010
.
Consolidated Statements of Stockholders’ Equity—years ended
December 31, 2012
,
2011
and
2010
.
Notes to the Financial Statements.
Report of Independent Registered Public Accounting Firm.
Interim Financial Results (unaudited).
No other financial statement schedules are required to be filed.
B. Exhibits
The exhibits filed as part of this report or incorporated by reference herein are listed in the accompanying exhibit index. Each management contract or compensatory plan or arrangement is identified by an asterisk (*).
100
SIGNATURES
Pursuant to the requirements of Section 13 or 15(d) of the Securities Exchange Act of 1934, Louisiana-Pacific Corporation, a Delaware corporation (the “registrant”), has duly caused this report to be signed on its behalf by the undersigned, thereunto duly authorized.
|
Date:
|
February 28, 2013
|
LOUISIANA-PACIFIC CORPORATION
(Registrant)
|
|
/s/ SALLIE B. BAILEY
|
||
|
Sallie B. Bailey
Executive Vice President and
Chief Financial Officer
|
||
Pursuant to the requirements of the Securities Exchange Act of 1934, this report has been signed below by the following persons on behalf of the registrant and in the capacities and on the dates indicated.
|
Date
|
|
Signature and Title
|
|
February 28, 2013
|
/s/ CURTIS M. STEVENS
|
|
|
Curtis M. Stevens
Chief Executive Officer, Director
(Principal Executive Officer)
|
||
|
February 28, 2013
|
/s/ SALLIE B. BAILEY
|
|
|
Sallie B Bailey
Executive Vice President and Chief Financial Officer
(Principal Financial Officer)
|
||
|
February 28, 2013
|
/s/ R
EBECCA
A. B
ARCKLEY
|
|
|
Rebecca A. Barckley
Controller, Financial Reporting
(Principal Accounting Officer)
|
||
|
February 28, 2013
|
/s/ E. G
ARY
C
OOK
|
|
|
E. Gary Cook
Chairman of the Board
|
||
|
February 28, 2013
|
/s/ C
OLIN
D.W
ATSON
|
|
|
Colin D.Watson
Director
|
||
|
February 28, 2013
|
/s/ A
RCHIE
W. D
UNHAM
|
|
|
Archie W. Dunham
Director
|
||
|
February 28, 2013
|
/s/ L
IZANNE
C. G
OTTUNG
|
|
|
Lizanne C. Gottung
Director
|
||
|
February 28, 2013
|
/s/ D
USTAN
E. M
C
C
OY
|
|
|
Dustan E. McCoy
Director
|
||
|
February 28, 2013
|
/s/ D
ANIEL
K. F
RIERSON
|
|
|
Daniel K. Frierson
Director
|
||
|
February 28, 2013
|
/s/ K
URT
M. L
ANDGRAF
|
|
|
Kurt M. Landgraf
Director
|
||
|
February 28, 2013
|
/s/ J
OHN
W. W
EAVER
|
|
|
John W. Weaver
Director
|
||
101
EXHIBIT INDEX
On written request, Louisiana-Pacific Corporation (LP) will furnish to any record holder or beneficial holder of its common stock any exhibit to this report upon the payment of a fee equal to LP’s costs of copying such exhibit plus postage. Any such request should be sent to: Louisiana-Pacific Corporation, 414 Union Street, Suite 2000, Nashville, TN 37219.
Items identified with an asterisk (*) are management contracts or compensatory plans or arrangements. Each prior LP filing which contains an exhibit incorporated by reference herein is filed under SEC File No. 001-07107.
|
3.1
|
|
Restated Certificate of Incorporation of LP. Incorporated herein by reference to Exhibit 3.1 to LP’s Annual Report on Form 10-K for the year ended December 31, 2007.
|
|
3.1 (a)
|
|
Amended Certificate of Designation of Series A Junior Participating Cumulative Preferred Stock. Incorporated herein by reference to Exhibit 3.3 to LP’s Quarterly Report on Form 10-Q for the quarter ended June 30, 2009.
|
|
3.2
|
|
Bylaws of LP, as amended and restated effective November 5, 2010. Incorporated herein by reference to Exhibit 3.2 to LP’s Current Report on Form 8-K dated November 4, 2010.
|
|
4.1
|
|
Rights Agreement, dated as of May 23, 2008, between LP and Computershare Trust Company, N.A., as Rights Agent, including the form of Right Certificate as Exhibit A and the Summary of Rights to Purchase Preferred Shares as Exhibit B. Incorporated herein by reference to Exhibit 4.1 to LP’s Registration Statement on Form 8-A filed June 17, 2008.
|
|
4.2
|
|
Warrant Agreement, dated as of March 10, 2009, between Louisiana-Pacific Corporation and Computershare Trust Company, N.A., as warrant agent. Incorporated herein by reference to
Exhibit 4.4 to LP’s Current Report on Form 8-K dated March 10, 2009.
|
|
10.1(a)
|
|
Loan and Security Agreement, dated March 10, 2009, among Louisiana-Pacific Corporation, and its subsidiaries, GreenStone Industries, Inc., Ketchikan Pulp Company, Louisiana-Pacific International, Inc., LPS Corporation, 3047525 Nova Scotia Company, 3047526 Nova Scotia Company, Louisiana-Pacific Limited Partnership, Louisiana-Pacific Canada Ltd., Louisiana-Pacific (OSB) Ltd., Louisiana-Pacific Canada Pulp Co. and Louisiana-Pacific Canada Sales ULC and Bank of America, N.A. Portions of this Exhibit have been omitted pursuant to a request for confidential treatment. The confidential portions have been furnished to the SEC. Incorporated herein by reference to 10.1(a) to LP’s Form 10-K for the year ended December 31, 2009.
|
|
10.1(b)
|
|
First Amendment to Loan and Security Agreement, dated June 8, 2009, among Louisiana-Pacific Corporation, and its subsidiaries, GreenStone Industries, Inc., Ketchikan Pulp Company, Louisiana-Pacific International, Inc., LPS Corporation, 3047525 Nova Scotia Company, 3047526 Nova Scotia Company, Louisiana-Pacific Limited Partnership, Louisiana-Pacific Canada Ltd., Louisiana-Pacific (OSB) Ltd., Louisiana-Pacific Canada Pulp Co. and Louisiana-Pacific Canada Sales ULC and Bank of America, N.A. Incorporated herein by reference to 10.1(b) to LP’s Form 10-K for the year ended December 31, 2009.
|
|
10.1(c)
|
|
Second Amendment of the Loan and Security Agreement, dated January 27, 2010, among the Company, and its subsidiaries, GreenStone Industries, Inc., Ketchikan Pulp Company, Louisiana-Pacific International, Inc., LPS Corporation, 3047525 Nova Scotia Company, 3047526 Nova Scotia Company, Louisiana-Pacific Limited Partnership, Louisiana-Pacific Canada Ltd., Louisiana-Pacific (OSB) Ltd., Louisiana-Pacific Canada Pulp Co. and Louisiana-Pacific Canada Sales ULC and Bank of America, N.A. Incorporated herein by reference to 10.1(c) to LP’s Form 10-K for the year ended December 31, 2009.
|
|
10.1(d)
|
|
Third Amendment to Loan and Security Agreement, dated November 5, 2010, among the Company, and its subsidiaries, GreenStone Industries, Inc., Ketchikan Pulp Company, Louisiana-Pacific International, Inc., LPS Corporation, 3047525 Nova Scotia Company, 3047526 Nova Scotia Company, Louisiana-Pacific Limited Partnership, Louisiana-Pacific Canada Ltd., Louisiana-Pacific (OSB) Ltd., Louisiana-Pacific Canada Pulp Co. and Louisiana-Pacific Canada Sales ULC and Bank of America, N.A.. Incorporated by reference to 10.1 to LP’s Current Report on Form 8-K dated November 4, 2010.
|
102
|
10.1(e)
|
Fourth Amendment to Loan and Security Agreement, dated October 14, 2011, among the Company, and its subsidiaries, GreenStone Industries, Inc., Ketchikan Pulp Company, Louisiana-Pacific International, Inc., LPS Corporation, 3047525 Nova Scotia Company, 3047526 Nova Scotia Company, Louisiana-Pacific Limited Partnership, Louisiana-Pacific Canada Ltd., Louisiana-Pacific (OSB) Ltd., Louisiana-Pacific Canada Pulp Co. and Louisiana-Pacific Canada Sales ULC and Bank of America, N.A. Incorporated by reference to 10.1 to LP's Current Report on Form 8-K dated October 18, 2011.
|
|
|
10.1(f)
|
Sixth Amendment to Loan and Security Agreement, dated July 6, 2012, among the Company, and its subsidiaries, GreenStone Industries, Inc., Ketchikan Pulp Company, Louisiana-Pacific International, Inc., LPS Corporation, 3047525 Nova Scotia Company, 3047526 Nova Scotia Company, Louisiana-Pacific Limited Partnership, Louisiana-Pacific Canada Ltd., Louisiana-Pacific (OSB) Ltd., Louisiana-Pacific Canada Pulp Co. and Louisiana-Pacific Canada Sales ULC and Bank of America, N.A. Incorporated by reference to 10.1 to LP's Current Report on Form 8-K dated July 11, 2012.
|
|
|
10.2
|
|
Canadian Security Agreement, dated March 10, 2009, among Louisiana-Pacific Corporation, 3047525 Nova Scotia Company, 3047526 Nova Scotia Company, Louisiana-Pacific Limited Partnership, Louisiana-Pacific Canada Ltd., Louisiana-Pacific (OSB) Ltd., Louisiana-Pacific Canada Pulp Co. and Louisiana-Pacific Canada Sales ULC and Bank of America, N.A. Incorporated herein by reference to Exhibit 10.2 to LP’s Current Report on Form 8-K dated March 10, 2009.
|
|
10.3
|
Indenture, dated as of May 21, 2012, between Louisiana-Pacific Corporation and The Bank of New York Mellon Trust Company, N.A., as trustee. Incorporated herein by reference to Exhibit10.3 to LP's Current Report on Form 8-K dated May 21, 2012. *
|
|
|
10.4
|
|
Note Purchase Agreement, dated June 30, 1998, among LP, LP SPV2, LLC and the Purchasers named therein. Incorporated herein by reference to Exhibit 4 to LP’s Quarterly Report on Form 10-Q for the quarter ended June 30, 1998.
|
|
10.5
|
|
Undertaking Letter between Phemus Corporation and LP, dated July 2, 2003. Incorporated herein by reference to Exhibit 10.22 to LP’s Quarterly Report on Form 10-Q for the quarter ended June 30, 2003.
|
|
10.6(a)
|
|
Settlement Agreement, dated May 3, 2000, among ABT Building Products Corporation, ABTco, Inc., Abitibi-Price Corporation, attorneys representing plaintiffs in hard board siding class action litigation and the other parties named therein. Incorporated herein by reference to Exhibit 10.2 to LP’s Quarterly Report on Form 10-Q for the quarter ended March 30, 2000.
|
|
10.6(b)
|
Settlement Agreement, dated November 30, 2012, between Duetsche Bank Securities, Inc. and LP. Incorporated herein by reference to Exhibit 10.6(b) to LP’s Current Report on Form 8-K dated December 3, 2012.
|
|
|
10.7
|
|
1992 Non-Employee Director Stock Option Plan (as amended and restated as of May 8, 2009). Incorporated herein by reference to Exhibit 10.10 to LP’s Quarterly Report on Form 10-Q for the fiscal quarter ended June 30, 2009. *
|
|
10.8
|
|
2000 Non-Employee Director Restricted Stock Plan Effective May 1, 2000 (as amended and restated as of May 8, 2009). Incorporated herein by reference to Exhibit 10.15 to LP’s Quarterly Report on Form 10-Q for the fiscal quarter ended June 30, 2009. *
|
|
10.9
|
|
1997 Incentive Stock Award Plan, as amended and restated effective May 7, 2009. Incorporated herein by reference to Appendix A B to LP’s Proxy Statement dated March 23, 2009. *
|
|
10.9(a)
|
|
Form of Award Agreement under the 1997 Incentive Stock Award Plan for Non-Qualified Stock Options. Incorporated herein by reference to Exhibit 10.1 to LP’s Current Report on Form 8-K dated February 4, 2005. *
|
|
10.9(b)
|
|
General Form of Award Agreement under the 1997 Incentive Stock Award Plan for Incentive Shares. Incorporated herein by reference to Exhibit 10.3 to LP Current Report on Form 8-K dated February 4, 2005. *
|
103
|
10.9(c)
|
|
Form of Award Agreement for Richard W. Frost under the 1997 Incentive Stock Award Plan for Incentive Shares. Incorporated herein by reference to Exhibit 10.11(e) to LP’s Current Report on Form 8-K dated February 4, 2010.*
|
|
10.9 (d)
|
|
Form of Award Agreement under the 1997 Incentive Stock Award Plan for Restricted Stock. Incorporated herein by reference to Exhibit 10.11(c) to LP’s Annual Report on Form 10-K for the fiscal year ended December 31, 2007.*
|
|
10.9(e)
|
|
Form of Award Agreement under the 1997 Incentive Stock Award Plan for Stock Settled Stock Appreciation Rights. Incorporated herein by reference to Exhibit 10.11(d) to LP’s Annual Report on Form 10-K for the fiscal year ended December 31, 2007.*
|
|
10.9(f)
|
|
Form of Award Agreement for Richard W. Frost under the 1997 Incentive Stock Award Plan for Stock Settled Stock Appreciation Rights. Incorporated herein by reference to Exhibit 10.11(f) to LP’s Current Report on Form 8-K dated February 4, 2010.*
|
|
10.10
|
|
Annual Cash Incentive Award Plan, as amended and restated as of February 12, 2009. Incorporated herein by reference to Appendix B to LP’s Proxy Statement dated March 23, 2009. *
|
|
10.11
|
|
Performance Share Award Agreement LP and Curtis M. Stevens
|
|
10.12
|
|
Form of Change of Control Employment Agreement between LP and each of Richard W. Frost, Curtis M. Stevens, Richard S. Olszeski and Mr. Jeffrey M. Wagner. Incorporated herein by reference to Exhibit 10.1 to LP’s Current Report on Form 8-K. *
|
|
10.13
|
|
Change of Control Employment Agreement between LP and Sallie B. Bailey.
|
|
10.14
|
2004 Executive Deferred Compensation Plan, amended and restated effective January 1, 2009. Incorporated herein by reference to Exhibit 10.13 to LP's Quarterly Report on Form 10-Q dated July 29, 2011. *
|
|
|
10.15
|
2008 Supplemental Executive Retirement Plan, amended and restated effective January 1, 2008. Incorporated herein by reference to Exhibit 10.14 to LP's Quarterly Report on Form 10-Q dated July 29, 2011. *
|
|
|
10.16
|
|
2011 Non-Employee Director Phantom Share Plan effective May 15, 2011. Incorporated herein by reference to Exhibit 10.15 to LP's Quarterly Report on Form 10-Q dated July 29, 2011. *
|
|
21
|
|
List of LP’s subsidiaries. Incorporated by reference to Exhibit 21 to LP’s Annual Report on Form 10-K for the fiscal year ended December 31, 2004.
|
|
23
|
|
Consent of Deloitte & Touche LLP.
|
|
31.1
|
|
Certification of Chief Executive Officer Pursuant to Rule 13a-14(a).
|
|
31.2
|
|
Certification of Chief Financial Officer Pursuant to Rule 13a-14(a).
|
|
32.1
|
|
Certifications pursuant to §906 of the Sarbanes-Oxley Act of 2002.
|
LP hereby agrees to furnish supplementally to the SEC upon its request any schedules and similar documents omitted pursuant to Item 601(b)(2) of Regulation S-K and any instruments omitted pursuant to Item 601(b)(4)(iii) of Regulation S-K.
104
TABLE OF CONTENTS
Part IItem 1. BusinessItem 1A. Risk FactorsItem 1B. Unresolved Staff CommentsItem 2. PropertiesItem 3. Legal ProceedingsItem 4. Mine Safety DisclosuresPart IIItem 5. Market For Registrant S Common Equity, Related Stockholder Matters and Issuer Purchases Of Equity SecuritiesItem 6. Selected Financial DataItem 7. Management S Discussion and Analysis Of Financial Condition and Results Of OperationsItem 7A. Quantitative and Qualitative Disclosures About Market RiskItem 8. Financial Statements and Supplementary DataItem 9. Changes in and Disagreements with Accountants on Accounting and Financial DisclosureItem 9A. Controls and ProceduresPart IIIItem 10. Directors and Executive Officers Of The RegistrantItem 11. Executive CompensationItem 12. Security Ownership Of Certain Beneficial Owners and Management and Related Stockholder MattersItem 13. Certain Relationships and Related Transactions, and Director IndependenceItem 14. Principal Accountant Fees and ServicesPart IVItem 15. Exhibits and Financial Statement Schedules