LOUISIANA-PACIFIC CORP
10-Ks and 10-Qs
|
|
|
|
|
|
|
|
|
|
|
|
|
|
|
|
|
|
|
|
|
|
|
|
|
|
|
|
|
|
|
|
|
|
|
|
|
|
|
|
|
|
|
|
|
|
|
|
|
|
|
|
|
|
|
|
UNITED STATES
SECURITIES AND EXCHANGE COMMISSION
Washington, D.C. 20549
_____________________________
FORM 10-K
Annual Report Pursuant to Section 13 or 15(d)
of the Securities Exchange Act of 1934
|
For the fiscal year ended
|
|
Commission File Number
|
|
December 31, 2018
|
1-7107
|
|
_____________________________
Louisiana-Pacific Corporation
(Exact name of registrant as specified in its charter)
|
Delaware
|
|
93-0609074
|
|
(State of Incorporation)
|
|
(I.R.S. Employer
Identification No.)
|
|
414 Union Street
Nashville, TN 37219
|
|
615-986-5600
|
|
(Address of principal executive offices)
|
|
Registrant’s telephone number
(including area code)
|
Securities registered pursuant to Section 12(b) of the Act:
|
Title of Each Class
|
|
Name of Each Exchange on Which Registered
|
|
Common Stock, $1 par value
|
|
New York Stock Exchange
|
Securities registered pursuant to Section 12(g) of the Act: None
_____________________________
Indicate by check mark if the registrant is a well-known seasoned issuer as defined in Rule 405 of the Securities Act. Yes
ý
No
¨
Indicate by check mark if the registrant is not required to file reports pursuant to Section 13 or Section 15(d) of the Act. Yes
¨
No
ý
Indicate by check mark whether the registrant (1) has filed all reports required to be filed by Section 13 or 15(d) of the Securities Exchange Act of 1934 during the preceding 12 months (or for such shorter period that the registrant was required to file such reports), and (2) has been subject to such filing requirements for the past 90 days. Yes
ý
No
¨
Indicate by check mark whether the registrant has submitted electronically every Interactive Data File required to be submitted pursuant to Rule 405 of Regulation S-T (§ 232.405 of this chapter) during the preceding 12 months (or for such shorter period that the registrant was required to submit such files). Yes
ý
No
¨
Indicate by check mark if disclosure of delinquent filers pursuant to Item 405 of Regulation S-K is not contained herein, and will not be contained, to the best of registrant’s knowledge, in definitive proxy or information statements incorporated by reference in Part III of this Form 10-K or any amendment to this Form 10-K.
ý
Indicate by check mark whether the registrant is a large accelerated filer, an accelerated filer, a non-accelerated filer, smaller reporting company, or an emerging growth company. See the definitions of “large accelerated filer,” “accelerated filer,” “smaller reporting company,” and “emerging growth company” in Rule 12b-2 of the Exchange Act.
|
Large accelerated filer
|
x
|
Accelerated filer
|
o
|
|
Non-accelerated filer
|
o
|
Smaller reporting company
|
o
|
|
Emerging growth company
|
o
|
||
If an emerging growth company, indicate by check mark if the registrant has elected not to use the extended transition period for complying with any new or revised financial accounting standards provided pursuant to Section 13(a) of the Exchange Act.
o
Indicate by check mark whether the registrant is a shell company (as defined in Rule 12b-2 of the Exchange Act): Yes
¨
No
ý
State the aggregate market value of the voting and non-voting common equity held by non-affiliates computed by reference to the price at which the common equity was sold, or the average bid and asked price of such common equity, as of the last business day of the registrant’s most recently completed second fiscal quarter:
$3,916,810,009
.
Indicate the number of shares outstanding of each of the registrant’s classes of common stock as of the latest practicable date:
135,393,187
shares of Common Stock, $1 par value, outstanding as of February 12, 2019.
Documents Incorporated by Reference
Definitive Proxy Statement for 2019 Annual Meeting: Part III
Except as otherwise specified and unless the context otherwise requires, references to “LP”, the “Company”, “we”, “us”, and “our” refer to Louisiana-Pacific Corporation and its subsidiaries.
ABOUT FORWARD-LOOKING STATEMENTS
Section 27A of the Securities Act of 1933 and Section 21E of the Securities Exchange Act of 1934 provide a “safe harbor” for forward-looking statements to encourage companies to provide prospective information about their businesses and other matters as long as those statements are identified as forward-looking and are accompanied by meaningful cautionary statements identifying important factors that could cause actual results to differ materially from those discussed in the statements. This report contains, and other reports and documents filed by us with the Securities and Exchange Commission (SEC) may contain, forward-looking statements. These statements are or will be based upon the beliefs and assumptions of, and on information available to, our management.
The following statements are or may constitute forward-looking statements: (1) statements preceded by, followed by or that include words like “may,” “will,” “could,” “should,” “believe,” “expect,” “anticipate,” “intend,” “plan,” “estimate,” “potential,” “continue” or “future” or the negative or other variations thereof and (2) other statements regarding matters that are not historical facts, including without limitation, plans for product development, forecasts of future costs and expenditures, possible outcomes of legal proceedings, capacity expansion and other growth initiatives and the adequacy of reserves for loss contingencies.
Factors that could cause actual results to differ materially from those expressed or implied by the forward-looking statements include, but are not limited to the following:
|
•
|
changes in governmental fiscal and monetary policies, including tariffs, and levels of employment;
|
|
•
|
changes in general economic conditions;
|
|
•
|
changes in the cost and availability of capital;
|
|
•
|
changes in the level of home construction and repair activity;
|
|
•
|
changes in competitive conditions and prices for our products;
|
|
•
|
changes in the relationship between supply of and demand for building products;
|
|
•
|
changes in the relationship between supply of and demand for raw materials, including wood fiber and resins, used in manufacturing our products;
|
|
•
|
changes in the cost of and availability of energy, primarily natural gas, electricity and diesel fuel;
|
|
•
|
changes in the cost of and availability of transportation;
|
|
•
|
changes in other significant operating expenses;
|
|
•
|
changes in exchange rates between the U.S. dollar and other currencies, particularly the Canadian dollar, Brazilian
real
and Chilean
peso
;
|
|
•
|
changes in general and industry-specific environmental laws and regulations;
|
|
•
|
changes in tax laws, and interpretations thereof;
|
|
•
|
changes in circumstances giving rise to environmental liabilities or expenditures;
|
|
•
|
the resolution of existing and future product-related litigation and other legal proceedings; and
|
|
•
|
acts of public authorities, war, civil unrest, natural disasters, fire, floods, earthquakes, inclement weather and other matters beyond our control.
|
In addition to the foregoing and any risks and uncertainties specifically identified in the text surrounding forward-looking statements, any statements in the reports and other documents filed by us with the SEC that warn of risks or uncertainties associated with future results, events or circumstances identify important factors that could cause actual results, events and circumstances to differ materially from those reflected in the forward-looking statements.
ABOUT THIRD-PARTY INFORMATION
In this report, we rely on and refer to information regarding industry data obtained from market research, publicly available information, industry publications, U.S. government sources and other third parties. Although we believe the information is reliable, we cannot guarantee the accuracy or completeness of the information and have not independently verified it.
1
TABLE OF CONTENTS
|
PART I
|
||
|
Item 1
|
||
|
Item 1A
|
||
|
Item 1B
|
||
|
Item 2
|
||
|
Item 3
|
||
|
Item 4
|
||
|
PART II
|
||
|
Item 5
|
||
|
Item 6
|
||
|
Item 7
|
||
|
Item 7A
|
||
|
Item 8
|
||
|
Item 9A
|
||
|
Item 9B
|
||
|
PART III
|
|
|
|
Item 10*
|
||
|
Item 11*
|
||
|
Item 12*
|
||
|
Item 13*
|
||
|
Item 14*
|
||
|
|
||
|
PART IV
|
|
|
|
Item 15
|
||
|
Item 16
|
FORM 10K SUMMARY
|
|
|
*
|
All or a portion of the referenced section is incorporated by reference from our definitive proxy statement that will be issued in connection with the upcoming 2019 Annual Meeting of Stockholders.
|
|
2
PART I
ITEM 1.
Business
General
We are a leading provider of high-performance building solutions. We design, manufacture and market a broad range of products for the new home construction, repair and remodeling and outdoor structures markets. We have leveraged our expertise to become an industry leader known for innovation, quality and reliability. Our products and services are sold to retail, wholesale, homebuilding and industrial customers. The Company was founded in 1973 and headquartered in Nashville, Tennessee.
Shown in the table below are our four business segments.
|
Segment
|
Net Sales
(in millions)
|
Percentage of 2018 Net Sales
|
|||
|
Siding
|
$
|
942.3
|
|
33.3
|
%
|
|
Oriented Strand Board (OSB)
|
1,305.2
|
|
46.2
|
%
|
|
|
Engineered Wood Products (EWP)
|
390.9
|
|
13.8
|
%
|
|
|
South America
|
160.8
|
|
5.7
|
%
|
|
|
Other
|
28.8
|
|
1.0
|
%
|
|
|
$
|
2,828.0
|
|
|||
Our Business Segments
Siding
Our Siding segment consists of LP SmartSide® Strand and Fiber trim and siding, LP CanExel® prefinished siding, as well as LP Outdoor Building Solutions® innovative products for premium outdoor buildings. Our SmartSide® products consist of a full line of wood-based sidings, trim, soffit and fascia. These products have quality and performance characteristics similar to solid wood at more attractive prices due to lower raw material and production costs. Our CanExel® siding and accessory product offerings include a number of pre-finished lap and trim products in a variety of patterns and textures. These products are used in new construction, repair and remodeling and outdoor structures such as sheds. We believe we are the largest producer of engineered wood siding. We believe we operate in diverse end markets with stable pricing.
We drive product innovation by utilizing our technological expertise in wood and wood composites to better address the needs of our customers. We intend to increase our product offerings and production capacity of higher margin, value-added products through the addition of lower cost plants or the conversion of OSB plants from commodity structural panel production to exterior siding products.
Additionally, some amounts of OSB are produced and sold in this segment.
OSB
Our OSB segment manufactures and distributes OSB structural panel products including LP OSB, LP TechShield® radiant barrier, LP TopNotch® sub-flooring, LP Legacy® super tough, moisture-resistant sub-flooring and LP FlameBlock® fire-rated sheathing.
OSB is an innovative, affordable and environmentally friendly product made from wood strands arranged in layers and bonded with resin. OSB serves many of the same uses as plywood, including roof decking, sidewall sheathing and floor underlayment, but can be produced at a significantly lower cost. It is estimated for
2018
that OSB accounted for approximately
66%
of the structural panel consumption in North America with plywood accounting
3
for the remainder. We estimate that the overall North American structural panel market (based upon
2018
housing starts) was
35.6 billion
square feet with the OSB market comprising an estimated
23.4 billion
square feet of this market. Based upon our production in
2018
of
4.5 billion
square feet (including OSB produced in our siding and EWP segments), we estimate that we account for
19%
of the North American OSB market and
13%
of the overall North American structural panel market. During
2018
, our volume percentage of value-added OSB was
38%
as compared to
36%
in 2017. We believe we are a leading producer of commodity and value-added OSB in North America and are positioned to compete in all geographic markets.
To enhance our industry leading position in the OSB business, we plan to: (1) leverage our expertise in OSB to capitalize on new opportunities for revenue growth through value-added product lines; (2) deliver superior quality and service; (3) reduce costs and improve throughput and recovery by continuing to focus on efficiency, raw materials cost reductions and logistics; and (4) manage our capacity to meet our customers' expected needs for OSB.
Engineered Wood Products
Our EWP segment is comprised of LP SolidStart® I-Joist (IJ), Laminated Veneer Lumber (LVL) and Laminated Strand Lumber (LSL) and other related products. This segment also includes the sale of I-Joist produced by our joint venture with Resolute Forest Products and LVL sold under a contract manufacturing arrangement. We believe that in North America, we are one of the top three producers (including our joint venture production) of I-Joists, LVL and LSL. A plywood mill associated with our LVL operations in British Columbia and minor amounts of OSB are also included in this segment. We believe that our engineered I-joists, which are used primarily in residential and commercial flooring and roofing systems and other structural applications, are stronger, lighter and straighter than conventional lumber joists. Our LVL and LSL are high-grade, value-added structural products used in applications where extra strength and quality is required, such as headers and beams.
Our strategy is to strengthen our brand recognition in the EWP market by growing our distribution and dealer network through providing superior technical support and leveraging our sales and marketing relationships to cross-sell our EWP products. Additionally, we are seeking to drive costs down by reducing selling, general and administrative costs in the business and improve operating efficiencies in our manufacturing facilities.
South America
Our South American segment manufactures and distributes OSB and siding products in South America and certain export markets. This segment also distributes and sells related products to augment the transition to wood frame construction. We believe we are the only producer of OSB and siding in South America. We believe we are positioned to capitalize on the growing demand for wood-based residential construction in South America.
Our Business Strategy
Continue to Grow Our Siding Segment and Expand Internationally in Order to Diversify Revenue Mix.
We believe that we are currently the leading producer of treated engineered wood siding and, therefore, are poised to benefit from demand growth as it continues to displace alternative siding materials such as vinyl, wood, fiber cement and other materials. Furthermore, this segment is less sensitive to new housing market cyclicality as over 50% of its demand comes from other markets including sheds, retail and the repair and remodeling end market. Our investments in South America will help us continue to satisfy the growing demand for structural panels in South America to support the growth of affordable housing. This growth in the Siding and South American segments will continue to diversify our revenue mix.
Generate Value Added Sales Growth through Customer Focus and Innovation.
Our marketing efforts target builders, repair and remodel contractors, industrial manufacturers and major home improvement retailers and focus on the features of our products. Our sales efforts target customers by channel and focus on providing these customers with quality service and a broad array of traditional and specialty building products. We continue to grow our high value-add products to provide growing stable margins. Our facilities are strategically located in the United States, Canada and South America, allowing us to be closer to our customers and more responsive to end-user needs
4
and trends. We prioritize quality service and continue to enhance our reputation for accurate deliveries on a timely basis. In addition, we continually seek to identify new specialty building solutions and markets where we can utilize our core competencies in the design, manufacturing and marketing of building products.
Continue to Grow Market Share and Capitalize on Strength in New Home Construction.
We continue to strategically invest in our operations with the goal of maximizing profitability as the new home construction and repair and remodeling markets continue to strengthen. We believe the initiatives implemented and investments we have made during the past few years, and which we continue to make, have strengthened our market position and enhanced our ability to capture significant cash flow growth from continued improvement in the end markets we serve. We have also focused our sales and marketing efforts with the purpose of generating more sales of our products per housing start.
Improve Operating Efficiencies and Continue Focus on Cost Reductions and Portfolio Optimization.
We have improved and continue to lower the cost structure of our facilities through our Overall Equipment Effectiveness (OEE) programs and investing in technology. Our OEE programs continue to produce excellent returns from efficiency projects across our manufacturing organization. We have also structured our management teams along product lines to enhance our ability to implement manufacturing best practices across operations. Given these initiatives and the strategic locations of many of our facilities, we believe that we are one of the lowest average delivered-cost producers of OSB in North America. We also employ a strategy of curtailing production at selected facilities, when appropriate, in order to meet customer demand and optimize our portfolio and margins. As market conditions continue to change, we plan to adapt our product mix, selectively invest in new technologies that modernize our manufacturing facilities and develop improved manufacturing processes in order to enhance the quality and consistency of our earnings.
Pursue Selected Strategic Transactions.
We evaluate on an ongoing basis various opportunities to participate in acquisitions of assets, businesses and activities that are complementary, and other strategic business combination transactions. We believe that our pursuit of these opportunities, if successful, could enable us to increase the size and scope of our businesses or joint ventures.
Our Market
Our sales and marketing efforts are primarily focused on traditional distribution, professional building products dealers, home centers, third-party wholesale buying groups and other retailers. The wholesale distribution channel includes a variety of specialized and broad-line wholesale distributors and dealers focused primarily on the supply of products for use by professional builders and contractors. The retail distribution channel includes large retail chains catering to the do-it-yourself (DIY) and repair and remodeling markets as well as smaller independent retailers.
Our Customers
We seek to maintain a broad customer base and a balanced approach to national distribution through both wholesale and retail channels. In
2018
, our top ten customers accounted for approximately
44%
of our sales. Our principal customers include the following:
|
•
|
Wholesale distribution companies, which supply building materials to retailers on a regional, state or local basis;
|
|
•
|
Distributors, who provide building materials to smaller retailers, contractors and others;
|
|
•
|
Building materials professional dealers, that specialize in sales to professional builders, remodeling firms and trade contractors that are involved in residential home construction and light commercial building;
|
|
•
|
Retail home centers, that provide access to consumer markets with a broad selection of home improvement materials and increasingly serve professional builders, remodelers DIY, and trade contractors; and
|
|
•
|
Shed producers, who design, construct and distribute prefabricated residential and light commercial structures, including fully manufactured, modular and panelized structures, for consumer and professional markets.
|
5
Seasonality
Our business is subject to seasonal variances, with demand for many of our products tending to be greater during the building season, which generally occurs in the second and third quarters in North America and the fourth and first quarters in South America. From time to time, we engage in promotional activities designed to stimulate demand for our products, such as reducing our selling prices and providing extended payment terms, particularly at times when demand is otherwise relatively soft. We do this in an effort to better balance our inventory levels with demand, manage the logistics of our product shipments, allow our production facilities to run efficiently, be competitive and/or obtain initial orders from customers.
Our Competitors / Competition
The building products industry is highly competitive. We compete internationally with several thousand forest and building products firms, ranging from very large, fully integrated firms to smaller enterprises that may manufacture only one or a few items. We also compete less directly with firms that manufacture substitutes for wood building products. Some competitors have substantially greater financial and other resources than we do that could, in some instances, give them a competitive advantage over us.
In terms of our commodity OSB, we compete based upon price, quality and availability of products. In terms of our specialty products, including EWP, Siding and various value-added OSB products, we compete based upon price, quality, and availability of products as well as performance features offered.
Our Manufacturing
We operate manufacturing facilities throughout North and South America and utilize the best available manufacturing techniques based on the needs of our businesses, including the use of OEE, a disciplined, data-driven approach and methodology to improve the productivity of our operations. We currently operate 20 modern, strategically located facilities in the U.S. and Canada, three facilities in Chile and one facility in Brazil. We also operate facilities through a joint venture, for which we are the exclusive provider of product distribution for North America.
Strategic Sourcing
We rely on various suppliers to furnish the raw materials and inputs used in the manufacturing of our products. To maximize our buying effectiveness in the marketplace, we have a central strategic sourcing group that consolidates purchases of certain materials and indirect items across business segments. The goal of the strategic sourcing group is to develop global strategies for a given component group, identify suppliers that meet our business requirements and develop long-term relationships with these vendors. By developing these strategies and relationships, we seek to leverage our material needs to implement leading practices, reduce costs, improve process efficiencies and improve operating performance.
Raw Materials
Wood fiber is the primary raw material used in most of our operations, and the primary source of wood fiber is timber. The primary end-markets for timber harvested in the North America are manufacturers who supply: (1) the housing market, where it is used in the construction of new housing and the repair and remodeling of existing housing; (2) the pulp and paper market; (3) commercial and industrial markets; (4) export markets; and (5) emerging biomass energy production markets. The supply of timber is limited by the availability of timberlands and access to the fiber. The availability of timberlands, in turn, is limited by several factors, including forest management policies, alternate uses of land, and loss to urban or suburban real estate development. Because wood fiber is subject to commodity pricing, the cost of various types of timber that we purchase in the market has at times fluctuated greatly due to weather, governmental regulations / restrictions, economic or other industry conditions. However, our mills are generally in close proximity to large and diverse supplies of timber and have the ability to procure wood fiber at competitive prices.
6
In addition to wood fiber, we use significant quantities of various resins in our manufacturing processes. Resin product costs are influenced by changes in the prices of raw materials used to produce resin, primarily petroleum products and energy, as well as competing demand for resin products. Currently, we purchase the majority of our resin from three major suppliers and believe our relationships with those suppliers are good. However, there can be no assurance that pricing or availability of resins will not be impacted based upon competing demand.
While a large portion of our energy requirements are met at our plants through the energy produced from the conversion of wood waste, we also purchase substantial amounts of energy in our operations, primarily electricity and natural gas. Energy prices have experienced significant volatility in recent years, particularly in deregulated markets. We attempt to mitigate our exposure to energy price changes through the selective use of long-term supply agreements.
Environmental Compliance / Climate Change
Our operations are subject to many environmental laws and regulations governing, among other things, the discharge of pollutants and other emissions on or into land, water and air, the disposal of hazardous substances or other contaminants, the remediation of contamination and the restoration and reforestation of timberlands. In addition, certain environmental laws and regulations impose liability and responsibility on present and former owners, operators or users of facilities and sites for contamination at such facilities and sites without regard to causation or knowledge of contamination. Compliance with environmental laws and regulations can significantly increase the costs of our operations. In some cases, plant closures can result in more onerous compliance requirements becoming applicable to a facility or a site. Violations of environmental laws and regulations can subject us to additional costs and expenses, including defense costs and expenses and civil and criminal penalties. We cannot assure you that the environmental laws and regulations to which we are subject will not become more stringent, or be more stringently implemented or enforced, in the future.
Changes in global or regional climate conditions and current or future governmental response to such changes at the international, U.S. federal and state levels, such as regulating and/or taxing the production of carbon dioxide and other “greenhouse gases” to facilitate the reduction of emissions into the atmosphere, and/or the imposition of taxes or other incentives to produce and use “cleaner” energy, may increase energy costs, limit harvest levels and impact our operations or our planned or future growth activities. Because our manufacturing operations depend upon significant amounts of energy and raw materials, these initiatives could have an adverse impact on our operations and profitability. Future legislation or regulatory activity in this area remains uncertain, and the impact on our operations is unclear at this time.
Our policy is to comply fully with all applicable environmental laws and regulations. We devote significant management attention to achieving full compliance. In addition, from time to time, we undertake construction projects for environmental control equipment or incur other environmental costs that extend an asset’s useful life, improve its efficiency or improve the marketability of certain properties.
Additional information concerning environmental matters is set forth under item 3, Legal Proceedings, and in Note 18 of the Notes to the consolidated financial statements included in item 8 of this report.
Employees
We employ approximately
4,900
people, about
1,500
of whom are members of unions, primarily in Canada, Chile and Brazil. We consider our relationship with our employees generally to be good. While we do not currently anticipate any work stoppages, there can be no assurance that work stoppages will not occur.
Available Information
We file annual reports on Form 10-K, quarterly reports on Form 10-Q, current reports on Form 8-K, proxy statements and other information with the SEC. Our SEC filings are available to the public over the internet at the
7
SEC’s website at
http://www.sec.gov
.
In addition, we will make available our annual reports on Form 10-K, quarterly reports on Form 10-Q, current reports on Form 8-K and amendments to those reports filed or furnished pursuant to Section 13(a) or 15(d) of the Exchange Act through our website at
http://www.lpcorp.com
as soon as reasonably practicable after we electronically file such material with, or furnish it to, the SEC.
8
Segment and Price Trend Data
The following table sets forth, for each of the last three years: (1) our sales volumes; (2) housing starts and (3) the estimated average wholesale price of OSB sold in the United States. In addition, information concerning our: (1) net sales by business segment; (2) profit (loss) by business segment; (3) identifiable assets by segment; (4) depreciation and amortization by business segment; (5) capital expenditures by business segment; and (6) geographic segment information is included at Note 24 of the Notes to the consolidated financial statements included in item 8 of this report.
Sales Information Summary
|
Year Ended December 31, 2018
|
|||||||||||||
|
Sales Volume
|
Siding
|
OSB
|
EWP
|
Total
|
|||||||||
|
SmartSide® Strand siding (MMSF)
|
1,139
|
|
—
|
|
—
|
|
1,139
|
|
2018
|
||||
|
SmartSide® fiber siding (MMSF)
|
222
|
|
—
|
|
—
|
|
222
|
|
Housing starts
1
:
|
||||
|
CanExel® siding (MMSF)
|
36
|
|
—
|
|
—
|
|
36
|
|
Single Family
|
828
|
|
||
|
OSB - commodity (MMSF)
|
136
|
|
2,582
|
|
33
|
|
2,751
|
|
Multi-Family
|
428
|
|
||
|
OSB - value added (MMSF)
|
61
|
|
1,610
|
|
36
|
|
1,707
|
|
1,256
|
|
|||
|
LVL (MCF)
|
—
|
|
—
|
|
6,932
|
|
6,932
|
|
|||||
|
LSL (MCF)
|
—
|
|
—
|
|
3,694
|
|
3,694
|
|
|||||
|
I-joist (MMLF)
|
—
|
|
—
|
|
86
|
|
86
|
|
|||||
|
Year Ended December 31, 2017
|
|||||||||||||
|
Sales Volume
|
Siding
|
OSB
|
EWP
|
Total
|
|||||||||
|
SmartSide® Strand siding (MMSF)
|
1,059
|
|
—
|
|
—
|
|
1,059
|
|
2017
|
||||
|
SmartSide® fiber siding (MMSF)
|
254
|
|
—
|
|
—
|
|
254
|
|
Housing starts
1
:
|
||||
|
CanExel® siding (MMSF)
|
48
|
|
—
|
|
—
|
|
48
|
|
Single Family
|
848
|
|
||
|
OSB - commodity (MMSF)
|
230
|
|
2,642
|
|
34
|
|
2,906
|
|
Multi-Family
|
354
|
|
||
|
OSB - value added (MMSF)
|
—
|
|
1,604
|
|
39
|
|
1,643
|
|
1,202
|
|
|||
|
LVL (MCF)
|
—
|
|
—
|
|
7,577
|
|
7,577
|
|
|||||
|
LSL (MCF)
|
—
|
|
—
|
|
3,176
|
|
3,176
|
|
|||||
|
I-joist (MMLF)
|
—
|
|
—
|
|
87
|
|
87
|
|
|||||
|
Year Ended December 31, 2016
|
|||||||||||||
|
Sales Volume
|
Siding
|
OSB
|
EWP
|
Total
|
|||||||||
|
SmartSide® Strand siding (MMSF)
|
944
|
|
—
|
|
—
|
|
944
|
|
2016
|
||||
|
SmartSide® fiber siding (MMSF)
|
251
|
|
—
|
|
—
|
|
251
|
|
Housing starts
1
:
|
||||
|
CanExel® siding (MMSF)
|
43
|
|
—
|
|
—
|
|
43
|
|
Single Family
|
781
|
|
||
|
OSB - commodity (MMSF)
|
178
|
|
2,818
|
|
1
|
|
2,997
|
|
Multi-Family
|
392
|
|
||
|
OSB - value added (MMSF)
|
7
|
|
1,490
|
|
34
|
|
1,531
|
|
1,173
|
|
|||
|
LVL (MCF)
|
—
|
|
—
|
|
6,834
|
|
6,834
|
|
|||||
|
LSL (MCF)
|
—
|
|
—
|
|
2,700
|
|
2,700
|
|
|||||
|
I-joist (MMLF)
|
—
|
|
—
|
|
78
|
|
78
|
|
|||||
1
Actual U.S. Housing starts data reported by U.S. Census Bureau. Information for 2018 is based upon seasonally adjusted information published through November 2018 based upon the partial U.S. Government shutdown.
9
|
2018
|
2017
|
2016
|
|||||||||
|
COMMODITY PRODUCT PRICE TRENDS
(1)
|
|||||||||||
|
OSB, MSF,
7
/
16
” span rating (North Central price)
|
$
|
350
|
|
$
|
353
|
|
$
|
269
|
|
||
|
OSB, MSF,
7
/
16
” span rating (Western Canada price)
|
$
|
307
|
|
$
|
326
|
|
$
|
234
|
|
||
|
OSB, MSF,
7
/
16
” span rating (Southwest price)
|
$
|
319
|
|
$
|
334
|
|
$
|
258
|
|
||
|
(1)
|
Prices represent yearly averages stated in dollars per thousand square feet (MSF). Source:
Random Lengths
.
|
10
|
ITEM 1A.
|
Risk Factors
|
You should be aware that the occurrence of any of the events described in this Risk Factors section and elsewhere in this report or in any other of our filings with the SEC could have a material adverse effect on our business, financial position, results of operations and cash flows. In evaluating us, you should consider carefully, among other things, the risks described below and the matters described in “About Forward-Looking Statements.”
Our business primarily relies on North American new home construction and repair which are impacted by risks associated with fluctuations in the housing market. Downward changes in the general economy, the housing market or other business conditions could adversely affect our results of operations, cash flows and financial condition.
The housing market is sensitive to changes in economic conditions and other factors, such as the level of employment, access to labor, consumer confidence, consumer income, availability of financing and interest rate levels. Adverse changes in any of these conditions generally, or in any of the markets where we operate, could decrease demand and could adversely impact our businesses by: causing consumers to delay or decrease homeownership; making consumers more price conscious resulting in a shift in demand to smaller homes; making consumers more reluctant to make investments in their existing homes; or making it more difficult to secure loans for major renovations or new home construction. Although the U.S. new home construction market is improving, demand for new homes is still recovering after the 2007-2009 U.S. economic recession and continues to remain below historical levels.
We have a high degree of product concentration in OSB
.
OSB accounted for about
54%
, 54% and 51% of our North American sales in 2018, 2017 and 2016 and we expect OSB sales to continue to account for a substantial portion of our revenues and profits in the future. Concentration of our business in the OSB market further increases our sensitivity to commodity pricing and price volatility. Historical prices for our commodity products have been volatile, and we, like other participants in the building products industry, have limited influence over the timing and extent of price changes for our products. Commodity product pricing is significantly affected by the relationship between supply and demand in the building products industry. Product supply is influenced primarily by fluctuations in available manufacturing capacity. Demand is affected by the state of the economy in general and a variety of other factors, including the level of new residential construction activity and home repair and remodeling activity, changes in the availability and cost of mortgage financing. In this competitive environment with so many variables for which we do not control, we cannot assure you that pricing for OSB will not decline from current levels.
Intense competition in the building products industry could prevent us from increasing or sustaining our net sales and profitability
.
The markets for our products are highly competitive. Our competitors range from very large, fully integrated forest and building products firms to smaller firms that may manufacture only one or a few types of products. Many of our competitors have greater financial and other resources than we do, and certain of the mills operated by our competitors may be lower-cost producers than the mills operated by us.
Our results of operations may be harmed by potential shortages of raw materials and increases in raw material costs.
The most significant raw material used in our operations is wood fiber. Wood fiber is subject to commodity pricing, which fluctuates on the basis of market factors over which we have no control. In addition, the cost of various types of wood fiber that we purchase in the market has at times fluctuated greatly because of governmental, economic or industry conditions, and may be affected by increased demand resulting from initiatives to increase the use of biomass materials in the production of heat, power, bio-based products and bio-fuels. In addition to wood fiber, we also use a significant quantity of various resins in our manufacturing processes. Resin product costs are influenced by changes in the prices or availability of raw materials used to produce resins, primarily petroleum products, as well as demand for and availability of resin products. Selling prices of our products have not always increased in response to raw material cost increases. We are unable to determine to what extent, if any, we will be able to pass any future raw material cost increases through to our customers through product price increases. Our inability to pass increased costs through to our customers could have a material adverse effect on our financial condition, results of operations and cash flows.
Many of the Canadian forestlands from which we obtain wood fiber also are subject to the constitutionally protected treaty or common-law rights of the aboriginal peoples of Canada. Most of British Columbia is not covered by
11
treaties and, as a result, the claims of British Columbia’s aboriginal peoples relating to forest resources are largely unresolved, although many aboriginal groups are actively engaged in treaty discussions with the governments of British Columbia and Canada. Final or interim resolution of claims brought by aboriginal groups are expected to result in additional restrictions on the sale or harvest of timber and may increase operating costs and affect timber supply and prices in Canada.
We mostly depend on third parties for transportation services and increases in costs and the availability of transportation could materially and adversely affect our business and operations
.
Our business depends on the transportation of a large number of products, both domestically and internationally. We rely primarily on third parties for transportation of the products we manufacture and/or distribute as well as for delivery of our raw materials. In particular, a significant portion of the goods we manufacture and raw materials we use are transported by railroad or trucks, which are highly regulated. If any of our third-party transportation providers were to fail to deliver the goods we manufacture or distribute in a timely manner, we may be unable to sell those products at full value or at all. Similarly, if any of these providers were to fail to deliver raw materials to us in a timely manner, we may be unable to manufacture our products in response to customer demand. In addition, if any of these third parties were to cease operations or cease doing business with us, we may be unable to replace them at reasonable cost. Any failure of a third-party transportation provider to deliver raw materials or finished products in a timely manner could harm our reputation, negatively affect our customer relationships and have a material adverse effect on our financial condition and results of operations. In addition, an increase in transportation rates or fuel surcharges could materially and adversely affect our sales and profitability.
We are subject to significant environmental regulation and environmental compliance expenditures and liabilities.
Our businesses are subject to many environmental laws and regulations, particularly with respect to discharges of pollutants and other emissions on or into land, water and air, and the disposal and remediation of hazardous substances or other contaminants and the restoration and reforestation of timberlands. Compliance with these laws and regulations is a significant factor in our business. We have incurred and expect to continue to incur significant expenditures to comply with applicable environmental laws and regulations. Moreover, some or all of the environmental laws and regulations to which we are subject could become more stringent in the future. Our failure to comply with applicable environmental laws and regulations and permit requirements could result in civil or criminal fines or penalties or enforcement actions, including regulatory or judicial orders enjoining or curtailing operations or requiring corrective measures, installation of pollution control equipment or remedial actions.
Some environmental laws and regulations impose liability and responsibility on present and former owners, operators or users of facilities and sites for contamination at such facilities and sites without regard to causation or knowledge of contamination. In addition, we occasionally evaluate various alternatives with respect to our facilities, including possible dispositions or closures. Investigations undertaken in connection with these activities may lead to discoveries of contamination that must be remediated, and closures of facilities may trigger compliance requirements that are not applicable to operating facilities. Consequently, we cannot assure you that existing or future circumstances or developments with respect to contamination will not require significant expenditures by us.
We are involved in various environmental matters, product liability and other legal proceedings. The outcome of these matters and proceedings and the magnitude of related costs and liabilities are subject to uncertainties
.
The conduct of our business involves the use of hazardous substances and the generation of contaminants and pollutants. In addition, the end-users of many of our products are members of the general public. We currently are or from time to time in the future may be involved in a number of environmental matters and legal proceedings, including legal proceedings involving anti-trust, warranty or non-warranty product liability claims, negligence and other claims, including claims for wrongful death, personal injury and property damage alleged to have arisen out of the use by others of our or our predecessors’ products or the release by us or our predecessors of hazardous substances. Environmental matters and legal matters and proceedings, including class action settlements relating to certain of our products, have in the past caused and in the future may cause us to incur substantial costs. We have established contingency reserves in our consolidated financial statements with respect to the estimated costs of existing environmental matters and legal proceedings to the extent that our management has determined that such costs are both probable and reasonably estimable as to amount. However, such reserves are based upon various estimates and assumptions relating to future events and circumstances, all of which are subject to inherent uncertainties. We
12
regularly monitor our estimated exposure to environmental and litigation loss contingencies and, as additional information becomes known, may change our estimates significantly. However, no estimate of the range of any such change can be made at this time. We may incur costs in respect of existing and future environmental matters and legal proceedings as to which no contingency reserves have been established. We cannot assure you that we will have sufficient resources available to satisfy the related costs and expenses associated with these matters and proceedings.
We have not independently verified the results of third-party research or confirmed assumptions or judgments upon which it may be based, and the forecasted and other forward-looking information contained therein is subject to inherent uncertainties.
We refer in this report and other documents that we file with the SEC to historical, forecasted and other forward-looking information published by sources such as
RISI
(
Resource Information Systems, Inc
.),
FEA (Forest Economic Advisors, LLC), Random Lengths
and the U.S. Census Bureau that we believe to be reliable. However, we have not independently verified this information and, with respect to the forecasted and forward-looking information, have not independently confirmed the assumptions and judgments upon which it is based. Forecasted and other forward looking information is necessarily based on assumptions regarding future occurrences, events, conditions and circumstances and subjective judgments relating to various matters, and is subject to inherent uncertainties. Actual results may differ materially from the results expressed or implied by, or based upon, such forecasted and forward-looking information.
Cyber security risks related to the technology used in our operations and other business processes, as well as security breaches of company, customer, employee, and vendor information, could adversely affect our business
.
We rely on various information technology systems to capture, process, store, and report data and interact with customers, vendors, and employees. Despite careful security and controls design, implementation, updating, and internal and independent third-party assessments, our information technology systems, and those of our third-party providers, could become subject to cyber-attacks. Network, system, and data breaches could result in misappropriation of sensitive data or operational disruptions, including interruption to systems availability and denial of access to and misuse of applications required by our customers to conduct business with us. In addition, hardware and operating system software and applications that we procure from third parties may contain defects in design or manufacture, including "bugs" and other problems that could unexpectedly interfere with the operation of the systems. Misuse of internal applications; theft of intellectual property, trade secrets, or other corporate assets; and inappropriate disclosure of confidential information could stem from such incidents. A security failure of that technology could impact our ability to operate our businesses effectively, adversely affect our reported financial results, impact our reputation and expose us to potential liability or litigation.
|
ITEM 1B.
|
Unresolved Staff Comments
|
None.
13
ITEM 2.
Properties
Information regarding our principal facilities is set forth in the following table. Information regarding currently operating production capacities is based on annual normal operating rates and normal production mixes under current market conditions, taking into account known constraints such as log supply. Market conditions, fluctuations in log supply, environmental restrictions and the nature of current orders may cause actual production rates and mixes to vary significantly from the production rates and mixes shown.
|
OSB
|
Siding
|
|||||
|
OSB - 3/8" basis, million square feet
|
Siding - 3/8" basis, million square feet
|
|||||
|
Carthage, TX
|
500
|
|
Dawson Creek, British Columbia, Canada
1
|
300
|
|
|
|
Ft. St. John, British Columbia, Canada
|
800
|
|
Newberry, MI
|
140
|
|
|
|
Hanceville, AL
|
420
|
|
Hayward, WI
2
|
475
|
|
|
|
Jasper, TX
|
475
|
|
Tomahawk, WI
|
220
|
|
|
|
Maniwaki, Quebec, Canada
|
650
|
|
Two Harbors, MN
|
200
|
|
|
|
Roxboro, NC
|
525
|
|
Roaring River, NC
|
275
|
|
|
|
Sagola, MI
|
420
|
|
East River, Nova Scotia, Canada
|
55
|
|
|
|
Thomasville, AL
|
725
|
|
Swan Valley, Manitoba, Canada
2
|
350
|
|
|
|
8 facilities
|
4,515
|
|
8 facilities
|
2,015
|
|
|
|
EWP
|
SOUTH AMERICAN OPERATIONS
|
|||||
|
I-Joist. million lineal feet
3
|
OSB / Siding — 3/8” basis, million square feet
|
|||||
|
Red Bluff, CA
|
80
|
|
Panguipulli, Chile
|
130
|
|
|
|
Panguipulli II, Chile
|
160
|
|
||||
|
LVL / LSL, thousand cubic feet
|
Lautaro, Chile
|
160
|
|
|||
|
Golden, BC, Canada
|
4,000
|
|
Ponta Grossa, Brazil
|
300
|
|
|
|
Wilmington, NC
|
4,600
|
|
4 facilities
|
750
|
|
|
|
Houlton, ME
2
|
5,500
|
|
||||
|
3 facilities
|
14,100
|
|
||||
1
During the latter portion of 2017, we announced our intent to convert the Dawson OSB mill to a siding mill in 2018 with production start up anticipated in early 2019. Capacity information noted is based upon future siding capacities.
2
The Hayward, WI, Swan Valley siding and Houlton, ME LSL facilities can produce commodity OSB when market conditions warrant.
3
In addition to the plants described, our 50/50 joint venture with Resolute Forest Products owns and operates a plant in St. Prime, Quebec, Canada and a plant in La Rouche, Quebec, Canada. The combined annual production capacity of these facilities is 140 million lineal feet.
14
ITEM 3.
Legal Proceedings
ENVIRONMENTAL MATTERS
We are involved in a number of environmental proceedings and activities, and may be wholly or partially responsible for known or unknown contamination existing at a number of other sites at which we have conducted operations or disposed of wastes. Based on the information currently available, management believes that any fines, penalties or other costs or losses resulting from these matters will not have a material adverse effect on our financial position, results of operations, cash flows or liquidity.
OTHER PROCEEDINGS
LP is party to other legal proceedings in the ordinary course of business. Based on the information currently available, LP believes that the resolution of such proceedings will not have a material adverse effect on its financial position, results of operations, cash flows or liquidity.
CONTINGENCY RESERVES
We maintain reserves for the estimated cost of the legal and environmental matters referred to above. However, as with any estimate, there is uncertainty of predicting the outcomes of claims and litigation and environmental investigations and remediation efforts that could cause actual costs to vary materially from current estimates. Due to various uncertainties, we cannot predict to what degree actual payments will exceed the recorded liabilities related to these matters. However, it is possible that, in either the near term or the longer term, revised estimates or actual payments will significantly exceed the recorded liabilities.
For information regarding our financial statement reserves for the estimated costs of the environmental and legal matters referred to above, see Note 18 of the Notes to financial statements included in item 8 in this report.
ITEM 4.
Mine Safety Disclosures
N/A
15
PART II
|
ITEM 5.
|
Market for Registrant’s Common Equity, Related Stockholder Matters and Issuer Purchases of Equity Securities
|
The common stock of LP is listed on the New York Stock Exchange with the ticker symbol “LPX.” As of February 8, 2019, there were approximately
4,478
holders of record of our common stock.
ISSUER PURCHASES OF EQUITY SECURITIES
The following amount of our common stock was repurchased under these authorizations during the quarter ended
December 31, 2018
:
|
Period
|
Number of Shares Repurchased
|
Average Price Paid Per Share
|
Total Number of Shares Purchased as part of Publicly Announced Purchase Plan or Program
|
Maximum Dollar Value of Shares That May Yet be Purchased under the Plans or Programs
(1)
|
|||||||||
|
October 1, 2018 - October 31, 2018
|
727,388
|
|
$
|
23.59
|
|
727,388
|
|
$
|
134,172,287
|
|
|||
|
November 1, 2018 - November 30, 2018
|
1,477,185
|
|
$
|
23.17
|
|
1,477,185
|
|
$
|
99,943,788
|
|
|||
|
December 1, 2018 - December 31, 2018
|
2,866,429
|
|
$
|
21.53
|
|
2,866,429
|
|
$
|
38,236,371
|
|
|||
|
5,071,002
|
|
5,071,002
|
|
|
|||||||||
'
(1)
On October 31, 2014, our Board of Directors authorized us to repurchase up to $100 million of our common stock. On August 7, 2018, our Board of Directors authorized a new stock repurchase program under which we may repurchase up to an additional $150 million of our common stock. At December 31, 2018,
$38.2 million
remained authorized to repurchase our common stock. As of
February 14, 2019
, we have exhausted the remaining authorization. As of February 7, 2019, our Board of Directors authorized an additional stock repurchase plan under which LP may repurchase up to $600 million of its common stock. LP intends to initially enter into a $400 million accelerated share repurchase program in the near future.
We may initiate, discontinue or resume purchases of our common stock under this authorization in the open market, in privately negotiated transactions or otherwise at any time or from time to time without prior notice.
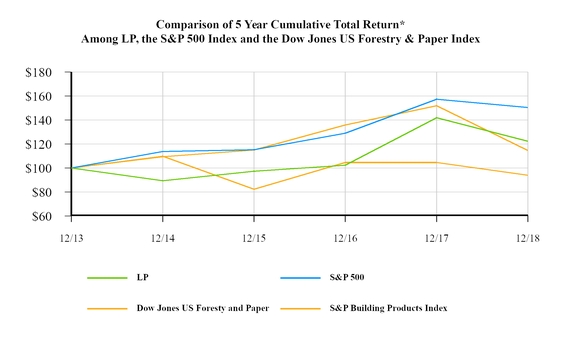
PERFORMANCE GRAPH
The following graph compares the total cumulative return to investors, including dividends paid (assuming reinvestment of dividends) and appreciation or depreciation in stock price, from an investment in LP common stock for the period from December 31, 2013 through
December 31, 2018
, to the total cumulative return to investors from the Standard & Poor’s 500 Stock Index and the Dow Jones US Forestry & Paper Index for the same period. Stockholders are cautioned that the graph shows the returns to investors only as of the dates noted and may not be representative of the returns for any other past or future period.
16
17
ITEM 6.
Selected Financial Data
|
Dollar amounts in millions, except per share
|
2018
|
2017
(1)
|
2016
(1)
|
2015
(1) (2)
|
2014
(1) (2)
|
||||||||||||||
|
Year ended December 31
|
|||||||||||||||||||
|
SUMMARY INCOME STATEMENT DATA
|
|||||||||||||||||||
|
Net sales
|
$
|
2,828.0
|
|
$
|
2,733.9
|
|
$
|
2,233.4
|
|
$
|
1,892.5
|
|
$
|
1,934.8
|
|
||||
|
Income (loss) from continuing operations
|
398.8
|
|
391.1
|
|
150.3
|
|
(86.0
|
)
|
(73.4
|
)
|
|||||||||
|
Net income (loss)
|
394.6
|
|
389.8
|
|
149.8
|
|
(88.1
|
)
|
(75.4
|
)
|
|||||||||
|
Income (loss) from continuing operations, per share—basic
|
$
|
2.79
|
|
$
|
2.71
|
|
$
|
1.05
|
|
$
|
(0.60
|
)
|
$
|
(0.52
|
)
|
||||
|
Income (loss) from continuing operations, per share—diluted
|
$
|
2.76
|
|
$
|
2.67
|
|
$
|
1.03
|
|
$
|
(0.60
|
)
|
$
|
(0.52
|
)
|
||||
|
Net income (loss) per share—basic
|
$
|
2.76
|
|
$
|
2.70
|
|
$
|
1.04
|
|
$
|
(0.62
|
)
|
$
|
(0.53
|
)
|
||||
|
Net income (loss) per share—diluted
|
$
|
2.73
|
|
$
|
2.66
|
|
$
|
1.03
|
|
$
|
(0.62
|
)
|
$
|
(0.53
|
)
|
||||
|
Average shares of common stock outstanding
|
|||||||||||||||||||
|
Basic
|
143.0
|
|
144.4
|
|
143.4
|
|
142.4
|
|
141.1
|
|
|||||||||
|
Diluted
|
144.4
|
|
146.4
|
|
145.3
|
|
142.4
|
|
141.1
|
|
|||||||||
|
Cash dividends declared per common share
|
$
|
0.52
|
|
$
|
—
|
|
$
|
—
|
|
$
|
—
|
|
$
|
—
|
|
||||
|
SUMMARY BALANCE SHEET INFORMATION
|
|||||||||||||||||||
|
Cash and cash equivalents
|
$
|
878.4
|
|
$
|
928.0
|
|
$
|
659.3
|
|
$
|
434.7
|
|
$
|
532.7
|
|
||||
|
Working capital (excluding cash and cash equivalents)
|
$
|
147.2
|
|
$
|
161.5
|
|
$
|
120.2
|
|
$
|
191.4
|
|
$
|
244.9
|
|
||||
|
Total assets
|
$
|
2,514.1
|
|
$
|
2,448.5
|
|
$
|
2,031.2
|
|
$
|
2,176.3
|
|
$
|
2,348.8
|
|
||||
|
Long-term debt, excluding current portion
|
$
|
346.9
|
|
$
|
350.8
|
|
$
|
374.4
|
|
$
|
751.8
|
|
$
|
754.8
|
|
||||
|
Capital expenditures
|
$
|
214.2
|
|
$
|
148.6
|
|
$
|
(124.8
|
)
|
$
|
113.8
|
|
$
|
80.1
|
|
||||
|
Business acquisitions / Investments
|
$
|
45.0
|
|
$
|
20.8
|
|
$
|
—
|
|
$
|
—
|
|
$
|
—
|
|
||||
|
NON-GAAP MEASURES
|
|||||||||||||||||||
|
Adjusted EBITDA
(2)
|
$
|
659.8
|
|
$
|
677.5
|
|
$
|
350.2
|
|
$
|
78.1
|
|
$
|
50.3
|
|
||||
|
Adjusted income from continuing operations
(2)
|
$
|
397.3
|
|
$
|
339.2
|
|
$
|
129.5
|
|
$
|
(46.1
|
)
|
$
|
(65.8
|
)
|
||||
|
Return on invested capital
(2)
|
19.3
|
%
|
18.5
|
%
|
8.4
|
%
|
(3.1
|
)%
|
(4.2
|
)%
|
|||||||||
(1)
As of January 1, 2018, we adopted guidance under ASU No 2017-17, "Retirement Benefits - Improving the Presentation of Net Periodic Pension Cost and Net Periodic Postretirement Benefit Cost" which reclassified interest cost, expected return on assets, amortization of prior service costs, amortization of net actuarial losses and settlement costs from Cost of sales, Selling, general and administrative expenses and Other operating credits and charges to Non-operating income (expense). All prior periods were restated to reflect this adoption.
(2)
As of December 31, 2015, we adopted guidance under ASU No 2015-03, "Imputation of Interest (Subtopic 835-30): Simplifying the Presentation of Debt Issuance Costs" which reclassified certain deferred debt costs as a direct deduction from the carrying amount of that debt liability. All prior periods were restated to reflect this adoption.
(3)
See reconciliation and definitions to the most directly reportable generally accepted accounting principles (GAAP) measures included in Item 7.
18
ITEM 7.
Management’s Discussion and Analysis of Financial Condition and Results of Operations
This Management's Discussion and Analysis of Financial Condition and Results of Operations should be read in conjunction with our consolidated financial statements and related notes and other financial information appearing elsewhere in this Form 10-K. The following discussion includes statements that are forward-looking statements that are based on the beliefs of our management, as well as assumptions made by, and information currently available to, our management.
OVERVIEW
General
We are a leading provider of high-performance building solutions. We design, manufacture and market a broad range of products for the new home construction, repair and remodeling and outdoor structures markets. We also market and sell our products in light industrial and commercial construction and we have a modest export business. Our manufacturing facilities are primarily located in the U.S. and Canada, and we also operate two facilities in Chile and one facility in Brazil.
To serve these markets, we operate in four segments: Siding; North America Oriented Strand Board (OSB); Engineered Wood Products (EWP); and South America.
Executive Summary
We recorded a
3%
increase in sales to
$2.8 billion
for the year ended
December 31, 2018
from
$2.7 billion
reported for the year ended
December 31, 2017
. We recorded income from operations of
$526.1 million
during
2018
compared to
$532.8 million
during the prior year. We recorded net income of
$394.6 million
(
$2.73
per diluted share) during
2018
compared to
$389.8 million
(
$2.66
per diluted share) during the prior year. We reported a decrease of
$17.7 million
in Adjusted EBITDA between years. Improvements in OSB pricing in all North American operations had a positive impact of
$32.0 million
for
2018
as compared to
2017
for operating results.
Changes in sales, operating results and Adjusted EBITDA are discussed further in "Our Operating Results" below.
Demand for Building Products
Demand for our products correlates to a significant degree to the level of new home construction activity in North America, which historically has been characterized by significant cyclicality. The U.S. Census Bureau reported that actual single and multi-family housing starts in
2018
were about
4%
higher than
2017
. Single family housing starts were flat with
2017
. We believe that the level of building continues to be impacted by lack of available labor.
While near-term residential construction is constrained in the U.S., positive long-term fundamentals exist. Increased immigration, the changing age distribution of the population, and historically low interest rates are expected to lead to more household formations. The chart below, which is based on data published by U.S. Census Bureau, provides a graphical summary of new housing starts for single and multi-family in the U.S. showing actual and rolling five and ten year averages for housing starts.
19

Supply and Demand for Siding
SmartSide siding is a specialty building material and is subject to competition from various siding technologies including vinyl, stucco, wood, fiber cement, brick and other. We believe we are the largest manufacturer to the $800 million engineered wood siding market. The overall siding market is estimated to be over $10 billion. LP's growth in this market will be dependent upon increasing housing demand as well as continued displacement of vinyl, wood, fiber cement and stucco alternatives.
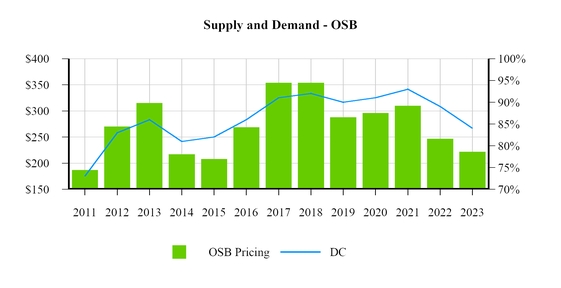
Supply and Demand for OSB
OSB is a commodity product, and it is subject to competition from manufacturers worldwide. Product supply is influenced primarily by fluctuations in available manufacturing capacity and imports. OSB demand and capacity generally drives price. The chart below, as calculated by FEA (as of December 2018) including indefinitely curtailed mills, shows the demand capacity ratio (demand divided by supply) for OSB from 2014 through 2018 and FEA’s forecasted OSB price through 2023 based upon estimated future demand and supply.
20
CRITICAL ACCOUNTING POLICIES AND SIGNIFICANT ESTIMATES
A discussion of our significant accounting policies and significant accounting estimates and judgments is presented in Note 1 of the Notes to the financial statements in item 8 of this report. Throughout the preparation of the financial statements, we employ significant judgments in the application of accounting principles and methods. We believe that the accounting estimates discussed below represent the accounting estimates requiring the exercise of judgment where a different set of judgments could result in the greatest changes to reported results. We reviewed the development, selection, and disclosure of our critical accounting estimates with the Finance and Audit Committee of our Board of Directors. For
2018
, these significant accounting estimates and judgments include:
Long-lived Assets
In accordance with GAAP for Property, Plant and Equipment, a long-lived asset (including amortizable identifiable intangible assets) or asset group held for use is tested for recoverability whenever events or changes in circumstances indicate that its carrying amount may not be recoverable. When such events occur, we compare the sum of the undiscounted cash flows expected to result from the use and eventual disposition of the asset or asset group to the carrying amount of a long-lived asset or asset group. The cash flows are based on our best estimate of future cash flows derived from the most recent business projections. If this comparison indicates that there is an impairment, the amount of the impairment is calculated based on fair value. Fair value is estimated primarily using discounted expected future cash flows on a market-participant basis.
Defined Benefit Plans
We have a number of pension plans in the U.S. and Canada, covering many of the Company’s employees. Benefit accruals under our defined benefit pension plan in the U.S. were frozen as of January 1, 2010.
We account for the consequences of our sponsorship of these plans in accordance with GAAP which requires us to make assumptions that are used to calculate the related assets, liabilities and expenses recorded in our financial statements. Net actuarial gains and losses occur when actual experience differs from any of the assumptions used to value defined benefit plans or when assumptions change as they may each year. The primary factors contributing to actuarial gains and losses are changes in the discount rate used to value obligations as of the measurement date and the differences between expected and actual returns on pension plan assets. This accounting method results in the potential for volatile and difficult to forecast gains and losses.
21
We record amounts relating to these defined benefit plans based on various actuarial assumptions, including discount rates, assumed rates of return, compensation increases and life expectancy. We review our actuarial assumptions on an annual basis and make modifications to the assumptions based on current economic conditions and trends. We believe that the assumptions utilized in recording our obligations under our plans are reasonable based on our experience and on advice from our independent actuaries; however, differences in actual experience or changes in the assumptions may materially affect our financial condition or results of operations.
A 50 basis point change in our discount rate assumption would lead to an increase or decrease in our pension liability of approximately $
15.0 million
. A 50 basis point change in the long-term rate of return on plan assets used in accounting for our pension plans would have a $
1.3 million
impact on pension expense and a 50 basis point change in the discount rate would have a $
0.1 million
impact on pension expense. It is not possible to forecast or predict whether there will be actuarial gains and losses in future periods, and if required, the magnitude of any such adjustment. These gains and losses are driven by differences in actual experience or changes in the assumptions that are beyond our control, such as changes in interest rates and the actual return on pension plan assets.
For our U.S. plans, we used a long-term rate of return assumption of
5.75%
and discount rate of
4.17%
. For our Canadian plans, we used a long-term rate of return assumption of
4.06%
and discount rate of
3.25%
Income Taxes
In accordance with GAAP, we establish deferred tax liabilities or assets for temporary differences between financial and tax reporting bases and subsequently adjust them to reflect changes in tax rates expected to be in effect when the temporary differences reverse. We record a valuation allowance reducing deferred tax assets when it is more likely than not that such assets will not be realized.
We record liabilities for uncertain income tax positions based on a two-step process. The first step is recognition, where we evaluate whether an individual tax position has a likelihood of greater than 50% of being sustained upon examination based on the technical merits of the position, including resolution of any related appeals or litigation processes. For tax positions that are currently estimated to have a less than 50% likelihood of being sustained, no tax benefit is recorded. For tax positions that have met the recognition threshold in the first step, we perform the second step of measuring the benefit (expense) to be recorded. The actual benefits (expense) ultimately realized may differ from our estimates. In future periods, changes in facts, circumstances, and new information may require us to change the recognition and measurement estimates with regard to individual tax positions. Changes in recognition and measurement estimates are recorded in the consolidated statement of income and consolidated balance sheet in the period in which such changes occur. As of
December 31, 2018
, we had liabilities for unrecognized tax benefits pertaining to uncertain tax positions totaling
$40.8 million
.
Customer Program Costs
Customer programs and incentives are a common practice in our businesses. Our businesses incur customer program costs to obtain favorable product placement, to promote sales of products and to maintain competitive pricing. Customer program costs and incentives, including rebates and promotion and volume allowances, are accounted for as a reduction in net sales at the time the program is initiated and/or the revenue is recognized. The costs include, but are not limited to, volume allowances and rebates, promotional allowances, and cooperative advertising programs. These costs are recorded at the later of the time of sale or the implementation of the program based on management’s best estimates. Estimates are based on historical and projected experience for each type of program or customer. Volume allowances are accrued based on our estimates of customer volume achievement and other factors incorporated into customer agreements, such as new products, merchandising support and customer training. We review accruals for these rebates and allowances, and adjusts accruals when circumstances indicate (typically as a result of a change in volume expectations). As of December 31, 2018 and 2017, we had
$30.1 million
and
$24.2 million
accrued as customer rebates.
Inventory valuation
22
We record inventories at the lower of cost or estimated net realizable value. Inventory cost includes an overhead component that can be affected by levels of production and actual costs incurred. We evaluate the need to record adjustments for impairment of inventory at least quarterly. If in our judgment persuasive evidence exists that the net realizable value of inventory is lower than its cost, the inventory value is written-down to its estimated net realizable value. Significant judgments regarding future events and market conditions must be made when estimating net realizable value
.
NON-GAAP FINANCIAL MEASURES
In evaluating our business, we utilize several non-GAAP financial measures. A non-GAAP financial measure is generally defined by the SEC as one that purports to measure historical or future financial performance, financial position or cash flows, but excludes or includes amounts that would not be so excluded or included under applicable GAAP guidance. In this report on Form 10-K, we disclose segment earnings (loss) from continuing operations before interest expense, taxes, depreciation and amortization and exclude stock based compensation expense, (gain) loss on sales or impairment of long-lived assets, other operating credits and charges, net, loss on early debt extinguishment, investment income and other non-operating items as Adjusted EBITDA from continuing operations (Adjusted EBITDA) which is a non-GAAP financial measure. We also disclose Adjusted income from continuing operations which excludes (gain) loss on sale or impairment of long-lived assets, interest outside of normal operations, other operating credits and charges, net, early debt extinguishment and adjusts for a normalized tax rate. Neither Adjusted EBITDA nor Adjusted income from continuing operations are a substitute for the GAAP measure of net income or for any other GAAP measures of operating performance.
We have included Adjusted EBITDA in this report because we use them as important supplemental measures of our performance and believe that they are frequently used by securities analysts, investors and other interested persons in the evaluation of companies in our industry, some of which present Adjusted EBITDA when reporting their results. We use Adjusted EBITDA to evaluate our performance as compared to other companies in our industry that have different financing and capital structures and/or tax rates. It should be noted that companies calculate Adjusted EBITDA and differently and, therefore, our Adjusted EBITDA measures may not be comparable to Adjusted EBITDA reported by other companies. Our Adjusted EBITDA measures have material limitations as performance measures because they exclude interest expense, income tax (benefit) expense and depreciation and amortization which are necessary to operate our business or which we otherwise incur or experience in connection with the operation of our business.
We believe that Adjusted income (loss) from continuing operations, which excludes (gain) loss on sale or impairment of long-lived assets, interest outside of normal operations, other operating credits and charges, net and early debt extinguishment, adjusted for a normalized tax rate is a useful measure for evaluating our ability to generate earnings and that providing this measure will allow investors to more readily compare the earnings for past and future periods. It should be noted that other companies may present similarly-titled measures differently and, therefore, as presented by us may not be comparable to similarly-titled measures reported by other companies. In addition, Adjusted income (loss) from continuing operations has material limitations as a performance measure because it excludes items that are actually incurred or experienced in connection with the operations of our business. Adjusted income (loss) from continuing operations is then used to calculate return on invested capital (ROIC). ROIC is calculated as the ratio of adjusted income from continuing operations to average invested capital. Average invested capital is defined as interest-bearing liabilities (debt and pension liabilities) plus shareholder's equity and is calculated as the sum of current and prior year ending amounts divided by two. The ROIC percentage is a non-GAAP financial measure. We believe ROIC is useful to investors as a measure of operating performance and the effectiveness of the use of capital in our operations. We use ROIC as a measure to monitor and evaluate operating performance relative to our invested capital. This measure should not be construed as an alternative to, or substitute for, return on equity or any other measure determined in accordance with GAAP.
The following table presents significant items by operating segment and reconciles net income (loss) to Adjusted EBITDA:
|
Year Ended December 31, 2018 (Dollar amounts in millions)
|
Siding
|
OSB
|
EWP
|
South America
|
Other
|
Corporate
|
Total
|
||||||||||||||||||||
|
Net income (loss)
|
$
|
201.6
|
|
$
|
395.7
|
|
$
|
19.5
|
|
$
|
31.0
|
|
$
|
(8.5
|
)
|
$
|
(244.7
|
)
|
$
|
394.6
|
|
||||||
|
Reconciliation of net income (loss) to Adjusted EBITDA:
|
|||||||||||||||||||||||||||
|
Loss from discontinued operations
|
—
|
|
—
|
|
—
|
|
—
|
|
5.6
|
|
—
|
|
5.6
|
|
|||||||||||||
|
Benefit for income taxes
|
—
|
|
—
|
|
—
|
|
—
|
|
(1.4
|
)
|
—
|
|
(1.4
|
)
|
|||||||||||||
|
Income (loss) from continuing operations
|
201.6
|
|
395.7
|
|
19.5
|
|
31.0
|
|
(4.3
|
)
|
(244.7
|
)
|
398.8
|
|
|||||||||||||
|
Provision for income taxes
|
—
|
|
—
|
|
—
|
|
—
|
|
—
|
|
122.3
|
|
122.3
|
|
|||||||||||||
|
Interest expense, net of capitalized interest
|
—
|
|
—
|
|
—
|
|
—
|
|
—
|
|
15.8
|
|
15.8
|
|
|||||||||||||
|
Depreciation and amortization
|
32.3
|
|
58.3
|
|
15.1
|
|
9.1
|
|
2.0
|
|
3.2
|
|
120.0
|
|
|||||||||||||
|
Stock-based compensation expense
|
1.1
|
|
0.7
|
|
0.4
|
|
—
|
|
—
|
|
5.8
|
|
8.0
|
|
|||||||||||||
|
Loss on sale or impairments of long-lived assets, net
|
|
—
|
|
—
|
|
—
|
|
—
|
|
10.8
|
|
10.8
|
|
||||||||||||||
|
Investment income
|
—
|
|
—
|
|
—
|
|
—
|
|
—
|
|
(17.6
|
)
|
(17.6
|
)
|
|||||||||||||
|
Other operating credits and charges, net
|
—
|
|
—
|
|
—
|
|
—
|
|
—
|
|
(2.2
|
)
|
(2.2
|
)
|
|||||||||||||
|
Other non-operating items
|
—
|
|
—
|
|
—
|
|
—
|
|
—
|
|
3.9
|
|
3.9
|
|
|||||||||||||
|
Adjusted EBITDA
|
$
|
235.0
|
|
$
|
454.7
|
|
$
|
35.0
|
|
$
|
40.1
|
|
$
|
(2.3
|
)
|
$
|
(102.7
|
)
|
$
|
659.8
|
|
||||||
|
Adjusted EBITDA Margin
|
24.9
|
%
|
34.8
|
%
|
9.0
|
%
|
24.9
|
%
|
(8.0
|
)%
|
NA
|
|
23.3
|
%
|
|||||||||||||
|
Year Ended December 31, 2017 (Dollar amounts in millions)
|
Siding
|
OSB
|
EWP
|
South America
|
Other
|
Corporate
|
Total
|
||||||||||||||||||||
|
Net income (loss)
|
$
|
188.7
|
|
$
|
427.3
|
|
$
|
15.7
|
|
$
|
24.3
|
|
$
|
(4.7
|
)
|
$
|
(261.5
|
)
|
$
|
389.8
|
|
||||||
|
Reconciliation of net income (loss) to Adjusted EBITDA:
|
|||||||||||||||||||||||||||
|
Loss from discontinued operations
|
—
|
|
—
|
|
—
|
|
—
|
|
2.0
|
|
—
|
|
2.0
|
|
|||||||||||||
|
Benefit for income taxes
|
—
|
|
—
|
|
—
|
|
—
|
|
(0.7
|
)
|
—
|
|
(0.7
|
)
|
|||||||||||||
|
Income (loss) from continuing operations
|
188.7
|
|
427.3
|
|
15.7
|
|
24.3
|
|
(3.4
|
)
|
(261.5
|
)
|
391.1
|
|
|||||||||||||
|
Provision for income taxes
|
—
|
|
—
|
|
—
|
|
—
|
|
—
|
|
119.1
|
|
119.1
|
|
|||||||||||||
|
Interest expense, net of capitalized interest
|
—
|
|
—
|
|
—
|
|
—
|
|
—
|
|
19.3
|
|
19.3
|
|
|||||||||||||
|
Depreciation and amortization
|
30.9
|
|
61.6
|
|
15.8
|
|
9.1
|
|
2.8
|
|
3.1
|
|
123.3
|
|
|||||||||||||
|
Stock-based compensation expense
|
0.9
|
|
0.9
|
|
0.3
|
|
—
|
|
—
|
|
7.6
|
|
9.7
|
|
|||||||||||||
|
Loss on sale or impairments of long-lived assets, net
|
—
|
|
—
|
|
—
|
|
—
|
|
—
|
|
6.8
|
|
6.8
|
|
|||||||||||||
|
Other operating credits and charges, net
|
—
|
|
—
|
|
—
|
|
—
|
|
—
|
|
4.9
|
|
4.9
|
|
|||||||||||||
|
Investment income
|
—
|
|
—
|
|
—
|
|
—
|
|
—
|
|
(10.5
|
)
|
(10.5
|
)
|
|||||||||||||
|
Other non-operating items
|
—
|
|
—
|
|
—
|
|
—
|
|
—
|
|
13.8
|
|
13.8
|
|
|||||||||||||
|
Adjusted EBITDA
|
$
|
220.5
|
|
$
|
489.8
|
|
$
|
31.8
|
|
$
|
33.4
|
|
$
|
(0.6
|
)
|
$
|
(97.4
|
)
|
$
|
677.5
|
|
||||||
|
Adjusted EBITDA Margin
|
24.9
|
%
|
37.6
|
%
|
8.7
|
%
|
21.5
|
%
|
(2.0
|
)%
|
NA
|
|
24.8
|
%
|
|||||||||||||
23
|
Year Ended December 31, 2016 (Dollar amounts in millions)
|
Siding
|
OSB
|
EWP
|
South America
|
Other
|
Corporate
|
Total
|
||||||||||||||||||||
|
Net income (loss)
|
$
|
128.0
|
|
$
|
187.8
|
|
$
|
(4.6
|
)
|
$
|
17.0
|
|
$
|
(2.0
|
)
|
$
|
(176.4
|
)
|
$
|
149.8
|
|
||||||
|
Reconciliation of net income (loss) to Adjusted EBITDA:
|
|||||||||||||||||||||||||||
|
Loss from discontinued operations
|
—
|
|
—
|
|
—
|
|
—
|
|
0.8
|
|
—
|
|
0.8
|
|
|||||||||||||
|
Benefit for income taxes
|
—
|
|
—
|
|
—
|
|
—
|
|
(0.3
|
)
|
—
|
|
(0.3
|
)
|
|||||||||||||
|
Income (loss) from continuing operations
|
128.0
|
|
187.8
|
|
(4.6
|
)
|
17.0
|
|
(1.5
|
)
|
(176.4
|
)
|
150.3
|
|
|||||||||||||
|
Provision for income taxes
|
—
|
|
—
|
|
—
|
|
—
|
|
—
|
|
19.8
|
|
19.8
|
|
|||||||||||||
|
Interest expense, net of capitalized interest
|
—
|
|
—
|
|
—
|
|
—
|
|
—
|
|
32.1
|
|
32.1
|
|
|||||||||||||
|
Depreciation and amortization
|
27.4
|
|
58.6
|
|
12.7
|
|
8.6
|
|
2.3
|
|
3.2
|
|
112.8
|
|
|||||||||||||
|
Stock-based compensation expense
|
0.9
|
|
1.0
|
|
0.6
|
|
—
|
|
—
|
|
10.5
|
|
13.0
|
|
|||||||||||||
|
Gain on sale or impairments of long-lived assets, net
|
—
|
|
—
|
|
—
|
|
—
|
|
—
|
|
(8.4
|
)
|
(8.4
|
)
|
|||||||||||||
|
Other operating credits and charges, net
|
—
|
|
—
|
|
—
|
|
—
|
|
—
|
|
17.4
|
|
17.4
|
|
|||||||||||||
|
Investment income
|
—
|
|
—
|
|
—
|
|
—
|
|
—
|
|
(8.2
|
)
|
(8.2
|
)
|
|||||||||||||
|
Other non-operating items
|
—
|
|
—
|
|
—
|
|
—
|
|
—
|
|
21.4
|
|
21.4
|
|
|||||||||||||
|
Adjusted EBITDA
|
$
|
156.3
|
|
$
|
247.4
|
|
$
|
8.7
|
|
$
|
25.6
|
|
$
|
0.8
|
|
$
|
(88.6
|
)
|
$
|
350.2
|
|
||||||
|
Adjusted EBITDA Margin
|
20.8
|
%
|
24.1
|
%
|
2.9
|
%
|
18.7
|
%
|
3.0
|
%
|
NA
|
|
15.7
|
%
|
|||||||||||||
The following table provides the reconciliation of net income (loss) to Adjusted income (loss):
|
For the years ended December 31,
|
|||||||||||||||||||
|
(Dollar amounts in millions)
|
2018
|
2017
|
2016
|
2015
|
2014
|
||||||||||||||
|
Net income (loss)
|
$
|
394.6
|
|
$
|
389.8
|
|
$
|
149.8
|
|
$
|
(88.1
|
)
|
$
|
(75.4
|
)
|
||||
|
Add (deduct):
|
|||||||||||||||||||
|
Loss from discontinued operations
|
4.2
|
|
1.3
|
|
0.5
|
|
2.1
|
|
(2.0
|
)
|
|||||||||
|
(Gain) loss on sale or impairment of long-lived assets, net
|
10.8
|
|
6.8
|
|
(8.4
|
)
|
2.1
|
|
(3.1
|
)
|
|||||||||
|
Other operating credits and charges, net
|
(2.2
|
)
|
4.9
|
|
17.4
|
|
16.3
|
|
7.5
|
|
|||||||||
|
Interest expense outside of normal operations
|
—
|
|
—
|
|
2.8
|
|
—
|
|
—
|
|
|||||||||
|
Other operating credits and charges, net associated with joint venture
|
—
|
|
—
|
|
—
|
|
(0.7
|
)
|
(1.0
|
)
|
|||||||||
|
Early debt extinguishment
|
—
|
|
—
|
|
17.3
|
|
—
|
|
—
|
|
|||||||||
|
Reported tax provision
|
122.3
|
|
119.1
|
|
19.8
|
|
(2.7
|
)
|
(27.2
|
)
|
|||||||||
|
Normalized tax provision at 25% for 2018 and 35% for 2014 - 2017
|
(132.4
|
)
|
(182.7
|
)
|
(69.7
|
)
|
24.9
|
|
35.4
|
|
|||||||||
|
Adjusted income (loss)
|
$
|
397.3
|
|
$
|
339.2
|
|
$
|
129.5
|
|
$
|
(46.1
|
)
|
$
|
(65.8
|
)
|
||||
24
The following table provides the calculation of return on capital invested.
|
For the years ended December 31,
|
|||||||||||||||||||
|
(Dollar amounts in millions)
|
2018
|
2017
|
2016
|
2015
|
2014
|
||||||||||||||
|
Debt
|
$
|
351.9
|
|
$
|
375.9
|
|
$
|
377.0
|
|
$
|
753.9
|
|
$
|
757.2
|
|
||||
|
Notes receivable from asset sales
|
—
|
|
(22.2
|
)
|
(22.2
|
)
|
(432.2
|
)
|
(432.2
|
)
|
|||||||||
|
Stockholders’ equity
|
1,700.2
|
|
1,604.5
|
|
1,195.7
|
|
1,017.0
|
|
1,115.8
|
|
|||||||||
|
Pension liabilities, net of pension assets
|
21.9
|
|
79.6
|
|
92.0
|
|
93.4
|
|
95.9
|
|
|||||||||
|
Invested capital
|
$
|
2,074.0
|
|
$
|
2,037.8
|
|
$
|
1,642.5
|
|
$
|
1,432.1
|
|
$
|
1,536.7
|
|
||||
|
Average invested capital
|
$
|
2,055.6
|
|
$
|
1,840.1
|
|
$
|
1,537.3
|
|
$
|
1,484.4
|
|
$
|
1,565.4
|
|
||||
|
Return on invested capital
|
19.3
|
%
|
18.5
|
%
|
8.4
|
%
|
(3.1
|
)%
|
(4.2
|
)%
|
|||||||||
OUR OPERATING RESULTS
Our results of operations for each of our segments are discussed below, as are results of operations for the “other” category which comprises other products that are not individually significant. See Note 24 of the Notes to the consolidated financial statements included in item 8 of this report for further information regarding our segments.
Siding
Our siding segment produces and markets wood-based siding and related accessories and OSB products. We believe that we are a leading wood composite exterior siding producer in North America. We manufacture exterior siding and other cladding products for the residential and commercial building markets, retail and non-residential structures.
Segment sales, operating profits and Adjusted EBITDA for this segment were as follows:
|
Dollar amounts in millions
|
|
|
|
Increase (decrease)
|
|||||||||||||
|
Year ended December 31,
|
2018
|
2017
|
2016
|
2018 - 2017
|
2017 - 2016
|
||||||||||||
|
Sales
|
$
|
942.3
|
|
$
|
884.0
|
|
$
|
752.3
|
|
7
|
%
|
18
|
%
|
||||
|
Operating profits
|
$
|
201.6
|
|
$
|
188.7
|
|
$
|
128.0
|
|
7
|
%
|
47
|
%
|
||||
|
Adjusted EBITDA
|
$
|
235.0
|
|
$
|
220.5
|
|
$
|
156.3
|
|
7
|
%
|
41
|
%
|
||||
|
Adjusted EBITDA margin
|
24.9
|
%
|
24.9
|
%
|
20.8
|
%
|
|||||||||||
Sales in this segment by product line were as follows:
|
Dollar amount in millions
|
|
|
|
Increase (decrease)
|
|||||||||||||
|
Year ended December 31,
|
2018
|
2017
|
2016
|
2018 - 2017
|
2017 - 2016
|
||||||||||||
|
SmartSide
®
strand siding
|
$
|
724.8
|
|
$
|
646.3
|
|
$
|
549.5
|
|
12
|
%
|
18
|
%
|
||||
|
SmartSide
®
fiber siding
|
106.4
|
|
111.3
|
|
108.1
|
|
(4
|
)%
|
3
|
%
|
|||||||
|
CanExel siding
|
37.3
|
|
49.4
|
|
43.2
|
|
(24
|
)%
|
14
|
%
|
|||||||
|
OSB - commodity
|
39.4
|
|
66.9
|
|
40.8
|
|
(41
|
)%
|
64
|
%
|
|||||||
|
OSB - value add
|
22.5
|
|
—
|
|
1.8
|
|
NA`
|
|
NA
|
|
|||||||
|
Other
|
11.9
|
|
10.1
|
|
8.9
|
|
18
|
%
|
13
|
%
|
|||||||
|
Total
|
$
|
942.3
|
|
$
|
884.0
|
|
$
|
752.3
|
|
||||||||
Percent changes in average sales prices and unit shipments are as follows:
25
|
|
2018 versus 2017
|
2017 versus 2016
|
|||||||||
|
|
Average Net
Selling Price
|
Unit
Shipments
|
Average Net
Selling Price
|
Unit
Shipments
|
|||||||
|
SmartSide
®
strand siding
|
5
|
%
|
8
|
%
|
5
|
%
|
12
|
%
|
|||
|
SmartSide
®
fiber siding
|
10
|
%
|
(13
|
)%
|
2
|
%
|
1
|
%
|
|||
|
CanExel siding
|
2
|
%
|
(25
|
)%
|
3
|
%
|
10
|
%
|
|||
|
OSB
|
8
|
%
|
(14
|
)%
|
27
|
%
|
24
|
%
|
|||
For
2018
compared to
2017
, sales volumes increased in our SmartSide strand line based upon increased demand in our key markets. Sales prices in our SmartSide strand product line for
2018
as compared to
2017
increased due to changes in product mix as well as a price increase, which was implemented in the first quarter of
2018
.
For
2018
compared to
2017
, sales volumes declined in our SmartSide fiber product line due to our decision to raise prices which slowed demand. Sales prices in our SmartSide fiber line for
2018
as compared to
2017
were higher due to a price increase implemented in the first quarter of
2018
.
For CanExel, sales volumes decreased in
2018
as compared to
2017
due to decreased demand in Canada due to customers re-balancing their inventories. Sales prices were higher for
2018
as compared to
2017
due to changes in our product mix and the fluctuations in the U.S. to Canadian dollar as majority of these sales are denominated in Canadian dollars.
For our OSB produced in the siding segment for
2018
compared to
2017
, sales prices increased as compared to the prior year, as discussed in the OSB segment below. Sales volumes were lower for
2018
compared to 2017 due to logistics challenges. We estimated Adjusted EBITDA associated with OSB produced and sold in the siding segment for
2018
was
$18.9 million
as compared to
$19.7 million
in 2017. The increase in selling price favorably impacted operating results and Adjusted EBITDA by approximately
$4.9 million
for
2018
as compared to
2017
.
Overall, the improvement in the siding segment for
2018
compared to
2017
was due to higher pricing and volume on our SmartSide strand products which were partially offset by increases in raw materials, primarily resin, expenses associated with the Dawson Creek conversion project, logistic challenges resulting in higher freight and lower throughput, principally at our Dawson Creek mill, and increases in sales and marketing expenses.
OSB
Our OSB segment manufactures and distributes OSB structural panel products in North America and certain export markets. OSB is an innovative, affordable and environmentally smart product. OSB is manufactured through the use of wood strands arranged in layers and bonded with resins and wax. Significant cost inputs to produce OSB and approximate breakdown percentages for
2018
include wood fiber (
29%
), resin and wax (
20%
), labor and burden (
16%
), utilities (
5%
) and manufacturing and other (
30%
).
Segment sales, operating profits and Adjusted EBITDA for this segment were as follows:
|
Dollar amounts in millions
|
|
|
|
Increase (decrease)
|
|||||||||||||
|
Year ended December 31,
|
2018
|
2017
|
2016
|
2018 - 2017
|
2017 - 2016
|
||||||||||||
|
Sales
|
$
|
1,305.2
|
|
$
|
1,302.5
|
|
$
|
1,027.7
|
|
—
|
%
|
27
|
%
|
||||
|
Operating profits
|
$
|
395.7
|
|
$
|
427.3
|
|
$
|
187.8
|
|
(7
|
)%
|
128
|
%
|
||||
|
Adjusted EBITDA
|
$
|
454.7
|
|
$
|
489.8
|
|
$
|
247.4
|
|
(7
|
)%
|
98
|
%
|
||||
|
Adjusted EBITDA margin
|
34.8
|
%
|
37.6
|
%
|
24.1
|
%
|
|||||||||||
26
Sales in this segment by product line were as follows:
|
Dollar amount in millions
|
|
|
|
Increase (decrease)
|
|||||||||||||
|
Year ended December 31,
|
2018
|
2017
|
2016
|
2018 - 2017
|
2017 - 2016
|
||||||||||||
|
OSB - commodity
|
$
|
746.0
|
|
$
|
765.5
|
|
$
|
626.0
|
|
(3
|
)%
|
22
|
%
|
||||
|
OSB - value-add
|
$
|
550.9
|
|
524.7
|
|
390.3
|
|
5
|
%
|
34
|
%
|
||||||
|
Other
|
$
|
8.3
|
|
12.3
|
|
11.4
|
|
(33
|
)%
|
8
|
%
|
||||||
|
$
|
1,305.2
|
|
$
|
1,302.5
|
|
$
|
1,027.7
|
|
|||||||||
Percent changes in average sales prices and unit shipments are as follows:
|
|
2018 versus 2017
|
2017 versus 2016
|
|||||||||
|
|
Average Net
Selling Price
|
Unit
Shipments
|
Average Net
Selling Price
|
Unit
Shipments
|
|||||||
|
OSB - commodity
|
—
|
%
|
(2
|
)%
|
31
|
%
|
(6
|
)%
|
|||
|
OSB - value add
|
4
|
%
|
—
|
%
|
24
|
%
|
8
|
%
|
|||
For
2018
as compared to
2017
, OSB prices increased likely due to the overall demand compared to the supply available in the market. Sales volumes for
2018
are higher in value-add and lower in commodity compared to 2017 due to our continued expansion of our value added footprint. The increase in selling price favorably impacted operating results and Adjusted EBITDA by $
24.8 million
. OSB sales volumes were essentially flat between periods.
Overall, the decline in operating results for OSB for
2018
as compared to
2017
was due to increased sales prices offset by increases in raw material costs (primarily resin) and increases in manufacturing costs due to downtime related to logistics associated with our Western Canadian operations, maintenance capital improvements and market curtailments (primarily in the fourth quarter).
Engineered Wood Products
Our EWP segment manufactures and distributes LVL, LSL, I-Joists and other related products. This segment also includes the sale of I-Joist and LVL products produced by our joint venture with Resolute Forest Products and under a sales and marketing arrangement with Murphy Plywood. Included in this segment is a plywood mill, which primarily produces plywood as a by-product from the LVL production process. OSB is also produced by our LSL facility.
Segment sales, operating profits (losses) and Adjusted EBITDA for this segment were as follows:
|
Dollar amount in millions
|
|
|
|
Increase (decrease)
|
|||||||||||||
|
Year ended December 31,
|
2018
|
2017
|
2016
|
2018 - 2017
|
2017 - 2016
|
||||||||||||
|
Sales
|
$
|
390.9
|
|
$
|
365.9
|
|
$
|
296.9
|
|
7
|
%
|
23
|
%
|
||||
|
Operating profits (losses)
|
$
|
19.5
|
|
$
|
15.7
|
|
$
|
(4.6
|
)
|
24
|
%
|
NM
|
|
||||
|
Adjusted EBITDA
|
$
|
35.0
|
|
$
|
31.8
|
|
$
|
8.7
|
|
10
|
%
|
266
|
%
|
||||
|
Adjusted EBITDA margin
|
9.0
|
%
|
8.7
|
%
|
2.9
|
%
|
|||||||||||
Sales in this segment by product line were as follows:
27
|
Dollar amount in millions
|
|
|
|
Increase (decrease)
|
|||||||||||||
|
Year ended December 31,
|
2018
|
2017
|
2016
|
2018 - 2017
|
2017 - 2016
|
||||||||||||
|
LVL
|
$
|
140.9
|
|
$
|
144.3
|
|
$
|
122.1
|
|
(2
|
)%
|
18
|
%
|
||||
|
LSL
|
59.2
|
|
46.8
|
|
37.8
|
|
26
|
%
|
24
|
%
|
|||||||
|
I-joist
|
122.1
|
|
116.9
|
|
99.4
|
|
4
|
%
|
18
|
%
|
|||||||
|
OSB - commodity
|
9.9
|
|
9.4
|
|
0.1
|
|
5
|
%
|
NM
|
|
|||||||
|
OSB - value add
|
13.9
|
|
13.2
|
|
10.7
|
|
5
|
%
|
23
|
%
|
|||||||
|
Plywood
|
28.7
|
|
25.1
|
|
15.8
|
|
14
|
%
|
59
|
%
|
|||||||
|
Related products
|
16.2
|
|
10.2
|
|
11.0
|
|
59
|
%
|
(7
|
)%
|
|||||||
|
Total
|
$
|
390.9
|
|
$
|
365.9
|
|
$
|
296.9
|
|
||||||||
Percent changes in average sales prices and unit shipments are as follows:
|
|
2018 versus 2017
|
2017 versus 2016
|
|||||||||
|
|
Average Net
Selling Price
|
Unit
Shipments
|
Average Net
Selling Price
|
Unit
Shipments
|
|||||||
|
LVL
|
9
|
%
|
(9
|
)%
|
5
|
%
|
11
|
%
|
|||
|
LSL
|
10
|
%
|
16
|
%
|
5
|
%
|
18
|
%
|
|||
|
I-joist
|
8
|
%
|
(1
|
)%
|
5
|
%
|
11
|
%
|
|||
|
OSB
|
11
|
%
|
(4
|
)%
|
2
|
%
|
105
|
%
|
|||
|
Plywood
|
8
|
%
|
5
|
%
|
14
|
%
|
40
|
%
|
|||
For
2018
as compared to
2017
, sales volumes increased in LSL and plywood due to improved market demand and continued penetration into new applications. Sales volumes declined in LVL due to customers rebalancing inventories. Net average selling prices increased due to changes in product mix and price increases implemented across all product lines. Plywood prices increased likely due to higher demand compared to the supply available in the market. The increase in selling prices for plywood favorably impacted operating results and Adjusted EBITDA by
$2.2 million
as compared to
2017
. The change in OSB pricing impacted operating results and Adjusted EBITDA by
$2.3 million
.
During the third quarter of
2018
, our Wilmington, N.C. engineered wood operation suffered damage in Hurricane Florence and has been temporarily shutdown. Cost associated with the repairs and clean up are included in our other operating charges and credits for 2018 of
$4.5 million
. It is expected that LP will receive reimbursement from our insurance carriers for costs in excess of our $5.0 million deductible.
Overall operating results for EWP for
2018
as compared to
2017
improved due to increased sales prices and reductions in manufacturing costs due to higher utilization across all EWP mills partially offset by increases in raw material costs, principally, lumber, veneer and OSB.
South America
Our South America segment manufactures and distributes OSB structural panel and siding products in South America and selected export markets. This segment has manufacturing operations in two countries, Chile and Brazil and operates sales offices in Chile, Brazil, Peru, Columbia and Argentina. During the fourth quarter of 2018, we commenced operations at the third mill in Chile.
Segment sales, operating profits and Adjusted EBITDA for this segment were as follows:
28
|
Dollar amount in millions
|
|
|
|
Increase (decrease)
|
|||||||||||||
|
Year ended December 31,
|
2018
|
2017
|
2016
|
2018 - 2017
|
2017 - 2016
|
||||||||||||
|
Sales
|
$
|
160.8
|
|
$
|
155.3
|
|
$
|
136.9
|
|
4
|
%
|
13
|
%
|
||||
|
Operating profits
|
$
|
31.0
|
|
$
|
24.3
|
|
$
|
17.0
|
|
28
|
%
|
43
|
%
|
||||
|
Adjusted EBITDA
|
$
|
40.1
|
|
$
|
33.4
|
|
$
|
25.6
|
|
20
|
%
|
30
|
%
|
||||
|
Adjusted EBITDA margin
|
24.9
|
%
|
21.5
|
%
|
18.7
|
%
|
|||||||||||
Sales in this segment by product were as follows:
|
Dollar amount in millions
|
|
|
|
Increase (decrease)
|
|||||||||||||
|
Year ended December 31,
|
2018
|
2017
|
2016
|
2018 - 2017
|
2017 - 2016
|
||||||||||||
|
OSB - value add
|
135.2
|
|
131.7
|
|
112.3
|
|
3
|
%
|
17
|
%
|
|||||||
|
Strand siding
|
21.5
|
|
19.7
|
|
19.6
|
|
9
|
%
|
1
|
%
|
|||||||
|
Other
|
4.1
|
|
3.9
|
|
5.0
|
|
5
|
%
|
(22
|
)%
|
|||||||
|
Total
|
$
|
160.8
|
|
$
|
155.3
|
|
$
|
136.9
|
|
||||||||
Percent changes in average sales prices and unit shipments for
2018
compared to
2017
are as follows:
|
|
2018 versus 2017
|
2017 versus 2016
|
|||||||||
|
|
Average Net
Selling Price
|
Unit
Shipments
|
Average Net
Selling Price
|
Unit
Shipments
|
|||||||
|
OSB
|
12
|
%
|
(8
|
)%
|
9
|
%
|
7
|
%
|
|||
|
Siding
|
4
|
%
|
5
|
%
|
6
|
%
|
(5
|
)%
|
|||
For
2018
, OSB sales volumes decreased compared to
2017
due to reduced demand in South America due to the slowing housing market in Chile and continued economic weakness across South America. Sales volumes increased due to continued sales penetration. Sales prices for OSB and siding increased due to price increases implemented in South America. For
2018
, siding volume was flat with the prior year.
For
2018
as compared to
2017
, operating results improved due to increases in sales prices partially offset by operating costs associated with the start up of the third mill in Chile.
Other
Our other products segment includes our joint venture that provides off-site framing for both residential and commercial construction, remaining timber and timberlands and other minor products, services and closed operations which are not classified as discontinued operations.
Sales, operating losses and Adjusted EBITDA for this category were as follows:
|
Dollar amount in millions
|
|
|
|
Increase (decrease)
|
|||||||||||||
|
Year ended December 31,
|
2018
|
2017
|
2016
|
2018 - 2017
|
2017 - 2016
|
||||||||||||
|
Sales
|
$
|
28.9
|
|
$
|
30.0
|
|
$
|
26.9
|
|
(4
|
)%
|
12
|
%
|
||||
|
Operating losses
|
$
|
(4.3
|
)
|
$
|
(3.4
|
)
|
$
|
(1.5
|
)
|
(26
|
)%
|
(127
|
)%
|
||||
|
Adjusted EBITDA
|
$
|
(2.3
|
)
|
$
|
(0.6
|
)
|
$
|
0.8
|
|
(283
|
)%
|
175
|
%
|
||||
GENERAL CORPORATE AND OTHER EXPENSE, NET
Net general corporate expense was
$111.7 million
in
2018
as compared to
$108.1 million
in
2017
. General corporate and other expenses primarily consist of corporate overhead such as wages and benefits, professional fees, insurance and other expenses for corporate functions including certain executive officers, public company costs, information technology, financial services, environmental and safety, legal, supply management, human resources and other
29
corporate functions. The increase in
2018
as compared to
2017
was primarily due to increased costs associated with corporate initiatives related to sales and marketing activities.
OTHER OPERATING CREDITS AND CHARGES, NET
For a discussion of other operating credits and charges, net, see Notes 1 and 16 of the Notes to the consolidated financial statements included in item 8 of this report.
GAIN (LOSS) ON SALES OF AND IMPAIRMENTS OF LONG-LIVED ASSETS
For a discussion of gain (loss) on sales of and impairments of long-lived assets, see Notes 1 and 17 of the Notes to the consolidated financial statements included in item 8 of this report.
NON-OPERATING INCOME (EXPENSE)
For a discussion of non-operating income (expense), see Note 12 of the Notes to the consolidated financial statements included in item 8 of this report.
INCOME TAXES
We recorded a tax provision in continuing operations of
$122.3 million
in
2018
and
$119.1 million
in
2017
. For
2018
, the primary differences between the U.S. statutory rate of 21% and the effective rate applied to continuing operations relate to state income tax, foreign tax rates, discretionary pension payments and tax deductions related to stock-based compensation. We paid
$89.9 million
of cash taxes and received
$0.2 million
in cash tax refunds in
2018
and expect to receive
$16.3 million
in tax refunds and pay
$21.0 million
in taxes payable from prior years in 2019.
DEFINED BENEFIT PENSION PLANS
We maintain several qualified and non-qualified defined benefit pension plans in the U.S. and Canada that cover a substantial portion of our employees. The measurement of liabilities related to these plans is based on management’s interpretation of the applicable plan provisions and assumptions related to future events, including expected return on plan assets and rate of compensation increases. The discount rate reflects the rate at which benefits could be effectively settled on the measurement date. The projected payment for each year is discounted using the rates specified by the yield curve. The sum of these discounted payments is the benefit obligation. The discount rate disclosed is the single rate applied to all projected payments that creates an equivalent obligation. Actual pension plan asset investment performance will either reduce or increase unamortized pension losses at the end of any fiscal year, which ultimately affects future pension costs. See Note 22 of the Notes to the consolidated financial statements included in item 8 of this report for further information on these plans.
For our U.S. plans, we used a long term rate of return assumption of
5.75%
in
2018
and
2017
to calculate the net periodic pension costs. For our Canadian plans, we used a long-term rate of return assumption of
3.25%
to
4.50%
in
2018
and
2017
to calculate the net periodic pension costs. For
2018
, our net periodic pension cost was
$6.6 million
and we estimate for
2019
our net periodic pension cost will be $
5.5 million
. This estimate assumes that we will have no curtailment or settlement expenses in
2019
. If a settlement or curtailment does occur in
2019
, this estimate may change significantly.
LEGAL AND ENVIRONMENTAL MATTERS
For a discussion of legal and environmental matters involving us and the potential impact thereof on our financial position, results of operations and cash flows, see Item 3 in this report as well as Note 18 in the Notes to the consolidated financial statements included in item 8 of this report.
LIQUIDITY AND CAPITAL RESOURCES
Overview
30
Our principal sources of liquidity are existing cash and investment balances, cash generated by our operations and our ability to borrow under such credit facilities as we may have in effect from time to time. We may also from time to time issue and sell equity, debt or hybrid securities or engage in other capital market transactions.
Our principal uses of liquidity are paying the costs and expenses associated with our operations, servicing outstanding indebtedness, dividends and making capital expenditures. We may also from time to time prepay or repurchase outstanding indebtedness or shares or acquire assets or businesses that are complementary to our operations. Any such repurchases may be commenced, suspended, discontinued or resumed, and the method or methods of effecting any such repurchases may be changed at any time or from time to time without prior notice.
Operating Activities
During
2018
, we generated
$510.5 million
of cash from operations as compared to
$473.7 million
of cash from operations in
2017
. This change reflects improved results of operations for
2018
primarily due to higher SmartSide strand volume. During
2018
, we made a discretionary contribution to our defined benefit pension plan of $33.2 million to maximize the tax savings allowed under the Tax Cuts and Jobs Act and lower our expenses associated with pension funding regulations going forward. Our accounts receivables increased
$3.4 million
during
2018
due to increased siding sales. Our accounts payable decreased by
$20.7 million
during
2018
primarily due to decreases in our salary and wages payable. During
2018
, we made
$2.2 million
in contingency payments and
$8.8 million
in warranty payments.
Investing Activities
During
2018
, we used
$238.2 million
in cash from investing activities. Capital expenditures for
2018
were
$214.2 million
, primarily related to the expansion in South America and siding operations as well as growth and maintenance capital. We also used $
45.0 million
to invest in an unconsolidated affiliate (see Note 9 in the Notes to the consolidated financial statements included in item 8 of this report for additional details). Additionally we received a payment of $
22.2 million
on notes receivable from asset sales. Included in accounts payable is
$22.1 million
related to capital expenditures that had not yet been paid as of
December 31, 2018
.
Capital expenditures in 2019 are expected to be approximately $150 million to $180 million related to expansions in our siding business and maintenance projects.
Financing Activities
In
2018
, net cash used in financing activities was
$317.0 million
. During
2018
, we used $
74.4 million
to pay cash dividends, $
211.8 million
to repurchase stock, $
24.7 million
to repay outstanding debt and
$9.3 million
for taxes related to net share settlement of equity awards.
CREDIT AGREEMENTS
In December 2013, we entered into a credit agreement with various lenders and American AgCredit, PCA, as administrative agent and CoBank, ACB, as letter of credit issuer. The credit agreement provides for a $200 million revolving credit facility, with a $60 million sublimit for letters of credit. The credit facility terminates and all loans made under the credit agreement become due in December 2022. As of
December 31, 2018
, no revolving borrowings were outstanding under the credit facility.
The credit agreement contains financial covenants that require us and our consolidated subsidiaries to have, as of the end of each quarter, (i) a capitalization ratio (i.e., funded debt to total capitalization) of no more than 40% and (ii) a current ratio (i.e, currents assets to current liabilities) of at least 2 to 1, in each case calculated in the manner specified in the credit agreement. As of
December 31, 2018
, we were in compliance with all financial covenants under the credit agreement. The credit agreement contains customary events of default, the occurrence of which could result in the acceleration of our obligation to repay the indebtedness outstanding thereunder.
LP Chile is a party to a term loan agreement with Banco de Credito e Inversiones for UF 943,543.7391 (equivalent to $39 million at the time of inception). The loan agreement has a term of 10 years with semi-annual principal
31
payments beginning in June of 2012. The loan bears interest at UF plus 3.9% per annum. The loan contains various restrictive covenants and requires the maintenance by LP Chile of a debt to equity ratio of less than or equal to 1. If LP Chile is late in making payments, LP Chile will also be required to maintain a ratio of net debt to earnings before interest, taxes, depreciation and amortization (EBITDA) of less than or equal to 2.5 and a ratio of EBITDA to financial costs of at least 3. The loan agreement also contains customary events of default, the occurrence of which could result in acceleration of our obligations to repay the indebtedness outstanding thereunder. Since this loan is denominated in other than U.S. dollars, the balance fluctuates based upon changes in the underlying currency rates. The impact of foreign currency exchange rates in
2018
was
$0.9 million
which was partially offset by a UF change of
$0.2 million
.
OTHER LIQUIDITY MATTERS
As of
December 31, 2018
, we had
$6.1 million
(
$19.3 million
, par value) of principal invested in auction rate securities (ARS). The ARS held by us are securities with long-term nominal maturities for which the interest rates were historically reset through a Dutch auction each month. We intend to continue to offer our ARS at auction and to consider other options, including alternative buyers and other potential transactions. We do not currently require our ARS to be liquidated in order to fund our day-to-day operations and we are prepared to hold them until maturity, if necessary.
Contingency Reserves
Contingency reserves, which represent an estimate of future cash needs for various contingencies (principally, payments for environmental reserves), totaled
$10.8 million
at
December 31, 2018
, of which
$2.3 million
is estimated to be payable within one year. As with all accounting estimates, there is inherent uncertainty concerning the reliability and precision of such estimates. As described above and in Note 18 of the Notes to the consolidated financial statements included in item 8 of this report, the amounts ultimately paid in resolving these contingencies could exceed the current reserves by a material amount.
Contractual Obligations
The table below summarizes our contractual obligations as of
December 31, 2018
over the next several years. See discussion above concerning provisions that could accelerate the due dates on our long-term debt.
|
Dollars amounts in millions
|
Payments due by period
|
||||||||||||||
|
Contractual obligations
|
Less than 1 year
|
1-3 years
|
3-5 years
|
More than 5 years
|
|||||||||||
|
Long-term debt
|
$
|
5.2
|
|
$
|
0.4
|
|
$
|
0.1
|
|
$
|
350.0
|
|
|||
|
Interest payments on long-term debt
1
|
17.2
|
|
34.1
|
|
34.1
|
|
17.1
|
|
|||||||
|
Operating leases
|
8.4
|
|
11.9
|
|
1.8
|
|
—
|
|
|||||||
|
Other long-term obligations
2
|
11.9
|
|
14.1
|
|
3.5
|
|
—
|
|
|||||||
|
Total contractual cash obligations
3,4
|
$
|
42.7
|
|
$
|
60.5
|
|
$
|
39.5
|
|
$
|
367.1
|
|
|||
_______________
|
1
|
The estimate of interest payments assumes interest is paid through the date of maturity or expiration of the related debt based upon stated rates in the respective debt instruments.
|
|
2
|
Other long term obligations primarily consist of obligations related to information technology infrastructure.
|
|
3
|
Unrecognized tax positions have been excluded from the above table as it is not reasonably possible to estimate when these may need to be paid. As of
December 31, 2018
, the amount of uncertain tax positions excluded from the above table is
$40.8 million
.
|
|
4
|
As of
December 31, 2018
, LP had warranty reserves of
$13.5 million
. These have been excluded from the above table as it is not reasonably possible to determine when these may need to be paid.
|
POTENTIAL IMPAIRMENTS
We continue to review several mills and investments for potential impairments. Management currently believes we have adequate support for the carrying value of each of these assets based upon the anticipated cash flows that result
32
from our estimates of future demand, pricing and production costs assuming certain levels of planned capital expenditures. As of
December 31, 2018
, the fair values of LP's facilities were substantially in excess of their carrying value, which supported the conclusion that no impairment is necessary for those facilities. However, if demand and pricing for the relevant products continues at levels significantly below cycle average demand and pricing, or should LP decide to invest capital in alternative projects, or should changes occur related to LP's wood supply for these locations, it is possible that impairment charges will be required.
We also review from time to time possible dispositions of various assets in light of current and anticipated economic and industry conditions, our strategic plan and other relevant factors. Because a determination to dispose of particular assets can require management to make assumptions regarding the transaction structure of the disposition and to estimate the net sales proceeds, which may be less than previous estimates of undiscounted future net cash flows, we may be required to record impairment charges in connection with decisions to dispose of assets.
PROSPECTIVE ACCOUNTING PRONOUNCEMENTS
See Note 2 for discussion of prospective accounting pronouncements in the Notes to the consolidated financial statements included in item 8 of this report.
33
ITEM 7A.
Quantitative and Qualitative Disclosures about Market Risk
Our international operations have exposure to foreign currency rate risks, primarily due to fluctuations in the Canadian dollar, Brazilian real and the Chilean peso. Although we have in the past entered into foreign exchange contracts associated with certain of our indebtedness and may continue to enter into foreign exchange contracts associated with major equipment purchases to manage a portion of the foreign currency rate risk, we historically have not entered into material currency rate hedges with respect to our exposure from operations, although we may do so in the future.
Some of our products are sold as commodities and therefore sales prices fluctuate daily based on market factors over which we have little or no control. The most significant commodity product we sell is OSB. Based upon an assumed North America annual production capacity in the OSB segment of
4.5 billion
square feet (3/8” basis) or
3.9 billion
square feet (7/16” basis), a $1 change in the annual average price per thousand square feet on 7/16” basis would change annual pre-tax profits by approximately
$3.9 million
.
We historically have not entered into material commodity futures and swaps, although we may do so in the future.
34
ITEM 8.
Financial Statements and Supplementary Data
REPORT OF INDEPENDENT REGISTERED PUBLIC ACCOUNTING FIRM
To the Board of Directors and Stockholders of Louisiana-Pacific Corporation:
Opinion on the Financial Statements
We have audited the accompanying consolidated balance sheets of Louisiana-Pacific Corporation and subsidiaries (the “Company”) as of December 31, 2018 and 2017, the related consolidated statements of income, comprehensive income, cash flows, and stockholders’ equity for each of the three years in the period ended December 31, 2018, and the related notes (collectively referred to as the “financial statements”). In our opinion, the financial statements present fairly, in all material respects, the financial position of the Company as of December 31, 2018 and 2017, and the results of its operations and its cash flows for each of the three years in the period ended December 31, 2018, in conformity with accounting principles generally accepted in the United States of America.
We have also audited, in accordance with the standards of the Public Company Accounting Oversight Board (United States) (PCAOB), the Company’s internal control over financial reporting as of December 31, 2018, based on criteria established in
Internal Control-Integrated Framework (2013)
issued by the Committee of Sponsoring Organizations of the Treadway Commission and our report dated February 14, 2019, expressed an unqualified opinion on the Company’s internal control over financial reporting.
Basis for Opinion
These financial statements are the responsibility of the Company’s management. Our responsibility is to express an opinion on the Company’s financial statements based on our audits. We are a public accounting firm registered with the PCAOB and are required to be independent with respect to the Company in accordance with the U.S. federal securities laws and the applicable rules and regulations of the Securities and Exchange Commission and the PCAOB.
We conducted our audits in accordance with the standards of the PCAOB. Those standards require that we plan and perform the audit to obtain reasonable assurance about whether the financial statements are free of material misstatement, whether due to error or fraud. Our audits included performing procedures to assess the risks of material misstatement of the financial statements, whether due to error or fraud, and performing procedures that respond to those risks. Such procedures included examining, on a test basis, evidence regarding the amounts and disclosures in the financial statements. Our audits also included evaluating the accounting principles used and significant estimates made by management, as well as evaluating the overall presentation of the financial statements. We believe that our audits provide a reasonable basis for our opinion.
/s/ DELOITTE & TOUCHE LLP
Nashville, Tennessee
February 14, 2019
We have served as the Company’s auditor since 1997.
35
Consolidated Balance Sheets
Dollar amounts in millions
|
|
|||||||
|
|
December 31,
|
||||||
|
|
2018
|
2017
|
|||||
|
ASSETS
|
|||||||
|
Current assets:
|
|||||||
|
Cash and cash equivalents
|
$
|
878.4
|
|
$
|
928.0
|
|
|
|
Receivables, net of allowance for doubtful accounts of $0.8 million and $0.9 million at December 31, 2018 and 2017
|
127.6
|
|
142.5
|
|
|||
|
Inventories
|
273.0
|
|
259.1
|
|
|||
|
Prepaid expenses and other current assets
|
8.2
|
|
7.8
|
|
|||
|
Current portion of notes receivable from asset sales
|
—
|
|
22.2
|
|
|||
|
Total current assets
|
1,287.2
|
|
1,359.6
|
|
|||
|
Timber and timberlands
|
62.4
|
|
55.7
|
|
|||
|
Property, plant and equipment, net
|
1,010.4
|
|
926.1
|
|
|||
|
Goodwill and other intangible assets
|
26.2
|
|
26.7
|
|
|||
|
Investments in and advances to affiliates
|
49.4
|
|
7.8
|
|
|||
|
Restricted cash
|
13.4
|
|
13.3
|
|
|||
|
Other assets
|
61.2
|
|
56.8
|
|
|||
|
Deferred tax asset
|
3.9
|
|
2.5
|
|
|||
|
Total assets
|
$
|
2,514.1
|
|
$
|
2,448.5
|
|
|
|
LIABILITIES AND STOCKHOLDERS’ EQUITY
|
|||||||
|
Current liabilities:
|
|||||||
|
Current portion of long-term debt
|
$
|
5.0
|
|
$
|
25.1
|
|
|
|
Accounts payable and accrued liabilities
|
233.3
|
|
237.1
|
|
|||
|
Income taxes payable
|
21.0
|
4.5
|
|||||
|
Current portion of contingency reserves
|
2.3
|
|
3.4
|
|
|||
|
Total current liabilities
|
261.6
|
|
270.1
|
|
|||
|
Long-term debt, excluding current portion
|
346.9
|
|
350.8
|
|
|||
|
Deferred income taxes
|
62.2
|
|
33.4
|
|
|||
|
Contingency reserves, excluding current portion
|
8.5
|
|
11.7
|
|
|||
|
Other long-term liabilities
|
134.7
|
|
178.0
|
|
|||
|
Stockholders’ equity:
|
|||||||
|
Preferred stock, $1 par value, 15,000,000 shares authorized, no shares issued
|
—
|
|
—
|
|
|||
|
Common stock, $1 par value, 200,000,000 shares authorized, 153,358,542 shares issued
|
153.4
|
|
153.4
|
|
|||
|
Additional paid-in capital
|
458.2
|
|
470.6
|
|
|||
|
Retained earnings
|
1,612.6
|
|
1,280.1
|
|
|||
|
Treasury stock, 16,525,351 shares and 8,462,949 shares, at cost
|
(377.6
|
)
|
(177.5
|
)
|
|||
|
Accumulated comprehensive loss
|
(146.4
|
)
|
(122.1
|
)
|
|||
|
Total stockholders’ equity
|
1,700.2
|
|
1,604.5
|
|
|||
|
Total liabilities and stockholders’ equity
|
$
|
2,514.1
|
|
$
|
2,448.5
|
|
|
See Notes to the Consolidated Financial Statements.
Consolidated Statements of Income
Dollar amounts in millions, except per share
|
|
Year ended December 31,
|
||||||||||
|
|
2018
|
2017
|
2016
|
||||||||
|
Net sales
|
$
|
2,828.0
|
|
$
|
2,733.9
|
|
$
|
2,233.4
|
|
||
|
Cost of sales
|
2,084.0
|
|
1,998.1
|
|
1,829.1
|
|
|||||
|
Gross profit
|
744.0
|
|
735.8
|
|
404.3
|
|
|||||
|
Selling and administrative
|
209.3
|
|
191.3
|
|
185.1
|
|
|||||
|
(Gain) loss on sale or impairment of long lived assets, net
|
10.8
|
|
6.8
|
|
(8.4
|
)
|
|||||
|
Other operating credits and charges, net
|
(2.2
|
)
|
4.9
|
|
17.4
|
|
|||||
|
Income from operations
|
526.1
|
|
532.8
|
|
210.2
|
|
|||||
|
Non-operating income (expense):
|
|||||||||||
|
Interest expense, net of capitalized interest
|
(15.8
|
)
|
(19.3
|
)
|
(32.1
|
)
|
|||||
|
Investment income
|
17.6
|
|
10.5
|
|
8.2
|
|
|||||
|
Other non-operating items
|
(3.9
|
)
|
(13.8
|
)
|
(21.4
|
)
|
|||||
|
Total non-operating income (expense)
|
(2.1
|
)
|
(22.6
|
)
|
(45.3
|
)
|
|||||
|
Income from continuing operations before income taxes and equity in (income) loss of unconsolidated affiliate
|
524.0
|
|
510.2
|
|
164.9
|
|
|||||
|
Provision for income taxes
|
122.3
|
|
119.1
|
|
19.8
|
|
|||||
|
Equity in (income) loss of unconsolidated affiliates
|
2.9
|
|
—
|
|
(5.2
|
)
|
|||||
|
Income from continuing operations
|
398.8
|
|
391.1
|
|
150.3
|
|
|||||
|
Loss from discontinued operations before taxes
|
(5.6
|
)
|
(2.0
|
)
|
(0.8
|
)
|
|||||
|
Benefit for income taxes
|
(1.4
|
)
|
(0.7
|
)
|
(0.3
|
)
|
|||||
|
Loss from discontinued operations
|
(4.2
|
)
|
(1.3
|
)
|
(0.5
|
)
|
|||||
|
Net income
|
$
|
394.6
|
|
$
|
389.8
|
|
$
|
149.8
|
|
||
|
Basic net income per share:
|
|||||||||||
|
Income per share from continuing operations
|
$
|
2.79
|
|
$
|
2.71
|
|
$
|
1.05
|
|
||
|
Loss per share from discontinued operations
|
(0.03
|
)
|
(0.01
|
)
|
(0.01
|
)
|
|||||
|
Net income per share
|
$
|
2.76
|
|
$
|
2.70
|
|
$
|
1.04
|
|
||
|
Diluted net income per share:
|
|||||||||||
|
Income per share from continuing operations
|
$
|
2.76
|
|
$
|
2.67
|
|
$
|
1.03
|
|
||
|
Loss per share from discontinued operations
|
(0.03
|
)
|
(0.01
|
)
|
—
|
|
|||||
|
Net income per share
|
$
|
2.73
|
|
$
|
2.66
|
|
$
|
1.03
|
|
||
|
Average shares of common stock used to compute net income per share:
|
|||||||||||
|
Basic
|
143.0
|
|
144.4
|
|
143.4
|
|
|||||
|
Diluted
|
144.4
|
|
146.4
|
|
145.3
|
|
|||||
See Notes to the Consolidated Financial Statements.
37
Consolidated Statements of Comprehensive Income
Dollar amounts in millions
|
|
Year ended December 31,
|
||||||||||
|
|
2018
|
2017
|
2016
|
||||||||
|
Net income
|
$
|
394.6
|
|
$
|
389.8
|
|
$
|
149.8
|
|
||
|
Other comprehensive income (loss), net of tax
|
|||||||||||
|
Foreign currency translation adjustments
|
(17.3
|
)
|
6.6
|
|
8.8
|
|
|||||
|
Unrealized gains (losses) on securities, net of reversals
|
0.1
|
|
0.8
|
|
(0.6
|
)
|
|||||
|
Defined benefit pension plans:
|
|||||||||||
|
Change benefit obligations, translation adjustment
|
0.7
|
|
(0.4
|
)
|
(0.5
|
)
|
|||||
|
Net gain (loss)
|
2.3
|
|
2.5
|
|
(2.9
|
)
|
|||||
|
Amortization of amounts included in net periodic benefit cost:
|
|||||||||||
|
Actuarial loss, net of tax
|
5.7
|
|
6.1
|
|
3.5
|
|
|||||
|
Prior service cost, net of tax
|
0.4
|
|
0.3
|
|
0.3
|
|
|||||
|
Other
|
0.5
|
|
(0.8
|
)
|
0.3
|
|
|||||
|
Other comprehensive income (loss), net of tax
|
(7.6
|
)
|
15.1
|
|
8.9
|
|
|||||
|
Comprehensive income
|
$
|
387.0
|
|
$
|
404.9
|
|
$
|
158.7
|
|
||
See Notes to the Consolidated Financial Statements.
38
Consolidated Statements of Cash Flows
Dollar amounts in millions
|
|
Year ended December 31,
|
||||||||||
|
|
2018
|
2017
|
2016
|
||||||||
|
CASH FLOWS FROM OPERATING ACTIVITIES
|
|||||||||||
|
Net income
|
$
|
394.6
|
|
$
|
389.8
|
|
$
|
149.8
|
|
||
|
Adjustments to reconcile net income to net cash provided by operating activities:
|
|||||||||||
|
Depreciation and amortization
|
120.0
|
|
123.3
|
|
112.8
|
|
|||||
|
Equity in (income) loss of unconsolidated affiliates, including dividends
|
3.3
|
|
(0.8
|
)
|
1.5
|
|
|||||
|
Other operating credits and charges, net
|
2.2
|
|
4.9
|
|
17.4
|
|
|||||
|
(Gain) loss on sale or impairment of long-lived assets, net
|
10.8
|
|
6.8
|
|
(8.4
|
)
|
|||||
|
Loss on early debt extinguishment
|
—
|
|
—
|
|
17.3
|
|
|||||
|
Stock-based compensation
|
8.6
|
|
9.7
|
|
13.0
|
|
|||||
|
Exchange (gain) loss on remeasurement
|
(1.1
|
)
|
2.1
|
|
(2.0
|
)
|
|||||
|
Cash settlements of warranty, net of accruals
|
(2.9
|
)
|
(6.8
|
)
|
(13.6
|
)
|
|||||
|
Cash settlement of contingencies, net of accruals
|
(2.3
|
)
|
(1.0
|
)
|
(0.7
|
)
|
|||||
|
Pension contributions
|
(41.1
|
)
|
(12.8
|
)
|
(7.0
|
)
|
|||||
|
Pension expense
|
7.5
|
|
14.1
|
|
10.7
|
|
|||||
|
Other adjustments, net
|
1.2
|
|
1.5
|
|
3.4
|
|
|||||
|
Changes in assets and liabilities (net of acquisitions):
|
|||||||||||
|
(Increase) decrease in receivables
|
3.4
|
|
(35.0
|
)
|
(8.9
|
)
|
|||||
|
Increase in inventories
|
(1.9
|
)
|
(22.7
|
)
|
(11.0
|
)
|
|||||
|
(Increase) decrease in prepaid expenses
|
(0.4
|
)
|
(1.6
|
)
|
1.0
|
|
|||||
|
Increase (decrease) in accounts payable and accrued liabilities
|
(20.7
|
)
|
22.5
|
|
53.8
|
|
|||||
|
Increase (decrease) in income taxes payable or deferred income taxes
|
29.3
|
|
(20.3
|
)
|
13.2
|
|
|||||
|
Net cash provided by operating activities
|
510.5
|
|
473.7
|
|
342.3
|
|
|||||
|
CASH FLOWS FROM INVESTING ACTIVITIES
|
|||||||||||
|
Property, plant, and equipment additions
|
(214.2
|
)
|
(148.6
|
)
|
(124.8
|
)
|
|||||
|
Proceeds from asset sales
|
1.0
|
|
3.2
|
|
0.3
|
|
|||||
|
Acquisition of businesses, net of cash acquired
|
—
|
|
(20.8
|
)
|
—
|
|
|||||
|
Investment in unconsolidated affiliates
|
(45.0
|
)
|
—
|
|
—
|
|
|||||
|
Receipt of proceeds from notes receivable from asset sales
|
22.2
|
|
—
|
|
410.0
|
|
|||||
|
Payment of long-term deposit
|
—
|
|
(32.0
|
)
|
—
|
|
|||||
|
Other investing activities, net
|
(2.2
|
)
|
(0.4
|
)
|
(0.4
|
)
|
|||||
|
Net cash provided by (used in) investing activities
|
(238.2
|
)
|
(198.6
|
)
|
285.1
|
|
|||||
|
CASH FLOWS FROM FINANCING ACTIVITIES
|
|||||||||||
|
Borrowings of long-term debt
|
—
|
|
—
|
|
350.0
|
|
|||||
|
Repayment of long-term debt
|
(24.7
|
)
|
(2.6
|
)
|
(742.5
|
)
|
|||||
|
Payment of debt issuance fees
|
—
|
|
(0.5
|
)
|
(5.2
|
)
|
|||||
|
Payment of cash dividends
|
(74.4
|
)
|
—
|
|
—
|
|
|||||
|
Purchase of treasury stock
|
(211.8
|
)
|
—
|
|
—
|
|
|||||
|
Taxes paid related to net share settlement of equity awards
|
(9.3
|
)
|
(5.9
|
)
|
(9.2
|
)
|
|||||
|
Other financing activities, net
|
3.2
|
|
(0.4
|
)
|
(0.1
|
)
|
|||||
|
Net cash used in financing activities
|
(317.0
|
)
|
(9.4
|
)
|
(407.0
|
)
|
|||||
|
Effect of exchange rate on cash, cash equivalents and restricted cash
|
(4.8
|
)
|
3.1
|
|
3.1
|
|
|||||
|
Net increase (decrease) in cash, cash equivalents and restricted cash
|
(49.5
|
)
|
268.8
|
|
223.5
|
|
|||||
|
Cash, cash equivalents and restricted cash at beginning of year
|
941.3
|
|
672.5
|
|
449.0
|
|
|||||
|
Cash, cash equivalents and restricted cash at end of year
|
$
|
891.8
|
|
$
|
941.3
|
|
$
|
672.5
|
|
||
See Notes to the Consolidated Financial Statements.
39
Consolidated Statements of Stockholders’ Equity
Dollar and share amounts in millions, except per share amounts
|
|
Common Stock
|
Treasury Stock
|
Additional
Paid-In
Capital
|
Retained
Earnings
|
Accumulated
Comprehensive
Loss
|
Total
Stockholders’
Equity
|
|||||||||||||||||||||
|
|
Shares
|
Amount
|
Shares
|
Amount
|
|||||||||||||||||||||||
|
Balance as of December 31, 2015
|
153.0
|
|
$
|
153.0
|
|
10.0
|
|
$
|
(210.6
|
)
|
$
|
496.5
|
|
$
|
724.2
|
|
$
|
(146.1
|
)
|
$
|
1,017.0
|
|
|||||
|
Cumulative effect of adoption of accounting principle
|
|
|
|
|
(0.4
|
)
|
16.3
|
|
|
15.9
|
|
||||||||||||||||
|
Net income
|
|
|
|
|
|
149.8
|
|
|
149.8
|
|
|||||||||||||||||
|
Issuance of shares under stock plans
|
|
|
|
|
(1.5
|
)
|
30.8
|
(30.4
|
)
|
|
|
0.4
|
|
||||||||||||||
|
Exercise of stock warrants
|
0.4
|
|
0.4
|
|
|
|
(0.4
|
)
|
|
|
—
|
|
|||||||||||||||
|
Compensation expense associated with stock plans
|
12.9
|
|
12.9
|
|
|||||||||||||||||||||||
|
Taxes paid related to net settlement of equity awards
|
|
|
|
|
0.5
|
|
(9.2
|
)
|
|
|
|
|
(9.2
|
)
|
|||||||||||||
|
Other comprehensive loss
|
|
|
|
|
|
8.9
|
|
8.9
|
|
||||||||||||||||||
|
Balance as of December 31, 2016
|
153.4
|
|
153.4
|
|
9.0
|
|
(189.0
|
)
|
478.2
|
|
890.3
|
|
(137.2
|
)
|
1,195.7
|
|
|||||||||||
|
Net income
|
|
|
|
|
|
389.8
|
|
|
389.8
|
|
|||||||||||||||||
|
Issuance of shares under stock plans
|
|
|
(0.9
|
)
|
17.7
|
|
(17.1
|
)
|
|
|
0.6
|
|
|||||||||||||||
|
Compensation expense associated with stock plans
|
9.5
|
|
9.5
|
|
|||||||||||||||||||||||
|
Taxes paid related to net settlement of equity awards
|
|
|
0.3
|
|
(6.2
|
)
|
|
|
|
|
(6.2
|
)
|
|||||||||||||||
|
Other comprehensive loss
|
|
|
|
|
|
|
15.1
|
|
15.1
|
|
|||||||||||||||||
|
Balance as of December 31, 2017
|
153.4
|
|
153.4
|
|
8.4
|
|
(177.5
|
)
|
470.6
|
|
1,280.1
|
|
(122.1
|
)
|
1,604.5
|
|
|||||||||||
|
Cumulative effect of adoption of accounting principles
|
|
|
|
|
|
|
|
|
|
|
12.3
|
|
(16.7
|
)
|
(4.4
|
)
|
|||||||||||
|
Net income
|
|
|
|
|
|
|
|
|
|
|
394.6
|
|
|
|
394.6
|
|
|||||||||||
|
Dividends paid
|
(74.4
|
)
|
(74.4
|
)
|
|||||||||||||||||||||||
|
Issuance of shares under stock plans
|
|
|
|
|
(1.0
|
)
|
21.0
|
|
(21.0
|
)
|
|
|
|
|
—
|
|
|||||||||||
|
Purchase of treasury stock
|
8.6
|
|
(211.8
|
)
|
(211.8
|
)
|
|||||||||||||||||||||
|
Compensation expense associated with stock plans
|
8.6
|
|
8.6
|
|
|||||||||||||||||||||||
|
Taxes paid related to net settlement of equity awards
|
|
|
|
|
0.5
|
|
(9.3
|
)
|
|
|
|
|
|
|
(9.3
|
)
|
|||||||||||
|
Other comprehensive income
|
|
|
|
|
|
|
|
|
|
|
|
|
(7.6
|
)
|
(7.6
|
)
|
|||||||||||
|
Balance as of December 31, 2018
|
153.4
|
|
$
|
153.4
|
|
16.5
|
|
$
|
(377.6
|
)
|
$
|
458.2
|
|
$
|
1,612.6
|
|
$
|
(146.4
|
)
|
$
|
1,700.2
|
|
|||||
See Notes to the Consolidated Financial Statements
40
INDEX TO THE NOTES TO THE CONSOLIDATED FINANCIAL STATEMENTS
|
Note:
|
Description
|
Page No.
|
|
Note 1:
|
||
|
Note 2:
|
||
|
Note 3:
|
||
|
Note 4:
|
||
|
Note 5:
|
||
|
Note 6:
|
||
|
Note 7:
|
||
|
Note 8:
|
||
|
Note 9:
|
||
|
Note 10:
|
||
|
Note 11:
|
||
|
Note 12:
|
||
|
Note 13:
|
||
|
Note 14:
|
||
|
Note 15
|
||
|
Note 16:
|
||
|
Note 17:
|
||
|
Note 18:
|
||
|
Note 19:
|
||
|
Note 20:
|
||
|
Note 21:
|
||
|
Note 22:
|
||
|
Note 23:
|
||
|
Note 24:
|
||
|
Note 25:
|
||
41
NOTES TO THE CONSOLIDATED FINANCIAL STATEMENTS
|
1.
|
SUMMARY OF SIGNIFICANT ACCOUNTING POLICIES
|
Nature of Operations
Louisiana-Pacific Corporation and our subsidiaries are a leading provider of high-performance building solutions. We design, manufacture and market a broad range of products for the new home construction, repair and remodeling and outdoor structures markets. In addition to our U.S. operations, the Company also maintains manufacturing facilities in Canada, Chile and Brazil through foreign subsidiaries and joint ventures. The principal customers for our building products are retail home centers, manufactured housing producers, distributors and wholesalers in North America and South America, with limited sales to Asia, Australia and Europe. References to "LP", "the Company", "we", "our" and "us" refers to Louisiana-Pacific Corporation and its consolidated subsidiaries as a whole.
See Note 24 below for further information regarding our products and segments.
Use of Estimates in the Preparation of Financial Statements
The preparation of financial statements in conformity with accounting principles generally accepted in the U.S. requires management to make estimates and assumptions that affect the reported amounts of assets and liabilities and disclosure of contingent assets and liabilities at the date of the financial statements and the reported amounts of revenues and expenses during the reporting period. Actual results could differ from those estimates.
Consolidation
The consolidated financial statements include the accounts of LP and our majority-owned subsidiaries. All intercompany transactions, profits and balances have been eliminated.
Cash and Cash Equivalents
Cash and cash equivalents includes cash on hand and short-term investments of 3 months or less when purchased. These investments are stated at cost, which approximates market value.
Investments
Our long-term investments are classified as available-for-sale and are reported at estimated fair value. Unrealized gains and losses, net of tax, on these investments are reported as a separate component of “Accumulated comprehensive loss” in Stockholders’ Equity until realized. Impairment losses are charged to income for other-than-temporary declines in fair value. Realized gains and losses (including impairments) are recorded in “Investment income” in the Consolidated Statements of Income. For purposes of computing realized gains and losses, cost is identified on a specific identification basis. See Note 4 for further discussion.
Fair Value of Financial Instruments
We have, where appropriate, estimated the fair value of financial instruments. These fair value amounts may be significantly affected by the assumptions used, including the discount rate and estimates of cash flows. Accordingly, the estimates presented are not necessarily indicative of the amounts that could be realized in a current market exchange.
42
Inventory
Inventories are valued at the lower of cost or net realizable value. Inventory costs include materials, labor and operating overhead. The LIFO (last-in, first-out) method is used for a minor portion of our log inventories with the remaining inventories valued at FIFO (first-in, first-out) or average cost. Included in the inventory balance as of
December 31, 2018
is a valuation allowance of
$10.9 million
. Inventory consists of the following:
|
|
December 31,
|
||||||
|
Dollar amounts in millions
|
2018
|
2017
|
|||||
|
Logs
|
$
|
56.9
|
|
$
|
60.3
|
|
|
|
Other raw materials
|
24.8
|
|
20.8
|
|
|||
|
Semi finished inventory
|
23.4
|
|
24.3
|
|
|||
|
Finished products
|
167.9
|
|
153.7
|
|
|||
|
Total
|
$
|
273.0
|
|
$
|
259.1
|
|
|
Timber and Timberlands
Timber and timberlands is comprised of timber deeds and allocations of purchase price to Canadian timber harvesting licenses. Timber deeds are transactions in which we purchase timber, but not the underlying land. The cost of timber deeds are capitalized in timber and timberlands and charged to cost of timber harvested as the volume is removed. Timber that has been severed but has not yet been delivered to a facility is included in timber and timberlands. The values associated with timber licenses were allocated in the purchase price allocations for Le Groupe Forex (Forex), Peace Valley OSB, and the assets of Evans Forest Products. These licenses have a life of twenty to twenty-five years. These licenses are amortized on a straight-line basis over the life of the facilities. See Note 8 for further discussion.
Canadian timber harvesting licenses also include future requirements for reforestation. The fair value of the future estimated reforestation obligation is accrued and recognized in cost of sales on the basis of the volume of timber harvested; fair value is determined by discounting the estimated future cash flows using a credit adjusted risk-free rate. Subsequent changes to fair value resulting from the passage of time and revisions to fair value calculations are recognized in earnings as they occur.
Property, Plant and Equipment
Property, plant and equipment, including capitalized interest, are recorded at cost. Depreciation is principally calculated by the units of production method for machinery and equipment which amortizes the cost of equipment over the estimated units that will be produced during its useful life. Provisions for depreciation of buildings, land improvements and the remaining machinery and equipment have been computed using straight-line rates based on the estimated service lives. The effective straight-line lives for the principal classes of property range from three to twenty years. Depreciation expense can be attributed to Cost of sales and Selling and administrative as noted below:
|
Dollar amounts in millions
|
Years ended December 31,
|
||||||||||
|
2018
|
2017
|
2016
|
|||||||||
|
Cost of sales
|
$
|
116.8
|
|
$
|
120.1
|
|
$
|
109.6
|
|
||
|
Selling and administrative
|
3.2
|
|
3.2
|
|
3.2
|
|
|||||
|
Total depreciation and amortization
|
$
|
120.0
|
|
$
|
123.3
|
|
$
|
112.8
|
|
||
Logging road construction costs are capitalized and included in land and land improvements. These costs are amortized as the timber volume adjacent to the road system is harvested.
We capitalize interest on borrowed funds during construction periods. Capitalized interest is charged to and amortized over the lives of the related assets. Capitalized interest totaled
$4.0 million
in
2018
and $
2.2 million
2017
.
43
Plant, property and equipment, net consists of the following:
|
Dollar amounts in millions
|
December 31,
|
||||||
|
2018
|
2017
|
||||||
|
Property, plant and equipment, at cost:
|
|||||||
|
Land, land improvements and logging roads, net of road amortization
|
$
|
168.6
|
|
$
|
162.7
|
|
|
|
Buildings
|
329.9
|
|
347.5
|
|
|||
|
Machinery and equipment
|
1,949.0
|
|
1,977.4
|
|
|||
|
Construction in progress
|
148.1
|
|
98.5
|
|
|||
|
2,595.6
|
|
2,586.1
|
|
||||
|
Accumulated depreciation
|
(1,585.2
|
)
|
(1,660.0
|
)
|
|||
|
Property, plant and equipment, net
|
$
|
1,010.4
|
|
$
|
926.1
|
|
|
Potential Impairments
Long-lived assets to be held and used by us (primarily property, plant and equipment and timber and timberlands) are reviewed for impairment when events or changes in circumstances indicate that the carrying amount of the assets may not be recoverable. When impairment is indicated, the book values of the assets are written down to their estimated fair value as calculated by the expected discounted cash flow or estimated net sales price. See Note 17 for a discussion of charges in
2018
,
2017
and
2016
related to impairments of property, plant and equipment. Long-lived assets that are held for sale are written down to the estimated sales proceeds less cost to sell unless the estimated net proceeds exceed the carrying value.
Goodwill and Intangible assets
Goodwill is tested for impairment on an annual basis, and when indicators of impairment are determined to exist. Impairment is evaluated by applying a fair value based test. Impairment losses would be recognized whenever the implied fair value of goodwill is less than its carrying value. Intangible assets with finite useful lives are amortized generally on a straight-line basis over the periods benefited. Impairment of the intangible asset is evaluated when factors indicate impairment may exist. See Note 8 for further discussion.
Investments in Affiliates
LP accounts for investments in affiliates when LP does not have a controlling financial interest using the equity method under which LP’s share of earnings and losses of the affiliate is reflected in earnings and dividends are credited against the investment in affiliate when declared. See Note 9 for further discussion.
Restricted Cash
Our restricted cash accounts generally secure outstanding letters of credit.
Income Taxes
We account for income taxes under an asset and liability approach that requires the recognition of deferred tax assets and liabilities for the expected future tax consequences of events that have been recognized in our financial statements or tax returns. In estimating future tax consequences, we generally consider all expected future events other than the enactment of changes in tax laws or rates. The effect on deferred tax assets and liabilities of a change in tax rates will be recognized as income or expense in the period that includes the enactment date. Additionally, deferred tax assets are reduced by a valuation allowance when it is more likely than not that some portion of the deferred tax assets will not be realized.
44
We recognize liabilities for uncertain tax positions through a two-step process. The first step is to evaluate the tax position for recognition by determining if the weight of the available evidence indicates that it is more likely than not that the position will be sustained on audit, including resolution of related appeals or litigation process, if any. The second step requires us to estimate and measure the tax benefit as the largest amount that is more than 50% likely to be realized upon ultimate settlement. It is inherently difficult and subjective to estimate such amounts, as LP must determine the probability for various outcomes. LP evaluates these uncertain tax provisions when new information becomes available. These revaluations are based upon factors including, but not limited to, changes in circumstances, changes in tax law, successful settlement of issues under audit and new audit activity. Such a change in recognition or measurement could result in the recognition of a tax benefit or an increase to the related provision.
We classify interest related to income taxes liabilities or uncertain tax positions as interest expense or interest income and, if applicable, penalties are recognized as a component of income tax expense.
See Note 11 for further discussion of deferred income taxes.
Asset Retirement Obligations
We record the fair value of the legal and conditional obligations to retire and remove long-lived assets in the period which the obligation is incurred. These obligations primarily consist of monitoring costs on closed landfills, timber reforestation obligations associated with LP’s timber licenses in Canada and site restoration costs. When the related liability is initially recorded, we capitalize the cost by increasing the carrying amount of the related long-lived asset. Over time, the liability is accreted to its settlement value and the capitalized cost is depreciated over the useful life of the related asset. Upon settlement of the liability, we recognize a gain or loss for any difference between the settlement amount and the liability recorded. See Note 15 for further discussion.
Stock-Based Compensation
We recognize the cost of employee services received in exchange for awards of equity instruments, such as performance shares, restricted stock or restricted stock units and stock-settled stock appreciation rights (SSARs), based upon the fair value of those awards at the date of grant over the requisite service period. See Note 14 for further discussion.
Foreign Currency Translation
The functional currency for our Canadian subsidiaries is the U.S. dollar; however, the books and records for these subsidiaries are maintained in the Canadian dollar. The financial statements of these foreign subsidiaries are remeasured into U.S. dollars using the historical exchange rate for property, plant and equipment, timber and timberlands (related depreciation and amortization on both property, plant and equipment and timber and timberlands), goodwill, and certain other non-monetary assets.We use the exchange rate at the balance sheet date for the remaining assets and liabilities, including deferred taxes. A weighted-average exchange rate is used for each period for revenues and expenses. These transaction gains or losses are recorded in “Other non-operating income (expense)” on the Consolidated Statements of Income.
The functional currencies of our Argentinean, Brazilian, Chilean, Columbian and Peruvian subsidiaries is the local currency and therefore their books and records are maintained in the local currency. Translation adjustments, which are based upon the exchange rate at the balance sheet date for assets and liabilities and the weighted-average rate for the income statement, are recorded in “Accumulated comprehensive income (loss)” in Stockholders’ equity.
Advertising costs
Advertising costs, which amounted to
$21.3 million
,
$19.1 million
and
$19.6 million
in 2018, 2017 and 2016, are principally expensed as incurred. Advertising costs include product displays, media production costs, agency fees, sponsorships and cooperating advertising.
45
Other Operating Credits and Charges, Net
We classify significant amounts unrelated to ongoing core operating activities as “Other operating credits and charges, net” in the Consolidated Statements of Income. Such items include, but are not limited to, amounts related to restructuring charges (including severance charges), charges to establish and maintain litigation or environmental reserves, product reserves, prior year adjustments, retirement charges and gains or losses from settlements with governmental or other organizations. Due to the nature of these items, amounts in the income statement can fluctuate from year to year. The determination of which items are considered significant and unrelated to core operations is based upon management’s judgment. See Note 16 for a discussion of specific amounts in
2018
,
2017
and
2016
.
Retirement Benefits
We are required to use actuarial methods and assumptions in the valuation of defined benefit obligations and the determination of expense. Difference between actual and expected results or changes in the values of the obligations and plan assets are not recognized in earnings as they occur but, rather, systematically and gradually over subsequent periods. See Note 22 for further information.
Comprehensive Income
Comprehensive income consists of net income (loss) and other gains and losses affecting shareholders’ equity that are excluded from net income (loss), including foreign currency translation adjustments, costs associated with pension or other post retirement benefits that have not been recognized as components of net periodic benefit costs, and net unrealized gains or losses on securities and is presented in the accompanying Consolidated Statements of Comprehensive Income. See Note 23 for further discussion.
2. PRESENT AND PROSPECTIVE ACCOUNTING PRONOUNCEMENTS
Adoption of New Accounting Standards
On January 1, 2018, we adopted ASU 2014-09, "Revenue from Contracts with Customers" (ASC 606), and all the related amendments to all contracts using the modified retrospective method. We recognized the cumulative effect of initially applying the new revenue standard as an adjustment to the opening balance of retained earnings. The comparative information has not been restated and continues to be reported under the accounting standards in effect for those periods. We expect the impact of the adoption of the new revenue standard to be immaterial to our net income on an ongoing basis. Recognition of a portion of our sales revenue has been delayed due to the timing of satisfying the performance obligations. The new revenue standard also provided additional clarity that resulted in reclassifications to or from net sales and selling, general and administrative expenses.
On January 1, 2018, we adopted ASU 2018-02, “Income Statement - Reporting Comprehensive Income (Topic 220): Reclassification of Certain Tax Effects from Accumulated Other Comprehensive Income.” The guidance allows us to reclassify the stranded tax effects within Accumulated other comprehensive income to Retained earnings in each period in which the effect of the change in the U.S. federal corporate income tax rate in the 2017 Tax Cuts and Jobs Act (the Tax Act) is recorded.
The cumulative effect of the changes made to our Consolidated Balance Sheet as of January 1, 2018 for the adoption of ASU 2014-09 and ASU 2018-02, were as follows:
46
|
Dollar amounts in millions
|
Balance at December 31, 2017
|
ASU 2014-09
|
ASU 2018-02
|
Balance at January 1, 2018
|
|||||||||||
|
Receivables, net of allowance for doubtful accounts
|
$
|
142.5
|
|
$
|
(21.7
|
)
|
$
|
—
|
|
$
|
120.8
|
|
|||
|
Inventories
|
259.1
|
|
15.8
|
|
—
|
|
274.9
|
|
|||||||
|
Deferred tax asset
|
2.5
|
|
1.5
|
|
—
|
|
4.0
|
|
|||||||
|
Retained earnings
|
1,280.1
|
|
(4.4
|
)
|
16.7
|
|
1,292.4
|
|
|||||||
|
Accumulated comprehensive loss
|
(122.1
|
)
|
—
|
|
(16.7
|
)
|
(138.8
|
)
|
|||||||
In accordance with the new revenue standard requirements, the disclosure of the impact on our Consolidated Statement of Income and Consolidated Balance Sheet is as follows:
|
Year ended December 31, 2018
|
|||||||||||
|
Dollar amounts in millions
|
As reported
|
Balances without adoption of ASC 606
|
Effect of Change Higher (Lower)
|
||||||||
|
Consolidated Statement of Income
|
|||||||||||
|
Net sales
|
$
|
2,828.0
|
|
$
|
2,829.6
|
|
$
|
(1.6
|
)
|
||
|
Cost of sales
|
2,084.0
|
|
2,082.0
|
|
2.0
|
|
|||||
|
Selling, general and administrative expenses
|
209.3
|
|
213.8
|
|
(4.5
|
)
|
|||||
|
Provision for income taxes
|
122.3
|
|
122.1
|
|
0.2
|
|
|||||
|
Net income
|
394.6
|
|
393.9
|
|
0.7
|
|
|||||
|
Consolidated Balance Sheet
|
December 31, 2018
|
||||||||||
|
Receivables, net of allowance for doubtful accounts
|
$
|
127.6
|
|
$
|
146.6
|
|
$
|
(19.0
|
)
|
||
|
Inventory
|
$
|
273.0
|
|
$
|
259.2
|
|
$
|
13.8
|
|
||
|
Income taxes payable
|
$
|
21.0
|
|
$
|
22.3
|
|
$
|
(1.3
|
)
|
||
|
Retained earnings
|
$
|
1,612.6
|
|
$
|
1,616.3
|
|
$
|
(3.7
|
)
|
||
On January 1, 2018, we adopted ASU 2017-07, "Retirement Benefits - Improving the Presentation of Net Periodic Pension Cost and Net Periodic Postretirement Benefit Cost" (an amendment to ASC 715), to improve the presentation of net periodic pension and postretirement benefit costs. We retrospectively adopted the presentation of service cost separate from the other components of net periodic costs. The interest cost, expected return on assets, amortization of prior service costs, amortization of net actuarial losses and settlement costs have been reclassified from Cost of sales, Selling, general and administrative expenses and Other operating credits and charges to Non-operating income (expense). We elected to apply the practical expedient which allows us to reclassify amounts disclosed previously in the retirement benefits note as the basis for applying retrospective presentation for comparative periods as it is impracticable to determine the disaggregation of the cost components for amounts capitalized and amortized in those periods. On a prospective basis, the other components of net periodic benefit costs (excluding service cost) will not be included in amounts capitalized in inventory or property, plant, and equipment.
In addition to the effects of ASU 2017-07, we have reclassified depreciation and amortization into the financial statement caption that reflects the category of the expense to be more comparable with our peers.
The effect of the retrospective presentation change related to the net periodic cost of our defined benefit pension and postretirement plans and the reclassification of depreciation and amortization on our Consolidated Statement of Income for the years ended
December 31, 2017
and
2016
is as follows:
47
|
Year ended December 31, 2017
|
|||||||||||||||
|
Dollar amounts in millions
|
As reported
|
ASU 2017-07
|
Reclassifications
|
As adjusted
|
|||||||||||
|
Consolidated Statement of Income
|
|||||||||||||||
|
Cost of sales (exclusive of depreciation and amortization shown separately below)
|
$
|
1,882.0
|
|
$
|
(4.0
|
)
|
$
|
120.1
|
|
$
|
1,998.1
|
|
|||
|
Depreciation and amortization
|
123.3
|
|
—
|
|
(123.3
|
)
|
—
|
|
|||||||
|
Selling, general and administrative expenses
|
190.4
|
|
(2.3
|
)
|
3.2
|
|
191.3
|
|
|||||||
|
Other operating credits and charges, net
|
8.0
|
|
(3.1
|
)
|
—
|
|
4.9
|
|
|||||||
|
Income from operations
|
523.4
|
|
9.4
|
|
—
|
|
532.8
|
|
|||||||
|
Total non-operating income (expense)
|
(13.2
|
)
|
(9.4
|
)
|
—
|
|
(22.6
|
)
|
|||||||
|
Year ended December 31, 2016
|
||||||||||||||
|
Dollar amounts in millions
|
As reported
|
ASU 2017-07
|
Reclassifications
|
As adjusted
|
||||||||||
|
Consolidated Statement of Income
|
||||||||||||||
|
Cost of sales (exclusive of depreciation and amortization shown separately below)
|
$
|
1,724.0
|
|
$
|
(4.5
|
)
|
109.6
|
|
$
|
1,829.1
|
|
|||
|
Depreciation and amortization
|
112.8
|
|
|
(112.8
|
)
|
—
|
|
|||||||
|
Selling, general and administrative expenses
|
183.6
|
|
(1.7
|
)
|
3.2
|
|
185.1
|
|
||||||
|
Income from operations
|
204.0
|
|
6.2
|
|
—
|
|
210.2
|
|
||||||
|
Total non-operating income (expense)
|
(39.1
|
)
|
(6.2
|
)
|
—
|
|
(45.3
|
)
|
||||||
On January 1, 2018, we adopted ASU 2016-18, "Statement of Cash Flows (Topic 230): Restricted Cash." The adoption of this standard requires the inclusion of the change in amounts described as restricted cash or restricted cash equivalents to be included as part of our Consolidated Statement of Cash Flows.
In accordance with
disclosure requirements of this new accounting standard, the impact of adoption on our Consolidated Statement of Cash Flows for the years ended
December 31, 2017
and
2016
is as follows:
|
Year ended December 31, 2017
|
|||||||||||
|
Dollar amounts in millions
|
As reported
|
ASU 2016-18
|
As adjusted
|
||||||||
|
Consolidated Statement of Cash Flows
|
|||||||||||
|
Net cash provided by (used in) investing activities
|
$
|
(198.6
|
)
|
$
|
—
|
|
$
|
(198.6
|
)
|
||
|
Effect of exchange rate on cash, cash equivalents and restricted cash
|
3.0
|
|
0.1
|
|
3.1
|
|
|||||
|
Net increase in cash, cash equivalents and restricted cash
|
268.7
|
|
0.1
|
|
268.8
|
|
|||||
|
Cash, cash equivalents and restricted cash at beginning of period
|
659.3
|
|
13.2
|
|
672.5
|
|
|||||
|
Cash, cash equivalents and restricted cash at end of period
|
928.0
|
|
13.3
|
|
941.3
|
|
|||||
48
|
Year ended December 31, 2016
|
|||||||||||
|
Dollar amounts in millions
|
As reported
|
ASU 2016-18
|
As adjusted
|
||||||||
|
Consolidated Statement of Cash Flows
|
|||||||||||
|
Net cash provided by (used in) investing activities
|
$
|
286.3
|
|
$
|
(1.2
|
)
|
$
|
285.1
|
|
||
|
Effect of exchange rate on cash, cash equivalents and restricted cash
|
3.0
|
|
0.1
|
|
3.1
|
|
|||||
|
Net increase in cash, cash equivalents and restricted cash
|
224.6
|
|
(1.1
|
)
|
223.5
|
|
|||||
|
Cash, cash equivalents and restricted cash at beginning of period
|
434.7
|
|
14.3
|
|
449.0
|
|
|||||
|
Cash, cash equivalents and restricted cash at end of period
|
659.3
|
|
13.2
|
|
672.5
|
|
|||||
Accounting Standards Issued But Not Yet Adopted
In March 2016, the Financial Accounting Standards Board (FASB) issued ASU 2016-02, "Leases (Topic 842)", which supersedes the lease accounting requirements in ASC Topic 840, "Leases". The new standard requires entities to recognize, separately from each other, an asset for its right to use (ROU) the underlying asset equal to the liability for its finance and operating lease obligations. Further, the entity is required to present separately the current and non-current portion of the ROU asset and corresponding lease liability. In July 2018, the FASB issued ASU 2018-10, "Codification Improvements to Topic 842, Leases", which clarifies certain aspects of the new lease standard. The amendments in this ASU address the rate implicit in the lease, impairment of the net investment in the lease, lessee reassessment of lease classification, lessor reassessment of lease term and purchase options, variable payments that depend on an index or rate and certain transition adjustments, among other things. In July 2018, the FASB issued ASU 2018-11, "Leases (Topic 842) Targeted Improvements", which provides an additional (and optional) transition method whereby the new lease standard is applied at the adoption date and recognized as an adjustment to retained earnings. The amendments have the same effective date and transition requirements as the new lease standard. We will adopt the standard on January 1, 2019, using this optional transition method and plan to elect all practical expedients. We do not expect the adoption of this new standard to have a material impact on our consolidated results of operations and financial position.
In October 2016, the FASB issued ASU 2016-16, "Income Taxes (Topic 740), Intra-Entity Transfers of Assets Other Than Inventory." The standard provides guidance that entities recognize the income tax consequences of an intra-entity transfer of an asset other than inventory when the transfer occurs. Consequently, the amendments eliminate the exception for an intra-entity transfer of an asset other than inventory. The new standard is effective for annual reporting periods beginning after December 15, 2018, and interim reporting periods within annual periods beginning after December 15, 2019. Early adoption is permitted for all entities as of the beginning of an annual reporting period for which financial statements (interim or annual) have not been issued or made available for issuance. We do not expect the adoption of this new standard to have a material impact on our consolidated results of operations and financial position.
In January 2017, the FASB issued ASU 2017-04, "Intangibles—Goodwill and Other (Topic 350)". The standard simplifies the accounting for goodwill impairments by eliminating step 2 from the goodwill impairment test. Instead, if the carrying amount of a reporting unit exceeds its fair value, an impairment loss shall be recognized in an amount equal to that excess, limited to the total amount of goodwill allocated to that reporting unit. The new standard is effective for fiscal years beginning after December 15, 2019, and interim periods within those fiscal years. We do not expect the adoption of this new standard to have a material impact on our consolidated results of operations and financial position.
In August 2018, the FASB issued ASU 2018-13, "Fair Value Measurement (Topic 820): Disclosure Framework - Changes to the Disclosure Requirements for Fair Value Measurement", which amends ASC 820 to add and remove disclosure requirements related to fair value measurement. The amendments include new disclosure requirement for changes in unrealized gains or losses included in Other Comprehensive Income (OCI) for recurring Level 3 fair value measurements held at the end of the reporting period and the range and weighted average used to develop significant unobservable inputs for Level 3 fair value measurements. The amendments eliminated disclosure requirements for amount of and reasons for transfers between Level 1 and Level 2, valuation processes for Level 3 fair value measurements, and policy for timing of transfers between levels of the fair value hierarchy. In addition,
49
the amendments modified certain disclosure requirement to provide clarification or to promote appropriate exercise of discretion by entities. ASU 2018-13 is effective for fiscal years beginning after December 15, 2019, including interim periods therein. Early adoption is permitted. We are currently evaluating the impact that the adoption of this guidance will have on our financial statements and related disclosures.
In August 2018, the FASB issued ASU 2018-14, "Disclosure Framework - Changes to the Disclosure Requirements for Defined Benefit Plans", which amends ASC 715 to add, remove, and clarify disclosure requirements related to defined benefit pension and other postretirement plans. The amended guidance modifies the disclosure requirements for employers that sponsor defined benefit pension or other post-retirement plans by removing and adding certain disclosures for these plans. The eliminated disclosures include (a) the amounts in accumulated OCI expected to be recognized in net periodic benefit costs over the next fiscal year, and (b) the effects of a one percentage point change in assumed health care cost trend rates on the net periodic benefit costs and the benefit obligation for post-retirement health care benefits. Additional disclosures include descriptions of significant gains and losses affecting the benefit obligation for the period. The amended guidance is effective for fiscal years ending after December 15, 2020. Early adoption is permitted. The adoption of this guidance will modify our disclosures but will not have a material effect on our consolidated financial statements.
In August 2018, the FASB issued ASU 2018-15, "Customer's Accounting for Implementation Costs Incurred in a Cloud Computing Arrangement That is a Service Contract", which provides additional guidance on the accounting for costs of implementation activities performed in a cloud computing arrangement that is a service contract. The amendments require an entity in such arrangements to account for implementation costs in the same manner as internal-use software as outlined in ASC 350. The amended guidance is effective for fiscal years beginning after December 15, 2019, and interim periods within those fiscal years. Early adoption is permitted. We are currently evaluating the impact that the adoption of this guidance will have on our financial statements and related disclosures.
3. REVENUE
Revenue is recognized when obligations under the terms of a contract (purchase orders) with our customers are satisfied; generally, this occurs with the transfer of control of our products. Revenue is measured as the amount of consideration we expect to receive in exchange for transferring goods. Shipping cost incurred by us to deliver products to our customers are recorded in cost of sales. The expected costs associated with our warranties continue to be recognized as expense when the products are sold. We recognize revenue as of a point in time.
During
2018
,
2017
and
2016
, LP's top ten customers accounted for approximately
44%
,
46%
and
41%
of its sales in the aggregate. No individual customer exceeded
10%
of LP's sales in
2018
,
2017
or
2016
.
Customer programs and incentives are a common practice in our businesses. Our businesses incur customer program costs to obtain favorable product placement, to promote sales of products and to maintain competitive pricing. Customer program costs and incentives, including rebates and promotion and volume allowances, are accounted for as deductions from net sales at the time the program is initiated. These reductions from revenue are recorded at the later of the time of sale or the implementation of the program based on management’s best estimates. Estimates are based on historical and projected experience for each type of program or customer. Volume allowances are accrued based on management’s estimates of customer volume achievement and other factors incorporated into customer agreements, such as new product purchases, store sell-through and merchandising support. Management periodically reviews accruals for these rebates and allowances, and adjusts accruals when circumstances indicate (typically as a result of a change in volume expectations). As of December 31, 2018 and 2017; we had
$30.1 million
and
$24.2 million
accrued as customer rebates recorded in Accounts payable and accrued liabilities on our Consolidated Balance Sheets.
We ship some of our products to customers' distribution centers on a consignment basis. We retain title to our products stored at the distribution centers. As our products are removed from the distribution centers by retailers and shipped to retailers’ stores, title passes from us to the retailers. At that time, we invoice the retailers and recognize revenue for these consignment transactions. We do not offer a right of return for products shipped to the retailers’ stores from the distribution centers. The amount of consignment inventory as of December 31, 2018 and 2017 was
$9.5 million
and
$18.3 million
.
50
The following tables disaggregate our revenue by product line and product type by segment for the years ended December 31:
|
Year Ended December 31, 2018
|
|||||||||||||||||||||||||||
|
By Product family:
|
Siding
|
OSB
|
EWP
|
South America
|
Other
|
Inter-segment
|
Total
|
||||||||||||||||||||
|
SmartSide
®
Strand siding
|
$
|
724.8
|
|
$
|
—
|
|
$
|
—
|
|
$
|
21.5
|
|
$
|
—
|
|
$
|
—
|
|
$
|
746.3
|
|
||||||
|
SmartSide
®
Fiber siding
|
106.4
|
|
—
|
|
—
|
|
—
|
|
—
|
|
—
|
|
106.4
|
|
|||||||||||||
|
CanExel
®
siding
|
37.3
|
|
—
|
|
—
|
|
—
|
|
—
|
|
—
|
|
37.3
|
|
|||||||||||||
|
OSB - commodity
|
39.4
|
|
746.0
|
|
9.9
|
|
—
|
|
—
|
|
(0.1
|
)
|
795.2
|
|
|||||||||||||
|
OSB - value-add
|
22.5
|
|
550.9
|
|
13.9
|
|
135.2
|
|
—
|
|
—
|
|
722.5
|
|
|||||||||||||
|
LVL
|
—
|
|
—
|
|
140.9
|
|
—
|
|
—
|
|
—
|
|
140.9
|
|
|||||||||||||
|
LSL
|
—
|
|
—
|
|
59.2
|
|
—
|
|
—
|
|
—
|
|
59.2
|
|
|||||||||||||
|
I-joist
|
—
|
|
—
|
|
122.1
|
|
—
|
|
—
|
|
—
|
|
122.1
|
|
|||||||||||||
|
Plywood
|
—
|
|
—
|
|
28.7
|
|
—
|
|
—
|
|
—
|
|
28.7
|
|
|||||||||||||
|
Other
|
11.9
|
|
8.3
|
|
16.2
|
|
4.1
|
|
28.9
|
|
—
|
|
69.4
|
|
|||||||||||||
|
$
|
942.3
|
|
$
|
1,305.2
|
|
$
|
390.9
|
|
$
|
160.8
|
|
$
|
28.9
|
|
$
|
(0.1
|
)
|
$
|
2,828.0
|
|
|||||||
|
By Product type:
|
|||||||||||||||||||||||||||
|
Commodity
|
$
|
39.4
|
|
$
|
746.0
|
|
$
|
38.6
|
|
$
|
—
|
|
$
|
—
|
|
$
|
(0.1
|
)
|
$
|
823.9
|
|
||||||
|
Value-add
|
891.0
|
|
550.9
|
|
336.1
|
|
156.7
|
|
—
|
|
—
|
|
1,934.7
|
|
|||||||||||||
|
Other
|
11.9
|
|
8.3
|
|
16.2
|
|
4.1
|
|
28.9
|
|
—
|
|
69.4
|
|
|||||||||||||
|
$
|
942.3
|
|
$
|
1,305.2
|
|
$
|
390.9
|
|
$
|
160.8
|
|
$
|
28.9
|
|
$
|
(0.1
|
)
|
$
|
2,828.0
|
|
|||||||
|
Year Ended December 31, 2017
|
|||||||||||||||||||||||||||
|
By Product family:
|
Siding
|
OSB
|
EWP
|
South America
|
Other
|
Inter-segment
|
Total
|
||||||||||||||||||||
|
SmartSide
®
Strand siding
|
$
|
646.3
|
|
$
|
—
|
|
$
|
—
|
|
$
|
19.7
|
|
$
|
—
|
|
$
|
(3.6
|
)
|
$
|
662.4
|
|
||||||
|
SmartSide
®
Fiber siding
|
111.3
|
|
—
|
|
—
|
|
—
|
|
—
|
|
—
|
|
111.3
|
|
|||||||||||||
|
CanExel
®
siding
|
49.4
|
|
—
|
|
—
|
|
—
|
|
—
|
|
—
|
|
49.4
|
|
|||||||||||||
|
OSB - commodity
|
66.9
|
|
765.5
|
|
9.4
|
|
—
|
|
—
|
|
—
|
|
841.8
|
|
|||||||||||||
|
OSB - value-add
|
—
|
|
524.7
|
|
13.2
|
|
131.7
|
|
—
|
|
—
|
|
669.6
|
|
|||||||||||||
|
LVL
|
—
|
|
—
|
|
144.3
|
|
—
|
|
—
|
|
—
|
|
144.3
|
|
|||||||||||||
|
LSL
|
—
|
|
—
|
|
46.8
|
|
—
|
|
—
|
|
(0.1
|
)
|
46.7
|
|
|||||||||||||
|
I-joist
|
—
|
|
—
|
|
116.9
|
|
—
|
|
—
|
|
(0.1
|
)
|
116.8
|
|
|||||||||||||
|
Plywood
|
—
|
|
—
|
|
25.1
|
|
—
|
|
—
|
|
—
|
|
25.1
|
|
|||||||||||||
|
Other
|
10.1
|
|
12.3
|
|
10.2
|
|
3.9
|
|
30.0
|
|
—
|
|
66.5
|
|
|||||||||||||
|
$
|
884.0
|
|
$
|
1,302.5
|
|
$
|
365.9
|
|
$
|
155.3
|
|
$
|
30.0
|
|
$
|
(3.8
|
)
|
$
|
2,733.9
|
|
|||||||
|
By Product type:
|
|||||||||||||||||||||||||||
|
Commodity
|
$
|
66.9
|
|
$
|
765.5
|
|
$
|
34.5
|
|
$
|
—
|
|
$
|
—
|
|
$
|
—
|
|
$
|
866.9
|
|
||||||
|
Value-add
|
807.0
|
|
524.7
|
|
321.2
|
|
151.4
|
|
—
|
|
(3.8
|
)
|
1,800.5
|
|
|||||||||||||
|
Other
|
10.1
|
|
12.3
|
|
10.2
|
|
3.9
|
|
30.0
|
|
—
|
|
66.5
|
|
|||||||||||||
|
$
|
884.0
|
|
$
|
1,302.5
|
|
$
|
365.9
|
|
$
|
155.3
|
|
$
|
30.0
|
|
$
|
(3.8
|
)
|
$
|
2,733.9
|
|
|||||||
51
|
Year Ended December 31, 2016
|
|||||||||||||||||||||||||||
|
By Product family:
|
Siding
|
OSB
|
EWP
|
South America
|
Other
|
Inter-segment
|
Total
|
||||||||||||||||||||
|
SmartSide
®
Strand siding
|
$
|
549.5
|
|
$
|
—
|
|
$
|
—
|
|
$
|
19.6
|
|
$
|
—
|
|
$
|
(1.5
|
)
|
$
|
567.6
|
|
||||||
|
SmartSide
®
Fiber siding
|
108.1
|
|
—
|
|
—
|
|
—
|
|
—
|
|
—
|
|
108.1
|
|
|||||||||||||
|
CanExel
®
siding
|
43.2
|
|
—
|
|
—
|
|
—
|
|
—
|
|
—
|
|
43.2
|
|
|||||||||||||
|
OSB - commodity
|
40.8
|
|
626.0
|
|
0.1
|
|
—
|
|
—
|
|
(5.8
|
)
|
661.1
|
|
|||||||||||||
|
OSB - value-add
|
1.8
|
|
390.3
|
|
10.7
|
|
112.3
|
|
—
|
|
—
|
|
515.1
|
|
|||||||||||||
|
LVL
|
—
|
|
—
|
|
122.1
|
|
—
|
|
—
|
|
—
|
|
122.1
|
|
|||||||||||||
|
LSL
|
—
|
|
—
|
|
37.8
|
|
—
|
|
—
|
|
—
|
|
37.8
|
|
|||||||||||||
|
I-joist
|
—
|
|
—
|
|
99.4
|
|
—
|
|
—
|
|
—
|
|
99.4
|
|
|||||||||||||
|
Plywood
|
—
|
|
—
|
|
15.8
|
|
—
|
|
—
|
|
—
|
|
15.8
|
|
|||||||||||||
|
Other
|
8.9
|
|
11.4
|
|
11.0
|
|
5.0
|
|
26.9
|
|
—
|
|
63.2
|
|
|||||||||||||
|
$
|
752.3
|
|
$
|
1,027.7
|
|
$
|
296.9
|
|
$
|
136.9
|
|
$
|
26.9
|
|
$
|
(7.3
|
)
|
$
|
2,233.4
|
|
|||||||
|
By Product type:
|
|||||||||||||||||||||||||||
|
Commodity
|
$
|
40.8
|
|
$
|
626.0
|
|
$
|
15.9
|
|
$
|
—
|
|
$
|
—
|
|
$
|
(5.8
|
)
|
$
|
676.9
|
|
||||||
|
Value-add
|
702.6
|
|
390.3
|
|
270.0
|
|
131.9
|
|
—
|
|
(1.5
|
)
|
1,493.3
|
|
|||||||||||||
|
Other
|
8.9
|
|
11.4
|
|
11.0
|
|
5.0
|
|
26.9
|
|
—
|
|
63.2
|
|
|||||||||||||
|
$
|
752.3
|
|
$
|
1,027.7
|
|
$
|
296.9
|
|
$
|
136.9
|
|
$
|
26.9
|
|
$
|
(7.3
|
)
|
$
|
2,233.4
|
|
|||||||
|
4.
|
INVESTMENTS
|
Long-term investments held by us are debt securities designated as available for sale and are reported at fair market value using the specific identification method. The following table summarizes unrealized gains and losses related to these investments as of
December 31, 2018
and
December 31, 2017
:
|
Dollar amounts in millions
|
Amortized Cost
|
Gross Unrealized Gains
|
Gross Unrealized Losses
|
Fair Value
|
|||||||||||
|
December 31, 2018
|
$
|
0.4
|
|
$
|
5.7
|
|
$
|
—
|
|
$
|
6.1
|
|
|||
|
December 31, 2017
|
$
|
0.4
|
|
$
|
5.6
|
|
$
|
—
|
|
$
|
6.0
|
|
|||
As of
December 31, 2018
, we had
$6.1 million
(
$19.3 million
, par value) invested in auction rate securities (ARS). The ARS held by us are securities with long-term nominal maturities for which the interest rates may be reset through a Dutch auction each month. Our investments in ARS represent interests in collateralized debt obligations supported by pools of residential and commercial mortgages and other securities. The contractual maturities of these debt securities classified as available for sale at
December 31, 2018
exceed one year.
During
2018
, we received a return of principal on our ARS of $
0.4 million
. We recorded a gain on securities of $
0.4 million
, which represents a recovery of losses previously recorded as "Other-than-temporary impairment."
There were no purchases of short-term and long-term investments for the years ended
December 31, 2018
and
2017
. During
2018
and
2017
, we did not own any short-term investments.
|
5.
|
FAIR VALUE MEASUREMENTS
|
Fair value is defined as the exchange price that would be received for an asset or paid to transfer a liability (an exit price) in the principal or most advantageous market for the asset or liability in an orderly transaction between market participants on the measurement date. The fair value hierarchy requires an entity to maximize the use of observable
52
inputs and minimize the use of unobservable inputs when measuring fair value. We are required to classify these financial assets and liabilities into two groups: recurring—measured on a periodic basis and non-recurring—measured on an as needed basis.
There are three levels of inputs that may be used to measure fair value:
|
Level 1
|
Unadjusted quoted prices in active markets that are accessible at the measurement date for identical, unrestricted assets or liabilities.
|
|
Level 2
|
Quoted prices for similar assets or liabilities in active markets; quoted prices for identical or similar assets or liabilities in inactive markets; or valuations based on models where the significant inputs are observable or can be corroborated by observable market data.
|
|
Level 3
|
Valuations based on models where significant inputs are not observable. Unobservable inputs are used when little or no market data is available and reflect the Company’s own assumptions about the assumptions market participants would use.
|
Assets and liabilities measured at fair value on a recurring basis as of
December 31, 2018
and
2017
is summarized in the following tables.
|
Dollar amounts in millions
|
December 31,
2018
|
Quoted Prices in
Active Markets
for Identical
Assets
(Level 1)
|
Significant
Other Observable
Inputs
(Level 2)
|
Significant
Unobservable
Inputs
(Level 3)
|
|||||||||||
|
Available for sale securities
|
$
|
6.1
|
|
$
|
—
|
|
$
|
—
|
|
$
|
6.1
|
|
|||
|
Trading securities
|
3.1
|
|
3.1
|
|
—
|
|
—
|
|
|||||||
|
Dollar amounts in millions
|
December 31,
2017
|
Quoted Prices in
Active Markets
for Identical
Assets
(Level 1)
|
Significant
Other Observable
Inputs
(Level 2)
|
Significant
Unobservable
Inputs
(Level 3)
|
|||||||||||
|
Available for sale securities
|
$
|
6.0
|
|
$
|
—
|
|
$
|
—
|
|
$
|
6.0
|
|
|||
|
Trading securities
|
3.1
|
|
3.1
|
|
—
|
|
—
|
|
|||||||
Due to the lack of observable market quotations on a portion of our ARS portfolio, we evaluate the structure of our ARS holdings and current market estimates of fair value, including fair value estimates from banks that rely exclusively on Level 3 inputs. These inputs include those that are based on expected cash flow streams and collateral values, including assessments of counterparty credit quality, default risk underlying the security, discount rates and overall capital market liquidity. The valuation of our ARS investment portfolio is subject to uncertainties that are difficult to predict. Factors that may impact our valuation include changes to credit ratings of the securities as well as to the underlying assets supporting those securities, rates of default of the underlying assets, underlying collateral value, discount rates, counterparty risk and ongoing strength and quality of market credit and liquidity.
Trading securities consist of rabbi trust financial assets which are recorded in other assets in our consolidated balance sheets. The rabbi trust holds assets attributable to the elections of certain management employees to defer the receipt of a portion of their compensation. The assets of the rabbi trust are invested in mutual funds and are reported at fair value based on active market quotations, which represent Level 1 inputs.
The following table summarizes changes in assets and liabilities measured at fair value on a recurring basis using significant unobservable inputs (Level 3) during the twelve months ended
December 31, 2018
and
2017
.
53
|
Dollar amounts in millions
|
Available for
sale securities
|
||
|
Balance at December 31, 2016
|
$
|
4.8
|
|
|
Total realized/unrealized gains
|
|||
|
Included in other comprehensive income
|
1.2
|
|
|
|
Balance at December 31, 2017
|
$
|
6.0
|
|
|
Return of principal on ARS
|
0.4
|
|
|
|
Total realized/unrealized gains
|
|||
|
Included in investment income
|
(0.4
|
)
|
|
|
Included in other comprehensive income
|
0.1
|
|
|
|
Balance at December 31, 2018
|
$
|
6.1
|
|
Carrying amounts reported on the balance sheet for cash and cash equivalents, receivables and accounts payable approximate fair value due to the short-term maturity of these instruments. See discussion on fair market values for Long-term Debt included within Note 13.
We review the carrying values of long-lived assets to be held and used for impairment wherever events or changes in circumstances indicate possible impairment. An impairment loss is recognized when a long-lived asset's carrying value is not recoverable (given assumptions on housing starts and growth rates) and exceeds estimated fair value.
6. EARNINGS PER SHARE
Basic earnings per share are based on the weighted-average number of shares of common stock outstanding. Diluted earnings per share are based upon the weighted-average number of shares of common stock outstanding plus all potentially dilutive securities that were assumed to be converted into common shares at the beginning of the period under the treasury stock method. This method requires that the effect of potentially dilutive common stock equivalents (stock options, stock settled stock appreciation rights (SSARs), restricted stock or units, performance shares and warrants) be excluded from the calculation of diluted earnings per share for the periods in which losses from continuing operations are reported because the effect is anti-dilutive. The following table sets forth the computation of basic and diluted earnings per share:
|
|
Year ended December 31,
|
|||||||
|
Share amounts in millions
|
2018
|
2017
|
2016
|
|||||
|
Denominator for basic earnings per share:
|
||||||||
|
Weighted average common shares outstanding
|
143.0
|
|
144.4
|
|
143.4
|
|
||
|
Effect of dilutive securities:
|
||||||||
|
Dilutive effect of employee stock plans
|
1.4
|
|
2.0
|
|
1.7
|
|
||
|
Dilutive effect of stock warrants
|
—
|
|
—
|
|
0.2
|
|
||
|
Dilutive potential common shares
|
1.4
|
|
2.0
|
|
1.9
|
|
||
|
Denominator for diluted earnings per share:
|
||||||||
|
Adjusted weighted average shares
|
144.4
|
|
146.4
|
|
145.3
|
|
||
For the year ended
December 31, 2018
, there were
no
SSARs that were considered not in-the-money for purposes of our earnings per share calculation.
For the years ended
December 31, 2017
and
2016
, SSARS relating to approximately
0.2 million
and
2.6 million
common shares were considered not in-the-money for purposes of our earnings per share calculation.
|
7.
|
RECEIVABLES
|
Receivables consist of the following:
54
|
|
December 31,
|
||||||
|
Dollar amounts in millions
|
2018
|
2017
|
|||||
|
Trade receivables
|
$
|
86.7
|
|
$
|
124.6
|
|
|
|
Income tax receivable
|
16.3
|
|
2.2
|
|
|||
|
Other receivables
|
25.4
|
|
16.6
|
|
|||
|
Allowance for doubtful accounts
|
(0.8
|
)
|
(0.9
|
)
|
|||
|
$
|
127.6
|
|
$
|
142.5
|
|
||
Other receivables at
December 31, 2018
and
2017
primarily consist of sales tax receivables, vendor rebates, interest receivables, a receivable associated with an affiliate and other miscellaneous receivables.
Additionally, as of
December 31, 2017
, we had
$22.2 million
recorded as notes receivable from asset sales related to a transaction that occurred during 1998. The note receivable provided collateral for our limited recourse note payable (see Note 13). This receivable was collected during
2018
and the associated limited recourse note payable matured and was paid.
|
8.
|
GOODWILL AND OTHER INTANGIBLE ASSETS
|
Changes in goodwill and other intangible assets for the year ended
December 31, 2018
and
2017
are provided in the following table:
|
Dollar amounts in millions
|
2018
|
2017
|
|||||||||||||||||||||||
|
Timber and timberlands
|
Goodwill
|
Developed Technology
|
Total
|
Timber and timberlands
|
Goodwill
|
Developed Technology
|
Total
|
||||||||||||||||||
|
Beginning balance December 31,
|
$
|
43.9
|
|
$
|
16.1
|
|
$
|
10.6
|
|
$
|
70.6
|
|
$
|
47.1
|
|
$
|
9.7
|
|
—
|
|
$
|
56.8
|
|
||
|
Additions
|
—
|
|
—
|
|
—
|
|
—
|
|
—
|
|
6.4
|
|
11.0
|
|
17.4
|
|
|||||||||
|
Amortization
|
(3.2
|
)
|
—
|
|
(0.5
|
)
|
(3.7
|
)
|
(3.2
|
)
|
—
|
|
(0.4
|
)
|
(3.6
|
)
|
|||||||||
|
Total goodwill and other intangibles
|
$
|
40.7
|
|
$
|
16.1
|
|
$
|
10.1
|
|
$
|
66.9
|
|
$
|
43.9
|
|
$
|
16.1
|
|
$
|
10.6
|
|
$
|
70.6
|
|
|
Included in the balance of timber and timberlands are values allocated to Canadian forest licenses in the purchase price allocations for Forex, Peace Valley OSB, and the assets of Evans Forest Products. The initial value of these licenses was
$91.3 million
and are amortized over the estimated useful life of twenty to twenty-five years.
During 2017, we purchased the stock of Barrier International, Inc. for
$22.0 million
(including cash acquired). This purchase results in us recording intangible assets of
$17.4 million
(comprised of
$11.0 million
of developed technology and
$6.4 million
of goodwill) based upon an independent appraisal. The developed technology will be amortized over a
20
year period.
Amortization of the above intangible assets over the next five years is as follows:
|
Dollar amounts in millions
|
|
||
|
Year ended December 31,
|
|||
|
2019
|
$
|
3.8
|
|
|
2020
|
3.8
|
|
|
|
2021
|
3.8
|
|
|
|
2022
|
3.8
|
|
|
|
2023
|
3.8
|
|
|
|
9.
|
INVESTMENTS IN AND ADVANCES TO AFFILIATES
|
55
During the year ended
December 31, 2018
, we invested $
45.0 million
in Entekra Holdings, LLC (Entekra), a start-up design, engineering and manufacturing company that provides off-site framing for both residential and commercial construction. This investment is recorded as an equity investment based upon the joint control of Entekra’s operations. We own
81.8%
of the A units and
55%
of the B units of this operation. Our portion of the earnings and losses of Entekra is included in our Consolidated Statement of Income as Income (loss) from unconsolidated affiliate. For the year ended
December 31, 2018
, we had no sales to Entekra.
At
December 31, 2018
, we also have an investment in a joint venture with Resolute Forest Products to operate jointly owned I-Joist facilities in Quebec (Resolute-LP). Each partner owns
50%
of the venture. We sell products and raw materials and purchase products for resale from Resolute-LP. We eliminate profits on these sales and purchases, to the extent the inventory has not been sold through to third parties, on the basis of its 50% interest. For the years ended
December 31, 2018
,
2017
and
2016
, we sold
$16.9 million
,
$15.5 million
and
$11.7 million
of products to Resolute-LP and purchased
$57.7 million
,
$60.1 million
and
$53.1 million
of I-joists from Resolute-LP.
Included in the Consolidated Balance Sheets at
December 31, 2018
and
2017
are
$3.8 million
and
$3.6 million
in accounts receivable and $
0.1 million
and $
1.2 million
in accounts payable associated with Resolute-LP. For the years ended
December 31, 2018
and
2017
, we received
$2.6 million
and
$3.3 million
in dividends from Resolute-LP. We classified the receipt of these cash dividends as cash flows from operations. Our cumulative equity in earnings from Resolute-LP exceeds the cumulative distributions received; therefore, the dividends were deemed to be a return on our investment and not a return of our investment.
We are the exclusive distributor of the I-joists produced and sold by the joint venture and it is considered an integral part of our operations. We are classifying the income (loss) from the joint venture as a reduction in cost of sales. LP recorded income from affiliates of
$2.2 million
in 2018,
$4.0 million
in 2017 and
$5.2 million
in 2016.
|
10.
|
ACCOUNTS PAYABLE AND ACCRUED LIABILITIES
|
Accounts payable and accrued liabilities were as follows:
|
|
December 31,
|
||||||
|
Dollar amounts in millions
|
2018
|
2017
|
|||||
|
Accounts payable
|
$
|
116.1
|
|
$
|
112.3
|
|
|
|
Salaries and wages payable
|
64.1
|
|
75.8
|
|
|||
|
Taxes other than income taxes
|
3.5
|
|
3.0
|
|
|||
|
Current portion of warranty reserves
|
3.0
|
|
9.0
|
|
|||
|
Accrued interest
|
6.8
|
|
6.0
|
|
|||
|
Accrued rebates
|
30.1
|
|
24.2
|
|
|||
|
Other accrued liabilities
|
9.7
|
|
6.8
|
|
|||
|
Total Accounts payable and accrued liabilities
|
$
|
233.3
|
|
$
|
237.1
|
|
|
Other accrued liabilities at
December 31, 2018
and
2017
primarily consist of reforestation liabilities, accrued rent, current portion of uncertain tax position liabilities, current portion of worker compensation liabilities and other items. Additionally, included in accounts payable is
$22.1 million
and
$19.0 million
related to capital expenditures that had not yet been paid as of
December 31, 2018
and as of
December 31, 2017
.
|
11.
|
INCOME TAXES
|
The Tax Act reduced the U.S. federal tax rate from
35%
in 2017 to
21%
in 2018 and eliminated the deduction for Domestic Production Activities. At the end of 2017, in accordance with SEC Staff Accounting Bulletin No. 118, we
56
recorded a provisional benefit of $
18.4 million
resulting from the reduction in the carrying value of our U.S. deferred tax liabilities to reflect the change in the tax rate. Additionally, we calculated a provisional amount of
zero
for the transition tax on unrepatriated foreign earnings.
During 2018, we revised our estimate of the amount of 2017 deferred taxes related to discretionary pension contributions; and recorded an additional benefit of $
3.1 million
as a discrete item in the second quarter. Our accounting for this and all other elements of the Tax Act is now complete, and there were no other adjustments to the provisional amounts previously recorded.
Income Tax Provision
Income from continuing operations before income taxes consists of the following:
|
|
Year ended December 31,
|
||||||||||
|
Dollar amounts in millions
|
2018
|
2017
|
2016
|
||||||||
|
Domestic
|
$
|
359.1
|
|
$
|
341.8
|
|
$
|
98.4
|
|
||
|
Foreign
|
162.0
|
|
168.4
|
|
71.7
|
|
|||||
|
Total
|
$
|
521.1
|
|
$
|
510.2
|
|
$
|
170.1
|
|
||
The following presents the components of our income tax provision (benefit) from continuing operations.
|
|
Year ended December 31,
|
||||||||||
|
Dollar amounts in millions
|
2018
|
2017
|
2016
|
||||||||
|
Current tax provision (benefit):
|
|||||||||||
|
U.S. federal
|
$
|
55.5
|
|
$
|
105.8
|
|
$
|
60.4
|
|
||
|
State and local
|
8.4
|
|
4.4
|
|
4.4
|
|
|||||
|
Foreign
|
31.7
|
|
7.9
|
|
10.4
|
|
|||||
|
Net current tax provision (benefit)
|
95.6
|
|
118.1
|
|
75.2
|
|
|||||
|
Deferred tax provision (benefit):
|
|||||||||||
|
U.S. federal
|
11.2
|
|
(19.3
|
)
|
(48.1
|
)
|
|||||
|
State and local
|
5.8
|
|
8.0
|
|
1.2
|
|
|||||
|
Foreign
|
11.1
|
|
38.2
|
|
11.7
|
|
|||||
|
Net valuation allowance increase (decrease)
|
(1.4
|
)
|
(25.9
|
)
|
(20.2
|
)
|
|||||
|
Net deferred tax benefit
|
26.7
|
|
1.0
|
|
(55.4
|
)
|
|||||
|
Total income tax provision (benefit)
|
$
|
122.3
|
|
$
|
119.1
|
|
$
|
19.8
|
|
||
We received income tax refunds during
2018
,
2017
and
2016
of
$0.2 million
,
$0.3 million
and
$0.8 million
and paid cash taxes of
$89.9 million
,
$143.1 million
and
$8.7 million
. Included in the Consolidated Balance Sheets at
December 31, 2018
and
2017
are income tax receivables of
$16.3 million
and
$2.2 million
and income taxes payable of
$21.0 million
and
$4.5 million
.
57
Deferred Taxes
The tax effects of significant temporary differences creating deferred tax assets and liabilities were as follows:
|
|
December 31,
|
||||||
|
Dollar amounts in millions
|
2018
|
2017
1
|
|||||
|
Accrued liabilities
|
$
|
21.4
|
|
$
|
26.6
|
|
|
|
Pension and post-retirement benefits
|
8.3
|
|
19.9
|
|
|||
|
Share-based compensation
|
5.3
|
|
6.9
|
|
|||
|
Benefit of capital loss and NOL carryovers
|
15.8
|
|
38.9
|
|
|||
|
Other
|
13.1
|
|
10.2
|
|
|||
|
Inventories
|
7.7
|
|
6.6
|
|
|||
|
Market value write down of ARS
|
3.3
|
|
4.9
|
|
|||
|
Benefit of tax credit carryovers
|
0.4
|
|
3.5
|
|
|||
|
Valuation allowance
|
(12.0
|
)
|
(13.6
|
)
|
|||
|
Total deferred tax assets
|
63.3
|
|
103.9
|
|
|||
|
Property, plant and equipment
|
(111.8
|
)
|
(118.2
|
)
|
|||
|
Timber and timberlands
|
(9.8
|
)
|
(11.4
|
)
|
|||
|
Installment sale gain deferral
|
—
|
|
(5.2
|
)
|
|||
|
Total deferred tax liabilities
|
(121.6
|
)
|
(134.8
|
)
|
|||
|
Net deferred tax liabilities
|
$
|
(58.3
|
)
|
$
|
(30.9
|
)
|
|
|
Balance sheet classification
|
|||||||
|
Long-term deferred tax asset
|
3.9
|
|
2.5
|
|
|||
|
Long-term deferred tax liability
|
(62.2
|
)
|
(33.4
|
)
|
|||
|
$
|
(58.3
|
)
|
$
|
(30.9
|
)
|
||
1
Prior year information has been revised to further breakout accrued liabilities into pension and post-retirement liabilities and share-based compensation.
The benefit relating to capital loss, net operating loss (NOL) and credit carryovers included in the above table at
December 31, 2018
consists of:
|
Dollar amounts in millions
|
Expiration Beginning in
|
Benefit Amount
|
Valuation Allowance
|
||||
|
State NOL carryovers
|
2020
|
$
|
9.9
|
|
$
|
(0.5
|
)
|
|
State credit carryovers
|
2019
|
0.3
|
|
(0.1
|
)
|
||
|
Canadian capital loss carryovers
|
Indefinitely
|
5.7
|
|
(5.7
|
)
|
||
|
Canadian credit carryovers
|
2026
|
0.1
|
|
—
|
|
||
|
Chilean NOL carryovers
|
Indefinitely
|
0.2
|
|
(0.2
|
)
|
||
|
$
|
16.2
|
|
$
|
(6.5
|
)
|
||
We periodically review the need for valuation allowances against deferred tax assets and recognize these deferred tax assets to the extent that their realization is more likely than not. As part of our review, we consider all positive and negative evidence, including earnings history, the future reversal of deferred tax liabilities, and the relevant expirations of carryforwards. We believe that the valuation allowances provided are appropriate. If future years’ earnings differ from the estimates used to establish these valuation allowances, or other objective positive or negative evidence arises, we may be required to record an adjustment resulting in an impact on tax expense (benefit) for that period.
58
As of December 31, 2018, certain of our foreign subsidiaries had accumulated undistributed earnings of approximately $
100.0 million
. These earnings have been, and are intended to be, indefinitely reinvested in our foreign operations, and we expect future US cash generation to be sufficient to meet our future US cash needs. As a result, no deferred taxes have been recorded with respect to the difference between the financial accounting value and the tax basis in these subsidiaries.
Since most of these earnings have previously been subject to the one-time US transition tax on foreign earnings required by the 2017 Tax Act, they are eligible to be repatriated without additional US tax. Any additional taxes due with respect to such earnings, if repatriated to the US, would generally be limited to foreign withholding taxes, which we estimate could be up to $
22.0 million
.
Tax Rate Reconciliation
The following table summarizes the differences between the statutory U.S. federal and effective income tax rates on continuing operations:
|
|
Year ended December 31,
|
|||||||
|
|
2018
|
2017
|
2016
|
|||||
|
U.S. federal tax rate
|
21
|
%
|
35
|
%
|
35
|
%
|
||
|
State and local income taxes
|
3
|
|
2
|
|
2
|
|
||
|
Effect of foreign tax rates
|
2
|
|
(3
|
)
|
(5
|
)
|
||
|
Effect of foreign exchange on functional currencies
|
(1
|
)
|
1
|
|
2
|
|
||
|
Tax credits
|
(1
|
)
|
(1
|
)
|
(12
|
)
|
||
|
Capital gain - timber
|
—
|
|
—
|
|
(15
|
)
|
||
|
Stock-based compensation
|
(1
|
)
|
—
|
|
(2
|
)
|
||
|
Domestic manufacturing deduction
|
—
|
|
(2
|
)
|
(2
|
)
|
||
|
Valuation allowance
|
—
|
|
(6
|
)
|
(12
|
)
|
||
|
Uncertain tax positions
|
—
|
|
1
|
|
21
|
|
||
|
Effect of U.S. federal rate change on deferred taxes
|
(1
|
)
|
(3
|
)
|
—
|
|
||
|
Other, net
|
1
|
|
(1
|
)
|
—
|
|
||
|
Effective tax rate (%)
|
23
|
%
|
23
|
%
|
12
|
%
|
||
We are subject to U.S. federal income tax as well as income taxes of multiple state jurisdictions. Our foreign subsidiaries are subject to income tax in Canada, Chile, Peru, Brazil, Colombia and Argentina.
U.S. tax years are now closed through 2014, and no audits are currently in progress. We remain subject to U.S. federal examinations of tax years 2015 to 2017 as well as state and local tax examination for the tax years 2007-2017. In 2016, Canada completed its audits of tax years 2012 and 2013; tax years 2014 through 2017 are subject to examination. Quebec provincial audits have been effectively settled through 2016 and Quebec is currently reviewing 2017. Chilean returns for the 2010 through 2016 tax years have been audited and various issues that were appealed in the Chilean courts have recently been settled while others remain ongoing. Tax year 2017 is currently being reviewed. Brazilian returns for years 2013 to 2017 are subject to examination but no audits are currently in progress.
59
Uncertain Tax Positions
In accordance with the accounting for uncertain tax positions, the following is a tabular reconciliation of the total amount of unrecognized tax benefits at the beginning and end of the years presented:
|
|
December 31,
|
||||||||||
|
Dollar amounts in millions
|
2018
|
2017
|
2016
|
||||||||
|
Beginning balance
|
$
|
40.3
|
|
$
|
39.8
|
|
$
|
4.1
|
|
||
|
Increases:
|
|||||||||||
|
Tax positions taken in current year
|
0.7
|
|
0.6
|
|
26.9
|
|
|||||
|
Tax positions taken in prior years
|
0.7
|
|
1.2
|
|
10.4
|
|
|||||
|
Decreases:
|
|||||||||||
|
Tax positions taken in current year
|
—
|
|
—
|
|
—
|
|
|||||
|
Tax positions taken in prior years
|
—
|
|
(1.3
|
)
|
—
|
|
|||||
|
Settlements during the year
|
(0.9
|
)
|
—
|
|
—
|
|
|||||
|
Lapse of statute in current year
|
—
|
|
—
|
|
(1.6
|
)
|
|||||
|
Ending balance
|
$
|
40.8
|
|
$
|
40.3
|
|
$
|
39.8
|
|
||
Included in the above balances at
December 31, 2018
and
2017
is
$40.2 million
and
$39.9 million
of tax benefits that, if recognized, would affect our effective tax rate. We accrued interest of
$0.3 million
and paid no interest during
2018
and accrued interest of
$0.7 million
and paid no interest during
2017
. In total, we have recognized a liability of
$3.4 million
and
$3.7 million
for accrued interest related to our uncertain tax positions as of
December 31, 2018
and
2017
.
|
12.
|
NON-OPERATING INCOME (EXPENSE)
|
Included in our Consolidated Statements of Income is non-operating expense of
$2.1 million
,
$22.6 million
and
$45.3 million
for the years ended
December 31, 2018
,
2017
and
2016
. This income (expense) is comprised of the following components:
|
|
Year ended December 31,
|
||||||||||
|
Dollar amounts in millions
|
2018
|
2017
|
2016
|
||||||||
|
Interest expense
|
$
|
(19.0
|
)
|
$
|
(20.6
|
)
|
$
|
(32.9
|
)
|
||
|
Amortization of debt charges
|
(0.8
|
)
|
(0.9
|
)
|
(1.1
|
)
|
|||||
|
Capitalized interest
|
4.0
|
|
2.2
|
|
1.9
|
|
|||||
|
Interest expense, net of capitalized interest
|
(15.8
|
)
|
(19.3
|
)
|
(32.1
|
)
|
|||||
|
Interest income
|
18.1
|
|
9.5
|
|
8.0
|
|
|||||
|
Gain on securities
|
0.4
|
|
—
|
|
—
|
|
|||||
|
SERP market adjustments
|
(0.9
|
)
|
1.0
|
|
0.2
|
|
|||||
|
Investment income
|
17.6
|
|
10.5
|
|
8.2
|
|
|||||
|
Net periodic pension cost, excluding service cost
|
(4.3
|
)
|
(9.4
|
)
|
(6.2
|
)
|
|||||
|
Foreign currency losses
|
0.4
|
|
(4.4
|
)
|
2.1
|
|
|||||
|
Early debt extinguishment
|
—
|
|
—
|
|
(17.3
|
)
|
|||||
|
Other non-operating income (expense)
|
(3.9
|
)
|
(13.8
|
)
|
(21.4
|
)
|
|||||
|
Total non-operating income (expense)
|
$
|
(2.1
|
)
|
$
|
(22.6
|
)
|
$
|
(45.3
|
)
|
||
60
|
13.
|
LONG-TERM DEBT
|
|
|
December 31,
|
|||||||||||||||||||||||||
|
Dollar amounts in millions
|
2018
|
2017
|
||||||||||||||||||||||||
|
Interest Rate
|
Principal
|
Unamortized Debt Costs
|
Total
|
Principal
|
Unamortized Debt Costs
|
Total
|
||||||||||||||||||||
|
Debentures:
|
||||||||||||||||||||||||||
|
Senior unsecured notes, maturing 2024, interest rates fixed
|
4.875
|
%
|
$
|
350.0
|
|
$
|
(3.7
|
)
|
$
|
346.3
|
|
$
|
350.0
|
|
$
|
(4.4
|
)
|
$
|
345.6
|
|
||||||
|
Bank credit facilities:
|
||||||||||||||||||||||||||
|
Chilean term credit facility, maturing 2019, interest rates fixed
|
UF+3.9%
|
|
4.7
|
|
(0.1
|
)
|
4.6
|
|
7.7
|
|
(0.1
|
)
|
7.6
|
|
||||||||||||
|
Limited recourse notes payable:
|
||||||||||||||||||||||||||
|
Senior notes, payable matured 2018, interest rates fixed
|
7.3
|
%
|
—
|
|
—
|
|
—
|
|
22.0
|
|
—
|
|
22.0
|
|
||||||||||||
|
Other financing:
|
||||||||||||||||||||||||||
|
Capital leases
|
1.0
|
|
—
|
|
1.0
|
|
0.7
|
|
—
|
|
0.7
|
|
||||||||||||||
|
Total
|
355.7
|
|
(3.8
|
)
|
351.9
|
|
380.4
|
|
(4.5
|
)
|
375.9
|
|
||||||||||||||
|
Less: current portion
|
(5.0
|
)
|
—
|
|
(5.0
|
)
|
(25.1
|
)
|
—
|
|
(25.1
|
)
|
||||||||||||||
|
Net long-term portion
|
$
|
350.7
|
|
$
|
(3.8
|
)
|
$
|
346.9
|
|
$
|
355.3
|
|
$
|
(4.5
|
)
|
$
|
350.8
|
|
||||||||
Deferred debt costs are amortized over the life of the related debt using a straight line basis which approximates the effective interest method. These costs are a direct deduction from the carrying amount related to the debt liability. If the debt is retired early, the related unamortized deferred financing costs are written off in the period the debt is retired to other non-operating income (expense). We amortized deferred debt costs of
$0.8 million
,
$0.9 million
and
$1.1 million
for the years ended
December 31, 2018
,
2017
and
2016
. Included in these amortized amounts are deferred debt costs associated with our current line of credit, which is recorded within "Other Assets" on LP's Consolidated Balance Sheet.
We estimated our limited recourse notes payable to have a fair value of approximately
$22.4 million
at
December 31, 2017
. We estimated the Senior Notes due 2024 to have a fair value of
$337.9 million
and
$363.9 million
at
December 31, 2018
and
2017
based upon market quotations. We believe the carrying amounts of the Chilean term credit facility approximates fair market value based upon current interest rates with similar remaining maturities.
We issued
$348.6 million
of senior notes in June 1998 in a private placement to institutional investors. The remaining notes payable of $
22.0 million
were repaid in 2018. These notes were secured by
$22.2 million
of notes receivable from Green Diamond Resource Company (Green Diamond), which were received in 2018.
In December 2013, we entered into a credit agreement with various lenders and American AgCredit, PCA, as administrative agent and CoBank, ACB, as letter of credit issuer. The credit agreement provides for a $
200 million
revolving credit facility, with a $
60 million
sublimit for letters of credit. The credit facility terminates and all loans made under the credit agreement become due in December 2022. As of
December 31, 2018
and
2017
, no revolving borrowings were outstanding under the credit facility. Certain of LP’s existing and future wholly owned domestic subsidiaries may guaranty our obligations under the credit facility and, subject to certain limited exceptions, provide security through a lien on substantially all of the personal property of these subsidiaries. Revolving borrowings under the credit agreement accrue interest, at our option, at either a “base rate” plus a margin of
0.63%
to
1.75%
or LIBOR plus a margin of
1.63%
to
2.75%
. The credit agreement also includes an unused commitment fee, due quarterly, ranging from
0.20%
to
0.500%
. The applicable margins and fees within these ranges are based on our ratio of consolidated EBITDA to cash interest charges. The “base rate” is the highest of (i) the Federal funds rate plus
0.5%
, (ii) the U.S. prime rate, and (iii) one month LIBOR plus
1.0%
.
The credit agreement contains various restrictive covenants and customary events of default. The credit agreement also contains financial covenants that require the Company and its consolidated subsidiaries to have, as of the end of each quarter, (i) a capitalization ratio (i.e., funded debt to total capitalization) of no more than
40%
and (ii) current ratio (i.e., current assets to current liabilities) of at least 2 to 1, in each case calculated in the manner specified in the credit agreement. As of
December 31, 2018
, we were in compliance with all financial covenants under the credit agreement.
61
In December 2009, we entered into a term loan agreement with Banco de Credito e Inversiones for UF
943,543.7391
(equivalent to
$39 million
at the time of inception). The loan will be repaid in
16
semi-annual principal payments that began in June 2012 and end in December 2019. The loan bears interest at UF plus
3.90%
per annum and contains various restrictive covenants and requires the maintenance by LP Chile of a debt to equity ratio of less than or equal to
1
. If LP Chile is late in making payments, it will also be required to maintain a ratio of net debt to earnings before interest, taxes, depreciation and amortization (EBITDA) of less than or equal to
2.5
and a ratio of EBITDA to financial costs of at least
3
. The loan agreement also contains customary events of default, the occurrence of which could result in acceleration of our obligations to repay the indebtedness outstanding. Any increases or decreases in the loan balance shown are related to the change in the underlying foreign currency exchange rates, the UF or principal payments. W made principal payments of $
2.3 million
during 2018. The impact of foreign currency exchange rates in 2018 was
$0.9 million
which was offset by a UF change of
$0.2 million
.
In September 2016, we issued $
350.0 million
aggregate principal of
4.875%
Senior Notes due in 2024. On or after September 15, 2019, we may, at our option on one or more occasions, redeem all or any portion of these notes at specified redemption rates. Obligations under the indenture governing our notes are unsecured and not presently guaranteed by any of our subsidiaries. The indenture contains customary covenants applicable to us and our subsidiaries, other than certain unrestricted subsidiaries, including restrictions on actions and activities that are restricted under the credit facility. The indenture also contains customary events of default, the occurrence of which could result in acceleration of our obligations to repay the indebtedness outstanding thereunder.
The weighted average interest rate for all long-term debt at
December 31, 2018
and
2017
was approximately
4.9%
and
5.1%
. Required repayment of principal for long-term debt is as follows:
|
Dollar amounts in millions
|
|
||
|
Years ending December 31,
|
|||
|
2019
|
$
|
5.2
|
|
|
2020
|
0.2
|
|
|
|
2021
|
0.2
|
|
|
|
2022
|
0.1
|
|
|
|
2023
|
—
|
|
|
|
2024 and after
|
350.0
|
|
|
|
Total
|
$
|
355.7
|
|
Cash paid during
2018
,
2017
and
2016
for interest (net of capitalized interest) was
$19.8 million
,
$17.5 million
and
$27.2 million
.
14. STOCKHOLDERS' EQUITY
Preferred Stock
We are authorized to issue up to
15,000,000
shares of preferred stock at
$1.00
par value. At
December 31, 2018
, no shares of preferred stock have been issued.
Common Stock Plan
We have a stock-based compensation plan under which stock options, SSARs, restricted stock (including units) and performance shares awards are granted. At
December 31, 2018
,
3.0 million
shares were available under the current plan for these awards.
|
Year ended December 31,
|
|||||||||||
|
Dollar amounts in millions
|
2018
|
2017
|
2016
|
||||||||
|
Total stock-based compensation expense (costs of sales, selling, general and administrative and other operating credits and charges, net)
|
$
|
8.6
|
|
$
|
9.7
|
|
$
|
13.0
|
|
||
|
Income tax benefit related to stock-based compensation
|
$
|
3.1
|
|
$
|
0.8
|
|
$
|
3.4
|
|
||
|
Impact on cash flow due to taxes paid related to net share settlement of equity awards
|
$
|
9.3
|
|
$
|
5.9
|
|
$
|
9.2
|
|
||
62
We recognize the compensation costs on a straight-line basis over the requisite service period of the award, which is generally the vesting term of three years. Compensation costs that were capitalized to inventory were not material.
SSARs
Prior to January 1, 2018, we granted SSARs to key employees. On exercise, we generally issue these shares from treasury. The SSARs are granted at market price at the date of grant. SSARs become exercisable over three years and expire ten years after the date of grant. The following table sets out the weighted average assumptions used to estimate the fair value of the SSARs granted using the Black-Scholes option-pricing model:
|
2017
|
2016
|
||||||
|
Expected stock price volatility
|
41
|
%
|
45
|
%
|
|||
|
The fair values of stock-based payments were valued using the Black-Scholes valuation method with a volatility factor based on our historical stock prices.
|
|||||||
|
Expected dividend yield
|
—
|
%
|
—
|
%
|
|||
|
The Black-Scholes valuation model calls for a single expected dividend yield as an input. This is determined based upon current annual dividend as of the date of grant compared to the grant price.
|
|||||||
|
Risk-free interest rate
|
2.1
|
%
|
1.4
|
%
|
|||
|
We base the risk-free interest rate used in the Black-Scholes valuation method on U.S. Treasury issues with an equivalent term. Where the expected term of our stock-based awards do not correspond with the terms for which interest rates are quoted, we perform a straight-line interpolation to determine the rate from the available maturities.
|
|||||||
|
Expected life of options (in years)
|
6 years
|
|
6 years
|
|
|||
|
Expected life represents the period that LP’s stock-based awards are expected to be outstanding and was determined based on historical experience of similar awards, giving consideration to the contractual terms of the stock-based awards, vesting schedules and expectations of future employee behavior as influenced by changes to the terms of its stock-based awards.
|
|||||||
|
Weighted average fair value of options and SSARs granted
|
$
|
8.02
|
|
$
|
6.99
|
|
|
Restricted Shares
We grant restricted awards (shares or units) to certain key employees and directors. The awards can either be time vested or vested based upon the attainment of certain performance metrics over a certain time period. Awards granted under this plan to employees generally have a performance or vesting period of three years from the date of grant and to directors over one year. Certain of these awards are eligible to received dividend equivalent shares.The market value of these grants approximates the fair value. For awards based upon the achievement of the performance goals, the award are earned ratably from 0% to 200%.
Summary of Stock Awards Outstanding
The following table summarizes stock awards as of
December 31, 2018
as well as activity during the last year.
63
|
Stock Options / SSARS
|
Restricted stock
|
Restricted units
|
|||||||||||||||||||||
|
Number of Awards
|
Weighted
Average
Exercise Price
|
Number of Awards
|
Weighted Average Grant Date Fair Value
|
Number of Awards
|
Weighted Average Grant Date Fair Value
|
||||||||||||||||||
|
Outstanding at December 31, 2017
|
2,404,808
|
|
$
|
14.76
|
|
311,215
|
|
$
|
17.33
|
|
851,244
|
|
$
|
18.93
|
|
||||||||
|
Granted
|
—
|
|
—
|
|
—
|
|
—
|
|
491,114
|
|
27.74
|
|
|||||||||||
|
Exercised
|
(1,201,644
|
)
|
13.91
|
|
—
|
|
—
|
|
—
|
|
—
|
|
|||||||||||
|
Vested
|
—
|
|
—
|
|
(64,747
|
)
|
17.04
|
|
(217,000
|
)
|
17.95
|
|
|||||||||||
|
Forfeited
|
(61,478
|
)
|
17.51
|
|
(6,294
|
)
|
16.80
|
|
(168,744
|
)
|
21.59
|
|
|||||||||||
|
Outstanding at December 31, 2018
|
1,141,686
|
|
$
|
15.50
|
|
240,174
|
|
$
|
17.43
|
|
956,614
|
|
$
|
23.17
|
|
||||||||
|
Vested and expected to vest at December 31, 2018
(1)
|
1,084,602
|
|
$
|
15.50
|
|
228,165
|
|
$
|
17.43
|
|
908,783
|
|
$
|
23.17
|
|
||||||||
|
Exercisable at December 31, 2018
|
870,431
|
|
$
|
14.83
|
|
—
|
|
—
|
|
—
|
|
$
|
—
|
|
|||||||||
|
Unrecognized compensation costs (in millions)
|
$
|
0.5
|
|
$
|
0.7
|
|
$
|
9.7
|
|
||||||||||||||
|
to be recognized over weighted average period of years
|
0.8
|
|
0.6
|
|
1.3
|
|
|||||||||||||||||
_______________
|
(1)
|
Expected to vest based upon historical forfeiture rate
|
The aggregate intrinsic value of the stock options and SSARs represented in the above table is the total pre-tax intrinsic value (the difference between our closing stock price on the last trading day of
2018
and the exercise price, multiplied by the number of in-the-money options and SSARs) that would have been received by the holders had all holders exercised their awards on
December 31, 2018
. This amount,
$7.7 million
, changes based on the market value of our stock as reported by the New York Stock Exchange.
The intrinsic value of SSARs exercised in the years ended
December 31, 2018
,
2017
and
2016
was
$35.2 million
,
$26.5 million
and
$29.8 million
. The total fair value of awards vested during the years ended
December 31, 2018
,
2017
and
2016
, was
$7.8 million
,
$6.7 million
and
$3.8 million
.
15. ASSET RETIREMENT OBLIGATIONS
The activity in our asset retirement obligation liability for
2018
and
2017
is summarized in the following table. These are included in “Other long-term liabilities” in the Consolidated Balance Sheets. Our asset retirement obligation reflects the estimated present value of its obligations for capping, closure and post closure costs with respect to landfills we own or operate and other on-going environmental monitoring costs.
|
Dollar amounts in millions
|
Year ended December 31,
|
||||||
|
2018
|
2017
|
||||||
|
Beginning balance
|
$
|
10.8
|
|
$
|
10.2
|
|
|
|
Accretion expense
|
0.9
|
|
0.8
|
|
|||
|
Adjusted to expense during the year
|
1.6
|
|
—
|
|
|||
|
Adjusted to other operating credits and charges, net
|
(0.8
|
)
|
—
|
|
|||
|
Payments made
|
(0.4
|
)
|
(0.3
|
)
|
|||
|
Translation
|
(0.1
|
)
|
0.1
|
|
|||
|
Ending balance
|
$
|
12.0
|
|
$
|
10.8
|
|
|
64
16. OTHER OPERATING CREDITS AND CHARGES, NET
The major components of “Other operating credits and charges, net” in the Consolidated Statements of Income for the years ended December 31 are reflected in the table below and described in the paragraphs following the table:
|
Dollar amounts in millions
|
Year ended December 31,
|
||||||||||
|
2018
|
2017
|
2016
|
|||||||||
|
Reorganization charges
|
$
|
(10.3
|
)
|
$
|
—
|
|
$
|
—
|
|
||
|
Refund of sales and use taxes
|
0.5
|
|
0.8
|
|
—
|
|
|||||
|
Refund of environmental costs
|
8.3
|
|
—
|
|
—
|
|
|||||
|
Loss on workers compensation reserve
|
—
|
|
(0.9
|
)
|
—
|
|
|||||
|
Adjustment to product related warranty reserves
|
7.7
|
|
(5.4
|
)
|
(16.9
|
)
|
|||||
|
Expenses related to hurricane
|
(4.5
|
)
|
—
|
|
—
|
|
|||||
|
Other
|
0.5
|
|
0.6
|
|
(0.5
|
)
|
|||||
|
$
|
2.2
|
|
|
$
|
(4.9
|
)
|
|
$
|
(17.4
|
)
|
|
2018
During
2018
, we recorded a
$2.2 million
gain in "Other operating credits and charges, net". The components of the net credits include:
|
•
|
a gain of $
8.3 million
related to the settlement of previously-paid environmental costs or the liability for future environmental costs to be paid by a third party associated with a non-operating site;
|
|
•
|
a gain of
$7.7 million
related to the reduction of product related warranty reserves associated with CanExel products sold in specific geographic locations and for a specific time period;
|
|
•
|
a loss of $
10.3 million
on severance and other charges related to certain reorganizations within the corporate offices, including the costs associated with the retirement of our previous chief financial officer; and
|
|
•
|
a loss of $
4.5 million
related to property damage sustained by our Wilmington facility during the recent hurricane.
|
2017
During 2017, we recorded an $
4.9 million
loss in "Other operating credits and charges, net". The components of the net charges include:
|
•
|
a loss of $
5.4 million
related to an increase in product related warranty reserves associated with CanExel products sold in specific geographic locations and for a specific time period;
|
|
•
|
a refund of $
0.8 million
related to sales and use taxes; and
|
|
•
|
a loss of $
0.9 million
associated with a workers' compensation reserve change.
|
2016
During 2016, we recorded a
$17.4 million
loss in "Other operating credits and charges, net". The components of the net charges include:
|
•
|
a loss of
$16.9 million
related to an increase in product related warranty reserves and a related adjustment of $
0.5 million
to value added taxes associated with CanExel products sold in specific geographic locations and for a specific time period.
|
Severance
Over the course of the last three years, we have entered into restructuring plans in an effort to reduce overall expenses. The detail of the severance accrual and related expense and payments for the last three years is as follows:
65
|
Dollar amounts in millions
|
Year ended December 31,
|
||||||||||
|
2018
|
2017
|
2016
|
|||||||||
|
Beginning balance at December 31,
|
$
|
1.7
|
|
$
|
0.2
|
|
$
|
0.2
|
|
||
|
Accrued to expense during the year
|
0.3
|
|
3.7
|
|
0.5
|
|
|||||
|
Accrued to other operating credits and charges, net
|
10.3
|
|
—
|
|
—
|
|
|||||
|
Payments
|
(6.8
|
)
|
(2.2
|
)
|
(0.5
|
)
|
|||||
|
Ending balance
|
$
|
5.5
|
|
$
|
1.7
|
|
$
|
0.2
|
|
||
The balance of accrued severance is included in "Accounts payable and accrued liabilities" on our Consolidated Balance Sheets. The balance as of December 31, 2018 is payable under contract through 2020. For the year ended December 31, 2018, severance expense is primarily related to general and corporate expenses.
17. GAIN (LOSS) ON SALE OR IMPAIRMENT OF LONG-LIVED ASSETS
The major components of “Gain (loss) on sale or impairment of long-lived assets” in the Consolidated Statements of Income for the years ended December 31 are reflected in the table below and are described in the paragraphs following the table:
|
Dollar amounts in millions
|
Year ended December 31,
|
||||||||||
|
2018
|
2017
|
2016
|
|||||||||
|
Impairment charges on long-lived assets
|
$
|
(10.7
|
)
|
$
|
(9.1
|
)
|
$
|
(0.8
|
)
|
||
|
Gain (loss) on sale or other disposition of other long-lived assets
|
(0.1
|
)
|
2.3
|
|
9.2
|
|
|||||
|
$
|
(10.8
|
)
|
$
|
(6.8
|
)
|
$
|
8.4
|
|
|||
2018
During 2018, we recorded a net loss on sale or impairment of long-lived assets of
$10.8 million
associated with a facility that is no longer used that is anticipated to be sold.
2017
During 2017, we recorded a net loss on sale or impairment of long-lived assets of
$6.8 million
. This net loss includes the following items:
|
•
|
a loss of
$4.7 million
associated with a facility which was previously held for sale;
|
|
•
|
a loss of
$3.0 million
associated with manufacturing equipment which is no longer being used; and
|
|
•
|
a gain $
2.3 million
on the sale of manufacturing facilities no longer used.
|
2016
During 2016, we recorded a net gain on sale of long-lived assets of
$8.4 million
. This net loss includes the following items:
|
•
|
a loss of
$0.8 million
related to the impairment on certain manufacturing assets associated with various OSB mills;
|
|
•
|
a gain of
$10.6 million
related to the exchange of an idled OSB mill; and
|
|
•
|
a loss of
$1.4 million
related to the disposal of various assets no longer used.
|
66
18. CONTINGENCIES
We maintain reserves for various contingent liabilities as follows:
|
|
December 31,
|
||||||
|
Dollar amounts in millions
|
2018
|
2017
|
|||||
|
Environmental reserves
|
$
|
10.6
|
|
$
|
15.0
|
|
|
|
Other reserves
|
0.2
|
|
0.1
|
|
|||
|
Total contingencies
|
10.8
|
|
15.1
|
|
|||
|
Current portion
|
(2.3
|
)
|
(3.4
|
)
|
|||
|
Long-term portion
|
$
|
8.5
|
|
$
|
11.7
|
|
|
Estimates of our loss contingencies are based on various assumptions and judgments. Due to the numerous uncertainties and variables associated with these assumptions and judgments, both the precision and reliability of the resulting estimates of the related contingencies are subject to substantial uncertainties. We regularly monitor our estimated exposure to contingencies and, as additional information becomes known, may change its estimates significantly. While no estimate of the range of any such change can be made at this time, the amount that we may ultimately pay in connection with these matters could materially exceed, in either the near term or the longer term, the amounts accrued to date. Our estimates of our loss contingencies do not reflect potential future recoveries from insurance carriers except to the extent that recovery may from time to time be deemed probable as a result of an insurer’s agreement to payment terms.
Environmental Proceedings
We are involved in a number of environmental proceedings and activities, and may be wholly or partially responsible for known or unknown contamination existing at a number of other sites at which we have conducted operations or disposed of wastes. Based on the information currently available, management believes that any fines, penalties or other costs or losses resulting from these matters will not have a material effect on our financial position, results of operations, cash flows or liquidity.
We maintain a reserve for undiscounted estimated environmental loss contingencies. This reserve is primarily for estimated future costs of remediation of hazardous or toxic substances at numerous sites currently or previously owned by the Company. Our estimates of our environmental loss contingencies are based on various assumptions and judgments, the specific nature of which varies in light of the particular facts and circumstances surrounding each environmental loss contingency. These estimates typically reflect assumptions and judgments as to the probable nature, magnitude and timing of required investigation, remediation and/or monitoring activities and the probable cost of these activities, and in some cases reflect assumptions and judgments as to the obligation or willingness and ability of third parties to bear a proportionate or allocated share of the cost of these activities. Due to the numerous uncertainties and variables associated with these assumptions and judgments, and the effects of changes in governmental regulation and environmental technologies, both the precision and reliability of the resulting estimates of the related contingencies are subject to substantial uncertainties. We regularly monitor our estimated exposure to environmental loss contingencies and, as additional information becomes known, may change our estimates significantly. However, no estimate of the range of any such change can be made at this time.
In those instances in which our estimated exposure reflects actual or anticipated cost-sharing arrangements with third parties, we do not believe that we will be exposed to additional material liability as a result of non-performance by such third parties. There are three forms of cost-sharing arrangements under which costs are apportioned to others and are therefore not reflected in our environmental reserves. The amounts involved, the number of sites and a description of each are as follows:
|
•
|
Approximately
$1.9 million
of costs, related to two sites, pursuant to formal cost-sharing arrangements between us and one or more third parties.
|
|
•
|
Approximately
$2.1 million
of costs, related to two transactions each covering multiple sites, pursuant to agreements contained in purchase and sale documents where we have sold an asset to a third party and that
|
67
third party has assumed responsibility for all or a portion of any remediation costs required for the sold asset.
|
•
|
Approximately
$0.3 million
of costs, related to two sites undergoing cleanup pursuant to federal or state environmental laws, where multiple parties are involved.
|
We consider the financial condition of third parties subject to the cost-sharing arrangements discussed above in determining the amounts to be reflected in our environmental reserves. In addition, we are a party to clean-up activities at two additional sites for which we do not believe that the failure of a third party to discharge its allocated responsibility would significantly increase our financial responsibility based on the manner in which financial responsibility has been, or is expected to be, allocated.
Our estimates of our environmental loss contingencies do not reflect potential future recoveries from insurance carriers except to the extent that recovery may from time to time be deemed probable as a result of a carrier’s agreement to payment terms.
The activity in our reserve for estimated environmental loss contingency reserves for the last three years is summarized in the following table.
|
|
Year ended December 31,
|
||||||||||
|
Dollar amounts in millions
|
2018
|
2017
|
2016
|
||||||||
|
Beginning balance
|
$
|
15.0
|
|
$
|
15.9
|
|
$
|
16.6
|
|
||
|
Adjusted to expense (income) during the year
|
(2.1
|
)
|
1.2
|
|
0.7
|
|
|||||
|
Payments made
|
(2.2
|
)
|
(2.1
|
)
|
(1.4
|
)
|
|||||
|
Translation
|
(0.1
|
)
|
—
|
|
—
|
|
|||||
|
Ending balance
|
$
|
10.6
|
|
$
|
15.0
|
|
$
|
15.9
|
|
||
Recorded in Other assets is $
1.4 million
related to a receivable for reimbursements of environmental costs associated with a non-operating site as of
December 31, 2018
.
During
2018
,
2017
and
2016
, we adjusted our reserves at a number of sites to reflect current estimates of remediation costs and environmental settlements.
Other Proceedings
We and our subsidiaries are parties to other legal proceedings in the ordinary course of business. Based on the information currently available, management believes that the resolution of such proceedings will not have a material adverse effect on our financial position, results of operations, cash flows or liquidity.
19. COMMITMENTS AND CONTINGENT LIABILITIES
Self insurance
We are primarily self-insured for workers’ compensation and employee health care liability costs. Self-insurance liabilities for workers’ compensation are determined based upon a valuation performed by an actuarial firm. The estimate of future workers’ compensation liabilities incorporates loss development and an estimate associated with incurred but not yet reported claims. These claims are discounted. Self-insurance liabilities for employee health costs are determined actuarially based upon claims filed and estimated claims incurred but not yet reported. These claims are not discounted.
Indemnities and Guarantees
We are a party to contracts in which we agree to indemnify third parties for certain liabilities that arise out of or relate to the subject matter of the contract. In some cases, this indemnity extends to related liabilities arising out of
68
the negligence of the indemnified parties, but usually excludes any liabilities caused by gross negligence or willful misconduct of the indemnified parties. We cannot estimate the potential amount of future payments under these agreements until events arise that would trigger the liability.
Additionally, in connection with certain sales of assets and divestitures of businesses, we have agreed to indemnify the buyer and related parties for certain losses or liabilities incurred by the buyer or such related parties with respect to (1) the representations and warranties made to the buyer by us in connection with the sales and (2) liabilities related to the pre-closing operations of the assets sold. Indemnities related to pre-closing operations generally include environmental liabilities, tax liabilities and other liabilities not assumed by the buyer.
Indemnities related to the pre-closing operations of sold assets normally do not represent added liabilities for us, but simply serve to protect the buyer from potential liability associated with the obligations that existed (known and unknown) at the time of the sale. We record accruals for those pre-closing obligations that are considered probable and estimable. We have not accrued any additional amounts as a result of the indemnity agreements summarized below as we believes the fair value of the guarantees are not material.
|
•
|
In connection with various sales of our timberlands, we have agreed to indemnify various buyers with respect to losses resulting from breaches of limited representations and warranties contained in these agreements. These indemnities generally are capped at a maximum potential liability and have an unspecified duration.
|
|
•
|
In connection with the sale by LP Canada Pulp Ltd (LPCP) of its pulp mill in Chetwynd, BC, Canada to Tembec, Ltd in October 2002, we provided an indemnity of unspecified duration provided by LPCP for liabilities arising out of pre-closing operations. These indemnities, which do not extend to environmental liabilities, are capped at
C$15.0 million
in the aggregate.
|
|
•
|
In connection with the mill exchange by LP Canada of its non-operating OSB mill in Chambord, Quebec to Norbord in November 2016, we provided an indemnity for liabilities arising out of pre-closing operations. These indemnities are capped at
C$5.0 million
in aggregate.
|
We also have various other indemnities that are individually and in the aggregate immaterial.
We will record a liability related to specific indemnification when future payment is probable and the amount is estimable.
Operating Leases
We lease certain office, manufacturing, warehousing and other plant sites and equipment. The leases generally provide for the lessee to pay taxes, maintenance, insurance and certain other operating costs of the leased properties.
At
December 31, 2018
, future minimum commitments are as follows:
|
Dollar amounts in millions
|
|
||
|
Year ended December 31,
|
|
||
|
2019
|
$
|
8.4
|
|
|
2020
|
7.3
|
|
|
|
2021
|
4.6
|
|
|
|
2022
|
1.8
|
|
|
|
2023
|
—
|
|
|
|
2024 and thereafter
|
—
|
|
|
|
Total
|
$
|
22.1
|
|
Rental expense for operating leases amounted to
$15.1 million
,
$12.5 million
and
$11.0 million
in
2018
,
2017
and
2016
.
69
20. PRODUCT WARRANTIES
We offer warranties on the sale of most of our products and record an accrual for estimated future claims. Such accruals are based upon historical experience and management’s estimate of the level of future claims. The activity in warranty reserves for the last three years is summarized in the following table.
|
|
Year ended December 31,
|
||||||||||
|
Dollar amounts in millions
|
2018
|
2017
|
2016
|
||||||||
|
Beginning balance
|
$
|
24.7
|
|
$
|
24.1
|
|
$
|
21.0
|
|
||
|
Accrued to expense during the year
|
1.0
|
|
1.0
|
|
0.8
|
|
|||||
|
Accrued/ (credited) to other operating credits and charges
|
(7.7
|
)
|
5.4
|
|
16.9
|
|
|||||
|
Accrued to discontinued operations
|
5.0
|
|
1.5
|
|
0.5
|
|
|||||
|
Foreign currency translation
|
(0.7
|
)
|
2.2
|
|
(0.2
|
)
|
|||||
|
Payments made
|
(8.8
|
)
|
(9.5
|
)
|
(14.9
|
)
|
|||||
|
Total warranty reserves
|
13.5
|
|
24.7
|
|
24.1
|
|
|||||
|
Current portion of warranty reserves
|
(3.0
|
)
|
(9.0
|
)
|
(9.0
|
)
|
|||||
|
Long term portion of warranty reserves
|
$
|
10.5
|
|
$
|
15.7
|
|
$
|
15.1
|
|
||
The current portion of the warranty reserve is included in “Accounts payable and accrued liabilities” and the long-term portion is included in “Other long-term liabilities” on the Consolidated Balance Sheets.
We changed the warranty reserves related to CanExel products sold in certain geographic areas and for a specific time period decreasing by
$7.7 million
in 2018 and increasing by
$5.4 million
in 2017. The changes to the reserve reflected revised estimates of future claims.
We increased the warranty reserves related to discontinued composite decking products by $
5.0 million
,
$1.5 million
and
$0.5 million
for the years ended
December 31, 2018
,
2017
and
2016
. The additional reserves reflect revised estimates of future claim payments based upon an increase in decking warranty claims.
We believe that the warranty reserve balances at
December 31, 2018
are adequate to cover future warranty payments. However, it is possible that additional charges may be required.
21. DISCONTINUED OPERATIONS
Over the last several years, we have sold selected businesses and assets in order to improve our operating results. For all periods presented, these operations include residual losses of mills divested in past years and associated warranty and other liabilities associated with these operations.
|
Dollar amounts in millions
|
2018
|
2017
|
2016
|
|||||||||
|
Operating loss
|
$
|
(5.6
|
)
|
$
|
(2.0
|
)
|
$
|
(0.8
|
)
|
|||
|
Cash provided by (used in) operations from discontinued operations
|
(6.7
|
)
|
(1.8
|
)
|
(2.6
|
)
|
||||||
Included in the operating losses of discontinued operations for the years ended
December 31, 2018
,
2017
and
2016
is an increase in warranty reserves of
$5.0 million
,
$1.5 million
and
$0.5 million
associated with discontinued composite decking products. Included in cash provided by (used in) operating activities on our Consolidated Statements of Cash Flows for the years ended
December 31, 2018
,
2017
and
2016
is
$6.1 million
,
$1.3 million
and
$2.3 million
of cash settlements of warranty obligations associated with discontinued operations.
70
|
22.
|
RETIREMENT PLANS AND POSTRETIREMENT BENEFITS
|
We sponsor various defined benefit and defined contribution retirement plans that provide retirement benefits to substantially all of our employees. Most regularly scheduled employees are eligible to participate in these plans except those covered by a collective bargaining agreement, unless the collective bargaining agreement specifically allows for participation in our plans. We contribute to a multiemployer plan for certain employees covered by collective bargaining agreements. We also provide other post-retirement benefits consisting primarily of healthcare benefits to certain retirees who meet age and service requirements.
Defined Benefit Plans
Pension benefits are earned generally based upon years of service and compensation during active employment. Contributions to the qualified defined benefit pension plans are based on actuarial calculations of amounts to cover current service costs and amortization of prior service costs over periods ranging up to
20 years
. We contribute additional funds as necessary to maintain desired funding levels. As of January 1, 2018, we retroactively adopted ASU 2017-07, "Retirement Benefits - Improving the Presentation of Net Periodic Pension Cost and Net Periodic Postretirement Benefit Cost". See Note 2 for further discussion.
Benefit accruals under our most significant plan, which account for approximately
81%
of the assets and
83%
of the benefit obligations in the tables below, had been credited at the rate of
4%
of eligible compensation with an interest credit based upon the 30-year U.S. Treasury rate. The Company discontinued providing contribution credits effective January 1, 2010 to this plan. The remaining defined benefit pension plans in Canada use a variety of benefit formulas, and we will discontinue providing contribution credits effective January 1, 2019.
We also maintain a Supplemental Executive Retirement Plan (SERP), an unfunded, non-qualified defined benefit plan intended to provide supplemental retirement benefits to certain executives. Benefits are generally based on compensation in the years immediately preceding normal retirement. During the years ended
December 31, 2018
and 2017, we recorded a plan settlement charge of $
0.1 million
and
$3.1 million
associated with the retirement of our executives during 2018 and 2017. As of
December 31, 2018
, we have no active participants in the SERP plan.
71
The projected benefit obligation is the actuarial present value of benefits attributable to employee service rendered to date, including the effects of estimated salary increases. The following table details information regarding our pension plans at December 31:
|
Dollar amounts in millions
|
2018
|
2017
|
|||||
|
Change in benefit obligation:
|
|||||||
|
Beginning of year balance
|
$
|
345.5
|
|
$
|
331.9
|
|
|
|
Service cost
|
2.6
|
|
4.9
|
|
|||
|
Interest cost
|
11.1
|
|
12.5
|
|
|||
|
Actuarial loss
|
(24.5
|
)
|
10.8
|
|
|||
|
Curtailment
|
(1.3
|
)
|
—
|
|
|||
|
Foreign exchange rate changes
|
(4.5
|
)
|
3.6
|
|
|||
|
Benefits paid
|
(32.2
|
)
|
(18.2
|
)
|
|||
|
End of year balance
|
$
|
296.7
|
|
$
|
345.5
|
|
|
|
Change in assets (fair value):
|
|||||||
|
Beginning of year balance
|
$
|
265.9
|
|
$
|
239.9
|
|
|
|
Actual return on plan assets
|
(7.3
|
)
|
27.8
|
|
|||
|
Employer contribution
|
52.9
|
|
12.7
|
|
|||
|
Foreign exchange rate changes
|
(4.5
|
)
|
3.7
|
|
|||
|
Benefits paid
|
(32.2
|
)
|
(18.2
|
)
|
|||
|
End of year balance
|
$
|
274.8
|
|
$
|
265.9
|
|
|
|
Funded status:
|
|||||||
|
Plan assets (less than) over benefit obligations:
|
$
|
(21.9
|
)
|
$
|
(79.6
|
)
|
|
|
Amounts included in the balance sheet:
|
|||||||
|
Noncurrent pension assets, included in “Other assets”
|
$
|
4.5
|
|
$
|
1.4
|
|
|
|
Current pension liabilities, included in “Accounts payable and accrued liabilities”
|
(3.1
|
)
|
(12.1
|
)
|
|||
|
Noncurrent pension liabilities, included in “Other long-term liabilities”
|
(23.3
|
)
|
(68.9
|
)
|
|||
|
Net amount recognized
|
$
|
(21.9
|
)
|
$
|
(79.6
|
)
|
|
The pretax amounts recognized in Accumulated other comprehensive loss were as follows:
|
Dollar amounts in millions
|
Actuarial losses
|
Prior service cost
|
Total
|
||||||||
|
December 31, 2016
|
$
|
(140.6
|
)
|
$
|
(8.4
|
)
|
$
|
(149.0
|
)
|
||
|
Other comprehensive income (loss) before reclassifications
|
3.2
|
|
—
|
|
3.2
|
|
|||||
|
Amounts reclassified from accumulated comprehensive loss
|
9.3
|
|
0.5
|
|
9.8
|
|
|||||
|
December 31, 2017
|
(128.1
|
)
|
(7.9
|
)
|
(136.0
|
)
|
|||||
|
Other comprehensive income (loss) before reclassifications
|
4.1
|
|
—
|
|
4.1
|
|
|||||
|
Amounts reclassified from accumulated comprehensive loss
|
7.6
|
|
0.5
|
|
8.1
|
|
|||||
|
December 31, 2018
|
$
|
(116.4
|
)
|
$
|
(7.4
|
)
|
$
|
(123.8
|
)
|
||
72
Weighted-average assumptions used to calculate our benefit obligations at December 31:
|
2018
|
2017
|
||||
|
Discount rate:
|
|||||
|
US
|
4.2
|
%
|
3.5
|
%
|
|
|
Canada
|
3.8
|
%
|
3.3
|
%
|
|
|
SERP
|
NA
|
|
2.9
|
%
|
|
|
Rate of compensation increase:
|
|||||
|
US
|
NA
|
|
NA
|
|
|
|
Canada
|
3.5
|
%
|
3.5
|
%
|
|
|
SERP
|
NA
|
|
3.0
|
%
|
|
Benefit obligations by plan category are as follows:
|
2018
|
|||||||||||||||
|
Dollar amounts in millions
|
US
|
Canada
|
SERP
|
Total
|
|||||||||||
|
Fair value of plan assets
|
$
|
222.4
|
|
$
|
52.4
|
|
$
|
—
|
|
$
|
274.8
|
|
|||
|
Benefit obligation
|
244.8
|
|
49.0
|
|
2.9
|
|
296.7
|
|
|||||||
|
Funded Status
|
$
|
(22.4
|
)
|
$
|
3.4
|
|
$
|
(2.9
|
)
|
$
|
(21.9
|
)
|
|||
|
2017
|
|||||||||||||||
|
US
|
Canada
|
SERP
|
Total
|
||||||||||||
|
Fair value of plan assets
|
$
|
207.7
|
|
$
|
58.2
|
|
$
|
—
|
|
$
|
265.9
|
|
|||
|
Benefit obligation
|
272.6
|
|
58.1
|
|
14.8
|
|
345.5
|
|
|||||||
|
Funded Status
|
$
|
(64.9
|
)
|
$
|
0.1
|
|
$
|
(14.8
|
)
|
$
|
(79.6
|
)
|
|||
The total accumulated benefit obligation for all pension plans as of
December 31, 2018
and
2017
was
$296.5 million
and
$343.2 million
. The decrease in the accumulated benefit obligation primarily is a result of an increase in the discount rate and a discretionary contribution to our U.S. plan of $
33.2 million
to maximize the tax savings allowed under the Tax Act and lower our expenses associated with pension funding regulations going forward.
The accumulated benefit obligation and fair value of plan assets for pension plans with accumulated benefit obligations in excess of plan assets were $
248.8 million
and $
222.4 million
at
December 31, 2018
and $
287.9 million
and $
207.7 million
at
December 31, 2017
. The projected benefit obligations and fair value of plan assets of plans with projected benefit obligations in excess of plan assets were $
248.8 million
and $
222.4 million
at
December 31, 2018
and $
288.7 million
and $
207.7 million
at
December 31, 2017
.
The amount of accumulated other comprehensive income that is expected to be amortized as expense during
2019
is:
|
Dollar amounts in millions
|
|
||
|
Net actuarial loss
|
$
|
4.7
|
|
|
Prior service cost
|
0.5
|
|
|
|
Total
|
$
|
5.2
|
|
The benefits expected to be paid from the benefit plans, which reflect expected future service, are as follows:
73
|
Dollar amounts in millions
|
|
||
|
Year
|
|||
|
2019
|
$
|
22.4
|
|
|
2020
|
20.3
|
|
|
|
2021
|
20.4
|
|
|
|
2022
|
19.6
|
|
|
|
2023
|
20.1
|
|
|
|
2024– 2028
|
96.6
|
|
|
These estimated benefit payments are based upon assumptions about future events. Actual benefit payments may vary significantly from these estimates.
The following table sets forth the net periodic pension cost for our defined benefit pension plans. The components of our net periodic pension costs consisted of the following:
|
|
Year ended December 31,
|
||||||||||
|
Dollar amounts in millions
|
2018
|
2017
|
2016
|
||||||||
|
Service cost
|
$
|
2.6
|
|
$
|
4.9
|
|
$
|
4.3
|
|
||
|
Other components of net periodic pension cost:
|
|||||||||||
|
Interest cost
|
11.1
|
|
12.5
|
|
13.1
|
|
|||||
|
Expected return on plan assets
|
(13.9
|
)
|
(13.1
|
)
|
(13.1
|
)
|
|||||
|
Amortization of prior service cost and net transition asset
|
0.5
|
|
0.5
|
|
0.5
|
|
|||||
|
Amortization of net actuarial loss
|
6.3
|
|
6.2
|
|
5.4
|
|
|||||
|
Net periodic pension cost before loss due to settlement
|
$
|
6.6
|
|
$
|
11.0
|
|
$
|
10.2
|
|
||
|
Loss due to settlement
|
0.1
|
|
3.1
|
|
—
|
|
|||||
|
$
|
6.7
|
|
$
|
14.1
|
|
$
|
10.2
|
|
|||
|
Net periodic pension cost included in cost of sales
|
$
|
1.6
|
|
$
|
3.6
|
|
$
|
3.2
|
|
||
|
Net periodic pension cost included in selling, general, and administrative expenses
|
1.0
|
|
1.3
|
|
1.1
|
|
|||||
|
Net periodic pension cost included in other non-operating items
|
4.1
|
|
9.2
|
|
5.9
|
|
|||||
|
$
|
6.7
|
|
$
|
14.1
|
|
$
|
10.2
|
|
|||
74
Weighted-average assumptions used to calculate our net periodic pension costs for the year ended December 31:
|
2018
|
2017
|
2016
|
||||||
|
Discount rate:
|
||||||||
|
U.S.
|
3.5
|
%
|
4.0
|
%
|
4.2
|
%
|
||
|
Canada
|
3.3
|
%
|
3.7
|
%
|
3.8
|
%
|
||
|
SERP
|
NA
|
|
2.7
|
%
|
2.8
|
%
|
||
|
Expected return on plan assets:
|
||||||||
|
U.S.
|
5.8
|
%
|
5.8
|
%
|
5.8
|
%
|
||
|
Canada
|
4.1
|
%
|
3.8
|
%
|
3.8
|
%
|
||
|
SERP
|
NA
|
|
NA
|
|
NA
|
|
||
|
Rate of compensation increase:
|
||||||||
|
U.S.
|
NA
|
|
NA
|
|
NA
|
|
||
|
Canada
|
3.5
|
%
|
3.5
|
%
|
3.5
|
%
|
||
|
SERP
|
NA
|
|
3.0
|
%
|
3.0
|
%
|
||
The expected long-term rate of return on plan assets reflects the weighted-average expected long-term rates of return for the broad categories of investments currently held in the plans (adjusted for expected changes), based on historical rates of return for each broad category, as well as factors that may constrain or enhance returns in the broad categories in the future. The expected long-term rate of return on plan assets is adjusted when there are fundamental changes in expected returns in one or more broad asset categories and when the weighted-average mix of assets in the plans changes significantly.
Asset allocation targets are established based upon the long-term returns and volatility characteristics of the investment classes and recognize the benefits of diversification and the profits of the plans’ liabilities. The actual and target allocations at the measurement dates are as follows:
|
Target
Allocation
2018
|
Actual
Allocation
|
|||||||
|
2018
|
2017
|
|||||||
|
Asset category
|
||||||||
|
U.S. Plans
|
||||||||
|
Equity securities
|
33
|
%
|
26
|
%
|
40
|
%
|
||
|
Debt securities
|
50
|
%
|
52
|
%
|
20
|
%
|
||
|
Multi-Strategy Funds
|
17
|
%
|
22
|
%
|
40
|
%
|
||
|
Total Allocation for U.S. Plans
|
100
|
%
|
100
|
%
|
100
|
%
|
||
|
Non-U.S. Plans
|
||||||||
|
Equity securities
|
—
|
%
|
—
|
%
|
28
|
%
|
||
|
Debt securities
|
90
|
%
|
90
|
%
|
70
|
%
|
||
|
Multi-Strategy Funds
|
10
|
%
|
10
|
%
|
2
|
%
|
||
|
Total Allocation for Non-U.S. Plans
|
100
|
%
|
100
|
%
|
100
|
%
|
||
Our investment policies for the defined benefit pension plans provide target asset allocations by broad categories of investment and ranges of acceptable allocations. These policies are set by an administrative committee with the goal of maximizing long-term investment returns within acceptable levels of volatility and risk. Our U.S. plans include hedge funds and real return investment strategies to increase returns and reduce volatility. Our plans do not currently invest directly in derivative securities, although such investments may be considered in the future to increase returns
75
and/or reduce volatility. To the extent the expected return on plan assets varies from the actual return, an actuarial gain or loss results.
The fair value of our pension plan assets at
December 31, 2018
and
December 31, 2017
, fair value asset categories and the level of inputs as defined in Note 4 are as follows:
|
Dollar amounts in millions
Asset Category
|
December 31, 2018
|
Quoted Prices
in Active
Markets for
Identical
Assets
(Level 1)
|
Significant
Observable
Inputs
(Level 2)
|
Significant
Unobservable
Inputs
(Level 3)
|
|||||||||||
|
Equity investment funds:
(a)
|
|||||||||||||||
|
Domestic stock funds:
|
|
|
|||||||||||||
|
Measured within the fair value hierarchy
|
$
|
22.3
|
|
$
|
22.3
|
|
$
|
—
|
|
$
|
—
|
|
|||
|
Measured at net asset value
(d)
|
8.3
|
|
—
|
|
8.3
|
|
—
|
|
|||||||
|
International stock funds:
|
|
|
|||||||||||||
|
Measured within the fair value hierarchy
|
13.2
|
|
13.2
|
|
—
|
|
—
|
|
|||||||
|
Measured at net asset value
(d)
|
13.7
|
|
|
|
13.7
|
|
|
|
|||||||
|
Fixed income investment funds:
(b)
|
|||||||||||||||
|
Domestic bond funds:
|
|||||||||||||||
|
Measured within the fair value hierarchy
|
27.1
|
|
27.1
|
|
—
|
|
—
|
|
|||||||
|
Measured at net asset value
(d)
|
88.5
|
|
3.9
|
|
84.6
|
|
|
|
|||||||
|
International bond funds:
|
|||||||||||||||
|
Measured within the fair value hierarchy
|
27.3
|
|
|
|
27.3
|
|
|
|
|||||||
|
Measured at net asset value
(d)
|
20.1
|
|
—
|
|
20.1
|
|
—
|
|
|||||||
|
Multi-strategy funds:
(c)
|
|||||||||||||||
|
Measured within the fair value hierarchy
|
35.0
|
|
35.0
|
|
—
|
|
—
|
|
|||||||
|
Measured at net asset value
(d)
|
17.8
|
|
—
|
|
5.1
|
|
12.7
|
|
|||||||
|
Cash & cash equivalents
|
1.5
|
|
—
|
|
1.5
|
|
—
|
|
|||||||
|
Total
|
$
|
274.8
|
|
$
|
101.5
|
|
$
|
160.6
|
|
$
|
12.7
|
|
|||
_______________
|
(a)
|
Equity investments include investments in funds that are primarily invested in large capitalization U.S. and international equity securities and a mutual fund.
|
|
(b)
|
Fixed income investments include investments in funds that are primarily invested in a diversified portfolio of investment grade U.S. and international debt securities.
|
|
(c)
|
The multi-strategy funds invest in various hedge funds that employ a fund of funds strategy.
|
|
(d)
|
Investments for which fair value is measured using the net asset value per share as a practical expedient are not categorized within the fair value hierarchy.
|
76
|
Dollar amounts in millions
Asset Category
|
December 31, 2017
|
Quoted Prices
in Active
Markets for
Identical
Assets
(Level 1)
|
Significant
Observable
Inputs
(Level 2)
|
Significant
Unobservable
Inputs
(Level 3)
|
|||||||||||
|
Equity investment funds:
(a)
|
|||||||||||||||
|
Domestic stock funds
|
$
|
56.2
|
|
$
|
42.2
|
|
$
|
14.0
|
|
$
|
—
|
|
|||
|
International stock funds
|
43.1
|
|
15.5
|
|
27.6
|
|
—
|
|
|||||||
|
Fixed income investment funds:
(b)
|
|
|
|||||||||||||
|
Domestic bond funds
|
40.2
|
|
20.2
|
|
20.0
|
|
—
|
|
|||||||
|
International bond funds
|
40.9
|
|
—
|
|
40.9
|
|
—
|
|
|||||||
|
Multi-strategy funds
(c)
|
82.5
|
|
69.6
|
|
—
|
|
12.9
|
|
|||||||
|
Cash & cash equivalents
|
3.0
|
|
—
|
|
3.0
|
|
—
|
|
|||||||
|
Total
|
$
|
265.9
|
|
$
|
147.5
|
|
$
|
105.5
|
|
$
|
12.9
|
|
|||
|
(a)
|
Equity investments include investments in funds that are primarily invested in large capitalization U.S. and international equity securities and a mutual fund.
|
|
(b)
|
Fixed income investments include investments in funds that are primarily invested in a diversified portfolio of investment grade U.S. and international debt securities.
|
|
(c)
|
The multi-strategy funds invest in various hedge funds that employ a fund of funds strategy.
|
Level 1 investments are valued based on active market quotations.
Level 2 investments are valued based on the unit prices quoted by the funds, representing the fair value of underlying investments.
Due to the lack of observable market quotations on real estate and multi-strategy funds, we evaluate our structure and current market estimates of fair value, including fair value estimates from the funds that rely exclusively on Level 3 inputs. These inputs include those that are based on expected cash flow streams and property values, including assessments of overall market liquidity. The valuations are subject to uncertainties that are difficult to predict.
The following table summarizes assets measured at fair value on a recurring basis using significant unobservable inputs (Level 3) during the period.
|
Dollar amounts in millions
|
Multi-Strategy
Funds
|
||
|
Balance at January 1, 2017
|
$
|
12.2
|
|
|
Total unrealized gains
|
0.7
|
|
|
|
Contribution (redemption)
|
0.1
|
|
|
|
Management fees
|
(0.1
|
)
|
|
|
Balance at December 31, 2017
|
$
|
12.9
|
|
|
Total unrealized gains
|
$
|
(0.2
|
)
|
|
Contribution (redemption)
|
0.2
|
|
|
|
Management fees
|
(0.2
|
)
|
|
|
Balance at December 31, 2018
|
$
|
12.7
|
|
Defined Contribution Plans
We also sponsor defined contribution plans in the U.S. and Canada. In the U.S., these plans are primarily 401(k)
77
plans for hourly and salaried employees that allow for pre-tax employee deferrals and a company match of up to
5.0%
of an employee’s eligible wages (subject to certain limits). Under the profit sharing feature of these plans, we may elect to contribute a discretionary amount as a percentage of eligible wages. Included in the assets of the 401(k) and profit sharing plans are
1.3 million
shares of LP common stock that represented approximately
7.5%
of the total market value of plan assets at
December 31, 2018
.
In Canada, we sponsor both defined contribution plans and Registered Retirement Savings Plans for hourly and salaried employees that allow for tax employee deferrals. We provide a base contribution of
2.5%
of eligible earnings and matches
50%
of an employee’s deferrals up to a maximum of
3%
of each employee’s eligible earnings (subject to certain limits).
Expenses related to defined contribution plans and the multiemployer plan in
2018
,
2017
and
2016
were
$10.1 million
,
$9.7 million
and
$8.7 million
.
Other Benefit Plans
We have several plans that provide post-retirement benefits other than pensions, primarily for salaried employees in the U.S. and certain groups of Canadian employees. The funded status at
December 31, 2018
and
2017
was
$8.6 million
and
$9.0 million
. Net expense related to these plans was not significant in
2018
or
2017
.
Effective August 16, 2004, we adopted the Louisiana-Pacific Corporation 2004 Executive Deferred Compensation Plan (the Plan). Pursuant to the Plan, certain management employees are eligible to defer up to
90%
of their regular salary and annual cash incentives that exceed the limitation as set forth by the I.R.S. Each plan participant is fully vested in all employee deferred compensation and earnings credited associated with employee contributions. Employer contributions and associated earnings vest over periods not exceeding
five years
. The liability under this plan amounted to
$1.1 million
and
$1.9 million
at
December 31, 2018
and
December 31, 2017
and is included in “Other long-term liabilities” on LP’s Consolidated Balance Sheets.
78
23. ACCUMULATED COMPREHENSIVE INCOME (LOSS)
Accumulated comprehensive loss consists of cumulative translation adjustments, unrealized gains (losses) on certain derivative instruments and pension and post retirement adjustments. Other comprehensive income activity, net of tax, is provided in the following table for the years ended
December 31, 2018
,
2017
and
2016
.
|
Pension adjustments
|
|||||||||||||||||||||||
|
Dollar amounts in millions
|
Foreign
currency
translation
adjustments
|
Actuarial losses
|
Prior service costs
|
Unrealized
gain (loss)
on investments
|
Other
|
Total
|
|||||||||||||||||
|
Balance at January 1, 2016
|
$
|
(55.1
|
)
|
$
|
(87.8
|
)
|
$
|
(5.5
|
)
|
$
|
3.3
|
|
$
|
(1.0
|
)
|
$
|
(146.1
|
)
|
|||||
|
Other comprehensive income (loss) before reclassifications
|
8.8
|
|
(5.3
|
)
|
—
|
|
(1.0
|
)
|
0.4
|
|
2.9
|
|
|||||||||||
|
Income taxes
|
—
|
|
1.9
|
|
—
|
|
0.4
|
|
(0.1
|
)
|
2.2
|
|
|||||||||||
|
Net other comprehensive income (loss) before reclassifications
|
8.8
|
|
(3.4
|
)
|
—
|
|
(0.6
|
)
|
0.3
|
|
5.1
|
|
|||||||||||
|
Amounts reclassified from accumulated comprehensive income (loss)
|
—
|
|
5.5
|
|
0.5
|
|
—
|
|
—
|
|
6.0
|
|
|||||||||||
|
Income taxes
|
—
|
|
(2.0
|
)
|
(0.2
|
)
|
—
|
|
—
|
|
(2.2
|
)
|
|||||||||||
|
Net amounts reclassified from cumulative other comprehensive income (loss)
|
—
|
|
3.5
|
|
0.3
|
|
—
|
|
—
|
|
3.8
|
|
|||||||||||
|
Total other comprehensive income (loss)
|
8.8
|
|
0.1
|
|
0.3
|
|
(0.6
|
)
|
0.3
|
|
8.9
|
|
|||||||||||
|
Balance at December 31, 2016
|
(46.3
|
)
|
(87.7
|
)
|
(5.2
|
)
|
2.7
|
|
(0.7
|
)
|
(137.2
|
)
|
|||||||||||
|
Other comprehensive income (loss) before reclassifications
|
6.6
|
|
3.2
|
|
—
|
|
1.3
|
|
(0.9
|
)
|
10.2
|
|
|||||||||||
|
Income taxes
|
—
|
|
(1.1
|
)
|
—
|
|
(0.5
|
)
|
0.2
|
|
(1.4
|
)
|
|||||||||||
|
Net other comprehensive income (loss) before reclassifications
|
6.6
|
|
2.1
|
|
—
|
|
0.8
|
|
(0.7
|
)
|
8.8
|
|
|||||||||||
|
Amounts reclassified from accumulated comprehensive income (loss)
|
—
|
|
9.3
|
|
0.5
|
|
—
|
|
(0.1
|
)
|
9.7
|
|
|||||||||||
|
Income taxes
|
—
|
|
(3.2
|
)
|
(0.2
|
)
|
—
|
|
—
|
|
(3.4
|
)
|
|||||||||||
|
Net amounts reclassified from cumulative other comprehensive income (loss)
|
—
|
|
6.1
|
|
0.3
|
|
—
|
|
(0.1
|
)
|
6.3
|
|
|||||||||||
|
Total other comprehensive income (loss)
|
6.6
|
|
8.2
|
|
0.3
|
|
0.8
|
|
(0.8
|
)
|
15.1
|
|
|||||||||||
|
Balance at December 31, 2017
|
(39.7
|
)
|
(79.5
|
)
|
(4.9
|
)
|
3.5
|
|
(1.5
|
)
|
(122.1
|
)
|
|||||||||||
|
Effect of adoption of ASU 2018-02
|
—
|
|
(17.4
|
)
|
—
|
|
0.7
|
|
—
|
|
(16.7
|
)
|
|||||||||||
|
Other comprehensive income (loss) before reclassifications
|
(17.3
|
)
|
4.1
|
|
—
|
|
0.1
|
|
0.7
|
|
(12.4
|
)
|
|||||||||||
|
Income taxes
|
—
|
|
(1.1
|
)
|
—
|
|
—
|
|
(0.2
|
)
|
(1.3
|
)
|
|||||||||||
|
Net other comprehensive income (loss) before reclassifications
|
(17.3
|
)
|
3.0
|
|
—
|
|
0.1
|
|
0.5
|
|
(13.7
|
)
|
|||||||||||
|
Amounts reclassified from accumulated comprehensive income (loss)
|
—
|
|
7.6
|
|
0.5
|
|
—
|
|
—
|
|
8.1
|
|
|||||||||||
|
Income taxes
|
—
|
|
(1.9
|
)
|
(0.1
|
)
|
—
|
|
—
|
|
(2.0
|
)
|
|||||||||||
|
Net amounts reclassified from cumulative other comprehensive income (loss)
|
—
|
|
5.7
|
|
0.4
|
|
—
|
|
—
|
|
6.1
|
|
|||||||||||
|
Total other comprehensive income (loss)
|
(17.3
|
)
|
8.7
|
|
0.4
|
|
0.1
|
|
0.5
|
|
(7.6
|
)
|
|||||||||||
|
Balance at December 31, 2018
|
$
|
(57.0
|
)
|
$
|
(88.2
|
)
|
$
|
(4.5
|
)
|
$
|
4.3
|
|
$
|
(1.0
|
)
|
$
|
(146.4
|
)
|
|||||
(a) These accumulated other comprehensive income components are included in the computation of net periodic pension cost, see Note 22 for additional details. The net periodic pension cost is included in Cost of sales, Selling
79
and administrative and Other operating credits and charges, net classifications in the Consolidated Statements of Income.
Foreign currency translation adjustments exclude income tax expense (benefit) given that these adjustments arise out of the translation of assets into the reporting currency that is separate from the taxable income and is deemed to be reinvested for an indefinite period of time. The pension adjustments included an income tax provision of
$3.1 million
,
$4.5 million
and
$0.3 million
in 2018, 2017 and 2016, The unrealized gain (loss) on investments included a tax provision of
$0.5 million
in 2017 and a benefit of
$0.4 million
in 2016.
24. SEGMENT INFORMATION
Operating segments are defined as components of an enterprise that engage in business activities and by which discrete financial information is available that is evaluated on a regular basis by the chief operating decision maker to make decisions about how to allocate resources to the segment and assess the performance of the segment. We operate in four segments: Siding; North America Oriented Strand Board (OSB); Engineered Wood Products (EWP) and South America. Our business units have been aggregated into these four segments based upon the similarity of economic characteristics, customers and distribution methods. Our results of operations are summarized below for each of these segments separately as well as for the “other” category which comprises other products that are not individually significant. Segment information was prepared in accordance with the same accounting principles as those described in Note 1. We evaluate the performance of our business segments based upon operating profits excluding other operating credits and charges, net, gain (loss) on sales of and impairments of long-lived assets, general corporate and other expenses, translation gains and losses, interest and income taxes.
The siding segment includes Smart Side
®
strand and fiber siding products; CanExel
®
siding products; and other related products. The OSB segment includes commodity and value-added OSB products produced in North America. The engineered wood products segment includes laminated veneer lumber, laminated strand lumber; I-joists; plywood; and other related products. The South America segment includes products produced and/or sold (generally OSB, Siding and I-joists) in South America or exported to non-North American countries.
80
Information about our product segments is as follows:
|
|
Year ended December 31,
|
||||||||||
|
Dollar amounts in millions
|
2018
|
2017
|
2016
|
||||||||
|
SALES BY BUSINESS SEGMENT
|
|||||||||||
|
Siding
|
$
|
942.3
|
|
$
|
884.0
|
|
$
|
752.3
|
|
||
|
OSB
|
1,305.2
|
|
1,302.5
|
|
1,027.7
|
|
|||||
|
Engineered Wood Products
|
390.9
|
|
365.9
|
|
296.9
|
|
|||||
|
South America
|
160.8
|
|
155.3
|
|
136.9
|
|
|||||
|
Other products
|
28.9
|
|
30.0
|
|
26.9
|
|
|||||
|
Intersegment Sales
|
(0.1
|
)
|
(3.8
|
)
|
(7.3
|
)
|
|||||
|
Total sales
|
$
|
2,828.0
|
|
$
|
2,733.9
|
|
$
|
2,233.4
|
|
||
|
PROFIT (LOSS) BY BUSINESS SEGMENT
|
|||||||||||
|
Siding
|
$
|
201.6
|
|
$
|
188.7
|
|
$
|
128.0
|
|
||
|
OSB
|
395.7
|
|
427.3
|
|
187.8
|
|
|||||
|
Engineered Wood Products
|
19.5
|
|
15.7
|
|
(4.6
|
)
|
|||||
|
South America
|
31.0
|
|
24.3
|
|
17.0
|
|
|||||
|
Other products
|
(4.3
|
)
|
(3.4
|
)
|
(1.5
|
)
|
|||||
|
Other operating credits and charges, net
|
2.2
|
|
(4.9
|
)
|
(17.4
|
)
|
|||||
|
Gain (loss) on sales of and impairments of long-lived assets
|
(10.8
|
)
|
(6.8
|
)
|
8.4
|
|
|||||
|
General corporate and other expense, net
|
(111.7
|
)
|
(108.1
|
)
|
(102.3
|
)
|
|||||
|
Interest expense, net of capitalized interest
|
(15.8
|
)
|
(19.3
|
)
|
(32.1
|
)
|
|||||
|
Investment income
|
17.6
|
|
10.5
|
|
8.2
|
|
|||||
|
Other non-operating income (expense)
|
(3.9
|
)
|
(13.8
|
)
|
(21.4
|
)
|
|||||
|
Income from continuing operations before taxes
|
521.1
|
|
510.2
|
|
170.1
|
|
|||||
|
Provision for income taxes
|
122.3
|
|
119.1
|
|
19.8
|
|
|||||
|
Income from continuing operations
|
$
|
398.8
|
|
$
|
391.1
|
|
$
|
150.3
|
|
||
|
|
Year ended December 31,
|
||||||||||
|
|
2018
|
2017
|
2016
|
||||||||
|
DEPRECIATION AND AMORTIZATION
|
|||||||||||
|
Siding
|
$
|
32.3
|
|
$
|
30.9
|
|
$
|
27.4
|
|
||
|
OSB
|
58.3
|
|
61.6
|
|
58.6
|
|
|||||
|
Engineered Wood Products
|
15.1
|
|
15.8
|
|
12.7
|
|
|||||
|
South America
|
9.1
|
|
9.1
|
|
8.6
|
|
|||||
|
Other products
|
2.0
|
|
2.8
|
|
2.3
|
|
|||||
|
Non-segment related
|
3.2
|
|
3.1
|
|
3.2
|
|
|||||
|
Total depreciation and amortization
|
$
|
120.0
|
|
$
|
123.3
|
|
$
|
112.8
|
|
||
|
CAPITAL EXPENDITURES
|
|||||||||||
|
Siding
|
$
|
117.1
|
|
$
|
63.0
|
|
$
|
49.9
|
|
||
|
OSB
|
54.9
|
|
58.4
|
|
49.3
|
|
|||||
|
Engineered Wood Products
|
9.9
|
|
6.0
|
|
5.3
|
|
|||||
81
|
South America
|
28.3
|
|
17.5
|
|
8.7
|
|
|||||
|
Other products
|
1.2
|
|
1.0
|
|
8.1
|
|
|||||
|
Non-segment related
|
2.8
|
|
2.7
|
|
3.5
|
|
|||||
|
Total capital expenditures
|
$
|
214.2
|
|
$
|
148.6
|
|
$
|
124.8
|
|
||
Information concerning identifiable assets by segment is as follows:
|
Dollar amounts in millions
|
December 31,
|
||||||
|
2018
|
2016
|
||||||
|
IDENTIFIABLE ASSETS
|
|||||||
|
Siding
|
$
|
487.1
|
|
$
|
371.8
|
|
|
|
OSB
|
578.6
|
|
577.5
|
|
|||
|
Engineered Wood Products
|
122.9
|
|
116.3
|
|
|||
|
South America
|
113.6
|
|
95.9
|
|
|||
|
Other products
|
63.6
|
|
93.7
|
|
|||
|
Non-segment related
|
1,148.3
|
|
1,193.3
|
|
|||
|
Total assets
|
$
|
2,514.1
|
|
$
|
2,448.5
|
|
|
Non-segment related assets include cash and cash equivalents, short-term and long-term investments, corporate assets and other items.
Information concerning our geographic segments is as follows:
82
|
|
Year ended December 31,
|
||||||||||
|
Dollar amounts in millions
|
2018
|
2017
|
2016
|
||||||||
|
GEOGRAPHIC LOCATIONS
|
|||||||||||
|
Total Sales—Point of origin
|
|||||||||||
|
U.S.
|
$
|
2,409
|
|
$
|
2,307
|
|
$
|
1,882
|
|
||
|
Canada
|
861
|
|
704
|
|
682
|
|
|||||
|
South America
|
174
|
|
165
|
|
137
|
|
|||||
|
Intercompany sales
|
(616
|
)
|
(442
|
)
|
(468
|
)
|
|||||
|
Total Sales
|
$
|
2,828
|
|
$
|
2,734
|
|
$
|
2,233
|
|
||
|
Operating profit (loss)
|
|||||||||||
|
U.S.
|
$
|
475
|
|
$
|
462
|
|
$
|
239
|
|
||
|
Canada
|
138
|
|
167
|
|
71
|
|
|||||
|
South America
|
31
|
|
24
|
|
17
|
|
|||||
|
Other operating credits and charges, net and gain (loss) on sales of and impairments of long-lived assets
|
(9
|
)
|
(12
|
)
|
(9
|
)
|
|||||
|
General corporate expense, loss on early debt extinguishment, other income(expense) and interest, net
|
(114
|
)
|
(131
|
)
|
(148
|
)
|
|||||
|
521
|
|
510
|
|
170
|
|
||||||
|
Provision for income taxes
|
122
|
|
119
|
|
20
|
|
|||||
|
Income from continuing operations
|
$
|
399
|
|
$
|
391
|
|
$
|
150
|
|
||
|
IDENTIFIABLE TANGIBLE LONG LIVED ASSETS
|
|||||||||||
|
U.S.
|
$
|
540
|
|
$
|
529
|
|
$
|
516
|
|
||
|
Canada
|
449
|
|
380
|
|
365
|
|
|||||
|
South America
|
84
|
|
73
|
|
57
|
|
|||||
|
Total assets
|
$
|
1,073
|
|
$
|
982
|
|
$
|
938
|
|
||
83
25. SUBSEQUENT EVENT
As of January 15, 2019, LP obtained a controlling financial interest in Entekra based upon LP's ability to add an additional board member to Entekra's Board of Directors. LP will be required to consolidate Entekra's financial results within LP's consolidation financial statements beginning in the first quarter of 2019.
84
Interim Financial Results (unaudited)
|
|
1ST QTR
|
2ND QTR
|
3RD QTR
|
4TH QTR
|
|||||||||||||||||||||||||||
|
(Dollars in millions, except per share)
|
2018
|
2017
|
2018
|
2017
|
2018
|
2017
|
2018
|
2017
|
|||||||||||||||||||||||
|
QUARTERLY DATA
|
|||||||||||||||||||||||||||||||
|
Net sales
|
$
|
691.3
|
|
$
|
610.9
|
|
$
|
810.8
|
|
$
|
694.1
|
|
$
|
736.8
|
|
$
|
718.3
|
|
$
|
589.1
|
|
$
|
710.6
|
|
|||||||
|
Income from continuing operations before taxes, equity in income of unconsolidated affiliates
|
$
|
124.6
|
|
$
|
70.5
|
|
$
|
214.7
|
|
$
|
130.5
|
|
$
|
167.0
|
|
$
|
157.3
|
|
$
|
17.7
|
|
$
|
151.9
|
|
|||||||
|
Income from continuing operations
|
$
|
94.9
|
|
$
|
55.0
|
|
$
|
162.9
|
|
$
|
94.5
|
|
$
|
124.1
|
|
$
|
110.9
|
|
$
|
16.9
|
|
$
|
130.7
|
|
|||||||
|
Net income
|
$
|
90.9
|
|
$
|
55.0
|
|
$
|
162.7
|
|
$
|
94.5
|
|
$
|
124.0
|
|
$
|
109.8
|
|
$
|
17.0
|
|
$
|
130.5
|
|
|||||||
|
Income from continuing operations per share—basic
|
$
|
0.66
|
|
$
|
0.38
|
|
$
|
1.13
|
|
$
|
0.65
|
|
$
|
0.87
|
|
$
|
0.77
|
|
$
|
0.12
|
|
$
|
0.90
|
|
|||||||
|
Income from continuing operations per share—diluted
|
$
|
0.65
|
|
$
|
0.38
|
|
$
|
1.11
|
|
$
|
0.65
|
|
$
|
0.86
|
|
$
|
0.76
|
|
$
|
0.12
|
|
$
|
0.89
|
|
|||||||
|
Net income per share—basic
|
$
|
0.63
|
|
$
|
0.38
|
|
$
|
1.13
|
|
$
|
0.65
|
|
$
|
0.87
|
|
$
|
0.76
|
|
$
|
0.12
|
|
$
|
0.90
|
|
|||||||
|
Net income per share—diluted
|
$
|
0.62
|
|
$
|
0.38
|
|
$
|
1.11
|
|
$
|
0.65
|
|
$
|
0.86
|
|
$
|
0.75
|
|
$
|
0.12
|
|
$
|
0.89
|
|
|||||||
|
Cash dividends per share
|
$
|
0.13
|
|
$
|
—
|
|
$
|
0.13
|
|
$
|
—
|
|
$
|
0.13
|
|
$
|
—
|
|
$
|
0.13
|
|
$
|
—
|
|
|||||||
|
SALES BY SEGMENT:
|
|||||||||||||||||||||||||||||||
|
Siding
|
$
|
227.0
|
|
$
|
214.0
|
|
$
|
261.6
|
|
$
|
231.0
|
|
$
|
240.8
|
|
$
|
226.2
|
|
$
|
212.9
|
|
$
|
212.8
|
|
|||||||
|
OSB
|
313.3
|
|
268.4
|
|
387.4
|
|
325.0
|
|
349.1
|
|
350.9
|
|
255.4
|
|
358.2
|
|
|||||||||||||||
|
Engineered wood products
|
100.7
|
|
82.1
|
|
109.1
|
|
94.2
|
|
104.8
|
|
98.1
|
|
76.3
|
|
91.5
|
|
|||||||||||||||
|
South America
|
42.4
|
|
37.8
|
|
45.3
|
|
38.7
|
|
34.5
|
|
38.3
|
|
38.6
|
|
40.5
|
|
|||||||||||||||
|
Other
|
7.9
|
|
8.7
|
|
7.4
|
|
7.1
|
|
7.6
|
|
6.5
|
|
6.0
|
|
7.7
|
|
|||||||||||||||
|
Intersegment sales
|
—
|
|
(0.1
|
)
|
—
|
|
(1.9
|
)
|
—
|
|
(1.7
|
)
|
(0.1
|
)
|
(0.1
|
)
|
|||||||||||||||
|
Total net sales
|
$
|
691.3
|
|
$
|
610.9
|
|
$
|
810.8
|
|
$
|
694.1
|
|
$
|
736.8
|
|
$
|
718.3
|
|
$
|
589.1
|
|
$
|
710.6
|
|
|||||||
|
PROFIT (LOSS) BY BUSINESS SEGMENT
|
|||||||||||||||||||||||||||||||
|
Siding
|
$
|
45.3
|
|
$
|
40.7
|
|
$
|
62.7
|
|
$
|
49.0
|
|
$
|
59.8
|
|
$
|
53.3
|
|
$
|
33.8
|
|
$
|
45.7
|
|
|||||||
|
OSB
|
97.4
|
|
60.8
|
|
157.4
|
|
103.0
|
|
114.8
|
|
126.8
|
|
26.1
|
|
136.7
|
|
|||||||||||||||
|
Engineered wood products
|
2.8
|
|
0.8
|
|
8.6
|
|
5.3
|
|
8.5
|
|
6.5
|
|
(0.4
|
)
|
3.1
|
|
|||||||||||||||
|
South America
|
8.9
|
|
5.1
|
|
9.6
|
|
5.5
|
|
6.5
|
|
5.8
|
|
6.0
|
|
7.9
|
|
|||||||||||||||
|
Other
|
(0.9
|
)
|
(0.2
|
)
|
(0.8
|
)
|
(0.9
|
)
|
(1.2
|
)
|
(1.6
|
)
|
(1.4
|
)
|
(0.7
|
)
|
|||||||||||||||
|
Other operating credits and charges, net
|
0.4
|
|
(3.4
|
)
|
4.5
|
|
(2.0
|
)
|
6.3
|
|
0.9
|
|
(9.0
|
)
|
(0.4
|
)
|
|||||||||||||||
|
Gain (loss) on sale of and impairment of long-lived assets
|
0.6
|
|
(0.6
|
)
|
—
|
|
3.1
|
|
(0.3
|
)
|
(0.7
|
)
|
(11.1
|
)
|
(8.6
|
)
|
|||||||||||||||
|
General corporate and other expenses, net
|
(27.3
|
)
|
(27.8
|
)
|
(27.6
|
)
|
(26.8
|
)
|
(27.9
|
)
|
(29.5
|
)
|
(28.9
|
)
|
(24.0
|
)
|
|||||||||||||||
|
Non-operating income (expense)
|
(1.4
|
)
|
(1.9
|
)
|
(0.7
|
)
|
(3.1
|
)
|
(2.2
|
)
|
(2.2
|
)
|
0.4
|
|
(6.6
|
)
|
|||||||||||||||
|
Investment income
|
3.2
|
|
2.0
|
|
4.8
|
|
2.3
|
|
5.5
|
|
2.9
|
|
4.1
|
|
3.3
|
|
|||||||||||||||
|
Interest expense, net of capitalized interest
|
(4.4
|
)
|
(5.0
|
)
|
(4.4
|
)
|
(4.9
|
)
|
(3.9
|
)
|
(4.9
|
)
|
(3.1
|
)
|
(4.5
|
)
|
|||||||||||||||
|
Income from operations before taxes
|
124.6
|
|
70.5
|
|
214.1
|
|
130.5
|
|
165.9
|
|
157.3
|
|
16.5
|
|
151.9
|
|
|||||||||||||||
|
Provision (benefit) for income taxes
|
29.7
|
|
15.5
|
|
51.2
|
|
36.0
|
|
41.8
|
|
46.4
|
|
(0.4
|
)
|
21.2
|
|
|||||||||||||||
|
Income from continuing operations
|
$
|
94.9
|
|
$
|
55.0
|
|
$
|
162.9
|
|
$
|
94.5
|
|
$
|
124.1
|
|
$
|
110.9
|
|
$
|
16.9
|
|
$
|
130.7
|
|
|||||||
85
|
ADJUSTED EBITDA
|
|||||||||||||||||||||||||||||||
|
Siding
|
53.7
|
|
49.0
|
|
71.4
|
|
56.7
|
|
68.3
|
|
61.6
|
|
41.6
|
|
53.2
|
|
|||||||||||||||
|
OSB
|
$
|
112.5
|
|
$
|
75.7
|
|
$
|
171.1
|
|
$
|
118.1
|
|
$
|
130.5
|
|
$
|
142.2
|
|
$
|
40.6
|
|
$
|
153.8
|
|
|||||||
|
Engineered wood products
|
7.3
|
|
4.7
|
|
13.0
|
|
9.1
|
|
12.4
|
|
10.6
|
|
2.3
|
|
7.4
|
|
|||||||||||||||
|
South America
|
11.2
|
|
7.3
|
|
11.9
|
|
7.7
|
|
8.6
|
|
8.2
|
|
8.4
|
|
10.2
|
|
|||||||||||||||
|
Other
|
(0.4
|
)
|
0.7
|
|
(0.1
|
)
|
(0.4
|
)
|
(0.8
|
)
|
(0.9
|
)
|
(1.0
|
)
|
—
|
|
|||||||||||||||
|
Corporate
|
(24.9
|
)
|
(23.3
|
)
|
(25.3
|
)
|
(24.6
|
)
|
(25.6
|
)
|
(27.3
|
)
|
(26.9
|
)
|
(22.2
|
)
|
|||||||||||||||
|
Total Adjusted EBITDA
|
$
|
159.4
|
|
$
|
114.1
|
|
$
|
242.0
|
|
$
|
166.6
|
|
$
|
193.4
|
|
$
|
194.4
|
|
$
|
65.0
|
|
$
|
202.4
|
|
|||||||
Included in “Other operating credits and charges, net” and "Gain (loss) on sale of and impairment of long-lived assets" for continuing operations are the following:
During the fourth quarter of 2018, we recorded $5.6 million in severance and other charges related to certain reorganizations and a loss of $4.0 million related to property damage sustained by our Wilmington facility during Hurricane Florence. Additionally, we recorded a loss of $10.7 million related to the impairment on idled manufacturing facility.
During the third quarter of 2018, we recorded a gain of $7.7 million related to the reduction in product-related warranty reserves associated with CanExel products sold in specific geographic locations and for a specific time period based upon reductions in claims activities. Additionally, we recorded $0.9 million in severance and other charges related to certain reorganizations and a loss of $0.5 million related to property damage sustained by our Wilmington facility during Hurricane Florence.
During the second quarter of 2018, we recorded a gain of $8.3 million related to the settlement of previously-paid environmental costs or the liability for future environmental costs to be paid by a third party associated with a non-operating site. Additionally, we recorded $3.8 million in severance and other charges related to certain reorganizations within the corporate offices, including the costs associated with the retirement of our previous chief financial officer.
During the first quarter of 2018, we recorded a gain of $0.4 million related to a previously-settled claim associated with our hardboard siding.
During the third quarter of 2017, LP recorded a refund of $0.8 million related to sales and use taxes.
During the second quarter of 2017, LP recorded an expense of $2.0 million related to an increase in product related warranty reserves associated with CanExel products sold in specific geographic locations and for a specific time period.
During the first quarter of 2017, LP recorded an expense of $3.4 million related to an increase in product related warranty reserves associated with CanExel products sold in specific geographic locations and for a specific time period.
During the fourth quarter of 2016, LP recorded a loss of $
0.8 million
related to the impairment on certain manufacturing assets associated with various OSB mills; a gain of
$10.6 million
related to the exchange of an idled OSB mill; and a loss of $
1.4 million
related to the disposal of various assets no longer used.
During the second quarter of 2016, LP recorded an expense of
$4.8 million
related to an increase in product related warranty reserves and a related adjustment to value added taxes associated with CanExel products sold in specific geographic locations and for a specific time period.
See Notes 16 and 17 for further discussion on the other operating charges and credits, net and the losses on sale of
86
and impairment of long-lived assets mentioned above.
87
ITEM 9.
Changes in and Disagreements with Accountants on Accounting and Financial Disclosure
None
ITEM 9A.
Controls and Procedures
Evaluation of Disclosure Controls and Procedures
As of
December 31, 2018
, our Chief Executive Officer and Chief Financial Officer carried out, with the participation of the Company’s Disclosure Practices Committee and the Company’s management, an evaluation of the effectiveness of our disclosure controls and procedures, as defined in Rule 13a-15(e) under the Act. Based upon this evaluation, the Chief Executive Officer and Chief Financial Officer have concluded that, as of
December 31, 2018
, our disclosure controls are designed to provide reasonable assurance of achieving our objectives and that procedures are effective to provide reasonable assurance that material information required to be disclosed by us in reports we file under the Exchange Act is recorded, processed, summarized and reported within the time periods specified in the SEC rules and forms and that information required to be disclosed by us in the reports we file or submit under the Exchange Act is accumulated and communicated to our management, including our Chief Executive Officer and Chief Financial Officer, as appropriate to allow timely decisions regarding required disclosure.
Changes in Internal Control over Financial Reporting
There were no changes in our internal control over financial reporting that occurred during our most recently completed fiscal quarter that have materially affected, or are reasonably likely to materially affect, our internal control over financial reporting.
Management’s Report on Internal Control Over Financial Reporting
Our management is responsible for establishing and maintaining adequate internal control over financial reporting, as defined in Rule 13a-15(f) under the Exchange Act. Our management conducted an assessment of our internal control over financial reporting based on the framework established by the Committee of Sponsoring Organizations of the Treadway Commission in
Internal Control—Integrated Framework (2013).
Based on this assessment, our management has concluded that, as of December 31, 2018, the Company’s internal control over financial reporting is effective. Our independent registered public accounting firm, Deloitte & Touche LLP, has audited our consolidated financial statements and has issued an attestation report on the Company’s internal control over financial reporting, as stated in their report included herein.
The certifications of our Chief Executive Officer and Chief Financial Officer required under Section 302 of the Sarbanes-Oxley Act have been filed as Exhibits 31.1 and 31.2 to this report.
ITEM 9B.
Other Information
None.
88
REPORT OF INDEPENDENT REGISTERED PUBLIC ACCOUNTING FIRM
To the Board of Directors and Stockholders of Louisiana-Pacific Corporation
Opinion on Internal Control over Financial Reporting
We have audited the internal control over financial reporting of Louisiana-Pacific Corporation and subsidiaries (the “Company”) as of December 31, 2018, based on criteria established in
Internal Control-Integrated Framework (2013)
issued by the Committee of Sponsoring Organizations of the Treadway Commission (COSO). In our opinion, the Company maintained, in all material respects, effective internal control over financial reporting as of December 31, 2018, based on criteria established in
Internal Control-Integrated Framework (2013)
issued by COSO.
We have also audited, in accordance with the standards of the Public Company Accounting Oversight Board (United States) (PCAOB), the consolidated financial statements as of and for the year ended December 31, 2018, of the Company and our report dated February 14, 2019, expressed an unqualified opinion on those financial statements.
Basis for Opinion
The Company’s management is responsible for maintaining effective internal control over financial reporting and for its assessment of the effectiveness of internal control over financial reporting, included in the accompanying
Management’s Report on Internal Control over Financial Reporting
. Our responsibility is to express an opinion on the Company’s internal control over financial reporting based on our audit. We are a public accounting firm registered with the PCAOB and are required to be independent with respect to the Company in accordance with the U.S. federal securities laws and the applicable rules and regulations of the Securities and Exchange Commission and the PCAOB.
We conducted our audit in accordance with the standards of the PCAOB. Those standards require that we plan and perform the audit to obtain reasonable assurance about whether effective internal control over financial reporting was maintained in all material respects. Our audit included obtaining an understanding of internal control over financial reporting, assessing the risk that a material weakness exists, testing and evaluating the design and operating effectiveness of internal control based on the assessed risk, and performing such other procedures as we considered necessary in the circumstances. We believe that our audit provides a reasonable basis for our opinion.
Definition and Limitations of Internal Control over Financial Reporting
A company’s internal control over financial reporting is a process designed to provide reasonable assurance regarding the reliability of financial reporting and the preparation of financial statements for external purposes in accordance with generally accepted accounting principles. A company’s internal control over financial reporting includes those policies and procedures that (1) pertain to the maintenance of records that, in reasonable detail, accurately and fairly reflect the transactions and dispositions of the assets of the company; (2) provide reasonable assurance that transactions are recorded as necessary to permit preparation of financial statements in accordance with generally accepted accounting principles, and that receipts and expenditures of the company are being made only in accordance with authorizations of management and directors of the company; and (3) provide reasonable assurance regarding prevention or timely detection of unauthorized acquisition, use, or disposition of the company’s assets that could have a material effect on the financial statements.
Because of its inherent limitations, internal control over financial reporting may not prevent or detect misstatements. Also, projections of any evaluation of effectiveness to future periods are subject to the risk that controls may become inadequate because of changes in conditions, or that the degree of compliance with the policies or procedures may deteriorate.
89
/s/ DELOITTE & TOUCHE LLP
Nashville, Tennessee
February 14, 2019
90
PART III
ITEM 10.
Directors and Executive Officers of the Registrant
Information regarding our directors is incorporated herein by reference to the material included under the caption “Item 1—Election of Directors” in the definitive proxy statement to be filed by LP for its 2019 annual meeting of stockholders (the “2019 Proxy Statement”). Information regarding compliance with Section 16(a) of the Securities Exchange Act of 1934 is incorporated herein by reference to the material included under the caption “Section 16(a) Beneficial Ownership Reporting Compliance” in the 2019 Proxy Statement. Information regarding our audit committee is incorporated herein by reference to the material included under the captions “Board and Committee Meetings,” “Finance and Audit Committee” and “Audit Committee Financial Experts” in the 2019 Proxy Statement.
Information regarding each of our executive officers as of
February 14, 2019
, including employment history for the past five years, is set forth below:
|
Name
|
Age
|
Title
|
|
|
W. Bradley Southern
|
59
|
Chief Executive Officer
|
|
|
Alan J.M. Haughie
|
55
|
Executive Vice President, CFO
|
|
|
Timothy Mann, Jr.
|
53
|
Executive Vice President, General Counsel and Secretary
|
|
|
Jason Ringblom
|
36
|
Executive Vice President, OSB
|
|
|
Neil Sherman
|
56
|
Executive Vice President, Siding
|
|
|
Michael Sims
|
61
|
Senior Vice President, Sales and Marketing
|
|
W. Bradley Southern
has been Chief Executive Officer since July 2017 and previously Executive Vice President, Chief Operating Officer since November 2016, Executive Vice President of OSB since March 2015, Senior Vice President of Siding since May 2012 and Vice President of Specialty Operations since 2004.
Alan J.M. Haughie
has been Executive Vice President, CFO since January 2019. From 2013 to 2017, he was Senior Vice President and Chief Financial Officer of ServiceMaster Global Holdings Inc. From 2010 until 2013, Mr. Haughie served as Senior Vice President and Chief Financial Officer of Federal-Mogul Corporation.
Timothy Mann, Jr.
has been Executive Vice President, General Counsel and Secretary since March 2018. From 2012 to 2017, he held various roles at Axiall Corporation including President and Chief Executive Officer and Executive Vice President, General Counsel and Corporate Secretary.
Jason Ringblom
has been Executive Vice President, OSB since January 2017 and previously Vice President of OSB sales and marketing since February 2015 and held various other sales positions at LP since 2004.
Neil Sherman
has been Executive Vice President, Siding since January 2017 and previously Senior Vice President, EWP since March 2015 and Vice President of Supply Management since 2006.
Michael Sims
has been Senior Vice President, Sales, Marketing and Strategy since April 2015 and previously Vice President of OSB sales since January 2014 and Vice President of Specialty Sales since 2004.
In January 2018, the Board revised the Code of Business Conduct and Ethics applicable to our principal executive officer, principal financial officer and principal accounting officer. The Code of Ethics is disclosed at our website at www.lpcorp.com.
In January 2005, the Board adopted revised charters for the Nominating Committee and the Compensation Committee and also adopted a Code of Business Conduct and Ethics and Corporate Governance Guidelines, each of which is disclosed at our website at www.lpcorp.com.
ITEM 11.
Executive Compensation
Information regarding executive compensation is incorporated herein by reference to the material under the captions
91
“Compensation of Executive Officers,” and “Directors’ Compensation,” in the 2019 Proxy Statement.
ITEM 12.
Security Ownership of Certain Beneficial Owners and Management and Related Stockholder Matters
Information regarding security ownership of certain beneficial owners and management and our existing equity compensation plans and arrangements is incorporated herein by reference to the material under the captions “Holders of Common Stock” and “Equity Compensation Plan Information” in the 2019 Proxy Statement.
ITEM 13.
Certain Relationships and Related Transactions, and Director Independence
There are no transactions of the type required to be disclosed by Item 404(a) of Regulation S-K.
Information regarding transactions with related persons and director independence is incorporated herein by reference to the material under the captions “Nominees,” “Continuing Directors,” “Principles of Corporate Governance,” “Audit Committee Financial Experts” and “Related Person Transactions” in the 2019 Proxy Statement.
ITEM 14.
Principal Accountant Fees and Services
Information regarding fees and services provided by our principal accountant and the LP Audit Committee’s pre-approval policies and procedures relating thereto is incorporated herein by reference to the material under the caption “Pre-Approval of Audit and Permissible Non-Audit Services of Independent Auditor” in the 2019 Proxy Statement. The charter for the Audit Committee is disclosed at our website at www.lpcorp.com.
92
PART IV
ITEM 15.
Exhibits and Financial Statement Schedules
A. Financial Statements and Financial Statement Schedules
The following financial statements of LP are included in this report:
Consolidated Balance Sheets—
December 31, 2018
, and
2017
.
Consolidated Statements of Income—years ended
December 31, 2018
,
2017
, and
2016
.
Consolidated Statements of Comprehensive Income—years ended
December 31, 2018
,
2017
and
2016
.
Consolidated Statements of Cash Flows—years ended
December 31, 2018
,
2017
,
2016
.
Consolidated Statements of Stockholders’ Equity—years ended
December 31, 2018
,
2017
and
2016
.
Notes to the Financial Statements.
Report of Independent Registered Public Accounting Firm.
Interim Financial Results (unaudited).
No other financial statement schedules are required to be filed.
B. Exhibits
The exhibits filed as part of this report or incorporated by reference herein are listed below. Each management contract or compensatory plan or arrangement is identified by an asterisk (*).
Each prior LP filing which contains an exhibit incorporated by reference herein is filed under SEC File No. 001-07107.
Exhibit
Number
Exhibit
|
3.1
|
|
Restated Certificate of Incorporation of LP. Incorporated herein by reference to Exhibit 3.1 to LP’s Annual Report on Form 10-K for the year ended December 31, 2007.
|
|
3.1 (a)
|
|
Amended Certificate of Designation of Series A Junior Participating Cumulative Preferred Stock. Incorporated herein by reference to Exhibit 3.3 to LP’s Quarterly Report on Form 10-Q for the quarter ended June 30, 2009.
|
|
3.2
|
|
Bylaws of LP. Incorporated herein by reference to Exhibit 3.1 to LP’s Current Report on Form 8-K, filed on August 4, 2015.
|
|
4.2
|
Indenture, dated as of September 14, 2016, between LP and The Bank of New York Mellon Trust Company, N.A., as trustee, including form of 4.875% Senior Note due 2024. Incorporated herein by reference to Exhibit 4.1 to LP's Current Report on Form 8-K, filed on September 14, 2016.
|
|
|
4.3
|
Note Purchase Agreement, dated June 30, 1998, among LP, L-P SPV2, LLC and the purchasers named therein. Incorporated herein by reference to Exhibit 4 to LP's Quarterly Report on Form 10-Q for the quarter ended June 30, 1998.
|
|
|
10.1(a)
|
|
Credit Agreement, dated as of December 6, 2013, among LP, as borrower, certain subsidiaries of LP from time to time party thereto, the lenders party thereto, American AgCredit, FLCA, as administrative agent for the lenders, and CoBank, ACB, as letter of credit issuer. Incorporated herein by reference to Exhibit 10.1 to LP’s Current Report on Form 8-K, filed on December 12, 2013.
|
93
|
10.1(b)
|
|
Letter Agreement re: Louisiana-Pacific Credit Agreement; Resignation of American AgCredit, FLCA (“FLCA”), as Administrative Agent, and appointment of its Affiliate, American AgCredit, PCA (“PCA”), as new Administrative Agent, dated as of December 6, 2013, among PCA, FLCA, the lenders party to the Credit Agreement and LP.
|
|
10.1(c)
|
|
Joinder Agreement, dated as of December 31, 2013, between LPS Corporation and American AgCredit, PCA, in its capacity as administrative agent under the credit agreement.
|
|
10.1(d)
|
First Amendment to Credit Agreement, dated as of February 25, 2014, among LP, as borrower, certain subsidiaries of LP from time to time party thereto, the lenders party thereto, American AgCredit, PCA, as administrative agent for the lenders (as assignee of American AgCredit, FLCA), and CoBank, ACB, as letter of credit issuer. Incorporated herein by reference to Exhibit 10.1 to LP’s Current Report on Form 8-K, filed on February 27, 2014.
|
|
|
10.1(e)
|
Second Amendment to Credit Agreement, dated as of July 25, 2014, among LP, as borrower, certain subsidiaries of LP from time to time party thereto and the lenders party thereto and American AgCredit, PCA, as administrative agent for the lenders (as assignee of American AgCredit, FLCA). Incorporated herein by reference to Exhibit 10.1 to LP’s Current Report on Form 8-K, filed on July 28, 2014.
|
|
|
10.1(f)
|
|
Third Amendment to Credit Agreement, dated as of December 6, 2017, among LP, as borrower, the lenders party thereto and American AgCredit, PCA, as administrative agent for the lenders (as assignee of American AgCredit, FLCA). Incorporated herein by reference to Exhibit 10.1 to LP’s Current Report on Form 8-K, filed on December 11, 2017.
|
|
10.2
|
|
Security Agreement, dated as of December 6, 2013, among LP, certain subsidiaries of LP from time to time party thereto and American AgCredit, PCA, as administrative agent under the Credit Agreement (as assignee of American AgCredit, FLCA). Incorporated herein by reference to Exhibit 10.2 to LP’s Current Report on Form 8-K, filed on December 12, 2013.
|
|
10.4
|
|
1992 Non-Employee Director Stock Option Plan (Amended and Restated as of May 8, 2009). Incorporated herein by reference to Exhibit 10.10 to LP’s Quarterly Report on Form 10-Q for the quarter ended June 30, 2009. *
|
|
10.5
|
|
2000 Non-Employee Director Restricted Stock Plan Effective May 1, 2000 (Amended and Restated as of May 8, 2009). Incorporated herein by reference to Exhibit 10.15 to LP’s Quarterly Report on Form 10-Q for the quarter ended June 30, 2009. *
|
|
10.6
|
|
Amended and Restated 1997 Incentive Stock Award Plan. Incorporated herein by reference to Appendix A to LP’s Definitive Proxy Statement on Schedule 14A, filed on March 23, 2009. *
|
|
10.6(a)
|
|
Form of Award Agreement under the 1997 Incentive Stock Award Plan for Non-Qualified Stock Options. Incorporated herein by reference to Exhibit 10.1 to LP’s Current Report on Form 8-K, filed on February 9, 2005. *
|
|
10.6(b)
|
|
Form of Award Agreement under the 1997 Incentive Stock Award Plan for Incentive Shares (Restricted Stock Units). Incorporated herein by reference to Exhibit 10.3 to LP's Current Report on Form 8-K, filed on February 9, 2005. *
|
|
10.6(c)
|
|
Form of Award Agreement under the 1997 Incentive Stock Award Plan for Restricted Stock. Incorporated herein by reference to Exhibit 10.11(c) to LP’s Annual Report on Form 10-K for the year ended December 31, 2007.*
|
|
10.6(d)
|
|
Form of Award Agreement under the 1997 Incentive Stock Award Plan for Stock Settled Stock Appreciation Rights. Incorporated herein by reference to Exhibit 10.11(d) to LP’s Annual Report on Form 10-K for the year ended December 31, 2007.*
|
94
|
10.7
|
|
Annual Cash Incentive Award Plan, Amended and Restated as of February 12, 2009. Incorporated herein by reference to Appendix B to LP’s Definitive Proxy Statement on Schedule 14A, filed on March 23, 2009. *
|
|
10.8
|
|
Change of Control Employment Agreement between LP and Sallie B. Bailey. Incorporated herein by reference to Exhibit 10.2 to LP's Current Report on Form 8-K, filed on February 7, 2012. *
|
|
10.9
|
2004 Executive Deferred Compensation Plan, Amended and Restated, Effective January 1, 2009. Incorporated herein by reference to Exhibit 10.13 to LP's Quarterly Report on Form 10-Q for the quarter ended June 30, 2011. *
|
|
|
10.10
|
2008 Supplemental Executive Retirement Plan, Amended and Restated, Effective January 1, 2008. Incorporated herein by reference to Exhibit 10.14 to LP's Quarterly Report on Form 10-Q for the quarter ended June 30, 2011. *
|
|
|
10.11
|
|
2011 Non-Employee Director Phantom Share Plan, Effective May 15, 2011. Incorporated herein by reference to Exhibit 10.15 to LP's Quarterly Report on Form 10-Q for the quarter ended June 30, 2011.
|
|
10.12
|
2013 Omnibus Stock Award Plan, Effective May 3, 2013. Incorporated herein by reference to Annex A to LP’s Definitive Proxy Statement on Schedule 14A, filed on March 20, 2013. *
|
|
|
10.13
|
Form of Stock Appreciation Rights Award Agreement under the 2013 Omnibus Stock Award Plan. Incorporated by reference to Exhibit 10.19 to LP's Annual Report on Form 10-K for the year ended December 31, 2015.*
|
|
|
10.14
|
Form of Restricted Stock Award Agreement under the 2013 Omnibus Stock Award Plan. Incorporated by reference to Exhibit 10.20 to LP's Annual Report on Form 10-K for the year ended December 31, 2015.*
|
|
|
10.15
|
Form of Restricted Stock Unit Award Agreement under the 2013 Omnibus Stock Award Plan. Incorporated by reference to Exhibit 10.21 to LP's Annual Report on Form 10-K for the year ended December 31, 2015.*
|
|
|
10.16
|
Form of Restricted Stock Unit Award Agreement with certain retirement provisions under the 2013 Omnibus Stock Award Plan. Incorporated herein by reference to Exhibit 10.22 to LP's Annual Report on Form 10-K for the year ended December 31, 2016. *
|
|
|
10.17
|
Form of Performance Shares Award Agreement under the 2013 Omnibus Stock Award Plan. Incorporated herein by reference to Exhibit 10.23 to LP's Annual Report on Form 10-K for the year ended December 31, 2016. *
|
|
|
10.18
|
Form of Performance Shares Award Agreement with certain retirement provisions under the 2013 Omnibus Stock Award Plan. Incorporated herein by reference to Exhibit 10.24 to LP's Annual Report on Form 10-K for the year ended December 31, 2016. *
|
|
|
10.19
|
Form of Stock Appreciation Rights Award Agreement with certain retirement provisions under the 2013 Omnibus Stock Award Plan. Incorporated herein by reference to Exhibit 10.25 to LP's Annual Report on Form 10-K for the year ended December 31, 2016.
|
|
|
10.20
|
Form of Restricted Stock Unit Award Agreement for directors under the 2013 Omnibus Stock Award Plan. Incorporated herein by reference to Exhibit 10.29 to LP's Quarterly Report on Form 10-Q for the quarter ended March 31, 2017.*
|
|
|
10.21
|
Separation Agreement with Mr. Brian Luoma. Incorporated herein by reference to Exhibit 10.26 to LP's Annual Report on Form 10-K for the year ended December 31, 2016*
|
|
|
10.22
|
Form of Change of Control Employment Agreement. Incorporated herein by reference to Exhibit 10.26 to LP’s Current Report on Form 8-K, filed on March 4, 2015.
|
|
95
|
10.23
|
Form of Note Prepayment Agreement among LP, LP Pinewood SPV, LLC and Wells Fargo Bank National Association. Incorporated herein by reference to Exhibit 10.1 to LP's Current Report on Form 8-K, filed on August 26, 2016.
|
|
|
10.24
|
Form of Restricted Stock Unit Award Agreement under the 2013 Omnibus Stock Award Plan with certain prorated vesting. Incorporated herein by reference to Exhibit 10.24 to LP's Annual Report on Form 10-K for the year ended December 31, 2017. *
|
|
|
10.25
|
Form of Performance Stock Unit Award Agreement under the 2013 Omnibus Stock Award Plan with certain prorated vesting. Incorporated herein by reference to Exhibit 10.25 to LP's Annual Report on Form 10-K for the year ended December 31, 2017.*
|
|
|
10.26
|
Amendment No 1 to Louisiana-Pacific Corporation 2013 Omnibus Stock Award Plan. Incorporated herein by reference to Exhibit 10.26 to LP's Annual Report on Form 10-K for the year ended December 31, 2017.*
|
|
|
10.27
|
Non-Employee Directors Compensation Plan. Incorporated herein by reference to Exhibit 10.1 to LP's Quarterly Report filed on on Form 10-Q for the quarter ended September 30, 2018.
|
|
|
10.28
|
Form of Restricted Stock Unit Award agreement for directors under the 2013 Omnibus Stock Award Plan. Incorporated herein by reference to Exhibit 10.2 to LP's Quarterly Report filed on on Form 10-Q for the quarter ended September 30, 2018.
|
|
|
10.29
|
Retirement Agreement with Ms. Sallie B. Bailey. Incorporated herein by reference to Exhibit 10.2 to LP's Quarterly Report filed on on Form 10-Q for the quarter ended June 30, 2018. *
|
|
|
10.30
|
||
|
21
|
|
List of LP’s subsidiaries.
|
|
23
|
|
|
|
31.1
|
|
|
|
31.2
|
|
|
|
32
|
|
|
ITEM 16.
Form 10-K Summary
None.
96
SIGNATURES
Pursuant to the requirements of Section 13 or 15(d) of the Securities Exchange Act of 1934, Louisiana-Pacific Corporation, a Delaware corporation (the “registrant”), has duly caused this report to be signed on its behalf by the undersigned, thereunto duly authorized.
|
Date:
|
February 14, 2019
|
LOUISIANA-PACIFIC CORPORATION
(Registrant)
|
|
/s/ ALAN J.M. HAUGHIE
|
||
|
Alan J.M. Haughie
Executive Vice President and
Chief Financial Officer
|
||
Pursuant to the requirements of the Securities Exchange Act of 1934, this report has been signed below by the following persons on behalf of the registrant and in the capacities and on the dates indicated.
97
|
Date
|
|
Signature and Title
|
|
February 14, 2019
|
/s/ W. BRADLEY SOUTHERN
|
|
|
W. Bradley Southern
Chief Executive Officer, Director
(Principal Executive Officer)
|
||
|
February 14, 2019
|
/s/ ALAN J.M. HAUGHIE
|
|
|
Alan J.M. Haughie
Executive Vice President and Chief Financial Officer
(Principal Financial Officer)
|
||
|
February 14, 2019
|
/s/ REBECCA A. BARCKLEY
|
|
|
Rebecca A. Barckley
Controller, Financial Reporting
(Principal Accounting Officer)
|
||
|
February 14, 2019
|
/s/ E. GARY COOK
|
|
|
E. Gary Cook
Chairman of the Board
|
||
|
February 14, 2019
|
/s/ TRACY EMBREE
|
|
|
Tracy Embree
Director
|
||
|
February 14, 2019
|
/s/ LIZANNE C. GOTTUNG
|
|
|
Lizanne C. Gottung
Director
|
||
|
February 14, 2019
|
/s/ STEPHEN E. MACADAM
|
|
|
Stephen E. Macadam
Director
|
||
|
February 14, 2019
|
/s/ OZEY K. HORTON, Jr.
|
|
|
Ozey K. Horton
Director
|
||
|
February 14, 2019
|
/s/ DUSTAN E. MCCOY
|
|
|
Dustan E. McCoy
Director
|
||
|
February 14, 2019
|
/s/ KURT M. LANDGRAF
|
|
|
Kurt M. Landgraf
Director
|
||
98
TABLE OF CONTENTS
Part IItem 1. BusinessItem 1A. Risk FactorsItem 1B. Unresolved Staff CommentsItem 2. PropertiesItem 3. Legal ProceedingsItem 4. Mine Safety DisclosuresPart IIItem 5. Market For Registrant S Common Equity, Related Stockholder Matters and Issuer Purchases Of Equity SecuritiesItem 6. Selected Financial DataItem 7. Management S Discussion and Analysis Of Financial Condition and Results Of OperationsItem 7A. Quantitative and Qualitative Disclosures About Market RiskItem 8. Financial Statements and Supplementary DataItem 9. Changes in and Disagreements with Accountants on Accounting and Financial DisclosureItem 9A. Controls and ProceduresItem 9B. Other InformationPart IIIItem 10. Directors and Executive Officers Of The RegistrantItem 11. Executive CompensationItem 12. Security Ownership Of Certain Beneficial Owners and Management and Related Stockholder MattersItem 13. Certain Relationships and Related Transactions, and Director IndependenceItem 14. Principal Accountant Fees and ServicesPart IVItem 15. Exhibits and Financial Statement SchedulesItem 16. Form 10-k Summary