LATTICE SEMICONDUCTOR CORP
10-Ks and 10-Qs
|
|
|
|
|
|
|
|
|
|
|
|
|
|
|
|
|
|
|
|
|
|
|
|
|
|
|
|
|
|
|
|
|
|
|
|
|
|
|
|
|
|
|
|
|
|
|
|
|
|
|
|
|
|
|
|
|
UNITED STATES SECURITIES AND EXCHANGE COMMISSION
|
||||
|
Washington, D.C. 20549
|
||||
|
FORM 10-K
|
||||
|
(Mark One)
|
||||
|
[X]
|
ANNUAL REPORT PURSUANT TO SECTION 13 OR 15(d) OF THE SECURITIES EXCHANGE ACT OF 1934 FOR THE FISCAL YEAR ENDED JANUARY 3, 2015
|
|||
|
or
|
||||
|
o
|
TRANSITION REPORT PURSUANT TO SECTION 13 OR 15(d) OF THE SECURITIES EXCHANGE ACT OF 1934
|
|||
|
FOR THE TRANSITION PERIOD FROM __________ TO __________
|
||||
Commission file number: 000-18032

LATTICE SEMICONDUCTOR CORPORATION
(Exact name of registrant as specified in its charter)
|
Delaware
|
93-0835214
|
|
(State of Incorporation)
|
(I.R.S. Employer Identification Number)
|
|
5555 NE Moore Court, Hillsboro, Oregon
|
97124-6421
|
|
(Address of principal executive offices)
|
(Zip Code)
|
Registrant's telephone number, including area code: (
503
)
268-8000
________________________________________
Securities registered pursuant to Section 12(b) of the Act:
________________________________________
|
(Title of Class)
|
(Name of each exchange on which registered)
|
|
Common Stock, $.01 par value
|
NASDAQ Global Select Market
|
Securities registered pursuant to Section 12(g) of the Act: None
Indicate by check mark if the registrant is a well-known seasoned issuer, as defined in Rule 405 of the Securities Act. Yes o No [X]
Indicate by check mark if the registrant is not required to file reports pursuant to Section 13 or Section 15(d) of the Act. Yes o No [X]
Indicate by check mark whether the registrant (1) has filed all reports required to be filed by Section 13 or 15(d) of the Securities Exchange Act of 1934 during the preceding 12 months (or for such shorter period that the registrant was required to file such reports), and (2) has been subject to such filing requirements for the past 90 days. Yes [X] No o
Indicate by check mark whether the registrant has submitted electronically and posted on its corporate Web site, if any, every Interactive Data File required to be submitted and posted pursuant to Rule 405 of Regulation S-T (§232.405 of this chapter) during the preceding 12 months (or for such shorter period that the registrant was required to submit and post such files). Yes [X] No o
Indicate by check mark if disclosure of delinquent filers pursuant to Item 405 of Regulation S-K (§229.405 of this chapter) is not contained herein, and will not be contained, to the best of the registrant's knowledge, in definitive proxy or information statements incorporated by reference in Part III of this Form 10-K or any amendment to this Form 10-K. [X]
Indicate by check mark whether the registrant is a large accelerated filer, an accelerated filer, a non-accelerated filer, or a smaller reporting company. See the definitions of “large accelerated filer”, “accelerated filer”, and “smaller reporting company” in Rule 12b-2 of the Exchange Act. (Check one):
|
Large accelerated filer [X]
|
Accelerated filer o
|
|
Non-accelerated filer o
|
Smaller reporting company o
|
|
Indicate by check mark whether the registrant is a shell company (as defined in Rule 12b-2 of the Act). Yes o No [X]
|
||
|
Aggregate market value of voting stock held by non-affiliates of the registrant as of June 27, 2014
|
760,876,091
|
|
|
Number of shares of common stock outstanding as of February 26, 2015
|
116,645,921
|
|
DOCUMENTS INCORPORATED BY REFERENCE
The information required by Part III of this Report, to the extent not set forth herein, is incorporated herein by reference from the registrant's definitive proxy statement relating to the 2015 Annual Meeting of Stockholders, which definitive proxy statement shall be filed with the Securities and Exchange Commission within 120 days after the end of the fiscal year to which this Report relates.
LATTICE SEMICONDUCTOR CORPORATION
ANNUAL REPORT ON FORM 10-K
TABLE OF CONTENTS
|
Page
|
|||
|
PART I
|
|||
|
Item 1.
|
Business
|
||
|
Item 1A.
|
Risk Factors
|
||
|
Item 1B.
|
Unresolved Staff Comments
|
||
|
Item 2.
|
Properties
|
||
|
Item 3.
|
Legal Proceedings
|
||
|
Item 4.
|
Mine Safety Disclosures
|
||
|
PART II
|
|||
|
Item 5.
|
Market for Registrant's Common Equity, Related Stockholder Matters & Issuer
Purchases of Equity Securities |
||
|
Item 6.
|
Selected Financial Data
|
||
|
Item 7.
|
Management's Discussion and Analysis of Financial Condition and Results of Operations
|
||
|
Item 7A.
|
Quantitative and Qualitative Disclosures About Market Risk
|
||
|
Item 8.
|
Financial Statements and Supplementary Data
|
||
|
Item 9.
|
Changes in and Disagreements with Accountants On Accounting and Financial Disclosure
|
||
|
Item 9A.
|
Controls and Procedures
|
||
|
Item 9B.
|
Other Information
|
||
|
PART III
|
|||
|
Item 10.
|
Directors, Executive Officers and Corporate Governance
|
||
|
Item 11.
|
Executive Compensation
|
||
|
Item 12.
|
Security Ownership of Certain Beneficial Owners and Management and Related
Stockholder Matters |
||
|
Item 13.
|
Certain Relationships and Related Transactions, and Director Independence
|
||
|
Item 14.
|
Principal Accountant Fees and Services
|
||
|
PART IV
|
|||
|
Item 15.
|
Exhibits
|
||
|
Signatures
|
|||
2
Forward-Looking Statements
This Annual Report on Form 10-K contains forward-looking statements that involve estimates, assumptions, risks and uncertainties. Any statements about expectations, beliefs, plans, objectives, assumptions or future events or performance are not historical facts and may be forward-looking. Words or phrases such as “anticipates,” “believes,” “could,” “estimates,” “expects,” “intends,” “plans,” “predicts,” “projects,” “may,” “will,” “should,” “continue,” “ongoing,” “future,” “potential” and similar words or phrases identify forward-looking statements. Examples of forward-looking statements include, but are not limited to, statements about: our strategies and beliefs regarding the markets we serve or may serve; growth opportunities and growth in markets we may serve; acceptance of programmable logic devices and displacement of other general purpose logic solutions; our plans to introduce new FPGA families in high-growth market niches where we believe that we have sustainable and differentiated positions; the costs of making and developing various general purpose logic products; our intention to continually introduce new products and enhancements and reduce manufacturing costs; a significant portion of our revenue being through our sell-through distributors; the impact of our global tax structure and expectations regarding taxes and tax adjustments; our expectations that a significant portion of our revenue will continue to be dependent on the Consumer, Communications, and Industrial end markets; the Asia Pacific market being the primary source of our revenue; the impact of new accounting pronouncements; our expectations regarding customer preferences and product use; our future product development and marketing plans; our ability to maintain or develop successful foundry relationships to produce new products; our expectations regarding seasonal trends; our expectations regarding defenses to claims against our intellectual property; our making significant future investments in research and development; our beliefs concerning the adequacy of our liquidity and facilities, our ability to meet our operating and capital requirements and obligations; and the expected date of closing of our proposed acquisition of Silicon Image, Inc. and the potential benefits of the merger.
Forward-looking statements involve estimates, assumptions, risks and uncertainties that could cause actual results to differ materially from those expressed in the forward-looking statements. The following factors, among others, could cause actual results to differ materially from the forward-looking statements: global economic conditions and uncertainty, the concentration of our sales in the Consumer and Communications end markets, particularly as it relates to the concentration of our sales in the Asia Pacific region, market acceptance and demand for our new products, any disruption of our distribution channels, unexpected charges, delays or results relating to our restructuring plans, the effect of the downturn in the economy on capital markets and credit markets, the impact of competitive products and pricing, unanticipated taxation requirements, or positions of the U.S. Internal Revenue Service, unexpected impacts of recent accounting guidance, the risk that the merger transaction will not close when expected or at all or on terms that differ from those contemplated; the risk that the operations of the two companies will not be integrated successfully; the failure to achieve the anticipated benefits and synergies of the transaction; the risk that our or Silicon Image’s business will be adversely impacted during the pendency of the transaction; costs associated with the transaction; matters arising in connection with the parties’ efforts to comply with and satisfy applicable regulatory approvals and closing conditions relating to the transaction; and other events that could adversely impact the completion of the transaction, including industry or economic conditions outside of the control of us and Silicon Image. In addition, actual results are subject to other risks and uncertainties that relate more broadly to our and Silicon Image’s overall business, including those more fully described in our filings with the SEC, including but not limited to the items discussed in “Risk Factors” in Item 1A of Part I of this Annual Report on Form 10-K, and those more fully described in Silicon Image’s filings with the SEC including its annual report on Form 10-K for the fiscal year ended December 31, 2013, and its quarterly reports filed on Form 10-Q for the 2014 fiscal year.
You should not unduly rely on forward-looking statements because actual results could differ materially from those expressed in any forward-looking statements. In addition, any forward-looking statement applies only as of the date on which it is made. We do not plan to, and undertake no obligation to, update any forward-looking statements to reflect events or circumstances that occur after the date on which such statements are made or to reflect the occurrence of unanticipated events.
3
General
Lattice Semiconductor Corporation (“Lattice,” the “Company,” “we,” “us,” or “our”) designs, develops and markets programmable logic products, end market solutions and related software. We also provide design services, customer training, field engineering and technical support.
Lattice was incorporated in Oregon in 1983 and reincorporated in Delaware in 1985. Our headquarters facility is located at 5555 N.E. Moore Court, Hillsboro, Oregon 97124, and our website is www.latticesemi.com. Information contained or referenced on our website is not incorporated by reference into, and does not form a part of, this Annual Report on Form 10-K. Our common stock trades on the NASDAQ Global Select Market under the symbol LSCC.
We report based on a 52 or 53-week fiscal year ending on the Saturday closest to December 31. Our fiscal 2014 was a 53-week year, with a 14-week fourth quarter, that ended
January 3, 2015
. Our fiscal 2013, 2012, 2011, and 2010 were 52-week years that ended
December 28, 2013
,
December 29, 2012
, December 31, 2011, and January 1, 2011, respectively. Our fiscal
2015
will be a 52-week year and will end on
January 2, 2016
. All references to quarterly or yearly financial results are references to the results for the relevant fiscal period.
Logic Market Background
Three types of digital integrated circuits are used in most electronic systems: microprocessors, memory and logic.
|
•
|
Microprocessors
are used for control and computing tasks.
|
|
•
|
Memory
is used to store programming instructions and data.
|
|
•
|
Logic
is employed to manage the interchange and manipulation of digital signals within a system.
|
Logic circuits are found in a wide range of digital electronic equipment, including: communications, computing, consumer, industrial, scientific, medical, automotive, and military applications.
The general-purpose logic market for semiconductor solutions can be generally subdivided into two primary categories, fixed and programmable.
Fixed logic solutions are generally defined as either Application-Specific Integrated Circuits or Application-Specific Standard Products.
|
•
|
Application-specific integrated circuits
(“ASICs”) are custom devices for a single function, which generally entail significant design risks, non-recurring expenses and longer development cycles. ASICs have historically been perceived as having advantages of lower unit costs, higher performance and lower power when compared to other programmable logic solutions.
|
|
•
|
Application-specific standard products
(“ASSPs”) are standardized logic devices marketed to multiple manufacturers, with limited flexibility to customize an end system. ASSPs have historically been perceived as having similar advantages as ASICs (ie: cost, performance and power) relative to programmable logic solutions with the additional benefit of being readily available as an off-the-shelf standard product, thereby avoiding some of the risk and non-recurring engineering associated with ASICs.
|
Programmable logic solutions, including those offered by Lattice, are commonly referred to as Programmable Logic Devices ("PLDs") and are generally defined as standard semiconductor products, often purchased by systems manufacturers in a “blank” state, which can be quickly custom-configured using software into a virtually unlimited number of specific logic functions.
Based on industry sources, we believe that the programmable logic market was approximately $5.0 billion in 2014 (Wall Street Research, December 2013).
4
We believe PLDs possess key competitive advantages over ASICs and ASSPs which make them more aptly suited for certain types of applications, including:
|
•
|
Faster time to market and increased design flexibility. These advantages are enabled by development software allowing users to implement and revise their designs quickly. ASICs and ASSPs, on the other hand, require significant development time and offer limited, if any, flexibility to make design changes.
|
|
•
|
PLDs are standard components, meaning that the same device can be sold to many different users for a variety of applications, while ASICs and ASSPs are customized for an individual use or specific application.
|
Programmable Logic Device Architectures
There are two main subcategories of PLDs, each represents a distinctly different silicon architectural approaches which are typically suited for use in different logic applications.
|
•
|
Field programmable gate arrays (“FPGAs”) are traditionally characterized by a narrow-input logic cell and use a distributed interconnect scheme. FPGAs may also contain dedicated blocks of fixed circuits such as memory, high-speed input/output interfaces or processors and are well-suited for 'data-path' applications.
|
|
•
|
Complex programmable logic devices (“CPLDs”) are traditionally characterized by a regular building block structure of wide-input logic cells, called macrocells, and use a centralized logic interconnect scheme and are generally perceived as being well-suited for 'control-oriented' applications.
|
We believe that a substantial portion of general purpose programmable logic customers have needs for, and can utilize, both the FPGA and CPLD architectures. We offer solutions utilizing both of these silicon architectures to serve multiple markets in a wide variety of applications. We also offer another increasingly popular programmable logic device type known as Mixed Signal. A Mixed Signal device combines either an FPGA or CPLD architecture programmable digital logic component with an analog circuitry component to create a single product. Throughout this Annual Report we generally use the term FPGA when referring to all of our FPGA, CPLD and Mixed Signal devices.
5
End Markets for Our PLDs
An overview of the end market applications for our products is shown in the following table:
|
End Markets
|
Sub-Market
|
Applications
|
Tethered
|
Mobile
|
|
Communications
|
Wireless
|
Base Station and Remote Radio Unit
|
X
|
|
|
Wireless Backhaul
|
X
|
|||
|
Heterogeneous Networks
|
X
|
|||
|
Wireline
|
Routers and Switches
|
X
|
||
|
Data Centers
|
X
|
|||
|
Carrier Class Wifi
|
X
|
|||
|
Wired Access Aggregation
|
X
|
|||
|
Consumer
|
Smartphones
|
X
|
||
|
Wearables
|
X
|
|||
|
Tablets & E-Readers
|
X
|
|||
|
Digital SLR Cameras
|
X
|
|||
|
|
GPS Navigation Units
|
X
|
||
|
|
High Definition Televisions
|
X
|
||
|
Laptops and PCs
|
X
|
X
|
||
|
Gaming
|
X
|
X
|
||
|
Industrial
|
Industrial
|
Factory Automation
|
X
|
X
|
|
Motor and Process Controls
|
X
|
X
|
||
|
Video Surveillance & Security
|
X
|
X
|
||
|
Scientific
|
Human-Machine Interface
|
X
|
X
|
|
|
Test and Measurement
|
X
|
X
|
||
|
Medical
|
Diagnostic Imaging
|
X
|
X
|
|
|
Hand-held Medical Devices
|
X
|
X
|
||
|
|
Automotive
|
Driver Assistance/Information Systems
|
X
|
X
|
|
Driver Information Systems
|
X
|
X
|
||
|
Computing
|
Servers and Micro Servers
|
X
|
||
|
Data Centers
|
X
|
|||
|
Storage Networks
|
X
|
|||
|
Security
|
X
|
|||
Lattice Strategy and Advantage
Fundamentally, we have changed the landscape of the traditional FPGA industry by focusing on low-energy, small form factor, cost competitive solutions. Focusing our efforts to expand this niche in the FPGA industry and leveraging these pervasive attributes, we have expanded the Served Available Market for FPGAs. Opening up the previously under-served Consumer market to programmable logic has overcome a historical perception that FPGAs are predominantly large, power-hungry and expensive. This strategy has also enhanced our position in more traditional end markets as more applications can benefit from low-power, small form factor and greater affordability. We believe that the volume of devices which are always-on, always-connected and connected-to-everything (the “Internet of Things”) will continue to expand, providing growth opportunities in many of the markets we already serve. Our strategy is to lead the middle-to-low-end of the FPGA market where high density, system-level integration and cutting edge process technology are less necessary, and to displace ASICs and ASSPs in applications where low power, small form factor, low cost and rapid time to market are critical to the success of our customers.
6
The following table generally summarizes the key characteristics of our FPGAs relative to ASICs and ASSPs:
|
Lattice FPGAs
|
ASICs/ASSPs
|
|
|
Time to Market
|
Faster
|
Slower
|
|
Development Cost (non-recurring engineering)
|
Lower
|
Higher
|
|
Customizable by Customer
|
Yes
|
No
|
|
Reprogrammable
|
Yes
|
No
|
Where time to market is critical to our customers, the reprogrammability of FPGAs allows designers to move quickly and easily to add features, correct mistakes and fill gaps in functions. Additionally, our focus on the development of customizable design solutions for our FPGAs (“IP Cores”) provides customers with reliable, pre-tested, reusable functions that can be quickly adopted, allowing our customers to focus more of their time and energy on the unique aspects of their product. This can provide FPGAs a distinct time to market advantage over competing solutions.
Another advantage for certain of our FPGA solutions is their relatively advanced process technologies, often one or more generations ahead of competing ASICs, microcontrollers and ASSPs. This generational advantage from a lithography standpoint allows lower-end FPGAs to compete directly on power and cost while offering a distinct advantage in form factor. We expect the fixed cost of ASIC and ASSP development to significantly increase on more advanced technology nodes, allowing FPGAs to better address high volume applications and gain market share from ASIC and ASSP suppliers.
The following table generally summarizes certain key characteristics of our FPGAs relative to higher density FPGAs offered by other FPGA companies:
|
Lattice FPGAs
|
Higher Density FPGAs
|
|
|
Relative Size
|
Smaller
|
Larger
|
|
Unit Cost
|
Lower
|
Higher
|
|
Power Consumption
|
Lower
|
Higher
|
Higher density FPGAs are generally larger, more expensive and consume greater power. Integrating multiple functions, including high-end processors, on a single device often requires the use of more expensive process technologies, resulting in higher development and manufacturing costs. We have chosen not to compete at the high-end of this traditional FPGA market. Rather, we focus on providing flexible solutions in the middle and low-end of the market by leveraging established process nodes to create multiple generations of cost effective devices on more mature process technologies. By pairing lower cost technologies with the latest IP Cores, we are able to quickly and efficiently deliver added functionality while optimizing cost, power consumption and form factor.
Communications Market
Revenue from the Communications end market accounted for
42%
of our revenue in fiscal
2014
and historically has been our largest end market. Our products are used throughout the communications infrastructure with our LatticeECP families focused on high-speed serial communications channels ("SERDES") based, high bandwidth applications. Our MachXO, MachXO2 and MachXO3 products address IO-intensive, control plane applications and our iCE40 products support simple glue logic and connectivity applications.
Worldwide communications infrastructure continues to grow and evolve to meet the ever increasing bandwidth and coverage demands of consumers with industry sources expecting a substantial increase in data traffic over the next several years. In addition, we believe that Heterogeneous Networks ("HetNets") will become a more critical vehicle for increasing available bandwidth and filling coverage gaps in existing communications and data networks. We believe our ability to offer low power, small form factor FPGAs and the latest IP Cores will drive our continued success in the communications market.
Consumer Market
During fiscal
2014
, we derived
25%
of our revenue from the Consumer end market. While we historically served the Consumer market with products like the ispMach 4000ZE and MachXO2 in applications including e-readers, GPS navigation units and other mobile devices, the acquisition of SiliconBlue Technologies in December 2011 expanded our presence in the consumer market. Our products can now be found in smartphones, tablets, wearables, and other wireless, battery operated devices. Our iCE40 and MachXO2 product lines combine to achieve a distinctive balance of logic and non-volatile memory. Leveraging our low power and small form factor solutions allows us to deliver a compelling value proposition for manufacturers of consumer products. As a result, we shipped over 130 million iCE40, MachXO2, and ispMach 4000ZE devices into the rapidly growing Consumer end market in fiscal
2014
alone.
7
The expected continued proliferation of wireless, network connected, and battery operated devices in the consumer market provides many growth opportunities for FPGAs in applications such as smartphones, tablets, wearables, e-readers, GPS navigation units, high definition televisions and digital SLR cameras. Based on at least one industry source, we believe that global market shipments of wearable devices will grow to over 130 million units in 2018 (iHS iSuppli, January 2014). In addition, smartphone customers are becoming increasingly feature savvy, demanding higher resolutions cameras, multiple cameras to measure depth or take panoramic images, voice detection and recognition, and intelligent sensor management. All of these functions can use an FPGA alongside an image sensor and application processor to meet these demands.
Industrial
The Industrial end markets represented
33%
of total revenues in fiscal
2014
. Although a somewhat fragmented market, we believe we can service much of the Industrial end market with existing MachXO product families packaged in small form factors and ball pitches that meet customer needs. Additionally, those same products that create winning solutions for control plane and data path applications in the Communications market can also meet the video application requirements for surveillance and switching in the Industrial market. Further, the iCE40 family, developed for consumer mobile applications, can provide customers ready-made solutions for battery powered handheld devices at low cost. The same process technology advantage which we enjoy in the Consumer market also applies to the Industrial market.
Our MachXO product families feature both high-performance and low-power versions that align with a variety of server applications. The potential for growth in server farms and the widespread adoption of cloud computing could lead to greater demand for smaller, lower power, solutions that can deliver high data rates at affordable operating costs. With innovative features including Wafer Level Chip Scale Packaging (“WLCSP”) and very small ball pitch packages, we have the ability to supply customers with the smallest form factor FPGAs currently available.
Similar to the Consumer market, we believe that the Industrial markets may also see accelerated development as smartphone semiconductors become more prevalent in non-mobile applications including test and measurement, medical imaging, factory automation and process control, video surveillance and switching, driver assistance, and infotainment.
Lattice Products
We actively participate in the PLD market using both FPGA and CPLD silicon architectures. During fiscal 2014,
34%
of our revenue was derived from FPGA products, compared to
31%
in 2013 and
34%
in 2012. During fiscal 2014,
66%
of our revenue was derived from CPLD products, compared to
69%
in 2013 and
66%
in 2012. We strive to meet our customers' needs by offering innovative and differentiated solutions that include not only silicon and packaged devices, but also design tools and intellectual property.
LatticeECP Families
The LatticeECP families are designed for customers who need PLDs that provide Digital Signal Processing (“DSP”) capabilities, a significant amount of memory and SERDES, but do not want the cost or power premiums of high-end FPGAs. The LatticeECP3 family is able to serve this market due to careful circuit design choices aimed at achieving lower cost and architectural enhancements that reduce power consumption.
Introduced in April 2014, the ECP5 family is well suited for high-capability high-volume applications where low power, small form-factor, and low cost are crucial. In wireless and wireline applications, the ECP5 enables data path bridging and interfacing, providing the flexible connectivity required in small-cell applications as well as smart transceiver solutions for broadband access equipment. ECP5 also offers PCI Express side-band connectivity for microservers and can implement the entire image processing function in an industrial video camera application while consuming less than 2W of power.
MachXO Families
The MachXO families of versatile non-volatile reconfigurable FPGAs are designed for applications traditionally implemented using CPLDs or low-density FPGAs. MachXO families are used in a variety of end markets including consumer, communications, and industrial.
Announced in late 2014, the MachXO3L family is an instant-on, multi time programmable FPGA architecture designed primarily for applications traditionally addressed by fixed silicon or low-capacity PLDs. MachXO3L products are targeted for a broad range of high value, cost sensitive applications that require general purpose I/O expansion, interface bridging, hardware acceleration and power-up management. Additionally, it offers the benefits of increased system integration by providing ultra-small packages, embedded memory, built-in Phase-locked Loops ("PLL"), MiPi and high performance LVDS I/O.
8
iCE40 Families
The iCE40 families are designed to meet the shrinking power budgets and space constrained environments of handheld products. Emphasizing the smallest overall solution size, the lowest power consumption and aggressive high volume pricing, the iCE40 families are directly competitive with ASIC and ASSP alternatives. Where system designers could wait months for ASIC and ASSP solutions, our iCE40 families enable them to realize their design in days.
With package technologies as small as 0.35mm, and IP including PLLs, oscillators, LED drivers, and serial interfaces, iCE40 products can serve the basic I/O expansion, bridging and processor acceleration needs of broad market applications as well as consumer mobile applications in devices such as smartphones, tablets and wearables.
Introduced in July 2014, the iCE40 Ultra family delivers exceptional integration for infrared remote, barcode, touch, user identification, and pedometer functions. These and other customization capabilities allow makers of mobile consumer devices to quickly implement features that differentiate their products. iCE40 Ultra delivers more functionality, in smaller form factors, than competing solutions. The iCE40 Ultra family also features reduced power consumption (by 75%) compared to previous devices. When combined, these features enable designers to create more compact systems and enable longer battery lives.
Programmable Mixed Signal Families
As customer equipment grows more complex, so does the customer's power and clock management problems. Our Mixed Signal families (Platform Manager 2, Platform Manager, Power Manager II and ispClock) feature a combination of programmable logic and analog circuitry that allows system designers to reduce system cost and design time by quickly and easily integrating a wide variety of power or clock management functions within a single integrated device. These products can replace numerous discrete components, reducing cost and conserving board space, while providing customers with additional design flexibility and time-to-market benefits. The accuracy of our products enables more reliable system performance for our customers.
The Platform Manager 2 family is Lattice's fourth-generation programmable mixed signal device family. The Platform Manager 2 devices simplify board management design significantly by integrating programmable analog and logic to support many common functions, including power, thermal and control plane management, all in real time. By integrating these support functions, Platform Manager 2 devices not only reduce the cost of these functions compared to traditional approaches, but also can improve system reliability and provide a higher degree of flexibility, reducing the likelihood of a board re-spin.
Software Development Tools and Intellectual Property Cores
Our programmable logic products are supported by several design and development suites with each one targeted at the specific needs of the user. Our iCE40 products are supported by our iCEcube2 design and development suite. Certain other products are supported by ispLEVER Classic. Some of our mixed signal products are supported by PAC-Designer® software. The remainder of our products are supported by the Lattice Diamond design and development tool suite.
iCEcube2 is a complete, easy to learn design flow that meets the needs of the designer and is supported both on the Windows and Linux platforms. Lattice Diamond is also a complete, modern and easy to learn FPGA design suite supported on both Windows and Linux platforms. Both iCEcube2 and Lattice Diamond allow our users to easily enter their design along with the design goals, quickly analyze and verify the design for accuracy, and then implement the design in our programmable logic solution. The flow enables logic simulation, static timing analysis, I/O pin assignment, synthesis, automatic timing-driven place and route and device programming.
For all tool suites, Synopsys' Synplify Pro advanced FPGA synthesis is included for all operating systems supported, and Aldec's Active-HDL Lattice Edition II® simulator is included for Windows. In addition to the tool support for Lattice devices provided by the OEM versions of Synplify Pro® and Active-HDL®, our devices are also supported by the full versions of Synopsys Synplify Pro® and Aldec Active-HDL®. Additionally, Mentor Graphics ModelSim SE® is supported.
Our IP core program (LatticeCORE) assists our customers' design efforts by providing pre-tested, reusable functions that can be easily used; allowing our customers to focus on their unique system architectures. These IP cores eliminate the need to “re-invent the wheel” by providing many industry-standard functions, including PCI Express, DDR, Ethernet, CPRI, 7:1 LVDS and embedded microprocessors.
Product Development
We place substantial emphasis on new product development and believe that continued investment in this area is required to maintain and improve our competitive position. Our product development activities emphasize new proprietary products, advanced packaging, enhancement of existing products and process technologies, and improvement of software development tools. Product development activities occur primarily in: Hillsboro, Oregon; San Jose, California; Shanghai, China; and Alabang, Philippines.
9
Research and development expenses were
$88.1 million
in 2014,
$81.0 million
in 2013 and
$77.6 million
in 2012. We expect to continue to make significant investments in research and development.
Operations
We do not manufacture our own silicon products. We maintain strategic relationships with large semiconductor foundries to source our finished silicon wafers. This strategy allows us to focus our internal resources on product and market development, and eliminates the fixed cost of owning and operating semiconductor manufacturing facilities. We are also able to take advantage of the ongoing advanced process technology development efforts of semiconductor foundries.
Lattice and Fujitsu Limited ("Fujitsu") have entered into agreements pursuant to which Fujitsu manufactures our products on its 130nm, 90nm and 65nm CMOS process technologies, as well as on 130nm, 90nm and 65nm technologies with embedded flash memory that we have jointly developed with Fujitsu. Taiwan Semiconductor Manufacturing Company Ltd. (“TSMC”) manufactures our 40nm iCE products. United Microelectronics Corporation ("UMC") manufactures certain of our 40nm products, as well as some of our 350nm and 180nm products. Seiko Epson ("Epson") manufactures some of our 500nm, 350nm, 250nm and 180nm products.
All of our assembly and test operations are performed by outside suppliers.
We rely on third party vendors to provide cost-effective and efficient supply chain services. Among other activities, these outsourced services relate to direct sales logistics, including order fulfillment, inventory management and warehousing, and shipment of inventory to third party distributors.
We perform certain test operations as well as reliability and quality assurance processes internally. We have achieved and maintained ISO9001:2008 Quality Management Systems Certification and released a full line of products qualified to the AEC-Q100 Reliability Standard.
Wafer Fabrication
We source silicon wafers from our foundry partners, Fujitsu and Epson in Japan, and TSMC and UMC in Taiwan, pursuant to agreements with each company and their respective affiliates. We negotiate wafer volumes, prices and other terms with our foundry partners and their respective affiliates on a periodic basis.
Assembly
After wafer fabrication and initial testing, we ship wafers to independent subcontractors for assembly. During assembly, wafers are separated into individual die and encapsulated in plastic packages. We have qualified assembly partners in Indonesia, Malaysia, Taiwan, the Philippines, South Korea and Singapore. We negotiate assembly prices, volumes and other terms with our assembly partners and their respective affiliates on a periodic basis.
We currently offer an extensive list of standard products in lead (Pb) free packaging. Our lead-free products meet the European Parliament Directive entitled "Restrictions on the use of Hazardous Substances" ("ROHS"). A select and growing subset of our ROHS compliant products are also offered with a "Halogen Free" material set.
Testing
We electrically test the die on most wafers prior to shipment for assembly. Following assembly but prior to customer shipment, each product undergoes final testing and quality assurance procedures. Wafer sort testing is performed by independent contractors in Malaysia, Japan, Indonesia and Singapore. Final testing is performed by independent contractors in Indonesia, Malaysia, the Philippines, Singapore, Taiwan, and South Korea. We also perform certain test operations as well as reliability and quality assurance processes internally.
Marketing, Sales and Customers
We sell our products to end customers both directly through our wholly-owned subsidiary Lattice SG Pte. Ltd. and through a network of independent manufacturers' representatives. Additionally, we sell indirectly through independent sell-in (Japan only) and sell-through distributors. We also employ a direct sales management and field applications engineering organization to support our end customers and indirect sales resources. Our end customers are primarily original equipment manufacturers ("OEMs") in the Communications, Consumer and Industrial end markets.
10
We have agreements with 18 manufacturers' representatives in North America. We have established foreign sales channels in over 50 foreign countries and maintain a network of 7 international sales representatives. A substantial portion of our sales are made through distributors.
We provide global technical support to our end customers with engineering staff based at our headquarters, product development centers and selected field sales offices. We maintain numerous domestic and international field sales offices in major metropolitan areas.
Resale of product by sell-through distributors accounted for
45%
of our net revenue in fiscal
2014
, compared to 45% of our net revenue in fiscal 2013 and 55% of our net revenue in fiscal 2012, and we expect our distributors to generate a significant portion of our revenue in the future. We depend on our distributors to sell our products to end customers, complete order fulfillment and maintain sufficient inventory of our products. Our distributors also provide technical support and other value-added services to our end customers. We have two primary sell-through distributors. We also have regional distribution in Asia, Japan and Israel and we sell through three major on-line catalog distributors.
Historically the largest percentage of our revenue has been derived from customers participating in the Communications end market. A significant portion of that revenue comes from two large China-based telecommunication equipment providers. In fiscal
2014
, Huawei Technologies Co. Ltd. accounted for
12%
of total revenue. Additionally, we maintained significant revenue from the Consumer end market in
2014
, and as a result Samsung Electronics Co., Ltd. accounted for
19%
of total revenue in
2014
, down from
22%
in fiscal 2013. No other individual end customers, in any end markets, accounted for more than 10% of total revenue in any of the fiscal years
2014
, 2013 or 2012.
Revenue from foreign sales as a percentage of total revenue was
92%
,
91%
, and
88%
for fiscal
2014
, 2013, and 2012, respectively. We assign revenue to geographies based on customer ship-to address at the point where revenue is recognized. Revenue attributed to China for fiscal
2014
was approximately
43%
of total revenue, compared to 45% and 41% in fiscal 2013 and fiscal 2012, respectively. In the case of sell-in distributors and OEMs, revenue is typically recognized, and geography is assigned, when products are shipped. In the case of sell-through distributors, revenue is recognized when resale to the end customer occurs and geography is assigned based on the end customer location on the resale reports provided by the distributor. Both foreign and domestic sales are denominated in U.S. dollars, with the exception of sales in Japan, where sales to certain customers are denominated in yen.
The composition of our revenue by geography, based on ship-to location, is as follows:
|
|
Year Ended
|
% Change in
|
||||||||||||||||||||||||
|
(In thousands)
|
January 3, 2015
|
December 28, 2013
|
December 29, 2012
|
2014
|
2013
|
|||||||||||||||||||||
|
Asia
|
$
|
266,831
|
|
73
|
%
|
$
|
245,689
|
|
74
|
%
|
$
|
189,811
|
|
68
|
%
|
9
|
29
|
|
||||||||
|
Europe
|
59,041
|
|
16
|
|
47,459
|
|
14
|
|
48,202
|
|
17
|
|
24
|
(2
|
)
|
|||||||||||
|
Americas
|
40,255
|
|
11
|
|
39,377
|
|
12
|
|
41,243
|
|
15
|
|
2
|
(5
|
)
|
|||||||||||
|
Total revenue
|
$
|
366,127
|
|
100
|
%
|
$
|
332,525
|
|
100
|
%
|
$
|
279,256
|
|
100
|
%
|
10
|
19
|
|
||||||||
Seasonality
In most years, we experience some seasonal trends in the sale of our products. Sales of our products are often higher during our fiscal quarters two and three, but lower during our other fiscal quarters. However, on balance general economic conditions and the cyclical nature of the end markets we serve have a greater impact on our business and financial results than seasonal trends.
Backlog
Our backlog consists of orders from distributors and orders from certain OEMs which are for deliveries within the next year. Historically, our backlog is a poor predictor of future sales or customer demand for the following reasons:
|
•
|
Purchase orders, consistent with common industry practices, can generally be revised or canceled up to 30 days before the scheduled delivery date without significant penalty.
|
|
•
|
Our backlog for sell-through distributors is valued at list price, which in most cases is substantially higher than the prices ultimately recognized as revenue.
|
|
•
|
A sizable portion of our revenue comes from our "turns business," where the product is ordered and delivered within the same quarter.
|
|
•
|
A growing portion of our revenue arises from vendor managed inventory arrangements where the timing and volume of vendor utilization is difficult to predict.
|
11
Competition
The semiconductor industry is intensely competitive and characterized by rapid rates of technological change, product obsolescence and price erosion. Our current and potential competitors include a broad range of semiconductor companies from emerging companies to large, established companies, many of which have greater financial, technical, manufacturing, marketing and sales resources.
The principal competitive factors in the programmable logic market include silicon and software product features, price, technical support, sales, marketing and distribution strength. The availability of competitive intellectual property cores is also critical. In addition to product features such as power consumption, package size, density, performance, re-programmability, and reliability, competition occurs on the basis of price and market acceptance of specific products and technology. We intend to continue to address these competitive factors by continually introducing product enhancements and new products and by reducing the manufacturing cost of our products.
We compete primarily with other semiconductor companies that provide logic solutions that are not user programmable via hardware configuration, or that offer products based on alternative solutions such as ASIC, ASSP, microcontroller, analog and DSP technologies. Although we have not yet experienced direct competition from companies located outside the United States, such companies may become a more significant competitive factor in the future. Competition may also increase if other larger semiconductor companies seek to expand into our market. Any such increases in competition could have a material adverse effect on our operating results. We do not compete directly with Altera Corporation or Xilinx, Inc. in the consumer market. However, we occasionally compete with them in the low-end of the traditional FPGA markets, primarily in the communications and industrial markets.
Intellectual Property
We seek to protect our products and technologies primarily through patents, trade secrecy measures, copyrights, mask work protection, trademark registrations, licensing restrictions, confidentiality agreements and other approaches designed to protect proprietary information. There can be no assurance that others may not independently develop competitive technology not covered by our intellectual property rights or that measures we take to protect our technology will be effective.
Patents
We hold numerous domestic, European and Asian patents and have patent applications pending in the United States, Europe and Asia. Our current patents will expire at various times between 2015 and 2033. There can be no assurance that pending or future patent applications will result in issued patents, or that any issued patents will survive challenges to their validity. Although we believe that our patents have value, there can be no assurance that our patents, or any additional patents that may be issued in the future, will provide meaningful protection from competition. We believe that our success will depend primarily upon the technical expertise, experience, creativity, and the sales and marketing abilities of our personnel.
Patent and other proprietary rights infringement claims are common in our industry. There can be no assurance that, with respect to any claim made against us, we would be able to successfully defend against the claim or that we could obtain a license that would allow us to use the proprietary rights on terms or under conditions that would not harm our business.
Licenses and Agreements
We have acquired various licenses from third parties to certain technologies that are implemented in IP cores or embedded in our products. Those licenses support our continuing ability to make and sell these products to our customers. While our various licenses are important to our success, we believe our business as a whole is not materially dependent on any particular license, or group of licenses.
Advanced Micro Devices
In 1999, as part of our acquisition of Vantis Corporation, a wholly owned subsidiary of Advanced Micro Devices, Inc. (“AMD”), we entered into an agreement with AMD pursuant to which we have cross-licensed Vantis patents with AMD patents, having an effective filing date on or before June 15, 1999, related to programmable logic products. This cross-license was made on a worldwide, non-exclusive and royalty-free basis. Additionally, as part of our acquisition of Vantis, we acquired certain third-party license rights held by Vantis prior to the acquisition.
Altera
In 2001, we entered into a comprehensive, royalty-free, non-exclusive patent cross-license agreement and a multi-year patent peace agreement with Altera.
12
Agere Systems
In 2002, as part of our acquisition of the FPGA business of Agere Systems, Inc., we entered into an intellectual property agreement with Agere and Agere Systems Guardian Corporation. Pursuant to this agreement, these Agere companies assigned or licensed to us certain FPGA and Field Programmable System Chip patents, trademarks, software and other intellectual property rights and technology, and we licensed back rights in these same assets. These cross-licenses were made on a worldwide, non-exclusive and royalty-free basis.
SiliconBlue
In 2011, as part of the acquisition of SiliconBlue Technologies, we assumed a patent license agreement dated July 21, 2006, under which Kilopass Technology, Inc. granted to SiliconBlue and its successors a license to certain U.S. patents and related foreign patents. The license is an exclusive, fully paid, worldwide license but is limited to the use of the patented inventions in the field of stand-alone programmable logic devices.
Intellectual Ventures
In 2013, we entered into a paid-up, non-exclusive patent license agreement with IV Global Licensing LLC, Intellectual Ventures I LLC, and Intellectual Ventures II LLC which provides us a five-year license to a portfolio of certain U.S. semiconductor related patents.
PACT
In 2014, we entered into a paid-up, non-exclusive patent license agreement with PACT XPP Technologies AG, which provides us with a worldwide license to a portfolio of certain semiconductor related patents.
Employees
At
January 3, 2015
, we had 784 full-time employees. We believe that our future success will depend, in part, on our ability to continue to attract and retain highly skilled technical and management personnel. No employee is subject to a collective bargaining agreement. We have never experienced a work stoppage and consider our employee relations to be good.
Executive Officers of the Company
The following individuals currently serve as our executive officers:
|
Name
|
Position
|
Age
|
|
Darin G. Billerbeck
|
President, Chief Executive Officer and Director
|
55
|
|
Joe Bedewi
|
Corporate Vice President and Chief Financial Officer
|
55
|
|
Byron W. Milstead
|
Corporate Vice President, General Counsel and Secretary
|
58
|
Darin G. Billerbeck
joined the Company as President and Chief Executive Officer on November 8, 2010. Prior to joining the Company, Mr. Billerbeck served as the Chief Executive Officer of Zilog, a microcontroller manufacturer, which was acquired by IXYS Corporation in February 2010. Prior to joining Zilog in January 2007, Mr. Billerbeck served 18 years in various executive and management positions at Intel Corporation, including as Vice President and General Manager of Intel's Flash Products Group from 1999 to 2007.
Joseph Bedewi
joined the Company as Corporate Vice President and Chief Financial Officer on April 15, 2011. Mr. Bedewi served 17 years as Financial Controller for several groups, and held various other financial and operational management roles at Intel Corporation. His operations experience ranges from organizational development and optimization, strategic planning, business development and process improvement, to capacity and capital planning. After leaving Intel, Mr. Bedewi served as Chief Financial Officer at International DisplayWorks, Malibu Boats, LLC, and Solar Power, Inc.
Byron W. Milstead
joined the Company in May 2008 as Corporate Vice President and General Counsel. In January 2013, Mr. Milstead was appointed to serve as President and General Manager of Lattice SG Pte. Ltd., the Company’s wholly-owned sales subsidiary in Singapore. Prior to joining the Company, Mr. Milstead served as Senior Vice President and General Counsel of Credence Systems Corporation from December 2005 to May 2008. Mr. Milstead served as Vice President and General Counsel of Credence Systems Corporation from November 2000 until December 2005. Prior to joining Credence Systems Corporation, Mr. Milstead practiced law at the Salt Lake City office of Parsons Behle & Latimer and the Portland offices of both Bogle and Gates and Ater Wynne.
13
Available Information
We make available, free of charge through our Investor Relations section of our website at www.latticesemi.com, our annual reports on Form 10-K, quarterly reports on Form 10-Q, current reports on Form 8-K, proxy statements and amendments to those reports and statements as soon as reasonably practicable after such materials are electronically filed with, or furnished to, the SEC. You may also obtain free copies of these materials by contacting our Investor Relations Department at 5555 N.E. Moore Court, Hillsboro, Oregon 97124-6421, telephone (503) 268-8000. Our SEC filings are also available at the SEC's website at www.sec.gov.
The following risk factors and other information included in this Annual Report should be carefully considered before making an investment decision relating to our common stock. If any of the risks described below occur, our business, financial condition, operating results and cash flows could be materially adversely affected. The risks and uncertainties described below are not the only ones we face. Additional risks and uncertainties not presently known to us or that we currently deem immaterial also may impair our business operations and financial results.
We rely on independent foundries for the manufacture of all of our products and a manufacturing problem or insufficient foundry capacity could adversely affect our operations.
We depend on independent foundries to supply silicon wafers for many of our products. These foundries include Fujitsu in Japan, which supplies the majority of our wafers. We negotiate wafer volumes, prices and other terms with our foundry partners and their respective affiliates on a periodic basis typically resulting in short-term agreements which do not ensure long-term supply or allocation commitments. We rely on our foundry partners to produce wafers with competitive performance attributes. Should the foundries that supply our wafers experience manufacturing problems, including unacceptable yields, delays in the realization of the requisite process technologies, or difficulties due to limitations of new and existing process technologies, our operating results could be adversely affected. Should the foundries not be able to manufacture sufficient quantities of our products or continue to manufacture a product for the full life of the product, we may be required to prematurely limit or discontinue the sales of certain products or incur significant costs to transfer products to other foundries, and our customer relationships and operating results could be adversely affected. In addition, weak economic conditions may adversely impact the financial health and viability of the foundries and cause them to limit or discontinue their business operations, resulting in shortages of supply and an inability to meet their commitments to us, which could adversely affect our financial condition and operating results.
A disruption of our foundry partners' operations as a result of a fire, earthquake, act of terrorism, political or labor unrest, governmental uncertainty, war, disease or other natural disaster or catastrophic event, or any other reason, could disrupt our wafer supply and could adversely affect our operating results.
Establishing, maintaining and managing multiple foundry relationships requires the investment of management resources as well as additional costs. If we fail to maintain our foundry relationships, or elect or are required to change foundries, we will incur significant costs and manufacturing delays. The success of certain of our next generation products is dependent upon our ability to successfully partner with Fujitsu and other foundry partners, including Seiko Epson Corporation in Japan, United Microelectronics Corporation in Taiwan, and Taiwan Semiconductor Manufacturing Company Ltd. ("TSMC") in Taiwan. If for any reason our foundry partners do not provide their facilities and support for our development efforts, we may be unable to effectively develop new products in a timely manner.
Should a change in foundry relationships be required, we may be unsuccessful in establishing new foundry relationships for our current or next generation products, or may incur substantial cost and or manufacturing delays until we form and ramp relationships and migrate products, each of which could adversely affect our operating results.
A downturn in the Communications end market could cause a reduction in demand for our products and limit our ability to maintain revenue levels and operating results.
Revenue from the Communications end market accounted for
42%
of our revenue in
2014
. Three of our top five customers participate primarily in the Communications end market. In the past, cyclical weakening in demand for programmable logic products from customers in the Communications end market has adversely affected our revenue and operating results. In addition, telecommunication equipment providers are building network infrastructure for which we compete for product sales. Any deterioration in the Communications end market or our end customers' reduction in spending to support this end market could lead to a reduction in demand for our products which could adversely affect our revenue and results of operations.
The Consumer end market is rapidly changing and cyclical, and our failure to accurately predict the frequency, duration, timing and severity of these cycles could adversely affect our financial condition and results.
14
Revenue from the Consumer end market accounted for
25%
of our revenue in fiscal
2014
. Revenue from the Consumer end market consists primarily of revenue from our products designed and used in a broad range of products including smart handheld devices, flat panel displays, digital cameras and camcorders, gaming consoles, and set-top boxes. This market is characterized by rapidly changing requirements and product features. Our success in this market will depend principally on our ability to:
|
•
|
meet the market windows for consumer products;
|
|
•
|
predict technology and market trends;
|
|
•
|
develop IP cores to meet emerging market needs;
|
|
•
|
develop products on a timely basis; and
|
|
•
|
avoid cancellations or delay of products.
|
Our inability to accomplish any of the foregoing, or to offset the volatility of this end market through diversification into other markets, could materially and adversely affect our business, financial condition, and results of operations. Cyclicality in the Consumer market could periodically result in higher or lower levels of revenue and revenue concentration with a single or small number of customers. In addition, rapid changes in this market may affect demand for our products, may cause our revenue derived from sales in this market to vary significantly over time, adversely affecting our financial results.
We are dependent on a concentrated group of customers for a significant part of our revenues. If we were to lose any of these customers, our revenue could decrease significantly.
A large portion of our revenue depends on sales to a limited number of customers. During fiscal
2014
, Samsung Electronics Co., Ltd. accounted for
19%
of our total revenue and Huawei Technologies Co. Ltd accounted for
12%
of our total revenue. Additionally our top five end customers accounted for approximately
45%
of our total revenue. If any of these relationships were to diminish, or if these customers were to develop their own solutions, or adopt an alternative solution or a competitor's solution, our results could be adversely affected.
While we strive to maintain a strong relationship with our customers, their continued use of our products is frequently reevaluated, as certain of our customers' product life cycles are relatively short and they continually develop new products. The selection process for our products to be included in our customers' new products is highly competitive. There are no guarantees that our products will be included in the next generation of products introduced by these customers. Any significant loss of, or a significant reduction in purchases by, one or more of these customers, or their failure to meet their commitments to us, could have an adverse effect on our financial condition and results of operations. If any one or more of our concentrated group of customers were to experience significantly adverse financial conditions, our financial condition and business could be adversely affected as well.
Our proposed acquisition of Silicon Image may not be completed or may occur on terms different than those contemplated, which could negatively affect our ongoing business.
On
January 26, 2015
, we entered into an agreement to commence a tender offer to acquire Silicon Image, Inc. ("Silicon Image"), a leading provider of wired and wireless connectivity solutions, for $7.30 in cash per share, resulting in a purchase price of approximately $602.05 million, plus related fees and expenses. The transaction will be funded through a combination of cash on hand and $350.0 million of new debt financing.
Acquiring debt may make it difficult for us to satisfy our financial obligations, including making scheduled principal and interest payments on the note, and may limit our ability to use our cash flow or obtain additional financing for future working capital, capital expenditures, acquisitions or other general business purposes. If we are unable to generate sufficient cash flow in the future to service our debt, we may be required to refinance all or a portion of this debt or obtain additional financing. We cannot ensure that we will be able to refinance our debt or obtain additional financing on terms acceptable to us. Overall, our ability to meet our debt service obligations will depend on our future performance, which will be subject to financial, business and other factors affecting our operations, many of which are beyond our control.
Additionally, this debt financing may contain customary covenants, including the requirement to meet specified financial ratios. Events beyond our control may affect our ability to meet those covenants, and failure to comply with covenants under this borrowing arrangement may result in declaration of an event of default. An event of default, if not cured or waived, may permit acceleration of required payments against such indebtedness. We cannot be certain we would be able to remedy any such defaults. If our required payments are accelerated, we cannot be certain that we would have sufficient funds available to pay the indebtedness or that we would have the ability to raise sufficient capital to replace the indebtedness on terms favorable to us or at all. In addition, in the case of an event of default on this debt financing, the lenders may be permitted to foreclose on our assets securing that indebtedness.
Although we and Silicon Image, Inc. have signed a merger agreement in furtherance of our proposed acquisition of Silicon Image, Inc., the completion of the acquisition is subject to a successful tender offer, regulatory approvals and other closing conditions, and there is no assurance that all of the conditions to closing will be met or that the proposed acquisition will be
15
completed on a timely basis or at all. In addition, in specified circumstances, we or Silicon Image, Inc. may be permitted to terminate the merger agreement.
It is possible that Silicon Image may receive a superior offer from a third party, in which under the terms of the proposed transaction, we have the option to change the terms of our offer to acquire Silicon Image. If the transaction is not completed or is completed on terms different than those contemplated for any reason, we may be harmed in a number of ways, including the following:
|
•
|
to the extent that the current market price of our common stock reflects an increase resulting from a market assumption that the transaction will be completed, the market price of our common stock may decline by the value attributed to this assumption, or could decline even more;
|
|
•
|
an adverse reaction from our investors and potential investors may reduce future opportunities for financings or business combinations;
|
|
•
|
we will be required to pay certain costs and expenses relating to the proposed acquisition, whether or not the proposed acquisition is completed, such as significant fees and expenses relating to legal, accounting and advisory services; and
|
|
•
|
matters relating to the proposed acquisition may require substantial commitments of time and resources by our management, which could otherwise have been devoted to other opportunities that, had they been pursued, might have been beneficial to us.
|
If the proposed acquisition is not completed, these risks may materially and adversely affect our stock price, financial results and ongoing business.
Acquisitions and strategic investments present risks, and we may not realize the goals that were contemplated at the time of a transaction.
We may make further acquisitions and strategic investments in the future. Acquisitions and strategic investments including the proposed acquisition of Silicon Image present risks, including:
|
•
|
our ongoing business may be disrupted and our management's attention may be diverted by investment, acquisition, transition or integration activities;
|
|
•
|
an acquisition or strategic investment may not perform as well or further our business strategy as we expected, and we may not integrate an acquired company or technology as successfully as we expected;
|
|
•
|
our operating results or financial condition may be adversely impacted by unexpected costs, claims or liabilities that we assume from an acquired company or technology or that are otherwise related to an acquisition;
|
|
•
|
we may discover adverse conditions post-acquisition that are not covered by representations and warranties;
|
|
•
|
we may have difficulty incorporating acquired technologies or products with our existing product lines;
|
|
•
|
we may have higher than anticipated costs in continuing support and development of acquired products, in general and administrative functions that support such products;
|
|
•
|
we may have difficulty integrating and retaining key personnel;
|
|
•
|
our liquidity and/or capital structure may be adversely impacted;
|
|
•
|
our strategic investments may not perform as expected;
|
|
•
|
we may experience unexpected changes in how we are required to account for our acquisitions and strategic investments pursuant to United States generally accepted accounting principles ("GAAP"); and
|
|
•
|
we may have difficulty integrating acquired entities into our global tax structure with potentially negative impacts on our effective tax rate.
|
The occurrence of any of these risks could have a material adverse effect on our business, results of operations, financial condition or cash flows, particularly in the case of a larger acquisition or several concurrent acquisitions or strategic investments.
We cannot guarantee that we will be able to consummate any future acquisitions or that we will realize any anticipated benefits from any of our past or future acquisitions. We may not be able to find suitable acquisition opportunities that are available at attractive valuations, if at all. A sustained decline in the price of our common stock may make it more difficult and expensive to initiate or consummate additional acquisitions on commercially acceptable terms.
As a result of past acquisitions, as of
January 3, 2015
, we had
$44.8 million
in goodwill on our balance sheet. We are required under U.S. GAAP to test goodwill for possible impairment on an annual basis and at any other time that circumstances arise indicating the carrying value may not be recoverable. We completed our annual test of goodwill impairment in the fourth quarter of
2014
and concluded that we did not have any impairment at that time. There is no assurance that future impairment tests will indicate that goodwill will be deemed recoverable.
16
We will incur significant transaction and merger-related costs in connection with the proposed merger with Silicon Image, Inc.
We expect to incur a number of non-recurring costs associated with the proposed merger with Silicon Image, Inc. and combining the operations of the two companies. The substantial majority of non-recurring expenses will be comprised of transaction and regulatory costs related to the merger.
We also will incur transaction fees and costs related to formulating and implementing integration plans, including facilities and systems consolidation costs and employment-related costs. We continue to assess the magnitude of these costs, and additional unanticipated costs may be incurred in the proposed merger and the integration of the two companies' businesses. Although we expect that the elimination of duplicative costs, as well as the realization of other efficiencies related to the integration of the businesses, should allow us to offset integration-related costs over time, these projected benefits may not be achieved
.
We depend on distributors to generate a significant portion of our revenue and complete order fulfillment.
We depend on our distributors to sell our products to end customers, complete order fulfillment and maintain sufficient inventory of our products. Our distributors also provide technical support and other value-added services to our end customers. Resale of product through distributors accounted for
45%
of our revenue in
2014
, with two distributors accounting for
34%
of our revenue in
2014
. We expect our distributors to generate a significant portion of our revenue in the future. Any adverse change to our relationships with our distributors or a failure by one or more of our distributors to perform its obligations to us could have a material impact on our business. In addition, a significant reduction of effort by a distributor to sell our products or a material change in our relationship with one or more distributors may reduce our access to certain end customers and adversely affect our ability to sell our products.
The financial health of our distributors is important to our success. Economic conditions may adversely impact the financial health of one or more of our distributors. This could result in the inability of distributors to finance the purchase of our products or cause the distributors to delay payment of their obligation to us and increase our credit risk. If the financial health of our distributors impairs their performance and we are unable to secure alternate distributors, our financial condition and results of operations may be negatively impacted.
In addition, our distribution channels have historically experienced consolidation due to merger and acquisition activity. Consolidation may result in our distributors allocating fewer resources to the distribution and sale of our products, which could adversely affect our financial results.
We depend on the timeliness and accuracy of resale reports from our distributors; late or inaccurate resale reports could have a detrimental effect on our ability to properly recognize revenue and our ability to predict future sales.
Our success and future revenue depends on our ability to innovate, develop and introduce new products which achieve customer and market acceptance, and failure to do so could have a material adverse effect on our financial condition and results of operations.
The programmable logic market is characterized by rapid technology and product evolution, generally followed by a relatively longer ramp process to volume production on advanced technologies. Our competitive position and success depends on our ability to innovate, develop and introduce new products that compete effectively on the basis of price, density, functionality, power consumption, form factor and performance addressing the evolving needs of the markets we serve. These new products typically are more technologically complex than their predecessors.
The success of new product introductions depends upon numerous factors, including:
|
•
|
timely completion and introduction of new product designs;
|
|
•
|
ability to generate new design opportunities and design wins;
|
|
•
|
achieving design wins which result in sales of significant volume;
|
|
•
|
availability of specialized field application engineering resources supporting demand creation and customer adoption of new products;
|
|
•
|
ability to utilize advanced manufacturing process technologies;
|
|
•
|
achieving acceptable yields;
|
|
•
|
ability to obtain adequate production capacity from our wafer foundries and assembly and test subcontractors;
|
|
•
|
ability to obtain advanced packaging;
|
|
•
|
availability of supporting software design tools;
|
|
•
|
utilization of predefined IP logic;
|
|
•
|
customer acceptance of advanced features in our new products; and
|
|
•
|
market acceptance of our customers' products.
|
Our product innovation and development efforts may not be successful, our new products may not achieve industry acceptance and we may not achieve the necessary volume of production to achieve acceptable cost. Revenue relating to our mature products is expected to decline in the future, which is normal for our product life cycles. As a result, we may be increasingly d
17
ependent on revenue derived from our newer products as well as anticipated cost reductions in the manufacture of our current products. We rely on obtaining yield improvements and corresponding cost reductions in the manufacture of existing products and on introducing new products that incorporate advanced features and other price/performance factors that enable us to increase revenues while maintaining acceptable margins. To the extent such cost reductions and new product introductions do not occur in a timely manner, or that our products do not achieve market acceptance or market acceptance at acceptable pricing, our forecasts of future revenue, financial condition and operating results could be materially adversely affected.
General economic conditions and deterioration in the global business environment could have a material adverse effect on our business, operating results and financial condition.
Adverse economic conditions may negatively affect customer demand for our products and services and result in delayed or decreased spending amid concerns over declining asset values, inflation, volatility in energy costs, geopolitical issues, the availability and cost of credit, rising unemployment, and the stability and solvency of financial institutions, financial markets, businesses and sovereign nations, among other concerns. Weak global economic conditions in the past have resulted in weak demand for our products in certain geographies and had an adverse impact on our results of operations. If weak economic conditions persist or worsen, our business could be harmed due to customers or potential customers reducing or delaying orders. The inability of customers to obtain credit, the insolvency of one or more customers, or the insolvency of key suppliers could result in production delays. Any of these effects could impact our ability to effectively manage inventory levels and collect receivables, require additional restructuring actions, and decrease our revenue and profitability. Uncertainty about future economic conditions makes it difficult for us to forecast operating results and to make decisions about future investments. Any or all of these factors could adversely affect our financial condition and results of operations in the future.
A number of factors, including our inventory strategy, can impact our gross margins.
A number of factors, including yield, wafer pricing, cost of packaging raw materials, product mix, market acceptance of our new products, competitive pricing dynamics, geographic and/or end market mix and pricing strategies, can cause our gross margins to fluctuate. In addition, forecasting our gross margins is difficult because a significant portion of our business is based on turns within the same quarter.
From time to time our inventory levels may be higher than historical norms due to inventory build decisions aimed at reducing direct material cost or enabling responsiveness to expected demand. In the event the expected demand does not materialize, we may be subject to incremental excess and obsolescence costs. In addition, future product cost reductions could impact our inventory valuation, which could adversely affect our operating results.
Increased costs of wafers and materials, or shortages in wafers and materials could adversely impact our gross margins and lead to reduced revenues.
If greater demand for wafers is not accommodated by increased foundry capacity, if market demand for wafers or production and assembly materials increases, or if a supplier of our wafers or assembly materials ceases or suspends operations or otherwise experiences a disruption to its operations, our supply of wafers and other materials could become constrained. Worldwide manufacturing capacity for silicon wafers is relatively inelastic. Wafer shortages could result in wafer price increases or shortages in materials at production and test facilities, which could adversely impact our ability to meet customer product demands in a timely manner.
If any of our current or future foundry partners or assembly and test subcontractors significantly increases the costs of wafers or other materials, interrupts or reduces our supply, including for reasons outside of their control, or if any of our relationships with our partner suppliers is terminated, our operating results could be adversely affected.
We are dependent on independent contractors for a majority of our assembly, test, and logistics services, and disruption of these services could negatively impact our financial condition and results of operations.
We are dependent on subcontractors to assemble, test and ship our products with acceptable quality and yield levels. Should our subcontractors experience problems impacting the delivery of product to our customers including: prolonged inability to obtain wafers or packaging materials with competitive performance and cost attributes, inability to achieve adequate yields or timely delivery; disruption or defects in assembly, test or shipping services; or delays in stabilizing manufacturing processes or ramping up volume for new products, our operations and operating results may be adversely affected. Economic conditions may adversely impact the financial health and viability of our subcontractors and result in their inability to meet their commitments to us resulting in product shortages, quality assurance problems, reduced revenue and/or increased costs which could negatively impact our financial condition and results of operations.
In the past, we have experienced delays in obtaining assembled and tested products and in securing assembly and test capacity commitments from our suppliers. We currently anticipate that our assembly and test capacity commitments are adequate; however, these existing commitments may not be sufficient for us to satisfy customer demand in future periods. We negotiate assembly and test prices and capacity commitments from our contractors on a periodic basis. If any of our assembly or test contractors reduce their capacity commitment or increase their prices, and we cannot find alternative sources, our
18
operating results could be adversely affected.
The semiconductor industry routinely experiences cyclical market patterns and a significant industry downturn could adversely affect our operating results.
Our revenue and gross margin can fluctuate significantly due to downturns in the semiconductor industry. These downturns can be severe and prolonged and can result in price erosion and weak demand for our products. Weak demand for our products resulting from general economic conditions affecting the end markets we serve or the semiconductor industry specifically and reduced spending by our customers can result, and in the past has resulted, in excess and obsolete inventories and corresponding inventory write-downs. The dynamics of the markets in which we operate make prediction of and timely reaction to such events difficult. Due to these and other factors, our past results are not reliable predictors of our future results.
Our expense levels are based, in part, on our expectations of future sales. Many of our expenses, particularly those relating to facilities, capital equipment, and other overhead, are relatively fixed. We might be unable to reduce spending quickly enough to compensate for reductions in sales. Accordingly, shortfalls in sales could adversely affect our operating results.
Foreign sales, accounting for the majority of our revenue, are subject to various risks associated with selling in international markets, which could have a material adverse effect on our operations, financial condition, and results of operations.
We derive the majority of our revenue from sales outside of the United States. Accordingly, if we experience a decline in foreign sales, our operating results could be adversely affected. Our foreign sales are subject to numerous risks, including:
|
•
|
changes in local economic conditions;
|
|
•
|
currency exchange rate volatility;
|
|
•
|
governmental stimulus packages, controls and trade restrictions;
|
|
•
|
governmental policies that promote development and consumption of domestic integrated circuits;
|
|
•
|
export license requirements, foreign trade compliance matters, and restrictions on the use of technology;
|
|
•
|
political instability, war, terrorism or pandemic disease;
|
|
•
|
changes in tax rates, tariffs or freight rates;
|
|
•
|
reduced protection for intellectual property rights;
|
|
•
|
longer receivable collection periods;
|
|
•
|
natural or man-made disasters in the countries where we sell our products;
|
|
•
|
interruptions in transportation;
|
|
•
|
interruptions in the global communication infrastructure; and
|
|
•
|
labor regulations.
|
Any of these factors could adversely affect our financial condition and results of operations in the future.
We have significant international operations exposing us to various economic, regulatory, political, and business risks, which could have a material adverse effect on our operations, financial condition, and results of operations.
We have significant international operations, including foreign sales offices to support our international customers and distributors, an operational center in the Philippines, and research and development sites in China, India and the Philippines. Our international operations have grown as we relocated certain operational, design, and administrative functions outside the United States. In addition, we purchase our wafers from foreign foundries, have our commercial products assembled, packaged and tested by subcontractors located outside the United States, and rely upon an international service provider for inventory management, order fulfillment, and direct sales logistics.
These and other integral business activities outside of the United States are subject to the risks and uncertainties associated with conducting business in foreign economic and regulatory environments including trade barriers, economic sanctions, environmental regulations, import and export regulations, duties and tariffs and other trade restrictions, changes in trade policies, anti-corruption laws, domestic and foreign governmental regulations, potential vulnerability of and reduced protection for IP, longer receivable collection periods, disruptions or delays in production or shipments, and instability or fluctuations in currency exchange rates, any of which could have a material adverse effect on our business, financial condition and operating results.
Moreover, our financial condition and results of operations could be affected in the event of political instability, terrorist activity, U.S. or other military actions, or economic crises in countries where our main wafer suppliers, end customers, contract manufacturers, and logistics providers are located.
19
Our global organizational structure and operations expose us to unanticipated tax consequences.
Our legal organizational structure could result in unanticipated unfavorable tax or other consequences which could have an adverse effect on our financial condition and results of operations. In 2011 and 2012, we implemented a global tax structure to more effectively align our corporate structure with our business operations including responsibility for sales and purchasing activities. We created new and realigned existing legal entities, completed intercompany sales of rights to intellectual property, inventory and fixed assets across different tax jurisdictions, and implemented cost-sharing and intellectual property licensing and royalty agreements between our legal entities. We currently operate legal entities in countries where we conduct supply-chain management, design, and sales operations around the world. In some countries, we maintain multiple entities for tax or other purposes. Changes in tax laws, regulations, future jurisdictional profitability of the Company and its subsidiaries, and related regulatory interpretations in the countries in which we operate may impact the taxes we pay or tax provision we record, which could adversely affect our results of operations.
We are subject to taxation in the United States, Singapore and other countries. Future effective tax rates could be affected by changes in the composition of earnings in countries with differing tax rates, changes in the valuation of deferred tax assets and liabilities, or changes in tax laws. We compute our effective tax rate using actual jurisdictional profits and losses. Changes in the jurisdictional mix of profits and losses may cause fluctuations in the effective tax rate. Adverse changes in tax rates, our tax assets, and tax liabilities could negatively affect our results in the future.
We cannot give any assurance as to what taxes we pay or the ability to estimate our future effective tax rate because of, among other things, uncertainty regarding the tax policies of the jurisdictions where we operate. The U.S. government and the Organization for Economic Cooperation and Development ("OECD") have proposed tax policy changes with respect to the taxation of global operations of multinational companies. As a result, our actual effective tax rate or taxes paid may vary materially from our expectations. Changes in tax laws, regulations and related interpretations in the countries in which we operate may have an adverse effect on our business, financial condition or operating results.
Product quality problems could lead to reduced revenue, gross margins and net income.
In general, we warranty our products for varying lengths of time against non-conformance to our specifications and certain other defects. Because our products, including hardware, software and intellectual property cores, are highly complex and increasingly incorporate advanced technology, our quality assurance programs may not detect all defects, whether manufacturing defects in individual products or systematic defects that could affect numerous shipments. Inability to detect a defect could result in a diversion of our engineering resources from product development efforts, increased engineering expenses to remediate the defect and increased costs due to customer accommodation or inventory impairment charges. On occasion we have also repaired or replaced certain components or made software fixes or refunded the purchase price or license fee paid by our customers due to product or software defects. If there are significant product defects, the costs to remediate such defects, net of reimbursed amounts from our vendors, if any, or to resolve warranty claims may adversely affect our revenue, gross margins and net income.
The nature of our business makes our revenue and gross margin subject to fluctuation and difficult to predict which could have an adverse impact on our business.
In addition to the challenging market conditions we may face, we have limited visibility into the demand for our products, particularly new products, because demand for our products depends upon our products being designed into our end customers' products and those products achieving market acceptance. Due to the complexity of our customers' designs, the design to volume production process for many of our customers requires a substantial amount of time, frequently longer than a year. In addition, we are dependent upon "turns," orders received and turned for shipment in the same quarter. These factors make it difficult for us to forecast future sales and project quarterly revenues. The difficulty in forecasting future sales weakens our ability to project our inventory requirements, which could result, and in the past has resulted, in inventory write-downs or failure to meet customer product demands in a timely manner. The difficulty in forecasting revenues as well as the relative customer and product mix of those revenues inhibits our ability to provide forward-looking revenue and gross margin guidance.
Reductions in the average selling prices of our products could have a negative impact on our gross margins.
The average selling prices of our products generally decline as the products mature or may decline as we compete for market share or customer acceptance in competitive markets. We seek to offset the decrease in selling prices through yield improvement, manufacturing cost reductions and increased unit sales. We also seek to continue to develop higher value products or product features that increase, or slow the decline of, the average selling price of our products. However, we cannot guarantee that our ongoing efforts will be successful or that they will keep pace with the decline in selling prices of our products, which could ultimately lead to a decline in revenues and have a negative effect on our gross margins.
If we are unable to adequately protect our intellectual property rights, our financial results and our ability to compete effectively may suffer.
Our success depends in part on our proprietary technology and the representations of technologies that we acquire, and we rely
20
upon patent, copyright, trade secret, mask work and trademark laws to protect our intellectual property. We intend to continue to protect our proprietary technology, however, we may be unsuccessful in asserting our intellectual property rights or such rights may be invalidated, violated, circumvented or challenged. From time to time, third parties, including our competitors, have asserted against us patent, copyright and other intellectual property rights to technologies that are important to us. Third parties may attempt to misappropriate our intellectual property through electronic or other means or assert infringement claims against us in the future. Such assertions by third parties may result in costly litigation, indemnity claims or other legal actions, and we may not prevail in such matters or be able to license any valid and infringed patents from third parties on commercially reasonable terms. This could result in the loss of our ability to import and sell our products or require us to pay costly royalties to third parties in connection with sales of our products. Any infringement claim, indemnification claim, or impairment or loss of use of our intellectual property could materially adversely affect our financial condition and results of operations.
Litigation and unfavorable results of legal proceedings could adversely affect our financial condition and operating results.
From time to time we are subject to various legal proceedings and claims that arise out of the ordinary conduct of our business. Certain claims are not yet resolved, including those that are discussed under Note 15 contained in the Notes to Consolidated Financial Statements, and additional claims may arise in the future. Results of legal proceedings cannot be predicted with certainty. Regardless of merit, litigation may be both time-consuming and disruptive to our operations and cause significant expense and diversion of management attention and we may enter into material settlements to avoid these risks. Should we fail to prevail in certain matters, we may be faced with significant monetary damages or injunctive relief against us that could materially and adversely affect our financial condition and operating results and certain portions of our business.
If we are not able to successfully compete in the highly competitive semiconductor industry, our financial results and future prospects will be adversely affected.
The semiconductor industry is intensely competitive and many of our direct and indirect competitors have substantially greater financial, technological, manufacturing, marketing and sales resources. The current level of competition in the programmable logic market is high and may increase in the future. We currently compete directly with companies that have licensed our technology or have developed similar products, including Altera Corporation and Xilinx, Inc. We also compete with numerous semiconductor companies that offer products based on alternative solutions such as ASIC, ASSP, microcontroller, analog, and Digital Signal Processing ("DSP") technologies. Competition from these semiconductor companies may intensify as we offer products in the Consumer end market. These competitors include established, multinational semiconductor companies as well as emerging companies. If we are unable to compete successfully in this environment, our future results may be adversely affected.
We depend upon a third party to provide inventory management, order fulfillment, and direct sales logistics and disruption of these services could adversely impact our business and results of operations.
We rely on a third party vendor to provide cost-effective and efficient supply chain services. Among other activities, these outsourced services relate to direct sales logistics, including order fulfillment, inventory management and warehousing, and distribution of inventory to third party distributors. If our third party supply chain partner were to discontinue services for us or its operations are disrupted as a result of a fire, earthquake, act of terrorism, political unrest, governmental uncertainty, war, disease or other natural disaster or catastrophic event, or any other reason, our ability to fulfill direct sales orders and distribute inventory timely, cost effectively, or at all, would be hindered, which could adversely affect our business.
We rely on independent software and hardware developers and disruption of these services could negatively affect our operations and financial results.
We rely on independent software and hardware developers for the design, development, supply and support of intellectual property cores, design and development software, and certain elements of evaluation boards. As a result, failure or significant delay to complete software or deliver hardware in accordance with our plans, specifications, and agreements could disrupt the release of or introduction of new or existing products, which could be detrimental to the capability of our new products to win designs. Any of these delays or inability to complete the design or development could have an adverse effect on our business, financial condition, or operating results.
We rely on information technology systems, and failure of these systems to function properly or our failure to control unauthorized access to our systems may cause business disruptions.
We rely in part on various information technology ("IT") systems to manage our operations, including financial reporting, and we regularly make changes to improve them as necessary. Consequently, we periodically implement new, or upgrade or enhance existing, operational and IT systems, procedures and controls. Any delay in the implementation of, or disruption in the transition to, new or enhanced systems, procedures or controls, could harm our ability to record and report financial and management information on a timely and accurate basis. These systems are also subject to power and telecommunication outages or other general system failures. Failure of our IT systems or difficulties in managing them could result in excessive cost or business disruption.
21
We may also be subject to unauthorized access to our IT systems through a security breach or attack. In the ordinary course of our business, we maintain sensitive data on our networks, including our intellectual property and proprietary or confidential business information relating to our business and that of our customers and business partners. The secure maintenance of this information is critical to our business and reputation. We believe that companies have been increasingly subject to a wide variety of security incidents, cyber-attacks and other attempts to gain unauthorized access. These threats can come from a variety of sources, ranging in sophistication from an individual hacker to a state-sponsored attack. Cyber threats may be generic, or they may be custom-crafted against our information systems. Over the past year, cyber-attacks have become more prevalent and much harder to detect and defend against. Our network and storage applications may be subject to unauthorized access by hackers or breached due to operator error, malfeasance or other system disruptions. It is often difficult to anticipate or immediately detect such incidents and to assess the damage caused by them.
We have implemented security procedures, such as virus protection software and emergency recovery processes, to address the potential risks. While we believe that our IT systems are appropriately controlled and that we have processes in place to adequately manage these risks, security procedures for information systems cannot be guaranteed to be failsafe. In the past third parties have attempted to penetrate and or infect our network and systems with malicious software in an effort to gain access to our network and systems. We seek to prevent, detect and investigate any security incidents and prevent their recurrence, but in some cases, we might be unaware of an incident or its magnitude and effects.
These data breaches and any unauthorized access or disclosure of our information or intellectual property could compromise our intellectual property and expose sensitive business information. Cyber-attacks could also cause us to incur significant remediation costs, result in product development delays, disrupt key business operations and divert attention of management and key information technology resources. Our reputation and business could be significantly harmed, and we could be subject to third party claims in the event of such a security breach.
We may have failed to adequately insure against certain risks, and, as a result, our financial condition and results may be adversely affected.
We carry insurance customary for companies in our industry, including, but not limited to, liability, property and casualty, workers' compensation and business interruption insurance. We also insure our employees for basic medical expenses. In addition, we have insurance contracts that provide director and officer liability coverage for our directors and officers. Other than the specific areas mentioned above, we are self-insured with respect to most other risks and exposures, and the insurance we carry in many cases is subject to a significant policy deductible or other limitation before coverage applies. Based on management's assessment and judgment, we have determined that it is more cost effective to self-insure against certain risks than to incur the insurance premium costs. The risks and exposures for which we self-insure include, but are not limited to, certain natural disasters, certain product defects, political risk, certain theft, patent infringement and employment practice matters. Should there be a catastrophic loss due to an uninsured event such as an earthquake or a loss due to adverse occurrences in any area in which we are self-insured, our financial condition or operating results could be adversely affected.
We compete with others to attract and retain key personnel, and any loss of, or inability to attract, such personnel would harm us.
We depend on the efforts and abilities of certain key members of management and other technical personnel. Our future success depends, in part, upon our ability to retain such personnel and attract and retain other highly qualified personnel, particularly product engineers. Competition for such personnel is intense and we may not be successful in hiring or retaining new or existing qualified personnel. From time to time we have effected restructurings which have eliminated a number of positions. Even if such personnel are not directly affected by the restructuring effort, such terminations can have a negative impact on morale and our ability to attract and hire new qualified personnel in the future. If we lose existing qualified personnel or are unable to hire new qualified personnel, as needed, our business, financial condition and results of operations could be seriously harmed.
The conflict minerals provisions of the Dodd-Frank Wall Street Reform and Consumer Protection Act could result in additional costs and liabilities.
As part of the Dodd-Frank Wall Street Reform and Consumer Protection Act, the Securities and Exchange Commission established new disclosure and reporting requirements for those companies who use "conflict" minerals mined from the Democratic Republic of Congo and adjoining countries in their products, whether or not these products are manufactured by third parties. As these new requirements are fully implemented, they could affect the sourcing and availability of minerals used in the manufacture of our semiconductor products. There are also costs associated with complying with the disclosure requirements, including for due diligence in regard to the sources of any conflict minerals used in our products, in addition to the cost of any required remediation and other changes to products, processes, or sources of supply as a consequence of such verification activities. Although we filed our first conflict minerals report in 2014, it may be several years before we can fully assess the internal and external cost of compliance of the effect the rules will have on our business.
22
None.
In November 2014, we sold the properties that contained our headquarters in Hillsboro, Oregon.
Our current corporate headquarters consists of 146,620 square feet of buildings we lease in Hillsboro, Oregon through March 2015. A 47,800 square foot portion of that property will continue to be leased for a research and development facility through November 2022. In March 2015, our corporate headquarters and executive office will move to a 23,680 square foot leased space in Portland, Oregon through March 2025. In Shanghai, China, we own an 18,869 square foot research and development facility and lease an additional 3,212 square foot research and development facility. We currently lease a 98,874 square foot research and development facility in San Jose, California through September 2026. In Alabang, Philippines, we lease a 17,114 square foot research and development facility through December 2016, an 8,648 square foot facility through May 2017, and a 2,933 square foot facility through April 2017. We lease a 5,296 square foot research and development facility in Bangalore, India through October 2016. We also lease office facilities in multiple metropolitan locations for our domestic and international sales staff. We believe that our existing facilities are suitable and adequate for our current and foreseeable future needs.
In November 2014, a patent infringement lawsuit was filed by Papst Licensing GmbH & Co., KG ("Papst") against us in the U.S. District Court for the District of Delaware. In the complaint, Papst alleges that certain of the simulator or simulation products sold by the Company may infringe one or more of the patents held by Papst. No discovery has been conducted with respect to these allegations. At this stage of the proceedings, Lattice does not have an estimate of the likelihood or the amount of any potential exposure to the Company. The Company believes that it possesses defenses to these claims and intends to vigorously defend this litigation. It is reasonably possible that the actual losses may exceed the accrued liabilities, however, and the Company currently cannot estimate such amount.
On or about January 29, 2015, Silicon Image, Inc., members of its Board, the Company and the Company’s wholly-owned merger acquisition subsidiary, were named as defendants in two complaints filed in Santa Clara Superior Court by alleged stockholders of Silicon Image in connection with the proposed merger of Silicon Image and the Company. Both complaints were dated January 29, 2015 and were captioned respectively
Molland v. George, et al
. and
Stein v. Silicon Image, Inc. et. al
. Five additional complaints were subsequently filed on January 30, 2015, February 4, 2015 and February 9, 2015 in Delaware Chancery Court by alleged stockholders of Silicon Image, Inc. in connection with the Merger, captioned respectively
Pfeiffer v. Martino et. al
.;
Lipinski v. Silicon Image, Inc. et. al
.;
Feldbaum et. al. v. Silicon Image, Inc. et. al; Nelson v. Silicon Image, Inc. et. al.
and
Partansky v. Silicon Image, Inc. et. al
. The five Delaware matters were subsequently consolidated into an action captioned
In re Silicon Image Stockholders Litigation
by order of the Delaware Chancery Court on February 11, 2015, and a consolidated amended complaint was filed in the matter on February 13, 2015. Two complaints captioned
Tapia v. Silicon Image, Inc. et. al.
and
Caldwel v. Silicon Image, Inc.
were also filed on February 4, 2015 and February 9, 2015 in Santa Clara Superior Court by alleged stockholders in connection with the Merger. Amended complaints were filed in the
Molland
and
Stein
actions on February 11, 2015.
Each of these lawsuits are purported class actions brought on behalf of Silicon Image stockholders, asserting claims against each member of the Board for breach of fiduciary duty, and against various of the Silicon Image, Silicon Image’s Board, the Company, and the Company’s wholly-owned merger subsidiary for aiding and abetting breach of fiduciary duty. The lawsuits allege that the Merger does not appropriately value Silicon Image, was the result of an inadequate process, and includes preclusive deal devices. The amended complaints also assert that the Silicon Image’s disclosures regarding the Merger in its Schedule 14D-9 omitted material information regarding the Merger. Each of these complaints purport to seek unspecified damages and may seek injunctive relief preventing consummation of the transactions.
The Company believes that the claims in these complaints are without merit and intends to vigorously defend this litigation.
An adverse judgment for monetary damages could have an adverse effect on the operations of the Company. A preliminary injunction could delay or jeopardize the completion of the Merger, and an adverse judgment granting permanent injunctive relief could indefinitely enjoin completion of the Merger.
We are also exposed to certain other asserted and unasserted potential claims. There can be no assurance that, with respect to potential claims made against us, we could resolve such claims under terms and conditions that would not have a material adverse effect on our business, our liquidity or our financial results. Periodically, we review the status of each significant matter and assess its potential financial exposure. If the potential loss from any claim or legal proceeding is considered probable and a range of possible losses can be estimated, we then accrue a liability for the estimated loss based on the provisions of Financial Accounting Standards Board (“FASB”) Accounting Standards Codification (“ASC”) 450, “Contingencies" (“ASC 450”). Legal proceedings are subject to uncertainties, and the outcomes are difficult to predict. Because of such uncertainties, accruals are based only on the best information available at the time. As additional information becomes available, we reassess the potential
23
liability related to pending claims and litigation and may revise estimates. Presently, no accrual has been estimated under ASC 450 for potential losses that may or may not arise from the current lawsuits in which we are involved.
Not applicable.
24
Market Information
Our common stock is traded on the NASDAQ Global Select Market under the symbol "LSCC". The following table sets forth the low and high intraday sale prices for our common stock for the last two fiscal years, as reported by NASDAQ.
|
Low
|
High
|
||||||
|
2014:
|
|||||||
|
First Quarter
|
$
|
5.30
|
|
$
|
8.00
|
|
|
|
Second Quarter
|
7.37
|
|
9.19
|
|
|||
|
Third Quarter
|
6.03
|
|
8.50
|
|
|||
|
Fourth Quarter
|
5.94
|
|
7.66
|
|
|||
|
2013:
|
|||||||
|
First Quarter
|
$
|
3.82
|
|
$
|
5.71
|
|
|
|
Second Quarter
|
4.50
|
|
5.50
|
|
|||
|
Third Quarter
|
4.44
|
|
5.44
|
|
|||
|
Fourth Quarter
|
4.17
|
|
5.77
|
|
|||
Holders
As of
February 26, 2015
, we had approximately 280 stockholders of record.
Dividends
The payment of dividends on our common stock is within the discretion of our Board of Directors. We intend to retain earnings to finance the growth of our business. We have never paid cash dividends.
Recent Sales of Unregistered Securities (most recent quarter only)
None.
Issuer Purchases of Equity Securities (most recent quarter only)
|
Period
|
Total Number of Shares Purchased
|
Average Price paid Per Share
|
Total Number of Shares Purchased as Part of Publicly Announced Program
|
Maximum Dollar Value of Shares That May Yet Be Purchased Under the Program
|
|||||||||
|
September 28, 2014 through October 25, 2014
|
499,881
|
|
$
|
6.80
|
|
499,881
|
|
$
|
14,900,415
|
|
|||
|
October 26, 2014 through November 22, 2014
|
519,079
|
|
$
|
6.55
|
|
519,079
|
|
$
|
11,500,011
|
|
|||
|
November 23, 2014 through January 3, 2015
|
697,771
|
|
$
|
6.58
|
|
697,771
|
|
$
|
6,910,069
|
|
|||
|
1,716,731
|
|
$
|
6.63
|
|
1,716,731
|
|
|||||||
On
March 3, 2014
, our Board of Directors approved a stock repurchase program pursuant to which up to $20.0 million of outstanding common stock may be repurchased from time to time. The duration of the repurchase program is twelve months. Under this program during fiscal
2014
, approximately
1.9 million
shares were repurchased for
$13.1 million
. At
January 3, 2015
,
25
we had approximately
$6.9 million
remaining under the approved program. The 2014 program was completed during February 2015 for the approved amount.
Comparison of Total Cumulative Stockholder Return
The following graph shows the five-year comparison of cumulative stockholder return on our common stock, the Standard and Poor's (“S&P”) 500 Index and the Philadelphia Semiconductor Index (“PHLX”) from December 2009 through December 2014. Cumulative stockholder return assumes $100 invested at the beginning of the period in our common stock, the S&P and PHLX. Historical stock price performance is not necessarily indicative of future stock price performance.
Lattice Cumulative Stockholder Return
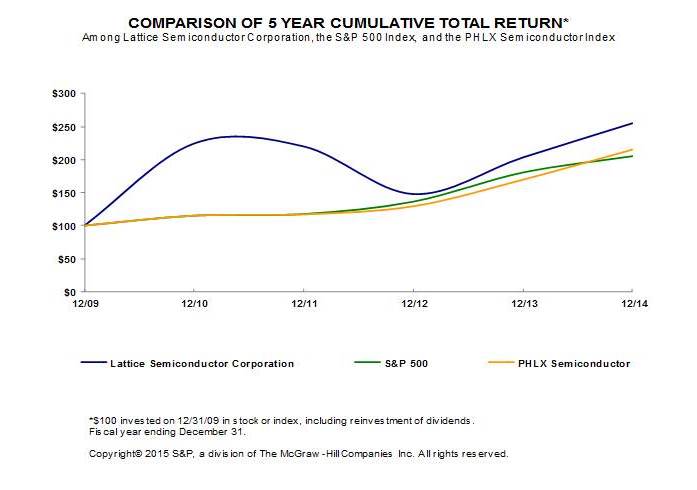
26
|
Year Ended*
|
|||||||||||||||||||
|
(In thousands)
|
January 3,
2015 |
December 28,
2013 |
December 29,
2012 |
December 31,
2011 |
January 1,
2011 |
||||||||||||||
|
STATEMENT OF OPERATIONS:
|
|||||||||||||||||||
|
Revenue
|
$
|
366,127
|
|
$
|
332,525
|
|
$
|
279,256
|
|
$
|
318,366
|
|
$
|
297,768
|
|
||||
|
Costs and expenses:
|
|||||||||||||||||||
|
Cost of products sold
|
159,940
|
|
154,281
|
|
128,499
|
|
129,769
|
|
117,943
|
|
|||||||||
|
Research and development
|
88,079
|
|
80,966
|
|
77,610
|
|
71,855
|
|
60,326
|
|
|||||||||
|
Selling, general and administrative
|
73,527
|
|
67,144
|
|
72,317
|
|
68,838
|
|
64,359
|
|
|||||||||
|
Acquisition related charges, including amortization of intangible assets
|
2,948
|
|
2,960
|
|
4,178
|
|
536
|
|
—
|
|
|||||||||
|
Restructuring charges
|
17
|
|
388
|
|
6,018
|
|
6,079
|
|
11
|
|
|||||||||
|
324,511
|
|
305,739
|
|
288,622
|
|
277,077
|
|
242,639
|
|
||||||||||
|
Income (loss) from operations
|
41,616
|
|
26,786
|
|
(9,366
|
)
|
41,289
|
|
55,129
|
|
|||||||||
|
Other income (expense), net
|
1,325
|
|
(300
|
)
|
505
|
|
1,434
|
|
2,474
|
|
|||||||||
|
Income (loss) before taxes
|
42,941
|
|
26,486
|
|
(8,861
|
)
|
42,723
|
|
57,603
|
|
|||||||||
|
(Benefit) provision for income taxes
|
(5,639
|
)
|
4,165
|
|
20,745
|
|
(35,509
|
)
|
531
|
|
|||||||||
|
Net income (loss)
|
$
|
48,580
|
|
$
|
22,321
|
|
$
|
(29,606
|
)
|
$
|
78,232
|
|
$
|
57,072
|
|
||||
|
Basic net income (loss) per share
|
$
|
0.41
|
|
$
|
0.19
|
|
$
|
(0.25
|
)
|
$
|
0.66
|
|
$
|
0.49
|
|
||||
|
Diluted net income (loss) per share
|
$
|
0.40
|
|
$
|
0.19
|
|
$
|
(0.25
|
)
|
$
|
0.65
|
|
$
|
0.48
|
|
||||
|
Shares used in per share calculations:
|
|||||||||||||||||||
|
Basic
|
117,708
|
|
115,701
|
|
117,194
|
|
117,875
|
|
116,726
|
|
|||||||||
|
Diluted
|
120,245
|
|
117,081
|
|
117,194
|
|
121,139
|
|
120,143
|
|
|||||||||
|
At
|
|||||||||||||||||||
|
(In thousands)
|
January 3,
2015 |
December 28,
2013 |
December 29,
2012 |
December 31,
2011 |
January 1,
2011 |
||||||||||||||
|
BALANCE SHEET:
|
|||||||||||||||||||
|
Cash, cash equivalents and short-term marketable securities
|
$
|
254,844
|
|
$
|
215,815
|
|
$
|
183,401
|
|
$
|
210,134
|
|
$
|
238,220
|
|
||||
|
Total assets
|
$
|
510,530
|
|
$
|
447,876
|
|
$
|
414,619
|
|
$
|
453,784
|
|
$
|
377,687
|
|
||||
|
Long term liabilities
|
$
|
8,809
|
|
$
|
3,588
|
|
$
|
3,976
|
|
$
|
8,247
|
|
$
|
4,625
|
|
||||
|
Total liabilities
|
$
|
69,555
|
|
$
|
62,196
|
|
$
|
57,069
|
|
$
|
60,223
|
|
$
|
58,965
|
|
||||
|
Total stockholders' equity
|
$
|
440,975
|
|
$
|
385,680
|
|
$
|
357,550
|
|
$
|
393,561
|
|
$
|
318,722
|
|
||||
* The year ended January 3, 2015 was a 53-week year as compared to the prior years which were based on our standard 52-week year.
27
Overview
Lattice Semiconductor Corporation (“Lattice,” the “Company,” “we,” “us,” or “our”) designs, develops and markets high performance programmable logic products and related software. Programmable logic products are widely used semiconductor components that can be configured by end customers as specific logic circuits, enabling shorter design cycle times and reduced development costs. Our end customers are primarily original equipment manufacturers ("OEMs") in the Communications, Consumer, and Industrial end markets. There are two main categories of programmable logic devices (“PLDs”): field programmable gate arrays (“FPGAs”) and complex programmable logic devices (“CPLDs”), each representing distinctly different silicon architectural approaches. Products based on these two alternative programmable logic architectures are generally optimal for different types of logic functions, although many logic functions can be implemented using either architecture. We believe that a substantial portion of programmable logic customers utilize both CPLD and FPGA architectures.
Critical Accounting Policies and Estimates
Critical accounting policies are those that are both most important to the portrayal of a company's financial condition and results, and require management's most difficult, subjective and complex judgments, often as a result of the need to make estimates about the effect of matters that are inherently uncertain. A description of our critical accounting policies follows.
Use of Estimates
The preparation of financial statements in conformity with U.S. generally accepted accounting principles ("GAAP") requires management to make estimates and assumptions that affect the reported amounts and classification of assets, such as marketable securities, accounts receivable, inventory, auction rate securities, goodwill (including the assessment of reporting unit), intangible assets, current and deferred income taxes, accrued liabilities (including restructuring charges and bonus arrangements), deferred income and allowances on sales to sell-through distributors, disclosure of contingent assets at the date of the financial statements and the reported amounts of revenue and expenses during the fiscal periods presented. Actual results could differ from those estimates.
Revenue Recognition and Deferred Income
We sell our products directly to end customers or through a network of independent manufacturers' representatives and indirectly through a network of independent sell-in and sell-through distributors. Distributors provide periodic data regarding the product, price, quantity, and end customer when products are resold, as well as the quantities of our products they still have in stock.
Revenue from sales to OEMs and sell-in distributors is recognized upon shipment. Revenue from sales by our sell-through distributors is recognized at the time of reported resale. Under both types of revenue recognition, persuasive evidence of an arrangement exists, the price is fixed or determinable, title has transferred, collection of resulting receivables is reasonably assured, and there are no remaining customer acceptance requirements and no remaining significant performance obligations. Revenue and Cost of products sold are presented net of taxes collected on behalf of government authorities.
Orders from our sell-through distributors are initially recorded at published list prices; however, for a majority of our sales, the final selling price is determined at the time of resale and in accordance with a distributor price agreement. In certain circumstances, we allow sell-through distributors to return unsold products. At times, we protect our sell-through distributors against reductions in published list prices. For these reasons, we do not recognize revenue until products are resold by sell-through distributors to an end customer.
For sell-through distributors, at the time of shipment to distributors, we (a) record Accounts receivable at published list price since there is a legally enforceable obligation from the distributor to pay us currently for product delivered, (b) relieve inventory for the carrying value of goods shipped since legal title has passed to the distributor, and (c) record deferred revenue and deferred cost of sales in Deferred income and allowances on sales to sell-through distributors in the liability section of our Consolidated Balance Sheets. The final price is set at the time of resale and is determined in accordance with a distributor price agreement. Revenue and cost of products sold to sell-through distributors are deferred until either the product is resold by the distributor or, in certain cases, return privileges terminate, at which time Revenue and Cost of products sold are reflected in Net income (loss), and Accounts receivable are adjusted to reflect the final selling price.
28
We must use estimates and apply judgment to reconcile sell-through distributors' reported inventories to their activities. Errors in our estimates or judgments could result in inaccurate reporting of our Revenue, Cost of products sold, Deferred income and allowances on sales to sell-through distributors, and Net income (loss).
Fair Value of Financial Instruments
We invest in various financial instruments including corporate and government bonds, notes, and commercial paper. We were also invested in auction rate securities until June 2014. We value these instruments at their fair value and monitor our portfolio for impairment on a periodic basis. In the event that the carrying value of an investment exceeds its fair value and the decline in value is determined to be other than temporary, we record an impairment charge and establish a new carrying value. We assess other-than-temporary impairment of marketable securities in accordance with Financial Accounting Standards Board (“FASB”) Accounting Standards Codification (“ASC”) 820, “Fair Value Measurements and Disclosures.” The framework under the provisions of ASC 820 establishes three levels of inputs that may be used to measure fair value. Each level of input has different levels of subjectivity and difficulty involved in determining fair value.
Level 1
instruments are characterized generally by quoted prices for identical assets or liabilities in active markets. Therefore, determining fair value for Level 1 instruments generally does not require significant management judgment, and the estimation is not difficult.
Level 2
instruments include inputs other than Level 1 that are observable, either directly or indirectly, such as quoted prices for similar assets or liabilities; quoted prices for identical instruments in markets that are not active; or other inputs that are observable or can be corroborated by observable market data for substantially the full term of the assets or liabilities.
Level 3
instruments include unobservable inputs that are supported by little or no market activity and that are significant to the fair value of the assets or liabilities. Our auction rate securities were classified as Level 3 instruments. Management used a combination of the market and income approach to derive the fair value of auction rate securities, which included third party valuation results, investment broker provided market information and available information on the credit quality of the underlying collateral. As a result, the determination of fair value for Level 3 instruments requires significant management judgment and subjectivity. Our Level 3 instruments were classified as Long-term marketable securities on our Consolidated Balance Sheets and were entirely made up of auction rate securities that consisted of student loan asset-backed notes. During fiscal 2014 we sold all of our Level 3 instruments, which consisted entirely of auction rate securities.
Inventory
Inventories are recorded at the lower of actual cost determined on a first-in-first-out basis or market. We establish provisions for inventory if it is obsolete or we hold quantities which are in excess of projected customer demand. The creation of such provisions results in a write-down of inventory to net realizable value and a charge to cost of products sold.
Asset Impairments
Long-lived assets, including amortizable intangible assets, are carried on our financial statements based on their cost less accumulated depreciation or amortization. We monitor the carrying value of our long-lived assets for potential impairment and test the recoverability of such assets whenever events or changes in circumstances indicate that their carrying amounts may not be recoverable. These events or changes in circumstances, including management decisions pertaining to such assets, are referred to as impairment indicators. If an impairment indicator occurs, we perform a test of recoverability by comparing the carrying value of the asset group to its undiscounted expected future cash flows. If the carrying values are in excess of undiscounted expected future cash flows, we measure any impairment by comparing the fair value of the asset group to its carrying value. Fair value is generally determined by considering (i) internally developed discounted projected cash flow analysis of the asset group; (ii) actual third-party valuations; and/or (iii) information available regarding the current market for similar asset groups. If the fair value of the asset group is determined to be less than the carrying amount of the asset group, an impairment in the amount of the difference is recorded in the period that the impairment indicator occurs and is included in our Consolidated Statement of Operations. Estimating future cash flows requires significant judgment and projections may vary from the cash flows eventually realized, which could impact our ability to accurately assess whether an asset has been impaired. No impairment charges were recorded for the fiscal year ended
2014
.
Valuation of Goodwill
Goodwill is an asset representing the future economic benefits arising from other assets acquired in a business combination that are not individually identified and separately recognized. We review goodwill for impairment annually during the fourth quarter and whenever events or changes in circumstances indicate the carrying value of goodwill may not be recoverable. When evaluating whether goodwill is impaired, we make a qualitative assessment to determine if it is more likely than not that the fair value is less than the carrying amount. If the qualitative assessment determines that it is more likely than not that the fair value is less than the carrying amount, the fair value of the reporting unit is compared with its carrying value (including goodwill). If the
29
fair value of the reporting unit is less than its carrying value, an indication of goodwill impairment exists for the reporting unit and we must measure the impairment loss. The impairment loss, if any, is recognized for any excess of the carrying amount of the reporting unit's goodwill over the implied fair value of the goodwill. The implied fair value of goodwill is determined by allocating the fair value of the reporting unit in a manner similar to purchase price allocation and the residual fair value after this allocation is the implied fair value of the reporting unit goodwill. Fair value of the reporting unit is determined using a discounted cash flow analysis. If the fair value of the reporting unit exceeds its carrying value, no further impairment analysis is needed. For purposes of testing goodwill for impairment, the Company operates as a single reporting unit. No goodwill impairment charges were recorded for the fiscal year ended
2014
.
Restructuring Charges
Expenses associated with exit or disposal activities are recognized when incurred under ASC 420, “Exit or Disposal Cost Obligations” for everything but severance. However, because we have a history of paying severance benefits, the cost of severance benefits associated with a restructuring charge is recorded when such costs are probable and the amount can be reasonably estimated in accordance with ASC 712, “Compensation - Nonretirement Postemployment Benefits.” When leased facilities are vacated, an amount equal to the total future lease obligations from the date of vacating the premises through the expiration of the lease, net of estimated sublease income, is recorded as a part of restructuring charges.
Accounting for Income Taxes
Our provision for income tax is comprised of our current tax liability and changes in deferred tax assets and liabilities. Deferred tax assets and liabilities are recognized for the expected tax consequences of temporary differences between the tax bases of assets and liabilities and their reported amounts in the financial statements using enacted tax rates and laws that will be in effect when the difference is expected to reverse. Valuation allowances are provided to reduce deferred tax assets to an amount that in management’s judgment is more-likely-than-not to be recoverable against future taxable income. At
January 3, 2015
, U.S. income taxes were not provided on approximately
$3.3 million
of the undistributed earnings of our Chinese subsidiary. We intend to reinvest these earnings indefinitely. If these earnings were distributed to the U.S. in the form of dividends or otherwise, we would be subject to additional U.S. income taxes.
Our income tax calculations are based on application of the respective U.S. federal, state or foreign tax law. Our tax filings, however, are subject to audit by the relevant tax authorities. Accordingly, we recognize tax liabilities based upon our estimate of whether, and the extent to which, additional taxes will be due when such estimates are more-likely-than-not to be sustained. An uncertain income tax position will not be recognized if it has less than a 50% likelihood of being sustained. To the extent the final tax liabilities are different than the amounts originally accrued, the increases or decreases are recorded as income tax expense or benefit in the Consolidated Statements of Operations.
In assessing the realizability of deferred tax assets, we evaluate both positive and negative evidence that may exist and consider whether it is more-likely-than-not that some portion or all of the deferred tax assets will be realized. The ultimate realization of deferred tax assets is dependent upon the generation of future taxable income during the periods in which those temporary differences become deductible.
Any adjustment to the net deferred tax asset valuation allowance is recorded in the Consolidated Statements of Operations in the period that the adjustment is determined to be required.
Stock-Based Compensation
We use the Black-Scholes option pricing model to estimate the fair value of substantially all share-based awards consistent with the provisions of ASC 718, “Compensation - Stock Compensation.” Option pricing models, including the Black-Scholes model, require the use of input assumptions, including expected volatility, expected term, expected dividend rate, and expected risk-free rate of return. The assumptions for expected volatility and expected term most significantly affect the grant date fair value.
30
Results of operations
Key elements of our Consolidated Statements of Operations were as follows:
|
Year Ended*
|
||||||||||||||||||||
|
(In thousands)
|
January 3, 2015
|
December 28, 2013
|
December 29, 2012
|
|||||||||||||||||
|
Revenue
|
$
|
366,127
|
|
100.0
|
%
|
$
|
332,525
|
|
100.0
|
%
|
$
|
279,256
|
|
100.0
|
%
|
|||||
|
Gross margin
|
206,187
|
|
56.3
|
|
178,244
|
|
53.6
|
|
150,757
|
|
54.0
|
|
||||||||
|
Research and development
|
88,079
|
|
24.1
|
|
80,966
|
|
24.3
|
|
77,610
|
|
27.8
|
|
||||||||
|
Selling, general and administrative
|
73,527
|
|
20.1
|
|
67,144
|
|
20.2
|
|
72,317
|
|
25.9
|
|
||||||||
|
Acquisition related charges, including amortization of intangible assets
|
2,948
|
|
0.7
|
|
2,960
|
|
0.9
|
|
4,178
|
|
1.5
|
|
||||||||
|
Restructuring charges
|
17
|
|
—
|
|
388
|
|
0.1
|
|
6,018
|
|
2.2
|
|
||||||||
|
Income (loss) from operations
|
$
|
41,616
|
|
11.4
|
%
|
$
|
26,786
|
|
8.1
|
%
|
$
|
(9,366
|
)
|
(3.4
|
)%
|
|||||
* The year ended January 3, 2015 was a 53-week year as compared to the prior years which were based on our standard 52-week year.
Revenue
|
|
Year Ended
|
% Change in
|
|||||||||||||
|
(In thousands)
|
January 3, 2015
|
December 28, 2013
|
December 29, 2012
|
2014
|
2013
|
||||||||||
|
Revenue
|
$
|
366,127
|
|
$
|
332,525
|
|
$
|
279,256
|
|
10
|
19
|
||||
Revenue increased
$33.6 million
, or
10%
, in fiscal 2014 compared to fiscal 2013, primarily driven by volume increases in certain of our ECP3 products in the Communications end market, largely in continued support of the Chinese telecommunications infrastructure build out which began in 2013. Stronger demand in the second half of 2014 from the Industrial end market also contributed to the increase in revenue. These increases were partially offset by lower demand for certain of our iCE40 products at a major OEM in the Consumer end market.
One Consumer end market customer, Samsung Electronics Co., Ltd., accounted for
19%
of total revenue in 2014 and
22%
of revenue in 2013. Additionally, one Communications end market customer, Huawei Technologies Co. Ltd., accounted for
12%
of total revenue in 2014. No other individual end customers accounted for more than 10% of total revenue in any of the fiscal years 2014, 2013 or 2012.
Revenue increased $53.3 million, or 19%, in fiscal 2013 compared to fiscal 2012, primarily driven by volume increases in our iCE40 product line, which was led by increased revenue from a major OEM in the Consumer end market and certain of our ECP3 products in the Communications end market. These increases were partially offset by reduced volume of end-of-life mature products, relatively weak macroeconomic factors, and a migration to our newer technologies affecting the Industrial end markets.
31
Revenue by End Market
The following end market data is derived from data that is provided to us by our distributors and end customers. With a diverse base of customers who in some cases manufacture end products spanning multiple end markets, the assignment of revenue to a specific end market requires the use of estimates and judgment. Therefore, actual results may differ from those reported.
The composition of our revenue by end market for fiscal years 2014, 2013 and 2012 was as follows:
|
|
Year Ended
|
% Change in
|
|||||||||||||||||||||||||
|
(In thousands)
|
January 3, 2015
|
December 28, 2013
|
December 29, 2012
|
2014
|
2013
|
||||||||||||||||||||||
|
Communications
|
$
|
153,167
|
|
42
|
%
|
$
|
126,566
|
|
38
|
%
|
$
|
116,668
|
|
42
|
%
|
21
|
|
8
|
|
||||||||
|
Consumer
|
91,813
|
|
25
|
|
99,569
|
|
30
|
|
35,612
|
|
13
|
|
(8
|
)
|
180
|
|
|||||||||||
|
Industrial
|
121,147
|
|
33
|
|
$
|
106,390
|
|
32
|
|
126,976
|
|
45
|
|
14
|
|
(16
|
)
|
||||||||||
|
Total revenue
|
$
|
366,127
|
|
100
|
%
|
$
|
332,525
|
|
100
|
%
|
$
|
279,256
|
|
100
|
%
|
10
|
|
19
|
|
||||||||
Our revenue in the Communications end market is largely dependent on a small number of large telecommunications equipment providers. For fiscal 2014, Communications end market revenue increased
21%
primarily driven by demand to support the telecommunications infrastructure build out in China, largely in the first half of 2014. Revenue in the Communications end market increased 8% when comparing fiscal 2013 to fiscal 2012, also driven by demand related to the telecommunications infrastructure build out in China.
Consumer end market revenue decreased
8%
in fiscal 2014, after increasing
180%
in fiscal 2013. Consumer end market revenue decreased primarily due to lower demand at a major OEM for certain of our iCE40 products. Consumer end market revenue increased in fiscal 2013 due in large part to the strong volume growth of our iCE40 product at a major OEM.
For fiscal 2014, Industrial end market revenue increased
14%
when compared to fiscal 2013. This increase was primarily due to broad market strengthening in the second half of fiscal 2014, largely in Europe and Japan. For fiscal 2013, revenue decreased
16%
when compared to fiscal 2012. This decline was primarily due to reduced sales volume of end-of-life mature products.
Revenue by Product Classification
The composition of our revenue by product classification for fiscal years 2014, 2013 and 2012 was as follows:
|
|
Year Ended
|
% Change in
|
||||||||||||||||||||||||
|
(In thousands)
|
January 3, 2015
|
December 28, 2013
|
December 29, 2012
|
2014
|
2013
|
|||||||||||||||||||||
|
New *
|
$
|
177,087
|
|
48
|
%
|
$
|
152,161
|
|
46
|
%
|
$
|
62,304
|
|
22
|
%
|
16
|
144
|
|
||||||||
|
Mainstream *
|
141,074
|
|
39
|
|
135,243
|
|
41
|
|
154,733
|
|
56
|
|
4
|
(13
|
)
|
|||||||||||
|
Mature *
|
47,966
|
|
13
|
|
45,121
|
|
13
|
|
62,219
|
|
22
|
|
6
|
(27
|
)
|
|||||||||||
|
Total revenue
|
$
|
366,127
|
|
100
|
%
|
$
|
332,525
|
|
100
|
%
|
$
|
279,256
|
|
100
|
%
|
10
|
19
|
|
||||||||
Revenue for New products increased
16%
in fiscal 2014, while r
evenue for New products increased
144%
in fiscal 2013.
In both years, New product revenue increased primarily due to strong volume ramping of certain New products, principally to customers in the Communications end markets. In 2014, this volume ramping occurred primarily in the first half of the year.
Revenue for Mainstream products increased 4%
in fiscal 2014 when
compared to fiscal 2013. The increase in Mainstream revenue was primarily due to improving macroeconomic conditions and increased demand from the Communications end market in the first half of 2014 and the Industrial end market in the second half of 2014. Revenue for Mainstream products decreased
13% in fiscal 2013.
Mainstream product revenue declined in fiscal 2013 due primarily to macroeconomic factors affecting the Industrial end markets as well as reduced volumes as customers migrated to newer technology.
Mature product revenue increased
6% in fiscal 2014 when compared to fiscal 2013, primarily due to an increase in
the sales volume of late life-cycle products in the fourth quarter of 2014
. Mature product revenue decreased 27% in fiscal 2013 when
compared to fiscal 2012. Mature product revenue decreased in fiscal 2013 when compared to fiscal 2012 primarily due to lower sales volumes as customers migrated to our newer technology.
|
* Product Classifications:
|
|
|
New:
|
LatticeECP5, MachXO3, LatticeECP3, MachXO2, Power Manager II, and iCE40
|
|
Mainstream:
|
ispMACH4000ZE, ispMACH 4000/Z, LatticeSC, LatticeECP2/M, LatticeXP2, MachXO, ispClock A/D/S, Software and IP
|
|
Mature:
|
ispXPLD, ispXPGA, FPSC, ORCA 2, ORCA 3, ORCA 4, ispPAC, ispLSI 8000V, ispMACH 5000B, ispMACH 2LV, ispMACH 5LV, ispLSI 2000V, ispLSI 5000V, ispMACH 5000VG, all 5-volt CPLDs, ispGDX2, GDX/V, ispMACH 4/LV, iCE65, ispClock, Power Manager I, all SPLDs, LatticeECP, LatticeXP
|
32
* Product categories are modified as appropriate relative to our portfolio of products and the generation within each major product family. New products consist of our latest generation of products, while Mainstream and Mature are older or based on unique late stage customer-based production needs. Generally, product categories are adjusted every two to three years, at which time prior periods are reclassified to conform to the new categorization. In the first fiscal quarter of 2014 we reclassified our New, Mainstream and Mature product categories to better reflect our current product portfolio.
Revenue by Geography
We assign revenue to geographies based on customer ship-to address at the point where revenue is recognized. In the case of sell-in distributors and OEM customers, revenue is typically recognized, and geography is assigned, when products are shipped. In the case of sell-through distributors, revenue is recognized when resale to the end customer occurs and geography is assigned based on the end customer location on the resale reports provided by the distributor. Both foreign and domestic sales are denominated in U.S. dollars, with the exception of sales in Japan, where sales to certain customers are denominated in yen.
The composition of our revenue by geography, based on ship-to location, is as follows:
|
|
Year Ended
|
% Change in
|
||||||||||||||||||||||||
|
(In thousands)
|
January 3, 2015
|
December 28, 2013
|
December 29, 2012
|
2014
|
2013
|
|||||||||||||||||||||
|
Asia
|
$
|
266,831
|
|
73
|
%
|
$
|
245,689
|
|
74
|
%
|
$
|
189,811
|
|
68
|
%
|
9
|
29
|
|
||||||||
|
Europe
|
59,041
|
|
16
|
|
47,459
|
|
14
|
|
48,202
|
|
17
|
|
24
|
(2
|
)
|
|||||||||||
|
Americas
|
40,255
|
|
11
|
|
39,377
|
|
12
|
|
41,243
|
|
15
|
|
2
|
(5
|
)
|
|||||||||||
|
Total revenue
|
$
|
366,127
|
|
100
|
%
|
$
|
332,525
|
|
100
|
%
|
$
|
279,256
|
|
100
|
%
|
10
|
19
|
|
||||||||
Revenue increased 9% in Asia in fiscal 2014 and 29% in fiscal 2013. In both years, revenue growth in Asia was due primarily to strong volume growth of New products in the Communications end markets, driven largely by demand to support the telecommunications infrastructure build out in China in the first half of 2014. Additionally in 2013, we saw additional growth in Asia coming from the Consumer end market. We believe the Asia Pacific region will remain the primary source of our revenue due to relatively more favorable business conditions in Asia and a continuing trend towards the migration of manufacturing by North American and European customers to the Asia Pacific region.
Revenue increased 24% in Europe in fiscal 2014 on generally improving macroeconomic conditions and increased demand from customers in the Industrial and Communications end markets.
Americas revenue increased 2% in fiscal 2014 due to increased sales volumes of late life-cycle products in the Industrial end market, largely in the fourth quarter of 2014. Revenue from Americas decreased 5% in fiscal 2013, due largely to macroeconomic weakness in the region.
Revenue from foreign sales as a percentage of total revenue was 92%, 91%, and 88% for fiscal 2014, 2013 and 2012, respectively.
Revenue by Distributors
Our largest customers are often distributors and sales through distributors have historically made up a significant portion of our total revenue. Revenue attributable to the resale of products by our primary sell-through distributors was as follows:
|
% of Total Revenue
|
||||||||
|
2014
|
2013
|
2012
|
||||||
|
Arrow Electronics Inc. (including Nu Horizons Electronics)
|
24
|
%
|
23
|
%
|
28
|
%
|
||
|
Weikeng Group
|
10
|
|
12
|
|
12
|
|
||
|
All others
|
11
|
|
10
|
|
15
|
|
||
|
All sell-through distributors
|
45
|
%
|
45
|
%
|
55
|
%
|
||
Revenue from sell-through distributors as a percent of total revenue was flat in fiscal 2014 as compared to 2013. Revenue from sell-through distributors as a percent of total revenue declined in fiscal 2013 due primarily to increased sales to OEM customers.
33
Gross Margin
The composition of our gross margin, including as a percentage of revenue, for fiscal years 2014, 2013 and 2012 was as follows:
|
Year Ended
|
||||||||||||
|
(In thousands)
|
January 3, 2015
|
December 28, 2013
|
December 29, 2012
|
|||||||||
|
Gross margin
|
$
|
206,187
|
|
$
|
178,244
|
|
$
|
150,757
|
|
|||
|
Percentage of revenue
|
56.3
|
%
|
53.6
|
%
|
54.0
|
%
|
||||||
In fiscal 2014, gross margin, as a percentage of revenue, increased 2.7 percentage points as compared to fiscal 2013. Product cost improvements, driven by high volume manufacturing and strategic inventory builds in the first half of the year, combined to improve our gross margin in fiscal 2014. Those product cost improvements were partially offset, however, by less favorable product and customer mix resulting from increased revenue from New products in both the Consumer and Communications end markets. Less sell-through of fully reserved inventory and, to a lesser extent, increased expense from excess and obsolete inventory also degraded our gross margin in fiscal 2014. We expect that product and customer mix as well as downward pressure on average selling price will continue to affect our gross margin in the future. If we are unable to realize additional or sufficient product cost reductions in the future, we may experience degradation in our gross margin.
In fiscal 2013, gross margin, as a percentage of revenue, decreased 0.4 percentage points as compared to fiscal 2012. Less favorable product and customer mix combined to reduce our gross margins during 2013. The adverse effect of the mix driven margin decline in 2013 was substantially offset by product cost improvements, reduced expense from excess and obsolete inventory and, to a lesser extent, more sell-through of fully reserved inventory.
Operating Expenses
Research and development expense
The composition of our research and development expenses, including as a percentage of revenue, for fiscal years 2014, 2013 and 2012 was as follows:
|
Year Ended
|
% Change in
|
|||||||||||||||||
|
(In thousands)
|
January 3,
2015 |
December 28,
2013 |
December 29,
2012 |
2014
|
2013
|
|||||||||||||
|
Research and development
|
$
|
88,079
|
|
$
|
80,966
|
|
$
|
77,610
|
|
8.8
|
%
|
4.3
|
%
|
|||||
|
Percentage of revenue
|
24.1
|
%
|
24.3
|
%
|
27.8
|
%
|
||||||||||||
|
Mask costs included in Research and development
|
$2,877
|
$2,381
|
$1,882
|
20.8
|
%
|
26.5
|
%
|
|||||||||||
Research and development expenses include costs for compensation and benefits, development masks, engineering wafers, depreciation, licenses, and outside engineering services. These expenditures are for the design of new products, intellectual property cores, processes, packaging, and software to support new products.
We believe that a continued commitment to research and development is essential to maintain product leadership and provide innovative new product offerings, and therefore we expect to continue to make significant future investments in research and development.
The increase in expense in fiscal 2014, compared to fiscal 2013, was primarily due to project-based outside engineering services, variable compensation and amortization costs, and increased engineering mask costs, with approximately 10% of these increases offset by lower facility costs.
The increase in expense in fiscal 2013, compared to fiscal 2012, was primarily due to increased variable compensation, facility costs and mask costs. More than 60% of these increases were offset by lower compensation expense, a reduction in depreciation, and reduced use of outside engineering services.
34
Selling, general, and administrative expense
The composition of our selling, general and administrative expenses, including as a percentage of revenue, for fiscal years 2014, 2013 and 2012 was as follows:
|
Year Ended
|
% Change in
|
|||||||||||||||||
|
(In thousands)
|
January 3,
2015 |
December 28,
2013 |
December 29,
2012 |
2014
|
2013
|
|||||||||||||
|
Selling, general and administrative
|
$
|
73,527
|
|
$
|
67,144
|
|
$
|
72,317
|
|
9.5
|
%
|
(7.2
|
)%
|
|||||
|
Percentage of revenue
|
20.1
|
%
|
20.2
|
%
|
25.9
|
%
|
||||||||||||
Selling, general, and administrative expenses include costs for compensation and benefits related to selling, general, and administrative employees, commissions, depreciation, professional services and travel expenses.
The increase in expense in fiscal 2014 compared to fiscal 2013 was primarily due to increases in commissions as a result of improved revenue, increased stock compensation expense largely driven by performance based awards, and increased legal and professional services expenses, approximately 10% of which was offset by a decrease in variable compensation expense.
The decrease in expense in fiscal 2013 compared to fiscal 2012 was primarily due to a lower compensation expense as a result of reduced headcount and lower legal and professional service expense, approximately 50% offset by an increase in variable compensation.
Acquisition related charges, including amortization of intangible assets
The composition of our acquisition related charges, including as a percentage of revenue, for fiscal years 2014, 2013 and 2012 was as follows:
|
Year Ended
|
% Change in
|
|||||||||||||||||
|
(In thousands)
|
January 3, 2015
|
December 28, 2013
|
December 29, 2012
|
2014
|
2013
|
|||||||||||||
|
Acquisition related charges, including amortization of intangible assets
|
$
|
2,948
|
|
$
|
2,960
|
|
$
|
4,178
|
|
(0.4
|
)%
|
(29.2
|
)%
|
|||||
|
Percentage of revenue
|
0.7
|
%
|
0.9
|
%
|
1.5
|
%
|
||||||||||||
Acquisition related charges includes severance and professional fees directly related to acquisitions, as well as expensed stepped up value of inventory and amortization of identifiable intangible assets with finite useful lives associated with our 2011 acquisition of SiliconBlue.
The fiscal 2014 and 2013 charges consist solely of amortization of intangible assets.
The fiscal 2012 charges include $2.9 million in amortization of intangibles assets, along with expensed stepped up value of inventory, professional fees, and severance costs.
Restructuring charges
The composition of our restructuring charges, including as a percentage of revenue, for fiscal years 2014, 2013 and 2012 was as follows:
|
Year Ended
|
% Change in
|
|||||||||||||||||
|
(In thousands)
|
January 3, 2015
|
December 28, 2013
|
December 29, 2012
|
2014
|
2013
|
|||||||||||||
|
Restructuring charges
|
$
|
17
|
|
$
|
388
|
|
$
|
6,018
|
|
(95.6
|
)%
|
(93.6
|
)%
|
|||||
|
Percentage of revenue
|
—
|
%
|
0.1
|
%
|
2.2
|
%
|
||||||||||||
On October 12, 2012, our Board of Directors adopted the 2012 restructuring plan. In connection with this restructuring plan, we reduced our headcount by approximately 110 employees and eliminated certain sites, including our sites in Pennsylvania and Illinois.
For fiscal 2014, restructuring charges solely related to changes in lease termination costs from previously announced restructurings.
35
For fiscal 2013, restructuring charges primarily related to severance and changes in lease termination costs associated with the 2012 restructuring plan. The 2012 restructuring plan was substantially completed in the first quarter of 2013.
Other
income (expense)
, net
The composition of our Other income (expense), net, including as a percentage of revenue, for fiscal years 2014, 2013 and 2012 was as follows:
|
Year Ended
|
% Change in
|
|||||||||||||||||
|
(In thousands)
|
January 3, 2015
|
December 28, 2013
|
December 29, 2012
|
2014
|
2013
|
|||||||||||||
|
Other income (expense), net
|
$
|
1,325
|
|
$
|
(300
|
)
|
$
|
505
|
|
(541.7
|
)%
|
(159.4
|
)%
|
|||||
|
Percentage of revenue
|
0.4
|
%
|
(0.1
|
)%
|
0.2
|
%
|
||||||||||||
The increase in Other income (expense), net, in fiscal 2014, as compared to fiscal 2013 resulted primarily from the realization of a gain on the sale of auction rate securities in the second quarter of 2014 combined with reduced foreign exchange losses compared to fiscal 2013.
The decrease in Other income (expense), net, in fiscal 2013, as compared to fiscal 2012 resulted primarily from higher losses on the sale of marketable securities and higher foreign exchange losses in fiscal 2013.
Income taxes
The composition of our income taxes for fiscal years 2014, 2013 and 2012 was as follows:
|
|
Year Ended
|
% Change in
|
||||||||||||||||
|
(In thousands)
|
January 3, 2015
|
December 28, 2013
|
December 29, 2012
|
2014
|
2013
|
|||||||||||||
|
(Benefit) provision for income taxes
|
$
|
(5,639
|
)
|
$
|
4,165
|
|
$
|
20,745
|
|
(235.4
|
)%
|
(79.9
|
)%
|
|||||
On December 31, 2011, we began to implement a global tax structure to more effectively align our corporate structure with the geographic business operations including responsibility for sales and manufacturing activities. Implementation of the global tax structure was completed during the first quarter of 2012 upon the intercompany sale of inventory and fixed assets. During 2012, this inventory was sold to end customers in the ordinary course of business resulting in income before taxes in the United States and a loss before taxes in certain foreign jurisdictions. Because these foreign jurisdictions have 0% income tax rates, we received no tax benefit associated with the losses resulting in a significant foreign rate differential. Taxes have been applied to the gain on sale based on U.S. statutory rates, offset by deferred tax assets. This resulted in an increase to the effective tax rate and a net income tax provision of $13.7 million during 2012.
During the fourth quarter of 2014, we concluded that it was more-likely-than-not that we would be able to realize the benefit of a portion of our remaining deferred tax assets, resulting in a tax benefit of $11.5 million. We based this conclusion on improved operating results over the previous two years and our expectations about generating taxable income in the foreseeable future. We exercised significant judgment and considered estimates about our ability to generate revenue, gross profits, operating income and taxable income in future periods under our global tax structure in reaching this decision.
We are not currently paying federal income taxes and do not expect to pay such taxes until the benefits of our tax net operating loss and credit carryforwards are fully utilized. We expect to pay a nominal amount of state income tax. We accrue interest and penalties related to uncertain tax positions in the provision for income taxes. We are paying foreign income taxes, which are primarily related to the cost of operating offshore research and development, marketing and sales subsidiaries.
The inherent uncertainties related to the geographical distribution and relative level of profitability among various high and low tax jurisdictions make it difficult to estimate the impact of the global tax structure on our future effective tax rate.
Liquidity and Capital Resources
The following sections discuss the effect of changes in our balance sheets, as well as the effects of our contractual obligations, other commitments, and the stock repurchase program on our liquidity and capital resources.
We classify our marketable securities as short-term based on their nature and availability for use in current operations. The overall quality of our portfolio is strong, with our cash equivalents and short-term marketable securities consisting primarily of
36
high quality, investment-grade securities. Our cash, cash equivalent and short-term marketable securities positions allow us to use our cash resources for acquisitions, working capital needs, and repurchases of common stock.
We have historically financed our operating and capital resource requirements through cash flows from operations. Cash provided by operating activities will fluctuate from period to period due to fluctuations in operating results, the timing and collection of accounts receivable, and required inventory levels, among other things.
We believe that our financial resources will be sufficient to meet our working capital needs through the next 12 months. As of
January 3, 2015
, we had no long-term debt and did not have significant long-term commitments for capital expenditures. In the future, we may consider acquisition opportunities to extend our product or technology portfolios and to expand our product offerings, such as the acquisition of Silicon Image, Inc. described below. In connection with funding capital expenditures, completing acquisitions, securing additional wafer supply, or increasing our working capital, we may seek to obtain debt or equity financing, or advance purchase payments or similar arrangements with wafer manufacturers. We may also need to obtain debt or equity financing if we experience downturns or cyclical fluctuations in our business that are more severe or longer than we anticipated when determining our current working capital needs.
On
January 26, 2015
, we entered into an agreement to commence a tender offer to acquire Silicon Image, Inc., a leading provider of wired and wireless connectivity solutions, for $7.30 in cash per share, resulting in a purchase price of approximately $602.05 million, plus related fees and expenses. The transaction was approved by the board of directors of each company and is expected to close upon the successful tender of required shares and regulatory approval. The transaction will be funded through a combination of cash on hand and $350.0 million of new debt financing.
Liquidity
Cash and cash equivalents, Short-term and Long-term marketable securities
|
(In thousands)
|
January 3, 2015
|
December 28, 2013
|
$Change
|
||||||||
|
Cash and cash equivalents
|
$
|
115,611
|
|
$
|
114,310
|
|
$
|
1,301
|
|
||
|
Short-term marketable securities
|
139,233
|
|
101,505
|
|
37,728
|
|
|||||
|
Long-term marketable securities
|
—
|
|
5,241
|
|
(5,241
|
)
|
|||||
|
Total Cash and cash equivalents, short-term and long-term marketable securities
|
$
|
254,844
|
|
$
|
221,056
|
|
$
|
33,788
|
|
||
As of
January 3, 2015
, we had total Cash and cash equivalents of
$115.6 million
, of which approximately
$28.2 million
was held by our foreign subsidiaries. We manage our global cash requirements considering (i) available funds among the subsidiaries through which we conduct business, (ii) the geographic location of our liquidity needs, and (iii) the cost to access international cash balances. The repatriation of non-U.S. earnings may have adverse tax consequences as we may be required to pay and record income tax expense on those funds to the extent they were previously considered permanently reinvested. As of
January 3, 2015
, we could access all cash held by our foreign subsidiaries without incurring significant additional expense.
The increase in Cash and cash equivalents and Short-term investments of
$33.8 million
as compared to
December 28, 2013
, was primarily the result of cash provided by operations of $40.1 million, $14.6 million in net proceeds from the sale of our headquarters, and proceeds from the sale of auction rate securities of $5.5 million, offset by cash used for stock buyback of $13.1 million and capital expenditures of $10.3 million.
During fiscal 2014, we redeemed our long-term marketable securities with a par value of $5.7 million and an estimated fair value of $5.2 million for $5.5 million.
Accounts receivable, net
|
(In thousands)
|
January 3, 2015
|
December 28, 2013
|
$Change
|
%Change
|
||||||||||
|
Accounts receivable, net
|
$
|
62,372
|
|
$
|
50,085
|
|
$
|
12,287
|
|
24.5
|
%
|
|||
|
Days sales outstanding
|
67
|
|
50
|
|
17
|
|
||||||||
Accounts receivable, net increased
$12.3 million
or
25%
as of January 3, 2015 compared to December 28, 2013 due primarily to an increase in distributor shipments late in the fourth quarter of fiscal 2014. As a result, days sales outstanding at January 3, 2015 was
67
, an increase of
17
days from
50
days at December 28, 2013.
37
Inventories
|
(In thousands)
|
January 3, 2015
|
December 28, 2013
|
$Change
|
%Change
|
||||||||||
|
Inventories
|
$
|
64,925
|
|
$
|
46,222
|
|
$
|
18,703
|
|
40.5
|
%
|
|||
|
Months of inventory on hand
|
5.2
|
|
3.4
|
|
1.8
|
|
||||||||
Inventory increased
$18.7 million
, or 40%, as of January 3, 2015 compared to December 28, 2013 primarily due to increased inventory of products related to anticipated future demand and, to a lesser extent, builds in anticipation of certain end-of-life orders. Months of inventory on hand increased to 5.2 months at the end of fiscal 2014 from 3.4 months at the end of fiscal 2013 as a result of the increase in inventory value coupled with lower revenue in the fourth quarter of fiscal 2014 compared to the fourth quarter of fiscal 2013. We expect inventory value and months of inventory on hand to return to historical levels in the future.
Share Repurchase Program
On
March 3, 2014
, the Company's Board of Directors approved a stock repurchase program pursuant to which up to $20.0 million of outstanding common stock may be repurchased from time to time. The duration of the repurchase program is twelve months. Under this program during fiscal
2014
, approximately
1.9 million
shares were repurchased for
$13.1 million
. At
January 3, 2015
, we had approximately
$6.9 million
remaining under the approved program. The 2014 program was completed during February 2015 for the approved amount.
During 2013, our Board of Directors approved a stock repurchase program pursuant to which up to $20.0 million of outstanding common stock may be repurchased from time to time. The duration of the repurchase program was twelve months. Under this program during fiscal 2013, approximately
0.8 million
shares were repurchased for
$3.7 million
. The 2013 program completed during February 2014.
Credit Arrangements
As of January 3, 2015, we had no long-term debt, no significant long-term purchase commitments for capital expenditures, and no existing used or unused credit arrangements. In connection with our proposed acquisition of Silicon Image, Inc., we expect to enter into a $350.0 million term loan facility with Jefferies Finance LLC, HSBC Bank USA, N.A. and HSBC Securities (USA) Inc. (collectively, the “Financing Parties”). The commitment from the Financing Parties to provide financing is subject to the satisfaction of customary conditions.
Lease Obligations
The following table summarizes our significant contractual cash obligations at January 3, 2015:
|
(In thousands)
|
||||
|
Fiscal year
|
Operating leases(1)
|
|||
|
2015
|
$
|
4,125
|
|
|
|
2016
|
3,702
|
|
||
|
2017
|
3,440
|
|
||
|
2018
|
3,449
|
|
||
|
2019
|
3,534
|
|
||
|
Thereafter
|
22,708
|
|
||
|
$
|
40,958
|
|
||
|
(1)
|
Certain of our facilities and equipment are leased under operating leases, which expire at various times through 2026.
|
We also have other liabilities of
$18.7 million
relating to uncertain tax positions. However, as we are unable to reliably estimate the timing of future payments related to uncertain tax positions, we have excluded this amount from the table above.
Our significant operating leases are for our facilities in Hillsboro and Portland Oregon; San Jose, California; Shanghai, China and Alabang, Philippines. In November 2014 we sold the properties that contained our headquarters in Hillsboro, Oregon for net proceeds of $14.6 million. We leased back the majority of the facility until March 2015. Beyond March 2015, we have leased a smaller portion of the facility until November 2022. Annual rental costs are estimated at $0.5 million with 3% annual increases. In November 2014 we entered into a lease for a new corporate headquarters facility in Portland, Oregon which expires in March 2025. Annual rental costs are estimated at $0.5 million with average annual increases of approximately 5%. We will commence operations at the new facility in Portland during the first quarter of fiscal 2015. Our lease in Shanghai expires in October 2015,
38
with remaining rental costs estimated to be $0.1 million. Our leases in Alabang expire in December 2016, April 2017 and May 2017, with total annual rental costs estimated to be $0.4 million with 5% annual increases. Leasehold improvements are amortized over the shorter of the non-cancelable lease term or the estimated useful life of the assets.
New Accounting Pronouncements
The information contained in Note 2: New Accounting Pronouncements to our Consolidated Financial Statements in Part II, Item 8 is incorporated by reference into this Part II, Item 7.
Off-Balance Sheet Arrangements
As of January 3, 2015, we did not have any off-balance sheet arrangements, as defined in Item 303(a)(4)(ii) of SEC Regulation S-K.
39
Credit Market Risks
At
January 3, 2015
we no longer held auction rate securities. On June 19, 2014, we sold our remaining auction rate securities with a par value of $5.7 million with an estimated fair value of $5.2 million, for $5.5 million. As a result, we reported a gain of $1.7 million in the Consolidated Statement of Operations and relieved $1.1 million of previously unrealized gain, net of taxes, from Accumulated other comprehensive loss in fiscal 2014.
At December 28, 2013, we held auction rate securities with a par value of $5.7 million with an estimated fair value of $5.2 million. Our investments in auction rate securities were subject to interest rate and market risk. A hypothetical 10% movement in interest rates would not have had a material impact on the fair value of the portfolio.
Foreign Currency Exchange Rate Risk
A portion of our silicon wafer and other purchases are denominated in Japanese yen, we bill our Japanese customers and collect a Japanese consumption tax refund in yen. As a result of this, as well as having various international subsidiary and branch operations, our financial position and results of operations are subject to exchange rate risk.
We mitigate the resulting foreign currency exchange rate exposure by entering into foreign currency forward exchange contracts. Although these hedges mitigate our foreign currency exchange rate exposure from an economic perspective they were not designated as "effective" hedges for accounting purposes and as such are adjusted to fair value through Other income (expense), net. We do not engage in speculative trading in any financial or capital market.
We had forward contracts for Japanese yen of $4.2 million and $2.3 million at January 3, 2015 and December 28, 2013, respectively. The net fair value of these contracts was favorable by approximately $0.4 million and less than $0.1 million at January 3, 2015 and December 28, 2013, respectively. A hypothetical 10% unfavorable exchange rate change in the yen against the U.S. dollar would have resulted in an unfavorable net fair value of less than $0.1 million and $0.2 million at January 3, 2015 and December 28, 2013. Changes in fair value resulting from foreign exchange rate fluctuations would be substantially offset by the change in value of the underlying hedged transactions.
40
Index to Consolidated Financial Statements
|
Page
|
|
|
Consolidated Financial Statements:
|
|
|
Consolidated Balance Sheets
|
|
|
Consolidated Statements of Operations
|
|
|
Consolidated Statements of Comprehensive Income (Loss)
|
|
|
Consolidated Statements of Changes in Stockholders' Equity
|
|
|
Consolidated Statements of Cash Flows
|
|
|
Notes to Consolidated Financial Statements
|
|
|
Report of Independent Registered Public Accounting Firm
|
|
41
LATTICE SEMICONDUCTOR CORPORATION
|
(In thousands, except share and par value data)
|
January 3, 2015
|
December 28, 2013
|
|||||
|
ASSETS
|
|||||||
|
Current assets:
|
|||||||
|
Cash and cash equivalents
|
$
|
115,611
|
|
$
|
114,310
|
|
|
|
Short-term marketable securities
|
139,233
|
|
101,505
|
|
|||
|
Accounts receivable, net
|
62,372
|
|
50,085
|
|
|||
|
Inventories
|
64,925
|
|
46,222
|
|
|||
|
Prepaid expenses and other current assets
|
16,281
|
|
13,679
|
|
|||
|
Total current assets
|
398,422
|
|
325,801
|
|
|||
|
Property and equipment, less accumulated depreciation
|
27,796
|
|
41,719
|
|
|||
|
Long-term marketable securities
|
—
|
|
5,241
|
|
|||
|
Other long-term assets
|
9,862
|
|
6,120
|
|
|||
|
Intangible assets, net of amortization
|
9,537
|
|
12,484
|
|
|||
|
Goodwill
|
44,808
|
|
44,808
|
|
|||
|
Deferred income taxes
|
20,105
|
|
11,703
|
|
|||
|
Total assets
|
$
|
510,530
|
|
$
|
447,876
|
|
|
|
LIABILITIES AND STOCKHOLDERS' EQUITY
|
|||||||
|
Current liabilities:
|
|||||||
|
Accounts payable and accrued expenses
|
$
|
32,171
|
|
$
|
37,454
|
|
|
|
Accrued payroll obligations
|
13,629
|
|
13,659
|
|
|||
|
Deferred income and allowances on sales to sell-through distributors
|
14,946
|
|
7,495
|
|
|||
|
Total current liabilities
|
60,746
|
|
58,608
|
|
|||
|
Long-term liabilities
|
8,809
|
|
3,588
|
|
|||
|
Total liabilities
|
69,555
|
|
62,196
|
|
|||
|
Commitments and contingencies (Notes 9 and 15)
|
|||||||
|
Stockholders' equity:
|
|||||||
|
Preferred stock, $.01 par value, 10,000,000 shares authorized, none issued and outstanding
|
—
|
|
—
|
|
|||
|
Common stock, $.01 par value, 300,000,000 shares authorized; 117,288,000 shares issued and outstanding as of January 3, 2015 and 115,671,000 shares issued and outstanding as of December 28, 2013
|
1,173
|
|
1,157
|
|
|||
|
Paid-in capital
|
635,299
|
|
626,861
|
|
|||
|
Accumulated other comprehensive loss
|
(1,884
|
)
|
(145
|
)
|
|||
|
Accumulated deficit
|
(193,613
|
)
|
(242,193
|
)
|
|||
|
Total stockholders' equity
|
440,975
|
|
385,680
|
|
|||
|
Total liabilities and stockholders' equity
|
$
|
510,530
|
|
$
|
447,876
|
|
|
The accompanying notes are an integral part of these Consolidated Financial Statements.
42
LATTICE SEMICONDUCTOR CORPORATION
|
|
|
Year Ended
|
||||||||||
|
(In thousands, except per share data)
|
|
January 3,
2015 |
December 28,
2013 |
December 29,
2012 |
||||||||
|
Revenue
|
$
|
366,127
|
|
$
|
332,525
|
|
$
|
279,256
|
|
|||
|
Costs and expenses:
|
||||||||||||
|
Cost of products sold
|
159,940
|
|
154,281
|
|
128,499
|
|
||||||
|
Research and development
|
88,079
|
|
80,966
|
|
77,610
|
|
||||||
|
Selling, general and administrative
|
73,527
|
|
67,144
|
|
72,317
|
|
||||||
|
Acquisition related charges, including
amortization of intangible assets
|
2,948
|
|
2,960
|
|
4,178
|
|
||||||
|
Restructuring charges
|
17
|
|
388
|
|
6,018
|
|
||||||
|
324,511
|
|
305,739
|
|
288,622
|
|
|||||||
|
Income (loss) from operations
|
41,616
|
|
26,786
|
|
(9,366
|
)
|
||||||
|
Other income (expense), net
|
1,325
|
|
(300
|
)
|
505
|
|
||||||
|
Income (loss) before taxes
|
42,941
|
|
26,486
|
|
(8,861
|
)
|
||||||
|
Income tax (benefit) expense
|
(5,639
|
)
|
4,165
|
|
20,745
|
|
||||||
|
Net Income (loss)
|
$
|
48,580
|
|
$
|
22,321
|
|
$
|
(29,606
|
)
|
|||
|
Net income (loss) per share
|
||||||||||||
|
Basic
|
$
|
0.41
|
|
$
|
0.19
|
|
$
|
(0.25
|
)
|
|||
|
Diluted
|
$
|
0.40
|
|
$
|
0.19
|
|
$
|
(0.25
|
)
|
|||
|
Shares used in per share calculations:
|
||||||||||||
|
Basic
|
117,708
|
|
115,701
|
|
117,194
|
|
||||||
|
Diluted
|
120,245
|
|
117,081
|
|
117,194
|
|
||||||
The accompanying notes are an integral part of these Consolidated Financial Statements
43
LATTICE SEMICONDUCTOR CORPORATION
CONSOLIDATED STATEMENTS OF COMPREHENSIVE INCOME (LOSS)
|
|
Year Ended
|
|||||||||||
|
(In thousands)
|
January 3,
2015 |
December 28,
2013 |
December 29,
2012 |
|||||||||
|
Net income (loss)
|
$
|
48,580
|
|
$
|
22,321
|
|
$
|
(29,606
|
)
|
|||
|
Other comprehensive income (loss):
|
||||||||||||
|
Unrealized (loss) gain related to marketable securities, net
|
(373
|
)
|
284
|
|
(57
|
)
|
||||||
|
Reclassification adjustment for losses (gains) included in net income (loss)
|
170
|
|
337
|
|
(78
|
)
|
||||||
|
Realized gain on sale of auction rate securities, previously unrealized, net of tax
|
(1,147
|
)
|
—
|
|
—
|
|
||||||
|
Translation adjustment (loss) gain
|
(330
|
)
|
(505
|
)
|
219
|
|
||||||
|
Other
|
(59
|
)
|
—
|
|
—
|
|
||||||
|
Comprehensive income (loss)
|
$
|
46,841
|
|
$
|
22,437
|
|
$
|
(29,522
|
)
|
|||
The accompanying notes are an integral part of these Consolidated Financial Statements
44
LATTICE SEMICONDUCTOR CORPORATION
CONSOLIDATED STATEMENTS OF CHANGES IN STOCKHOLDERS' EQUITY
|
Common Stock
($.01 par value)
|
Paid-in
capital
|
Treasury
stock
|
Accumulated
deficit
|
Accumulated other comprehensive loss
|
||||||||||||||||||||||
|
(In thousands, except par value)
|
Shares
|
Amount
|
|
|
|
|
Total
|
|||||||||||||||||||
|
Balances, December 31, 2011
|
117,675
|
|
1,177
|
|
627,637
|
|
—
|
|
(234,908
|
)
|
(345
|
)
|
393,561
|
|
||||||||||||
|
Net loss for 2012
|
—
|
|
—
|
|
—
|
|
—
|
|
(29,606
|
)
|
—
|
|
(29,606
|
)
|
||||||||||||
|
Unrealized loss related to marketable securities, net
|
—
|
|
—
|
|
|
—
|
|
|
—
|
|
|
—
|
|
|
(57
|
)
|
|
(57
|
)
|
|||||||
|
Recognized gain on redemption of marketable securities, previously unrealized
|
—
|
|
—
|
|
—
|
|
—
|
|
—
|
|
(78
|
)
|
(78
|
)
|
||||||||||||
|
Translation adjustments
|
—
|
|
—
|
|
—
|
|
—
|
|
—
|
|
219
|
|
219
|
|
||||||||||||
|
Common stock issued in connection with the exercise of stock options, ESPP and vested RSUs (net of tax)
|
1,896
|
|
19
|
|
3,531
|
|
—
|
|
—
|
|
—
|
|
3,550
|
|
||||||||||||
|
Stock repurchase
|
—
|
|
—
|
|
—
|
|
(17,549
|
)
|
—
|
|
—
|
|
(17,549
|
)
|
||||||||||||
|
Retirement of treasury stock
|
(4,071
|
)
|
(41
|
)
|
(17,508
|
)
|
17,549
|
|
—
|
|
—
|
|
—
|
|
||||||||||||
|
Stock-based compensation expense related to options, ESPP and RSUs
|
—
|
|
—
|
|
7,510
|
|
—
|
|
—
|
|
—
|
|
7,510
|
|
||||||||||||
|
Balances, December 29, 2012
|
115,500
|
|
1,155
|
|
621,170
|
|
—
|
|
(264,514
|
)
|
(261
|
)
|
357,550
|
|
||||||||||||
|
Net income for 2013
|
—
|
|
—
|
|
—
|
|
—
|
|
22,321
|
|
—
|
|
22,321
|
|
||||||||||||
|
Unrealized gain related to marketable securities, net
|
—
|
|
—
|
|
—
|
|
—
|
|
—
|
|
284
|
|
284
|
|
||||||||||||
|
Recognized loss on redemption of marketable securities, previously unrealized
|
—
|
|
—
|
|
—
|
|
—
|
|
—
|
|
337
|
|
337
|
|
||||||||||||
|
Translation adjustments
|
—
|
|
—
|
|
—
|
|
—
|
|
—
|
|
(505
|
)
|
(505
|
)
|
||||||||||||
|
Common stock issued in connection with the exercise of stock options, ESPP and vested RSUs (net of tax)
|
1,580
|
|
16
|
|
2,316
|
|
—
|
|
—
|
|
—
|
|
2,332
|
|
||||||||||||
|
Stock repurchase
|
—
|
|
—
|
|
—
|
|
(6,161
|
)
|
—
|
|
—
|
|
(6,161
|
)
|
||||||||||||
|
Retirement of treasury stock
|
(1,409
|
)
|
(14
|
)
|
(6,147
|
)
|
6,161
|
|
—
|
|
—
|
|
—
|
|
||||||||||||
|
Stock-based compensation expense related to options, ESPP and RSUs
|
—
|
|
—
|
|
9,522
|
|
—
|
|
—
|
|
—
|
|
9,522
|
|
||||||||||||
|
Balances, December 28, 2013
|
115,671
|
|
$
|
1,157
|
|
$
|
626,861
|
|
$
|
—
|
|
$
|
(242,193
|
)
|
$
|
(145
|
)
|
$
|
385,680
|
|
||||||
|
Net income for 2014
|
—
|
|
—
|
|
—
|
|
—
|
|
48,580
|
|
48,580
|
|
||||||||||||||
|
Unrealized loss related to marketable securities, net
|
—
|
|
—
|
|
—
|
|
—
|
|
—
|
|
(373
|
)
|
(373
|
)
|
||||||||||||
|
Realized gain on sale of auction rate securities, previously unrealized, net of tax
|
—
|
|
—
|
|
—
|
|
—
|
|
—
|
|
(1,147
|
)
|
(1,147
|
)
|
||||||||||||
|
Recognized loss on redemption of marketable securities, previously unrealized
|
—
|
|
—
|
|
—
|
|
—
|
|
—
|
|
170
|
|
170
|
|
||||||||||||
|
Translation adjustments
|
—
|
|
—
|
|
—
|
|
—
|
|
—
|
|
(330
|
)
|
(330
|
)
|
||||||||||||
|
Common stock issued in connection with the exercise of stock options, ESPP and vested RSUs (net of tax)
|
3,560
|
|
35
|
|
8,706
|
|
—
|
|
—
|
|
—
|
|
8,741
|
|
||||||||||||
|
Stock repurchase
|
—
|
|
—
|
|
—
|
|
(13,089
|
)
|
—
|
|
—
|
|
(13,089
|
)
|
||||||||||||
|
Retirement of treasury stock
|
(1,943
|
)
|
(19
|
)
|
(13,070
|
)
|
13,089
|
|
—
|
|
—
|
|
—
|
|
||||||||||||
|
Stock-based compensation expense related to options, ESPP and RSUs
|
—
|
|
—
|
|
12,802
|
|
—
|
|
—
|
|
—
|
|
12,802
|
|
||||||||||||
|
Other
|
—
|
|
—
|
|
—
|
|
—
|
|
—
|
|
(59
|
)
|
(59
|
)
|
||||||||||||
|
Balance, January 3, 2015
|
117,288
|
|
1,173
|
|
635,299
|
|
—
|
|
(193,613
|
)
|
(1,884
|
)
|
440,975
|
|
||||||||||||
The accompanying notes are an integral part of these Consolidated Financial Statements
45
LATTICE SEMICONDUCTOR CORPORATION
|
|
Year Ended
|
||||||||||
|
(In thousands)
|
January 3,
2015 |
December 28,
2013 |
December 29,
2012 |
||||||||
|
Cash flows from operating activities:
|
|||||||||||
|
Net income (loss)
|
$
|
48,580
|
|
$
|
22,321
|
|
$
|
(29,606
|
)
|
||
|
Adjustments to reconcile net income (loss) to net cash provided by operating activities:
|
|||||||||||
|
Depreciation and amortization
|
22,248
|
|
20,807
|
|
22,149
|
|
|||||
|
Change in deferred income tax (benefit) provision
|
(7,222
|
)
|
2,358
|
|
19,224
|
|
|||||
|
Gain on sale or maturity of marketable securities, net
|
(1,698
|
)
|
—
|
|
(393
|
)
|
|||||
|
Stock-based compensation
|
12,802
|
|
9,522
|
|
7,510
|
|
|||||
|
Changes in assets and liabilities: net of acquisitions
|
|||||||||||
|
Accounts receivable, net
|
(12,287
|
)
|
(3,138
|
)
|
(9,954
|
)
|
|||||
|
Inventories
|
(18,703
|
)
|
(2,028
|
)
|
(6,916
|
)
|
|||||
|
Prepaid expenses and other assets
|
(3,200
|
)
|
(1,339
|
)
|
387
|
|
|||||
|
Accounts payable and accrued expenses (includes restructuring)
|
(7,819
|
)
|
3,549
|
|
5,307
|
|
|||||
|
Accrued payroll obligations
|
(30
|
)
|
7,510
|
|
(3,224
|
)
|
|||||
|
Deferred income and allowances on sales to sell-through distributors
|
7,451
|
|
(3,058
|
)
|
(208
|
)
|
|||||
|
Net cash provided by operating activities
|
40,122
|
|
56,504
|
|
4,276
|
|
|||||
|
Cash flows from investing activities:
|
|||||||||||
|
Proceeds from sales or maturities of marketable securities
|
101,861
|
|
67,318
|
|
56,408
|
|
|||||
|
Purchase of marketable securities, net
|
(139,792
|
)
|
(103,861
|
)
|
(50,076
|
)
|
|||||
|
Proceeds from sale of auction rate securities
|
5,488
|
|
—
|
|
—
|
|
|||||
|
Proceeds from sale of land and building
|
14,625
|
|
—
|
|
—
|
|
|||||
|
Capital expenditures, net
|
(10,267
|
)
|
(12,500
|
)
|
(13,593
|
)
|
|||||
|
Other investing activities
|
(6,059
|
)
|
(7,353
|
)
|
(6,122
|
)
|
|||||
|
Net cash used in investing activities
|
(34,144
|
)
|
(56,396
|
)
|
(13,383
|
)
|
|||||
|
Cash flows from financing activities:
|
|||||||||||
|
Net share settlement upon issuance of RSUs
|
(3,427
|
)
|
(744
|
)
|
(832
|
)
|
|||||
|
Purchase of treasury stock
|
(13,089
|
)
|
(6,161
|
)
|
(17,549
|
)
|
|||||
|
Net proceeds from issuance of common stock
|
12,168
|
|
3,076
|
|
4,382
|
|
|||||
|
Net cash used in financing activities
|
(4,348
|
)
|
(3,829
|
)
|
(13,999
|
)
|
|||||
|
Effect of exchange rate change on cash
|
(329
|
)
|
(505
|
)
|
219
|
|
|||||
|
Net increase (decrease) in cash and cash equivalents
|
1,301
|
|
(4,226
|
)
|
(22,887
|
)
|
|||||
|
Beginning cash and cash equivalents
|
114,310
|
|
118,536
|
|
141,423
|
|
|||||
|
Ending cash and cash equivalents
|
$
|
115,611
|
|
$
|
114,310
|
|
$
|
118,536
|
|
||
|
Supplemental disclosures of non-cash investing and financing activities:
|
|||||||||||
|
Unrealized (loss) gain related to marketable securities, net, included in Accumulated other comprehensive loss
|
$
|
(373
|
)
|
$
|
284
|
|
$
|
(57
|
)
|
||
|
Income taxes paid, net of refunds
|
$
|
1,599
|
|
$
|
1,370
|
|
$
|
908
|
|
||
|
Accrued purchases of plant and equipment
|
(34
|
)
|
122
|
|
331
|
|
|||||
The accompanying notes are an integral part of these Consolidated Financial Statements
46
LATTICE SEMICONDUCTOR CORPORATION
NOTES TO CONSOLIDATED FINANCIAL STATEMENTS
Nature of Operations
Lattice Semiconductor Corporation (“Lattice,” the “Company,” “we,” “us,” or “our”) designs, develops and markets programmable logic products and related software. Programmable logic products are widely used semiconductor components that can be configured by end customers as specific logic circuits, enabling shorter design cycle times and reduced development costs. Our end customers are primarily original equipment manufacturers (“OEMs”) in the Communications, Industrial and Consumer end markets.
We do not manufacture our own silicon wafers. We maintain strategic relationships with large semiconductor foundries to source our finished silicon wafers in Asia. In addition, all of our assembly operations and most of our test and logistics operations are performed by outside suppliers in Asia. We perform certain test operations and reliability and quality assurance processes internally.
We place substantial emphasis on new product development and believe that continued investment in this area is required to maintain and improve our competitive position. Our product development activities emphasize new proprietary products, advanced packaging, enhancement of existing products and process technologies, and improvement of software development tools. Product development activities occur primarily in: Hillsboro, Oregon; San Jose, California; Shanghai, China; Bangalore, India; and Alabang, Philippines.
Fiscal Reporting Period
We report based on a 52 or 53-week fiscal year ending on the Saturday closest to December 31. Our fiscal 2014 was a 53-week year that ended
January 3, 2015
. Our fiscal 2013, 2012, 2011, and 2010 were 52-week years that ended
December 28, 2013
,
December 29, 2012
, December 31, 2011, and January 1, 2011, respectively. Our fiscal
2015
will be a 52-week year and will end on
January 2, 2016
. All references to quarterly or yearly financial results are references to the results for the relevant fiscal period.
Principles of Consolidation
The accompanying Consolidated Financial Statements include the accounts of Lattice and its subsidiaries, all of which are wholly owned, after the elimination of all intercompany balances and transactions. Certain balances in prior fiscal years have been reclassified to conform to the presentation adopted in the current year.
Cash Equivalents and Marketable Securities
We consider all investments that are readily convertible into cash and have original maturities of
three months
or less, to be cash equivalents. Cash equivalents consist primarily of highly liquid investments in time deposits or money market accounts and are carried at cost. We account for marketable securities as available for sale with unrealized gains or losses recorded to Accumulated other comprehensive loss, unless losses are considered other-than-temporary, in which case, losses are charged to the Consolidated Statements of Operations. Deposits with financial institutions at times exceed Federal Deposit Insurance Corporation insurance limits.
Fair Value of Financial Instruments
We invest in various financial instruments including corporate and government bonds, notes and commercial paper. We were also invested in auction rate securities until June 2014. The Company values these instruments at fair value and monitors their portfolio for impairment on a periodic basis. In the event that the carrying value of an investment exceeds its fair value and the decline in value is determined to be other-than-temporary, the Company records an impairment charge and establishes a new carrying value. We assess other-than-temporary impairment of marketable securities in accordance with Financial Accounting Standards Board (“FASB”) Accounting Standards Codification (“ASC”) 820, “Fair Value Measurements and Disclosures.” The framework under the provisions of ASC 820 establishes three levels of inputs that may be used to measure fair value. Each level of input has different levels of subjectivity and difficulty involved in determining fair value.
Level 1
instruments are characterized generally by quoted prices for identical assets or liabilities in active markets. Therefore, determining fair value for Level 1 instruments generally does not require significant management judgment, and the estimation is not difficult.
47
Level 2
instruments include inputs other than Level 1 that are observable, either directly or indirectly, such as quoted prices for similar assets or liabilities; quoted prices for identical instruments in markets that are not active; or other inputs that are observable or can be corroborated by observable market data for substantially the full term of the assets or liabilities.
Level 3
instruments include unobservable inputs that are supported by little or no market activity and that are significant to the fair value of the assets or liabilities. Our auction rate securities were classified as Level 3 instruments. Management used a combination of the market and income approach to derive the fair value of auction rate securities, which included third party valuation results, investment broker provided market information and available information on the credit quality of the underlying collateral. As a result, the determination of fair value for Level 3 instruments requires significant management judgment and subjectivity. Our Level 3 instruments were classified as Long-term marketable securities on our Consolidated Balance Sheets and were entirely made up of auction rate securities that consisted of student loan asset-backed notes. During fiscal 2014 we sold our Level 3 instruments, which consisted entirely of auction rate securities.
Foreign Exchange and Translation of Foreign Currencies
We have international subsidiary and branch operations. In addition, a portion of our silicon wafer and other purchases are denominated in Japanese yen, we bill certain Japanese customers in yen and collect a Japanese consumption tax refund in yen. Gains or losses from foreign exchange rate fluctuations on balances denominated in foreign currencies are reflected in Other income (expense), net. Realized and unrealized gains or losses on foreign currency transactions were not significant for the periods presented. We translate accounts denominated in foreign currencies in accordance with ASC 830, “Foreign Currency Matters,” using the current rate method under which asset and liability accounts are translated at the current rate, while stockholders' equity accounts are translated at the appropriate historical rates, and revenue and expense accounts are translated at average monthly exchange rates. Translation adjustments related to the consolidation of foreign subsidiary financial statements are reflected in Accumulated other comprehensive loss in Stockholders' equity.
Derivative Financial Instruments
We had forward contracts for Japanese yen of
$4.2 million
and
$2.3 million
at January 3, 2015 and December 28, 2013, respectively. One contract outstanding at
January 3, 2015
settled in
January 2015
and the other five contracts will settle in
June 2015
. The contracts outstanding at
December 28, 2013
settled in
January 2014
and
June 2014
, respectively. Although such hedges mitigate our foreign currency exchange rate exposure from an economic perspective they were not designated as "effective" hedges for accounting purposes and are adjusted to fair value through Other income (expense), net, with an impact of approximately
$0.4 million
and less than
$0.1 million
for the years end January 3, 2015 and December 28, 2013, respectively.
Concentration Risk
Potential exposure to concentration risk consists primarily of revenue concentration, cash and cash equivalents, marketable securities, accounts receivable and supply of wafers for our new products. One OEM end customer accounted for
19%
of revenue in fiscal 2014, while a second OEM end customer accounted for
12%
of total revenue in fiscal 2014. One OEM end customer accounted for
22%
of revenue in fiscal 2013. No end customer accounted for more than
10%
of revenue in fiscal 2012. We place our investments primarily through two financial institutions and mitigate the concentration of credit risk by limiting the maximum portion of the investment portfolio which may be invested in any one instrument. The Company's investment policy defines approved credit ratings for investment securities. Investments on-hand consisted primarily of money market instruments, “AA” or better corporate notes and bonds and commercial paper, and U.S. government agency obligations. See Note 4 for a discussion of the liquidity attributes of our marketable securities.
Concentration of credit risk with respect to accounts receivable is mitigated by our credit and collection process. Accounts receivable are recorded at the invoice amount, do not bear interest, and are shown net of allowances for doubtful accounts of
$0.9 million
and
$0.9 million
at
January 3, 2015
and
December 28, 2013
, respectively. We perform credit evaluations for essentially all customers and secure transactions with letters of credit or advance payments where appropriate. We regularly review our allowance for doubtful accounts and the aging of our accounts receivable. Write-offs for uncollected accounts receivable have not been significant to date.
We rely on a limited number of foundries for our wafer purchases including: Fujitsu Limited, Seiko Epson Corporation, Taiwan Semiconductor Manufacturing Company, Ltd and United Microelectronics Corporation.
Revenue Recognition and Deferred Income
We sell our products directly to end customers or through a network of independent manufacturers' representatives and indirectly through a network of independent sell-in and sell-through distributors. Distributors provide periodic data regarding the product, price, quantity, and end customer when products are resold, as well as the quantities of our products they still have in stock.
Revenue from sales to OEMs or sell-in distributors is recognized upon shipment. Revenue from sales by our sell-through distributors is recognized at the time of reported resale. Under both types of revenue recognition, persuasive evidence of an
48
arrangement exists, the price is fixed or determinable, title has transferred, collection of resulting receivables is reasonably assured, and there are no remaining customer acceptance requirements and no remaining significant performance obligations. Revenue and Cost of products sold are presented net of taxes collected on behalf of government authorities.
Orders from our sell-through distributors are initially recorded at published list prices; however, for a majority of our sales, the final selling price is determined at the time of resale and in accordance with a distributor price agreement. In certain circumstances, we allow sell-through distributors to return unsold products. At times, we protect our sell-through distributors against reductions in published list prices. For these reasons, we do not recognize revenue until products are resold by sell-through distributors to an end customer.
For sell-through distributors, at the time of shipment to distributors, we (a) record Accounts receivable at published list price since there is a legally enforceable obligation from the distributor to pay us currently for product delivered, (b) relieve inventory for the carrying value of goods shipped since legal title has passed to the distributor, and (c) record deferred revenue and deferred cost of sales in Deferred income and allowances on sales to sell-through distributors in the liability section of our Consolidated Balance Sheets. The final price is set at the time of resale and is determined in accordance with a distributor price agreement. Revenue and cost of products sold to sell-through distributors are deferred until either the product is resold by the distributor or, in certain cases, return privileges terminate, at which time Revenue and Cost of products sold are reflected in Net income (loss), and Accounts receivable are adjusted to reflect the final selling price.
The components of Deferred income and allowances on sales to sell-through distributors are presented in the following table
|
(In thousands)
|
January 3, 2015
|
December 28, 2013
|
||||||
|
Inventory valued at published list price and held by sell-through distributors with right of return
|
$
|
50,854
|
|
$
|
36,056
|
|
||
|
Allowance for distributor advances
|
(29,490
|
)
|
(24,090
|
)
|
||||
|
Deferred cost of sales related to inventory held by sell-through distributors
|
(6,418
|
)
|
(4,471
|
)
|
||||
|
Total Deferred income and allowances on sales to sell-through distributors
|
$
|
14,946
|
|
$
|
7,495
|
|
||
A significant portion of our revenue in fiscal 2014 was from sell-through distributors. For the fiscal years 2014, 2013 and 2012, resale of products by sell-through distributors as a percentage of our total revenue was
45%
,
45%
and
55%
, respectively.
We must use estimates and apply judgment to reconcile sell-through distributors' reported inventories to their activities. Errors in our estimates or judgments could result in inaccurate reporting of our Revenue, Cost of products sold, Deferred income and allowances on sales to sell-through distributors, and Net income (loss).
Inventories
Inventories are recorded at the lower of actual cost determined on a first-in-first-out basis or market. We establish provisions for inventory if it is obsolete or we hold quantities which are in excess of projected customer demand. The creation of such provisions results in a write-down of inventory to net realizable value and a charge to Cost of products sold.
Property and Equipment
Property and equipment are stated at cost. Depreciation and amortization are computed using the straight-line method for financial reporting purposes over the estimated useful lives of the related assets, generally
three
to
five
years for equipment and software,
one
to
three
years for tooling and
thirty
years for buildings. Upon disposal of Property and equipment, the accounts are relieved of the costs and related accumulated depreciation and amortization, and resulting gains or losses are reflected in the Consolidated Statements of Operations for recognized gains and losses, or in the Consolidated Balance Sheets for deferred gains and losses. Repair and maintenance costs are expensed as incurred.
Asset Impairments
Long-lived assets, including amortizable intangible assets, are carried on our financial statements based on their cost less accumulated depreciation or amortization. We monitor the carrying value of our long-lived assets for potential impairment and test the recoverability of such assets whenever events or changes in circumstances indicate that their carrying amounts may not be recoverable. These events or changes in circumstances, including management decisions pertaining to such assets, are referred to as impairment indicators. If an impairment indicator occurs, we perform a test of recoverability by comparing the carrying value of the asset group to its undiscounted expected future cash flows. If the carrying values are in excess of undiscounted expected future cash flows, we measure any impairment by comparing the fair value of the asset group to its carrying value. Fair value is generally determined by considering (i) internally developed discounted projected cash flow analysis of the asset group; (ii) actual third-party valuations; and/or (iii) information available regarding the current market for similar asset
49
groups. If the fair value of the asset group is determined to be less than the carrying amount of the asset group, an impairment in the amount of the difference is recorded in the period that the impairment indicator occurs and is included in our Consolidated Statement of Operations. Estimating future cash flows requires significant judgment and projections may vary from the cash flows eventually realized, which could impact our ability to accurately assess whether an asset has been impaired. No impairment charges were recorded for the fiscal year ended 2014.
Valuation of Goodwill
Goodwill is an asset representing the future economic benefits arising from other assets acquired in a business combination that are not individually identified and separately recognized. The Company reviews goodwill for impairment annually during the fourth quarter and whenever events or changes in circumstances indicate the carrying value of goodwill may not be recoverable. When evaluating whether goodwill is impaired, the Company makes a qualitative assessment to determine if it is more likely than not that the reporting unit's fair value is less than its carrying amount. If the qualitative assessment determines that it is more likely than not that its fair value is less than its carrying amount, the fair value of the reporting unit is compared with its carrying value (including goodwill). If the fair value of the reporting unit is less than its carrying value, an indication of goodwill impairment exists for the reporting unit and the Company must measure the impairment loss. The impairment loss, if any, is recognized for any excess of the carrying amount of the reporting unit's goodwill over the implied fair value of the goodwill. The implied fair value of goodwill is determined by allocating the fair value of the reporting unit in a manner similar to purchase price allocation and the residual fair value after this allocation is the implied fair value of the reporting unit goodwill. Fair value of the reporting unit is determined using a discounted cash flow analysis. If the fair value of the reporting unit exceeds its carrying value, no further impairment analysis is needed. For purposes of testing goodwill for impairment, the Company operates as a single reporting unit. No goodwill impairment charges were recorded for the fiscal year ended 2014.
Leases
We lease office space and classify our leases as either operating or capital lease arrangements in accordance with the criteria of ASC 840, “Leases.” Certain of our office space operating leases contain provisions under which monthly rent escalates over time and certain leases may also contain provisions for reimbursement of a specified amount of leasehold improvements. When lease agreements contain escalating rent clauses, we recognize expense on a straight-line basis over the term of the lease. When lease agreements provide allowances for leasehold improvements, we capitalize the leasehold improvement assets and amortize them on a straight-line basis over the lesser of the lease term or the estimated useful life of the asset, and reduce rent expense on a straight-line basis over the term of the lease by the amount of the asset capitalized.
Restructuring Charges
Expenses associated with exit or disposal activities are recognized when incurred under ASC 420, “Exit or Disposal Cost Obligations,” for everything but severance. Because the Company has a history of paying severance benefits, the cost of severance benefits associated with a restructuring plan is recorded when such costs are probable and the amount can be reasonably estimated in accordance with ASC 712, “Compensation - Nonretirement Postemployment Benefits.” When leased facilities are vacated, an amount equal to the total future lease obligations from the date of vacating the premises through the expiration of the lease, net of any future sublease income, was recorded as a part of restructuring charges.
Research and Development
Research and development costs are expensed as incurred.
Accounting for Income Taxes
The Company’s provision for income tax is comprised of its current tax liability and change in deferred tax assets and liabilities. Deferred tax assets and liabilities are recognized for the expected tax consequences of temporary differences between the tax bases of assets and liabilities and their reported amounts in the financial statements using enacted tax rates and laws that will be in effect when the difference is expected to reverse. Valuation allowances are provided to reduce deferred tax assets to an amount that in management’s judgment is more-likely-than-not to be recoverable against future taxable income. At
January 3, 2015
, U.S. income taxes were not provided on approximately
$3.3 million
of the undistributed earnings of our Chinese subsidiary as we intend to reinvest these earnings indefinitely. If these earnings were distributed to the U.S. in the form of dividends or otherwise, we would be subject to additional U.S. income taxes.
The Company’s income tax calculations are based on application of the respective U.S. federal, state or foreign tax law. The Company’s tax filings, however, are subject to audit by the relevant tax authorities. Accordingly, the Company recognizes tax liabilities based upon its estimate of whether, and the extent to which, additional taxes will be due when such estimates are more-likely-than-not to be sustained. An uncertain income tax position will not be recognized if it has less than a
50%
likelihood of being sustained. To the extent the final tax liabilities are different than the amounts originally accrued, the increases or
50
decreases as well as any interest or penalties are recorded as income tax expense or benefit in the Consolidated Statements of Operations.
In assessing the ability to realize deferred tax assets, the Company evaluates both positive and negative evidence that may exist and consider whether it is more-likely-than-not that some portion or all of the deferred tax assets will be realized. The ultimate realization of deferred tax assets is dependent upon the generation of future taxable income during the periods in which those temporary differences become deductible.
Any adjustment to the net deferred tax asset valuation allowance is recorded in the Consolidated Statements of Operations for the period that the adjustment is determined to be required.
Stock-Based Compensation
The Company records stock-based compensation expense related to employee and director stock options, restricted stock units (“RSUs”), and the Employee Stock Purchase Plan (“ESPP”) in accordance with ASC 718, “Compensation - Stock Compensation.”
Net Income (Loss) Per Share
We compute basic income (loss) per share by dividing Net income (loss) available to common stockholders by the weighted average number of common shares outstanding during the period. To determine diluted share count, we apply the treasury stock method to determine the dilutive effect of outstanding stock option shares, RSUs and ESPP shares. Our application of the treasury stock method includes as assumed proceeds, the average unamortized stock-based compensation expense for the period and the impact of the pro forma net deferred tax benefit or cost associated with stock-based compensation expense.
A reconciliation of basic and diluted Net income (loss) per share is presented below:
|
Year Ended
|
|||||||||||
|
(in thousands, except per share data)
|
January 3,
2015 |
December 28,
2013 |
December 29,
2012 |
||||||||
|
Basic and diluted Net income (loss)
|
$
|
48,580
|
|
$
|
22,321
|
|
$
|
(29,606
|
)
|
||
|
Shares used in basic Net income (loss) per share
|
117,708
|
|
115,701
|
|
117,194
|
|
|||||
|
Dilutive effect of stock options, RSUs and ESPP shares
|
2,537
|
|
1,380
|
|
—
|
|
|||||
|
Shares used in diluted Net income (loss) per share
|
120,245
|
|
117,081
|
|
117,194
|
|
|||||
|
Basic Net income (loss) per share
|
$
|
0.41
|
|
$
|
0.19
|
|
$
|
(0.25
|
)
|
||
|
Diluted Net income (loss) per share
|
$
|
0.40
|
|
$
|
0.19
|
|
$
|
(0.25
|
)
|
||
The computation of diluted Net income (loss) per share for fiscal years 2014 and 2013, respectively, includes the effects of stock options, RSUs and ESPP shares aggregating approximately
2.5 million
and
1.4 million
, respectively, as they are dilutive, and excludes the effects of stock options, RSUs and ESPP shares aggregating approximately
2.6 million
,
7.8 million
and
10.6 million
shares, for fiscal years 2014, 2013 and 2012, respectively, as they are antidilutive. Stock options, RSUs and ESPP shares are considered antidilutive when the aggregate of exercise price, unrecognized stock-based compensation expense and excess tax benefit are greater than the average market price for our common stock during the period or when the Company is in a net loss position, as the effects would reduce the loss per share. Stock options and RSUs that are antidilutive at
January 3, 2015
could become dilutive in the future.
Use of Estimates
The preparation of financial statements in conformity with U.S. generally accepted accounting principles ("GAAP") requires management to make estimates and assumptions that affect the reported amounts and classification of assets, such as marketable securities, accounts receivable, inventory, auction rate securities, goodwill - including the assessment of reporting unit, intangible assets, current and deferred income taxes, accrued liabilities - including restructuring charges and bonus arrangements, deferred income and allowances on sales to sell-through distributors, disclosure of contingent liabilities at the date of the financial statements and the reported amounts of revenue and expenses during the fiscal periods presented. Actual results could differ from those estimates.
51
In April 2014, the FASB issued ASU No. 2014-08, Presentation of Financial Statements (Topic 205) and Property, Plant, and Equipment (Topic 360): Reporting Discontinued Operations and Disclosures of Disposals of Components of an Entity, which changes the criteria for reporting discontinued operations to only those disposals which represent a strategic shift in operations. In addition, the new guidance requires expanded disclosures about discontinued operations, including pre-tax income attributable to a disposal of a significant part of an organization that does not qualify for discontinued operations reporting. The new standard became effective for us on January 4, 2015. Early adoption is permitted, but only for disposals (or classifications as held-for-sale) that have not been reported in financial statements previously issued or available for issuance. We do not expect the adoption of this accounting standard update to impact our consolidated financial statements.
In
May 2014
, the FASB issued ASU No. 2014-09, Revenue from Contracts with Customers, which requires an entity to recognize the amount of revenue to which it expects to be entitled for the transfer of promised goods or services to customers. The ASU will replace most existing revenue recognition guidance under U.S. GAAP when it becomes effective. The new standard will become effective for us on January 1, 2017. Early application is not permitted. The standard permits the use of either the retrospective or cumulative effect transition method. We are currently evaluating the impact of ASU 2014-09 on our consolidated financial statements and related disclosures and have not yet selected a transition method.
In February 2015, the FASB issued ASU No. 2015-02, Consolidation (Topic 810): Amendments to the Consolidation Analysis, which focuses on the consolidation evaluation for reporting organizations and requires the evaluation of whether or not certain legal entities should be consolidated. All legal entities are subject to reevaluation under the revised consolidation model. The new standard will become effective for us on January 3, 2016. Early adoption is permitted, including adoption in an interim period. We do not expect the adoption of this accounting standard update to impact our consolidated financial statements.
On January 26, 2015, we entered into an agreement to commence a cash tender offer to acquire Silicon Image, Inc. The transaction will close upon the successful tender of required shares and regulatory approval. We are currently evaluating the impact of new accounting pronouncements as they relate to this business.
In December 2011, we acquired SiliconBlue Technologies Ltd., ("SiliconBlue"), for
$63.2 million
in cash. Of the total purchase price,
$43.9 million
was allocated to goodwill,
$18.5 million
was allocated to intangible assets, and the remaining to net tangible assets acquired. The goodwill and identifiable intangible assets are not deductible for tax purposes. SiliconBlue was consolidated into our financial statements beginning in December 2011.
No
impairment charges relating to goodwill and intangible assets have been recorded.
On
January 26, 2015
, we entered into an agreement to commence a cash tender offer to acquire Silicon Image, Inc., a leading provider of wired and wireless connectivity solutions, for
$7.30
in cash per share, resulting in a purchase price of approximately
$602.05 million
, plus related fees and expenses. The transaction was approved by the board of directors of each company and is expected to close upon the successful tender of required shares and regulatory approval. The transaction will be funded through a combination of cash on hand and $350.0 million of new debt financing.
Our short-term marketable securities have contractual maturities of up to 2.1 years, and our long-term marketable securities had contractual maturities of up to 6.2 years. The following table summarizes the remaining maturities of our marketable securities at fair value:
|
(In thousands)
|
January 3,
2015 |
December 28,
2013 |
|||||
|
Short-term marketable securities:
|
|||||||
|
Maturing within one year
|
$
|
60,965
|
|
$
|
51,920
|
|
|
|
Maturing between one and two years
|
78,268
|
$
|
49,585
|
|
|||
|
Long-term marketable securities:
|
|||||||
|
Maturing in more than ten years
|
—
|
|
5,241
|
|
|||
|
Total marketable securities
|
$
|
139,233
|
|
$
|
106,746
|
|
|
52
The following table summarizes the composition of our marketable securities at fair value:
|
(In thousands)
|
January 3,
2015 |
December 28,
2013 |
|||||
|
Short-term marketable securities:
|
|||||||
|
Corporate and government bonds and notes and commercial paper
|
$
|
139,233
|
|
$
|
101,505
|
|
|
|
Long-term marketable securities:
|
|||||||
|
Federally-insured or FFELP guaranteed student loans
|
—
|
|
5,241
|
|
|||
|
Total marketable securities
|
$
|
139,233
|
|
$
|
106,746
|
|
|
The following table summarizes the composition of our auction rate securities:
|
|
January 3, 2015
|
December 28, 2013
|
|||||||||||||||||
|
(In thousands)
|
Par Value
|
Fair Value
|
S&P
Credit
rating
|
Par Value
|
Fair Value
|
S&P
Credit rating |
|||||||||||||
|
Long-term marketable securities:
|
|||||||||||||||||||
|
Federally-insured or FFELP guaranteed student loans
|
$
|
—
|
|
$
|
—
|
|
$
|
5,700
|
|
$
|
5,241
|
|
AA+
|
||||||
In
June 2014
, our remaining auction rate securities, with a par value of
$5.7 million
and an estimated fair value of
$5.2 million
, were sold for
$5.5 million
. As a result, we reported a gain of
$1.7 million
in the Consolidated Statement of Operations and relieved
$1.1 million
of previously unrecognized gain, net of taxes, from Accumulated other comprehensive loss in fiscal 2014.
|
Fair value measurements as of
January 3, 2015
|
Fair value measurements as of
December 28, 2013 |
||||||||||||||||||||||||||||||
|
(In thousands)
|
Total
|
Level 1
|
Level 2
|
Level 3
|
Total
|
Level 1
|
Level 2
|
Level 3
|
|||||||||||||||||||||||
|
Short-term marketable securities
|
$
|
139,233
|
|
$
|
139,233
|
|
$
|
—
|
|
$
|
—
|
|
$
|
101,505
|
|
$
|
101,505
|
|
$
|
—
|
|
$
|
—
|
|
|||||||
|
Long-term marketable securities
|
—
|
|
—
|
|
—
|
|
—
|
|
5,241
|
|
—
|
|
—
|
|
5,241
|
|
|||||||||||||||
|
Foreign currency forward exchange contracts, net
|
414
|
|
—
|
|
414
|
|
—
|
|
48
|
|
—
|
|
48
|
|
—
|
|
|||||||||||||||
|
Total fair value of financial instruments
|
$
|
139,647
|
|
$
|
139,233
|
|
$
|
414
|
|
$
|
—
|
|
$
|
106,794
|
|
$
|
101,505
|
|
$
|
48
|
|
$
|
5,241
|
|
|||||||
We invest in various financial instruments including corporate and government bonds and notes, and commercial paper. We were also invested in auction rate securities until June 2014. In addition, we enter into foreign currency forward exchange contracts to mitigate our foreign currency exchange rate exposure. The Company carries these instruments at their fair value in accordance with ASC 820. The framework under the provisions of ASC 820 establishes three levels of inputs that may be used to measure fair value. Each level of input has different levels of subjectivity and difficulty involved in determining fair value.
Level 1
instruments generally represent quoted prices for identical assets or liabilities in active markets. Therefore, determining fair value for Level 1 instruments generally does not require significant management judgment, and the estimation is not difficult. Our Level 1 instruments consist of federal agency, corporate notes and bonds, and commercial paper that are traded in active markets and are classified as Short-term marketable securities on our Consolidated Balance Sheet.
Level 2
instruments include inputs other than Level 1 that are observable, either directly or indirectly, such as quoted prices for similar assets or liabilities; quoted prices for identical instruments in markets that are not active; or other inputs that are observable or can be corroborated by observable market data for substantially the full term of the assets or liabilities. Our Level 2 instruments consist of foreign currency exchange contracts entered into to hedge against fluctuation in the Japanese yen.
Level 3
instruments include unobservable inputs that are supported by little or no market activity and that are significant to the fair value of the assets or liabilities. Our auction rate securities were classified as Level 3 instruments. Management used a
53
combination of the market and income approach to derive the fair value of auction rate securities, which included third party valuation results, investment broker provided market information and available information on the credit quality of the underlying collateral. As a result, the determination of fair value for Level 3 instruments requires significant management judgment and subjectivity. Our Level 3 instruments were classified as Long-term marketable securities on our Consolidated Balance Sheets and were entirely made up of auction rate securities that consisted of student loan asset-backed notes. During second quarter of fiscal 2014 we sold our Level 3 instruments, which consisted entirely of auction rate securities.
There were no transfers between any of the levels during fiscal 2014, 2013 and 2012.
During the fiscal years ended January 3, 2015 and December 28, 2013, the following changes occurred in our
Level 3 instruments:
|
Year Ended
|
|||||||
|
(In thousands)
|
January 3,
2015 |
December 28,
2013 |
|||||
|
Beginning fair value of Long-term marketable securities
|
$
|
5,241
|
|
$
|
4,717
|
|
|
|
Fair value of securities sold or redeemed
|
(5,488
|
)
|
—
|
|
|||
|
Realized gain from increase in fair value
|
247
|
|
—
|
|
|||
|
Temporary fluctuations in fair value
|
—
|
|
524
|
|
|||
|
Ending fair value of Long-term marketable securities
|
$
|
—
|
|
$
|
5,241
|
|
|
In accordance with ASC 320, “Investments-Debt and Equity Securities,” the Company recorded an unrealized loss of
$0.4 million
during the fiscal year ended January 3, 2015 and an unrealized gain of
$0.3 million
during the fiscal year ended December 28, 2013, on certain Short-term marketable securities (Level 1 instruments), which have been recorded in Accumulated other comprehensive loss. Future fluctuations in fair value related to these instruments that the Company deems to be temporary, including any recoveries of previous write-downs, would be recorded to Accumulated other comprehensive loss. In addition, during the fiscal year ended January 3, 2015, the Company realized a gain of
$1.7 million
related to the sale of a portion of its Long-term marketable securities portfolio. No sale activity for Long-term marketable securities occurred during the fiscal year ended December 28, 2013.
|
(In thousands)
|
January 3,
2015 |
December 28,
2013 |
|||||
|
Work in progress
|
$
|
49,554
|
|
$
|
32,111
|
|
|
|
Finished goods
|
15,371
|
|
14,111
|
|
|||
|
Total inventories
|
$
|
64,925
|
|
$
|
46,222
|
|
|
|
(In thousands)
|
January 3,
2015 |
December 28,
2013 |
|||||
|
Land
|
$
|
—
|
|
$
|
1,456
|
|
|
|
Buildings
|
3,516
|
|
27,827
|
|
|||
|
Computer and test equipment
|
158,117
|
|
154,508
|
|
|||
|
Office furniture and equipment
|
7,028
|
|
9,122
|
|
|||
|
Leasehold and building improvements
|
13,213
|
|
16,695
|
|
|||
|
181,874
|
|
209,608
|
|
||||
|
Accumulated depreciation and amortization
|
(154,078
|
)
|
(167,889
|
)
|
|||
|
$
|
27,796
|
|
$
|
41,719
|
|
||
Depreciation expense was
$11.4 million
,
$11.2 million
and
$13.6 million
for fiscal years 2014, 2013 and 2012, respectively.
In November 2014, we sold land and buildings, comprising our headquarters in Hillsboro, Oregon, for net proceeds of approximately
$14.6 million
. This property had a historical cost of
$30.9 million
and accumulated depreciation of
$17.9 million
, resulting in a net gain on sale of
$1.6 million
. We leased back a portion of the facilities for a lease term of
eight
years, resulting in deferral of the gain, which will be amortized over the life of the lease.
54
In connection with our acquisition of SiliconBlue in
December 2011
, we recorded identifiable intangible assets related to developed technology and customer relationships based on guidance for determining fair value under the provisions of ASC 820. The following table summarizes the details of the Company’s total purchased intangible assets:
|
(In thousands)
|
Weighted Average Amortization Period (in years)
|
Gross
|
Accumulated Amortization
|
Intangible assets, net of amortization January 3, 2015
|
||||||||||
|
Developed technology
|
7.0
|
$
|
10,700
|
|
$
|
(4,649
|
)
|
$
|
6,051
|
|
||||
|
Customer relationships
|
5.5
|
7,800
|
|
(4,314
|
)
|
3,486
|
|
|||||||
|
Total
|
6.3
|
$
|
18,500
|
|
$
|
(8,963
|
)
|
$
|
9,537
|
|
||||
Amortization expense associated with these intangible assets is reported as Acquisition related charges, including amortization of intangible assets in the Consolidated Statements of Operations and amounted to
$2.9 million
in each of the fiscal years 2014, 2013 and 2012. We expect amortization expense related to these intangible assets to approximate
$2.9 million
in 2015 and 2016,
$2.2 million
in 2017 and
$1.5 million
in 2018.
Acquisition related charges, including amortization of intangible assets in the Consolidated Statements of Operations, also include severance and professional fees related to the acquisition, as well as expensed stepped up value of inventory collectively, amounting to less than
$0.1 million
in 2014 and 2013, and
$1.2 million
, in 2012, respectively.
Certain of our facilities are leased under operating leases, which expire at various times through 2026. Rental expense under the operating leases was
$4.5 million
$4.6 million
and
$3.7 million
for fiscal years 2014, 2013 and 2012, respectively. Future minimum lease commitments at January 3, 2015 are as follows:
|
Fiscal year
|
Amount
|
|||
|
(In thousands)
|
||||
|
2015
|
$
|
4,125
|
|
|
|
2016
|
3,702
|
|
||
|
2017
|
3,440
|
|
||
|
2018
|
3,449
|
|
||
|
2019
|
3,534
|
|
||
|
Thereafter
|
22,708
|
|
||
|
$
|
40,958
|
|
||
The domestic and foreign components of Income (loss) before income taxes were as follows:
|
Year Ended
|
||||||||||||
|
(In thousands)
|
January 3, 2015
|
December 28, 2013
|
December 29, 2012
|
|||||||||
|
Domestic
|
$
|
6,292
|
|
$
|
6,293
|
|
$
|
51,859
|
|
|||
|
Foreign
|
36,649
|
|
20,193
|
|
(60,720
|
)
|
||||||
|
Income (loss) before taxes
|
$
|
42,941
|
|
$
|
26,486
|
|
$
|
(8,861
|
)
|
|||
55
The components of the income tax (benefit) expense are as follows:
|
Year Ended
|
||||||||||||
|
(In thousands)
|
January 3,
2015 |
December 28,
2013 |
December 29,
2012 |
|||||||||
|
Current:
|
||||||||||||
|
Federal
|
$
|
329
|
|
$
|
251
|
|
$
|
(344
|
)
|
|||
|
State
|
5
|
|
(527
|
)
|
36
|
|
||||||
|
Foreign
|
1,944
|
|
1,616
|
|
1,498
|
|
||||||
|
2,278
|
|
1,340
|
|
1,190
|
|
|||||||
|
Deferred:
|
||||||||||||
|
Federal
|
(7,416
|
)
|
2,549
|
|
18,000
|
|
||||||
|
State
|
(513
|
)
|
342
|
|
1,487
|
|
||||||
|
Foreign
|
12
|
|
(66
|
)
|
68
|
|
||||||
|
(7,917
|
)
|
2,825
|
|
19,555
|
|
|||||||
|
Income tax (benefit) expense
|
$
|
(5,639
|
)
|
$
|
4,165
|
|
$
|
20,745
|
|
|||
Income tax (benefit) expense differs from the amount of income tax determined by applying the applicable U.S. statutory federal income tax rate to pretax income as a result of the following differences:
|
Year Ended
|
||||||
|
January 3,
2015 |
December 28,
2013 |
December 29,
2012 |
||||
|
%
|
%
|
%
|
||||
|
Statutory federal rate
|
35
|
35
|
35
|
|||
|
Adjustments for tax effects of:
|
||||||
|
State taxes, net
|
1
|
2
|
(2)
|
|||
|
Research and development credits
|
(9)
|
(11)
|
(1)
|
|||
|
Stock compensation
|
1
|
3
|
(3)
|
|||
|
Foreign rate differential
|
(25)
|
(20)
|
(252)
|
|||
|
Foreign dividends
|
1
|
—
|
3
|
|||
|
Capital loss expiration
|
7
|
2
|
—
|
|||
|
Valuation allowance
|
(23)
|
6
|
(19)
|
|||
|
Change in uncertain tax benefit accrual
|
1
|
(1)
|
3
|
|||
|
Tax rate change
|
(4)
|
(1)
|
—
|
|||
|
Other
|
2
|
1
|
2
|
|||
|
Effective income tax rate
|
(13)
|
16
|
(234)
|
|||
ASC 740, “Income Taxes”, provides for the recognition of deferred tax assets if realization of these assets is more-likely-than-not. We evaluate both positive and negative evidence to determine if some or all of our deferred tax assets should be recognized on a quarterly basis.
On December 31, 2011, we began to implement a global tax structure to more effectively align the Company's corporate structure with the geographic business operations including responsibility for sales and manufacturing activities. The global tax structure was completed during the first quarter of 2012 upon the intercompany sale of inventory and fixed assets. During 2012, this inventory was sold to end customers in the ordinary course of business resulting in income before taxes in the U.S. and a loss before taxes in foreign jurisdictions. Because these foreign jurisdictions have 0% income tax rates, we received no tax benefit associated with the losses resulting in a significant foreign rate differential. Taxes have been applied to the gain on sale based on U.S. statutory tax rates, offset by deferred tax assets. This resulted in an increase to the effective tax rate and a net income tax provision of
$13.7 million
during 2012.
During the fourth quarter of 2014, we concluded that it was more-likely-than-not that we would be able to realize the benefit of a portion of our remaining deferred tax assets, resulting in a tax benefit of
$11.5 million
and a federal and state net deferred tax
56
asset of
$21.3 million
. We based this conclusion on improved operating results over the past two years and our expectations about generating taxable income in the foreseeable future. We exercised significant judgment and considered estimates about our ability to generate revenue, gross profits, operating income and jurisdictional taxable income in future periods under our tax structure in reaching this decision. We will continue to evaluate both positive and negative evidence in future periods to determine if additional deferred tax assets should be recognized. We do not have a valuation allowance in any foreign jurisdictions as it has been concluded it is more-likely-than-not that we will realize the net deferred tax assets in future periods. The net decrease in the total valuation allowance affecting the effective tax rate for the year ended
January 3, 2015
was approximately
$9.7 million
.
The components of our net deferred tax assets are as follows:
|
(In thousands)
|
January 3,
2015 |
December 28,
2013 |
||||||
|
Deferred tax assets:
|
||||||||
|
Accrued expenses and reserves
|
$
|
5,416
|
|
$
|
4,959
|
|
||
|
Stock-based and deferred compensation
|
5,530
|
|
4,986
|
|
||||
|
Intangible assets
|
9,841
|
|
8,456
|
|
||||
|
Fixed assets
|
983
|
|
828
|
|
||||
|
Net operating loss carry forwards
|
96,543
|
|
101,144
|
|
||||
|
Tax credit carry forwards
|
40,588
|
|
36,644
|
|
||||
|
Capital loss carry forwards
|
4,142
|
|
6,698
|
|
||||
|
Unrealized loss on securities
|
—
|
|
758
|
|
||||
|
Other
|
220
|
|
143
|
|
||||
|
163,263
|
|
164,616
|
|
|||||
|
Less: valuation allowance
|
(141,215
|
)
|
(150,528
|
)
|
||||
|
Net deferred tax assets
|
22,048
|
|
14,088
|
|
||||
|
Deferred tax liabilities:
|
||||||||
|
Other
|
717
|
|
969
|
|
||||
|
Total deferred tax liabilities
|
717
|
|
969
|
|
||||
|
Net deferred tax assets
|
$
|
21,331
|
|
$
|
13,119
|
|
||
Of the total Net deferred tax assets,
$1.2 million
and
$1.4 million
are considered current and included in Prepaid expenses and other current assets on the Consolidated Balance Sheets as of
January 3, 2015
and
December 28, 2013
, respectively.
At
January 3, 2015
, we had federal net operating loss carryforwards (pretax) of approximately
$301.8 million
that expire at various dates between
2023
and
2032
. We had state net operating loss carryforwards (pretax) of approximately
$141.3 million
that expire at various dates from
2015
through
2032
. We also had federal and state credit carryforwards of
$17.7 million
and
$26.3 million
of which
$24.5 million
do not expire. The remaining credits expire at various dates from
2015
through
2034
.
Future utilization of federal and state net operating losses and tax credit carry forwards may be limited if cumulative changes to ownership exceed
50%
within any
three
-year period, which has not occurred through fiscal 2014. However, if there is a significant change in ownership, the future utilization may be limited and the deferred tax asset would be reduced to the amount available.
At
January 3, 2015
, U.S. income taxes were not provided for approximately
$3.3 million
of the undistributed earnings of our Chinese subsidiary. We intend to reinvest these earnings indefinitely. If these earnings were distributed to the U.S. in the form of dividends or otherwise, we would be subject to additional U.S. income taxes and foreign withholding taxes.
At
January 3, 2015
, our unrecognized tax benefits associated with uncertain tax positions were
$18.7 million
, of which
$17.4 million
, if recognized, would affect the effective tax rate, subject to valuation allowance. As of
January 3, 2015
, interest and penalties associated with unrecognized tax benefits were
$0.2 million
.
57
The following table summarizes the changes to unrecognized tax benefits for fiscal years 2014, 2013 and 2012:
|
(In thousands)
|
Amount
|
|||
|
Balance at December 31, 2011
|
21,552
|
|
||
|
Additions based on tax positions related to the current year
|
384
|
|
||
|
Additions based on tax positions of prior years
|
192
|
|
||
|
Reduction for tax positions of prior years
|
(26
|
)
|
||
|
Settlements
|
(30
|
)
|
||
|
Reduction as a result of lapse of applicable statute of limitations
|
(392
|
)
|
||
|
Balance at December 29, 2012
|
$
|
21,680
|
|
|
|
Additions based on tax positions related to the current year
|
1,600
|
|
||
|
Additions based on tax positions of prior years
|
68
|
|
||
|
Reduction for tax positions of prior years
|
—
|
|
||
|
Settlements
|
(338
|
)
|
||
|
Reduction as a result of lapse of applicable statute of limitations
|
(367
|
)
|
||
|
Balance at December 28, 2013
|
22,643
|
|
||
|
Additions based on tax positions related to the current year
|
770
|
|
||
|
Additions based on tax positions of prior years
|
—
|
|
||
|
Reduction for tax positions of prior years
|
(4,673
|
)
|
||
|
Settlements
|
—
|
|
||
|
Reduction as a result of lapse of applicable statute of limitations
|
(67
|
)
|
||
|
Balance at January 3, 2015
|
18,673
|
|
||
At
January 3, 2015
, it was reasonably possible that
$14.2 million
of unrecognized tax benefits and less than
$0.1 million
of associated interest and penalties could significantly change during the next twelve months. The
$14.2 million
potential change would represent a decrease in unrecognized tax benefits, with
$14.1 million
related to the valuation of our intellectual property sold to our Bermuda subsidiary, which is currently under tax authority examination. The remaining
$0.1 million
related to tax filings for years that will no longer be subject to examination under expiring statutes of limitations.
Our U.S. and French income tax returns are both currently under examination for 2011 and 2012, as well as our Singapore income tax return for 2012. We are not under examination in any state jurisdictions or any other foreign jurisdictions.
We are subject to federal and state income tax as well as income tax in the various foreign jurisdictions in which we operate. Additionally, the years that remain subject to examination are 2011 for federal income taxes, 2010 for state income taxes, and 2008 for foreign income taxes, including years ending thereafter. However, to the extent allowed by law, the tax authorities may have the right to examine prior periods where net operating losses or tax credits were generated and carried forward, and make adjustments up to the amount of the net operating losses or credit carryforward amount.
The American Taxpayer Relief Act of 2012, which reinstated the United States federal research and development tax credit retroactively from January 1, 2012 through December 31, 2013, was not enacted into law until the first quarter of 2013. The Tax Increase Prevention Tax Act of 2014 was enacted into law in the fourth quarter of 2014 and extended the research and development tax credit through December 31, 2014. The tax benefit in each year resulting from these reinstatements of the federal research and development tax credit was offset by a valuation allowance and therefore did not impact our annual effective tax rate.
In October 2012, the Company's Board of Directors adopted the "2012 restructuring plan." In connection with this restructuring plan, the Company reduced its headcount by approximately
110
employees and eliminated certain sites, including its sites in Pennsylvania and Illinois. In connection with this action, the Company recorded Restructuring charges in the Statements of Operations of approximately
$17 thousand
and approximately
$0.4 million
during 2014 and 2013, respectively. In 2012, the Company recorded Restructuring charges of
$5.4 million
related to the 2012 restructuring plan and
$0.7 million
related to the 2011 restructuring plan which was completed during the second quarter of 2012.
58
The following table displays the activity related to the restructuring plans described above:
|
(In thousands)
|
Severance and related
|
Lease termination
|
Other
|
Total
|
|||||||||||
|
Balance at December 31, 2011
|
$
|
1,556
|
|
$
|
26
|
|
$
|
—
|
|
$
|
1,582
|
|
|||
|
Restructuring charges
|
4,277
|
|
1,083
|
|
776
|
|
6,136
|
|
|||||||
|
Cash payments
|
(3,356
|
)
|
(302
|
)
|
(518
|
)
|
(4,176
|
)
|
|||||||
|
Adjustments to prior restructuring costs
|
(104
|
)
|
(14
|
)
|
—
|
|
(118
|
)
|
|||||||
|
Balance at December 29, 2012
|
$
|
2,373
|
|
$
|
793
|
|
$
|
258
|
|
$
|
3,424
|
|
|||
|
Restructuring charges
|
109
|
|
224
|
|
253
|
|
586
|
|
|||||||
|
Cash payments
|
(2,315
|
)
|
(740
|
)
|
(225
|
)
|
(3,280
|
)
|
|||||||
|
Adjustments to prior restructuring costs
|
(150
|
)
|
91
|
|
(139
|
)
|
(198
|
)
|
|||||||
|
Balance at December 28, 2013
|
$
|
17
|
|
$
|
368
|
|
$
|
147
|
|
$
|
532
|
|
|||
|
Restructuring charges
|
—
|
|
1
|
|
9
|
|
10
|
|
|||||||
|
Cash payments
|
(8
|
)
|
(341
|
)
|
(18
|
)
|
(367
|
)
|
|||||||
|
Adjustments to prior restructuring costs
|
(9
|
)
|
15
|
|
1
|
|
7
|
|
|||||||
|
Balance at January 3, 2015
|
$
|
—
|
|
$
|
43
|
|
$
|
139
|
|
$
|
182
|
|
|||
On
March 3, 2014
, the Company's Board of Directors approved a stock repurchase program pursuant to which up to
$20.0 million
of outstanding common stock may be repurchased from time to time. The duration of the repurchase program is twelve months. Under this program during fiscal
2014
, approximately
1.9 million
shares were repurchased for
$13.1 million
. At
January 3, 2015
, we had approximately
$6.9 million
remaining under the approved program. All shares repurchased under this program were retired by
January 3, 2015
. All repurchases were open market transactions funded from available working capital. The 2014 program was completed during February 2015 for the approved amount.
On
February 27, 2013
, the Company's Board of Directors approved a stock repurchase program pursuant to which up to
$20.0 million
of outstanding common stock may be repurchased from time to time. The duration of the repurchase program was twelve months. During fiscal 2013, approximately
0.8 million
shares were repurchased at
$3.7 million
. At December 28, 2013, we had approximately
$16.3 million
remaining under the approved program. All shares repurchased under this program were retired by December 28, 2013. All repurchases were open market transactions funded from available working capital.
Employee and Director Stock Options, Restricted Stock and ESPP
We have four equity incentive plans (the "1996 Stock Incentive Plan," the "2001 Stock Plan," the "2013 Incentive Plan" and the "2011 Non-Employee Director Equity Incentive Plan"). Awards granted under the 1996 Stock Incentive Plan and the 2001 Stock Plan remain outstanding, but no shares are available for future awards under these plans. Shares remain available for grants to employees and non-employee directors only under the 2013 Incentive Plan and the 2011 Non-Employee Director Equity Incentive Plan. "Incentive stock options" under Section 422 of the U.S. Internal Revenue Code and restricted stock unit ("RSU") grants are part of our equity compensation practices for employees who receive equity grants. Options and RSUs generally vest quarterly over a four-year period beginning on the grant date. The contractual terms of options granted do not exceed ten years.
At January 3, 2015, a total of
9.6 million
shares of our common stock were available for future grants under the Plans. Shares subject to stock option grants that expire or are canceled, without delivery of such shares, generally become available for re-issuance under the Plans.
In May 2012, the Company's stockholders approved the 2012 Employee Stock Purchase Plan ("2012 ESPP"). The Plan authorizes the issuance of
3,000,000
shares of common stock to eligible employees to purchase shares of common stock through payroll deductions, which cannot exceed
10%
of an employee's compensation. The purchase price of the shares is the lower of
85%
of the fair market value of the stock at the beginning of each six-month offering period or
85%
of the fair market value at the end of such period. Employees are required to hold purchased shares for six months. We have treated the 2012 ESPP as a compensatory plan, and recorded related compensation expense of
$0.3 million
,
$0.2 million
and less than
$0.1 million
for the fiscal years 2014, 2013 and 2012, respectively. At January 3, 2015, a total of
2.5 million
shares of our common stock were available for future purchases under the 2012 ESPP.
59
The Company's ESPP, which was amended and approved by our stockholders in May 2007 ("2007 ESPP"), permits eligible employees to purchase shares of common stock through payroll deductions, not to exceed 10% of an employee's compensation. The purchase price of the shares is the lower of
85%
of the fair market value of the stock at the beginning of each six-month offering period or
85%
of the fair market value at the end of such period, but in no event less than the book value per share at the mid-point of each offering period. An aggregate of
5,500,000
shares of common stock have been authorized for issuance under the plan. We have treated the 2007 ESPP as a compensatory plan and recorded compensation expense related to the 2007 ESPP of
$0.1 million
for fiscal 2012. The 2007 ESPP was replaced with the 2012 ESPP in May 2012.
Stock-Based Compensation
Total stock-based compensation expense included in our Consolidated Statements of Operations was as follows:
|
Year Ended
|
||||||||||||
|
(In thousands)
|
January 3,
2015 |
December 28,
2013 |
December 29,
2012 |
|||||||||
|
Line item:
|
||||||||||||
|
Cost of products sold
|
$
|
819
|
|
$
|
627
|
|
$
|
525
|
|
|||
|
Research and development
|
5,176
|
|
3,916
|
|
3,009
|
|
||||||
|
Selling, general and administrative
|
6,807
|
|
4,979
|
|
3,976
|
|
||||||
|
Total stock-based compensation
|
$
|
12,802
|
|
$
|
9,522
|
|
$
|
7,510
|
|
|||
ASC 718, “Compensation-Stock Compensation (“ASC 718”),” requires that we recognize compensation expense for only the portion of employee and director options and ESPP rights that are expected to vest.
The fair value of each option award is estimated on the date of grant using the Black-Scholes valuation model and the assumptions noted in the following table. Beginning January 1, 2006, in connection with the adoption of ASC 718, the Company examined the historical pattern of option exercises in an effort to determine if there were any discernible activity patterns based on certain employee populations. From this analysis, the Company identified
two
employee populations. Prior to January 3, 2009, the Company used the simplified method as prescribed by the SEC's Staff Accounting Bulletin No. 107. The Company now believes that it has sufficient internal historical data to refine the expected term assumption. As such, the expected term computation is based on historical vested option exercises and includes an estimate of the expected term for options that were fully vested and outstanding at January 3, 2009 for each of the
two
populations identified. The expected volatility of both stock options and ESPP shares is based on the daily historical volatility of our stock price, measured over the expected term of the option or the ESPP purchase period. The risk-free interest rate is based on the implied yield on a U.S. Treasury zero-coupon issue with a remaining term closest to the expected term of the option. The dividend yield reflects that we have not paid any cash dividends since inception and do not intend to pay any cash dividends in the foreseeable future.
|
Year Ended
|
|||||
|
January 3,
2015 |
December 28,
2013 |
December 29,
2012 |
|||
|
Employee and Director Stock Options
|
|||||
|
Expected volatility
|
45.4% to 50.4%
|
51.4% to 54.3%
|
58.1% to 59.5%
|
||
|
Risk-free interest rate
|
1.5%-1.7%
|
0.7% to 1.0%
|
0.6% to 1.0%
|
||
|
Expected term
|
4.1 to 4.7 years
|
4.1 to 4.5 years
|
4.1 to 4.5 years
|
||
|
Dividend yield
|
—%
|
—%
|
—%
|
||
|
Employee Stock Purchase Plan
|
|||||
|
Weighted average expected volatility
|
38.7%
|
48.0%
|
50.0%
|
||
|
Weighted average risk-free interest rate
|
0.08%
|
0.11%
|
0.12%
|
||
|
Expected term
|
6 months
|
6 months
|
6 months
|
||
|
Dividend yield
|
—%
|
—%
|
—%
|
||
At January 3, 2015, there was
$10.0 million
of total unrecognized compensation cost related to unvested employee and director stock options, which is expected to be recognized over a weighted average period of
4.6 years
. Our current practice is to issue new shares to satisfy option exercises. Compensation expense for all stock-based compensation awards is recognized using the straight-line method.
60
The following table summarizes our stock option activity and related information for the year ended January 3, 2015:
|
(Shares and aggregate intrinsic value in thousands)
|
Shares
|
Weighted
average exercise price |
Weighted average
remaining contractual term (years) |
Aggregate
Intrinsic Value |
||||||||
|
Balance, December 28, 2013
|
10,441
|
|
$
|
4.88
|
|
|||||||
|
Granted
|
1,932
|
|
7.16
|
|
||||||||
|
Exercised
|
(2,486
|
)
|
4.41
|
|
||||||||
|
Forfeited or expired
|
(512
|
)
|
5.41
|
|
||||||||
|
Balance, January 3, 2015
|
9,375
|
|
$
|
5.45
|
|
|||||||
|
Vested and expected to vest at January 3, 2015
|
9,375
|
|
$
|
5.45
|
|
4.56
|
$
|
14,427
|
|
|||
|
Exercisable, January 3, 2015
|
5,114
|
|
$
|
5.01
|
|
3.66
|
$
|
9,827
|
|
|||
The aggregate intrinsic value in the table above represents the total pretax intrinsic value (the difference between the Company's closing stock price on the last trading day of the fiscal year and the exercise price, multiplied by the number of in-the-money options) that would have been received by the option holders had all option holders exercised their options on that day. This amount changes based on the fair market value of the Company's stock. Total intrinsic value of options exercised for fiscal 2014, 2013 and 2012, and was
$7.8 million
,
$2.5 million
and
$3.4 million
, respectively. The total fair value of options and RSUs vested and expensed in fiscal 2014, 2013 and 2012 and was
$12.8 million
,
$9.3 million
and
$7.4 million
, respectively.
The resultant grant date weighted-average fair values calculated using the Black-Scholes option pricing model and the noted assumptions for stock options granted were
$2.93
,
$2.10
and
$2.74
for fiscal years 2014, 2013 and 2012, respectively. The weighted average fair values calculated using the Black-Scholes option pricing model for the ESPP were
$1.73
,
$1.29
and
$1.35
for fiscal years 2014, 2013 and 2012, respectively.
The following table summarizes our RSU activity for the year ended January 3, 2015:
|
(Shares in thousands)
|
Shares
|
Weighted average grant date fair value
|
||||
|
Balance at December 28, 2013
|
2,190
|
|
$
|
5.49
|
|
|
|
Granted
|
1,316
|
|
7.50
|
|
||
|
Vested
|
(1,302
|
)
|
5.61
|
|
||
|
Forfeited
|
(183
|
)
|
6.18
|
|
||
|
Balance at January 3, 2015
|
2,021
|
|
$
|
6.66
|
|
|
At January 3, 2015, there was
$11.1 million
of total unrecognized compensation cost related to unvested RSUs. Our current practice is to issue new shares when RSUs vest. Compensation expense for RSUs is recognized using the straight-line method over the related vesting period.
At January 3, 2015, a total of
9.6 million
shares of our common stock were available for future grants under our stock option plans. Shares subject to stock option grants that expire or are canceled without delivery of such shares generally become available for re-issuance under these plans. At January 3, 2015, a total of
2.5 million
shares of our common stock were available for future purchases under our ESPP.
During the fiscal year ended January 3, 2015, we granted
98,592
market-based, restricted stock units in
two
equal tranches, each of which vest upon achievement of certain market-based conditions. The fair values of the market-based restricted stock units were determined and fixed on the date of grant using a lattice-based option-pricing valuation model, which incorporates a Monte-Carlo simulation, and considered the likelihood that we would achieve the market-based conditions. During the first quarter of fiscal 2014, the first tranche of
49,296
restricted stock units vested and we incurred stock compensation expense related to performance based awards of
$0.5 million
. During the second quarter of fiscal 2014, the second tranche of
49,296
restricted stock units vested and we incurred stock compensation expense related to performance based awards of
$0.2 million
, amounting to a total stock compensation expense related to performance based awards of
$0.7 million
for the fiscal year ended January 3, 2015.
61
Qualified Investment Plan
In 1990, we adopted a 401(k) plan, which provides participants with an opportunity to accumulate funds for retirement. The plan does not allow investments in the Company's common stock. The plan allows for the Company to make discretionary matching contributions in cash. The Company recorded
no
matching contributions in fiscal 2014 or 2013, but matched contributions for a total of
$0.8 million
in fiscal 2012.
2013 Cash Incentive Plan
On February 4, 2013, upon the recommendation of the Compensation Committee, the Board of Directors of the Company approved the 2013 Cash Incentive Plan (the “2013 Cash Plan”). The Chief Executive Officer, other executive officers, and other members of senior management, including vice presidents and director-level employees, together with all other employees of the Company not on the Company's sales incentive plan are eligible to participate in the 2013 Cash Plan. Under the 2013 Cash Plan, individual cash incentive payments for the eligible employees will be based both on Company financial performance, as measured by achievement of operating income (before incentive plan accruals) and revenue goals within specified ranges established by the Compensation Committee, and Company performance, as measured by the achievement of personal management objectives. The Compensation Committee will determine the performance of the chief executive officer, the chief financial officer and other participants based on the achievement of the management objectives established by the committee during the first fiscal quarter of 2013. There was
$11.3 million
of expense recorded under this plan in fiscal 2013.
2014 Cash Incentive Plan
On February 3, 2014, upon the recommendation of the Compensation Committee, the Board of Directors of the Company approved the 2014 Cash Incentive Plan (the “2014 Cash Plan”). The Chief Executive Officer, other executive officers, and other members of senior management, including vice presidents and director-level employees, together with all other employees of the Company not on the Company's sales incentive plan are eligible to participate in the 2014 Cash Plan. Under the 2014 Cash Plan, individual cash incentive payments for the eligible employees will be based both on Company financial performance, as measured by achievement of operating income (before incentive plan accruals) and revenue goals within specified ranges established by the Compensation Committee, and Company performance, as measured by the achievement of personal management objectives. The Compensation Committee will determine the performance of the chief executive officer, the chief financial officer and other participants based on the achievement of the management objectives established by the committee during the first fiscal quarter of 2014. There was
$11.6 million
of expense recorded under this plan in fiscal 2014.
In November 2014, a patent infringement lawsuit was filed by Papst Licensing GmbH & Co., KG ("Papst") against us in the U.S. District Court for the District of Delaware. In the complaint, Papst alleges that certain of the simulator or simulation products sold by the Company may infringe one or more of the patents held by Papst. No discovery has been conducted with respect to these allegations. At this stage of the proceedings, Lattice does not have an estimate of the likelihood or the amount of any potential exposure to the Company. The Company believes that it possesses defenses to these claims and intends to vigorously defend this litigation. It is reasonably possible that the actual losses may exceed our accrued liabilities, however, and we cannot currently estimate such amount.
On or about January 29, 2015, Silicon Image, Inc., members of its Board, the Company and the Company’s wholly-owned merger acquisition subsidiary, were named as defendants in two complaints filed in Santa Clara Superior Court by alleged stockholders in connection with the proposed merger of Silicon Image and the Company. Both complaints were dated January 29, 2015 and were captioned respectively
Molland v. George, et al
. and
Stein v. Silicon Image, Inc. et. al
. Five additional complaints were subsequently filed on January 30, 2015, February 4, 2015 and February 9, 2015 in Delaware Chancery Court by alleged stockholders of Silicon Image, Inc. in connection with the Merger, captioned respectively
Pfeiffer v. Martino et. al
.;
Lipinski v. Silicon Image, Inc. et. al
.;
Feldbaum et. al. v. Silicon Image, Inc
.
et. al
;
Nelson v. Silicon Image, Inc. et. al
. and
Partansky v. Silicon Image, Inc. et. al
. The five Delaware matters were subsequently consolidated into an action captioned In re Silicon Image Stockholders Litigation by order of the Delaware Chancery Court on February 11, 2015, and a consolidated amended complaint was filed in the matter on February 13, 2015. Two complaints captioned
Tapia v. Silicon Image, Inc. et. al
. and
Caldwel v. Silicon Image, Inc
. were also filed on February 4, 2015 and February 9, 2015 in Santa Clara Superior Court by alleged stockholders in connection with the Merger. Amended complaints were filed in the
Molland
and
Stein
actions on February 11, 2015.
Each of these lawsuits are purported class actions brought on behalf of Silicon Image stockholders, asserting claims against each member of the Board for breach of fiduciary duty, and against various of the Silicon Image, Silicon Image’s Board, the Company, and the Company’s wholly-owned merger subsidiary for aiding and abetting breach of fiduciary duty. The lawsuits allege that the Merger does not appropriately value Silicon Image, was the result of an inadequate process, and includes
62
preclusive deal devices. The amended complaints also assert that the Silicon Image’s disclosures regarding the Merger in its Schedule 14D-9 omitted material information regarding the Merger. Each of these complaints purport to seek unspecified damages and may seek injunctive relief preventing consummation of the transactions.
The Company believes that the claims in these complaints are without merit and intends to vigorously defend this litigation.
An adverse judgment for monetary damages could have an adverse effect on the operations of the Company. A preliminary injunction could delay or jeopardize the completion of the Merger, and an adverse judgment granting permanent injunctive relief could indefinitely enjoin completion of the Merger.
We are also exposed to certain other asserted and unasserted potential claims. There can be no assurance that, with respect to potential claims made against us, we could resolve such claims under terms and conditions that would not have a material adverse effect on our business, our liquidity or our financial results. Periodically, we review the status of each significant matter and assess its potential financial exposure. If the potential loss from any claim or legal proceeding is considered probable and a range of possible losses can be estimated, we then accrue a liability for the estimated loss based on the provisions of FASB ASC 450, “Contingencies" (“ASC 450”). Legal proceedings are subject to uncertainties, and the outcomes are difficult to predict. Because of such uncertainties, accruals are based only on the best information available at the time. As additional information becomes available, we reassess the potential liability related to pending claims and litigation and may revise estimates. Presently, no accrual has been estimated under ASC 450 for potential losses that may or may not arise from the current lawsuits in which we are involved.
The following table displays the activity related to changes in our valuation and qualifying accounts:
|
(In thousands)
|
Balance at
beginning of period |
Charged (Credit) to
costs and expenses |
Charged to
other accounts |
Write-offs
net of recoveries |
Balance at end
of period |
||||||||||||||
|
Fiscal year ended January 3, 2015
|
|||||||||||||||||||
|
Allowance for deferred taxes
|
150,528
|
|
(9,958
|
)
|
645
|
|
—
|
|
141,215
|
|
|||||||||
|
Allowance for doubtful accounts
|
878
|
|
—
|
|
—
|
|
(3
|
)
|
875
|
|
|||||||||
|
Allowance for warranty expense
|
—
|
|
81
|
|
—
|
|
—
|
|
81
|
|
|||||||||
|
151,406
|
|
(9,877
|
)
|
645
|
|
(3
|
)
|
142,171
|
|
||||||||||
|
Fiscal year ended December 28, 2013:
|
|||||||||||||||||||
|
Allowance for deferred taxes
|
149,209
|
|
1,636
|
|
(317
|
)
|
—
|
|
150,528
|
|
|||||||||
|
Allowance for doubtful accounts
|
1,122
|
|
41
|
|
—
|
|
(285
|
)
|
878
|
|
|||||||||
|
Allowance for warranty expense
|
—
|
|
—
|
|
—
|
|
—
|
|
—
|
|
|||||||||
|
150,331
|
|
1,677
|
|
(317
|
)
|
(285
|
)
|
151,406
|
|
||||||||||
|
Fiscal year ended December 29, 2012:
|
|||||||||||||||||||
|
Allowance for deferred taxes
|
$
|
147,499
|
|
$
|
1,652
|
|
$
|
58
|
|
$
|
—
|
|
$
|
149,209
|
|
||||
|
Allowance for doubtful accounts
|
939
|
|
286
|
|
—
|
|
(103
|
)
|
1,122
|
|
|||||||||
|
Allowance for warranty expense
|
—
|
|
—
|
|
—
|
|
—
|
|
—
|
|
|||||||||
|
$
|
148,438
|
|
$
|
1,938
|
|
$
|
58
|
|
$
|
(103
|
)
|
$
|
150,331
|
|
|||||
63
We operate in
one
industry segment comprising the design, development, manufacture and marketing of high performance programmable logic devices. Our revenue by major geographic area based on ship-to location was as follows:
|
|
Year Ended
|
||||||||||||||||||||
|
(In thousands)
|
January 3, 2015
|
December 28, 2013
|
December 29, 2012
|
||||||||||||||||||
|
United States:
|
$
|
30,848
|
|
8
|
%
|
$
|
28,506
|
|
9
|
%
|
34,172
|
|
12
|
%
|
|||||||
|
China
|
159,155
|
|
43
|
|
148,018
|
|
45
|
|
113,585
|
|
41
|
|
|||||||||
|
Europe
|
59,041
|
|
16
|
|
47,459
|
|
14
|
|
48,202
|
|
17
|
|
|||||||||
|
Japan
|
31,207
|
|
9
|
|
26,538
|
|
8
|
|
35,696
|
|
13
|
|
|||||||||
|
Taiwan
|
6,691
|
|
2
|
|
6,708
|
|
2
|
|
8,276
|
|
3
|
|
|||||||||
|
Other Asia
|
69,778
|
|
19
|
|
64,425
|
|
19
|
|
32,254
|
|
12
|
|
|||||||||
|
Other Americas
|
9,407
|
|
3
|
|
10,871
|
|
3
|
|
7,071
|
|
2
|
|
|||||||||
|
Total foreign revenue
|
335,279
|
|
92
|
|
304,019
|
|
91
|
|
245,084
|
|
88
|
|
|||||||||
|
Total revenue
|
$
|
366,127
|
|
100
|
%
|
$
|
332,525
|
|
100
|
%
|
$
|
279,256
|
|
100
|
%
|
||||||
We assign revenue to geographies based on the customer ship-to address at the point where revenue is recognized. In the case of sell-in distributors and OEM customers, revenue is typically recognized, and geography is assigned, when products are shipped to our distributor or customer. In the case of sell-through distributors, revenue is recognized when resale occurs and geography is assigned based on the customer location on the resale reports provided by the distributor.
Revenue by Distributors
Our largest customers are often distributors and sales through distributors have historically made up a significant portion of our total revenue. Revenue attributable to resales of products by our primary distributors are as follows:
|
% of Total Revenue
|
||||||||
|
2014
|
2013
|
2012
|
||||||
|
Arrow Electronics Inc. (including Nu Horizons Electronics)
|
24
|
%
|
23
|
%
|
28
|
%
|
||
|
Weikeng Group
|
10
|
|
12
|
|
12
|
|
||
|
All others
|
11
|
|
10
|
|
15
|
|
||
|
All sell-through distributors
|
45
|
%
|
45
|
%
|
55
|
%
|
||
Orders from our sell-through distributors are initially recorded at published list prices; however, for a majority of our sales, the final selling price is determined at the time of resale and in accordance with a distributor price agreement. In certain circumstances, we allow sell-through distributors to return unsold products. At times, we protect our sell-through distributors against reductions in published list prices. For these reasons, we do not recognize revenue until products are resold by sell-through distributors to an end customer.
64
A summary of the Company's consolidated quarterly results of operations is as follows:
|
2014
|
2013
|
|||||||||||||||||||||||||||||||
|
(In thousands, except per share data)
|
Q4 *
|
Q3
|
Q2
|
Q1
|
Q4
|
Q3
|
Q2
|
Q1
|
||||||||||||||||||||||||
|
Revenue
|
$
|
83,600
|
|
$
|
86,570
|
|
$
|
99,320
|
|
$
|
96,637
|
|
$
|
89,519
|
|
$
|
87,154
|
|
$
|
84,694
|
|
$
|
71,158
|
|
||||||||
|
Gross margin
|
46,263
|
|
50,811
|
|
54,975
|
|
54,138
|
|
48,603
|
|
46,376
|
|
45,110
|
|
38,155
|
|
||||||||||||||||
|
Restructuring charges
|
1
|
|
2
|
|
3
|
|
11
|
|
131
|
|
85
|
|
19
|
|
153
|
|
||||||||||||||||
|
Net income (loss)
|
15,419
|
|
9,406
|
|
11,771
|
|
11,984
|
|
6,547
|
|
8,844
|
|
5,040
|
|
1,890
|
|
||||||||||||||||
|
Basic net income per share
|
$
|
0.13
|
|
$
|
0.08
|
|
$
|
0.10
|
|
$
|
0.10
|
|
$
|
0.06
|
|
$
|
0.08
|
|
$
|
0.04
|
|
$
|
0.02
|
|
||||||||
|
Diluted net income per share
|
$
|
0.13
|
|
$
|
0.08
|
|
$
|
0.10
|
|
$
|
0.10
|
|
$
|
0.06
|
|
$
|
0.08
|
|
$
|
0.04
|
|
$
|
0.02
|
|
||||||||
* The fourth quarter of 2014 was a 14-week quarter as compared to the prior quarters in 2014 and 2013, which were based on our standard 13-week quarter.
65
Report of Independent Registered Public Accounting Firm
The Board of Directors and Stockholders
Lattice Semiconductor Corporation:
We have audited the accompanying consolidated balance sheets of Lattice Semiconductor Corporation and subsidiaries as of January 3, 2015 and December 28, 2013, and the related consolidated statements of operations, comprehensive income (loss), changes in stockholders’ equity, and cash flows for each of the years in the three-year period ended January 3, 2015. These consolidated financial statements are the responsibility of the Company’s management. Our responsibility is to express an opinion on these consolidated financial statements based on our audits.
We conducted our audits in accordance with the standards of the Public Company Accounting Oversight Board (United States). Those standards require that we plan and perform the audit to obtain reasonable assurance about whether the financial statements are free of material misstatement. An audit includes examining, on a test basis, evidence supporting the amounts and disclosures in the financial statements. An audit also includes assessing the accounting principles used and significant estimates made by management, as well as evaluating the overall financial statement presentation. We believe that our audits provide a reasonable basis for our opinion.
In our opinion, the consolidated financial statements referred to above present fairly, in all material respects, the financial position of Lattice Semiconductor Corporation and subsidiaries as of January 3, 2015 and December 28, 2013, and the results of their operations and their cash flows for each of the years in the three-year period ended January 3, 2015, in conformity with U.S. generally accepted accounting principles.
We also have audited, in accordance with the standards of the Public Company Accounting Oversight Board (United States), Lattice Semiconductor Corporation’s internal control over financial reporting as of January 3, 2015, based on criteria established in
Internal Control - Integrated Framework (1992)
issued by the Committee of Sponsoring Organizations of the Treadway Commission (COSO), and our report dated March 4, 2015 expressed an unqualified opinion on the effectiveness of the Company's internal control over financial reporting.
/s/ KPMG LLP
Portland, Oregon
March 4, 2015
66
Report of Independent Registered Public Accounting Firm
The Board of Directors and Stockholders
Lattice Semiconductor Corporation:
We have audited Lattice Semiconductor Corporation’s internal control over financial reporting as of January 3, 2015, based on criteria established in
Internal Control - Integrated Framework (1992)
issued by the Committee of Sponsoring Organizations of the Treadway Commission (COSO). Lattice Semiconductor Corporation’s management is responsible for maintaining effective internal control over financial reporting and for its assessment of the effectiveness of internal control over financial reporting, included in the accompanying Management’s Report on Internal Control Over Financial Reporting. Our responsibility is to express an opinion on the Company’s internal control over financial reporting based on our audit.
We conducted our audit in accordance with the standards of the Public Company Accounting Oversight Board (United States). Those standards require that we plan and perform the audit to obtain reasonable assurance about whether effective internal control over financial reporting was maintained in all material respects. Our audit included obtaining an understanding of internal control over financial reporting, assessing the risk that a material weakness exists, and testing and evaluating the design and operating effectiveness of internal control based on the assessed risk. Our audit also included performing such other procedures as we considered necessary in the circumstances. We believe that our audit provides a reasonable basis for our opinion.
A company’s internal control over financial reporting is a process designed to provide reasonable assurance regarding the reliability of financial reporting and the preparation of financial statements for external purposes in accordance with generally accepted accounting principles. A company’s internal control over financial reporting includes those policies and procedures that (1) pertain to the maintenance of records that, in reasonable detail, accurately and fairly reflect the transactions and dispositions of the assets of the company; (2) provide reasonable assurance that transactions are recorded as necessary to permit preparation of financial statements in accordance with generally accepted accounting principles, and that receipts and expenditures of the company are being made only in accordance with authorizations of management and directors of the company; and (3) provide reasonable assurance regarding prevention or timely detection of unauthorized acquisition, use, or disposition of the company’s assets that could have a material effect on the financial statements.
Because of its inherent limitations, internal control over financial reporting may not prevent or detect misstatements. Also, projections of any evaluation of effectiveness to future periods are subject to the risk that controls may become inadequate because of changes in conditions, or that the degree of compliance with the policies or procedures may deteriorate.
In our opinion, Lattice Semiconductor Corporation maintained, in all material respects, effective internal control over financial reporting as of January 3, 2015, based on criteria established in
Internal Control - Integrated Framework (1992)
issued by the Committee of Sponsoring Organizations of the Treadway Commission (COSO).
We also have audited, in accordance with the standards of the Public Company Accounting Oversight Board (United States), the consolidated balance sheets of Lattice Semiconductor Corporation and subsidiaries as of January 3, 2015 and December 28, 2013, and the related consolidated statements of operations, comprehensive income (loss), changes in stockholders’ equity, and cash flows for each of the years in the three-year period ended January 3, 2015, and our report dated March 4, 2015 expressed an unqualified opinion on those consolidated financial statements.
/s/ KPMG LLP
Portland, Oregon
March 4, 2015
67
None.
Conclusion Regarding the Effectiveness of Disclosure Controls and Procedures
Under the supervision and with the participation of our management, including our principal executive officer and principal financial officer, we conducted an evaluation of our disclosure controls and procedures, as such term is defined under Rule 13a-15(e) promulgated under the Securities Exchange Act of 1934, as amended. Based on this evaluation, our principal executive officer and our principal financial officer concluded that our disclosure controls and procedures were effective as of the end of the period covered by this annual report.
Management's Report on Internal Control Over Financial Reporting
The management of the Company is responsible for establishing and maintaining adequate internal control over financial reporting as defined in Rules 13a-15(f) or 15d-15(f) under the Securities Exchange Act of 1934. The Company's internal control over financial reporting is a process designed to provide reasonable assurance regarding reliability of financial reporting and the preparation and fair presentation of published financial statements for external purposes in accordance with generally accepted accounting principles.
Because of its inherent limitations, internal control over financial reporting may not prevent or detect misstatements. Also, projections of any evaluation of effectiveness to future periods are subject to the risk that controls may become inadequate because of changes in conditions, or that the degree of compliance with the policies or procedures may deteriorate.
Management assessed the effectiveness of the company's internal control over financial reporting as of January 3, 2015. In making this assessment, management used the criteria set forth by the Committee of Sponsoring Organizations of the Treadway Commission (COSO) in
Internal Control - Integrated Framework (1992)
. Based on this assessment, management concluded that, as of January 3, 2015, the Company's internal control over financial reporting was effective.
KPMG LLP, an independent registered public accounting firm, has audited the Company's financial statements in this report on Form 10-K and issued its report on the effectiveness of the Company's internal control over financial reporting as of January 3, 2015.
Changes in Internal Control over Financial Reporting
There were no changes in our internal controls over financial reporting (as defined in Rules 13a - 15(f) and 15(d) - 15(f) under the Exchanges Act) that occurred during the fourth quarter of fiscal 2014 that have materially affected, or are reasonably likely to materially affect, our internal control over financial reporting.
None.
68
Certain information required by Part III is incorporated by reference from our definitive proxy statement (the “Proxy Statement”) for the 2015 Annual Meeting of Stockholders, pursuant to Regulation 14A of the Securities Exchange Act of 1934, as amended, which we will file not later than 120 days after the end of the fiscal year covered by this report. With the exception of the information expressly incorporated by reference from the Proxy Statement, the Proxy Statement is not to be deemed filed as a part of this report.
Information regarding our directors that is required by this item is incorporated by reference from the information contained under the captions “Proposal 1: Election of Directors” and “Corporate Governance and Other Matters--Board Meetings and Committees” in the Proxy Statement. Information regarding our executive officers that is required by this item is set forth in Part I of this report under the caption “Executive Officers of the Registrant.”
Information regarding Section 16(a) reporting compliance that is required by this item is incorporated by reference from the information contained under the caption “Section 16(a) Beneficial Ownership Reporting Compliance” in the Proxy Statement.
We have adopted a Code of Conduct that applies to all of our employees, including our principal executive officer, principal financial officer, principal accounting officer, and persons performing similar functions. The Code of Conduct is posted on our website at www.latticesemi.com. We revised our Code of Conduct effective January 2014. Amendments to the Code of Conduct or any grant of a waiver from a provision of the code of ethics requiring disclosure under applicable SEC rules, if any, will be disclosed on our website at www.latticesemi.com.
Information about our “Director Code of Ethics” and written committee charters for our Audit Committee, Compensation Committee, and Nominating and Governance Committee are available free of charge on the Company's website at www.latticesemi.com and are available in print to any shareholder upon request.
There have been no material changes to the procedures by which security holders may recommend nominees to our Board of Directors since the filing of our Annual Report on Form 10-K for the year ended December 28, 2013. The procedures by which security holders may recommend nominees to our Board of Directors were described in detail in the information concerning our Nominating and Governance Committee under the caption “Board Meetings and Committees” in our Proxy Statement filed March 20, 2014.
Information regarding our Audit Committee that is required by this Item is incorporated by reference from the information concerning our Audit Committee contained under the caption “Corporate Governance and Other Matters--Board Meetings and Committees” in the Proxy Statement.
The information contained under the captions “Executive Compensation,” "Director Compensation," “Compensation Committee Interlocks and Insider Participation,” and “Compensation Committee Report” in the Proxy Statement is incorporated herein by reference.
The information contained under the captions “Security Ownership of Certain Beneficial Owners and Management” and "Equity Compensation Plan Information" in the Proxy Statement is incorporated herein by reference.
The information contained under the captions entitled “Certain Relationships and Related Transactions” and “Corporate Governance and Other Matters--Director Independence” in the Proxy Statement is incorporated herein by reference.
69
The information contained under the caption entitled “Audit and Related Fees” in the Proxy Statement is incorporated herein by reference.
70
(a) List of Documents Filed as Part of this Report
(1) All financial statements.
The following financial statements are filed as part of this report under Item 8.
|
Consolidated Financial Statements:
|
Page
|
|
Consolidated Balance Sheets
|
|
|
Consolidated Statements of Operations
|
|
|
Consolidated Statements of Comprehensive Income (Loss)
|
|
|
Consolidated Statements of Changes in Stockholders' Equity
|
|
|
Consolidated Statements of Cash Flows
|
|
|
Notes to Consolidated Financial Statements
|
|
All other schedules have been omitted because the required information is included in the Consolidated Financial Statements or the notes thereto, or is not applicable or required.
(2) Exhibits.
|
Exhibit Number
|
Description
|
|
|
2.1
|
Agreement and Plan of Merger, dated January 26, 2015, by and among Lattice Semiconductor Corporation, Cayabyab Merger Company and Silicon Image, Inc. (Incorporated by reference to Exhibit 2.1 filed with the Company’s Current Report on Form 8-K filed January 27, 2015).
|
|
|
3.1
|
The Company’s Restated Certificate of Incorporation filed, as amended on June 4, 2009 (Incorporated by reference to Exhibit 3.1 filed with the Company's Current Report on Form 8-K filed June 4, 2009).
|
|
|
3.2
|
The Company’s Bylaws, as amended and restated as of June 4, 2009 (Incorporated by reference to Exhibit 3.2 filed with the Company’s Current Report on Form 8-K filed June 4, 2009).
|
|
|
10.16*
|
Lattice Semiconductor Corporation Employee Stock Purchase Plan, as amended (incorporated by reference to Appendix B to the Company's Definitive Proxy Statement on Schedule 14A for the 2007 Annual Meeting of Stockholders filed on April 5, 2007).
|
|
|
10.24*
|
Lattice Semiconductor Corporation 1996 Stock Incentive Plan, as amended, and Related Form of Option Agreement (Incorporated by reference to Exhibit 10.24 filed with the Company's Annual Report on Form 10-K for the fiscal year ended December 29, 2012).
|
|
|
10.33*
|
2001 Outside Directors' Stock Option Plan, as amended and restated (Incorporated by reference to Exhibit 10.33 filed with the Company's Annual Report on Form 10-K for the fiscal year ended December 29, 2012).
|
|
|
10.34*
|
2001 Stock Plan, as amended, and related Form of Option Agreement (Incorporated by reference to Exhibit 10.34 filed with the Company's Annual Report on Form 10-K for the fiscal year ended December 29, 2012).
|
|
|
10.35
|
Intellectual Property Agreement by and between Agere Systems Inc. and Agere Systems Guardian Corporation and Lattice Semiconductor Corporation as Buyer, dated January 18, 2002 (Incorporated by reference to Exhibit 10.35 filed with the Company’s Annual Report on Form 10-K for the fiscal year ended December 29, 2001).
|
|
71
|
Exhibit Number
|
Description
|
|
|
10.37*
|
Lattice Semiconductor Corporation Executive Deferred Compensation Plan, as amended and restated effective as of August 11, 1997 (Incorporated by reference to Exhibit 99.3 filed with the Company’s Registration Statement on Form S-3, as amended, dated October 17, 2002).
|
|
|
10.38*
|
Amendment No. 1 to the Lattice Semiconductor Corporation Executive Deferred Compensation Plan, as amended, dated November 19, 1999 (Incorporated by reference to Exhibit 99.4 filed with the Company’s Registration Statement on Form S-3, as amended, dated October 17, 2002).
|
|
|
10.41*
|
Form of Indemnification Agreement executed by each director and executive officer of the Company and certain other officers and employees of the Company and its subsidiaries (Incorporated by reference to Exhibit 10.41 filed with the Company’s Annual Report on Form 10-K for the fiscal year ended January 3, 2004).
|
|
|
10.51*
|
Form of Amendment to Stock Option Agreements for 1996 Stock Incentive Plan, as amended, and 2001 Stock Plan, as amended (Incorporated by reference to Exhibit 99.3 filed with the Company’s Current Report on Form 8-K filed on December 12, 2005).
|
|
|
10.56*
|
Form of Notice of Grant of Restricted Stock Units to Executive Officer (Incorporated by reference to Exhibit 99.1 filed with the Company’s Current Report on Form 8-K filed on February 8, 2007).
|
|
|
10.63*
|
2009 Bonus Plan of Lattice Semiconductor Corporation (Incorporated by reference to Exhibit 10.63 filed with the Company’s Annual Report on Form 10-K for the fiscal year ended January 3, 2009).
|
|
|
10.66*
|
Employment Agreement between Lattice Semiconductor Corporation and Byron Milstead effective as of December 30, 2008 (Incorporated by reference to Exhibit 10.66 filed with the Company's Annual Report on Form 10-K filed for the fiscal year ended January 3, 2009).
|
|
|
10.67*
|
Employment Agreement between Lattice Semiconductor Corporation and Sean Riley dated September 22, 2008 (Incorporated by reference to Exhibit 10.67 filed with the Company's Current Report on Form 10-Q filed on May 8, 2009).
|
|
|
10.69*
|
Lattice Semiconductor Corporation 2010 Cash Incentive Compensation Plan (Incorporated by reference to Exhibit 10.69 filed with the Company's Annual Report on Form 10-K filed for the fiscal year ended January 2, 2010).
|
|
|
10.70*
|
Employment Agreement between Lattice Semiconductor Corporation and Darin G. Billerbeck dated as of November 8, 2010 (Incorporated by reference to Exhibit 10.70 filed with the Company's Quarterly Report on Form 10-Q for the quarter ended October 2, 2010).
|
|
|
10.71*
|
Employment Agreement between Lattice Semiconductor Corporation and Joe Bedewi dated as of April 11, 2011. (Incorporated by reference to Exhibit 10.71 filed with the Company's Quarterly Report on Form 10-Q for the quarter ended April 2, 2011).
|
|
|
10.72*
|
Lattice Semiconductor Corporation 2012 Employee Stock Purchase Plan (incorporated by reference to Annex 1 to the Company's Definitive Proxy Statement on Schedule 14A for the 2012 Annual Meeting of Stockholders filed on April 12, 2012).
|
|
|
10.74*
|
Lattice Semiconductor Corporation Amended 2011 Non-Employee Director Equity Incentive Plan (Incorporated by reference to Appendix B to the Company's Definitive Proxy Statement on Schedule 14A for the 2014 Annual Meeting of Stockholders filed on March 20, 2014).
|
|
|
10.75*
|
Lattice Semiconductor Corporation 2013 Incentive Plan (Incorporated by reference to Appendix A to the Company's Definitive Proxy Statement on Schedule 14A for the 2014 Annual Meeting of Stockholders filed on March 20, 2014).
|
|
|
10.76
|
Office Lease, effective as of October 21, 2014, between 555 SW Oak, LLC and Lattice Semiconductor Corporation (Incorporated by reference to Exhibit 10.1 filed with the Company’s Current Report on Form 8-K filed October 27, 2014)
.
|
|
|
10.77*
|
Lattice Semiconductor Corporation 2013 Cash Incentive Plan
|
|
|
10.78*
|
Lattice Semiconductor Corporation 2014 Cash Incentive Plan
|
|
72
|
Exhibit Number
|
Description
|
|
|
21.1
|
Subsidiaries of the Registrant.
|
|
|
23.1
|
Consent of Independent Registered Public Accounting Firm.
|
|
|
31.1
|
Certification of Chief Executive Officer pursuant to Rule 13a-14(a) of the Securities Exchange Act of 1934, as amended.
|
|
|
31.2
|
Certification of Chief Financial Officer pursuant to Rule 13a-14(a) of the Securities Exchange Act of 1934, as amended.
|
|
|
32.1
|
Certification of Chief Executive Officer pursuant to 18 U.S.C. 1350, as adopted pursuant to Section 906 of the Sarbanes-Oxley Act of 2002.
|
|
|
32.2
|
Certification of Chief Financial Officer pursuant to 18 U.S.C. 1350, as adopted pursuant to Section 906 of the Sarbanes-Oxley Act of 2002.
|
|
|
101.INS
|
XBRL Instance Document
|
|
|
101.SCH
|
XBRL Taxonomy Extension Schema Document
|
|
|
101.CAL
|
XBRL Taxonomy Extension Calculation Linkbase Document
|
|
|
101.DEF
|
XBRL Taxonomy Extension Definition Linkbase Document
|
|
|
101.LAB
|
XBRL Taxonomy Extension Labels Linkbase Document
|
|
|
101.PRE
|
XBRL Taxonomy Extension Presentation Linkbase Document
|
|
|
*
|
Management contract or compensatory plan or arrangement required to be filed as an Exhibit to this Annual Report on Form 10-K pursuant to Item 15(b) thereof.
|
73
SIGNATURES
Pursuant to the requirements of Section 13 or 15(d) of the Securities Exchange Act of 1934, the registrant has duly caused this report to be signed on its behalf by the undersigned, thereunto duly authorized.
|
LATTICE SEMICONDUCTOR CORPORATION
|
|
|
(Registrant)
|
|
|
By:
|
/s/ Joe Bedewi
|
|
Joe Bedewi
Corporate Vice President and Chief Financial Officer
(Duly Authorized Officer and Principal Financial and Accounting Officer)
|
|
|
Date:
|
March 4, 2015
|
KNOW ALL PERSONS BY THESE PRESENTS, that each person whose signature appears below constitutes and appoints Darin G. Billerbeck and Joe Bedewi, or either of them, his or her attorneys-in-fact, each with the power of substitution, for such person in any and all capacities, to sign any amendments to this report and to file the same, with exhibits thereto and other documents in connection therewith, with the Securities and Exchange Commission, hereby ratifying and confirming all that either of said attorneys-in-fact, or his substitute or substitutes, may do or cause to be done by virtue hereof.
Pursuant to the requirements of the Securities Exchange Act of 1934, this report has been signed below by the following persons on behalf of the registrant in the capacities indicated and on the dates indicated:
|
Signature
|
Title
|
Date
|
|
Principal Executive Officer
|
||
|
/s/ D
ARIN
G. B
ILLERBECK
|
March 4, 2015
|
|
|
Darin G. Billerbeck
|
President, Chief Executive Officer and Director
|
|
|
Principal Financial and Accounting Officer
|
||
|
/s/ J
OE
B
EDEWI
|
March 4, 2015
|
|
|
Joe Bedewi
|
Corporate Vice President and Chief Financial Officer
|
|
|
Directors
|
||
|
/s/ R
OBIN
A
BRAMS
|
March 4, 2015
|
|
|
Robin Abrams
|
Director
|
|
|
/s/ J
OHN
B
OURGOIN
|
March 4, 2015
|
|
|
John Bourgoin
|
Director
|
|
|
/s/ R
OBERT
H
ERB
|
March 4, 2015
|
|
|
Robert Herb
|
Director
|
|
|
/s/ M
ARK
J
ENSEN
|
|
March 4, 2015
|
|
Mark Jensen
|
Director
|
|
|
/s/ P
ATRICK
S. J
ONES
|
March 4, 2015
|
|
|
Patrick S. Jones
|
Director
|
|
|
/s/ B
ALAJI
K
RISHNAMURTHY
|
March 4, 2015
|
|
|
Balaji Krishnamurthy
|
Director
|
|
|
/s/ J
EFF
R
ICHARDSON
|
March 4, 2015
|
|
|
Jeff Richardson
|
Director
|
|
74
TABLE OF CONTENTS
Part IItem 1. BusinessItem 1A. Risk FactorsItem 1B. Unresolved Staff CommentsItem 2. PropertiesItem 3. Legal ProceedingsItem 4. Mine Safety DisclosuresPart IIItem 5. Market For Registrant's Common Equity, Related Stockholder Matters & Issuer Purchases Of Equity SecuritiesItem 6. Selected Financial DataItem 7. Management's Discussion and Analysis Of Financial Condition and Results Of OperationsItem 7A. Quantitative and Qualitative Disclosures About Market RiskItem 8. Financial Statements and Supplementary DataNote 1 - Nature Of Operations and Significant Accounting PoliciesNote 2 - New Accounting PronouncementsNote 3 - Business Combinations and GoodwillNote 4 - Marketable SecuritiesNote 5 - Fair Value Of Financial InstrumentsNote 6 - InventoriesNote 7 - Property and EquipmentNote 8 - Intangible Assets and Acquisition Related ChargesNote 9 - Lease ObligationsNote 10 - Income TaxesNote 11 - RestructuringNote 12 - Common Stock Repurchase ProgramNote 13 - Stockholders' EquityNote 14 - Employee Benefit PlansNote 15 - Legal MattersNote 16 - Valuation and Qualifying AccountsNote 17 - Segment and Geographic InformationNote 18 - Quarterly Financial Data (unaudited)Item 9. Changes in and Disagreements with Accountants on Accounting and Financial DisclosureItem 9A. Controls and ProceduresItem 9B. Other InformationPart IIIItem 10. Directors, Executive Officers and Corporate GovernanceItem 11. Executive CompensationItem 12. Security Ownership Of Certain Beneficial Owners and Management and Related Stockholder MattersItem 13. Certain Relationships and Related Transactions, and Director IndependenceItem 14. Principal Accountant Fees and ServicesPart IVItem 15. Exhibits