Use these links to rapidly review the document
paAs filed with the Securities and Exchange Commission on March 19, 2018
UNITED STATES
SECURITIES AND EXCHANGE COMMISSION
WASHINGTON, D.C. 20549
|
FORM 20-F
|
|
o
|
REGISTRATION STATEMENT PURSUANT TO SECTION 12(b) OR (g) OF THE SECURITIES EXCHANGE ACT OF 1934
|
OR
|
x
|
ANNUAL REPORT PURSUANT TO SECTION 13 OR 15(d) OF THE SECURITIES EXCHANGE ACT OF 1934
|
|
For the fiscal year ended December 31, 2017
|
|
OR
|
o
|
TRANSITION REPORT PURSUANT TO SECTION 13 OR 15(d) OF THE SECURITIES EXCHANGE ACT OF 1934
|
OR
|
o
|
SHELL COMPANY REPORT PURSUANT TO SECTION 13 OR 15(d) OF THE SECURITIES EXCHANGE ACT OF 1934
|
Commission File Number 001-35370
|
LUXFER HOLDINGS PLC
|
|
(Exact name of Registrant as specified in its charter)
|
|
England and Wales
|
|
(Jurisdiction of incorporation or organization)
|
|
Lumns Lane, Manchester, M27 8LN
|
|
(Address of principal executive offices)
|
|
Heather Harding, Chief Financial Officer
Lumns Lane, Manchester, M27 8LN
Telephone No. 001 951 341 2375, E-Mail: investor.relations@luxfer.com
|
|
(Name, Telephone, E-mail and/or Facsimile number and Address of Company Contact Person)
|
Securities registered or to be registered pursuant to Section 12(b) of the Act.
|
Title of each class
|
Name of each exchange on which registered
|
|
|
Ordinary Shares, nominal value £0.50 each
|
New York Stock Exchange
|
|
Securities registered or to be registered pursuant to Section 12(g) of the Act:
None
Securities for which there is a reporting obligation pursuant to Section 15(d) of the Act:
None
Indicate the number of outstanding shares of each of the issuer's classes of capital or common stock as of the close of the period covered by the annual report: 26,504,474 Ordinary Shares of £0.50 each and 769,413,708,000 Deferred Ordinary Shares of £0.0001 each.
Indicate by check mark if the registrant is a well-known seasoned issuer, as defined in Rule 405 of the Securities Act.
Yes
o
No
x
If this report is an annual or transition report, indicate by check mark if the registrant is not required to file reports pursuant to Section 13 or 15(d) of the Securities Exchange Act of 1934.
Yes
o
No
x
Indicate by check mark whether the registrant (1) has filed all reports required to be filed by Section 13 or 15(d) of the Securities Exchange Act of 1934 during the preceding 12 months (or for such shorter period that the registrant was required to file such reports), and (2) has been subject to such filing requirements for the past 90 days.
Yes
x
No
o
Indicate by check mark whether the registrant has submitted electronically and posted on its corporate Web site, if any, every Interactive Data File required to be submitted and posted pursuant to Rule 405 of Regulation S-T (§232.405 of this chapter) during the preceding 12 months (or for such shorter period that the registrant was required to submit and post such files).
Yes
x
No
o
Indicate by check mark whether the registrant is a large accelerated filer, an accelerated filer, a non-accelerated filer, or an emerging growth company. See definition of "large accelerated filer", "accelerated filer", and "emerging growth company" in Rule 12b-2 of the Exchange Act. (Check one):
|
Large accelerated filer
o
|
Accelerated filer
x
|
Non-accelerated filer
o
|
Emerging growth company
o
|
If an emerging growth company that prepares its financial statements in accordance with U.S. GAAP, indicate by check mark if the registrant has elected not to use the extended transition period for complying with any new or revised financial accounting standards† provided pursuant to Section 13(a) of the Exchange Act.
o
Indicate by check mark which basis of accounting the registrant has used to prepare the financial statements included in this filing:
|
U.S. GAAP
o
|
International Financial Reporting Standards as issued
by the International Accounting Standards Board
x
|
Other
o
|
If "Other" has been checked in response to the previous question, indicate by check mark which financial statement item the registrant has elected to follow.
Item 17
o
Item 18
o
If this is an annual report, indicate by check mark whether the registrant is a shell company (as defined in Rule 12b-2 of the Exchange Act).
Yes
o
No
x
† The term “new or revised financial accounting standard” refers to any update issued by the Financial Accounting Standards Board to its Accounting Standards Codification after April 5, 2012.
|
TABLE OF CONTENTS
|
|
Page
|
|||||
GENERAL INFORMATION
In this Annual Report on Form 20-F ("Annual Report"), references to "Company," "Luxfer," "Group," "Luxfer Group," "we," "us" and "our" are to Luxfer Holdings PLC and, except as the context requires, its consolidated subsidiaries.
PRESENTATION OF FINANCIAL AND OTHER DATA
The consolidated financial statements have been prepared in accordance with International Financial Reporting Standards ("IFRS") as issued by the International Accounting Standards Board ("IASB") as they apply to the consolidated financial statements of the Group. The consolidated financial statements have been prepared on a historical cost basis, except where IFRS requires or permits fair value measurement.
All references in this Annual Report to (i) "U.S. dollar," "USD" or "$" are to the currency of the United States (the "U.S."), (ii) "pounds sterling," "GBP sterling," "pence," "p" or "£" are to the currency of the United Kingdom (the "U.K.") and (iii) "euro" or "€" are to the currency introduced at the start of the third stage of European economic and monetary union pursuant to the treaty establishing the European Community, as amended.
INFORMATION REGARDING FORWARD-LOOKING STATEMENTS
This Annual Report contains certain statements, statistics and projections that are, or may be, forward-looking. These forward-looking statements are subject to known and unknown risks, uncertainties, assumptions and other factors that could cause our actual results of operations, financial condition, liquidity, performance, prospects, opportunities, achievements or industry results, as well as those of the markets we serve or intend to serve, to differ materially from those expressed in, or suggested by, these forward-looking statements. The accuracy and completeness of all such statements, including, without limitation, statements regarding our future financial position, strategy, plans and objectives for the management of future operations, is not warranted or guaranteed. These statements typically contain words such as "believes," "intends," "expects," "anticipates," "estimates," "may," "will," "should" and words of similar import. By their nature, forward-looking statements involve risk and uncertainty because they relate to events and depend on circumstances that will occur in the future. We undertake no obligation to update any forward-looking statements, whether as a result of new information, future events or otherwise. Although we believe that the expectations reflected in such statements are reasonable, no assurance can be given that such expectations will prove to be correct. There are a number of factors that could cause actual results and developments to differ materially from those expressed or implied by such forward-looking statements. These factors include, but are not limited to, factors identified in "Risk factors," "Information on the Company" and "Operating and Financial Review and Prospects," or elsewhere in this Annual Report, as well as:
|
•
|
general economic conditions, or conditions affecting demand for the services offered by us in the markets in which we operate, both domestically and internationally, being less favorable than expected;
|
|
•
|
worldwide economic and business conditions and conditions in the industries in which we operate;
|
|
•
|
fluctuations in the cost of raw materials and utilities;
|
|
•
|
currency fluctuations and other financial risks;
|
|
•
|
our ability to protect our intellectual property;
|
|
•
|
the significant amount of indebtedness we have incurred and may incur, and the obligations to service such indebtedness and to comply with the covenants contained therein;
|
|
•
|
relationships with our customers and suppliers;
|
|
•
|
increased competition from other companies in the industries in which we operate;
|
|
•
|
changing technology;
|
|
•
|
claims for personal injury, death or property damage arising from the use of products produced by us;
|
|
•
|
the occurrence of accidents or other interruptions to our production processes;
|
|
•
|
changes in our business strategy or development plans, and our expected level of capital expenditure;
|
|
•
|
our ability to attract and retain qualified personnel;
|
|
•
|
restrictions on the ability of Luxfer Holdings PLC to receive dividends or loans from certain of its subsidiaries;
|
|
•
|
regulatory, environmental, legislative and judicial developments; and
|
|
•
|
our intention to pay dividends.
|
You are urged to read the sections "Risk Factors," "Information on the Company" and "Operating and Financial Review and Prospects" of this Annual Report for a more complete discussion of the factors that could affect our performance and the industries in which we operate, as well as those discussed in other documents we file or furnish with the SEC.
|
Item 1.
|
Identity of Directors, Senior Management and Advisers
|
Not applicable.
|
Item 2.
|
Offer Statistics and Expected Timetable
|
Not applicable.
|
Item 3.
|
Key Information
|
A. Selected financial data.
The following selected consolidated financial data of Luxfer as of
December 31, 2017
,
2016
,
2015
,
2014
and
2013
, and for the years ended
December 31, 2017
,
2016
,
2015
,
2014
and
2013
, have been derived from our consolidated financial statements and the related notes appearing elsewhere in this Annual Report (or prior Annual Reports), which have been prepared in accordance with IFRS as issued by the IASB. Our historical results are not necessarily indicative of results to be expected for future periods.
This financial data should be read in conjunction with our consolidated financial statements and the related notes appearing elsewhere in this Annual Report (or prior Annual Reports) and Item 5, "Operating and Financial Review and Prospects" below.
Summary Consolidated Data
|
Year Ended December 31,
|
|||||||||||||||||||||
|
2017
|
2016
|
2015
|
2014
|
2013
|
|||||||||||||||||
|
(in $ million, except per share data)
|
|||||||||||||||||||||
|
Revenue
|
$
|
441.3
|
|
$
|
414.8
|
|
$
|
460.3
|
|
$
|
489.5
|
|
$
|
481.3
|
|
||||||
|
Trading profit
(1)
:
|
$
|
40.5
|
|
$
|
35.3
|
|
$
|
42.3
|
|
$
|
44.8
|
|
$
|
59.2
|
|
||||||
|
Trading margin
|
9.2
|
%
|
8.5
|
%
|
9.2
|
%
|
9.2
|
%
|
12.3
|
%
|
|||||||||||
|
Operating profit
|
$
|
19.3
|
|
$
|
35.8
|
|
$
|
37.9
|
|
$
|
40.9
|
|
$
|
56.5
|
|
||||||
|
Net income
|
$
|
11.5
|
|
$
|
21.9
|
|
$
|
16.1
|
|
$
|
29.2
|
|
$
|
34.1
|
|
||||||
|
Earnings per share - basic
(2)
|
0.43
|
|
0.83
|
|
0.60
|
|
1.09
|
|
1.27
|
|
|||||||||||
|
Earnings per share - diluted
(2)
|
0.43
|
|
0.82
|
|
0.59
|
|
1.05
|
|
1.22
|
|
|||||||||||
|
Net cash flows from operating activities
|
$
|
45.2
|
|
$
|
29.2
|
|
$
|
52.8
|
|
$
|
23.0
|
|
$
|
37.1
|
|
||||||
Segmental Information
|
As of December 31,
|
|||||||||||||||||||||
|
2017
|
2016
|
2015
|
2014
|
2013
|
|||||||||||||||||
|
(in $ million)
|
|||||||||||||||||||||
|
Revenue:
|
|
|
|
|
|
|
|
|
|
|
|||||||||||
|
Elektron
|
$
|
221.1
|
|
$
|
189.0
|
|
$
|
221.2
|
|
$
|
230.6
|
|
$
|
219.7
|
|
||||||
|
Gas Cylinders
|
220.2
|
|
225.8
|
|
239.1
|
|
258.9
|
|
261.6
|
|
|||||||||||
|
$
|
441.3
|
|
$
|
414.8
|
|
$
|
460.3
|
|
$
|
489.5
|
|
$
|
481.3
|
|
|||||||
|
Trading profit
(1)
:
|
|
|
|
|
|
|
|
|
|
|
|||||||||||
|
Elektron
|
$
|
31.8
|
|
$
|
23.9
|
|
$
|
33.7
|
|
$
|
38.9
|
|
$
|
40.2
|
|
||||||
|
Gas Cylinders
|
8.7
|
|
11.4
|
|
8.6
|
|
5.9
|
|
19.0
|
|
|||||||||||
|
$
|
40.5
|
|
$
|
35.3
|
|
$
|
42.3
|
|
$
|
44.8
|
|
$
|
59.2
|
|
|||||||
1
Consolidated Balance Sheet Data
|
As of December 31,
|
|||||||||||||||||||||
|
2017
|
2016
|
2015
|
2014
|
2013
|
|||||||||||||||||
|
(in $ million)
|
|||||||||||||||||||||
|
Total assets
|
$
|
402.6
|
|
$
|
391.5
|
|
$
|
435.7
|
|
$
|
459.8
|
|
$
|
396.1
|
|
||||||
|
Total liabilities
|
(240.3
|
)
|
(249.6
|
)
|
(266.0
|
)
|
(284.4
|
)
|
(204.4
|
)
|
|||||||||||
|
Total equity
|
$
|
162.3
|
|
$
|
141.9
|
|
$
|
169.7
|
|
$
|
175.4
|
|
$
|
191.7
|
|
||||||
|
Cash and cash equivalents
|
13.3
|
|
13.6
|
|
36.9
|
|
14.6
|
|
28.4
|
|
|||||||||||
|
Overdrafts
|
(4.2
|
)
|
—
|
|
—
|
|
—
|
|
—
|
|
|||||||||||
|
Restricted cash
|
(0.7
|
)
|
—
|
|
—
|
|
—
|
|
—
|
|
|||||||||||
|
Bank and other loans
|
(108.8
|
)
|
(121.0
|
)
|
(131.6
|
)
|
(121.4
|
)
|
(63.8
|
)
|
|||||||||||
|
Net debt (non-GAAP)
(3)
|
$
|
(100.4
|
)
|
$
|
(107.4
|
)
|
$
|
(94.7
|
)
|
$
|
(106.8
|
)
|
$
|
(35.4
|
)
|
||||||
Non-GAAP Financial Measures
|
|
Year ended December 31,
|
||||||||||||||||||||
|
|
2017
|
2016
|
2015
|
2014
|
2013
|
||||||||||||||||
|
|
(in $ million, except per share data)
|
||||||||||||||||||||
|
Adjusted EBITDA
(3)
:
|
|
|
|
|
|
|
|
|
|
|
|||||||||||
|
Elektron
|
$
|
44.5
|
|
$
|
35.6
|
|
$
|
45.7
|
|
$
|
50.1
|
|
$
|
49.8
|
|
||||||
|
Gas Cylinders
|
17.3
|
|
19.7
|
|
16.5
|
|
14.7
|
|
26.8
|
|
|||||||||||
|
$
|
61.8
|
|
$
|
55.3
|
|
$
|
62.2
|
|
$
|
64.8
|
|
$
|
76.6
|
|
|||||||
|
Adjusted net income
(3)
|
$
|
27.6
|
|
$
|
24.7
|
|
$
|
29.5
|
|
$
|
30.9
|
|
$
|
39.8
|
|
||||||
|
Adjusted net income per ordinary share
(4)
:
|
|||||||||||||||||||||
|
Basic
|
$
|
1.04
|
|
$
|
0.93
|
|
$
|
1.10
|
|
$
|
1.15
|
|
$
|
1.48
|
|
||||||
|
Diluted
|
$
|
1.02
|
|
$
|
0.92
|
|
$
|
1.08
|
|
$
|
1.11
|
|
$
|
1.42
|
|
||||||
|
(1)
|
Trading profit is defined as operating profit or loss before profit on sale of redundant site, changes to defined benefit pension plans and restructuring and other expense. For the purposes of our divisional segmental analysis, IFRS 8 requires the use of "segment profit" performance measures that are used by our chief operating decision maker. Trading profit is the "segment profit" measure used by our chief operating decision maker for divisional segmental analysis. See "Note 2—Revenue and segmental analysis" in our consolidated financial statements included elsewhere in this Annual Report (or prior Annual Reports).
|
|
(2)
|
Basic and diluted earnings per ordinary share
|
For further information, see "Note 10—Earnings per share" to our consolidated financial statements. We calculate earnings per share in accordance with IAS 33. Basic earnings per share is calculated based on the weighted average of ordinary shares outstanding for the period presented. The weighted average of ordinary shares outstanding is calculated by time-apportioning the shares outstanding during the year. For the purpose of calculating diluted earnings per share, the weighted average of ordinary shares outstanding during the period presented has been adjusted for the dilutive effect of all share options granted to employees. In calculating the diluted weighted average of ordinary shares outstanding, there are no shares that have not been included for anti-dilution reasons.
(3)
Non-GAAP financial measures
The following table presents a reconciliation of adjusted net income and adjusted EBITDA to net income, the most comparable IFRS measure. A reconciliation of adjusted EBITDA to trading profit on a segmental basis is included in "Note 2—Revenue and segmental analysis" in our consolidated financial statements included elsewhere in this Annual Report (or prior Annual Reports).
2
|
Year Ended December, 31
|
|||||||||||||||||||||
|
2017
|
2016
|
2015
|
2014
|
2013
|
|||||||||||||||||
|
(in $ million)
|
|||||||||||||||||||||
|
Net income for the year
|
$
|
11.5
|
|
$
|
21.9
|
|
$
|
16.1
|
|
$
|
29.2
|
|
$
|
34.1
|
|
||||||
|
Acquisition and disposal charges
|
|||||||||||||||||||||
|
Unwind of discount on deferred contingent consideration from acquisitions
|
0.2
|
|
0.4
|
|
0.4
|
|
0.3
|
|
—
|
|
|||||||||||
|
Net (gain) / loss on acquisitions and disposals
|
(1.3
|
)
|
(0.2
|
)
|
2.0
|
|
(4.5
|
)
|
0.1
|
|
|||||||||||
|
Amortization on acquired intangibles
|
1.2
|
|
1.0
|
|
1.4
|
|
0.6
|
|
—
|
|
|||||||||||
|
IAS 19R retirement benefits finance charge
|
1.8
|
|
2.1
|
|
3.0
|
|
2.7
|
|
3.8
|
|
|||||||||||
|
Profit on sale of redundant site
|
(0.4
|
)
|
(2.1
|
)
|
—
|
|
—
|
|
—
|
|
|||||||||||
|
Changes to defined benefit pension plans
|
—
|
|
(0.6
|
)
|
(18.0
|
)
|
—
|
|
1.7
|
|
|||||||||||
|
Restructuring and other expense
|
21.6
|
|
2.2
|
|
22.4
|
|
3.9
|
|
1.0
|
|
|||||||||||
|
Other share based compensation charges
|
2.2
|
|
1.4
|
|
1.3
|
|
1.6
|
|
1.3
|
|
|||||||||||
|
Tax thereon
|
(3.2
|
)
|
(1.4
|
)
|
0.9
|
|
(2.9
|
)
|
(2.2
|
)
|
|||||||||||
|
Impact of U.S. tax reform
|
(6.0
|
)
|
—
|
|
—
|
|
—
|
|
—
|
|
|||||||||||
|
Adjusted net income
|
$
|
27.6
|
|
$
|
24.7
|
|
$
|
29.5
|
|
$
|
30.9
|
|
$
|
39.8
|
|
||||||
|
Add back:
|
|||||||||||||||||||||
|
Impact of U.S tax reform
|
6.0
|
|
—
|
|
—
|
|
—
|
|
—
|
|
|||||||||||
|
Tax thereon
|
3.2
|
|
1.4
|
|
(0.9
|
)
|
2.9
|
|
2.2
|
|
|||||||||||
|
Tax expense
|
0.4
|
|
6.0
|
|
9.5
|
|
7.1
|
|
12.6
|
|
|||||||||||
|
Net interest costs
|
6.7
|
|
5.6
|
|
6.9
|
|
6.1
|
|
5.9
|
|
|||||||||||
|
Depreciation and amortization
|
19.0
|
|
18.4
|
|
18.6
|
|
18.1
|
|
15.8
|
|
|||||||||||
|
Amortization on acquired intangibles
|
(1.2
|
)
|
(1.0
|
)
|
(1.4
|
)
|
(0.6
|
)
|
—
|
|
|||||||||||
|
Loss on disposal of property, plant and equipment
|
0.1
|
|
0.2
|
|
—
|
|
0.3
|
|
0.3
|
|
|||||||||||
|
Adjusted EBITDA
|
$
|
61.8
|
|
$
|
55.3
|
|
$
|
62.2
|
|
$
|
64.8
|
|
$
|
76.6
|
|
||||||
Adjusted net income consists of net income for the period adjusted for the post tax impact of non-trading items, including certain accounting charges relating to acquisitions and disposals of businesses (comprising net gain / (loss) from acquisitions and disposals, the unwind of the discount on deferred contingent consideration from acquisitions and the amortization on acquired intangibles), IAS 19R retirement benefits finance charge, profit on sale of redundant site, changes to defined benefit pension plans, restructuring and other expense and other share based compensation charges.
Adjusted EBITDA is defined as net income for the period before income tax expense, finance income (which comprises interest receivable), finance costs (which comprises interest costs, IAS 19R retirement benefits finance charge, and the unwind of the discount on deferred contingent consideration from acquisitions), net gain / (loss) on acquisitions and disposals, profit on sale of redundant site, changes to defined benefit pension plans, restructuring and other expense, other share based compensation charges, depreciation and amortization and loss on disposal of property, plant and equipment.
We prepare and present adjusted net income and adjusted EBITDA to eliminate the effect of items that we do not consider indicative of our core operating performance. Management believes that adjusted net income and adjusted EBITDA are key performance indicators used by the investment community, and that the presentation of adjusted net income and adjusted EBITDA will enhance investors' understanding of our results of operations. However, adjusted net income and adjusted EBITDA should not be considered in isolation by investors as an alternative to net income for the year as an indicator of our operating performance or as a measure of our profitability. Adjusted net income and adjusted EBITDA are not measures of financial performance under IFRS, may not be indicative of historic operating results and are not meant to be predictive of potential future results. Adjusted net income and adjusted EBITDA measures presented herein may not be comparable to other similarly titled measures of other companies. While adjusted net income and adjusted EBITDA are not measures of financial performance under IFRS, adjusted net income and adjusted EBITDA presented have been computed using IFRS amounts.
We use net debt as a measure of our financial leverage. We believe that investors may also find net debt to be helpful in evaluating our financial leverage.
3
(4)
Basic and diluted adjusted earnings per ordinary share
For further information, see "Note 10—Earnings per share" to our consolidated financial statements. We believe that the use of non-GAAP financial measures, such as adjusted earnings per ordinary share more closely reflects the underlying earnings per ordinary share performance and is a financial measure widely used by both investors and financial analysts of the Company's ordinary shares.
Not applicable.
C. Reasons for the offer and use of proceeds.
Not applicable.
D. Risk factors.
You should carefully consider the following risk factors described below, together with all of the other information in this Annual Report, including our consolidated financial statements and the related notes appearing elsewhere in this Annual Report, before investing in our ordinary shares. The risks and uncertainties described below are those significant risk factors currently known and specific to us that we believe are relevant to an investment in our securities. If any of these risks materialize, our business, financial position or results of operations could suffer, the price of our ordinary shares could decline and you could lose part or all of your investment. Additional risks and uncertainties not currently known to us or those we now deem immaterial, may also harm us and adversely affect your investment in our ordinary shares.
Risks Relating to Our Operations
We depend on certain end-markets, including automotive, alternative fuels, self-contained breathing apparatus, aerospace and defense, medical, and printing and paper. An economic downturn, or regulatory changes, in any of those end-markets, could reduce sales and margins on those sales.
We have significant exposures to certain key end-markets, including some end-markets that are cyclical in nature or subject to high levels of regulatory control. For example, 20% of our
2017
sales were related to automotive end-markets, 12% to the self-contained breathing apparatus ("SCBA") end-market, 21% to aerospace and defense end-markets, 6% to alternative fuel and 11% to printing and paper end-markets. Together, these five markets accounted for 70% of our
2017
revenue. Dependence of either of our divisions on certain end-markets is even more pronounced. For example, in
2017
, 34% of the Elektron Division's sales were to customers in aerospace and defense end-markets which were depressed during 2016 with partial recovery in 2017.
To the extent that any of these cyclical end-markets are in decline, at a low point in their economic cycle, or subject to regulatory change, sales and margins on those sales may be adversely affected. It is possible that all or most of these end-markets could be in decline at the same time, such as during a recession. Any significant reduction in sales could have a material adverse impact on our results of operations, financial position and cash flows.
Our global operations expose us to economic conditions, political risks and specific regulations in the countries in which we operate, which could have a material adverse impact on our results of operations, financial position and cash flows.
We derive our revenue and earnings from operations in many countries and are subject to risks associated with doing business internationally. We have wholly-owned operations in the U.S., the U.K., Canada, France, the Czech Republic, China and Australia; joint venture facilities in India, Japan and the U.S.; and an associate in Australia. Doing business in different countries has risks, including the potential for adverse changes in the local political, financial or regulatory climate, difficulty in staffing and managing geographically diverse operations, and the costs of complying with a variety of laws and regulations. For example the change in the political climate in the U.S. could make it more challenging or expensive to import products manufactured in Europe.
4
Due to the fact we have operations in many countries, we are also liable to pay taxes in many fiscal jurisdictions. Our tax burden depends on the interpretation of local tax regulations, bilateral or multilateral international tax treaties and the administrative doctrines in each jurisdiction. Changes in these tax regulations may increase our tax burden, or otherwise affect our accounting for taxes. For example, as a result of the reduction in the statutory corporate income tax rate in the U.S. pursuant to the tax reform bill enacted on December 22, 2017, discussed below, we have recorded a reduction in the value of our deferred tax assets in the U.S. of $6.0 million. Moreover, the principal markets for our products are located in North America, Europe and Asia, and any financial difficulties experienced in these markets may have a material adverse impact on our businesses. For example, the maturity of some of our markets, particularly the U.S. medical oxygen cylinder market and the European fire extinguisher market, could require us to increase sales in developing regions, which may involve greater economic and political risks. We cannot provide any assurances that we will be able to expand sales in these regions. Any of these factors could have a material adverse impact on our results of operations, financial position and cash flows.
On June 23, 2016, the U.K. held a referendum in which voters approved an exit from the European Union (the "E.U.")., commonly referred to as 'Brexit'. On March 29, 2017, the U.K. Government invoked Article 50 of the Treaty on the European Union, which is likely to result in the U.K. exiting the E.U. on March 29, 2019. The U.K. Government has commenced negotiating the terms of the U.K.'s future relationship with the E.U. although there is still considerable uncertainty as to the outcome. It is possible that there will be greater restrictions on imports and exports between the U.K. and other countries and increased regulatory complexity. These changes may adversely affect our operations and financial results. See also "—Changes in foreign exchange rates could reduce margins on our sales and reduce the reported revenue of our non-U.S. operations and have a material adverse effect on our results of operations."
On December 22, 2017, President Trump signed into law legislation known as the “Tax Cuts and Jobs Act” (the “Act”) that significantly reforms the Internal Revenue Code of 1986, as amended. The Act, among other things, reduces the U.S. federal corporate income tax rate from 35% to 21%, imposes new limitations on the deductibility of interest and net operating loss carry forwards, allows for the expensing of capital expenditures, and makes other significant changes to the U.S. international tax system. The U.S. Internal Revenue Service to date has issued only limited guidance with respect to certain of the new provisions, and there are numerous interpretive issues that are expected to require clarification. Such future guidance could significantly affect the impact of the Act on us.
Our operations rely on a number of large customers in certain areas of our business, and the loss of any of our major customers could negatively impact our results of operations.
If we fail to maintain our relationships with our major customers, or fail to replace lost customers, or if there is reduced demand from our customers or for products produced by our customers, such failures or reduced demand could materially reduce our sales. In addition, we could experience a reduction in sales if any of our customers fail to perform or default on any payment pursuant to our contracts with them. Long-term relationships with customers are especially important for suppliers of intermediate materials and components such as ourselves. We often work closely with customers to develop products that meet particular specifications as part of the design of a product intended for an end-user market. The bespoke nature of many of our products could make it difficult to replace lost customers. Our top 10 customers accounted for
25%
of our revenue in
2017
. Any significant reduction in sales or customer payment default could have an adverse material impact on our results of operations, financial position and cash flows.
Competitive pressures could materially and adversely affect our sales and margins.
The markets for many of our products are now increasingly global and highly competitive, especially in terms of quality, price and service. Due to the highly competitive nature of some markets in which we operate, we may have difficulty raising customer prices to offset increases in the costs of raw materials. For example, the U.S. medical oxygen cylinder market has a number of dedicated producers with excess capacity, making it very difficult for us to raise customer prices to offset aluminum cost increases. In addition, rising aluminum costs could lead to the development of alternative products that use lower cost materials, which could become favored by end-market users.
We also experience competition from developing markets where manufacturers may benefit from lower labor costs. We are also affected by Western-based competitors that have chosen to relocate production to Asia to take advantage of lower labor costs. Competitors with operations in these regions may be able to produce goods at a relatively lower cost, which may enable them to offer highly competitive selling prices.
Competition with respect to less-complex zirconium chemicals has been particularly intense, with Chinese suppliers providing low-cost feedstock to specialist competitors, making it especially difficult to compete in commodity products such as paper-making additives. Chinese magnesium also continues to be imported into
5
Europe in large volumes, which may impact our competitive position in Europe regarding certain magnesium alloys. More generally, we may face potential competition from producers that manufacture products similar to our aluminum-based, magnesium-based and zirconium-based products using other materials, such as steel, plastics, composite materials or other metals, minerals and chemicals. Products manufactured by competitors using different materials might compete with our products in terms of price, weight, engineering characteristics, recyclability or other grounds.
We may also enter new markets with established competitors. We expect to face new and significant challenges in our effort to enter into these highly competitive markets in which we did not have a presence historically. For example, in recent years, we have entered markets focused on the containment of compressed natural gas (CNG) and incurred startup costs along with strong competitive pressures from existing providers of similar cylinder technologies. Even if we are able to enter into these new markets initially, we may not be able to sustain the effort on a long-term basis or establish sufficient market share to achieve meaningful returns from our investment.
Other parts of our operations manufacture and sell products that satisfy customer specifications. Competitors may develop lower cost or better performing products, and customers may not be willing to pay a premium for advantages offered by our products.
In addition, governments may impose import and export restrictions, grant subsidies to local companies and implement tariffs and other trade protection regulations and measures that may give competitive advantages to certain of our competitors and adversely affect our business.
Any of these factors could have a material adverse impact on our results of operations, financial position and cash flows.
We depend upon our larger suppliers for a significant portion of our raw materials, and a loss of one of these suppliers, or a significant supply interruption could negatively impact our financial performance.
We rely, to varying degrees, on major suppliers for some of the principal raw materials of our engineered products, including aluminum, zirconium and carbon fiber. For example, in
2017
, we obtained
73%
of our aluminum, the largest single raw material purchased by the Gas Cylinders Division, from Rio Tinto Alcan and its associated companies. Moreover, demand for carbon fiber is increasing, which has led to occasional periods of short supply in recent years with a number of expanding applications competing for the same supply of this specialized raw material. Our largest suppliers of carbon fiber are Toray and Grafil, a subsidiary of Mitsubishi Chemical. For additional details of some of our major suppliers, see "Item 4.B. Business Overview."
We generally purchase raw materials from suppliers on a spot basis under standard terms and conditions. In 2017, we entered into a three-year supply contract with Rio Tinto Alcan for a substantial portion of our aluminum requirements. In addition, we have in place one-year and five-year magnesium supply contracts with U.S. Magnesium for a portion of our requirements that expire in December 2018 and December 2019 respectively.
An interruption in the supply of essential raw materials used in our production processes or an increase in the costs of raw materials due to market shortages, supplier financial difficulties, government quotas or natural disturbances, could significantly affect our ability to provide competitively priced products to customers in a timely manner. In the event of a significant interruption in the supply of any materials used in our production processes, or a significant increase in their prices (as we have experienced, for example, at different times with aluminum, magnesium and rare earths), we may have to purchase these materials from alternative sources, build additional inventory of raw materials, increase our prices, reduce our margins or possibly fail to fill customer orders by deadlines required in contracts, which could result in, among other things, contractual penalties. We can provide no assurance that we would be able to obtain replacement materials quickly on similar terms or at all. Failure to maintain relationships with key suppliers or to develop relationships with alternative suppliers could have a material adverse effect on our results of operations, financial position and cash flows.
We are exposed to fluctuations in the costs of the raw materials that are used to manufacture our products, and such fluctuations could lead us to incur unexpected costs and could affect our margins and / or working capital requirements.
The primary raw material we use to manufacture gas cylinders and superformed panels is aluminum supplied in billet and sheet form. The cost of aluminum is subject to both significant short-term price fluctuations and to longer-term cyclicality as a result of international supply and demand relationships. In
2017
, the London Metal Exchange ("LME") three month cost of aluminum reached a high of just below $2,300 per metric ton and a low of just below $1,700 per metric ton. The delivery premiums added by suppliers to the LME price also fluctuate, for example: the Midwest Aluminum Premium for physical supply of aluminum billet in the U.S. has historically averaged around $200 per metric ton, but in 2015 rose to a high of $535 per metric ton then fell to a low of $155
6
per metric ton. We have experienced significant volatility in other raw material costs in the last few years, such as primary magnesium, carbon fiber, zircon sand and rare earths. See "Item 4.B. Business Overview."
Fluctuations in the costs of these raw materials could affect margins and working capital requirements in the businesses in which we use them. See "Item 5. Operating and Financial Review and Prospects." We cannot always pass on cost increases or increase our prices to offset these cost increases immediately or at all, whether because of fixed-price agreements with customers, competitive pressures that restrict our ability to pass on cost increases or increase prices, or other factors. It can be particularly difficult to pass on cost increases or increase prices in product areas such as gas cylinders, where competitors offer similar products made from alternative materials, such as steel, if those materials are not subject to the same cost increases. Higher prices necessitated by large increases in raw material costs could make our current or future products unattractive compared to competing products made from alternative materials that have not been so affected by raw material cost increases, or compared to products produced by competitors who have not incurred such large increases in their raw material costs.
In addition, pricing of raw materials, such as aluminum, may be impacted by the level of tariffs imposed on imports. President Trump announced in March, 2018 that the U.S. is to impose a 10% tariff on aluminum imported into the U.S. The Company uses a substantial amount of aluminum in its products, with imports into the U.S. primarily originating from Canada. Whilst details regarding the applicability of the tariffs have not been fully established at this time, we believe there will be no direct and immediate impact on our business since there will be an initial exemption for Canada (and Mexico) whilst the North American Free Trade Agreement (NAFTA) is renegotiated. If the exemption were to be lifted, then the price of such imported materials would increase substantially and the price of U.S.-made aluminum can also be expected to increase substantially.
If the cost of aluminum were to rise, we may not be able pass those cost increases on to our customers or manage the exposure effectively through hedging instruments. Currently we use derivative financial instruments to hedge our exposures to fluctuations in aluminum costs. Although it is our treasury policy to enter into these transactions only for hedging and not for speculative purposes, we are exposed to market risk and credit risk with respect to the use of these derivative financial instruments. See "Item 11. Quantitative and Qualitative Disclosures About Market Risk." In addition, if we have hedged our metal position, a fall in the cost of aluminum might give rise to hedging margin calls to the detriment of our borrowing position.
In the past several years we have made additional purchases of large stocks of magnesium chemicals in an effort to delay the effect of potentially increased costs in the future. However, even though such purchases are not made for speculative purposes, there can be no assurance that costs will move as expected.
Moreover, these strategic purchases increase our working capital needs, thus reducing our liquidity and cash flow.
Accordingly, a substantial increase in raw material costs could have a material adverse effect on our results of operations, financial position and cash flows.
We are exposed to fluctuations in costs of utilities that are used in the manufacture of our products, and such fluctuations could lead us to incur unexpected costs and could affect our margins and results of operations.
Our utility costs, which constitute another major input cost of our total expenses and include costs related to electricity, natural gas and water, may be subject to significant variations. Increased taxation and other factors have contributed in the past to a significant increase in utility costs for us, particularly with respect to the price that we pay for our U.K. energy supplies.
Fluctuations in the costs of these utilities could affect margins in our businesses in which we use them. We cannot always pass on cost increases or increase our prices to offset cost increases immediately or at all, whether because of fixed-price agreements with customers, competitive pressures that restrict our ability to pass on cost increases or increase prices, or other factors. It can be particularly difficult to pass on cost increases or increase prices in product areas such as gas cylinders, where competitors offer similar products made from alternative materials, such as steel, if those materials are not subject to the same cost increases. As a result, a substantial increase in utility costs could have a material adverse effect on our results of operations, financial position and cash flows.
Changes in foreign exchange rates could reduce margins on our sales and reduce the reported revenue of our non-U.S. operations and have a material adverse effect on our results of operations.
We conduct a large portion of our commercial transactions, purchases of raw materials and sales of goods in various countries and regions, including the U.S., the U.K., continental Europe, Australia and Asia. Our manufacturing operations based in the U.S., continental Europe and Asia usually purchase raw materials and
7
sell goods denominated in their local currency, but our manufacturing operations in the U.K. often purchase raw materials and sell products in different currencies. Changes in the relative values of currencies can decrease the profits of our subsidiaries when they incur costs in currencies that are different from the currencies in which they generate all or part of their revenue. These transaction risks principally arise as a result of purchases of raw materials in U.S. dollars, coupled with sales of products to customers in euros. This impact is most pronounced in our exports to continental Europe from the U.K. In 2017, our U.K. operations sold approximately €46 million of goods into the Eurozone. Our policy is to hedge a portion of our net exposure to fluctuations in exchange rates with forward foreign currency exchange contracts. Therefore, we are exposed to market risk and credit risk through the use of derivative financial instruments. Moreover, any failure of hedging policies could negatively impact our profits, and thus damage our ability to fund our operations and to service our indebtedness. Whilst exchange rates have been more stable in 2017 than in 2016 (following the E.U. referendum in the U.K.), until the terms of the U.K.'s future relationship with the E.U. are known, further exchange rate volatility is to be expected.
In addition to subsidiaries and joint ventures in the U.S., we have subsidiaries located in the U.K., Canada, France, the Czech Republic, China, Germany and Australia, as well as joint ventures in Japan and India, and an associate in Australia, whose revenue, costs, assets and liabilities are denominated in local currencies. As our consolidated financial statements are reported in U.S. dollars, we are exposed to fluctuations in those currencies when those amounts are translated to U.S. dollars for purposes of reporting our consolidated financial statements, which may cause declines in results of operations. The largest risk is from our operations in the U.K., which in 2017 generated an operating loss of
$5.1 million
and sales revenue of
$139.5 million
. Fluctuations in exchange rates, particularly between the U.S. dollar and GBP sterling (which has been subject to significant fluctuations, as described above), can have a material effect on our consolidated income statement and consolidated balance sheet. In 2017, movements in the average U.S. dollar exchange rate had a
positive
impact on revenue of
$6.4 million
, while in 2016; movements in the average U.S. dollar exchange rate had a negative impact on reported revenue of $13.4 million. Changes in translation exchange rates increased net assets by
$11.6 million
in 2017, compared to a decrease of $13.1 million in 2016.
These foreign exchange risks could have a material adverse effect on our results of operations, financial position and cash flows. For additional information on these risks, and the historical impact on our results, see "Item 11. Quantitative and Qualitative Disclosure About Market Risk."
Our defined benefit pension plans have significant funding deficits and are exposed to market forces that could require us to make increased ongoing cash contributions in response to changes in market conditions, actuarial assumptions and investment decisions, and that could expose us to significant short-term liabilities if a wind-up trigger occurred in relation to such plans, each of which could have a material adverse impact on our results of operations and financial position.
We have defined benefit pension arrangements in the U.K., the U.S. and France. See "Note 29—Retirement benefits" of the consolidated financial statements appearing elsewhere in this Annual Report. Our largest defined benefit plan, the Luxfer Group Pension Plan, which closed to new members in 1998, remained open for accrual of future benefits based on career-average salary until April 5, 2016. However, following a consultation, it was agreed with the trustees and plan members to close the Luxfer Group Pension Plan in the U.K. to future accrual of benefits, effective from April 5, 2016. Moreover, for the purpose of increasing pensions in payment, it was agreed to use the CPI as the reference index, in place of the RPI where applicable. The Luxfer Group Pension Plan is funded according to the regulations in effect in the U.K. and, as of December 31, 2017, and December 31, 2016, had an IAS 19R accounting deficit of $43.4 million and $54.5 million, respectively. Luxfer Group Limited is the principal employer under the Luxfer Group Pension Plan, and other U.K. subsidiaries also participate under the plan. Our other defined benefit plans are less significant than the Luxfer Group Pension Plan and, as of December 31, 2017, and December 31, 2016, had aggregate IAS 19R accounting deficits of $11.9 million and $12.0 million, respectively. The largest of these additional plans is the BA Holdings, Inc. Pension Plan in the U.S., which was closed to further benefit accruals in December 2005, and merged with the much smaller Luxfer Hourly Pension Plan, effective January 1, 2016. According to the actuarial valuation of the Luxfer Group Pension Plan as of April 5, 2015, but after reflecting the reduction in liabilities from closing the plan to future accrual and changing the reference index (for the purpose of increasing pensions in payment), the Luxfer Group Pension Plan had a deficit of £32.5 million on a plan-specific basis. Should a wind-up trigger occur in relation to the Luxfer Group Pension Plan, the buy-out deficit of that plan will become due and payable by the employers. The aggregate deficit of the Luxfer Group Pension Plan on a buy-out basis was estimated at
£117.0 million as of April 5, 2015. The trustees have the power to wind-up the Luxfer Group Pension Plan if they consider that in the best interests of members there is no reasonable purpose in continuing the Luxfer Group Pension Plan.
As a result of the actuarial valuation as of April 5, 2015, we are required to continue to make ongoing cash contributions, over and above normal contributions required to meet the cost of future accrual, to the Luxfer Group Pension Plan. These additional payments are intended to reduce the funding deficit. We have agreed with
8
the trustees to a schedule of payments to reduce the deficit. This schedule has been provided to the U.K. Pensions Regulator (the "Pensions Regulator") and a response was received in 2016 stating there were no issues with the valuation methodology. The schedule of payments provides for minimum annual contributions of £3.8 million per year, together with additional variable contributions based on 15% of net earnings (in the previous calendar year) of Luxfer Holdings PLC between £12 million and £24 million, and 10% of net earnings (in the previous calendar year) of Luxfer Holdings PLC in excess of £24 million. The total contributions are not subject to an annual cap. These contribution rates are to apply until the deficit is eliminated (which is expected to take between 4 and 6 years from 2017, depending on variable contributions), but in practice the schedule will be reviewed and may be revised following the next triennial actuarial valuation. Regulatory burdens have also proven to be a significant risk, such as the U.K.'s Pension Protection Fund Levy, which was $0.3 million in 2017.
We are exposed to various risks related to our defined benefit plans, including the risk of loss of market value of the plan assets, the risk of actual investment returns being less than assumed rates of return, the trustees of the Luxfer Group Pension Plan switching investment strategy (which does require consultation with the employer) and the risk of actual experience deviating from actuarial assumptions for such things as mortality of plan participants. In addition, fluctuations in interest rates cause changes in the annual cost and benefit obligations. Any of these risks could have a material adverse impact on our results of operations, financial position and cash flows.
The Pensions Regulator in the U.K. has the power in certain circumstances to issue contribution notices or financial support directions that, if issued, could result in significant liabilities arising for us.
The Pensions Regulator may issue a contribution notice to the employers that participate in the Luxfer Group Pension Plan, or any person who is connected with, or is an associate of, these employers where the Pensions Regulator is of the opinion that the relevant person has been a party to an act, or a deliberate failure to act, which had as its main purpose (or one of its main purposes) the avoidance of pension liabilities or where such act has a materially detrimental effect on the likelihood of payment of accrued benefits under the Luxfer Group Pension Plan being received. A person holding alone or together with his or her associates, directly or indirectly, one-third or more of our voting power, could be the subject of a contribution notice. The terms "associate" and "connected person," which are taken from the Insolvency Act 1986, are widely defined and could cover our significant shareholders and others deemed to be shadow directors. If the Pensions Regulator considers that a plan employer is "insufficiently resourced" or a "service company" (which terms have statutory definitions), it may impose a financial support direction requiring such plan's employer or any member of the Group, or any person associated or connected with an employer, to put in place financial support in relation to the Luxfer Group Pension Plan. Liabilities imposed under a contribution notice or financial support direction may be up to the difference between the value of the assets of the Luxfer Group Pension Plan and the cost of buying out the benefits of members and other beneficiaries of the Luxfer Group Pension Plan. In practice, the risk of a contribution notice being imposed may restrict our ability to restructure or undertake certain corporate activities. Additional security may also need to be provided to the trustees of the Luxfer Group Pension Plan before certain corporate activities can be undertaken (such as the payment of an unusual dividend), and any additional funding of the Luxfer Group Pension Plan may have a material adverse effect on our financial position and cash flows.
Our ability to remain profitable depends on our ability to protect and enforce our intellectual property, and any failure to protect and enforce such intellectual property could have a material adverse impact on our results of operations and financial position.
We cannot ensure that we will always have the ability to protect proprietary information and our intellectual property rights. We protect our intellectual property rights (within the U.S., Europe and other countries) through various means, including patents and trade secrets. Due to the difference in foreign trademark, patent and other laws concerning proprietary rights, our intellectual property rights may not receive the same degree of protection in other countries as they would in the U.S. or the U.K. The patents we own could be challenged, invalidated or circumvented by others and may not be of sufficient scope or strength to provide us with any meaningful protection or commercial advantage. Further, competitors may infringe our patents and the costs of protecting our patents could be significant. We cannot assure you that we will have adequate resources to enforce our patents. Our patents will only be protected for the duration of the patent. Some of our older key patents have expired, and others will expire over the next few years. As a result, our competitors may introduce products using the technology previously protected, and these products may have lower prices than our products, which may negatively affect our market share. To compete, we may need to reduce our prices for those products. Additionally, the expiry of certain of those patents has reduced, or will reduce, barriers to entry to possible competitors for certain products and end-markets. With respect to our unpatented proprietary technology, it is possible that others will independently develop the same or similar technology or obtain access to our unpatented technology. To protect our trade secrets and other proprietary information, we require employees, consultants, advisors and collaborators to enter into confidentiality agreements. Nevertheless, we cannot assure you that these agreements will provide meaningful protection for our trade secrets, know-how or other
9
proprietary information in the event of any unauthorized use, misappropriation or disclosure of such trade secrets, know-how or other proprietary information. We rely on our trademarks, trade names and brand names to distinguish our products from the products of our competitors, and we have registered or applied to register many of these trademarks. Third parties may also oppose our trademark applications, or otherwise challenge our use of the trademarks. In the event that our trademarks are successfully challenged, we could be forced to rebrand our products, which could result in loss of brand recognition and could require us to devote resources to advertising and marketing new brands. Further, we cannot assure you that competitors will not infringe our trademarks or that we will have adequate resources to enforce our trademarks.
Any failure to maintain, protect and enforce our intellectual property or the expiry of patent protection could have a material adverse impact on our results of operations, financial position and cash flows.
Expiration or termination of our right to use certain intellectual property granted by third parties, the right of those third parties to grant the right to use the same intellectual property to our competitors, and the right of certain third parties to use certain intellectual property used as part of our business, could have a material adverse impact on our results of operations, financial position and cash flows.
We have negotiated, and may from time to time in the future negotiate, licenses with third parties with respect to third party proprietary technologies used in certain of our manufacturing processes and products. If any of these licenses expire or terminate, we will no longer retain the rights to use the relevant third party proprietary technologies in our manufacturing processes and products, which could have a material adverse effect on our results of operations, financial position and cash flows. Further, the rights granted to us might be non-exclusive, which could result in our competitors gaining access to the same intellectual property.
Some of our patents may cover inventions that were conceived or first reduced to practice under, or in connection with, government contracts or other government funding agreements or grants. With respect to inventions conceived or first reduced to practice under such government funding agreements, a government may retain a non-exclusive, irrevocable, royalty-free license to practice, or have practiced for or on behalf of the relevant country, the invention throughout the world. In addition, if we fail to comply with our reporting obligations, or to adequately exploit the developed intellectual property under these government funding agreements, the relevant country may obtain additional rights to the developed intellectual property, including the right to take title to any patents related to government funded inventions or to license the same to our competitors. Furthermore, our ability to exclusively license or assign the intellectual property developed under these government funding agreements to third parties may be limited or subject to the relevant government's approval or oversight. These limitations could have a significant impact on the commercial value of the developed intellectual property.
We often enter into research and development agreements with academic institutions whereby they generally retain certain rights to the developed intellectual property. The academic institutions generally retain rights over the technology for use in non-commercial academic and research fields, including in some cases the right to license the technology to third parties for use in those fields. It is difficult to monitor and enforce such non-commercial academic and research uses, and we cannot predict whether the third party licensees would comply with the use restrictions of these licenses. We could incur substantial expenses to enforce our rights against such licensees. In addition, even though the rights that academic institutions obtain are generally limited to the non-commercial academic and research fields, they may obtain rights to commercially exploit developed intellectual property in certain instances. Under research and development agreements with academic institutions, our rights to intellectual property developed thereunder are not always certain, but instead may be in the form of an option to obtain license rights to such intellectual property. If we fail to exercise our option rights in a timely way and / or we are unable to negotiate a license agreement, the academic institution may offer a license to the developed intellectual property to third parties for commercial purposes. Any such commercial exploitation could adversely affect our competitive position and have a material adverse effect on our business.
If third parties claim that intellectual property used by us infringes upon their intellectual property, our operating profits could be adversely affected.
We may, from time to time, be notified of claims that we are infringing upon patents, copyrights, or other intellectual property rights owned by third parties, and we cannot provide assurances that other companies will not in the future pursue such infringement claims against us or any third party proprietary technologies we have licensed. If we were found to infringe upon a patent or other intellectual property right, or if we failed to obtain or renew a license under a patent or other intellectual property right from a third party, or if a third party from whom we are licensing technologies was found to infringe upon a patent or other intellectual property rights of another third party, we may be required to pay damages, suspend the manufacture of certain products or re-engineer or rebrand our products, if feasible, or we may be unable to enter certain new product markets. Any such claims could also be expensive and time consuming to defend and could divert management's attention and resources. In addition, if we have omitted to enter into a valid non-disclosure or assignment agreement for any reason, we
10
may not own the invention or our intellectual property and may not be adequately protected. Our competitive position could suffer as a result of any of these events and have a material adverse impact on our results of operations, financial position and cash flows.
Any failure of our research and development activity to improve our existing products and develop new products could cause us to lose market share.
Our products are highly technical in nature, and in order to maintain and improve our market position, we depend on successful research and development activity to continue to improve our existing products and develop new products. We cannot be certain that we will have sufficient research and development capability to respond to changes in the industries in which we operate. These changes could include changes in the technological environment in which we currently operate, increased demand for new products or the development of alternatives to our products. For example, the development of lighter weight steel alloys has made the use of steel in gas cylinders a more competitive alternative to aluminum than it had been previously. In addition, our superformed aluminum components compete with new high-performance composite materials developed for use in the aerospace industry. In our efforts to develop and market new products and enhancements to our existing products, we may fail to identify new product opportunities or timely bring new products to market. We may also experience delays in completing development of, enhancements to or new versions of our products and product innovations may not achieve the market penetration or price stability necessary for profitability. In addition to benefiting from our research collaboration with universities, we spent
$7.8 million
, $7.6 million and $8.3 million (including revenue and capital items but before funding grants received) in 2017, 2016 and 2015 respectively, on our own research and development activities. We expect to fund our future research and development expenditure requirements through operating cash flows and restricted levels of indebtedness, but if operating profit decreases, we may not be able to invest in research and development or continue to develop new products or enhancements.
Without the timely introduction of new products or enhancements to existing products, our products could become obsolete over time, in which case our results of operations, financial position and cash flows could be adversely affected.
Some of our key operational equipment is relatively old and may require significant capital expenditures for repair or replacement.
We incur considerable expense on maintenance, including preventative maintenance and repairs. Higher levels of maintenance and repair costs could result from the need to maintain our older plants, property and equipment, and machinery breakdowns could result in interruptions to the business, causing lost production time and reduced output. Machinery breakdowns or equipment failures may hamper or cause delays in the production and delivery of products to our customers and increase our operating costs, thus reducing cash flows from operations. In particular, the breakdown of some of our older equipment, such as the large hot-rolling mill at our Madison, Illinois plant, could be difficult to repair and would be very costly should it need to be replaced. Any failure to deliver products to our customers in a timely manner could adversely affect our customer relationships and reputation. Any failure to implement required investments, due to the need to divert funds to repair existing physical infrastructure, service debt obligations, unanticipated liquidity constraints or other factors, could have a material adverse effect on our results of operations, financial position and cash flows.
Our operations may prove harmful to the environment resulting in reputational damage and clean-up or other related costs.
We are exposed to substantial environmental costs and liabilities, including liabilities associated with divested assets and prior activities performed on sites before we acquired an interest in them. Our operations, including the production and delivery of our products, are subject to a broad range of continually changing environmental laws and regulations in each of the jurisdictions in which we operate. These laws and regulations increasingly impose more stringent environmental protection standards on us with respect to, among other things, air emissions, wastewater discharges, the use and handling of hazardous materials, noise levels, waste disposal practices, soil and groundwater contamination and environmental clean-up. Complying with these regulations involves significant and recurring costs. See "Item 4.B. Business Overview" for details of our environmental management program and the environmental issues that we are currently addressing.
We cannot predict our future environmental liabilities and cannot assure investors that our management is aware of every fact or circumstance regarding potential liabilities, or that the amounts provided and budgeted to address such liabilities will be adequate for all purposes. In addition, future developments, such as changes in regulations, laws or environmental conditions, may result in reputational damage or increase environmental costs and liabilities that could have a material adverse effect on our results of operations, financial position and cash flows.
11
The health and safety of our employees and the safe operation of our business is subject to various health and safety regulations in each of the jurisdictions in which we operate. These regulations impose various obligations on us, including the provision of safe working environments and employee training on health and safety matters. Complying with these regulations involves recurring costs.
Certain of our operations are highly regulated by different agencies that require products to comply with their rules and procedures and can subject our operations to penalties or adversely affect production.
Certain of our operations are in highly regulated industries that require us to maintain regulatory approvals and, from time to time, obtain new regulatory approvals from various countries. This can involve substantial time and expense. In turn, higher costs of compliance reduce our cash flows from operations. For example, manufacturers of gas cylinders throughout the world must comply with high local safety and health standards and obtain regulatory approvals in the markets in which they sell their products. Furthermore, military organizations require us to comply with applicable government regulations and specifications when providing products or services to them directly or as subcontractors. In addition, we are required to comply with U.S. and other export regulations with respect to certain products and materials. The E.U. has also passed legislation governing the registration, evaluation and authorization of chemicals, known as REACH, pursuant to which we are required to register chemicals and gain authorization for the use of certain substances. In the U.S. there is similar legislation under the Toxic Substance Control Act 1976 ("TSCA") which was substantially amended in 2016. Although we make reasonable efforts to obtain all licenses and certifications that are required by countries in which we operate, there is always a risk that we may be found not to comply with certain required procedures. This risk grows with increased complexity and variance in regulations across the globe. As regulatory schemes vary by country, we may also be subject to regulations of which we are not presently aware and could be subject to sanctions by a foreign government that could materially and adversely affect our operations in the relevant country.
Governments and their agencies have considerable discretion to determine whether regulations have been satisfied. They may also revoke or limit existing licenses and certifications or change the laws and regulations to which we are subject at any time. If our operations fail to obtain, experience delays in obtaining or lose a needed certification or approval, we may not be able to sell our products to our customers, expand into new geographic markets or expand into new product lines. In addition, new or more stringent regulations, if imposed, could result in us incurring significant costs in connection with compliance. Non-compliance with these regulations could result in administrative, civil, financial, criminal or other sanctions against us, which could have negative consequences on our business and financial position. Furthermore, if we begin to operate in new countries, we may need to obtain new licenses, certifications and approvals.
Our customers are also often subject to similar regulations and risks. We therefore face the risk that our customers may have the demand for their products reduced as a result of regulatory matters that fall outside our direct control. This would in turn reduce demand for our products and have a negative financial impact on our operating results.
Any of these factors could have a material adverse impact on our results of operations, financial position and cash flows.
We are subject to legislation and regulations to reduce carbon dioxide and other greenhouse gas emissions.
Although we are working to improve our energy efficiency, our manufacturing processes and the manufacturing processes of many of our suppliers and customers are still energy-intensive and use or generate, directly or indirectly, greenhouse gases ("GHGs"). Political and scientific debates related to the effects of emissions of carbon dioxide and other greenhouse gases on the global climate are ongoing. In recent years, current regulatory programs impacting GHG emissions from large industrial plants and other sources include the E.U. Emissions Trading Scheme, the CRC Energy Efficiency Scheme in the U.K. and certain federal and state programs in the U.S., including GHG reporting and permitting rules issued by the U.S.E.P.A and the California Cap and Trade Program. Moreover, in December 2015, 195 countries participating in the United Nations Framework Convention on Climate Change, at its 21st Conference of the Parties meeting held in Paris, adopted a new global agreement on the reduction of climate change (the "Paris Agreement"). The Paris Agreement sets a goal of holding the increase in global average temperature to well below 2 degrees Celsius and pursuing efforts to limit the increase to 1.5 degrees Celsius, to be achieved by commitments by the participating countries to set emissions reduction targets, referred to as "nationally determined contributions." The Paris Agreement came into effect on November 4, 2016, after it was ratified the previous month, with the intent that emissions reductions will occur beginning in 2020 or sooner. As it is implemented, the Paris Agreement is anticipated to result in more stringent requirements relating to greenhouse gas emissions. Due to the costs of compliance and the potential impact on our energy costs, these programs and additional future legislation and regulations aimed at reducing GHG emissions could have a material adverse effect on our results of operations, financial position and cash flows.
12
Due to the nature and use of the products that we manufacture, we may in the future face large liability claims.
We are subject to litigation in the ordinary course of our business, which could be costly to us and which may arise in the future. We are exposed to possible claims for personal injury, death or property damage, which could result from a failure of a product manufactured by us or of a product integrating one of our products. For example, improperly manufactured gas cylinders could explode at high pressure, which can cause substantial personal and property damage. This risk may be increased through the use of new technologies, materials and innovations. We also supply many components into aerospace applications in which the potential for significant liability exposures necessitates additional insurance costs.
Many factors beyond our control could lead to liability claims, including:
|
•
|
the failure of a product manufactured by a third party that incorporated components manufactured by us;
|
|
•
|
the reliability and skills of persons using our products or the products of our customers; and
|
|
•
|
the use by customers of materials or products that we produced for applications for which the material or product was not designed.
|
If we cannot successfully defend ourselves against claims, we may incur substantial liabilities. Even successful defense would require significant financial and management resources. Regardless of the merits or eventual outcome, liability claims may result in:
|
•
|
decreased demand for our products;
|
|
•
|
reputational injury;
|
|
•
|
initiation of investigation by regulators;
|
|
•
|
costs to defend related litigation;
|
|
•
|
diversion of management time and resources;
|
|
•
|
compensatory damages and fines;
|
|
•
|
product recalls, withdrawals or labeling, marketing or promotional restrictions;
|
|
•
|
loss of revenue;
|
|
•
|
exhaustion of any available insurance and our capital resources; and
|
|
•
|
a decline in our stock price.
|
We could be required to pay a material amount if a claim is made against us that is not covered by insurance or otherwise subject to indemnification or that exceeds the insurance coverage that we maintain. Moreover, we do not currently carry insurance to cover the expense of product recalls, and litigation involving significant product recalls or product liability could have a material adverse effect on our results of operations, financial position and cash flows.
Our businesses could suffer if we lose certain employees or cannot attract and retain qualified employees.
We rely upon a number of key executives and employees, particularly members of the Executive Leadership Team. If these and certain other employees ceased to work for us, we would lose valuable expertise and industry experience and could become less profitable. We do not carry "key-man" insurance covering the loss of any of our executives or employees.
In addition, future operating results depend in part upon our ability to attract and retain qualified engineering and technical personnel. As a result of intense competition for talent in the market, we cannot ensure that we will be able to continue to attract and retain such personnel. While our key employees are generally subject to non-competition agreements for a limited period of time following the end of their employment, if we were to lose the services of key executives or employees, it could adversely impact our ability to maintain our technological position, and / or have a material adverse effect on our results of operations, financial position and cash flows.
We may not be able to consummate, finance or successfully integrate future acquisitions into our business, or expand our existing business, which could hinder our strategy or result in unanticipated expenses, losses or charges.
As part of our strategy, we have supplemented and may continue to supplement organic growth by acquiring companies or operations engaged in similar or complementary businesses. If the consummation of acquisitions and integration of acquired companies and businesses excessively diverts management's attention from the operations of our core businesses, operating results could suffer. Any acquisition made could be subject to a number of risks, including:
13
|
•
|
failing to discover liabilities of the acquired company or business for which we may be responsible as a successor owner or operator, including environmental costs and liabilities;
|
|
•
|
difficulties associated with the assimilation of operations and personnel of the acquired company or business;
|
|
•
|
increased debt service requirements as a result of increased indebtedness to complete acquisitions;
|
|
•
|
the loss of key personnel in the acquired company or business; and / or
|
|
•
|
a negative effect on our financial results resulting from an impairment of acquired intangible assets, the creation of provisions, or write downs.
|
Goodwill represents the amount of acquisition cost over the fair value of net assets we acquired in the purchase of other businesses. We review goodwill for impairment at least annually, or more frequently if events or changes in circumstances indicate the carrying amount of the asset might be impaired. We determine impairment by comparing the implied fair value of the reporting unit with the carrying amount of that reporting unit (including goodwill). If the carrying amount of the reporting unit (including goodwill) exceeds the implied fair value of that reporting unit, an impairment loss is recognized in an amount equal to that excess. Any such adjustments are reflected in our results of operations in the periods in which they become known. As of December 31, 2017, our goodwill totaled $
59.6 million
. While we have recorded few impairment charges since we initially recorded the goodwill, there can be no assurance that our future evaluations of goodwill will not result in findings of impairment and related write downs.
We cannot ensure that every acquisition will ultimately provide the benefits originally anticipated.
We also face certain challenges as a result of organic growth. For example, in order to grow while maintaining or decreasing per unit costs, we will need to improve efficiency, effectively manage operations and employees and hire enough qualified technical personnel. We may not be able to adequately meet these challenges. Any failure to do so could result in costs increasing more rapidly than any growth in sales, thus resulting in lower operating income from which to finance operations and indebtedness. In addition, we may need to incur indebtedness to finance organic growth, which will increase our debt service requirements. There can be no assurance that we will be able to incur indebtedness in the future on favorable terms or at all.
Any of these events could have a material adverse impact on our results of operations, financial position and cash flows.
We could suffer a material interruption in our operations as a result of unforeseen events or operating hazards.
Our production facilities are located in a number of different locations around the world. Any of our facilities could suffer an interruption in production, either at separate times or at the same time, because of various and unavoidable occurrences, such as severe weather events (for example, hurricanes and floods), earthquakes, casualty events (for example, explosions, fires or material equipment breakdowns), acts of terrorism, pandemic disease, labor disruptions or other events (for example, required maintenance shutdowns). For example, our operations in California are subject to risks related to earthquakes. Further disruption occurred during 2015 at our Riverside, California, facility when an electrical arc caused damage to electrical equipment which triggered a power outage at the facility. In addition, some of our products are highly flammable, and there is a risk of fire inherent in their production process. Such hazards could cause personal injury or death, serious damage to, or destruction of, property and equipment, suspension of operations, substantial damage to the environment and / or reputational harm. The risk is particularly high in the production of ultra-fine magnesium powders, which are highly flammable and explosive in certain situations. Similar disruptions in the operations of our suppliers and / or customers could materially affect our business and operations. Although we carry certain levels of business
interruption insurance, the coverage on certain catastrophic events or natural disasters, including earthquakes, a failure of energy supplies and certain other events, is limited, and it is possible that the occurrence of such events may have a significant adverse impact on our results of operations, financial position and cash flows.
We are exposed to risks related to cybersecurity threats and general information security incidents which may also expose us to liability under data protection laws including the GDPR.
In the conduct of our business, we increasingly collect, use, transmit and store data on information technology systems. This data includes confidential information belonging to us our customers and other business partners, as well as personally identifiable information of individuals, including our employees. Like other global companies, we have experienced, and expect to continue to be subject to, cybersecurity threats and incidents, ranging from employee error or misuse to individual attempts to gain unauthorized access to information technology systems, to sophisticated and targeted measures known as advanced persistent threats, none of which have been material to the Group to date.
14
Although we devote significant resources to network security, data encryption and other measures to protect our information technology systems and data from unauthorized access or misuse, including those measures necessary to meet certain information security standards that may be required by our customers, there can be no assurance that these measures will be successful in preventing a cybersecurity or general information security incident. We also rely in part on the reliability of certain tested third parties' cybersecurity measures, including firewalls, virus solutions and backup solutions, and our business may be affected if these third-party resources are compromised.
Cybersecurity incidents may result in business disruption, the misappropriation, corruption or loss of confidential information (including personally identifiable information) and critical data (ours or that of third parties), reputational damage, litigation with third parties, regulatory fines, diminution in the value of our investment in research and development and data privacy issues and increased information security protection and remediation costs. As these cybersecurity threats, and government and regulatory oversight of associated risks continue to evolve, we may be required to expend additional resources to remediate, enhance or expand upon the cybersecurity protection and security measures we currently maintain. For example, we are subject to the European Union’s General Data Protection Regulation ("GDPR"), which is enforceable from May 25, 2018. The GDPR introduces a number of new obligations for subject companies and over the coming months (as well as following May 25, 2018), we will need to continue dedicating financial resources and management time to GDPR compliance. Among other things, the GDPR places subject companies under obligations relating to the security of the personally identifiable information they process; while we have taken steps to ensure compliance with the GDPR, there can be no assurance that the measures we have taken will be successful in preventing an incident, including a cybersecurity incident or other data breach, which results in a breach of the GDPR. Fines for non-compliance with the GDPR may be levied by supervisory authorities in the European Union up to a maximum of €20,000,000 or 4% of the subject company’s annual, group-wide turnover (whichever is higher). Individuals who have suffered damage as a result of a subject company’s non-compliance with the GDPR also have the right to seek compensation from such a company.
Future cybersecurity breaches, general information security incidents, further increases in data protection costs or failure to comply with relevant legal obligations regarding protection of data could therefore have a material adverse effect on our results of operations, financial position and cash flows.
Employee strikes and other labor-related disruptions may adversely affect our operations.
Several of our production facilities depend on employees who are members of various trade union organizations. Strikes by, or labor disputes with, our employees may adversely affect our ability to conduct business. We cannot assure you that there will not be any strike, lock-out or material labor dispute in the future. Work interruptions or stoppages could have a material adverse effect on our results of operations, financial position and cash flows.
We could incur future liability claims arising from previous businesses now closed or sold.
We have sold or closed down a number of businesses over the years, but the products or services provided when the businesses were open and under our ownership could still result in potential liabilities which could have a material adverse effect on our operations, financial position and cash flows.
As a holding company, Luxfer Holdings PLC's main source of cash is distributions from our operating subsidiaries.
Our ultimate parent company, Luxfer Holdings PLC, conducts all of its operations through the subsidiaries of Luxfer Group. Accordingly, its main cash source is dividends from these subsidiaries. The ability of each subsidiary to make distributions depends on the funds that a subsidiary receives from its operations in excess of the funds necessary for its operations, obligations or other business plans. Since Luxfer Group subsidiaries are wholly-owned, claims of Luxfer Holdings PLC will generally rank junior to all other obligations of the subsidiaries. If Luxfer Group operating subsidiaries are unable to make distributions, Luxfer Group's growth may slow, unless we are able to obtain additional debt or equity financing. In the event of a subsidiary's liquidation, there may not be assets sufficient for us to recoup our investment in the subsidiary.
Our failure to perform under purchase or sale contracts could result in the payment of penalties to customers or suppliers, which could have a negative impact on our results of operations, financial position or cash flows.
A failure to perform under purchase or sale contracts could result in the payment of penalties to suppliers and / or customers, which could have a negative impact on our results of operations, financial position or cash flows. Certain contracts with suppliers could also obligate us to purchase a minimum product volume (clauses known as "take or pay") or contracts with customers may impose firm commitments for the delivery of certain quantities of products within certain time periods. The risk of incurring liability under a take or pay supply contract would increase during an economic crisis, which in turn would increase the likelihood of a sharp drop in demand for our
15
products, which could have a material adverse effect on our results of operations, financial position and cash flows.
We could be adversely affected by violations of the U.K. Bribery Act, the U.S. Foreign Corrupt Practices Act and similar worldwide anti-bribery laws.
The U.K. Bribery Act, the U.S. Foreign Corrupt Practices Act and similar worldwide anti-bribery laws generally prohibit companies and their intermediaries from making or receiving improper payments to, or from, government officials or, third parties, for the purpose of obtaining or retaining business. Failing to prevent bribery is also an offense under the U.K. Bribery Act. Our policies mandate compliance with these laws. Despite our compliance program, we cannot assure you that our internal control policies and procedures will always protect us from reckless, negligent or improper acts committed by our employees or agents. The costs of violations of these laws or allegations of such violations could have a material adverse effect on our results of operations, financial position and cash flows.
We have a significant amount of indebtedness, which may adversely affect our cash flows and our ability to operate our business, remain in compliance with debt covenants, make payments on our indebtedness, pay dividends and respond to changes in our business or take certain actions.
As of December 31,
2017
, we had $90.0 million of indebtedness under our senior notes (the "Loan Notes")
divided into tranches of $15.0 million, $25.0 million, $25.0 million and $25.0 million due 2018, 2021, 2023 and 2026 respectively; and $
21.3 million
of indebtedness under the Revolving Credit Facility. See item 5 "Operating and Financial Review and Prospects—Financing."
Our indebtedness could have important consequences to you. For example, it could make it more difficult for us to satisfy obligations with respect to indebtedness, and any failure to comply with the obligations of any of our debt instruments, including financial and other restrictive covenants, could result in an event of default under agreements governing our indebtedness. Further, our indebtedness could require us to dedicate a substantial portion of available cash flows to pay principal and interest on our outstanding debt, which would reduce the funds available for working capital, capital expenditures, dividends, acquisitions and other general corporate purposes. Our indebtedness could also limit our ability to operate our business, including the ability to engage in strategic transactions or implement business strategies. Factors related to our indebtedness could materially and adversely affect our business and our results of operations. Furthermore, our interest expense could increase if interest rates rise, because certain portions of our debt facilities bear interest at floating rates. If we do not have sufficient cash flows to service our debt, we may be required to refinance all or part of our existing debt, sell assets, incur further indebtedness or sell securities, none of which we can guarantee we will be able to do.
In addition, the agreements that govern the terms of our indebtedness contain, and any future indebtedness would likely contain, a number of restrictive covenants imposing significant operating and financial restrictions on us, including restrictions that may limit our ability to engage in acts that may be in our long-term best interests, including:
|
•
|
incurring or guaranteeing additional indebtedness;
|
|
•
|
capital expenditures;
|
|
•
|
paying dividends (including to fund cash interest payments at different entity levels) or making redemptions, repurchases or distributions with respect to ordinary shares or capital stock;
|
|
•
|
creating or incurring certain security interests;
|
|
•
|
making certain loans or investments;
|
|
•
|
engaging in mergers, acquisitions, investment in joint ventures, amalgamations, asset sales and sale and leaseback transactions; and
|
|
•
|
engaging in transactions with affiliates.
|
These restrictive covenants are subject to a number of qualifications and exceptions. The operating and financial restrictions and covenants in our existing debt agreements and any future financing agreements may adversely affect our ability to finance future operations or capital needs or to engage in other business activities.
We may be able to incur significant additional indebtedness in the future. Although the agreements governing our indebtedness contain restrictions on the incurrence of certain additional indebtedness, these restrictions are subject to a number of important qualifications and exceptions, and the indebtedness incurred in compliance with these restrictions could be substantial. If we incur new indebtedness, the related risks, including those described above, could intensify.
Any of these factors could have a material adverse impact on our results of operations, financial position and cash flows.
16
Certain factors beyond our control may affect the market price of our ordinary shares.
Certain factors, some of which are beyond our control, may have a material effect on the market price of our ordinary shares, including:
|
•
|
fluctuations in our results of operations;
|
|
•
|
negative publicity;
|
|
•
|
changes in stock market analyst recommendations regarding our company, sectors in which we operate, the securities market generally and conditions in the financial markets;
|
|
•
|
regulatory developments affecting our industry;
|
|
•
|
announcements of studies and reports relating to our products or those of our competitors;
|
|
•
|
changes in economic performance or market valuations of our competitors;
|
|
•
|
actual or anticipated fluctuations in our quarterly results;
|
|
•
|
conditions in industries in which we operate;
|
|
•
|
announcements by us or our competitors of new products, acquisitions, strategic relations, joint ventures or capital commitments;
|
|
•
|
additions to or departures of our key executives and employees;
|
|
•
|
fluctuations of exchange rates;
|
|
•
|
release of transfer restrictions on our outstanding ordinary shares; and
|
|
•
|
sales or perceived sales of additional ordinary shares.
|
During recent years, securities markets in the U.S. and worldwide have experienced significant volatility in prices and trading volumes. This volatility could have a material effect on the market price of our ordinary shares, which could adversely impact our ability to access equity markets and have a material adverse impact on our results of operations, financial position and cash flows.
Our ability to pay regular dividends on our ordinary shares is subject to the discretion of our Board of Directors and will depend on many factors, including our results of operations, cash requirements, financial position, contractual restrictions, applicable laws and other factors, and may be limited by our structure and statutory restrictions and restrictions imposed by the Revolving Credit Facility and the Loan Notes, as well as any future agreements.
We may declare cash dividends on our ordinary shares as described in "Item 8. Financial Information." However, the payment of future dividends will be at the discretion of our Board of Directors. Any recommendation by our Board to pay dividends will depend on many factors, including our results of operations, cash requirements, financial position, contractual restrictions, applicable laws and other factors, including availability of future debt facilities. Under English law, any payment of dividends would be subject to the Companies Act 2006 of England and Wales (the "Companies Act"), which requires, among other things, that we can only pay dividends on ordinary shares out of profits available for distribution determined in accordance with the Companies Act. Additionally, any change in the level of our dividends or the suspension of the payment thereof could adversely affect the market price of our ordinary shares.
As a foreign private issuer, we are exempt from a number of rules under the U.S. securities laws and are permitted to file less information with the Securities and Exchange Commission than a U.S. company. This may limit the information available to holders of the ordinary shares.
We are a "foreign private issuer," as defined in the Securities and Exchange Commission ("SEC") rules and regulations and, consequently, we are not subject to all of the disclosure requirements applicable to companies organized within the U.S. For example, we are exempt from certain rules under the U.S. Securities Exchange Act of 1934, as amended (the "Exchange Act"), that regulate disclosure obligations and procedural requirements related to the solicitation of proxies, consents or authorizations applicable to a security registered under the Exchange Act. In addition, our officers and directors are exempt from the reporting and "short-swing" profit recovery provisions of Section 16 of the Exchange Act and related rules with respect to their purchases and sales of our securities. Moreover, we are not required to file periodic reports and consolidated financial statements with the SEC as frequently or as promptly as U.S. public companies. Accordingly, there may be less publicly available information concerning our company than there is for U.S. public companies.
As a foreign private issuer, we are not subject to certain New York Stock Exchange corporate governance rules applicable to U.S. listed companies.
We rely on a provision in the New York Stock Exchange's Listed Company Manual that allows us to follow English corporate law and the Companies Act with regard to certain aspects of corporate governance. This
17
allows us to follow certain corporate governance practices that differ in significant respects from the corporate governance requirements applicable to U.S. companies listed on the New York Stock Exchange ("NYSE").
For example, we are exempt from NYSE regulations that require a listed U.S. company, among other things, to:
|
•
|
have a majority of the board of directors consisting of independent directors;
|
|
•
|
require non-management directors to meet on a regular basis without management present;
|
|
•
|
establish a nominating and compensation committee composed entirely of independent directors;
|
|
•
|
adopt and disclose a code of business conduct and ethics for directors, officers and employees; and
|
|
•
|
promptly disclose any waivers of the code for directors or executive officers that should address certain specified items.
|
In accordance with our NYSE listing, our Audit Committee is required to comply with the provisions of Section 301 of the Sarbanes-Oxley Act of 2002 (the "Sarbanes-Oxley Act") and Rule 10A-3 of the Exchange Act, both of which are also applicable to NYSE listed U.S. companies. As we are a foreign private issuer, however, our Audit Committee is not subject to additional NYSE requirements applicable to listed U.S. companies, including:
|
•
|
an affirmative determination that all members of the Audit Committee are "independent," using more stringent criteria than those applicable to us as a foreign private issuer;
|
|
•
|
the adoption of a written charter specifying, among other things, the Audit Committee's purpose and including an annual performance evaluation; and
|
|
•
|
the review of an auditor's report describing internal quality control issues and procedures and all relationships between the auditor and us.
|
Furthermore, the New York Stock Exchange's Listed Company Manual requires listed U.S. companies to, among other things, seek shareholder approval for the implementation of certain equity compensation plans and issuances of common stock.
We expect to lose our foreign private issuer status which will require us to comply with the U.S. domestic reporting regime under the Exchange Act and result in significant additional compliance activity and increased costs and expenses.
We are currently a “foreign private issuer,” as such term is defined in Rule 405 under the Securities Act, and, therefore, we are not required to comply with all the periodic disclosure and current reporting requirements of the Exchange Act and related rules and regulations. Under Rule 405, the determination of foreign private issuer status is made annually on the last business day of an issuer’s most recently completed second fiscal quarter and, accordingly, the next determination will be made with respect to us on June 30, 2018. We expect to lose our foreign private issuer status on the next determination date as the majority of our executive officers and directors are U.S. citizens, which we do not expect this to change before the next determination date, and separately, we may have more than 50% of our assets located in the U.S. As a result, we expect to be required to comply with U.S. domestic issuer requirements, most of which will apply from January 1, 2019.
The regulatory and compliance costs to us under U.S. securities laws as a U.S. domestic issuer may be significantly more than costs we incur as a foreign private issuer. If we are not a foreign private issuer, we will be required to file periodic reports and registration statements on U.S. domestic issuer forms with the SEC, which are more detailed and extensive in certain respects than the forms available to a foreign private issuer. We will be required under current SEC rules to prepare our consolidated financial statements in accordance with U.S. generally accepted accounting principles (“U.S. GAAP”) and modify certain of our policies to comply with corporate governance practices associated with U.S. domestic issuers; these requirements will be additional to, and not in place of, those under U.K. law to prepare consolidated financial statements under International Financial Reporting Standards as issued by the European Union ("IFRS") and comply with U.K. corporate governance laws. Such conversion and modifications will involve additional costs, both one‑off in nature on conversion and also extra ongoing costs to meet reporting in both U.S. GAAP and IFRS, which will reduce our operating profit. In addition, we may lose our ability to rely upon exemptions from certain corporate governance requirements on U.S. stock exchanges that are available to foreign private issuers, such as the ones described above, and exemptions from requirements related to the preparation and solicitation of proxies (including compliance with full disclosure obligations regarding executive compensation in proxy statements and the requirements of holding a nonbinding advisory vote on certain executive compensation matters, such as “say on pay” and “say on frequency”). Moreover, we will no longer be exempt from certain of the provisions of U.S. securities laws, such as Regulation FD (which restricts the selective disclosure of material information),
18
exemptions for filing beneficial ownership reports under Section 16(a) for officers, directors and 10% shareholders and the Section 16(b) short swing profit rules. In light of our expectations, we have already started to prepare for the consequences of becoming a U.S. domestic issuer, including those described above, and we expect that the loss of foreign private issuer status will increase our legal and financial compliance costs and will make some activities highly time-consuming and costly. The additional costs could have an adverse impact on our results of operations, financial position and cash flows.
In addition, the transition to being treated as a U.S. domestic issuer may make it more difficult and expensive for us to obtain director and officer liability insurance, and we may be required to accept reduced coverage or incur substantially higher costs to obtain coverage.
The City Code on Takeovers and Mergers no longer applies to us and we and you therefore do not have the benefit of the protections that the Code affords.
Although we are a public limited company incorporated in England and Wales, our securities are not admitted to trading on a regulated market in the U.K. (or the Channel Islands or the Isle of Man) and, therefore, the City Code on Takeovers and Mergers (the “Code”) only applies to us if we are considered by the Panel on Takeovers and Mergers (the “Panel”) to have our place of central management and control in the U.K. (or the Channel Islands or the Isle of Man). Under the Code, the Panel looks to where the majority of our directors are themselves resident, among other factors, for the purposes of determining where we have our place of central management and control. In January 2018, the Panel confirmed to us, based on the residency of the members of our board of directors, that the Code does not apply to us and we and you will therefore not have the benefit of the protections the Code affords, including, for example, the requirement that a person who acquires an interest in our shares carrying 30% or more of the voting rights must make a cash offer to all other shareholders at the highest price paid in the 12 months before the offer was announced.
If we fail to establish or maintain an effective system of internal controls, we may be unable to accurately report our financial results or prevent fraud, and investor confidence and the market price of our ordinary shares may, therefore, be adversely impacted.
We are subject to reporting obligations under U.S. securities laws. Our reporting obligations as a public company place a significant strain on our management, operational and financial resources and systems for the foreseeable future. Our management is required to report on the effectiveness of our internal control over financial reporting as required by Section 404(a) of the Sarbanes-Oxley Act, for which we perform system and process evaluation and testing of our internal control over financial reporting.
Over time we may identify and correct deficiencies or weaknesses in our internal controls and, where and when appropriate, report on the identification and correction of these deficiencies or weaknesses. However, the internal control procedures can provide only reasonable, and not absolute, assurance that deficiencies or weaknesses are identified. Deficiencies or weaknesses that have not been identified by us could emerge, and the identification and correction of these deficiencies or weaknesses could have a material adverse impact on our results of operations. If our internal control over financial reporting are not considered adequate, this may adversely affect our ability to report our financial results on a timely and accurate basis, which may result in a loss of public confidence or have an adverse effect on the market price of our ordinary shares, which could adversely impact our ability to access equity markets and could have a material adverse impact on our results of operations, financial position and cash flows.
We ceased to be an "emerging growth company" as defined under the JOBS Act on December 31, 2017, and therefore the reduced disclosure requirements applicable to emerging growth companies no longer apply to us.
We ceased to be an "emerging growth company" on December 31, 2017. We are therefore no longer able to rely on those exemptions to reporting requirements available to "emerging growth companies." As a result, we need to comply with certain more burdensome reporting requirements and devote substantial management effort toward ensuring compliance with these requirements. For example, we need to comply with the independent auditor attestation requirements of Section 404(b) of the Sarbanes-Oxley Act, relating to the effectiveness of our internal control over financial reporting, beginning with this Annual Report.
Our inability to continue to take advantage of these exemptions may place additional strain on our resources and divert our management's attention from other business concerns. Moreover, we may incur additional expenses toward ensuring compliance with the requirements applicable to non-emerging growth companies.
19
It may be difficult to effect service of U.S. process and enforce U.S. legal process against the directors of Luxfer.
Luxfer is a public limited company incorporated under the laws of England and Wales. A number of our directors and officers reside outside of the U.S., principally in the U.K. A substantial portion of our assets, and the assets of such persons, are located outside of the U.S. Therefore, it may not be possible to effect service of process within the U.S. upon Luxfer or these persons in order to enforce judgments of U.S. courts against Luxfer or these persons based on the civil liability provisions of the U.S. federal securities laws. There is doubt as to the enforceability in England and Wales, in original actions or in actions for enforcement of judgments of U.S. courts, of civil liabilities solely based on the U.S. federal securities laws.
20
|
Item 4.
|
Information on the Company
|
|
A.
|
History and development of the company.
|
General
Although the origins of some of our operations date back to the early part of the 19th century, we trace our business as it is today back to the 1982 merger of The British Aluminium Company Limited and Alcan Aluminium U.K. Limited, which created British Alcan. The original Luxfer Group was formed in February 1996 in connection with the management buy-in (the "Management Buy-in") of certain downstream assets of British Alcan. The Management Buy-in was financed by a syndicate of private equity investors. Largely through a leveraged reorganization in 1999, and finally a capital reorganization in 2007, these investors fully exited their original investments in the business.
Our company was incorporated on December 31, 1998, with the name Neverealm Limited (we re-registered as a public limited company and changed our name to Luxfer Holdings PLC on April 1, 1999), for the purpose of acquiring all of the outstanding share capital of the original Luxfer Group Limited in connection with a leveraged recapitalization that occurred in April 1999. As part of the 1999 recapitalization, Luxfer Holdings PLC became the parent holding company of our operating subsidiaries around the world. To facilitate the 1999 recapitalization, Luxfer Holdings PLC issued £160 million of Senior Notes due 2009 and took on £140 million of bank debt.
In February 2007, Luxfer Holdings PLC completed a capital reorganization, which reduced its debt burden and realigned its share capital. A key part of this reorganization was the release and cancellation of the Senior Notes due 2009 in consideration for, among other things, the issuance of a lower principal amount of new senior notes due 2012 (the "Senior Notes due 2012"). Senior noteholders, other than Luxfer Group Limited, also acquired 87% of the voting share capital of Luxfer Holdings PLC from existing shareholders with management and the employee share ownership plan ("ESOP") retaining 13% of the voting share capital.
Since the 2007 capital reorganization, we have considerably improved the profitability of our businesses and reduced debt, repaying the Senior Notes due 2012 early.
In October 2012, Luxfer Holdings PLC successfully listed its shares (in the form of American Depositary Shares evidenced by American Depositary Receipts) on the NYSE.
We have re-shaped the company since 1996 through a significant number of acquisitions and disposals. The main acquisitions which have been made include:
|
•
|
the agreement to purchase Dynetek Industries Ltd, a Canadian business listed on the Toronto Stock Exchange which closed in September 2012;
|
|
•
|
the acquisition of the assets and businesses of Truetech Inc. and Innotech Products Limited in July 2014. These entities produce magnesium-based flameless heating pads for self-heating meals used by the U.S. military and emergency relief agencies; an extensive line of self-heating meals, soups and beverages used by military and civilian end-users; chemical agent detection kits and chemical decontamination equipment; and seawater desalinization kits; and
|
|
•
|
the acquisition on December 5, 2017 of the trade and assets of Specialty Metals business of ESM Group Inc., including a manufacturing facility in Saxonburg, PA, U.S.A. ESM Group’s Saxonburg plant manufactures a range of magnesium-based chips, granules, ground powders and atomized powders.
|
On December 11, 2017, Luxfer Holdings PLC terminated its ADR facility and arranged for the exchange of outstanding ADSs for the underlying ordinary shares. The exchange allows Luxfer shareholders to directly own and publicly trade ordinary shares on the New York Stock Exchange under the symbol "LXFR".
Corporate
Luxfer Holdings PLC is registered as a public limited company under the laws of England and Wales with its registered office at Lumns Lane, Manchester, M27 8LN, England. Our telephone number is +44(0) 161 300 0600.
Our agent in the U.S. is Corporation Service Company, 2711 Centreville Road, Wilmington, Delaware 19808.
21
B. Business overview
Luxfer is a global materials technology company specializing in the innovation and manufacture of high-performance materials, components and devices for transportation, defense and emergency response, healthcare and general industrial applications. Our customers include both end-users of our products and manufacturers that incorporate our products into finished goods. Details about our products are found below in descriptions of our two reporting divisions and their brands.
We focus primarily on innovations related to magnesium alloys, zirconium alloys, aluminum alloys and carbon composites. For example, we were the first to develop and patent a rare-earth-containing magnesium alloy (EZ33A) for use in high-temperature aerospace applications, including helicopter gearboxes; we were at the forefront of the commercial development of zirconia-rich mixed oxides for use in automotive catalysis; we were the first to manufacture a high-pressure gas cylinder out of a single piece of aluminum using cold-impact extrusion; and we developed and patented the superforming process and the first superplastic aluminum alloy (AA2004). We have a long history of innovation derived from our strong technical expertise, and we work closely with customers to apply innovative solutions to their most demanding product needs. Our proprietary technologies and technical expertise, coupled with best-in-class customer service and global presence, provide significant competitive advantages and have established us as leaders in the global markets we serve. We believe that we have leading positions, technically and by market share, in key product areas, including magnesium aerospace alloys, photo-engraving plates, zirconium chemicals for automotive catalytic converters and high-pressure aluminum and composite cylinders for breathing applications and a wide variety of other uses.
We have a global presence, operating 23 manufacturing plants in the U.S., the U.K., Canada, France, the Czech Republic and China, and our average total headcount was
1,769
people, including temporary staff, in
2017
. We also have joint ventures in Japan, India, and the U.S. In
2017
, our total revenue was
$441.3 million
, net income was
$11.5 million
and our adjusted EBITDA was
$61.8 million
. See "Item 3A. Selected Financial Data" for the definition of adjusted EBITDA and reconciliations to net income for the year. In
2017
, we manufactured and sold approximately
16,600
metric tons of our magnesium products, approximately
3,300
metric tons of our zirconium products (excluding water weight as sold as a solution) and approximately
1.8
million high-pressure gas cylinders. For a breakdown of our total revenue in
2017
,
2016
and
2015
by segment and geographic origin, see "Note 2—Revenue and segmental analysis" to our consolidated financial statements included in this Annual Report.
Our company is organized into two reporting divisions, Elektron and Gas Cylinders, each of which produced
50%
of our total revenue in
2017
. Elektron represented
79%
of our total trading profit for the year, and Gas Cylinders represented
21%
.
Elektron Division
Our Elektron Division focuses on specialty materials based primarily on magnesium and zirconium. Key product lines include:
|
•
|
Advanced lightweight, corrosion-resistant and heat- and flame-resistant magnesium alloys including our new bioresorbable SynerMag
®
alloy and our dissolvable SoluMag
®
alloy.
|
|
•
|
Magnesium powders used in countermeasure flares that protect aircraft from heat-seeking missiles and also for heating pads for self-heating meals used by the military and emergency-relief agencies.
|
|
•
|
Magnesium, copper, and zinc photoengraving plates for graphic arts and luxury packaging.
|
|
•
|
High-performance zirconium-based materials and oxides used as catalysts and in the manufacture of advanced ceramics, fiber-optic fuel cells, and many other performance products.
|
Gas Cylinders Division
Our Gas Cylinders Division manufactures and markets specialized products using aluminum, titanium and carbon composites. Key product lines include:
|
•
|
Carbon composite cylinders for self-contained breathing apparatus (SCBA), used by firefighters and other emergency-responders. Our products are also used by scuba divers and personnel in potentially hazardous environments such as mines.
|
|
•
|
Aluminum and composite cylinders used for containment of oxygen and other medical gases used by patients, healthcare facilities and laboratories.
|
|
•
|
Carbon composite cylinders for compressed natural gas (CNG) and hydrogen containment in alternative fuel (AF) vehicles.
|
|
•
|
Lightweight aluminum cylinders for a variety of industrial applications such as fire extinguishers and containment of high-purity specialty gases.
|
22
|
•
|
Lightweight aluminum and titanium panels superformed into highly complex shapes used mainly in the transportation industry.
|
Our end-markets
Key end-markets for Luxfer Group products fall into four categories:
Transportation (
29%
of
2017
revenue):
Many Luxfer products serve a growing need to improve and safeguard the environment in the field of transportation, including our zirconium-based products that clean up automotive exhausts; our lightweight magnesium alloys used in fuel-efficient aerospace and automotive designs; and our lightweight, high-pressure carbon composite alternative fuel cylinders that contain clean-burning compressed natural gas. We also superform single sheets of aluminum, magnesium or titanium to create complex, three-dimensional shapes used in automotive, aerospace and rail components. As recycling metals is an essential environmental and economic practice, we have a dedicated site specifically for recycling magnesium alloys, as well as recycling capabilities at all our production sites.
|
Area of Focus
|
Product
|
End-market drivers
|
||||
|
Alternative fuels
|
• Alternative fuel cylinders
• Exhaust catalysts
• Bulk gas transportation cylinders
|
• "Clean air" initiatives
• Abundance of natural gas
• Favorable tax treatment
• Increasing CNG filling infrastructure
|
||||
|
Environmental catalysts (cleaning of exhaust emissions)
|
• Zirconium compounds with specific properties used in auto-catalysis washcoats
|
• Emissions legislation generally
• Application of tighter regulations on diesel engines in U.S. and Europe
• Cost effective for vehicle manufacturers as they reduce the use of precious metals
|
||||
|
Specialty / high-end automotive
|
• Superformed complex body panels, doors and trunk assemblies and other high-strength components
• Magnesium extrusions
|
• Fuel efficiency for a given level of performance
• Increased flexibility for vehicle designers in terms of complex shapes and strength
• Strong demand for top-end cars from affluent customers, typically in emerging markets
|
||||
|
Sensors, piezoelectrics and electro-ceramics
|
• Zirconium-based ceramic materials used in sensors of engine management systems
|
• Engine efficiency
• Control of exhaust gases
|
||||
|
Rail transport
|
• Superformed train front-cab and internal components
|
• Government investment in public transport
• Fuel efficiency
• Safety requirements for moving from plastic to metal for internal components
|
||||
|
Military and civil aerospace
|
• Superform (wing leading edges, engine nacelle skins, winglets)
• Elektron® aerospace alloys in cast, extruded, and sheet form
|
• Growing aircraft build rate
• Increasing cost of fuel
|
||||
|
Helicopters
|
• Magnesium sand-casting alloys, superformed panels
|
• Lightweighting
• Fuel efficiency
|
||||
|
Recycling
|
• Recycling service converting magnesium scrap into good die-casting ingot
|
• Marketing "whole-of-life" costing for vehicles
• Legislation requiring recycling at end of vehicle's life cycle
|
||||
23
Defense and emergency response (
30%
of
2017
revenue) :
Luxfer offers a number of products that address principal factors driving growth in this market, such as heightened societal expectations regarding protection of people, equipment and property during conflicts and emergencies. Our products include magnesium powders for countermeasure flares that defend aircraft against heat-seeking missile attack, life-support cylinders for firefighters and other emergency-service personnel, fire extinguisher cylinders, and chemical agent detection and decontamination products.
|
Area of Focus
|
Product
|
|
End-market drivers
|
|||
|
Life-support breathing apparatus
|
• Composite cylinders used in SCBA
|
|
• Increased awareness of importance of properly equipping firefighting services post 9/11
• Demand for lightweight products to upgrade from heavy all-metal cylinders
• Periodic upgrade of new U.S. National Institute for Occupational Safety and Health (NIOSH) standards and natural replacement cycles
• Asian and European fire services looking to adopt more modern SCBA equipment
|
|||
|
Fire protection
|
• Cylinders (CO
2
fire extinguishers)
|
|
• New commercial buildings
• Cylinder replacement during annual servicing
|
|||
|
Countermeasures
|
• Ultra-fine magnesium powders for flares used to protect aircraft from attack by heat-seeking missiles
|
|
• Use in combat and training
• Maintenance of countermeasures reserves (shelf-life restrictions)
|
|||
|
Military vehicles
|
• Elektron® magnesium alloys in cast rolled, and extruded forms
|
|
• Maintaining high level of protection while reducing weight to improve maneuverability and fuel economy
|
|||
|
Military personnel and emergency relief agencies
|
• Self-heating meals used by military personnel and emergency-relief agencies
• Chemical detection and chemical decontamination kits
|
|
• Ensuring protection and well-being for military personnel and victims of natural disasters
• Use in combat and training and in response to terrorist activities
|
|||
Healthcare (
8%
of
2017
revenue):
Luxfer has a long history in the healthcare end-market, and we see this as a major area for the introduction of new technologies. These include lightweight aluminum and composite cylinders for containment of medical and laboratory gases; magnesium powders for pharmaceutical products; magnesium materials for lightweight orthopedic devices; specialized magnesium alloys for cardiovascular stents and implants; and zirconium materials for biomedical applications and dental implants.
|
Area of Focus
|
|
Product
|
|
End-market drivers
|
||
|
Medical gases
|
|
• Portable aluminum and composite cylinders
• Portable oxygen concentrators
|
|
• Growing use of medical gases
• Shift to paramedics, who need portable, lightweight products
• Growing trend to provide oxygen therapy in the home and to keep patients mobile
• Increasingly aging population
• Increase in respiratory diseases
|
||
|
Medical equipment casings
|
|
• Superformed panels (e.g., for MRI scanners)
|
|
• Growing use of equipment using powerful magnets and consequent need for non-ferrous, hygienic casings
|
||
|
Pharmaceutical industry
|
|
• Magnesium powders as a catalyst for chemical synthesis (Grignard process)
|
|
• Growth in pharmaceutical industry
|
||
|
Orthopedics
|
|
• Magnesium sheets
|
|
• Improved mobility through use of easy-to-wear, lightweight braces and trusses
|
||
|
Sorbents
|
|
• MELsorb® material being developed as active ingredient in dialysis equipment and enterosorbents
|
|
• Growth in kidney problems
• New technologies to remove noxious elements from the body
|
||
24
General industrial (
33%
of
2017
revenue):
Our core technologies have enabled us to exploit various other niche markets and applications. Our products include zirconium-based compounds to purify drinking water and clean up industrial exhausts; magnesium alloys shaped for use in various general engineering applications; and high-pressure gas cylinders used for high-purity specialty gases, beverage dispensing, scuba diving and performance racing. Metal foil-stamping and embossing dies are used primarily for luxury packaging, labels and greeting cards. Our high-quality magnesium, copper and zinc plates are ideal for these and other graphic applications.
|
Area of Focus
|
Product
|
End-market drivers
|
||||
|
Specialty gases
|
• Inert-interior aluminum cylinders for high-purity gases
|
• Semiconductor and electronics industries
• Pharmaceutical industry growth
• Specialized laboratory requirements
• Oil exploration
|
||||
|
Leisure activities
|
• Cylinders for SCUBA diving, car and boat racing
|
• Leisure time
• Growth of middle class in emerging markets
|
||||
|
General engineering
|
• Magnesium billets, sheets, coil, tooling plates
• Zirconium ceramic compounds for hard working components
|
• Economic growth
• Need for components to operate in more extreme environments for longer periods, such as underground or in the ocean
|
||||
|
Water purification
|
• Isolux® (removal of heavy metals from drinking water) and MELsorb® (wastewater treatment)
|
• Tightened World Health Organization guidelines on levels of heavy metals in water and associated legislation
|
||||
|
Paper
|
• Bacote™ and Zirmel™, both formaldehyde-free insolubilizers that aid high-quality printing
|
• Elimination of toxic chemicals
|
||||
|
Graphic arts
|
• Photo-engraving plates
|
• Luxury packaging as part of marketing high-end products
|
||||
Our strengths
Focus on innovation and product development for growing specialized end-markets.
We continue to produce a steady stream of new products, including those developed in close collaboration with our customers.
Strong technical expertise and know-how.
Using our expertise in metallurgy and material science, we specialize in advanced materials, developing products and materials with superior performance to satisfy the most demanding requirements in the most extreme environments. Further, we benefit from the fact that a growing number of our products, including many of our alloys and compounds, are patented.
Diversified blue chip customer base with long-standing relationships.
We put the customer at the heart of our strategy, and we have long-standing relationships with many of our customers, including global leaders in our key markets.
Our Business Excellence Standard Toolkit.
The "Luxfer B.E.S.T. Model," consists of the following key themes:
|
•
|
A common set of values that drives accountability, innovation, customer first, personal development, teamwork and integrity.
|
|
•
|
Disciplined capital allocation with the aim of maximizing organic growth and the product portfolio value through value-enhancing acquisitions and divestitures.
|
|
•
|
Balanced score-card used in an effort to continuously improve employee performance in an effort to help translate our vision into actionable individual goals and ensure that employee compensation is commensurate with individual performance.
|
|
•
|
A published Customer Charter designed to enable us to retain and grow our customer base and capture additional market share.
|
|
•
|
A lean enterprise philosophy that helps drive operational process excellence in all functions including, sales, marketing, innovation, human resources, supply, manufacturing, information technology and finance.
|
25
Our business divisions
We are organized into two reporting divisions, Elektron and Gas Cylinders. The following tables illustrate the revenue, trading profit and adjusted EBITDA of each division in
2017
,
2016
and
2015
.
|
Year ended December 31, 2017
|
||||||||||||||||||||||
|
Revenue
|
Trading profit
(1)
|
Adjusted EBITDA
(2)
|
||||||||||||||||||||
|
Amount
|
Percentage
|
Amount
|
Percentage
|
Amount
|
Percentage
|
|||||||||||||||||
|
(in $ million)
|
(%)
|
(in $ million)
|
(%)
|
(in $ million)
|
(%)
|
|||||||||||||||||
|
Elektron
|
$
|
221.1
|
|
50.1
|
%
|
$
|
31.8
|
|
78.5
|
%
|
$
|
44.5
|
|
72.0
|
%
|
|||||||
|
Gas Cylinders
|
220.2
|
|
49.9
|
%
|
8.7
|
|
21.5
|
%
|
17.3
|
|
28.0
|
%
|
||||||||||
|
Year ended December 31, 2016
|
||||||||||||||||||||||
|
Revenue
|
Trading profit
(1)
|
Adjusted EBITDA
(2)
|
||||||||||||||||||||
|
Amount
|
Percentage
|
Amount
|
Percentage
|
Amount
|
Percentage
|
|||||||||||||||||
|
(in $ million)
|
(%)
|
(in $ million)
|
(%)
|
(in $ million)
|
(%)
|
|||||||||||||||||
|
Elektron
|
$
|
189.0
|
|
45.6
|
%
|
$
|
23.9
|
|
67.7
|
%
|
$
|
35.6
|
|
64.4
|
%
|
|||||||
|
Gas Cylinders
|
225.8
|
|
54.4
|
%
|
11.4
|
|
32.3
|
%
|
19.7
|
|
35.6
|
%
|
||||||||||
|
Year ended December 31, 2015
|
||||||||||||||||||||||
|
Revenue
|
Trading profit
(1)
|
Adjusted EBITDA
(2)
|
||||||||||||||||||||
|
Amount
|
Percentage
|
Amount
|
Percentage
|
Amount
|
Percentage
|
|||||||||||||||||
|
(in $ million)
|
(%)
|
(in $ million)
|
(%)
|
(in $ million)
|
(%)
|
|||||||||||||||||
|
Elektron
|
$
|
221.2
|
|
48.1
|
%
|
$
|
33.7
|
|
79.7
|
%
|
$
|
45.7
|
|
73.5
|
%
|
|||||||
|
Gas Cylinders
|
239.1
|
|
51.9
|
%
|
8.6
|
|
20.3
|
%
|
16.5
|
|
26.5
|
%
|
||||||||||
|
(1)
|
Trading profit is defined as operating profit before profit on sale of redundant site, changes to defined benefit pension plans and restructuring and other expense. For purposes of our divisional segmental analysis, IFRS 8 requires the use of "segment profit" performance measures that are used by our chief operating decision maker. Trading profit is the "segment profit" measure used by our chief operating decision maker for divisional segmental analysis. See "Note 2—Revenue and segmental analysis" in our consolidated financial statements included elsewhere in this Annual Report.
|
|
(2)
|
Adjusted EBITDA is defined as net income for the period before income tax expense, finance income (which comprises interest receivable), finance costs (which comprises interest costs, IAS 19R retirement benefits finance charge, and the unwind of the discount on deferred contingent consideration from acquisitions), net gain / (loss) on acquisitions and disposals, profit on sale of redundant site, changes to defined benefit pension plans, restructuring and other expense, other share based compensation charges, depreciation and amortization and loss on disposal of property, plant and equipment.
See footnote (3) of Item 3.A. ("Selected financial data") of this Annual Report for a reconciliation to net income.
|
26
Elektron Division
The Elektron Division represented
50%
of our total revenue and
79%
of our trading profit in
2017
. The table below provides a summary of products, applications / principal markets and illustrative customers and end-users.
|
Products
|
Application / principal
markets supplied
|
Illustrative customers
and end-users
|
||||
|
Magnesium alloys
|
Aerospace, oil and gas and specialist automotive
|
United Technologies, Fansteel-Wellman, Boeing, Lockheed Martin
|
||||
|
Magnesium powders and powder-based products
|
Defense countermeasure flares and self-heating meals for military personnel and emergency-relief agencies
|
Esterline Defense Technologies, Chemring, US armed forces, FEMA, Red Cross, The Wornick Company, AmeriQual Group, LLC, Sopakco
|
||||
|
Magnesium plates
|
Photo-engraving for packaging and decorative printing
|
American Greetings
|
||||
|
Zirconium compounds
|
Catalysts
|
Umicore, Johnson Matthey, BASF, Sud Chemie, Dinex, UOP (Honeywell)
|
||||
|
Ceramics
|
Bosch, EPCOS, Imerys, Oerlikon Metco, Ask-Hi Tech
|
|||||
|
Chemical synthesis
|
BASF
|
|||||
|
Reflective coatings
|
3M
|
|||||
The principal geographic markets for the Elektron Division are North America and Europe. Shown below are
2017
percentages of revenue by geographic destinations and geographic origins.
Elektron Division—Revenue by geographic destination
2017
|
Geographic Region
|
Percentage of Elektron revenue
|
||||
|
North America
|
59
|
%
|
|||
|
Europe, other than U.K.
|
25
|
%
|
|||
|
Asia Pacific
|
9
|
%
|
|||
|
U.K.
|
4
|
%
|
|||
|
Rest of World
|
3
|
%
|
|||
Elektron Division—Revenue by geographic origin
2017
|
Geographic Region
|
Percentage of Elektron revenue
|
||||
|
North America
|
64
|
%
|
|||
|
U.K.
|
28
|
%
|
|||
|
Europe, other than U.K.
|
8
|
%
|
|||
Magnesium alloys:
These offer significant advantages over aluminum alloys, since magnesium alloys are approximately a third lighter in weight while exhibiting similar strength and stability. Customers typically use our specialized alloys when lightness of weight, high strength and high temperature stability are important, such as in jet fighters and helicopter gearboxes, which operate under extreme conditions.
We have developed a large percentage of high-performance magnesium alloys available in major markets, including the U.S. For example, we developed 12 of the 18 magnesium alloys approved by the American Society for Testing Material ("ASTM")
Standard Specification for Magnesium-Alloy Sand Castings
. In the last 30 years, we developed and patented five out of six new alloys added to the list. The ASTM
Standard Specification for Magnesium-Alloy Extruded Bars, Rods, Profiles, Tubes, and Wire
lists nine currently used alloys, and we developed five of them.
Recently we have commercialized two new alloys, SynerMag
®
, for use in bioresorbable cardio stents and SoluMag
®
, a dissolvable alloy for use in the oil and gas industry.
Magnesium powders and powder based products:
We believe that we are the largest manufacturer of atomized magnesium powders in the U.S. Our magnesium powder facilities have been manufacturing ground magnesium powders since 1941 and atomized powders since 1966.
27
We also produce magnesium-based flameless heating pads for self-heating meals used by the U.S. military and emergency relief agencies, as well as magnesium-based chemical agent detection kits and chemical decontamination equipment.
In 2017, we acquired the trade and assets of Specialty Metals business of ESM Group Inc., including a manufacturing facility in Saxonburg, PA. The acquired business is being integrated with our existing powder business that currently offers similar products.
Magnesium plates:
We believe that we are the largest manufacturer of magnesium plates used for photo-engraving for packaging and decorative printing.
Our magnesium-based products serve a wide range of customers globally and we have close, collaborative relationships with our customers. We compete in various specialty niches, as highlighted above. Competition, which is fragmented and varies from sector to sector, includes Chinese suppliers of magnesium die-casting alloys. We do not normally compete directly against primary magnesium producers, which supply pure magnesium and simple alloys.
We have a number of patented and off-patent products that help us maintain our competitive position. Due to the significant complexity of producing our specific alloys, we believe that competitors are likely to have difficulty manufacturing these alloys even after our patents expire.
Zirconium chemicals
: We believe that our zirconium chemicals business is a leader in the manufacture of specialty zirconium compounds. Chemically derived zirconium products are more versatile, pure and suitable for demanding applications than thermally derived products or natural zirconia, and our products consequently command significantly higher value-added premiums. Sold in powder and solution forms, these products are used in a broad range of applications, including wash coats for catalytic converters, functional ceramics, chemical catalysis, and solid-oxide fuel cells.
Our zirconium plants use a multi-stage process based on proprietary technology to produce zirconium salts and zirconium oxides differentiated by their chemical purity and unique physical properties. Zircon sand is often the base raw material in our manufacturing process, and we also use a number of rare earths and commodity chemical products to produce our zirconium compounds.
The demand for our products is mainly driven by environmental concerns and legislation, since our environmentally-friendly products can replace toxic chemicals in many applications.
With a leading position in the zirconium compounds market, we have established ourselves over a number of years as an approved supplier to a number of blue-chip customers. These relationships have, in turn, facilitated the sharing of technical knowledge to develop new products and applications.
We have experienced significant competition in simple zirconium compounds from Chinese suppliers, either directly or through the availability of low-cost Chinese zirconium stock used by specialty competitors. Markets with relatively low technological needs, such as lead-replacement products for paint drying, now offer lower margins due to aggressive pricing by Chinese suppliers. Rather than compete in such lower margin markets, we have shifted our focus to more advanced markets that require our advanced technologies and know-how, which we use to develop customized products that meet the specific needs of our customers. We have a limited number of direct competitors in our chosen specialized markets that require complex chemical compounds with advanced catalytic, electrical and ceramic properties. In these markets, we compete primarily with Daiichi Kigenso Kagaku Kogyo of Japan, Solvay of France, Neo Performance Materials of the U.S. and Tosoh of Japan.
28
Gas Cylinders Division
The Gas Cylinders Division represented
50%
of our total revenue and
21%
of our trading profit in
2017
. The table below shows products, applications, principal markets and illustrative customers and end-users.
|
Products
|
Application / principal markets
supplied
|
Illustrative customers
and end-users
|
||||
|
High-pressure aluminum and composite gas-containment cylinders and systems
|
Self-contained breathing apparatus (SCBA)
|
Scott Safety (3M), MSA, Honeywell
|
||||
|
Alternative fuels
|
Creative Bus, MAN
|
|||||
|
Bulk gas transportation
|
GTM Technologies
|
|||||
|
Specialty gases
|
Linde, Air Liquide, Airgas
|
|||||
|
Medical
|
Linde, Air Products
|
|||||
|
Fire extinguisher
|
Ansul (Johnson Controls), Chubb / Kidde (UTC)
|
|||||
|
Beverage
|
Coca-Cola, Pepsi
|
|||||
|
Scuba
|
XS Scuba
|
|||||
|
Inflation (aerospace)
|
Goodrich (UTC)
|
|||||
|
Superplastically-formed aluminum, titanium and magnesium products
|
Aerospace
|
Exelis, Boeing, Bombardier, Honda, Spirit, UTC Aerospace, Honeywell, Embraer, Short Brothers Plc (Bombardier), BAE Systems, GKN Aerospace.
|
||||
|
Automotive
|
Aston Martin, Morgan, Bentley (VW), Ferrari S.P.A., Chrysler / FnG, McLaren Automotive
|
|||||
|
Medical
|
Siemens, Varian
|
|||||
|
Rail
|
Bombardier, Kinki Sharyo, Hitachi, LUL.
|
|||||
The principal geographic markets for the Gas Cylinders Division are the U.S., Europe and Asia Pacific. Shown below are
2017
percentages of revenue by geographic destinations and geographic origins.
Gas Cylinders Division—Revenue by geographic destination
2017
|
Geographic Region
|
Percentage of Gas Cylinders revenue
|
||||
|
North America
|
49
|
%
|
|||
|
Europe, other than U.K.
|
21
|
%
|
|||
|
Asia Pacific
|
12
|
%
|
|||
|
U.K.
|
14
|
%
|
|||
|
Rest of World
|
4
|
%
|
|||
Gas Cylinders Division—Revenue by geographic origin
2017
|
Geographic Region
|
Percentage of Gas Cylinders revenue
|
||||
|
North America
|
61
|
%
|
|||
|
U.K.
|
27
|
%
|
|||
|
Europe, other than U.K.
|
10
|
%
|
|||
|
Asia Pacific
|
2
|
%
|
|||
Luxfer Gas Cylinders
manufactured and sold approximately
1.8
million cylinders in
2017
, and we believe that we remain the largest global manufacturer of portable high-pressure aluminum and composite cylinders. The business achieved its leadership position through a long history of innovation and a commitment to setting a leading worldwide standard in product innovation and customer service.
Historically, overall growth in the Luxfer Gas Cylinders business has been driven by inherent benefits of aluminum over steel for high-pressure cylinders. In
2017
, sales of aluminum cylinders accounted for approximately
34%
of divisional revenue. Although steel was the first material used for the containment of high-pressure gas, aluminum cylinders have the following recognized benefits:
|
•
|
Aluminum cylinders are up to 40% lighter in weight than steel cylinders.
|
29
|
•
|
Non-corroding and non-reactive aluminum cylinders are ideal for maintaining the purity of many specialty gases used in critical manufacturing and laboratory applications.
|
|
•
|
Considered by many to be more cosmetically attractive than steel, aluminum cylinders are desirable for fire extinguishers, medical and scuba applications.
|
|
•
|
Non-magnetic aluminum cylinders may be safely used near diagnostic medical equipment containing powerful magnets.
|
Luxfer Gas Cylinders is also a leading supplier of carbon composite cylinders, including thin-walled, aluminum-lined cylinders fully-wrapped with aerospace-grade carbon fiber. Luxfer developed both the world's highest-pressure and lightest-weight composite life-support cylinders. In
2017
, sales of composite cylinders accounted for approximately
44%
of Gas Cylinders Division revenue. Over the last decade, our composite cylinder business has enjoyed higher growth rates and stronger margins than our aluminum cylinder business. We believe demand for carbon composite cylinders will continue to grow, driven by the following benefits when compared to aluminum and steel cylinders:
|
•
|
Carbon composite cylinders are about one-third the weight of comparable aluminum cylinders and about 70% lighter than comparable steel cylinders.
|
|
•
|
High strength-to-weight ratio enables increased pressure to be used for the same size cylinder, thereby increasing cylinder volume capacity.
|
Demand for composite cylinders has been driven in part by increased usage in the emergency services sector, which prefers lighter-weight, higher-pressure cylinders for life-support applications. The use of carbon composite cylinders to contain compressed natural gas (CNG) and other alternative fuels has also grown over the past decade. We make cylinders and systems for AF vehicles and for storage and transportation of bulk CNG, and we also specialize in cylinders and valves for hydrogen fuel-cell vehicles and other hydrogen applications. Our research shows further growth opportunities in composite cylinders and associated new specialty products.
Luxfer Gas Cylinders has a very broad customer base, both geographically and by number. Customers in medical, SCBA and fire extinguisher markets tend to be highly concentrated since there are relatively few end-user distributors. Within the SCBA market, we have achieved a very high level of market penetration by providing composite cylinders to the three major suppliers to the North American market: MSA, Scott Safety (3M) and Honeywell.
Due to our strong worldwide distribution network, we believe that Luxfer Gas Cylinders is the most global manufacturer of high-pressure aluminum and composite gas cylinders. Luxfer had specialized in Type 3 (aluminum-lined) composite cylinders for a number of years, but in 2014, we introduced a new line of Luxfer-designed Type 4 (polymer-lined) cylinders for the AF market.
In recent years, the high-pressure gas cylinder market has undergone some consolidation. Worthington Industries, originally a steel cylinder competitor in the U.S. and Europe, has over the past decade purchased composite cylinder manufacturers that compete directly with Luxfer Gas Cylinders. Other competitors include Catalina Cylinders, an aluminum cylinder manufacturer in the U.S.; Faber, a steel cylinder manufacturer in Italy; and MES Cylinders, an aluminum cylinder manufacturer based in Turkey. In the AF sector, our main competitor is the Norwegian-owned Hexagon Composites, which produces Type 4 composite cylinders for CNG containment and which has recently acquired Agility Fuel Solutions which competes in the same field.
In Asia, the market for aluminum cylinders is less developed, and larger competitors predominantly offer steel products. These include Everest Kanto Cylinder, based in India, and Beijing Tianhai Industry, based in China. However, the use of composite cylinders is growing in the Asia Pacific region, and several competitors are now also manufacturing composite cylinders.
Superform
developed a superplastic-forming process that uses customized tooling and controlled heat and air pressure applied to special aluminum, magnesium or titanium alloy sheets to elongate and form them into complex, bespoke shapes. These lightweight components are principally used in automotive, aerospace, medical, rail transportation and architectural end-markets. Although these products currently represent a relatively small niche market, we believe that Superform, which has operations in England and the U.S., is the largest independent supplier of such components in the Western world. In
2017
, Superform sales accounted for approximately
16%
of Gas Cylinders Division revenue.
In
2017
, we continued to develop new manufacturing processes and high-strength materials to form parts at faster speeds and also to form titanium parts. Complementary value-enhancing processes have been added to strengthen our customer offering. These new innovations are targeted at widening the sales potential of our technology.
30
Due to the fact that Superform invented the superplastic-forming process, direct competition with our technology is limited. Competition mainly comes from alternative technologies, such as cold pressing (which Superform is investing in), hydroforming and composite technologies, including those using carbon fiber. Hydroforming is a specialized type of die forming that uses a high-pressure hydraulic fluid to press material into a die at room temperature. The process is slower than cold pressing, and tooling costs are generally higher than for superforming.
Competitors include KTK in China, Magna International in Ireland, EBP in Sweden, Fontana in Italy and Verbom in Canada. Boeing, which purchased a license from Superform in 1998, has in-house aluminum superplastic-forming capability.
Suppliers and raw materials
Elektron Division
Key raw materials used by our Elektron Division are magnesium, zircon sand and rare earths.
The world market for magnesium is around one million metric tons per year. China provides about 70% of the world supply. Western primary production is, however, significant, from North American suppliers, Dead Sea Magnesium in Israel, RIMA Industrial in Brazil and two smelters in Russia. We purchase approximately half of our magnesium needs from China. We use only U.S.-sourced materials for our products sold to the U.S. military, for which U.S. and Canadian sourcing is mandatory.
We purchase and process zircon sand, which is found in heavy-minerals sand, titanium dioxide and other products. Global production of zircon is estimated at approximately 1.6 million metric tons. We source premium-grade zircon sand from Rio Tinto in South Africa and Iluka in Australia. We also purchase intermediate zirconium chemicals from suppliers in China; the level of these purchases is based on a number of factors, including required properties and relative market prices.
There are 17 rare earth metals that are reasonably common in nature. Usually found mixed together with other mineral deposits, these rare earths have magnetic and light-emitting properties that make them invaluable to high-technology manufacturers. As they are key ingredients in the manufacturing of our zirconium chemical and magnesium alloy products, our use of rare earths has expanded over the last few years. Our main requirement is for cerium, which we use in automotive catalysis compounds because of its unique oxygen-storage capabilities.
Gas Cylinders Division
The largest single raw material purchased by the Gas Cylinders Division is aluminum. In
2017
, we purchased
73%
of our aluminum from Rio Tinto Alcan and its associated companies, and aluminum represented
35%
of the division's raw material costs in the year.
Since 2005, the price of aluminum has been somewhat volatile. While we pass on most price movements to our customers, sometimes through contractual cost-sharing formulas, doing so can be more difficult or time consuming with our higher-value products. Consequently, we have historically hedged a portion of our exposure to fluctuations in aluminum pricing.
As a means of hedging against aluminum price increases, we use LME derivative contracts. During
2017
, such contracts covered approximately
60%
of our estimated primary aluminum needs for the year.
Another key material is high-strength carbon fiber used in our composite products. Our main suppliers are Toray and Mitsubishi. In recent years, carbon fiber shortages have occurred due to increased demand for commercial aerospace and military applications. Consequently, we have built up relationships with our suppliers, providing them predictable requirements and fixed-price annual contracts to encourage successful procurement of our required quota of carbon fiber.
Environmental matters
Like most manufacturing facilities, our operations are subject to a range of environmental laws and regulations, including those relating to air emissions, wastewater discharges, handling and disposal of solid and hazardous wastes and remediation of contamination associated with current and historic use of hazardous substances or materials. If release of hazardous substances or materials occurs on or from our properties, from our processes or at any off-site disposal location we have used, or if contamination from previous activities is discovered at any of our locations, we may be held liable for costs of remediation, including response costs, natural resource damage costs and associated transaction costs. We devote considerable efforts to complying with and reducing our risk of liability under environmental laws, including maintaining an environmental management system.
31
Due to their long history of industrial use, some of our facilities have areas of soil and water contamination that require or are anticipated to require investigation or remediation, including:
Manchester, England.
A dedicated landfill has been adjacent to our Manchester plant for more than 60 years. Following a review, we decided to close the landfill and ship our continuing waste to commercial off-site landfills. A detailed closure plan for the landfill was approved in June 2011 with the U.K. Environment Agency as the relevant regulator. The remediation process has progressed well although progress in 2017 was slow due to the lack of availability of top-of-cap-grade material. This material has now been sourced and is on site. We have recognized a provision of $0.3 million that we estimate to be the cost to complete the closure, which we now expect to be realized during 2018.
Manchester, England.
In 1998, we identified radioactive scale in mineral buildup that was contaminating pipes, valves and tanks in a redundant ion-exchange plant. The zircon sand used by the operation contains low-level, naturally occurring radioactive material, which had concentrated in the scale. The ion-exchange plant has been assessed, and a disposal route for the contaminated pipes and valves has been identified. We have been advised that leaving the tanks in situ is a safe and suitable option with the building used for storage being isolated, clearly quarantined and declared off-limits to site personnel. The U.K. Environment Agency has been made aware of this and has confirmed that it does not have any objections to this proposal. We do not expect there to be any health or safety risks as long as the building remains sealed.
Saxonburg, Pennsylvania.
As part of the due diligence regarding the acquisition of the Specialty Metals business of ESM Group Inc during 2017, we identified excess levels of manganese in water samples obtained from shallow depths. Even though this does not pose a health concern, we are going to participate in Pennsylvania Department of Environmental Protection's voluntary Act 2 program.
As of December 31,
2017
, the provision recognized with respect to this matter was $0.4 million.
Flemington, New Jersey.
We have requested permission to close a disused settling pond at this location and as a pre-condition to this closure, a program of remediation work to remove small amounts of contaminated soil and return the area to commercial land condition has been proposed to the New Jersey Department of Environmental Protection (NJDEP). Pursuant to the Industrial Site Recovery Act, we are pursuing an agreement with the previous owners to share in remediation costs. We have an accrual of $0.4 million related to this matter.
Flemington, New Jersey.
We have been investigating the presence of dissolved salts in groundwater adjacent to our plant to determine whether it was caused by activity on our site. At this point, we believe that most of the salts are naturally occurring, emanating from the local type of ground rock, and our consultants have submitted a report to the NJDEP for acceptance.
Riverhead, New York.
This site contains a small, redundant laboratory once used for testing chemical decontamination products. It is currently sealed, but as part of our acquisition due diligence, we determined to have the facility professionally removed and cleansed. During 2016, the expected work began and is expected to be completed in 2018. As of December 31,
2017
, the remaining provision with respect to this matter was $0.1 million.
Redditch, England.
In 2000, civil works carried out at the BA Tubes plant in Redditch led to the discovery of significant sub-soil contamination. Further investigation suggested that two large trichloroethylene spillages had occurred before we owned the business. Over several years we have been implementing a long-term improvement plan at the site in line with an action plan for voluntary remediation that we presented to the U.K. Environment Agency. Since 2008, there has been no industrial activity on the Redditch site. On March 11, 2016, we sold our redundant Redditch site to a company that specializes in remediating contaminated land. The sale was with passage of statutory liability for environmental issues to the purchaser, but our protection from future liabilities was partly dependent on a pre-arranged insurance policy that came into force when the on-site remediation was completed. The on-site remediation was completed at the end of March 2017, and we consequently released a provision of $0.4 million held as at December 31, 2016, to cover potential future costs.
General Issues.
Under the U.S. Superfund Law or similar laws, we may be subject to liability with regard to on-site contamination and off-site waste disposals. The costs and liabilities associated with matters identified above are not currently expected to be material. However, because additional contamination could be discovered or more stringent remediation requirements could be imposed in the future, there can be no assurance that costs and liabilities associated with further environmental investigation and clean-up related to these matters will not be material.
We have made and will continue to make expenditures related to environmental compliance. In 2014, we spent $5.1 million on environmental remediation which included $4.0 million on the removal of sludge and clean-up of related contamination from a large pond at our Flemington, New Jersey, facility, which is now completed. We
32
spent $0.3 million on environmental remediation in each of 2015 and 2016, but did not incur any environmental remediation related expenditures in 2017.
We estimate that our expenditures on general environmental matters could be approximately $0.7 million in
2018
. These expenditures include finalizing the closure of the Manchester landfill and completing the decommissioning of the laboratory in Riverhead, New York. The exact timing of these expenditures is still uncertain, and they may be delayed, reducing the expenditures in
2018
and pushing work into
2019
and later years. Since the magnitude of environmental problems often becomes clearer as remediation is under way, the actual cost of such remediation could be higher than our estimate. The nature of the cost is also difficult to fully ascertain, and we may capitalize some costs because the remediation work enhances the value of the land we own.
We have taken the future estimated environmental remediation expenditures into account in our ongoing financial planning, and we expect to fund expenditures from operating cash we generate. Based on information currently available to us, we do not believe that there are any other environmental liabilities or issues of non-compliance that will have a material adverse effect on our results of operations, financial position or cash flows. Future changes in environmental laws and regulations or other developments could, however, increase environmental expenditures and liabilities, and there can be no assurance that such costs and liabilities in any given year will not be material.
Environmental Management Systems.
Following completion of the Management Buy-in in 1996, we retained independent environmental consultants RPS to design and implement an Environmental Management System ("EMS") for the purpose of monitoring and taking remedial action related to issues identified in the course of the acquisition due diligence. This work led to the adoption of a corporate environmental policy and the development of an EMS manual used by all facilities acquired at that time. Subsequent to the original Management Buy-in, all acquired facilities have been the subject of appropriate environmental due diligence.
On all sites, we continued during
2017
to take a proactive approach to environmental issues, and we completed a number of projects to reduce potential environmental impacts of issues identified in previous base-line reviews. We intend to certify all our larger sites as ISO 14001-compliant. As of December 31,
2017
,
14
of our 23 sites had achieved this objective.
We report the proportion of our sales that comes from ISO 14001-compliant sites as a non-financial KPI. The figure for
2017
is
90%
, which is
2%
lower
than in
2016
(92%).
Seasonality
In general, demand for our products is not seasonal. However, we have shutdown periods at most of our manufacturing sites during which we carry out important maintenance work. Shutdowns typically last two weeks in the summer and one to two weeks around the year-end holidays, resulting in reduced levels of activity in the second half of the year compared to the first half. Third-quarter and fourth-quarter revenue and operating profit can be affected by our own shutdowns and by shutdowns by various industrial customers. In particular, we have found that our fourth-quarter results are generally lower, since many customers reduce production activity from late November through December. However, less activity in December usually leads to lower levels of working capital and therefore stronger cash flows around year-end. We also operate in various areas that are susceptible to bad weather during winter months, such as Calgary, Canada, and various U.S. eastern states. Bad weather can unexpectedly disrupt production and shipments from our manufacturing facilities, which can lead to reduced sales revenue and operating profits. We also manufacture products used in graphic arts and premium packaging, demand for which increases in the run up to Christmas.
33
C. Organizational structure.
The following is a list of Luxfer Holdings PLC subsidiaries:
|
Name of company
|
Country of incorporation
|
Proportion of ownership interest
|
|||||
|
BA Holdings, Inc.*
|
U.S.
|
100
|
%
|
||||
|
Biggleswick Limited*
|
England and Wales
|
100
|
%
|
||||
|
Luxfer Group Services Limited*
|
England and Wales
|
100
|
%
|
||||
|
LGL 1996 Limited*
|
England and Wales
|
100
|
%
|
||||
|
BAL 1996 Limited*
|
England and Wales
|
100
|
%
|
||||
|
Hart Metals, Inc.*
|
U.S.
|
100
|
%
|
||||
|
Lumina Trustee Limited
(1)
|
England and Wales
|
100
|
%
|
||||
|
Luxfer Australia Pty Limited*
|
Australia
|
100
|
%
|
||||
|
Luxfer Gas Cylinders Limited*
|
England and Wales
|
100
|
%
|
||||
|
Luxfer Gas Cylinders China Holdings Limited*
|
England and Wales
|
100
|
%
|
||||
|
Luxfer Gas Cylinders (Shanghai) Co., Limited*
|
People's Republic of China
|
100
|
%
|
||||
|
Luxfer Group Limited
|
England and Wales
|
100
|
%
|
||||
|
Luxfer Group 2000 Limited
|
England and Wales
|
100
|
%
|
||||
|
Luxfer, Inc.*
|
U.S.
|
100
|
%
|
||||
|
Luxfer Overseas Holdings Limited*
|
England and Wales
|
100
|
%
|
||||
|
Magnesium Elektron Limited*
|
England and Wales
|
100
|
%
|
||||
|
MEL Chemicals, Inc.*
|
U.S.
|
100
|
%
|
||||
|
Magnesium Elektron North America, Inc.*
|
U.S.
|
100
|
%
|
||||
|
Magnesium Elektron CZ s.r.o.*
|
Czech Republic
|
100
|
%
|
||||
|
MEL Chemicals China Limited*
|
England and Wales
|
100
|
%
|
||||
|
Niagara Metallurgical Products Limited*
|
Canada
|
100
|
%
|
||||
|
Reade Manufacturing, Inc.*
|
U.S.
|
100
|
%
|
||||
|
Luxfer Gas Cylinders S.A.S.*
|
France
|
100
|
%
|
||||
|
Luxfer Canada Limited*
|
Canada
|
100
|
%
|
||||
|
Luxfer Germany GmbH*
|
Germany
|
100
|
%
|
||||
|
Luxfer Utah LLC*
|
U.S.
|
100
|
%
|
||||
|
HyPerComp Engineering Inc.*
|
U.S.
|
100
|
%
|
||||
|
Luxfer Magtech Inc.*
|
U.S.
|
100
|
%
|
||||
|
Luxfer Magtech International Limited*
|
England and Wales
|
100
|
%
|
||||
Other Investments:
|
Name of company
|
Country of incorporation
|
Proportion of voting rights and shares held
|
|||||
|
Nikkei-MEL Co Limited*
|
Japan
|
50
|
%
|
||||
|
Luxfer Uttam India Private Limited*
|
India
|
51
|
%
|
||||
|
Dynetek Cylinders India Private Ltd*
|
India
|
49
|
%
|
||||
|
Dynetek Korea Co Limited*
|
South Korea
|
49
|
%
|
||||
|
Luxfer Holdings NA, LLC*
|
U.S.
|
49
|
%
|
||||
|
Sub161 Pty Limited*
|
Australia
|
26.4
|
%
|
||||
Subsidiary undertakings are all held by the Company unless indicated.
* Held by a subsidiary undertaking.
(1)
Acts as bare trustee in connection with the 2007 share capital reorganization.
34
D. Property, plants and equipment
In
2017
, we operated from 23 manufacturing plants in the U.K., U.S., France, Czech Republic, Canada and China. We also had joint ventures in Japan, India and the U.S. Our manufacturing plants for our operations, as of December 31,
2017
, are shown in the table below:
|
Division
|
Property / Plant
|
Principal products
manufactured
|
Ownership
|
Approximate area (square feet)
|
|||||||
|
Elektron
|
|||||||||||
|
Manchester, England (3 plants)
|
Magnesium alloys / zirconium chemicals
|
Split Lease / Own
|
561,264
|
|
|||||||
|
Madison, IL
|
Magnesium sheet
|
Lease
|
803,795
|
|
|||||||
|
Findlay, OH
|
Photo-engraving sheet
|
Own
|
43,000
|
|
|||||||
|
Tamaqua, PA
|
Magnesium powders
|
Own
|
64,304
|
|
|||||||
|
Lakehurst, NJ
|
Magnesium powders
|
Own
|
78,926
|
|
|||||||
|
Flemington, NJ
|
Zirconium chemicals
|
Own
|
65,000
|
|
|||||||
|
Hamilton, Canada
|
Magnesium powders
|
Lease
|
16,335
|
|
|||||||
|
Litvinov, Czech Republic
|
Magnesium recycling
|
Own
|
62,140
|
|
|||||||
|
Riverhead, NY
|
Magnesium heating pads
|
Own
|
75,000
|
|
|||||||
|
Cincinnati, OH
|
Magnesium heating pads
|
Lease
|
150,000
|
|
|||||||
|
Saxonburg, PA
|
Magnesium powders
|
Own
|
68,000
|
|
|||||||
|
Gas Cylinders
|
|
|
|
|
|
||||||
|
Nottingham, England
|
Aluminum cylinders
|
Lease
|
143,222
|
|
|||||||
|
Gerzat, France
|
Cylinders
|
Own
|
327,535
|
|
|||||||
|
Calgary, Canada
|
Composite cylinders
|
Lease
|
65,500
|
|
|||||||
|
Worcester, England
|
Aluminum panels
|
Lease
|
97,315
|
|
|||||||
|
Kidderminster, England
|
Aluminum panels
|
Lease
|
60,200
|
|
|||||||
|
Riverside, CA
|
Composite cylinders
|
Lease / Own
|
125,738
|
|
|||||||
|
Graham, NC
|
Aluminum cylinders
|
Own
|
121,509
|
|
|||||||
|
Riverside, CA
|
Aluminum panels
|
Lease
|
68,240
|
|
|||||||
|
Brigham City, UT
|
Cylinders
|
Lease
|
10,670
|
|
|||||||
|
Shanghai, China
|
Cylinders
|
Lease
|
15,383
|
|
|||||||
We also have locations in Australia and Italy that are involved in sales and distribution but not in manufacturing, as well as our headquarters in Salford, England. Our current headquarters office, which we hold under a short-term lease, is approximately 5,500 square feet, but is due to move to Manchester, England, in late March, 2018.
Utilization of our main production facilities is generally moderate to high across our businesses. We can adjust capacity relatively easily by varying shift patterns and / or manning levels, and we currently have few areas that require major capital investment to add capacity. Our strategic growth projects may require additional capacity over the next three years, depending on the degree to which these projects are successful.
|
Item 4A.
|
Unresolved Staff Comments
|
There are no written comments from the staff of the SEC that remain unresolved as of the date of filing this Annual Report with the SEC.
35
|
Item 5.
|
Operating and Financial Review and Prospects
|
The following discussion of our financial position and results of operations should be read in conjunction with Item 3.A "Selected Financial Data", our consolidated financial statements and accompanying notes appearing elsewhere in this Annual Report. Our consolidated financial statements have been prepared in accordance with IFRS as issued by the IASB.
The preparation of our consolidated financial statements required the adoption of assumptions and estimates that affect the amounts recorded as assets, liabilities, revenue and expenses in the years and periods addressed and are subject to certain risks and uncertainties. See "Note 1—Accounting policies" to our consolidated financial statements included in this Annual Report for additional details on assumptions and estimates. Our future results may vary substantially from those indicated because of various factors that affect our business, including, among others, those identified under "Forward-Looking Statements" and "Risk factors" and other factors discussed in this Annual Report.
Overview
We are a global materials technology company specializing in the design, manufacture and supply of high-performance materials, components and high-pressure gas-containment devices for healthcare, environmental, protection and specialty end-markets. Our company is organized into two reporting divisions, Elektron and Gas Cylinders, which both represented
50%
, of our total revenue in
2017
. Our Elektron Division focuses on specialty materials based primarily on magnesium, zirconium and rare earths. Our Gas Cylinders Division manufactures and markets specialized products using aluminum, magnesium, carbon composites and steel. For a description of our products, see Item 4.B "Business Overview." Our customers include both end-users of our products and manufacturers that incorporate our products into their finished goods.
Key Factors Affecting our Results
A number of factors have contributed to our results of operations during recent periods, including the effects of fluctuations in raw material costs, effects of fluctuations in foreign exchange rates, changes in market sector demand, our development of new products, the global nature of our operations, our ability to improve operating efficiencies and costs associated with our retirement benefit arrangements.
Raw material costs
We are exposed to commodity price risks in relation to purchases of our raw materials. Raw materials we use include primary magnesium, rare earth metals and chemical compounds, zircon sand, zirconium oxychloride intermediates and other chemical inputs like soda ash for the Elektron Division and aluminum log and sheet and carbon fiber for the Gas Cylinders Division. Many of these raw materials have been subject to price rises and volatility over the last few years, some of which were substantial. We take certain actions to attempt to manage the impact of fluctuations in the costs of these commodities, including passing commodity prices through to certain customers through increasing prices and surcharges on certain products, entering into forward fixed purchase contracts and engaging in some hedging of aluminum prices. Changes in the costs of raw materials can nevertheless have a significant impact on our results of operations. For more information on the effect of commodity price movements on our results of operations, see "Item 11. Quantitative and Qualitative Disclosure About Market Risk—Effect of Commodity Price Movements on Results of Operations."
Exchange rates
As a result of our international operations, we are subject to risks associated with fluctuations among different foreign currencies. This affects our consolidated financial statements and results of operations in various ways:
|
•
|
As part of our consolidation each period, we translate the financial statements of those entities in our group that have functional currencies other than U.S. dollars into U.S. dollars at the period-end exchange rates (in the case of the balance sheet amounts) and the average exchange rates for the period (in the case of income statement and cash flow amounts). The translated values in respect of each entity fluctuate over time with the movement of the exchange rate for the entity's functional currency against the U.S. dollar. We refer to this as the currency translation risk;
|
|
•
|
Our operating subsidiaries make purchases and sales denominated in a number of currencies, including currencies other than their respective functional currencies. To the extent that an entity makes purchases in a currency that appreciates against its functional currency, its cost basis expressed in its functional currency will increase (or decrease if the other currency depreciates against its functional currency). Similarly, for sales in a currency other than the entity's functional currency, its revenues will increase to the extent that the other currency appreciates against the entity's functional currency and decrease to the extent that the currency depreciates against the entity's functional currency. These
|
36
movements can have a material effect on the gross profit margin of the entity concerned and on our consolidated gross profit margin. We refer to this as the currency transaction risk;
|
•
|
After a purchase or sale is completed, the currency transaction risk continues to affect foreign currency accounts payable and accounts receivable on the books of those entities that made purchases or sales in a foreign currency. These entities are required to remeasure these balances at market exchange rates at the end of each period; and
|
|
•
|
To mitigate our exposure to currency transaction risk, we have operated a policy of hedging all contracted commitments in foreign currency, although no new hedges were taken out in the second half of 2017. We also hedge a portion of non-contracted forecast currency receipts and payments for up to 12 months forward.
|
On June 23, 2016, the U.K. held a referendum in which voters approved an exit from the European Union (the "E.U."), commonly referred to as 'Brexit'. On March 29, 2017, the U.K. Government invoked Article 50 of the Treaty on the European Union, which is likely to result in the U.K. exiting the E.U. on March 29, 2019. The U.K. Government has commenced negotiating the terms of the U.K.'s future relationship with the E.U. although there is still considerable uncertainty as to the outcome. It is possible that there will be greater restrictions on imports and exports between the U.K. and other countries and increased regulatory complexity. These changes may adversely affect our operations and financial results.
In 2017, we sold €58.0 million from the U.K. into the Eurozone, and despite the fact that GBP sterling has remained weak against the euro, we were unable to take full advantage of this due to hedges being taken out during 2015 and the first half of 2016 at less favorable exchange rates (these hedges currently cover approximately 32% of 2018 forecast sales in euros). The Gas Cylinders Division, selling mainly aluminum cylinders priced in euros, is more affected than Elektron. Exports from U.S. business units, largely of composite cylinders, into Europe tend to be priced in U.S. dollars, as most of the competition also prices in dollars.
However, if GBP sterling remains weak, we anticipate a potential transactional benefit once pre-existing hedges run off.
For more information on the effect of currency movement on our results of operations, and how we use foreign currency exchange derivative contracts to hedge this risk, see "Item 11. Quantitative and Qualitative Disclosure About Market Risk—Effect of Currency Movement on Results of Operations." We evaluate our results of operations on both an as-reported basis and a constant translation exchange rate basis. The constant translation exchange rate presentation is a non-GAAP measure, which excludes the impact of fluctuations in foreign currency exchange rates. We believe providing constant currency information provides valuable supplemental information regarding our results of operations, consistent with how we evaluate our performance. We calculate constant translation exchange rate percentages by converting our prior-period local currency financial results using the current-period foreign currency exchange rates and comparing these adjusted amounts to our current period reported results. This calculation may differ from similarly-titled measures used by others and, accordingly, the constant translation exchange rate presentation is not meant to be a substitution for recorded amounts presented in conformity with IFRS as issued by the IASB, nor should such amounts be considered in isolation.
Demand in end-markets
Our sales are driven by demand in the major end-markets for our products, which are transportation, defense and emergency response, healthcare and general industrial.
|
•
|
Transportation:
Many Luxfer products serve a growing need to improve and safeguard the environment in the field of transportation, including our zirconium-based products that clean up automotive exhausts; our lightweight magnesium alloys used in fuel-efficient aerospace and automotive designs; and our lightweight, high-pressure carbon composite alternative fuel cylinders that contain clean-burning compressed natural gas. We also superform single sheets of aluminum, magnesium or titanium to create a complex, three-dimensional shapes used in automotive, aerospace and rail components. As recycling metals is an essential environmental and economic practice, we have a dedicated site specifically for recycling magnesium alloys, as well as recycling capabilities at all our production sites.
|
|
•
|
Defense and emergency response:
Luxfer offers a number of products that address principal factors driving growth in this market, such as heightened societal expectations regarding protection of people, equipment and property during conflicts and emergencies. Our products include magnesium powders for countermeasure flares that defend aircraft against heat-seeking missile attack, life-support cylinders for firefighters and other emergency-service personnel, inflation cylinders for aircraft escape slides and life rafts, fire extinguisher cylinders, and chemical agent detection and decontamination products.
|
37
|
•
|
Healthcare:
Luxfer has a long history in the healthcare end-market, and we see this as a major area for the introduction of new technologies. These include lightweight aluminum and composite cylinders for containment of medical and laboratory gases; magnesium powders for pharmaceutical products; magnesium materials for lightweight orthopedic devices; specialized magnesium alloys for cardiovascular stents and implants; and zirconium materials for biomedical applications and dental implants.
|
|
•
|
General industrial:
Our core technologies have enabled us to exploit various other niche markets and applications. Our products include zirconium-based compounds to purify drinking water and clean up industrial exhausts; magnesium alloys shaped for use in various general engineering applications; and high-pressure gas cylinders used for high-purity specialty gases, beverage dispensing, scuba diving and performance racing. Metal foil-stamping and embossing dies are used primarily for luxury packaging, labels and greeting cards. Our high-quality magnesium, copper and zinc plates are ideal for these and other graphic applications.
|
Changes in the dynamics of any of these key end-markets could have a significant effect on our results of operations. For instance, governmental regulation, including government spending and delays in regulatory approvals, as well as decreased prices of substitute products, including falling oil prices, may affect our results of operations in any of these end-markets. See Item 3.D. "
Risk factors—Risks Relating to Our Operations—We depend on certain end-markets, including automotive, alternative fuels, self-contained breathing apparatus, aerospace and defense, medical, and printing and paper. An economic downturn or regulatory changes in any of those end-markets could reduce sales, and margins on those sales.
" and "
Risk factors—Risks Relating to Our Operations—Certain of our operations are highly regulated by different agencies that require products to comply with their rules and procedures and can subject our operations to penalties or adversely affect production.
" For a more detailed discussion of our key end-markets and the factors affecting our results of operations in each market, see Item 4 "Business Overview—Our End-markets."
Product development
Part of our strategy is to increase our focus on high-margin product lines and end-markets, and every year we re-evaluate and balance our investment in product development. In the near-term, we plan to focus on maximizing the potential of the following products that we have already introduced into the market: industrial catalysts and biomedical applications using our zirconia-based materials; L7X
®
higher-pressure medical oxygen cylinders; extruded magnesium alloy shapes; and soluble magnesium alloys for the oil and gas industry.
Global operations
We are a global company with operations and customers around the world. In
2017
, our sales to Europe (including the U.K.), North America and the rest of the world accounted for
33%
,
54%
and
13%
of our revenues respectively. Changes in global economic conditions have impacted, and will continue to impact, demand for our products. Further, our geographic diversity exposes us to a range of risks, such as compliance with different regulatory and legal regimes, exchange controls and regional economic conditions. For more information about potential risks we face, see Item 3.D.
"Risk factors—Risks Relating to Our Operations—Our global operations expose us to economic conditions, political risks and specific regulations in the countries in which we operate, which could have a material adverse impact on our results of operations, financial position and cash flows."
We believe, however, that our geographic diversity also allows us to take advantage of opportunities arising in individual countries or regions. As a result of this diversity, demand for our products across sectors in which we operate can vary depending on the economic health and demographic shifts of our geographic markets. These macro factors can have a significant effect on our financial results. For instance, aging populations in the world's developed economies, along with increasing awareness of the importance of good healthcare in emerging markets, are driving an increase in the use of various medical technologies and applications, creating a growth opportunity for us. Economic expansion in developing economies such as Brazil, Russia, India and China has created increased demand in areas such as auto-catalysis chemicals and gas cylinders.
Operating efficiency
Our management seeks to improve long-term profitability and operating efficiencies to maintain our competitive position. These efforts include identifying operations with costs disproportionate to related revenues, especially operations with significant fixed costs that could negatively impact gross profit margin. In the past few years, we have taken more aggressive rationalization measures. Initiatives have included automation projects, employee redundancy exercises and undertaking temporary and permanent facility closings. Total charges for rationalization (which are a component of restructuring and other expenses) were
$12.1 million
,
$0.4 million
and
$21.8 million
in
2017
,
2016
and
2015
respectively.
38
Retirement benefit arrangements
We operate defined benefit arrangements in the U.K., the U.S. and France. Funding levels are determined by periodic actuarial valuations. Further, we also operate defined contribution plans in the U.K., the U.S. and Australia. Assets of the plans are generally held in separate trustee administered funds. We incur costs related to these retirement benefit arrangements, which can vary from year to year depending on various factors such as interest rates, valuations, regulatory burdens, life expectancy and investment returns. Total charges we incurred for all retirement benefit arrangements were
$6.6 million
,
$7.0 million
and $8.9 million in
2017
,
2016
and
2015
, respectively.
Key Line Items
Revenue
We generate revenue through sales of products that we have developed and manufactured for our customers. The main products that we sell are magnesium alloy powders, ingot, bar, extruded product, rolled plates and thin sheets, engraving plates, zirconium compounds in powder form, various forms of aluminum and carbon composite gas cylinders and superplastically-formed parts pressed using our vacuum pressing technology. We also generate revenue from designing and manufacturing special tools used with our Superform presses to make formed parts and from recycling magnesium alloy scrap for customers, along with sales of scrapped aluminum arising from the manufacture of gas cylinders. In general, for our magnesium and zirconium products, we charge our customers by weight sold, while for our gas cylinder and Superform products, we charge our customers by units and parts sold. For a description of our products, see Item 4.B "Business Overview."
Cost of sales
Our cost of sales primarily consists of a complex set of materials, energy, water and steam, direct shop-floor labor costs, supervisory management costs at our manufacturing facilities, engineering and maintenance costs, depreciation of property, plant and equipment, factory rents, security costs, property taxes and factory consumables, including machinery oils and protective equipment for employees. For a description of raw materials we use, see "Key Factors Affecting Our Results—Raw material costs" and Item 4.B "Business Overview—Suppliers and Raw Materials."
Distribution costs
As a global business, we transport and deliver our products to customers around the world. While some customers pay for their own transport, we can organize transportation through third parties. These distribution costs are recovered in the product price included in our revenue.
Administrative expenses
Our administrative expenses primarily consist of costs for staff working in sales, marketing, research and development, human resources, accounting, legal, information technology and general management. Administrative expenses also include sales commissions to agents, pension administration costs, legal costs, audit fees, directors' fees, taxation consultancy fees and other advisory costs. We also buy office consumables such as stationery, computer equipment and telecommunications equipment.
Restructuring and other income / (expense)
Our restructuring and other income / (expense) primarily consist of items of income and expense, which, because of their infrequent nature, merit separate presentation. In the past, these expenses have included costs related to redundancies, restructuring / rationalization of manufacturing operations, demolition and environmental remediation, litigation settlements, among others.
Other income / (expense)
Other income / (expense) consists of costs related to corporate finance activities, including business acquisitions and financing income and costs. Our finance costs consist of interest costs representing amounts accrued and paid on the outstanding balances under our indebtedness.
39
Critical Accounting Policies
Our consolidated financial statements are prepared in accordance with IFRS as issued by the IASB and the accounting policies that we use are set out under the heading "Note 1—Accounting policies" to our consolidated financial statements. In applying these policies, we make estimates and assumptions that affect the reported amounts of assets and liabilities and disclosure of contingent assets and liabilities, as well as our results of operations. The actual outcome could differ from these estimates. Some of these policies require a high level of judgment, either because they are especially subjective or complex. We believe that the most critical accounting policies and significant areas of judgment and estimation are with respect to impairment of goodwill, intangible assets and property, plant and equipment, retirement benefits, deferred income taxes, inventories obsolescence and write down and measurement of contingent consideration.
Impairment of goodwill, intangible assets and property, plant and equipment
Under IFRS as issued by the IASB, goodwill is held at cost less accumulated impairment and tested annually for impairment, or more frequently if events or changes in circumstances indicate the carrying amount of the asset might be impaired. Tests for impairment are based on discounted cash flow projections, which require us to estimate both future cash flows and an appropriate discount rate. Such estimates are inherently subjective.
For intangible assets other than goodwill, and property, plant and equipment, we assess whether there is any indication that an asset may be impaired at each balance sheet date or more frequently if events or changes in circumstances indicate the carrying amount of the asset might be impaired. If such an indication exists, we estimate the recoverable amount of the asset and charge any impairment directly to the income statement.
The process of reviewing and calculating impairments of fixed assets necessarily involves certain assumptions. It requires the preparation of cash flow forecasts for a particular set of assets, known as "cash generating units." These forecasts are based on, among other things, our current expectations regarding future industry conditions, our own operational plans and assumptions about the future revenues and costs of the unit under review. Accordingly, there can be no certainty that the cash flow forecasts are correct. Current turmoil in many financial and industrial markets will make this type of analysis far more difficult to perform and therefore subject to a greater risk of error.
Further analysis was performed to assess whether the remaining goodwill, intangible assets and property, plant and equipment in our consolidated balance sheet were impaired as of
December 31, 2017
. It was concluded that based on the commercial information available and applying an average discount rate of
10.0%
across the group, the Luxfer Czech Republic CGU was deemed impaired. As a result, an impairment of $2.2 million was recognized with regards to the property, plant and equipment.
Post-employment benefits
We account for the pension costs relating to our retirement plans under IAS 19R "Employee Benefits." In applying IAS 19R, we have recognized actuarial gains and losses in full through reserves. In all cases, the pension costs are assessed in accordance with the advice of independent qualified actuaries, but require the exercise of significant judgment in relation to assumptions for future salary and pension increases, long-term price inflation and investment returns. The most sensitive assumption is the long-term discount rate used to discount the net retirement benefit obligation.
Deferred income taxes
Deferred income tax assets are recognized for unabsorbed tax losses and unutilized capital allowances to the extent that it is probable that taxable profit will be available against which the losses and capital allowances can be utilized. Judgment is required to determine the amount of deferred income tax assets that can be recognized, based upon the likely timing, level of future taxable profits and tax rates in various jurisdictions, together with future tax planning strategies.
Inventories obsolescence and inventories write down
Inventories are stated at the lower of cost and net realizable value and are reviewed on a regular basis. We will make allowance for excess or obsolete inventories and write down to net realizable value. This will be based primarily on committed sales prices and our estimates of expected and future product demand and related pricing.
40
Other significant accounting policies
Other significant accounting policies not involving the same levels of measurement uncertainties as those discussed above are nevertheless important to an understanding of our consolidated financial statements. Policies related to financial instruments, the characterization of operating and finance leases and consolidation policy require difficult judgments on complex matters that are often subject to multiple sources of authoritative guidance. Certain of these matters are among topics currently under re-examination by accounting bodies and regulators. The new IFRS 16 accounting standard on leases is likely to have a material impact on our accounting policies and on our balance sheet as a result of having to bring, currently off-balance sheet, operating leases onto the balance sheet, with a corresponding liability also recorded. With regards to other policies, whilst material change appears unlikely, we cannot predict outcomes with confidence.
Recent Accounting Pronouncements
See "Note 1—Accounting policies" to our consolidated financial statements for a description of other recent accounting pronouncements, including the respective dates of effectiveness and effects on our results of operations.
41
|
A.
|
Operating results.
|
Results of Operations for the Years Ended December 31,
2017
,
2016
and
2015
The table below summarizes our consolidated results of operations for the years ended December 31,
2017
,
2016
and
2015
, both in U.S. dollars and as a percentage of total revenue. For more detailed segment information, see "Note 2—Revenue and segmental analysis" to our consolidated financial statements included elsewhere in this Annual Report.
|
Year Ended December 31,
|
|||||||||||||||||||||||
|
2017
|
2016
|
2015
|
|||||||||||||||||||||
|
Amount
|
Percentage
of
Revenue
|
Amount
|
Percentage
of
Revenue
|
Amount
|
Percentage
of
Revenue
|
||||||||||||||||||
|
(in $ million)
|
(%)
|
(in $ million)
|
(%)
|
(in $ million)
|
(%)
|
||||||||||||||||||
|
Revenue
|
$
|
441.3
|
|
100.0
|
%
|
$
|
414.8
|
|
100.0
|
%
|
$
|
460.3
|
|
100.0
|
%
|
||||||||
|
Cost of sales
|
(332.7
|
)
|
(75.4
|
)%
|
(321.4
|
)
|
(77.5
|
)%
|
(356.3
|
)
|
(77.4
|
)%
|
|||||||||||
|
Gross profit
|
108.6
|
|
24.6
|
%
|
93.4
|
|
22.5
|
%
|
104.0
|
|
22.6
|
%
|
|||||||||||
|
Distribution costs
|
(9.3
|
)
|
(2.1
|
)%
|
(7.8
|
)
|
(1.9
|
)%
|
(7.9
|
)
|
(1.7
|
)%
|
|||||||||||
|
Administrative expenses
|
(58.9
|
)
|
(13.3
|
)%
|
(50.8
|
)
|
(12.2
|
)%
|
(52.6
|
)
|
(11.4
|
)%
|
|||||||||||
|
Share of results of joint ventures and associates
|
0.1
|
|
0.1
|
%
|
0.5
|
|
0.1
|
%
|
(1.2
|
)
|
(0.3
|
)%
|
|||||||||||
|
Trading profit
(1)
|
$
|
40.5
|
|
9.2
|
%
|
$
|
35.3
|
|
8.5
|
%
|
$
|
42.3
|
|
9.2
|
%
|
||||||||
|
Profit on sale of redundant site
(2)
|
0.4
|
|
0.1
|
%
|
2.1
|
|
0.5
|
%
|
—
|
|
—
|
|
|||||||||||
|
Changes to defined benefit pension plans
(2)
|
—
|
|
—
|
|
0.6
|
|
0.1
|
%
|
18.0
|
|
3.9
|
%
|
|||||||||||
|
Restructuring and other expense
(2)
|
(21.6
|
)
|
(4.9
|
)%
|
(2.2
|
)
|
(0.5
|
)%
|
(22.4
|
)
|
(4.9
|
)%
|
|||||||||||
|
Operating profit
|
$
|
19.3
|
|
4.4
|
%
|
$
|
35.8
|
|
8.6
|
%
|
$
|
37.9
|
|
8.2
|
%
|
||||||||
|
Other income / (expense):
|
|
|
|
|
|
|
|
|
|
|
|
|
|||||||||||
|
Net gain / (loss) on acquisitions and disposals
(2)
|
1.3
|
|
0.3
|
%
|
0.2
|
|
0.1
|
%
|
(2.0
|
)
|
(0.4
|
)%
|
|||||||||||
|
Finance income:
|
|
|
|
|
|
|
|
|
|
|
|
|
|||||||||||
|
Interest received
|
0.5
|
|
0.1
|
%
|
1.2
|
|
0.3
|
%
|
0.5
|
|
0.1
|
%
|
|||||||||||
|
Finance costs:
|
|
|
|
|
|
|
|
|
|
|
|
|
|||||||||||
|
Interest costs
|
(7.2
|
)
|
(1.6
|
)%
|
(6.8
|
)
|
(1.6
|
)%
|
(7.4
|
)
|
(1.6
|
)%
|
|||||||||||
|
IAS 19R retirement benefits finance charge
|
(1.8
|
)
|
(0.4
|
)%
|
(2.1
|
)
|
(0.5
|
)%
|
(3.0
|
)
|
(0.7
|
)%
|
|||||||||||
|
Unwind of discount on deferred contingent consideration from acquisitions
|
(0.2
|
)
|
0.1
|
%
|
(0.4
|
)
|
(0.1
|
)%
|
(0.4
|
)
|
(0.1
|
)%
|
|||||||||||
|
Total finance costs:
|
(9.2
|
)
|
(2.1
|
)%
|
(9.3
|
)
|
(2.2
|
)%
|
(10.8
|
)
|
(2.3
|
)%
|
|||||||||||
|
Profit on operations before taxation
|
$
|
11.9
|
|
2.7
|
%
|
$
|
27.9
|
|
6.7
|
%
|
$
|
25.6
|
|
5.6
|
%
|
||||||||
|
Tax expense
|
(0.4
|
)
|
(0.1
|
)%
|
(6.0
|
)
|
(1.4
|
)%
|
(9.5
|
)
|
(2.1
|
)%
|
|||||||||||
|
Net income for the year
|
$
|
11.5
|
|
2.6
|
%
|
$
|
21.9
|
|
5.3
|
%
|
$
|
16.1
|
|
3.5
|
%
|
||||||||
|
Non-GAAP measures:
|
|
|
|
|
|
|
|
|
|
|
|
|
|||||||||||
|
Adjusted EBITDA
(3)
|
$
|
61.8
|
|
14.0
|
%
|
$
|
55.3
|
|
13.3
|
%
|
$
|
62.2
|
|
13.5
|
%
|
||||||||
|
Adjusted net income for the year
(4)
|
$
|
27.6
|
|
6.3
|
%
|
$
|
24.7
|
|
6.0
|
%
|
$
|
29.5
|
|
6.4
|
%
|
||||||||
|
(1)
|
Trading profit is defined as operating profit before profit on sale of redundant site, changes to defined benefit pension plans and restructuring and other expense. For the purposes of our divisional segmental analysis, IFRS 8 requires the use of "segment profit" performance measures that is used by our chief operating decision maker. Trading profit is the "segment profit" measure used by our chief operating decision maker for divisional segmental analysis. See "Note 2—Revenue and segmental analysis" in our consolidated financial statements included elsewhere in this Annual Report.
|
|
(2)
|
For further information, see analysis of trading profit and operating profit variances, below.
|
|
(3)
|
Adjusted EBITDA is defined as net income for the period before income tax expense, finance income (which comprises interest received) and finance costs (which comprises interest costs, IAS 19R retirement benefits finance charge and the
|
42
unwind of the discount on deferred contingent consideration from acquisitions), net gain / (loss) on acquisitions and disposals, profit on sale of redundant site, changes to defined benefit pension plans, restructuring and other expense, other share based compensation charges, depreciation and amortization and loss on disposal of property, plant and equipment. See footnote (3) of Item 3.A. ("Selected financial data") of this Annual Report for a reconciliation to net income.
|
(4)
|
Adjusted net income is a non-GAAP financial measure and consists of net income for the period adjusted for the post-tax impact of non-trading items, including certain accounting charges relating to acquisitions and disposals of businesses (comprising net gain / (loss) on acquisitions and disposals, the unwind of the discount on deferred contingent consideration from acquisitions and the amortization on acquired intangibles), IAS 19R retirement benefits finance charge, profit on sale of redundant site, changes to defined benefit pension plans, restructuring and other expense and other share based compensation charges. See footnote (8) of Item 3.A. ("Selected financial data") of this Annual Report for a reconciliation to net income.
|
Year Ended
December 31, 2017
Compared to Year Ended
December 31, 2016
Revenue.
Our revenue from continuing operations was
$441.3 million
in
2017
, an increase of
$26.5 million
from
$414.8 million
million in
2016
. Compared to
2016
, revenue reflected a
$6.4 million
gain from more-favorable average exchange rates. Thus, underlying revenue, net of exchange rate effects,
increased
by
$20.1 million
.
Reasons for the revenue change are discussed in detail by division, but in general, there were higher sales of Luxfer Magtech products, as well as of our SoluMag
®
alloy in the Elektron Division, partially offset by reduced sales of composite AF and SCBA cylinders as well as a delay in Superform automotive tooling projects in the Gas Cylinders Division.
Analysis of revenue variances from 2016 to 2017 for continuing operations
|
Elektron
|
Gas Cylinders
|
Group
|
|||||||||||
|
(in $ million)
|
|||||||||||||
|
2016 revenue—as reported under IFRS
|
$
|
189.0
|
|
$
|
225.8
|
|
$
|
414.8
|
|
||||
|
FX impact
|
4.9
|
|
1.5
|
|
6.4
|
|
|||||||
|
2016 revenue—adjusted for FX
|
$
|
193.9
|
|
$
|
227.3
|
|
$
|
421.2
|
|
||||
|
Trading variances for underlying operations—2017 v 2016
|
27.2
|
|
(7.1
|
)
|
20.1
|
|
|||||||
|
2017 revenue—as reported under IFRS
|
$
|
221.1
|
|
$
|
220.2
|
|
$
|
441.3
|
|
||||
The above table shows the change in each division's revenue between
2017
and
2016
. It separates the impact of changes in average exchange rates on non-U.S. operations when translated into U.S. dollar consolidated results and any trading variances which have been noted. The following discussion provides an explanation of our changes in revenue by division.
Elektron Division
Elektron Division revenue in
2017
was
$221.1 million
compared to
$189.0 million
in
2016
. Exchange rate differences were
favorable
by
$4.9 million
and underlying revenue was
$27.2 million
, or
14.0%
,
higher
than
2016
.
Revenue was higher in the Division primarily due to increased sales for Flameless Ration Heaters (FRH), used in Meals, Ready-to-Eat
TM
, (MRE), which reflected increased disaster-relief shipments to hurricane affected areas in the United States and Caribbean during the second half of the year. Sales of our proprietary SoluMag
®
alloy continued to grow as we gained traction in the oil and gas market, reflecting success in broadening the product line. The military powders business has experienced moderate growth as the budgetary pressure on U.S. defense spending loosened and the business recovered from an outage suffered by a key customer in 2016. Graphic Arts and zirconium products have also benefited from year-on-year increases in revenue.
Gas Cylinders Division
Gas Cylinders Division revenue was lower at
$220.2 million
compared to
$225.8 million
in
2016
. Exchange rate differences were
favorable
by
$1.5 million
, and underlying revenue was
$7.1 million
, or
3.1%
,
lower
than
2016
.
Revenue was lower in the Division largely due to depressed sales of our AF cylinders following the loss of a major customer, and lower sales of SCBA cylinders, partially offset by an increase in European medical composite cylinders, as well as shipments of aluminum cylinders. Superform sales were also down in the year following unusually high tooling sales in 2016. Sales of formed parts remained relatively flat from 2016 as we continued to deliver our products pursuant to our existing contracts.
43
Luxfer Group
Cost of sales.
Our cost of sales was
$332.7 million
in
2017
,
an increase
of
$11.3 million
from
$321.4 million
in
2016
. Excluding an exchange rate gain of $1.6 million on cost of sales of non-U.S. operations, our cost of sales at constant exchange rates increased by $12.9 million, or 4.0%, from
2016
.
Gross profit.
Gross profit was
$108.6 million
in
2017
,
an increase
of
$15.2 million
from
$93.4 million
in
2016
resulting mainly due to increased sales, coupled with cost reductions. The gross margin percentage
increased
to
24.6%
, compared with
22.5%
in
2016
.
Distribution costs.
Distribution costs were
$9.3 million
in
2017
,
an increase
of
$1.5 million
from
$7.8 million
in
2016
. There was an exchange rate gain on distribution costs from non-U.S. operations of $0.1 million, and the underlying movement in distribution costs at constant exchange rates was an increase of $1.6 million, or 20.3%, reflecting increased levels of exports from the U.K. to the U.S., primarily as a result of the increased sales activity in 2017.
Administrative expenses.
Our administrative expenses were
$58.9 million
in
2017
,
an increase
of
$8.1 million
, from
$50.8 million
in
2016
. There was an exchange rate gain on administrative expenses from our non-U.S. operations of $0.4 million, at constant exchange rates, administrative expenses increased by $8.5 million, 16.9%, with the underlying increase due to increased employment costs and write off of bad debt.
Share of results of joint ventures and associates.
We have a number of joint venture operations and an associate, the most active being in the U.S. and India. The joint ventures have been accounted for using the equity method, as the partners have a contractual agreement that establishes joint control over the economic activities of the entities. In
2017
, a
profit
of
$0.1 million
was attributable to joint ventures and associates, compared to a
profit
of
$0.5 million
in
2016
. We also received interest income from the U.S. joint venture in
2017
and
2016
of $0.3 million, which under IFRS is recognized below operating profit.
Operating and trading profit.
Our operating profit was
$19.3 million
in
2017
,
a decrease
of
$16.5 million
, or
46.1%
, from
$35.8 million
in
2016
. Our trading profit was
$40.5 million
in
2017
,
an increase
of
$5.2 million
, or
14.7%
, from
$35.3 million
in
2016
.
Analysis of trading profit and operating profit variances from
2016
to
2017
for continuing operations
|
Elektron
Trading
Profit
|
Gas Cylinders Trading Profit
|
Group
Trading
Profit
|
Profit on sale of redundant site
|
Changes to Defined Benefit Pension Plans
|
Restructuring
and Other
Expense
|
Group
Operating
Profit
|
||||||||||||||||||||||||
|
2016—as reported under IFRS
|
$
|
23.9
|
|
$
|
11.4
|
|
$
|
35.3
|
|
$
|
2.1
|
|
$
|
0.6
|
|
$
|
(2.2
|
)
|
$
|
35.8
|
|
|||||||||
|
FX impact
|
3.1
|
|
1.2
|
|
3.1
|
|
4.3
|
|
(0.3
|
)
|
—
|
|
(0.1
|
)
|
3.9
|
|
||||||||||||||
|
2016—adjusted for FX
|
27.0
|
|
12.6
|
|
39.6
|
|
1.8
|
|
0.6
|
|
(2.3
|
)
|
39.7
|
|
||||||||||||||||
|
Trading variances for underlying operations—2016 v 2017
|
4.8
|
|
(3.9
|
)
|
0.9
|
|
(1.4
|
)
|
(0.6
|
)
|
(19.3
|
)
|
(20.4
|
)
|
||||||||||||||||
|
2017—as reported under IFRS
|
$
|
31.8
|
|
$
|
8.7
|
|
$
|
40.5
|
|
$
|
0.4
|
|
$
|
—
|
|
$
|
(21.6
|
)
|
$
|
19.3
|
|
|||||||||
The above table shows the change in each division's trading profit, the Group trading profit and the Group operating profit between
2016
and
2017
. The table also provides a reconciliation of the Group trading profit to the Group operating profit. The table separates the impact of changes in average exchange rates on non-U.S. operations when translated into U.S. dollar consolidated results.
Translating our non-U.S. operations into U.S. dollars resulted in an exchange rate gain of
$4.3 million
in trading profit and
$3.9 million
in operating profit in
2017
. At constant exchange rates, our trading profit
increased
by
$0.9 million
, or
2.3%
, and our operating profit
decreased
by
$20.4 million
, or
51.4%
, in
2017
.
Trading profit in the Elektron Division was
$31.8 million
in
2017
,
an increase
of
$7.9 million
, or
33.1%
, from
$23.9 million
in
2016
. Translating our non-U.S. operations into U.S. dollars resulted in an exchange rate gain of
$3.1 million
in the Elektron Division's trading profit in
2017
. Trading profit variances in the Elektron Division were
favorable
by
$4.8 million
, or
17.8
%, compared to
2016
.
Trading profit in the Gas Cylinders Division was
$8.7 million
in
2017
,
a decrease
of
$2.7 million
, or
23.7%
, from
$11.4 million
in
2016
. Translating our non-U.S. operations into U.S. dollars resulted in an exchange rate gain of
$1.2 million
in the Gas Cylinders Division's trading profit in
2017
. Gas Cylinders Division's trading variances were
unfavorable
by
$3.9 million
, or
31.0
%. These trading variances are explained by division in more detail below.
44
Operating profit was also impacted by several other non-trading items as follows:
|
•
|
In
2017
,
there was a release of a provision in relation to the sale in 2016 of the redundant site at Redditch, resulting in a credit of
$0.4 million
compared to a $2.1 million profit on the sale itself in 2016.
|
|
•
|
The restructuring and other expense charge increased from
$2.2 million
in 2016 to
$21.6 million
in
2017
. The charge in
2017
relates predominantly to the rationalization of our operations,
$12.1 million
and non-current asset impairments,
$3.7 million
. We also incurred charges in relation to a litigation claim against a competitor (
$3.5 million
) and professional fees in connection to converting our ADR listing to a direct listing (
$2.3 million
).
|
The segment trading profit results by division are explained in more detail below:
Elektron Division
The increase in the Elektron Division's trading profit can be attributed, partially, to the increased sales in the Division, in particular, sales of FRHs relating to disaster-relief shipments, as explained above.
There was a positive variance of $11.2 million from 2016 due to changes in sales volumes and mix across the division, coupled with a $4.6 million reduction in raw material and utility costs. These were partially offset by a $4.8 million adverse variance from price changes and $6.2 million adverse variance in depreciation, employment and other fixed costs included within cost of sales and administrative expenses.
Gas Cylinders Division
Sales of AF cylinders decreased significantly in the year, following the loss of a major customer, compared to 2016, and Superform tooling revenue was also down compared to 2016 when we recognized unusually high tooling revenue. Volume and sales mix variances had a total negative impact of $0.6 million compared to 2016 and depreciation, employment and other fixed costs expenses increased by $3.2 million which included a one-time bad debt expense in relation to one of our overseas customers. These were partially offset by pricing increases, resulting in a $0.3 million favorable effect on trading profit.
Further adverse variances arose for $0.4 million as a result of production inefficiencies noted within our Superform division.
Luxfer Group
Profit on sale of redundant site.
In 2017, a credit of $0.4 million was recognized in relation to a provision that was no longer required. The provision was held pending completion of remediation works at the former Redditch site, which was sold during 2016 to a company that specializes in remediating contaminated land. Given the remediation works were completed at the end of March 2017, it was appropriate to release the provision.
In 2016, a profit of $2.1 million was recognized in relation to the sale of the redundant Redditch site.
Restructuring and other income / (expense).
In 2017,
$21.6 million
was charged to restructuring and other expense.
$12.1 million
of the charge related to rationalization of operations, of which
$6.6 million of costs were incurred in relation to rationalization costs in the Gas Cylinders Division and $5.5 million in the Elektron Division. $2.2 million of the charge in the Gas Cylinders Division was in relation to an impairment of the investment in our associate, Sub 161 Pty Limited, $2.1 million was incurred following the decision to discontinue our Advanced Oxygen System (AOS) product line and $1.0 million following the announcement to exit our Luxfer HEI business. These were offset in part by a $0.4 million credit relating to sales of inventory that was previously written down as part of the closure of our German operation in 2015. In the Elektron Division, $1.7 million of the charge related to the rationalization of its Magtech operations, which includes $1.3 million in relation to the write down of land and buildings. Separately, we have recorded $0.6 million related to an onerous communications contract. There has also been a Group-wide effort to reduce headcount and streamline management that has resulted in a $1.5 million and $3.0 million charge within the Gas Cylinders and Elektron Divisions respectively. Other rationalization costs of $0.4 million has been incurred, split evenly between the two Divisions.
In addition to rationalization costs, we incurred
$3.5 million
of costs related to patent infringement litigation against a competitor. There was a charge of
$3.7 million
in relation to non-current asset write offs in the Elektron Division as well as
$2.3 million
of costs in relation to professional fees incurred in connection with converting our ADR listing to a direct listing of our ordinary shares, not allocated to a division.
In 2016, $2.2 million was charged to restructuring and other expense. We incurred rationalization costs of $0.4 million in the Elektron Division, in addition to $0.6 million of costs related to patent infringement litigation against a competitor. There was also a charge of $1.2 million in respect of a receivable impairment provision recognized in relation to an aerospace customer entering Chapter 11 protection.
Net gain / (loss) on acquisitions and disposals.
In 2017, we incurred a non-operating credit of $1.0 million related to the remeasurement of deferred contingent consideration arising from acquisitions, more specifically the acquisition of Luxfer Magtech in the Elektron Division, where an element of the deferred contingent
45
consideration was no longer payable due to the acquired business failing to achieve a profit trigger as of December 31, 2017.
Furthermore, in 2017 we acquired the trade and assets of the Specialty Metals business of ESM Group Inc. On closing, an initial consideration of $4.3 million was paid including an amount placed in general escrow of $0.3 million as deferred consideration. The fair value of net assets acquired was been assessed as $5.8 million, resulting in a gain on bargain purchase balance of $1.2 million that was recognized as an non-operating credit.
There was also a $0.9 million of merger and acquisition costs in connection to the above acquisition. We incurred $0.5 million in acquisition-related expenses and a provision of $0.4 million was set up for the disbursement of environmental liabilities.
In 2016, the $0.5 million non-operating credit in relation to the remeasurement of deferred contingent consideration in relation to the acquisition of Luxfer Magtech was offset by a $0.3 million charge in relation to aborted acquisition costs.
Finance income—interest receivable.
Interest receivable was
$0.5 million
in
2017
,
down
from
$1.2 million
in
2016
. Interest received in
2017
included $0.3 million in respect of funding provided to our U.S. joint venture Luxfer-GTM Technologies (2016: $0.3 million) and $0.2 million generated by placing surplus cash on short-term deposit (2016: $0.2 million). There was also a $0.7 million exchange gain on the loan to Luxfer-GTM Technologies in 2016.
Finance costs—interest costs.
We incurred
$7.2 million
of finance costs in
2017
,
up
from
$6.8 million
in
2016
as a result of increased foreign exchange losses on financing activities. The finance costs we incurred in
2017
included $6.3 million (2016: $6.3 million) of interest payable on our current financing facilities, $0.6 million (2016: $0.5 million) of amortization relating to finance costs and $0.3 million (2016: $nil) of foreign exchange losses on the loan to Luxfer-GTM technologies.
Finance costs—IAS 19R retirement benefits finance charge.
The charge under IAS 19R in relation to our retirement benefit deficits was
$1.8 million
in
2017
,
a decrease
from
$2.1 million
in
2016
, as a result of the deficit being lower for the majority of
2017
than it was for
2016
and lower discount rates in the year.
Finance costs—unwind of discount on deferred contingent consideration from acquisitions.
In
2017
, there was a $0.2 million charge in relation to the unwind of discount on the deferred contingent consideration that arose from the acquisition of Luxfer Magtech in 2014 ($0.4 million in 2016).
Taxation.
In
2017
, our tax expense was
$0.4 million
on profit before tax of
$11.9 million
. The statutory effective tax rate was
3.4%
on the profit before tax. Of the charge of
$0.4 million
,
$5.2 million
related to current tax payable and a credit of
$4.8 million
was related to deferred income tax. In
2016
, our tax expense was
$6.0 million
on profit before tax of
$27.9 million
. The statutory effective tax rate was
21.5%
on the profit before tax. Of the charge of
$6.0 million
,
$3.7 million
related to current tax payable and
$2.3 million
was a deferred income tax charge. In recent years our statutory effective tax rate has been affected by various non-trading items, the largest of which was a $6.0 million credit related to the re-measurement of the deferred tax position as a result of U.S. tax reform.
in 2017 related to the decrease in the deferred tax asset of $6.0 million as a result of U.S. tax reform.
Net income for the financial year.
Net income for the year
decreased
to
$11.5 million
from
$21.9 million
in
2016
. The
$10.4 million
decrease
can be attributed to an increase in restructuring and other expenses and a lower credit in relation to the previous sale of a redundant site. These were offset by the increased trading profit for the year, for reasons described above.
Year Ended December 31, 2016 Compared to Year Ended December 31, 2015
Revenue.
Our revenue from continuing operations was $414.8 million in 2016, a decrease of $45.5 million from $460.3 million in 2015. Compared to 2015, revenue reflected a $13.4 million loss from less-favorable average translation exchange rates. Thus, underlying revenue, net of exchange rate translation, fell by $32.1 million. Reasons for the revenue change are discussed in detail by division, but in general, there were lower sales of our automotive materials for catalysis and magnesium recycling services, along with lower sales of U.S. defense-related magnesium products following cuts to U.S. defense spending. Whilst medical cylinder demand was depressed we did achieve higher sales in the AF market, which is still subdued by the low oil price and following on from the launch of our SoluMag® alloy in 2015, sales of that have continued to improve throughout 2016.
46
Analysis of revenue variances from 2015 to 2016 for continuing operations
|
Elektron
|
Gas Cylinders
|
Group
|
|||||||||||
|
(in $ million)
|
|||||||||||||
|
2015 revenue—as reported under IFRS
|
$
|
221.2
|
|
$
|
239.1
|
|
$
|
460.3
|
|
||||
|
FX translation impact—on non-U.S. operating results
|
(6.5
|
)
|
(6.9
|
)
|
(13.4
|
)
|
|||||||
|
2015 revenue—adjusted for FX translation
|
$
|
214.7
|
|
$
|
232.2
|
|
$
|
446.9
|
|
||||
|
Trading variances for underlying operations—2016 v 2015
|
(25.7
|
)
|
(6.4
|
)
|
(32.1
|
)
|
|||||||
|
2016 revenue—as reported under IFRS
|
$
|
189.0
|
|
$
|
225.8
|
|
$
|
414.8
|
|
||||
The above table shows the change in each division's revenue between 2016 and 2015. It separates the impact of changes in average exchange rates on non-U.S. operations when translated into U.S. dollar consolidated results and any trading variances which have been noted. The following discussion provides an explanation of our changes in revenue by division.
Elektron Division
Elektron Division revenue in 2016 was $189.0 million compared to $221.2 million in 2015. Exchange rate translation differences were adverse by $6.5 million, and underlying revenue was $25.7 million, or 12.0%, lower than 2015.
Revenue was lower in the Division primarily due to reduced sales of automotive catalysis materials, currently in transition to a new generation of technology, and a reduction in lower-margin magnesium recycling services. In the second half of the year, sales of U.S. defense-related magnesium products were depressed reflecting budgetary pressure on U.S. defense spending. Revenue, however, from European high-performance aerospace alloys and industrial catalysis chemical products increased, as did sales of our new SoluMag® alloy. Photo-engraving revenue was impacted by de-stocking at distributors in the latter part of the year, as we made a transition to selling direct to certain customers instead of through distributors. This action will enable us to better support major customers and take cost out of the supply chain.
Gas Cylinders Division
Gas Cylinders Division revenue was lower at $225.8 million compared to $239.1 million in 2015. Exchange rate translation differences were adverse by $6.9 million, and underlying revenue was $6.4 million, or 2.8% lower than 2015.
Revenue was lower in the Division largely due to depressed medical cylinder demand, in part due to our customers reassigning stocks of cylinders between regions rather than buying new cylinders. On a positive note, the AF business continued to perform well with year-on-year growth and sales of industrial cylinders were also up.
Superform sales were down slightly on 2015 due to lower forming sales as existing contracts expire, but tooling sales on new long-term contracts have increased as a result of the new business won with Ferrari and other prestige car manufacturers.
Luxfer Group
Cost of sales.
Our cost of sales was $321.4 million in 2016, a decrease of $34.9 million from $356.3 million in 2015. Excluding an exchange rate translation gain of $10.3 million on cost of sales of non-U.S. operations, our cost of sales at constant translation exchange rates decreased by $24.6 million, or 7.1%, from 2015.
Gross profit.
Gross profit was $93.4 million in 2016, a decrease of $10.6 million from $104.0 million in 2015 resulting mainly due to weaker exchange rates (as compared to the dollar, our presentation currency), coupled with decreased sales. The gross margin percentage fell marginally to 22.5%, compared with 22.6% in 2015.
Distribution costs.
Distribution costs were $7.8 million in 2016, a decrease of $0.1 million from $7.9 million in 2015. There was an exchange rate translation gain on distribution costs from non-U.S. operations of $0.5 million, and the underlying movement in distribution costs at constant translation exchange rates was an increase of $0.4 million, or 5.4%, reflecting increased levels of exports from the U.K. to the U.S., which more than offset the lower sales activity in 2016.
Administrative expenses.
Our administrative expenses were $50.8 million in 2016, a decrease of $1.8 million, or 3.4%, from $52.6 million in 2015. There was an exchange rate translation gain on administrative
47
expenses from our non-U.S. operations of $2.1 million, with a small underlying increase due to rising underlying costs.
Share of results of joint ventures and associates.
We have a number of joint venture operations and an associate, the most active being in India and the U.S. The joint ventures have been accounted for using the equity method, as the partners have a contractual agreement that establishes joint control over the economic activities of the entities. In 2016, a profit of $0.5 million was attributable to joint ventures and associates, compared to a loss of $1.2 million in 2015. We also received interest income from the U.S. joint venture in 2016 and 2015 of $0.3 million, which under IFRS would be recognized below operating profit. When calculating net profits after tax for the joint venture, this would also need to be included.
Operating and trading profit.
Our operating profit was $35.8 million in 2016, a decrease of $2.1 million, or 5.5%, from $37.9 million in 2015. Our trading profit was $35.3 million in 2016, a decrease of $7.0 million, or 16.5%, from $42.3 million in 2015.
Analysis of trading profit and operating profit variances from 2015 to 2016 for continuing operations
|
Elektron Trading Profit
|
Gas Cylinders Trading Profit
|
Group Trading Profit
|
Profit on sale of redundant site
|
Changes to Defined Benefit Pension Plans
|
Restructuring and Other Expense
|
Group Operating Profit
|
|||||||||||||||||||||||
|
2015—as reported under IFRS
|
$
|
33.7
|
|
$
|
8.6
|
|
$
|
42.3
|
|
$
|
—
|
|
$
|
18.0
|
|
$
|
(22.4
|
)
|
$
|
37.9
|
|
||||||||
|
FX translation impact—on non-U.S. operating results
|
(0.7
|
)
|
0.2
|
|
(0.5
|
)
|
—
|
|
(2.9
|
)
|
1.2
|
|
(2.2
|
)
|
|||||||||||||||
|
2015—adjusted for FX translation
|
33.0
|
|
8.8
|
|
41.8
|
|
—
|
|
15.1
|
|
(21.2
|
)
|
35.7
|
|
|||||||||||||||
|
Trading variances for underlying operations—2015 v 2016
|
(9.1
|
)
|
2.6
|
|
(6.5
|
)
|
2.1
|
|
(14.5
|
)
|
19.0
|
|
0.1
|
|
|||||||||||||||
|
2016—as reported under IFRS
|
$
|
23.9
|
|
$
|
11.4
|
|
$
|
35.3
|
|
$
|
2.1
|
|
$
|
0.6
|
|
$
|
(2.2
|
)
|
$
|
35.8
|
|
||||||||
The above table shows the change in each division's trading profit, the Group trading profit and the Group operating profit between 2015 and 2016. The table also provides a reconciliation of the Group trading profit to the Group operating profit. The table separates the impact of changes in average exchange rates on non-U.S. operations when translated into U.S. dollar consolidated results.
Translating our non-U.S. operations into U.S. dollars resulted in an exchange rate translation loss of $0.5 million in our trading profit and $2.2 million loss in operating profit in 2016. The results were also negatively impacted by less favorable transaction exchange rates, which reduced trading and operating profit by $0.3 million. At constant exchange rates, our trading profit decreased by $6.2 million, or 14.9%, and our operating profit increased by $0.4 million, or 1.1%, in 2016.
Trading profit in the Elektron Division was $23.9 million in 2016, a decrease of $9.8 million, or 29.1%, from $33.7 million in 2015. Translating our non-U.S. operations into U.S. dollars resulted in an exchange rate translation loss of $0.7 million in the Elektron Division's trading profit in 2016. Trading profit variances in the Elektron Division were adverse by $9.1 million, or 27.6%, compared to 2015. Trading profit in the Gas Cylinders Division was $11.4 million in 2016, an increase of $2.8 million, or 32.6%, from $8.6 million in 2015. Translating our non-U.S. operations into U.S. dollars resulted in an exchange rate translation gain of $0.2 million in the Gas Cylinders Division's trading profit in 2016. Gas Cylinders Division's trading variances were favorable by $2.6 million, or 29.5%. These trading variances are explained by division in more detail below. The fall in sales volumes and changes in the mix of sales, reduced trading profit by $13.4 million in the year.
In addition to the exchange rate and sales variances, we had a number of cost changes that together increased trading profit by a net $7.2 million in 2016. The main reasons for these changes were as follows:
|
•
|
Other trading variances net of price changes benefited the Group by $5.7 million.
|
|
•
|
Employment and other costs decreased by $1.5 million in 2016, driven by initiatives across the Group to reduce fixed costs.
|
|
•
|
Operating profit was also impacted by several other non-trading items as follows:
|
|
•
|
In 2016, the redundant site at Redditch was sold to a company that specializes in remediating contaminated land, realizing a profit of $2.1million.
|
|
•
|
During 2016, a net credit of $0.6million was recognized following the sale of $10.0 million of U.S. deferred pensioner liabilities to an insurer, and lump sum payments of $4.9 million offered to certain U.S. deferred pensioners.
|
48
|
•
|
The restructuring and other expense charge decreased from $22.4 million in 2015 to $2.2 million in 2016. The charge in 2015 was higher primarily due to restructuring activity in the Gas Cylinders Division implemented to eliminate trading losses caused by the downturn in the CNG-AF market following the oil price collapse in 2015.
|
The segment trading profit results by division are explained in more detail below:
Elektron Division
Elektron Division trading profit of $23.9 million in 2016 was a decrease of $9.8 million from $33.7 million in 2015. Changes in exchange rates used to translate divisional trading profit into U.S. dollars led to a $0.7 million translation loss in 2016. Favorable transaction rates increased profits by $1.8 million, and trading profit at constant translation exchange rates therefore decreased by $10.9 million, or 31.3%.
The reduction in trading profit for the Elektron Division was primarily due to the challenges faced in the magnesium business highlighted above. However, zirconium has held up well during the transition in autocatalysis technologies, with trading profit being flat compared to the prior year, helped by the progress in chemical catalysis.
There was an adverse variance of $11.0 million from 2015 due to changes in sales volumes and mix across the division and other trading variances net of price changes were adverse by $0.4 million as a result of reduced selling prices on our zirconium products, net of reduced raw material costs. Employment and other costs decreased by a net $0.5 million, driven by cost-saving activities initiated in 2016.
Gas Cylinders Division
Gas Cylinders Division trading profit of $11.4 million in 2016 was an increase of $2.8 million from $8.6 million in 2015. Changes in exchange rates used to translate divisional trading profit into U.S. dollars led to a $0.2 million translation gain in 2016. Less-favorable transaction rates reduced profits by $2.1 million. Trading profit at constant exchange rates therefore increased by $4.7 million or 70.1%.
Sales of aluminum cylinders fell across all markets, other than industrial, while composite cylinder unit sales increased. Volume and sales mix variances had a total negative impact of $2.4 million compared to 2015, although material costs and sales prices offset this, being favorable by $6.1 million.
Savings of $1.0 million in employment and other costs were achieved in 2016 through a reduction of administrative headcount and various efficiency improvement projects.
Luxfer Group
Profit on sale of redundant site.
In 2016, a profit of $2.1 million has been recognized in relation to the sale of the redundant Redditch site to a company that specializes in remediating contaminated land.
Changes to defined benefit pension plans.
During 2016, we recognized a settlement credit of $0.6 million in respect of the U.S. defined benefit pension plan, see above for further details.
In 2015, due to the closure of the U.K. defined benefit pension plan to future accrual, and a move to CPI from RPI, for the purpose of increasing pensions in payment, we recognized a credit to the income statement of $18.0 million. This credit consisted of a non-cash curtailment gain of $3.3 million in respect of the closure of the plan to future accrual and a non-cash past service gain of $14.9 million in respect of the change in expected future pension increases in payment, offset by advisory costs of $0.2 million.
Restructuring and other income / (expense).
In 2016, $2.2 million was charged to restructuring and other expense (2015: $22.4 million). We incurred rationalization costs of $0.4 million in the Elektron Division, in addition to $0.6 million of costs related to patent infringement litigation against a competitor. There was also a charge of $1.2 million in respect of a receivable impairment provision recognized in relation to an aerospace customer entering Chapter 11 protection.
In 2015, we incurred rationalization costs of $21.8 million in the Gas Cylinders Division as we continued to restructure the division following the downturn in the AF market. In addition, we incurred $0.5 million of costs in the Elektron Division related to patent infringement litigation against a competitor. There was also a charge of $0.1 million to the income statement under IFRS 2 related to share options granted as part of the I.P.O.
Net gain / (loss) on acquisitions and disposals.
In 2016, we incurred a non-operating credit of $0.2 million compared to a $2.0 million charge in 2015. There was a $0.5 million credit related to the remeasurement of deferred contingent consideration arising from acquisitions, more specifically the acquisition of Luxfer Magtech in the Elektron Division, where an element of the deferred contingent consideration was no longer payable due to
49
the acquired business failing to achieve a profit trigger as of December 31, 2016, offset by a $0.3 million charge in relation to aborted acquisition costs.
Of the charge in 2015, $1.8 million related to two approaches to acquire the company. Neither of these approaches resulted in an executable offer that could be put to shareholders. The balance of $0.2 million was incurred in connection with our investment in Sub161 Pty Limited. In 2014, we incurred $1.5 million of costs for the acquisition of Luxfer Magtech (attributable to the Elektron Division) and $0.3 million for the acquisition of Luxfer Utah (attributable to the Gas Cylinders Division). In 2014, a credit of $6.3 million was recognized in the income statement in relation to the remeasurement of deferred contingent consideration arising from acquisitions. Of the $6.3 million, $4.8 million related to the Elektron Division and $1.5 million related to the Gas Cylinders Division.
Finance income—interest received.
Interest received was $1.2 million in 2016, up from $0.5 million in 2015. Interest received in 2016 included $0.3 million in respect of funding provided to our U.S. joint venture Luxfer-GTM Technologies (equal to $0.3 million in 2015) and $0.2 million generated by placing surplus cash on short-term deposit (equal to $0.2 million in 2015). There was also a $0.7 million exchange gain on the loan to Luxfer-GTM Technologies.
Finance costs—interest costs.
We incurred $6.8 million of interest costs in 2016, down from $7.4 million in 2015. Costs were lower as a result of the refinancing exercise during the year. The finance costs we incurred in 2016 included $6.3 million of interest payable on our current financing facilities and $0.5 million of amortization relating to finance costs.
The finance costs we incurred in 2015 included $6.5 million of interest payable on our current financing facilities and $0.9 million of amortization relating to finance costs.
Finance costs—IAS 19R retirement benefits finance charge.
The charge under IAS 19R in relation to our retirement benefit deficits was $2.1 million in 2016, a decrease from $3.0 million in 2015, as a result of the deficit being lower for the majority of 2016 than it was for 2015.
Finance costs—unwind of discount on deferred contingent consideration from acquisitions.
In 2016, there was a $0.4 million charge in relation to the unwind of discount on the deferred contingent consideration that arose from the acquisitions of Luxfer Utah and Luxfer Magtech in 2014, ($0.4 million in 2015).
Taxation.
In 2016, our tax expense was $6.0 million on profit before tax of $27.9 million. The statutory effective tax rate was 21.5% on the profit before tax. Of the charge of $6.0 million, $3.7 million (13.3% effective rate) related to current tax payable and $2.3 million (8.2% effective rate) was a deferred income tax charge. In 2015, our tax expense was $9.5 million on profit before tax of $25.6 million. The statutory
effective tax rate was 37.1% on the profit before tax. Of the charge of $9.5 million, $6.1 million (23.8% effective rate) related to current tax payable and $3.4 million (13.3% effective rate) was a deferred income tax charge. In recent years our statutory effective tax rate has been affected by various non-trading items. The statutory effective tax rate for 2016 decreased to 21.5%. The 2015 effective tax rate was affected as nearly all of the $21.8 million of restructuring costs in the Gas Cylinder Division did not lead to a tax credit due to losses in AF operations. The effective rate excluding the effect of these losses in 2015 was 22.6%.
Net income for the financial year.
Net income for the year increased to $21.9 million from $16.1 million in 2015. The $5.8 million increase can be attributed to lower restructuring and other expenses, offset by a lower credit for changes to defined benefit pension plans, and net finance costs which are $2.2 million lower. This was offset by a reduction in trading profit for the year, for the reasons described above.
B. Liquidity and capital resources.
Liquidity
Our liquidity requirements arise primarily from obligations under our indebtedness, capital expenditures, acquisitions, the funding of working capital and the funding of hedging facilities to manage foreign exchange and commodity purchase price risks. We meet these requirements primarily through cash flows from operating activities, cash deposits and borrowings under the Revolving Credit Facility and accompanying ancillary hedging facilities and the Loan Notes due 2018, 2021, 2023 and 2026. Our principal liquidity needs are:
|
•
|
funding acquisitions, including deferred contingent consideration payments;
|
|
•
|
capital expenditure requirements;
|
|
•
|
payment of shareholder dividends;
|
|
•
|
servicing interest on the Loan Notes, which is payable at each quarter end, in addition to interest and / or commitment fees on the Senior Facilities Agreement (as defined below);
|
50
|
•
|
working capital requirements, particularly in the short term as we aim to achieve organic sales growth;
|
|
•
|
hedging facilities used to manage our foreign exchange and aluminum purchase price risks.
|
From time to time, we consider acquisitions or investments in other businesses that we believe would be appropriate additions to our business. For example, in 2017, we acquired the trade and assets of the Specialty Metals business of ESM Group Inc., including a manufacturing facility in Saxonburg, PA.
We believe that, in the long term, cash generated from our operations will be adequate to meet our anticipated requirements for working capital, capital expenditures and interest payments on our indebtedness. In the short term, we believe we have sufficient credit facilities to cover any variation in our cash flow generation. However, any major repayments of indebtedness will be dependent on our ability to raise alternative financing or to realize substantial returns from operational sales. Also, our ability to expand operations through sales development and capital expenditures could be constrained by the availability of liquidity, which, in turn, could impact the profitability of our operations.
We have been in compliance with the covenants under the Loan Notes and the Senior Facilities Agreement throughout all of the quarterly measurement dates from and including September 30, 2011, to
December 31, 2017
.
Luxfer Holdings PLC conducts all of its operations through its subsidiaries, joint ventures and associate. Accordingly, Luxfer Holdings PLC's main cash source is dividends from its subsidiaries. The ability of each subsidiary to make distributions depends on the funds that a subsidiary receives from its operations in excess of the funds necessary for its operations, obligations or other business plans. We have not historically experienced any material impediment to these distributions, and we do not expect any local legal or regulatory regimes to have any impact on our ability to meet our liquidity requirements in the future. In addition, since our subsidiaries are wholly-owned, our claims will generally rank junior to all other obligations of the subsidiaries. If our operating subsidiaries are unable to make distributions, our growth may slow, unless we are able to obtain additional debt or equity financing. In the event of a subsidiary's liquidation, there may not be assets sufficient for us to recoup our investment in the subsidiary.
Our ability to maintain or increase the generation of cash from our operations in the future will depend significantly on the competitiveness of and demand for our products, including our success in launching new products that we have been developing over many years. Achieving such success is a key objective of our business strategy. Due to commercial, competitive and external economic factors, however, we cannot guarantee that we will generate sufficient cash flows from operations or that future working capital will be available in an amount sufficient to enable us to service our indebtedness or make necessary capital expenditures.
We are still vulnerable to external shocks relating to our fixed and variable cost of goods sold. In recent years, external economic shocks to oil prices, commodity prices and currency fluctuations have impacted our results. In
2017
, our continuing operations incurred over $13 million of energy costs, purchased over $31 million of primary aluminum and over $30 million of primary magnesium. In
2017
,
$27.7 million
of our operating profit was derived from North American businesses. A significant economic shock that has a major impact on one or more of these areas simultaneously could have a severe impact on our financial position.
We operate robust cash and trading forecasting systems that impose tight controls on our operating businesses with regard to cash management. We use regularly updated forecasts to plan liquidity requirements, including the payment of interest on our indebtedness, capital expenditures and payments to our suppliers. Although we have generated cash sufficient to cover most of our liability payments, we also rely on the Revolving Credit Facility to provide sufficient liquidity. Our banking facilities are further explained below under "—Financing—Senior Facilities Agreement."
51
Cash Flow
The following table presents information regarding our cash flows, cash and cash equivalents for the years ended
December 31, 2017
,
2016
and
2015
:
|
Year Ended December 31,
|
|||||||||||||
|
2017
|
2016
|
2015
|
|||||||||||
|
(in $ million)
|
|||||||||||||
|
Net cash flows from operating activities
|
$
|
45.2
|
|
$
|
29.2
|
|
$
|
52.8
|
|
||||
|
Net cash used in investing activities
|
(18.1
|
)
|
(15.1
|
)
|
(21.2
|
)
|
|||||||
|
Net cash flows before financing activities
|
27.1
|
|
14.1
|
|
31.6
|
|
|||||||
|
Net cash flows from financing activities
|
(33.6
|
)
|
(35.5
|
)
|
(9.2
|
)
|
|||||||
|
Net (decrease) / increase in cash and cash equivalents
|
(6.5
|
)
|
(21.4
|
)
|
22.4
|
|
|||||||
|
Net foreign exchange differences
|
2.0
|
|
(1.9
|
)
|
(0.1
|
)
|
|||||||
|
Net movement in cash and cash equivalents
|
$
|
(4.5
|
)
|
$
|
(23.3
|
)
|
$
|
22.3
|
|
||||
Cash flows from operating activities
|
Year Ended December 31,
|
|||||||||||||
|
2017
|
2016
|
2015
|
|||||||||||
|
(in $ million)
|
|||||||||||||
|
CASH FLOWS FROM OPERATING ACTIVITIES
|
|||||||||||||
|
Net income for the year
|
$
|
11.5
|
|
$
|
21.9
|
|
$
|
16.1
|
|
||||
|
Adjustments to reconcile net income for the year to net cash flows from continuing operating activities:
|
|||||||||||||
|
Income tax expense
|
0.4
|
|
6.0
|
|
9.5
|
|
|||||||
|
Depreciation and amortization
|
19.0
|
|
18.4
|
|
18.6
|
|
|||||||
|
Loss on disposal of property, plant and equipment
|
0.1
|
|
0.2
|
|
—
|
|
|||||||
|
Profit on sale of redundant site
|
(0.4
|
)
|
(2.1
|
)
|
—
|
|
|||||||
|
Share based compensation charges net of cash settlement
|
1.7
|
|
1.1
|
|
1.3
|
|
|||||||
|
Net interest costs
|
6.7
|
|
5.6
|
|
6.9
|
|
|||||||
|
Non-cash restructuring charges
|
|||||||||||||
|
Property, plant and equipment impairment
|
5.0
|
|
—
|
|
1.7
|
|
|||||||
|
Intangibles assets impairment
|
2.0
|
|
—
|
|
3.7
|
|
|||||||
|
Investment impairment
|
2.2
|
|
—
|
|
4.6
|
|
|||||||
|
Other non-cash restructuring charges
|
1.8
|
|
—
|
|
7.7
|
|
|||||||
|
Curtailment and past service credits on retirement benefits obligations
|
—
|
|
(0.6
|
)
|
(18.2
|
)
|
|||||||
|
IAS 19R retirement benefits finance charge
|
1.8
|
|
2.1
|
|
3.0
|
|
|||||||
|
Acquisitions and disposals.
|
(1.3
|
)
|
(0.2
|
)
|
2.0
|
|
|||||||
|
Unwind of discount on deferred contingent consideration from acquisitions
|
0.2
|
|
0.4
|
|
0.4
|
|
|||||||
|
Share of results of joint ventures and associates
|
(0.1
|
)
|
(0.5
|
)
|
1.2
|
|
|||||||
|
Changes in operating assets and liabilities:
|
|||||||||||||
|
Sale / (purchase) of assets classified as held for sale
|
—
|
|
—
|
|
1.2
|
|
|||||||
|
(Increase) / decrease in receivables
|
(9.1
|
)
|
(1.8
|
)
|
5.0
|
|
|||||||
|
Decrease in inventories
|
5.0
|
|
4.5
|
|
3.0
|
|
|||||||
|
Increase / (decrease) in payables
|
9.7
|
|
(10.3
|
)
|
(0.9
|
)
|
|||||||
|
Movement in retirement benefits obligations
|
(8.0
|
)
|
(6.3
|
)
|
(8.6
|
)
|
|||||||
|
Movement in provisions
|
1.1
|
|
(2.6
|
)
|
0.3
|
|
|||||||
|
Acquisition approach costs paid
|
—
|
|
(1.2
|
)
|
(0.6
|
)
|
|||||||
|
Income taxes paid
|
(4.1
|
)
|
(5.4
|
)
|
(5.1
|
)
|
|||||||
|
$
|
45.2
|
|
$
|
29.2
|
|
$
|
52.8
|
|
|||||
In
2017
, net cash flows from operating activities
increased
by
$16.0 million
to
$45.2 million
from
$29.2 million
in
2016
. Net income in
2017
of
$11.5 million
decreased
by
$10.4 million
from
$21.9 million
in
2016
. There was a
52
net working capital (defined as, net movement in current receivables, current payables and inventories)
inflow
of
$5.6 million
in
2017
compared to an
outflow
of
$7.6 million
in
2016
,
a favorable
variance of
$13.2 million
. The decrease in inventories resulted in a cash inflow of
$5.0 million
in
2017
, a
$0.5 million
increase
from a cash inflow of
$4.5 million
in
2016
. There was an outflow in receivables of
$9.1 million
in
2017
compared to an outflow of
$1.8 million
in
2016
, an
unfavorable
movement of
$7.3 million
. The average days taken to collect debt increased slightly in
2017
to 53 days, compared to 49 days in
2016
. There was also an inflow in payables of
$9.7 million
in
2017
, a
favorable
movement of
$20.0 million
from the
$10.3 million
outflow in
2016
. Net interest costs of
$6.7 million
in
2017
were
$1.1 million
higher
than the
$5.6 million
in
2016
, primarily as a result of a $0.3 million foreign exchange loss on financing activities in 2017 compared to a $0.7 million gain in 2016. There was an inflow in relation to movement in provisions of
$1.1 million
in
2017
compared to an outflow of
$2.6 million
in
2016
, a
favorable
variance of
$3.7 million
. The non-cash restructuring charges of $10.4 million include impairments of property, plant and equipment, intangibles assets and investments, amongst other non-cash charges.
In 2016, net cash flows from operating activities decreased by $23.6 million to $29.2 million from $52.8 million in 2015. Net income in 2016 of $21.9 million increased by $5.8 million from $16.1 million in 2015. There was a net working capital (as defined as, net movement in current receivables, current payables and inventories) outflow of $7.6 million in 2016 compared to an inflow of $7.1 million in 2015, an unfavorable variance of $14.7 million. The decrease in inventories resulted in a cash inflow of $4.5 million in 2016, a $1.5 million increase from a cash inflow of $3.0 million in 2015. There was an outflow in receivables of $1.8 million in 2016 compared to an inflow of $5.0 million in 2015, an unfavorable movement of $6.8 million. The average days taken to collect debt increased slightly in 2016 to 49 days, compared to 46 days in 2015. There was also an outflow in payables of $10.3 million in 2016, an increase of $9.4 million from the $0.9 million outflow in 2015. Payable levels reduced in the latter part of 2016, with reduced purchasing of new raw materials, as a result of the decreased sales volumes. Lower average indebtedness, coupled with the refinancing of our private placement loans, resulted in the net interest costs of $5.6 million in 2016 being $1.3 million lower than the $6.9 million in 2015. The gain on the changes to defined benefit pension plans of $0.6 million in 2016 and $18.2 million in 2015 was non-cash. There was an outflow in provisions of $2.6 million in 2016 compared to an inflow of $0.3 million in 2015, an unfavorable variance of $2.9 million which related to the settlement of 2015 restructuring costs in the AF cylinder business. Neither the non-cash restructuring charges of $17.7 million nor the $1.2 million inflow from the sale of assets classified as held for sale, each recognized in 2015, recurred in 2016.
Cash flows from investing activities
|
|
Year Ended December 31,
|
||||||||||||
|
|
2017
|
2016
|
2015
|
||||||||||
|
|
(in $ million)
|
||||||||||||
|
CASH FLOWS FROM INVESTING ACTIVITIES
|
|
|
|
|
|
|
|||||||
|
Purchases of property, plant and equipment
|
$
|
(9.6
|
)
|
$
|
(16.5
|
)
|
$
|
(15.3
|
)
|
||||
|
Purchases of intangible assets
|
(1.7
|
)
|
(2.4
|
)
|
(2.1
|
)
|
|||||||
|
Proceeds from sale of redundant site
|
—
|
|
3.0
|
|
—
|
|
|||||||
|
Receipts from sales of property, plant and equipment
|
0.1
|
|
0.4
|
|
—
|
|
|||||||
|
Cash received from compensation for insured assets
|
—
|
|
0.2
|
|
—
|
|
|||||||
|
Investment in joint ventures and associates
|
(1.0
|
)
|
0.2
|
|
(4.2
|
)
|
|||||||
|
Interest income received from joint ventures
|
0.1
|
|
0.3
|
|
0.4
|
|
|||||||
|
Net cash flows on purchase of businesses
|
(5.6
|
)
|
(0.3
|
)
|
—
|
|
|||||||
|
Acquisition and disposal costs paid
|
(0.4
|
)
|
—
|
|
—
|
|
|||||||
|
$
|
(18.1
|
)
|
$
|
(15.1
|
)
|
$
|
(21.2
|
)
|
|||||
Net cash used in investing activities
increased
by
$3.0 million
, or
19.9%
, to
$18.1 million
in
2017
from
$15.1 million
in
2016
. Capital expenditure in
2017
was
$9.6 million
, a
decrease
of
$6.9 million
from the
$16.5 million
expenditure in
2016
. See "—Capital Expenditures—". In addition, we incurred
$1.7 million
of intangible capital expenditure in
2017
. We had an inflow of
$0.1 million
in
2017
in relation to sales of property, plant and equipment compared to an inflow of $0.4 million in 2016. Investment in joint ventures and associates was a
$1.0 million
outflow
, compared with a
$0.2 million
inflow
in
2016
. Interest income from joint ventures
decreased
to
$0.1 million
compared with
$0.3 million
in
2016
. We had a net cash outflow of
$5.6 million
in relation to the purchase of businesses compared to
$0.3 million
in
2016
. This outflow mainly related to the acquisition of the trade and assets of the Specialty Metals business of ESM Group Inc., for a initial consideration of $4.3 million. There was also $0.4 million of acquisition costs paid in respect to the aforementioned acquisition.
53
Net cash used in investing activities decreased by $6.1 million, or 28.8%, to $15.1 million in 2016 from $21.2 million in 2015. Capital expenditure in 2016 was $16.5 million, an increase of $1.2 million from the $15.3 million expenditure in 2015. See "—Capital Expenditures—". In addition, we incurred $2.4 million of intangible capital expenditure in 2016. We had an inflow of $3.0 million and $0.4 million respectively in relation to proceeds from the sale of the redundant Redditch site and sales of property, plant and equipment. There was also $0.2 million received from compensation for insured assets. Investment in joint ventures and associates was a $0.2 million inflow, compared with a $4.2 million outflow in 2015. Interest income from joint ventures decreased to $0.3 million compared with $0.4 million in 2015. We had a net cash outflow of $0.3 million in relation to purchase of businesses.
Cash flows from financing activities
|
|
Year Ended December 31,
|
|||||||||||||
|
|
2017
|
2016
|
2015
|
|||||||||||
|
|
(in $ million)
|
|||||||||||||
|
CASH FLOWS FROM FINANCING ACTIVITIES
|
|
|
|
|
|
|
||||||||
|
Interest and similar finance costs paid on banking facilities
|
$
|
(1.9
|
)
|
$
|
(1.9
|
)
|
$
|
(1.7
|
)
|
|||||
|
Interest paid on Loan Notes
|
(4.3
|
)
|
(4.5
|
)
|
(4.9
|
)
|
||||||||
|
Bank interest received
|
0.2
|
|
0.2
|
|
0.2
|
|
||||||||
|
(Repayment) / draw down on banking facilities
|
(13.4
|
)
|
(8.5
|
)
|
9.6
|
|
||||||||
|
Extension to long-term debt—financing costs
|
(1.2
|
)
|
(0.2
|
)
|
—
|
|
||||||||
|
Dividends paid
|
(13.3
|
)
|
(13.3
|
)
|
(10.8
|
)
|
||||||||
|
ESOP cash movements
|
—
|
|
(1.0
|
)
|
0.1
|
|
||||||||
|
Proceeds from issue of shares
|
—
|
|
—
|
|
0.2
|
|
||||||||
|
Treasury share cash movements
|
0.3
|
|
(6.3
|
)
|
(1.9
|
)
|
||||||||
|
$
|
(33.6
|
)
|
$
|
(35.5
|
)
|
$
|
(9.2
|
)
|
||||||
Net cash outflows from financing activities
decreased
by
$1.9 million
to a
$33.6 million
outflow in
2017
from a
$35.5 million
outflow in
2016
. Cash outflows in respect of dividend payments to holders of our ordinary shares were
$13.3 million
, in line with
2016
payments. Total interest paid on borrowings was
$6.2 million
,
down
$0.2 million
on the
$6.4 million
paid in
2016
.
Repayments
of
$13.4 million
were made to the banking facilities, compared to
$8.5 million
of
repayments
in
2016
, a movement of
$4.9 million
. There were also
$1.2 million
of financing costs paid in relation to the extension of our long-term debt facility.
Net cash flows from financing activities decreased by $26.3 million to a $35.5 million outflow in 2016 from a $9.2 million outflow in 2015. Cash outflows in respect of dividend payments to holders of our ordinary shares were $13.3 million, $2.5 million up on 2015 as a result of the increase in the quarterly dividend from $0.10 per share to $0.125. Total interest paid on borrowings was $6.4 million, down $0.2 million on the $6.6 million paid in 2015. Repayments of $8.5 million were made to the banking facilities, compared to $9.6 million of drawdowns in 2015, a movement of $18.1 million. Following the approval of a share buy-back program at the 2014 Annual General Meeting, the purchase of 634,185 shares resulted in a cash outflow in 2016 of $6.3 million, compared with $1.9 million in 2015.
Decrease in cash and cash equivalents
Our net cash and cash equivalents
decreased
by
$4.5 million
to
$9.1 million
for the year ended December 31,
2017
, from
$13.6 million
at December 31,
2016
. As of December 31,
2017
, we held
$2.4 million
of net cash and cash equivalents denominated in GBP sterling,
$2.4 million
denominated in U.S. dollars,
$1.0 million
denominated in euros and
$3.3 million
of foreign cash and cash equivalents denominated in Australian dollars, Canadian dollars, Chinese renminbi, and Czech koruna.
Our cash and cash equivalents decreased by $23.3 million to $13.6 million for the year ended December 31, 2016, from $36.9 million at December 31, 2015. As of December 31, 2016, we held $9.1 million of cash and cash equivalents denominated in GBP sterling, $1.3 million denominated in U.S. dollars, $1.4 million denominated in euros and $1.8 million of foreign cash and cash equivalents denominated in Australian dollars, Canadian dollars, Chinese renminbi, and Czech koruna.
54
Financing
Indebtedness and cash and cash equivalents
Our indebtedness under the Revolving Credit Facility and the Loan Notes was
$111.3 million
gross of issue costs, and reported under IFRS as
$108.8 million
(net of issue costs) as of
December 31, 2017
, while our net cash and cash equivalents were
$9.1 million
, of which $0.7 million was restricted, as of
December 31, 2017
. Our indebtedness under the Revolving Credit Facility and the Loan Notes was
$122.8 million
gross of issue costs, and reported under IFRS as
$121.0 million
(net of issue costs) as of
December 31, 2016
, while our net cash and cash equivalents were
$13.6 million
as of
December 31, 2016
.
As of
December 31, 2017
, we also had utilized
$1.4 million
(
December 31, 2016
:
$1.3 million
) of the ancillary facilities available under the Senior Facilities Agreement in connection with certain derivative financial instruments, letters of credit and bank guarantees.
Loan Notes due 2018, 2023 and 2026
On May 13, 2011, our subsidiary, BA Holdings, Inc., entered into a note purchase agreement (the "Note Purchase Agreement") among us, our subsidiaries and the note purchasers, to issue $65 million aggregate principal amount of senior notes due 2018 in a U.S. private placement to an insurance company and related parties (the "Loan Notes due 2018"). The Loan Notes due 2018 bore interest at a rate of 6.19% per annum, payable quarterly on the 15th day of September, December, March and June, commencing on September 15, 2011, and continuing until the principal amount of the Loan Notes due 2018 has become due and payable. The Loan Notes due 2018 were due to mature on June 15, 2018.
On June 29, 2016, Luxfer agreed with the lender under the Loan Notes due 2018 to extend the maturity date of $50 million of the outstanding $65 million principal amount. This was facilitated through the utilization of the Shelf Facility. The extension also includes a lower long-term fixed interest rate on the debt. The maturity date on $25 million was extended from June 2018 to June 2023 (the "Loan Notes due 2023") at a fixed interest rate of 4.88%; and the maturity date on $25 million was extended to June 2026 (the "Loan Notes due 2026") at a fixed interest rate of 4.94%. The revised loan documents also relaxed a number of provisions and covenants, including the removal of various restrictions on distributions, including dividends.
The Note Purchase Agreement contains customary covenants and events of default, in each case with customary and appropriate grace periods and thresholds. In addition, the Note Purchase Agreement requires us to maintain compliance with an interest coverage ratio and a leverage ratio. The interest coverage ratio measures our EBITDA (as defined in the Note Purchase Agreement) to Net Finance Charges (as defined in the Note Purchase Agreement). We are required to maintain an interest coverage ratio of 4.0:1. The leverage ratio measures our Total Net Debt (as defined in the Note Purchase Agreement) to Adjusted Acquisition EBITDA (as defined in the Note Purchase Agreement). We are required to maintain a leverage ratio of no more than 3.0:1. We have been in compliance with the covenants under the Note Purchase Agreement throughout all of the quarterly measurement dates from and including September 30, 2011, to
December 31, 2017
.
The Loan Notes due 2018, 2023 and 2026 and the Note Purchase Agreement are governed by the law of the State of New York.
The Loan Notes due 2018, 2023 and 2026 are denominated in U.S. dollars, which creates a natural partial offset between the dollar-denominated net assets and earnings of our U.S. operations and the dollar-denominated debt and related interest expense of the notes. We have included the Note Purchase Agreement and a form of the Loan Notes due 2018, 2023 and 2026 as exhibits to this Annual Report and refer you to the exhibits for more information on the Note Purchase Agreement and the Loan Notes due 2018, 2023 and 2026.
Loan Notes due 2021 and Shelf Facility
On September 18, 2014, we entered into a note purchase and shelf facility agreement (the "Note Purchase and Private Shelf Agreement") among us, our subsidiaries and the note purchasers, to issue $25 million aggregate principal amount of senior notes due 2021 in a U.S. private placement to an insurance company and related parties (the "Loan Notes due 2021"). This arrangement also allows for a further $50 million of borrowing through an uncommitted three-year shelf facility with the insurance company (the "Shelf Facility"). The Loan Notes due 2021 bear interest at a rate of 3.67% per annum, payable quarterly on the 15th day of December, March, June and September, commencing on December 15, 2014, and continuing until the principal amount of the Loan Notes 2021 has become due and payable. The Loan Notes due 2021 mature on September 15, 2021.
The Note Purchase and Private Shelf Agreement contains the same customary covenants and events of default as for the Note Purchase Agreement. The Note Purchase and Private Shelf Agreement also requires us to maintain compliance with the same, interest and leverage ratios as for the Note Purchase Agreement. Amounts
55
drawn under the Shelf Facility in June 2016 were used to facilitate an extension of the maturity of $50 million of the outstanding principal amount of the Loan Notes due 2018.
We have been in compliance with the covenants under the Note Purchase and Private Shelf Agreement throughout all of the quarterly measurement dates from and including September 30, 2014, to
December 31, 2017
.
The Loan Notes due 2021 and Shelf Facility and the Note Purchase and Private Shelf Agreement are governed by the law of the State of New York.
Senior Facilities Agreement
Overview.
On May 13, 2011, we entered into the Senior Facilities Agreement with Lloyds TSB Bank plc, Clydesdale Bank PLC and Bank of America, N.A. Lloyds TSB Bank plc and Clydesdale Bank PLC were Mandated Lead Arrangers under the Senior Facilities Agreement. This agreement has been subject to a series of amendments. The most significant of these amendments were dated March 25, 2014, when two new banks, Santander U.K. plc and National Westminster Bank plc (a subsidiary of The Royal Bank of Scotland plc), joined the banking syndicate and July 31, 2017, when two banks left the banking syndicate, Santander U.K. plc and Bank of America, N.A., and were replaced by two new banks, Citibank, N.A and HSBC Bank plc.
The following is a summary of the terms of the Senior Facilities Agreement, as amended, that we believe are the most important. We have included the Senior Facilities Agreement as an exhibit to this Annual Report and refer you to the exhibit for more information on the Senior Facilities Agreement.
Structure.
The current Senior Facilities Agreement provides $150 million of committed debt facilities, in the form of a multi-currency (GBP sterling, U.S. dollars or euros) Revolving Credit Facility and an additional $50 million of uncommitted facilities through an accordion clause. The amended facilities mature July 31, 2022. As of
December 31, 2017
, we had drawn down
$21.3 million
under the Revolving Credit Facility (
December 31, 2016
:
$32.8 million
).
Availability.
The facility is used for loans and overdrafts. Amounts unutilized under the Revolving Credit Facility (or, if the case, under the revolving portion of the Accordion) are allocated to ancillary facilities available under the Senior Facilities Agreement in connection with overdraft facilities, bilateral loan facilities and letter of credit facilities. As of
December 31, 2017
, we had drawn down
$21.3 million
under the ancillary facilities (
December 31, 2016
:
$32.8 million
). We may use amounts drawn under the Revolving Credit Facility for our general corporate purposes and certain capital expenditures, as well as for the financing of permitted acquisitions and reorganizations. As of
December 31, 2017
,
$128.7 million
was available under the Revolving Credit Facility. The last day we may draw funds from the Revolving Credit Facility is June 30, 2022.
The Company has a separate bonding facility for bank guarantees and documentary letters of credit denominated in GBP sterling of
£10.0 million
(
$13.6 million
), of which
£1.0 million
(
$1.4 million
) was drawn as of
December 31, 2017
. The amount drawn on the bonding facility as of
December 31, 2016
, was
£1.0 million
(
$1.3 million
).
Interest rates and fees.
Borrowings under the facility bears an interest rate equal to an applicable margin plus either EURIBOR, in the case of amounts drawn in euros, or LIBOR, in the case of amounts drawn in GBP sterling or U.S. dollars.
The applicable base margin for the Revolving Credit Facility is subject to adjustment each quarter end based on our leverage ratio, which is defined in the Senior Facilities Agreement as the ratio of the Total Net Debt to Adjusted Acquisition EBITDA (each as defined in the Senior Facilities Agreement) in respect of the rolling 12-month period ending on the last day of the relevant quarter.
The tables below sets out the range of ratios and the related margin percentage currently in effect.
|
Leverage
|
Margin
|
||||
|
|
(% per annum)
|
||||
|
Greater than 3.0:1
|
2.90
|
|
|||
|
Less than or equal to 3.0:1, but greater than 2.5:1
|
2.50
|
|
|||
|
Less than or equal to 2.5:1, but greater than 2.0:1
|
2.25
|
|
|||
|
Less than or equal to 2.0:1, but greater than 1.5:1
|
2.00
|
|
|||
|
Less than or equal to 1.5:1, but greater than 1.0:1
|
1.75
|
|
|||
|
Less than or equal to 1.0:1
|
1.50
|
|
|||
56
As of
December 31, 2017
, we had drawn down
$21.3 million
under the Revolving Credit Facility (
December 31, 2016
:
$32.8 million
). A commitment fee is levied each quarter against any unutilized element of the Revolving Credit Facility, excluding overdraft or ancillary facilities. This was calculated at 40% of the applicable margin in force before the July 2017 amendment, following which it is now calculated at 35% of the applicable margin in force. During
2017
, this fee percentage ranged between 0.7% and 1.0%.
Guarantees and security.
The renegotiated Senior Facilities Agreement, agreed in November 2012, removed all U.K. and U.S. security debentures from the agreement together with the cancellation of all share pledges, with no change to this in the March 2014 and July 2017 amendments.
Repayment of principal.
Any amounts borrowed under the Revolving Credit Facility must be paid at the end of an interest period agreed between the borrower (and Luxfer Holdings PLC acting on its behalf) and the agent when the loan is made.
Change of control.
In the event of a sale of all or substantially all of our business and / or assets or if any person or group of persons acting in concert gains direct or indirect control (as defined in the Senior Facilities Agreement) of Luxfer Holdings PLC, we will be required to immediately repay all outstanding amounts under the Revolving Credit Facility (and, if the case, the Accordion) and the ancillary facilities under the Senior Facilities Agreement.
Certain covenants and undertakings.
The Senior Facilities Agreement contains a number of additional undertakings and covenants that, among other things, restrict, subject to certain exceptions, us and our subsidiaries' ability to:
|
•
|
engage in mergers, demergers, consolidations or deconstructions;
|
|
•
|
change the nature of our business;
|
|
•
|
make certain acquisitions;
|
|
•
|
participate in certain joint ventures;
|
|
•
|
grant liens or other security interests on our assets;
|
|
•
|
sell, lease, transfer or otherwise dispose of assets, including receivables;
|
|
•
|
enter into certain non-arm's-length transactions;
|
|
•
|
grant guarantees;
|
|
•
|
pay off certain existing indebtedness;
|
|
•
|
make investments, loans or grant credit;
|
|
•
|
repurchase our shares;
|
|
•
|
issue shares or other securities; and
|
|
•
|
redeem, repurchase, decease, retire or repay any of our share capital.
|
We are permitted to dispose of assets up to $25 million in aggregate until July 2022, without restriction as to the use of the proceeds under the Senior Facilities Agreement. Above this level, we would need to seek agreement from the majority of the lenders under the Senior Facilities Agreement. In addition, we may pay dividends, subject to certain limitations.
In addition, the Senior Facilities Agreement requires us to maintain compliance with an interest coverage ratio and a leverage ratio. The interest coverage ratio measures our EBITDA (as defined in the Senior Facilities Agreement) to Net Finance Charges (as defined in the Senior Facilities Agreement). We are required to maintain an interest coverage ratio of 4.0:1. The leverage ratio measures our Total Net Debt (as defined in the Senior Facilities Agreement) to the Relevant Period Adjusted Acquisition EBITDA (as defined in the Senior Facilities Agreement). We are required to maintain a leverage ratio of no more than 3.0:1.
Any breach of a covenant in the Senior Facilities Agreement could result in a default under the Senior Facilities Agreement, in which case lenders could elect to declare all borrowed amounts immediately due and payable if the default is not remedied or waived within any applicable grace periods. Additionally, our and our subsidiaries' ability to make investments, incur liens and make certain restricted payments is also tied to ratios based on EBITDA.
We have been in compliance with the covenants under the Senior Facilities Agreement throughout all of the quarterly measurement dates from and including September 30, 2011, to
December 31, 2017
.
Events of default.
The Senior Facilities Agreement contains customary events of default, in each case with customary and appropriate grace periods and thresholds, including, but not limited to:
|
•
|
non-payment of principal, interest or commitment fee;
|
57
|
•
|
violation of covenants or undertakings;
|
|
•
|
representations, warranties or written statements being untrue;
|
|
•
|
cross default and cross acceleration;
|
|
•
|
certain liquidation, insolvency, winding-up, attachment and bankruptcy events;
|
|
•
|
certain litigation, arbitration, administrative or environmental claims having a material adverse effect on us or any of our subsidiaries;
|
|
•
|
qualification by the auditors of our consolidated financial statements which is materially adverse to the interests of the lenders;
|
|
•
|
certain change of control events;
|
|
•
|
cessation of business;
|
|
•
|
material adverse change; and
|
|
•
|
certain ERISA matters.
|
Upon the occurrence of an event of default under the Senior Facilities Agreement, the lenders will be able to terminate the commitments under the senior secured credit facilities, and declare all amounts, including accrued interest, to be due and payable and to take certain other actions.
The Senior Facilities Agreement is governed by English law.
Capital Expenditures
Investment in upgrading and expanding our production facilities is a key part of our strategy. In
2015
and
2016
, we reaffirmed our commitment to capital expenditures by investing $15.3 million and $16.5 million, respectively. In
2017
, we spent a further
$9.6 million
on the purchase of property, plant and equipment. The projects conducted in
2017
,
2016
and
2015
included:
|
•
|
In 2017, we invested in a new assembly facility to increase the capacity of the Superform business within the U.K. We invested a total of $1.5 million in this project.
|
|
•
|
In 2016, we invested in a new restrike press at our Worcester site to expand the capability of the Superform business in the U.K. We invested a total of $2.2 million in this project.
|
|
•
|
In 2016 and 2015, we continued to expand and upgrade the cylinders lines in place at our facilities in Riverside, California, and Graham, North Carolina. We invested a total of $3.4 million in 2016 and $2.9 million in 2015 in this project.
|
|
•
|
In 2015, we invested in new ERP systems at our Madison, Illinois, and Findlay, Ohio, sites, and also upgraded key manufacturing equipment at both sites. We invested a total of $3.2 million in these projects.
|
C. Research and development, patents and licenses, etc.
Research and Development
Luxfer has always recognized the importance of research in materials science and the need to develop innovative new products to meet future needs of customers and to continue providing growth opportunities for the business. Each year we make a major investment across the Group in the development of new products and processes directed towards transportation, defense and emergency response, healthcare and general industrial end-markets. Direct expenditure on research and development (including revenue and capital items and before funding grants received) amounted to
$7.8 million
in
2017
(
2016
:
$7.6 million
;
2015
:
$8.3 million
). The wider cost of product development and our financial commitment to its success is much harder for us to measure, because our product development projects include utilizing skills of our wider commercial technical sales staff and general management, many of whom are highly qualified scientists and engineers. A large proportion of senior sales and management time is spent overseeing development of products and working with customers on integrating our technology into their product designs.
To provide customers with improving products and services, we continually invest in new technology and research and employ some of the world's leading specialists in materials science and metallurgy. Our engineers and metallurgists collaborate closely with our customers to design, develop and manufacture our products. We also co-sponsor ongoing research programs at major universities in the U.S., Canada and Europe. Thanks to the ingenuity of our own research and development teams, Luxfer has developed a steady stream of new products, most recently including:
|
•
|
soluble magnesium alloys, branded SoluMag
®
, for down-well oil and gas applications;
|
|
•
|
ultra-lightweight large composite cylinders, branded G-Stor
TM
, for containment of CNG, hydrogen, helium and other gases;
|
58
|
•
|
enabling technologies for AF systems, including high-pressure valves, branded G-Flo
TM
, and pressure- release devices;
|
|
•
|
new magnesium alloy variants such as in Elektron
®
43, designed for use in aircraft seating;
|
|
•
|
zirconium catalysts for large-scale industrial chemical applications;
|
|
•
|
L7X
®
higher-strength aluminum alloy and carbon composite gas cylinders;
|
|
•
|
bioresorbable magnesium alloys, branded SynerMag
®
; and
|
|
•
|
zirconium sorbents, branded MELsorb
®
, being developed for use as an active ingredient in kidney dialysis equipment.
|
We believe that our commitment to research and new product development, through dedicated resources and significant use of management's time, is the core of Luxfer Group's growth potential worldwide. This commitment reflects our strategy of focusing on high-performance, value-added product lines and markets and leveraging our collaboration with universities. We invest in developing products for end-markets that we believe have long-term growth potential. Although such products sometimes take considerable time to commercialize, when they succeed, they provide significant competitive advantages and opportunities for sustainable profit growth.
Intellectual Property
We rely on a combination of patents, trade secrets, copyrights, trademarks and design rights, together with non-disclosure agreements and technical measures, to establish and protect proprietary rights in our products. Our Elektron Division holds key patents related to protection applications, including numerous aerospace alloys and magnesium-gadolinium alloys, as well as patents related to environmental applications, including water-treatment products and our specialized G4 process used to manufacture zirconium-cerium oxides for emissions-control catalysts. The division also has patented technology for magnesium-based flameless heater pads used to heat meals and beverages. Key patents held by our Gas Cylinders Division relate to aluminum alloys for pressurized hollow bodies and superplastic-forming techniques.
In certain areas, we rely more heavily upon trade secrets and unpatented proprietary know-how than patent protection in order to establish and maintain our competitive advantage. We generally enter into non-disclosure and invention assignment agreements with our employees and subcontractors.
D. Trend information.
Information required by this item is set forth in Item 5.A of this Annual Report, "Risk factors" and below.
The Group has a diversified portfolio of products and end-markets, and therefore it is not unusual for certain markets to be down or to be experiencing positive or negative trends. In particular, the level of sales of our Luxfer Magtech FRHs used in MRE can have a positive or negative impact on our Elektron Division. For example, 2017 saw increased demand within the defense and emergency responders end market, as a result of increased disaster-relief shipments to hurricane affected areas in the United States and Caribbean, whereas in 2016 sales were depressed due to reduced government spending.
Our strategy is focused around introducing new products into markets with expected strong growth trends. For example, we seek to respond to the need for more environmentally-friendly products resulting from stricter government regulations on emissions and the long-term view of the increasing cost of fossil fuels.
E. Off-balance sheet arrangements.
In the ordinary course of business, we enter into operating lease commitments and capital commitments. These transactions are recognized in the consolidated financial statements in accordance with IFRS as issued by the IASB and are more fully disclosed therein.
As of
December 31, 2017
, neither Luxfer Holdings PLC nor any of its subsidiaries has any off-balance sheet arrangements that currently have or are reasonably likely to have a future effect on the Group's financial position, changes in financial position, results of operations, liquidity, capital expenditure or capital resources.
F. Tabular disclosure of contractual obligations.
We have various contractual obligations arising from both our continuing operations. The following table lists the aggregate maturities of various classes of obligations and expiration amounts of various classes of commitments related to our continuing operations as of
December 31, 2017
. See "Note 26—Commitments and contingencies" and "Note 27—Financial risk management objectives and policies" to our consolidated financial statements attached to this Annual Report for additional details on these obligations and commitments.
59
|
|
Payments Due by Period
|
||||||||||||||||||||
|
|
Total
|
Less than
1 year
|
1 – 3
years
|
3 – 5
years
|
After
5 years
|
||||||||||||||||
|
|
(in $ million)
|
||||||||||||||||||||
|
Contractual cash obligations
|
|
|
|
|
|
|
|
|
|
|
|||||||||||
|
Loan Notes due 2018
(1)
|
15.0
|
|
15.0
|
|
—
|
|
—
|
|
—
|
|
|||||||||||
|
Loan Notes due 2021
(1)
|
25.0
|
|
—
|
|
—
|
|
25.0
|
|
—
|
|
|||||||||||
|
Loan Notes due 2023
(1)
|
25.0
|
|
—
|
|
—
|
|
—
|
|
25.0
|
|
|||||||||||
|
Loan Notes due 2026
(1)
|
25.0
|
|
—
|
|
—
|
|
—
|
|
25.0
|
|
|||||||||||
|
Revolving Credit Facility
|
21.3
|
|
—
|
|
—
|
|
21.3
|
|
—
|
|
|||||||||||
|
Deferred contingent consideration
(2)
|
0.7
|
|
0.5
|
|
0.2
|
|
—
|
|
—
|
|
|||||||||||
|
Deferred consideration
(3)
|
0.3
|
|
0.3
|
|
—
|
|
|||||||||||||||
|
Obligations under operating leases
|
34.4
|
|
5.4
|
|
8.0
|
|
6.5
|
|
14.5
|
|
|||||||||||
|
Capital commitments
|
0.6
|
|
0.6
|
|
—
|
|
—
|
|
—
|
|
|||||||||||
|
Interest payments
(4)
|
24.6
|
|
4.5
|
|
8.3
|
|
6.9
|
|
4.9
|
|
|||||||||||
|
Total contractual cash obligations
|
$
|
171.9
|
|
$
|
26.3
|
|
$
|
16.5
|
|
$
|
59.7
|
|
$
|
69.4
|
|
||||||
|
(1)
|
The Loan Notes due 2018, 2021, 2023 and 2026 are gross of unamortized finance costs, which were
nil
,
$0.1 million
,
$0.3 million
and
$0.3 million
respectively, as of
December 31, 2017
. As required by IFRS, the Loan Notes due 2018, 2021, 2023 and 2026 are disclosed in our consolidated balance sheet as
$89.3 million
, being net of these costs. The amounts to be repaid exclude interest payable on the indebtedness.
|
|
(2)
|
The deferred contingent consideration relates to the 2014 acquisition of Luxfer Magtech. The amount is linked to its future expected profitability which, where appropriate is payable annually from 2015 to 2020.
|
|
(3)
|
The deferred consideration relates to the 2017 acquisition of the trade and assets of the Specialty Metals business of ESM Group Inc.
|
|
(4)
|
Interest payments include estimated interest payable on the Loan Notes due 2018, 2021, 2023 and 2026 at the fixed rates of 6.19%, 3.67%, 4.88% and 4.94% respectively. No interest payments have been included for the Revolving Credit Facility given that the level of debt under this facility is managed on an ongoing basis in conjunction with the level of cash and cash equivalents held by us.
|
Loan notes due 2018, 2023 and 2026.
See "—Financing—Loan Notes due 2018, 2023 and 2026" above for a detailed explanation of the Loan Notes due 2018, 2023 and 2026.
Loan notes due 2021.
See "—Financing—Loan Notes due 2021 and Shelf Facility" above for a detailed explanation of the Loan Notes due 2021.
Obligations under non-cancellable operating leases.
We lease certain land and buildings and a limited amount of plant and equipment pursuant to agreements that we cannot terminate prior to the end of their terms without incurring substantial penalties, absent breach by the counterparty. However, under the lease agreements, the risks and rewards of ownership have substantially remained with the lessors. In particular, the fair value of the future payments under these leases is significantly less than the value of the assets to which they relate, and the lease periods are significantly shorter than the estimated lives of the relevant assets. We therefore do not recognize the future lease obligations and the value of the assets leased in our consolidated balance sheet. The lease costs payable each year are charged to operating expenses during the year and amounted to
$5.1 million
in the year ended
December 31, 2017
.
Foreign currency forward contracts.
We use forward contracts to hedge the risk of exchange movements of foreign currencies in relation to sales and purchases and their corresponding trade receivable or trade payable. Under IFRS, we recognize the value of these contracts at their fair value in our consolidated balance sheet. As of
December 31, 2017
, we had outstanding contracts with a mark to market fair value
loss
of
$0.7 million
, calculated using exchange rates and forward interest rates compared to market rates as of
December 31, 2017
. See "Item 11. Quantitative and Qualitative Disclosure About Market Risk—Effect of Currency Movement on Results of Operations."
60
Aluminum forward contracts.
We may use LME forward purchase contracts to fix a portion of our aluminum purchase costs and thereby hedge against future price movements in the price of primary aluminum. In
2017
, we entered into a number of LME contracts to provide hedges against some of our aluminum price risks in
2017
. As of
December 31, 2017
, we had outstanding contracts with a mark to market fair value
gain
of
$1.2 million
. See "Item 11. Quantitative and Qualitative Disclosure About Market Risk—Effect of Commodity Price Movements on Results of Operations."
We do not recognize the fair value of forward LME contracts in our income statement until we receive delivery of the underlying physical aluminum. The value of such contracts is recognized as an asset or liability in our consolidated balance sheet, with the profit or loss on effective hedges deferred in a hedging reserve account in equity until the underlying delivery of the physical aluminum. The fair value of the contracts is based on quoted forward prices from the LME.
Forward interest rate agreements.
There were no forward interest rate agreements in place as of
December 31, 2017
.
Capital commitments.
From time to time, we have capital expenditure commitments when we have new plant and equipment on order. We treat these commitments as contingent liabilities, because they will not be recognized on the consolidated balance sheet until the capital equipment to which they relate has been delivered. As of
December 31, 2017
, we had capital commitments of
$0.6 million
.
G. Safe harbor.
See the section entitled "Information Regarding Forward-Looking Statements" at the beginning of this Annual Report.
|
Item 6.
|
Directors, Senior Management and Employees
|
A. Directors and Senior Management
The Board of Directors
The following table presents information regarding the members of the Board of Directors during the year.
|
Name
|
Age
|
Position
|
|||||
|
Joseph A. Bonn
(1)(2)(3)(4)
|
74
|
|
Non-Executive Chairman
|
||||
|
Brian G. Purves
(5)
|
63
|
|
Director and Chief Executive Officer (retired)
|
||||
|
Alok Maskara
(6)
|
46
|
|
Director and Chief Executive Officer
|
||||
|
Andrew M. Beaden
(7)
|
50
|
|
Director and Group Finance Director (resigned)
|
||||
|
Kevin S. Flannery
(1)(2)(3)(4)(8)
|
73
|
|
Non-Executive Director (retired)
|
||||
|
David F. Landless
(1)(2)(3)(4)
|
58
|
|
Non-Executive Director
|
||||
|
Dr Brian Kushner
(1)(2)(3)(4)
|
59
|
|
Non-Executive Director
|
||||
|
Clive J. Snowdon
(1)(2)(3)(4)
|
64
|
|
Non-Executive Director
|
||||
|
Adam Cohn
(2)(3)
|
46
|
|
Non-Executive Director
|
||||
|
(1)
|
Member of the Audit Committee during the year.
|
|
(2)
|
Member of the Remuneration Committee during the year.
|
|
(3)
|
Member of the Nominating and Governance Committee during the year.
|
|
(4)
|
An "independent director" as such term is defined in Rule 10A-3 under the Exchange Act for Audit Committee purposes, having served on the Committee for all or part of the year.
|
|
(5)
|
Brian G. Purves stepped down as Chief Executive Officer on July 1, 2017 and retired as a Director of Luxfer on September 25, 2017.
|
|
(6)
|
Alok Maskara was appointed as a Director on May 23, 2017 and as the Chief Executive Officer on July 1, 2017.
|
|
(7)
|
Andrew M. Beaden resigned as Group Finance Director on October 2, 2017.
|
|
(8)
|
Kevin S. Flannery retired as a Director of Luxfer on May 23, 2017.
|
61
Biographical information concerning the members of our Board of Directors is set forth below.
Joseph A. Bonn
Non-Executive Chairman
Joseph (Joe) was appointed as a Non-Executive Director on March 1, 2007, at which time he was also appointed to both the Audit and Remuneration Committees. He has also been a member of the Nominating Committee since its establishment in July 2013. Joe was appointed as Non-Executive Chairman on December 6, 2016. Joe was a member of the Audit Committee until and including January 30, 2017. He was also Chair of the Remuneration Committee until and including November 23, 2017 after which he stepped down as Chair, but remained a member of the Committee. Joe was Chair of the Nominating Committee until and including December 4, 2017 after which he stepped down as Chair, but remained a member of the Committee. Joe has informed the Board of his decision not to stand for re-election to the board at the AGM in 2019 and to step down as Chairman by early 2019.
Experience:
Joe has extensive experience in the aluminum and specialty chemical industry, having worked for Kaiser Aluminum and Chemical Corporation for over 35 years in various senior capacities. Among other appointments in the U.S., he has served on the Board and Executive Committee of the Aluminum Association, the Board of the National Association of Purchasing Management and the International Primary Aluminium Institute Board. He is currently a consultant with Joseph Bonn RE&C Corp.
Joe holds a BS degree from Rensselaer Polytechnic Institute and an M.B.A. degree in Finance from Cornell University.
Brian G. Purves
Chief Executive Officer (Resigned as Chief Executive Officer July 1, 2017 and retired as Director September 25, 2017)
Brian was appointed as our Chief Executive Officer at the start of 2002 and was an Executive Director of the Company and its predecessor since 1996. He was one of the two-man management buy-in team that led the private equity-funded acquisition of British Aluminium (including the core or our current Group) from Alcan in 1996, serving as Finance Director from that date until 2001. Brian stepped down as Chief Executive Officer on July 1, 2017 and retired as a Director on September 25, 2017.
Experience:
Before joining the Company, Brian held several senior positions in the U.K. motor manufacturing industry covering various financial, commercial and general management responsibilities.
Brian has an honours degree in natural philosophy (physics) from the University of Glasgow and a Master of business studies degree from the University of Edinburgh. A Fellow of the Chartered Institute of Management Accountants, he is also a Companion of the Chartered Management Institute.
Alok Maskara
Chief Executive Officer
Alok was named as the Chief Executive Officer designate of Luxfer and appointed to the Board of Directors on May 23, 2017 and later became Chief Executive Officer on July 1, 2017.
Experience: Before joining Luxfer, Alok was a business segment President at Pentair Plc for eight years where he led businesses of progressively larger sizes. Prior to Pentair, he was at General Electric Corporation for four years. Alok has also worked at McKinsey & Company, a management consultancy firm in Chicago, Illinois.
Alok holds an M.B.A. from the Kellogg Graduate School of Management, an M.S. from the University of New Mexico and a Bachelor in Technology from the Indian Institute of Technology, Mumbai.
Andrew M. Beaden
Group Finance Director (Resigned October 2, 2017)
Andrew (Andy) was appointed as Group Finance Director in June 2011 prior to the I.P.O., at which time he was appointed to the Board as an Executive Director. Andy joined the Group in 1997 and became Group Financial Controller in 2002, becoming a member of the Executive Management Board in January 2006. He worked as Director of Planning and Finance from 2008 to 2011. Andy stepped down as Group Finance Director and as a Director on the Board on October 2, 2017
Experience:
Before joining the Company, Andy worked for KPMG, as well as several U.K. FTSE 100 companies in a variety of financial roles.
62
Andy is a Chartered Accountant and holds a degree in economics and econometrics from Nottingham University.
Kevin S. Flannery
Non-Executive Director (Retired May 23, 2017)
Kevin was appointed as a Non-Executive Director on June 1, 2007, at which time he was also appointed to both the Audit and Remuneration Committees. He was appointed to the Nominating Committee on its establishment in July 2013, but stepped down on October 6, 2016. Kevin was a member of the Audit Committee until and including January 30, 2017 and reappointed to the Nominating Committee from January 31, 2017. He retired as a Director of Luxfer on May 23, 2017.
Experience:
Kevin has over 40 years of experience in both operational and financial management roles in a variety of industries and has also served in the capacities of Director, Chairman and Chief Executive Officer of several companies in the U.S. He is currently the President and Chief Executive Officer of Whelan Financial Corporation, a company he founded in 1993 that specializes in financial management and consulting. He was formerly the Chairman and Chief Executive Officer of several companies, including RoweCom, Inc., Telespectrum Worldwide and Rehrig United Inc. He also served as a director of a number of other corporations between 2005 and 2011. Kevin began his career at Goldman, Sachs & Co and was a senior managing partner of Bear Stearns & Co.
David F. Landless
Non-Executive Director
David was appointed as a Non-Executive Director in March 2013 and was appointed to the Audit Committee on March 28, 2013, and the Nominating Committee on July 23, 2013. He acts as the financial expert on the Audit Committee under the listing rules of the New York Stock Exchange. He was appointed as a member of the Remuneration Committee in January 2015 and on May 28, 2015, he was appointed Chair of the Audit Committee. David was a member of the Nominating Committee until and including January 30, 2017 and then from December 5, 2017. He was a member of the Remuneration Committee until and including November 23, 2017.
Experience:
David started his career with Bowater and Carrington Viyella and joined Courtaulds Plc in 1984. He was appointed a Finance Director in the U.K. and U.S. divisions of Courtaulds Plc from 1989 to 1997 and Finance Director of Courtaulds Coatings (Holdings) Limited from 1997 to 1999. He was appointed Group Finance Director of Bodycote plc in 1999 until he retired from the position on January 1, 2017. He is a Non-Executive Director of Innospec, Inc. and was appointed a Non-Executive Director of Renold plc on January 9, 2017 and a Non-Executive Director of European Metal Recycling Limited on June 30, 2017.
David is a Chartered Management Accountant. He graduated from the University of Manchester Institute of Science and Technology.
Dr. Brian Kushner
Non-Executive Director
Brian was appointed as a Non-Executive Director on May 24, 2016, at which time he was also appointed to the Remuneration and Nominating committees. He was appointed to the Audit Committee on August 5, 2016. During 2017, Brian was a member of the Nominating Committee until and including January 30, 2017 and he was appointed Chair of the Remuneration Committee from November 24, 2017.
Experience: Brian co-founded CXO, LLC, a management consulting firm acquired by FTI Consulting, ("FTI", NYSE:FCN) a global business advisory firm in 2008. Brian is now Senior Managing Director at FTI, and leads the Private Capital practice. Over the past two decades, he has served as the CEO, Chief Restructuring Officer or non-executive Director of more than two dozen public and private technology, manufacturing, telecom and defense companies. Brian began his career in 1982 at BDM International, and was part of the management team that completed a leveraged buyout of BDM in 1990 by Carlyle.
Brian serves as a Non-Executive Director and Audit Committee Chair of Mudrick Capital Acquisition Corporation (NASDAQ:MUDS), Non-Executive Director and Audit Committee Chair of Dex Media (OTC: DMDA), and Non-Executive Director and member of the Audit and Governance Committees at Zodiac Interactive. Brian holds a doctorate in applied physics / electrical engineering from Cornell University.
63
Clive J. Snowdon
Non-Executive Director
Clive was appointed as a Non-Executive Director on July 29, 2016, at which time he was also appointed to the Remuneration and Nominating Committees. He was appointed to the Audit Committee on August 5, 2016. Clive was a member of the Remuneration Committee until and including January 30, 2017 and became Chair of the Nominating Committee from December 5, 2017.
Experience:
Clive has served as Chairman of the Midlands Aerospace Alliance since 2007 and is a Trustee of the Stratford Town Trust. He is also the aerospace industry advisor to Cooper Parry Corporate Finance. In May 2016, Mr. Snowdon stepped down from the board of Hill & Smith Holdings PLC, where he had been Senior Non-Executive Director since May 2007 and chair of the remuneration committee, as well as a member of the Audit and Nominating Committees. Mr. Snowdon retired from Umeco PLC in June 2011 after serving as Chief Executive since April 1997, and he was Executive Chairman of Shimtech Industries Group Limited until the sale of the business in May 2015. From 1992 to 1997, Mr. Snowdon served as Managing Director of Burnfield PLC after being promoted to that position from Finance Director. He has also held senior positions with Vickers PLC, BTR PLC and Hawker Siddeley Group. Mr. Snowdon is qualified as a Chartered Accountant.
Adam Cohn
Non-Executive Director
Adam was appointed as a Non-Executive Director on July 18, 2016, at which time he was also appointed to the Remuneration Committee. Adam was appointed to the Nominating Committee from January 31, 2017.
Experience:
Adam is Co-CEO of Stone Canyon Industries LLC (SCI), a company he co-founded in September 2014. SCI has a small investment in Luxfer. Prior to SCI, from March 2000 to September 2014, Adam was a Partner at Knowledge Universe ("KU"), where he served as Head of Mergers and Acquisitions and Business Development for KU and its portfolio companies. Prior to joining KU, he was a Senior Associate with Whitney & Co., a private equity firm. Before that, Adam was an investment banker in the Financial Sponsors Group at Bankers Trust Company and Deutsche Bank. He has a B.S. in business from Skidmore College and an M.B.A. from Columbia University. Adam served on the board of k12, Inc, where he was also Chairman of the Compensation Committee. In addition, he serves on several other private company boards.
Executive Leadership Team
The members of the Executive Leadership Team (previously Executive Management Board) of Luxfer are responsible for the day-to-day management of our company.
The following table lists the names and positions of the current members of the Executive Leadership Team as well as those who served during the year.
|
Name
|
Age
|
Position
|
|||||
|
Brian G. Purves
(1)
|
63
|
|
Director and Chief Executive Officer (retired)
|
||||
|
Alok Maskara
(2)
|
46
|
|
Director and Chief Executive Officer
|
||||
|
Andrew M. Beaden
(3)
|
50
|
|
Director and Group Finance Director (resigned)
|
||||
|
Heather C. Harding
(4)
|
49
|
|
Chief Financial Officer
|
||||
|
Edward J. Haughey
(5)
|
62
|
|
Divisional Managing Director of MEL Chemicals (retired)
|
||||
|
David T. Rix
(6)
|
49
|
|
Divisional Managing Director of Magnesium Elektron (resigned)
|
||||
|
Andrew W. J. Butcher
|
49
|
|
President of Luxfer Gas Cylinders
|
||||
|
Graham D. Wardlow
(7)
|
50
|
|
Managing Director of Luxfer MEL Technologies
|
||||
|
James G. Gardella
(7)
|
61
|
|
President of Luxfer Magtech
|
||||
|
Christopher A. Barnes
(7)
|
63
|
|
President of Luxfer Graphic Arts
|
||||
|
Simon P. Tarmey
(7)
|
55
|
|
Managing Director of Luxfer Superform
|
||||
|
Claire L. Swarbrick
(7)
|
43
|
|
General Counsel and Legal Adviser
|
||||
|
Peter N. Gibbons
(7)
|
47
|
|
Director of Sourcing and IT
|
||||
|
Peter S. Dyke
(8)
|
47
|
|
Chief Human Resources Officer
|
||||
|
(1)
|
Brian G. Purves stepped down as Chief Executive Officer on July 1, 2017 and retired as a Director of Luxfer on September 25, 2017.
|
|
(2)
|
Alok Maskara was appointed as a Director on May 23, 2017 and as the Chief Executive Officer on July 1, 2017.
|
64
|
(3)
|
Andrew M. Beaden resigned as Group Finance Director on October 2, 2017.
|
|
(4)
|
Heather Harding was appointed as Chief Financial Officer on January 1, 2018.
|
|
(5)
|
Edward J. Haughey retired from Luxfer during May 2017.
|
|
(6)
|
David T. Rix resigned from Luxfer in June 2017.
|
|
(7)
|
Appointed to the Executive Leadership Team during August 2017.
|
|
(8)
|
Peter S. Dyke was appointed as a Chief Human Resources Officer on January 2, 2018.
|
Biographical information of the members of our Executive Leadership Team who are not members of our Board of Directors is set forth below.
Brian G. Purves, Alok Maskara and Andrew M. Beaden
Please refer to the Board of Directors biographies on page 62.
Heather C. Harding
Chief Financial Officer
Heather was named Chief Financial Officer of Luxfer on January 1, 2018.
Before joining Luxfer, Heather was vice president, finance, for Eaton Lighting, a business unit of Eaton Corporation. Prior to that, she was vice president, finance, for various operating units within Cooper Industries and Emerson Electric.
Heather is a Certified Public Accountant and has received a Bachelor of Science in accounting from Southern Illinois University at Carbondale.
Edward J. Haughey
Managing Director of MEL Chemicals (Retired)
Edward (Eddie) became a member of the Executive Management Board on his appointment as Managing Director of Luxfer's zirconium business in 2003. Prior to joining Luxfer Group, he was Managing Director of Croda Colloids Limited for Croda International Plc from 1994 to 2003, and has held a series of senior management positions in the Croda Group, BASF and Rhone Poulenc. He holds a BA (Honours) degree in Chemistry. Eddie retired from Luxfer in May 2017.
David T. Rix
Managing Director of Magnesium Elektron (Resigned)
David was appointed to the Executive Management Board in 2013 on assuming responsibility for Luxfer's magnesium businesses. He joined Alcan Wire and Conductor in 1991 and moved to Luxfer Gas Cylinders in 1994, holding various sales and marketing positions in Germany, France and Dubai, UAE, before returning to the U.K. He was appointed Managing Director of Luxfer Gas Cylinders in Europe after serving as European Sales Director and was also a member of the Gas Cylinders Divisional Team with strategic responsibility for global marketing. David holds a BA (Honours) degree in business studies and a diploma from the Chartered Institute of Marketing. David resigned from Luxfer in June 2017.
Andrew W. J. Butcher
President of Luxfer Gas Cylinders
Andrew (Andy) was appointed as President of Luxfer Gas Cylinders in April 2014. He became a member of the Executive Management Board on January 1, 2014, on his appointment as President designate. He joined Luxfer Gas Cylinders in Nottingham in 1991, before moving to California in 2002, where he led our composite businesses. He was President of Luxfer Gas Cylinders North America from 2009 to 2014. Andy holds an MA degree in Engineering from Cambridge University, and an M.B.A. from Keele University.
Graham D. Wardlow
Managing Director of Luxfer MEL Technologies
Graham was appointed Managing Director of Luxfer MEL Technologies during 2017 following the merger of MEL Chemicals with the Magnesium Elektron business. Graham joined Magnesium Elektron in 1991 and undertook a number of technical and commercial roles before becoming Managing Director of the Alloys business in 2008.
65
Graham led the transformation of this business before his appointment to Divisional Managing Director of MEL Chemicals in May 2017, at which time he became a member of the Executive Management Board.
Graham holds a degree in Materials Engineering from Imperial College, University of London, and an M.B.A. from Keele University.
James G. Gardella
President of Luxfer Magtech
James (Jim) was appointed President of Luxfer Magtech and became a member of the Executive Leadership Team during August, 2017. Prior to that, he was appointed President of Magnesium Elektron Powders in 2007 which he originally joined in 1990 as Financial Controller.
Jim holds a B.S. Degree in Accounting from Villanova University, an M.B.A. in Finance and a Certified Public Accountant credential.
Christopher A. Barnes
President of Luxfer Graphic Arts
Christopher (Chris) was President of Magnesium Elektron North America, Inc. since 2009 and was appointed President of Luxfer Graphic Arts during 2017 and appointed to the Executive Leadership Team at that time. Prior to joining Magnesium Elektron in 2003, Chris held several key leadership positions in serving the Graphic Arts Market and manufacturing magnesium wrought products.
Chris has a Bachelor of Science Degree from Michigan State University and an M.B.A. from Washington University in St. Louis, Missouri.
Simon P. Tarmey
Managing Director of Luxfer Superform
Simon was initially appointed Managing Director of Superform Worcester and then took responsibility for both the Worcester and Riverside California plants in 2009 when he became the Divisional head. Simon was appointed a member of the Executive Leadership Team during August, 2017. After graduating from South Bank Polytechnic with a degree in Engineering, Simon has worked in R&D, Engineering and Operational management roles within GKN, Federal Mogul and Unipart before joining Luxfer Superform in 2004.
Claire L. Swarbrick
General Counsel and Legal Adviser
Claire has been legal adviser to the Luxfer Group since joining the business in January 2012. She was appointed general counsel in March 2016. After graduating from the University of Nottingham with a degree in law, Claire completed the legal practice course at Chester Law College and qualified as a solicitor in September 2000. Before taking the role at Luxfer, Claire spent 12 years in private practice, specializing in corporate and commercial law. Claire was appointed a member of the Executive Leadership Team during August, 2017.
Peter N. Gibbons
Director of Sourcing and IT
Peter was appointed Director of Sourcing and IT and became a member of the Executive Leadership Team during August, 2017. He joined Luxfer in 2003 as European Financial Controller at Magnesium Elektron, before moving to Group Head Office to take up the Group Financial Controller role. He returned to Magnesium Elektron in 2014 as Divisional Finance Director. Peter is a fellow of the Association of Chartered Certified Accountants.
Peter S. Dyke
Chief Human Resources Officer
Peter (Pete) was named Chief Human Resources Officer of Luxfer on January 2, 2018.
Before joining Luxfer, Pete was Vice President Human Resources for Pentair Water, a business segment of Pentair PLC. Prior to that, he served as Vice President Human Resources for various operating units within Pentair and as Senior Manager, Human Resources with General Electric’s Aircraft Engines Division.
Pete attended Michigan State University where he received a Masters of Labor and Industrial Relations degree and a Bachelor of Arts degree in International Relations and Economics.
66
B. Compensation
The total amount of compensation paid and benefits in kind granted to the Executive Directors and members of our Executive Leadership Team (previously Executive Management Board) for the
2017
fiscal year was
$4.7 million
. This amount includes bonuses paid to the Executive Directors and members of the Executive Leadership Team (previously Executive Management Board) under the annual cash bonus plan, which is described below in note 4, page 72 of the
2017
remuneration report (the "Remuneration Report") below. The annual bonus potential as a percentage of base salary of the members of our Executive Leadership Team ranged from 50% to 160%. Moreover, details of stock options granted to the Executive Directors and members of our Executive Leadership Team are provided in Item 6.E.
For the
2017
fiscal year, (i) we and our subsidiaries contributed a total of
$0.3 million
in respect of our contribution into money purchase plans to provide pension, retirement or similar benefits to our Directors and members of the Executive Leadership Team and (ii) the total increase in accrued pension benefits earned during the
2017
fiscal year (excluding any increase due to inflation) by our Directors and members of the Executive Leadership Team under the defined benefit plans was less than $0.1 million.
Service Contracts
Other than as mentioned below, the Executive Directors are not entitled to any special arrangements on termination, just their contractual rights and, if appropriate, the Company's standard redundancy policy for all senior management, which provides for compensation based on length of service.
The Company has entered into service contracts with the Executive Directors that are not for a fixed term. Brian Purves' service contract was dated April 9, 1999. His service contract expressly stated that he had continuity of employment from when he first joined the Group in March 1996. Andrew Beaden's service contract was dated August 5, 2011, and was effective from the date of his appointment as Group Finance Director on June 1, 2011. His service contract expressly stated that he had continuity of employment from when he first joined the Group in 1997. Alok Maskara's service contract is dated May 23, 2017, being when he first joined the Company.
The Executive Directors' service contracts are terminable by 12 months' notice from the Company, which notice can be given at any time. The contracts also provide for pay in lieu of notice, which include base salary, benefits and pension payable for the notice period. A bonus may be paid if the period for which pay in lieu of notice is made extends past the year end, subject to targets being met. In the event that an acquiring company does not assume their employment agreements or offers them a materially different position, they will be entitled to severance payments based on our standard severance policy, but calculated using two times their annual salary. Otherwise, the Executive Directors have the same employment rights as any other employee in the case of redundancy or if the termination of their employment was determined by a relevant tribunal to be unfair under English law.
The relevant rules for the Long-Term Umbrella Incentive Plan ("LTiP"), in which the Executive Directors participate, provide that upon a change in control, all unvested time-based awards will fully vest and become exercisable as applicable and unless determined by the Remuneration Committee, shall lapse on the first anniversary of the change of control if not exercised as applicable. Under the rules of the LTiP all performance-based awards will vest pro-rata based on the performance results to the date of change and the elapsed portion of the performance period.
The Company has entered into letters of appointment with the Non-Executive Directors that are not for a fixed term as it was inappropriate to engage them on a fixed term at the date of their appointment. The appointments are subject to termination with three months' notice to be given at any time by the Company except if they should fail to be re-elected at an AGM when their contract terminates immediately without notice or compensation. The Chairman, Joseph Bonn's letter of appointment is dated February 28, 2007, David Landless' is dated February 20, 2013, Brian Kushner's is dated May 24, 2016, Adam Cohn's is dated July 18, 2016, and Clive Snowdon's is dated July 29, 2016. Neither the Non-Executive Directors nor the Chairman has any employment rights.
The Remuneration Report was prepared in accordance with our U.K. home-country regulations and is reproduced hereunder in all material respects.
67
DIRECTORS' REMUNERATION REPORT
Chairman's Letter
Dear Shareholder,
Following my appointment as Chairman of the Remuneration Committee in November 2017, I present my first report to the shareholders pursuant to U.K. regulations governing the way remuneration for directors of quoted U.K. companies is reported and voted upon.
During the year, the Remuneration Committee (“the Committee”) dedicated considerable time to the re-evaluation of its remuneration policy ("the Policy") with the help of independent external advisors. The updated Policy is to be presented to Shareholders for approval at the 2018 AGM and is enclosed as part of the Remuneration Report.
Major Decisions on Remuneration during the Year
Decisions made affecting 2017 remuneration
The Committee’s overall approach to remuneration packages remained the same and followed the Policy approved by shareholders in 2017.
Overall, 2017 was a strong year, with recoveries in both revenue and reported trading profit, from the previous year. The main targets of the annual bonus for 2017 related to management trading profit and net cash flow, weighted towards the management trading profit metric. For the new Chief Executive Officer, Alok Maskara, the bonus plan also contained a number of non‑financial objectives relating to the achievement of certain strategic milestones. These non-financial objectives were achieved in 2017 which generated a bonus payable of 50% of base salary (pro-rata) for the new CEO. For the main financial targets for 2017, trading profit in excess of budget was achieved, but less than the stretch target, and net cash flow in excess of the stretch target was achieved. The outgoing Executive Directors were entitled to the annual bonus for the achievement of the financial targets of the Company, pro-rata for their length of service during the year. The total annual bonus awarded to Alok Maskara was therefore 145% of his base salary, out of a potential 150%, pro-rata from the commencement of his employment. Further details of the bonus arrangements and the bonus paid can be found
in Single Figure, Executive Directors’ Remuneration of the Remuneration Report on page 71 and note 4 to that table.
The Committee believe they set challenging targets for the performance‑based awards to motivate the executives and align the interests of the executive, with those of shareholders. Stretch targets required exceptional performance to be achieved. The budget target set for 2017 was achieved and therefore share awards are to be made in respect of this in 2018. The targets set for 2016 were not achieved and therefore no awards were made in 2017 in respect of these. Further details are set out in the section headed
Remuneration Report, Awards Granted During the Year and the section headed Implementation of the Remuneration Policy for the Year Ending 31 December 2017 under Long Term Incentives and its associated Notes.
As part of his appointment, the Board approved the awarding of 225,000 share awards to the new Chief Executive Officer, Alok Maskara. These include a mix of time-based restricted stock units and performance-based restricted stock units. The time-based awards vest in equal tranches across three and four year periods and the performance-based awards would vest on the achievement of various earnings per share targets being met. Alok Maskara must achieve a shareholding in the Company equivalent to one hundred and fifty percent of his initial base salary within a three year period from the date of appointment to the Company, and the availability of these awards help facilitate this opportunity and in targeting the achievement of certain performance metrics. These awards were made in accordance with the ‘Approach to Recruitment Remuneration- Executive Directors’ section of the existing Policy. A summary of the Executive Directors’ outstanding share awards during 2017 can be found under the section headed
Outstanding Share Awards During 2017 on page 77 of the Remuneration Report.
Decisions affecting 2018
The Committee reviewed the Executive Director's salary at its January 2018 meeting in accordance with the Policy. It was recognized that Alok Maskara had made a strong start in his role as Chief Executive Officer and had helped deliver the 2017 budget and the achievement of the Company’s non-financial objectives. On this basis, the Committee proposed and the Board agreed to increase his salary by 2.5% effective January 1, 2018. The new salary is still at or below the external benchmark as reported by our independent advisory consultants.
The Committee has also determined the Executive Director’s variable remuneration arrangements for 2018, with the maximum cash bonus award available increasing to 200% of base salary and the maximum share award available increasing to 220% of base salary. The focus very much remains on improving trading profit and net cash flow. A series of non-financial bonus targets have also been approved by the Board for 2018. A summary of
68
the Executive Director's salary and incentive arrangements for the financial year 2018 can be found under the section headed
Implementation of the Remuneration Policy for the Year Ending 31 December 2018 on pages 90 to 91 of the Remuneration Report.
The Committee has also reviewed the compensation of the Non-Executive Directors. As part of the proposed Board approved Remuneration Policy each Non-Executive Director, at their discretion, can forgo the proposed 2.5% increase in base fee, effective January 1, 2018, in lieu of equivalent value of share awards, valued at up to 55% of annual base fee, at the date of award. Pending shareholder approval, all Non-Executive Directors have elected to receive additional share awards in the Company and forgo the annual increase to their base fee in 2018.
The Committee looks forward to gaining your support for the updated Remuneration Policy and the Annual Remuneration Report at the 2018 AGM.
B G Kushner
CHAIRMAN OF THE REMUNERATION COMMITTEE
March 19, 2018
69
Remuneration Report
2017 Remuneration Report
(subject to advisory vote by the shareholders at the 2018 AGM)
This report has been compiled in accordance with the U.K. ‘
The Large and Medium‑sized Companies and Groups (Accounts and Reports) (Amendments) Regulations 2013’.
As required by the Regulations, the report will be proposed for an advisory vote at the 2018 AGM.
The approved Remuneration Policy can be found on the Company’s website at www.luxfer.com/governance/.
The Remuneration Committee, its Activities and Responsibilities
The members of the Committee during the year are set out below.
|
Members of Committee during 2017
|
|
Meetings
attended
|
|||
|
Joseph Bonn
|
Member throughout entire year and Chairman (Chair) until and including November 23, 2017
|
8
|
|||
|
Brian Kushner
|
Member and Chairman (Chair) from November 24, 2017
|
8
|
|||
|
Adam Cohn
|
Member
|
8
|
|||
|
Kevin Flannery
|
Member until and including May 23, 2017
|
1
|
|||
|
David Landless
|
Member until and including November 23, 2017
|
6
|
|||
|
Total number of meetings in 2017
|
|
8
|
|||
The Company Secretary acts as secretary to the Committee. The Chief Executive Officer normally attends all the meetings, at least in part.
The Committee is responsible for determining and agreeing with the Board the framework on executive remuneration and its costs.
The Committee’s written Terms of Reference can be accessed in the Governance section of the Company’s website www.luxfer.com/governance/.
During 2017, the Committee dealt with some of the following matters:
|
January 2017
|
•
Consideration as to whether, and to what extent, the Executive Directors' bonus targets for 2016 had been met;
•
Determination of the Executive Directors' annual bonus targets for 2017;
•
Annual review of the Executive Directors' and Company Secretary salaries;
•
Setting of goals to be met by the Executive Directors and Senior Managers which if met would lead to time‑based share awards in 2018;
•
Delegation of authority to Chief Executive Officer to make awards under the LTiP over a defined number of shares to junior and middle management in his sole discretion;
•
Consideration of accelerating of vesting of LTiP awards and extension of exercise periods for IPO and LTiP awards held by impending retirees.
|
||
|
|
|
||
|
March 2017 (two meetings)
|
•
Review of 2016 Remuneration Report for subsequent approval by the Board;
•
Review of Revised Remuneration Policy for subsequent approval by the Board;
•
Review and approve remuneration package for new Managing Director at MEL Chemicals;
•
Review of Awards under the LTiP made to junior and middle management.
|
||
|
April 2017
|
•
Consideration of the remuneration package for the new Chief Executive Officer.
|
||
|
May 2017
|
•
Review the final remuneration package and contract of the new Chief Executive Officer prior to main Board approval.
|
||
|
October, November, December 2017
|
•
Consider a benchmarking study prepared by external consultants on Senior Executive Compensation. Review recommendations and formulate proposed framework.
•
Change in Remuneration Committee Chairman.
•
Consideration of changes to be made for newly proposed Remuneration Policy.
|
||
70
Advisors to the Committee
The Committee has access to independent advice when it considers it requires such advice. PricewaterhouseCoopers LLP (“PwC”) HR Services provided a review of the revised Remuneration Policy, prior to it being put before Shareholders for approval at the 2017 AGM, and remuneration advice in respect of the Chief Executive Officer recruitment process. PwC were appointed as the Company’s auditor in the middle of 2015 after a competitive tender. Any work that PwC HR Services continues to provide is subject to a case‑by‑case independence review and the Company’s non‑audit service approval process. The cost of advice by PwC HR Services provided during 2017 was $8,635 (2016: $20,355). Although the Committee has not made a specific determination to the effect, they are satisfied that PwC HR Services provides independent and professional advice. PwC is a member of the Remuneration Consultants Group and is signed up to the Group’s Code of Conduct. The Company has also engaged with Meridian Compensation Partners, LLC ("Meridian") to provide advisory and benchmarking surveys with regards to its proposed Remuneration Policy. The cost of advice provided by Meridian during 2017 was $20,492.
REMUNERATION RECEIVED BY THE DIRECTORS FOR THE YEAR ENDED DECEMBER 31, 2017
(Up to and including page 81 is subject to audit unless stated otherwise)
Single Figure
The tables below set out an analysis of each Director’s total remuneration for 2017. Total remuneration reflects both the performance of the Company and the contribution made by each Director to the continued success of the Company during their period of tenure.
Executive Directors' Remuneration
Single Total Figure Table
|
U.S.$
(1)
|
Year
|
Salary
(2)
|
Taxable
Benefits
(3)
|
Annual
Bonus
(4)
|
Long-Term Incentive Awards
(5)
|
Other Share Awards
(6)
|
Pensions
Contributions
|
Total
|
|||||||||||||||||
|
Brian Purves
|
2017
|
320,168
|
|
20,017
|
|
319,145
|
|
464,366
|
|
711
|
|
80,042
|
|
1,204,449
|
|
||||||||||
|
2016
|
534,802
|
|
27,635
|
|
—
|
|
135,134
|
|
1,236
|
|
137,510
|
|
836,317
|
|
|||||||||||
|
Andrew Beaden
(7)
|
2017
|
201,952
|
|
16,358
|
|
161,045
|
|
297,272
|
|
711
|
|
50,489
|
|
727,827
|
|
||||||||||
|
2016
|
281,114
|
|
22,492
|
|
—
|
|
56,456
|
|
1,159
|
|
70,674
|
|
431,895
|
|
|||||||||||
|
Alok Maskara
|
2017
|
365,826
|
|
36,524
|
|
530,448
|
|
628,869
|
|
1,141,098
|
|
91,457
|
|
2,794,222
|
|
||||||||||
Table compiled in accordance with the U.K. 'The Large and Medium-sized Companies and Groups (Accounts and Reports) Regulations 2008', as amended by 'The Large and Medium-sized Companies and Groups (Accounts and Reports) (Amendment) Regulations 2013'.
|
(1)
|
Exchange rates
-Salary, Taxable Benefits, Awards and Pension Contributions for Brian Purves and Andy Beaden are determined and paid in GBP sterling and translated into U.S. dollars at the average exchange rate for the first nine months of the year of $1.2877:£ as used for the Consolidated Financial Statements. For consistency, the 2016 amounts remain as reported last year translated at the average exchange rate used for that full year of $1.3444:£. The Salary, Taxable Benefits, Awards and Pension Contributions of Alok Maskara are determined and paid in U.S. dollars.
|
|
(2)
|
Salaries
-Brian Purves remained on the Board of Directors of the Company up to and including September 25, 2017. His salary in 2017 reflects the amounts paid in respect of his duties and responsibilities during this period. Andrew Beaden resigned from his position as Group Finance Director and as a director Luxfer Holdings PLC with effect from October 2, 2017. Alok Maskara was appointed as a director of Luxfer Holdings PLC on May 23, 2017 and upon the retirement of Brian Purves, he was appointed CEO of Luxfer Holdings PLC with effect from July 1, 2017. During 2017, the actual GBP sterling salary amount for Brian Purves was £248,625 (2016: £397,800) and for Andrew Beaden £156,825 (2016: £209,100).
|
71
|
(3)
|
Taxable Benefits
-During the year an amount was paid to each director, pro rata to their period in office, in respect of expenses relating to car allowance, and medical and dental insurance. Taxable benefits for Brian Purves and Andrew Beaden are valued at their GBP sterling taxable value. During 2017, the actual GBP sterling amount for Brian Purves was £15,544 (2016: £20,556) and for Andrew Beaden £12,703 (2016: £16,730). All payments made to Alok Maskara in respect of these allowances were determined and paid in U.S. dollars.
|
|
(4)
|
Annual Bonus
-For the 2017 financial year, the annual bonus plan was based on the achievement of two financial performance goals, profit performance and cash performance (two of the key strategic performance indicators used by the Company to assess its development against its financial objectives during the year), measured against the annual budget. The bonus was weighted towards the achievement of the management profit target, which required a material improvement over the prior year outcome and a cash target which was equally set at a much higher level than achieved in 2016. Alok Maskara had also been set a further series of strategic project targets to achieve. These strategic project targets were achieved. In 2016, the main financial targets were not achieved and no bonus was payable. A number of the non-financial objectives were achieved during the year, however given that no bonus was generated from main financial targets, both Brian Purves and Andy Beaden thought it appropriate to waive any bonus payable in respect of the achievement of non-financial targets under the 2016 plan.
|
Summary of the annual bonus potential as a percentage of base salary of each of the Executive Directors for 2017:
|
Sliding scale between threshold, target and stretch
|
|||||||||||||||
|
|
Maximum Annual bonus (number of points available and % of salary)
|
Management Trading Profit
(3)
|
Net Cash Flow (after tax)
|
Non-
financial
objectives
|
Bonus
outcome
2017
(1)(2)
|
||||||||||
|
Number of points available
|
1,800
|
|
0 - 800
|
0 - 400
|
600
|
|
1,740
|
|
|||||||
|
Alok Maskara
|
150
|
%
|
0.0% - 66.7%
|
0.0% - 33.3%
|
50.0
|
%
|
145.0
|
%
|
|||||||
|
Number of points available
|
1,200
|
|
0 - 800
|
0 - 400
|
—
|
|
1,140
|
|
|||||||
|
Brian Purves
|
100
|
%
|
0.0% - 66.7%
|
0.0% - 33.3%
|
—
|
|
95.0
|
%
|
|||||||
|
Andrew Beaden
|
80
|
%
|
0.0% - 53.3%
|
0.0% - 26.7%
|
—
|
|
76.0
|
%
|
|||||||
|
(1)
|
In 2017 Luxfer achieved a level of trading performance which resulted in 740 points being available in respect of the Management Trading Profit Target. Net cash flow generation in 2017 resulted in all 400 points being made available for the bonus calculations. In addition to these targets, Alok Maskara achieved all his non-financial targets in 2017.
|
|
(2)
|
The level of bonus for 2017 has been calculated pro rata to the length of time in office during the year.
|
|
(3)
|
Management trading profit is defined as operating profit or loss before profit on disposal of redundant site, restructuring expense, amortization on acquired intangibles and share based compensation charges.
|
In 2017 the Company generated a trading profit of $
40.5 million
(2016: $35.3 million) and net cash flows from continuing operations of $
45.2 million
(2016: $29.2 million).
The Board has considered whether to include in this report the targets which applied to the bonus arrangements for the Executive Directors in 2017 but has determined that these amounts are commercially sensitive.
|
(5)
|
The Long Term Incentive Awards
—
the 2017 Single Figure:
|
In 2017, the Remuneration Committee targets for the year were based solely upon EPS targets as described in
Executive Director Awards Under the LTiP
on page 76. The target level was achieved in 2017 resulting in the granting of time-based awards, reduced on a pro-rated basis to the length of time served
72
as an Executive Director in 2017, in 2018 as follows:
|
Number of Awards
|
||||||||||||||
|
Possible Awards
|
Awards to be made in 2018
|
% of possible awards made in 2018
|
Value of Awards
$
(1)
|
|||||||||||
|
Alok Maskara
|
48,550
|
|
48,550
|
|
100.0
|
%
|
628,869
|
|
||||||
|
Brian Purves
|
53,780
|
|
35,850
|
|
66.7
|
%
|
464,366
|
|
||||||
|
Andrew Beaden
|
34,425
|
|
22,950
|
|
66.7
|
%
|
297,272
|
|
||||||
(1)
These awards will be granted in March 2018. The value of the awards in the above table has been estimated by using the average closing share price of the Company during the fourth quarter of 2017 ($13.63) and deducting the nominal cost value of £0.50 each share (68 cents each share at an exchange rate of $1.3512:£).
For Brian Purves and Andrew Beaden, as a result of their departure from the Board during 2017, the Remuneration Committee agreed that, in accordance with provisions in the Remuneration Policy, the above share awards will vest and be made fully available at the date of grant in 2018. For Alok Maskara, the share awards will commence vesting from the anniversary of their grant date, over the next three subsequent years.
In addition, upon appointment, Alok Maskara was awarded share options and was subsequently awarded further options upon attainment of a specified shareholding in the Company. For additional information refer to the section of this report headed
Outstanding Share Awards During 2017
on page 77.
In 2016 the Remuneration Committee set profit, cash flow and EPS targets with all three metrics being measured at threshold, target and stretch. Greater weighting was assigned to the cash flow and EPS targets. None of the targets during 2016 were achieved so no awards in 2017 based on 2016 performance were granted. On attainment of the cash flow target for 2015 being met at the threshold level, an award under the LTiP was made in 2016 to Brian Purves and Andrew Beaden.
|
(6)
|
Other Share Awards
—The awards made to Brian Purves and Andrew Beaden relate to the value ascribed to the Matching Shares awarded under the Company’s U.K. All Employee Share Investment Plan (“SIP”), as further detailed below: ‑
|
|
Monthly contribution from salary during 2017 (£)
|
No. of Partnership Shares purchased June 2017 @ average price of $11.742 each ordinary share
|
No. of Matching Shares awarded June 2017
|
Dividends shares acquired from dividend reinvestment during 2017
|
Total shares accumulated in SIP during 2017
|
||||||||||||
|
Brian Purves
|
150
|
|
95
|
|
47
|
|
33
|
|
175
|
|
||||||
|
Andrew Beaden
|
150
|
|
95
|
|
47
|
|
30
|
|
172
|
|
||||||
In May 2017 Alok Maskara was granted share options in respect of his appointment to the role of Chief Executive Officer. These time-based options were outside the terms of reference of the LTiP but granted in accordance with the provisions of the Remuneration Policy. The value of the grants appears in the Single Figure table for 2017. The number, and details of the terms, of the grants are set out in the table in
Outstanding Share Awards During 2017
and the accompanying notes, on pages 77 to 78.
|
(7)
|
Andrew Beaden resigned from his position as Group Finance Director and as a director of Luxfer Holdings PLC with effect from October 2, 2017. He received a compensation payment of $338,064 and the proportion of his outstanding awards under the LTiP were allowed to vest, as set out in the tables in
Payment to Past Directors and Payment for Loss of Office
on pages 79 to 80.
|
|
(8)
|
For details of pension arrangements see page 79.
|
73
Non-Executive Directors' Remuneration
None of the Non-Executive Directors (including the Chairman) received taxable benefits, annual bonus, long-term incentive awards (exceeding one year) or pension-related benefits during the year.
Single Total Figure Table
|
U.S.$
(1)
|
Year
|
Base Fee
(1)
|
Other Fees (Fees in the form of share awards)
(2)
|
Total
|
|||||||||
|
Joseph Bonn
|
2017
|
98,812
|
|
48,484
|
|
147,296
|
|
||||||
|
2016
|
80,702
|
|
38,704
|
|
119,406
|
|
|||||||
|
Adam Cohn
|
2017
|
79,050
|
|
69,134
|
|
148,184
|
|
||||||
|
2016
|
32,940
|
|
—
|
|
32,940
|
|
|||||||
|
Brian Kushner
|
2017
|
79,050
|
|
39,116
|
|
118,166
|
|
||||||
|
2016
|
46,116
|
|
37,246
|
|
83,362
|
|
|||||||
|
David Landless
|
2017
|
79,050
|
|
39,116
|
|
118,166
|
|
||||||
|
2016
|
79,050
|
|
38,704
|
|
117,754
|
|
|||||||
|
Clive Snowdon
|
2017
|
79,050
|
|
68,006
|
|
147,056
|
|
||||||
|
2016
|
32,940
|
|
—
|
|
32,940
|
|
|||||||
|
Kevin Flannery
|
2017
|
32,940
|
|
1,623
|
|
34,563
|
|
||||||
|
2016
|
79,050
|
|
38,704
|
|
117,754
|
|
|||||||
Table compiled in accordance with the U.K. 'The Large and Medium-sized Companies and Groups (Accounts and Reports) Regulations 2008', as amended by 'The Large and Medium-sized Companies and Groups (Accounts and Reports) (Amendment) Regulations 2013'.
|
(1)
|
Kevin Flannery did not offer himself for re-election to the Board at the 2017 AGM and consequently he ceased to be a Director of the Company with effect from May 23, 2017. His base fee in 2017 reflects the period of service as a Non-Executive Director.
|
The Chairman's fee of Joseph Bonn and the Non-Executive Directors' fees of Adam Cohn, Brian Kushner and Kevin Flannery are all determined in U.S. dollars.
The Non-Executive Directors' fees of David Landless and Clive Snowdon although determined in U.S. dollars, are paid in GBP sterling translated at the exchange rate reported in the Financial Times on the 5th of each month prior to payment. Actual payments received by David Landless and Clive Snowdon for 2017 aggregated to £61,245 (2016: £58,117) and £61,245 (2016: £25,739) respectively.
|
(2)
|
2017 Single figure:
|
The value of the Other Fees in the Single Figure table is calculated as follows:
|
•
|
An element of the fees received by the Chairman and the other Non‑Executive Directors are delivered as time‑based restricted stock units (“RSUs”). The award value is a fixed percentage of their Base Fee (50%) as provided in the Director Equity Incentive Plan (“EIP”) less the issue price per share of £0.50 translated into U.S. dollars at the exchange rate on the grant date of $1.2949:£ (65 cents). Awards were made immediately after the 2017 AGM and vest immediately before the 2018 AGM. The number of RSUs was calculated using the closing share price on the NYSE ($12.52) the day before the award was made. Additional RSUs were awarded to Adam Cohn and Clive Snowdon to reflect the period from the date of their appointment until the date of the grant of the 2017 awards. The number of awards received by each Non‑Executive Director is set out in
Awards Granted During the Year - Non‑Executive Directors Under the Director Equity Incentive Plan (EIP) on page 76
.
|
|
•
|
The RSU awards carry with them the right to receive accumulated dividends during the period of the award, in shares. The dividends are not credited until the award vests. The Other Fees amount includes the value of the dividends vested and paid on the 2016 RSU fee awards that vested immediately before the 2017 AGM. The value of the awards themselves were included in the Single Figure for 2016 as they were time‑based awards (see below). The dividend shares were valued at the closing share price on the NYSE on the date of vesting, being $12.50, less the issue price of £0.50 translated at the date of vesting at an exchange rate of $1.3016:£ (65 cents). The number of dividend shares allocated and their value were:
|
74
|
Non-Executive Director
|
Dividend shares allocated
|
Value of dividend less nominal cost of share $
|
|||||||
|
Joseph Bonn
|
137
|
|
1,623
|
|
|||||
|
Brian Kushner
|
137
|
|
1,623
|
|
|||||
|
David Landless
|
137
|
|
1,623
|
|
|||||
|
Kevin Flannery
|
137
|
|
1,623
|
|
|||||
LUXFER SHARE INCENTIVE PROGRAMS
Luxfer has a number of share incentive plans designed to align the interests of its Directors, managers and employees, with the interests of its shareholders, and to act as retention tools.
The plan under which awards are granted to the Executive Directors on an on‑going basis is the Luxfer Holdings PLC Long‑Term Umbrella Incentive Plan (“LTiP”). Awards, which are considered part of their fees, are made to the Non‑Executive Directors under the Non‑Executive Directors Equity Incentive Plan (“EIP”). The U.K. Executive Directors also participate in the Company’s All Employee Share Plan (“SIP”) open to all U.K. employees. In the U.S. the Company has established an Employee Share Purchase Plan (“ESPP”) which is open to all U.S. employees and U.S. based Executive Directors.
LTiP:
The LTiP was adopted for the I.P.O. in 2012. It is used to grant awards not only to the Executive Directors but also senior and junior managers in the Luxfer Group. A variety of different awards can be granted under the LTiP. To date, it has been used to grant time‑based nominal cost options to U.K. employees including the Executive Directors, performance‑based nominal cost options and market value options to the Executive Directors and other senior U.K. employees and time‑based and performance restricted stock units to U.S. managers and managers from other countries in which the Luxfer Group operate. The maximum value of awards under the rules of the LTiP that can be granted to the Chief Executive Officer and Other Executive Directors are defined in the Remuneration Policy.
ESOP 2007:
In 2007, prior to the 2012 I.P.O. and as part of the re‑organization the Company underwent in that year, it implemented The Luxfer Holdings Executive Share Options Plan (“ESOP 2007”). All the options made available under the 2007 Plan have been exercised. The Trustees have agreed to make available for use under the various LTiP grants the remaining shares held in the employee benefit trust (“EBT”). Further details on the EBT and the 2007 Plan can be found in
Note 31 to the Consolidated Financial Statements
.
I.P.O. Options:
As part of the I.P.O. in October 2012, stand‑alone option grants were made over shares to the Executive Directors, Non‑Executive Directors and certain other key executives seen as critical to the Company’s future success on completion of the I.P.O. All these options have fully vested and are exercisable up to October 2019, being seven years from the date of grant. No dividend shares are allocated on these awards, either before or after vesting, whilst unexercised. Both Brian Purves and Andrew Beaden have I.P.O. options. The exercise price is the I.P.O. price of $10 per share.
EIP:
Annual awards are made under the EIP to Non‑Executive Directors as part of their fees. The value of the award is 50% of the base fee of a Non‑Executive Director. These awards are made the day after the annual general meeting (“AGM”) of the Company in each year and vest the day before the following AGM. Annual awards are usually made as restricted stock units. They are paid out immediately on vesting, together with dividends which have been accumulated during the vesting period. New Non‑Executive Directors cannot participate in the annual awards until they have served six months, however, the awards they would have earned from the date of appointment are added to the next annual award provided they are re-elected at the AGM.
Copies of the LTiP, ESOP 2007, I.P.O. Options and EIP plans mentioned above are filed on the Company’s file at the SEC.
75
AWARDS GRANTED DURING THE YEAR
Executive Directors' Awards Under the LTiP
The Remuneration Committee set a scorecard of goals for 2016 to assess performance consisting of net cash flow, accretive EBITDA generated by acquisitions in the year and fully diluted EPS, which if attained at the end of 2016, would have led to the granting of nominal cost options to both Brian Purves and Andrew Beaden in 2017. None of the threshold targets for any of the goals were achieved for 2016 so no awards were earned and granted.
The Remuneration Committee set Executive Directors performance targets for 2017 based solely upon the achievement of adjusted diluted EPS to be measured at threshold, target and stretch levels. The reported EPS for 2017 resulted in the target level being achieved which will result in Alok Maskara earning 100% of the available awards. Brian Purves and Andrew Beaden will also be eligible to receive awards under the LTiP for the attainment of the EPS metric at target, earning 66.6% of the total awards available. These awards will be made pro rata to the length of time served as an Executive Director during 2017. Estimates of the value of the grants to be made based on 2017 performance are included in the Single Figure table for 2017.
The Committee believe they set challenging targets to motivate the executives and align the interests of the executives with those of shareholders. Achievement of stretch targets would require exceptional performance.
Non-Executive Directors under the Director EIP
|
Chairman or Non-Executive Director
|
Date of Grant
|
Basis of Aggregate Awards Granted
|
Share Price at Date of Grant $
|
Type of Award
|
No. of Shares Granted
|
Face Value of Award $
|
(1)
Issue Price per share & in Aggregate $
|
Vesting Date
|
% of Face Value That Vest
|
|||||||||||
|
Joseph Bonn
|
May 24, 2017
|
50% of annual fee for 2017
|
12.52
|
Restricted Stock Unit
|
3,947
|
49,416
|
$0.65 each share
|
Day before 2018 AGM
|
On vesting date 100%
|
|||||||||||
|
Adam Cohn
|
May 24, 2017
|
50% of annual fee for 2017 & from date of appointment in 2016
|
12.52
|
Restricted Stock Unit
|
5,823
|
72,904
|
$0.65 each share
|
Day before 2018 AGM
|
On vesting date 100%
|
|||||||||||
|
Brian Kushner
|
May 24, 2017
|
50% of annual fee for 2017
|
12.52
|
Restricted Stock Unit
|
3,158
|
39,538
|
$0.65 each share
|
Day before 2018 AGM
|
On vesting date 100%
|
|||||||||||
|
David Landless
|
May 24, 2017
|
50% of annual fee for 2017
|
12.52
|
Restricted Stock Unit
|
3,158
|
39,538
|
$0.65 each share
|
Day before 2018 AGM
|
On vesting date 100%
|
|||||||||||
|
Clive Snowdon
|
May 24, 2017
|
50% of annual fee for 2017 & from date of appointment in 2016
|
12.52
|
Restricted Stock Unit
|
5,728
|
71,715
|
$0.65 each share
|
Day before 2018 AGM
|
On vesting date 100%
|
|||||||||||
(1)
The issue price of £0.50 each share has been translated at the U.S. dollar Financial Times exchange rate for 25 May 2017, the date of grant, of $1.2949:£.
76
OUTSTANDING SHARE AWARDS DURING 2017
Executive and Non-Executive Directors
Awards will be granted in 2018 in respect of 2017 performance. No awards were made in 2017 in respect of 2016 performance.
|
Awards
|
Options
|
||||||||||||||||||||||||||||
|
Awards
|
Available
Jan 1,
2017
|
Granted
During
Year
|
(Lapsed) /
(Exercised)
During
Year
|
Available
Dec 31,
2017
|
Vested
Awards
Jan 1,
2017
|
Vested
Awards
During
Year
|
(Lapsed) /
(Exercised)
During
Year
|
Vested
Awards
Dec 31,
2017
|
Available
Unvested
Awards
|
||||||||||||||||||||
|
Brian Purves
|
|
|
|
|
|
|
|
|
|
|
|
|
|
|
|
|
|
|
|||||||||||
|
IPO Options
(1)
|
179,200
|
|
—
|
|
—
|
|
179,200
|
|
179,200
|
|
—
|
|
—
|
|
179,200
|
|
—
|
|
|||||||||||
|
M.V.
(2)
|
22,100
|
|
—
|
|
(22,100
|
)
|
—
|
|
22,100
|
|
—
|
|
(22,100
|
)
|
—
|
|
—
|
|
|||||||||||
|
LTiP 2016
(4)
|
13,500
|
|
—
|
|
—
|
|
13,500
|
|
—
|
|
13,500
|
|
—
|
|
13,500
|
|
—
|
|
|||||||||||
|
Totals
|
214,800
|
|
—
|
|
(22,100
|
)
|
192,700
|
|
201,300
|
|
13,500
|
|
(22,100
|
)
|
192,700
|
|
—
|
|
|||||||||||
|
Andrew Beaden
|
|
|
|
|
|
|
|
|
|
|
|
|
|
|
|
|
|
|
|||||||||||
|
IPO Options
(1)
|
69,000
|
|
—
|
|
—
|
|
69,000
|
|
69,000
|
|
—
|
|
—
|
|
69,000
|
|
—
|
|
|||||||||||
|
M.V.
(2)
|
9,100
|
|
—
|
|
(9,100
|
)
|
—
|
|
9,100
|
|
—
|
|
(9,100
|
)
|
—
|
|
—
|
|
|||||||||||
|
LTiP 2013
(3)
|
2,166
|
|
—
|
|
(2,166
|
)
|
—
|
|
2,166
|
|
—
|
|
(2,166
|
)
|
—
|
|
—
|
|
|||||||||||
|
LTiP 2016
(4)
|
5,640
|
|
—
|
|
(5,640
|
)
|
—
|
|
—
|
|
5,640
|
|
(5,640
|
)
|
—
|
|
—
|
|
|||||||||||
|
Totals
|
85,906
|
|
—
|
|
(16,906
|
)
|
69,000
|
|
80,266
|
|
5,640
|
|
(16,906
|
)
|
69,000
|
|
—
|
|
|||||||||||
|
Alok Maskara
|
|
|
|
|
|
|
|
|
|
|
|
|
|
|
|
|
|
|
|||||||||||
|
Upon Appointment
(7)
|
—
|
|
45,000
|
|
—
|
|
45,000
|
|
—
|
|
—
|
|
—
|
|
—
|
|
45,000
|
|
|||||||||||
|
Upon Appointment
(8)
|
—
|
|
60,000
|
|
—
|
|
60,000
|
|
—
|
|
—
|
|
—
|
|
—
|
|
60,000
|
|
|||||||||||
|
Upon Appointment
(9)
|
—
|
|
120,000
|
|
—
|
|
120,000
|
|
—
|
|
—
|
|
—
|
|
—
|
|
120,000
|
|
|||||||||||
|
Totals
|
—
|
|
225,000
|
|
—
|
|
225,000
|
|
—
|
|
—
|
|
—
|
|
—
|
|
225,000
|
|
|||||||||||
|
Joseph Bonn
|
|
|
|
|
|
|
|
|
|
|
|
|
|
|
|
|
|
|
|||||||||||
|
IPO Options
(1)
|
20,000
|
|
—
|
|
—
|
|
20,000
|
|
20,000
|
|
—
|
|
—
|
|
20,000
|
|
—
|
|
|||||||||||
|
EIP 2016
(5)
|
3,130
|
|
—
|
|
(3,130
|
)
|
—
|
|
—
|
|
3,130
|
|
(3,130
|
)
|
—
|
|
—
|
|
|||||||||||
|
EIP 2017
(6)
|
—
|
|
3,947
|
|
—
|
|
3,947
|
|
—
|
|
—
|
|
—
|
|
—
|
|
3,947
|
|
|||||||||||
|
Totals
|
23,130
|
|
3,947
|
|
(3,130
|
)
|
23,947
|
|
20,000
|
|
3,130
|
|
(3,130
|
)
|
20,000
|
|
3,947
|
|
|||||||||||
|
Adam Cohn
|
|
|
|
|
|
|
|
|
|
|
|
|
|
|
|
|
|
|
|||||||||||
|
EIP 2017
(6)
|
—
|
|
5,823
|
|
—
|
|
5,823
|
|
—
|
|
—
|
|
—
|
|
—
|
|
5,823
|
|
|||||||||||
|
Totals
|
—
|
|
5,823
|
|
—
|
|
5,823
|
|
—
|
|
—
|
|
—
|
|
—
|
|
5,823
|
|
|||||||||||
|
Brian Kushner
|
|
|
|
|
|
|
|
|
|
|
|
|
|
|
|
|
|
|
|||||||||||
|
EIP 2016
(5)
|
3,130
|
|
—
|
|
(3,130
|
)
|
—
|
|
—
|
|
3,130
|
|
(3,130
|
)
|
—
|
|
—
|
|
|||||||||||
|
EIP 2017
(6)
|
—
|
|
3,158
|
|
—
|
|
3,158
|
|
—
|
|
—
|
|
—
|
|
—
|
|
3,158
|
|
|||||||||||
|
Totals
|
3,130
|
|
3,158
|
|
(3,130
|
)
|
3,158
|
|
—
|
|
3,130
|
|
(3,130
|
)
|
—
|
|
3,158
|
|
|||||||||||
|
David Landless
|
|
|
|
|
|
|
|
|
|
|
|
|
|
|
|
|
|
|
|||||||||||
|
EIP 2016
(5)
|
3,130
|
|
—
|
|
(3,130
|
)
|
—
|
|
—
|
|
3,130
|
|
(3,130
|
)
|
—
|
|
—
|
|
|||||||||||
|
EIP 2017
(6)
|
—
|
|
3,158
|
|
—
|
|
3,158
|
|
—
|
|
—
|
|
—
|
|
—
|
|
3,158
|
|
|||||||||||
|
Totals
|
3,130
|
|
3,158
|
|
(3,130
|
)
|
3,158
|
|
—
|
|
3,130
|
|
(3,130
|
)
|
—
|
|
3,158
|
|
|||||||||||
|
Clive Snowdon
|
|
|
|
|
|
|
|
|
|
|
|
|
|
|
|
|
|
|
|||||||||||
|
EIP 2017
(6)
|
—
|
|
5,728
|
|
—
|
|
5,728
|
|
—
|
|
—
|
|
—
|
|
—
|
|
5,728
|
|
|||||||||||
|
Totals
|
—
|
|
5,728
|
|
—
|
|
5,728
|
|
—
|
|
—
|
|
—
|
|
—
|
|
5,728
|
|
|||||||||||
77
Key to table:
|
Award
|
Award Scheme, Type & Grant
|
Grant Date
|
Exercise Price / Nominal Cost Each Award
|
Remaining Vesting/ Settlement Dates
|
Exercise
Period
|
|||||||
|
(1)
|
I.P.O. Options
|
Oct 2, '12
|
$10.00
|
All vested
|
To October 2019
|
|||||||
|
(2)
|
Market Value
|
Jan 31, '13
|
$12.91
|
All vested
|
To Jan 30, 2018
|
|||||||
|
(3)
|
LTiP 2013—Performance-based—EPS and TSR targets
(ii)
|
Jan 31, '13
|
£0.50
(i)
|
All lapsed
|
No longer applicable
|
|||||||
|
(4)
|
|
LTiP 2016 Options—Time-based (iv)
|
|
Mar 21, '16
|
|
£0.50
(i)
|
|
Mar 21, 2017, 2018, 2019
|
|
To Mar 21, 2021
|
||
|
(5)
|
EIP 2016—Restricted Stock Units
(iii)
|
|
May 25, '16
|
|
£0.50
(i)
|
|
Day before 2017 AGM
|
|
—
|
|||
|
(6)
|
EIP 2017—Restricted Stock Units
(iii)
|
|
May 24, '17
|
|
£0.50
(i)
|
|
Day before 2018 AGM
|
|
—
|
|||
|
(7)
|
|
Upon appointment - Time-based Restricted Stock Units
(v)
|
Aug 23, '17
|
£0.50
(i)
|
Jun 13, 2018, 2019, 2020
|
To Aug 12, 2020
|
||||||
|
(8)
|
|
Upon appointment - Time-based Restricted Stock Units
(vi)
|
Aug 23, '17
|
£0.50
(i)
|
May 23, 2018, 2019, 2020, 2021
|
To Jul 22, 2021
|
||||||
|
(9)
|
|
Upon appointment - Performance-based - EPS Targets Restricted Stock Units
(vii)
|
Aug 23, '17
|
£0.50
(i)
|
Achievement of EPS targets
|
To Mar 1, 2021, 2023, 2025
|
||||||
|
(i)
|
Where the exercise price / nominal cost is indicated in GBP sterling, in so far as it is required to be translated into U.S. dollars for the purpose of the exercise / settlement, it is translated at the $:£ exchange rate reported in the Financial Times for the date of exercise / settlement.
|
|
(ii)
|
LTiP 2013: One sixth of the total awards were granted based upon the achievement of the TSR goal in 2013. All options which vested due to the achievement of this goal have now been fully exercised. The remaining targets were not achieved and therefore all other options under this award have lapsed.
|
|
(iii)
|
EIP 2016 and EIP 2017 annual awards are settled immediately on vesting, together with dividends which have been accumulated during the vesting period. The 2016 awards were settled in 2017 net of payroll taxes.
|
|
(iv)
|
LTiP 2016: Awards made on attainment of 2015 performance goals and include “holding period” and “claw back” provisions. Time-based option awards accumulate dividend shares until vesting only; shares are then added to the award when the option is exercised. In respect of both Brian Purves and Andrew Beaden, who stepped down from their roles as Chief Executive Officer and Group Finance Director respectively during the year, the Remuneration Committee agreed to the acceleration of the unvested element of their awards, which allowed them to be made fully available following their departure.
|
|
(v)
|
Upon Appointment - The Remuneration Committee determined that the new Chief Executive Officer should acquire a minimum quantity of 22,500 shares within twelve months of appointment. Upon the Chief Executive Officer acquiring the shares, the Company matched the purchase by granting an award over 45,000 nominal cost RSUs, to vest over three years.
|
|
(vi)
|
Upon Appointment - The Remuneration Committee determined to make a one-off share award to the new CEO, outside the terms of the LTiP, over 60,000 time-based nominal cost RSUs, to vest over four years.
|
|
(vii)
|
Upon Appointment - Performance-based Awards made to the new Chief Executive Officer vest upon achievement of attaining a specified adjusted diluted EPS target at each annual measurement date. Three levels of targets have been set:
|
|
•
|
The lower target must be achieved by the measurement date at the end of 2020 and will result in the vesting of 30,000 shares.
|
|
•
|
The mid-point target must be achieved by the measurement date at the end of 2022 and will result in the vesting of a further 40,000 shares.
|
|
•
|
The top target must be achieved by the measurement date at the end of 2024 and will result in the vesting of a further 50,000 shares.
|
If the targets are not achieved by the appropriate measurement date, the associated awards will lapse. For the Restricted Stock Units to vest following the achievement of the target, the Return on Capital Employed of the Company must equal or exceed 10% after tax in the calendar year for which the EPS achievement is measured. Any award grants are subject to “holding period” and “claw back” provisions. The Board has concluded that the targets set are commercially sensitive and should not be disclosed.
Kevin Flannery held options over 3,130 shares which were granted as part of the 2016 EIP awards. These vested the day before the 2017 AGM and were subsequently exercised and settled in 2017, net of payroll taxes. As he did not seek re-election as a Director at the AGM in 2017 no further awards have been made. At the end of 2017, Kevin also held 20,000 IPO $10.00 options.
78
PENSION ARRANGEMENTS
Prior to April 5, 2016, the pensions for the Executive Directors were provided partly by the defined benefit and partly by registered defined contribution arrangements and an allocation to an unfunded unapproved retirement benefit plan (“UURBS”) accrued by the Company.
Benefits provided by the Luxfer Group Pension Plan (“the Plan”) ceased to accrue on April 5, 2016, following the agreement, reached during 2015, to close the Plan to future accrual from this date. Following the closure of the Plan, the Company also decided members would cease to accrue further benefits in the UURBS. In lieu of contributions into these plans, the Company offers a salary supplement. Reflecting the cost of previous defined benefit arrangements, now withdrawn, Executive Directors are paid the equivalent of 25% of base salary, with additional funding into the U.S. funded defined contribution scheme for Alok Maskara.
Details of the payments made to the defined contribution arrangement and salary supplement during years 2017 and 2016, and the accrued pension entitlements for the Executive Directors under the defined benefit arrangement for 2016, are set forth in the tables below.
Directors' Remuneration and Benefits for the Year Ended December 31, 2017 and 2016
|
2017
|
||||||||||||||||||||||
|
Executive Directors
|
Defined
Benefit
|
Funded Defined
Contribution
(1)
|
Unfunded Defined Contribution
|
Cash
Supplement
|
Total
|
|||||||||||||||||
|
Brian Purves
|
$
|
—
|
|
$
|
—
|
|
$
|
—
|
|
$
|
80,042
|
|
$
|
80,042
|
|
|||||||
|
Andrew Beaden
|
$
|
—
|
|
$
|
9,658
|
|
$
|
—
|
|
$
|
40,831
|
|
$
|
50,489
|
|
|||||||
|
Alok Maskara
|
$
|
—
|
|
$
|
16,200
|
|
$
|
—
|
|
$
|
75,257
|
|
$
|
91,457
|
|
|||||||
|
2016
|
||||||||||||||||||||||
|
Executive Directors
|
Defined
Benefit
|
Funded Defined
Contribution
(1)
|
Unfunded Defined
Contribution
|
Cash
Supplement
|
Total
|
|||||||||||||||||
|
Brian Purves
|
$
|
—
|
|
$
|
—
|
|
$
|
37,233
|
|
$
|
100,276
|
|
$
|
137,509
|
|
|||||||
|
Andrew Beaden
|
$
|
6,536
|
|
$
|
17,702
|
|
$
|
3,809
|
|
$
|
42,627
|
|
$
|
70,674
|
|
|||||||
Exchange rate used above: $1.2877:£ for the first nine months of 2017 and $1.3444:£ for the full year 2016.
|
(1)
|
During 2017, the Funded Defined Contribution for Andrew Beaden was made through a salary sacrifice arrangement. The Funded Defined Contribution for Alok Maskara relates to amounts paid in respect of a 401K matching program.
|
Payment to Past Directors and Payment for Loss of Office
Group Finance Director, Andrew Beaden, resigned from the Board of Luxfer Holdings PLC on October 2, 2017. He was awarded a partial bonus for the period of his employment during 2017 and share awards will be granted in March 2018 based on the achievement of EPS during 2017, which are set out in the
Single Total Figure Table
on page 71, as well as compensation for the loss of office representing his salary and benefits for an eleven month period (as set forth in his service contact) and the early vesting of his outstanding long-term incentive awards under the LTiP, as agreed by the Remuneration Committee.
Andrew Beaden's Compensation Payment
|
Eleven months
|
||||||
|
Salary
|
$
|
255,167
|
|
|||
|
Holidays accrued but not taken
|
$
|
3,205
|
|
|||
|
Other benefits
|
$
|
79,692
|
|
|||
|
Total paid in cash
|
$
|
338,064
|
|
|||
79
Early Vesting of LTiP Awards
|
Awards
|
% of Shares Vested and Exercised
|
% Balance of Award Accelerated
|
Number of Options Accelerated
|
Value of shares vested $
(2)
|
|||||||||
|
LTiP 2016
(1)
|
33.3
|
|
66.7
|
%
|
3,760 award shares plus 239 dividend shares
|
55,790
|
|
||||||
|
(1)
|
All of the shares vested were exercised before the end of 2017. The value ascribed is calculated using the share price at the time of exercise, less the option cost. For further detail on the share awards, please see the table
Outstanding Share Awards During 2017
on page 77.
|
|
(2)
|
The value of the full award, calculated with reference to the share price at the time of grant, is disclosed in Single figure table under Long-Term Incentive Awards for 2016.
|
No payments to past Directors or payment for loss of office were made during 2016.
Directors' Interests in Shares in the Company
|
Number of Ordinary Shares
Held at Dec 31, 2017
|
Number of Ordinary Shares
Held at Jan 1, 2017
|
|||||||
|
Joseph Bonn
(1)
|
7,800
|
|
5,783
|
|
||||
|
Adam Cohn
(2)
|
—
|
|
—
|
|
||||
|
Brian Kushner
(3)
|
1,823
|
|
—
|
|
||||
|
David Landless
(4)
|
7,633
|
|
5,581
|
|
||||
|
Alok Maskara
(5)
|
25,712
|
|
—
|
|
||||
|
Clive Snowdon
()
|
2,000
|
|
2,000
|
|
||||
|
(1)
|
The additional 2,017 shares acquired by Joseph Bonn during the year were as the result of his 2016 “Other Fees” award of 3,130 shares vesting prior to the 2017 AGM together with accrued dividend of 137 shares. He also purchased a further 213 shares on market. The shares delivered are net of those sold to pay the option costs and tax due on the value of the awards. Further details on these awards can be found in the Notes to
Single Figure-Non‑Executive Directors’ Remuneration
on pages 74 to 75.
|
|
(2)
|
The additional 1,823 shares acquired by Brian Kushner during the year were as the result of his 2016 “Other Fees” award of 3,130 shares vesting prior to the 2017 AGM together with accrued dividend of 137 shares. The shares delivered are net of those sold to pay the option costs and tax due on the value of the awards. Further details on these awards can be found in the notes to
Single Figure-Non‑Executive Directors’ Remuneration
on pages 74 to 75.
|
|
(3)
|
The additional 2,052 shares acquired by David Landless during the year were as the result of his 2016 “Other Fees” awards of 3,130 shares vesting prior to the 2017 AGM together with accrued dividend of 137 shares. The shares delivered are net of those sold to pay the option costs and tax due on the value of the awards. Additional shares were also acquired in the year through the operation of a Dividend Reinvestment Plan (DRIP) which allows the reinvestment of cash dividends to purchase additional shares. Further details of his awards can be found in Notes to
Single Figure-Non‑Executive Directors’ Remuneration
on pages 74 to 75.
|
|
(4)
|
The shares held by Alok Maskara were all purchased on market in the period following his appointment as an Executive Director.
|
|
(5)
|
The shares identified as held by Clive Snowdon are held by a connected person.
|
Executive Director Shareholding Requirements Upon Appointment
Upon appointment, an Executive Director is required to hold and maintain ordinary shares equal in value to 150% of base salary. The Director is allowed a period of three years from date of appointment to acquire the holding. Executive Directors are required to obtain the Chairman’s permission before they or their connected persons can deal in the Company’s shares providing an effective way of ensuring their shareholding requirements are maintained.
80
Total Directors' Shareholdings and Interests at 31 December 2017
|
Shares Owned
Beneficially
|
Options Vested but not Exercised
(1)
|
Restricted Stock Units Not Yet Vested (assuming will be settled in Shares not Cash)
(1)
|
|||||||||
|
Alok Maskara
|
25,712
|
|
—
|
|
225,000
|
|
|||||
|
Non-Executive
|
|
|
|
|
|
|
|||||
|
Joseph Bonn
|
7,800
|
|
20,000
|
|
3,947
|
|
|||||
|
Adam Cohn
|
—
|
|
—
|
|
5,823
|
|
|||||
|
Brian Kushner
|
1,823
|
|
—
|
|
3,158
|
|
|||||
|
David Landless
|
7,633
|
|
—
|
|
3,158
|
|
|||||
|
Clive Snowdon
|
2,000
|
|
—
|
|
5,728
|
|
|||||
|
(1)
|
A breakdown of the vested and unvested awards and brief details of the plans under which the awards were made can be found in
Outstanding Share Awards During 2017
table on page 77 of this report.
|
Performance Graph (unaudited)
U.K. legislation requires the Annual Remuneration Report to contain a line graph that shows the total shareholder return (TSR) over a ten year period for both a holding of the Company’s listed shares and a hypothetical comparator holding of shares representing a specified broad equity market index. As the Company was only listed on the NYSE at the beginning of October 2012, we are only able to provide TSR for the Company’s shares in a listed environment for a period 3 October 2012 to 31 December 2017. We have used the S&P SmallCap 600 (Industrial) index as the most appropriate to where we are placed as a small cap company in the U.S. and the industrials sub‑sector includes most of our comparable companies. The graph shows the value of $100 vested in Luxfer in October 2012 at the I.P.O., compared to $100 invested in the S&P SmallCap 600 (Industrial) on the same date. The S&P SmallCap 600 (Industrial) was chosen as the index as it comprises companies that most closely resemble Luxfer. The TSR is calculated in U.S. dollars.

81
History of Total Remuneration Figure for Chief Executive Officer
We have included the total remuneration figure for the Chief Executive Officer for a seven year period as required by legislation despite the TSR graph only reflecting the TSR from the date of the I.P.O.
|
U.S.$
|
2011
|
2012
|
2013
|
2014
|
2015
|
2016
|
2017
(1)
|
||||||||||||||||
|
Year ended December 31
|
|||||||||||||||||||||||
|
Total remuneration
|
998,638
|
|
1,050,878
|
|
985,076
|
|
853,320
|
|
1,021,357
|
|
836,317
|
|
3,396,615
|
|
|||||||||
|
Annual bonus %
(2)
|
100
|
%
|
71
|
%
|
—
|
%
|
—
|
%
|
39
|
%
|
—
|
%
|
124
|
%
|
|||||||||
|
Share awards vesting %
(2)
|
N/A
|
|
100
|
%
|
59
|
%
|
59
|
%
|
21
|
%
|
—
|
%
|
37
|
%
|
|||||||||
|
(1)
|
The 2017 figures include Brian Purves' remuneration for the first six months of 2017 and Alok Maskara's remuneration for the second six months of 2017.
|
|
(2)
|
Percentage of salary.
|
Relative Importance of Spend on Pay
The following chart sets out the Group's actual spend on pay (for all employees) relative to dividends paid in the current and prior year.
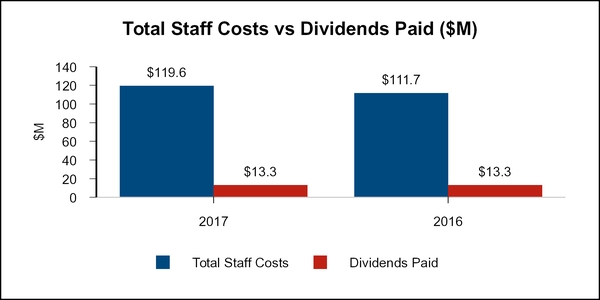
(To assist with conformity and transparency we have used staff costs as set out in Note 6 to the Consolidated Financial Statements.)
Percentage Change in Chief Executive Officer's Remuneration
For 2017, we have selected U.S. employees as the most appropriate comparator as the Chief Executive Officer is based in the U.S. and the benefits structure is similar. The comparative information for 2016 is based on U.K. employees as during 2016 the Chief Executive Officer was based in the U.K. The 2016 amounts were adjusted for the impact of translation and have been calculated using the 2017 average exchange rate of $1.3018:£.
|
U.S.$
|
2017
|
2016
|
% change
|
||||||||
|
Salary
|
|
|
|
|
|
|
|||||
|
Chief Executive Officer
|
557,744
|
|
534,802
|
|
4.3
|
%
|
|||||
|
Employee average
|
65,953
|
|
42,535
|
|
55.1
|
%
|
|||||
|
Benefits
|
|
|
|
|
|
|
|||||
|
Chief Executive Officer
|
44,980
|
|
27,635
|
|
62.8
|
%
|
|||||
|
Employee average
|
635
|
|
639
|
|
(0.6
|
)%
|
|||||
|
Annual Bonus
|
|
|
|
|
|
|
|||||
|
Chief Executive Officer
|
690,316
|
|
—
|
|
n/a
|
|
|||||
|
Employee average
|
3,742
|
|
1,176
|
|
218.2
|
%
|
|||||
82
Statement of voting at AGM
The Annual Remuneration Implementation Report and an updated Remuneration Policy was put to an advisory vote at the 2017 AGM.
|
Votes for (and
percentage of
votes cast)
|
Votes against (and
percentage of
votes cast)
|
Proportion of
share capital
voting
|
Shares on which votes were withheld
|
|||||||||||
|
Annual Remuneration Implementation Report
|
16,654,955
|
|
2,609,852
|
|
72.50
|
%
|
5,231
|
|
||||||
|
86.45
|
%
|
13.55
|
%
|
|
|
|
|
|||||||
|
Adoption of Revised Remuneraion Policy
|
16,703,150
|
|
2,556,852
|
|
72.50
|
%
|
10,036
|
|
||||||
|
86.72
|
%
|
13.28
|
%
|
|||||||||||
The vote received in favor of the Remuneration Report was 86.45%, and the larger shareholders with whom the Directors liaise with from time to time did not make any negative comments in those conversations concerning Directors’ pay and incentives. As referred to in the Chairman's letter at the beginning of the Remuneration Report, an updated Remuneration Policy will be presented at the 2018 AGM for shareholder approval.
Remuneration Policy Report
The Remuneration Committee presents the proposed Executive Directors’ Remuneration Policy Report for 2018. This policy will take effect immediately, following approval at the 2018 annual general meeting and will apply until a further policy is approved by an ordinary resolution of the shareholders. The Committee believes that this Policy continues in being competitive for current and successor Executive Directors.
The Committee has determined that to maintain top performance levels in the Company they should be targeting at least median level remuneration packages for the Chief Executive Officer, other Executive Directors and Senior Management. However, the Committee recognizes that this will be achieved by adjusting remuneration packages over a number of years. The Committee has agreed that a competitive benchmarking study will be commissioned every three years in order to maintain independent guidance on the overall remuneration of the Chief Executive Officer, other Executive Directors and Senior Management.
Under the Remuneration Policy, the Committee has discretion in a number of areas as set out in the relevant section of the policy. In addition, certain operational and administrative discretions may be exercised under relevant standalone deeds of grant or plan rules, including LTiP and EIP implemented for the I.P.O., the rules of which we have previously filed with the SEC.
Proposed policy changes
The 2018 policy that is being presented to shareholders for approval has been drafted to take into account the latest findings from a recent competitive benchmarking study over the existing policy. The key changes from the 2017 policy, which are described in the chairman’s letter, can be summarized as follows:
|
•
|
The maximum annual cash bonus opportunity for the Chief Executive Officer is increased from 150% to 200% of base salary. Included within this, the Additional Percentage Bonus (APB) set at a maximum of 50% of base salary under the existing remuneration policy, attributable to the achievement of specific additional non-financial targets, will now be set at the start of each year at the discretion of the Remuneration Committee.
|
|
•
|
The maximum annual cash bonus opportunity for other Executive Directors remains unchanged at 120% of base salary. Included within this, the APB set at a maximum of 40% of base salary under the existing remuneration policy, attributable to the achievement of specific additional non-financial targets, will now be set at the start of each year at the discretion of the Remuneration Committee.
|
|
•
|
The maximum value of share incentive awards under the Company’s Long-term incentive plan (‘LTiP’) available for the achievement of certain financial targets for the Chief Executive Officer is increased from 150% to 220% of base salary and for the other Executive Directors increased from 120% to 150% of base salary.
|
|
•
|
The Non-Executive Directors, at their discretion, may choose to forgo annual or periodic increases to cash fee, in lieu of an equivalent value of share awards. Awards will continue to be made annually immediately after the annual general meeting, however, as a result, the maximum value of these awards will be
|
83
increased from 50% up to 55% of the Non-Executive Directors existing annual fee. Pending shareholder approval, for 2018, all Non-Executive Directors have elected to receive additional share awards in the Company and forgo the annual increase to their base fee.
The above proposed changes to policy will be effective immediately following the 2018 annual general meeting. The impact of these changes to the remuneration of the Executive Directors is demonstrated in the illustrative remuneration chart on page 89.
The tables below sets out the main components of the remuneration packages for the Chief Executive Officer and other Executive Directors.
|
CHIEF EXECUTIVE OFFICER AND OTHER EXECUTIVE DIRECTORS Fixed Remuneration
|
|||
|
Base salary
|
Purpose and Link to Strategy
:
To attract, retain and incentivize high caliber individuals who can deliver the company’s strategy and reward performance.
To be competitive.
|
||
|
Operation:
Reviewed annually and normally fixed for 12 months from 1 January in each year. Paid in 12 equal monthly installments.
Reviews take account of a variety of different factors including:
- The rise in the cost of living, market rates, responsibility of the position, experience and contribution of the individual, the scale of the Group’s operations, group performance and affordability, remuneration levels and increases in the rest of the Group;
- The Executive pay packages of comparable companies; Pay and practices in both the US and the UK.
|
Maximum Opportunity:
No prescribed maximum to avoid setting expectations.
The Committee retain discretion to re-adjust salaries as part of the overall package to, at or about median of the external comparator group deemed appropriate by them to maximize the Group’s objective of top quartile performance. Where it is satisfied that salaries are at or about the median of the external comparator group, annual increases will normally be limited to the increases granted to the wider workforce, but may be higher in certain circumstances such as a change in the role or an increase in the responsibilities of the role where it will increase salaries in its discretion.
|
||
|
Benefits in kind
|
Purpose and Link to Strategy
:
To aid recruitment and retention of high caliber individuals and to remain competitive in the market.
|
||
|
Operation:
Benefits received by directors will generally include car allowance or mileage reimbursement, medical and dental insurance. Additional benefits may be provided where required by legislation or to align the remuneration package with market practice where these are not significant in value.
The company may introduce new benefits that are or become prevalent in the jurisdiction in which it operates or in which the director is based.
Where an individual director is relocated benefits such as relocation expenses, travel expenses, accommodation, tax equalization; professional advice, and post-retirement medical expenses may be provided.
Benefits are reviewed annually.
|
Maximum Opportunity:
No maximum value is set but the Committee periodically monitors the overall cost of the benefits to ensure they are affordable, competitive and in line with market practice in the UK and the US.
|
||
|
Performance Metric:
None
|
Provisions for Recovery or Withholding of Payment:
None
|
||
|
Pension or 401K Contributions
|
Purpose and Link to Strategy
:
To provide funding for retirement and aid recruitment and retention of high caliber individuals.
|
||
|
Operation:
Following the closure of the defined benefits scheme to future accrual in April 2016, all Directors will have benefits provided by the registered defined contribution scheme.
For those directors whose pension planning is restricted by one or more tax allowance, an equivalent allocation or payment may be made to an unregistered alternative savings vehicle, or as a salary supplement in lieu of pension contributions.
Arrangements are reviewed annually to ensure consistency with market practice and take account of the effect of regulatory change on an individual’s benefits.
For directors based in other jurisdictions they will be offered arrangements appropriate to that jurisdiction.
|
Maximum Opportunity:
Under the Defined contribution arrangements
the Company makes an annual contribution into a personal pension plan, 401K plan or salary supplement in lieu of pension or 401K contributions up to a maximum of 25% of basic salary.
|
||
|
Performance Metric:
None
|
Provisions for Recovery or Withholding of Payment:
None
|
||
84
|
CHIEF EXECUTIVE OFFICER AND OTHER EXECUTIVE DIRECTORS Variable Remuneration
|
|||
|
Annual bonus
|
Purpose and Link to Strategy
:
To retain, motivate, incentivize high caliber individuals and promote the achievement of key financial and strategic goals and targets of the Company in the financial year to which it relates.
|
||
|
Operation:
Cash bonus for performance over the previous financial year.
Targets are set at the beginning of the financial year and normally based on achievement of a mix of financial targets (typically profit before tax and net cash flow) measured against the approved annual budget for the bonus year and usually awarded for achieving on a sliding scale between Threshold, Target, and Stretch. The Committee has retained the flexibility to determine one or more elements may be earned for attaining target and stretch or a single target.
The Remuneration Committee has flexibility to use non-financial and personal targets if deemed appropriate in addition to financial targets.
In addition the Committee has reserved discretion to offer an Additional Percentage Bonus (APB) on achievement of specific additional targets set by them at their discretion aligned with the strategic goals of the Company for that year.
The bonus for achieving threshold is at the discretion of the Committee but will normally be one quarter of the potential.
|
Maximum Opportunity:
Maximum bonus is capped (including APB) at:
- 200% of salary for the Chief Executive;
- 120% of salary for Other Executive Directors.
The APB discretionary award offered will be set at the start of each year at the discretion of the Remuneration Committee.
|
||
|
Performance Metric:
Weighting of measures and between measures for achieving financial and non-financial targets are adjusted annually and are discretionary being driven by the Company’s strategy, financial goals and requirement to maintain and improve operating efficiencies.
The APB performance metric is discretionary based on the associated strategic objective for which the APB is offered.
|
Provisions for Recovery or Withholding of Payment:
None. If the Director qualifies as a “good leaver” during the year to which the bonus relates, it is payable retrospectively pro-rata to the time in service during the calendar year.
|
||
|
Long-term incentive plan (‘LTiP’)
|
Purpose and Link to Strategy
:
Attract and retain high quality senior employees in an environment where compensation levels are based on a global market.
Align rewards for employees with returns to shareholders through personal financial investment.
Reward achievement of business targets and key strategic objectives.
|
||
|
Operation:
The type and level of award made and the criteria for vesting are considered annually to ensure they continue to support shareholder alignment and group strategy.
The LTiP provides the Remuneration Committee the discretion to grant time-based, market value or performance-based awards in the form of Options, Stock Appreciation Rights (SARs) Restricted Stock, Restricted Stock Units (RSUs) and Other stock based awards or a combination of such awards. The discretion over what type or combination of types of award to be made will be exercised by the Remuneration Committee based on what they consider to be the market norms in the UK and US and the particular circumstance in which the award is made.
Awards are made and are satisfied through the use of existing treasury shares or through the issue of new shares. Participants are required to pay at a minimum the nominal cost of the regular share.
The Committee has the discretion (which will be used as deemed appropriate to a good leaver in a particular circumstance, such as retirement of long serving employees or leaving due to sickness or disability) to:
- Accelerate vesting and exercise dates;
- Waive conditions to vesting or exercise or transferability;
- Extend exercise periods after termination of employment.
RSU’s can be settled in cash or shares or a combination of both at the discretion of the Committee. This discretion will be exercised based on what is in the best interests of the Company.
Awards may accrue dividends either under the rules of the Plan or at the discretion of the Committee, payable in cash or shares. Options and RSUs that vest accrue a dividend until vesting payable in cash or shares as determined at the discretion of the Committee.
|
Maximum Opportunity:
The LTiP maximum awards in any calendar year may not exceed:
- Chief Executive 220% of base salary;
- Other Executive Directors 150% of base salary.
The maximum amount of dividend paid will be the dividends paid on the regular share over which the awards are granted between grant and vesting.
|
||
|
Performance Metric:
Under the LTiP the Committee has the discretion to use a range of performance targets. Performance targets for performance awards will be those deemed appropriate by the Committee to support the long term strategy of the group set at the time of grant and in the best interests of the Company. For recent performance awards the Committee has used profit, cash flow, EPS and TSR in various combinations of each.
|
Provisions for Recovery or Withholding of Payment
If, during the preparation of the current year’s accounts, a material misstatement of the previous year’s accounts is discovered, a clawback of the awards granted in respect of the misstated element of the previous year’s accounts shall apply.
Leavers are treated as set out in the section of this report titled Policy on
Payment for Loss of Office.
|
||
|
All employee share incentive plans
|
Purpose and Link to Strategy
:
To encourage share ownership by all employees in the group and increase alignment with shareholders.
|
||
|
Operation:
The UK all employee share incentive plan is an HMRC approved plan, subject to prescribed limits, to provide all eligible employees (including executive directors) with a tax-efficient way of purchasing regular shares out of monthly savings over a 6 monthly accumulation period. The Company currently provides 1 matching share free for every 2 share purchased.
A tax-efficient share purchase program is offered to our US colleagues, and additional share incentive schemes may be offered where practical on a cost-efficient basis.
|
Maximum Opportunity:
Participants in the UK plan, including the executive directors, can invest up to £150 per month (£1,800 p.a.) or 10% of salary, if lower, in any tax year to purchase regular stock shares. Regular shares are purchased using the participants’ contributions at the end of each accumulation period at the lower of the price at the start of the accumulation period and the price immediately before purchase. The maximum number of shares matched is 1:1, but the matching is currently 1:2. Dividends on both purchased shares and matching shares are used to purchase additional shares.
The plan or plans implemented for other jurisdictions in which the Group operates may have maximum opportunity commensurate with the UK plan or their legislation if deemed appropriate by the Committee.
|
||
85
|
Performance Metric:
None
|
Provisions for Recovery or Withholding of Payment:
Under the UK plan, matching shares are forfeited if not held for 3 years except if the participant leaves employment as a good leaver through redundancy, retirement, disability, or TUPE transfer.
|
||
Non-Executive Directors
|
Fees
|
Purpose and Link to Strategy
:
Reflects the time commitment required for the role.
To attract and retain executive directors with the skill set and experience required by the Company.
To be in line with UK and US market practice.
|
|
|
Operation:
Fees may be paid in cash, shares or a combination of both cash and shares.
Neither the Board Chairman nor the Non-Executive Directors are paid supplemental fees for any of their committee responsibilities, however, the discretion is reserved to do so if it is deemed appropriate and in line with market practice.
The cash element of the fees is reviewed annually. Reviews take account of a variety of different factors including:
- Inflation, market rates, affordability, remuneration levels and increases in the rest of the Group;
- Pay and practices in both the US and the UK.
Non-Executive Directors may choose to forgo annual or periodic increases to their cash fee, in lieu of an equivalent value of share awards at their individual discretion.
Fees for the Non-Executive Directors and Chairman are denominated in USD.
The share based element of the fees is a non-discretionary grant of share awards in the form of options, restricted stock or restricted stock units.
Awards are made annually immediately after the Annual General Meeting (AGM) and vest the day before the following years AGM.
|
Maximum Opportunity:
There is no prescribed maximum for the cash element for the fees to avoid setting expectations. Fees are and will be increased in line with the market.
Non-Executive Directors serving for at least six months from appointment receive share based fee awards valued at up to 55% of annual fees at date of award.
|
|
Differences between Policy for Directors and Employees
There are differences in the remuneration policy for Executive Directors and the approach to remuneration of other employees which reflect differing levels of responsibility and seniority within the organization and market norms in the jurisdictions in which the employees are employed. The following are differences in the remuneration policy for Executive Directors and the approach to remuneration for other employees generally:
|
•
|
The bonus arrangements for the executives, directors and senior, middle and lower management are structured broadly on the same basis to ensure commonality of objectives but at a lower percentage level depending on the seniority of the manager in the group. There is a greater emphasis on performance-related pay for management levels, and lower levels of bonus opportunity or no bonus opportunity may apply to other employees in the group, depending on local policies;
|
|
•
|
Benefits are generally offered that meet market norms in the jurisdiction in which employees are employed and take into account the position in which they are employed;
|
|
•
|
Pension arrangements are offered where it is the market norm to offer such arrangements in the jurisdiction in which the employee is employed. Where such arrangements are in place membership is encouraged. Where local regulation permits, higher contributions may be put in place for more senior management if that is the market norm. The main pension plans that the group operates are described in Note 29 of the financial statements;
|
|
•
|
Participation in the LTiP is limited to Executive Directors and a selected number of senior officers and senior managers. At the discretion of the Committee, market value share awards or time-based share awards may be awarded to employees in recognition of outstanding performance or achievement and to encourage share ownership and retention. U.K. employees, if eligible, can participate in the U.K. SIP.
|
Approach to Recruitment Remuneration
Executive Directors
When setting a remuneration package for new Executive Directors, including internal promotions, the Committee will apply similar principles to those set out in the most recent approved remuneration policy for both short term and long term incentives depending on the experience of the new executive. The table below sets out the maximum variable pay opportunities.
86
Maximum Variable Pay Opportunities
|
Element of Remuneration
|
Approach
|
Maximum Opportunity
|
|
Base salary
|
Set in line with policy at a level appropriate to the role and experience of the new executive. This may include, if appropriate, an agreement to increase base salary over a defined period up to a pre-defined level on acquiring experience and having delivered satisfactory performance in the role, in which case the salary increases may exceed inflation or increases given to the general work force in the country in which the executive is based.
|
In line with existing policy.
|
|
Benefits
|
In line with existing policy.
|
In line with existing policy.
|
|
Pension
|
In line with existing policy.
|
In line with existing policy.
|
|
Annual Bonus
|
In line with existing policy. May be pro-rated to reflect the proportion of the year served.
|
In line with existing policy
|
|
Long-term Incentives
|
In line with existing policy.
|
In line with existing policy
|
Upon Appointment
In relation to external appointments, the Committee may consider compensating candidates in cash or shares for remuneration relinquished on leaving their former employment if they consider it to be in the best interests of the Company and the shareholders. In considering such payments, the Committee would take into consideration the amount of remuneration forgone, the nature, vesting dates and performance requirements attached to the remuneration foregone.
If a new Executive Director (either an internal or external appointment) is required to relocate, relocation payments may be offered at the Committee’s discretion if they consider it to be in the best interests of the Company and the shareholders.
In respect of internal promotions, any commitments made to the new executive before his/her promotion will continue to be honored by the Committee even if not consistent with the approved policy outlined above in terms of short term and long term incentives awarded but yet to be earned.
New Executive Directors will be required to hold shares to the value of 150% of their annual basic salary. The Chief Executive Officer will be allowed a period of three years from date of appointment to acquire this holding.
The Committee may award an incoming Executive Director up to 100% of basic salary in time-based options outside of the terms of reference of the LTiP. These options would vest in three equal tranches over the three anniversaries of award.
The Committee may award an incoming Executive Director up to three hundred percent of basic salary in performance-based options outside of the terms of reference of the LTiP. These options may be made available in tranches with different performance targets and over a period of up to seven years to allow for the delivery of strategic objectives. Shares acquired under this element must be retained for a minimum of five years from date of appointment.
Non-Executive Directors
New Non-Executive Directors will be paid fees on the same basis as the existing Non-Executive Directors. They will also participate in the Non-Executive Directors Incentive Plan under which the annual awards are non-discretionary. The form of the award can be in the form of Options, Restricted Stock, or Restricted Stock Units, given at the discretion of the Board and
based on the value of each type of award and the number of shares left in the plan. The vesting period is in the discretion of what the relevant committee of the Board believes is in the best interests of the Company.
Service Contracts
Executive Directors
The Company has entered into a service contract with the single current Executive Director that is not for a fixed term. Executive Directors have service contracts that ordinarily are terminable by twelve months’ notice by either the Company or the director, which notice can be given at any time. The Company may terminate an Executive Director’s contract without notice on the occurrence of certain events identified in their contract which would normally consist of conduct justifying summary dismissal, including gross misconduct.
87
Executive Directors’ Service Contracts
|
Director
|
Date of Current Contract
|
Notice Period
|
Remuneration Entitlement
|
|
Alok Maskara
|
May 23, 2017
|
12 months
|
Payment in lieu of notice in the event of early termination. This may include base salary benefits and pension payable for the notice period. A bonus may be paid if the period for which pay in lieu of notice is made extends past the year end subject to targets being met.
|
Executive Directors have the same employment rights as any other employee in the case of redundancy or if the termination of their employment was determined by a relevant tribunal to be unfair under English law.
In the event of a change in control, and their contract is not assumed by the acquiring entity or a materially different position is offered to Executive Directors, on termination of their contract a severance payment based on the group standard severance policy will be payable, but calculated by doubling the highest annual base salary prior to the change of control instead of using the last twelve months’ salary under their normal notice provisions.
The LTiP provisions provide that upon a change in control,
all unvested time-based awards will fully vest and become exercisable as applicable and unless determined by the Committee, shall lapse on the first anniversary of the change of control if not exercised as applicable. Under the rules of the LTiP all performance-based awards will vest pro-rata based on the performance results to the date of change and the elapsed portion of the performance period.
Service agreements for new recruits to the Board and internal promotions will be on the same basis as the current Executive Director with no fixed term and will be terminable by either party on twelve months’ notice. Executive Directors may make provision, at the discretion of the Company for pay in lieu of notice for early termination which will include base salary, benefit and pension contributions and may include payment of the annual bonus. They may also make provision for similar change of control provisions as offered to the current Executive Director if the Committee considers it is market practice or in the best interests of the Company.
Non-Executive Directors
The Company has entered into letters of appointment with the Non-Executive Directors and the Chairman that are not for a fixed term.
Non-Executive Directors’ Letters of Appointment
|
Date of Current Letter of Appointment
|
Notice Period and Entitlement to Fees
|
|
|
Joseph Bonn
|
February 28, 2007
|
3 months, except if the director fails to be re-elected at an AGM when the contract terminates immediately without notice or compensation.
|
|
David Landless
|
February 20, 2013
|
3 months, except if the director fails to be re-elected at an AGM when the contract terminates immediately without notice or compensation.
|
|
Brian Kushner
|
May 24, 2016
|
3 months, except if the director fails to be re-elected at an AGM when the contract terminates immediately without notice or compensation.
|
|
Adam Cohn
|
July 18, 2016
|
3 months, except if the director fails to be re-elected at an AGM when the contract terminates immediately without notice or compensation.
|
|
Clive Snowdon
|
July 29, 2016
|
3 months, except if the director fails to be re-elected at an AGM when the contract terminates immediately without notice or compensation.
|
The Chairman and the Non-Executive Directors do not have any employment rights. New appointees to the Board will generally be appointed on the same basis as the current Non-Executive Directors.
Directors’ service agreements and letters of appointment are available for inspection at the registered office of the Company.
Policy on Payment for Loss of Office
Contractual entitlements to the date of termination will be honored and the Company will pay any amounts it is required to pay in accordance with the directors statutory employment or contractual rights and to settle those rights. The Company will seek to apply the principles of mitigation to ensure it is not paying more than is required. In the event of a compromise or severance agreement, the Committee may make payments it considers reasonable in
88
settlement of potential legal claims. It may include in such payments reasonable incidental and professional fees paid by a director.
There is generally no entitlement to annual bonus on cessation of employment for leavers in the first half of the calendar year. Good leavers in the second half of the calendar year may, at the Committee's discretion, be retrospectively paid a time pro-rated bonus. Leavers departing after the year-end, but before completion of the audit, will be paid the actual bonus earned on the normal bonus payment date. Leavers are not eligible for bonus payments if they are in breach of any obligations of their contract of employment, including the period of notice
On termination of employment, outstanding share awards will be treated in accordance with the relevant plan rules:
LTiP
: The default treatment under the LTiP is that subject to the Committee’s discretion, after a participant ceases to be employed by the Company, for any reason other than termination for Cause, all unvested time-based awards will immediately lapse or be forfeited and all vested unexercised options and stock appreciation rights (SARs) will lapse on the first anniversary of the date of leaving. In the case of termination of the participant’s employment for Cause, all time-based awards will immediately lapse or be forfeited as at the date of termination and all unexercised options will immediately lapse or be forfeited as at the date of termination. If employment of a participant is terminated for any reason, other than for Cause, performance-based awards will vest on a pro-rated basis based on the performance results to the date of termination. In case of termination of employment for Cause, all unvested performance-based awards will lapse as of the date of termination.
IPO Options
: The default treatment under the I.P.O. standalone option grants for both Executive and Non-Executive Directors is that subject to the relevant Committees’ discretion, after a participant's termination of employment for any reason other than for Cause, the vested unexercised portion of the options will lapse on the first anniversary of the date of termination unless exercised beforehand. If a participant’s employment is terminated for Cause, all unexercised options will immediately lapse.
The definition of Cause for both the LTiP and the IPO options is as defined in the participant's service contract or, if not so defined, would be conduct that would constitute grounds for summary dismissal.
The Committee has the discretion to accelerate vesting and exercise dates, waive conditions to vesting or exercise or extend exercise periods after termination of employment. The Committee may exercise their discretion to allow accelerated vesting or extended exercise periods, which discretion it will normally exercise in such circumstances as long serving directors retiring before the last vesting date or leaving employment through ill health or redundancy. This graph seeks to demonstrate how pay varies with performance. The graph is reflective of the remuneration policy that is being presented for approval at the 2018 AGM.

89
Notes:
|
1.
|
The base salary of the Executive Directors used is the 2018 confirmed salary in
U.S. dollars for the year ending 31 December, 2018.
|
|
2.
|
The Remuneration Committee sets bonus targets early in 2018. Annual cash bonus is earned only when Company performance exceeds a threshold level. ‘On plan’ bonus is generally set to be half the potential and is paid for achievement of the annual budget. Maximum bonus is earned for hitting a stretch target considerably above the Board-approved budget, and represents exceptional performance.
|
|
3.
|
The LTiP is a combination of performance and time-based awards with targets being set by the Committee. Within each year, there is a threshold level, an 'on plan’; level, and a stretch level. Performance below the threshold would mean no performance element of the LTiP would be awarded in the following year. Hitting the plan targets would result in granting total awards at maximum value of 150% of base salary for the Chief Executive Officer and at 100% of base salary for the Other Executive Director. Each subsequent year’s target represents a material improvement on the prior-year target. Reaching stretch targets would mean that the Company had considerably out-performed the Board’s expectations, would result in a maximum granting at 220% of the value of base salary for the Chief Executive Officer and at 150% of the value of base salary for the Other Executive Director.
|
|
4.
|
The above illustration excludes remuneration in the form of taxable benefits and pension contributions.
|
Consideration of Conditions Elsewhere in the Group
While the major influence in setting the Executive Directors’ pay and benefits is benchmarking of comparable companies, consideration is given to pay and benefits throughout the Group, so that there is a clear structure of pay and benefits layer by layer. Benchmarking studies commissioned by the Committee normally include other senior executive positions. When undertaking annual reviews of basic salary, the general level of cost-of-living increases throughout the Group is taken into account.
The Committee does not consult with employees when drawing up the Directors’ Remuneration Policy. No internal comparison metrics were used, but the Committee is aware of average pay and benefits packages within the Group.
Shareholders’ Views
The Committee take into consideration the views expressed by institutional shareholder bodies when formulating the terms of the awards to Executive Directors.
Implementation of the Remuneration Policy for the Year Ending December 31, 2018
The proposed Directors’ Remuneration Policy is subject to a binding shareholder vote at the 2018 AGM. If approved, the Policy will take effect immediately and will continue to apply, unless the Company seeks shareholder approval for changes to the Policy in the meantime. If shareholders do not vote to approve the proposed new Policy then the current Policy will continue to apply.
Set out below is a summary of how the proposed Directors’ Remuneration Policy will be applied during the year ending 31 December 2018.
Base Salary
|
2018
|
2017
|
||||||||||
|
$
|
$
|
% increase
(2)
|
|||||||||
|
Alok Maskara
(1)
|
615,000
|
|
365,826
|
|
2.5
|
%
|
|||||
|
(1)
|
The 2017 salary of Alok Maskara is for part year only, calculated from his date of appointment. The annualized salary for 2017 is $600,000 per annum.
|
|
(2)
|
The increase in base salaries in 2018 over 2017 was approved by the Remuneration Committee.
|
Pension Arrangements
The Executive Director will receive a cash supplement calculated at a flat rate of 25% of base salary.
Annual Bonus
In accordance with the proposed Policy, the maximum annual bonus for Alok Maskara, as Chief Executive Officer, will be capped at 200% of base salary. Included within this is the Additional Percentage Bonus to be awarded on achievement of specific targets set by the Remuneration Committee. At the start of each year, the
90
Remuneration Committee reserve the discretion to set the Additional Percentage Bonus and related specific targets that are aligned with the strategic goals of the Company.
As in previous years, the financial performance target element of the annual bonus will be based on a combination of two financial performance metrics, management EBITA (previously referred to as management trading profit) and the ratio of management EBITA to pre-interest cash flow conversion “Cash Conversion” (previously net cash flow after tax was used as the second performance target). It will be on a sliding scale that commences only once threshold has been achieved and rises through the target performance up to a stretch target. For management EBITA; threshold approximates to exceeding prior-year; target is the annual EBITA budget and stretch is exceeding the annual EBITA budget by at least a 10%. The financial performance award element of the annual bonus opportunity will be split evenly between the above two financial metrics:
|
Split; sliding scale between threshold,
target and stretch
|
|||||||
|
Financial metric annual bonus opportunity
|
Management EBITA
|
Cash Conversion
|
|||||
|
Alok Maskara
|
0% - 50%
|
0% - 50%
|
|||||
Long Term Incentives
The Remuneration Committee has then set targets for 2018 which, if attained, would lead to the granting of nominal cost options for Alok Maskara in 2019. The Committee has set a scorecard of metrics to assess the performance of the Company based upon Total Shareholder Return (“TSR”) and a Group adjusted EPS. A greater weighting has been assigned to the attainment of the TSR target which earns 60% of the performance awards available, compared to the EPS target which has a 40% weighting.
The Remuneration Committee is also proposing that Alok Maskara be granted time-based nominal cost options, which vest in equal tranches commencing on the first anniversary of the grant date at the value of 40% of the total target share award available.
The options to be granted in 2019 based on the achievement of 2018 performance will be time-based nominal cost options which vest in equal tranches, commencing on the first anniversary of the grant date. The grants will incorporate “claw back” provisions in the event of a material misstatement in the consolidated financial statements on which the basis of the grant was made. The shares acquired from the granting of the awards to Alok Maskara must be held for a minimum of three years from the date of grant whether vested or not, effectively four years from the setting of the targets (other than to fund the exercise price and tax liabilities on a vesting or exercise).
The maximum value of awards that can be granted in accordance with the proposed Policy is up to 220% of base salary for the Chief Executive Officer.
Non-Executive Directors
Summary of how the Directors' Remuneration Policy for the Non-Executive Directors will be applied during the year ending December 31, 2018.
The Board decides the approach to compensating the Non‑Executive Directors. As part of the proposed Board approved Remuneration Policy each Non-Executive Director, at their discretion, can forgo the proposed 2.5% increase in base fee, effective 1 January 2018, in lieu of equivalent value of share awards, valued at up to 55% of their annual base fee, at the date of award.
|
2018
|
2017
|
%
|
Value of Share
|
Value of Share
|
|||||||||||
|
$
|
$
|
Increase
|
Awards % of Base Fee
|
Awards % of Base Fee
|
|||||||||||
|
Base Fee
|
Base Fee
|
Base Fee
|
2018
|
2017
|
|||||||||||
|
Joseph Bonn
(1)
|
98,812-101,282
|
98,812
|
|
2.5
|
%
|
50% - 55%
|
50
|
%
|
|||||||
|
Adam Cohn
|
79,050-81,026
|
79,050
|
|
2.5
|
%
|
50% - 55%
|
50
|
%
|
|||||||
|
Brian Kushner
|
79,050-81,026
|
79,050
|
|
2.5
|
%
|
50% - 55%
|
50
|
%
|
|||||||
|
David Landless
|
79,050-81,026
|
79,050
|
|
2.5
|
%
|
50% - 55%
|
50
|
%
|
|||||||
|
Clive Snowdon
|
79,050-81,026
|
79,050
|
|
2.5
|
%
|
50% - 55%
|
50
|
%
|
|||||||
91
|
(1)
|
Base fee increase reflects additional supplement for Chairman Fees.
|
Pending shareholder approval, for 2018, all Non-Executive Directors have elected to receive additional share awards in the Company and forgo the annual increase to their base fee.
Approval of Report
Brian Kushner, the Chairman of the Committee, will attend the forthcoming AGM and will be available to answer any questions shareholders may have concerning the Directors' remuneration. This Remuneration Report will be submitted for approval by an advisory vote at the forthcoming AGM.
Signed on behalf of the Board by:
B G Kushner
CHAIRMAN OF THE RUMENERATION COMMITTEE
March 19, 2018
For and on behalf of the Board
92
C. Board Practices
Corporate Governance
In this section we explain our corporate governance and what informs and influences our corporate governance practices.
Overview of Corporate Governance
The Company is incorporated in England and Wales and has a single listing of ordinary shares on the NYSE. Accordingly, our corporate governance is informed by the relevant aspects of two regulatory regimes, the U.K. and the U.S.
As a company incorporated in England and Wales, our corporate governance practices primarily are governed by our articles of association (our "Articles") and the Companies Act 2006 (the "Companies Act"). For example, as a company listed on the NYSE we are a "quoted company" for the purposes of the Companies Act and therefore required to comply with its "quoted company" requirements. Significant aspects of these requirements include the production of a yearly report on Directors' remuneration, details of which are prescribed by English corporate law, an annual advisory shareholder vote on whether to approve such remuneration and a binding shareholder vote every three years on our remuneration policy with respect to the Directors. These requirements in turn influence aspects of how we report remuneration.
As we are not, however, listed on the London Stock Exchange, the Company is not required to comply with the U.K. Corporate Governance Code (the "Code"). Nevertheless, we choose to follow aspects of the Code, insofar as it is appropriate, relevant and practical to a company of the size and status of the Company.
In 2017 (as in 2016), we were a foreign private issuer (an "FPI") as defined in the SEC's rules and regulations, and consequently, in many aspects of corporate governance we rely on a provision in the NYSE's Listed Company Manual ("NYSE's Manual") that permits us to follow home-country practice in lieu of certain NYSE corporate governance requirements. For example, although each member of our Audit Committee must be independent within the meaning of Rule 10A-3 under the Securities Exchange Act of 1934, as amended (the "Exchange Act"), each such member does not need to satisfy the requirements for independence set out in Section 303A.02 of the NYSE's Manual. Our Nominating and Governance Committee and Remuneration Committee each consist entirely of Non-Executive Directors; however, each such Non-Executive Director is not required to satisfy the requirements for independence set out in Section 303A.02 of the NYSE's Manual. As an FPI we are not subject to all of the disclosure requirements applicable to companies organized within the U.S. that relate to corporate governance. For example, we are exempt from certain rules under the Exchange Act that regulate disclosure obligations and procedural requirements related to the solicitation of proxies, consents or authorizations applicable to a security registered under the Exchange Act.
However, because our shares are listed on the NYSE, we are required to comply with certain U.S. law requirements, including certain provisions of the Sarbanes-Oxley Act that affect our corporate governance. For example, Section 404(a) requires our management to identify in our Annual Report on Form 20-F a framework used by management to evaluate the effectiveness of our internal controls over financial reporting. Such evaluation must be based on a suitable, recognized control framework that is established by a body or group that has followed due-process procedures, such as the framework established in "Internal Control—Integrated Framework (2013)" issued by the Committee of Sponsoring Organizations of the Treadway Commission (the "2013 COSO framework"). We are required to and have updated our framework for the evaluation of the effectiveness of our internal control over financial reporting in accordance with the 2013 COSO framework.
In developing corporate governance practices for the Group, the Directors have taken note of all of these different regulatory requirements, as well as reflecting best practice as the Directors consider appropriate.
Board Members
During 2017, the Board comprised a Non-Executive Chairman, between four and five Non-Executive Directors and between one and three Executive Directors. The maximum number of Directors permitted under the Articles is eight. All Directors have an interest in the shares of the Company as set out in the Remuneration Report on pages 70 to 92.
Our Articles contain a provision requiring a third of the Directors to retire by rotation each year. In line with best practice, the Nominating Committee has proposed and the Board has agreed that all directors should offer themselves for re-election at the 2018 annual general meeting ("AGM").
Brief biographical details of the Directors who served during 2017 are provided in Item 6.A, together with information on their Committee and other commitments.
93
Roles
The Board
The Board has responsibility for the overall leadership of the Company, its long-term success and helping to develop and approve its strategic aims. The Directors have determined a schedule of matters reserved to the Board. Reserved matters are comprehensive and reviewed as the Board considers appropriate, normally annually. A review was undertaken during the year, following a comprehensive review in 2013 in the context of a newly listed company. The Directors determined no further amendments were necessary. Matters reserved to the Board are set out in the Governance section of the Company's website.
Executive Leadership Team
The Executive Leadership Team (previously Executive Management Board) meets at least four times a year in person, and hold a weekly conference call which are chaired by the Chief Executive Officer. The Executive Leadership Team consists of the Chief Financial Officer and senior management at group and divisional levels. The members of the Executive Leadership Team during 2017 are listed on page 64. The Executive Leadership Team acts in an advisory capacity to the Chief Executive Officer and provides a forum where matters of interest or concern to the Group can be reviewed and discussed, strategy debated, policies developed and agreed, best practice discussed and appropriate measures implemented. It also provides an opportunity for senior management to receive updates on progress in other areas of the Group outside their remit.
Division of Responsibilities
Due to the size of the Board, the Directors have determined it is not necessary to appoint a senior independent Director.
The division of responsibilities between the Chief Executive Officer and the Chairman is clear and it has not been considered necessary to record it in writing.
|
•
|
The Chief Executive Officer is responsible to the Board for the management and performance of the business within the framework of the matters reserved to the Board and for developing strategy and then implementing the strategy he has agreed with the Board; and
|
|
•
|
The Chairman is responsible for the leadership of the Board and ensuring its effectiveness. He ensures that Board discussions are conducted taking into account all views, promoting openness and debate by facilitating the effective contribution of the Non-Executive Directors and ensuring no individual or group dominates the Board.
|
The Chairman maintains a dialogue with the Non-Executive Directors in the absence of the Executive Directors, and where appropriate, canvasses their opinion on issues and meets with them in the absence of the Executive Directors on a regular basis.
The Nominating Committee annually reviews succession planning for senior appointments in the Group and to the Board, with recommendations made to the Board.
Meetings
There are normally five main scheduled meetings of the Board each year and additional scheduled telephone meetings timed to approve the release of financial information. Additional meetings are called as appropriate. The Board will normally meet at least twice a year at one of the Group's operational plants, including overseas locations, as part of their monitoring role and to ensure a better understanding of the Group's operations. At these meetings the Board tours the plant and has an opportunity to meet local and divisional management on both a formal and an informal basis and discuss the progress of their operations with them.
94
Attendance at Board and Committee Meetings during 2017
|
Main Board
|
Telephone Board
|
Total Board
|
Audit Committee
|
Remuneration
Committee
|
Nominating and Governance
Committee
|
||||||||
|
Joseph Bonn
|
6
|
3
|
9
|
-
i
|
8
|
2
|
|||||||
|
Andrew Beaden
|
4
|
3
|
7
|
Non-member
ii
|
Non-member
|
Non-member
|
|||||||
|
Adam Cohn
|
6
|
1
|
7
|
Non-member
|
8
|
1
vi
|
|||||||
|
Kevin Flannery
|
1
|
—
|
1
|
-
i
|
1
|
-
iii
|
|||||||
|
Brian Kushner
|
6
|
1
|
7
|
8
|
8
|
-
i
|
|||||||
|
David Landless
|
6
|
3
|
9
|
8
|
6
iv
|
1
v
|
|||||||
|
Alok Maskara
|
4
|
1
|
5
|
Non-member
ii
|
Non-member
ii
|
Non-member
ii
|
|||||||
|
Brian Purves
|
4
|
3
|
7
|
Non-member
ii
|
Non-member
ii
|
Non-member
ii
|
|||||||
|
Clive Snowdon
|
6
|
3
|
9
|
8
|
-
i
|
2
|
|||||||
|
Total number of meetings
|
6
|
3
|
9
|
8
|
8
|
2
|
|||||||
|
No. of meetings held at operational sites in the U.K. or U.S.
|
1
|
—
|
1
|
||||||||||
i
The director was a member of the Committee until and including January 30, 2017. During his period of membership in 2017, no meetings were held.
ii
Although not a member of the Committee the director attended the meeting to present to the Committee.
iii
The director was a member of the Committee from January 31, 2017 until May 23, 2017. During his period of membership in 2017, no meetings were held.
iv
The director was a member of the Committee until and including November 23, 2017.
v
The director was a member of the Committee until and including January 30, 2017 and then from December 5, 2017.
vi
The director was a member of the Committee from January 31, 2017.
See Item 6.A, as to when certain members of the Board and Committee members retired or resigned.
Information and Support
The Company Secretary normally distributes Board and Committee agendas and materials to the Board and Committees seven days before a scheduled meeting.
There is a written procedure for decisions to be taken between scheduled Board and Committee meetings that also deals with information distribution in such cases.
The Board receives both financial and operational information to assist it in discharging its duties. The Chief Executive Officer and the Chief Financial Officer provide monthly reports to the Board which together cover all aspects of the business and which are then elaborated or commented upon at scheduled Board Meetings as appropriate. Additional topics for review and discussion are added in these reports from time to time at the request of the Directors. In addition, specific items are scheduled into the Board agenda for report and review on a regular basis, such as health and safety and environmental matters and current topical issues.
There is a written procedure in place to cover circumstances when the Directors either individually or collectively determine that they require independent professional advice at the Company's expense.
The General Counsel updates the Board on issues and changes of a legal and regulatory nature of which it and the individual Directors should be aware to refresh their skills and knowledge. There is a culture of information exchange on various matters of interest to the Group and its operations between Directors and senior managers to keep Directors abreast of relevant developments. In addition to meetings held at sites as described above, the Non-Executive Directors may independently visit operational sites to enlarge their knowledge of the individual businesses that make up the Group. The Executive Directors have regular business reviews at operational sites throughout the year and any appropriate information gathered on those visits will be reported to the Board.
Newly appointed directors undergo an induction program.
The Board evaluates its information and support procedures periodically to ensure they remain appropriate.
95
Audit Committee
The members of our Audit Committee during the year were:
|
Meetings attended
|
||||
|
David Landless
|
Member and Chairman (Chair)
|
8
|
||
|
Joseph Bonn
|
Member until and including January 30, 2017
|
-
i
|
||
|
Kevin Flannery
|
Member until and including January 30, 2017
|
-
i
|
||
|
Brian Kushner
|
Member
|
8
|
||
|
Clive Snowdon
|
Member
|
8
|
||
i
The director was a member of the Committee until and including January 30, 2017. During his period of membership in 2017, no meetings were held.
The Company Secretary acts as secretary to the Audit Committee. The Chief Financial Officer and the Chief Executive Officer attend as required. The Company's external auditor is invited to attend most meetings of the Committee.
The responsibility and duties of the Audit Committee are set out in written terms of reference which appear on the Company's website under the Governance section. The terms of reference were reviewed during the year. The Committee has the responsibility of overseeing corporate accounting and financial reporting in the Group.
Its duties include:
|
•
|
External Auditors:
Engagement and retention of our independent auditors, pre-approval of audit and non-audit services, approving fees paid, monitoring independence and performance, discussing audit findings with auditors;
|
|
•
|
Financial Reporting:
Monitoring the integrity of the financial information to be included in all consolidated financial statements and announcements, reviewing and challenging critical accounting policies, the manner in which major elements of judgment are reflected in the consolidated financial statements, disclosures, significant adjustments and compliance with standards;
|
|
•
|
Internal Controls and Risk Management System:
Reviewing systems of internal control and risk management and adequacy of disclosure controls and procedures. Maintaining a record of complaints regarding accounting and audit matters;
|
|
•
|
Whistleblowing:
Establishment and monitoring of the Group whistleblowing policy and procedures; and
|
|
•
|
Oversight of the Code of Ethics
.
|
The Board considers that all the members have appropriate financial experience to enable them to contribute to the Audit Committee's work. The Board also considers that each member of the Audit Committee satisfies the requirements for independence set out in Section 303A.02 of the NYSE rules and Rules 10A-3 under the Exchange Act. David Landless is the 'Audit Committee Financial Expert' as defined in Item 407(d) of Regulation S-K.
Each year, normally prior to the commencement of the financial year, the Committee establishes a schedule of meetings to coincide with the key events in the Company's financial reporting and audit cycle to ensure it has sufficient time on its agendas to deal with matters for which it has responsibility. Agendas and appropriate papers are issued for each meeting. The Chairman speaks to the external auditors as he considers appropriate and necessary in preparation for meetings at which matters are discussed that have been identified by the Company's external auditors or are relevant to them.
The Audit Committee has adopted and implemented a 'Policy on the Provision of Audit and Non-Audit Services by Auditors' (the "Pre-approval Policy") to comply with auditor independence requirements contained in Rule 2-01 of Regulation S-X under the Exchange Act. The policy requires the Audit Committee to pre-approve all matters upon which the Company's external auditors are requested to advise (audit and non-audit work), including fees, subject to certain pre-approvals made annually by the Audit Committee. A pre-approved sum to be spent on audit and tax matters is delegated to the Chief Financial Officer (formerly Group Finance Director) and there is a procedure for approval of urgent items by the Chairman between meetings. The policy also affirmatively proscribes the Company's external auditors from advising on certain matters.
During the year the Audit Committee met on eight occasions and among other matters they undertook the following:
96
|
•
|
A specific review of the Company's external auditors' independence with the Company's external auditors and the Company's management, which confirmed the independence of the external auditors;
|
|
•
|
A discussion of matters pertaining to and approval of work to be undertaken by the Company's external auditors under the Pre-approval Policy;
|
|
•
|
A review with the Head of Corporate Review and senior management of the internal audit work, the system of internal control and monitored the implementation of internal controls over financial reporting pursuant to Section 404 of the Sarbanes-Oxley Act and the progress of the update to the internal control over financial reporting framework to reflect the 2013 COSO framework throughout the Group;
|
|
•
|
A review of how Group risks are assessed, the Group's risk profile and how the Group mitigates its risks;
|
|
•
|
A review of the Company's annual SEC filing, statutory report and consolidated financial statements and the quarterly financial releases made by the Company;
|
|
•
|
An evaluation of the work of the Audit Committee.
|
Remuneration Committee
Membership of the Remuneration Committee and details of its work appear in the Remuneration Report on pages 70 to 92. Its terms of reference appear under the Governance section on the Company's website.
Nominating and Governance Committee
The members of our Nominating and Governance Committee during the year were:
|
Meetings attended
|
||||
|
Joseph Bonn
|
Member throughout entire year and Chairman (Chair) until and including December 4, 2017
|
2
|
||
|
David Landless
|
Member
|
1
i
|
||
|
Kevin Flannery
|
Member until and including May 23, 2017
|
-
ii
|
||
|
Brian Kushner
|
Member until and including January 30, 2017
|
-
iii
|
||
|
Clive Snowdon
|
Member and Chairman (Chair) from December 5, 2017
|
2
|
||
|
Adam Cohn
|
Member
|
1
|
||
i
The director was a member of the Committee until and including January 30, 2017 and from December 5, 2017.
ii
The director was a member of the Committee from January 31, 2017 until May 23, 2017. During his period of membership in 2017, no meetings were held.
iii
The director was a member of the Committee until and including January 30, 2017. During his period of membership in 2017, no meetings were held.
The Company Secretary acts as secretary to the Nominating and Governance Committee. The Chief Executive Officer attends as required.
The responsibility and duties of the Nominating and Governance Committee are set out in written terms of reference which appear on the Company's website under the Governance section. The terms of reference were reviewed during the year.
Its duties include:
|
•
|
Identify and review individuals qualified to become Directors and fill vacancies;
|
|
•
|
Select and approve Directors to stand for re-election pursuant to the retirement provisions under our Articles;
|
|
•
|
To identify and review individuals qualified to become Senior Officers of the Company, (other than its Board members), consistent with criteria approved by the Board;
|
|
•
|
Develop a process for annual evaluation of the Board and its Committees;
|
|
•
|
Develop and recommend to the Board a succession plan, and review management's succession plan;
|
|
•
|
Develop and recommend to the Board a set of corporate governance principles applicable to the Company;
|
|
•
|
Annually review the Company's corporate governance processes and its governance principles;
|
|
•
|
Play a leadership role in the Company's corporate governance.
|
Its terms of reference appear under the Governance section on the Company's website.
97
Whistleblowing Arrangements
We have established policies, subject to individual legal requirements in the countries in which the Group operates, which encourage and enable employees to report in confidence any possible impropriety in either financial reporting or, where permitted in the relevant jurisdiction, other matters. An independent third party telephone line is provided for reporting matters where the individual believes they cannot report any issue through their line management. The Audit Committee oversees the operation of the whistleblowing policy and receives a report from the Company Secretary at each meeting of the Audit Committee.
Anti-Corruption Policy
We have an established policy and procedures to enable compliance with current legislation.
Relations with Shareholders
Directors seek to develop an understanding of the views of our shareholders in various ways and from time to time engage with them on a one-to-one basis, as appropriate, taking into account the need to treat shareholders equally. The Chief Executive Officer holds quarterly investor conference calls as part of the Group's reporting cycle. From time to time we consult with our major shareholders in an effort to seek feedback on various matters of corporate governance, including our Director remuneration policy. The Chief Executive Officer and the Chief Financial Officer also attend investor conferences.
AGM documentation is normally sent out at least 20 working days before the meeting. Separate resolutions are proposed and proxy votes for our ordinary shares are recorded. Results for, against and withheld are posted to the Company's website. All Directors attend the AGM. Shareholders under the Company's all employee share plans are also given the opportunity to vote through procedures agreed with the Trustee or Agent of the scheme as appropriate.
D. Employees
The average number of employees by division, function and geography for the years ended December 31,
2017
,
2016
and
2015
, were as follows:
|
|
2017
|
2016
|
2015
|
|||||||
|
By Division:
|
|
|
|
|
|
|
||||
|
Elektron
|
695
|
|
699
|
|
703
|
|
||||
|
Gas Cylinders
|
963
|
|
988
|
|
1,003
|
|
||||
|
Total
|
1,658
|
|
1,687
|
|
1,706
|
|
||||
|
By Function:
|
|
|
|
|
|
|
||||
|
Direct production and distribution
|
1,397
|
|
1,381
|
|
1,432
|
|
||||
|
Indirect:
|
|
|
|
|
|
|
||||
|
Sales and administration
|
204
|
|
246
|
|
218
|
|
||||
|
Research and development
|
57
|
|
60
|
|
56
|
|
||||
|
Total
|
1,658
|
|
1,687
|
|
1,706
|
|
||||
|
By Geography:
|
|
|
|
|
|
|
||||
|
Europe
|
823
|
|
844
|
|
870
|
|
||||
|
North America
|
816
|
|
822
|
|
814
|
|
||||
|
Rest of the World
|
19
|
|
21
|
|
22
|
|
||||
|
Total
|
1,658
|
|
1,687
|
|
1,706
|
|
||||
Employees at a number of our locations are members of various trade union organizations. We consider our employee relations to be good. We have experienced work stoppages in the past, but do not consider any of these work stoppages to have been material to our operations. We also employed on average
111
,
129
and
163
temporary contract and agency staff in
2017
,
2016
and
2015
, respectively. Our average total headcount, including employees and temporary contract and agency staff, was
1,769
,
1,816
and
1,869
in
2017
,
2016
and
2015
, respectively.
98
E. Share Ownership
The following table shows the number of shares owned by our Directors as of
December 31, 2017
.
|
Name of Beneficial Owner
|
Ordinary Shares Beneficially Owned
(1)
|
Awards over Ordinary Shares
(2)
|
|
Percentage
ownership
|
|||||||
|
Joseph A. Bonn
|
7,800
|
|
24,021
|
|
(3)
|
(*)
|
|||||
|
Alok Maskara
|
25,712
|
|
229,276
|
|
(4)
|
(*)
|
|||||
|
Adam Cohn
|
—
|
|
5,933
|
|
(3)
|
(*)
|
|||||
|
Brian G Kushner
|
1,823
|
|
3,217
|
|
(3)
|
(*)
|
|||||
|
David F. Landless
|
7,633
|
|
3,217
|
|
(3)
|
(*)
|
|||||
|
Clive J. Snowdon
|
2,000
|
|
5,836
|
|
(3)
|
(*)
|
|||||
|
(*)
|
Indicates beneficial ownership of less than one percent of our ordinary shares.
|
|
(1)
|
Number of shares owned as shown both in this table and the accompanying footnotes and percentage of ownership are based upon 27,136,799 £0.50 ordinary shares outstanding as at
December 31, 2017
.
|
|
(2)
|
Awards comprise options and restricted stock units ("RSUs") over ordinary shares granted under the agreements or incentive plans described below:
|
I.P.O. Option Awards:
As part of the I.P.O. process in 2012, stand-alone options grants (each, an "I.P.O. option") were made over ordinary shares to the Executive Directors, Non-Executive Directors and certain other key executives. The I.P.O. options were granted on October 2, 2012, 40% of which vested on the date of grant and with the remainder vesting in equal tranches over three years from the date of grant. All options are now vested and exercisable. The I.P.O. options expire if not exercised on or prior to October 1, 2019, and have an exercise price of $10 per ordinary share.
LTiP Awards:
Awards granted under the Luxfer Holdings PLC Long-Term Umbrella Incentive Plan ("LTiP") in 2017 ("2017 Grants") were made either as options or RSUs.
2017 Grants
Awards were granted on August 23, 2017, under the LTiP for the CEO of Luxfer Holdings plc.
Time-based options were granted on August 23, 2017, and vest annually in equal tranches over three years from the date on which the CEO purchased a required amount of shares ("time-based CEO 2017 options (1)"). The time-based CEO 2017 options (1) expire if not exercised on or prior to June 13, 2022. Time-based CEO 2017 options (1) have an exercise price of £0.50 per ordinary share.
Further time-based options were granted on August 23, 2017, and vest annually in equal tranches over four years from the date of the appointment of the CEO ("time-based CEO 2017 options (2)"). The time-based CEO 2017 options (2) expire if not exercised on or prior to May 23, 2023. Time-based CEO 2017 options (2) have an exercise price of £0.50 per ordinary share.
Performance-based options ("performance-based 2017 options") were granted on August 23, 2017. These performance-based awards are based on annual earnings per share ("EPS") targets, which are tested annually and which vest on the date the EPS is attained. Performance-based awards that do not vest by the end of the performance period are forfeited. Performance-based 2017 options expire if not exercised on or prior to December 31, 2024, and each has an exercise price of £0.50 per ordinary share.
EIP:
2017 awards granted under the EIP comprised RSUs ("EIP 2017 RSUs"), which were granted on May 24, 2017, and vest the day before the 2018 AGM of the Company. They are settled upon vesting and are subject to a nominal payment of £0.50 per ordinary share.
|
(3)
|
Includes 20,000 I.P.O. options and 3,947 EIP 2017 RSUs granted to Mr. Bonn, 5,823 EIP 2017 RSUs granted to Mr. Cohn, 3,158 EIP 2017 RSUs granted to Dr. Kushner, 3,158 EIP 2017 RSUs granted to Mr. Landless and 5,728 EIP 2017 RSUs granted to Mr. Snowdon.
|
|
(4)
|
Includes 45,000 time-based CEO 2017 options (1), 60,000 time-based CEO 2017 options (2) and 120,000 performance-based 2017 options.
|
99
|
Item 7.
|
Major Shareholders and Related Party Transactions
|
|
A.
|
Major Shareholders.
|
The following table shows our major shareholders (shareholders that are beneficial owners of 5% or more of the Company's voting shares) as of
December 31, 2017
, based on notifications made to the Company or public filings:
|
Shareholder
|
Number of Ordinary Shares Beneficially Owned
|
Percent
(7)
|
||||||
|
Wellington Management Group LLP
(1)
|
3,729,953
|
|
14.1
|
%
|
||||
|
Nantahala Capital Management LLC
(2)
|
2,587,341
|
|
9.8
|
%
|
||||
|
FMR LLC
(3)
|
2,290,632
|
|
8.6
|
%
|
||||
|
T. Rowe Price Associates, Inc.
(4)
|
2,057,890
|
|
7.8
|
%
|
||||
|
Paradice Investment Management LLC
(5)
|
2,026,960
|
|
7.6
|
%
|
||||
|
DePrince, Race & Zollo, Inc
(6)
|
1,724,650
|
|
6.5
|
%
|
||||
|
(1)
|
This information is based solely on the Schedule 13F filed on February 13, 2018, by Wellington Management Group LLP ("Wellington") (formerly known as Wellington Management Company, LLP), a Massachusetts limited liability partnership. Wellington is an investment adviser and may be deemed to beneficially own
3,729,953
ordinary shares held by its clients. Wellington's principal business address is c/o Wellington Management Company LLP, 280 Congress Street, Boston, MA 02210.
|
|
(2)
|
This information is based solely on the Schedule 13G filed jointly on February 14, 2018, by Nantahala Capital Management LLC, a Massachusetts limited liability company, and Wilmot B. Harkey and Daniel Mack. Includes
2,587,341
ordinary shares beneficially owned by Nantahala LLC and (ii)
2,587,341
ordinary shares beneficially owned by each of Messrs. Harker and Mack ("Nantahala Management"). The principal business address of Nantahala LLC is 19 Old Kings Highway S, Suite 200, Darien, CT 06820.
|
|
(3)
|
This information is based solely on the Schedule 13G filed jointly on February 13, 2018 by FMR LLC (‘‘FMR’’), a Delaware limited liability company, and Abigail P. Johnson. Includes
2,290,632
ordinary shares beneficially owned by FMR and (ii)
2,290,632
ordinary shares beneficially owned by Ms. Johnson (inclusive of the ordinary shares beneficially owned by FMR). The principal business address of each member of the Fidelity Group is 245 Summer Street, Boston, MA 02210.
|
|
(4)
|
This information is based solely on the Schedule 13G filed on February 14, 2018, by T. Rowe Price Associates, Inc. ("Price Associates"), a Maryland corporation. Price Associates is an investment adviser and may be deemed to beneficially own
2,057,890
ordinary shares. Price Associates disclaims beneficial ownership of such ordinary shares. The principal business address of Price Associates is 100 E. Pratt Street, Baltimore, MD 21202.
|
|
(5)
|
This information is based solely on the Schedule 13G filed jointly on February 13, 2018, by Paradice Investment Management LLC ("Paradice LLC"), a Delaware limited liability company, and Paradice Investment Management Pty Ltd ("Investment Pty"), a company incorporated in Australia. Includes
2,026,960
ordinary shares beneficially owned by Paradice LLC and (ii)
2,026,960
ordinary shares beneficially owned by Investment Pty (inclusive of the ordinary shares beneficially owned by Paradice LLC). The principal business address of Paradice LLC is 257 Fillmore Street, Suite 200, Denver, CO 80206. The principal business address of Paradice Investment Pty is Level 27, The Chifley Tower, 2 Chifley Square, Sydney NSW 2000, Australia.
|
|
(6)
|
This information is based solely on the Schedule 13G filed jointly on February 13, 2018, by DePrince, Race & Zollo, Inc., a Florida limited liability company. Includes
1,724,650
ordinary shares beneficially owned by DePrince, Race & Zollo, Inc. The principal business address of 250 Park Ave South, Suite 250, Winter Park, FL 32789.
|
|
(7)
|
Based upon the percentage of the total ordinary share capital in issue. As of
December 31, 2017
, this was
26,504,474
ordinary shares (
December 31, 2016
: 26,415,559).
|
Between January 1, 2017, and December 31, 2017:
|
•
|
the percentage of our ordinary shares beneficially owned by Nantahala increased from 5.8% to 9.8%;
|
|
•
|
FMR LLC and DePrince, Race & Zollo, Inc became a major shareholder; and
|
100
|
•
|
Canton Group, Stonehill Group and GMT Capital Group ceased to be major shareholders of the Company. The percentage of shares beneficially owned by Canton Group decreased from 8.1% to 3.9% and the percentage of shares beneficially owned by Stonehill Group and GMT Capital Group decreased from 5.8% and 5.3% respectively to nil.
|
Between January 1, 2016, and December 31, 2016:
|
•
|
the percentage of our ordinary shares beneficially owned by (i) Stonehill Group decreased from 9.2% to 5.8%, and (ii) GMT Capital Group decreased from 9.0% to 5.3%; and
|
|
•
|
Nantahala LLC became a major shareholder.
|
Between January 1, 2015, and December 31, 2015:
|
•
|
the percentage of our ordinary shares beneficially owned by (i) Canton Group increased from 7.3% to 9.4%, and (ii) T. Rowe Price Associates, Inc. decreased from 12.6% to 7.3%;
|
|
•
|
Paradice Investment Management LLC became a major shareholder; and
|
|
•
|
FMR LLC ("FMR"), a Delaware limited liability company, Edward C. Johnson 3d and Abigail P. Johnson (together with FMR and Ms. Johnson, the "Fidelity Group") ceased to be major shareholders of the Company. The percentage of shares beneficially owned by the Fidelity Group decreased from 5.2% to 1.6%.
|
Voting Rights
Major shareholders have the same voting rights per share as all other ordinary shareholders.
U.S. Resident Shareholders of Record
BNY (Nominees) Limited were the holder of record for the Company's ADR program, pursuant to which each ADS represented one ordinary share of £0.50 each. On December 11, 2017, the American Depositary Share (ADS) facility was terminated and all outstanding ADSs were converted into ordinary shares. The Company's ordinary shares are held by the Depository Trust Company (DTC), act as securities depository for the securities, and are registered in the name of Cede & Co.
At January 2, 2018, DTC held 25,929,312 ordinary shares representing 95.6% of the issued share capital held at that date. As of that date, we had a further 68,700 ordinary shares held by two U.S. resident shareholders of record, representing approximately 0.3% of total voting power. Certain of these ordinary shares were held by brokers or other nominees. As a result, the number of holders of record or registered holders in the U.S. is not representative of the number of beneficial holders or of the residence of beneficial holders.
|
B.
|
Related Party Transactions
|
Since January 1,
2015
, other than disclosed below, there has not been, nor is there currently proposed, any material transaction or series of similar material transactions to which we were or are a party in which any of our directors, members of our Executive Leadership Team (previously Executive Management Board), associates, holders of more than 10% of any class of our voting securities, or any affiliates or member of the immediate family of any of the foregoing persons, had or will have a direct or indirect material interest, other than the compensation and shareholding arrangements we describe where required in "Management."
Joint venture in which the Group is a venturer
During
2017
, the Group maintained its 51% investment in the equity of the joint venture Luxfer Uttam India Private Limited. During
2017
, the Gas Cylinders division made
$1.9 million
(
2016
:
$1.7 million
) of sales to the joint venture. At
December 31, 2017
, the gross amounts receivable from the joint venture amounted to
$2.3 million
(
2016
:
$0.9 million
) and the net amounts receivable amounted to
$0.9 million
(2016: $
0.9 million
). All sales to the joint venture are made on similar terms to arms length transactions.
During
2017
, the Group also maintained its 50% investment in the equity of the joint venture, Nikkei-MEL Company Limited. During
2017
, the Elektron division made
$1.2 million
of sales to the joint venture (2016: $
0.8 million
).
During
2017
, the Group provided
$0.9 million
in debt investment (
2016
: received
$1.0 million
in repayment) to the joint venture Luxfer Holdings NA, LLC, of which it holds 49% of the equity. The debt investment is provided through a secured revolving credit facility that the Group has granted to the joint venture of which up to
$10.0 million
can be drawn down until March 31, 2018 at an interest rate of
8%
per annum. During
2017
, the Gas Cylinders division made
$5.0 million
(
2016
:
$3.9 million
) of sales to the joint venture. At
December 31, 2017
, the amounts receivable from the joint venture amounted to
$0.9 million
(
2016
:
$1.0 million
) of trade debt and
$4.7
101
million
(
2016
:
$3.8 million
) of debt investment. All sales to the joint venture are made on similar terms to arm's length transactions.
Associates in which the Group holds an interest
During 2015, the Group acquired
26.4%
of the share capital of Sub161 Pty Limited. Following the investment, in
2017
the Group has made
$0.0 million
sales (
2016
:
$0.1 million
) to the associate. At
December 31, 2017
, the amounts receivable from the associate was
$0.0 million
(
2016
:
$0.1 million
). The debtor recognized in the prior year has been converted into a secured loan note during
2017
. The secured loan note has interest accruing at
6.0%
, of which $nil was outstanding at the year end (net of $0.5 million provision).
Transactions with other related parties
At
December 31, 2017
, the directors and key management comprising the members of the Executive Leadership Team, owned
170,297
£0.50
ordinary shares (
2016
:
1,062,672
£0.50
ordinary shares) and held awards over a further
316,797
£0.50
ordinary shares (
2016
:
476,839
£0.50
ordinary shares).
Stone Canyon Industries LLC represents a related party due to its association with Adam Cohn as co-CEO, and holds 570,000 ordinary shares in Luxfer Holdings PLC as at December 31, 2017 (2016: 570,000 ADSs).
FTI consulting represents a related party due to its association with Brian Kushner as Senior Managing Director, Corporate Finance. During 2017, we engaged with FTI consulting for IT services for the value of $0.1 million (2016: nil).
Cherokee Properties Inc. represents a related party due to its association with Chris Barnes, who is the president of one of our operating segments and is the president of Cherokee Properties Inc. During 2017, we engaged with Cherokee Properties Inc. for rental costs regarding our manufacturing site in Madison, IL for the value of $1.0 million (2016: $1.0 million.
The son of the retired Chief Executive Officer was employed by the Group during 2017, having joined through our normal recruitment channels.
C. Interests of experts and counsel
Not applicable.
|
Item 8.
|
Financial Information
|
|
A.
|
Consolidated Statements and Other Financial Information.
|
See "Item 18. Financial Statements."
Dividend distribution policy
In July 2012, our Board of Directors declared an interim dividend of £0.25 per £1 ordinary share (equal to $0.39 per £1 ordinary share at an exchange rate of $1.57:£1), totaling $3.8 million, which was paid on August 10, 2012. Our first quarterly dividend was declared and paid in October 2012 to holders of our ordinary shares as of September 30, 2012. A dividend of $0.10 per ordinary share was then paid each quarter during 2013, 2014 and 2015. During 2016, the quarterly interim dividends were increased to $0.125 per ordinary share. In 2017, interim dividends totaling $3.3 million ($0.125 per ordinary share) were paid on February 1, 2017, May 3, 2017, August 2, 2017 and November 1, 2017. The declaration and payment of these dividends and any future dividends will be at the discretion of our Board of Directors and will depend upon our results of operations, cash requirements, financial position, contractual restrictions, restrictions imposed by our indebtedness, any future debt agreements or applicable laws and other factors that our Board of Directors may deem relevant. As with all dividends declared to date, we expect future dividends to be paid out of our earnings. See Item 5. "Operating and Financial Review and Prospects" and Item 3.D. "
Risk factors—Risks Relating to Our Operations—Our ability to pay regular dividends on our ordinary shares is subject to the discretion of our Board of Directors and will depend on many factors, including our results of operations, cash requirements, financial position, contractual restrictions, applicable laws and other factors, and may be limited by our structure and statutory restrictions and restrictions imposed by the Revolving Credit Facility, the Loan Notes, as well as any future agreements."
Under our Articles of Association, our shareholders must approve any final dividend, although the Board of Directors may resolve to pay interim dividends without shareholder approval. Any payment of dividends is also subject to the provisions of the Companies Act, according to which dividends may only be paid out of profits available for distribution determined by reference to financial statements prepared in accordance with the Companies Act and IFRS as issued by the IASB, which differ in some respects from U.S. GAAP. In the event that dividends are paid in the future, holders of the ordinary shares will be entitled to receive payments in U.S.
102
dollars in respect of dividends on the underlying ordinary shares in accordance with the deposit agreement. Furthermore, because we are a holding company, any dividend payments would depend on cash flows from our subsidiaries. See Item 3.D.
"Risk factors—Risks Relating to Our Operations—As a holding company, Luxfer Holdings PLC's main source of cash is distributions from our operating subsidiaries."
|
B.
|
Significant Changes.
|
Except as disclosed elsewhere in this Annual Report, there have been no significant changes since
December 31, 2017
.
103
|
Item 9.
|
The Offer and Listing.
|
|
A.
|
Offer and listing details.
|
Price History of Stock
Following the listing of our ordinary shares, in the form of ADSs evidenced by ADRs, on October 3, 2012, on the NYSE, and the exchange of our ADSs to ordinary shares on December 11, 2017, the following table sets forth, for the periods indicated, the reported high and low prices quoted in USD.
|
|
Price
|
|||||||
|
|
High
|
Low
|
||||||
|
|
(in USD)
|
|||||||
|
Annual
|
|
|
|
|
||||
|
2017
|
16.05
|
|
10.82
|
|
||||
|
2016
|
13.60
|
|
9.17
|
|
||||
|
2015
|
14.98
|
|
9.20
|
|
||||
|
2014
|
22.05
|
|
13.44
|
|
||||
|
2013
|
21.16
|
|
12.03
|
|
||||
|
Quarter
|
|
|
|
|
||||
|
2017
|
||||||||
|
First Quarter
|
12.28
|
|
10.82
|
|
||||
|
Second Quarter
|
13.49
|
|
10.85
|
|
||||
|
Third Quarter
|
13.42
|
|
11.30
|
|
||||
|
Fourth Quarter
|
16.05
|
|
11.96
|
|
||||
|
2016
|
|
|
|
|
||||
|
First Quarter
|
11.21
|
|
9.17
|
|
||||
|
Second Quarter
|
13.60
|
|
9.99
|
|
||||
|
Third Quarter
|
13.39
|
|
10.28
|
|
||||
|
Fourth Quarter
|
12.06
|
|
9.28
|
|
||||
|
Month
|
|
|
|
|
||||
|
2017
|
|
|
|
|
||||
|
September
|
13.00
|
|
11.89
|
|
||||
|
October
|
12.84
|
|
11.96
|
|
||||
|
November
|
14.83
|
|
12.17
|
|
||||
|
December
|
16.05
|
|
14.02
|
|
||||
|
2018
|
|
|
|
|
||||
|
January
|
15.87
|
|
14.46
|
|
||||
|
February
|
14.29
|
|
12.95
|
|
||||
|
B.
|
Plan of distribution.
|
Not applicable.
|
C.
|
Markets.
|
As of December 31, 2017,
25,929,312
ordinary shares of Luxfer Holdings PLC are listed on the NYSE. Prior to this listing, no public market existed for our ordinary shares. Our ordinary shares are listed on the NYSE under the symbol "LXFR".
|
D.
|
Selling Shareholders.
|
Not applicable.
|
E.
|
Dilution.
|
Not applicable.
|
F.
|
Expenses of the issue.
|
Not applicable.
104
|
Item 10.
|
Additional Information.
|
|
A.
|
Share capital.
|
Not applicable.
|
B.
|
Memorandum and articles of association.
|
The information called for by this item has been reported previously in our Registration Statement on form F-1 (File No. 333-178278), filed with the SEC on October 4, 2012, as amended, under the heading "Description of Share Capital" and is incorporated by reference into this Annual Report.
|
C.
|
Material contracts.
|
For the two years immediately preceding the date of this Annual Report, we have not been a party to any material agreements other than in the ordinary course of business.
|
D.
|
Exchange controls.
|
There are no governmental laws, decrees, regulations or other legislation in the U.K. that may affect the import or export of capital, including the availability of cash and cash equivalents for use by us, or which may affect the remittance of dividends, interest, or other payments by us to non-resident holders of our ordinary shares, other than withholding tax requirements. There is no limitation imposed by U.K. law or Luxfer Holdings PLC's Articles of Association on the right of non-residents to hold or vote shares.
|
E.
|
Taxation.
|
U.S. Federal Income Taxation
The following discussion describes certain U.S. federal income tax consequences of the purchase, ownership and disposition of our ordinary shares by a holder that is a citizen or resident of the U.S., a U.S. domestic corporation or a person or entity that otherwise will be subject to U.S. federal income tax on a net income basis in respect of our ordinary shares (a "U.S. Holder"). This discussion does not purport to be a description of all of the possible tax considerations that may be relevant to a decision to purchase, hold or dispose of ordinary shares. In particular, this discussion does not address all U.S. federal income tax considerations that may be relevant to a particular investor, nor does it address the special tax rules applicable to certain categories of investors, such as banks, dealers, traders who elect to mark to market, tax-exempt entities, insurance companies, certain short-term holders of ordinary shares or investors who hold our ordinary shares as part of a hedge, straddle, conversion or integrated transaction or investors who have a "functional currency" other than the U.S. dollar. In addition, the discussion does not address tax consequences to an entity treated as a partnership for U.S. federal income tax purposes that holds the ordinary shares, or a partner in such partnership. This summary deals only with U.S. Holders that will hold our ordinary shares as capital assets and does not address the tax treatment of a U.S. holder that owns or is treated as owning 10% or more of the total combined voting power or value of the company's shares.
This discussion is based on the federal income tax laws of the U.S., as well as U.S. Treasury regulations promulgated thereunder and judicial and administrative interpretations thereof, all as in effect as of the date of this Annual Report, and the income and capital gains tax convention between the U.S. and the U.K. that was signed on July 24, 2001, (and amended by a Protocol signed on July 19, 2002) (the "Treaty"). All of the foregoing authorities are subject to change, which change could apply retroactively and could affect the tax consequences described below. This summary does not address any tax consequences under the laws of any state or locality of the U.S., or the Medicare tax on net investment income.
YOU ARE URGED TO CONSULT YOUR TAX ADVISORS ABOUT THE APPLICATION OF THE U.S. FEDERAL INCOME TAX RULES TO YOUR PARTICULAR CIRCUMSTANCES AS WELL AS THE STATE, LOCAL, FOREIGN AND OTHER TAX CONSEQUENCES OF THE PURCHASE, OWNERSHIP AND DISPOSITION OF THE ORDINARY SHARES.
Taxation of Dividends and Other Distributions on the Ordinary Shares
Subject to the exceptions discussed below, the gross amount of distributions made by us to you with respect to the ordinary shares will generally be includable in your gross income as dividend income. You will be treated as receiving the dividend on the date of receipt. If dividends are converted into U.S. dollars on the date of receipt, you generally should not be required to recognize foreign currency gain or loss in respect of the dividends. You should consult your tax advisor regarding the treatment of the foreign currency gain or loss, if any, on any non-U.S. currency received that is converted into U.S. dollars on a date subsequent to the date of receipt.
105
The gross amount of distributions made by us to you with respect to the ordinary shares will be treated as a dividend for U.S. federal income tax purposes only to the extent that the distribution is paid out of our current or accumulated earnings and profits (as determined under U.S. federal income tax principles). To the extent, if any, that the amount of the distribution exceeds our current and accumulated earnings and profits, it will be treated first as a tax-free return of your tax basis in your ordinary shares, and to the extent the amount of the distribution exceeds your tax basis, the excess will be taxed as capital gain. We do not intend to calculate our earnings and profits under U.S. federal income tax principles. Therefore, a U.S. Holder should expect that a distribution will generally be treated as a dividend even if that distribution would otherwise be treated as a non-taxable return of capital or as capital gain under the rules described above. A dividend in respect of the ordinary shares will not be eligible for the dividends-received deduction allowed to corporations in respect of dividends received from other U.S. corporations.
With respect to non-corporate U.S. Holders, including individual U.S. Holders, dividends will generally be taxed at the lower rate applicable to qualified dividend income, provided that (1) the ordinary shares are readily tradable on an established securities market in the U.S., or we are eligible for the benefits of a qualifying income tax treaty with the U.S. that has been approved by the U.S. Internal Revenue Service for purposes of the qualified dividend rules, (2) we are not a passive foreign investment company (a "PFIC") for either our taxable year in which the dividend is paid or the preceding taxable year and (3) certain holding period requirements are met. Under U.S. Internal Revenue Service authority, common or ordinary shares are considered for purpose of clause (1) above to be readily tradable on an established securities market in the U.S. if they are listed on the NYSE. Based on our financial statements and current expectations regarding our income, assets and activities, we believe that we were not a PFIC in 2017 and do not anticipate becoming a PFIC in 2018 or in the foreseeable future. If we were to be a PFIC for any taxable year during which a U.S. Holder holds our shares, certain adverse U.S. federal income tax consequences (including, but not limited to, dividends received by non-corporate U.S. Holders being treated as other than qualified dividends) could apply. You should consult your tax advisors regarding the availability of the lower rate for dividends paid with respect to the ordinary shares.
Dividends generally will constitute foreign source income for foreign tax credit limitation purposes. However, if 50% or more of our stock is treated as held by U.S. persons, we will be treated as a "U.S.-owned foreign corporation." In view of the substantial number of shares of our stock that are held by shareholders of record that are U.S. persons, there is a significant possibility that we may be classified as a U.S.-owned foreign corporation. If that were the case, dividends on our stock would be treated for foreign tax credit limitation purposes as income from sources within the U.S. to the extent they are attributable to our U.S. source earnings and profits, and as income from sources outside the U.S. to the extent the dividends are attributable to our non-U.S. source earnings. As described below under "—U.K. Tax Considerations," U.S. Holders that are eligible for benefits under the Treaty and meet certain other requirements generally will not be subject to U.K. tax on dividend payments in respect of the ordinary shares or on capital gains realized on the disposal of the ordinary shares. The treatment of our dividends as U.S. source or foreign source income under the rules described above may nevertheless be relevant for determining your overall foreign tax credit limitation. We do not maintain information definitively establishing the extent to which our earnings and profits are treated as U.S. source for these purposes and such amount therefore is uncertain. You should consult your tax advisor regarding the consequences to you, if any, of the potential treatment of dividends on our stock as U.S. source income under these rules. If the dividends are taxed as qualified dividend income (as discussed above), the amount of the dividend taken into account for purposes of calculating the foreign tax credit limitation will generally be limited to the gross amount of the dividend, multiplied by the reduced rate divided by the highest rate of tax normally applicable to dividends. The limitation on foreign taxes eligible for credit is calculated separately with respect to specific classes of income. For this purpose, dividends distributed by us with respect to the ordinary shares will generally constitute "passive category income."
Distributions of additional shares with respect to our ordinary shares that are made as part of a pro rata distribution to all of our shareholders generally will not be subject to U.S. federal income tax.
Taxation of Dispositions of Ordinary Shares
Subject to the PFIC rules discussed above, you will recognize taxable gain or loss on any sale, exchange or other taxable disposition of an ordinary share equal to the difference between the amount realized (in U.S. dollars) for the ordinary share and your tax basis (in U.S. dollars) in the ordinary share. The gain or loss will generally be a capital gain or loss. If you are a non-corporate U.S. Holder, including an individual U.S. Holder, who has held the ordinary share for more than one year, you will be eligible for reduced tax rates. The deductibility of capital losses is subject to limitations. Any such gain or loss that you recognize will generally be treated as U.S. source income or loss.
106
Foreign Financial Asset Reporting
Certain U.S. Holders that own “specified foreign financial assets” with an aggregate value in excess of U.S.$50,000 are generally required to file an information statement along with their tax returns, currently on Form 8938, with respect to such assets. “Specified foreign financial assets” include any financial accounts held at a non-U.S. financial institution, as well as securities issued by a non-U.S. issuer that are not held in accounts maintained by financial institutions. The understatement of income attributable to “specified foreign financial assets” in excess of U.S.$5,000 extends the statute of limitations with respect to the tax return to six years after the return was filed. U.S. Holders who fail to report the required information could be subject to substantial penalties. Prospective investors are encouraged to consult with their own tax advisors regarding the possible application of these rules, including the application of the rules to their particular circumstances.
Information Reporting and Backup Withholding
Dividend payments with respect to ordinary shares and proceeds from the sale, exchange or redemption of ordinary shares may be subject to information reporting to the U.S. Internal Revenue Service and possible U.S. backup withholding. Backup withholding will not apply, however, to a U.S. Holder who furnishes a correct taxpayer identification number and makes any other required certification or who is otherwise exempt from backup withholding. U.S. Holders that are U.S. persons who are required to establish their exempt status generally must provide such certification on U.S. Internal Revenue Service Form W-9. Holders that are not U.S. persons generally are not subject to information reporting or backup withholding. However, such a holder may be required to provide a certification of its non-U.S. status in connection with payments received within the U.S. or through a U.S.-related financial intermediary. You should consult your tax advisors regarding the application of the U.S. information reporting and backup withholding rules.
Backup withholding is not an additional tax. Amounts withheld as backup withholding may be credited against your U.S. federal income tax liability, and you may obtain a refund of any excess amounts withheld under the backup withholding rules by filing the appropriate claim for refund with the U.S. Internal Revenue Service and furnishing any required information.
U.K. Tax Considerations
This section discusses the material U.K. tax consequences of an investment in ordinary shares by Eligible U.S. Holders. It applies only to Eligible U.S. Holders that beneficially hold ordinary shares as capital assets and does not address the tax treatment of investors that are subject to special rules. An "Eligible U.S. Holder" is an investor that, at all material times: (i) qualifies for benefits under the income and capital gains tax convention between the U.S. and the U.K. that was signed on July 24, 2001, (and amended by a Protocol signed on July 19, 2002) (the "Treaty"); (ii) is a resident of the U.S. for the purposes of the Treaty; and (iii) is not resident in the U.K. for U.K. tax purposes at any material time.
This section does not apply to an investor who holds shares in connection with the conduct of a business or the performance of personal services in the U.K. or otherwise in connection with a branch, agency or permanent establishment in the U.K.
This section is based on current U.K. tax law as applied in England and published HM Revenue & Customs ("HMRC") practice as at the date of this Annual Report, both of which are subject to change, possibly with retrospective effect.
POTENTIAL INVESTORS IN THE ORDINARY SHARES SHOULD SATISFY THEMSELVES PRIOR TO INVESTING AS TO THE OVERALL TAX CONSEQUENCES, INCLUDING, SPECIFICALLY, THE CONSEQUENCES UNDER UNITED KINGDOM TAX LAW AND HMRC PRACTICE OF THE ACQUISITION, OWNERSHIP AND DISPOSAL OF THE ORDINARY SHARES, IN THEIR OWN PARTICULAR CIRCUMSTANCES BY CONSULTING THEIR OWN TAX ADVISORS.
Taxation of dividends
Withholding tax
Dividend payments in respect of the ordinary shares may be made without withholding or deduction for or on account of U.K. tax.
Income tax
Payments of dividends on the ordinary shares will constitute U.K. source income for U.K. tax purposes and, as such, remain subject to U.K. income tax by direct assessment even if paid without deduction or withholding for or on account of any U.K. tax. However, dividends with a U.K. source will not generally be chargeable to U.K. tax by direct assessment in the hands of an Eligible U.S. Holder.
107
Taxation of disposals
As an Eligible U.S. Holder, you will not generally be liable for U.K. taxation on any capital gain realized on the disposal of the ordinary shares.
Inheritance Tax
If for the purposes of the Taxes on Estates of Deceased Persons and on Gifts Treaty 1978 between the U.S. and the U.K. an individual holder is domiciled in the U.S. and is not a national of the U.K., any ordinary shares or ordinary shares beneficially owned by that holder will not generally be subject to U.K. inheritance tax on that holder's death or on a gift made by that holder during his / her lifetime, provided that any applicable U.S. federal gift or estate tax liability is paid, except where (i) the ordinary shares are part of the business property of a U.K. permanent establishment or pertain to a U.K. fixed base used for the performance of independent personal services; or (ii) the ordinary shares are comprised in a settlement unless, at the time of the settlement, the settlor was domiciled in the U.S. and not a national of the U.K.
Stamp Duty and Stamp Duty Reserve Tax
While the ordinary shares are held within the DTC clearance service, provided that DTC satisfies various conditions specified in U.K. legislation, electronic book-entry transfers of such shares should not be subject to U.K. stamp duty and agreements to transfer such shares should not be subject to U.K. stamp duty reserve tax (“SDRT”). The parties have obtained confirmation of this position by way of formal clearance by HMRC. Likewise, transfers of, or agreements to transfer, the ordinary shares from the DTC clearance service into another clearance service or into a depositary receipt system should not, provided that the other clearance service or depositary receipt system satisfies various conditions specified in U.K. legislation, be subject to U.K. stamp duty or SDRT.
In the event that the ordinary shares have left the DTC clearance service otherwise than into another clearance service or depositary receipt system, any subsequent transfer of, or agreement to transfer, such ordinary shares may, subject to any available exemption or relief, be subject to U.K. stamp duty or SDRT at a rate of 0.5% of the consideration for such transfer or agreement. Any such U.K. stamp duty or SDRT will generally be payable by the transferee and must be paid (and any relevant transfer document stamped by HMRC) before the transfer can be registered in the books of Luxfer Holdings PLC.
In the event that ordinary shares which have left the DTC clearance service otherwise than into another clearance service or depositary receipt system are subsequently transferred back into a clearance service or depositary receipt system, such transfer, or agreement to transfer, may, subject to any available exemption or relief, be subject to U.K. stamp duty or SDRT at a rate of 1.5% of the consideration for such transfer (or, where there is no such consideration, 1.5% of the value of such ordinary shares). In practice this liability for stamp duty or SDRT is in general borne by the person depositing the relevant shares in the clearance service or depositary receipt system.
|
F.
|
Dividends and paying agents.
|
Not applicable.
|
G.
|
Statement by experts.
|
Not applicable.
|
H.
|
Documents on display.
|
You may read and copy any reports or information that we file at the SEC's Public Reference Room at 100 F Street, N.E., Washington, D.C. 20549. Information on the operation of the Public Reference Room may be obtained by calling the SEC at 1-800-SEC-0330. In addition, the SEC maintains an Internet website that contains reports and other documents about issuers, like us, that file electronically with the SEC. The address of that site is "www.sec.gov".
We also make available on our website, free of charge, our Annual Reports on Form 20-F and the text of our reports on Form 6-K, including any amendments to these reports, as well as certain other SEC filings, as soon as reasonably practicable after they are electronically filed with or furnished to the SEC. Our website address is "www.Luxfer.com". The information contained on our website is not incorporated by reference in this document.
|
I.
|
Subsidiary Information.
|
Not applicable.
108
|
Item 11.
|
Quantitative and Qualitative Disclosures About Market Risk
|
We are exposed to market risk during the normal course of business from changes in currency exchange rates, interest rates and commodity prices such as aluminum prices. We manage exposures through a combination of normal operating and financing activities and through the use of derivative financial instruments such as foreign currency forward purchase contracts and aluminum forward purchase contracts. We do not use market risk-sensitive instruments for trading or speculative purposes.
A treasury committee, chaired by the Chief Financial Officer, controls and oversees the monitoring of market risks and hedging activities undertaken throughout the company.
Effect of Currency Movement on Results of Operations
We conduct business in the U.K., the U.S., continental Europe, Australasia and Asia and in various other countries around the world and, accordingly, our results of operations are subject to currency translation risk and currency transaction risk.
For the year ended
December 31, 2017
, our revenue by origin of manufacture and destination of sales, as a percentage of our consolidated revenue, were as follows:
Revenue by Geographic Origin
2017
|
Geographic Region
|
Percentage of revenue
|
||||
|
North America
|
57
|
%
|
|||
|
U.K.
|
32
|
%
|
|||
|
Europe, excluding U.K
|
10
|
%
|
|||
|
Rest of World
|
1
|
%
|
|||
Revenue by Geographic Destination
2017
|
Geographic Region
|
Percentage of revenue
|
||||
|
North America
|
54
|
%
|
|||
|
Europe, excluding U.K.
|
23
|
%
|
|||
|
Asia Pacific
|
11
|
%
|
|||
|
U.K.
|
9
|
%
|
|||
|
Rest of World
|
3
|
%
|
|||
In
2017
,
51%
,
9%
and
19%
of our sales revenue was denominated in U.S. dollars, GBP sterling and euro, respectively.
Currency translation risk
With respect to currency translation risk, our financial position and results of operations are measured and recorded in the relevant local base currency and then translated each month into U.S. dollars for inclusion in our consolidated financial statements. We translate balance sheet amounts at the exchange rates in effect on the date of the balance sheet, while income and cash flow items are translated at the average rate of exchange in effect for the relevant period.
The chart below shows the monthly rates used to translate our U.K. and continental Europe operations over the last year:
109
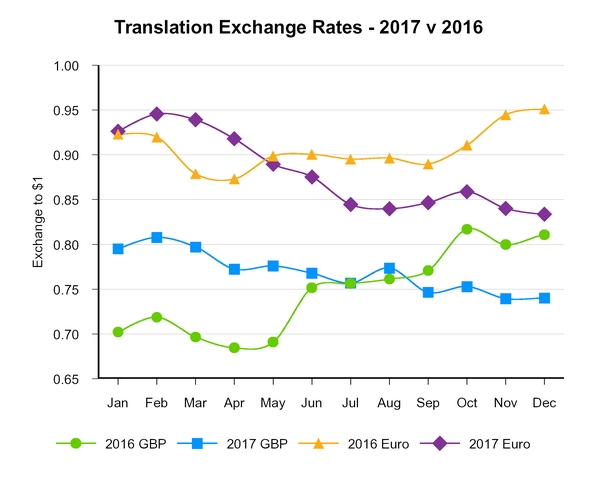
Translation risk on net assets
We hold significant assets in the U.S., U.K. and continental Europe, and we have in the past used either forward foreign currency exchange contracts or local currency debt to hedge translation risk on our net assets. We do not engage in the use of forward foreign currency exchange contracts for the purpose of hedging translation risk, although we may in the future enter into other similar arrangements when we believe it appropriate. We use local denominated debt externally provided by third parties, in various forms and to various levels, to hedge the exchange rate risks. We had net assets employed (which excludes inter-segment assets and liabilities) in North America, the U.K. and continental Europe of
$118.8 million
,
$10.0 million
and
$30.7 million
, respectively, as of
December 31, 2017
. Of the
$118.8 million
net assets employed in North America,
$18.9 million
related to goodwill with a functional currency of GBP sterling, the functional currency of the holding company, Luxfer Holdings PLC, following the transition to IFRS in 2012. Net assets employed in other regions only totaled
$2.8 million
and therefore were not a significant risk. Following the change in presentation currency to U.S. dollars as part of the transition to IFRS, we are now exposed to translation risk for the U.K. and all other non-U.S. net assets employed plus the U.S. goodwill, which in total is
$62.4 million
. Depreciation of the U.S. dollar compared to GBP sterling positively affects the value of our assets that are exposed to translation risk as reported in U.S. dollars in our consolidated financial statements and, conversely, the appreciation of the U.S dollar has a negative impact on the value of those assets.
As at
December 31, 2017
, the U.S. dollar had weakened by approximately 9% against GBP sterling and by approximately 12% against the euro, compared to
December 31, 2016
. These movements in conjunction with exchange rate movements of our other overseas investments, which are principally denominated in Czech koruna, Chinese renminbi, Canadian dollars and Australian dollars,
increased
our consolidated net assets by
$11.6 million
, which we reported in our statement of other comprehensive income. As of
December 31, 2017
, we estimate that a 10% appreciation in the U.S. dollar against the other currencies of our operations would have decreased the value of our consolidated net assets by approximately $3.9 million.
110
Translation risk on revenue and operating profits
The impact of changes in exchange rates on our reported revenue and operating profit is dependent on changes in average exchange rates in one year when compared to another. The chart above plots the GBP sterling and euro exchange rates against U.S. dollars. The table below shows the impact of such shifts in average exchange rates had on our financial results.
|
First quarter
|
Second quarter
|
Third quarter
|
Fourth quarter
|
Full year
|
||||||||||||||||||
|
2017
|
2017
|
2017
|
2017
|
2017
|
||||||||||||||||||
|
(in $ million)
|
||||||||||||||||||||||
|
All currencies—translation impact—(loss) / gain
|
||||||||||||||||||||||
|
Revenue
|
$
|
(3.7
|
)
|
$
|
(2.7
|
)
|
$
|
1.0
|
|
$
|
3.8
|
|
$
|
(1.6
|
)
|
|||||||
|
Operating profit
|
(0.1
|
)
|
1.1
|
|
0.8
|
|
2.1
|
|
3.9
|
|
||||||||||||
The table above also indicates the impact of movements in the exchange rate of GBP sterling, the euro and other currencies against the U.S. dollar for
2017
. We estimate that a 10% appreciation in the U.S. dollar against the other currencies of our operations in
2017
would have decreased our operating profit by approximately $0.6 million.
Hedging of currency translation risk
The gains and losses arising from our exposure to movements in foreign currency exchange rates are recognized in the statement of other comprehensive income.
We cannot easily hedge the impact of translation risk on our operating profits, but we are able to hedge the translation risk on our overseas net assets. The two common methods are through either bank borrowing denominated in the foreign currency or use of forward foreign currency exchange contracts. We have hedged this risk through bank borrowings denominated in the same currencies as the net assets they help to fund. We can draw down amounts under our Revolving Credit Facility in U.S. dollars, GBP sterling and euro. As of
December 31, 2017
, we had
$105.5 million
of debt denominated in U.S. dollars and £4.7 million of debt denominated in GBP sterling (as of
December 31, 2016
, we had
$117.0 million
of debt denominated in U.S. dollars and £4.7 million of debt denominated in GBP sterling). We have on occasion also used forward foreign currency exchange contracts to hedge this exposure. However, this approach is less desirable than the use of bank debt because it requires the cash settlement of the contracts, which exposes us to an additional cash flow risk. As a result, we have not used such hedges in recent years. We also report any gains and losses on hedging instruments in the statement of other comprehensive income, offsetting the exchange movements on overseas net assets.
Currency transaction risk
In addition to currency translation risk, we incur currency transaction risk whenever one of our operating subsidiaries enters into either a purchase or sales transaction in a currency other than its functional currency. Matching sales revenues and costs in the same currency reduces currency transaction risk.
Our U.S. operations have little currency exposure, as most purchases, costs and revenue are denominated in U.S. dollars. In our U.K. operations, purchases of raw materials and sales are conducted in a large number of countries and in differing currencies, while other operating costs are generally incurred in GBP sterling, resulting in exposure to changes in foreign exchange rates. For example, purchases of raw materials are denominated principally in U.S. dollars, and a large portion of our sales by U.K. operations are in euros.
The analysis of our revenue by destination and origin demonstrates that, although
32%
of our product sales revenue in
2017
originates from manufacturing facilities in the U.K., only
9%
of our revenue is derived from sales to customers within the U.K. The remaining percentage of revenue is generated from exports outside the U.K. In
2017
, we sold
19%
of our products into the countries that have adopted the euro, but we only manufactured 7% of our goods in the Eurozone. As a result, movement in the exchange rate between the euro and GBP sterling is our largest currency transaction risk. We estimate the net exposure to the euro between sales and purchases equates to a gross profit exposure varying between €45 million and €55 million a year, fluctuating due to changes in sales, which will vary due to market demand factors. The geographic sales analysis shows that the U.S. dollar is another potential source of currency transaction risk for our U.K. operations, with sales of products denominated in U.S. dollars extending beyond North America, as many of our sales to Asia are also priced in U.S. dollars. We also purchase a significant amount of raw materials priced in U.S. dollars. The U.K. operations are exposed to a net transaction risk for U.S. dollars estimated at $10 million to $30 million for a net sales risk
111
per year. We manage transaction risk on the sales and purchase cash flows separately, using separate sell and buy forward currency contracts, rather than on a net basis.
Hedging of currency transaction risk
To mitigate our exposure to currency transaction risk, we operate a policy of hedging all contracted commitments in foreign currency, and we also hedge a substantial portion of non-contracted forecast currency receipts and payments for up to 18 months forward.
Where no natural hedge exists, all firm contracted commitments and a portion of non-contracted forecast receipts and payments denominated in foreign currencies are hedged by means of forward foreign currency exchange contracts. We base our decision to hedge against non-contracted amounts based on the nature of the transaction being hedged and the volatility of currency movements, among other factors. For example, we cover a lower percentage of our forecast exposure in the case of businesses with relatively few long-term sales contracts.
As of
December 31, 2017
, we held various foreign currency exchange contracts designated as hedges in respect of forward sales for U.S. dollars, euros and Australian dollars for the receipt of GBP sterling or euros. For our largest risk exposure, euro to GBP sterling, we had hedges in place for
2018
covering approximately 40% of our forecasted sales. We also held foreign currency exchange contracts designated as hedges in respect of forward purchases for U.S. dollars by the sale of GBP sterling. The contract totals in GBP sterling, range of maturity dates and range of exchange rates are disclosed below:
|
December 31, 2017
|
|||||||||||
|
Sales Hedges
|
U.S. dollars
|
Euros
|
Australian dollars
|
||||||||
|
Contract totals / £M
|
17.1
|
|
27.5
|
|
2.8
|
|
|||||
|
Maturity dates
|
01/18 to 07/19
|
|
01/18 to 07/19
|
|
06/18
|
|
|||||
|
Exchange rates
|
$1.2433 to $1.3444
|
|
€1.0949 to €1.1803
|
|
1.7667
|
|
|||||
|
December 31, 2017
|
|||||||||||
|
Purchase Hedges
|
U.S. dollars
|
Euros
|
Australian dollars
|
||||||||
|
Contract totals / £M
|
12.5
|
|
0.1
|
|
1.7
|
|
|||||
|
Maturity dates
|
01/18 to 07/19
|
|
01/18
|
|
06/18
|
|
|||||
|
Exchange rates
|
$1.2414 to $1.3389
|
|
€1.1084
|
|
$1.7161
|
|
|||||
The fair value of the above hedges was
$0.7 million
as of
December 31, 2017
. Under IAS 39, a
loss
of
$0.7 million
has been deferred from recognition in our consolidated income statement until
2018
, because it relates to effective hedges against forecast sales and purchases in
2018
. We disclose the amount deferred separately under hedging reserve in our consolidated balance sheet.
Effect of Commodity Price Movements on Results of Operations
Commodity price risk
We are exposed to commodity price risks in relation to the purchases of our raw materials. The raw materials we use include primary magnesium, rare earth metals and chemical compounds, zircon sand, zirconium oxychloride intermediates and other chemical inputs like soda ash for the Elektron Division and aluminum log and sheet and carbon fiber for the Gas Cylinders Division. Many of these raw materials have been subject to price rises and volatility over the last few years, some of which were substantial.
In 2017, raw material costs increased as the average three month LME price for aluminum rose from $1,609 to $1,819 per metric ton, an increase of $210 per metric ton, or 13.1%, from the 2016 equivalent figure. The U.S. Midwest Aluminum Premium remained stable at approximately $200 per metric ton. Magnesium prices rose slightly in 2017 compared to the previous year with an average price of Chinese magnesium on a free on board basis being $2,245 per metric ton, a $48 per metric ton increase, when compared to the average for 2016.
In 2016, raw material costs were stable. The average three month LME price for aluminum was $1,609 per metric ton in 2016, a decrease of $65 per metric ton, or 3.9%, from the 2015 equivalent figure. The U.S. Midwest Aluminum Premium throughout 2016, remained stable at approximately $200 per metric ton. Magnesium prices rose slightly in 2016 compared to the previous year with the average price of Chinese magnesium on a free on board basis being $2,197 per metric ton, a $57 per metric ton increase, when compared to the average for 2015.
112
Primary aluminum is a global commodity, with its principal trading market on the LME. In the normal course of business, we are exposed to aluminum price volatility to the extent that the costs of aluminum purchases are more closely related to the LME price than the sales prices of certain of our products. Our Gas Cylinders Division will buy various aluminum alloys, in log, sheet, or tube form, and the contractual price will usually include an LME-linked base price plus a premium for a particular type of alloy and the cost of casting, rolling or extruding. The price of high-grade aluminum, which is actively traded on the LME, has fluctuated significantly in recent years as shown in the LME price graph below. The price remains volatile and difficult to predict. Since aluminum is the Gas Cylinders Division's largest single raw material cost, these fluctuations in the price of aluminum can affect this division's and our financial results. In order to help mitigate this risk, we enter into LME-related transactions in the form of commodity contracts. Historically we have also ordered a certain amount of our aluminum billet purchases on a forward fixed price.
The three month LME price for primary aluminum was as follows from January 1, 2015, through
December 31, 2017
:

Source: London Metal Exchange
We estimate that changes in the LME price of aluminum will normally take approximately three months to impact our reported costs of sales and operating profits. In 2015, the price of aluminum fell from $1,832 per metric ton to $1,597 per metric ton, resulting in a $1.9 million reduction in our cost base. In 2016, whilst the price of aluminum stated to rise, ending at $1,693 per metric ton, the fall in the average price year-on-year resulted in a $3.5 million reduction in our cost base. In 2017, the price of aluminum continued to rise, with a year-end high of $2,268 per metric ton.
The average cost of our LME hedges was $1,819 per metric ton in 2017, $1,604 per metric ton in 2016 and $1,942 per metric ton in 2015.
There is no similar financial market to hedge magnesium, zirconium raw materials or carbon fiber, and prices for these raw materials have been volatile in recent years with some increasing substantially. To help mitigate these risks, we have a number of fixed-price supply contracts for these raw materials, which limit our exposure to price volatility over a calendar year. However, we remain exposed over time to rising prices in these markets, and therefore rely on the ability to pass on any major price increases to our customers in order to maintain our levels of profitability for zirconium, and magnesium-based products. We have also in the last few years, when we felt it
113
was appropriate, made additional physical purchases of magnesium and some rare earth chemicals to delay the impact of higher prices, but this has had a cash flow impact on occasion thereby leading to greater utilization of our revolving credit bank facilities. Also, the price of magnesium in the U.S. is fairly high due to the protection of the U.S. market from Chinese imports through anti-dumping tariffs.
Ultimately we aim to recover all our raw material cost increases through adjustment to our sales prices. However, for aluminum costs, we can utilize LME financial derivative contracts over a one to two year period to mitigate shorter-term fluctuations and protect us in the short-term as we renegotiate sales prices with customers.
Hedging of Aluminum Metal Price Risk
Based on current sales mix between composite and aluminum cylinders, we expect that our gas cylinders operations will need to purchase approximately 10,000 to 14,000 metric tons of primary aluminum each year, in various sizes of billet and various types of alloy, and that another approximately 1,000 metric tons per year of various forms of fabricated sheet aluminum will be purchased for use in our Superform and composite cylinder production processes. Normally, the division will recover approximately 2,500 to 3,500 metric tons per year of process scrap and would expect to be able to sell this scrap into the market at prices linked to the LME prices. Over time, we have also aimed to recover cost increases via sales price increases, and use LME hedging to protect margins for the next 12 to 18 months.
In 2017, approximately 60% of our price risk on primary aluminum costs was covered with LME hedges. We estimate we have 30% of our forecast price risk of aluminum covered by LME derivative contracts for 2018.
Our hedging policy is designed to enable us to benefit from a more stable cost base. The effect of the LME-related transactions we enter into is to mitigate the unfavorable impact of price increases on aluminum purchases. Under IFRS, similar to the treatment of derivative financial instruments used to hedge foreign currency risk, the change in the fair value of the LME contracts that relate to future transactions is deferred and held in an equity hedging reserve account. Gains and losses derived from such commodity contracts are reflected in the cost of goods sold when the underlying physical transaction takes place. The LME contracts we had at the end of 2017 had a mark-to-market gain of $1.2 million, compared to a mark-to-market loss of $0.6 million in 2016.
Our hedging policy aims to achieve protection against our calculated exposure to metal price volatility for a full calendar year by the end of the immediately preceding year. We use our hedging policy to minimize risk rather than to engage in speculative positions on the underlying commodity. Although this may result in losses on hedged positions, the downside risk of un-hedged exposure to aluminum prices can be far greater. If we did not hedge our aluminum exposure and were unable to pass additional costs onto customers, we estimate, based on a price exposure on 10,000 metric tons that a $100 annual increase in the price of aluminum on the LME would result in a
$1.3 million
adverse effect on our full year operating profit.
Effect of Interest Rate Movements
Interest Rate Risk
As of
December 31, 2017
, we had both fixed rate and variable rate debt outstanding on our consolidated balance sheet. As a result of this exposure, we have in the past hedged interest payable under our floating rate indebtedness based on a combination of forward rate agreements, interest rate caps and swaps. There were no fixed or variable rate interest hedge agreements in place as of
December 31, 2017
, and
December 31, 2016
.
On May 13, 2011, we entered into the Senior Facilities Agreement and Note Purchase Agreement, providing a variable interest rate Term Loan and Revolving Credit Facility and fixed rated Loan Notes due 2018. This debt was all drawn down on June 15, 2011. The Loan Notes due 2018 had a $65 million principal amount and a fixed rate of interest of 6.19%. During 2016, Luxfer agreed to extend the maturity date of $50 million of the $65 million outstanding aggregate amount of the Loan Notes due 2018. The extension also includes a lower long-term fixed interest rate on the debt. The maturity date on $25 million was extended from June 2018 to June 2023, with a fixed interest rate of 4.88%; and the maturity date on a further $25 million was extended to June 2026 at a fixed interest rate of 4.94%. The Term Loan was fully repaid in October 2012 and under the revised agreement, the value of debt repaid could be re-drawn against the revolving credit facility available in GBP sterling, U.S. dollars or euros. Following an amendment to the Senior Facilities Agreement on March 25, 2014, we are able to draw down up to a maximum aggregate principal amount of $150 million, of which
$21.3 million
was outstanding at
December 31, 2017
. The variable interest charged is linked to ICE LIBOR.
On September 18, 2014, we entered into the Note Purchase and Private Shelf Agreement. The Loan Notes due 2021 issued thereunder have a $25 million principal amount and a fixed rate of interest of 3.67%.
114
|
Item 12.
|
Description of Securities Other than Equity Securities.
|
|
A.
|
Debt Securities.
|
Not applicable.
|
B.
|
Warrant and Rights.
|
Not applicable.
|
C.
|
Other Securities.
|
Not applicable.
|
D.
|
American Depositary Shares.
|
On December 11, 2017, Luxfer Holdings PLC terminated its ADR facility and arranged for the exchange of outstanding ADSs for the underlying ordinary shares. The exchange allows Luxfer shareholders to directly own and publicly trade ordinary shares on the New York Stock Exchange under the symbol "LXFR". As a result of this, there are no outstanding ADRs as at December 31, 2017.
Fees and Other Payments Made by the Depositary to Luxfer
The depositary agreed to reimburse us for certain expenses we incurred in relation to the former ADS program.
During the year ended
December 31, 2017
, we received $0.5 million in fees from the depositary of our ADSs.
|
Item 13.
|
Defaults, Dividend Arrearages and Delinquencies.
|
None.
|
Item 14.
|
Material Modifications to the Rights of Security Holders and Use of Proceeds.
|
Not applicable.
|
Item 15.
|
Controls and Procedures.
|
We have carried out an evaluation of the effectiveness of the design and operation of our disclosure controls and procedures (as such term is defined in Rules 13a-15(e) and 15d-15(e) under the Securities Exchange Act of 1934) under the supervision and the participation of the Executive Leadership Team, which is responsible for the management of the internal controls, and which includes the Chief Executive Officer and the Chief Financial Officer. There are inherent limitations to the effectiveness of any system of disclosure controls and procedures, including the possibility of human error and the circumvention or overriding of the controls and procedures. Accordingly, even effective disclosure controls and procedures can only provide reasonable assurance of achieving their control objectives. Based upon our evaluation as of
December 31, 2017
, the Chief Executive Officer and Chief Financial Officer have concluded that the disclosure controls and procedures (i) were effective at a reasonable level of assurance as of the end of the period covered by this Annual Report on Form 20-F in ensuring that information required to be recorded, processed, summarized and reported in the reports that are filed or submitted under the Exchange Act, is recorded, processed, summarized and reported within the time periods specified in the SEC's rules and forms and (ii) were effective at a reasonable level of assurance as of the end of the period covered by this Annual Report on Form 20-F in ensuring that information to be disclosed in the reports that are filed or submitted under the Exchange Act is accumulated and communicated to the management of the Company, including the Chief Executive Officer and the Chief Financial Officer, to allow timely decisions regarding required disclosure.
Management's Annual Report on Internal Control over Financial Reporting
Our Executive Leadership Team is responsible for establishing and maintaining adequate internal control over financial reporting. Our internal control over financial reporting is a process designed, under the supervision of the Chief Executive Officer and the Chief Financial Officer, to provide reasonable assurance regarding the reliability of financial reporting and the preparation of our consolidated financial statements for external reporting purposes in accordance with IFRS.
Our internal control over financial reporting includes policies and procedures that pertain to the maintenance of records that, in reasonable detail, accurately and fairly, reflect transactions and dispositions of assets, provide
115
reasonable assurance that transactions are recorded in the manner necessary to permit the preparation of consolidated financial statements in accordance with IFRS, and that receipts and expenditures are only carried out in accordance with the authorization of our Executive Leadership Team and directors, and provide reasonable assurance regarding the prevention or timely detection of any unauthorized acquisition, use or disposition of our assets and that could have a material effect on our consolidated financial statements.
Because of its inherent limitations, internal control over financial reporting may not prevent or detect all misstatements. Moreover, projections of any evaluation of the effectiveness of internal control to future periods are subject to a risk that controls may become inadequate because of changes in conditions and that the degree of compliance with the policies or procedures may deteriorate.
Our Executive Leadership Team has assessed the effectiveness of internal control over financial reporting based on the framework in Internal Control—Integrated Framework (2013 Framework) issued by the Committee of Sponsoring Organizations of the Treadway Commission. Based on this assessment, our Executive Leadership Team has concluded that our internal control over financial reporting as of
December 31, 2017
, was effective.
Attestation Report of the Registered Public Accountant Firm
Our independent registered public accounting firm, PricewaterhouseCoopers LLP, has audited the consolidated financial statements included in this Annual Report on Form 20-F, and as part of its audit, has issued its report on the effectiveness of our internal control over financial reporting. This report is included on page F-2 of this Form 20-F and is incorporated herein by reference.
Changes in Internal Control over Financial Reporting
During the period covered by this report, we have not made any changes to our internal control over financial reporting that have materially affected, or are reasonably likely to materially affect, our internal control over financial reporting.
|
Item 16.
|
[Reserved]
|
|
Item 16A.
|
Audit committee financial expert.
|
During the year ended
December 31, 2017
, David Landless served as a Non-Executive Director and as the Audit Committee financial expert and is independent for the purposes of Rule 10A-3 of the Exchange Act and NYSE rule 303A.02.
|
Item 16B.
|
Code of Ethics.
|
The Company has adopted a formal code of ethics applicable to all employees, including to the Chief Executive Officer, Chief Financial Officer and Group Financial Controller.
The Company's code of ethics is available on our website at:
http://www.luxfer.com/governance/code_of_ethics_and_business_conduct.asp
|
Item 16C.
|
Principal Accountant Fees and Services.
|
Our independent registered public accounting firm was our independent auditor for the fiscal years ended
December 31, 2017
,
December 31, 2016
and
December 31, 2015
. The table below sets out the amount billed to us by our independent auditor for services performed in the year ended
December 31, 2017
,
2016
and
2015
and breaks down these amounts by category:
|
|
2017
|
2016
|
2015
|
||||||||
|
|
(in $ million)
|
||||||||||
|
Fees payable to auditors for the audit of the consolidated financial statements and its subsidiaries
|
1.3
|
|
1.1
|
|
1.1
|
|
|||||
|
Fees payable to auditors for non-audit services:
|
|||||||||||
|
Accounting advisory services
|
0.1
|
|
—
|
|
—
|
|
|||||
|
Total
|
1.4
|
|
1.1
|
|
1.1
|
|
|||||
Audit fees
Audit fees in
2017
,
2016
and
2015
were related to the audit of our consolidated financial statements and other audit services provided in connection with statutory and regulatory filings or engagements.
116
Accounting advisory services
Accounting advisory services fees incurred in 2017 relate to an ongoing GAAP conversion project in relation to the expected loss of our FPI status.
Pre-approval policies and procedures
The Audit Committee has established pre-approval policies and procedures which are followed prior to the engagement of our independent registered public accounting firm relating to the carrying out of audit and non-audit services. All services provided by our auditors are approved in advance by the audit committee in accordance with such policies and procedures.
|
Item 16D.
|
Exemptions from the Listing Standards for Audit Committees.
|
Not applicable.
|
Item 16E.
|
Purchases of Equity Securities by the Issuer and Affiliated Purchasers.
|
Effective June 4, 2015, the Board authorized a share buy-back program of up to $10.0 million, primarily to satisfy obligations under the Group's employee share programs, subject to applicable securities laws, regulatory considerations and other factors. Shareholder approval for this program was granted at the 2014 Annual General Meeting (for repurchases up to an aggregate amount of 2,700,000 ordinary shares or ADSs). Set forth below is the summary of shares repurchased by us during 2015, 2016 and the approximate dollar value, and number, of shares that may yet be repurchased under this program. No shares were repurchased in 2017.
117
|
|
Total number of
shares
purchased
|
Average price
paid per share
(in U.S. dollars)
|
Total number of
shares
purchased as
part of publicly
announced plans
or programs
|
Approximate
dollar value of
shares that may
yet be purchased
under the plans
or programs
(in $ million)
|
Maximum
number of
shares that may
yet be purchased
under the plans
or programs
|
|||||||||||||
|
June 5—June 30, 2015
|
146,804
|
|
$
|
13.44
|
|
146,804
|
|
8.1
|
|
2,553,196
|
|
|||||||
|
July 1—July 31, 2015
|
—
|
|
—
|
|
146,804
|
|
8.1
|
|
2,553,196
|
|
||||||||
|
August 1—August 31, 2015
|
—
|
|
—
|
|
146,804
|
|
8.1
|
|
2,553,196
|
|
||||||||
|
September 1—September 30, 2015
|
—
|
|
—
|
|
146,804
|
|
8.1
|
|
2,553,196
|
|
||||||||
|
October 1—October 31, 2015
|
—
|
|
—
|
|
146,804
|
|
8.1
|
|
2,553,196
|
|
||||||||
|
November 1—November 30, 2015
|
—
|
|
—
|
|
146,804
|
|
8.1
|
|
2,553,196
|
|
||||||||
|
December 1—December 31, 2015
|
—
|
|
—
|
|
146,804
|
|
8.1
|
|
2,553,196
|
|
||||||||
|
January 1—January 31, 2016
|
236,537
|
|
$
|
9.99
|
|
383,341
|
|
5.7
|
|
2,316,659
|
|
|||||||
|
February 1—February 29, 2016
|
333,169
|
|
$
|
10.21
|
|
716,510
|
|
2.3
|
|
1,983,490
|
|
|||||||
|
March 1—March 31, 2016
|
21,331
|
|
$
|
10.66
|
|
737,841
|
|
2.0
|
|
1,962,159
|
|
|||||||
|
April 1—April 30, 2016
|
—
|
|
—
|
|
737,841
|
|
2.0
|
|
1,962,159
|
|
||||||||
|
May 1—May 31, 2016
|
—
|
|
—
|
|
737,841
|
|
2.0
|
|
1,962,159
|
|
||||||||
|
June 1—June 30, 2016
|
—
|
|
—
|
|
737,841
|
|
2.0
|
|
1,962,159
|
|
||||||||
|
July 1—July 31, 2016
|
—
|
|
—
|
|
737,841
|
|
2.0
|
|
1,962,159
|
|
||||||||
|
August 1—August 31, 2016
|
—
|
|
—
|
|
737,841
|
|
2.0
|
|
1,962,159
|
|
||||||||
|
September 1—September 30, 2016
|
—
|
|
—
|
|
737,841
|
|
2.0
|
|
1,962,159
|
|
||||||||
|
October 1—October 31, 2016
|
18,276
|
|
$
|
9.50
|
|
756,117
|
|
1.9
|
|
1,943,883
|
|
|||||||
|
November 1—November 30, 2016
|
24,872
|
|
$
|
9.50
|
|
780,989
|
|
1.6
|
|
1,919,011
|
|
|||||||
|
December 1—December 31, 2016
|
—
|
|
—
|
|
780,989
|
|
1.6
|
|
1,919,011
|
|
||||||||
|
January 1—January 31, 2017
|
—
|
|
—
|
|
780,989
|
|
1.6
|
|
1,919,011
|
|
||||||||
|
February 1—February 29, 2017
|
—
|
|
—
|
|
780,989
|
|
1.6
|
|
1,919,011
|
|
||||||||
|
March 1—March 31, 2017
|
—
|
|
—
|
|
780,989
|
|
1.6
|
|
1,919,011
|
|
||||||||
|
April 1—April 30, 2017
|
—
|
|
—
|
|
780,989
|
|
1.6
|
|
1,919,011
|
|
||||||||
|
May 1—May 31, 2017
|
—
|
|
—
|
|
780,989
|
|
1.6
|
|
1,919,011
|
|
||||||||
|
June 1—June 30, 2017
|
—
|
|
—
|
|
780,989
|
|
1.6
|
|
1,919,011
|
|
||||||||
|
July 1—July 31, 2017
|
—
|
|
—
|
|
780,989
|
|
1.6
|
|
1,919,011
|
|
||||||||
|
August 1—August 31, 2017
|
—
|
|
—
|
|
780,989
|
|
1.6
|
|
1,919,011
|
|
||||||||
|
September 1—September 30, 2017
|
—
|
|
—
|
|
780,989
|
|
1.6
|
|
1,919,011
|
|
||||||||
|
October 1—October 31, 2017
|
—
|
|
—
|
|
780,989
|
|
1.6
|
|
1,919,011
|
|
||||||||
|
November 1—November 30, 2017
|
—
|
|
—
|
|
780,989
|
|
1.6
|
|
1,919,011
|
|
||||||||
|
December 1—December 31, 2017
|
—
|
|
—
|
|
780,989
|
|
1.6
|
|
1,919,011
|
|
||||||||
|
Total
|
780,989
|
|
$
|
10.72
|
|
780,989
|
|
1.6
|
|
1,919,011
|
|
|||||||
|
Item 16F.
|
Change in Registrant's Certifying Accountant.
|
Not applicable.
|
Item 16G.
|
Corporate Governance.
|
Corporate Governance Practices
Our ordinary shares are listed on the NYSE. As a foreign private issuer, we rely on a provision in the NYSE's Listed Company Manual that permits us to follow home-country practice in lieu of certain NYSE corporate governance requirements. As a U.K. company, our corporate governance practices are governed by our Articles and the Companies Act. The significant differences between our corporate governance practices as a U.K. company and those required by NYSE listing standards for U.S. companies are as follows:
Independence
The NYSE listing standards provide that listed companies must have a majority of independent directors and that both the nominating / corporate governance committee and the compensation committee must consist solely of independent directors. Under NYSE rule 303A.02, a director qualifies as independent only if the board affirmatively determines that such director has no material relationship with the company, either directly or as a
118
partner, shareholder or officer of an organization that has a relationship with the company. In addition, in affirmatively determining the independence of any director who will serve on the compensation committee of the listed company's board of directors, the board of directors must consider all factors specifically relevant to determining whether a director has a relationship to the listed company which is material to that director's ability to be independent from management in connection with the duties of a compensation committee member, including, but not limited to (i) the source of compensation of such director (including any consulting, advisory or other compensatory fee paid by the listed company to such director) and (ii) whether such director is affiliated with the listed company, a subsidiary of the listed company or an affiliate of a subsidiary of the listed company. Moreover, the NYSE listing standards enumerate a number of relationships that preclude independence.
The NYSE listing standards also provide that listed companies must have an audit committee that (i) satisfies the requirements of Rule 10A-3 under the Exchange Act, which, among other things, requires each member of the audit committee to be independent within the meaning of the Rule, subject to certain exemptions, and (ii) satisfies the requirements for independence set out in NYSE rule 303A.02.
Since we are a foreign private issuer, we have not needed to make an affirmative determination that each member of our Audit Committee is independent for the purposes of NYSE rule 303A.02. However, the Board has determined that each member of the Audit Committee is independent for the purposes of Rule 10A-3 under the Exchange Act and NYSE rile 303A.02.
Committees
We have board committees that are different than those required by NYSE rules for listed U.S. companies.
For instance, in addition to the independence requirement described above, the nominating / corporate governance committee of a listed U.S. company must have (i) a written charter that addresses certain corporate governance matters and (ii) an annual performance evaluation of the committee. Our Nominating and Governance Committee has written terms of reference that are generally responsive to the recommendations thereunder and that are available on our website.
Furthermore, in addition to the independence requirement described above, the compensation committee of a listed U.S. company must have (i) a written charter that addresses certain corporate governance matters and (ii) an annual performance evaluation of the compensation committee and (iii) the rights and responsibilities of the compensation committee set forth in NYSE rule 303A.05(c). Our compensation committee has written terms of reference that are generally responsive to the recommendations thereunder and that are available on our website.
Finally, in addition to the independence requirement described above, the audit committee of a U.S. listed company must (i) satisfy the requirements of Rule 10A-3 under the Exchange Act, (ii) have a minimum of three members, and (iii) have a written charter that addresses certain corporate governance matters. Our audit committee comprises three Non-Executive Directors who are independent for purposes of Rule 10A-3 under the Exchange Act and satisfies the other requirements of Rule 10A-3 under the Exchange Act. Moreover, the Board has determined that each member of the audit committee is independent under NYSE rule 303A.02. Moreover, our audit committee has written terms of reference that are generally responsive to the requirements under NYSE rule 303A.07 and which are available on our website.
Equity Compensation Plans
U.S. listed companies must give shareholders the opportunity to vote on all equity-compensation plans and material revisions thereto, except for employment inducement awards, certain grants, plans and amendments in the context of mergers and acquisitions, and certain specific types of plans. We comply with legal requirements under the Companies Act 2006 and our Articles of Association regarding shareholder approval required in respect of equity compensation plans. Such requirements do not require shareholder approval of equity compensation plans and certain revisions thereof in all circumstance for which the NYSE rules applicable to the U.S. listed companies require such shareholder approval.
Corporate Governance Guidelines
U.S. listed companies are required to adopt and disclose corporate governance guidelines. There is no equivalent recommendation in the U.K. Corporate Governance Code.
Code of Ethics
Listed companies must adopt and disclose a code of business conduct and ethics for directors, officers and employees and promptly disclose any waivers of the code for directors or executive officers. The Companies Act 2006 does not require us to adopt a Code of Ethics. See "Item 16b. Code of Ethics."
119
|
Item 16H.
|
Mine Safety Disclosure.
|
Not applicable.
|
Item 17.
|
Financial Statements.
|
Not applicable.
|
Item 18.
|
Financial Statements.
|
The audited consolidated financial statements as required under Item 18 are attached hereto starting on page F-1 of this Annual Report. The audit report of PricewaterhouseCoopers LLP, independent registered public accounting firm, is included herein preceding the audited consolidated financial statements.
120
|
Item 19.
|
Exhibits.
|
|
1.1
|
|
2.1
|
|
2.2
|
|
2.3
|
|
2.4
|
|
2.5
|
|
2.6
|
|
2.7
|
|
4.1
|
|
4.2
|
|
4.3
|
|
8.1
|
List of Subsidiaries (included under Item 4.C "Organizational Structure" in this Annual Report on Form 20-F)
|
|
12.1
|
|
12.2
|
|
13.1
|
|
13.2
|
|
15.1
|
121
Signature
The registrant hereby certifies that it meets all of the requirements for filing on Form 20-F and that it has duly caused and authorized the undersigned to sign this Annual Report on its behalf.
|
|
|
Luxfer Holdings PLC
|
||
|
March 19, 2018
|
|
By:
|
/s/ Alok Maskara
|
|
|
|
|
|
Alok Maskara
|
|
|
|
|
|
Chief Executive Officer
|
|
122
INDEX TO CONSOLIDATED FINANCIAL STATEMENTS
|
|
Page
|
||
|
Consolidated Financial Statements
|
|
||
F-
1
Report of Independent Registered Public Accounting Firm
To the Board of Directors and Shareholders of Luxfer Holdings PLC
Opinions on the Financial Statements and Internal Control over Financial Reporting
We have audited the accompanying consolidated balance sheets of Luxfer Holdings PLC and its subsidiaries as of December 31, 2017 and 2016 and the related consolidated income statements, consolidated statements of comprehensive income, consolidated statements of changes in equity and consolidated cash flow statements for each of the three years in the period ended December 31, 2017, including the related notes (collectively referred to as the “consolidated financial statements”). We also have audited the Company’s internal control over financial reporting as of December 31, 2017, based on criteria established in Internal Control - Integrated Framework (2013) issued by the Committee of Sponsoring Organizations of the Treadway Commission (COSO).
In our opinion, the consolidated financial statements referred to above present fairly, in all material respects, the financial position of the Company as of December 31, 2017 and 2016, and the results of their operations and their cash flows for each of the three years in the period ended December 31, 2017 in conformity with International Financial Reporting Standards as issued by the International Accounting Standards Board. Also in our opinion, the Company maintained, in all material respects, effective internal control over financial reporting as of December 31, 2017, based on criteria established in Internal Control - Integrated Framework (2013) issued by the COSO.
Basis for Opinions
The Company's management is responsible for these consolidated financial statements, for maintaining effective internal control over financial reporting, and for its assessment of the effectiveness of internal control over financial reporting, included in Management’s Annual Report on Internal Control over Financial Reporting appearing under Item 15 of the 2017 Annual Report. Our responsibility is to express opinions on the Company’s consolidated financial statements and on the Company's internal control over financial reporting based on our audits. We are a public accounting firm registered with the Public Company Accounting Oversight Board (United States) ("PCAOB") and are required to be independent with respect to the Company in accordance with the U.S. federal securities laws and the applicable rules and regulations of the Securities and Exchange Commission and the PCAOB.
We conducted our audits in accordance with the standards of the PCAOB. Those standards require that we plan and perform the audits to obtain reasonable assurance about whether the consolidated financial statements are free of material misstatement, whether due to error or fraud, and whether effective internal control over financial reporting was maintained in all material respects.
Our audits of the consolidated financial statements included performing procedures to assess the risks of material misstatement of the consolidated financial statements, whether due to error or fraud, and performing procedures that respond to those risks. Such procedures included examining, on a test basis, evidence regarding the amounts and disclosures in the consolidated financial statements. Our audits also included evaluating the accounting principles used and significant estimates made by management, as well as evaluating the overall presentation of the consolidated financial statements. Our audit of internal control over financial reporting included obtaining an understanding of internal control over financial reporting, assessing the risk that a material weakness exists, and testing and evaluating the design and operating effectiveness of internal control based on the assessed risk. Our audits also included performing such other procedures as we considered necessary in the circumstances. We believe that our audits provide a reasonable basis for our opinions.
Definition and Limitations of Internal Control over Financial Reporting
A company’s internal control over financial reporting is a process designed to provide reasonable assurance regarding the reliability of financial reporting and the preparation of financial statements for external purposes in accordance with generally accepted accounting principles. A company’s internal control over financial reporting includes those policies and procedures that (i) pertain to the maintenance of records that, in reasonable detail, accurately and fairly reflect the transactions and dispositions of the assets of the company; (ii) provide reasonable assurance that transactions are recorded as necessary to permit preparation of financial statements in accordance with generally accepted accounting principles, and that receipts and expenditures of the company are being made only in accordance with authorizations of management and directors of the company; and (iii) provide reasonable assurance regarding prevention or timely detection of unauthorized acquisition, use, or disposition of the company’s assets that could have a material effect on the financial statements.
Because of its inherent limitations, internal control over financial reporting may not prevent or detect misstatements. Also, projections of any evaluation of effectiveness to future periods are subject to the risk that controls may become inadequate because of changes in conditions, or that the degree of compliance with the policies or procedures may deteriorate.
/s/ PricewaterhouseCoopers LLP
Manchester, United Kingdom
March 19, 2018
We have served as the Company’s auditor since 2015.
F-
2
LUXFER HOLDINGS PLC
CONSOLIDATED INCOME STATEMENT
All amounts in millions, except share and per share data
|
2017
|
2016
|
2015
|
|||||||||||||
|
|
Note
|
$M
|
$M
|
$M
|
|||||||||||
|
REVENUE
|
2
|
441.3
|
|
414.8
|
|
460.3
|
|
||||||||
|
Cost of sales
|
(332.7
|
)
|
(321.4
|
)
|
(356.3
|
)
|
|||||||||
|
Gross profit
|
108.6
|
|
93.4
|
|
104.0
|
|
|||||||||
|
Distribution costs
|
(9.3
|
)
|
(7.8
|
)
|
(7.9
|
)
|
|||||||||
|
Administrative expenses
|
(58.9
|
)
|
(50.8
|
)
|
(52.6
|
)
|
|||||||||
|
Share of results of joint ventures and associates
|
14
|
0.1
|
|
0.5
|
|
(1.2
|
)
|
||||||||
|
TRADING PROFIT
|
2
|
40.5
|
|
35.3
|
|
42.3
|
|
||||||||
|
Profit on sale of redundant site
|
5
|
0.4
|
|
2.1
|
|
—
|
|
||||||||
|
Changes to defined benefit pension plans
|
5
|
—
|
|
0.6
|
|
18.0
|
|
||||||||
|
Restructuring and other expense
|
5
|
(21.6
|
)
|
(2.2
|
)
|
(22.4
|
)
|
||||||||
|
OPERATING PROFIT
|
3
|
19.3
|
|
35.8
|
|
37.9
|
|
||||||||
|
Other income / (expense):
|
|
|
|||||||||||||
|
Net gain / (loss) on acquisitions and disposals
|
5
|
1.3
|
|
0.2
|
|
(2.0
|
)
|
||||||||
|
Finance income:
|
|
|
|||||||||||||
|
Interest received
|
7
|
0.5
|
|
1.2
|
|
0.5
|
|
||||||||
|
Finance costs:
|
|
|
|||||||||||||
|
Interest costs
|
8
|
(7.2
|
)
|
(6.8
|
)
|
(7.4
|
)
|
||||||||
|
IAS 19R retirement benefits finance charge
|
8
|
(1.8
|
)
|
(2.1
|
)
|
(3.0
|
)
|
||||||||
|
Unwind of discount on deferred contingent consideration from acquisitions
|
8
|
(0.2
|
)
|
(0.4
|
)
|
(0.4
|
)
|
||||||||
|
Total finance costs
|
(9.2
|
)
|
(9.3
|
)
|
(10.8
|
)
|
|||||||||
|
PROFIT ON OPERATIONS BEFORE TAXATION
|
11.9
|
|
27.9
|
|
25.6
|
|
|||||||||
|
Income tax expense
|
9
|
(0.4
|
)
|
(6.0
|
)
|
(9.5
|
)
|
||||||||
|
NET INCOME FOR THE YEAR
|
11.5
|
|
21.9
|
|
16.1
|
|
|||||||||
|
Attributable to:
|
|
|
|||||||||||||
|
Equity shareholders
|
11.5
|
|
21.9
|
|
16.1
|
|
|||||||||
|
Earnings per share:
|
|||||||||||||||
|
Basic
|
|||||||||||||||
|
Unadjusted
|
10
|
$
|
0.43
|
|
$
|
0.83
|
|
$
|
0.60
|
|
|||||
|
Diluted
|
|
|
|||||||||||||
|
Unadjusted
|
10
|
$
|
0.43
|
|
$
|
0.82
|
|
$
|
0.59
|
|
|||||
F-
3
LUXFER HOLDINGS PLC
All amounts in millions, except share and per share data
|
2017
|
2016
|
2015
|
||||||||||
|
Note
|
$M
|
$M
|
$M
|
|||||||||
|
Net income for the year
|
11.5
|
|
21.9
|
|
16.1
|
|
||||||
|
Other comprehensive income movements
|
||||||||||||
|
Items that may be reclassified to the consolidated income statement:
|
||||||||||||
|
Exchange differences on translation of foreign operations
|
11.6
|
|
(13.1
|
)
|
(8.6
|
)
|
||||||
|
Fair value movements in cash flow hedges
|
3.1
|
|
1.1
|
|
(5.4
|
)
|
||||||
|
Transfers to consolidated income statement on cash flow hedges
|
0.6
|
|
(0.9
|
)
|
(0.1
|
)
|
||||||
|
Deferred income taxes on cash flow hedges
|
(0.6
|
)
|
—
|
|
1.1
|
|
||||||
|
Hedge accounting income / (loss) adjustments
|
3.1
|
|
0.2
|
|
(4.4
|
)
|
||||||
|
Total hedge accounting and translation of foreign operations movements
|
14.7
|
|
(12.9
|
)
|
(13.0
|
)
|
||||||
|
Items that will not be reclassified to the consolidated income statement:
|
||||||||||||
|
Remeasurement of defined benefit retirement plans
|
29
|
9.5
|
|
(21.7
|
)
|
4.4
|
|
|||||
|
Deferred income taxes on retirement benefits remeasurements
|
23
|
(5.2
|
)
|
4.3
|
|
(1.5
|
)
|
|||||
|
Retirement benefits changes
|
4.3
|
|
(17.4
|
)
|
2.9
|
|
||||||
|
Total other comprehensive income / (loss) movements for the year
|
19.0
|
|
(30.3
|
)
|
(10.1
|
)
|
||||||
|
Total comprehensive income / (loss) for the year
|
30.5
|
|
(8.4
|
)
|
6.0
|
|
||||||
|
Attributed to:
|
|
|
|
|
|
|
||||||
|
Equity shareholders
|
30.5
|
|
(8.4
|
)
|
6.0
|
|
||||||
F-
4
LUXFER HOLDINGS PLC
All amounts in millions, except share and per share data
|
December 31, 2017
|
December 31, 2016
|
||||||||
|
Note
|
$M
|
$M
|
|||||||
|
ASSETS
|
|||||||||
|
Non-current assets
|
|||||||||
|
Property, plant and equipment
|
11
|
125.5
|
|
127.9
|
|
||||
|
Intangible assets
|
12
|
81.7
|
|
80.6
|
|
||||
|
Investments
|
14
|
7.6
|
|
10.0
|
|
||||
|
Deferred income tax assets
|
23
|
16.2
|
|
16.6
|
|
||||
|
Trade and other receivables
|
16
|
0.3
|
|
0.3
|
|
||||
|
231.3
|
|
235.4
|
|
||||||
|
Current assets
|
|
|
|||||||
|
Current investments
|
14
|
1.6
|
|
—
|
|
||||
|
Inventories
|
15
|
82.2
|
|
82.5
|
|
||||
|
Trade and other receivables
|
16
|
72.6
|
|
57.6
|
|
||||
|
Income tax receivable
|
1.6
|
|
2.4
|
|
|||||
|
Cash and cash equivalents
|
17
|
13.3
|
|
13.6
|
|
||||
|
171.3
|
|
156.1
|
|
||||||
|
TOTAL ASSETS
|
402.6
|
|
391.5
|
|
|||||
|
EQUITY AND LIABILITIES
|
|||||||||
|
Capital and reserves
|
|||||||||
|
Ordinary share capital
|
18
|
25.3
|
|
25.3
|
|
||||
|
Deferred share capital
|
18
|
150.9
|
|
150.9
|
|
||||
|
Share premium account
|
18
|
56.4
|
|
56.4
|
|
||||
|
Treasury shares
|
18
|
(5.8
|
)
|
(7.1
|
)
|
||||
|
Own shares held by ESOP
|
18
|
(1.0
|
)
|
(0.5
|
)
|
||||
|
Retained earnings
|
20
|
311.4
|
|
308.1
|
|
||||
|
Hedging reserve
|
20
|
(0.2
|
)
|
(3.3
|
)
|
||||
|
Translation reserve
|
20
|
(46.3
|
)
|
(57.9
|
)
|
||||
|
Share based compensation reserve
|
20
|
5.4
|
|
3.8
|
|
||||
|
Merger reserve
|
20
|
(333.8
|
)
|
(333.8
|
)
|
||||
|
Capital and reserves attributable to the Group's equity shareholders
|
162.3
|
|
141.9
|
|
|||||
|
Total equity
|
162.3
|
|
141.9
|
|
|||||
|
Non-current liabilities
|
|
|
|
|
|||||
|
Bank and other loans
|
21
|
93.8
|
|
121.0
|
|
||||
|
Retirement benefits
|
29
|
55.3
|
|
66.5
|
|
||||
|
Deferred income tax liabilities
|
23
|
3.6
|
|
4.9
|
|
||||
|
Deferred contingent consideration
|
25
|
0.2
|
|
1.5
|
|
||||
|
Provisions
|
22
|
1.1
|
|
1.1
|
|
||||
|
Trade and other payables
|
24
|
1.9
|
|
0.6
|
|
||||
|
155.9
|
|
195.6
|
|
||||||
|
Current liabilities
|
|||||||||
|
Trade and other payables
|
24
|
61.3
|
|
51.1
|
|
||||
|
Current income tax liabilities
|
0.3
|
|
0.1
|
|
|||||
|
Bank and other loans
|
21
|
15.0
|
|
—
|
|
||||
|
Deferred contingent consideration
|
25
|
0.5
|
|
—
|
|
||||
|
Deferred consideration
|
25
|
0.3
|
|
1.3
|
|
||||
|
Provisions
|
22
|
2.8
|
|
1.5
|
|
||||
|
Overdrafts
|
17
|
4.2
|
|
—
|
|
||||
|
84.4
|
|
54.0
|
|
||||||
|
Total liabilities
|
240.3
|
|
249.6
|
|
|||||
|
TOTAL EQUITY AND LIABILITIES
|
402.6
|
|
391.5
|
|
|||||
F-
5
LUXFER HOLDINGS PLC
CONSOLIDATED CASH FLOW STATEMENT
All amounts in millions, except share and per share data
|
2017
|
2016
|
2015
|
||||||||||
|
|
Note
|
$M
|
$M
|
$M
|
||||||||
|
RECONCILIATION OF CASH FLOWS FROM CONTINUING OPERATING ACTIVITIES
|
||||||||||||
|
Net income for the year
|
11.5
|
|
21.9
|
|
16.1
|
|
||||||
|
Adjustments to reconcile net income for the year to net cash flows from continuing operating activities:
|
||||||||||||
|
Income taxes
|
9
|
0.4
|
|
6.0
|
|
9.5
|
|
|||||
|
Depreciation and amortization
|
3
|
19.0
|
|
18.4
|
|
18.6
|
|
|||||
|
Loss on disposal of property, plant and equipment
|
3
|
0.1
|
|
0.2
|
|
—
|
|
|||||
|
Profit on sale of redundant site
|
5
|
(0.4
|
)
|
(2.1
|
)
|
—
|
|
|||||
|
Share based compensation charges net of cash settlement
|
1.7
|
|
1.1
|
|
1.3
|
|
||||||
|
Net interest costs
|
6.7
|
|
5.6
|
|
6.9
|
|
||||||
|
Non-cash restructuring charges
|
||||||||||||
|
Property, plant and equipment impairment
|
11
|
5.0
|
|
|
—
|
|
|
1.7
|
|
|||
|
Intangible assets impairment
|
12
|
2.0
|
|
|
—
|
|
|
3.7
|
|
|||
|
Investment impairment
|
14
|
2.2
|
|
|
—
|
|
|
4.6
|
|
|||
|
Other non-cash restructuring charges
|
1.8
|
|
|
—
|
|
|
7.7
|
|
||||
|
Curtailment and past service credits on retirement benefits obligations
|
5
|
—
|
|
(0.6
|
)
|
(18.2
|
)
|
|||||
|
IAS 19R retirement benefits finance charge
|
6
|
1.8
|
|
2.1
|
|
3.0
|
|
|||||
|
Acquisitions and disposals costs
|
5
|
(1.3
|
)
|
(0.2
|
)
|
2.0
|
|
|||||
|
Unwind of discount on deferred contingent consideration from acquisitions
|
8
|
0.2
|
|
0.4
|
|
0.4
|
|
|||||
|
Share of results of joint ventures and associates
|
14
|
(0.1
|
)
|
(0.5
|
)
|
1.2
|
|
|||||
|
Changes in operating assets and liabilities:
|
||||||||||||
|
Sale of assets classified as held for sale
|
—
|
|
—
|
|
1.2
|
|
||||||
|
(Increase) / decrease in receivables
|
(9.1
|
)
|
(1.8
|
)
|
5.0
|
|
||||||
|
Decrease in inventories
|
5.0
|
|
4.5
|
|
3.0
|
|
||||||
|
Increase / (decrease) in payables
|
9.7
|
|
(10.3
|
)
|
(0.9
|
)
|
||||||
|
Movement in retirement benefits obligations
|
(8.0
|
)
|
(6.3
|
)
|
(8.6
|
)
|
||||||
|
Movement in provisions
|
22
|
1.1
|
|
(2.6
|
)
|
0.3
|
|
|||||
|
Acquisition approach costs paid
|
—
|
|
(1.2
|
)
|
(0.6
|
)
|
||||||
|
Income taxes paid
|
(4.1
|
)
|
(5.4
|
)
|
(5.1
|
)
|
||||||
|
NET CASH FLOWS FROM CONTINUING OPERATING ACTIVITIES
|
45.2
|
|
29.2
|
|
52.8
|
|
||||||
|
CASH FLOWS FROM INVESTING ACTIVITIES
|
||||||||||||
|
Purchases of property, plant and equipment
|
(9.6
|
)
|
(16.5
|
)
|
(15.3
|
)
|
||||||
|
Purchases of intangible assets
|
(1.7
|
)
|
(2.4
|
)
|
(2.1
|
)
|
||||||
|
Proceeds from sale of redundant site
|
—
|
|
3.0
|
|
—
|
|
||||||
|
Receipts from sales of property, plant and equipment
|
0.1
|
|
0.4
|
|
—
|
|
||||||
|
Cash received as compensation for insured assets
|
—
|
|
0.2
|
|
—
|
|
||||||
|
Investment in joint ventures and associates
|
14
|
(1.0
|
)
|
0.2
|
|
(4.2
|
)
|
|||||
|
Interest income received from joint ventures and associates
|
0.1
|
|
0.3
|
|
0.4
|
|
||||||
|
Net cash flows on purchase of businesses
|
25
|
(5.6
|
)
|
(0.3
|
)
|
—
|
|
|||||
|
Acquisition and disposal costs paid
|
(0.4
|
)
|
—
|
|
—
|
|
||||||
|
NET CASH FLOWS FROM INVESTING ACTIVITIES
|
(18.1
|
)
|
(15.1
|
)
|
(21.2
|
)
|
||||||
|
NET CASH FLOWS BEFORE FINANCING
|
27.1
|
|
14.1
|
|
31.6
|
|
||||||
|
CASH FLOWS FROM FINANCING ACTIVITIES
|
||||||||||||
|
Interest and similar finance costs paid on banking facilities
|
(1.9
|
)
|
(1.9
|
)
|
(1.7
|
)
|
||||||
|
Interest paid on Loan Notes
|
(4.3
|
)
|
(4.5
|
)
|
(4.9
|
)
|
||||||
|
Bank interest received
|
0.2
|
|
0.2
|
|
0.2
|
|
||||||
|
(Repayment) / draw down on banking facilities
|
(13.4
|
)
|
(8.5
|
)
|
9.6
|
|
||||||
|
Extension to long term debt—financing costs
|
(1.2
|
)
|
(0.2
|
)
|
—
|
|
||||||
|
Dividends paid
|
19
|
(13.3
|
)
|
(13.3
|
)
|
(10.8
|
)
|
|||||
|
ESOP cash movements
|
18
|
—
|
|
(1.0
|
)
|
0.1
|
|
|||||
|
Proceeds from issue of shares
|
—
|
|
—
|
|
0.2
|
|
||||||
|
Treasury shares cash movements
|
0.3
|
|
(6.3
|
)
|
(1.9
|
)
|
||||||
|
NET CASH FLOWS FROM FINANCING ACTIVITIES
|
|
(33.6
|
)
|
(35.5
|
)
|
(9.2
|
)
|
|||||
|
NET (DECREASE) / INCREASE IN CASH AND CASH EQUIVALENTS
|
|
(6.5
|
)
|
(21.4
|
)
|
22.4
|
|
|||||
|
Net foreign exchange differences
|
|
2.0
|
|
(1.9
|
)
|
(0.1
|
)
|
|||||
|
Net cash and cash equivalents at January 1
|
17
|
13.6
|
|
36.9
|
|
14.6
|
|
|||||
|
Net cash and cash equivalents at December 31
|
17
|
9.1
|
|
13.6
|
|
36.9
|
|
|||||
F-
6
LUXFER HOLDINGS PLC
CONSOLIDATED STATEMENT OF CHANGES IN EQUITY
All amounts in millions, except share and per share data
|
|
Equity attributable to the equity shareholders of the parent
|
||||||||||||||||||||||||||
|
|
Ordinary
share
capital
|
Deferred
share
capital
|
Share
premium
account
|
Treasury
shares
|
Retained
earnings
|
Own shares
held
by ESOP
|
Other Reserves
(1)
|
Total
equity
|
|||||||||||||||||||
|
Note
|
$M
|
$M
|
$M
|
$M
|
$M
|
$M
|
$M
|
$M
|
|||||||||||||||||||
|
At January 1, 2015
|
25.3
|
|
150.9
|
|
56.2
|
|
—
|
|
308.8
|
|
(0.4
|
)
|
(365.4
|
)
|
175.4
|
|
|||||||||||
|
Net income for the year
|
—
|
|
—
|
|
—
|
|
—
|
|
16.1
|
|
—
|
|
—
|
|
16.1
|
|
|||||||||||
|
Currency translation differences
|
—
|
|
—
|
|
—
|
|
—
|
|
—
|
|
—
|
|
(8.6
|
)
|
(8.6
|
)
|
|||||||||||
|
Increase in fair value of cash flow hedges
|
—
|
|
—
|
|
—
|
|
—
|
|
—
|
|
—
|
|
(5.4
|
)
|
(5.4
|
)
|
|||||||||||
|
Transfer to consolidated income statement on cash flow hedges
|
—
|
|
—
|
|
—
|
|
—
|
|
—
|
|
—
|
|
(0.1
|
)
|
(0.1
|
)
|
|||||||||||
|
Remeasurement of defined benefit retirement plans
|
—
|
|
—
|
|
—
|
|
—
|
|
4.4
|
|
—
|
|
—
|
|
4.4
|
|
|||||||||||
|
Deferred income taxes on items taken to other comprehensive income
|
—
|
|
—
|
|
—
|
|
—
|
|
(1.5
|
)
|
—
|
|
1.1
|
|
(0.4
|
)
|
|||||||||||
|
Total comprehensive income for the year
|
—
|
|
—
|
|
—
|
|
—
|
|
19.0
|
|
—
|
|
(13.0
|
)
|
6.0
|
|
|||||||||||
|
Equity dividends
|
19
|
—
|
|
—
|
|
—
|
|
—
|
|
(10.8
|
)
|
—
|
|
—
|
|
(10.8
|
)
|
||||||||||
|
Equity settled share based compensation charges
|
—
|
|
—
|
|
—
|
|
—
|
|
—
|
|
—
|
|
0.9
|
|
0.9
|
|
|||||||||||
|
Arising from issue of share capital
|
18
|
—
|
|
—
|
|
0.2
|
|
—
|
|
—
|
|
—
|
|
—
|
|
0.2
|
|
||||||||||
|
Purchase of own shares
|
18
|
—
|
|
—
|
|
—
|
|
(1.9
|
)
|
—
|
|
—
|
|
—
|
|
(1.9
|
)
|
||||||||||
|
Purchase of shares from ESOP
|
18
|
—
|
|
—
|
|
—
|
|
—
|
|
—
|
|
0.1
|
|
—
|
|
0.1
|
|
||||||||||
|
Utilization of treasury shares
|
18
|
—
|
|
—
|
|
—
|
|
0.6
|
|
(0.1
|
)
|
—
|
|
(0.5
|
)
|
—
|
|
||||||||||
|
Deferred income taxes on items taken to equity
|
23
|
—
|
|
—
|
|
—
|
|
—
|
|
(0.3
|
)
|
—
|
|
—
|
|
(0.3
|
)
|
||||||||||
|
Exchange movement on ESOP
|
18
|
—
|
|
—
|
|
—
|
|
—
|
|
—
|
|
0.1
|
|
—
|
|
0.1
|
|
||||||||||
|
Other changes in equity in the year
|
—
|
|
—
|
|
0.2
|
|
(1.3
|
)
|
(11.2
|
)
|
0.2
|
|
0.4
|
|
(11.7
|
)
|
|||||||||||
|
At December 31, 2015
|
25.3
|
|
150.9
|
|
56.4
|
|
(1.3
|
)
|
316.6
|
|
(0.2
|
)
|
(378.0
|
)
|
169.7
|
|
|||||||||||
|
Net income for the year
|
—
|
|
—
|
|
—
|
|
—
|
|
21.9
|
|
—
|
|
—
|
|
21.9
|
|
|||||||||||
|
Currency translation differences
|
—
|
|
—
|
|
—
|
|
—
|
|
—
|
|
—
|
|
(13.1
|
)
|
(13.1
|
)
|
|||||||||||
|
Increase in fair value of cash flow hedges
|
—
|
|
—
|
|
—
|
|
—
|
|
—
|
|
—
|
|
1.1
|
|
1.1
|
|
|||||||||||
|
Transfer to consolidated income statement on cash flow hedges
|
—
|
|
—
|
|
—
|
|
—
|
|
—
|
|
—
|
|
(0.9
|
)
|
(0.9
|
)
|
|||||||||||
|
Remeasurement of defined benefit retirement plans
|
—
|
|
—
|
|
—
|
|
—
|
|
(21.7
|
)
|
—
|
|
—
|
|
(21.7
|
)
|
|||||||||||
|
Deferred income taxes on items taken to other comprehensive income
|
23
|
—
|
|
—
|
|
—
|
|
—
|
|
4.3
|
|
—
|
|
—
|
|
4.3
|
|
||||||||||
|
Total comprehensive income for the year
|
—
|
|
—
|
|
—
|
|
—
|
|
4.5
|
|
—
|
|
(12.9
|
)
|
(8.4
|
)
|
|||||||||||
|
Equity dividends
|
19
|
—
|
|
—
|
|
—
|
|
—
|
|
(13.3
|
)
|
—
|
|
—
|
|
(13.3
|
)
|
||||||||||
|
Equity settled share based compensation charges
|
—
|
|
—
|
|
—
|
|
—
|
|
—
|
|
—
|
|
1.2
|
|
1.2
|
|
|||||||||||
|
Purchase of own shares
|
18
|
—
|
|
—
|
|
—
|
|
(6.3
|
)
|
—
|
|
—
|
|
—
|
|
(6.3
|
)
|
||||||||||
|
Purchase of shares into ESOP
|
18
|
—
|
|
—
|
|
—
|
|
—
|
|
—
|
|
(1.0
|
)
|
—
|
|
(1.0
|
)
|
||||||||||
|
Utilization of treasury shares
|
18
|
—
|
|
—
|
|
—
|
|
0.5
|
|
0.1
|
|
—
|
|
(0.6
|
)
|
—
|
|
||||||||||
|
Utilization of shares from ESOP
|
18
|
—
|
|
—
|
|
—
|
|
—
|
|
0.2
|
|
0.7
|
|
(0.9
|
)
|
—
|
|
||||||||||
|
Other changes in equity in the year
|
—
|
|
—
|
|
—
|
|
(5.8
|
)
|
(13.0
|
)
|
(0.3
|
)
|
(0.3
|
)
|
(19.4
|
)
|
|||||||||||
|
At December 31, 2016
|
25.3
|
|
150.9
|
|
56.4
|
|
(7.1
|
)
|
308.1
|
|
(0.5
|
)
|
(391.2
|
)
|
141.9
|
|
|||||||||||
|
Net income for the year
|
—
|
|
—
|
|
—
|
|
—
|
|
11.5
|
|
—
|
|
—
|
|
11.5
|
|
|||||||||||
|
Currency translation differences
|
—
|
|
—
|
|
—
|
|
—
|
|
—
|
|
—
|
|
11.6
|
|
11.6
|
|
|||||||||||
|
Increase in fair value of cash flow hedges
|
—
|
|
—
|
|
—
|
|
—
|
|
—
|
|
—
|
|
3.1
|
|
3.1
|
|
|||||||||||
|
Transfer to consolidated income statement on cash flow hedges
|
—
|
|
—
|
|
—
|
|
—
|
|
—
|
|
—
|
|
0.6
|
|
0.6
|
|
|||||||||||
|
Remeasurement of defined benefit retirement plans
|
—
|
|
—
|
|
—
|
|
—
|
|
9.5
|
|
—
|
|
—
|
|
9.5
|
|
|||||||||||
|
Deferred income taxes on items taken to other comprehensive income
|
23
|
—
|
|
—
|
|
—
|
|
—
|
|
(5.2
|
)
|
—
|
|
(0.6
|
)
|
(5.8
|
)
|
||||||||||
|
Total comprehensive income for the year
|
—
|
|
—
|
|
—
|
|
—
|
|
15.8
|
|
—
|
|
14.7
|
|
30.5
|
|
|||||||||||
|
Equity dividends
|
19
|
—
|
|
—
|
|
—
|
|
—
|
|
(13.3
|
)
|
—
|
|
—
|
|
(13.3
|
)
|
||||||||||
|
Equity settled share based compensation charges
|
—
|
|
—
|
|
—
|
|
—
|
|
—
|
|
—
|
|
2.6
|
|
2.6
|
|
|||||||||||
|
Purchase of shares into ESOP
|
18
|
—
|
|
—
|
|
—
|
|
0.8
|
|
—
|
|
(0.8
|
)
|
—
|
|
—
|
|
||||||||||
|
Utilization of treasury shares
|
18
|
—
|
|
—
|
|
—
|
|
0.5
|
|
0.1
|
|
—
|
|
(0.6
|
)
|
—
|
|
||||||||||
|
Utilization of shares from ESOP
|
18
|
—
|
|
—
|
|
—
|
|
—
|
|
0.1
|
|
0.3
|
|
(0.4
|
)
|
—
|
|
||||||||||
|
Deferred income taxes on items taken to equity
|
23
|
—
|
|
—
|
|
—
|
|
—
|
|
0.6
|
|
—
|
|
—
|
|
0.6
|
|
||||||||||
|
Other changes in equity in the year
|
|
—
|
|
—
|
|
—
|
|
1.3
|
|
(12.5
|
)
|
(0.5
|
)
|
1.6
|
|
(10.1
|
)
|
||||||||||
|
At December 31, 2017
|
|
25.3
|
|
150.9
|
|
56.4
|
|
(5.8
|
)
|
311.4
|
|
(1.0
|
)
|
(374.9
|
)
|
162.3
|
|
||||||||||
|
(1)
|
Other reserves include a hedging reserve of a loss of
$0.2 million
(
2016
: a loss of
$3.3 million
and
2015
: a loss of
$3.5 million
), a translation reserve of
$46.3 million
(
2016
:
$57.9 million
and
2015
:
$44.8 million
), a merger reserve of
$333.8 million
(
2016
and
2015
:
$333.8 million
) and a share based compensation reserve of
$5.4 million
(
2016
:
$3.8 million
and
2015
:
$4.1 million
).
|
F-
7
LUXFER HOLDINGS PLC
NOTES TO THE CONSOLIDATED FINANCIAL STATEMENTS (Continued)
All amounts in millions, except share and per share data
|
1.
|
Accounting policies
|
Basis of preparation and statement of compliance with IFRS
The consolidated financial statements have been prepared in accordance with the International Financial Reporting Standards (IFRS) as issued by the International Accounting Standards Board as they apply to the consolidated financial statements of the Group and interpretations issued by IFRS Interpretation Committee, for the year ended
December 31, 2017
. The consolidated financial statements have been prepared on a historical cost basis, except where IFRS requires or permits fair value measurement.
The directors have a reasonable expectation that the Group has adequate resources to continue in operational existence for the foreseeable future. Therefore the directors continue to apply the going concern basis for accounting in the preparation of the consolidated financial statements.
For the purpose of the accompanying consolidated financial statements, subsequent events have been evaluated through to
March 19, 2018
, which is the date the consolidated financial statements were authorized by the Board. The consolidated financial statements were issued on
March 19, 2018
.
Basis of consolidation
The consolidated financial statements comprise the financial statements of Luxfer Holdings PLC and its subsidiaries (the "Group") at
December 31
each year. The financial statements of the subsidiaries are prepared for the same reporting year as the parent company, using consistent accounting policies. All inter-company balances and transactions, including unrealized profits arising from intra-Group transactions, have been eliminated in full.
Subsidiaries are consolidated from the date on which control is transferred to the Group and cease to be consolidated from the date on which control is transferred out of the Group.
The accounting policies which follow, set out those polices which apply in preparing the consolidated financial statements for the years ended
December 31, 2015
,
December 31, 2016
and
December 31, 2017
.
Presentation currency
The consolidated financial statements are presented in U.S. dollars and all values are rounded to the nearest
$0.1 million
except when otherwise indicated. The books of the Group's non-U.S. entities are converted to U.S. dollars at each reporting period date in accordance with the accounting policy below.
The functional currency of the holding company Luxfer Holdings PLC and its U.K. subsidiaries remains GBP sterling, being the most appropriate currency for those particular operations.
Business combinations and goodwill
Business combinations are accounted for using the acquisition method. The cost of an acquisition is measured as the aggregate of the consideration transferred, measured at acquisition date fair value, and the amount of any non-controlling interest in the acquiree. The choice of measurement of non-controlling interest, either at fair value or at the proportionate share of the acquiree's identifiable net assets, is determined on a transaction by transaction basis. Acquisition costs are expensed as incurred.
Goodwill is initially measured at cost, being the excess of the aggregate of the acquisition-date fair value of the consideration transferred and the amount recognized for the non-controlling interest over the net identifiable amounts of the assets acquired and the liabilities assumed in exchange for the business combination. After initial recognition, goodwill is measured at cost less any accumulated impairment losses. For the purpose of impairment testing, goodwill acquired in a business combination is, from the acquisition date, allocated to the Group's cash generating units that are expected to benefit from the combination. .
Goodwill arising on acquisitions before the date of transition to IFRS has been retained at the previous U.K. GAAP amounts subject to being tested for impairment at that date and in subsequent years.
A bargain purchase is measured at cost being the excess of the net identifiable amounts of the assets acquired and the liabilities assumed in exchange for the business combination over the aggregate of the acquisition-date fair value of the consideration transferred and the amount recognized for the non-controlling interest. Any amount of a bargain purchase is recognized immediately as income.
LUXFER HOLDINGS PLC
NOTES TO THE CONSOLIDATED FINANCIAL STATEMENTS (Continued)
All amounts in millions, except share and per share data
1. Accounting policies (continued)
Contingent consideration arising as a result of a business combination is recognized at fair value at the acquisition date. Subsequent changes in the fair value of contingent consideration classified as an asset or liability are accounted for in accordance with the relevant IFRSs.
Other intangible assets
Other intangible assets excluding development costs, are measured initially at purchase cost, or where acquired in a business combination at fair value, and are amortized on a straight-line basis over their estimated useful lives as shown in the table below.
Research expenditure is expensed as incurred. Internal development expenditure is charged as administrative costs to the consolidated income statement in the year it is incurred unless it meets the recognition criteria of IAS 38 "Intangible Assets". Where the recognition criteria are met, intangible assets are capitalized and amortized over their estimated useful economic lives from product launch, as shown in the table below. Intangible assets relating to products in development are subject to impairment testing at each balance sheet date or earlier upon indication of impairment.
|
Technology and patents
|
14 – 20 years
|
||
|
Tradenames and trademarks
|
20 – 25 years
|
||
|
Customer relationships
|
10 – 15 years
|
||
|
Backlogs and non-compete agreements
|
5 – 6 years
|
||
|
Development costs
|
5 – 10 years
|
||
|
Software
|
4 – 7 years
|
||
The carrying values are reviewed for impairment when events or changes in circumstances indicate that the carrying value may not be recoverable. Reviews are made annually of the estimated remaining lives and residual values of the patents and trademarks.
Revenue
Revenue is measured at the fair value of the consideration received or receivable, and represents amounts receivable for goods supplied, less inter-company revenue, estimated rebates, returns, settlement discounts and sales tax.
Sale of goods
Revenue for the sale of goods is recognized when all of the following conditions are satisfied:
|
•
|
The significant risks and rewards of ownership of the goods have been transferred to the buyer;
|
|
•
|
The Group retain neither continuing managerial involvement to the degree usually associated with ownership nor effective control over the goods sold;
|
|
•
|
The amount of revenue can be reliably measured;
|
|
•
|
It is probable that future economic benefits will flow to the entity; and
|
|
•
|
The costs incurred or to be incurred in respect of the transaction can be measured reliably.
|
Royalties
Royalty revenue is recognized on an accrual basis in accordance with the substance of the relevant agreements, provided that it is probable that the economic benefits will flow to the Group and the amount of revenue can be measured reliably.
F-
9
LUXFER HOLDINGS PLC
NOTES TO THE CONSOLIDATED FINANCIAL STATEMENTS (Continued)
All amounts in millions, except share and per share data
1. Accounting policies (continued)
Tooling revenue
Revenue recognition associated with tooling contracts is recognized in proportion to the progress and costs incurred as a percentage of total expected costs. Payments made in advance of work performed and raw materials purchased for which no work has been performed are excluded from the calculations and are accounted for as deferred income and inventory respectively. Where customer acceptance is on final completion and handover of the tool, revenue is recognized at the point the customer accepts ownership of the tool.
Property, plant and equipment
Property, plant and equipment is stated at cost less accumulated depreciation and any impairment in value. Depreciation is initially calculated on a straight-line basis over the estimated useful life of the particular asset. As a result of the complexity of our manufacturing process, there is a wide range of plant and equipment in operation. The rate of annual charge is summarized as follows:
|
Freehold buildings
|
3% – 10%
|
||
|
Leasehold land and buildings
|
The lesser of life of lease or freehold rate
|
||
|
Plant and equipment
|
4% – 30%
|
||
|
Including:
|
|
||
|
Heavy production equipment (including casting, rolling, extrusion and press equipment)
|
4% – 6%
|
||
|
Chemical production plant and robotics
|
10% – 15%
|
||
|
Other production machinery
|
10% – 20%
|
||
|
Furniture, fittings, storage and equipment
|
10% – 30%
|
||
Freehold land is not depreciated.
Reviews are made annually of the estimated remaining lives and residual values of individual productive assets, taking account of commercial and technological obsolescence as well as normal wear and tear.
For any individual asset the carrying value is reviewed for impairment when events or changes in circumstances indicate the carrying value may not be recoverable. If any such indication exists and where the carrying value exceeds the estimated recoverable amount, the asset is written-down to its recoverable amount. The recoverable amount of property, plant and equipment is the greater of the fair value less costs of disposal and the value in use. In assessing the value in use, the estimated future cash flows are discounted to their present value using a pre-tax discount rate that reflects current market assessments of the time value of money and the risks specific to the asset. For an asset that does not generate largely independent cash inflows, the recoverable amount is determined for the cash-generating unit to which the asset belongs. Impairment losses are recognized in the consolidated income statement as part of the profit or loss on operations before taxation.
An item of property, plant and equipment is derecognized upon disposal or when no future economic benefits are expected to arise from the continued use of the asset. Any gain or loss arising on derecognition of the asset (calculated as the difference between the net disposal proceeds and the carrying value of the item) is included in the consolidated income statement in the year the item is derecognized.
Maintenance costs in relation to an item of property, plant and equipment are expensed as incurred.
Inventories
Inventories are stated at the lower of cost and net realizable value. Raw materials are valued on a first-in, first-out basis. Strategic purchases of inventories in order to secure supply and reduce the impact of price volatility on the cost of inventories are valued on an average cost basis. Work in progress and finished goods costs comprise direct materials and, where applicable, direct labor costs, an apportionment of production overheads and any other costs that have been incurred in bringing the inventories to their present location and condition. Net realizable value represents the estimated selling price less all estimated costs of completion and costs to be incurred in selling and distribution. Inventories are reviewed on a regular basis, and we will make allowance for excess or obsolete inventories and write-down to net realizable value based primarily on committed sales prices and our estimates of expected and future product demand and related pricing.
F-
10
LUXFER HOLDINGS PLC
NOTES TO THE CONSOLIDATED FINANCIAL STATEMENTS (Continued)
All amounts in millions, except share and per share data
1. Accounting policies (continued)
Foreign currencies
Transactions in currencies other than an operation's functional currency are initially recorded in the functional currency at the rate of exchange prevailing on the dates of transactions. At each balance sheet date, the foreign currency monetary assets and liabilities are translated into the functional currency at the rates prevailing on the balance sheet date.
All differences are taken to the consolidated income statement with the exception of differences on foreign currency borrowings that provide a hedge against a net investment in a foreign entity. These are taken directly to equity until the disposal of the net investment, at which time they are recognized in the consolidated income statement. Tax charges and credits attributable to exchange differences on those borrowings are also dealt with in equity.
On consolidation, the assets and liabilities of the Group's foreign operations are translated at exchange rates prevailing on the balance sheet date. Income and expense items are translated at the average exchange rates for the period. Exchange differences that arise, if any, are classified as equity and transferred to the Group's translation reserve. Such translation differences are recognized in the consolidated income statement in the period in which the operation is disposed or partially disposed.
Income taxes
Current income taxes
Current income tax assets and liabilities for the current period are measured at the amount expected to be recovered from or paid to the taxation authorities. The tax rates and tax laws used to compute the amount are those that are enacted, or substantively enacted, at the reporting date in the countries where the Group operates and generates taxable income.
Current income taxes relating to items recognized directly in equity is recognized in equity and not in the consolidated income statement. Management periodically evaluates positions taken in the tax returns with respect to situations in which applicable tax regulations are subject to interpretation and establishes provisions where appropriate.
Deferred income taxes
Deferred income taxes are the future income taxes expected to be payable or recoverable on differences between the carrying values of assets and liabilities in the consolidated financial statements and the corresponding tax bases used in the computation of taxable profit, and are accounted for using the balance sheet liability method. Deferred income tax liabilities are generally recognized for all taxable temporary differences. Deferred income tax assets are recognized to the extent that it is probable that taxable profits will be available against which deductible temporary differences can be utilized. Such assets and liabilities are not recognized if the temporary difference arises from goodwill or from the initial recognition (other than in a business combination) of other assets and liabilities in a transaction that affects neither the tax profit nor the accounting profit.
Deferred income tax liabilities are recognized for taxable temporary differences arising on investments in subsidiaries, investments in associates, and interests in joint ventures, except where the Group is able to control the reversal of the temporary difference and it is probable that the temporary difference will not reverse in the foreseeable future.
The carrying value of a deferred income tax asset is reviewed at each balance sheet date and reduced to the extent that it is no longer probable that sufficient taxable profits will be available to allow all or part of the asset to be recovered.
Deferred income taxes are calculated at the tax rate that is expected to apply in the period when the liability is settled or the asset is realized based on tax rates and tax laws that have been enacted or substantively enacted at the balance sheet date. Deferred income taxes are charged or credited to the consolidated income statement, except when it relates to items charged or credited directly to equity, in which case the deferred income taxes are also dealt with in equity.
F-
11
LUXFER HOLDINGS PLC
NOTES TO THE CONSOLIDATED FINANCIAL STATEMENTS (Continued)
All amounts in millions, except share and per share data
1. Accounting policies (continued)
Leases
Leases where the lessor retains substantially all the risks and benefits of ownership of the asset are classified as operating leases. Operating lease payments are recognized as an expense in the consolidated income statement on a straight-line basis over the lease term.
Retirement benefits costs
In respect of defined benefit plans, obligations are measured at the present value whilst plan assets are recorded at fair value. The cost of providing benefits is determined using the Projected Unit Credit Method, with actuarial valuations being carried out at each balance sheet date.
The charge to the consolidated income statement is based on an actuarial calculation of the Group's portion of the annual expected costs of the benefit plans and the net interest cost, which is calculated by applying the discount rate to the net defined benefit obligation, taking into account contributions and benefits paid. Remeasurements are recognized in the statement of comprehensive income.
When a settlement or curtailment occurs the obligation and related plan assets are remeasured using current actuarial assumptions and the resultant gain or loss recognized in the consolidated income statement in the period in which the settlement or curtailment occurs.
Payments to defined contribution plans are charged as an expense as they fall due.
Provisions
Provisions are recognized when the Group has a present obligation as a result of a past event, it is probable that a transfer of resources will be required to settle the obligation, and a reliable estimate can be made of the amount of the obligation.
Share based compensation
The cost of equity settled transactions is recognized, based upon the fair value at grant date, together with a corresponding increase in the share based compensation reserve in equity, over the period in which the performance or service conditions are fulfilled. The cumulative expense recognized for equity settled transactions at each reporting date until the vesting date reflects the extent to which the vesting period has expired and the Group's best estimate of the number of equity instruments that will ultimately vest. The consolidated income statement expense or credit for a period represents the movement in cumulative expense recognized at the beginning and end of that period.
Separate disclosure of expenses or income
Certain items of expense or income are presented separately based on management's judgment that they need to be disclosed by virtue of their size, nature or incidence in order to provide a proper understanding of our results of operations and financial condition. Such items of expense or income incurred during a period are disclosed under identifiable headings in the consolidated income statement and further explained in Note 5 to the consolidated financial statements. Examples of such items include but are not limited to:
|
•
|
Restructuring of the activities of the Group and reversals of any provisions for the costs of restructuring;
|
|
•
|
write-downs of inventories to net realizable value or of property, plant and equipment to recoverable amount, as well as reversals of such write-downs;
|
|
•
|
disposals of items of property, plant and equipment;
|
|
•
|
disposals of investments and subsidiaries;
|
|
•
|
discontinued operations;
|
|
•
|
litigation settlements; and
|
|
•
|
other material reversals of provisions.
|
F-
12
LUXFER HOLDINGS PLC
NOTES TO THE CONSOLIDATED FINANCIAL STATEMENTS (Continued)
All amounts in millions, except share and per share data
1. Accounting policies (continued)
The nature of the items of expense or income is considered to determine whether the item should be presented as part of operating profit or loss or as other expenses or income. The trading profit and adjusted earnings per share calculations, presented by the Group exclude the impact of these items. Management believes that the use of adjusted measures such as this provides additional useful information on underlying trends to shareholders.
Cash and cash equivalents
Cash and cash equivalents in the balance sheet comprise cash at bank and in hand and short-term deposits with an original maturity date of three months or less. For the purpose of the consolidated cash flow statement, cash and cash equivalents consist of cash and cash equivalents as defined above, but net of bank overdrafts.
Interest in joint ventures
The Group has applied IFRS 11 to all joint arrangements. Under IFRS 11, investments in joint arrangements are classified as either joint operations or joint ventures depending on the contractual rights and obligations of each investor. The Group has assessed the nature of its joint arrangements and determined them to be joint ventures. Joint ventures are accounted for using the equity method of accounting. Under the equity method of accounting, interests in joint ventures are initially recognized at cost and adjusted thereafter to recognize the Group's share of the post-acquisition profits or losses and movements in other comprehensive income.
When the Group's share of losses in a joint venture equals or exceeds its interests in the joint ventures (which includes any long-term interests that, in substance, form part of the Group's net investment in the joint ventures), the Group does not recognize further losses, unless it has incurred legal or constructive obligations or made payments on behalf of the joint ventures.
The Group determines at each reporting date whether there is any objective evidence that the investment in the joint venture is impaired. If the investment is impaired, the Group calculates the amount of impairment as the difference between the recoverable amount of the joint venture and its carrying value and recognizes the amount as 'restructuring and other expense' in the consolidated income statement.
Gains or losses resulting from upstream and downstream transactions between the Group and its joint venture are recognized in the Group's consolidated financial statements only to the extent of unrelated investor's interests in the joint venture. Unrealized losses are eliminated unless the transaction provides evidence of an impairment of the asset transferred. Accounting policies of the joint ventures have been changed where necessary to ensure consistency with the policies adopted by the Group.
Interest in associates
Associates are all entities over which the Group has significant influence but not control, generally accompanying a shareholding of between
20%
and
50%
of the voting rights. Investments in associates are accounted for using the equity method of accounting. Under the equity method of accounting, the investment is initially recognized at cost, and the carrying value is increased or decreased to recognize the investor's share of the profit or loss and movements in other comprehensive income of the investee after the date of acquisition.
If the ownership interest in an associate is reduced but significant influence is retained, only a proportionate share of the amounts previously recognized in other comprehensive income is reclassified to profit or loss where appropriate.
The Group's share of post-acquisition profit or loss is recognized in the consolidated income statement, and its share of post-acquisition movements in other comprehensive income is recognized in other comprehensive income with a corresponding adjustment to the carrying value of the investment. When the Group's share of losses in an associate equals or exceeds its interest in the associate, including other unsecured receivables, the Group does not recognize further losses, unless it has incurred legal or constructive obligations or made payments on behalf of the associate.
The Group determines at each reporting date whether there is any objective evidence that the investment in the associate is impaired. If this is the case, the Group calculates the amount of impairment as the difference between the recoverable amount of the associate and its carrying value and recognizes the amount as 'restructuring and other expense' in the consolidated income statement.
F-
13
LUXFER HOLDINGS PLC
NOTES TO THE CONSOLIDATED FINANCIAL STATEMENTS (Continued)
All amounts in millions, except share and per share data
1. Accounting policies (continued)
Gains or losses resulting from upstream and downstream transactions between the Group and its associate are recognized in the Group's consolidated financial statements only to the extent of unrelated investor's interests in the associates. Unrealized losses are eliminated unless the transaction provides evidence of an impairment of the asset transferred. Accounting policies of associates have been changed where necessary to ensure consistency with the policies adopted by the Group.
Dilution gains and losses arising in investments in associates are recognized in the consolidated income statement.
Financial assets and liabilities
Trade and other receivables
Trade receivables do not carry any interest and are stated at their nominal value as reduced by appropriate allowances for estimated irrecoverable amounts.
Bank and other loans
Bank and other loans are recorded at the fair value of the proceeds received net of directly attributable transaction costs. Issue costs relating to revolving credit facilities are charged to the consolidated income statement over the estimated life of the facility on a periodic basis and are added to the carrying value of the facility. Issue costs relating to fixed term loans are charged to the consolidated income statement using the effective interest method and are added to the carrying value of the fixed term loan.
Trade payables
Trade payables are not interest bearing and are stated at their nominal value.
Derivative financial instruments
The Group uses derivative financial instruments such as foreign currency contracts to hedge its risks associated with foreign currency fluctuations. Such derivative financial instruments are stated at fair value.
Hedges are classified as cash flow hedges when they hedge exposure to variability in cash flows either attributable to a particular risk associated with a recognized asset or liability or a highly probable forecast transaction.
In relation to cash flow hedges to hedge the foreign currency risk of firm commitments which meet the conditions for special hedge accounting, the portion of the gain or loss on the hedging instrument that is determined to be an effective hedge is recognized directly in equity and the ineffective portion is recognized in the consolidated income statement.
In relation to derivative financial instruments used to hedge a forecast transaction, the portion of the gain or loss on the hedging instrument that is determined to be an effective hedge is recognized directly in equity and the ineffective portion is recognized in the consolidated income statement. Amounts taken to equity are transferred to the consolidated income statement when the hedged transaction affects profit or loss.
Financial liabilities and equity instruments
Financial liabilities and equity instruments issued by the Group are recorded at the proceeds received, net of direct issue costs.
Financial liabilities and equity instruments are all instruments that are issued by the Group as a means of raising finance, including shares, loan notes, debentures, debt instruments and options and warrants that give the holder the right to subscribe for or obtain financial liabilities and equity instruments.
An equity instrument is any contract that evidences a residual interest in the assets of an entity after deducting all of its liabilities. All equity instruments are included in shareholders' funds. The finance costs incurred in respect of an equity instrument are charged directly to the consolidated income statement. Other instruments are classified as financial liabilities if they contain a contractual obligation to transfer economic benefits.
F-
14
LUXFER HOLDINGS PLC
NOTES TO THE CONSOLIDATED FINANCIAL STATEMENTS (Continued)
All amounts in millions, except share and per share data
1. Accounting policies (continued)
Critical accounting judgments and key sources of estimation uncertainty
The key assumptions concerning the future, and other key sources of estimation uncertainty at the balance sheet date, that have a significant risk of causing a material adjustment to the carrying values of assets and liabilities within the next financial year, are discussed below. The judgments used by management in the application of the Group's accounting policies in respect of these key areas of estimation are considered to be the most significant. The below policies include both elements of judgments and estimates.
Impairment of non-financial assets
The Group assesses whether there are any indicators of impairment for all non-financial assets at each reporting date. Goodwill is tested for impairment annually and at other times when such indicators exist. Other non-financial assets are tested for impairment when there are indicators that the carrying value may not be recoverable. Further details are given in Note 13.
When value in use calculations are undertaken, management must estimate the expected future cash flows from the asset or cash generating unit, including suitable sales growth and terminal growth rates, and choose a suitable discount rate in order to calculate the present value of those cash flows. Details regarding goodwill and assumptions used in carrying out the impairment review are given in Note 13.
Pensions
Determining the present value of future obligations of pensions requires an estimation of future mortality rates, future salary increases, future pension increases, future inflation increases and discount rates. These assumptions are determined in association with qualified actuaries. Due to the long-term nature of these plans, such estimates are subject to significant uncertainty. The pension liabilities at
December 31, 2017
are
$55.3 million
(
2016
:
$66.5 million
). Further details are given in Note 29.
Deferred income taxes
Deferred income tax assets are recognized for unabsorbed tax losses and unutilized capital allowances to the extent that it is probable that taxable profit will be available against which the losses and capital allowances can be utilized. Judgment is required to determine the amount of deferred income tax assets that can be recognized, based upon the likely timing and level of future taxable profits together with future tax planning strategies. Further details are given in Note 23.
Inventories obsolescence and inventories write down
Inventories are stated at the lower of cost and net realizable value. Inventories are reviewed on a regular basis, and we will make allowance for excess or obsolete inventories and write down to net realizable value based primarily on committed sales prices and our estimates of expected and future product demand and related pricing. Further details are given in Note 15.
Measurement of contingent consideration
Contingent consideration arising from business combinations is valued at fair value at the acquisition date. When the contingent consideration meets the definition of a financial liability, it is subsequently remeasured to fair value at each reporting date. The determination of the fair value is based on an estimate of the future profitability of the acquired businesses. Further details are given in Note 25.
Changes in accounting policies
The accounting policies adopted are consistent with those of the previous financial year except for the following new and amended standards and interpretations during the year that are applicable to the Group. Adoption of these revised standards and interpretations did not have any significant effect on the consolidated financial statements of the Group.
|
International Financial Reporting Standards
|
Effective date
|
||||
|
IAS 7
|
Statement of cash flows (Amendments)
|
January 1, 2017
|
|||
|
IAS 12
|
Income taxes (Amendments)
|
January 1, 2017
|
|||
F-
15
LUXFER HOLDINGS PLC
NOTES TO THE CONSOLIDATED FINANCIAL STATEMENTS (Continued)
All amounts in millions, except share and per share data
1. Accounting policies (continued)
New standards and amendments to standards not applied
The IASB has issued the following standards and amendments to standards with a mandatory effective date on or after January 1, 2018:
|
International Financial Reporting Standards
|
Mandatory effective date
|
||||
|
IFRS 2
|
Share based payments (Amendments)
|
No earlier than January 1, 2018
|
|||
|
IFRS 15
|
Revenue from Contracts with Customers
|
No earlier than January 1, 2018
|
|||
|
IFRS 9
|
Financial Instruments
|
No earlier than January 1, 2018
|
|||
|
IFRS 16
|
Leases
|
No earlier than January 1, 2019
|
|||
The Group applies IFRS as issued by the IASB.
The directors do not expect that the adoption of the standards listed above will have a material impact on the consolidated financial statements of the Group in future periods, except as follows:
|
•
|
IFRS 15—A five step approach will be taken in respect to recognizing revenue. Having undertaken a detailed review of our material revenue streams within the Group, revenue will continue to be recognized over the same profile as currently under IAS 18 and therefore there will be no change to the timing of revenue recognition. Incremental and contract fulfillment costs will need to be assessed on an ongoing basis, but at present there are no applicable costs. As a result there is not expected to be any material difference in our reported revenue numbers under IFRS 15 compared to what is currently reported under IAS 18;
|
|
•
|
IFRS 9—Financial assets will continue to be classified and measured at amortized cost under IFRS 9. The directors anticipate that the timing of the recognition of impairments will change rather than the size of the balance. Foreign currency exchange contracts should not be impacted although the ability to hedge component parts of the commodity hedges should allow us to decrease the risk of ineffectiveness; and
|
|
•
|
IFRS 16—Currently disclosed operating leases would be brought on to the balance sheet, with an offsetting liability and a depreciation charge and a finance charge would replace the lease expense charge to operating income, with the latter going through finance costs. The current level of operating lease commitments is disclosed in Note 26. These will be included within the balance sheet at a discounted amount, once the standard is adopted. These leases relate to company cars, real property leases and other vehicles. Low value assets (less than $5,000) and short-term (less than twelve months) leases do not need to be brought onto the balance sheet in the same way and can continue to be expensed through the income statement in line with current IAS 17 treatment. An assessment will also need to be carried out for any implicit leases which we have within any of our contracts.
|
F-
16
LUXFER HOLDINGS PLC
NOTES TO THE CONSOLIDATED FINANCIAL STATEMENTS (Continued)
All amounts in millions, except share and per share data
|
2.
|
Revenue and segmental analysis
|
For management purposes, the Group is organized into
two
reporting divisions, Gas Cylinders and Elektron. These divisions are aggregated from the
six
identified operating segments in the Group; Luxfer Gas Cylinders and Luxfer Superform aggregate to Gas Cylinders; and Luxfer MEL Technologies, Luxfer Magtech, Luxfer Graphic Arts and Luxfer Czech Republic aggregate to Elektron. The change in operating segments has come about with the change of CEO during 2017, and the way the group has been re-organized to reflect the common elements within the group. This rationale is in line with IFRS 8 which allows for aggregation of operating segments on the basis they share similar economic characteristics for the nature of the products and services; the nature of the production processes; the type or class of customer for their products and services; the methods used to distribute their products or provide their services; and the nature of the regulatory environment. For the purposes of impairment testing, the cash generating units (CGUs) have been assessed to be at the same level as the operating segments. The tables below set out information on the results of these
two
reportable divisions.
Management monitors the operating results of its operating segments separately for the purpose of making decisions about resource allocation and performance assessment. Segment performance is evaluated by the chief operating decision maker, who is responsible for allocating resources and assessing performance of the operating segments and has been identified as the CEO, based on trading profit or loss (defined as operating profit or loss before profits on sale of redundant site, changes to defined benefit pension plans and restructuring and other expense), and adjusted EBITDA (defined as profit on operations before taxation for the period, finance income (which comprises interest received and foreign exchange gains) and costs (which comprises interest costs, IAS 19R retirement benefits finance charge and the unwind of the discount on deferred contingent consideration from acquisitions), net gain / loss on acquisitions and disposals of businesses, changes to defined benefit pension plans, restructuring and other expense, other share based compensation charges, depreciation and amortization and loss on disposal of property, plant and equipment). For the purposes of our divisional segmental analysis, IFRS 8 requires the use of "segment profit" performance measures that are used by our chief operating decision maker. Trading profit is the "segment profit" used to satisfy this requirement in the below analysis.
Unallocated assets and liabilities include those which are held on behalf of the Group and cannot be allocated to a division, such as taxation, investments, cash, retirement benefits obligations, bank and other loans and holding company assets and liabilities.
F-
17
LUXFER HOLDINGS PLC
NOTES TO THE CONSOLIDATED FINANCIAL STATEMENTS (Continued)
All amounts in millions, except share and per share data
REPORTING SEGMENTS:
Year ended
December 31, 2017
|
|
Gas
Cylinders
|
Elektron
|
Unallocated
|
Total
Continuing
Activities
|
|||||||||
|
$M
|
$M
|
$M
|
$M
|
||||||||||
|
Revenue
|
|
|
|
|
|
|
|
|
|||||
|
Segment revenue
|
220.2
|
|
221.6
|
|
—
|
|
441.8
|
|
|||||
|
Inter-segment revenue
|
—
|
|
(0.5
|
)
|
—
|
|
(0.5
|
)
|
|||||
|
Revenue to external customers
|
220.2
|
|
221.1
|
|
—
|
|
441.3
|
|
|||||
|
Result
|
|
|
|
|
|
|
|||||||
|
Adjusted EBITDA
|
17.3
|
|
44.5
|
|
—
|
|
61.8
|
|
|||||
|
Other share based compensation charges
|
(1.0
|
)
|
(1.2
|
)
|
—
|
|
(2.2
|
)
|
|||||
|
Loss on disposal of property, plant and equipment
|
—
|
|
(0.1
|
)
|
—
|
|
(0.1
|
)
|
|||||
|
Depreciation and amortization
|
(7.6
|
)
|
(11.4
|
)
|
—
|
|
(19.0
|
)
|
|||||
|
Trading profit—segment result
|
8.7
|
|
31.8
|
|
—
|
|
40.5
|
|
|||||
|
Profit on sale of redundant site
|
—
|
|
—
|
|
0.4
|
|
0.4
|
|
|||||
|
Restructuring and other expense (Note 5)
|
(6.6
|
)
|
(12.7
|
)
|
(2.3
|
)
|
(21.6
|
)
|
|||||
|
Operating profit
|
2.1
|
|
19.1
|
|
(1.9
|
)
|
19.3
|
|
|||||
|
Acquisitions and disposals (Note 5)
|
—
|
|
1.3
|
|
—
|
|
1.3
|
|
|||||
|
Net interest costs
|
—
|
|
—
|
|
(6.7
|
)
|
(6.7
|
)
|
|||||
|
IAS 19R retirement benefits finance charge
|
—
|
|
—
|
|
(1.8
|
)
|
(1.8
|
)
|
|||||
|
Unwind of discount on deferred contingent consideration from acquisitions
|
—
|
|
(0.2
|
)
|
—
|
|
(0.2
|
)
|
|||||
|
Profit / (loss) on operations before taxation
|
2.1
|
|
20.2
|
|
(10.4
|
)
|
11.9
|
|
|||||
|
Tax expense
|
|
|
|
|
(0.4
|
)
|
|||||||
|
Net income for the year
|
|
|
|
|
|
|
11.5
|
|
|||||
|
Other segment information
|
|
|
|
|
|
|
|||||||
|
Segment assets
|
150.5
|
|
207.6
|
|
44.5
|
|
402.6
|
|
|||||
|
Segment liabilities
|
(22.6
|
)
|
(22.3
|
)
|
(195.4
|
)
|
(240.3
|
)
|
|||||
|
Net assets / (liabilities) employed
(2)
|
127.9
|
|
185.3
|
|
(150.9
|
)
|
162.3
|
|
|||||
|
Capital expenditure: Property, plant and equipment
|
3.5
|
|
5.7
|
|
—
|
|
9.2
|
|
|||||
|
Capital expenditure: Intangible assets
|
1.4
|
|
0.3
|
|
—
|
|
1.7
|
|
|||||
F-
18
LUXFER HOLDINGS PLC
NOTES TO THE CONSOLIDATED FINANCIAL STATEMENTS (Continued)
All amounts in millions, except share and per share data
Year ended
December 31, 2016
|
Gas
Cylinders
|
Elektron
|
Unallocated
|
Total
Continuing
Activities
|
||||||||||
|
|
$M
|
$M
|
$M
|
$M
|
|||||||||
|
Revenue
|
|
|
|
|
|
|
|
|
|||||
|
Segment revenue
|
225.8
|
|
189.1
|
|
—
|
|
414.9
|
|
|||||
|
Inter-segment revenue
|
—
|
|
(0.1
|
)
|
—
|
|
(0.1
|
)
|
|||||
|
Revenue to external customers
|
225.8
|
|
189.0
|
|
—
|
|
414.8
|
|
|||||
|
Result
|
|
|
|
|
|
|
|||||||
|
Adjusted EBITDA
|
19.7
|
|
35.6
|
|
—
|
|
55.3
|
|
|||||
|
Other share based compensation charges
|
(0.6
|
)
|
(0.8
|
)
|
—
|
|
(1.4
|
)
|
|||||
|
Loss on disposal of property, plant and equipment
|
(0.1
|
)
|
(0.1
|
)
|
—
|
|
(0.2
|
)
|
|||||
|
Depreciation and amortization
|
(7.6
|
)
|
(10.8
|
)
|
—
|
|
(18.4
|
)
|
|||||
|
Trading profit—segment result
|
11.4
|
|
23.9
|
|
—
|
|
35.3
|
|
|||||
|
Profit on sale of redundant site
|
—
|
|
—
|
|
2.1
|
|
2.1
|
|
|||||
|
Changes to defined benefit pension plans (Note 5)
|
—
|
|
—
|
|
0.6
|
|
0.6
|
|
|||||
|
Restructuring and other expense (Note 5)
|
—
|
|
(2.2
|
)
|
—
|
|
(2.2
|
)
|
|||||
|
Operating profit
|
11.4
|
|
21.7
|
|
2.7
|
|
35.8
|
|
|||||
|
Acquisitions and disposals (Note 5)
|
—
|
|
0.2
|
|
—
|
|
0.2
|
|
|||||
|
Net interest costs
|
—
|
|
—
|
|
(5.6
|
)
|
(5.6
|
)
|
|||||
|
IAS 19R retirement benefits finance charge
|
—
|
|
—
|
|
(2.1
|
)
|
(2.1
|
)
|
|||||
|
Unwind of discount on deferred contingent consideration from acquisitions
|
—
|
|
(0.4
|
)
|
—
|
|
(0.4
|
)
|
|||||
|
Profit / (loss) on operations before taxation
|
11.4
|
|
21.5
|
|
(5.0
|
)
|
27.9
|
|
|||||
|
Tax expense
|
|
|
|
|
(6.0
|
)
|
|||||||
|
Net income for the year
|
|
|
|
|
|
|
21.9
|
|
|||||
|
Other segment information
|
|
|
|
|
|
|
|||||||
|
Segment assets
|
146.8
|
|
190.6
|
|
54.1
|
|
391.5
|
|
|||||
|
Segment liabilities
|
(21.7
|
)
|
(14.2
|
)
|
(213.7
|
)
|
(249.6
|
)
|
|||||
|
Net assets / (liabilities) employed
(2)
|
125.1
|
|
176.4
|
|
(159.6
|
)
|
141.9
|
|
|||||
|
Capital expenditure: Property, plant and equipment
|
6.5
|
|
10.0
|
|
—
|
|
16.5
|
|
|||||
|
Capital expenditure: Intangible assets
|
1.5
|
|
0.9
|
|
—
|
|
2.4
|
|
|||||
F-
19
LUXFER HOLDINGS PLC
NOTES TO THE CONSOLIDATED FINANCIAL STATEMENTS (Continued)
All amounts in millions, except share and per share data
Year ended
December 31, 2015
|
|
Gas
Cylinders
|
Elektron
|
Unallocated
|
Total
Continuing
Activities
|
|||||||||
|
$M
|
$M
|
$M
|
$M
|
||||||||||
|
Revenue
|
|
|
|
|
|||||||||
|
Segment revenue
|
239.1
|
|
221.8
|
|
—
|
|
460.9
|
|
|||||
|
Inter-segment revenue
|
—
|
|
(0.6
|
)
|
—
|
|
(0.6
|
)
|
|||||
|
Revenue to external customers
|
239.1
|
|
221.2
|
|
—
|
|
460.3
|
|
|||||
|
Result
|
|
|
|
|
|
|
|||||||
|
Adjusted EBITDA
|
16.5
|
|
45.7
|
|
—
|
|
62.2
|
|
|||||
|
Other share based compensation charges
|
(0.7
|
)
|
(0.6
|
)
|
—
|
|
(1.3
|
)
|
|||||
|
Depreciation and amortization
|
(7.2
|
)
|
(11.4
|
)
|
—
|
|
(18.6
|
)
|
|||||
|
Trading profit—segment result
|
8.6
|
|
33.7
|
|
—
|
|
42.3
|
|
|||||
|
Changes to defined benefit pension plans (Note 5)
|
—
|
|
—
|
|
18.0
|
|
18.0
|
|
|||||
|
Restructuring and other expense (Note 5)
|
(21.9
|
)
|
(0.5
|
)
|
—
|
|
(22.4
|
)
|
|||||
|
Operating (loss)/profit
|
(13.3
|
)
|
33.2
|
|
18.0
|
|
37.9
|
|
|||||
|
Acquisitions and disposals (Note 5)
|
(0.2
|
)
|
—
|
|
(1.8
|
)
|
(2.0
|
)
|
|||||
|
Net interest costs
|
—
|
|
—
|
|
(6.9
|
)
|
(6.9
|
)
|
|||||
|
IAS 19R retirement benefits finance charge
|
—
|
|
—
|
|
(3.0
|
)
|
(3.0
|
)
|
|||||
|
Unwind of discount on deferred contingent consideration from acquisitions
|
—
|
|
(0.4
|
)
|
—
|
|
(0.4
|
)
|
|||||
|
(Loss)/profit on operations before taxation
|
(13.5
|
)
|
32.8
|
|
6.3
|
|
25.6
|
|
|||||
|
Tax expense
|
|
|
|
|
(9.5
|
)
|
|||||||
|
Net income for the year
|
|
|
|
|
|
|
16.1
|
|
|||||
|
Other segment information
|
|
|
|
|
|
|
|||||||
|
Segment assets
|
158.3
|
|
208.5
|
|
68.9
|
|
435.7
|
|
|||||
|
Segment liabilities
|
(32.3
|
)
|
(21.4
|
)
|
(212.3
|
)
|
(266.0
|
)
|
|||||
|
Net assets/(liabilities) employed
(2)
|
126.0
|
|
187.1
|
|
(143.4
|
)
|
169.7
|
|
|||||
|
Capital expenditure: Property, plant and equipment
|
6.0
|
|
9.3
|
|
—
|
|
15.3
|
|
|||||
|
Capital expenditure: Intangible assets
|
1.2
|
|
0.9
|
|
—
|
|
2.1
|
|
|||||
F-
20
LUXFER HOLDINGS PLC
NOTES TO THE CONSOLIDATED FINANCIAL STATEMENTS (Continued)
All amounts in millions, except share and per share data
GEOGRAPHIC ORIGIN:
Year ended
December 31, 2017
|
|
United
Kingdom
|
Rest of
Europe
|
North
America
|
Australasia
|
Asia
|
Total
|
|||||||||||||
|
$M
|
$M
|
$M
|
$M
|
$M
|
$M
|
||||||||||||||
|
Revenue
|
|
|
|
|
|
|
|
|
|
|
|
|
|||||||
|
Segment revenue
|
162.6
|
|
48.6
|
|
275.9
|
|
0.1
|
|
2.7
|
|
489.9
|
|
|||||||
|
Inter-segment revenue
|
(23.1
|
)
|
(1.5
|
)
|
(24.0
|
)
|
—
|
|
—
|
|
(48.6
|
)
|
|||||||
|
Revenue to external customers
|
139.5
|
|
47.1
|
|
251.9
|
|
0.1
|
|
2.7
|
|
441.3
|
|
|||||||
|
Result
|
|
|
|
|
|
|
|
|
|
|
|||||||||
|
Adjusted EBITDA
|
16.2
|
|
1.3
|
|
44.1
|
|
0.1
|
|
0.1
|
|
61.8
|
|
|||||||
|
Other share based compensation charges
|
(1.4
|
)
|
—
|
|
(0.8
|
)
|
—
|
|
—
|
|
(2.2
|
)
|
|||||||
|
Loss on disposal of property, plant and equipment
|
—
|
|
(0.1
|
)
|
—
|
|
—
|
|
—
|
|
(0.1
|
)
|
|||||||
|
Depreciation and amortization
|
(5.9
|
)
|
(2.4
|
)
|
(10.7
|
)
|
—
|
|
—
|
|
(19.0
|
)
|
|||||||
|
Trading profit/(loss)—segment result
|
8.9
|
|
(1.2
|
)
|
32.6
|
|
0.1
|
|
0.1
|
|
40.5
|
|
|||||||
|
Sale of redundant site
|
0.4
|
|
—
|
|
—
|
|
—
|
|
—
|
|
0.4
|
|
|||||||
|
Restructuring and other expense (Note 5)
|
(14.4
|
)
|
(2.3
|
)
|
(4.9
|
)
|
—
|
|
—
|
|
(21.6
|
)
|
|||||||
|
Operating (loss) / profit
|
(5.1
|
)
|
(3.5
|
)
|
27.7
|
|
0.1
|
|
0.1
|
|
19.3
|
|
|||||||
|
Other geographical segment information
|
|
|
|
|
|
|
|
|
|
|
|||||||||
|
Non-current assets
(1)
|
74.3
|
|
14.2
|
|
142.5
|
|
—
|
|
0.3
|
|
231.3
|
|
|||||||
|
Net assets employed
(2)
|
10.0
|
|
30.7
|
|
118.8
|
|
—
|
|
2.8
|
|
162.3
|
|
|||||||
|
Capital expenditure: Property, plant and equipment
|
4.4
|
|
0.7
|
|
4.1
|
|
—
|
|
—
|
|
9.2
|
|
|||||||
|
Capital expenditure: Intangible assets
|
1.4
|
|
—
|
|
0.3
|
|
—
|
|
—
|
|
1.7
|
|
|||||||
F-
21
LUXFER HOLDINGS PLC
NOTES TO THE CONSOLIDATED FINANCIAL STATEMENTS (Continued)
All amounts in millions, except share and per share data
Year ended
December 31, 2016
|
|
United
Kingdom
|
Rest of
Europe
|
North
America
|
Australasia
|
Asia
|
Total
|
|||||||||||||
|
$M
|
$M
|
$M
|
$M
|
$M
|
$M
|
||||||||||||||
|
Revenue
|
|||||||||||||||||||
|
Segment revenue
|
142.6
|
|
39.1
|
|
282.5
|
|
0.1
|
|
3.4
|
|
467.7
|
|
|||||||
|
Inter-segment revenue
|
(28.6
|
)
|
(1.6
|
)
|
(22.7
|
)
|
—
|
|
—
|
|
(52.9
|
)
|
|||||||
|
Revenue to external customers
|
114.0
|
|
37.5
|
|
259.8
|
|
0.1
|
|
3.4
|
|
414.8
|
|
|||||||
|
Result
|
|
|
|
|
|
|
|
|
|
|
|||||||||
|
Adjusted EBITDA
|
17.4
|
|
(0.4
|
)
|
37.8
|
|
0.1
|
|
0.4
|
|
55.3
|
|
|||||||
|
Other share based compensation charges
|
(1.0
|
)
|
—
|
|
(0.4
|
)
|
—
|
|
—
|
|
(1.4
|
)
|
|||||||
|
Loss on disposal of property, plant and equipment
|
—
|
|
(0.1
|
)
|
(0.1
|
)
|
—
|
|
—
|
|
(0.2
|
)
|
|||||||
|
Depreciation and amortization
|
(5.7
|
)
|
(2.3
|
)
|
(10.3
|
)
|
—
|
|
(0.1
|
)
|
(18.4
|
)
|
|||||||
|
Trading profit/(loss)—segment result
|
10.7
|
|
(2.8
|
)
|
27.0
|
|
0.1
|
|
0.3
|
|
35.3
|
|
|||||||
|
Sale of redundant site
|
2.1
|
|
—
|
|
—
|
|
—
|
|
—
|
|
2.1
|
|
|||||||
|
Changes to defined benefit pension plans
|
—
|
|
—
|
|
0.6
|
|
—
|
|
—
|
|
0.6
|
|
|||||||
|
Restructuring and other expense (Note 5)
|
(0.6
|
)
|
—
|
|
(1.6
|
)
|
—
|
|
—
|
|
(2.2
|
)
|
|||||||
|
Operating profit/(loss)
|
12.2
|
|
(2.8
|
)
|
26.0
|
|
0.1
|
|
0.3
|
|
35.8
|
|
|||||||
|
Other geographical segment information
|
|
|
|
|
|
|
|
|
|
|
|||||||||
|
Non-current assets
(1)
|
77.5
|
|
13.8
|
|
143.9
|
|
—
|
|
0.2
|
|
235.4
|
|
|||||||
|
Net assets employed
(2)
|
6.9
|
|
19.7
|
|
112.3
|
|
0.3
|
|
2.7
|
|
141.9
|
|
|||||||
|
Capital expenditure: Property, plant and equipment
|
6.7
|
|
1.2
|
|
8.6
|
|
—
|
|
—
|
|
16.5
|
|
|||||||
|
Capital expenditure: Intangible assets
|
2.0
|
|
—
|
|
0.4
|
|
—
|
|
—
|
|
2.4
|
|
|||||||
F-
22
LUXFER HOLDINGS PLC
NOTES TO THE CONSOLIDATED FINANCIAL STATEMENTS (Continued)
All amounts in millions, except share and per share data
Year ended
December 31, 2015
|
United
Kingdom
|
Rest of
Europe
|
North
America
|
Australasia
|
Asia
|
Total
|
||||||||||||||
|
|
$M
|
$M
|
$M
|
$M
|
$M
|
$M
|
|||||||||||||
|
Revenue
|
|||||||||||||||||||
|
Segment revenue
|
145.0
|
|
62.4
|
|
299.6
|
|
0.1
|
|
3.9
|
|
511.0
|
|
|||||||
|
Inter-segment revenue
|
(27.0
|
)
|
(2.9
|
)
|
(20.8
|
)
|
—
|
|
—
|
|
(50.7
|
)
|
|||||||
|
Revenue to external customers
|
118.0
|
|
59.5
|
|
278.8
|
|
0.1
|
|
3.9
|
|
460.3
|
|
|||||||
|
Result
|
|||||||||||||||||||
|
Adjusted EBITDA
|
13.6
|
|
1.3
|
|
46.5
|
|
0.2
|
|
0.6
|
|
62.2
|
|
|||||||
|
Other share based compensation charges
|
(1.0
|
)
|
—
|
|
(0.3
|
)
|
—
|
|
—
|
|
(1.3
|
)
|
|||||||
|
Depreciation and amortization
|
(6.1
|
)
|
(2.3
|
)
|
(10.1
|
)
|
—
|
|
(0.1
|
)
|
(18.6
|
)
|
|||||||
|
Trading profit/(loss)—segment result
|
6.5
|
|
(1.0
|
)
|
36.1
|
|
0.2
|
|
0.5
|
|
42.3
|
|
|||||||
|
Changes to defined benefit pension plans
|
18.0
|
|
—
|
|
—
|
|
—
|
|
—
|
|
18.0
|
|
|||||||
|
Restructuring and other expense (Note 5)
|
(8.0
|
)
|
(7.8
|
)
|
(6.6
|
)
|
—
|
|
—
|
|
(22.4
|
)
|
|||||||
|
Operating profit/(loss)
|
16.5
|
|
(8.8
|
)
|
29.5
|
|
0.2
|
|
0.5
|
|
37.9
|
|
|||||||
|
Other geographical segment information
|
|||||||||||||||||||
|
Non-current assets
(1)
|
67.8
|
|
14.5
|
|
147.6
|
|
—
|
|
0.3
|
|
230.2
|
|
|||||||
|
Net assets employed
(2)
|
19.7
|
|
23.7
|
|
122.6
|
|
0.3
|
|
3.4
|
|
169.7
|
|
|||||||
|
Capital expenditure: Property, plant and equipment
|
5.5
|
|
1.4
|
|
8.4
|
|
—
|
|
—
|
|
15.3
|
|
|||||||
|
Capital expenditure: Intangible assets
|
1.7
|
|
—
|
|
0.4
|
|
—
|
|
—
|
|
2.1
|
|
|||||||
|
(1)
|
The Group's non-current assets analyzed by geographic origin include property, plant and equipment, intangible assets and investments.
|
|
(2)
|
Represents net assets employed—excluding inter-segment assets and liabilities.
|
GEOGRAPHIC DESTINATION:
|
United
Kingdom
|
Rest of
Europe
|
Africa
|
North
America
|
South
America
|
Asia
Pacific
|
Total
|
||||||||||||||||
|
$M
|
$M
|
$M
|
$M
|
$M
|
$M
|
$M
|
||||||||||||||||
|
Revenue—Continuing activities
|
|
|
|
|
|
|
|
|
|
|
|
|
|
|
||||||||
|
Year ended December 31, 2017
|
40.7
|
|
102.9
|
|
3.0
|
|
238.7
|
|
8.6
|
|
47.4
|
|
441.3
|
|
||||||||
|
Year ended December 31, 2016
|
36.4
|
|
94.2
|
|
2.4
|
|
226.3
|
|
9.9
|
|
45.6
|
|
414.8
|
|
||||||||
|
Year ended December 31, 2015
|
53.5
|
|
98.9
|
|
2.7
|
|
245.9
|
|
13.4
|
|
45.9
|
|
460.3
|
|
||||||||
F-
23
LUXFER HOLDINGS PLC
NOTES TO THE CONSOLIDATED FINANCIAL STATEMENTS (Continued)
All amounts in millions, except share and per share data
|
3.
|
Operating profit
|
Operating profit for continuing activities is stated after charging/ (crediting):
|
|
2017
|
2016
|
2015
|
|||||||||
|
$M
|
$M
|
$M
|
||||||||||
|
Research and development expenditure charged to the consolidated income statement
|
6.9
|
|
5.5
|
|
5.8
|
|
||||||
|
Development capital expenditure included within non-current assets (Note 12)
|
0.9
|
|
2.1
|
|
2.5
|
|
||||||
|
Total research and development expenditure
|
7.8
|
|
7.6
|
|
8.3
|
|
||||||
|
Less development expenditure capitalized within non-current assets
|
(0.9
|
)
|
(2.1
|
)
|
(2.5
|
)
|
||||||
|
Net research and development
|
6.9
|
|
5.5
|
|
5.8
|
|
||||||
|
Depreciation of property, plant and equipment (Note 11)
|
16.7
|
|
16.7
|
|
16.6
|
|
||||||
|
Amortization of intangible assets (Note 12)
|
2.3
|
|
1.7
|
|
2.2
|
|
||||||
|
Loss on disposal of property, plant and equipment
|
0.1
|
|
0.2
|
|
—
|
|
||||||
|
Operating lease expense (Note 26)
|
5.1
|
|
4.8
|
|
5.6
|
|
||||||
|
Restructuring and other expense (Note 5)
|
21.6
|
|
—
|
|
2.2
|
|
—
|
|
22.4
|
|
||
|
Net foreign exchange gains
|
—
|
|
—
|
|
(0.7
|
)
|
(0.6
|
)
|
||||
|
Staff costs (Note 6)
|
121.3
|
|
111.7
|
|
119.3
|
|
||||||
|
Cost of inventories recognized as expense
|
282.9
|
|
287.3
|
|
316.2
|
|
||||||
|
4.
|
Fees payable to auditors
|
The total remuneration of the Group's auditor, PricewaterhouseCoopers LLP and other member firms of PricewaterhouseCoopers International Limited, for services provided to the Group during the years ended
December 31, 2017
,
December 31, 2016
and
December 31, 2015
is analyzed below.
|
2017
|
2016
|
2015
|
|||||||||
|
|
$M
|
$M
|
$M
|
||||||||
|
Fees payable to auditors for the audit of the consolidated financial statements and its subsidiaries
|
1.3
|
|
1.1
|
|
1.1
|
|
|||||
|
Fees payable to auditors for non-audit services:
|
|||||||||||
|
Accounting advisory services
|
0.1
|
|
—
|
|
—
|
|
|||||
|
Total fees payable
|
1.4
|
|
1.1
|
|
1.1
|
|
|||||
Accounting advisory services fees incurred in 2017 relate to an ongoing GAAP conversion project in relation to the expected loss of our FPI status.
The audit fee for the company financial statements of Luxfer Holdings PLC was
$0.1 million
(
2016
:
$0.1 million
and
2015
:
$0.1 million
).
F-
24
LUXFER HOLDINGS PLC
NOTES TO THE CONSOLIDATED FINANCIAL STATEMENTS (Continued)
All amounts in millions, except share and per share data
|
5.
|
Other income/ (expense) items
|
|
|
2017
|
2016
|
2015
|
|||||
|
$M
|
$M
|
$M
|
||||||
(a) Profit on sale of redundant site
|
Credited to operating profit:
|
|||||||||||
|
Profit on sale of redundant site
|
0.4
|
|
2.1
|
|
—
|
|
|||||
|
0.4
|
|
2.1
|
|
—
|
|
||||||
(b) Changes to defined benefit pension plans
|
Credited to operating profit:
|
|||||||||||
|
Changes to defined benefit pension plans
|
—
|
|
0.6
|
|
18.0
|
|
|||||
|
—
|
|
0.6
|
|
18.0
|
|
||||||
(c) Restructuring and other expense
|
Charged to operating profit:
|
|||||||||||
|
Rationalization of operations
|
(12.1
|
)
|
(0.4
|
)
|
(21.8
|
)
|
|||||
|
Patent infringement litigation costs
|
(3.5
|
)
|
(0.6
|
)
|
(0.5
|
)
|
|||||
|
Direct listing costs
|
(2.3
|
)
|
—
|
|
—
|
|
|||||
|
Non-current asset impairments
|
(3.7
|
)
|
—
|
|
—
|
|
|||||
|
Receivable impairment provision
|
—
|
|
(1.2
|
)
|
—
|
|
|||||
|
I.P.O. related share based compensation charges
|
—
|
|
—
|
|
(0.1
|
)
|
|||||
|
(21.6
|
)
|
(2.2
|
)
|
(22.4
|
)
|
||||||
(d) Net gain / (loss) on acquisitions and disposals
|
(Charged)/credited to non-operating profit:
|
|||||||||||
|
Merger and acquisition costs
|
(0.9
|
)
|
(0.3
|
)
|
(2.0
|
)
|
|||||
|
Gain on bargain purchase
|
1.2
|
|
—
|
|
—
|
|
|||||
|
Remeasurement of deferred contingent consideration
|
1.0
|
|
0.5
|
|
—
|
|
|||||
|
1.3
|
|
0.2
|
|
(2.0
|
)
|
||||||
Profit on sale of redundant site
In 2017, a credit of $0.4 million was recognized in relation to a provision that was no longer required. The provision was held pending completion of remediation works at the former Redditch site, which was sold during 2016 to a company that specializes in remediating contaminated land. Given the remediation works were completed at the end of March 2017, it was appropriate to release the provision.
In 2016, a profit of
$2.1 million
was recognized in relation to the sale of the Redditch site.
Changes to defined benefit pension plans
During 2016, a net credit of
$0.6 million
was recognized following the sale of
$10.0 million
of U.S. deferred pensioner liabilities to an insurer, and lump sum payments of
$4.9 million
offered to certain U.S. deferred pensioners.
In 2015, a credit of
$18.0 million
has been recognized in relation to changes to the U.K. defined benefit pension plan effective April 5, 2016 in respect of closure of the plan to future accrual and changing the reference index
F-
25
LUXFER HOLDINGS PLC
NOTES TO THE CONSOLIDATED FINANCIAL STATEMENTS (Continued)
All amounts in millions, except share and per share data
5. Other income/ (expense) items (Continued)
from the Retail Prices Index ("RPI") to the Consumer Prices Index ("CPI") when increasing pensions in payment. This credit comprises a past service credit of
$14.9 million
and a curtailment credit of
$3.3 million
, offset by associated advisory costs of
$0.2 million
.
Rationalization of operations
In 2017,
$6.6 million of costs were incurred in relation to rationalization costs in the Gas Cylinders Division and $5.5 million in the Elektron Division. $2.2 million of the charge in the Gas Cylinders Division was in relation to an impairment of the investment in our associate, Sub 161 Pty Limited, $2.1 million was incurred following the decision to discontinue our Advanced Oxygen System (AOS) product line and $1.0 million following the announcement to exit our Luxfer HEI business. These were offset in part by a $0.4 million credit relating to sales of inventory that was previously written down as part of the closure of our German operation in 2015. In the Elektron Division, $1.7 million of the charge related to the rationalization of its Magtech operations, which includes $1.3 million in relation to the write down of land and buildings. Separately, we have recorded $0.6 million related to an onerous communications contract. There has also been a Group-wide effort to reduce headcount and streamline management that has resulted in a $1.5 million and $3.0 million charge within the Gas Cylinders and Elektron Divisions respectively. Other rationalization costs of $0.4 million has been incurred, split evenly between the two Divisions.
In 2016,
$0.4 million
of costs were incurred in relation to rationalization costs in the Elektron division.
In 2015,
$21.8 million
of costs have been incurred in relation to rationalization costs in the Gas Cylinders Division. The
$21.8 million
of costs incurred related to the rationalization of its Alternative Fuel ("AF") operations, including closure of
two
manufacturing facilities (in Germany and Utah) and a review of related assets and investments for obsolescence and impairment. The charge comprises asset write-downs of
$17.7 million
, redundancy costs of
$2.2 million
, closure costs of
$1.7 million
and legal costs of
$0.2 million
.
Patent infringement litigation costs
In February 2018, the Company reached an out-of-court settlement with regards to the patent infringement litigation action taken against a competitor with us agreeing to pay an amount equivalent to
$1.6 million
. The settlement has been recognized as an accrual at December 31, 2017. Additionally, our litigation costs incurred during 2017 were
$1.9 million
, resulting in a total charge of
$3.5 million
(2016:
$0.6 million
and 2015: $
0.5 million
) all relating to the Elektron Division.
Direct listing costs
In 2017,
$2.3 million
of costs were incurred in relation to professional fees in connection with our project of converting our ADR listing to a direct listing of our ordinary shares. The project was successfully implemented in December 2017.
Non-current asset impairments
In 2017, a charge of
$3.7 million
has been recognized in relation to non-current asset impairments within the Elektron Division.
$2.2 million
of this charge relates to our Czech business,
$0.9 million
in relation to our North America business and
$0.6 million
in relation to our U.K. business.
Receivable impairment provision
In 2016,
$1.2 million
was incurred for an impairment charge on receivables in relation to an aerospace customer that has entered Chapter 11 protection . This was an operating cost item but was separated out within the income statement with other unusual operating items and included within the restructuring and other expenses line due to the nature of the customer entering Chapter 11.
I.P.O. related share based compensation charges
In 2015, a charge of
$0.1 million
was recognized in the consolidated income statement under IFRS 2 in relation to share options granted as part of the initial public offering. The share options are described in further detail in Note 31.
F-
26
LUXFER HOLDINGS PLC
NOTES TO THE CONSOLIDATED FINANCIAL STATEMENTS (Continued)
All amounts in millions, except share and per share data
5. Other income/ (expense) items (Continued)
Merger and acquisition costs
In 2017, acquisition costs of
$0.5 million
has been recognized in relation to the acquisition of the Specialty Metals business of ESM Group Inc. In addition, as part of the acquisition, an environmental provision of
$0.4 million
has been established, with funds placed in escrow, to clean up low level chemical contamination on the land acquired, with any remaining funds remitted to the seller.
In 2016, a charge of
$0.3 million
has been recognized in the consolidated income statement in relation to a potential acquisition which was subsequently aborted.
In 2015, a charge of
$1.8 million
related to two approaches to acquire the company. Neither of these approaches resulted in an executable offer that could be put to shareholders.
$0.2 million
of legal costs have also been incurred in relation to the investment in Sub161 Pty Limited; further details are given in Note 14.
Gain on bargain purchase
In 2017, the Group acquired the trade and assets of the Specialty Metals business of ESM Group Inc., for a total consideration of
$4.6 million
. The fair value of the net assets acquired has been assessed at
$5.8 million
, with a gain on bargain purchase of
$1.2 million
recognized. Further details are given in Note 25.
Remeasurement of deferred contingent consideration
In 2017, a credit of
$1.0 million
(2016:
$0.5 million
) has been recognized in the consolidated income statement in relation to the remeasurement of deferred contingent consideration arising from the acquisition of Luxfer Magtech Inc. where an element of deferred contingent consideration is no longer payable due to the acquired business failing to achieve a profit triggers at December 31, 2017 and at December 31, 2016.
|
6.
|
Staff Costs
|
|
|
2017
|
2016
|
2015
|
|||||||
|
$M
|
$M
|
$M
|
||||||||
|
Wages and salaries
|
96.1
|
|
92.2
|
|
96.3
|
|
||||
|
Social security costs
|
11.0
|
|
10.5
|
|
11.2
|
|
||||
|
Retirement benefits costs
|
4.8
|
|
4.8
|
|
5.9
|
|
||||
|
IAS 19R retirement benefits finance charge
|
1.8
|
|
2.1
|
|
3.0
|
|
||||
|
Redundancy costs: Continuing activities
|
4.5
|
|
0.7
|
|
1.5
|
|
||||
|
Share based compensation charges (Note 31)
|
3.1
|
|
1.4
|
|
1.4
|
|
||||
|
121.3
|
|
111.7
|
|
119.3
|
|
|||||
The average monthly number of employees during the year was made up as follows:
|
|
2017
|
2016
|
2015
|
|||||||
|
No.
|
No.
|
No.
|
||||||||
|
Production and distribution
|
1,397
|
|
1,381
|
|
1,432
|
|
||||
|
Sales and administration
|
204
|
|
246
|
|
218
|
|
||||
|
Research and development
|
57
|
|
60
|
|
56
|
|
||||
|
1,658
|
|
1,687
|
|
1,706
|
|
|||||
F-
27
LUXFER HOLDINGS PLC
NOTES TO THE CONSOLIDATED FINANCIAL STATEMENTS (Continued)
All amounts in millions, except share and per share data
|
6.
|
Staff Costs (continued)
|
The compensation of the members of our Board of Directors (each, a "director") was:
|
|
2017
|
2016
|
2015
|
|||||||
|
$M
|
$M
|
$M
|
||||||||
|
Remuneration (short-term benefits)
|
2.0
|
|
1.5
|
|
1.7
|
|
||||
|
Social security costs
|
0.3
|
|
0.2
|
|
0.2
|
|
||||
|
Post-retirement benefits
|
0.2
|
|
0.1
|
|
0.2
|
|
||||
|
Compensation for loss of office
|
0.3
|
|
—
|
|
—
|
|
||||
|
Total short-term and post-retirement benefits
|
2.8
|
|
1.8
|
|
2.1
|
|
||||
In
2017
, compensation of key management personnel for the period they served on the Executive Leadership Team, (formally, Executive Management Board), (including directors) was
$4.7 million
(
2016
:
$2.2 million
and
2015
:
$2.6 million
) for short-term employee benefits, and
$0.3 million
(
2016
:
$0.2 million
and
2015
:
$0.4 million
) for post-employment benefits. Social security costs were incurred of
$0.5 million
(
2016
:
$0.3 million
and
2015
:
$0.4 million
).
Details of the share awards granted are included in the remuneration report in Outstanding Share Awards During 2017, on pages 77 to 78 of the Remuneration Report.
Further details of directors' remuneration are included in the remuneration report on pages 71 to 81.
During the year, one of the directors was a member of the Group's U.K. registered defined contribution and defined benefit pension arrangements, another director was a participant in the unfunded unregistered unsecured retirement benefits arrangement accrued by the Company and another director was a member of the Group's U.S. registered defined contribution plan.
Directors' interests and related party transactions
No directors had a material interest in, nor were they a party to, any contract or arrangement to which the parent company, Luxfer Holdings PLC (the "Company") or any of its subsidiaries is or was party to either during the year or at the end of the year, with the following exceptions: in the case of the executive directors their individual service contract and the Luxfer Holdings PLC Long-Term Umbrella Incentive Plan; in the case of the non-executive directors their engagement letters or the contract for services under which their services as a director of the Company are provided; in the case of the executive directors and the chairman, the Luxfer Holdings PLC Non-Executive Directors Equity Incentive Plan. Information regarding the share options exercised during the year is included within the Remuneration Report. See Note 32 for related party transactions.
|
7.
|
Finance income
|
|
|
2017
|
2016
|
2015
|
|||||||
|
$M
|
$M
|
$M
|
||||||||
|
Bank interest received
|
0.2
|
|
0.2
|
|
0.2
|
|
||||
|
Other interest received
|
0.3
|
|
0.3
|
|
0.3
|
|
||||
|
Foreign exchange gains on financing activities
|
—
|
|
0.7
|
|
—
|
|
||||
|
Total finance income
|
0.5
|
|
1.2
|
|
0.5
|
|
||||
F-
28
LUXFER HOLDINGS PLC
NOTES TO THE CONSOLIDATED FINANCIAL STATEMENTS (Continued)
All amounts in millions, except share and per share data
|
8.
|
Finance costs
|
|
|
2017
|
2016
|
2015
|
|||||||
|
$M
|
$M
|
$M
|
||||||||
|
Bank and other loan interest payable
|
6.3
|
|
6.3
|
|
6.5
|
|
||||
|
Amortization of issue costs
|
0.6
|
|
0.5
|
|
0.9
|
|
||||
|
Foreign exchange loss on financing activities
|
0.3
|
|
—
|
|
—
|
|
||||
|
IAS 19R retirement benefits finance charge
|
1.8
|
|
2.1
|
|
3.0
|
|
||||
|
Unwind of discount on deferred contingent consideration from acquisitions
|
0.2
|
|
0.4
|
|
0.4
|
|
||||
|
Total finance costs
|
9.2
|
|
9.3
|
|
10.8
|
|
||||
|
9.
|
Income taxes
|
|
(a)
|
Analysis of taxation charge for the year
|
|
2017
|
2016
|
2015
|
||||||||
|
|
$M
|
$M
|
$M
|
|||||||
|
Current income taxes:
|
||||||||||
|
U.K. corporation tax
|
—
|
|
—
|
|
0.3
|
|
||||
|
Adjustments in respect of previous years
|
(0.3
|
)
|
0.2
|
|
(0.4
|
)
|
||||
|
(0.3
|
)
|
0.2
|
|
(0.1
|
)
|
|||||
|
Non-U.K. tax
|
6.3
|
|
3.5
|
|
7.2
|
|
||||
|
Adjustments in respect of previous years
|
(0.8
|
)
|
—
|
|
(0.9
|
)
|
||||
|
Total current tax charge
|
5.2
|
|
3.7
|
|
6.2
|
|
||||
|
Deferred income taxes:
|
|
|
|
|
|
|
||||
|
Origination and reversal of temporary differences
|
(5.3
|
)
|
2.1
|
|
2.7
|
|
||||
|
Adjustments in respect of previous years
|
0.5
|
|
0.2
|
|
0.6
|
|
||||
|
Total deferred income taxes (credit) / charge
|
(4.8
|
)
|
2.3
|
|
3.3
|
|
||||
|
Tax on profit on operations
|
0.4
|
|
6.0
|
|
9.5
|
|
||||
The income taxes charges relate to continuing activities.
F-
29
LUXFER HOLDINGS PLC
NOTES TO THE CONSOLIDATED FINANCIAL STATEMENTS (Continued)
All amounts in millions, except share and per share data
9. Income taxes (Continued)
|
(b)
|
Factors affecting the taxation charge for the year
|
The tax assessed for the year differs from the standard rate of
19.25%
(
2016
:
20%
and
2015
:
20.25%
) for corporation tax in the U.K.
The differences are explained below:
|
|
2017
|
2016
|
2015
|
|||||||
|
$M
|
$M
|
$M
|
||||||||
|
Profit on operations before taxation
|
11.9
|
|
27.9
|
|
25.6
|
|
||||
|
Profit on operations at 2017 standard rate of corporation tax in the U.K. of 19.25% (2016: 20% and 2015: 20.25%)
|
2.3
|
|
5.6
|
|
5.2
|
|
||||
|
Effects of:
|
|
|
|
|
|
|
||||
|
(Income not taxable) / non-deductible expenses
|
0.1
|
|
0.2
|
|
2.4
|
|
||||
|
Unprovided deferred income taxes
|
0.3
|
|
(2.9
|
)
|
—
|
|
||||
|
Foreign tax rate differences
|
4.3
|
|
2.7
|
|
2.6
|
|
||||
|
Effect of U.S. tax reform
|
(6.0
|
)
|
—
|
|
—
|
|
||||
|
Adjustment in respect of previous years
|
(0.6
|
)
|
0.4
|
|
(0.7
|
)
|
||||
|
Tax expense
|
0.4
|
|
6.0
|
|
9.5
|
|
||||
The 2017 deferred tax credit includes a non-cash accounting adjustment of $6.0 million following the enactment of U.S. tax reform on December 22, 2017. The non-cash adjustment is due to the reduction in the U.S. federal corporate income tax rate from 35% to 21%, which necessitated a re-measurement of the existing U.S. deferred tax position in 2017.
|
(c)
|
Factors that may affect future taxation charge
|
At
December 31, 2017
, the Group had carried forward tax losses of
$81.9 million
(U.K.:
$43.6 million
, non-U.K.:
$38.3 million
). Carried forward tax losses for
2016
were
$72.1 million
(U.K.:
$35.3 million
, non-U.K.:
$36.8 million
) and for
2015
were
$82.9 million
(U.K.:
$52.9 million
, non-U.K.:
$30.0 million
). To the extent that these losses are not already recognized as deferred income taxes assets, and available to offset against future taxable profits, it is expected that the future effective tax rate would be below the standard rate in the country where the profits are offset. The Group has unrecognized deferred tax assets relating to certain trading and capital losses and other temporary timing difference of
$13.3 million
(
2016
:
$12.3 million
,
2015
:
$14.2 million
), potentially available for offset against future profits.
Changes to the U.K. corporation tax rates were substantively enacted as part of Finance Bill 2017 (on September 6, 2016) to reduce the main rate down to
17%
from April 1, 2020. Deferred taxes at the balance sheet date have been measured using the enacted tax rates and reflected in the Group's consolidated financial statements at
December 31, 2017
.
F-
30
LUXFER HOLDINGS PLC
NOTES TO THE CONSOLIDATED FINANCIAL STATEMENTS (Continued)
All amounts in millions, except share and per share data
10. Earnings per share
The Group calculates earnings per share in accordance with IAS 33. Basic income per share is calculated based on the weighted average common shares outstanding for the period presented. The weighted average number of shares outstanding is calculated by time-apportioning the shares outstanding during the year.
For the purpose of calculating diluted earnings per share, the weighted average number of ordinary shares outstanding during the financial year has been adjusted for the dilutive effects of all potential ordinary shares and share options granted to employees.
Following the decision to terminate Luxfer Holdings PLC's ADS facility, each
£0.50
ordinary share of Luxfer Holdings PLC are now listed and traded directly on the New York Stock Exchange (NYSE).
Management believe the use of non-GAAP financial measures such as adjusted earnings, as reconciled in the table below, per share more closely reflects the underlying earnings per share performance.
|
2017
|
2016
|
2015
|
|||||||||||
|
$M
|
$M
|
$M
|
|||||||||||
|
Basic earnings:
|
|||||||||||||
|
Net income
|
11.5
|
|
21.9
|
|
16.1
|
|
|||||||
|
Adjusted earnings:
|
|||||||||||||
|
Accounting charges relating to acquisitions and disposals of businesses
|
|||||||||||||
|
Unwind of discount on deferred contingent consideration from acquisitions
|
0.2
|
|
0.4
|
|
0.4
|
|
|||||||
|
Acquisitions and disposals (Note 5)
|
(1.3
|
)
|
(0.2
|
)
|
2.0
|
|
|||||||
|
Amortization on acquired intangibles
|
1.2
|
|
1.0
|
|
1.4
|
|
|||||||
|
IAS 19R retirement benefits finance charge
|
1.8
|
|
2.1
|
|
3.0
|
|
|||||||
|
Profit on sale of redundant site (Note 5)
|
(0.4
|
)
|
(2.1
|
)
|
—
|
|
|||||||
|
Changes to defined benefit pension plans (Note 5)
|
—
|
|
(0.6
|
)
|
(18.0
|
)
|
|||||||
|
Restructuring and other expense (Note 5)
|
21.6
|
|
2.2
|
|
22.4
|
|
|||||||
|
Other share based compensation charges
|
2.2
|
|
1.4
|
|
1.3
|
|
|||||||
|
Impact from U.S. tax reform
|
(6.0
|
)
|
—
|
|
—
|
|
|||||||
|
Income tax thereon
|
(3.2
|
)
|
(1.4
|
)
|
0.9
|
|
|||||||
|
Adjusted net income
|
27.6
|
|
24.7
|
|
29.5
|
|
|||||||
|
Weighted average number of £0.50 ordinary shares:
|
|||||||||||||
|
For basic earnings per share
|
26,460,947
|
|
26,443,662
|
|
26,918,987
|
|
|||||||
|
Exercise of share options
|
541,223
|
|
270,997
|
|
453,736
|
|
|||||||
|
For diluted earnings per share
|
27,002,170
|
|
26,714,659
|
|
27,372,723
|
|
|||||||
|
Earnings per share using weighted average number of ordinary shares outstanding:
|
|||||||||||||
|
Basic
|
|||||||||||||
|
Adjusted
|
$
|
1.04
|
|
$
|
0.93
|
|
$
|
1.10
|
|
||||
|
Unadjusted
|
$
|
0.43
|
|
$
|
0.83
|
|
$
|
0.60
|
|
||||
|
Diluted
|
|||||||||||||
|
Adjusted
|
$
|
1.02
|
|
$
|
0.92
|
|
$
|
1.08
|
|
||||
|
Unadjusted
|
$
|
0.43
|
|
$
|
0.82
|
|
$
|
0.59
|
|
||||
F-
31
LUXFER HOLDINGS PLC
NOTES TO THE CONSOLIDATED FINANCIAL STATEMENTS (Continued)
All amounts in millions, except share and per share data
|
11.
|
Property, plant and equipment
|
|
|
Freehold
|
Long
leasehold
|
Short
leasehold
|
Plant and
equipment
|
Total
|
|||||||||||
|
$M
|
$M
|
$M
|
$M
|
$M
|
||||||||||||
|
Cost:
|
|
|
|
|
|
|
|
|
|
|
||||||
|
At January 1, 2016
|
56.1
|
|
6.4
|
|
10.3
|
|
314.6
|
|
387.4
|
|
||||||
|
Additions
|
1.9
|
|
0.6
|
|
0.5
|
|
13.5
|
|
16.5
|
|
||||||
|
Disposals
|
(3.8
|
)
|
—
|
|
—
|
|
(23.0
|
)
|
(26.8
|
)
|
||||||
|
Transfers
|
3.8
|
|
(0.2
|
)
|
—
|
|
(3.6
|
)
|
—
|
|
||||||
|
Exchange difference
|
(1.6
|
)
|
(0.9
|
)
|
(0.3
|
)
|
(25.3
|
)
|
(28.1
|
)
|
||||||
|
At December 31, 2016
|
56.4
|
|
5.9
|
|
10.5
|
|
276.2
|
|
349.0
|
|
||||||
|
Additions
|
0.9
|
|
0.3
|
|
0.9
|
|
7.1
|
|
9.2
|
|
||||||
|
Acquired via acquisition
|
2.0
|
|
—
|
|
—
|
|
3.2
|
|
5.2
|
|
||||||
|
Disposals
|
(0.1
|
)
|
(0.1
|
)
|
—
|
|
(4.7
|
)
|
(4.9
|
)
|
||||||
|
Exchange difference
|
3.2
|
|
0.1
|
|
0.8
|
|
14.2
|
|
18.3
|
|
||||||
|
At December 31, 2017
|
62.4
|
|
6.2
|
|
12.2
|
|
296.0
|
|
376.8
|
|
||||||
|
Accumulated depreciation and impairment:
|
|
|
|
|
|
|
|
|
|
|
||||||
|
At January 1, 2016
|
20.1
|
|
3.9
|
|
4.7
|
|
222.7
|
|
251.4
|
|
||||||
|
Provided during the year
|
2.0
|
|
0.3
|
|
0.8
|
|
13.6
|
|
16.7
|
|
||||||
|
Disposals
|
(2.8
|
)
|
—
|
|
—
|
|
(22.8
|
)
|
(25.6
|
)
|
||||||
|
Transfers
|
7.9
|
|
(0.5
|
)
|
0.2
|
|
(7.6
|
)
|
—
|
|
||||||
|
Exchange difference
|
(0.6
|
)
|
(0.6
|
)
|
(0.2
|
)
|
(20.0
|
)
|
(21.4
|
)
|
||||||
|
At December 31, 2016
|
26.6
|
|
3.1
|
|
5.5
|
|
185.9
|
|
221.1
|
|
||||||
|
Provided during the year
|
2.2
|
|
0.3
|
|
0.9
|
|
13.3
|
|
16.7
|
|
||||||
|
Disposals
|
(0.1
|
)
|
(0.1
|
)
|
—
|
|
(4.5
|
)
|
(4.7
|
)
|
||||||
|
Impairment
|
2.5
|
|
—
|
|
—
|
|
2.5
|
|
5.0
|
|
||||||
|
Exchange difference
|
1.3
|
|
0.2
|
|
0.3
|
|
11.4
|
|
13.2
|
|
||||||
|
At December 31, 2017
|
32.5
|
|
3.5
|
|
6.7
|
|
208.6
|
|
251.3
|
|
||||||
|
Net book values:
|
|
|
|
|
|
|
|
|
||||||||
|
At December 31, 2017
|
29.9
|
|
2.7
|
|
5.5
|
|
87.4
|
|
125.5
|
|
||||||
|
At December 31, 2016
|
29.8
|
|
2.8
|
|
5.0
|
|
90.3
|
|
127.9
|
|
||||||
|
At January 1, 2016
|
36.0
|
|
2.5
|
|
5.6
|
|
91.9
|
|
136.0
|
|
||||||
As at
December 31, 2017
and
December 31, 2016
,
no
assets were held under finance leases.
Impairment of property, plant and equipment
$
2.2 million
of the impairment in
2017
relates to the Luxfer Czech Republic operating segment, as a result of the present value of the free cash flows not covering the enterprise value of the segment. The impairment has been allocated equally across all asset groups based on their respective net book values. The impairment review was carried out as there were indicators of impairment at this level.
$
1.3 million
of the freehold impairment in
2017
relates to the write-down of land and buildings within the Luxfer Magtech operating segment, as a result of the announced exit from one of our sites. The land and buildings have been written down to their net realizable value, as determined by an independent valuation specialist.
$
1.5 million
of the impairment in
2017
relates to the write down of assets across all operating segments as part of an annual exercise to review the use of our non-current assets. These assets are either no longer in use or are part of a site which we have announced we are exiting.
Long and short leasehold
The long and short leasehold costs relate to leasehold property improvements.
F-
32
LUXFER HOLDINGS PLC
NOTES TO THE CONSOLIDATED FINANCIAL STATEMENTS (Continued)
All amounts in millions, except share and per share data
|
12.
|
Intangible assets
|
|
Goodwill
|
Customer
related
|
Technology
and trading
related
|
Development
costs
|
Software
|
Total
|
||||||||||||||
|
$M
|
$M
|
$M
|
$M
|
$M
|
$M
|
||||||||||||||
|
Cost:
|
|
|
|
|
|
|
|
|
|
|
|
|
|||||||
|
At January 1, 2016
|
83.4
|
|
13.4
|
|
9.3
|
|
4.0
|
|
3.5
|
|
113.6
|
|
|||||||
|
Additions
|
0.1
|
|
0.1
|
|
—
|
|
2.4
|
|
0.1
|
|
2.7
|
|
|||||||
|
Disposals
|
—
|
|
—
|
|
—
|
|
—
|
|
(0.6
|
)
|
(0.6
|
)
|
|||||||
|
Exchange difference
|
(8.2
|
)
|
—
|
|
(1.3
|
)
|
(0.4
|
)
|
(0.3
|
)
|
(10.2
|
)
|
|||||||
|
At December 31, 2016
|
75.3
|
|
13.5
|
|
8.0
|
|
6.0
|
|
2.7
|
|
105.5
|
|
|||||||
|
Additions
|
—
|
|
—
|
|
—
|
|
0.9
|
|
0.8
|
|
1.7
|
|
|||||||
|
Disposals
|
—
|
|
(0.1
|
)
|
—
|
|
—
|
|
(0.4
|
)
|
(0.5
|
)
|
|||||||
|
Exchange difference
|
4.1
|
|
—
|
|
0.6
|
|
0.5
|
|
0.3
|
|
5.5
|
|
|||||||
|
At December 31, 2017
|
79.4
|
|
13.4
|
|
8.6
|
|
7.4
|
|
3.4
|
|
112.2
|
|
|||||||
|
Accumulated amortization and impairment:
|
|
|
|
|
|
|
|
|
|
|
|
|
|||||||
|
At January 1, 2016
|
21.2
|
|
1.5
|
|
1.8
|
|
0.1
|
|
2.0
|
|
26.6
|
|
|||||||
|
Provided during the year
|
—
|
|
0.7
|
|
0.4
|
|
0.3
|
|
0.3
|
|
1.7
|
|
|||||||
|
Disposals
|
—
|
|
—
|
|
—
|
|
—
|
|
(0.3
|
)
|
(0.3
|
)
|
|||||||
|
Exchange difference
|
(2.8
|
)
|
(0.1
|
)
|
(0.3
|
)
|
0.1
|
|
—
|
|
(3.1
|
)
|
|||||||
|
At December 31, 2016
|
18.4
|
|
2.1
|
|
1.9
|
|
0.5
|
|
2.0
|
|
24.9
|
|
|||||||
|
Provided during the year
|
—
|
|
0.9
|
|
0.4
|
|
0.7
|
|
0.3
|
|
2.3
|
|
|||||||
|
Disposals
|
—
|
|
(0.1
|
)
|
—
|
|
—
|
|
(0.4
|
)
|
(0.5
|
)
|
|||||||
|
Impairment
|
—
|
|
—
|
|
0.5
|
|
1.5
|
|
—
|
|
2.0
|
|
|||||||
|
Exchange difference
|
1.4
|
|
—
|
|
0.2
|
|
0.1
|
|
0.1
|
|
1.8
|
|
|||||||
|
At December 31, 2017
|
19.8
|
|
2.9
|
|
3.0
|
|
2.8
|
|
2.0
|
|
30.5
|
|
|||||||
|
Net book values:
|
|
|
|
|
|
|
|
|
|
|
|||||||||
|
At December 31, 2017
|
59.6
|
|
10.5
|
|
5.6
|
|
4.6
|
|
1.4
|
|
81.7
|
|
|||||||
|
At December 31, 2016
|
56.9
|
|
11.4
|
|
6.1
|
|
5.5
|
|
0.7
|
|
80.6
|
|
|||||||
|
At January 1, 2016
|
62.2
|
|
11.9
|
|
7.5
|
|
3.9
|
|
1.5
|
|
87.0
|
|
|||||||
Customer related intangibles include customer relationships, order backlogs and non-compete agreements. Technology and trading related intangibles include technology, patents, tradenames and trademarks.
Development costs include
$4.6 million
(
2016
:
$5.5 million
) relating to internally generated intangible assets, all other intangible assets are externally generated.
Impairment of intangible assets
The
$0.5 million
impairment of technology and trading related intangibles relates to the announcement to exit of our Luxfer HEI business. The
$1.5 million
impairment of the development costs has resulted following the decision to discontinue our Advanced Oxygen System (AOS) product line. These impairments are both within our Gas Cylinders operating segment.
F-
33
LUXFER HOLDINGS PLC
NOTES TO THE CONSOLIDATED FINANCIAL STATEMENTS (Continued)
All amounts in millions, except share and per share data
|
13.
|
Impairment of goodwill
|
Goodwill acquired in a business combination is allocated, at acquisition, to the cash-generating units (CGUs) that are expected to benefit from the business combination. The
six
identified CGUs (Luxfer Gas Cylinders, Luxfer Superform, Luxfer MEL Technologies, Luxfer Magtech, Luxfer Graphic Arts and Luxfer Czech Republic) represent the lowest level within the Group at which goodwill is monitored for internal management reporting purposes. The
six
CGUs are aggregated to form the Group's
two
defined reportable divisions: Gas Cylinders Division and Elektron Division. The table below summarizes the carrying value of goodwill by division:
|
Gas Cylinders
Division
|
Elektron
Division
|
Total
|
||||||||
|
|
$M
|
$M
|
$M
|
|||||||
|
At January 1, 2016
|
22.3
|
|
39.9
|
|
62.2
|
|
||||
|
Additions
|
—
|
|
0.1
|
|
0.1
|
|
||||
|
Exchange difference
|
(3.4
|
)
|
(2.0
|
)
|
(5.4
|
)
|
||||
|
At December 31, 2016
|
18.9
|
|
38.0
|
|
56.9
|
|
||||
|
Exchange difference
|
1.6
|
|
1.1
|
|
2.7
|
|
||||
|
At December 31, 2017
|
20.5
|
|
39.1
|
|
59.6
|
|
||||
The Gas Cylinders Division goodwill of
$20.5 million
(
2016
:
$18.9 million
) includes goodwill attributable to our Luxfer Gas Cylinders operations of
$19.5 million
(
2016
:
$17.9 million
) and goodwill attributable to our Luxfer Superform operations of
$1.0 million
(
2016
:
$1.0 million
). During the year, our Elektron Division redefined its operations with MEL Chemicals and Magnesium Elektron reorganized to form the new CGUs of Luxfer MEL Technologies, Luxfer Magtech, Luxfer Graphic Arts and Luxfer Czech Republic. The Elektron Division goodwill of
$39.1 million
(
2016
:
$38.0 million
) included goodwill attributable to our Luxfer MEL Technologies operations of
$5.4 million
and goodwill attributable to our Luxfer Magtech operations of
$33.7 million
; no goodwill is allocated to Luxfer Graphic Arts or Luxfer Czech Republic. The goodwill figure was allocated based on which operating segments historical acquisitions were allocated to and the value of the acquired goodwill on those historical acquisitions. As at December 31, 2016, the goodwill of
$38.0 million
included goodwill attributable to our MEL Chemicals of
$3.9 million
and goodwill attributable to our Magnesium Elektron operations of
$34.1 million
.
The Group tests goodwill annually for impairment, or more frequently if there are indications that goodwill might be impaired. The recoverable amount of each of the cash-generating units has been determined based on a value-in-use calculation using a discounted cash flow method. The cash flows were derived from a 3-year business plan prepared at a detailed level by each CGU. The results of these plans were then extrapolated to give a terminal value based on a growth rate of
2.1%
(
2016
:
2.1%
). The 3-year business plans were driven by detailed sales forecasts by product type and best estimate of future demand by end market, using current margins. The cash flows included allowance for capital maintenance costs, along with working capital requirements based on the projected level of sales. A pre-tax discount rate of between
8.5%
and
10.9%
was used for the individual CGUs (
2016
: between
10.1%
and
10.7%
for all CGUs), which was considered a best estimate for the risk-adjusted cost of capital for the CGUs. The long-term projections assumed product prices and costs were at current levels, but the exchange rates used were USD:GBP of
$1.35
and USD:EUR of
$1.19
.
F-
34
LUXFER HOLDINGS PLC
NOTES TO THE CONSOLIDATED FINANCIAL STATEMENTS (Continued)
All amounts in millions, except share and per share data
14. Investments
|
Shares in joint ventures
|
Loans to joint ventures and associates
|
Total
|
||||||||
|
|
$M
|
$M
|
$M
|
|||||||
|
At January 1, 2016
|
2.4
|
|
4.8
|
|
7.2
|
|
||||
|
Debt funding
|
—
|
|
(1.0
|
)
|
(1.0
|
)
|
||||
|
Transfer from trade receivables
|
—
|
|
3.7
|
|
3.7
|
|
||||
|
Share of results
|
0.5
|
|
—
|
|
0.5
|
|
||||
|
Exchange difference
|
(0.2
|
)
|
(0.2
|
)
|
(0.4
|
)
|
||||
|
At December 31, 2016
|
2.7
|
|
7.3
|
|
10.0
|
|
||||
|
Debt funding
|
—
|
|
0.9
|
|
0.9
|
|
||||
|
Share of results
|
0.1
|
|
—
|
|
0.1
|
|
||||
|
Impairment
|
—
|
|
(2.2
|
)
|
(2.2
|
)
|
||||
|
Exchange difference
|
0.1
|
|
0.3
|
|
0.4
|
|
||||
|
At December 31, 2017
|
2.9
|
|
6.3
|
|
9.2
|
|
||||
The loans to joint ventures and associates are repayable in 2018, with interest being charged on
$4.7 million
at
8.0%
and
$1.6 million
incurring interest at
6.0%
.
See section 4.C "Organizational Structure" for a full list of Luxfer Holdings PLC subsidiaries.
Investment in joint ventures and associates
At
December 31, 2017
, the Group had the following joint ventures and associates which affect the profit of the Group. Unless otherwise stated, the Group's joint ventures and associates have share capital which consists solely of ordinary shares and are indirectly held, and the country of incorporation or registration is also their principal place of operation.
|
Name of company
|
Country of
incorporation
|
Holding
|
Proportion of voting rights and shares held
|
Classification
|
Nature of
business
|
||||||||
|
Dynetek Cylinders India Private Limited
|
India
|
Ordinary shares
|
49
|
%
|
Joint venture
|
Engineering
|
|||||||
|
Dynetek Korea Co. Limited
|
South Korea
|
Ordinary shares
|
49
|
%
|
Joint venture
|
Engineering
|
|||||||
|
Luxfer Holdings NA, LLC
|
U.S.
|
Membership interest
|
49
|
%
|
Joint venture
|
Engineering
|
|||||||
|
Luxfer Uttam India Private Limited
|
India
|
Ordinary shares
|
51
|
%
|
Joint venture
|
Engineering
|
|||||||
|
Nikkei-MEL Co. Limited
|
Japan
|
Ordinary shares
|
50
|
%
|
Joint venture
|
Distribution
|
|||||||
|
Sub161 Pty Limited
|
Australia
|
Ordinary shares
|
26.4
|
%
|
Associate
|
Engineering
|
|||||||
During 2015, the Group acquired
26.4%
of the share capital of Sub161 Pty Limited, an associate, which is a start-up virtual pipeline operator based in Western Australia, for a cash consideration of
$3.7 million
and the contribution of a number of AF assets with a value of
$1.7 million
. An impairment of this investment was recognized as part of the review of AF assets following this business stream's restructuring. This write-down would be reversed on any sale or realization of value of these assets in future years.
During 2016, a receivable from Sub161 Pty Limited was converted into a secured loan note which is repayable by March 31, 2018 or before the event of a substantial equity injection, a sale of the business, a material new customer or at the request of Sub161, this was subsequently extended to July 1, 2018.
F-
35
LUXFER HOLDINGS PLC
NOTES TO THE CONSOLIDATED FINANCIAL STATEMENTS (Continued)
All amounts in millions, except share and per share data
14. Investments (Continued)
During 2017, a further impairment of
$2.2 million
was recognized in relation to the Sub161 Pty Limited investment following continued weakness in this sector. The remaining
$1.6 million
carrying value is based on the net realizable value of the assets secured against the loan.
The main trading activity in 2017 was in Luxfer Holdings NA, LLC, Luxfer Uttam India Private Limited and Nikkei MEL Co. Limited.
The Group has made available up to
$12.5 million
of future funding to aid expansion of the U.S. joint venture in the coming years, via
$2.5 million
of equity into Luxfer Holdings NA, LLC and a
$10.0 million
secured credit line for working capital and supplier finance, of which
$4.7 million
(
2016
:
$3.8 million
) was drawn down at
December 31, 2017
.
The share of profits of all joint ventures and associates was
$0.1 million
(
2016
:
$0.5 million
), with
no
items recognized in other comprehensive income in
2017
or
2016
.
The Group has looked in detail at the ownership agreements of its joint ventures and associates in order to determine the level of control that it has. The Group has determined that it has joint control of its joint ventures mainly based upon the number of members on each company board of directors and their associated voting rights. In relation to the associate undertaking, the Group has significant influence but not joint control based on the proportion of directors on the company board and associated voting rights. The Group therefore accounts for all material joint ventures and associates on an equity basis.
Related party transactions with joint ventures and associates have been disclosed in Note 32 to the Group's consolidated financial statements.
|
15.
|
Inventories
|
|
December 31, 2017
|
December 31, 2016
|
||||||
|
|
$M
|
$M
|
|||||
|
Raw materials and consumables
|
31.0
|
|
28.3
|
|
|||
|
Work in progress
|
28.1
|
|
30.5
|
|
|||
|
Finished goods and goods for resale
|
23.1
|
|
23.7
|
|
|||
|
82.2
|
|
82.5
|
|
||||
Inventories above are disclosed net of any provisions for obsolete and excess inventories. The provision against obsolete and excess inventories at
December 31, 2017
was
$8.4 million
(
2016
:
$6.5 million
). The cost of inventories recognized as an expense during the year was
$282.9 million
(
2016
:
$287.3 million
). The cost of inventories written-off during
2017
was
$1.6 million
(
2016
:
$0.1 million
).
F-
36
LUXFER HOLDINGS PLC
NOTES TO THE CONSOLIDATED FINANCIAL STATEMENTS (Continued)
All amounts in millions, except share and per share data
|
16.
|
Trade and other receivables
|
|
|
December 31, 2017
|
December 31, 2016
|
|||||
|
$M
|
$M
|
||||||
|
Non-current Assets
|
|
|
|
|
|||
|
Derivative financial instruments
|
0.3
|
|
0.3
|
|
|||
|
0.3
|
|
0.3
|
|
||||
|
Current Assets
|
|
|
|
|
|||
|
Trade receivables
|
54.0
|
|
40.5
|
|
|||
|
Amounts owed by joint ventures and associates
|
1.8
|
|
2.8
|
|
|||
|
Other receivables
|
4.2
|
|
3.1
|
|
|||
|
Prepayments and accrued income
|
10.5
|
|
9.4
|
|
|||
|
Derivative financial instruments
|
2.1
|
|
1.8
|
|
|||
|
72.6
|
|
57.6
|
|
||||
The directors consider that the carrying value of trade and other receivables approximates to their fair value. Trade receivables are non-interest bearing and are generally on
30
-
90
day terms. Trade receivables above are disclosed net of any provisions for doubtful receivables.
During 2016, a loan for
$3.6 million
to Sub 161 was converted into a secured loan note. This was subsequently reclassified into investments (Note 14).
At
December 31, 2017
, trade receivables with a nominal value of
$4.1 million
(
2016
:
$2.1 million
) were impaired and fully provided for. Movements in the provision for impairment of trade receivables and amounts owed by joint ventures and associates were as follows:
|
|
2017
|
2016
|
|||||
|
$M
|
$M
|
||||||
|
At January 1
|
2.1
|
|
4.8
|
|
|||
|
Charge in the year
|
2.7
|
|
1.3
|
|
|||
|
Utilized in the year
|
(0.8
|
)
|
(3.6
|
)
|
|||
|
Exchange difference
|
0.1
|
|
(0.4
|
)
|
|||
|
At December 31
|
4.1
|
|
2.1
|
|
|||
|
17.
|
Cash and cash equivalents
|
|
|
December 31, 2017
|
December 31, 2016
|
|||||
|
$M
|
$M
|
||||||
|
Cash at bank and in hand
|
13.3
|
|
13.6
|
|
|||
|
Overdrafts
|
(4.2
|
)
|
—
|
|
|||
|
9.1
|
|
13.6
|
|
||||
In 2017,
$0.7 million
(2016:
nil
) of the
$13.3 million
cash at bank and in hand balance was held in escrow, as described further in Note 25.
F-
37
LUXFER HOLDINGS PLC
NOTES TO THE CONSOLIDATED FINANCIAL STATEMENTS (Continued)
All amounts in millions, except share and per share data
18. Share capital
|
(a)
|
Ordinary share capital
|
|
December 31, 2017
|
December 31, 2016
|
December 31, 2017
|
December 31, 2016
|
||||||||||||
|
|
No.
|
No.
|
$M
|
|
$M
|
|
|||||||||
|
Authorized:
|
|
|
|
|
|
|
|
|
|
|
|||||
|
Ordinary shares of £0.50 each
|
40,000,000
|
|
40,000,000
|
|
35.7
|
|
(1)
|
35.7
|
|
(1)
|
|||||
|
Deferred ordinary shares of £0.0001 each
|
769,423,688,000
|
|
769,423,688,000
|
|
150.9
|
|
(1)
|
150.9
|
|
(1)
|
|||||
|
769,463,688,000
|
|
769,463,688,000
|
|
186.6
|
|
(1)
|
186.6
|
|
(1)
|
||||||
|
Allotted, called up and fully paid:
|
|
|
|
|
|
|
|
|
|
|
|||||
|
Ordinary shares of £0.50 each
|
27,136,799
|
|
27,136,799
|
|
25.3
|
|
(1)
|
25.3
|
|
(1)
|
|||||
|
Deferred ordinary shares of £0.0001 each
|
769,413,708,000
|
|
769,413,708,000
|
|
150.9
|
|
(1)
|
150.9
|
|
(1)
|
|||||
|
769,440,844,799
|
|
769,440,844,799
|
|
176.2
|
|
(1)
|
176.2
|
|
(1)
|
||||||
|
|
|
|
|
|
|
|
|
|
|
|
|||||
|
(1)
|
The Group's ordinary and deferred share capital are shown in U.S. dollars at the exchange rate prevailing at the month end spot rate at the time of the share capital being issued. This rate at the end of February 2007 was
$1.9613
:
£1
when the first
20,000,000
shares were issued; the rate at the end of October 2012 was
$1.6129
:
£1
when
7,000,000
shares were issued; the rate at the end of March 2013 was
$1.5173
:
£1
when
1,924
shares were issued; the rate at the end of January 2014 was
$1.6487
:
£1
when
12,076
shares were issued; the rate at the end of May 2014 was
$1.6760
:
£1
when
24,292
shares were issued; the rate at the end of August 2014 was
$1.6580
:
£1
when
58,399
shares were issued; the rate at the end of February 2015 was
$1.5436
:
£1
when
8,563
shares were issued; the rate at the end of March 2015 was
$1.4847
:
£1
when
3,866
shares were issued; and the rate at the end of June 2015 was
$1.5715
:
£1
when
27,679
shares were issued.
|
The rights of the shares are as follows:
Ordinary shares of
£0.50
each
The ordinary shares carry no entitlement to an automatic dividend but rank pari passu in respect of any dividend declared and paid. The ordinary shares were allotted and issued to satisfy share awards which vested under the Group's share award and share incentive plans.
At
December 31, 2017
, there were
25,929,312
ordinary shares
of Luxfer Holdings PLC listed on the New York Stock Exchange (NYSE) following the decision to terminate its ADR facility and to convert outstanding ADSs into ordinary shares.
Deferred ordinary shares of
£0.0001
each
The deferred shares have no entitlement to dividends or to vote. On a winding up (but not otherwise) the holders of the deferred shares shall be entitled to the repayment of the paid up nominal amount of the deferred shares, but only after any payment to the holders of ordinary shares of an amount equal to
100
times the amount paid up on such ordinary shares.
|
(b)
|
American Depositary Shares
|
At
December 31, 2017
, there were no ADSs (
2016
:
25,180,726
ADSs)
of Luxfer Holdings PLC listed on the New York Stock Exchange (NYSE) following the decision to terminate its ADR facility and to convert outstanding ADSs into ordinary shares.
The Depositary for the ADSs held one
£0.50
ordinary share for every ADS traded, through American Depositary Receipts.
ADS holders were entitled to instruct their Depositary to vote and to receive a dividend as per the ordinary shareholders, after deducting the fees and expenses of the Depositary.
F-
38
LUXFER HOLDINGS PLC
NOTES TO THE CONSOLIDATED FINANCIAL STATEMENTS (Continued)
All amounts in millions, except share and per share data
18. Share capital (Continued)
|
(c)
|
Share premium account
|
|
|
$M
|
|||
|
At January 1, 2016
|
56.4
|
|
||
|
At December 31, 2016
|
56.4
|
|
||
|
At December 31, 2017
|
56.4
|
|
||
The share premium account is used to record the excess of proceeds over nominal value on the issue of shares. Share issue costs directly related to the issue of shares are deducted from share premium.
|
(d)
|
Treasury shares
|
|
|
$M
|
|||
|
At January 1, 2016
|
(1.3
|
)
|
||
|
Purchase of own shares
|
(6.3
|
)
|
||
|
Utilization of treasury shares
|
0.5
|
|
||
|
At December 31, 2016
|
(7.1
|
)
|
||
|
Transfer of treasury shares into ESOP
|
0.8
|
|
||
|
Utilization of treasury shares
|
0.5
|
|
||
|
At December 31, 2017
|
(5.8
|
)
|
||
In June 2015, the Board announced a share buy-back program of up to
$10 million
, to cover the needs of employee share plans. Shareholder approval for this program was granted at the 2014 Annual General Meeting (for repurchases up to an aggregate amount of
2,700,000
ordinary shares or ADSs).
During
2016
,
634,185
ordinary shares were repurchased under the share buy-back program at a cost of
$6.3 million
; these repurchased shares are presented as treasury shares. At
December 31, 2016
, there were
665,424
treasury shares held at a cost of
$7.1 million
.
During 2017,
no
ordinary shares were repurchased under the share buy-back program. At
December 31, 2017
, there were
527,616
treasury shares held at a cost of
$5.8 million
.
|
(e)
|
Own shares held by ESOP
|
|
|
$M
|
|||
|
At January 1, 2016
|
(0.2
|
)
|
||
|
Purchases of shares into ESOP
|
(1.0
|
)
|
||
|
Utilization of ESOP shares
|
0.7
|
|
||
|
At December 31, 2016
|
(0.5
|
)
|
||
|
Transfer of treasury shares into ESOP
|
(0.8
|
)
|
||
|
Utilization of ESOP shares
|
0.3
|
|
||
|
At December 31, 2017
|
(1.0
|
)
|
||
At
December 31, 2017
, there were
104,709
ordinary shares of
£0.50
each (
2016
:
55,816
ordinary shares of
£0.50
each) held by The Luxfer Group Employee Share Ownership Plan (the "ESOP").
F-
39
LUXFER HOLDINGS PLC
NOTES TO THE CONSOLIDATED FINANCIAL STATEMENTS (Continued)
All amounts in millions, except share and per share data
19. Dividends paid and proposed
|
|
2017
|
2016
|
2015
|
|||||||
|
$M
|
$M
|
$M
|
||||||||
|
Dividends declared and paid during the year:
|
|
|
|
|
|
|
||||
|
Interim dividend paid February 4, 2015 ($0.10 per ordinary share)
|
—
|
|
—
|
|
2.7
|
|
||||
|
Interim dividend paid May 6, 2015 ($0.10 per ordinary share)
|
—
|
|
—
|
|
2.7
|
|
||||
|
Interim dividend paid August 5, 2015 ($0.10 per ordinary share)
|
—
|
|
—
|
|
2.7
|
|
||||
|
Interim dividend paid November 4, 2015 ($0.10 per ordinary share)
|
—
|
|
—
|
|
2.7
|
|
||||
|
Interim dividend paid February 3, 2016 ($0.125 per ordinary share)
|
—
|
|
3.4
|
|
—
|
|
||||
|
Interim dividend paid May 4, 2016 ($0.125 per ordinary share)
|
—
|
|
3.3
|
|
—
|
|
||||
|
Interim dividend paid August 3, 2016 ($0.125 per ordinary share)
|
—
|
|
3.3
|
|
—
|
|
||||
|
Interim dividend paid November 2, 2016 ($0.125 per ordinary share)
|
—
|
|
3.3
|
|
—
|
|
||||
|
Interim dividend paid February 1, 2017 ($0.125 per ordinary share)
|
3.3
|
|
—
|
|
—
|
|
||||
|
Interim dividend paid May 3, 2017 ($0.125 per ordinary share)
|
3.3
|
|
—
|
|
—
|
|
||||
|
Interim dividend paid August 2, 2017 ($0.125 per ordinary share)
|
3.3
|
|
—
|
|
—
|
|
||||
|
Interim dividend paid November 1, 2017 ($0.125 per ordinary share)
|
3.4
|
|
—
|
|
—
|
|
||||
|
13.3
|
|
13.3
|
|
10.8
|
|
|||||
|
|
2017
|
2016
|
2015
|
|||||||
|
$M
|
$M
|
$M
|
||||||||
|
Dividends declared and paid after December 31 (not recognized as a liability at December 31):
|
|
|
|
|
|
|
||||
|
Interim dividend paid February 3, 2016: ($0.125 per ordinary share)
|
—
|
|
—
|
|
2.7
|
|
||||
|
Interim dividend paid February 1, 2017: ($0.125 per ordinary share)
|
—
|
|
3.3
|
|
—
|
|
||||
|
Interim dividend paid February 7, 2018: ($0.125 per ordinary share)
|
3.4
|
|
—
|
|
—
|
|
||||
|
3.4
|
|
3.3
|
|
2.7
|
|
|||||
|
|
|
|
|
|
|
|
||||
F-
40
LUXFER HOLDINGS PLC
NOTES TO THE CONSOLIDATED FINANCIAL STATEMENTS (Continued)
All amounts in millions, except share and per share data
20. Reserves
|
Retained
earnings
|
Hedging
reserve
|
Translation
reserve
|
Share based
compensation
reserve
|
Merger
reserve
|
||||||||||||
|
|
$M
|
$M
|
$M
|
$M
|
$M
|
|||||||||||
|
At January 1, 2015
|
308.8
|
|
0.9
|
|
(36.2
|
)
|
3.7
|
|
(333.8
|
)
|
||||||
|
Net income for the year
|
16.1
|
|
—
|
|
—
|
|
—
|
|
—
|
|
||||||
|
Currency translation differences
|
—
|
|
—
|
|
(8.6
|
)
|
—
|
|
—
|
|
||||||
|
Decrease in fair value of cash flow hedges
|
—
|
|
(5.4
|
)
|
—
|
|
—
|
|
—
|
|
||||||
|
Transfer to consolidated income statement on cash flow hedges
|
—
|
|
(0.1
|
)
|
—
|
|
—
|
|
—
|
|
||||||
|
Remeasurement of defined benefit retirement plans
|
4.4
|
|
—
|
|
—
|
|
—
|
|
—
|
|
||||||
|
Deferred income taxes on items taken to other comprehensive income
|
(1.5
|
)
|
1.1
|
|
—
|
|
—
|
|
—
|
|
||||||
|
Equity dividends
|
(10.8
|
)
|
—
|
|
—
|
|
—
|
|
—
|
|
||||||
|
Equity settled share based compensation charges
|
—
|
|
—
|
|
—
|
|
1.4
|
|
—
|
|
||||||
|
Cash settled share based compensation charges
|
—
|
|
—
|
|
—
|
|
(0.5
|
)
|
—
|
|
||||||
|
Deferred income taxes on items taken to equity
|
(0.3
|
)
|
—
|
|
—
|
|
—
|
|
—
|
|
||||||
|
Utilization of treasury shares
|
(0.1
|
)
|
—
|
|
—
|
|
(0.5
|
)
|
—
|
|
||||||
|
At December 31, 2015
|
316.6
|
|
(3.5
|
)
|
(44.8
|
)
|
4.1
|
|
(333.8
|
)
|
||||||
|
Net income for the year
|
21.9
|
|
—
|
|
—
|
|
—
|
|
—
|
|
||||||
|
Currency translation differences
|
—
|
|
—
|
|
(13.1
|
)
|
—
|
|
—
|
|
||||||
|
Increase in fair value of cash flow hedges
|
—
|
|
1.1
|
|
—
|
|
—
|
|
—
|
|
||||||
|
Transfer to consolidated income statement on cash flow hedges
|
—
|
|
(0.9
|
)
|
—
|
|
—
|
|
—
|
|
||||||
|
Remeasurement of defined benefit retirement plans
|
(21.7
|
)
|
—
|
|
—
|
|
—
|
|
—
|
|
||||||
|
Deferred income taxes on items taken to other comprehensive income
|
4.3
|
|
—
|
|
—
|
|
—
|
|
—
|
|
||||||
|
Equity dividends
|
(13.3
|
)
|
—
|
|
—
|
|
—
|
|
—
|
|
||||||
|
Equity settled share based compensation charges
|
—
|
|
—
|
|
—
|
|
1.2
|
|
—
|
|
||||||
|
Utilization of treasury shares
|
0.1
|
|
—
|
|
—
|
|
(0.6
|
)
|
—
|
|
||||||
|
Utilization of ESOP shares
|
0.2
|
|
—
|
|
—
|
|
(0.9
|
)
|
—
|
|
||||||
|
At December 31, 2016
|
308.1
|
|
(3.3
|
)
|
(57.9
|
)
|
3.8
|
|
(333.8
|
)
|
||||||
|
Net income for the year
|
11.5
|
|
—
|
|
—
|
|
—
|
|
—
|
|
||||||
|
Currency translation differences
|
—
|
|
—
|
|
11.6
|
|
—
|
|
—
|
|
||||||
|
Increase in fair value of cash flow hedges
|
—
|
|
3.1
|
|
—
|
|
—
|
|
—
|
|
||||||
|
Transfer to consolidated income statement on cash flow hedges
|
—
|
|
0.6
|
|
—
|
|
—
|
|
—
|
|
||||||
|
Remeasurement of defined benefit retirement plans
|
9.5
|
|
—
|
|
—
|
|
—
|
|
—
|
|
||||||
|
Deferred income taxes on items taken to other comprehensive income
|
(5.2
|
)
|
(0.6
|
)
|
—
|
|
—
|
|
—
|
|
||||||
|
Equity dividends
|
(13.3
|
)
|
—
|
|
—
|
|
—
|
|
—
|
|
||||||
|
Equity settled share based compensation charges
|
—
|
|
—
|
|
—
|
|
2.6
|
|
—
|
|
||||||
|
Utilization of treasury shares
|
0.1
|
|
—
|
|
—
|
|
(0.6
|
)
|
—
|
|
||||||
|
Utilization of ESOP shares
|
0.1
|
|
—
|
|
—
|
|
(0.4
|
)
|
—
|
|
||||||
|
Deferred income taxes on items taken to equity
|
0.6
|
|
—
|
|
—
|
|
—
|
|
—
|
|
||||||
|
At December 31, 2017
|
311.4
|
|
(0.2
|
)
|
(46.3
|
)
|
5.4
|
|
(333.8
|
)
|
||||||
F-
41
LUXFER HOLDINGS PLC
NOTES TO THE CONSOLIDATED FINANCIAL STATEMENTS (Continued)
All amounts in millions, except share and per share data
20. Reserves
Nature and purpose of reserves
Hedging reserve
The hedging reserve contains the effective portion of the cash flow hedge relationships entered into by the Group at the reporting date. The movement in the year to
December 31, 2017
of
$3.1 million
(
2016
:
$0.2 million
) includes
an increase
in the fair value of cash flow hedges of
$3.1 million
(
2016
: increase of
$1.1 million
) and a
gain
of
$0.6 million
of cash flow hedges being transferred to the consolidated income statement (
2016
: loss of
$0.9 million
). This is partially offset by
$0.6 million
of deferred taxes on items taken to other comprehensive income. For further information regarding the Group's forward foreign currency exchange rate contracts, forward aluminum commodity contracts and forward interest rate agreements refer to Note 28 section (a)—Financial Instruments: Financial Instruments of the Group.
Translation reserve
The foreign currency translation reserve is used to record exchange differences arising from the translation of the financial statements of operations which do not have U.S. dollars as their functional currency.
Share based compensation reserve
The share based compensation reserve is used to recognize the fair value of options and performance shares granted under IFRS 2. For further information refer to Note 31. The charges in 2015, 2016 and 2017 related to options over ordinary shares.
During the year,
no
shares were purchased on the open market on behalf of one of the share based compensation plans (
2016
:
no
shares were purchased). Shares are held in the names of the employees who are members of the plan until the end of the holding period.
Merger reserve
The merger reserve relates to the recapitalization of Luxfer Group Limited during the year ended December 31, 1999. Pursuant to the recapitalization of Luxfer Group Limited, Luxfer Holdings PLC acquired the entire share capital of Luxfer Group Limited. The company known as Luxfer Group Limited during the year ended December 31, 1999 was subsequently renamed LGL 1996 Limited and remains dormant. The recapitalization was accounted for using merger accounting principles.
The accounting treatment reflected the fact that ownership and control of Luxfer Group Limited, after the recapitalization, remained with the same institutional and management shareholders as before the recapitalization. Under merger accounting principles the consolidated financial statements of Luxfer Holdings PLC appear as a continuation of those for Luxfer Group Limited and therefore as if it had been the parent of the Group from its incorporation.
F-
42
LUXFER HOLDINGS PLC
NOTES TO THE CONSOLIDATED FINANCIAL STATEMENTS (Continued)
All amounts in millions, except share and per share data
|
21.
|
Bank and other loans
|
|
December 31, 2017
|
December 31, 2016
|
||||||
|
|
$M
|
$M
|
|||||
|
Loan Notes due 2018—gross
|
15.0
|
|
15.0
|
|
|||
|
Unamortized finance costs
|
—
|
|
(0.1
|
)
|
|||
|
Loan Notes due 2018—net
|
15.0
|
|
14.9
|
|
|||
|
Loan Notes due 2021—gross
|
25.0
|
|
25.0
|
|
|||
|
Unamortized finance costs
|
(0.1
|
)
|
(0.1
|
)
|
|||
|
Loan Notes due 2021—net
|
24.9
|
|
24.9
|
|
|||
|
Loan Notes due 2023—gross
|
25.0
|
|
25.0
|
|
|||
|
Unamortized finance costs
|
(0.3
|
)
|
(0.3
|
)
|
|||
|
Loan Notes due 2023—net
|
24.7
|
|
24.7
|
|
|||
|
Loan Notes due 2026—gross
|
25.0
|
|
25.0
|
|
|||
|
Unamortized finance costs
|
(0.3
|
)
|
(0.3
|
)
|
|||
|
Loan Notes due 2026—net
|
24.7
|
|
24.7
|
|
|||
|
Revolving credit facility—gross
|
21.3
|
|
32.8
|
|
|||
|
Unamortized finance costs
|
(1.8
|
)
|
(1.0
|
)
|
|||
|
Revolving credit facility—net
|
19.5
|
|
31.8
|
|
|||
|
108.8
|
|
121.0
|
|
||||
|
Included in current liabilities
|
15.0
|
|
—
|
|
|||
|
Included in non-current liabilities
|
93.8
|
|
121.0
|
|
|||
|
108.8
|
|
121.0
|
|
||||
On July 31, 2017, an extension to the Senior Facilities Agreement was agreed which provides
$150 million
in committed debt facilities, in the form of a multi-currency revolving credit facility, with an additional
$50 million
of uncommitted facilities through an accordion facility. The Senior Facilities Agreement was due to mature in April 2019, but has now been extended until the end of July 2022. Finance costs of
$1.2 million
were capitalized following this extension and were deemed to be a modification of the existing facility. The Senior Facility Agreement bears interest equal to a margin based upon the Group's leverage plus either EURIBOR or LIBOR, depending on the currency drawn down.
On June 29, 2016, Luxfer agreed to extend the maturity date of
$50 million
of its existing
$65 million
Loan Notes due 2018. The extension includes a lower long-term fixed interest rate on the debt. The maturity date on
$25 million
was extended from June 2018 to June 2023 with a reduction in the fixed interest rate from
6.19%
to
4.88%
; and the maturity date on
$25 million
was extended to June 2026 at a fixed interest rate of
4.94%
. This was facilitated through the utilization of the Shelf Facility.
The
$25.0 million
7
year private placement will be repayable in full in 2021 and bears interest at a fixed rate of
3.67%
.
The maturity profile of the Group's undiscounted contractual payments is disclosed in Note 27.
LUXFER HOLDINGS PLC
NOTES TO THE CONSOLIDATED FINANCIAL STATEMENTS (Continued)
All amounts in millions, except share and per share data
|
22.
|
Provisions
|
|
|
Rationalization
and
redundancy
|
Employee
benefits
|
Environmental
provisions
|
Total
|
|||||||||
|
$M
|
$M
|
$M
|
$M
|
||||||||||
|
At January 1, 2016
|
2.6
|
|
1.5
|
|
1.2
|
|
5.3
|
|
|||||
|
Charged to consolidated income statement
|
1.4
|
|
—
|
|
—
|
|
1.4
|
|
|||||
|
Credited to consolidated income statement
|
(0.2
|
)
|
(0.4
|
)
|
—
|
|
(0.6
|
)
|
|||||
|
Cash payments
|
(3.0
|
)
|
—
|
|
(0.3
|
)
|
(3.3
|
)
|
|||||
|
Translation
|
—
|
|
—
|
|
(0.2
|
)
|
(0.2
|
)
|
|||||
|
At December 31, 2016
|
0.8
|
|
1.1
|
|
0.7
|
|
2.6
|
|
|||||
|
Charged to consolidated income statement
|
4.3
|
|
0.5
|
|
0.4
|
|
5.2
|
|
|||||
|
Credited to consolidated income statement
|
—
|
|
—
|
|
(0.4
|
)
|
(0.4
|
)
|
|||||
|
Cash payments
|
(3.0
|
)
|
(0.5
|
)
|
—
|
|
(3.5
|
)
|
|||||
|
At December 31, 2017
|
2.1
|
|
1.1
|
|
0.7
|
|
3.9
|
|
|||||
|
At December 31, 2017
|
|
|
|
|
|
|
|||||||
|
Included in current liabilities
|
2.1
|
|
—
|
|
0.7
|
|
2.8
|
|
|||||
|
Included in non-current liabilities
|
—
|
|
1.1
|
|
—
|
|
1.1
|
|
|||||
|
2.1
|
|
1.1
|
|
0.7
|
|
3.9
|
|
||||||
|
At December 31, 2016
|
|
|
|
|
|
|
|||||||
|
Included in current liabilities
|
0.8
|
|
—
|
|
0.7
|
|
1.5
|
|
|||||
|
Included in non-current liabilities
|
—
|
|
1.1
|
|
—
|
|
1.1
|
|
|||||
|
0.8
|
|
1.1
|
|
0.7
|
|
2.6
|
|
||||||
Rationalization and redundancy
At
December 31, 2017
, the Group had
$2.1 million
of provisions relating to redundancy and the rationalization of its operations (
2016
:
$0.8 million
).
$1.3 million
(2016:
$0.3 million
) and
$0.8 million
(2016:
$0.5 million
) of this provision in 2017 related to the Elektron and Gas Cylinders divisions respectively. Of the
$1.3 million
within the Elektron division,
$0.6 million
related to an onerous contract and
$0.5 million
to the rationalization of its Magtech operations.
Employee benefits
At
December 31, 2017
, the Group had
$1.1 million
of employee benefit liabilities (in addition to retirement benefits), as calculated on an actuarial basis, relating to a provision for workers' compensation in the U.S. (
2016
:
$1.1 million
).
Environmental provisions
At
December 31, 2017
, the Group had environmental provisions totaling
$0.7 million
relating to environmental clean-up costs (
2016
:
$0.7 million
).
$0.4 million
relates to a provision for disbursement of environmental liabilities as part of the acquisition of the trade and assets of the Specialty Metals business of ESM Group Inc.,
$0.2 million
relates to work required at the U.K. Elektron division site and
$0.1 million
relates to work required at a Elektron business in the U.S. acquired during 2014.
F-
44
LUXFER HOLDINGS PLC
NOTES TO THE CONSOLIDATED FINANCIAL STATEMENTS (Continued)
All amounts in millions, except share and per share data
|
23.
|
Deferred income taxes
|
|
Accelerated
tax
depreciation
|
Other
temporary
differences
|
Tax
losses
|
Retirement
benefit
obligations
|
Total
|
||||||||||||
|
|
$M
|
$M
|
$M
|
$M
|
$M
|
|||||||||||
|
At January 1, 2016
|
(11.0
|
)
|
5.1
|
|
4.7
|
|
13.3
|
|
12.1
|
|
||||||
|
Credited/(charged) to consolidated income statement
|
0.1
|
|
(2.1
|
)
|
0.9
|
|
(1.2
|
)
|
(2.3
|
)
|
||||||
|
Credited to other comprehensive income
|
—
|
|
—
|
|
—
|
|
4.3
|
|
4.3
|
|
||||||
|
Exchange difference
|
—
|
|
(0.2
|
)
|
(0.5
|
)
|
(1.7
|
)
|
(2.4
|
)
|
||||||
|
At December 31, 2016
|
(10.9
|
)
|
2.8
|
|
5.1
|
|
14.7
|
|
11.7
|
|
||||||
|
Credited/(charged) to consolidated income statement
|
5.2
|
|
(1.0
|
)
|
—
|
|
0.6
|
|
4.8
|
|
||||||
|
Charged to other comprehensive income
|
—
|
|
(0.6
|
)
|
—
|
|
(5.2
|
)
|
(5.8
|
)
|
||||||
|
Credited to equity
|
—
|
|
0.6
|
|
—
|
|
—
|
|
0.6
|
|
||||||
|
Exchange difference
|
—
|
|
0.2
|
|
0.3
|
|
0.8
|
|
1.3
|
|
||||||
|
At December 31, 2017
|
(5.7
|
)
|
2.0
|
|
5.4
|
|
10.9
|
|
12.6
|
|
||||||
The amount of deferred income taxes accounted for in the Group balance sheet, after the offset of balances within countries for financial reporting purposes, comprised the following deferred income tax assets and liabilities:
|
December 31, 2017
|
December 31, 2016
|
||||||
|
|
$M
|
$M
|
|||||
|
Deferred income tax liabilities
|
(3.6
|
)
|
(4.9
|
)
|
|||
|
Deferred income tax assets
|
16.2
|
|
16.6
|
|
|||
|
Net deferred income tax assets
|
12.6
|
|
11.7
|
|
|||
At the balance sheet date, the Group has unrecognized deferred income tax assets relating to certain trading and capital losses and other temporary differences of
$13.3 million
(
2016
:
$12.3 million
) potentially available for offset against future profits. No deferred income tax assets have been recognized in respect of this amount because of the unpredictability of future qualifying profit streams in the relevant entities. Of the total unrecognized deferred income tax assets of
$13.3 million
(
2016
:
$12.3 million
),
$10.3 million
(
2016
:
$8.8 million
) relates to losses that can be carried forward indefinitely under current legislation and the remaining
$3.0 million
(
2016
:
$3.5 million
) are due to expire between 2028 and 2034.
At the balance sheet date, there were unremitted earnings of overseas subsidiaries and joint ventures and associates of
$42.4 million
(
2016
:
$54.9 million
), for which there are
no
deferred income tax liabilities recognized or unrecognized (
2016
: $
nil
).
The 2017 deferred tax credit includes a non-cash accounting adjustment of $6.0 million following the enactment of U.S. tax reform on December 22, 2017. The non-cash adjustment is due to the reduction in the U.S. federal corporate income tax rate from 35% to 21%, which necessitated a re-measurement of the existing U.S. deferred tax position in 2017.
F-
45
LUXFER HOLDINGS PLC
NOTES TO THE CONSOLIDATED FINANCIAL STATEMENTS (Continued)
All amounts in millions, except share and per share data
24. Trade and other payables
|
December 31, 2017
|
|
December 31, 2016
|
|||||
|
|
$M
|
|
$M
|
||||
|
Non-current Liabilities
|
|||||||
|
Accruals
|
1.5
|
|
—
|
|
|||
|
Derivative financial instruments
|
0.4
|
|
0.6
|
|
|||
|
1.9
|
|
0.6
|
|
||||
|
Current Liabilities
|
|
|
|
|
|||
|
Trade payables
|
28.4
|
|
24.0
|
|
|||
|
Other taxation and social security
|
1.3
|
|
1.3
|
|
|||
|
Accruals
|
29.7
|
|
20.4
|
|
|||
|
Interest payable
|
0.4
|
|
0.2
|
|
|||
|
Derivative financial instruments
|
1.5
|
|
5.2
|
|
|||
|
61.3
|
|
51.1
|
|
||||
The directors consider that the carrying value of trade payables approximates to their fair value.
25. Acquisitions
On December 5, 2017, the Group acquired the trade and assets of the Specialty Metals business of ESM Group Inc., incorporating a manufacturing facility in Saxonburg PA. The plant manufactures a range of magnesium-based chips, granules, ground powders and atomized powders. The acquired business will be integrated with Luxfer’s existing business that currently offers similar products under the Luxfer Magtech brand. On closing, an initial consideration of
$4.3 million
was paid as well as an amount placed in general escrow of
$0.3 million
as deferred consideration. There was a further
$0.4 million
placed in escrow for disbursement of environmental liabilities which has not been included as part of the purchase consideration.
The fair value of net assets acquired has been assessed as
$5.8 million
, resulting in a gain on bargain purchase of
$1.2 million
. The principal assets acquired are land and buildings,
$2.0 million
, plant and equipment,
$3.2 million
and inventory,
$0.7 million
, with assumed liabilities of
$0.1 million
. No separately identifiable intangibles have been identified. There gain on bargain purchase resulted because the Specialty Metals business was not considered to be part of ESM Group's core business activities as it has adopted a strategy to focus on its steel industry customers. In implementing this strategy, ESM Group was eager to divest this non-core business, which was reflected in the transaction price. The Group believes that it can extract additional value from the site due to synergies with our existing Luxfer Magtech business.
In addition to the purchase consideration,
$0.5 million
of acquisition-related costs were incurred and a
$0.4 million
provision was set up for the disbursement of the environmental liabilities.
On April 29, 2016, the Group acquired a business, Canland UK (Hotpack) Limited ("Canland") specializing in the assembly, packing, distribution and export of self-heating meals and import and distribution of flameless ration heaters. On closing, an initial consideration of
$0.5 million
was paid, and with the acquired business having
$0.2 million
of cash, the net cost was
$0.3m
. Based on the assessment of the assets which were acquired and liabilities assumed, customer related intangibles were recognized for
$0.1 million
, goodwill for
$0.1 million
was also recognized and
$0.1 million
of other net assets. Goodwill included the fair value of the expertise of the acquired workforce following the business combination and also the synergies that were expected to arise. Following the Group-wide rationalization which took place during 2017, the operation was closed and sold for consideration of
$0.1 million
.
Deferred consideration
The deferred consideration for the acquisition of the Specialty Metals business was shown in the balance sheet at December 31, 2017 at
$0.3 million
.
F-
46
LUXFER HOLDINGS PLC
NOTES TO THE CONSOLIDATED FINANCIAL STATEMENTS (Continued)
All amounts in millions, except share and per share data
25. Acquisitions (Continued)
The deferred consideration for Luxfer Utah was fixed and all of it was paid on March 31, 2017. The deferred consideration was shown in the balance sheet at
December 31, 2016
at
$1.3 million
.
Deferred contingent consideration
The deferred contingent consideration for Luxfer Magtech is linked to the future profitability of the company and where appropriate will be payable annually from 2015 to 2020. The deferred contingent consideration is shown in the balance sheet at
December 31, 2017
at
$0.7 million
(
2016
:
$1.5 million
, following a remeasurement of deferred contingent consideration at the year-end based upon the estimated future cash flows and the weighted probability of those cash flows being achieved, resulting in a credit to the consolidated income statement of
$1.0 million
(
2016
: credit of
$0.5 million
), net of an unwind of discount on deferred contingent consideration of
$0.2 million
(
2016
:
$0.2 million
).
$0.5 million
of the
$0.7 million
consideration is deemed to be current as it is based on the performance of Luxfer Magtech for the year ending December 31, 2017. The potential undiscounted future payment has been estimated at
$0.7 million
. The maximum undiscounted amount payable under the sale agreement is
$10.0 million
.
|
December 31, 2017
|
December 31, 2016
|
||||||
|
|
$M
|
$M
|
|||||
|
Net cash flows on purchase of business:
|
|||||||
|
Included in net cash flows from investing activities:
|
|||||||
|
Consideration paid
|
4.3
|
|
0.5
|
|
|||
|
Deferred consideration paid
|
1.4
|
|
—
|
|
|||
|
Cash receipt on disposal of business
|
(0.1
|
)
|
—
|
|
|||
|
Cash acquired
|
—
|
|
(0.2
|
)
|
|||
|
5.6
|
|
0.3
|
|
||||
26. Commitments and contingencies
|
December 31, 2017
|
December 31, 2016
|
December 31, 2015
|
||||||||
|
|
$M
|
$M
|
$M
|
|||||||
|
Operating lease commitments—Group as a lessee
|
||||||||||
|
Minimum lease payments under operating leases recognized in the consolidated income statement
|
5.1
|
|
4.8
|
|
5.6
|
|
||||
At the balance sheet date, the Group had outstanding commitments for future minimum lease payments under non-cancellable operating leases, which fall due as follows:
|
December 31, 2017
|
December 31, 2016
|
December 31, 2015
|
||||||||
|
|
$M
|
$M
|
$M
|
|||||||
|
Within one year
|
5.4
|
|
4.6
|
|
4.9
|
|
||||
|
In two to five years
|
14.5
|
|
11.8
|
|
13.5
|
|
||||
|
In over five years
|
14.5
|
|
10.7
|
|
12.4
|
|
||||
|
34.4
|
|
27.1
|
|
30.8
|
|
|||||
Operating lease payments represent rentals payable by the Group for certain of its properties and items of machinery. Leasehold land and buildings have a life between
2
and
65 years
. Plant and equipment held under operating leases have an average life between
2
and
5 years
. Renewal terms are included in the lease contracts.
F-
47
LUXFER HOLDINGS PLC
NOTES TO THE CONSOLIDATED FINANCIAL STATEMENTS (Continued)
All amounts in millions, except share and per share data
26. Commitments and contingencies (Continued)
Capital commitments
At
December 31, 2017
, the Group had capital expenditure commitments of
$0.6 million
(
2016
:
$3.6 million
and
2015
:
$3.1 million
) for the acquisition of new plant and equipment.
Contingencies
During February 2014, a cylinder was sold to a long term customer and ruptured at one of their gas facilities. As a result of this rupture,
three
people were noted to have minor injuries such as loss of hearing. There was
no
major damage to assets of the customer. A claim has been launched by the
three
people who were injured in the incident and a prosecutor has been appointed. We have reviewed our quality control checks from around the time which the cylinder was produced and
no
instances of failures have been noted. It has also been noted by the investigator that the customer has poor quality and safety checks. As a result we do not believe that we are liable for the incident.
27. Financial risk management objectives and policies
The Group's financial instruments comprise bank and other loans, senior loan notes, derivatives and trade payables. Other than derivatives, the main purpose of these financial instruments is to raise finance for the Group's operations. The Group also has various financial assets such as trade receivables and cash and cash equivalents, which arise directly from its operations.
A Treasury Committee, chaired by the Chief Financial Officer, oversees the implementation of the Group's hedging policies, including the risk management of currency and aluminum risks and the use of derivative financial instruments.
It is not the Group's policy or business activity to trade in derivatives. They are only used to hedge underlying risks occurring as part of the Group's normal operating activities.
The main risks arising from the Group's financial instruments are cash flow interest rate risk, liquidity risk, foreign currency translation and transaction risk, aluminum price risk and credit risk on trade receivables.
The Group regularly enters into forward currency contracts to manage currency risks and when considered suitable will use other financial derivatives to manage commodity and interest rate risks.
Interest rate risk
The Group has exposure to variable interest rates when it draws down on the revolving credit facilities. As a result of this exposure, the Group may decide to hedge interest payable based on a combination of forward rate agreements, interest rate caps and swaps. It has also used fixed rate debt within its financing structure to mitigate volatility in interest rate movements as disclosed in Note 21. If the interest rates were to change by 1%, based on the balance on the revolving credit facilities at
December 31, 2017
, this would impact the interest cost by approximately
$0.2 million
.
Total debt and debt funding to joint ventures and associates, at
December 31, 2017
, all related to fixed interest rate debt and so there was no interest rate risk at that date.
Liquidity risk
To understand and monitor cash flows, the Group uses a combination of a short-term rolling six week cash forecast, based on expected daily liquidity requirements and longer term monthly rolling forecasts, covering forecast periods of between
6
and
18 months
forward. The Group also prepares, at least annually, a longer-term strategic cash forecast. Together this system of control is used to ensure the Group can fund its ongoing operations, including working capital, capital expenditure and interest payments and to ensure that bank covenant targets will be met. Short and medium term changes in liquidity needs are funded from the Group's
$150 million
revolving bank facility, as disclosed in Note 21, which provides the ability to draw down and repay funds on a daily basis. In monitoring liquidity requirements and planning its working capital and capital expenditure programs, the Group aims to maintain a sufficiently prudent level of headroom against its banking facilities and forecast covenant position as protection against any unexpected or sudden market shocks.
F-
48
LUXFER HOLDINGS PLC
NOTES TO THE CONSOLIDATED FINANCIAL STATEMENTS (Continued)
All amounts in millions, except share and per share data
27. Financial risk management objectives and policies (Continued)
The Group also uses forecasts to manage the compliance with any associated covenant tests in relation to the Group's financing arrangements. The Group is subject to maintaining net debt to EBITDA levels of below three times, EBITDA to net interest above four times, and a number of other debt service tests which include EBITDA, taxation, capital expenditure and pension payments.
The Group has been in compliance with the covenants under the Loan Notes due 2018, 2021, 2023 and 2026 and the banking facilities throughout all of the quarterly measurement dates from and including September 30, 2011 to December 31, 2017.
The maturity of the Group's liabilities is also monitored to ensure sufficient funds remain available to meet liabilities as they fall due. The table below summarizes the maturity profile of the Group's financial liabilities at
December 31,
based on contractual payments.
|
December 31, 2017
|
December 31, 2016
|
||||||||||||||||||||||||
|
Within 12 months
|
1-5 years
|
> 5 years
|
Total
|
Within 12 months
|
1-5 years
|
> 5 years
|
Total
|
||||||||||||||||||
|
$M
|
$M
|
$M
|
$M
|
$M
|
$M
|
$M
|
$M
|
||||||||||||||||||
|
Loan Notes due 2018
|
15.0
|
|
—
|
|
—
|
|
15.0
|
|
—
|
|
15.0
|
|
—
|
|
15.0
|
|
|||||||||
|
Loan Notes due 2021
|
—
|
|
25.0
|
|
—
|
|
25.0
|
|
—
|
|
25.0
|
|
—
|
|
25.0
|
|
|||||||||
|
Loan Notes due 2023
|
—
|
|
—
|
|
25.0
|
|
25.0
|
|
—
|
|
—
|
|
25.0
|
|
25.0
|
|
|||||||||
|
Loan Notes due 2026
|
—
|
|
—
|
|
25.0
|
|
25.0
|
|
—
|
|
—
|
|
25.0
|
|
25.0
|
|
|||||||||
|
Revolving credit facility
|
—
|
|
21.3
|
|
—
|
|
21.3
|
|
—
|
|
32.8
|
|
—
|
|
32.8
|
|
|||||||||
|
Deferred contingent consideration
|
0.5
|
|
0.2
|
|
—
|
|
0.7
|
|
—
|
|
1.5
|
|
—
|
|
1.5
|
|
|||||||||
|
Deferred consideration
|
0.3
|
|
—
|
|
—
|
|
0.3
|
|
1.3
|
|
—
|
|
—
|
|
1.3
|
|
|||||||||
|
Trade payables
|
28.4
|
|
—
|
|
—
|
|
28.4
|
|
24.0
|
|
—
|
|
—
|
|
24.0
|
|
|||||||||
|
Accruals
|
29.7
|
|
1.5
|
|
—
|
|
31.2
|
|
20.4
|
|
—
|
|
—
|
|
20.4
|
|
|||||||||
|
Interest payable
|
0.4
|
|
—
|
|
—
|
|
0.4
|
|
0.2
|
|
—
|
|
—
|
|
0.2
|
|
|||||||||
|
Derivative financial instruments
|
1.5
|
|
0.4
|
|
—
|
|
1.9
|
|
5.2
|
|
0.6
|
|
—
|
|
5.8
|
|
|||||||||
|
Overdrafts
|
4.2
|
|
—
|
|
—
|
|
4.2
|
|
—
|
|
—
|
|
—
|
|
—
|
|
|||||||||
|
80.0
|
|
48.4
|
|
50.0
|
|
178.4
|
|
51.1
|
|
74.9
|
|
50.0
|
|
176.0
|
|
||||||||||
The table below summarizes the maturity profile of the Group's financial liabilities at
December 31
based on contractual undiscounted payments. Interest rates on the Group's variable rate debt have been based on a forward curve.
|
December 31, 2017
|
December 31, 2016
|
||||||
|
$M
|
$M
|
||||||
|
Undiscounted contractual maturity of financial liabilities:
|
|||||||
|
Amounts payable:
|
|||||||
|
Within 12 months
|
84.5
|
|
56.4
|
|
|||
|
1-5 years
|
63.6
|
|
90.5
|
|
|||
|
> 5 years
|
54.9
|
|
57.4
|
|
|||
|
203.0
|
|
204.3
|
|
||||
|
Less: future finance charges
|
(24.6
|
)
|
(28.3
|
)
|
|||
|
178.4
|
|
176.0
|
|
||||
F-
49
LUXFER HOLDINGS PLC
NOTES TO THE CONSOLIDATED FINANCIAL STATEMENTS (Continued)
All amounts in millions, except share and per share data
27. Financial risk management objectives and policies (Continued)
Capital risk management
The capital structure of the Group consists of shareholders' equity, debt and cash and cash equivalents. For the foreseeable future, the Board will maintain a capital structure that supports the Group's strategic objectives through:
|
•
|
Managing funding and liquidity;
|
|
•
|
Optimizing shareholder return; and
|
|
•
|
Maintaining a strong, investment-grade credit rating
|
The Group monitors its adjusted EBITDA, as reconciled in the table below, for continuing activities to net debt ratio. The table below sets out the calculations for
2017
,
2016
and
2015
:
|
2017
|
2016
|
2015
|
||||||||
|
$M
|
$M
|
$M
|
||||||||
|
For continuing operations:
|
||||||||||
|
Operating profit
|
19.3
|
|
35.8
|
|
37.9
|
|
||||
|
Deduct:
|
||||||||||
|
Profit on sale of redundant site (Note 5)
|
(0.4
|
)
|
(2.1
|
)
|
—
|
|
||||
|
Changes to defined benefit pension plans (Note 5)
|
—
|
|
(0.6
|
)
|
(18.0
|
)
|
||||
|
Add back:
|
||||||||||
|
Restructuring and other expense (Note 5)
|
21.6
|
|
2.2
|
|
22.4
|
|
||||
|
Loss on disposal of property, plant and equipment
|
0.1
|
|
0.2
|
|
—
|
|
||||
|
Other share based compensation charges
|
2.2
|
|
1.4
|
|
1.3
|
|
||||
|
Depreciation and amortization
|
19.0
|
|
18.4
|
|
18.6
|
|
||||
|
Adjusted EBITDA
|
61.8
|
|
55.3
|
|
62.2
|
|
||||
|
Bank and other loans
|
108.8
|
|
121.0
|
|
131.6
|
|
||||
|
Total debt
|
108.8
|
|
121.0
|
|
131.6
|
|
||||
|
Less: Cash and cash equivalents
|
(13.3
|
)
|
(13.6
|
)
|
(36.9
|
)
|
||||
|
Add: Overdrafts
|
4.2
|
|
—
|
|
—
|
|
||||
|
Add: Restricted cash
|
0.7
|
|
—
|
|
—
|
|
||||
|
Net debt
|
100.4
|
|
107.4
|
|
94.7
|
|
||||
|
Net debt: Adjusted EBITDA ratio
|
1.6
|
x
|
1.9
|
x
|
1.5
|
x
|
||||
F-
50
LUXFER HOLDINGS PLC
NOTES TO THE CONSOLIDATED FINANCIAL STATEMENTS (Continued)
All amounts in millions, except share and per share data
27. Financial risk management objectives and policies (Continued)
Reconciliation of net debt
|
Cash at bank and in hand
|
Overdrafts
|
Bank and other loans due within one year
|
Bank and other loans due after one year
|
Total
|
||||||||||||
|
$M
|
$M
|
$M
|
$M
|
$M
|
||||||||||||
|
Net debt at January 1, 2016
|
(36.9
|
)
|
—
|
|
—
|
|
131.6
|
|
94.7
|
|
||||||
|
Cash flows
|
21.4
|
|
—
|
|
—
|
|
(9.0
|
)
|
12.4
|
|
||||||
|
Foreign exchange adjustments
|
1.9
|
|
—
|
|
—
|
|
(2.1
|
)
|
(0.2
|
)
|
||||||
|
Other non-cash movements
|
—
|
|
—
|
|
—
|
|
0.5
|
|
0.5
|
|
||||||
|
Net debt at January 1, 2017
|
(13.6
|
)
|
—
|
|
—
|
|
121.0
|
|
107.4
|
|
||||||
|
Cash flows
|
6.5
|
|
—
|
|
—
|
|
(14.5
|
)
|
(8.0
|
)
|
||||||
|
Reclassification
|
(4.2
|
)
|
4.2
|
|
14.9
|
|
(14.9
|
)
|
—
|
|
||||||
|
Foreign exchange adjustments
|
(2.0
|
)
|
—
|
|
—
|
|
1.7
|
|
(0.3
|
)
|
||||||
|
Restricted cash
|
0.7
|
|
—
|
|
—
|
|
—
|
|
0.7
|
|
||||||
|
Other non-cash movements
|
—
|
|
—
|
|
0.1
|
|
0.5
|
|
0.6
|
|
||||||
|
Net debt at December 31, 2017
|
(12.6
|
)
|
4.2
|
|
15.0
|
|
93.8
|
|
100.4
|
|
||||||
Credit risk
The Group only provides trade credit to creditworthy third parties. Credit checks are performed on new and existing customers along with monitoring payment histories of customers. Outstanding receivables from customers are closely monitored to ensure they are paid when due, with both outstanding overdue days and total days of sales outstanding reported as a business unit key performance measure. Where possible sales are also protected through the use of credit insurance. At
December 31, 2017
, the Group has a provision for bad and doubtful debtors of
$4.1 million
(
2016
:
$2.1 million
) and a charge of
$2.7 million
(
2016
:
$1.3 million
) has been made to the consolidated income statement in relation to bad debts recognized in
2017
.
The analysis of trade receivables that were past due but not impaired is as follows:
|
Neither past due nor impaired
|
Past due but not impaired
|
|||||||||||||||||||||
|
Total
|
< 31 days
|
31-60 days
|
61-90 days
|
91-121 days
|
> 121 days
|
|||||||||||||||||
|
$M
|
$M
|
$M
|
$M
|
$M
|
$M
|
$M
|
||||||||||||||||
|
At December 31, 2017
|
54.0
|
|
37.3
|
|
11.0
|
|
3.2
|
|
1.7
|
|
0.8
|
|
—
|
|
||||||||
|
At December 31, 2016
|
40.5
|
|
33.4
|
|
5.5
|
|
1.0
|
|
0.5
|
|
0.1
|
|
—
|
|
||||||||
The Group also monitors the spread of its customer base with the objective of trying to minimize exposure at a Group and divisional level to any one customer. The top
10
customers in
2017
represented
25%
(
2016
:
27%
and
2015
:
27%
) of total revenue. There were
no
customers in
2017
,
2016
or
2015
that represented over
10%
of total revenue.
Foreign currency translation risk
With substantial operations in Europe, the Group is exposed to translation risk on both its consolidated income statement, based on average exchange rates, and its balance sheet with regards to period end exchange rates.
The Group's results and net assets are reported by geographic region in Note 2. This analysis shows in
2017
the Group had revenue of
$139.5 million
derived from U.K. operations, an operating loss of
$5.1 million
and when deducting profit on sale of a redundant site and adding back restructuring and other expense, share based compensation, and depreciation and amortization, an adjusted EBITDA of
$16.2 million
. During
2017
, the average exchange rate for GBP sterling was
£0.7682
compared to the
2016
average of
£0.7438
. This resulted in a negative impact of
$4.4 million
on revenue,
$0.2 million
on operating profit and
$0.5 million
on adjusted EBITDA. Based on the
2017
level of sales and profits a weakening in GBP sterling leading to a
£0.05
increase in the GBP sterling to U.S. dollar exchange rate would result in a decrease of
$8.5 million
in revenue,
$0.3 million
in operating loss and
$1.0 million
in adjusted EBITDA.
F-
51
LUXFER HOLDINGS PLC
NOTES TO THE CONSOLIDATED FINANCIAL STATEMENTS (Continued)
All amounts in millions, except share and per share data
27. Financial risk management objectives and policies (Continued)
The capital employed at
December 31, 2017
in the U.K. was
$81.8 million
translated at an exchange rate of
£0.7401
. A
£0.05
change in exchange rates would change capital employed by approximately
$5.2 million
.
During
2017
, the average exchange rate for the Euro was
€0.8788
, compared to the
2016
average of
€0.9061
. This resulted in a positive impact of
$0.9 million
on revenue,
nil
on operating profit and
$0.1 million
on adjusted EBITDA. Based on the
2017
level of sales and profits a weakening in the Euro leading to a
€0.05
increase in the Euro to U.S. dollar exchange rate would result in a decrease of
$1.5 million
in revenue, no change to operating profit and $
0.1 million
in adjusted EBITDA.
Foreign currency transaction risk
In addition to currency translation risk, the Group incurs currency transaction risk whenever one of the Group's operating subsidiaries enters into either a purchase or sales transaction in a currency other than its functional currency. Currency transaction risk is reduced by matching sales revenues and costs in the same currency. The Group's U.S. operations have little currency exposure as most purchases, costs and revenues are conducted in U.S. dollars. The Group's U.K. operations are exposed to exchange transaction risks, mainly because these operations sell goods priced in Euros and U.S. dollars, and purchase raw materials priced in U.S. dollars. The Group also incurs currency transaction risk if it lends currency other than its functional currency to one of its joint venture partners.
The U.K. operations within the Group have approximately
$14.0 million
net sales risk after offsetting raw material purchases made in U.S. dollars and a substantial Euro sales risk, with approximately
$54.0 million
of exports priced in Euros. These risks are being partly hedged through the use of forward foreign currency exchange rate contracts, but we estimate that in
2017
our Elektron division has incurred a transaction gain of
$5.6 million
, and the transaction impact at our Gas Cylinders division was a gain of
$2.4 million
.
Based on a
$14.0 million
net exposure to the U.S. dollar, a
$0.10
increase in exchange rates would have a
$1.1 million
annual decrease in Group operating profit and based on a
€54.0 million
Euro sales risk a
€0.10
increase in exchange rates would have a
$5.5 million
annual decrease in Group operating profit.
Commodity price risks
The Group is exposed to a number of commodity price risks, including primary aluminum, magnesium, rare earth chemicals, zircon sand and other zirconium basic compounds. All have been subject to substantial increases in recent years. Historically the
two
largest exposures to the Group have been the prices of aluminum and magnesium and the Group will spend annually approximately
$80 million
to
$100 million
on these
two
raw materials.
Unlike the other major commodities purchased, aluminum is traded on the London Metal Exchange ("LME") and therefore the Group is able to use LME derivative contracts to hedge a portion of its price exposure. In
2017
the Group purchased approximately
12,500
metric tons of primary aluminum. The processed waste can be sold as scrap aluminum at prices linked to the LME price. The price risk on aluminum is mitigated by the use of LME derivative contracts. At
December 31, 2017
, the Group had hedged
32%
of its main primary aluminum requirements for
2018
. Before hedging the risk, a
$100
increase in the LME price of aluminum would increase our Gas Cylinders division's costs by approximately
$1.3 million
.
In the long-term, the Group has sought to recover the cost of increased commodity costs through price increases and surcharges. Any hedging of aluminum risk is performed to protect the Group against short-term fluctuations in aluminum costs.
In
2017
the Group purchased approximately
6,000
metric tons of primary magnesium. Magnesium is not traded on the LME so we are not able to maintain a hedge position of its price exposure.
The Group purchases various rare earth chemicals which it uses in the production of various materials produced by its Elektron division and when these chemicals became subject to significant price volatility it used surcharges on its products to maintain its product margins.
F-
52
LUXFER HOLDINGS PLC
NOTES TO THE CONSOLIDATED FINANCIAL STATEMENTS (Continued)
All amounts in millions, except share and per share data
28. Financial instruments
The following disclosures relating to financial instruments have been prepared on a basis which excludes short-term debtors and creditors which have resulted from the Group's operating activities.
|
(a)
|
Financial instruments of the Group
|
The financial instruments of the Group other than short-term debtors and creditors and non-current derivative financial instruments were as follows:
|
Book value
|
Fair value
|
Book value
|
Fair value
|
||||||||||
|
December 31, 2017
|
December 31, 2017
|
December 31, 2016
|
December 31, 2016
|
||||||||||
|
Financial instruments:
|
$M
|
$M
|
$M
|
$M
|
|||||||||
|
Financial assets:
|
|||||||||||||
|
Cash at bank and in hand
|
13.3
|
|
13.3
|
|
13.6
|
|
13.6
|
|
|||||
|
Financial liabilities
(1)
:
|
|||||||||||||
|
Loan Notes due 2018
|
15.0
|
|
15.3
|
|
15.0
|
|
15.9
|
|
|||||
|
Loan Notes due 2021
|
25.0
|
|
25.2
|
|
25.0
|
|
25.0
|
|
|||||
|
Loan Notes due 2023
|
25.0
|
|
26.6
|
|
25.0
|
|
26.3
|
|
|||||
|
Loan Notes due 2026
|
25.0
|
|
27.1
|
|
25.0
|
|
26.5
|
|
|||||
|
Revolving credit facility
|
21.3
|
|
21.3
|
|
32.8
|
|
32.8
|
|
|||||
|
Overdrafts
|
4.2
|
|
4.2
|
|
—
|
|
—
|
|
|||||
|
Deferred contingent consideration
|
0.7
|
|
0.7
|
|
1.5
|
|
1.5
|
|
|||||
|
Deferred consideration
|
0.3
|
|
0.3
|
|
1.3
|
|
1.3
|
|
|||||
|
(1)
|
The financial instruments included in financial liabilities are shown gross of unamortized finance costs.
|
|
(2)
|
The fair value of these financial instruments is calculated by discounting the future cash flows, including interest payments due.
|
All financial assets mature within one year except some derivative financial instruments. The maturity of the financial liabilities is disclosed in Note 27.
At
December 31, 2017
, the amount drawn in bank and other loans was
$111.3 million
(
2016
:
$122.8 million
), of which
$105.5 million
was denominated in U.S. dollars with the remainder being denominated in GBP sterling (
2016
:
$117.0 million
was denominated in U.S. dollars with the remainder being denominated in GBP sterling).
|
Book value
|
Fair value
|
Book value
|
Fair value
|
||||||||||
|
Derivative financial instruments are as follows:
|
December 31, 2017
|
December 31, 2017
|
December 31, 2016
|
December 31, 2016
|
|||||||||
|
$M
|
$M
|
$M
|
$M
|
||||||||||
|
Held to hedge purchases and sales by trading businesses:
|
|||||||||||||
|
Forward foreign currency exchange rate contracts
|
(0.7
|
)
|
(0.7
|
)
|
(3.1
|
)
|
(3.1
|
)
|
|||||
|
LME derivative contracts
|
1.2
|
|
1.2
|
|
(0.6
|
)
|
(0.6
|
)
|
|||||
The fair value calculations were performed on the following basis:
Cash at bank and in hand / overdrafts
The carrying value approximates to the fair value as a result of the short-term maturity of the instruments. Cash at bank and in hand are subject to a right to offset.
F-
53
LUXFER HOLDINGS PLC
NOTES TO THE CONSOLIDATED FINANCIAL STATEMENTS (Continued)
All amounts in millions, except share and per share data
28. Financial instruments (Continued)
Bank loans
At
December 31, 2017
, bank and other loans of
$111.3 million
(
2016
:
$122.8 million
) were outstanding. At
December 31, 2017
, bank and other loans are shown net of issue costs of
$2.5 million
(
2016
:
$1.8 million
) and these issue costs are to be amortized to the expected maturity of the facilities. At
December 31, 2017
,
$21.3 million
(
2016
:
$32.8 million
) of the total
$111.3 million
(
2016
:
$122.8 million
) bank and other loans was variable interest rate debt and subject to floating interest rate risk, with the remainder being fixed rate debt.
Forward foreign currency exchange rate contracts
The fair value of these contracts was calculated by determining what the Group would be expected to receive or pay on termination of each individual contract by comparison to present market prices.
LME derivative contracts
The fair value of these contracts has been calculated by valuing the contracts against the equivalent forward rates quoted on the LME.
Deferred contingent consideration
Disclosure of the basis of calculation of the fair value of deferred contingent consideration is included within Note 25 of the consolidated financial statements.
Deferred consideration
Disclosure of the basis of calculation of the fair value of deferred consideration is included within Note 25 of the consolidated financial statements.
Fair value hierarchy
At
December 31, 2017
, the Group used the following hierarchy for determining and disclosing the fair value of financial instruments by valuation technique:
Level 1: quoted (unadjusted) prices in active markets for identical assets or liabilities.
Level 2: other techniques for which all inputs which have a significant effect on the recorded fair value are observable, either directly or indirectly.
Level 3: techniques which use inputs which have a significant effect on the recorded fair value that are not based on observable market data.
|
December 31, 2017
|
Level 1
|
Level 2
|
Level 3
|
||||||||||
|
$M
|
$M
|
$M
|
$M
|
||||||||||
|
Net derivative financial (assets) / liabilities at fair value through profit or loss:
|
|||||||||||||
|
Forward foreign currency exchange rate contracts
|
0.7
|
|
—
|
|
0.7
|
|
—
|
|
|||||
|
LME derivative contracts
|
(1.2
|
)
|
—
|
|
(1.2
|
)
|
—
|
|
|||||
|
Interest bearing loans and borrowings:
|
|||||||||||||
|
Loan Notes due 2018
|
15.3
|
|
—
|
|
15.3
|
|
—
|
|
|||||
|
Loan Notes due 2021
|
25.2
|
|
—
|
|
25.2
|
|
—
|
|
|||||
|
Loan Notes due 2023
|
26.6
|
|
—
|
|
26.6
|
|
—
|
|
|||||
|
Loan Notes due 2026
|
27.1
|
|
—
|
|
27.1
|
|
—
|
|
|||||
|
Revolving credit facility
|
21.3
|
|
—
|
|
21.3
|
|
—
|
|
|||||
|
Other financial liabilities:
|
|||||||||||||
|
Deferred contingent consideration
|
0.7
|
|
—
|
|
—
|
|
0.7
|
|
|||||
|
Deferred consideration
|
0.3
|
|
—
|
|
—
|
|
0.3
|
|
|||||
F-
54
LUXFER HOLDINGS PLC
NOTES TO THE CONSOLIDATED FINANCIAL STATEMENTS (Continued)
All amounts in millions, except share and per share data
28. Financial instruments (Continued)
During the year ended
December 31, 2017
, there were no transfers between Level 1 and Level 2 fair value measurements.
The following table presents the changes in Level 3 instruments for the year ended
December 31, 2017
and
2016
.
|
2017
|
2016
|
||||||
|
$M
|
$M
|
||||||
|
Balance at January 1
|
2.8
|
|
2.9
|
|
|||
|
Payments made during year
|
(1.3
|
)
|
—
|
|
|||
|
New deferred consideration
|
0.3
|
|
—
|
|
|||
|
Gains recognized in profit or loss
|
(0.8
|
)
|
(0.1
|
)
|
|||
|
Balance at December 31
|
1.0
|
|
2.8
|
|
|||
|
Total gains for the period included in profit and loss for assets held at the end at December 31
|
(0.8
|
)
|
(0.1
|
)
|
|||
|
Change in unrealized (gains) or losses for the period included in profit and loss for assets held at the end at December 31
|
(0.8
|
)
|
(0.1
|
)
|
|||
The deferred contingent consideration relates to estimations of amounts payable in the future regarding acquisitions made in prior years. This is based upon an estimate of the future profitability of the businesses versus targets agreed upon as part of the acquisitions.
|
(b)
|
Interest rate risks
|
Interest rate risk profile on financial assets
This table shows the Group's financial assets at December 31, which are cash and cash equivalents. These assets are all subject to floating interest rate risk.
|
December 31, 2017
|
December 31, 2016
|
||||||
|
Cash by currency:
|
$M
|
$M
|
|||||
|
U.S. dollar
|
5.4
|
|
1.3
|
|
|||
|
GBP sterling
|
3.6
|
|
9.1
|
|
|||
|
Euro
|
1.0
|
|
1.4
|
|
|||
|
Australian dollar
|
0.6
|
|
0.5
|
|
|||
|
Chinese renminbi
|
1.0
|
|
0.8
|
|
|||
|
Czech koruna
|
1.2
|
|
0.3
|
|
|||
|
Canadian dollar
|
0.5
|
|
0.2
|
|
|||
|
13.3
|
|
13.6
|
|
||||
|
December 31, 2017
|
December 31, 2016
|
||||||
|
Overdraft by currency:
|
$M
|
$M
|
|||||
|
U.S. dollar
|
(3.0
|
)
|
—
|
|
|||
|
GBP sterling
|
(1.2
|
)
|
—
|
|
|||
|
(4.2
|
)
|
—
|
|
||||
The Group earns interest on cash balances through either deposit accounts or placing funds on money markets at short-term fixed rates. In all cases, with the exception of the restricted cash of
$0.7 million
, interest earned is at approximately ICELIBOR rates during the year.
F-
55
LUXFER HOLDINGS PLC
NOTES TO THE CONSOLIDATED FINANCIAL STATEMENTS (Continued)
All amounts in millions, except share and per share data
28. Financial instruments (Continued)
Interest rate risk profile on financial liabilities
The following table sets out the carrying value, by original maturity, of the Group's financial instruments that were exposed to both fixed and variable interest rate risk. The carrying values include interest payments to be made and interest rates on the Group's variable rate debt have been based on a forward curve.
|
December 31, 2017
|
December 31, 2016
|
||||||||||||||||||||||||
|
Within 12 months
|
1-5 years
|
> 5 years
|
Total
|
Within 12 months
|
1-5 years
|
> 5 years
|
Total
|
||||||||||||||||||
|
$M
|
$M
|
$M
|
$M
|
$M
|
$M
|
$M
|
$M
|
||||||||||||||||||
|
Floating interest rate risk:
|
|||||||||||||||||||||||||
|
Revolving credit facility (including interest payments)
|
0.7
|
|
24.2
|
|
—
|
|
24.9
|
|
0.9
|
|
34.1
|
|
—
|
|
35.0
|
|
|||||||||
|
Fixed interest rate risk:
|
|
|
|||||||||||||||||||||||
|
Loan Notes due 2018 (including interest payments)
|
15.5
|
|
—
|
|
—
|
|
15.5
|
|
0.9
|
|
15.5
|
|
—
|
|
16.4
|
|
|||||||||
|
Loan Notes due 2021 (including interest payments)
|
0.9
|
|
27.5
|
|
—
|
|
28.4
|
|
1.0
|
|
28.7
|
|
—
|
|
29.7
|
|
|||||||||
|
Loan Notes due 2023 (including interest payments)
|
1.2
|
|
4.9
|
|
25.6
|
|
31.7
|
|
1.2
|
|
4.9
|
|
26.8
|
|
32.9
|
|
|||||||||
|
Loan Notes due 2026 (including interest payments)
|
1.2
|
|
5.0
|
|
29.3
|
|
35.5
|
|
1.2
|
|
5.0
|
|
30.6
|
|
36.8
|
|
|||||||||
|
19.5
|
|
61.6
|
|
54.9
|
|
136.0
|
|
5.2
|
|
88.2
|
|
57.4
|
|
150.8
|
|
||||||||||
|
(c)
|
Hedging activities
|
Forward foreign currency exchange contracts
The Group utilizes forward foreign currency exchange contracts to hedge significant future transactions and cash flows to manage its exchange rate exposures. The contracts purchased are primarily denominated in GBP sterling, U.S. dollars, Euros and Australian dollars. The Group is also exposed to a number of other currencies like Japanese yen and Canadian dollars with hedges against these on a more ad hoc basis, when exposures are more significant.
At
December 31, 2017
, the fair value of forward foreign currency exchange contracts deferred in equity was a loss of
$0.7 million
(
2016
: loss of
$3.1 million
and
2015
: loss of
$0.4 million
). During
2017
, a gain of
$0.6 million
(
2016
: loss of
$0.9 million
and
2015
: loss of
$0.1 million
) has been transferred to the consolidated income statement in respect of contracts that have matured in the year.
At
December 31, 2017
and
2016
, the Group held various forward foreign currency exchange contracts designated as hedges in respect of forward sales for U.S. dollars, Euros and Australian dollars for the receipt of GBP sterling or Euros. The Group also held forward foreign currency exchange contracts designated as hedges in respect of forward purchases for U.S. dollars by the sale of GBP sterling. The contract totals in GBP sterling and Euros, range of maturity dates and range of exchange rates are disclosed overleaf:
|
December 31, 2017
|
Australian dollars
|
||||||||||
|
Sales hedges
|
U.S. dollars
|
Euros
|
|||||||||
|
Contract totals/£m
|
17.1
|
|
|
27.5
|
|
|
2.8
|
|
|||
|
Maturity dates
|
01/18 to 07/19
|
|
|
01/18 to 07/19
|
|
|
06/18
|
|
|||
|
Exchange rates
|
$1.2433 to $1.3444
|
|
|
€1.0949 to €1.1803
|
|
|
$
|
1.7667
|
|
||
F-
56
LUXFER HOLDINGS PLC
NOTES TO THE CONSOLIDATED FINANCIAL STATEMENTS (Continued)
All amounts in millions, except share and per share data
28. Financial instruments (Continued)
|
Purchase hedges
|
U.S. dollars
|
Euros
|
Australian dollars
|
|||||||
|
Contract totals/£m
|
12.5
|
|
0.1
|
|
1.7
|
|
||||
|
Maturity dates
|
01/18 to 07/19
|
|
01/18
|
|
06/18
|
|
||||
|
Exchange rates
|
$1.2414 to $1.3389
|
|
€1.1084
|
|
$1.7161
|
|
||||
|
December 31, 2016
|
Australian dollars
|
|||||||||
|
Sales hedges
|
U.S. dollars
|
Euros
|
||||||||
|
Contract totals/£m
|
27.6
|
|
39.4
|
|
2.9
|
|
||||
|
Maturity dates
|
01/17 to 11/18
|
|
01/17 to 11/18
|
|
09/17
|
|
||||
|
Exchange rates
|
$1.2310 to $1.5638
|
|
€1.0951 to €1.4200
|
|
$1.7237
|
|||||
|
Purchase hedges
|
U.S. dollars
|
Euros
|
|||||||
|
Contract totals/£m
|
25.7
|
|
2.5
|
|
|||||
|
Maturity dates
|
01/17 to 10/18
|
|
01/17 to 06/17
|
|
|||||
|
Exchange rates
|
$1.2311 to $1.5618
|
|
€1.1121 to €1.1804
|
|
|||||
Aluminum commodity contracts
The Group did not hold any forward aluminum commodity contracts at
December 31, 2017
or
December 31, 2016
.
Forward interest rate agreements
The Group did not hold any forward interest rate agreements at
December 31, 2017
or
December 31, 2016
.
LME derivative contracts
At
December 31, 2017
, the Group has hedged
3,000
metric tons of aluminum for supply in
2018
, using its ancillary banking facilities. The fair value of LME derivative contracts deferred in equity was a
gain
of
$1.2 million
(
2016
:
loss
of
$0.6 million
and
2015
:
loss
of
$3.7 million
).
|
(d)
|
Foreign currency translation risk disclosures
|
Exchange gains and losses arising on the translation of the Group's non-U.S. assets and liabilities are classified as equity and transferred to the Group's translation reserve. In
2017
, a
gain
of
$11.6 million
(
2016
: loss of
$13.1 million
and
2015
: loss of
$8.6 million
) was recognized in translation reserves.
|
(e)
|
Un-drawn committed facilities
|
At
December 31, 2017
, the Group had committed banking facilities of
$150.0 million
. The facilities were for providing loans and overdrafts, with a separate facility for letters of credit which at
December 31, 2017
was
£7.0 million
(
$9.5 million
). Of the committed facilities,
$21.3 million
of loans were drawn and $
nil
for letters of credit were utilized. The Group also has a separate bonding facility for bank guarantees denominated in GBP sterling of
£3.0 million
(
$4.1 million
), of which
£1.0 million
(
$1.4 million
) was utilized at
December 31, 2017
.
At
December 31, 2016
, the Group had committed banking facilities of
$150.0 million
. The facilities were for providing loans and overdrafts, with a separate facility for letters of credit which at
December 31, 2016
was
£7.0 million
(
$8.6 million
). Of the committed facilities,
$32.8 million
of loans were drawn and $
nil
for letters of credit were utilized. The Group also has a separate bonding facility for bank guarantees denominated in GBP sterling of
£3.0 million
(
$3.7 million
), of which
£1.0 million
(
$1.3 million
) was utilized at
December 31, 2016
.
F-
57
LUXFER HOLDINGS PLC
NOTES TO THE CONSOLIDATED FINANCIAL STATEMENTS (Continued)
All amounts in millions, except share and per share data
29. Retirement benefits
The Group has defined benefit pension plans in the U.K., the U.S. and France. The levels of funding are determined by periodic actuarial valuations. The assets of the plans are generally held in separate trustee-administered funds. The Group also operates defined contribution plans in the U.K., the U.S., Australia and Canada.
Remeasurements are recognized in full in the period in which they occur. The liability recognized in the balance sheet represents the present value of the defined benefit obligation, as reduced by the fair value of plan assets. The cost of providing benefits is determined using the Projected Unit Credit Method.
The principal defined benefit pension plans in the Group is the U.K. Luxfer Group Pension Plan ("the Plan"), which closed to new members in 1998, new employees then being eligible for a defined contribution plan. With effect from April 2004, the Plan changed from a final salary to a career average revalued earnings benefit scale. In August 2005, a plan specific earnings cap of
£60,000
per annum subject to inflation increases was introduced, the figure had risen to
£76,000
in 2015. In October 2007, the rate of the future accrual for pension was reduced and a longevity adjustment was introduced to mitigate against the risk of further unexpected increases in life expectancies. In 2015, following a consultation with the Trustees and members, it was agreed the Plan would close to future accrual of benefits effective from April 5, 2016 and for the purpose of increasing pensions in payment, to use the Consumer Prices Index ("CPI") as the reference index in place of the Retail Prices Index ("RPI") where applicable. The remaining active members, numbering approximately
160
, were transferred into a defined contribution plan. The weighted average duration of the expected benefit payments from the Plan is around
18
years. The pension cost of the Plan is assessed in accordance with the advice of an independent firm of professionally qualified actuaries, Lane Clark & Peacock LLP. The Plan is registered with HMRC for tax purposes, operates separately from the Group and is managed by an independent set of Trustees. The Plan operates under U.K. trust law and the trust is a separate legal entity from the Group. The Plan is governed by an independent board of Trustees, composed of two member nominated Trustees and four company appointed Trustees.
The Trustees are required by law to act in the best interests of plan members and are responsible for setting certain policies (e.g. investment funding) together with the Company. A schedule of payments provides for deficit funding, which is based upon minimum annual contributions of
£3.8 million
per year, together with additional variable contributions based on
15%
of net earnings of Luxfer Holdings PLC between
£12.0 million
and
£24.0 million
, and
10%
of net earnings of Luxfer Holdings PLC in excess of
£24.0 million
.
The Group's other arrangements are less significant than the Luxfer Group Pension Plan, the largest being the BA Holdings, Inc. Pension Plan in the U.S. In December 2005, this plan was closed to further benefit accrual with members being offered contributions to that company's 401(k) plan. At January 1, 2016, the U.S. pension plans (BA Holdings, Inc. Pension Plan and Luxfer Hourly Pension Plan) merged into one plan.
The total charge to the Group's consolidated income statement for
2017
for retirement benefits was a cost of
$6.6 million
(
2016
: cost of
$6.4 million
,
2015
: credit of
$9.3 million
).
F-
58
LUXFER HOLDINGS PLC
NOTES TO THE CONSOLIDATED FINANCIAL STATEMENTS (Continued)
All amounts in millions, except share and per share data
29. Retirement benefits (Continued)
The movement in the pension liabilities is shown below:
|
2017
|
2016
|
||||||
|
$M
|
$M
|
||||||
|
Balance at January 1
|
66.5
|
|
58.9
|
|
|||
|
(Credited) / charged to the consolidated income statement:
|
|||||||
|
Past service credit
|
—
|
|
—
|
|
|||
|
Curtailment credit
|
—
|
|
(0.6
|
)
|
|||
|
Current service cost
|
0.1
|
|
0.4
|
|
|||
|
Net interest on net liability
|
1.8
|
|
2.0
|
|
|||
|
Administrative costs
|
0.7
|
|
0.9
|
|
|||
|
Total charge for defined contribution plans
|
4.0
|
|
3.7
|
|
|||
|
Cash contributions
|
(12.9
|
)
|
(10.9
|
)
|
|||
|
(Credited) / charged to the consolidated statement of comprehensive income
|
(9.5
|
)
|
21.7
|
|
|||
|
Exchange difference
|
4.6
|
|
(9.6
|
)
|
|||
|
Balance at December 31
|
55.3
|
|
66.5
|
|
|||
The financial assumptions used in the calculations were:
|
Projected Unit Credit Valuation
|
|||||||||||||
|
U.K.
|
Non-U.K.
|
||||||||||||
|
2017
|
2016
|
2015
|
2017
|
2016
|
2015
|
||||||||
|
%
|
%
|
%
|
%
|
%
|
%
|
||||||||
|
Discount rate
|
2.40
|
2.60
|
3.70
|
3.60
|
4.20
|
4.50
|
|||||||
|
Retail Price Inflation
|
3.10
|
3.20
|
3.00
|
—
|
—
|
—
|
|||||||
|
Inflation related assumptions:
|
|||||||||||||
|
Salary inflation
|
n/a
|
n/a
|
4.00
|
—
|
—
|
—
|
|||||||
|
Consumer Price Inflation
|
2.10
|
2.20
|
2.00
|
—
|
—
|
—
|
|||||||
|
Pension increases—pre 6 April 1997
|
1.90
|
2.00
|
1.80
|
—
|
—
|
—
|
|||||||
|
—1997 - 2005
|
2.10
|
2.20
|
2.10
|
—
|
—
|
—
|
|||||||
|
—post 5 April 2005
|
1.70
|
1.80
|
1.70
|
—
|
—
|
—
|
|||||||
|
2017
|
2016
|
||||
|
Other principal actuarial assumptions:
|
Years
|
Years
|
|||
|
Life expectancy of male / female in the U.K. aged 65 at accounting date
|
21.6 / 24.6
|
21.5 / 24.5
|
|||
|
Life expectancy of male / female in the U.K. aged 65 at 20 years after accounting date
|
23.3 / 26.5
|
23.2 / 26.4
|
|||
Investment strategies
For the principal defined benefit plan in the Group and the U.K., the Luxfer Group Pension Plan, the assets are invested in a diversified range of asset classes and include matching assets (comprising fixed interest and index linked bonds and swaps) and growth assets (comprising all other assets). The Trustees have formulated a de-risking strategy to help control the short term risks of volatility associated with holding growth assets. The Trustees also monitor the cost of a buy-in to secure pensioner liabilities with an insurance company to ensure they and the Company are able to act if such an opportunity arises. Other options to progressively reduce the scale of the liabilities are discussed between the Trustees and the Company.
Risk exposures
The Group is at risk of adverse experience relating to the defined benefit plans.
F-
59
LUXFER HOLDINGS PLC
NOTES TO THE CONSOLIDATED FINANCIAL STATEMENTS (Continued)
All amounts in millions, except share and per share data
29. Retirement benefits (Continued)
The plans hold a high proportion of assets in equity and other growth investments, with the intention of growing the value of assets relative to liabilities. The Group is at risk if the value of liabilities grows at a faster rate than the plans assets, or if there is a significant fall in the value of these assets not matched by a fall in the value of liabilities. If these events occurred, this would be expected to lead to an increase in the Group's future cash contributions.
Special events
In 2016 annuities were purchased settling
$10.0 million
of liabilities of the U.S. plan with an associated settlement charge of
$0.1 million
. Lump sums were also paid of
$4.2 million
with an associated settlement credit of
$0.7 million
. The gross amounts settled were
$14.8 million
and
$14.2 million
during this exercise.
In 2015, following a consultation with the Trustees and members, it was agreed that the Luxfer Group Pension Plan in the U.K. would close to future accrual of benefits effective from April 5, 2016 and for the purpose of increasing pensions in payment, to use CPI as the reference index in place of RPI where applicable. As a result, in 2015 the Group has recognized a curtailment credit of
$3.3 million
in respect of the closure of the Plan to future accrual and a past service credit of
$14.9 million
in respect of the change in expected future pension increases in payment.
The amounts recognized in the consolidated income statement in respect of the pension plans were as follows:
|
2017
|
2017
|
2017
|
2016
|
2016
|
2016
|
2015
|
2015
|
2015
|
||||||||||||||||||||
|
U.K.
|
Non-U.K.
|
Total
|
U.K.
|
Non-U.K.
|
Total
|
U.K.
|
Non-U.K.
|
Total
|
||||||||||||||||||||
|
$M
|
$M
|
$M
|
$M
|
$M
|
$M
|
$M
|
$M
|
$M
|
||||||||||||||||||||
|
In respect of defined benefit plans:
|
||||||||||||||||||||||||||||
|
Current service cost
|
—
|
|
0.1
|
|
0.1
|
|
0.3
|
|
0.1
|
|
0.4
|
|
1.4
|
|
0.1
|
|
1.5
|
|
||||||||||
|
Net interest on net liability
|
1.4
|
|
0.4
|
|
1.8
|
|
1.5
|
|
0.5
|
|
2.0
|
|
2.5
|
|
0.5
|
|
3.0
|
|
||||||||||
|
Administrative expenses
|
0.2
|
|
0.5
|
|
0.7
|
|
0.4
|
|
0.5
|
|
0.9
|
|
1.0
|
|
0.3
|
|
1.3
|
|
||||||||||
|
Past service credit
|
—
|
|
—
|
|
—
|
|
—
|
|
—
|
|
—
|
|
(14.9
|
)
|
—
|
|
(14.9
|
)
|
||||||||||
|
Curtailment credit
|
—
|
|
—
|
|
—
|
|
—
|
|
(0.6
|
)
|
(0.6
|
)
|
(3.3
|
)
|
—
|
|
(3.3
|
)
|
||||||||||
|
Total charge / (credit) for defined benefit plans
|
1.6
|
|
1.0
|
|
2.6
|
|
2.2
|
|
0.5
|
|
2.7
|
|
(13.3
|
)
|
0.9
|
|
(12.4
|
)
|
||||||||||
|
In respect of defined contribution plans:
|
||||||||||||||||||||||||||||
|
Total charge for defined contribution plans
|
1.9
|
|
2.1
|
|
4.0
|
|
1.6
|
|
2.1
|
|
3.7
|
|
1.3
|
|
1.8
|
|
3.1
|
|
||||||||||
|
Total charge / (credit) for pension plans
|
3.5
|
|
3.1
|
|
6.6
|
|
3.8
|
|
2.6
|
|
6.4
|
|
(12.0
|
)
|
2.7
|
|
(9.3
|
)
|
||||||||||
Of the total charge for the year (
2016
: charge for the year and
2015
: credit for the year), charges of
$4.1 million
and
$0.7 million
(
2016
:
$4.1 million
and
$0.9 million
and
2015
:
$4.6 million
and
$1.3 million
); have been included in cost of sales and administrative costs, respectively; a charge of
nil
(
2016
: credit of
$0.6 million
and
2015
: credit of
$18.0 million
) has been recognized as changes to defined benefit pension plans in the consolidated income statement and a charge of
$1.8 million
(
2016
:
$2.0 million
and
2015
:
$3.0 million
) has been included in finance costs.
For the year, the amount of gain recognized in the Consolidated Statement of Comprehensive Income is
$9.5 million
(
2016
: loss of
$21.7 million
and
2015
: gain of
$4.4 million
).
The actual return of the plans assets was a gain of
$33.2 million
(
2016
: gain of
$56.4 million
and
2015
: loss of
$0.6 million
).
F-
60
LUXFER HOLDINGS PLC
NOTES TO THE CONSOLIDATED FINANCIAL STATEMENTS (Continued)
All amounts in millions, except share and per share data
29. Retirement benefits (Continued)
The value of the plans assets were:
|
2017
|
2017
|
2017
|
2016
|
2016
|
2016
|
||||||||||||||
|
U.K.
|
Non-U.K.
|
Total
|
U.K.
|
Non-U.K.
|
Total
|
||||||||||||||
|
$M
|
$M
|
$M
|
$M
|
$M
|
$M
|
||||||||||||||
|
Assets in active markets:
|
|||||||||||||||||||
|
Equities and growth funds
|
203.4
|
|
22.9
|
|
226.3
|
|
171.6
|
|
20.6
|
|
192.2
|
|
|||||||
|
Government bonds
|
49.9
|
|
—
|
|
49.9
|
|
44.3
|
|
—
|
|
44.3
|
|
|||||||
|
Corporate bonds
|
72.7
|
|
18.3
|
|
91.0
|
|
64.5
|
|
16.0
|
|
80.5
|
|
|||||||
|
Cash
|
0.3
|
|
—
|
|
0.3
|
|
(0.1
|
)
|
—
|
|
(0.1
|
)
|
|||||||
|
Total market value of assets
|
326.3
|
|
41.2
|
|
367.5
|
|
280.3
|
|
36.6
|
|
316.9
|
|
|||||||
|
Present value of plan liabilities
|
(369.7
|
)
|
(53.1
|
)
|
(422.8
|
)
|
(334.8
|
)
|
(48.6
|
)
|
(383.4
|
)
|
|||||||
|
Deficit in the plans
|
(43.4
|
)
|
(11.9
|
)
|
(55.3
|
)
|
(54.5
|
)
|
(12.0
|
)
|
(66.5
|
)
|
|||||||
|
Related deferred income tax assets
|
7.8
|
|
3.1
|
|
10.9
|
|
10.2
|
|
4.4
|
|
14.6
|
|
|||||||
|
Net pension liabilities
|
(35.6
|
)
|
(8.8
|
)
|
(44.4
|
)
|
(44.3
|
)
|
(7.6
|
)
|
(51.9
|
)
|
|||||||
The plans do not invest directly in property occupied by the Group or in financial securities issued by the Group.
Analysis of movement in the present value of the defined benefit obligations:
|
2017
|
2017
|
2017
|
2016
|
2016
|
2016
|
||||||||||||||
|
U.K.
|
Non-U.K.
|
Total
|
U.K.
|
Non-U.K.
|
Total
|
||||||||||||||
|
$M
|
$M
|
$M
|
$M
|
$M
|
$M
|
||||||||||||||
|
At January 1
|
334.8
|
|
48.6
|
|
383.4
|
|
334.4
|
|
61.0
|
|
395.4
|
|
|||||||
|
Service cost
|
—
|
|
0.1
|
|
0.1
|
|
0.3
|
|
0.1
|
|
0.4
|
|
|||||||
|
Interest on obligation
|
8.9
|
|
1.9
|
|
10.8
|
|
10.9
|
|
2.6
|
|
13.5
|
|
|||||||
|
Contributions from plan members
|
—
|
|
—
|
|
—
|
|
0.1
|
|
—
|
|
0.1
|
|
|||||||
|
Actuarial gains on financial assumptions
|
6.9
|
|
3.8
|
|
10.7
|
|
67.5
|
|
2.6
|
|
70.1
|
|
|||||||
|
Actuarial gains on plan experience
|
3.5
|
|
0.5
|
|
4.0
|
|
(3.3
|
)
|
(0.2
|
)
|
(3.5
|
)
|
|||||||
|
Exchange difference
|
31.7
|
|
0.3
|
|
32.0
|
|
(59.3
|
)
|
(0.1
|
)
|
(59.4
|
)
|
|||||||
|
Benefits paid
|
(16.1
|
)
|
(2.1
|
)
|
(18.2
|
)
|
(15.8
|
)
|
(2.6
|
)
|
(18.4
|
)
|
|||||||
|
Curtailment credit
|
—
|
|
—
|
|
—
|
|
—
|
|
(14.8
|
)
|
(14.8
|
)
|
|||||||
|
At December 31
|
369.7
|
|
53.1
|
|
422.8
|
|
334.8
|
|
48.6
|
|
383.4
|
|
|||||||
The defined benefit obligation comprises
$2.1 million
(
2016
:
$2.6 million
) arising from unfunded plans and
$420.7 million
(
2016
:
$380.8 million
) from plans that are funded.
The sensitivities regarding the principal assumptions used to measure the present value of the defined benefit obligations are set out below:
|
Assumption
|
Change in assumption
|
Impact on total defined
benefit obligations
|
||||
|
Discount rate
|
Increase/decrease by 1.0%
|
Decrease/increase by 18%
|
||||
|
CPI inflation (and related increases)
|
Increase/decrease by 1.0%
|
Increase/decrease by 10%
|
||||
|
Post retirement mortality
|
Increase by 1 year
|
Increase by 4%
|
||||
The sensitivities have been calculated to show the movement in the total defined benefit obligation in isolation, assuming no other changes in market conditions at the accounting date. In practice, for example, a change in discount rate is likely to be associated with a movement in the value of the invested assets held by the plans.
F-
61
LUXFER HOLDINGS PLC
NOTES TO THE CONSOLIDATED FINANCIAL STATEMENTS (Continued)
All amounts in millions, except share and per share data
29. Retirement benefits (Continued)
Analysis of movement in the present value of the fair value of plan assets:
|
2017
|
2017
|
2017
|
2016
|
2016
|
2016
|
||||||||||||||
|
U.K.
|
Non-U.K.
|
Total
|
U.K.
|
Non-U.K.
|
Total
|
||||||||||||||
|
$M
|
$M
|
$M
|
$M
|
$M
|
$M
|
||||||||||||||
|
At January 1
|
280.3
|
|
36.6
|
|
316.9
|
|
287.1
|
|
49.4
|
|
336.5
|
|
|||||||
|
Interest on plan assets
|
7.5
|
|
1.5
|
|
9.0
|
|
9.4
|
|
2.1
|
|
11.5
|
|
|||||||
|
Actuarial gains
|
20.4
|
|
3.8
|
|
24.2
|
|
43.7
|
|
1.2
|
|
44.9
|
|
|||||||
|
Exchange difference
|
27.4
|
|
—
|
|
27.4
|
|
(49.8
|
)
|
—
|
|
(49.8
|
)
|
|||||||
|
Contributions from employer
|
7.0
|
|
1.9
|
|
8.9
|
|
6.0
|
|
1.2
|
|
7.2
|
|
|||||||
|
Contributions from plan members
|
—
|
|
—
|
|
—
|
|
0.1
|
|
—
|
|
0.1
|
|
|||||||
|
Administrative expenses
|
(0.2
|
)
|
(0.5
|
)
|
(0.7
|
)
|
(0.4
|
)
|
(0.5
|
)
|
(0.9
|
)
|
|||||||
|
Benefits paid
|
(16.1
|
)
|
(2.1
|
)
|
(18.2
|
)
|
(15.8
|
)
|
(2.6
|
)
|
(18.4
|
)
|
|||||||
|
Settlement credit
|
—
|
|
—
|
|
—
|
|
—
|
|
(14.2
|
)
|
(14.2
|
)
|
|||||||
|
At December 31
|
326.3
|
|
41.2
|
|
367.5
|
|
280.3
|
|
36.6
|
|
316.9
|
|
|||||||
The estimated amount of employer contributions expected to be paid to the defined benefit pension plans for the year ending
December 31, 2018
is
$8.7 million
(
2017
:
$8.9 million
actual employer contributions).
30. The Luxfer Group Employee Share Ownership Plan
The trust
In 1997, the Group established an employee benefit trust ("the ESOP") with independent Trustees, to purchase and hold shares in the Group in trust to be used to satisfy options granted to eligible senior employees under the Group's share plans established from time to time.
The ESOP was established with the benefit of a gift equivalent to the set up and running costs. Purchase monies and costs required by the ESOP Trustees to purchase shares for and under the provisions of the trust are provided by way of an interest free loan from a Group subsidiary. The loan is repayable, in normal circumstances, out of monies received from senior employees when they exercise options granted to them over shares. Surplus shares are held by the ESOP Trustees to satisfy future option awards. The ESOP Trustees have waived their right to receive dividends on shares held in trust. The Remuneration Committee is charged with determining which senior employees are to be granted options and in what number subject to the relevant plan rules.
The current plan
The current share option plan, implemented by the Group in February 2007 is The Luxfer Holdings Executive Share Option Plan ("the Plan"), which consists of two parts. Part A of the Plan is approved by HM Revenue & Customs and Part B is unapproved. Options can be exercised at any time up to the tenth anniversary of their grant subject to the rules of the relevant part of the Plan. As a result of the I.P.O. all leaver restrictions over the shares were released. There are no other performance criteria attached to the options.
Movements in the year
The movement in the number of shares held by the Trustees of the ESOP and the number of share options held over those shares are shown below:
F-
62
LUXFER HOLDINGS PLC
NOTES TO THE CONSOLIDATED FINANCIAL STATEMENTS (Continued)
All amounts in millions, except share and per share data
30. The Luxfer Group Employee Share Ownership Plan (Continued)
|
Number of shares held by ESOP Trustees
|
|||||||
|
£0.0001 deferred shares
|
£0.50 ordinary shares
|
||||||
|
At January 1, 2017
|
15,977,968,688
|
|
55,816
|
|
|||
|
Shares utilized during the year
|
—
|
|
(34,594
|
)
|
|||
|
Shares transferred into ESOP during the year
|
—
|
|
83,487
|
|
|||
|
At December 31, 2017
|
15,977,968,688
|
|
104,709
|
|
|||
At
December 31, 2017
, the loan outstanding from the ESOP was
$2.6 million
(
2016
:
$2.6 million
).
The market value of each
£0.50
ordinary share held by the ESOP at
December 31, 2017
was
$15.80
(
2016
:
$10.89
).
31. Share based compensation
Luxfer Holdings PLC Long-Term Umbrella Incentive Plan and Luxfer Holdings PLC Non-Executive Directors Equity Incentive Plan
As an important retention tool and to align the long-term financial interests of our management with those of our shareholders, the Group adopted the Luxfer Holdings PLC Long-Term Umbrella Incentive Plan (the "LTiP") for the Group's senior employees, and the Luxfer Holdings PLC Non-Executive Directors Equity Incentive Plan (the "Director EIP") for the Non-Executive Directors.
The equity or equity-related awards under the LTiP and the Director EIP are based on the ordinary shares of the Group. The Remuneration Committee administers the LTiP and have the power to determine to whom the awards will be granted, the amount, type and other terms. Awards under the Director EIP are non-discretionary and purely time-based.
Share option and restricted stock awards
As a tool to retain key people and align their interests with those of shareholders, a one-off award of market-value options was made to a small number of executives and the non-executive directors immediately prior to the I.P.O. in 2012.
40%
of the options granted vested immediately and
20%
of the options vested upon each of the first, second and third anniversaries of the I.P.O.
In January 2013,
306,200
Restricted Stock Units and Options over ordinary shares, were granted under the LTiP and
9,252
ADS Restricted Stock was granted under the Director EIP. In March 2013,
1,924
ADS Restricted Stock was granted under the Director EIP. These awards were a mixture of time-based, market-based and performance-based awards.
In March 2014,
201,870
Restricted Stock Units and Options over ordinary shares were granted under the LTiP, which were all performance-based awards. Following the Annual General Meeting on May 29, 2014,
12,517
Restricted Stock Units and Options over ordinary shares were granted under the Director EIP, which were all time-based awards.
In June 2015,
46,800
Restricted Stock Units and Options over ordinary shares were granted under the LTiP, which were all time-based awards. Following the Annual General Meeting on May 28, 2015,
15,943
Restricted Stock Units and Options over ordinary shares were granted under the Director EIP, which were all time-based awards.
In March 2016,
95,140
Restricted Stock Units and Options over ordinary shares were granted under the LTiP, which were all time-based awards. Following the Annual General Meeting on May 24, 2016,
12,520
Restricted Stock Units and Options over ordinary shares were granted under the Director EIP, which were all time-based awards.
In March 2017,
139,800
Restricted Stock Units and Options over ordinary shares were granted under the LTiP, which were all time-based awards. Following the Annual General Meeting on May 23, 2017,
21,814
Restricted Stock Units and Options over ordinary shares were granted under the Director EIP, which were all time-based awards.
F-
63
LUXFER HOLDINGS PLC
NOTES TO THE CONSOLIDATED FINANCIAL STATEMENTS (Continued)
All amounts in millions, except share and per share data
31. Share based compensation (Continued)
|
2017
|
2016
|
2015
|
||||||||
|
$M
|
$M
|
$M
|
||||||||
|
I.P.O. related share based compensation charges
|
—
|
|
—
|
|
0.1
|
|
||||
|
Other share based compensation charges
|
2.2
|
|
1.4
|
|
1.3
|
|
||||
|
Restructuring share based compensation charges
|
0.9
|
|
—
|
|
—
|
|
||||
|
3.1
|
|
1.4
|
|
1.4
|
|
|||||
There were
no
cancellations or modifications to the awards in
2017
,
2016
or
2015
.
The following table illustrates the number of, and movements in, share options during the year, with each option relating to 1 ordinary share:
|
2017
|
2017
|
2016
|
2016
|
||||||||
|
Number
|
Weighted average exercise price
|
Number
|
Weighted average exercise price
|
||||||||
|
At January 1
|
963,789
|
|
$8.51
|
1,144,534
|
|
$7.26
|
|||||
|
Granted during the year
|
386,614
|
|
$0.65
|
107,660
|
|
$0.67
|
|||||
|
Exercised during the year
|
(172,501
|
)
|
$(5.03)
|
(132,599
|
)
|
$(0.67)
|
|||||
|
Accrued dividend awards
|
12,258
|
|
$0.65
|
12,572
|
|
$0.67
|
|||||
|
Lapsed during the year
|
(7,845
|
)
|
$(0.65)
|
(168,378
|
)
|
$(0.67)
|
|||||
|
At December 31
|
1,182,315
|
|
$6.42
|
963,789
|
|
$8.51
|
|||||
Within the share options which were outstanding at the year-end of
1,182,315
(2016:
963,789
),
740,253
(2016:
819,856
), were able to be exercised. The weighted average remaining contractual life for the share options outstanding at
December 31, 2017
was
2.4
years (
2016
:
2.9
years). The weighted average fair value of options granted during the year was
$9.82
(
2016
:
$9.39
).
The following table illustrates the assumptions used in deriving the fair value of share options during the year:
|
2017
|
2016
|
||||
|
Dividend yield (%)
|
4.00
|
4.00
|
|||
|
Expected volatility range (%)
|
26.81 - 35.81
|
29.73 – 38.73
|
|||
|
Risk-free interest rate (%)
|
1.00 - 2.01
|
0.36 – 1.05
|
|||
|
Expected life of share options range (years)
|
0.50 - 7.36
|
1 - 3.5
|
|||
|
Weighted average exercise price ($)
|
$0.65
|
$0.67
|
|||
|
Model used
|
Black-Scholes
|
Black-Scholes
|
|||
The expected life of the share options is based on historical data and current expectations and is not necessarily indicative of exercise patterns that may occur. The expected volatility reflects the assumption that the historical volatility over a period similar to the life of the options is indicative of future trends, which may not necessarily be the actual outcome.
Employee share incentive plans
The Group operates an all-employee share incentive plan in its U.K. and U.S. operations and will look to implement plans in other geographic regions.
32. Related party transactions
Joint venture in which the Group is a venturer
During
2017
, the Group maintained its
51%
investment in the equity of the joint venture, Luxfer Uttam India Private Limited. During
2017
, the Gas Cylinders division made
$1.9 million
(
2016
:
$1.7 million
) of sales to the joint venture. At
December 31, 2017
, the gross amounts receivable from the joint venture amounted to
$2.3
F-
64
LUXFER HOLDINGS PLC
NOTES TO THE CONSOLIDATED FINANCIAL STATEMENTS (Continued)
All amounts in millions, except share and per share data
32. Related party transactions (Continued)
million
(
2016
:
$0.9 million
) and the net amounts receivable amounted to
$0.9 million
(2016: $
0.9 million
). All sales to the joint venture are made on similar terms to arms length transactions.
During
2017
, the Group also maintained its
50%
investment in the equity of the joint venture, Nikkei-MEL Company Limited. During
2017
, the Elektron division made
$1.2 million
of sales to the joint venture (2016: $
0.8 million
).
During
2017
, the Group provided
$0.9 million
in debt investment (
2016
: received
$1.0 million
in repayment) to the joint venture Luxfer Holdings NA, LLC, of which it holds
49%
of the equity. The debt investment is provided through a secured revolving credit facility that the Group has granted to the joint venture of which up to
$10.0 million
can be drawn down until March 31, 2018 at an interest rate of
8%
per annum. During
2017
, the Gas Cylinders division made
$5.0 million
(
2016
:
$3.9 million
) of sales to the joint venture. At
December 31, 2017
, the amounts receivable from the joint venture amounted to
$0.9 million
(
2016
:
$1.0 million
) of trade debt and
$4.7 million
(
2016
:
$3.8 million
) of debt investment. All sales to the joint venture are made on similar terms to arm's length transactions.
Associates in which the Group holds an interest
During 2015, the Group acquired
26.4%
of the share capital of Sub161 Pty Limited. In
2017
the Group has made $
nil
sales (
2016
:
$0.1 million
) to the associate. At
December 31, 2017
, the amounts receivable from the associate denominated in Australian dollars was $
nil
(
2016
:
$0.1 million
). The debtor recognized in the 2015 was converted into a secured loan note during
2016
. The secured loan note has interest accruing at
6.0%
, of which $
nil
was outstanding at the year end (net of
$0.5 million
provision).
Transactions with other related parties
At
December 31, 2017
, the directors and key management comprising the members of the Executive Leadership Team, owned
170,297
£0.50
ordinary shares (
2016
:
1,062,672
£0.50
ordinary shares) and held awards over a further
316,797
£0.50
ordinary shares (
2016
:
476,839
£0.50
ordinary shares).
During the year ended
December 31, 2017
, share options held by members of the Executive Leadership Team were exercised; information relating to these exercises is disclosed in the Remuneration Report.
Stone Canyon Industries LLC represents a related party due to its association with Adam Cohn as co-CEO, and holds 570,000 ordinary shares in Luxfer Holdings PLC as at December 31, 2017 (2016: 570,000 ADSs).
FTI consulting represents a related party due to its association with Brian Kushner as Senior Managing Director, Corporate Finance. During 2017, we engaged with FTI consulting for IT services for the value of $0.1 million (2016: nil).
Cherokee Properties Inc. represents a related party due to its association with Chris Barnes, who is the president of one of our operating segments and is the president of Cherokee Properties Inc. During 2017, we engaged with Cherokee Properties Inc. for rental costs regarding our manufacturing site in Madison, IL for the value of $1.0 million (2016: $1.0 million.
The son of the retired Chief Executive Officer was employed by the Group during 2017, having joined through the normal recruitment channels.
Other than the transactions with the joint ventures and associates disclosed above and key management personnel disclosed above, no other related party transactions have been identified.
33. Post Balance Sheet Events
Since the balance sheet date, the Company has reached an out-of-court settlement with regards to the patent infringement litigation which we had been pursuing. The settlement has been recognized as an accrual at December 31, 2017.
Furthermore, post year end we have announced plans to close our plants in Brigham City, UT and Findlay, OH. The operations from our Brigham City operation will be moved to our Canadian gas cylinders facility and the operations from Findlay will be moved to our Madison, IL facility.
F-
65
TABLE OF CONTENTS
Part IItem 1. Identity Of Directors, Senior Management and AdvisersItem 2. Offer Statistics and Expected TimetableItem 3. Key InformationItem 4. Information on The CompanyItem 4A. Unresolved Staff CommentsItem 5. Operating and Financial Review and ProspectsItem 6. Directors, Senior Management and EmployeesNote 31 To The Consolidated Financial StatementsItem 7. Major Shareholders and Related Party TransactionsItem 8. Financial InformationItem 9. The Offer and ListingItem 10. Additional InformationItem 11. Quantitative and Qualitative Disclosures About Market RiskItem 12. Description Of Securities Other Than Equity SecuritiesPart IIItem 13. Defaults, Dividend Arrearages and DelinquenciesItem 14. Material Modifications To The Rights Of Security Holders and Use Of ProceedsItem 15. Controls and ProceduresItem 16. [reserved]Item 16A. Audit Committee Financial ExpertItem 16B. Code Of EthicsItem 16C. Principal Accountant Fees and ServicesItem 16D. Exemptions From The Listing Standards For Audit CommitteesItem 16E. Purchases Of Equity Securities By The Issuer and Affiliated PurchasersItem 16F. Change in Registrant's Certifying AccountantItem 16G. Corporate GovernanceItem 16H. Mine Safety DisclosurePart IIIItem 17. Financial StatementsItem 18. Financial StatementsItem 19. Exhibits