LEXINGTON REALTY TRUST
10-Ks and 10-Qs
|
|
|
|
|
|
|
|
|
|
|
|
|
|
|
|
|
|
|
|
|
|
|
|
|
|
|
|
|
|
|
|
|
|
|
|
|
|
|
|
|
|
|
|
|
|
|
|
|
|
|
|
|
UNITED STATES
SECURITIES AND EXCHANGE COMMISSION
Washington, D.C. 20549
FORM 10-K
(Mark One)
|
þ
|
ANNUAL REPORT PURSUANT TO SECTION 13 OR 15(d) OF THE SECURITIES EXCHANGE ACT OF 1934
|
For the fiscal year ended December 31, 2010
or
|
o
|
TRANSITION REPORT PURSUANT TO SECTION 13 OR 15(d) OF THE SECURITIES EXCHANGE ACT OF 1934
|
For the transition period from to
Commission File Number 1-12386
LEXINGTON REALTY TRUST
(Exact name of Registrant as specified in its charter)
|
Maryland
|
13-3717318
|
|
|
(State or other jurisdiction of
incorporation or organization)
One Penn Plaza, Suite 4015
|
(I.R.S. Employer
Identification No.)
|
|
|
New York, NY
|
10119-4015
|
|
|
(Address of principal executive offices)
|
(Zip Code)
|
Registrant’s telephone number, including area code (212) 692-7200
Securities registered pursuant to Section 12(b) of the Act:
|
Title of Each Class
|
Name of Each Exchange on which Registered
|
|
|
Shares of beneficial interests, par value $0.0001, classified as Common Stock
|
New York Stock Exchange
|
|
|
8.05% Series B Cumulative Redeemable Preferred Stock,
par value $0.0001
|
New York Stock Exchange
|
|
|
6.50% Series C Cumulative Convertible Preferred Stock,
par value $0.0001
|
New York Stock Exchange
|
|
|
7.55% Series D Cumulative Redeemable Preferred Stock,
par value $0.0001
|
New York Stock Exchange
|
Securities registered pursuant to Section 12(g) of the Act: None
Indicate by check mark if the registrant is a well-known seasoned issuer, as defined in Rule 405 of the Securities Act. Yes
þ
No
o
.
Indicate by check mark if the registrant is not required to file reports pursuant to Section 13 or Section 15(d) of the Act. Yes
o
No
þ
.
Indicate by check mark whether the Registrant: (1) has filed all reports required to be filed by Section 13 or 15(d) of the Securities Exchange Act of 1934 during the preceding 12 months (or for such shorter period that the Registrant was required to file such reports), and (2) has been subject to such filing requirements for the past 90 days. Yes
þ
No
o
.
Indicate by check mark whether the registrant has submitted electronically and posted on its corporate website, if any, every Interactive Data File required to be submitted and posted pursuant to Rule 405 of Regulation S-T (§232.405 of this chapter) during the preceding 12 months (or for such shorter period that the registrant was required to submit and post such files). Yes
o
No
o
.
Indicate by check mark if disclosure of delinquent filers pursuant to Item 405 of Regulation S-K (§ 229.405 of this chapter) is not contained herein, and will not be contained, to the best of Registrant’s knowledge, in definitive proxy or information statements incorporated by reference in Part III of this Form 10-K or any amendment to this Form 10-K.
o
Indicate by check mark whether the registrant is a large accelerated filer, an accelerated filer, a non-accelerated filer or a smaller reporting company. See definition of “large accelerated filer”, “accelerated filer” and “smaller reporting company” in Rule 12b-2 of the Exchange Act. (Check one):
Large accelerated filer
þ
Accelerated filer
o
Non-accelerated filer
o
(Do not check if a smaller reporting company) Smaller reporting company
o
Indicate by check mark whether the registrant is a shell company (as defined in Rule 12b-2 of the Act). Yes
o
No
þ
.
The aggregate market value of the voting shares held by non-affiliates of the Registrant as of June 30, 2010, which was the last business day of the Registrant’s most recently completed second fiscal quarter was $789,274,513 based on the closing price of common shares as of that date, which was $6.01 per share.
Number of common shares outstanding as of February 24, 2011 was 146,871,917.
Certain information contained in the Definitive Proxy Statement for Registrant’s Annual Meeting of Shareholders, to be held on May 17, 2011, is incorporated by reference in this Annual Report on Form 10-K in response to Part III, Item 10, 11, 12, 13 and 14.
TABLE
OF CONTENTS
|
Item of
Form 10-K
|
Description
|
Page
|
||
|
PART I
|
||||
|
1.
|
1
|
|||
|
1A.
|
9
|
|||
|
1B.
|
17
|
|||
|
2.
|
17
|
|||
|
3.
|
31
|
|||
|
PART II
|
||||
|
5.
|
33
|
|||
|
6.
|
36
|
|||
|
7.
|
37
|
|||
|
7A.
|
49
|
|||
|
8.
|
52
|
|||
|
9.
|
96
|
|||
|
9A.
|
96
|
|||
|
9B.
|
96
|
|||
|
PART III
|
||||
|
10.
|
96
|
|||
|
11.
|
96
|
|||
|
12.
|
96
|
|||
|
13.
|
97
|
|||
|
14.
|
97
|
|||
|
PART IV
|
||||
|
15.
|
97
|
i
Introduction
When we use the terms “Lexington,” the “Company,” “we,” “us” and “our,” we mean Lexington Realty Trust and all entities owned by us, including non-consolidated entities, except where it is clear that the term means only the parent company. All interests in properties are held through special purpose entities, which we refer to as property owner subsidiaries or lender subsidiaries, which are separate and distinct legal entities, but in some instances consolidated for financial statement purposes and/or disregarded for income tax purposes.
References herein to our Annual Report are to our Annual Report on Form 10-K for the fiscal year ended December 31, 2010. When we use the term “REIT” we mean real estate investment trust. All references to 2010, 2009 and 2008 refer to our fiscal years ended, or the dates, as the context requires, December 31, 2010, December 31, 2009 and December 31, 2008, respectively.
Newkirk Realty Trust, Inc., or Newkirk, was merged with and into us on December 31, 2006, which we refer to as the Newkirk Merger. Unless otherwise noted, the information in this Annual Report regarding items in our Consolidated Statements of Operations for the year ended December 31, 2006 does not include the business and operations of Newkirk.
Lexington Strategic Asset Corp., a former taxable REIT subsidiary, which we refer to as LSAC, was merged with and into us as of June 30, 2007. Lexington Contributions Inc., a former taxable REIT subsidiary, which we refer to as LCI, was merged with and into us as of March 25, 2008.
Management of our interests in properties is generally conducted through Lexington Realty Advisors, Inc., a taxable REIT subsidiary, which we refer to as LRA, or through a property management joint venture subsidiary.
Cautionary Statements Concerning Forward-Looking Statements
This Annual Report, together with other statements and information publicly disseminated by us contain certain forward-looking statements within the meaning of Section 27A of the Securities Act of 1933, as amended, and Section 21E of the Securities Exchange Act of 1934, as amended. We intend such forward-looking statements to be covered by the safe harbor provisions for forward-looking statements contained in the Private Securities Litigation Reform Act of 1995 and include this statement for purposes of complying with these safe harbor provisions. Forward-looking statements, which are based on certain assumptions and describe our future plans, strategies and expectations, are generally identifiable by use of the words “believes,” “expects,” “intends,” “anticipates,” “estimates,” “projects” or similar expressions. Readers should not rely on forward-looking statements since they involve known and unknown risks, uncertainties and other factors which are, in some cases, beyond our control and which could materially affect actual results, performances or achievements. In particular, among the factors that could cause actual results to differ materially from current expectations include, among others, those risks discussed below and under “Risk Factors” in Part I, Item 1A of this Annual Report and “Management’s Discussion and Analysis of Financial Condition and Results of Operations” in Part II, Item 7 of this Annual Report. We undertake no obligation to publicly release the results of any revisions to these forward-looking statements which may be made to reflect events or circumstances after the date hereof or to reflect occurrence of unanticipated events. Accordingly, there is no assurance that our expectations will be realized.
General
We are a self-managed and self-administered REIT formed under the laws of the State of Maryland. Our primary business is the acquisition, ownership and management of portfolios of net-leased office, industrial and retail properties. A majority of these properties are subject to triple net or similar leases, where the tenant bears all or substantially all of the costs and/or cost increases for real estate taxes, utilities, insurance and ordinary repairs. In addition, we acquire, originate and hold investments in loan assets and debt securities related to real estate. We conduct all of our property operations through property owner subsidiaries.
As of December 31, 2010, we had ownership interests in approximately 195 consolidated real estate properties, located in 39 states and containing an aggregate of approximately 36.9 million square feet of space, approximately 93% of which was subject to a lease. In 2010, 2009 and 2008, no tenant/guarantor represented greater than 10% of our annual base rental revenue.
1
In addition to our shares of beneficial interests, par value $0.0001 per share, classified as common stock, which we refer to as common shares, we have three outstanding classes of beneficial interests classified as preferred stock, which we refer to as preferred shares: (1) 8.05% Series B Cumulative Redeemable Preferred Stock, which we refer to as our Series B Preferred Shares, (2) 6.50% Series C Cumulative Convertible Preferred Stock, which we refer to as our Series C Preferred Shares and (3) 7.55% Series D Cumulative Redeemable Preferred Stock, which we refer to as our Series D Preferred Shares. Our common shares, Series B Preferred Shares, Series C Preferred Shares and Series D Preferred Shares are traded on the New York Stock Exchange, or NYSE, under the symbols “LXP”, “LXP pb”, “LXP pc” and “LXP pd”, respectively.
We elected to be taxed as a REIT under Sections 856 through 860 of the Internal Revenue Code of 1986, as amended, which we refer to as the Code, commencing with our taxable year ended December 31, 1993. We intend to continue to qualify as a REIT. If we qualify for taxation as a REIT, we generally will not be subject to federal corporate income taxes on our net taxable income that is currently distributed to our common shareholders.
History
Our predecessor was organized in Delaware in October 1993 upon the combination of two investment programs, Lepercq Corporate Income Fund L.P. and Lepercq Corporate Income Fund II L.P., which were formed to acquire net-lease real estate assets providing current income. Our predecessor was merged into Lexington Corporate Properties Trust, a Maryland statutory REIT, on December 31, 1997. On December 31, 2006, Lexington Corporate Properties Trust completed the Newkirk Merger. All of Newkirk’s operations were conducted and all of its assets were held through its master limited partnership, subsequently named The Lexington Master Limited Partnership, which we refer to as the MLP. As of December 31, 2008, the MLP was merged with and into us.
We are structured as an umbrella partnership REIT, or UPREIT, and a portion of our business is conducted through our two operating partnership subsidiaries: (1) Lepercq Corporate Income Fund L.P. and (2) Lepercq Corporate Income Fund II L.P. On December 31, 2010, a third operating partnership subsidiary, Net 3 Acquisition L.P., was merged with and into us. We refer to these subsidiaries as our operating partnerships and to limited partner interests in these operating partnerships as OP units. We are party to a funding agreement with our operating partnerships under which we may be required to fund distributions made on account of OP units. The UPREIT structure enables us to acquire properties through our operating partnerships by issuing OP units to a property owner, as a form of consideration in exchange for the property. The OP units are generally redeemable, after certain dates, for our common shares on a one OP unit for approximately 1.13 common shares basis, or, at our election in certain instances, cash. We believe that this structure facilitates our ability to raise capital and to acquire portfolio and individual properties by enabling us to structure transactions which may defer tax gains for a contributor of property. As of December 31, 2010, there were approximately 4.4 million OP units outstanding, other than OP units held directly or indirectly by us, that are currently redeemable for approximately 4.9 million common shares if we satisfy redemptions entirely with common shares.
Current Economic Uncertainty and Capital Market Volatility
Our business continues to be impacted in a number of ways by the continued uncertainty in the overall economy and volatility in the capital markets. We encourage you to read “Risk Factors” in Part I, Item 1A of this Annual Report for a discussion of certain risks we are facing and “Management’s Discussion and Analysis of Financial Condition and Results of Operations” in Part II, Item 7 of this Annual Report for a detailed discussion of the trends impacting our business.
Objectives and Strategy
General.
We focus on maintaining a strong balance sheet and improving our long-term growth prospects. Since 2008, we believe we have strengthened our balance sheet primarily by (i) repurchasing and retiring our debt and senior securities or by extending their maturity date, (ii) financing our properties at what we believe are favorable rates and using the proceeds to retire higher rate or shorter term debt and (iii) issuing equity and recycling capital by selling non-core properties, in order to create additional liquidity, to retire maturing debt or to acquire single-tenant office and industrial properties. We view “core” assets as general purpose, efficient, single-tenant net-leased office and industrial assets, in well-located and growing markets.
When opportunities arise, we make investments in single-tenant office and industrial assets, which we believe will generate favorable returns. We grow our portfolio primarily by: (1) buying properties through subsidiaries and leasing them back to the sellers under net leases, (2) acquiring properties through subsidiaries already subject to net leases, (3) making mortgage and mezzanine loans through subsidiaries secured by single tenant buildings and (4) providing capital to developers who are engaged in “build-to-suit” projects for corporate users.
2
As part of our ongoing business efforts, we expect to continue to (1) recycle capital in compliance with regulatory and contractual requirements, (2) refinance or repurchase outstanding indebtedness when advisable, (3) effect strategic transactions, portfolio and individual property acquisitions and dispositions, (4) expand existing properties, (5) execute new leases with tenants, (6) extend lease maturities in advance of expiration and (7) explore new business lines and operating platforms. Additionally, we may continue to enter into joint ventures and co-investment programs with third-party investors as a means of creating additional growth and expanding the revenue realized from advisory and asset management activities as situations warrant.
Portfolio diversification is central to our investment strategy as we seek to create and maintain an asset base that provides steady, predictable and growing cash flows while being insulated against rising property operating expenses, regional recessions, industry-specific downturns and fluctuations in property values and market rent levels. Regardless of capital market and economic conditions, we stay focused on enhancing operating results, improving portfolio quality, mitigating risks relating to interest rates and the real estate cycle and implementing strategies where our management skills and real estate expertise can add value. We believe that our business strategy will continue to improve our liquidity and strengthen our overall balance sheet to create meaningful shareholder value.
Capital Recycling
. We began to dispose of our interests in non-core assets in 2007, subject to regulatory and contractual requirements. During 2010, 2009 and 2008, we used the proceeds from such dispositions primarily to retire senior debt and preferred securities. Currently, we are focused on the disposition of our interests in non-core, vacant or under-performing assets.
Acquisition Strategies.
When market conditions warrant, we seek to enhance our net-lease property portfolio through acquisitions of interests in core assets, including through the investment in loan assets and debt securities directly or indirectly secured by core assets. Prior to effecting any acquisition, our underwriting includes analyzing the (1) property’s design, construction quality, efficiency, functionality and location with respect to the immediate sub-market, city and region, (2) lease integrity with respect to term, rental rate increases, corporate guarantees and property maintenance provisions, (3) present and anticipated conditions in the local real estate market and (4) prospects for selling or re-leasing the property on favorable terms in the event of a vacancy. We also evaluate each potential tenant’s financial strength, growth prospects, competitive position within its respective industry and a property’s strategic location and function within a tenant’s operations or distribution systems. We believe that our comprehensive underwriting process is critical to the assessment of long-term profitability of any investment by us.
Strategic Transactions with Other Real Estate Investment Companies.
We seek to capitalize on the unique investment experience of our executive management team as well as their network of relationships in the industry to achieve appropriate risk-adjusted yields through strategic transactions. Accordingly, we occasionally pursue the (1) acquisition of portfolios of assets and equity interests in companies with a significant number of single-tenant assets, including through mergers and acquisitions activity and (2) participation in strategic partnerships, co-investment programs and joint ventures.
In connection with the Newkirk Merger, we acquired what is now a one-third interest in each of Concord Debt Holding LLC, which we refer to as Concord, and CDH CDO LLC, which we refer to as CDH CDO. The remaining two-thirds interests are held by WRT Realty L.P., which we refer to as Winthrop and a wholly-owned subsidiary of Inland American Real Estate Trust, Inc., which we refer to as Inland Concord. Each of Concord’s and CDH CDO’s primary business is the ownership of real estate loan and bond assets.
During 2007, we established Net Lease Strategic Assets Fund L.P., which we refer to as NLS, a co-investment program with a subsidiary of Inland American Real Estate Trust, Inc., which we refer to as Inland NLS, to invest in specialty net-leased real estate.
We believe that entering into co-investment programs and joint ventures with institutional investors and other real estate investment companies may mitigate our risk in certain assets and increase our return on equity to the extent we earn management or other fees. However, investments in co-investment programs and joint ventures limit our ability to make unilateral investment decisions relating to the assets and limit our ability to deploy capital.
Acquisitions of Portfolios and Individual Net-lease Properties.
We seek to acquire portfolios and individual properties from (1) creditworthy companies in sale/leaseback transactions for properties that are integral to the sellers’/tenants’ ongoing operations, (2) developers of newly constructed properties built-to-suit the needs of a corporate tenant by financing the project during the construction phase and/or agreeing to purchase the property upon completion of construction and occupancy by the tenant, (3) other real estate investment companies through strategic transactions and (4) sellers of properties subject to an existing lease. We believe that our geographical diversification and acquisition experience will allow us to compete effectively for the acquisition of such properties.
3
Competition
Through our predecessor entities, we have been in the net-lease real estate business for over 35 years. Over this period, we have established a broad network of contacts, including major corporate tenants, developers, brokers and lenders. In addition, our management is associated with and/or participates in many industry organizations. Notwithstanding these relationships, there are numerous commercial developers, real estate companies, financial institutions and other investors with greater financial or other resources that compete with us in seeking properties for acquisition and tenants who will lease space in these properties. Our competitors include other REITs, pension funds, private companies and individuals.
Co-Investment Programs and Other Equity Method Investment Limited Partnerships
Net Lease Strategic Assets Fund L.P.
NLS’s portfolio consists of 43 specialty net-leased assets and a 40% tenant-in-common interest in a property. These specialty net-leased assets, which were either sold by us or contributed by us to NLS, include data centers, light manufacturing facilities, medical office facilities, a car dealership and a golf course.
At December 31, 2010, Inland NLS owned 85%, and we owned 15% of NLS’s common equity, and we owned 100% of NLS’s preferred equity. LRA is the asset manager for NLS pursuant to a management agreement.
Concord Debt Holdings LLC and CDH CDO LLC
. On December 31, 2006 in connection with the Newkirk Merger, we acquired a 50% interest in a co-investment program, Concord, which owns bonds and loans secured, directly and indirectly, by real estate assets. The other 50% interest in Concord was held by Winthrop. We and Winthrop each contributed our interest in Concord to Lex-Win Concord LLC, which we refer to as Lex-Win Concord. During 2008, Inland Concord was admitted to Concord as a preferred member. During the third quarter of 2010, Concord was restructured upon the effectiveness of a settlement agreement with Inland Concord. As a result of the restructuring (i) Lex-Win Concord was dissolved and (ii) Concord and a new entity, CDH CDO, are now owned equally by subsidiaries of us, Winthrop and Inland Concord. The new entity purchased Concord Real Estate CDO 2006-1 LTD, which we refer to as CDO-1, from Concord with funds contributed by Inland Concord. CDH CDO is also owned equally by subsidiaries of us, Winthrop and Inland Concord. The Company has made no additional contributions and it has not recognized any income or loss as a result of the restructuring. The Company’s investment in these ventures is valued at zero. Each of Concord’s and CDH CDO’s obligations are non-recourse to us, and we have no obligation to fund the operations of Concord or CDH CDO, unless we receive management fees and then only to the extent of such management fees.
Other Equity Method Investment Limited Partnerships.
We are a partner in five other partnerships with ownership percentages ranging between 27% and 35%, which own primarily net-leased properties. All profits, losses and cash flows are distributed in accordance with the respective partnership agreements. As of December 31, 2010, the partnerships had $25.4 million in non-recourse mortgage debt (our proportionate share was $7.6 million) with interest rates ranging from 9.4% to 11.5%, a weighted-average rate of 9.9% and maturity dates ranging from 2011 to 2016.
We have determined that NLS and Lex-Win Concord have met the conditions of significant subsidiaries under Rule 1-02 (w) of Regulation S-X. The separate financial statements of NLS and Lex-Win Concord, as required pursuant to Rule 3-09 of Regulation S-X, are filed as Exhibits 99.2 and 99.1, respectively, to this Annual Report.
Internal Growth and Effectively Managing Assets
Tenant Relations and Lease Compliance.
We endeavor to maintain close contact with the tenants in the properties in which we have an interest in order to understand their future real estate needs. We monitor the financial, property maintenance and other lease obligations of the tenants in properties in which we have an interest, through a variety of means, including periodic reviews of financial statements and physical inspections of the properties.
Extending Lease Maturities.
Our property owner subsidiaries seek to extend tenant leases in advance of the lease expiration in order for us to maintain a balanced lease rollover schedule and high occupancy levels.
Revenue Enhancing Property Expansions.
Our property owner subsidiaries undertake expansions of properties based on tenant requirements or marketing opportunities. We believe that selective property expansions can provide attractive rates of return and our property owner subsidiaries actively seek such opportunities.
Property Sales.
Subject to regulatory requirements, we sell our interests in properties when we believe that the return realized from selling a property will exceed the expected return from continuing to hold such property or if there is a better use of capital such as repurchasing our debt and senior securities.
4
Conversion to Multi-Tenant
. If one of our property subsidiaries is unable to renew a single-tenant net lease or if it is unable to find a replacement single tenant, we either attempt to sell our interest in the property or have the property owner subsidiary convert the property for multi-tenant use and begin the process of leasing space. When appropriate, we seek to sell our interests in multi-tenant properties.
Property Management.
From time to time, our property owner subsidiaries use third-party property managers to manage certain properties. In 2010, we formed a joint venture with an unaffiliated third party to manage substantially all of these properties. We believe this new joint venture will primarily provide us with better management of our assets and tenant relationships, and secondarily provide us with revenue-enhancing opportunities and cost efficiencies.
Financing Strategy
General
. Since becoming a public company, our principal sources of financing have been the public and private equity and debt markets, property specific debt, our secured revolving credit facility, term loans, issuance of OP units and undistributed cash flows.
Mortgage Debt
. Generally, our property owners seek to finance their assets with non-recourse secured debt that has amortization, term and interest rate characteristics matched to the term and characteristics of the cash flows from the underlying investments.
Corporate Level Borrowings.
We also use corporate-level borrowings, such as revolving loans and term loans, as needed, and when other forms of financing are not available or appropriate. On January 28, 2011, we refinanced our $220.0 million secured revolving credit facility, which was scheduled to expire in February 2011, but could have been extended to February 2012 at our option, with a $300.0 million secured revolving credit facility with KeyBank National Association, which we refer to as KeyBank, as agent. The new facility bears interest at 2.50% plus LIBOR if our leverage ratio, as defined, is less than 50%, 2.85% plus LIBOR if our leverage ratio is between 50% and 60% and 3.10% plus LIBOR if our leverage ratio exceeds 60%. The new facility matures in January 2014 but can be extended until January 2015 at our option. With the consent of the lenders, we can increase the size of the revolving loan by $225.0 million for a total facility size of $525.0 million by adding properties to the borrowing base or admitting additional lenders. The secured revolving credit facility is secured by ownership interest pledges and guarantees by certain of our subsidiaries that in the aggregate own interests in a borrowing base currently consisting of 79 properties. The borrowing availability of the facility is based upon the net operating income of the properties comprising the borrowing base as defined in the facility. No amounts are currently outstanding under the secured revolving credit facility.
During the first quarter of 2010, we issued $115.0 million aggregate principal amount of 6.00% Convertible Guaranteed Notes. The notes pay interest semi-annually in arrears and mature in January 2030. The holders of the notes may require us to repurchase their notes in January 2017, January 2020 and January 2025 for cash equal to 100% of the notes to be repurchased, plus any accrued and unpaid interest. We may not redeem any notes prior to January 2017, except to preserve our REIT status. The notes have a current conversion rate of 141.1383 common shares per $1,000 principal amount of the notes, representing a conversion price of $7.09 per share. The conversion rate is subject to adjustment under certain circumstances. The notes are convertible by the holders under certain circumstances for cash, common shares or a combination of cash and common shares at our election.
Deleveraging.
Our primary focus for 2010 and 2009 was to effectively use our capital to deleverage our balance sheet by refinancing, satisfying and repurchasing indebtedness. During 2010 and 2009, we reduced our overall consolidated indebtedness by $300.3 million and $305.6 million, respectively, including $25.5 million and $123.4 million, respectively, original principal amount of our 5.45% Exchangeable Guaranteed Notes.
Common Share Equity Offerings
During 2010, we raised approximately $157.8 million by issuing approximately 22.4 million common shares through two public offerings. The proceeds from these common share offerings were primarily used to retire indebtedness.
Common Share Repurchases
During 2008, we entered into a forward equity commitment to purchase 3.5 million common shares at a price of $5.60 per share. We have prepaid $15.6 million of the $19.6 million purchase price. The contract is required to be settled no later than October 2011. No shares were repurchased in 2010. As of December 31, 2010, 1.1 million common shares/OP units remained eligible for repurchase under the share repurchase authorization.
Direct Share Purchase Plan
During 2010, we issued approximately 1.3 million common shares under our direct share purchase plan raising net proceeds of $8.6 million. The net proceeds were primarily used to retire indebtedness.
5
Advisory Contracts
General
. Members of our management have been in the business of investing in single-tenant net-lease properties since 1973. This experience has enabled us to provide advisory services to various net-lease investors.
Third Party Investors.
In 2001, LRA entered into an advisory and asset management agreement to invest and manage an equity commitment of up to $50.0 million on behalf of a private third-party investment fund. Under the agreement, LRA earns acquisition fees (90 basis points of total acquisition costs), annual asset management fees (30 basis points of gross asset value) and an incentive fee (16% of the return in excess of an internal rate of return of 10% earned by the investment fund). The investment fund made no purchases in 2010, 2009 or 2008 and owned one property as of December 31, 2010.
Affiliated Investors
. Through LRA, we provide advisory services to NLS. In exchange for providing advisory services to NLS, LRA receives (1) a management fee of 0.375% of the equity capital, as defined, (2) a property management fee of up to 3.0% of actual gross revenues from certain assets for which the landlord is obligated to provide property management services (contingent upon the recoverability of such fees from the tenant under the applicable lease) and (3) an acquisition fee of 0.5% of the gross purchase price of each asset acquired by NLS.
Environmental Matters
Under various federal, state and local environmental laws, statutes, ordinances, rules and regulations, an owner of real property may be liable for the costs of removal or remediation of certain hazardous or toxic substances at, on, in or under such property as well as certain other potential costs relating to hazardous or toxic substances. These liabilities may include government fines and penalties and damages for injuries to persons and adjacent property. Such laws often impose liability without regard to whether the owner knew of, or was responsible for, the presence or disposal of such substances. Although generally the tenants of the properties in which we have an interest are primarily responsible for any environmental damage and claims related to the leased premises, in the event of the bankruptcy or inability of a tenant of such premises to satisfy any obligations with respect to such environmental liability, a property owner subsidiary may be required to satisfy such obligations. In addition, as the owner of such properties, a property owner subsidiary may be held directly liable for any such damages or claims irrespective of the provisions of any lease.
From time to time, in connection with the conduct of our business and generally upon acquisition of a property and prior to surrender by a tenant, the property owner subsidiary authorizes the preparation of a Phase I and, when necessary, a Phase II environmental report with respect to its properties. Based upon such environmental reports and our ongoing review of the properties in which we have an interest, as of the date of this Annual Report, we are not aware of any environmental condition with respect to any of the properties in which we have an interest which we believe would be reasonably likely to have a material adverse effect on our financial condition and/or results of operations. There can be no assurance, however, that (1) the discovery of environmental conditions, the existence or severity of which were previously unknown, (2) changes in law, (3) the conduct of tenants or (4) activities relating to properties in the vicinity of the properties in which we have an interest, will not expose us to material liability in the future. Changes in laws increasing the potential liability for environmental conditions existing on properties or increasing the restrictions on discharges or other conditions may result in significant unanticipated expenditures or may otherwise adversely affect the operations of the tenants of properties in which we have an interest, which would adversely affect our financial condition and/or results of operations.
Non-Cash Impairment Charges
During 2010 and 2009, we incurred $56.9 million and $175.9 million, respectively, of non-cash impairment charges primarily related to (1) sales and other dispositions of assets at below book value, (2) vacancies of certain assets and (3) during 2009, $74.7 million of non-cash impairment charges related to our investment in Lex-Win Concord and another non-consolidated investment, which are included in equity in earnings (losses) of non-consolidated entities in our Consolidated Statement of Operations. In addition, we may continue to take similar non-cash impairment charges, which could be material in amount, due to (1) the current economic environment and (2) the implementation our current business strategy, which may include sales of properties acquired in the Newkirk Merger that have a high cost basis because of our common share price at the time of the Newkirk Merger.
Summary of 2010 Transactions and Recent Developments
The following summarizes certain of our transactions during 2010.
Sales
. With respect to sales activity, we, through our property owner subsidiaries, monetized our interests in 13 properties to unaffiliated third parties for an aggregate gross price of $158.1 million.
6
Acquisitions/Investments.
Property Acquisitions.
Through property owner subsidiaries, we:
|
|
-
|
acquired a 105,000 square foot office property in Columbus, Ohio for $16.7 million. The property is subject to a 16-year net-lease;
|
|
|
-
|
purchased a parking lot in a sale/leaseback transaction with an existing tenant, Nevada Power Company, for $3.3 million. The parking lot is adjacent to an existing property in which we have an interest in Las Vegas, Nevada, leased to Nevada Power Company. In connection with this transaction, the Nevada Power Company lease on the existing property was extended from January 2014 to January 2029, the same date as the parking lot lease; and
|
|
|
-purchased land previously subject to a ground lease on the property in which we have an interest located in Beaumont, Texas for $0.5 million.
|
Built-to-Suit Transactions.
Through property owner subsidiaries, we:
|
|
-
|
executed a purchase and sale agreement to acquire, upon completion of construction and occupancy by the tenant, which is expected to occur in the second quarter of 2011, a to-be-constructed 514,000 square foot industrial facility located in Byhalia, Mississippi for $27.5 million; and
|
|
|
-
|
executed a contract to fund the construction of a 672,000 square foot industrial facility located in Shelby, North Carolina for an estimated cost of approximately $24.0 million. One of our property owner subsidiaries intends to purchase the facility upon completion of construction and commencement of a 20-year net-lease, which is expected to occur in the second quarter of 2011.
|
|
|
Loan Investments.
Through lender subsidiaries, we:
|
|
|
-
|
made a 15%, $16.7 million mortgage loan on an office building in Schaumburg, Illinois, which matures January 2012, but can be extended one additional year by the borrower for a 50 basis point fee. The property is leased to Career Education Corporation from January 1, 2011 through December 31, 2022 for an average annual rent of $4.0 million. In addition, the lender is obligated to lend an additional $1.8 million through January 2012 upon the occurrence of certain events. If the borrower exercises the one-year extension option and certain other events occur, the lender will become obligated to lend an additional $12.2 million for tenant improvement costs; and
|
|
|
-
|
made a $17.0 million mezzanine loan to entities which owned five medical facilities. The mezzanine loan is (i) guaranteed by a parent entity and principal, (ii) principally secured by either ownership pledges for second mortgage liens or mortgage liens against the medical facilities and (iii) matures in December 2011 and requires payments of interest only at a rate of 14% through February 2011 and 16% thereafter. The lender received aggregate prepayments of $7.5 million in December 2010 and February 2011 in connection with the sale of certain collateral, resulting in $9.5 million currently outstanding.
|
Other.
We formed a joint venture with an unaffiliated third party to manage certain properties in portfolios we manage and/or have an ownership interest in that require such property management services.
Leasing.
Our property owner subsidiaries entered into 67 new leases and lease extensions encompassing an aggregate 4.1 million square feet, and our property owner subsidiaries received $8.1 million from four lease terminations and/or deferred maintenance payments.
Financing.
With respect to financing activities, we:
|
|
-
|
fully satisfied our secured credit facility, which had $164.3 million outstanding on the term loan portion and $7.0 million outstanding on the revolving loan portion at December 31, 2009;
|
|
|
-
|
issued $115.0 million aggregate principal amount of 6.00% Convertible Guaranteed Notes;
|
7
|
|
-
|
repurchased $25.5 million original principal amount of our 5.45% Exchangeable Guaranteed Notes;
|
|
|
-
|
made balloon payments through our property owner subsidiaries of $166.9 million on property specific, non-recourse mortgage and contract right debt;
|
|
|
-
|
retired through our property owner subsidiaries $74.5 million in property non-recourse mortgage debt due primarily to the assumption of debt related to the sale of properties to unrelated third parties; and
|
|
|
-
|
obtained through our property owner subsidiaries $59.8 million aggregate non-recourse mortgage financing on six properties.
|
Capital.
With respect to capital activities, we:
|
|
-
|
issued approximately 22.4 million common shares in two public offerings, raising net proceeds of approximately $157.8 million; and
|
|
|
-
|
issued approximately 1.3 million common shares under our direct share purchase plan raising net proceeds of approximately $8.6 million.
|
Subsequent to December 31, 2010, we:
|
|
-
|
disposed, through our property owner subsidiaries, five properties for gross proceeds of $78.4 million to unaffiliated third parties; and
|
|
|
-
|
refinanced our existing $220.0 million secured revolving credit facility, which was scheduled to expire in February 2011 but could have been extended to February 2012, with a $300.0 million secured revolving credit facility with a maturity date of January 2014 but can be extended at our option to January 2015.
|
Other
Employees.
As of December 31, 2010, we had 53 full-time employees. Lexington Realty Trust is a master employer and employee costs are allocated to LRA and property owner subsidiaries as applicable.
Industry Segments.
We operate in primarily one industry segment, investment in net-leased real estate assets.
Web Site.
Our Internet address is www.lxp.com and the investor relations section of our web site is located at http://www.snl.com/ irweblinkx/corporateprofile.aspx?iid=103128. We make available, free of charge, on or through the investor relations section of our web site or by contacting our Investor Relations Department, Annual Reports on Form 10-K, Quarterly Reports on Form 10-Q and Current Reports on Form 8-K and amendments to those reports filed or furnished pursuant to Section 13(a) or 15(d) of the Securities Exchange Act of 1934, as well as proxy statements, as soon as reasonably practicable after we electronically file such material with, or furnish it to, the U.S. Securities and Exchange Commission, which we refer to as the SEC. Also posted on our web site, and available in print upon request of any shareholder to our Investor Relations Department, are our amended and restated declaration of trust and amended and restated by-laws, charters for our Audit Committee, Compensation Committee and Nominating and Corporate Governance Committee, our Corporate Governance Guidelines, our Code of Business Conduct and Ethics governing our trustees, officers and employees and our Complaint Procedures Regarding Accounting and Auditing Matters. Within the time period required by the SEC and the NYSE, we will post on our web site any amendment to the Code of Business Conduct and Ethics and any waiver applicable to any of our trustees or executive officers. In addition, our web site includes information concerning purchases and sales of our equity securities by our executive officers and trustees as well as disclosure relating to certain non-GAAP financial measures (as defined in the SEC’s Regulation G) that we may make public orally, telephonically, by webcast, by broadcast or by similar means from time to time. Information contained on our web site or the web site of any other person is not incorporated by reference into this Annual Report.
Our Investor Relations Department can be contacted at Lexington Realty Trust, One Penn Plaza, Suite 4015, New York, NY 10119-4015, Attn: Investor Relations, telephone: (212) 692-7200, e-mail: ir@lxp.com.
Principal Executive Offices.
Our principal executive offices are located at One Penn Plaza, Suite 4015, New York, NY 10119-4015; our telephone number is (212) 692-7200.
8
NYSE CEO Certification.
Our Chief Executive Officer made an unqualified certification to the NYSE with respect to our compliance with the NYSE corporate governance listing standards in June 2010.
Set forth below are material factors that may adversely affect our business and
operations.
We are subject to risks involved in single- tenant leases.
We focus our acquisition activities on real properties that are net leased to single tenants. Therefore, the financial failure of, or other default by, a single tenant under its lease is likely to cause a significant reduction in the operating cash flow generated by the property leased to that tenant and might decrease the value of that property. In addition, the property owner will be responsible for 100% of the operating costs following a vacancy at a single-tenant building.
We rely on revenues derived from major tenants.
Revenues from several tenants and/or their guarantors constitute a significant percentage of our base rental revenues. The default, financial distress or bankruptcy of any of the tenants and/or guarantors of these properties could cause interruptions in the receipt of lease revenues and/or result in vacancies, which would reduce the property owner subsidiary’s revenues and increase operating costs until the affected property is re-let, and could decrease the ultimate sales value of that property. Upon the expiration or other termination of the leases that are currently in place with respect to these properties, the property owner subsidiary may not be able to re-lease the vacant property at a comparable lease rate, or at all, or without incurring additional expenditures in connection with the re-leasing. See “Management’s Discussion and Analysis of Financial Conditions and Results of Operations – Overview – Leasing Trends” in Part II, Item 7 of this Annual Report for further discussion.
Our assets may be subject to impairment charges, which could materially adversely affect our business, financial condition and results of operations.
We periodically evaluate our real estate investments and other assets for impairment indicators. The judgment regarding the existence of impairment indicators is based on generally accepted accounting principles, which includes a variety of factors such as market conditions, the status of significant leases, the financial condition of major tenants and other factors that could affect the cash flow or value of an investment. During 2010 and 2009, we incurred $56.9 million and $175.9 million, respectively, of non-cash impairment charges, primarily related to (1) sales and other dispositions of assets at below book value, (2) vacancies of certain assets and (3) during 2009, $74.7 million of non-cash, impairment charges relating to our investment in Lex-Win Concord and another non-consolidated investment, which are included in equity in earnings (losses) of non-consolidated entities in our Consolidated Statement of Operations. A substantial portion of these impairments related to assets acquired in the Newkirk Merger, which occurred during a period of high real estate values. In addition, we may continue to take similar non-cash impairment charges due to the current economic environment which could affect the implementation of our current business strategy and the disposition of assets acquired in the Newkirk Merger. These impairments could have a material adverse effect on our financial condition and results of operations.
Our interests in loans receivable are subject to delinquency, foreclosure and loss.
Our interests in loans receivable are generally secured by real estate properties. These loans are subject to risks of delinquency as well as risk associated with the capital markets. The ability of a borrower to repay a loan secured by a real estate property is typically and primarily dependent upon the successful operation of such property rather than upon the existence of independent income or assets of the borrower. If a borrower were to default on a loan, it is possible that the lender subsidiary would not recover the full value of the loan and the collateral may be non-performing.
The property owner subsidiaries face uncertainties relating to lease renewals and re-letting of space.
Upon the expiration of current leases for space located in properties in which we have an interest, the property owner subsidiary may not be able to re-let all or a portion of that space, or the terms of re-letting (including the cost of concessions to tenants) may be less favorable to the property owner subsidiary than current lease terms or market rates. If the property owner subsidiaries are unable to re-let promptly all or a substantial portion of the space located in their respective properties, or if the rental rates a property owner receives upon re-letting are significantly lower than current rates, our earnings and ability to make expected distributions to our shareholders will be adversely affected due to the resulting reduction in rent receipts and increase in the property owner subsidiaries’ property operating costs. There can be no assurance that the property owner subsidiaries will be able to retain tenants in any of the properties upon the expiration of their leases.
9
We are highly leveraged, which increases risk of default on our obligations and debt service requirements.
We are highly leveraged compared to certain of our competitors. We have incurred, and may continue to incur, direct and indirect indebtedness in furtherance of our activities. Neither our amended and restated declaration of trust nor any policy statement formally adopted by our Board of Trustees limits either the total amount of indebtedness or the specified percentage of indebtedness that we may incur, and accordingly, we could become even more highly leveraged. High levels of leverage may result in an increased risk of default on our obligations and in an increase in debt service requirements, which could adversely affect our financial condition, results of operations and our ability to pay distributions.
Market interest rates could have an adverse effect on our borrowing costs, profitability and our share price.
We have exposure to market risks relating to increases in interest rates due to our variable-rate debt. An increase in interest rates may increase our costs of borrowing on existing variable-rate indebtedness, leading to a reduction in our earnings. As of December 31, 2010, we had no amounts outstanding in consolidated variable-rate indebtedness that were not subject to an interest-rate swap agreement. However, borrowings under our secured revolving credit facility are subject to variable rates. The level of our variable-rate indebtedness, along with the interest rate associated with such variable-rate indebtedness, may change in the future and materially affect our interest costs and earnings. In addition, our interest costs on our fixed-rate indebtedness can increase if we are required to refinance our fixed-rate indebtedness at maturity at higher interest rates.
Furthermore, the public valuation of our common shares is related primarily to the earnings that we derive from rental income with respect to the properties in which we have an interest and not from the underlying appraised value of the properties themselves. As a result, interest rate fluctuations and capital market conditions can affect the market value of our common shares. For instance, if interest rates rise, the market price of our common shares may decrease because potential investors seeking a higher dividend yield than they would receive from our common shares may sell our common shares in favor of higher rate interest-bearing securities.
Continued disruptions in the financial markets could affect our ability to obtain debt financing on reasonable terms and have other adverse effects on us.
Since 2008, the United States credit markets have experienced significant dislocations and liquidity disruptions which have caused the spreads on prospective debt financings to widen considerably. These circumstances have materially impacted liquidity in the debt markets, making financing terms for borrowers less attractive, and in certain cases have resulted in the unavailability of certain types of debt financing. Continued uncertainty in the credit markets may negatively impact our ability to access additional debt financing at reasonable terms, which may negatively affect our ability to make acquisitions. A prolonged downturn in the credit markets may cause us to seek alternative sources of potentially less attractive financing and may require us to adjust our business plan accordingly. In addition, these factors may make it more difficult for us to sell properties or may adversely affect the price we receive for properties that we do sell, as prospective buyers may experience increased costs of capital or difficulties in obtaining capital. These events in the credit markets have also had an adverse effect on other financial markets in the United States, which may make it more difficult or costly for us to raise capital through the issuance of our common shares or preferred shares. These disruptions in the financial markets may have other adverse effects on us or the economy in general.
We also have interest rate swap agreements directly and through our investment in CDH CDO and have a direct forward equity commitment. The counterparties of these arrangements are major financial institutions; however, we are exposed to credit risk in the event of non-performance by the counterparties. In addition, we may be required to make additional prepayments pursuant to our forward equity commitment.
We have engaged and may engage in hedging transactions that may limit gains or result in losses.
We have used derivatives to hedge certain of our liabilities. This has certain risks, including losses on a hedge position, which have in the past and may in the future reduce the return on our investments. Such losses may exceed the amount invested in such instruments. In addition, counterparties to a hedging arrangement could default on their obligations. We may have to pay certain costs, such as transaction fees or breakage costs, related to hedging transactions.
We face risks associated with refinancings.
A significant number of the properties in which we have an interest, as well as corporate-level borrowings, are subject to mortgage or other secured notes with balloon payments due at maturity.
10
As of December 31, 2010, the consolidated scheduled balloon payments, for the next five calendar years, are as follows:
|
Year
|
Non-Recourse Property-Specific
Balloon Payments
|
Corporate Recourse
Balloon Payments
|
||||||
|
2011
|
$ | 12.9 million | $ | -- | ||||
|
2012 (1)
|
$ | 191.0 million | $ | 62.2 million | ||||
|
2013
|
$ | 234.9 million | $ | 60.6 million | ||||
|
2014
|
$ | 235.9 million | $ | -- | ||||
|
2015
|
$ | 269.9 million | $ | -- | ||||
(1)
Assumes 5.45% Exchangeable Guaranteed Notes due in January 2027 are put to us in 2012.
A property owner subsidiary’s ability to make the scheduled balloon payment will depend upon (1) in the event we determine to contribute capital, our cash balances and the amount available under our secured revolving credit facility and (2) the property owner subsidiary’s ability either to refinance the related mortgage debt or to sell the related property. If the property owner subsidiary is unable to refinance or sell the related property, the property may be conveyed to the lender through foreclosure or the property owner subsidiary may declare bankruptcy. However, the failure to pay the balloon payment may strain relationships with lenders.
We face risks associated with returning properties to lenders.
A significant number of the properties in which we have an interest are subject to non-recourse mortgages, which generally provide that a lender can only look to the property in the event of a default. During 2008, a lender foreclosed on a vacant property in Auburn Hills, Michigan, in which we held an interest, because the property owner subsidiary was unable to pay the required debt service. During 2009, (1) lenders foreclosed on vacant properties located in Richmond, Virginia and Plymouth, Michigan, in which we had an interest, because the property owner subsidiaries were unable to pay the required debt service, and (2) a vacant property in Houston, Texas was lost in the bankruptcy of the property owner subsidiary because the property owner subsidiary was unable to pay the required debt service. As a result, we lost all of our interest in these properties and any future opportunities to re-tenant these properties. The loss of a significant number of properties to foreclosure or bankruptcy could adversely affect our (1) financial condition and results of operations, (2) relationships with lenders and (3) ability to obtain additional financing in the future.
Certain of our properties are cross-collateralized, and certain of our indebtedness is cross-defaulted.
As of December 31, 2010, the mortgages on two sets of two properties, one set of four properties and one set of three properties are cross-collateralized. In addition, (1) our revolving credit facility is secured by a borrowing base of interests in 73 properties as of December 31, 2010, (2) our $45.0 million original principal amount secured term loan (of which $35.6 million was outstanding at December 31, 2010) is secured by a borrowing base of interests in certain properties and (3) our $25.0 million secured term loan is secured by interests in three properties. To the extent that any of the properties in which we have an interest are cross-collateralized, any default by the property owner subsidiary under the mortgage note relating to one property will result in a default under the financing arrangements relating to any other property that also provides security for that mortgage note or is cross-collateralized with such mortgage note.
In addition, our secured credit facility, secured term loans, 5.45% Exchangeable Guaranteed Notes and 6.00% Convertible Guaranteed Notes contain cross-default provisions, which may be triggered if we default on indebtedness in excess of certain thresholds.
We face possible liability relating to environmental matters.
Under various federal, state and local environmental laws, statutes, ordinances, rules and regulations, as an owner of real property, our property owner subsidiaries may be liable for the costs of removal or remediation of certain hazardous or toxic substances at, on, in or under the properties in which we have an interest as well as certain other potential costs relating to hazardous or toxic substances. These liabilities may include government fines and penalties and damages for injuries to persons and adjacent property. These laws may impose liability without regard to whether we knew of, or were responsible for, the presence or disposal of those substances. This liability may be imposed on our property owner subsidiaries in connection with the activities of an operator of, or tenant at, the property. The cost of any required remediation, removal, fines or personal or property damages and our liability therefore could exceed the value of the property and/or our aggregate assets. In addition, the presence of those substances, or the failure to properly dispose of or remove those substances, may adversely affect a property owner subsidiary’s ability to sell or rent that property or to borrow using that property as collateral, which, in turn, would reduce our revenues and ability to make distributions.
11
A property can also be adversely affected either through physical contamination or by virtue of an adverse effect upon value attributable to the migration of hazardous or toxic substances, or other contaminants that have or may have emanated from other properties. Although the tenants of the properties in which we have an interest are primarily responsible for any environmental damages and claims related to the leased premises, in the event of the bankruptcy or inability of any of the tenants of the properties in which we have an interest to satisfy any obligations with respect to the property leased to that tenant, our property owner subsidiary may be required to satisfy such obligations. In addition, we may be held directly liable for any such damages or claims irrespective of the provisions of any lease.
From time to time, in connection with the conduct of our business, our property owner subsidiaries authorize the preparation of Phase I environmental reports and, when necessary, Phase II environmental reports, with respect to their properties. Based upon these environmental reports and our ongoing review of the properties in which we have an interest, as of the date of this Annual Report, we are not aware of any environmental condition with respect to any of the properties in which we have an interest that we believe would be reasonably likely to have a material adverse effect on us.
There can be no assurance, however, that the environmental reports will reveal all environmental conditions at the properties in which we have an interest or that the following will not expose us to material liability in the future:
·
the discovery of previously unknown environmental conditions;
·
changes in law;
·
activities of tenants; or
·
activities relating to properties in the vicinity of the properties in which we have an interest.
Changes in laws increasing the potential liability for environmental conditions existing on properties or increasing the restrictions on discharges or other conditions may result in significant unanticipated expenditures or may otherwise adversely affect the operations of the tenants of the properties in which we have an interest, which could adversely affect our financial condition or results of operations.
Uninsured losses or a loss in excess of insured limits could adversely affect our financial condition.
We carry comprehensive liability, fire, extended coverage and rent loss insurance on most of the properties in which we have an interest, with policy specifications and insured limits that we believe are customary for similar properties. However, with respect to those properties where the leases do not provide for abatement of rent under any circumstances, we generally do not maintain rent loss insurance. In addition, there are certain types of losses, such as losses resulting from wars, terrorism or certain acts of God, that generally are not insured because they are either uninsurable or not economically insurable. Should an uninsured loss or a loss in excess of insured limits occur, we could lose capital invested in a property as well as the anticipated future revenues from a property, while remaining obligated for any mortgage indebtedness or other financial obligations related to the property. Any loss of these types could adversely affect our financial condition.
Future terrorist attacks, military conflicts and unrest in the Middle East could have a material adverse effect on general economic conditions, consumer confidence and market liquidity.
The types of terrorist attacks since 2001, on-going and future military conflicts and the recent unrest in the Middle East may affect commodity prices and interest rates, among other things. An increase in interest rates may increase our costs of borrowing, leading to a reduction in our earnings. The increase in the price of oil will cause an increase in our operating costs, which may not be reimbursed by our tenants. Also, terrorist acts could also result in significant damages to, or loss of, our properties.
We and the tenants of the properties in which we have an interest may be unable to obtain adequate insurance coverage on acceptable economic terms for losses resulting from acts of terrorism. Our lenders may require that we carry terrorism insurance even if we do not believe this insurance is necessary or cost effective. We may also be prohibited under the applicable lease from passing all or a portion of the cost of such insurance through to the tenant. Should an act of terrorism result in an uninsured loss or a loss in excess of insured limits, we could lose capital invested in a property as well as the anticipated future revenues from a property, while remaining obligated for any mortgage indebtedness or other financial obligations related to the property. Any loss of these types could adversely affect our financial condition.
12
Competition may adversely affect our ability to purchase properties.
There are numerous commercial developers, real estate companies, financial institutions and other investors with greater financial resources than we have that compete with us in seeking properties for acquisition and tenants who will lease space in the properties in which we have an interest. Due to our focus on net-lease properties located throughout the United States, and because most competitors are locally and/or regionally focused, we do not always encounter the same competitors in each market. Our competitors include other REITs, financial institutions, insurance companies, pension funds, private companies and individuals. This competition may result in a higher cost for properties that we wish to purchase or impact our ability to grow.
Our failure to maintain effective internal controls could have a material adverse effect on our business, operating results and share price.
Section 404 of the Sarbanes-Oxley Act of 2002 requires annual management assessments of the effectiveness of our internal controls over financial reporting. If we fail to maintain the adequacy of our internal controls, as such standards may be modified, supplemented or amended from time to time, we may not be able to ensure that we can conclude on an ongoing basis that we have effective internal controls over financial reporting in accordance with Section 404 of the Sarbanes-Oxley Act of 2002. Moreover, effective internal controls, particularly those related to revenue recognition, are necessary for us to produce reliable financial reports and to maintain our qualification as a REIT and are important to helping prevent financial fraud. If we cannot provide reliable financial reports or prevent fraud, our business and operating results could be harmed, our REIT qualification could be jeopardized, investors could lose confidence in our reported financial information and the trading price of our shares could drop significantly.
We may have limited control over our co-investment programs and joint venture investments.
Our co-investment programs and joint venture investments may involve risks not otherwise present for investments made solely by us, including the possibility that our partner might, at any time, become bankrupt, have different interests or goals than we do, or take action contrary to our instructions, requests, policies or objectives, including our policy with respect to maintaining our qualification as a REIT. Other risks of co-investment programs and joint venture investments include impasse on decisions, such as a sale, because neither we nor our partner has full control over the co-investment programs or joint venture. Also, there is no limitation under our organizational documents as to the amount of funds that may be invested in co-investment programs and joint ventures.
Two of our co-investment programs, Concord and CDH CDO, are owned equally by us, Winthrop and Inland Concord. Material actions taken by Concord and CDH CDO require the consent of each of us, Winthrop and Inland Concord. Accordingly, Concord and CDH CDO may not take certain actions or invest in certain assets even if we believe it to be in its best interest.
Another co-investment program, NLS, is managed by an Executive Committee comprised of three persons appointed by us and two persons appointed by our partner. With few exceptions, the vote of four members of the Executive Committee is required to conduct business. Accordingly, we do not control the business decisions of this co-investment.
Certain of our trustees and officers may face conflicts of interest with respect to sales and refinancings.
E. Robert Roskind, our Chairman, beneficially owns a significant number of OP units, and as a result, may face different and more adverse tax consequences than our other shareholders will if we sell our interests in certain properties or reduce mortgage indebtedness on certain properties. Our Chairman may, therefore, have different objectives than our other shareholders regarding the appropriate pricing and timing of any sale of such properties or reduction of mortgage debt.
Accordingly, there may be instances in which we may not sell a property or pay down the debt on a property even though doing so would be advantageous to our other shareholders. In the event of an appearance of a conflict of interest, the conflicted trustee or officer must recuse himself or herself from any decision making or seek a waiver of our Code of Business Conduct and Ethics.
Our ability to change our portfolio is limited because real estate investments are illiquid.
Equity investments in real estate are relatively illiquid and, therefore, our ability to change our portfolio promptly in response to changed conditions will be limited. Our Board of Trustees may establish investment criteria or limitations as it deems appropriate, but currently does not limit the number of properties in which we may seek to invest or on the concentration of investments in any one geographic region. We could change our investment, disposition and financing policies without a vote of our shareholders.
13
There can be no assurance that we will remain qualified as a REIT for federal income tax purposes.
We believe that we have met the requirements for qualification as a REIT for federal income tax purposes beginning with our taxable year ended December 31, 1993, and we intend to continue to meet these requirements in the future. However, qualification as a REIT involves the application of highly technical and complex provisions of the Code, for which there are only limited judicial or administrative interpretations. No assurance can be given that we have qualified or will remain qualified as a REIT. The Code provisions and income tax regulations applicable to REITs are more complex than those applicable to corporations. The determination of various factual matters and circumstances not entirely within our control may affect our ability to continue to qualify as a REIT. In addition, no assurance can be given that legislation, regulations, administrative interpretations or court decisions will not significantly change the requirements for qualification as a REIT or the federal income tax consequences of such qualification. If we do not qualify as a REIT, we would not be allowed a deduction for distributions to shareholders in computing our net taxable income. In addition, our income would be subject to tax at the regular corporate rates. We also could be disqualified from treatment as a REIT for the four taxable years following the year during which qualification was lost. Cash available for distribution to our shareholders would be significantly reduced or suspended for each year in which we do not qualify as a REIT. In that event, we would not be required to continue to make distributions. Although we currently intend to continue to qualify as a REIT, it is possible that future economic, market, legal, tax or other considerations may cause us, without the consent of the shareholders, to revoke the REIT election or to otherwise take action that would result in disqualification.
We may be subject to the REIT prohibited transactions tax, which could result in significant U.S. federal income tax liability to us.
We previously announced a restructuring of our investment strategy, focusing on core assets. A REIT will incur a 100% tax on the net income from a prohibited transaction. Generally, a prohibited transaction includes a sale or disposition of property held primarily for sale to customers in the ordinary course of a trade or business. While we believe that the dispositions of our assets pursuant to the restructuring of our investment strategy should not be treated as prohibited transactions, whether a particular sale will be treated as a prohibited transaction depends on the underlying facts and circumstances. We have not sought and do not intend to seek a ruling from the Internal Revenue Service regarding any dispositions. Accordingly, there can be no assurance that our dispositions of such assets will not be subject to the prohibited transactions tax. If all or a significant portion of those dispositions were treated as prohibited transactions, we would incur a significant U.S. federal income tax liability, which could have a material adverse effect on our results of operations.
Distribution requirements imposed by law limit our flexibility.
To maintain our status as a REIT for federal income tax purposes, we are generally required to distribute to our shareholders at least 90% of our taxable income for that calendar year. Our taxable income is determined without regard to any deduction for dividends paid and by excluding net capital gains. To the extent that we satisfy the distribution requirement but distribute less than 100% of our taxable income, we will be subject to federal corporate income tax on our undistributed income. In addition, we will incur a 4% nondeductible excise tax on the amount, if any, by which our distributions in any year are less than the sum of (i) 85% of our ordinary income for that year, (ii) 95% of our capital gain net income for that year and (iii) 100% of our undistributed taxable income from prior years. We intend to continue to make distributions to our shareholders to comply with the distribution requirements of the Code and to reduce exposure to federal income and nondeductible excise taxes. Differences in timing between the receipt of income and the payment of expenses in determining our taxable income and the effect of required debt amortization payments could require us to borrow funds on a short-term basis in order to meet the distribution requirements that are necessary to achieve the tax benefits associated with qualifying as a REIT.
Certain limitations limit a third party’s ability to acquire us or effectuate a change in our control.
Limitations imposed to protect our REIT status.
In order to protect us against the loss of our REIT status, among other restrictions, our declaration of trust limits any shareholder from owning more than 9.8% in value of our outstanding equity shares, defined as common shares or preferred shares, subject to certain exceptions. The ownership limit may have the effect of precluding acquisition of control of us. Our Board of Trustees has granted limited waivers of the ownership limitation to Vornado Realty, L.P., BlackRock, Inc. and Cohen & Steers Capital Management, Inc.
Severance payments under employment agreements.
Substantial termination payments may be required to be paid under the provisions of employment agreements with certain of our executives upon a change of control. We have entered into employment agreements with four of our executive officers which provide that, upon the occurrence of a change in control of us (including a change in ownership of more than 50% of the total combined voting power of our outstanding securities, the sale of all or substantially all of our assets, dissolution, the acquisition, except from us, of 20% or more of our voting shares or a change in the majority of our Board of Trustees), those executive officers may be entitled to severance benefits based on their current annual base salaries and trailing average of recent annual cash bonuses as defined in the employment agreements. Accordingly, these payments may discourage a third party from acquiring us.
14
Our ability to issue additional shares.
Our amended and restated declaration of trust authorizes our Board of Trustees to cause us to issue shares of any class, including preferred shares, without shareholder approval. Our Board of Trustees is able to establish the preferences and rights of any such class or series of additional shares, which could have the effect of delaying or preventing someone from taking control of us, even if a change in control were in shareholders’ best interests. At December 31, 2010, in addition to common shares, we had outstanding 3,160,000 Series B Preferred Shares that we issued in June 2003, 2,095,200 Series C Preferred
Shares, that we issued in December 2004 and January 2005, and 6,200,000 Series D Preferred Shares, that we issued in February 2007. Our Series B, Series C and Series D Preferred Shares include provisions that may deter a change of control. The establishment and issuance of shares of our existing series of preferred shares or a future class or series of shares could make a change of control of us more difficult.
Maryland Business Combination Act.
The Maryland General Corporation Law, as applicable to Maryland REITs, establishes special restrictions against “business combinations” between a Maryland REIT and “interested shareholders” or their affiliates unless an exemption is applicable. An interested shareholder includes a person who beneficially owns, and an affiliate or associate of the trust who, at any time within the two-year period prior to the date in question, was the beneficial owner of 10% or more of the voting power of our then-outstanding voting shares, but a person is not an interested shareholder if the Board of Trustees approved in advance the transaction by which he otherwise would have become an interested shareholder. Among other things, Maryland law prohibits (for a period of five years) a merger and certain other transactions between a Maryland REIT and an interested shareholder, or an affiliate of an interested shareholder. The five-year period runs from the most recent date on which the interested shareholder became an interested shareholder. Thereafter, any such business combination must be recommended by the Board of Trustees and approved by two super-majority shareholder votes unless, among other conditions, the common shareholders receive a minimum price for their shares and the consideration is received in cash or in the same form as previously paid by the interested shareholder for its shares. The statute permits various exemptions from its provisions, including business combinations that are exempted by the Board of Trustees prior to the time that the interested shareholder becomes an interested shareholder. The business combination statute could have the effect of discouraging offers to acquire us and of increasing the difficulty of consummating any such offers, even if such acquisition would be in shareholders’ best interests. In connection with the Newkirk Merger, Vornado Realty Trust, which we refer to as Vornado, was granted a limited exemption from the definition of “interested shareholder.”
Maryland Control Share Acquisition Act.
Maryland law provides that “control shares” of a Maryland REIT acquired in a “control share acquisition” shall have no voting rights except to the extent approved by a vote of two-thirds of the votes entitled to be cast on the matter under the Maryland Control Share Acquisition Act. Shares owned by the acquirer, by our officers or by employees who are our trustees are excluded from shares entitled to vote on the matter. “Control Shares” means shares that, if aggregated with all other shares previously acquired by the acquirer or in respect of which the acquirer is able to exercise or direct the exercise of voting power (except solely by virtue of a revocable proxy), would entitle the acquirer to exercise voting power in electing trustees within one of the following ranges of voting power: one-tenth or more but less than one-third, one-third or more but less than a majority or a majority or
more of all voting power. Control shares do not include shares the acquiring person is then entitled to vote as a result of having previously obtained shareholder approval. A “control share acquisition” means the acquisition of control issued and outstanding shares, subject to certain exceptions. If voting rights of control shares acquired in a control share acquisition are not approved at a shareholders’ meeting or if the acquiring person does not deliver an acquiring person statement as required under the statute, then, subject to certain conditions and limitations, the issuer may redeem any or all of the control shares for fair value. If voting rights of such control shares are approved at a shareholders’ meeting and the acquirer becomes entitled to vote a majority of the shares entitled to vote, all other shareholders may exercise appraisal rights. Any control shares acquired in a control share acquisition which are not exempt under our by-laws will be subject to the Maryland Control Share Acquisition Act. Our amended and restated by-laws contain a provision exempting from the Maryland Control Share Acquisition Act any and all acquisitions by any person of our shares. We cannot assure you that this provision will not be amended or eliminated at any time in the future.
Limits on ownership of our capital shares may have the effect of delaying, deferring or preventing someone from taking control of us.
For us to qualify as a REIT for federal income tax purposes, among other requirements, not more than 50% of the value of our outstanding capital shares may be owned, directly or indirectly, by five or fewer individuals (as defined for federal income tax purposes to include certain entities) during the last half of each taxable year, and these capital shares must be beneficially owned by 100 or more persons during at least 335 days of a taxable year of 12 months or during a proportionate part of a shorter taxable year (in each case, other than the first such year for which a REIT election is made). Our amended and restated declaration of trust includes certain restrictions regarding transfers of our capital shares and ownership limits.
15
Actual or constructive ownership of our capital shares in violation of the restrictions or in excess of the share ownership limits contained in our amended and restated declaration of trust would cause the violative transfer or ownership to be void or cause the shares to be transferred to a charitable trust and then sold to a person or entity who can own the shares without violating these limits. As a result, if a violative transfer were made, the recipient of the shares would not acquire any economic or voting rights attributable to the transferred shares. Additionally, the constructive ownership rules for these limits are complex, and groups of related individuals or entities may be deemed a single owner and consequently in violation of the share ownership limits.
However, these restrictions and limits may not be adequate in all cases to prevent the transfer of our capital shares in violation of the ownership limitations. The ownership limits discussed above may have the effect of delaying, deferring or preventing someone from taking control of us, even though a change of control could involve a premium price for the common shares or otherwise be in shareholders’ best interests.
Legislative or regulatory tax changes could have an adverse effect on us.
At any time, the federal income tax laws governing REITs or the administrative interpretations of those laws may be amended. Any of those new laws or interpretations may take effect retroactively and could adversely affect us or you as a shareholder. REIT dividends generally are not eligible for the reduced rates currently applicable to certain corporate dividends (unless attributable to dividends from taxable REIT subsidiaries and otherwise eligible for such rates). As a result, investment in non-REIT corporations may be relatively more attractive than investment in REITs. This could adversely affect the market price of our shares.
Our reported financial results may be adversely affected by changes in accounting principles applicable to us and the tenants of properties in which we have an interest.
Generally accepted accounting principles in the United States, which we refer to as GAAP, are subject to interpretation by various bodies formed to promulgate and interpret appropriate accounting principles such as the Financial Accounting Standards Board, which we refer to as the FASB. A change in these principles or interpretations could have a significant effect on our reported financial results, could affect the reporting of transactions completed before the announcement of a change and could affect the business practices and decisions of the tenants of properties in which we have an interest.
Our Board of Trustees may change our investment policy without shareholders’ approval.
Subject to our fundamental investment policy to maintain our qualification as a REIT, our Board of Trustees will determine our investment and financing policies, growth strategy and our debt, capitalization, distribution, acquisition, disposition and operating policies.
Our Board of Trustees may revise or amend these strategies and policies at any time without a vote by shareholders. Accordingly, shareholders’ control over changes in our strategies and policies is limited to the election of trustees, and changes made by our Board of Trustees may not serve the interests of shareholders and could adversely affect our financial condition or results of operations, including our ability to distribute cash to shareholders or qualify as a REIT.
Our inability to carry out our growth strategy could adversely affect our financial condition and results of operations.
Our growth strategy is based on the acquisition and development of additional properties and related assets, including acquisitions of large portfolios and real estate companies and acquisitions through co-investment programs and joint ventures. In the context of our business plan, “development” generally means an expansion or renovation of an existing property or the acquisition of a newly constructed property. We may provide a developer with a commitment to acquire a property upon completion of construction of a property and commencement of rent from the tenant or with a first mortgage which is satisfied upon conveyance of a fully constructed and leased facility. Our plan to grow through the acquisition and development of new properties could be adversely affected by trends in the real estate and financing businesses. The consummation of any future acquisitions will be subject to satisfactory completion of an extensive valuation analysis and due diligence review and to the negotiation of definitive documentation. Our ability to implement our strategy may be impeded because we may have difficulty finding new properties and investments at attractive prices that meet our investment criteria, negotiating with new or existing tenants or securing acceptable financing. If we are unable to carry out our strategy, our financial condition and results of operations could be adversely affected. Acquisitions of additional properties entail the risk that investments will fail to perform in accordance with expectations, including operating and leasing expectations. Redevelopment and new project development are subject to numerous risks, including risks of construction delays, cost overruns or force majeure events that may increase project costs, new project commencement risks such as the receipt of zoning, occupancy and other required governmental approvals and permits, and the incurrence of development costs in connection with projects that are not pursued to completion.
16
Some of our acquisitions and developments may be financed using the proceeds of periodic equity or debt offerings, lines of credit or other forms of secured or unsecured financing that may result in a risk that permanent financing for newly acquired projects might not be available or would be available only on disadvantageous terms. If permanent debt or equity financing is not available on acceptable terms to refinance acquisitions undertaken without permanent financing, further acquisitions may be curtailed, or cash available for distribution to shareholders may be adversely affected.
The concentration of ownership by certain investors may limit other shareholders from influencing significant corporate decisions.
At December 31, 2010, Vornado beneficially owned approximately 18.5 million common shares, and E. Robert Roskind, our Chairman, beneficially owned approximately 0.9 million of our common shares and approximately 1.5 million OP units, which are currently redeemable for approximately 1.7 million common shares, or with respect to a portion of the OP units, at our election, cash. Mr. Roskind and an employee of Vornado sit on our Board of Trustees as of the date this Annual Report was filed. Each of Vornado and Mr. Roskind may have substantial influence over us and on the outcome of any matters submitted to our shareholders for approval. In addition, certain decisions concerning our operations or financial structure may present conflicts of interest between each of Vornado and Mr. Roskind and our other equity or debt holders. In addition, Vornado engages in a wide variety of activities in the real estate business and may engage in activities that result in conflicts of interest with respect to matters affecting us, such as competition for properties and tenants.
Securities eligible for future sale may have adverse effects on our share price.
We have an unallocated universal shelf registration statement and a direct share purchase plan, pursuant to which we may issue additional common shares. In addition, as of December 31, 2010, an aggregate of approximately 9.3 million of our common shares are issuable upon the exercise of employee share options and on the exchange of OP units. There are also 16.2 million common shares underlying our 6.00% Convertible Guaranteed Notes as of December 31, 2010, which is subject to increase upon certain events, including if we pay a quarterly common share dividend in excess of $0.10 per common share. Depending upon the number of such securities issued, exercised or exchanged at one time, an issuance, exercise or exchange of such securities could be dilutive to or otherwise adversely affect the interests of holders of our common shares.
We are dependent upon our key personnel.
We are dependent upon key personnel whose continued service is not guaranteed. We are dependent on certain of our executive officers for business direction. We have entered into two-year employment agreements with E. Robert Roskind, our Chairman, Richard J. Rouse, our Vice Chairman and Chief Investment Officer, T. Wilson Eglin, our Chief Executive Officer and President and Patrick Carroll, our Executive Vice President, Chief Financial Officer and Treasurer.
Our inability to retain the services of any of our key personnel or our loss of any of their services could adversely impact our operations. We do not have key man life insurance coverage on our executive officers.
There are no unresolved written comments that were received from the SEC staff 180 days or more before the end of our fiscal year relating to our periodic or current reports under the Securities Exchange Act of 1934.
Real Estate Portfolio
General.
As of December 31, 2010, we had ownership interests in approximately 36.9 million square feet of rentable space in approximately 195 consolidated office, industrial and retail properties. As of December 31, 2010, these properties were approximately 93% leased based upon net rentable square feet. All properties in which we have an interest are held through at least one property owner subsidiary.
The properties in which we have an interest are generally subject to net leases; however, in certain leases the property owner subsidiaries are responsible for roof, structural and other repairs. In addition, certain of the properties in which we have an interest (including those held through non-consolidated entities) are subject to leases in which the landlord is responsible for a portion of the real estate taxes, utilities and general maintenance. The property owner subsidiaries are responsible for all operating expenses of any vacant properties, and the property owner subsidiaries may be responsible for a significant amount of operating expenses of multi-tenant properties.
17
Ground Leases.
Certain of the properties in which we have an interest are subject to long-term ground leases where a third party owns and leases the underlying land to the property owners. Certain of these properties are economically owned through the holding of industrial revenue bonds and as such, neither ground lease payments nor bond interest payments are made or received, respectively. For certain of the properties held under a ground lease, the ground lessee has a purchase option. At the end of these long-term ground leases, unless extended or the purchase option exercised, the land together with all improvements thereon reverts to the landowner. In addition, we have an interest in one property in which a portion of the land, on which a portion of the parking lot is located, is subject to a ground lease. At expiration of the ground lease, only that portion of the parking lot reverts to the landowner.
Leverage.
As of December 31, 2010, we had interests in properties subject to outstanding mortgages and notes payable and corporate level debt of approximately $1.8 billion with a weighted-average interest rate of approximately 5.8%.
18
|
LEXINGTON CONSOLIDATED PORTFOLIO
PROPERTY CHART
OFFICE
|
||||||||||||||
|
Property Location
|
City
|
State
|
Primary Tenant (Guarantor)
|
Net Rentable Square Feet
|
Current Lease Term Expiration
|
Percent Leased
|
||||||||
|
12209 W. Markham St.
|
Little Rock
|
AR
|
Entergy Arkansas, Inc.
|
36,311 |
10/31/2015
|
100 | % | |||||||
|
2211 S. 47th St.
|
Phoenix
|
AZ
|
Avnet, Inc.
|
176,402 |
11/14/2012
|
100 | % | |||||||
|
2005 E. Technology Circle
|
Tempe
|
AZ
|
Infocrossing, Inc.
|
60,000 |
12/31/2025
|
100 | % | |||||||
|
275 S. Valencia Ave
|
Brea
|
CA
|
Bank of America, NA
|
637,503 |
6/30/2012
|
100 | % | |||||||
|
26210 & 26220 Enterprise Court
|
Lake Forest
|
CA
|
Apria Healthcare, Inc. (Apria Healthcare Group, Inc.)
|
100,012 |
1/31/2012
|
100 | % | |||||||
|
2706 Media Center Dr.
|
Los Angeles
|
CA
|
Playboy Enterprises, Inc.
|
83,252 |
11/7/2012
|
100 | % | |||||||
|
3333 Coyote Hill Rd.
|
Palo Alto
|
CA
|
Xerox Corporation
|
202,000 |
12/13/2013
|
100 | % | |||||||
|
9201 E. Dry Creek Rd
|
Centennial
|
CO
|
The Shaw Group, Inc.
|
128,500 |
9/30/2017
|
100 | % | |||||||
|
1110 Bayfield Dr.
|
Colorado Springs
|
CO
|
Honeywell International, Inc.
|
166,575 |
11/30/2013
|
100 | % | |||||||
|
3940 S. Teller St.
|
Lakewood
|
CO
|
MoneyGram Payment Systems, Inc.
|
68,165 |
3/31/2012
|
100 | % | |||||||
|
1315 W. Century Dr.
|
Louisville
|
CO
|
Global Healthcare Exchange, Inc. (Global Healthcare Exchange, LLC)
|
106,877 |
4/30/2017
|
100 | % | |||||||
|
200 Executive Blvd. S.
|
Southington
|
CT
|
Hartford Fire Insurance Company
|
153,364 |
12/31/2012
|
100 | % | |||||||
|
100 Barnes Rd
|
Wallingford
|
CT
|
3M Company
|
44,400 |
6/30/2018
|
100 | % | |||||||
|
5600 Broken Sound Blvd.
|
Boca Raton
|
FL
|
Océ Printing Systems USA, Inc. (Océ -USA Holding, Inc.)
|
143,290 |
2/14/2020
|
100 | % | |||||||
|
12600 Gateway Blvd.
|
Fort Meyers
|
FL
|
Gartner, Inc.
|
62,400 |
1/31/2013
|
100 | % | |||||||
|
550 Business Center Dr.
|
Lake Mary
|
FL
|
JPMorgan Chase Bank, National Association
|
125,920 |
9/30/2015
|
100 | % | |||||||
|
600 Business Center Dr.
|
Lake Mary
|
FL
|
JPMorgan Chase Bank, National Association
|
125,155 |
9/30/2015
|
100 | % | |||||||
|
9200 S. Park Center Loop
|
Orlando
|
FL
|
Corinthian Colleges, Inc.
|
59,927 |
9/30/2013
|
100 | % | |||||||
|
Sandlake Rd./Kirkman Rd
|
Orlando
|
FL
|
Lockheed Martin Corporation
|
184,000 |
4/30/2013
|
100 | % | |||||||
|
4200 RCA Blvd.
|
Palm Beach Gardens
|
FL
|
The Wackenhut Corporation
|
114,518 |
2/28/2011
|
100 | % | |||||||
|
2223 N. Druid Hills Rd
|
Atlanta
|
GA
|
Bank of America, N.A. (Bank of America Corporation)
|
6,260 |
12/31/2014
|
100 | % | |||||||
|
6303 Barfield Rd
|
Atlanta
|
GA
|
International Business Machines Corporation (Internet Security Systems, Inc.)
|
238,600 |
5/31/2013
|
100 | % | |||||||
|
859 Mount Vernon Hwy
|
Atlanta
|
GA
|
International Business Machines Corporation/Problem Solved, LLC (Internet Security Systems, Inc.)
|
50,400 |
5/31/2014
|
100 | % | |||||||
|
956 Ponce de Leon Ave
|
Atlanta
|
GA
|
Bank of America, N.A. (Bank of America Corporation)
|
3,900 |
12/31/2014
|
100 | % | |||||||
|
4545 Chamblee-Dunwoody Rd
|
Chamblee
|
GA
|
Bank of America, N.A. (Bank of America Corporation)
|
4,565 |
12/31/2014
|
100 | % | |||||||
19
|
LEXINGTON CONSOLIDATED PORTFOLIO
PROPERTY CHART
OFFICE
|
||||||||||||||
|
Property Location
|
City
|
State
|
Primary Tenant (Guarantor)
|
Net Rentable Square Feet
|
Current Lease Term Expiration
|
Percent Leased
|
||||||||
|
201 W. Main St.
|
Cumming
|
GA
|
Bank of America, N.A. (Bank of America Corporation)
|
14,208 |
12/31/2014
|
100 | % | |||||||
|
1066 Main St.
|
Forest Park
|
GA
|
Bank of America, N.A. (Bank of America Corporation)
|
14,859 |
12/31/2014
|
100 | % | |||||||
|
825 Southway Dr.
|
Jonesboro
|
GA
|
Bank of America, N.A. (Bank of America Corporation)
|
4,894 |
12/31/2014
|
100 | % | |||||||
|
1698 Mountain Industrial Blvd.
|
Stone Mountain
|
GA
|
Bank of America, N.A. (Bank of America Corporation)
|
5,704 |
12/31/2014
|
100 | % | |||||||
|
4000 Johns Creek Pkwy
|
Suwanee
|
GA
|
Kraft Foods North America, Inc.
|
87,219 |
1/31/2012
|
100 | % | |||||||
|
1275 N.W. 128th St.
|
Clive
|
IA
|
Principal Life Insurance Company
|
61,180 |
1/31/2012
|
100 | % | |||||||
|
101 E. Erie St.
|
Chicago
|
IL
|
Draftfcb, Inc. (Interpublic Group of Companies, Inc.)
|
230,704 |
3/15/2014
|
100 | % | |||||||
|
850 & 950 Warrenville Rd
|
Lisle
|
IL
|
National Louis University
|
99,414 |
12/31/2019
|
92 | % | |||||||
|
500 Jackson St.
|
Columbus
|
IN
|
Cummins, Inc.
|
390,100 |
7/31/2019
|
100 | % | |||||||
|
10300 Kincaid Dr.
|
Fishers
|
IN
|
Roche Diagnostics Operations, Inc.
|
193,000 |
1/31/2020
|
100 | % | |||||||
|
10475 Crosspoint Blvd.
|
Fishers
|
IN
|
John Wiley & Sons, Inc.
|
141,047 |
10/31/2019
|
90 | % | |||||||
|
5757 Decatur Blvd.
|
Indianapolis
|
IN
|
Allstate Insurance Company
|
89,956 |
8/31/2012
|
100 | % | |||||||
|
11201 Renner Blvd.
|
Lenexa
|
KS
|
Applebee’s Services, Inc. (DineEquity, Inc.)
|
178,000 |
7/31/2023
|
100 | % | |||||||
|
5200 Metcalf Ave
|
Overland Park
|
KS
|
Swiss Re American Holding Corporation
|
320,198 |
12/22/2018
|
100 | % | |||||||
|
4455 American Way
|
Baton Rouge
|
LA
|
Bell South Mobility, Inc.
|
70,100 |
10/31/2012
|
100 | % | |||||||
|
147 Milk St.
|
Boston
|
MA
|
Harvard Vanguard Medical Associates, Inc.
|
52,337 |
12/31/2022
|
100 | % | |||||||
|
33 Commercial St.
|
Foxboro
|
MA
|
Invensys Systems, Inc. (Siebe, Inc.)
|
164,689 |
7/1/2015
|
100 | % | |||||||
|
37101 Corporate Dr.
|
Farmington Hills
|
MI
|
Continental Automotive Systems, Inc.
|
119,829 |
12/31/2011
|
100 | % | |||||||
|
26555 Northwestern Hwy
|
Southfield
|
MI
|
Federal-Mogul Corporation
|
187,163 |
1/31/2015
|
100 | % | |||||||
|
3165 McKelvey Rd
|
Bridgeton
|
MO
|
BJC Health System
|
52,994 |
3/31/2013
|
100 | % | |||||||
|
9201 Stateline Rd
|
Kansas City
|
MO
|
Swiss Re American Holding Corporation
|
155,925 |
4/1/2019
|
100 | % | |||||||
|
200 Lucent Lane
|
Cary
|
NC
|
Alcatel-Lucent USA, Inc.
|
124,944 |
9/30/2011
|
100 | % | |||||||
|
11707 Miracle Hills Dr.
|
Omaha
|
NE
|
Infocrossing, Inc.
|
85,200 |
11/30/2025
|
100 | % | |||||||
|
700 US Hwy. Route 202-206
|
Bridgewater
|
NJ
|
Biovail Pharmaceuticals, Inc. (Biovail Corporation)
|
115,558 |
10/31/2014
|
100 | % | |||||||
|
333 Mount Hope Ave
|
Rockaway
|
NJ
|
BASF Corporation
|
95,500 |
9/30/2014
|
100 | % | |||||||
|
1415 Wyckoff Rd
|
Wall
|
NJ
|
New Jersey Natural Gas Company
|
157,511 |
6/30/2021
|
100 | % | |||||||
|
29 S. Jefferson Rd
|
Whippany
|
NJ
|
CAE SimuFlite, Inc. (HP Whippany, LLC)
|
123,734 |
11/30/2021
|
100 | % | |||||||
20
|
LEXINGTON CONSOLIDATED PORTFOLIO
PROPERTY CHART
OFFICE
|
||||||||||||||
|
Property Location
|
City
|
State
|
Primary Tenant (Guarantor)
|
Net Rentable Square Feet
|
Current Lease Term Expiration
|
Percent Leased
|
||||||||
|
6226 W. Sahara Ave
|
Las Vegas
|
NV
|
Nevada Power Company
|
282,000 |
1/31/2029
|
100 | % | |||||||
|
180 S. Clinton St.
|
Rochester
|
NY
|
Frontier Corporation
|
226,000 |
12/31/2014
|
100 | % | |||||||
|
2000 Eastman Dr.
|
Milford
|
OH
|
Siemens Shared Services, LLC
|
221,215 |
4/30/2016
|
100 | % | |||||||
|
500 Olde Worthington Rd
|
Westerville
|
OH
|
InVentiv Communications, Inc.
|
97,000 |
9/30/2015
|
100 | % | |||||||
|
5500 New Albany Rd.
|
Columbus
|
OH
|
Evans, Mechwart, Hambleton & Tilton, Inc.
|
104,807 |
12/29/2026
|
100 | % | |||||||
|
4848 129th E. Ave
|
Tulsa
|
OK
|
HSBC Card Services, Inc. (HSBC Finance Corporation)
|
101,100 |
1/31/2011
|
100 | % | |||||||
|
275 Technology Dr.
|
Canonsburg
|
PA
|
ANSYS, Inc.
|
107,872 |
12/31/2014
|
100 | % | |||||||
|
2550 Interstate Dr.
|
Harrisburg
|
PA
|
New Cingular Wireless PCS, LLC
|
81,859 |
12/31/2013
|
100 | % | |||||||
|
1701 Market St.
|
Philadelphia
|
PA
|
Morgan, Lewis & Bockius, LLC
|
305,170 |
1/31/2014
|
98 | % | |||||||
|
1460 Tobias Gadsen Blvd.
|
Charleston
|
SC
|
Hagemeyer North America, Inc.
|
50,076 |
7/8/2020
|
100 | % | |||||||
|
2210 Enterprise Dr.
|
Florence
|
SC
|
JPMorgan Chase Bank, National Association
|
179,300 |
6/30/2013
|
100 | % | |||||||
|
3476 Stateview Blvd.
|
Fort Mill
|
SC
|
Wells Fargo Bank, N.A.
|
169,083 |
5/31/2014
|
100 | % | |||||||
|
3480 Stateview Blvd.
|
Fort Mill
|
SC
|
Wells Fargo Bank, N.A.
|
169,218 |
5/31/2014
|
100 | % | |||||||
|
400 E. Stone Ave
|
Greenville
|
SC
|
Canal Insurance Company
|
128,041 |
12/31/2029
|
100 | % | |||||||
|
1409 Centerpoint Blvd.
|
Knoxville
|
TN
|
Alstom Power, Inc.
|
84,404 |
10/31/2014
|
100 | % | |||||||
|
104 & 110 S. Front St.
|
Memphis
|
TN
|
Hnedak Bobo Group, Inc.
|
37,229 |
10/31/2016
|
100 | % | |||||||
|
3965 Airways Blvd.
|
Memphis
|
TN
|
Federal Express Corporation
|
521,286 |
6/19/2019
|
100 | % | |||||||
|
4001 International Pkwy
|
Carrollton
|
TX
|
Motel 6 Operating, LP (Accor S.A.)
|
138,443 |
7/31/2015
|
100 | % | |||||||
|
4201 Marsh Ln
|
Carrollton
|
TX
|
Carlson Restaurants Worldwide, Inc. (Carlson Companies, Inc.)
|
130,000 |
11/30/2018
|
100 | % | |||||||
|
11511 Luna Rd
|
Farmers Branch
|
TX
|
Haggar Clothing Company (Texas Holding Clothing Corporation & Haggar Corporation)
|
180,507 |
4/30/2016
|
100 | % | |||||||
|
10001 Richmond Ave
|
Houston
|
TX
|
Baker Hughes, Inc.
|
554,385 |
9/27/2015
|
100 | % | |||||||
|
1311 Broadfield Blvd.
|
Houston
|
TX
|
Transocean Offshore Deepwater Drilling, Inc. (Transocean Sedco Forex, Inc.)
|
155,040 |
3/31/2021
|
100 | % | |||||||
21
|
LEXINGTON CONSOLIDATED PORTFOLIO
PROPERTY CHART
OFFICE
|
||||||||||||||
|
Property Location
|
City
|
State
|
Primary Tenant (Guarantor)
|
Net Rentable Square Feet
|
Current Lease Term Expiration
|
Percent Leased
|
||||||||
|
16676 Northchase Dr.
|
Houston
|
TX
|
Anadarko Petroleum Corporation
|
101,111 |
7/31/2014
|
100 | % | |||||||
|
810 & 820 Gears Rd
|
Houston
|
TX
|
IKON Office Solutions, Inc.
|
157,790 |
1/31/2013
|
100 | % | |||||||
|
6555 Sierra Dr.
|
Irving
|
TX
|
TXU Energy Retail Company, LLC (Texas Competitive Electric Holdings Company, LLC)
|
247,254 |
3/31/2023
|
100 | % | |||||||
|
8900 Freeport Pkwy
|
Irving
|
TX
|
Nissan Motor Acceptance Corporation (Nissan North America, Inc.)
|
268,445 |
3/31/2023
|
100 | % | |||||||
|
6200 Northwest Pkwy
|
San Antonio
|
TX
|
United HealthCare Services, Inc.
|
142,500 |
11/30/2017
|
100 | % | |||||||
|
12645 W. Airport Rd
|
Sugar Land
|
TX
|
Baker Hughes, Inc.
|
165,836 |
9/27/2015
|
100 | % | |||||||
|
2050 Roanoke Rd
|
Westlake
|
TX
|
Chrysler Financial Services Americas, LLC
|
130,290 |
12/31/2011
|
100 | % | |||||||
|
120 E. Shore Dr.
|
Glen Allen
|
VA
|
Capital One Services, LLC
|
77,045 |
3/31/2012
|
100 | % | |||||||
|
400 Butler Farm Rd
|
Hampton
|
VA
|
Nextel Communications of the Mid-Atlantic, Inc. (Nextel Finance Company)
|
100,632 |
12/31/2014
|
100 | % | |||||||
|
13651 McLearen Rd
|
Herndon
|
VA
|
US Government
|
159,664 |
5/30/2018
|
100 | % | |||||||
|
13775 McLearen Rd
|
Herndon
|
VA
|
Equant, Inc. (Equant N.V.)
|
125,293 |
4/30/2015
|
100 | % | |||||||
|
2800 Waterford Lake Dr.
|
Richmond
|
VA
|
Alstom Power, Inc.
|
99,057 |
10/31/2014
|
100 | % | |||||||
|
22011 S.E. 51st St.
|
Issaquah
|
WA
|
OSI Systems, Inc. (Instrumentarium Corporation)
|
95,600 |
12/14/2014
|
100 | % | |||||||
|
5150 220th Ave
|
Issaquah
|
WA
|
OSI Systems, Inc. (Instrumentarium Corporation)
|
106,944 |
12/14/2014
|
100 | % | |||||||
|
Office Total
|
12,419,759 | |||||||||||||
22
|
LEXINGTON CONSOLIDATED PORTFOLIO
PROPERTY CHART
INDUSTRIAL
|
||||||||||||||
|
Property Location
|
City
|
State
|
Primary Tenant (Guarantor)
|
Net Rentable Square Feet
|
Current Lease Term Expiration
|
Percent Leased
|
||||||||
|
2415 U.S. Hwy 78 E.
|
Moody
|
AL
|
CEVA Logistics U.S., Inc. (TNT Logistics Holdings, B.V.)
|
595,346 |
1/2/2014
|
100 | % | |||||||
|
2455 Premier Dr.
|
Orlando
|
FL
|
Walgreen Company
|
205,016 |
3/31/2016
|
100 | % | |||||||
|
3102 Queen Palm Dr.
|
Tampa
|
FL
|
Time Customer Service, Inc. (Time, Inc.)
|
229,605 |
6/30/2020
|
100 | % | |||||||
|
1420 Greenwood Rd
|
McDonough
|
GA
|
Versacold USA, Inc.
|
296,972 |
10/31/2017
|
100 | % | |||||||
|
7500 Chavenelle Rd
|
Dubuque
|
IA
|
The McGraw-Hill Companies, Inc.
|
330,988 |
6/30/2017
|
100 | % | |||||||
|
3686 S. Central Ave
|
Rockford
|
IL
|
Jacobson Warehouse Company, Inc. (Jacobson Distribution Company, Inc. and Jacobson Transportation Company, Inc.)
|
90,000 |
12/31/2014
|
100 | % | |||||||
|
749 Southrock Dr.
|
Rockford
|
IL
|
Jacobson Warehouse Company, Inc. (Jacobson Distribution Company, Inc. and Jacobson Transportation Company, Inc.)
|
150,000 |
12/31/2015
|
100 | % | |||||||
|
10000 Business Blvd.
|
Dry Ridge
|
KY
|
Dana Light Axle Products, LLC (Dana Holding Corporation and Dana Limited)
|
336,350 |
6/30/2025
|
100 | % | |||||||
|
730 N. Black Branch Rd
|
Elizabethtown
|
KY
|
Metalsa Structural Products, Inc. (Dana Holding Corporation and Dana Limited)
|
167,770 |
6/30/2025
|
100 | % | |||||||
|
750 N. Black Branch Rd
|
Elizabethtown
|
KY
|
Metalsa Structural Products, Inc. (Dana Holding Corporation and Dana Limited)
|
539,592 |
6/30/2025
|
100 | % | |||||||
|
301 Bill Bryan Rd
|
Hopkinsville
|
KY
|
Metalsa Structural Products, Inc. (Dana Holding Corporation and Dana Limited)
|
424,904 |
6/30/2025
|
100 | % | |||||||
|
1901 Ragu Dr.
|
Owensboro
|
KY
|
Unilever Supply Chain, Inc. (Unilever United States, Inc.)
|
443,380 |
12/19/2020
|
100 | % | |||||||
|
4010 Airpark Dr.
|
Owensboro
|
KY
|
Metalsa Structural Products, Inc. (Dana Holding Corporation and Dana Limited)
|
211,598 |
6/30/2025
|
100 | % | |||||||
|
5001 Greenwood Rd
|
Shreveport
|
LA
|
Libbey Glass, Inc. (Libbey, Inc.)
|
646,000 |
10/31/2026
|
100 | % | |||||||
|
113 Wells St.
|
North Berwick
|
ME
|
United Technologies Corporation
|
972,625 |
4/30/2019
|
100 | % | |||||||
|
1601 Pratt Ave
|
Marshall
|
MI
|
Enbridge Energy L.P.
|
58,300 |
2/15/2012
|
100 | % | |||||||
|
43955 Plymouth Oaks Blvd.
|
Plymouth
|
MI
|
Tower Automotive Operations USA I, LLC (Tower Automotive Inc.)
|
290,133 |
10/31/2012
|
100 | % | |||||||
|
7111 Crabb Rd
|
Temperance
|
MI
|
CEVA Logistics U.S., Inc. (TNT Logistics Holdings, B.V.)
|
744,570 |
8/4/2012
|
100 | % | |||||||
|
7670 Hacks Cross Rd
|
Olive Branch
|
MS
|
MAHLE Clevite, Inc. (MAHLE Industries, Inc.)
|
268,104 |
2/28/2016
|
100 | % | |||||||
|
1133 Poplar Creek Rd
|
Henderson
|
NC
|
Staples, Inc.
|
196,946 |
1/31/2014
|
100 | % | |||||||
|
250 Swathmore Ave
|
High Point
|
NC
|
Steelcase, Inc.
|
244,851 |
9/30/2017
|
100 | % | |||||||
|
2880 Kenny Biggs Rd
|
Lumberton
|
NC
|
Quickie Manufacturing Corporation
|
423,280 |
11/30/2021
|
100 | % | |||||||
|
2203 Sherrill Dr.
|
Statesville
|
NC
|
Ozburn-Hessey Logistics, LLC (OHH Acquisition Corporation)
|
639,800 |
5/31/2013
|
100 | % | |||||||
|
121 Technology Dr.
|
Durham
|
NH
|
Heidelberg Americas, Inc. (Heidelberg Drackmaschinen AG)
|
500,500 |
3/30/2021
|
100 | % | |||||||
|
1109 Commerce Blvd.
|
Swedesboro
|
NJ
|
Vacant
|
262,644 |
None
|
0 | % | |||||||
|
75 N. St.
|
Saugerties
|
NY
|
Rotron, Inc. (EG&G)
|
52,000 |
12/31/2014
|
100 | % | |||||||
|
10590 Hamilton Ave
|
Cincinnati
|
OH
|
The Hillman Group, Inc.
|
248,200 |
8/31/2016
|
100 | % | |||||||
|
1650 - 1654 Williams Rd
|
Columbus
|
OH
|
ODW Logistics, Inc.
|
772,450 |
6/30/2018
|
100 | % | |||||||
|
7005 Cochran Rd
|
Glenwillow
|
OH
|
Royal Appliance Manufacturing Company
|
458,000 |
7/31/2025
|
100 | % | |||||||
23
|
LEXINGTON CONSOLIDATED PORTFOLIO
PROPERTY CHART
INDUSTRIAL
|
||||||||||||||
|
Property Location
|
City
|
State
|
Primary Tenant (Guarantor)
|
Net Rentable Square Feet
|
Current Lease Term Expiration
|
Percent Leased
|
||||||||
|
191 Arrowhead Dr.
|
Hebron
|
OH
|
Vacant
|
250,410 |
None
|
0 | % | |||||||
|
200 Arrowhead Dr.
|
Hebron
|
OH
|
Owens Corning Insulating Systems, LLC
|
400,522 |
5/30/2011
|
100 | % | |||||||
|
10345 Philipp Pkwy
|
Streetsboro
|
OH
|
L'Oreal USA S/D, Inc. (L’Oreal USA, Inc.)
|
649,250 |
10/17/2019
|
100 | % | |||||||
|
250 Rittenhouse Circle
|
Bristol
|
PA
|
Vacant
|
255,019 |
None
|
0 | % | |||||||
|
245 Salem Church Rd
|
Mechanicsburg
|
PA
|
Exel Inc. (NFC plc)
|
252,000 |
12/31/2012
|
100 | % | |||||||
|
34 E. Main St.
|
New Kingston
|
PA
|
Vacant
|
179,200 |
None
|
0 | % | |||||||
|
6 Doughten Rd
|
New Kingston
|
PA
|
Vacant
|
330,000 |
None
|
0 | % | |||||||
|
224 Harbor Freight Rd
|
Dillon
|
SC
|
Harbor Freight Tools USA, Inc. (Central Purchasing, Inc.)
|
1,010,859 |
12/31/2021
|
100 | % | |||||||
|
50 Tyger River Dr.
|
Duncan
|
SC
|
Plastic Omnium Exteriors, LLC
|
221,833 |
9/30/2018
|
100 | % | |||||||
|
101 Michelin Dr.
|
Laurens
|
SC
|
CEVA Logistics U.S., Inc. (TNT Logistics Holdings, B.V.)
|
1,164,000 |
8/4/2012
|
100 | % | |||||||
|
477 Distribution Pkwy
|
Collierville
|
TN
|
Federal Express Corporation
|
120,000 |
5/31/2021
|
100 | % | |||||||
|
900 Industrial Blvd.
|
Crossville
|
TN
|
Dana Commercial Vehicle Products, LLC
|
222,200 |
9/30/2016
|
100 | % | |||||||
|
3350 Miac Cove Rd
|
Memphis
|
TN
|
Mimeo.com, Inc.
|
140,078 |
9/30/2020
|
77 | % | |||||||
|
3456 Meyers Ave
|
Memphis
|
TN
|
Sears Logistics Services
|
780,000 |
2/28/2017
|
100 | % | |||||||
|
3820 Micro Dr.
|
Millington
|
TN
|
Ingram Micro, LP (Ingram Micro, Inc.)
|
701,819 |
9/30/2021
|
100 | % | |||||||
|
19500 Bulverde Rd
|
San Antonio
|
TX
|
Harcourt, Inc. (Harcourt General, Inc.)
|
559,258 |
3/31/2016
|
100 | % | |||||||
|
2425 Hwy 77 N.
|
Waxahachie
|
TX
|
James Hardie Building Products, Inc. (James Hardie N.V.)
|
335,610 |
3/31/2020
|
100 | % | |||||||
|
291 Park Center Dr.
|
Winchester
|
VA
|
Kraft Foods Global, Inc.
|
344,700 |
5/31/2016
|
100 | % | |||||||
|
Industrial Total
|
18,716,682 | |||||||||||||
24
|
LEXINGTON CONSOLIDATED PORTFOLIO
PROPERTY CHART
RETAIL
|
||||||||||||||
|
Property Location
|
City
|
State
|
Primary Tenant (Guarantor)
|
Net Rentable Square Feet
|
Current Lease Term Expiration
|
Percent Leased
|
||||||||
|
5544 Atlanta Hwy
|
Montgomery
|
AL
|
Vacant
|
60,698 |
None
|
0 | % | |||||||
|
10415 Grande Ave
|
Sun City
|
AZ
|
Cafeteria Operators, LP (Furrs Restaurant Group, Inc.)
|
10,000 |
4/30/2012
|
100 | % | |||||||
|
255 Northgate Dr.
|
Manteca
|
CA
|
Kmart Corporation
|
107,489 |
12/31/2018
|
100 | % | |||||||
|
12080 Carmel Mountain Rd
|
San Diego
|
CA
|
Sears Holdings Corporation
|
107,210 |
12/31/2018
|
100 | % | |||||||
|
10340 U.S. 19
|
Port Richey
|
FL
|
Kingswere Furniture, LLC
|
53, 280 |
10/31/2018
|
100 | % | |||||||
|
1150 W. Carl Sandburg Dr.
|
Galesburg
|
IL
|
Kmart Corporation
|
94,970 |
12/31/2018
|
100 | % | |||||||
|
5104 N. Franklin Rd
|
Lawrence
|
IN
|
Marsh Supermarkets, Inc.
|
28,721 |
10/31/2013
|
100 | % | |||||||
|
205 Homer Rd
|
Minden
|
LA
|
Brookshire Grocery Company
|
35,000 |
11/30/2012
|
100 | % | |||||||
|
24th St. W. & St. John’s Ave
|
Billings
|
MT
|
Safeway Stores, Inc.
|
40,800 |
5/31/2015
|
100 | % | |||||||
|
1146 Gum Branch Rd.
|
Jacksonville
|
NC
|
Food Lion, Inc. (Delhaize America, Inc.)
|
23,000 |
2/28/2013
|
100 | % | |||||||
|
US 221 & Hospital Rd
|
Jefferson
|
NC
|
Food Lion, Inc. (Delhaize America, Inc.)
|
23,000 |
2/28/2013
|
100 | % | |||||||
|
291 Talbert Blvd.
|
Lexington
|
NC
|
Food Lion, Inc. (Delhaize America, Inc.)
|
23,000 |
2/28/2013
|
100 | % | |||||||
|
835 Julian Ave
|
Thomasville
|
NC
|
Mighty Dollar, LLC
|
23,767 |
9/30/2018
|
100 | % | |||||||
|
900 S. Canal St.
|
Carlsbad
|
NM
|
Cafeteria Operators, LP (Furrs Restaurant Group, Inc.)
|
10,000 |
4/30/2012
|
100 | % | |||||||
|
130 Midland Ave
|
Port Chester
|
NY
|
Pathmark Stores, Inc.
|
59,000 |
10/31/2013
|
100 | % | |||||||
|
21082 Pioneer Plaza Dr.
|
Watertown
|
NY
|
Kmart Corporation
|
120,727 |
12/31/2018
|
100 | % | |||||||
|
4733 Hills and Dales Rd
|
Canton
|
OH
|
Bally’s Total Fitness of the Midwest (Bally’s Health & Tennis Corporation)
|
37,214 |
6/30/2011
|
100 | % | |||||||
|
4831 Whipple Avenue N.W.
|
Canton
|
OH
|
Best Buy Company, Inc.
|
46,350 |
2/26/2018
|
100 | % | |||||||
|
1084 E. Second St.
|
Franklin
|
OH
|
Marsh Supermarkets, Inc.
|
29,119 |
10/31/2013
|
100 | % | |||||||
|
5350 Leavitt Rd
|
Lorain
|
OH
|
Kmart Corporation
|
193,193 |
12/31/2018
|
100 | % | |||||||
|
N.E.C. 45th Street & Lee Blvd.
|
Lawton
|
OK
|
Associated Wholesale Grocers, Inc.
|
30,757 |
3/31/2014
|
100 | % | |||||||
|
6910 S. Memorial Hwy
|
Tulsa
|
OK
|
Toys “R” Us-Delaware, Inc.
|
43,123 |
5/31/2016
|
100 | % | |||||||
|
12525 S.E. 82
nd
Ave
|
Clackamas
|
OR
|
TRU 2005 RE I, LLC
|
42,842 |
5/31/2016
|
100 | % | |||||||
|
S. Carolina 52/52 Bypass
|
Moncks Corner
|
SC
|
Food Lion, Inc. (Delhaize America, Inc.)
|
23,000 |
2/28/2013
|
100 | % | |||||||
|
399 Peach Wood Centre Dr.
|
Spartanburg
|
SC
|
Best Buy Company, Inc.
|
45,800 |
2/26/2018
|
100 | % | |||||||
|
1600 E. 23rd St.
|
Chattanooga
|
TN
|
BI- LO, LLC
|
42,130 |
6/30/2012
|
100 | % | |||||||
25
|
LEXINGTON CONSOLIDATED PORTFOLIO
PROPERTY CHART
RETAIL
|
||||||||||||||
|
Property Location
|
City
|
State
|
Primary Tenant (Guarantor)
|
Net Rentable Square Feet
|
Current Lease Term Expiration
|
Percent Leased
|
||||||||
|
1053 Mineral Springs Rd
|
Paris
|
TN
|
The Kroger Company
|
31,170 |
7/1/2013
|
100 | % | |||||||
|
3040 Josey Lane
|
Carrollton
|
TX
|
Ong’s Family, Inc.
|
61,000 |
1/31/2021
|
100 | % | |||||||
|
4121 S. Port Ave
|
Corpus Christi
|
TX
|
Cafeteria Operators, LP (Furr’s Restaurant Group, Inc.)
|
10,000 |
4/30/2012
|
100 | % | |||||||
|
1610 S. Westmoreland Ave
|
Dallas
|
TX
|
Malone’s Food Stores, Ltd.
|
70,910 |
3/31/2017
|
100 | % | |||||||
|
119 N. Balboa Rd
|
El Paso
|
TX
|
Cafeteria Operators, LP (Furrs Restaurant Group, Inc.)
|
10,000 |
4/30/2012
|
100 | % | |||||||
|
3451 Alta Mesa Blvd.
|
Fort Worth
|
TX
|
Minyard Food Stores, Inc.
|
44,000 |
5/31/2012
|
100 | % | |||||||
|
101 W. Buckingham Rd
|
Garland
|
TX
|
Minyard Food Stores, Inc.
|
40,000 |
11/30/2012
|
100 | % | |||||||
|
4811 Wesley St.
|
Greenville
|
TX
|
Safeway Stores, Inc.
|
48,492 |
5/31/2016
|
100 | % | |||||||
|
120 S. Waco St.
|
Hillsboro
|
TX
|
Brookshire Grocery Company
|
35,000 |
11/30/2012
|
100 | % | |||||||
|
13133 Steubner Ave
|
Houston
|
TX
|
The Kroger Company
|
52,200 |
12/29/2016
|
100 | % | |||||||
|
901 W. Expressway
|
McAllen
|
TX
|
Cafeteria Operators, LP (Furrs Restaurant Group, Inc.)
|
10,000 |
4/30/2012
|
100 | % | |||||||
|
402 E. Crestwood Dr.
|
Victoria
|
TX
|
Cafeteria Operators, LP (Furrs Restaurant Group, Inc.)
|
10,000 |
4/30/2012
|
100 | % | |||||||
|
3211 W. Beverly St.
|
Staunton
|
VA
|
Food Lion, Inc. (Delhaize America, Inc.)
|
23,000 |
2/28/2013
|
100 | % | |||||||
|
9803 Edmonds Way
|
Edmonds
|
WA
|
Pudget Consumers Co-op d/b/a PCC Natural Markets
|
35,459 |
8/31/2028
|
100 | % | |||||||
|
18601 Alderwood Mall Blvd.
|
Lynnwood
|
WA
|
TRU 2005 RE I, LLC
|
43,105 |
5/31/2016
|
100 | % | |||||||
|
1700 State Route 160
|
Port Orchard
|
WA
|
Moran Foods, Inc. d/b/a Save-A-Lot, Ltd.
|
27,968 |
1/31/2015
|
57 | % | |||||||
|
97 Seneca Trail
|
Fairlea
|
WV
|
Kmart Corporation
|
90,933 |
12/31/2018
|
100 | % | |||||||
|
Retail Total
|
1,997,427 | |||||||||||||
26
|
LEXINGTON CONSOLIDATED PORTFOLIO
PROPERTY CHART
MULTI-TENANTED
|
||||||||||||||
|
Property Location
|
City
|
State
|
Primary Tenant (Guarantor)
|
Net Rentable Square Feet
|
Current Lease Term Expiration
|
Percent Leased
|
||||||||
|
13430 N. Black Canyon Fwy
|
Phoenix
|
AZ
|
Multi-tenanted
|
138,940 |
Various
|
100 | % | |||||||
|
1500 Hughes Way
|
Long Beach
|
CA
|
Multi-tenanted
|
490,555 |
Various
|
67 | % | |||||||
|
10 John St.
|
Clinton
|
CT
|
Vacant
|
41,188 |
None
|
0 | % | |||||||
|
6277 Sea Harbor Dr.
|
Orlando
|
FL
|
Vacant
|
360,307 |
None
|
0 | % | |||||||
|
160 Clairemont Ave
|
Decatur
|
GA
|
Multi-tenanted
|
121,686 |
Various
|
79 | % | |||||||
|
2300 Litton Lane
|
Hebron
|
KY
|
Multi-tenanted
|
80,441 |
Various
|
100 | % | |||||||
|
100 Light St.
|
Baltimore
|
MD
|
Multi-tenanted
|
474,498 |
Various
|
75 | % | |||||||
|
389 & 399 Interpace Hwy
|
Parsippany
|
NJ
|
Multi-tenanted
|
340,240 |
Various
|
87 | % | |||||||
|
207 Mockingbird Lane
|
Johnson City
|
TN
|
Multi-tenanted
|
60,684 |
Various
|
100 | % | |||||||
|
350 Pine St.
|
Beaumont
|
TX
|
Multi-tenanted
|
425,198 |
Various
|
82 | % | |||||||
|
100 E. Shore Dr.
|
Glen Allen
|
VA
|
Multi-tenanted
|
68,003 |
Various
|
100 | % | |||||||
|
130 E. Shore Dr.
|
Glen Allen
|
VA
|
Multi-tenanted
|
79,675 |
Various
|
65 | % | |||||||
|
421 Butler Farm Rd
|
Hampton
|
VA
|
Patient Advocate Foundation
|
56,564 |
12/31/2019
|
65 | % | |||||||
|
6050 Dana Way
|
Antioch
|
TN
|
W.M. Wright Company
|
674,528 |
3/31/2021
|
62 | % | |||||||
|
1032 Fort St. Mall/King St.
|
Honolulu
|
HI
|
Multi-tenanted
|
318,451 |
Various
|
95 | % | |||||||
|
Multi-Tenanted Total
|
3,730,958 | |||||||||||||
|
Consolidated Portfolio Grand Total
|
36,864,826 | |||||||||||||
27
|
LEXINGTON
NON-CONSOLIDATED PORTFOLIO PROPERTY
CHART
|
||||||||||||||
|
Property Location
|
City
|
State
|
Primary Tenant (Guarantor)
|
Net Rentable Square Feet
|
Current Lease Term Expiration
|
Percent Leased
|
||||||||
|
OFFICE
|
||||||||||||||
|
5201 W. Barraque St.
|
Pine Bluff
|
AR
|
Entergy Services, Inc.
|
27,189 |
10/31/2015
|
100 | % | |||||||
|
Route 64 W. & Junction 333
|
Russellville
|
AR
|
Entergy Gulf States
|
191,950 |
5/9/2016
|
100 | % | |||||||
|
19019 N. 59th Ave
|
Glendale
|
AZ
|
Honeywell International, Inc.
|
252,300 |
7/15/2011
|
100 | % | |||||||
|
8555 S. River Pkwy
|
Tempe
|
AZ
|
ASM Lithography, Inc. (ASM Lithography Holding NV)/DuPont Airproducts Nanomaterials LLC
|
95,133 |
6/30/2022
|
100 | % | |||||||
|
1440 E. 15th St.
|
Tucson
|
AZ
|
CoxCom, Inc.
|
28,591 |
7/31/2022
|
100 | % | |||||||
|
10419 N. 30th St.
|
Tampa
|
FL
|
Time Customer Service, Inc. (Time, Inc.)
|
132,981 |
6/30/2020
|
100 | % | |||||||
|
2500 Patrick Henry Pkwy
|
McDonough
|
GA
|
Georgia Power Company
|
111,911 |
6/30/2015
|
100 | % | |||||||
|
3500 N. Loop Court
|
McDonough
|
GA
|
Litton Loan Servicing, LP
|
62,218 |
8/31/2018
|
100 | % | |||||||
|
3265 E. Goldstone Dr.
|
Meridian
|
ID
|
VoiceStream PCS Holding, LLC (T-Mobile USA, Inc.)
|
77,484 |
6/28/2019
|
100 | % | |||||||
|
101 E. Washington Blvd.
|
Fort Wayne
|
IN
|
American Electric Power
|
348,452 |
10/31/2016
|
100 | % | |||||||
|
9601 Renner Blvd.
|
Lenexa
|
KS
|
Voicestream PCS II Corporation (T-Mobile USA, Inc.)
|
77,484 |
10/31/2019
|
100 | % | |||||||
|
70 Mechanic St.
|
Foxboro
|
MA
|
Invensys Systems, Inc. (Siebe, Inc.)
|
251,914 |
7/1/2014
|
100 | % | |||||||
|
First Park Dr.
|
Oakland
|
ME
|
Omnipoint Holdings, Inc. (T-Mobile USA, Inc.)
|
78,610 |
8/31/2020
|
100 | % | |||||||
|
12000 & 12025 Tech Center Dr.
|
Livonia
|
MI
|
Kelsey-Hayes Company (TRW Automotive, Inc.)
|
180,230 |
4/30/2014
|
100 | % | |||||||
|
3943 Denny Ave
|
Pascagoula
|
MS
|
Northrop Grumman Systems Corporation
|
94,841 |
10/14/2013
|
100 | % | |||||||
|
3201 Quail Springs Pkwy
|
Oklahoma City
|
OK
|
AT& T Services, Inc.
|
128,500 |
11/30/2015
|
100 | % | |||||||
|
2999 SW 6th St.
|
Redmond
|
OR
|
VoiceStream PCS I, LLC (T-Mobile USA, Inc.)
|
77,484 |
1/31/2019
|
100 | % | |||||||
|
265 Lehigh St.
|
Allentown
|
PA
|
Wells Fargo Bank, N.A.
|
71,230 |
6/30/2011
|
100 | % | |||||||
|
420 Riverport Rd
|
Kingport
|
TN
|
Kingsport Power Company
|
42,770 |
6/30/2013
|
100 | % | |||||||
|
2401 Cherahala Blvd.
|
Knoxville
|
TN
|
AdvancePCS, Inc.
|
59,748 |
5/31/2013
|
100 | % | |||||||
|
601 & 701 Experian Pkwy
|
Allen
|
TX
|
Experian Information Solutions, Inc. (Experian Holdings, Inc.)
|
292,700 |
3/15/2018
|
100 | % | |||||||
|
1401 & 1501 Nolan Ryan Pkwy
|
Arlington
|
TX
|
Siemens Shared Services, LLC
|
236,547 |
1/31/2014
|
100 | % | |||||||
|
1200 Jupiter Rd
|
Garland
|
TX
|
Raytheon Company
|
278,759 |
5/31/2016
|
100 | % | |||||||
|
2529 W. Thorne Dr.
|
Houston
|
TX
|
Baker Hughes, Inc.
|
65,500 |
9/27/2015
|
100 | % | |||||||
|
17191 St. Luke’s Way
|
The Woodlands
|
TX
|
Montgomery County Management Company, LLC
|
41,000 |
10/31/2019
|
100 | % | |||||||
|
3711 San Gabriel
|
Mission
|
TX
|
VoiceStream PCS II Corporation (T-Mobile USA, Inc.)
|
75,016 |
6/30/2015
|
100 | % | |||||||
|
11555 University Blvd.
|
Sugar Land
|
TX
|
KS Management Services, LLP (St. Luke’s Episcopal Health System Corporation)
|
72,683 |
11/30/2020
|
100 | % | |||||||
|
1600 Eberhardt Rd
|
Temple
|
TX
|
Nextel of Texas (Nextel Finance Company)
|
108,800 |
1/31/2016
|
100 | % | |||||||
|
1400 N.E. McWilliams Rd.
|
Bremerton
|
WA
|
Nextel West Corporation (Nextel Finance Company)
|
60,200 |
7/14/2016
|
100 | % | |||||||
|
Office Total
|
3,622,225 | |||||||||||||
28
|
LEXINGTON
NON-CONSOLIDATED PORTFOLIO PROPERTY
CHART
|
||||||||||||||
|
Property Location
|
City
|
State
|
Primary Tenant (Guarantor)
|
Net Rentable Square Feet
|
Current Lease Term Expiration
|
Percent Leased
|
||||||||
|
INDUSTRIAL
|
||||||||||||||
|
109 Stevens St.
|
Jacksonville
|
FL
|
Vacant
|
168,800 |
None
|
0 | % | |||||||
|
359 Gateway Dr.
|
Lavonia
|
GA
|
TI Group Automotive Systems, LLC (TI Automotive Ltd.)
|
133,221 |
5/31/2020
|
100 | % | |||||||
|
3600 Army Post Rd
|
Des Moines
|
IA
|
HP Enterprises, LLC
|
405,000 |
4/30/2012
|
100 | % | |||||||
|
2935 Van Vactor Way
|
Plymouth
|
IN
|
Bay Valley Foods, LLC
|
300,500 |
6/30/2015
|
100 | % | |||||||
|
6938 Elm Valley Dr.
|
Kalamazoo
|
MI
|
Dana Commercial Vehicle Products, LLC (Dana Holding Corporation and Dana Limited)
|
150,945 |
10/25/2021
|
100 | % | |||||||
|
904 Industrial Rd
|
Marshall
|
MI
|
Tenneco Automotive Operating Company, Inc. (Tenneco, Inc.)
|
246,508 |
9/30/2018
|
100 | % | |||||||
|
1700 47th Ave N.
|
Minneapolis
|
MN
|
Owens Corning Roofing and Asphalt, LLC
|
18,620 |
6/30/2015
|
100 | % | |||||||
|
324 Industrial Park Rd
|
Franklin
|
NC
|
SKF USA, Inc.
|
72,868 |
12/31/2014
|
100 | % | |||||||
|
736 Addison Rd
|
Erwin
|
NY
|
Corning, Inc.
|
408,000 |
11/30/2016
|
100 | % | |||||||
|
590 Ecology Lane
|
Chester
|
SC
|
Owens Corning, Inc.
|
420,597 |
7/14/2025
|
100 | % | |||||||
|
120 S.E. Pkwy Dr.
|
Franklin
|
TN
|
Essex Group, Inc. (United Technologies Corporation)
|
289,330 |
12/31/2013
|
100 | % | |||||||
|
9110 Grogans Mill Rd
|
Houston
|
TX
|
Baker Hughes, Inc.
|
275,750 |
9/27/2015
|
100 | % | |||||||
|
2424 Alpine Rd
|
Eau Claire
|
WI
|
Silver Spring Gardens, Inc. (Huntsinger Farms, Inc.)
|
159,000 |
4/30/2027
|
100 | % | |||||||
|
Industrial Total
|
3,049,139 | |||||||||||||
29
|
LEXINGTON
NON-CONSOLIDATED PORTFOLIO PROPERTY
CHART
|
||||||||||||||
|
Property Location
|
City
|
State
|
Primary Tenant (Guarantor)
|
Net Rentable Square Feet
|
Current Lease Term Expiration
|
Percent Leased
|
||||||||
|
RETAIL/OTHER
|
||||||||||||||
|
101 Creger Dr.
|
Ft. Collins
|
CO
|
Lithia Real Estate, Inc. (Lithia Motors, Inc.)
|
10,000 |
5/31/2012
|
100 | % | |||||||
|
11411 N. Kelly Ave
|
Oklahoma City
|
OK
|
American Golf Corporation
|
13,924 |
12/31/2017
|
100 | % | |||||||
|
25500 State Hwy 249
|
Tomball
|
TX
|
Parkway Chevrolet, Inc. (Raymond Durdin, Jean W. Durdin)
|
77,076 |
8/31/2026
|
100 | % | |||||||
|
Retail/Other Total
|
101,000 | |||||||||||||
|
Non-Consolidated Portfolio Grand Total
|
6,772,364 | |||||||||||||
The average effective annual rent per square foot for the consolidated portfolio for the year ended December 31, 2010 was $8.33.
The following chart sets forth certain information regarding lease expirations for the next ten years on our consolidated portfolio:
|
Year
|
Number of
Lease Expirations
|
Square Feet
|
Annual Rent ($000)
|
Percentage of
Annual Rent
|
|
2011
|
32
|
1,162,849
|
$15,579
|
5.1%
|
|
2012
|
49
|
4,458,580
|
34,703
|
11.3%
|
|
2013
|
44
|
2,374,380
|
24,759
|
8.1%
|
|
2014
|
40
|
3,298,197
|
43,919
|
14.3%
|
|
2015
|
25
|
2,159,739
|
31,188
|
10.2%
|
|
2016
|
20
|
2,702,562
|
17,471
|
5.7%
|
|
2017
|
11
|
2,111,932
|
12,993
|
4.2%
|
|
2018
|
21
|
2,856,804
|
23,477
|
7.6%
|
|
2019
|
16
|
3,131,162
|
24,607
|
8.0%
|
|
2020
|
10
|
1,541,762
|
13,758
|
4.5%
|
30
From time to time we are directly and indirectly involved in legal proceedings arising in the ordinary course of our business. We believe, based on currently available information, and after consultation with legal counsel, that the results of such proceedings, in the aggregate, will not have a material adverse effect on our financial condition, but might be material to our operating results for any particular period, depending, in part, upon the operating results for such period.
Deutsche Bank Securities, Inc. and SPCP Group LLC v. Lexington Drake, L.P., et al. (Supreme Court of the State of New York-Index No. 603051/08)
On June 30, 2006, one of our property owner subsidiaries and a property owner subsidiary of a then co-investment program respectively sold to Deutsche Bank Securities, Inc., which we refer to as Deutsche Bank, (1) a $7.7 million bankruptcy damage claim against Dana Corporation for $5.4 million, which we refer to as the Farmington Hills claim and (2) a $7.7 million bankruptcy damage claim against Dana Corporation for $5.7 million, which we refer to as the Antioch claim. Under the terms of the agreements covering the sale of the claims, which were guaranteed by us, the property owner subsidiaries are obligated to reimburse Deutsche Bank should the claim ever be disallowed, subordinated or otherwise impaired, to the extent of such disallowance, subordination or impairment, plus interest at the rate of 10% per annum from the date of payment of the purchase price by Deutsche Bank. On October 12, 2007, Dana Corporation filed an objection to both claims. We assisted Deutsche Bank and the then holders of the claims in the preparation and filing of a response to the objection. Despite a belief by us that the objections were without merit, the holders of the claims, without our consent, settled the allowed amount of the claims at $6.5 million for the Farmington Hills claim and $7.2 million for the Antioch claim in order to participate in a special settlement pool for allowed intangible unsecured claims and a preferred share rights offering having a value thought to be equal to, or greater than, the reduction of the claims. Deutsche Bank made a formal demand with respect to the Farmington Hills claim in the amount of $0.8 million plus interest, but did not make a formal demand with respect to the Antioch claim. Following a rejection of the demand by us, Deutsche Bank and SPCP Group, LLC filed a summons and complaint with the Supreme Court of the State of New York, County of New York for the Farmington Hills and Antioch claims, and claimed damages of $1.2 million plus interest and expenses.
Together with the property owner subsidiaries, we answered the complaint on November 26, 2008 and served numerous discovery requests. After almost a year of inactivity, on March 18, 2010, the defendants and the plaintiffs filed motions for summary judgment and related opposing and supporting motions. On November 22, 2010, the court ruled in favor of the plaintiffs on their motion for summary judgment. The court referred the issue of damages to a special referee to determine the value of plaintiffs’ participation in the preferred share rights offering and a settlement pool for allowed intelligible unsecured claims so as to be taken into consideration with respect to computation of damages, if any.
We filed a notice of appeal and intend to appeal the court’s ruling if the special referee determines there are damages. We intend to continue to vigorously defend the claims for a variety of reasons, including that (1) the holders of the claims arbitrarily settled the claims for reasons based on factors other than the merits, (2) the holders of the claims voluntarily reduced the claims to participate in certain settlement pools, (3) the contract language that supports the plaintiff’s position was specifically negotiated out of the agreement covering the sale of the claims and (4) the plaintiffs have no damages.
Experian Information Solutions, Inc. v. Lexington Allen L.P., Lexington Allen Manager LLC and Lexington Realty Trust (United States District Court for the Eastern District of Texas Sherman Division – Civil Action No. 4:10cv144)
On March 29, 2010, Experian Information Solutions, Inc., which we refer to as Experian, filed a complaint against Lexington Allen L.P., a wholly owned subsidiary of NLS, and us for breach of lease agreement, fraud/fraudulent inducement, claim under Section 91.004 of the Texas Property Code (breach of lease and ability to obtain a lien on other landlord non-exempt property), promissory estoppel, quantum meruit and Lexington Allen L.P. was our "alter-ego", in connection with the alleged failure of Lexington Allen L.P. to fund up to $5.9 million of tenant improvements. On May 5, 2010, we filed a motion to dismiss the complaint. On May 21, 2010, Experian filed an amended complaint, adding Lexington Allen Manager LLC as a defendant, and an opposition to our motion to dismiss. On June 7, 2010, we filed another motion to dismiss and on June 24, 2010, Experian filed an opposition to our motion to dismiss. Our motion to dismiss was denied and we answered the amended complaint on October 22, 2010.
On October 29, 2010, Experian filed a motion for summary judgment with respect to the breach of contract claim against Lexington Allen L.P., which has been briefed by the applicable parties. A mediation on November 5, 2010 was unsuccessful. On January 24, 2011, we filed a motion for summary judgment for all claims against us. Lexington Allen L.P. and Lexington Allen Manager LLC also filed a motion for summary judgment with respect to all claims other than the breach of contract claim. We believe, after consultation with counsel, meritorious defenses to these claims exist and intend to vigorously defend the claims against us. Discovery is scheduled to end on March 11, 2011.
31
Executive Officers of the Registrant
The following sets forth certain information relating to our executive officers:
|
Name
|
Business Experience
|
|
|
E. Robert Roskind
Age 65
|
Mr. Roskind, our Chairman since March 2008, previously served as Co-Vice Chairman from December 2006 to March 2008, Chairman from October 1993 to December 2006 and Co-Chief Executive Officer from October 1993 to January 2003. He founded The LCP Group, L.P., a real estate advisory firm, in 1973 and has been its Chairman since 1976. Mr. Roskind also serves as Chairman of Crescent Hotels and Resorts and as a member of the Board of Directors of LCP REIT Advisors, the external advisor to LCP Investment Corporation, a Japanese real estate investment trust listed on the Tokyo Stock Exchange.
|
|
|
Richard J. Rouse
Age 65
|
Mr. Rouse, our Vice Chairman since March 2008 and our Chief Investment Officer since January 2003, previously served as one of our trustees from October 1993 to May 2010, our Co-Vice Chairman from December 2006 to March 2008, our President from October 1993 to April 1996 and our Co-Chief Executive Officer from October 1993 to January 2003.
|
|
|
T. Wilson Eglin
Age 46
|
Mr. Eglin has served as our Chief Executive Officer since January 2003, our President since April 1996 and as a trustee since May 1994. He served as one of our Executive Vice Presidents from October 1993 to April 1996 and our Chief Operating Officer from October 1993 to December 31, 2010.
|
|
|
Patrick Carroll
Age 47
|
Mr. Carroll has served as our Chief Financial Officer since May 1998, our Treasurer since January 1999 and one of our Executive Vice Presidents since January 2003. Prior to joining us, Mr. Carroll was, from 1986 to 1998, in the real estate practice of Coopers & Lybrand L.L.P., a public accounting firm that was one of the predecessors of PricewaterhouseCoopers LLP.
|
|
|
Paul R. Wood
Age 50
|
Mr. Wood served as our Chief Accounting Officer from October 1993 to December 2010, and has served as one of our Vice Presidents and our Secretary since 1993 and our Chief Tax Compliance Officer since January 2011.
|
32
Market Information.
Our common shares are listed for trading on the NYSE under the symbol “LXP”. The following table sets forth the high and low sales prices as reported by the NYSE for our common shares for each of the periods indicated below:
|
For the Quarters Ended:
|
High
|
Low
|
||||||
|
December 31, 2010
|
$ | 8.96 | $ | 7.15 | ||||
|
September 30, 2010
|
7.47 | 5.39 | ||||||
|
June 30, 2010
|
7.76 | 5.30 | ||||||
|
March 31, 2010
|
7.22 | 5.17 | ||||||
|
December 31, 2009
|
6.41 | 3.96 | ||||||
|
September 30, 2009
|
5.98 | 2.81 | ||||||
|
June 30, 2009
|
5.74 | 2.22 | ||||||
|
March 31, 2009
|
6.08 | 1.93 | ||||||
The per common share closing price on the NYSE was $9.14 on February 24, 2011.
Holders.
As of February 24, 2011, we had approximately 4,025 common shareholders of record.
Dividends.
We have made quarterly distributions since October 1986 without interruption.
The common share dividends paid in each quarter for the last five years are as follows:
|
Quarters Ended
|
2010
|
2009
|
2008
|
2007
|
2006
|
|||||||||||||||
|
March 31,
|
$ | 0.10 | $ | 0.18 | $ | 2.475 | $ | 0.5975 | $ | 0.365 | ||||||||||
|
June 30,
|
$ | 0.10 | $ | 0.18 | (1) | $ | 0.33 | $ | 0.375 | $ | 0.365 | |||||||||
|
September 30,
|
$ | 0.10 | $ | 0.18 | (1) | $ | 0.33 | $ | 0.375 | $ | 0.365 | |||||||||
|
December 31,
|
$ | 0.10 | $ | 0.18 | (1) | $ | 0.33 | $ | 0.375 | $ | 0.365 | |||||||||
| __________________________ | ||||||||||||||||||||
(1) Dividend paid 90% in our common shares and 10% in cash.
During the fourth quarter of 2007, we declared a special dividend of $2.10 per common share which was paid in January 2008. During the fourth quarter 2006, we declared a special dividend of $0.2325 per common share which was paid in January 2007.
During 2009, we issued an aggregate 13,304,198 common shares in lieu of cash payments of common share dividends during the quarters ended June 30, September 30 and December 31, 2009 in accordance with IRS Rev. Proc. 2008–68.
The quarterly dividend per common share was increased to $0.115 and paid in January 2011.
While we intend to continue paying regular quarterly dividends to holders of our common shares, future dividend declarations will be at the discretion of our Board of Trustees and will depend on our actual cash flow, our financial condition, capital requirements, the annual distribution requirements under the REIT provisions of the Code and such other factors as our Board of Trustees deems relevant. The actual cash flow available to pay dividends will be affected by a number of factors, including, among others, the risks discussed under “Risk Factors” in Part I, Item 1A and “Management’s Discussion and Analysis of Financial Condition and Results of Operations” in Part II, Item 7 of this Annual Report.
We do not believe that the financial covenants contained in our loan agreements will have any adverse impact on our ability to pay dividends in the normal course of business to our common and preferred shareholders or to distribute amounts necessary to maintain our qualification as a REIT.
We maintain a direct share purchase plan, which has two components, (i) a dividend reinvestment component and (ii) a direct share purchase component. Under the dividend reinvestment component, common shareholders and holders of OP units may elect to automatically reinvest their dividends and distributions to purchase our common shares free of commissions and other charges. We currently offer a 5.0% discount on the common shares purchased under the plan. We may, from time to time, either repurchase common shares in the open market, or issue new common shares, for the purpose of fulfilling our obligations under the dividend reinvestment program. Currently all of the common shares issued under this program are new common shares issued by us. Under the direct share purchase component, our current investors and new investors can make optional cash purchases of our common shares directly from us. In 2010 and 2009, we issued approximately 1.3 million and 4.3 million common shares, respectively, under the plan, raising net proceeds of $8.6 million and $20.9 million, respectively.
33
Equity Compensation Plan Information.
The following table sets forth certain information, as of December 31, 2010, with respect to the compensation plan under which our equity securities are authorized for issuance.
|
Number of Securities
to be Issued Upon
Exercise of
Outstanding Options,
Warrants and Rights
|
Weighted-Average
Exercise Price of
Outstanding Options,
Warrants and Rights
|
Number of Securities
Remaining Available for
Future Issuance Under
Equity Compensation
Plans (Excluding
Securities Reflected in
Column (a))
|
||||||||||
|
Plan Category
|
(a)
|
(b)
|
(c)
|
|||||||||
|
Equity compensation plans approved by security holders
|
4,389,605 | $ | 6.23 | 20,158 | ||||||||
|
Equity compensation plans not approved by security holders
|
- | - | - | |||||||||
|
Total
|
4,389,605 | $ | 6.23 | 20,158 | ||||||||
Comparison of Cumulative Five Year Total Return
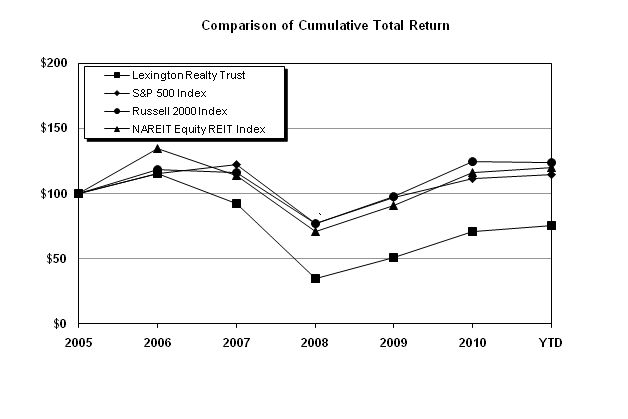
|
INDEXED RETURNS
|
|||||||||||||||||||||||
|
Base
|
Years Ending
|
||||||||||||||||||||||
|
Period
|
|||||||||||||||||||||||
|
Company / Index
|
2005
|
2006
|
2007
|
2008
|
2009
|
2010
|
|||||||||||||||||
|
Lexington Realty Trust
|
100 | 115.71 | 92.69 | 35.26 | 51.10 | 70.94 | |||||||||||||||||
|
S&P 500 Index
|
100 | 115.79 | 122.16 | 76.96 | 97.33 | 111.99 | |||||||||||||||||
|
Russell 2000 Index
|
100 | 118.37 | 116.51 | 77.15 | 98.11 | 124.46 | |||||||||||||||||
|
NAREIT Equity REIT Index
|
100 | 135.06 | 113.87 | 70.91 | 90.76 | 116.13 | |||||||||||||||||
34
Recent Sales of Unregistered Securities.
None, other than as previously disclosed in our Quarterly Reports on Form 10-Q and Current Reports on Form 8-K.
Share Repurchase Program.
The following table summarizes repurchases of our common shares/OP units during the fourth quarter of 2010 pursuant to publicly announced repurchase plans:
|
Period
|
Total Number of
Shares/Units
Purchased
|
Average Price
Paid per
Share/Unit ($)
|
Total Number of
Shares/Units
Purchased as Part of
Publicly Announced
Plans or Programs (1)
|
Maximum Number of
Shares That May Yet
Be Purchased Under
the Plans or Programs
|
||||||||||||
|
October 1 — 31, 2010
|
-- | $ | -- | -- | 1,056,731 | |||||||||||
|
November 1 — 30, 2010
|
-- | -- | -- | 1,056,731 | ||||||||||||
|
December 1 — 31, 2010
|
-- | -- | -- | 1,056,731 | ||||||||||||
|
Fourth Quarter 2010
|
-- | $ | -- | -- | 1,056,731 | |||||||||||
_________________________
(1) Share repurchase plan most recently announced on December 17, 2007.
During the year ended December 31, 2010, we repurchased $25.5 million original principal amount of our 5.45% Exchangeable Guaranteed Notes.
35
The following sets forth our selected consolidated financial data as of and for each of the years in the five-year period ended December 31, 2010. The selected consolidated financial data should be read in conjunction with the Consolidated Financial Statements and the related notes appearing elsewhere in this Annual Report. ($000’s, except per share data)
|
2010
|
2009
|
2008
|
2007
|
2006
|
||||||||||||||||
|
Total gross revenues
|
$ | 342,855 | $ | 356,316 | $ | 375,618 | $ | 378,202 | $ | 168,979 | ||||||||||
|
Expenses applicable to revenues
|
(235,262 | ) | (239,994 | ) | (279,691 | ) | (252,357 | ) | (95,084 | ) | ||||||||||
|
Interest and amortization expense
|
(123,115 | ) | (127,793 | ) | (148,119 | ) | (154,852 | ) | (57,610 | ) | ||||||||||
|
Income (loss) from continuing operations
|
(3,734 | ) | (133,394 | ) | (15,160 | ) | 3,255 | (11,283 | ) | |||||||||||
|
Total discontinued operations
|
(33,676 | ) | (77,878 | ) | 11,692 | 88,674 | 17,510 | |||||||||||||
|
Net income (loss)
|
(37,410 | ) | (211,272 | ) | (3,468 | ) | 91,929 | 6,227 | ||||||||||||
|
Net income (loss) attributable to Lexington Realty Trust
|
(32,960 | ) | (210,152 | ) | 2,754 | 75,249 | 7,753 | |||||||||||||
|
Net income (loss) attributable to common shareholders
|
(58,096 | ) | (242,876 | ) | (18,974 | ) | 47,155 | (10,424 | ) | |||||||||||
|
Loss from continuing operations per common share — basic and diluted
|
(0.25 | ) | (1.53 | ) | (0.33 | ) | (0.37 | ) | (0.57 | ) | ||||||||||
|
Income (loss) from discontinued operations — basic and diluted
|
(0.19 | ) | (0.69 | ) | 0.05 | 1.10 | 0.37 | |||||||||||||
|
Net income (loss) per common share — basic and diluted
|
(0.44 | ) | (2.22 | ) | (0.28 | ) | 0.73 | (0.20 | ) | |||||||||||
|
Cash dividends declared per common share
|
0.415 | 0.64 | 1.17 | 3.60 | 2.0575 | |||||||||||||||
|
Net cash provided by operating activities
|
164,751 | 159,307 | 230,201 | 287,651 | 108,020 | |||||||||||||||
|
Net cash provided by (used in) investing activities
|
(24,783 | ) | 111,967 | 230,128 | (31,490 | ) | (154,080 | ) | ||||||||||||
|
Net cash provided by (used in) financing activities
|
(141,189 | ) | (285,207 | ) | (804,637 | ) | 38,973 | 483 | ||||||||||||
|
Ratio of earnings to combined fixed charges and preferred dividends
|
N/A | N/A | 1.00 | N/A | N/A | |||||||||||||||
|
Real estate assets, net
|
2,762,347 | 3,015,400 | 3,294,527 | 3,729,266 | 3,475,073 | |||||||||||||||
|
Investments in and advances to non-consolidated entities
|
83,738 | 55,985 | 179,133 | 226,476 | 247,045 | |||||||||||||||
|
Total assets
|
3,334,996 | 3,579,845 | 4,105,725 | 5,264,705 | 4,624,857 | |||||||||||||||
|
Mortgages, notes payable and credit facility, including discontinued operations
|
1,778,077 | 2,072,738 | 2,372,323 | 3,028,088 | 2,132,661 | |||||||||||||||
|
Shareholders’ equity
|
1,280,156 | 1,208,669 | 1,406,075 | 960,601 | 1,122,444 | |||||||||||||||
|
Total equity
|
1,356,129 | 1,297,236 | 1,501,071 | 1,739,565 | 2,025,185 | |||||||||||||||
|
Preferred share liquidation preference
|
338,760 | 338,760 | 363,915 | 389,000 | 234,000 | |||||||||||||||
__________
N/A — Ratio is below 1.0, deficit of $44,992, $12,955, $67,414 and $10,478 exists at December 31, 2010, 2009, 2007 and 2006, respectively.
All years have also been adjusted to reflect the impact of operating properties sold during the years ended December 31, 2010, 2009, 2008, 2007 and 2006, which are reflected in discontinued operations in the Consolidated Statements of Operations.
36
In this discussion, we have included statements that may constitute “forward-looking
statements” within the meaning of the safe harbor provisions of the Private
Securities Litigation Reform Act of 1995. Forward-looking statements are not
historical facts but instead represent only our beliefs regarding future events, many
of which, by their nature, are inherently uncertain and outside our control. These
statements may relate to our future plans and objectives, among other things. By
identifying these statements for you in this manner, we are alerting you to the
possibility that our actual results may differ, possibly materially, from the
anticipated results indicated in these forward-looking statements. Important factors
that could cause our results to differ, possibly materially, from those indicated in
the forward-looking statements include, among others, those discussed above in
“Risk Factors” in Part I, Item 1A of this Annual Report and “Cautionary
Statements Concerning Forward Looking Statements” in Part I, of this Annual
Report.
|
Table of Contents
|
Page
|
|
Overview
|
37
|
|
Liquidity
|
42
|
|
Capital Resources
|
45
|
|
Results of Operations
|
46
|
|
Off-Balance Sheet Arrangements
|
48
|
|
Contractual Obligations
|
49
|
Overview
General
. We are a self-managed and self-administered real estate investment trust formed under the laws of the State of Maryland. We operate primarily in one segment and our primary business is the investment in and the acquisition, ownership and management of portfolios of net-leased office, industrial and retail properties. We conduct all of our property operations through property owner subsidiaries.
As of December 31, 2010, we had ownership interests in approximately 195 consolidated real estate properties, located in 39 states and encompassing approximately 36.9 million square feet. A majority of these properties are subject to triple net or similar leases, where the tenant bears all or substantially all of the costs and/or cost increases for real estate taxes, utilities, insurance and ordinary repairs.
Our revenues and cash flows are generated predominantly from property rent receipts. As a result, growth in revenues and cash flows is directly correlated to our ability to (1) acquire income producing real estate assets, (2) re-lease properties that are vacant, or may become vacant at favorable rental rates and (3) earn fee income.
Although there have been signs of recovery in the overall economy, our business continues to be impacted in a number of ways by the uncertainty and volatility in the capital markets, including (1) a need to preserve capital, generate additional liquidity and improve our overall financial flexibility, (2) our ability to find attractive financing, (3) difficulty in acquiring suitable property investments and (4) tenant uncertainty with respect to future space needs. In 2010, we have seen an increase from 2009 in potential investment opportunities and a slight strengthening in the availability of capital; however, it is difficult for us to predict when the economy will fully recover.
In an effort to diversify, we invest in properties leased to tenants in various industries, including finance/insurance, automotive, energy, consumer products and technology. Tenant defaults at properties in which we have an ownership interest could negatively impact our results of operations and cash flows.
Our principal sources of liquidity have been (1) undistributed cash flows generated from our investments, (2) the public and private equity and debt markets, including issuances of OP units, (3) property specific debt, (4) corporate level borrowings, (5) commitments from co-investment partners and (6) proceeds from sales of our investments. We expect that certain of these sources may be unavailable and/or disadvantageous to us at times if there is uncertainty and volatility in the capital markets.
We have consolidated property specific non-recourse debt with an aggregate of $12.9 million and $191.0 million in balloon payments that mature in 2011 and 2012, respectively. We also have (1) interest rate swap agreements and (2) a forward equity commitment on our common shares. The counterparties of these arrangements are major financial institutions; however, we are exposed to credit risk in the event of non-performance by the counterparties. In addition, we may be required to make additional prepayments pursuant to our forward equity commitment if the value of the underlying equity falls below a specific threshold. As of December 31, 2010, the forward equity commitment has an outstanding balance of $4.0 million and must be settled by October 2011 in cash, common shares, or a combination of cash and common shares at our election.
37
Business Strategy.
Our current business strategy is focused on maintaining a strong balance sheet and improving our long-term growth prospectus. See “Business” in Part I, Item 1 of this Annual Report for a detailed description of our current business strategy.
We believe a positive impact is resulting from our business strategy. In 2010 and 2009, we reduced our overall consolidated indebtedness by $300.3 million and $305.6 million, respectively, primarily by repurchasing our 5.45% Exchangeable Guaranteed Notes, and through the sale, transfer or other disposition of properties to third parties and lenders. We expect our business strategy will enable us to continue to improve our liquidity and strengthen our overall balance sheet, while we take advantage of attractive acquisition opportunities as they arise, which will create meaningful shareholder value.
Acquisition Trends
. Acquiring income producing real estate assets is one of our primary focuses. The challenge we face is finding investments that will provide an attractive return without compromising our real estate underwriting criteria. While we believe we have access to acquisition opportunities due to our relationship with developers, brokers, corporate users and sellers, our acquisition activity decreased during the last few years as a result of market conditions. When we do acquire real estate assets, we look for general purpose office and industrial real estate assets subject to a long-term net lease which have one or more of the following characteristics (1) a credit-worthy tenant, (2) adaptability to a variety of users, including multi-tenant use and (3) an attractive geographic location.
During 2009 and 2008, acquisition activity decreased as we focused on retiring senior debt and preferred securities. In response to the compression in capitalization rates, we refocused our efforts into (1) repurchasing our senior debt at what we believe were attractive and secure yields to maturity and (2) disposing of real estate assets in compliance with regulatory and contractual requirements.
Beginning in the fourth quarter of 2009, we began to see an increase in our acquisition activity. On December 31, 2009, through a property owner subsidiary, we acquired an office property in Greenville, South Carolina leased to Canal Insurance Company for $10.5 million. Canal Insurance Company has an option to purchase the property on December 31, 2014 at fair market value, but not less than $10.7 million and not greater than $11.6 million. If Canal Insurance Company fails to exercise its purchase option, the property owner has the right to require Canal Insurance Company to purchase the property for $10.7 million.
Our 2010 acquisition activity consisted primarily of build-to-suit transactions and debt investments secured by real estate assets, which we feel comfortable owning should the borrower default for reasons other than an underlying tenant default. Through property owner subsidiaries, we entered into two build-to-suit transactions during 2010. One contemplates the acquisition upon completion of construction and occupancy by the tenant, of a to-be-constructed 514,000 square foot industrial facility located in Byhalia, Mississippi for $27.5 million. In addition, one of our lender subsidiaries entered into a contract to fund the construction of a 672,000 square foot industrial facility located in Shelby, North Carolina for an estimated cost of approximately $24.0 million. One of our property owner subsidiaries intends to purchase the facility upon completion of construction and commencement of a 20-year net-lease. Completion of construction and tenant occupancy are expected to occur in the second quarter of 2011 for both transactions. These transactions are forward commitment contracts, and we can provide no assurance that these transactions will be successfully completed.
During 2010, through a lender subsidiary, we made a 15%, $16.7 million mortgage loan on an office building in Schaumburg, Illinois, which matures in January 2012 but can be extended one additional year by the borrower for a 50 basis point fee. The property is leased to Career Education Corporation from January 1, 2011 through December 31, 2022 for an average annual rent of $4.0 million. Our lender subsidiary is obligated to fund an additional $1.8 million through January 2012 upon the occurrence of certain events. If the borrower exercises the one-year extension option and certain other events occur, our lender subsidiary will become obligated to fund an additional $12.2 million for tenant improvement costs. One of our lender subsidiaries also made a $17.0 million mezzanine loan secured by a combination of limited partner interests in entities that owned, and second mortgage liens or mortgage liens against, five medical facilities. The mezzanine loan is guaranteed by a parent entity and principal and matures in December 2011 and requires payments of interest only at a rate of 14% through February 2011 and 16% thereafter. The borrower prepaid an aggregate $7.5 million in December 2010 and February 2011 in connection with the sale of certain collateral, thus $9.5 million is currently outstanding.
In December 2010, through a property owner subsidiary, we acquired a 105,000 square foot office property in Columbus, Ohio for $16.7 million. The property is subject to a 16-year net lease.
Despite the current economic uncertainty, we have seen an increase in our acquisition pipeline, mostly consisting of build-to-suit transactions. We have several commitments and letters of intent for future acquisitions as of the first quarter of 2011, and we anticipate an overall increase in our acquisition activity for 2011. However, we can provide no assurances that any of these transactions will be consummated.
38
Leasing Trends
. Re-leasing properties as leases expire and properties currently vacant at favorable effective rates is one of our primary focuses. The primary risks associated with re-tenanting properties are (1) the period of time required to find a new tenant, (2) whether rental rates will be lower than previously received, (3) the significance of leasing costs such as commissions and tenant improvement allowances and (4) the payment of capital expenditures and operating costs such as real estate taxes, insurance and maintenance while there is no offsetting revenue.
Our property owner subsidiaries try to mitigate these risks by staying in close contact with our tenants during the lease term in order to assess their current and future occupancy needs, maintaining relationships with local brokers to determine the depth of the rental market and retaining local expertise to assist in the re-tenanting of a property. However, no assurance can be given that once a property becomes vacant it will subsequently be re-let. Generally, a tenant in a single-tenant office property commences lease extension discussions well in advance of lease expiration. If the lease has a year or less remaining until expiration, there is a high likelihood that the tenant will not extend the lease.
If a property cannot be re-let to a single user and the property can be adapted to multi-tenant use, our property owner subsidiary determines whether the costs of adapting the property to multi-tenant use outweigh the benefit of funding operating costs while searching for a single-tenant.
Certain of the long-term leases on properties in which we have an ownership interest contain provisions that may mitigate the adverse impact of inflation on our operating results. Such provisions include clauses entitling our property owner subsidiaries to receive (1) scheduled fixed base rent increases and (2) base rent increases based upon the consumer price index. In addition, a majority of the leases on the properties in which we have an ownership interest require tenants to pay operating expenses, including maintenance, real estate taxes, insurance and utilities, thereby reducing the exposure to increases in costs and operating expenses. In addition, the leases on properties in which we have an ownership interest are generally structured in a way that minimizes responsibility for capital improvements.
We continue to monitor the credit of tenants of properties in which we have an interest. Under current bankruptcy law, a tenant can generally assume or reject a lease within a certain number of days of filing its bankruptcy petition. If a tenant rejects the lease, a landlord’s damages are generally limited to the greater of (1) one year’s rent and (2) the rent for 15%, not to exceed three years, of the remaining term of the lease.
During 2009, due to economic conditions, our property owner subsidiaries conveyed three properties to lenders and/or to a bankruptcy estate as a result of tenants vacating properties and there being no viable leasing prospects. Although there were no such conveyances of property to lenders during 2010, our property owner subsidiaries may convey properties to lenders or the property owner subsidiary may declare bankruptcy in the future if a property owner subsidiary is unable to refinance, re-let or sell its vacated property.
Impairment charges.
During 2010 and 2009, we incurred impairment charges, on our assets, of $56.9 million and $175.9 million, respectively, due primarily to economic conditions. Impairments on real estate assets that were eventually sold, foreclosed or are held for sale in 2010 were $50.1 million and $96.0 million in 2010 and 2009, respectively, as the assets were ultimately sold, foreclosed or are anticipated to be sold below their carrying value. The assets that were sold or that are anticipated to be sold are non-core or non-performing assets and we used the net proceeds from these sales to primarily deleverage our balance sheet. In addition, we incurred $3.0 million and $3.6 million of impairment charges on two real estate assets classified in continuing operations in 2010 and 2009, respectively. These real estate assets are non-core, retail properties acquired in the Newkirk Merger.
We recognized other-than-temporary impairments on two of our investments in non-consolidated entities in 2009 of $74.7 million. Concord experienced declines in the fair value of its loan securities consistent with liquidity concerns impacting the commercial bond and real estate markets and the overall economy. Concord recorded significant other-than-temporary impairment charges during 2009 and 2008. As a result of these charges and other factors, we recorded other-than-temporary impairments of $68.2 million on our investment in Lex-Win Concord during 2009, reducing the carrying value of our investment to zero. In addition, during 2009 we recorded an impairment charge of $6.5 million on our investment in an unconsolidated joint venture acquired in the Newkirk Merger due to the expiration of the net-lease on the hotel asset owned by the joint venture. We subsequently sold our interest in this joint venture for a nominal amount to another partner in the joint venture.
We incurred loan losses on our interest in loans receivable assets during 2010 and 2009. During 2010, we recorded a $3.8 million loan loss on a loan receivable as the tenant supporting the collateral declared bankruptcy and announced liquidation proceedings. During the first quarter of 2009, we agreed to the discounted payoffs of two loans receivable with an aggregate carrying value of $5.0 million. During 2009, we wrote the loans receivable down to the aggregate agreed upon discounted payoff amount of $3.9 million, which approximated fair value and recognized a loan loss reserve of $1.1 million. In addition, investments in debt securities were sold for $9.5 million during 2009 and we realized a loss of $0.5 million. The proceeds from these transactions were used to reduce corporate level debt.
39
Given the continued economic environment, we cannot estimate if we will incur, or the amount of, future impairment charges on our assets. See Part I, Item 1A – "Risk Factors" of this Annual Report.
Critical Accounting Policies
. Our accompanying consolidated financial statements have been prepared in conformity with accounting principles generally accepted in the United States, which require our management to make estimates that affect the amounts of revenues, expenses, assets and liabilities reported. A summary of our significant accounting policies which are important to the portrayal of our financial condition and results of operations is set forth in note 2 to the Consolidated Financial Statements beginning on page 62 of this Annual Report and incorporated herein.
The following is a summary of our critical accounting policies, which require some of management’s most difficult, subjective and complex judgments.
Basis of Presentation and Consolidation
. Our consolidated financial statements are prepared on the accrual basis of accounting. The financial statements reflect our accounts and the accounts of our consolidated subsidiaries. We consolidate our wholly-owned subsidiaries, partnerships and joint ventures which we control through (i) voting rights or similar rights or (ii) by means other than voting rights if we are the primary beneficiary of a variable interest entity, which we refer to as a VIE. Entities which we do not control and entities which are VIE's in which we are not the primary beneficiary are generally accounted for by the equity method. Significant judgments and assumptions are made by us to determine whether an entity is a VIE such as those regarding an entity’s equity at risk, the entity’s equity holder’s obligation to absorb anticipated losses and other factors. In addition, the determination of the primary beneficiary of a VIE requires judgments and assumptions to determine the party that has (i) power over the significant activities of the VIE and (ii) an obligation to absorb losses or the right to receive benefits that could be potentially significant to the VIE.
Judgments and Estimates
. Our management has made a number of estimates and assumptions relating to the reporting of assets and liabilities, the disclosure of contingent assets and liabilities and the reported amounts of revenues and expenses to prepare these consolidated financial statements in conformity with GAAP. These estimates and assumptions are based on our management’s best estimates and judgment. Our management evaluates its estimates and assumptions on an ongoing basis using historical experience and other factors, including the current economic environment. The current economic environment has increased the degree of uncertainty inherent in these estimates and assumptions. Our management adjusts such estimates when facts and circumstances dictate. The most significant estimates made include the recoverability of accounts receivable, allocation of property purchase price to tangible and intangible assets acquired and liabilities assumed, the determination of VIEs and entities that should be consolidated, the determination of impairment of long-lived assets, loans receivable and equity method investments, valuation and impairment of assets held by equity method investees, valuation of derivative financial instruments and the useful lives of long-lived assets.
Purchase Accounting and Acquisition of Real Estate
.
The fair value of the real estate acquired, which includes the impact of fair value adjustments for assumed mortgage debt related to property acquisitions, is allocated to the acquired tangible assets, consisting of land, building and improvements and identified intangible assets and liabilities, consisting of the value of above-market and below-market leases, other value of in-place leases and value of tenant relationships, based in each case on their fair values.
The fair value of the tangible assets of an acquired property (which includes land, building and improvements and fixtures and equipment) is determined by valuing the property as if it were vacant, and the “as-if-vacant” value is then allocated to land and building and improvements based on our management’s determination of relative fair values of these assets. Factors considered by our management in performing these analyses include an estimate of carrying costs during the expected lease-up periods considering current market conditions and costs to execute similar leases. In estimating carrying costs, our management includes real estate taxes, insurance and other operating expenses and estimates of lost rental revenue during the expected lease-up periods based on current market demand. Our management also estimates costs to execute similar leases including leasing commissions.
In allocating the fair value of the identified intangible assets and liabilities of an acquired property, above-market and below-market lease values are recorded based on the difference between the current in-place lease rent and management’s estimate of current market rents. Below-market lease intangibles are recorded as part of deferred revenue and amortized into rental revenue over the non-cancelable periods and bargain renewal periods of the respective leases. Above-market leases are recorded as part of intangible assets and amortized as a direct charge against rental revenue over the non-cancelable portion of the respective leases.
40
The aggregate value of other acquired intangible assets, consisting of in-place leases and tenant relationship values, is measured by the excess of (1) the purchase price paid for a property over (2) the estimated fair value of the property as if vacant, determined as set forth above. This aggregate value is allocated between in-place lease values and tenant relationship values based on management’s evaluation of the specific characteristics of each tenant’s lease. The value of in-place leases are amortized to expense over the remaining non-cancelable periods and any bargain renewal periods of the respective leases. The value of tenant relationships is amortized to expense over the applicable lease term plus expected renewal periods.
Revenue Recognition
.
We recognize lease revenue on a straight-line basis over the term of the lease unless another systematic and rational basis is more representative of the time pattern in which the use benefit is derived from the leased property. Renewal options in leases with rental terms that are lower than those in the primary term are excluded from the calculation of straight line rent if the renewals are not reasonably assured. In those instances in which we fund tenant improvements and the improvements are deemed to be owned by us, revenue recognition will commence when the improvements are substantially completed and possession or control of the space is turned over to the tenant. When we determine that the tenant allowances are lease incentives, we commence revenue recognition when possession or control of the space is turned over to the tenant for tenant work to begin. The lease incentive is recorded as a deferred expense and amortized as a reduction of revenue on a straight-line basis over the respective lease term. Determining if a tenant allowance is a lease incentive requires significant judgment. We recognize lease termination payments as a component of rental revenue in the period received, provided that there are no further obligations under the lease; otherwise the lease termination payment is amortized on a straight-line basis over the remaining obligation period. All above-market lease assets, below-market lease liabilities and deferred rent assets or liabilities for terminated leases are charged against or credited to rental revenue in the period the lease is terminated. All other capitalized lease costs and lease intangibles are accelerated via amortization expense to the date of termination.
Gains on sales of real estate are recognized based on the specific timing of the sale as measured against various criteria related to the terms of the transactions and any continuing involvement associated with the properties. If the sales criteria are not met, the gain is deferred and the finance, installment or cost recovery method, as appropriate, is applied until the sales criteria are met. To the extent we sell a property and retain a partial ownership interest in the property, we recognize gain to the extent of the third-party ownership interest.
Accounts Receivable
. We continuously monitor collections from our tenants and would make a provision for estimated losses based upon historical experience and any specific tenant collection issues that we have identified.
Impairment of Real Estate
.
We evaluate the carrying value of all tangible and intangible real estate assets for possible impairment when an event or change in circumstance has occurred that indicates its carrying value may not be recoverable. The evaluation includes estimating and reviewing anticipated future undiscounted cash flows to be derived from the asset. If such cash flows are less than the asset’s carrying value, an impairment charge is recognized to the extent by which the asset’s carrying value exceeds the estimated fair value. Estimating future cash flows is highly subjective and such estimates could differ materially from actual results.
Impairment of Equity Method Investments
.
We assess whether there are indicators that the value of our equity method investments may be impaired. An investment’s value is impaired if we determine that a decline in the value of the investment below its carrying value is other-than-temporary. The assessment of impairment is highly subjective and involves the application of significant assumptions and judgments about our intent and ability to recover our investment given the nature and operations of the underlying investment, including the level of our involvement therein, among other factors. To the extent impairment has occurred, the loss is measured as the excess of the carrying amount of the investment over the estimated value of the investment.
Loans Receivable.
We evaluate the collectability of both interest and principal of each of our loans, if circumstances warrant, to determine whether the loan is impaired. A loan is considered to be impaired, when based on current information and events, it is probable that we will be unable to collect all amounts due according to the existing contractual terms. Significant judgments are required in determining whether impairment has occurred. When a loan is considered to be impaired, the amount of the loss accrual is calculated by comparing the recorded investment to the value determined by discounting the expected future cash flows at the loan’s effective interest rate, the loan's observable current market price or the fair value of the underlying collateral. Interest on impaired loans is recognized on a cash basis.
41
Fair Value Measurements.
We follow the guidance in FASB Accounting Standards Codification, which we refer to as ASC, Topic 820, Fair Value Measurements and Disclosures, which we refer to as Topic 820, to determine the fair value of financial and non-financial investments. Topic 820 defines fair value, establishes a framework for measuring fair value in GAAP and expands disclosures about fair value measurements. Topic 820 establishes a fair value hierarchy that prioritizes observable and unobservable inputs used to measure fair value into three levels: Level 1 – quoted prices (unadjusted) in active markets that are accessible at the measurement date for assets or liabilities; Level 2 – observable prices that are based on inputs not quoted in active markets, but corroborated by market data; and Level 3 – unobservable inputs that are used when little or no market data is available. The fair value hierarchy gives the highest priority to Level 1 inputs and the lowest priority to Level 3 inputs. In determining fair value, we utilize valuation techniques that maximize the use of observable inputs and minimize the use of unobservable inputs to the extent possible as well as consider counterparty credit risk, where applicable, in our assessment of fair value.
The accounting for these critical accounting policies and implementation of accounting guidance issued in the future involves the making of estimates based on current facts, circumstances and assumptions which could change in a manner that would materially affect management’s future estimates with respect to such matters. Accordingly, future reported financial conditions and results could differ materially from financial conditions and results reported based on management’s current estimates.
Liquidity
General.
Since becoming a public company, our principal sources of liquidity have been (1) undistributed cash flows generated from our investments, (2) the public and private equity and debt markets, including issuances of OP units, (3) property specific debt, (4) corporate level borrowings, (5) commitments from co-investment partners and (6) proceeds from the sales of our investments.
Our ability to incur additional debt to fund acquisitions is dependent upon our existing leverage, the value of the assets we are attempting to leverage and general economic and credit market conditions, which may be outside of management’s control or influence.
Cash Flows
. We believe that cash flows from operations will continue to provide adequate capital to fund our operating and administrative expenses, regular debt service obligations and all dividend payments in accordance with REIT requirements in both the short-term and long-term. In addition, we anticipate that cash on hand, borrowings under our secured revolving credit facility, issuances of equity and debt and co-investment programs, as well as other alternatives, will be available to provide the necessary capital required by us.
Cash flows from operations as reported in the Consolidated Statements of Cash Flows totaled $164.8 million for 2010, $159.3 million for 2009 and $230.2 million for 2008. The underlying drivers that impact working capital and therefore cash flows from operations are the timing of collection of rents and tenant reimbursements, loan interest payments from borrowers, the collection of advisory fees, payment of interest on mortgage debt and payment of operating and general and administrative costs. We believe the net-lease structure of the majority of the leases encumbering properties in which we have an interest enhances cash flows from operations since the payment and timing of operating costs related to the properties are generally borne directly by the tenant. Collection and timing of tenant rents is closely monitored by management as part of our cash management program.
Net cash provided by (used in) investing activities totaled $(24.8) million in 2010, $112.0 million in 2009 and $230.1 million in 2008. Cash provided by investing activities related primarily to proceeds from the sale of properties, collection of loans receivable, distributions from non-consolidated entities in excess of accumulated earnings, proceeds from the sale of marketable equity and debt securities and changes in escrow deposits and restricted cash. Cash used in investing activities related primarily to investments in real estate properties, co-investment programs, loans receivable, an increase in deferred leasing costs and the purchase of noncontrolling interests. Therefore, the fluctuation in investing activities relates primarily to the timing of investments and dispositions.
Net cash used in financing activities totaled $141.2 million in 2010, $285.2 million in 2009 and $804.6 million in 2008. Cash provided by financing activities during each year was primarily attributable to proceeds from equity offerings, contributions from noncontrolling interests, non-recourse mortgages and corporate borrowings offset by dividend and distribution payments, net, repurchases of equity interests, forward equity commitment payments, net, an increase in deferred financing costs and debt payments and repurchases.
Public and Private Equity and Debt Markets
. We access the public and private equity and debt markets when we believe conditions are favorable and we have a compelling use of proceeds. During 2010, we issued approximated 22.4 million common shares raising net proceeds of approximately $157.8 million in two public common share offerings. During 2010 and 2009, we issued approximately 1.3 million and 4.3 million common shares under our direct share purchase plan raising net proceeds of approximately $8.6 million and $20.9 million, respectively. We primarily used these proceeds to retire indebtedness.
42
During 2007, we issued $200.0 million in Trust Preferred Securities, which bear interest at a fixed rate of 6.804% through April 2017 and thereafter at a variable rate of three month LIBOR plus 170 basis points through maturity. These securities are (1) classified as debt, (2) due in 2037 and (3) redeemable by us commencing April 2012. During 2008, we repurchased, through unsolicited offers, $70.9 million of these securities for $44.6 million in cash, which resulted in a gain on debt extinguishment of $24.7 million including a write off of $1.6 million in deferred financing costs.
During 2007, we issued an aggregate $450.0 million of 5.45% Exchangeable Guaranteed Notes due in 2027. These notes can be put to us commencing in 2012 and every five years thereafter through maturity. We may not redeem any notes prior to January 2012, except to preserve our REIT status. Thereafter, we may redeem the notes for cash equal to 100% of the principal of the notes to be redeemed, plus any accrued and unpaid interest. The notes are currently exchangeable by the holders into common shares at a price of $19.49 per share, subject to adjustment upon certain events, including increases in our dividend rate above a certain threshold. Upon exchange, the holders of the notes would receive (1) cash equal to the principal amount of the note and (2) to the extent the exchange value exceeds the principal amount of the note, either cash or common shares at our option. Since 2008, we repurchased $387.9 million original principal amount of the notes for $296.0 million in cash and 1.6 million common shares having a value at issuance of $23.5 million (or $14.50 per share).
During the first quarter of 2010, we issued $115.0 million aggregate principal amount of 6.00% Convertible Guaranteed Notes. The notes pay interest semi-annually in arrears and mature in January 2030. The holders of the notes may require us to repurchase their notes in January 2017, January 2020 and January 2025 for cash equal to 100% of the notes to be repurchased, plus any accrued and unpaid interest. We may not redeem any notes prior to January 2017, except to preserve our REIT status. Thereafter, we may redeem the notes for cash equal to 100% of the principal of the notes to be redeemed, plus any accrued and unpaid interest. The notes have a current conversion rate of 141.1383 common shares per $1,000 principal amount of the notes, representing a conversion price of approximately $7.09 per common share. The conversion rate is subject to adjustment under certain circumstances. The notes are convertible by the holders under certain circumstances for cash, common shares or a combination of cash and common shares at our election.
During 2008, we (1) repurchased 1.2 million common shares at an average price of $14.28 per share and (2) repurchased and retired 501,700 shares of our Series C Preferred Shares by issuing 0.7 million common shares and paying $7.5 million in cash. The difference between the cost to retire these Series C Preferred Shares and their historical cost was $5.7 million and is treated as an increase to shareholders equity and as a reduction in preferred dividends paid for calculating earnings per share. During 2009, we converted 503,100 shares of our Series C Preferred shares by issuing 3.0 million common shares. The difference between the fair value of the common shares issued pursuant to the original conversion terms of $7.0 million is considered a deemed dividend and as such is recorded as a reduction in shareholders’ equity and as an increase to preferred dividends paid for calculating earnings per share. During 2008, we also entered into a forward equity commitment to purchase 3.5 million of our common shares at a price of $5.60 per share, which must be settled by October 2011. We have prepaid $15.6 million of the $19.6 million purchase price as of December 31, 2010, agreed to make floating payments during the term of the forward purchase at LIBOR plus 250 basis points per annum and we retain all cash dividend payments.
We may access these markets in the future to implement our business strategy including capital to fund future growth.
UPREIT Structure.
Our UPREIT structure permits us to effect acquisitions by issuing OP units to a property owner as a form of consideration in exchange for the property. Substantially all outstanding OP units are redeemable by the holder at certain times on a one OP unit for approximately 1.13 common shares or, at our election, with respect to certain OP units, cash. Substantially all outstanding OP units require us to pay quarterly distributions to the holders of such OP units equal to the dividends paid to our common shareholders on an as redeemed basis and the remaining OP units have stated distributions in accordance with their respective partnership agreement. To the extent that our dividend per share is less than a stated distribution per unit per the applicable partnership agreement, the stated distributions per unit are reduced by the percentage reduction in our dividend. We are party to a funding agreement with our operating partnerships under which we may be required to fund distributions made on account of OP units. No OP units have a liquidation preference. The number of common shares that will be outstanding in the future should be expected to increase, and income (loss) attributable to noncontrolling interests should be expected to decrease (increase), as such OP units are redeemed for our common shares.
On December 31, 2008, the MLP merged with and into us and 6.4 million OP units were exchanged into an equal number of common shares. On December 31, 2010, Net 3 Acquisitions L.P. was merged with and into us. As of December 31, 2010, there were 4.4 million OP units outstanding. Of the total OP units outstanding, approximately 1.5 million are held by related parties.
43
Property Specific Debt
. We generally finance our business with property specific, non-recourse mortgage debt as well as corporate level debt. As of December 31, 2010, our property owner subsidiaries have balloon payments of $12.9 million and $191.0 million of property specific, non-recourse mortgage debt maturing during 2011 and 2012, respectively. We believe our property owner subsidiaries have sufficient sources of liquidity to meet these obligations through future cash flow from operations, the credit markets and, if determined appropriate by us, a capital contribution from us from either cash on hand ($52.6 million at December 31, 2010) or borrowing capacity on our secured revolving credit facility (currently $295.9 million), which expires in 2014, but can be extended by us to 2015.
The mortgages encumbering the properties in which we have an interest are generally non-recourse to us and the property owner subsidiaries, such that the property owner subsidiary may, if appropriate, satisfy a mortgage obligation by transferring title of the property to the lender or permitting a lender to foreclose.
We expect to continue to use property specific, non-recourse mortgages as we believe that by properly matching a debt obligation, including the balloon maturity risk, with a lease expiration, our cash-on-cash returns increase and the exposure to residual valuation risk is reduced. However, the current economic environment has impacted the ability of our property owner subsidiaries to obtain property specific debt on favorable terms.
During 2010, (1) one of our property owner subsidiaries obtained an $11.3 million, 3.56% fully amortizing, approximate nine-year, non-recourse mortgage loan on its North Berwick, Maine property and (2) another one of our property owner subsidiaries obtained a $9.0 million, 5.5% interest only, non-recourse mortgage loan on its Greenville South Carolina property, which matures in January 2015. In addition, one of our property owner subsidiaries obtained a $37.0 million non-recourse mortgage loan on its Salt Lake City, Utah property. The property was subsequently sold, and the loan was assumed by the buyer.
In August 2009, one of our property owner subsidiaries refinanced a $13.2 million, 8.19% non-recourse mortgage loan on a property in Fishers, Indiana which was scheduled to mature in April 2010, with an $11.5 million, 6.375% non-recourse mortgage loan which matures in August 2014.
During the first quarter of 2009, one of our property owner subsidiaries suspended debt service payments on the mortgage encumbering its property leased to Circuit City Stores, Inc. in Richmond, Virginia following the lease being rejected in the tenant's bankruptcy and subsequent vacancy. The non-recourse loan had a balance of $15.5 million at that time. The property was conveyed to the lender in a foreclosure sale during the third quarter of 2009.
In the third quarter of 2009, one of our property owner subsidiaries suspended debt service payments on a vacant property in Plymouth, Michigan which had an outstanding mortgage balance of $4.3 million. The property was conveyed through a foreclosure sale to the lender in December 2009. In addition, one of our property owner subsidiaries did not make an $18.2 million balloon payment on a property in Houston, Texas which was due in October 2009. The property owner subsidiary declared bankruptcy in December 2009 and the property and related debt were assumed by the bankruptcy estate.
Corporate Borrowings
. We also use corporate level borrowings, such as our secured revolving credit facility and secured term loans, to finance our investments and operations.
On January 28, 2011, we refinanced our secured credit facility with KeyBank, as agent, with a $300.0 million secured revolving credit facility. The new facility bears interest at 2.50% plus LIBOR if our leverage ratio, as defined, is less than 50%, 2.85% plus LIBOR if our leverage ratio is between 50% and 60% and 3.10% plus LIBOR if our leverage ratio exceeds 60%. The new facility matures in January 2014, but can be extended to January 2015 at our option. With the consent of the lenders, we can increase the size of the secured revolving loan by $225.0 million, for a total facility size of $525.0 million by adding properties to the borrowing base or admitting additional lenders. The revolving credit facility is secured by ownership interest pledges and guarantees by certain of our subsidiaries that in the aggregate own interests in a borrowing base consisting of 79 properties as of the date of filing this Annual Report. No amounts are outstanding as of the date of filing of this Annual Report and we were in compliance with the financial covenants contained in the loan agreement.
In March 2008, we obtained $25.0 million and $45.0 million secured term loans from KeyBank. The loans are interest only at LIBOR plus 60 basis points, however we entered into an interest rate swap agreement which fixed the interest rate at 5.52%, and mature in 2013. The net proceeds of the loans of $68.0 million were used to partially repay indebtedness on three cross-collateralized mortgages. After such repayment, the amount owed on the three mortgages was $103.5 million, the three loans were combined into one loan, which is interest only instead of having a portion as self-amortizing and matures in September 2014. As of December 31, 2010, $25.0 million and $35.6 million was outstanding on each secured term loan and we were in compliance with the financial covenants contained in each loan document.
44
Co-investment Programs
. We believe that entering into co-investment programs and joint ventures with institutional investors and other real estate companies is a good way to access private capital while mitigating our risk in certain assets and increasing our return on equity to the extent we earn management or other fees. However, investments in co-investment programs and joint ventures limit our ability to make investment decisions unilaterally relating to the assets and limit our ability to deploy capital.
Capital Recycling.
We attempt to effectively manage our balance sheet in order to accretively reduce leverage through management of tenant leases, maintaining occupancy, pursuing and executing well on property dispositions, recycling of capital and accessing the capital markets when opportunities arise. During 2010, we (i) issued $115.0 million of 6.00% Convertible Guaranteed Notes, which generated $111.3 million of net proceeds, (ii) raised $157.8 million in two public common share offerings, (iii) monetized 13 properties for a gross price of $158.1 million, (iv) raised $8.6 million from sales of common shares under our direct share purchase plan and (v) raised $59.8 million before closing costs, by financing six properties. These proceeds were used to retire indebtedness encumbering properties in which we have an interest and corporate level debt. As of the date of filing of this Annual Report, we have approximately $295.9 million of borrowing capacity under our secured revolving credit facility. Also, we have a $225.0 million accordion feature in our secured revolving credit facility. This feature can be exercised by providing additional properties as collateral for the borrowing base or by admitting additional lenders. However, the approval of the lenders is required for this feature to be exercised.
Liquidity Needs
. Our principal liquidity needs are the contractual obligations set forth under the heading “Contractual Obligations,” below, and the payment of dividends to our shareholders and distributions to the holders of OP units.
As of December 31, 2010, we and our property owner subsidiaries, in the aggregate, had approximately $1.8 billion of indebtedness, consisting of mortgages and notes payable outstanding, 6.00% Convertible Guaranteed Notes, 5.45% Exchangeable Guaranteed Notes and Trust Preferred Securities, with a weighted-average interest rate of approximately 5.8%. The ability of a property owner subsidiary to make debt service payments depends upon the rental revenues of its property and its ability to refinance the mortgage related thereto, sell the related property, or access capital from us or other sources. A property owner subsidiary’s ability to accomplish such goals will be affected by numerous economic factors affecting the real estate industry, including the availability and cost of mortgage debt at the time, its equity in the mortgaged property, the financial condition and the operating history of the mortgaged property, the then current tax laws and the general national, regional and local economic conditions.
If we are unable to satisfy our contractual obligations and other operating costs with our cash flow from operations, we intend to use borrowings under our secured revolving credit facility and proceeds from issuances of equity or debt securities. If a property owner subsidiary is unable to satisfy its contractual obligations and other operating costs, it may default on its obligations and lose its assets in foreclosure or through bankruptcy proceedings.
We elected to be taxed as a REIT under Sections 856 through 860 of the Code, commencing with our taxable year ended December 31, 1993. If we qualify for taxation as a REIT, we generally will not be subject to federal corporate income taxes on our net taxable income that is currently distributed to shareholders.
In connection with our intention to continue to qualify as a REIT for federal income tax purposes, we expect to continue paying regular dividends to our shareholders. These dividends are expected to be paid from operating cash flows and/or from other sources. Since cash used to pay dividends reduces amounts available for capital investments, we generally intend to maintain a conservative dividend payout ratio or we may issue common shares in lieu of cash dividends if permitted under the Code, reserving such amounts as we consider necessary for the maintenance or expansion of properties in our portfolio, debt reduction, the acquisition of interests in new properties as suitable opportunities arise, and such other factors as our Board of Trustees considers appropriate.
We paid approximately $77.3 million in cash dividends to our common and preferred shareholders in 2010. Although our property owner subsidiaries receive the majority of our base rental payments on a monthly basis, we intend to continue paying dividends quarterly. Amounts accumulated in advance of each quarterly distribution are invested by us in short-term money market or other suitable instruments.
Capital Resources
General
. Due to the net-lease structure, our property owner subsidiaries historically have not incurred significant expenditures in the ordinary course of business to maintain the properties in which we have an interest. However, particularly since 2008, as leases have expired, our property owner subsidiaries have incurred costs in extending the existing tenant leases, re-tenanting the properties with a single-tenant, or converting the property to multi-tenant use. The amounts of these expenditures can vary significantly depending on tenant negotiations, market conditions and rental rates.
45
Single-Tenant Properties.
We do not anticipate significant capital expenditures at the properties in which we have an interest that are subject to net leases since the tenants at these properties generally bear all or substantially all of the cost of property operations, maintenance and repairs. However, at certain properties subject to net leases, the property owner subsidiaries are responsible for replacement and/or repair of certain capital items. At certain single-tenant properties that are not subject to a net lease, the property owner subsidiaries have a level of property operating expense responsibility.
Multi-Tenant Properties
. Primarily as a result of non-renewals at single-tenant net-lease properties, we have interests in multi-tenant properties in our consolidated portfolio. While tenants are generally responsible for increases over base year expenses, the property owner subsidiaries are responsible for the base-year expenses and capital expenditures at these properties.
Vacant Properties
. To the extent there is a vacancy in a property, the property owner subsidiary would be obligated for all operating expenses, including real estate taxes and insurance. If a property is vacant for an extended period of time, the property owner subsidiary may incur substantial capital expenditure costs to re-tenant the property.
Property Expansions
. Under certain leases, tenants have the right to expand the facility located on a property in which we have an interest. In the past the property owner subsidiary has generally funded, and in the future the property owner subsidiary intends to generally fund, these property expansions with additional secured borrowings, the repayment of which was, and will be, funded out of rental increases under the leases covering the expanded properties.
Ground Leases
. The tenants of properties in which we have an interest generally pay the rental obligations on ground leases either directly to the fee holder or to the property owner subsidiary as increased rent. However, the property owner subsidiaries are responsible for these payments under certain leases and at vacant properties.
Environmental Matters.
Based upon management’s ongoing review of the properties in which we have an interest, management is not aware of any environmental condition with respect to any of these properties, which would be reasonably likely to have a material adverse effect on us. There can be no assurance, however, that (1) the discovery of environmental conditions, which were previously unknown, (2) changes in law, (3) the conduct of tenants or (4) activities relating to properties in the vicinity of the properties in which we have an interest, will not expose us to material liability in the future. Changes in laws increasing the potential liability for environmental conditions existing on properties or increasing the restrictions on discharges or other conditions may result in significant unanticipated expenditures or may otherwise adversely affect the operations of the tenants of properties in which we have an interest, which would adversely affect our financial condition and results of operations.
Results of Operations
Year ended December 31, 2010 compared with December 31,
2009.
The decrease in total gross revenues in 2010 of $13.5 million is attributable to a $7.8 million decrease in rental revenue and a $5.0 million decrease in tenant reimbursements due to an increase in vacancy in certain properties during the year ended December 31, 2010 and a decrease of $0.7 million in advisory and incentive fees.
The decrease in interest and amortization expense of $4.7 million is due primarily to a decrease in indebtedness.
The decrease in property operating expense of $3.1 million is primarily due to a decrease in the operating expenses at certain multi-tenant properties, which had an increase in vacancy resulting in lower costs, and certain tenants taking direct responsibility for payments of operating costs in which our property owner subsidiaries have an interest.
The decrease in depreciation and amortization of $1.6 million is due primarily to the full amortization of lease intangibles. Intangible assets are amortized over a shorter period of time (generally the lease term) than real estate assets.
The decrease in general and administrative expenses of $0.9 million is due primarily to a reduction in professional and service fees, reduced spending on technology and reduced corporate depreciation, offset by higher personnel costs due primarily to the accelerated amortization of common share option costs.
Non-operating income increased $3.8 million due primarily to interest earned on investments made during 2010 and the fourth quarter of 2009.
Debt satisfaction gains, net decreased $16.8 million primarily due to gains recognized on the retirement of our 5.45% Exchangeable Guaranteed Notes during 2009.
46
The change in value of forward equity commitment represents primarily the change in value of our common share price.
The change in impairment charges and loan losses was $1.7 million. During 2010, a lender subsidiary recognized a loan loss of $3.8 million on a loan receivable as the tenant supporting the collateral declared bankruptcy and announced liquidation proceeds. In addition, a property owner subsidiary recognized a $3.0 million impairment charge in 2010 on a property due to operational considerations with respect to the property and we recognized a $0.1 million other-than-temporary impairment on a bond investment. In 2009 a property owner subsidiary recognized a $3.6 million impairment on a non-core retail property and we, and a lender subsidiary, recognized $1.6 million of loan losses in the aggregate on two loans receivable and a debt security investment.
The equity in earnings (losses) of non-consolidated entities was earnings of $21.7 million in 2010 compared to a loss of $(123.2) million in 2009. The reason for the fluctuation between periods is primarily due to a loss recognized on our investment in Lex-Win Concord in 2009 of $135.1 million.
Net loss decreased by $173.9 million primarily due to the impact of items discussed above and a decrease of $44.2 million in loss from discontinued operations.
In 2010, 15 properties were sold or classified as held for sale, compared to 18 properties sold, transferred to lenders or otherwise disposed of in 2009. The total discontinued operations, which represents properties sold or held for sale, decreased $44.2 million due to a decrease in loss from discontinued operations of $1.3 million, an increase in gains on sale of properties of $5.5 million, and a decrease in impairment charges of $45.9 million, offset by a decrease in debt satisfaction gains, net of $8.5 million.
Net loss attributable to noncontrolling interests increased $3.3 million primarily due to an increase in impairment charges incurred on noncontrolling interest properties.
Net loss attributable to common shareholders in 2010 was $58.1 million compared to $242.9 million in 2009. The decrease in net loss is due to the items discussed above plus a reduction in Series C Preferred Share dividends of $0.4 million and a conversion dividend of $7.0 million in 2009 due to the repurchase of certain of our Series C Preferred Shares.
The increase in net income in future periods will be closely tied to the level of acquisitions made by us. Without acquisitions, the sources of growth in net income are limited to index adjusted rents (such as the consumer price index), reduced interest expense on amortizing mortgages and variable rate indebtedness and by controlling other variable overhead costs. However, there are many factors beyond management’s control that could offset these items including, without limitation, increased interest rates and tenant monetary defaults and the other risks described in this Annual Report.
Year ended December 31, 2009 compared with December 31, 2008.
Of the decrease in total gross revenues in 2009 of $19.3 million, $20.0 million is attributable to rental revenue, offset by an increase in tenant reimbursements of $0.3 million and an increase in advisory and incentive fees of $0.4 million. The decrease in rental revenue is primarily due to revenue recognized in connection with a lease termination in 2008, the sale of properties to NLS in 2008 and an increase in vacancy.
The decrease in interest and amortization expense of $20.3 million is due to the decrease in indebtedness.
The increase in property operating expense of $6.9 million is primarily due to an increase in the number of properties for which our property owner subsidiaries have operating expense responsibility and an increase in vacancies.
The decrease in depreciation and amortization of $46.6 million is due primarily to the full amortization of lease intangibles and tenant improvements in 2008. Intangible assets are amortized over a shorter period of time (generally the lease term) than real estate assets.
The decrease in general and administrative expenses of $6.9 million is due primarily to a reduction in personnel costs and professional fees.
Non-operating income decreased $16.2 million which is primarily attributable to $16.0 million of income recognized with the acquisition of land as part of a tenant's lease surrender obligation during 2008.
Debt satisfaction gains, net decreased $42.7 million due to the retirement of $70.9 million original principal amount of Trust Preferred Securities in 2008 and by the volume, timing and pricing of the repurchase of our 5.45% Exchangeable Guaranteed Notes.
47
The increase in the change in value of our forward equity commitment of $9.3 million was primarily a reflection of the increase in our common share price.
The impairment charges and loan losses of $5.2 million consist of a $3.6 million impairment charge on a non-core retail property and $1.6 million of loan losses on two loans receivable and a debt security investment that were sold.
The decrease in gains on sale—affiliates relates to the sale of properties to NLS.
The increase in losses of non-consolidated entities of $79.9 million is primarily due to impairment losses recognized on our investment in Lex-Win Concord.
Net loss increased by $207.8 million primarily due to the net impact of items discussed above coupled with an increase of $89.6 million in loss from discontinued operations.
Discontinued operations represents properties sold or held for sale. In 2009, 18 properties were sold, transferred to lenders or otherwise disposed of. In 2008, 42 properties were sold and/or foreclosed and classified as held for sale. The total discontinued operations loss increased $89.6 million due to an increase in impairment charges of $79.5 million, a decrease in gains on sales of properties of $4.0 million and an increase in loss from discontinued operations of $14.9 million offset by a decrease in provision for income taxes of $0.5 million and an increase in debt satisfaction gains, net of $8.4 million.
Net loss attributable to noncontrolling interests decreased $5.1 million primarily due to the merger of the MLP with and into us on December 31, 2008.
Net loss attributable to common shareholders in 2009 increased $223.9 million due to the items discussed above and an increase in preferred dividends of $11.0 million primarily due to the conversion of certain of our Series C Preferred Shares in 2009 and redemption of certain of our Series C Preferred Shares in 2008.
Off-Balance Sheet Arrangements
General.
As of December 31, 2010, we had investments in various real estate entities with varying structures. The real estate investments owned by these entities are financed with non-recourse debt. Non-recourse debt is generally defined as debt whereby the lenders’ sole recourse with respect to borrower defaults is limited to the value of the property collateralized by the mortgage. The lender generally does not have recourse against any other assets owned by the borrower or any of the members or partners of the borrower, except for certain specified exceptions listed in the particular loan documents. These exceptions generally relate to limited circumstances including breaches of material representations.
Net Lease Strategic Assets Fund L.P
. NLS is a co-investment program with Inland NLS. NLS was established to acquire single-tenant net-lease specialty real estate in the United States. Other than the acquisition of the initial 43 properties and a 40% tenant-in-common interest in a property from us in 2007 and 2008, NLS has not acquired any additional properties.
Inland NLS and we are currently entitled to a return on/of each of our respective investments as follows: (1) Inland NLS, 9% on its common equity ($220.6 million in common equity), (2) us, 6.5% on our preferred equity ($162.5 million in preferred equity), (3) us, 9% on our common equity ($38.9 million in common equity), (4) return of our preferred equity ($162.5 million in preferred equity), (5) return of Inland NLS common equity ($220.6 million in common equity), (6) return of our common equity ($38.9 million in common equity) and (7) any remaining cash flow is allocated 65% to Inland NLS and 35% to us as long as we are the general partner, if not, allocations are 85% to Inland NLS and 15% to us.
LRA has entered into a management agreement with NLS whereby LRA performs asset management services and will receive (1) a management fee of 0.375% of the equity capital, as defined, (2) a property management fee of up to 3.0% of actual gross revenues from certain assets for which the landlord is obligated to provide property management services (contingent upon the recoverability of such fees from the tenant under the applicable lease), and (3) an acquisition fee of 0.5% of the gross purchase price of each acquired asset by NLS.
Concord Debt Holdings LLC and CDH CDO LLC
. We currently have interests in two co-investment programs, to acquire and originate loans secured, directly and indirectly, by real estate assets, which we refer to collectively as Concord. Concord’s business has been to acquire and originate loan assets and loan securities collateralized by real estate assets including mortgage loans, subordinate interests in whole loans, mezzanine loans, preferred equity and commercial real estate securities. Concord sought to finance its loan assets and loan securities through various structures including repurchase facilities, credit lines, term loans and securitizations and, in this regard, Concord formed CDO-1, pursuant to which it financed approximately $464.7 million of its loan assets and loan securities. Concord has also sought additional capital through sales of preferred equity in Concord.
48
Concord initially sought to produce a stable income stream from its investments in loan assets and loan securities by managing credit risk and interest rate risk. However, the disruption in the capital and credit markets increased margin calls on Concord’s repurchase agreements. Furthermore, the ability to issue CDOs and the availability of new financing has effectively been eliminated, making the execution of Concord’s strategy unfeasible at this time.
Concord began experiencing declines in the fair value of its loan securities in the fourth quarter of 2007 consistent with liquidity concerns impacting the commercial bond and real estate markets and the overall economy. As a result Concord has recorded significant other-than-temporary impairment charges during 2008, 2009 and 2010.
Primarily due to (1) the continued deterioration in the value of Concord’s loan and bond portfolio, (2) a margin call received by Concord and potential additional margin calls, (3) the preferred member’s failure to fund the requested Concord capital call, (4) an increase in Concord borrower defaults, (5) Concord’s debt covenant violations and (6) the distressed sale of assets and potential sale of assets at distressed levels to satisfy margin calls and amendments to lender agreements, we determined during the first half of 2009 that our investment in Concord had suffered a significant decrease in value and that ultimately our investment should be valued at zero. As a result, we recorded aggregate $68.2 million other-than-temporary impairment charges during 2009. We have made no additional contributions and we have not recognized any income or loss from Concord. Our investment in these ventures is valued at zero. We are only obligated to fund capital calls for new investments to the extent of management fees we receive from Concord.
Contractual Obligations
The following summarizes our principal contractual obligations as of December 31, 2010 ($000’s):
|
2011
|
2012
|
2013
|
2014
|
2015
|
2016 and
Thereafter
|
Total
|
||||||||||||||||||||||
|
Notes payable (1)
|
$ | 43,533 | $ | 283,612 | $ | 320,576 | $ | 262,814 | $ | 287,316 | $ | 580,226 | $ | 1,778,077 | ||||||||||||||
|
Interest payable - fixed rate
|
102,566 | 93,539 | 74,771 | 62,683 | 43,633 | 68,706 | 445,898 | |||||||||||||||||||||
|
Purchase obligations (2)
|
4,024 | -- | -- | -- | -- | -- | 4,024 | |||||||||||||||||||||
|
Operating lease obligations (3)
|
3,649 | 2,529 | 2,341 | 1,899 | 1,701 | 14,909 | 27,028 | |||||||||||||||||||||
| $ | 153,772 | $ | 379,680 | $ | 397,688 | $ | 327,396 | $ | 332,650 | $ | 663,841 | $ | 2,255,027 | |||||||||||||||
__________
|
(1)
|
Includes balloon payments and discontinued operations. Amounts are shown net of debt discounts of $712 (2012), $2,183 (2013) and $11,789 (thereafter) and exclude $4.1 million in outstanding letters of credit.
|
|
(2)
|
Represents the December 31, 2010 remaining forward purchase equity commitment which must be settled by October 2011.
|
|
(3)
|
Includes ground lease payments and office rents. Amounts disclosed do not include rents that adjust to fair market value. In addition certain ground lease payments due under bond leases allow for a right of offset between the lease obligation and the debt service and accordingly are not included.
|
In addition, we guarantee certain tenant improvement allowances and lease commissions on behalf of certain property owner subsidiaries when required by the related tenant or lender.
Our exposure to market risk relates primarily to our variable rate debt and fixed rate debt. As of December 31, 2010 and 2009, our consolidated variable rate indebtedness not subject to interest rate swap agreements was approximately $0 and $171.3 million, respectively, which represented 0% and 8.3% of total long-term indebtedness, respectively. During 2010 and 2009, our variable rate indebtedness had a weighted-average interest rate of 3.1% and 3.2%, respectively. Had the weighted-average interest rate been 100 basis points higher, our interest expense for 2010 and 2009 would have been increased by approximately $0.8 million and $2.0 million, respectively. As of December 31, 2010 and 2009, our consolidated fixed rate debt, including discontinued operations, was approximately $1.8 billion and $1.9 billion respectively, which represented 100.0% and 91.7%, respectively, of total long-term indebtedness.
49
For certain of our financial instruments, fair values are not readily available since there are no active trading markets as characterized by current exchanges between willing parties. Accordingly, we derive or estimate fair values using various valuation techniques, such as computing the present value of estimated future cash flows using discount rates commensurate with the risks involved. However, the determination of estimated cash flows may be subjective and imprecise. Changes in assumptions or estimation methodologies can have a material effect on these estimated fair values. The following fair values were determined using the interest rates that we believe our outstanding fixed rate debt would warrant as of December 31, 2010 and are indicative of the interest rate environment as of December 31, 2010, and do not take into consideration the effects of subsequent interest rate fluctuations. Accordingly, we estimate that the fair value of our fixed rate debt is $1.6 billion as of December 31, 2010.
Our interest rate risk objectives are to limit the impact of interest rate fluctuations on earnings and cash flows and to lower our overall borrowing costs. To achieve these objectives, we manage our exposure to fluctuations in market interest rates through the use of fixed rate debt instruments to the extent that reasonably favorable rates are obtainable with such arrangements. We may enter into derivative financial instruments such as interest rate swaps or caps to mitigate our interest rate risk on a related financial instrument or to effectively lock the interest rate on a portion of our variable rate debt. As of the date of filing this Annual Report, we have one interest rate swap agreement.
50
MANAGEMENT’S ANNUAL REPORT ON INTERNAL CONTROLS
OVER FINANCIAL REPORTING
Management is responsible for establishing and maintaining adequate internal controls over financial reporting. Our internal control system was designed to provide reasonable assurance regarding the reliability of financial reporting and the preparation and fair presentation of published financial statements in accordance with U.S. generally accepted accounting principles.
All internal control systems, no matter how well designed, have inherent limitations. Therefore, even those systems determined to be effective can provide only reasonable assurance that financial statements are fairly presented in accordance with U.S. generally accepted accounting principles.
In assessing the effectiveness of our internal controls over financial reporting, management used as guidance the criteria established in
Internal Control —
Integrated Framework
issued by the Committee of Sponsoring Organizations of the Treadway Commission. Based upon the assessment performed, management believes that our internal controls over financial reporting are effective as of December 31, 2010.
Our internal control over financial reporting includes policies and procedures that pertain to the maintenance of records that, in reasonable detail, accurately and fairly reflect transactions and dispositions of assets; provide reasonable assurance that transactions are recorded as necessary to permit preparation of financial statements in accordance with U.S. generally accepted accounting principles, and that receipts and expenditures are being made only in accordance with authorizations of our management and the members of our Board of Trustees; and provide reasonable assurance regarding prevention or timely detection of unauthorized acquisition, use or disposition of our assets that could have a material effect on our financial statements.
Our independent registered public accounting firm, KPMG LLP, independently assessed the effectiveness of our internal controls over financial reporting. KPMG LLP has issued a report which is included on page 54 of this Annual Report.
51
LEXINGTON REALTY TRUST
AND CONSOLIDATED SUBSIDIARIES
INDEX
|
Page
|
||
|
Reports of Independent Registered Public Accounting Firm
|
53
|
|
|
Consolidated Balance Sheets as of December 31, 2010 and 2009
|
55
|
|
|
Consolidated Statements of Operations for the years ended December 31, 2010, 2009 and 2008
|
56
|
|
|
Consolidated Statements of Comprehensive Loss for the years ended December 31, 2010, 2009 and 2008
|
57
|
|
|
Consolidated Statements of Changes in Equity for the years ended December 31, 2010, 2009 and 2008
|
58
|
|
|
Consolidated Statements of Cash Flows for the years ended December 31, 2010, 2009 and 2008
|
61
|
|
|
Notes to Consolidated Financial Statements
|
62
|
|
|
Financial Statement Schedule
|
||
|
Schedule III — Real Estate and Accumulated Depreciation
|
90
|
52
Report of Independent Registered Public Accounting Firm
The Trustees and Shareholders
Lexington Realty Trust:
We have audited the accompanying consolidated balance sheets of Lexington Realty Trust and subsidiaries (the “Company”) as of December 31, 2010 and 2009, and the related consolidated statements of operations, changes in equity, comprehensive loss, and cash flows for each of the years in the three-year period ended December 31, 2010. In connection with our audits of the consolidated financial statements, we also have audited the accompanying financial statement schedule. These consolidated financial statements and financial statement schedule are the responsibility of the Company’s management. Our responsibility is to express an opinion on these consolidated financial statements and financial statement schedule based on our audits. We did not audit the 2008 financial statements of Lex-Win Concord LLC (“Concord”), a 50 percent owned investee company. The Company’s equity in losses of Concord and other comprehensive loss attributable to Concord were $30.2 million and $6.1 million, respectively, for the year ended December 31, 2008. The financial statements of Concord were audited by other auditors whose report was furnished to us, and our opinion, insofar as it relates to the amounts included for Concord for 2008, is based solely on the report of the other auditors.
We conducted our audits in accordance with the standards of the Public Company Accounting Oversight Board (United States). Those standards require that we plan and perform the audit to obtain reasonable assurance about whether the financial statements are free of material misstatement. An audit includes examining, on a test basis, evidence supporting the amounts and disclosures in the financial statements. An audit also includes assessing the accounting principles used and significant estimates made by management, as well as evaluating the overall financial statement presentation. We believe that our audits and the report of other auditors provide a reasonable basis for our opinion.
In our opinion, based on our audits and the report of other auditors, the consolidated financial statements referred to above present fairly, in all material respects, the financial position of Lexington Realty Trust and subsidiaries as of December 31, 2010 and 2009, and the results of their operations and their cash flows for each of the years in the three-year period ended December 31, 2010, in conformity with U.S. generally accepted accounting principles. Also in our opinion, the related financial statement schedule, when considered in relation to the basic consolidated financial statements taken as a whole, presents fairly, in all material respects, the information set forth therein.
We also have audited, in accordance with the standards of the Public Company Accounting Oversight Board (United States), the Company’s internal control over financial reporting as of December 31, 2010, based on criteria established in
Internal Control — Integrated Framework
issued by the Committee of Sponsoring Organizations of the Treadway Commission (COSO), and our report dated February 28, 2011 expressed an unqualified opinion on the effectiveness of the Company’s internal control over financial reporting.
(Signed) KPMG LLP
New York, New York
February 28, 2011
53
Report of Independent Registered Public Accounting Firm
The Trustees and Shareholders
Lexington Realty Trust:
We have audited Lexington Realty Trust’s (the “Company's”) internal control over financial reporting as of December 31, 2010, based on criteria established in
Internal Control – Integrated Framework
issued by the Committee of Sponsoring Organizations of the Treadway Commission (COSO). The Company’s management is responsible for maintaining effective internal control over financial reporting and for its assessment of the effectiveness of internal control over financial reporting, included in the accompanying Management’s Annual Report on Internal Controls over Financial Reporting. Our responsibility is to express an opinion on the Company’s internal control over financial reporting based on our audit.
We conducted our audit in accordance with the standards of the Public Company Accounting Oversight Board (United States). Those standards require that we plan and perform the audit to obtain reasonable assurance about whether effective internal control over financial reporting was maintained in all material respects. Our audit included obtaining an understanding of internal control over financial reporting, assessing the risk that a material weakness exists, and testing and evaluating the design and operating effectiveness of internal control based on the assessed risk. Our audit also included performing such other procedures as we considered necessary in the circumstances. We believe that our audit provides a reasonable basis for our opinion.
A company’s internal control over financial reporting is a process designed to provide reasonable assurance regarding the reliability of financial reporting and the preparation of financial statements for external purposes in accordance with generally accepted accounting principles. A company’s internal control over financial reporting includes those policies and procedures that (1) pertain to the maintenance of records that, in reasonable detail, accurately and fairly reflect the transactions and dispositions of the assets of the company; (2) provide reasonable assurance that transactions are recorded as necessary to permit preparation of financial statements in accordance with generally accepted accounting principles, and that receipts and expenditures of the company are being made only in accordance with authorizations of management and trustees of the company; and (3) provide reasonable assurance regarding prevention or timely detection of unauthorized acquisition, use, or disposition of the company’s assets that could have a material effect on the financial statements.
Because of its inherent limitations, internal control over financial reporting may not prevent or detect misstatements. Also, projections of any evaluation of effectiveness to future periods are subject to the risk that controls may become inadequate because of changes in conditions, or that the degree of compliance with the policies or procedures may deteriorate.
In our opinion, the Company maintained, in all material respects, effective internal control over financial reporting as of December 31, 2010, based on criteria established in
Internal Control – Integrated Framework
issued by the Committee of Sponsoring Organizations of the Treadway Commission.
We also have audited, in accordance with the standards of the Public Company Accounting Oversight Board (United States), the accompanying consolidated balance sheets of the Company as of December 31, 2010 and 2009, and the related consolidated statements of operations, changes in equity, comprehensive loss, and cash flows for each of the years in the three-year period ended December 31, 2010. In connection with our audits of the consolidated financial statements, we also have audited the accompanying financial statement schedule, and our report dated February 28, 2011 expressed an unqualified opinion on those consolidated financial statements.
(Signed) KPMG LLP
New York, New York
February 28, 2011
54
LEXINGTON REALTY TRUST
AND CONSOLIDATED SUBSIDIARIES
($000 except per share amounts)
As of December 31,
|
ASSETS
|
2010
|
2009
|
||||||
|
Real estate, at cost:
|
||||||||
|
Buildings and building improvements
|
$ | 2,789,985 | $ | 2,955,583 | ||||
|
Land and land estates
|
545,236 | 576,574 | ||||||
|
Land improvements
|
797 | 797 | ||||||
|
Fixtures and equipment
|
7,525 | 7,525 | ||||||
|
Construction in progress
|
20,043 | 12,327 | ||||||
| 3,363,586 | 3,552,806 | |||||||
|
Less: accumulated depreciation and amortization
|
601,239 | 537,406 | ||||||
| 2,762,347 | 3,015,400 | |||||||
|
Properties held for sale — discontinued operations
|
7,316 | -- | ||||||
|
Intangible assets (net of accumulated amortization of $374,139 in 2010 and $341,615 in 2009)
|
203,495 | 267,161 | ||||||
|
Cash and cash equivalents
|
52,644 | 53,865 | ||||||
|
Restricted cash
|
26,644 | 21,519 | ||||||
|
Investment in and advances to non-consolidated entities
|
83,738 | 55,985 | ||||||
|
Deferred expenses (net of accumulated amortization of $22,380 in 2010 and $16,970 in 2009)
|
39,912 | 38,245 | ||||||
|
Loans receivable, net
|
88,937 | 60,567 | ||||||
|
Rent receivable — current
|
7,498 | 11,463 | ||||||
|
Rent receivable — deferred
|
6,293 | 12,529 | ||||||
|
Other assets
|
56,172 | 43,111 | ||||||
|
Total assets
|
$ | 3,334,996 | $ | 3,579,845 | ||||
| LIABILITIES AND EQUITY | ||||||||
|
Liabilities:
|
||||||||
|
Mortgages and notes payable
|
$ | 1,481,216 | $ | 1,857,909 | ||||
|
Exchangeable notes payable
|
61,438 | 85,709 | ||||||
|
Convertible notes payable
|
103,211 | -- | ||||||
|
Trust preferred securities
|
129,120 | 129,120 | ||||||
|
Contract right payable
|
-- | 15,252 | ||||||
|
Dividends payable
|
23,071 | 18,412 | ||||||
|
Liabilities — discontinued operations
|
3,876 | -- | ||||||
|
Accounts payable and other liabilities
|
51,292 | 43,629 | ||||||
|
Accrued interest payable
|
13,989 | 11,068 | ||||||
|
Deferred revenue – below market leases (net of accretion of $35,969 in 2010 and $39,946 in 2009)
|
96,490 | 107,535 | ||||||
|
Prepaid rent
|
15,164 | 13,975 | ||||||
|
Total liabilities
|
1,978,867 | 2,282,609 | ||||||
|
Commitments and contingencies
|
||||||||
|
Equity:
|
||||||||
|
Preferred shares, par value $0.0001 per share; authorized 100,000,000 shares;
|
||||||||
|
Series B Cumulative Redeemable Preferred, liquidation preference, $79,000; 3,160,000 shares issued and outstanding
|
76,315 | 76,315 | ||||||
|
Series C Cumulative Convertible Preferred, liquidation preference $104,760; 2,095,200 shares issued and outstanding
|
101,778 | 101,778 | ||||||
|
Series D Cumulative Redeemable Preferred, liquidation preference $155,000; 6,200,000 shares issued and outstanding
|
149,774 | 149,774 | ||||||
|
Common shares, par value $0.0001 per share, authorized 400,000,000 shares, 146,552,589 and 121,943,258 shares issued
and outstanding in 2010 and 2009, respectively.
|
15 | 12 | ||||||
|
Additional paid-in-capital
|
1,937,942 | 1,750,979 | ||||||
|
Accumulated distributions in excess of net income
|
(985,562 | ) | (870,862 | ) | ||||
|
Accumulated other comprehensive income (loss)
|
(106 | ) | 673 | |||||
|
Total shareholders’ equity
|
1,280,156 | 1,208,669 | ||||||
|
Noncontrolling interests
|
75,973 | 88,567 | ||||||
|
Total equity
|
1,356,129 | 1,297,236 | ||||||
|
Total liabilities and equity
|
$ | 3,334,996 | $ | 3,579,845 | ||||
The accompanying notes are an integral part of these consolidated financial statements.
55
LEXINGTON REALTY TRUST
AND CONSOLIDATED SUBSIDIARIES
($000 except per share amounts)
Years ended December 31,
|
2010
|
2009
|
2008
|
||||||||||
|
Gross revenues:
|
||||||||||||
|
Rental
|
$ | 307,713 | $ | 315,493 | $ | 335,523 | ||||||
|
Advisory and incentive fees
|
1,108 | 1,822 | 1,432 | |||||||||
|
Tenant reimbursements
|
34,034 | 39,001 | 38,663 | |||||||||
|
Total gross revenues
|
342,855 | 356,316 | 375,618 | |||||||||
|
Expense applicable to revenues:
|
||||||||||||
|
Depreciation and amortization
|
(163,355 | ) | (164,968 | ) | (211,583 | ) | ||||||
|
Property operating
|
(71,907 | ) | (75,026 | ) | (68,108 | ) | ||||||
|
General and administrative
|
(22,487 | ) | (23,425 | ) | (30,299 | ) | ||||||
|
Non-operating income
|
11,855 | 8,021 | 24,230 | |||||||||
|
Interest and amortization expense
|
(123,115 | ) | (127,793 | ) | (148,119 | ) | ||||||
|
Debt satisfaction gains, net
|
208 | 17,023 | 59,710 | |||||||||
|
Change in value of forward equity commitment
|
8,906 | 7,182 | (2,128 | ) | ||||||||
|
Impairment charges and loan losses
|
(6,879 | ) | (5,174 | ) | -- | |||||||
|
Gains on sale - affiliates
|
-- | -- | 31,806 | |||||||||
|
Income (loss) before provision for income taxes, equity in earnings (losses) of non-consolidated entities
and discontinued operations
|
(23,919 | ) | (7,844 | ) | 31,127 | |||||||
|
Provision for income taxes
|
(1,556 | ) | (2,374 | ) | (2,982 | ) | ||||||
|
Equity in earnings (losses) of non-consolidated entities
|
21,741 | (123,176 | ) | (43,305 | ) | |||||||
|
Loss from continuing operations
|
(3,734 | ) | (133,394 | ) | (15,160 | ) | ||||||
|
Discontinued operations:
|
||||||||||||
|
Income (loss) from discontinued operations
|
(1,139 | ) | (2,410 | ) | 12,531 | |||||||
|
Provision for income taxes
|
(16 | ) | (81 | ) | (533 | ) | ||||||
|
Debt satisfaction gains, net
|
2,927 | 11,471 | 3,062 | |||||||||
|
Gains on sales of properties
|
14,613 | 9,134 | 13,151 | |||||||||
|
Impairment charges
|
(50,061 | ) | (95,992 | ) | (16,519 | ) | ||||||
|
Total discontinued operations
|
(33,676 | ) | (77,878 | ) | 11,692 | |||||||
|
Net loss
|
(37,410 | ) | (211,272 | ) | (3,468 | ) | ||||||
|
Less net loss attributable to noncontrolling interests
|
4,450 | 1,120 | 6,222 | |||||||||
|
Net income (loss) attributable to Lexington Realty Trust shareholders
|
(32,960 | ) | (210,152 | ) | 2,754 | |||||||
|
Dividends attributable to preferred shares — Series B — 8.05% rate
|
(6,360 | ) | (6,360 | ) | (6,360 | ) | ||||||
|
Dividends attributable to preferred shares — Series C — 6.50% rate
|
(6,809 | ) | (7,218 | ) | (8,852 | ) | ||||||
|
Dividends attributable to preferred shares — Series D — 7.55% rate
|
(11,703 | ) | (11,703 | ) | (11,703 | ) | ||||||
|
Dividends attributable to non-vested common shares
|
(264 | ) | (449 | ) | (491 | ) | ||||||
|
Redemption discount – Series C
|
-- | -- | 5,678 | |||||||||
|
Conversion dividend – Series C
|
-- | (6,994 | ) | -- | ||||||||
|
Net loss attributable to common shareholders
|
$ | (58,096 | ) | $ | (242,876 | ) | $ | (18,974 | ) | |||
|
Income (loss) per common share — basic and diluted:
|
||||||||||||
|
Loss from continuing operations
|
$ | (0.25 | ) | $ | (1.53 | ) | $ | (0.33 | ) | |||
|
Income (loss) from discontinued operations
|
(0.19 | ) | (0.69 | ) | 0.05 | |||||||
|
Net loss attributable to common shareholders
|
$ | (0.44 | ) | $ | (2.22 | ) | $ | (0.28 | ) | |||
|
Weighted average common shares outstanding — basic and diluted
|
130,985,809 | 109,280,955 | 67,872,590 | |||||||||
|
Amounts attributable to common shareholders:
|
||||||||||||
|
Loss from continuing operations
|
$ | (33,357 | ) | $ | (167,880 | ) | $ | (22,391 | ) | |||
|
Income (loss) from discontinued operations
|
(24,739 | ) | (74,996 | ) | 3,417 | |||||||
|
Net loss attributable to common shareholders
|
$ | (58,096 | ) | $ | (242,876 | ) | $ | (18,974 | ) | |||
The accompanying notes are an integral part of these consolidated financial statements.
56
LEXINGTON REALTY TRUST
AND CONSOLIDATED SUBSIDIARIES
Consolidated Statements of Comprehensive Loss
($000)
Years ended December 31,
|
2010
|
2009
|
2008
|
||||||||||
|
Net loss
|
$ | (37,410 | ) | $ | (211,272 | ) | $ | (3,468 | ) | |||
|
Other comprehensive income (loss):
|
||||||||||||
|
Change in unrealized gain on marketable equity securities and reclassifications, net
|
-- | -- | 38 | |||||||||
|
Change in unrealized gain on foreign currency translation and reclassifications, net
|
(740 | ) | (19 | ) | (96 | ) | ||||||
|
Change in unrealized loss on investments in non-consolidated entities and reclassifications, net
|
-- | 26,174 | (6,137 | ) | ||||||||
|
Change in unrealized loss on interest rate swap and reclassifications, net
|
(39 | ) | 1,815 | (1,882 | ) | |||||||
|
Other comprehensive income (loss)
|
(779 | ) | 27,970 | (8,077 | ) | |||||||
|
Comprehensive loss
|
(38,189 | ) | (183,302 | ) | (11,545 | ) | ||||||
|
Comprehensive loss attributable to noncontrolling interests
|
4,450 | 1,120 | 6,446 | |||||||||
|
Comprehensive loss attributable to Lexington Realty Trust
|
$ | (33,739 | ) | $ | (182,182 | ) | $ | (5,099 | ) | |||
The accompanying notes are an integral part of these consolidated financial statements.
57
LEXINGTON REALTY TRUST AND CONSOLIDATED SUBSIDIARIES
CONSOLIDATED STATEMENTS OF CHANGES IN EQUITY
($000 except share amounts)
Year ended December 31, 2008
| Lexington Realty Trust Shareholders | ||||||||||||||||||||||||||||||||||||
|
Total
|
Number of Preferred Shares
|
Preferred Shares
|
Number of Common Shares
|
Common Shares
|
Additional Paid-in-Capital
|
Accumulated Distributions in Excess of Net Income
|
Accumulated Other Comprehensive Income (Loss)
|
Non-controlling Interests
|
||||||||||||||||||||||||||||
|
Balance at December 31, 2007
|
$ | 1,739,565 | 12,460,001 | $ | 376,678 | 61,064,334 | $ | 6 | $ | 1,056,464 | $ | (469,769 | ) | $ | (2,778 | ) | $ | 778,964 | ||||||||||||||||||
|
Repurchase of exchangeable note equity component
|
(2,839 | ) | -- | -- | -- | -- | (2,839 | ) | -- | -- | -- | |||||||||||||||||||||||||
|
Contributions from noncontrolling interests
|
1,957 | -- | -- | -- | -- | -- | -- | -- | 1,957 | |||||||||||||||||||||||||||
|
Redemption of OP Units
|
-- | -- | -- | 34,377,989 | 3 | 516,537 | -- | -- | (516,540 | ) | ||||||||||||||||||||||||||
|
Repurchase of OP Units
|
(475 | ) | -- | -- | -- | -- | 156 | -- | -- | (631 | ) | |||||||||||||||||||||||||
|
Purchase of noncontrolling interest
|
(5,311 | ) | -- | -- | -- | -- | -- | -- | -- | (5,311 | ) | |||||||||||||||||||||||||
|
Transfer of noncontrolling interest
|
(3,086 | ) | -- | -- | -- | -- | -- | -- | -- | (3,086 | ) | |||||||||||||||||||||||||
|
Issuance of common shares and deferred compensation amortization, net
|
85,101 | -- | -- | 6,037,715 | 1 | 85,075 | 25 | -- | -- | |||||||||||||||||||||||||||
|
Repurchase of common shares
|
(16,853 | ) | -- | -- | (1,179,800 | ) | -- | (16,853 | ) | -- | -- | -- | ||||||||||||||||||||||||
|
Repurchase of preferred shares
|
(24,372 | ) | (501,700 | ) | (24,372 | ) | -- | -- | -- | -- | -- | -- | ||||||||||||||||||||||||
|
Redemption discount – Series C
|
5,678 | -- | -- | -- | -- | -- | 5,678 | -- | -- | |||||||||||||||||||||||||||
|
Retirement of special voting preferred
|
-- | (1 | ) | -- | -- | -- | -- | -- | -- | -- | ||||||||||||||||||||||||||
|
Dividends/distributions
|
(266,749 | ) | -- | -- | -- | -- | -- | (107,819 | ) | -- | (158,930 | ) | ||||||||||||||||||||||||
|
Comprehensive income (loss):
|
||||||||||||||||||||||||||||||||||||
|
Net income (loss)
|
(3,468 | ) | -- | -- | -- | -- | -- | 2,754 | -- | (6,222 | ) | |||||||||||||||||||||||||
|
Other comprehensive income (loss):
|
||||||||||||||||||||||||||||||||||||
|
Change in unrealized gain (loss) on marketable equity securities, net
|
38 | -- | -- | -- | -- | -- | -- | 107 | (69 | ) | ||||||||||||||||||||||||||
|
Change in unrealized gain on foreign currency translation
|
(96 | ) | -- | -- | -- | -- | -- | -- | (96 | ) | -- | |||||||||||||||||||||||||
|
Change in unrealized loss on interest rate swap, net
|
(1,882 | ) | -- | -- | -- | -- | -- | -- | (2,064 | ) | 182 | |||||||||||||||||||||||||
|
Change in unrealized loss from non-consolidated entities, net
|
(6,137 | ) | -- | -- | -- | -- | -- | -- | (5,800 | ) | (337 | ) | ||||||||||||||||||||||||
|
Transfer of noncontrolling interests share
|
-- | -- | -- | -- | -- | -- | -- | (5,019 | ) | 5,019 | ||||||||||||||||||||||||||
|
Other comprehensive income (loss)
|
(8,077 | ) | ||||||||||||||||||||||||||||||||||
|
Comprehensive income (loss)
|
(11,545 | ) | ||||||||||||||||||||||||||||||||||
|
Balance at December 31, 2008
|
$ | 1,501,071 | 11,958,300 | $ | 352,306 | 100,300,238 | $ | 10 | $ | 1,638,540 | $ | (569,131 | ) | $ | (15,650 | ) | $ | 94,996 | ||||||||||||||||||
The accompanying notes are an integral part of these consolidated financial statements.
58
LEXINGTON REALTY TRUST AND CONSOLIDATED SUBSIDIARIES
CONSOLIDATED STATEMENTS OF CHANGES IN EQUITY
($000 except share amounts)
Year ended December 31, 2009
| Lexington Realty Trust Shareholders | ||||||||||||||||||||||||||||||||||||
|
Total
|
Number of Preferred Shares
|
Preferred Shares
|
Number of Common Shares
|
Common Shares
|
Additional Paid-in-Capital
|
Accumulated Distributions in Excess of Net Income
|
Accumulated Other Comprehensive Income (Loss)
|
Non-controlling Interests
|
||||||||||||||||||||||||||||
|
Balance at December 31, 2008
|
$ | 1,501,071 | 11,958,300 | $ | 352,306 | 100,300,238 | $ | 10 | $ | 1,638,540 | $ | (569,131 | ) | $ | (15,650 | ) | $ | 94,996 | ||||||||||||||||||
|
Cumulative effect, change in accounting principal from non-consolidated entity
|
-- | -- | -- | -- | -- | -- | 11,647 | (11,647 | ) | -- | ||||||||||||||||||||||||||
|
Redemption of OP units
|
-- | -- | -- | 572,213 | -- | 3,580 | -- | -- | (3,580 | ) | ||||||||||||||||||||||||||
|
Contributions from noncontrolling interests
|
1,756 | -- | -- | -- | -- | -- | -- | -- | 1,756 | |||||||||||||||||||||||||||
|
Conversion – Series C
|
-- | (503,100 | ) | (24,439 | ) | 2,955,368 | -- | 31,433 | (6,994 | ) | -- | -- | ||||||||||||||||||||||||
|
Issuance of common shares and deferred compensation amortization, net
|
24,569 | -- | -- | 4,811,241 | 1 | 24,568 | -- | -- | -- | |||||||||||||||||||||||||||
|
Dividends/distributions
|
(46,858 | ) | -- | -- | 13,304,198 | 1 | 52,858 | (96,232 | ) | -- | (3,485 | ) | ||||||||||||||||||||||||
|
Comprehensive Income (loss):
|
||||||||||||||||||||||||||||||||||||
|
Net loss
|
(211,272 | ) | -- | -- | -- | -- | -- | (210,152 | ) | -- | (1,120 | ) | ||||||||||||||||||||||||
|
Other comprehensive income (loss):
|
||||||||||||||||||||||||||||||||||||
|
Change in unrealized gain on foreign currency translation
|
(19 | ) | -- | -- | -- | -- | -- | -- | (19 | ) | -- | |||||||||||||||||||||||||
|
Change in unrealized loss on interest rate swap, net
|
1,815 | -- | -- | -- | -- | -- | -- | 1,815 | -- | |||||||||||||||||||||||||||
|
Change in unrealized loss from non-consolidated entity, net
|
26,174 | -- | -- | -- | -- | -- | -- | 26,174 | -- | |||||||||||||||||||||||||||
|
Other comprehensive income
|
27,970 | |||||||||||||||||||||||||||||||||||
|
Comprehensive loss
|
(183,302 | ) | ||||||||||||||||||||||||||||||||||
|
Balance at December 31, 2009
|
$ | 1,297,236 | 11,455,200 | $ | 327,867 | 121,943,258 | $ | 12 | $ | 1,750,979 | $ | (870,862 | ) | $ | 673 | $ | 88,567 | |||||||||||||||||||
The accompanying notes are an integral part of these consolidated financial statements.
59
LEXINGTON REALTY TRUST AND CONSOLIDATED SUBSIDIARIES
CONSOLIDATED STATEMENTS OF CHANGES IN EQUITY
($000 except share amounts)
Year ended December 31, 2010
| Lexington Realty Trust Shareholders | ||||||||||||||||||||||||||||||||||||
|
Total
|
Number of Preferred Shares
|
Preferred Shares
|
Number of Common Shares
|
Common Shares
|
Additional Paid-in-Capital
|
Accumulated Distributions in Excess of Net Income
|
Accumulated Other Comprehensive Income (Loss)
|
Non-controlling Interests
|
||||||||||||||||||||||||||||
|
Balance at December 31, 2009
|
$ | 1,297,236 | 11,455,200 | $ | 327,867 | 121,943,258 | $ | 12 | $ | 1,750,979 | $ | (870,862 | ) | $ | 673 | $ | 88,567 | |||||||||||||||||||
|
Contributions from noncontrolling interests
|
4,854 | -- | -- | -- | -- | -- | 4,854 | |||||||||||||||||||||||||||||
|
Redemption of noncontrolling OP units for common shares
|
-- | -- | -- | 457,351 | -- | 2,685 | -- | -- | (2,685 | ) | ||||||||||||||||||||||||||
|
Transfer of noncontrolling interest
|
(1,957 | ) | -- | -- | -- | -- | -- | -- | -- | (1,957 | ) | |||||||||||||||||||||||||
|
Issuance of Convertible Notes
|
13,134 | -- | -- | -- | -- | 13,134 | -- | -- | -- | |||||||||||||||||||||||||||
|
Forfeiture of employee performance common shares
|
171 | -- | -- | (21,720 | ) | -- | -- | 171 | -- | -- | ||||||||||||||||||||||||||
|
Exercise of employee common share options
|
(356 | ) | -- | -- | 95,976 | -- | (356 | ) | -- | -- | -- | |||||||||||||||||||||||||
|
Issuance of common shares and deferred compensation amortization, net
|
171,503 | -- | -- | 24,077,724 | 3 | 171,500 | -- | -- | -- | |||||||||||||||||||||||||||
|
Dividends/distributions
|
(90,267 | ) | -- | -- | -- | -- | (81,911 | ) | -- | (8,356 | ) | |||||||||||||||||||||||||
|
Comprehensive loss:
|
||||||||||||||||||||||||||||||||||||
|
Net loss
|
(37,410 | ) | -- | -- | -- | -- | -- | (32,960 | ) | -- | (4,450 | ) | ||||||||||||||||||||||||
|
Other comprehensive loss:
|
||||||||||||||||||||||||||||||||||||
|
Change in unrealized gain on foreign currency translation, net
|
(740 | ) | -- | -- | -- | -- | -- | -- | (740 | ) | -- | |||||||||||||||||||||||||
|
Change in unrealized loss on interest rate swap, net
|
(39 | ) | -- | -- | -- | -- | -- | -- | (39 | ) | -- | |||||||||||||||||||||||||
|
Comprehensive loss
|
(38,189 | ) | ||||||||||||||||||||||||||||||||||
|
Balance at December 31, 2010
|
$ | 1,356,129 | 11,455,200 | $ | 327,867 | 146,552,589 | $ | 15 | $ | 1,937,942 | $ | (985,562 | ) | $ | (106 | ) | $ | 75,973 | ||||||||||||||||||
The accompanying notes are an integral part of these consolidated financial statements.
60
LEXINGTON REALTY TRUST
AND CONSOLIDATED SUBSIDIARIES
($000 except per share amounts)
Years ended December 31,
|
2010
|
2009
|
2008
|
||||||||||
|
Cash flows from operating activities:
|
||||||||||||
|
Net loss
|
$ | (37,410 | ) | $ | (211,272 | ) | $ | (3,468 | ) | |||
|
Adjustments to reconcile net loss to net cash provided by operating activities:
|
||||||||||||
|
Depreciation and amortization
|
172,301 | 185,208 | 252,389 | |||||||||
|
Gains on sales of properties
|
(14,613 | ) | (9,134 | ) | (44,957 | ) | ||||||
|
Debt satisfaction gains, net
|
(3,590 | ) | (29,872 | ) | (62,889 | ) | ||||||
|
Impairment charges and loan losses
|
56,940 | 101,166 | 16,519 | |||||||||
|
Straight-line rents
|
862 | (240 | ) | 2,114 | ||||||||
|
Other non-cash (income) charges, net
|
(7,912 | ) | (7,192 | ) | 5,944 | |||||||
|
Equity in (earnings) losses of non-consolidated entities
|
(21,741 | ) | 123,176 | 43,305 | ||||||||
|
Distributions of accumulated earnings from non-consolidated entities
|
3,233 | 4,707 | 1,697 | |||||||||
|
Deferred taxes, net
|
489 | 196 | 1,313 | |||||||||
|
Increase (decrease) in accounts payable and other liabilities
|
5,186 | 1,175 | (9,129 | ) | ||||||||
|
Change in rent receivable and prepaid rent, net
|
5,111 | 1,600 | 22,829 | |||||||||
|
Increase (decrease) in accrued interest payable
|
2,921 | (4,605 | ) | (6,026 | ) | |||||||
|
Other adjustments, net
|
2,974 | 4,394 | 10,560 | |||||||||
|
Net cash provided by operating activities
|
164,751 | 159,307 | 230,201 | |||||||||
|
Cash flows from investing activities:
|
||||||||||||
|
Net proceeds from sales/transfers of properties
|
80,224 | 113,139 | 238,600 | |||||||||
|
Net proceeds from sales of properties-affiliates
|
— | — | 95,576 | |||||||||
|
Purchase of noncontrolling interests
|
— | — | (5,311 | ) | ||||||||
|
Investments in real estate including intangible assets and capital leases
|
(52,324 | ) | (45,122 | ) | (94,610 | ) | ||||||
|
Investments in and advances to non-consolidated entities, net
|
(11,258 | ) | 4,765 | (18,388 | ) | |||||||
|
Proceeds from sale of interest in non-consolidated entity
|
112 | — | — | |||||||||
|
Principal payments received on loans receivable
|
12,480 | 12,886 | 1,468 | |||||||||
|
Real estate deposits
|
(1,330 | ) | — | 223 | ||||||||
|
Investment in loans receivable
|
(40,632 | ) | — | (1,000 | ) | |||||||
|
Proceeds from the sale of marketable equity and debt securities
|
— | 9,451 | 2,506 | |||||||||
|
Distribution from non-consolidated entities in excess of accumulated earnings
|
1,356 | 16,241 | 26,355 | |||||||||
|
Increase in deferred leasing costs
|
(5,129 | ) | (8,641 | ) | (11,988 | ) | ||||||
|
Change in escrow deposits and restricted cash
|
(8,282 | ) | 9,248 | (3,303 | ) | |||||||
|
Net cash provided by (used in) investing activities
|
(24,783 | ) | 111,967 | 230,128 | ||||||||
|
Cash flows from financing activities:
|
||||||||||||
|
Proceeds of mortgages and notes payable
|
59,769 | 11,540 | 13,700 | |||||||||
|
Change in revolving credit facility borrowing, net
|
(7,000 | ) | (18,000 | ) | 25,000 | |||||||
|
Dividends to common and preferred shareholders
|
(77,252 | ) | (49,642 | ) | (241,306 | ) | ||||||
|
Dividend reinvestment plan proceeds
|
3,619 | — | — | |||||||||
|
Repurchase of exchangeable notes
|
(25,493 | ) | (101,006 | ) | (169,479 | ) | ||||||
|
Repurchase of trust preferred securities
|
— | — | (44,561 | ) | ||||||||
|
Exercise of employee common share options
|
50 | — | — | |||||||||
|
Principal payments on debt, excluding normal amortization
|
(331,295 | ) | (264,399 | ) | (242,679 | ) | ||||||
|
Principal amortization payments
|
(33,781 | ) | (39,052 | ) | (64,552 | ) | ||||||
|
Proceeds from term loans
|
— | 165,000 | 70,000 | |||||||||
|
Proceeds from convertible notes
|
115,000 | — | — | |||||||||
|
Issuance of common shares, net
|
162,983 | 20,026 | 47,014 | |||||||||
|
Repurchase of common and preferred shares
|
— | — | (24,374 | ) | ||||||||
|
Contributions from noncontrolling interests
|
4,854 | 1,756 | 1,957 | |||||||||
|
Cash distributions to noncontrolling interests
|
(8,356 | ) | (3,485 | ) | (158,930 | ) | ||||||
|
Increase in deferred financing costs
|
(5,760 | ) | (5,317 | ) | (2,712 | ) | ||||||
|
Swap termination costs
|
— | (366 | ) | (415 | ) | |||||||
|
Receipts (payments) on forward equity commitment, net
|
1,473 | (2,262 | ) | (12,825 | ) | |||||||
|
Purchases of partnership units
|
— | — | (475 | ) | ||||||||
|
Net cash used in financing activities
|
(141,189 | ) | (285,207 | ) | (804,637 | ) | ||||||
|
Change in cash and cash equivalents
|
(1,221 | ) | (13,933 | ) | (344,308 | ) | ||||||
|
Cash and cash equivalents, beginning of year
|
53,865 | 67,798 | 412,106 | |||||||||
|
Cash and cash equivalents, end of year
|
$ | 52,644 | $ | 53,865 | $ | 67,798 | ||||||
The accompanying notes are an integral part of these consolidated financial statements.
61
LEXINGTON REALTY TRUST
AND CONSOLIDATED SUBSIDIARIES
Notes to Consolidated Financial Statements
($000 except per share/unit amounts)
(1) The Company
Lexington Realty Trust (together with its consolidated subsidiaries, except when the context only applies to the parent entity, the “Company”) is a self-managed and self-administered Maryland statutory real estate investment trust (“REIT”) that acquires, owns, and manages a geographically diversified portfolio of predominately net-leased office, industrial and retail properties. The Company also provides investment advisory and asset management services to investors in the net-lease area. As of December 31, 2010, the Company had interests in approximately 195 consolidated properties located in 39 states. A majority of the real properties in which the Company had an interest are generally subject to net leases or similar leases where the tenant pays all or substantially all of the cost and/or cost increases for real estate taxes, insurance, utilities and ordinary maintenance of the property. However, certain leases provide that the landlord is responsible for certain operating expenses. As of December 31, 2009, the Company had ownership interests in approximately 210 consolidated properties in 40 states and the Netherlands.
The Company believes it has qualified as a REIT under the Internal Revenue Code of 1986, as amended (the “Code”). Accordingly, the Company will not be subject to federal income tax, provided that distributions to its shareholders equal at least the amount of its REIT taxable income as defined under the Code. The Company is permitted to participate in certain activities from which it was previously precluded in order to maintain its qualification as a REIT, so long as these activities are conducted in entities which elect to be treated as taxable REIT subsidiaries (“TRS”) under the Code. As such, the TRS are subject to federal income taxes on the income from these activities.
The Company conducts its operations either directly or indirectly through (1) property owner subsidiaries and lender subsidiaries, (2) operating partnerships in which the Company is the sole unit holder of the general partner and the sole unit holder of the limited partner that holds a majority of the limited partner interests (“OP units”) or (3) Lexington Realty Advisors, Inc. (“LRA”), a wholly-owned TRS. On December 31, 2010, Net 3 Acquisition L.P. (“Net 3”), a former operating partnership, merged into the Company and Net 3 ceased to exist for financial reporting purposes. On December 31, 2008, The Lexington Master Limited Partnership ("MLP"), a former operating partnership, merged with and into the Company and the MLP ceased to exist for financial reporting purposes. As of December 31, 2010, the Company controlled two operating partnerships: (1) Lepercq Corporate Income Fund L.P. (“LCIF”) and (2) Lepercq Corporate Income Fund II L.P. (“LCIF II”). Property owner subsidiaries are landlords under leases and/or borrowers under loan agreements and lender subsidiaries are lenders under loan agreements, but in all cases are separate and distinct legal entities.
(2) Summary of Significant Accounting Policies
Basis of Presentation and Consolidation.
The Company’s consolidated financial statements are prepared on the accrual basis of accounting. The financial statements reflect the accounts of the Company and its consolidated subsidiaries. The Company consolidates its wholly owned subsidiaries, partnerships and joint ventures which it controls (i) through voting rights or similar rights or (ii) by means other than voting rights if the Company is the primary beneficiary of a variable interest entity ("VIE"). Entities which the Company does not control and entities which are VIEs in which the Company is not the primary beneficiary are accounted for under appropriate U.S. generally accepted accounting principles (“GAAP”).
The Company implemented new accounting guidance effective January 1, 2010 regarding VIEs. In accordance with the guidance, the Company re-evaluated all of its equity and loan investments and all other potential variable interests to determine if they are VIEs. For each of these investments, the Company has evaluated (1) the sufficiency of the entities’ equity investments at risk to permit the entity to finance its activities without additional subordinated financial support, (2) that as a group the holders of the equity investments at risk have (a) the power through voting rights or similar rights to direct the entities’ activities that most significantly impact the entity’s economic performance, (b) the obligation to absorb the expected losses of the entity and their obligations are not protected directly or indirectly and (c) the right to receive the expected residual return of the entity and their rights are not capped and (3) the voting rights of these investors are not proportional to their obligations to absorb the expected losses of the entity, their rights to receive the expected returns of the entity, or both, and that substantially all of the entities’ activities do not involve or are not conducted on behalf of an investor that has disproportionately few voting rights.
If an investment is determined to be a VIE, the Company then performs an analysis to determine if the Company is the primary beneficiary of the VIE. GAAP requires a VIE to be consolidated by its primary beneficiary. The primary beneficiary is the party that has a controlling financial interest in an entity. In order for a party to have a controlling financial interest in an entity it must have (1) the power to direct the activities of a VIE that most significantly impact the entity’s economic performance and (2) the obligation to absorb losses of an entity that could potentially be significant to the VIE or the right to receive benefits from the entity that could potentially be significant to the VIE.
62
LEXINGTON REALTY TRUST
AND CONSOLIDATED SUBSIDIARIES
Notes to Consolidated Financial Statements (Continued)
($000 except per share/unit amounts)
Consolidated Variable Interest Entities
.
The Company’s consolidated VIEs were determined to be VIEs primarily because the entities’ equity holders’ obligation to absorb losses is protected or their equity investment at risk is not sufficient to permit the entities to finance their activities without additional financial support. The Company determined that it was the primary beneficiary of these VIEs as it has a controlling financial interest in the entities.
The Company determined that a wholly-owned entity which owns an office building in Greenville, South Carolina is a VIE as the entity’s obligation to absorb losses is protected. The tenant has an option to purchase the property on December 31, 2014 at fair market value, but not for less than $10,710 and not for greater than $11,550. If the tenant does not exercise the purchase option, the Company has the right to require the tenant to purchase the property for $10,710.
The Company had a loan which was made to a VIE, Camfex Associates Limited Partnership (“Camfex”). The Company determined that it was the primary beneficiary of the VIE and, accordingly, consolidated Camfex in its financial statements. Camfex owned two multi-tenanted office buildings in California and had outstanding third-party mortgage debt. In January 2010, one property was sold to its tenant/lender. During the first quarter of 2010, the Company took a deed in lieu of foreclosure on the second property and satisfied the third-party mortgage debt; thus Camfex was no longer a VIE of the Company. As of December 31, 2009, the aggregate assets of Camfex that could only be used to settle the obligations of the VIE were $37,808. These assets were primarily classified in real estate in the Company’s Condensed Consolidated Balance Sheet. As of December 31, 2009, the aggregate liabilities of Camfex were $24,455 and were primarily classified in mortgages and notes payable in the Company’s Condensed Consolidated Balance Sheet. Neither creditors nor noncontrolling equity investors of the VIE had any recourse to the general credit of the Company.
Non-Consolidated Variable Interest Entities
.
At December 31, 2010 and December 31, 2009, the Company held variable interests in certain non-consolidated VIEs; however, the Company was not the primary beneficiary of these VIEs as the Company does not have a controlling financial interest in the entities. The Company determined Concord Debt Holdings LLC and related entities are VIEs. The Company’s carrying value of these investments is zero and the Company has no obligation to fund future operations (see note 9). The Company has certain acquisition commitments and/or acquisition, development and construction arrangements with VIEs. The Company is obligated to fund certain amounts as discussed in note 18.
Earnings Per Share.
Basic net income (loss) per share is computed by dividing net income (loss) reduced by preferred dividends and amounts allocated to non-vested share-based payment awards, if applicable, by the weighted average number of common shares outstanding during the period. Diluted net income (loss) per share amounts are similarly computed but include the effect, when dilutive, of in-the-money common share options, OP units and put options of certain convertible securities.
Use of Estimates.
Management has made a number of estimates and assumptions relating to the reporting of assets and liabilities, the disclosure of contingent assets and liabilities and the reported amounts of revenues and expenses to prepare these consolidated financial statements in conformity with GAAP. These estimates and assumptions are based on management’s best estimates and judgment. Management evaluates its estimates and assumptions on an ongoing basis using historical experience and other factors, including the current economic environment. The current economic environment has increased the degree of uncertainty inherent in these estimates and assumptions. Management adjusts such estimates when facts and circumstances dictate. The most significant estimates made include the recoverability of accounts receivable, allocation of property purchase price to tangible and intangible assets acquired and liabilities assumed, the determination of VIEs and which entities should be consolidated, classification of noncontrolling interests, the determination of impairment of long-lived assets, loans receivable and equity method investments, valuation and impairment of assets held by equity method investees, valuation of derivative financial instruments, and the useful lives of long-lived assets. Actual results could differ materially from those estimates.
Purchase Accounting and Acquisition of Real Estate.
The fair value of the real estate acquired, which includes the impact of fair value adjustments for assumed mortgage debt related to property acquisitions, is allocated to the acquired tangible assets, consisting of land, building and improvements and identified intangible assets and liabilities, consisting of the value of above-market and below-market leases, other value of in-place leases and value of tenant relationships, based in each case on their fair values. Beginning in 2009, acquisition costs are expensed as incurred and are included in property operating expense in the accompanying consolidated statement of operations. Also, noncontrolling interests acquired are recorded at estimated fair market value.
63
LEXINGTON REALTY TRUST
AND CONSOLIDATED SUBSIDIARIES
Notes to Consolidated Financial Statements (Continued)
($000 except per share/unit amounts)
The fair value of the tangible assets of an acquired property (which includes land, building and improvements and fixtures and equipment) is determined by valuing the property as if it were vacant, and the “as-if-vacant” value is then allocated to land and building and improvements based on management’s determination of relative fair values of these assets. Factors considered by management in performing these analyses include an estimate of carrying costs during the expected lease-up periods considering current market conditions and costs to execute similar leases. In estimating carrying costs, management includes real estate taxes, insurance and other operating expenses and estimates of lost rental revenue during the expected lease-up periods based on current market demand. Management also estimates costs to execute similar leases including leasing commissions.
In allocating the fair value of the identified intangible assets and liabilities of an acquired property, above-market and below-market lease values are recorded based on the difference between the current in-place lease rent and management’s estimate of current market rents. Below-market lease intangibles are recorded as part of deferred revenue and amortized into rental revenue over the non-cancelable periods and bargain renewal periods of the respective leases. Above-market leases are recorded as part of intangible assets and amortized as a direct charge against rental revenue over the non-cancelable portion of the respective leases.
The aggregate value of other acquired intangible assets, consisting of in-place leases and tenant relationship values, is measured by the excess of (1) the purchase price paid for a property over (2) the estimated fair value of the property as if vacant, determined as set forth above. This aggregate value is allocated between in-place lease values and tenant relationship values based on management’s evaluation of the specific characteristics of each tenant’s lease. The value of in-place leases are amortized to expense over the remaining non-cancelable periods and any bargain renewal periods of the respective leases. The value of tenant relationships are amortized to expense over the applicable lease term plus expected renewal periods.
Depreciation is determined by the straight-line method over the remaining estimated economic useful lives of the properties. The Company generally depreciates buildings and building improvements over periods ranging from 8 to 40 years, land improvements from 15 to 20 years, and fixtures and equipment from 2 to 16 years.
Revenue Recognition.
The Company recognizes lease revenue on a straight-line basis over the term of the lease unless another systematic and rational basis is more representative of the time pattern in which the use benefit is derived from the leased property. Renewal options in leases with rental terms that are lower than those in the primary term are excluded from the calculation of straight-line rent if the renewals are not reasonably assured. In those instances in which the Company, directly or through a property owner subsidiary, funds tenant improvements and the improvements are deemed to be owned by the Company, or its property owner subsidiary, revenue recognition will commence when the improvements are substantially completed and possession or control of the space is turned over to the tenant. When the Company determines that the tenant allowances are lease incentives, the Company commences revenue recognition when possession or control of the space is turned over to the tenant for tenant work to begin. The lease incentive is recorded as a deferred expense and amortized as a reduction of revenue on a straight-line basis over the respective lease term. The Company recognizes lease termination payments as a component of rental revenue in the period received, provided there are no further Company obligations under the lease; otherwise, the lease termination payment is amortized on a straight-line basis over the remaining obligation period. All above-market lease assets, below-market lease liabilities and deferred rent assets or liabilities for terminated leases are charged against or credited to rental revenue in the same period as the termination payment is recognized. All other capitalized lease costs and lease intangibles are accelerated via amortization expense through the date of termination.
Gains on sales of real estate are recognized based upon the specific timing of the sale as measured against various criteria related to the terms of the transactions and any continuing involvement associated with the properties. If the sales criteria are not met, the gain is deferred and the finance, installment or cost recovery method, as appropriate, is applied until the sales criteria are met. To the extent the Company sells a property and retains a partial ownership interest in the property, the Company recognizes gain to the extent of the third party ownership interest.
Accounts Receivable.
The Company continuously monitors collections from tenants and makes a provision for estimated losses based upon historical experience and any specific tenant collection issues that the Company has identified. As of December 31, 2010 and 2009, the Company’s allowance for doubtful accounts was not significant.
64
LEXINGTON REALTY TRUST
AND CONSOLIDATED SUBSIDIARIES
Notes to Consolidated Financial Statements (Continued)
($000 except per share/unit amounts)
Fair Value Measurements.
The Company follows the guidance in the Financial Accounting Standards Board (“FASB”) Accounting Standards Codification ("ASC") Topic 820, Fair Value Measurements and Disclosures ("Topic 820") to determine the fair value of financial and non-financial instruments. Topic 820 defines fair value, establishes a framework for measuring fair value in GAAP and expands disclosures about fair value measurements. The provisions of the guidance were effective for financial statements issued for fiscal years beginning after November 15, 2007, except for those relating to nonfinancial assets and liabilities, which were deferred for one additional year, and a scope exception for purposes of fair value measurements affecting lease classification or measurement. Topic 820 establishes a fair value hierarchy that prioritizes observable and unobservable inputs used to measure fair value into three levels: Level 1 – quoted prices (unadjusted) in active markets that are accessible at the measurement date for assets or liabilities; Level 2 – observable prices that are based on inputs not quoted in active markets, but corroborated by market data; and Level 3 – unobservable inputs that are used when little or no market data is available. The fair value hierarchy gives the highest priority to Level 1 inputs and the lowest priority to Level 3 inputs. In determining fair value, the Company utilizes valuation techniques that maximize the use of observable inputs and minimize the use of unobservable inputs to the extent possible, as well as considering counterparty credit risk, where applicable, in the Company’s assessment of fair value.
Impairment of Real Estate.
The Company evaluates the carrying value of all tangible and intangible real estate assets held for investment for possible impairment when an event or change in circumstance has occurred that indicates its carrying value may not be recoverable. The evaluation includes estimating and reviewing anticipated future undiscounted cash flows to be derived from the asset. If such cash flows are less than the asset’s carrying value, an impairment charge is recognized to the extent by which the asset’s carrying value exceeds the estimated fair value. Estimating future cash flows is highly subjective and such estimates could differ materially from actual results.
Investments in Non-Consolidated Entities.
The Company accounts for its investments in 50% or less owned entities under the equity method, unless consolidation is required. If the Company’s investment in the entity is insignificant and the Company has no influence over the control of the entity then the entity is accounted for under the cost method.
Impairment of Equity Method Investments.
On a quarterly basis, the Company assesses whether there are indicators that the value of its equity method investments may be impaired. An impairment charge is recognized only if the Company determines that a decline in the value of the investment below its carrying value is other-than-temporary. The assessment of impairment is highly subjective and involves the application of significant assumptions and judgments about the Company’s intent and ability to recover its investment given the nature and operations of the underlying investment, including the level of the Company’s involvement therein, among other factors. To the extent an impairment is deemed to be other-than-temporary, the loss is measured as the excess of the carrying amount of the investment over the estimated fair value of the investment.
Loans Receivable.
Loans held for investment are intended to be held to maturity and, accordingly, are carried at cost, net of unamortized loan origination costs and fees, loan purchase discounts, and net of an allowance for loan losses when such loan is deemed to be impaired. Loan origination costs and fees and loan purchase discounts are amortized over the term of the loan. The Company considers a loan impaired when, based upon current information and events, it is probable that it will be unable to collect all amounts due for both principal and interest according to the contractual terms of the loan agreement. Significant judgments are required in determining whether impairment has occurred. The Company performs an impairment analysis by comparing either the present value of expected future cash flows discounted at the loan’s effective interest rate, the loan’s observable current market price or the fair value of the underlying collateral to the net carrying value of the loan, which may result in an allowance and corresponding charge to loan loss. Interest on impaired loans is recognized on a cash basis.
Acquisition, Development and Construction Arrangements.
The Company evaluates loans receivable where the Company participates in residual profits through loan provisions or other contracts to ascertain whether the Company has the same risks and rewards as an owner or a joint venture partner. Where the Company concludes that such arrangements are more appropriately treated as an investment in real estate and the Company expects to receive less than 50% of the residual profits, the Company reflects such investment as part of investments in and advances to non-consolidated entities in the Consolidated Balance Sheets. In these cases, the loan receivable is treated as preferred capital in the hypothetical joint venture rather than a loan receivable and no interest income is recorded.
Common Shareholder Dividends.
For three of its quarterly common share dividends declared during 2009, the Company relied upon Internal Revenue Service Revenue Procedure 2008-68 (“IRS Rev. Proc. 2008-68”). IRS Rev. Proc. 2008-68, through a date certain, allows REITs to offer shareholders elective stock dividends, which are dividends paid in a mixture of stock and cash, of which at least 10% must be paid in cash. The stock portion of the dividend was accounted for as a stock issuance upon distribution and earnings per share was adjusted prospectively.
65
LEXINGTON REALTY TRUST
AND CONSOLIDATED SUBSIDIARIES
Notes to Consolidated Financial Statements (Continued)
($000 except per share/unit amounts)
Properties Held For Sale.
Assets and liabilities of properties that meet various held for sale criteria, including whether it is probable that a sale will occur within 12 months, are presented separately in the Consolidated Balance Sheets, with assets and liabilities being separately stated. The operating results of these properties are reflected as discontinued operations in the Consolidated Statements of Operations. Properties classified as held for sale are carried at the lower of net carrying value or estimated fair value less costs to sell. Properties that do not meet the held for sale criteria are accounted for as operating properties.
Deferred Expenses.
Deferred expenses consist primarily of debt and leasing costs. Debt costs are amortized using the straight-line method, which approximates the interest method, over the terms of the debt instruments and leasing costs are amortized over the term of the related lease.
Derivative Financial Instruments.
The Company accounts for its interest rate swap agreements in accordance with FASB ASC Topic 815 Derivatives and Hedging ("Topic 815"). In accordance with Topic 815, such agreements are carried on the balance sheet at their fair value, as an asset if their fair value is positive or as a liability, if their fair value is negative. If the interest rate swap is designated as a cash flow hedge, the effective portion of the swap’s change in fair value is reported as a component of other comprehensive income (loss) and the ineffective portion, if any, is recognized in earnings as an increase or decrease to interest expense.
Upon entering into hedging transactions, the Company documents the relationship between the interest rate swap agreements and the hedged item. The Company also documents its risk-management policies, including objectives and strategies, as they relate to its hedging activities. The Company assesses, both at inception of a hedge and on an on-going basis, whether or not the hedge is highly effective. The Company will discontinue hedge accounting on a prospective basis with changes in the estimated fair value reflected in earnings when (1) it is determined that the derivative is no longer effective in offsetting cash flows of a hedged item (including forecasted transactions), (2) it is no longer probable that the forecasted transaction will occur or (3) it is determined that designating the derivative as an interest rate swap is no longer appropriate. The Company may utilize interest rate swap and cap agreements to manage interest rate risk and does not anticipate entering into derivative transactions for speculative trading purposes.
Stock Compensation.
The Company maintains an equity participation plan. Non-vested share grants generally vest either based upon (1) time, (2) performance and/or (3) market conditions. Options granted under the plan in 2010 vest over a five-year period and expire ten years from the date of grant. Options granted under the plan in 2008 vest upon attainment of certain market performance measures and expire ten years from the date of grant. All share-based payments to employees, including grants of employee stock options, are recognized in the Consolidated Statements of Operations based on their fair values.
Tax Status.
The Company has made an election to qualify, and believes it is operating so as to qualify, as a REIT for federal income tax purposes. Accordingly, the Company generally will not be subject to federal income tax, provided that distributions to its shareholders equal at least the amount of its REIT taxable income as defined under Sections 856 through 860 of the Code.
The Company is permitted to participate in certain activities from which it was previously precluded in order to maintain its qualification as a REIT, so long as these activities are conducted in entities which elect to be treated as taxable REIT subsidiaries under the Code. As such, the Company is subject to federal and state income taxes on the income from these activities.
Income taxes, primarily related to the Company’s taxable REIT subsidiaries, are accounted for under the asset and liability method. Deferred tax assets and liabilities are recognized for the estimated future tax consequences attributable to differences between the financial statement carrying amounts of existing assets and liabilities and their respective tax basis and operating loss and tax credit carry-forwards. Deferred tax assets and liabilities are measured using enacted tax rates in effect for the year in which those temporary differences are expected to be recovered or settled.
66
LEXINGTON REALTY TRUST
AND CONSOLIDATED SUBSIDIARIES
Notes to Consolidated Financial Statements (Continued)
($000 except per share/unit amounts)
A summary of the average taxable nature of the Company’s common dividends for each of the years in the three-year period ended December 31, 2010, is as follows:
|
2010
|
2009
|
2008
|
||||||||||
|
Total dividends per share
|
$ | 0.40 | $ | 0.72 | $ | 2.25408 | (1) | |||||
|
Ordinary income
|
99.11 | % | 53.80 | % | 62.24 | % | ||||||
|
15% rate — qualifying dividend
|
0.89 | % | 0.61 | % | 0.66 | % | ||||||
|
15% rate gain
|
-- | -- | 14.12 | % | ||||||||
|
25% rate gain
|
-- | -- | 9.56 | % | ||||||||
|
Return of capital
|
-- | 45.59 | % | 13.42 | % | |||||||
| 100.00 | % | 100.00 | % | 100.00 | % | |||||||
__________
|
(1)
|
Of the total dividend paid in January 2008, $1.26408 is allocated to 2008.
|
A summary of the average taxable nature of the Company’s dividend on Series B Cumulative Redeemable Preferred Shares for each of the years in the three-year period ended December 31, 2010, is as follows:
|
|
2010
|
2009
|
2008
|
|||||||||
|
Total dividends per share
|
$ | 2.0125 | $ | 2.0125 | $ | 2.0125 | ||||||
|
Ordinary income
|
99.11 | % | 98.87 | % | 71.90 | % | ||||||
|
15% rate — qualifying dividend
|
0.89 | % | 1.13 | % | 0.76 | % | ||||||
|
15% rate gain
|
-- | -- | 16.30 | % | ||||||||
|
25% rate gain
|
-- | -- | 11.04 | % | ||||||||
| 100.00 | % | 100.00 | % | 100.00 | % | |||||||
A summary of the average taxable nature of the Company’s dividend on Series C Cumulative Convertible Preferred Shares for each of the years in the three-year period ended December 31, 2010, is as follows:
|
|
2010
|
2009
|
2008
|
|||||||||
|
Total dividends per share
|
$ | 3.25 | $ | 3.25 | $ | 7.63976 | (1) | |||||
|
Ordinary income
|
99.11 | % | 98.87 | % | 66.35 | % | ||||||
|
15% rate — qualifying dividend
|
0.89 | % | 1.13 | % | 0.70 | % | ||||||
|
15% rate gain
|
-- | -- | 15.05 | % | ||||||||
|
25% rate gain
|
-- | -- | 10.19 | % | ||||||||
|
Return of capital
|
-- | -- | 7.71 | % | ||||||||
| 100.00 | % | 100.00 | % | 100.00 | % | |||||||
__________
|
(1)
|
Includes deemed distribution of $4.38976 due to an adjustment to the conversion rate.
|
A summary of the average taxable nature of the Company’s dividend on Series D Cumulative Redeemable Preferred shares for the years in the three-year period ended December 31, 2010, is as follows:
|
|
2010
|
2009
|
2008
|
|||||||||
|
Total dividends per share
|
$ | 2.01002 | (1) | $ | 1.8875 | $ | 1.415625 | (2) | ||||
|
Ordinary income
|
99.11 | % | 98.87 | % | 71.90 | % | ||||||
|
15% rate — qualifying dividend
|
0.89 | % | 1.13 | % | 0.76 | % | ||||||
|
15% rate gain
|
-- | -- | 16.30 | % | ||||||||
|
25% rate gain
|
-- | -- | 11.04 | % | ||||||||
| 100.00 | % | 100.00 | % | 100.00 | % | |||||||
__________
|
(1)
|
Of the total dividend paid in January 2011, $0.12252 is allocated to 2010.
|
|
(2)
|
Dividend paid in January 2008 was allocated to 2007.
|
67
LEXINGTON REALTY TRUST
AND CONSOLIDATED SUBSIDIARIES
Notes to Consolidated Financial Statements (Continued)
($000 except per share/unit amounts)
Cash and Cash Equivalents.
The Company considers all highly liquid instruments with original maturities of three months or less to be cash equivalents.
Restricted Cash.
Restricted cash is comprised primarily of cash balances held in escrow with lenders.
Foreign Currency.
The Company determined that the functional currency of its foreign operation, which was sold in 2010, was the respective local currency. As such, assets and liabilities of the Company’s foreign operation was translated using the period-end exchange rates, and revenues and expenses are translated using the exchange rate as determined throughout the period. Unrealized gains or losses resulting from translation are included in accumulated other comprehensive income (loss) and as a separate component of the Company’s shareholders’ equity.
Environmental Matters.
Under various federal, state and local environmental laws, statutes, ordinances, rules and regulations, an owner of real property may be liable for the costs of removal or remediation of certain hazardous or toxic substances at, on, in or under such property as well as certain other potential costs relating to hazardous or toxic substances. These liabilities may include government fines and penalties and damages for injuries to persons and adjacent property. Such laws often impose liability without regard to whether the owner knew of, or was responsible for, the presence or disposal of such substances. Although the tenants of properties in which the Company has an interest are primarily responsible for any environmental damage and claims related to the leased premises, in the event of the bankruptcy or inability of the tenant of such premises to satisfy any obligations with respect to such environmental liability, one of the Company’s property owner subsidiaries may be required to satisfy any such obligations, should they exist. In addition, the property owner subsidiary, as the owner of such a property, may be held directly liable for any such damages or claims irrespective of the provisions of any lease. As of December 31, 2010 and 2009, the Company was not aware of any environmental matter relating to any of its assets that would have a material impact on the financial statements.
Segment Reporting.
The Company operates generally in one industry segment, investment in net-leased real properties.
Reclassifications.
Certain amounts included in prior years’ financial statements have been reclassified to conform to the current year presentation, including certain statement of operations captions including activities for properties sold or held for sale during 2010, which are presented as discontinued operations.
Recently Issued Accounting Guidance.
In January 2010, the FASB issued an update to ASC 820, Fair Value Measurements and Disclosures, adding new requirements for disclosures about transfers into and out of Levels 1 and 2 fair value measurements and additional disclosures about the activity within Level 3 fair value measurements. The adoption of this guidance on January 1, 2010 did not have an impact on the Company’s financial position, results of operations or cash flows.
In July 2010, the FASB issued guidance that significantly expands the disclosures about the credit quality of financing receivables and the allowance for credit losses. The disclosures as of the end of the reporting period (such as accounting policies, ending balances of allowance for credit losses and credit quality indicators) are effective for interim and annual reporting periods ending on or after December 15, 2010. The disclosures about activity that occurs during a reporting period (such as modifications and roll forward of allowance for credit losses) are effective for interim and annual reporting periods beginning on or after December 15, 2010. The implementation of this guidance did not have a material impact on the Company’s financial position, results of operations or cash flows.
68
LEXINGTON REALTY TRUST
AND CONSOLIDATED SUBSIDIARIES
Notes to Consolidated Financial Statements (Continued)
($000 except per share/unit amounts)
(3) Earnings Per Share
The Company’s non-vested share-based payment awards are considered participating securities and as such the Company is required to use the two-class method for the computation of basic and diluted earnings per share. Under the two-class computation method, net losses are not allocated to participating securities unless the holder of the security has a contractual obligation to share in the losses, accordingly the non-vested share-based payment awards are not allocated losses for the years ending December 31, 2010, 2009 and 2008. The following is a reconciliation of numerators and denominators of the basic and diluted earnings per share computations for each of the years in the three-year period ended December 31, 2010:
|
2010
|
2009
|
2008
|
||||||||||
|
BASIC AND DILUTED
|
||||||||||||
|
Loss from continuing operations attributable to common shareholders
|
$ | (33,357 | ) | $ | (167,880 | ) | $ | (22,391 | ) | |||
|
Income (loss) from discontinued operations attributable to common shareholders
|
(24,739 | ) | (74,996 | ) | 3,417 | |||||||
|
Net loss attributable to common shareholders
|
$ | (58,096 | ) | $ | (242,876 | ) | $ | (18,974 | ) | |||
|
Weighted average number of common shares outstanding
|
130,985,809 | 109,280,955 | 67,872,590 | |||||||||
|
Income (loss) per common share:
|
||||||||||||
|
Loss from continuing operations
|
$ | (0.25 | ) | $ | (1.53 | ) | $ | (0.33 | ) | |||
|
Income (loss) from discontinued operations
|
(0.19 | ) | (0.69 | ) | 0.05 | |||||||
|
Net loss attributable to common shareholders
|
$ | (0.44 | ) | $ | (2.22 | ) | $ | (0.28 | ) | |||
During 2009, 503,100 shares of Series C Cumulative Convertible Preferred Shares ("Series C Preferred") were converted into 2,955,368 common shares. The difference between the fair value of the securities transferred in excess of the fair value of the securities issuable pursuant to the original conversion terms of $6,994 constitutes a deemed dividend, even though the conversion was for equivalent fair values, and is dilutive to common shareholders. Accordingly, net loss was adjusted to arrive at net loss attributable to common shareholders for 2009.
During 2008, the Company redeemed 501,700 shares of Series C Preferred at a $5,678 discount to their historical cost basis. This discount constitutes a deemed negative dividend, offsetting other dividends, and is accretive to the common shareholders. Accordingly, net loss was adjusted to arrive at net loss attributable to common shareholders for the year ended December 31, 2008.
For per common share amounts all incremental shares are considered anti-dilutive for periods that have a loss from continuing operations attributable to common shareholders.
(4) Investments in Real Estate and Intangible Assets
During 2010, the Company, through a property owner subsidiary, acquired an office property for $16,650. The property is located in Columbus, Ohio and is net-leased for 16 years. The Company, through property owner subsidiaries, also acquired the land on a previously ground-leased property in Beaumont, Texas for $500 and a parking lot in a sales/leaseback transaction with Nevada Power Company, an existing tenant, for $3,275. The Company’s property owner subsidiary financed the purchase of the parking lot with a $2,450 non-recourse note mortgage, which matures in September 2014, bears interest at 7.5% and has a 25 year amortization schedule. The parking lot is adjacent to the property in Las Vegas, Nevada, leased to Nevada Power Company, in which the Company has an existing investment. In connection with the transaction, the Nevada Power Company’s lease on the existing property was extended from January 2014 to January 2029, the same expiration date as the parking lot lease.
During 2009, the Company, through a property owner subsidiary, acquired the remainder interests in land in Long Beach, California in connection with a tenant's lease surrender obligations for an estimated fair value of approximately $2,500 and recorded it as non-operating income, of which $1,125 was attributable to a noncontrolling interest in the property.
For the property acquired in 2010, the components of intangible assets and their respective weighted-average lives are as follows:
|
Costs
|
Weighted - Average Life (yrs)
|
||||||
|
In-place lease values
|
$ | 3,612 | 16 | ||||
|
Tenant relationship value
|
963 | 16 | |||||
| $ | 4,575 | ||||||
69
LEXINGTON REALTY TRUST
AND CONSOLIDATED SUBSIDIARIES
Notes to Consolidated Financial Statements (Continued)
($000 except per share/unit amounts)
As of December 31, 2010 and 2009, the components of intangible assets, are as follows:
|
|
2010
|
2009
|
||||||
|
In-place lease values
|
$ | 335,152 | $ | 349,864 | ||||
|
Tenant relationship values
|
156,495 | 160,006 | ||||||
|
Above-market leases
|
85,987 | 98,906 | ||||||
| $ | 577,634 | $ | 608,776 | |||||
The estimated amortization of the above intangibles for the next five years is $49,054 in 2011, $35,479 in 2012, $24,853 in 2013, $19,382 in 2014 and $13,765 in 2015.
Below-market leases, net of accretion, which are included in deferred revenue, are $94,677 and $106,291, respectively as of December 31, 2010 and 2009. The estimated accretion for the next five years is $8,073 in 2011, $7,758 in 2012, $7,303 in 2013, $6,144 in 2014 and $4,944 in 2015
(5) Sales of Real Estate and Discontinued Operations
The Company sold its interests, to unrelated parties, in (1) 13 properties in 2010, (2) 18 properties in 2009, three of which were transferred to lenders or disposed of through bankruptcy and (3) 41 properties in 2008, one of which was transferred to the lender, for aggregate net proceeds of $80,224, $108,475 and $238,600, respectively, which resulted in gains on sales in 2010, 2009 and 2008 of $14,613, $9,134 and $13,151, respectively. The Company recognized net debt satisfaction gains relating to these properties for 2010, 2009 and 2008 of $2,927, $11,471 and $3,062, respectively. These gains are included in discontinued operations.
At December 31, 2010 and 2009, the Company had two and no properties classified as held for sale, respectively.
The following presents the operating results for the properties sold and held for sale during the years ended December 31, 2010, 2009 and 2008:
|
|
Year Ending December 31,
|
|||||||||||
|
|
2010
|
2009
|
2008
|
|||||||||
|
Total gross revenues
|
$ | 9,068 | $ | 32,989 | $ | 76,469 | ||||||
|
Pre-tax income (loss), including gains on sales
|
$ | (33,660 | ) | $ | (77,797 | ) | $ | 12,225 | ||||
In 2009, the Company, through a property owner subsidiary, received gross proceeds of $4,750 in a sale-leaseback transaction of land in Palm Beach Gardens, Florida. The Company is leasing back the land for 30 years and has an option to purchase the land in June 2014 and June 2015. The Company has not recognized a gain on the transaction as the Company is considered to have continued involvement in the property due to the purchase option.
During 2009, the Company conveyed its interest in three properties to lenders in full satisfaction of the related aggregate $38,022 non-recourse mortgage notes payable.
During 2008, the Company conveyed its interest in one property to a lender in full satisfaction of the $6,516 non-recourse mortgage note payable. The Company recorded a gain on debt satisfaction of $3,990.
(6) Impairments and Loan Losses
The Company assesses on a regular basis whether there are any indicators that the value of Company assets have become impaired. Potential indicators may include a reduction in occupancy at a property, tenant reduction in utilization of a property and tenant financial instability. If an asset is determined to be impaired, the Company reduces the asset’s carrying value to its estimated fair value. During 2010, 2009 and 2008, the Company recognized $56,940, $101,166 and $16,519, respectively, of impairment charges and loan losses, including amounts in discontinued operations, relating primarily to the sale of real estate assets at less than carrying value and investments in certain loan assets.
70
LEXINGTON REALTY TRUST
AND CONSOLIDATED SUBSIDIARIES
Notes to Consolidated Financial Statements (Continued)
($000 except per share/unit amounts)
|
|
·
|
The Company recognized an impairment charge of $2,955, classified in continuing operations, in 2010 on a non-core retail property acquired on December 31, 2006 in the merger with Newkirk Realty Trust (“Newkirk”). The Company explored the possible disposition of the property and determined that the current market price was below its carrying value of $3,194.
|
|
|
·
|
During 2010, the Company recorded a $3,756 loan loss on a loan receivable as the tenant supporting the collateral declared bankruptcy and announced liquidation proceedings. In addition, the Company recognized an other-than-temporary impairment of $168 on a bond investment.
|
|
|
·
|
The Company recognized impairments of $50,061, $60,668 and $12,031 during 2010, 2009 and 2008, respectively, on real estate assets that were ultimately disposed of below their carrying value.
|
|
|
·
|
During 2009, three real estate assets with an aggregate carrying value of $59,974 were written down to their estimated aggregate fair value of $24,650 in anticipation of foreclosure by their respective mortgage lenders, resulting in an aggregate impairment charge of $35,324.
|
|
|
·
|
During 2009, the Company recognized an impairment of $3,598 on a non-core, vacant, retail property acquired in the merger with Newkirk, classified in continuing operations, as the Company determined that it is unlikely that it will recover any of its investment and wrote the property down to estimated fair value of zero.
|
|
|
·
|
During 2009, the Company agreed to the discounted payoff of two loans receivable with an aggregate carrying value of $4,950. The Company wrote the loans receivable down to the aggregate agreed-upon discounted payoff amount of $3,865, which approximated fair value and recognized a loan loss reserve of $1,085 during 2009. In addition, the Company sold investments in debt securities for $9,451 and realized a loss of $491.
|
|
|
·
|
During 2008, the Company conveyed its interest in one property to a lender and recognized an impairment loss of $4,488.
|
The Company also determined that two of its investments in non-consolidated entities incurred other-than-temporary impairments in 2009 and accordingly recognized $74,693 of impairment charges in equity in earnings (losses) from non-consolidated entities including other-than-temporary impairments of $68,213 on its investment in Lex-Win Concord LLC, which reduced the carrying value of that investment to zero. In addition, in 2009 the Company recorded an impairment charge of $6,480 on its investment in an unconsolidated joint venture acquired in the merger with Newkirk due to the expiration of the net-lease on the hotel asset owned by the joint venture. The Company sold this investment for $60 in 2009.
(7) Loans Receivable
As of December 31, 2010 and 2009, the Company’s loans receivable, including accrued interest, are comprised primarily of first and second mortgage loans on real estate aggregating $88,937 and $60,567, respectively, bearing interest, including imputed interest, at rates ranging from 4.6% to 16.0% and maturing at various dates between 2011 and 2022. During 2010, the Company, through lender subsidiaries:
|
|
-
|
funded a 15%, $16,725 mortgage loan to an entity which owns an office building in Schaumburg, Illinois, which matures January 2012, but can be extended one additional year by the borrower for a 50 basis point fee. The property is net-leased to Career Education Corporation from January 1, 2011 through December 31, 2022 for an average annual rent of $3,968. In addition, the lender subsidiary is obligated to lend an additional $1,810 through January 2012 upon the occurrence of certain events. If the borrower exercises its one-year extension option and certain other events occur, the lender subsidiary will become obligated to lend an additional $12,199 for tenant improvement costs; and
|
71
LEXINGTON REALTY TRUST
AND CONSOLIDATED SUBSIDIARIES
Notes to Consolidated Financial Statements (Continued)
($000 except per share/unit amounts)
|
|
-
|
made a $17,000 mezzanine loan to entities which owned five medical facilities. The mezzanine loan is (i) guaranteed by a parent entity and principal, (ii) principally secured by either ownership pledges for, second mortgage liens or mortgage liens against the medical facilities, (iii) matures in December 2011 and (iv) requires payments of interest only at a rate of 14% through February 2011 and 16% thereafter. The lender subsidiary received a prepayment of $6,363 in December 2010, resulting in $10,637 outstanding at December 31, 2010.
|
On December 31, 2009, the Company, through a property owner subsidiary, acquired an office property in Greenville, South Carolina for $10,500. The tenant has an option to purchase the property on December 31, 2014 at fair market value, but not less than $10,710 and not greater than $11,550. If the tenant does not exercise the purchase option, the property owner subsidiary has the right to require the tenant to purchase the property for $10,710. The Company has determined that the lease is a direct financing lease and has classified it in other assets in the accompanying Consolidated Balance Sheet.
The Company has two types of financing receivables: loans receivable and a capitalized financing lease. The Company determined that its financing receivables operate within one portfolio segment as they are both within the same industry and use the same impairment methodology. The Company’s loans receivable are secured by commercial real estate assets and the capitalized financing lease is for the commercial office property located in Greenville, South Carolina. In addition, the Company assesses all financing receivables for impairment, when warranted, based on an individual analysis of each receivable.
The Company’s financing receivables operate within one class of financing receivables as these assets are collateralized by commercial real estate and similar metrics are used to monitor the risk and performance of these assets. The Company’s management uses credit quality indicators to monitor financing receivables such as quality of collateral, the underlying tenant’s credit rating and collection experience. As of December 31, 2010, the financing receivables were performing as anticipated and there were no delinquent amounts outstanding.
During 2010, the Company recorded a loan loss of $3,756 on a loan receivable – see note 6. In October 2010, the Company entered into a loan modification agreement with the borrower. In accordance with the terms of the modification agreement, in addition to other provisions, monthly payments are interest only through maturity, the maturity was accelerated from July 2015 to December 2012 and the Company agreed to a discounted payoff prior to maturity. During 2010, the Company recognized $604 of interest income relating to the impaired loan and the loan had an average recorded investment value of $8,621 during 2010. At December 31, 2010, the impaired loan receivable had a net carrying value of $6,860 and a contractual unpaid principal balance of $10,616.
(8) Fair Value Measurements
The following tables presents the Company’s assets and liabilities from continuing operations measured at fair value on a recurring and non-recurring basis as of December 31, 2010 and 2009, aggregated by the level in the fair value hierarchy within which those measurements fall:
|
Balance
December 31, 2010
|
Fair Value Measurements Using
|
|||||||||||||||
|
Description
|
(Level 1)
|
(Level 2)
|
(Level 3)
|
|||||||||||||
|
Forward purchase equity asset
|
$ | 27,574 | $ | -- | $ | 27,574 | $ | -- | ||||||||
|
Interest rate swap liability
|
$ | (5,280 | ) | $ | -- | $ | (5,280 | ) | $ | -- | ||||||
|
Impaired real estate assets*
|
$ | 235 | $ | -- | $ | -- | $ | 235 | ||||||||
|
Impaired loans receivable*
|
$ | 6,860 | $ | -- | $ | -- | $ | 6,860 | ||||||||
*Represents a non-recurring measurement. See note 6 regarding impairments and loan losses
72
LEXINGTON REALTY TRUST
AND CONSOLIDATED SUBSIDIARIES
Notes to Consolidated Financial Statements (Continued)
($000 except per share/unit amounts)
|
Balance
December 31, 2009
|
Fair Value Measurements Using
|
|||||||||||||||
|
Description
|
(Level 1)
|
(Level 2)
|
(Level 3)
|
|||||||||||||
|
Forward purchase equity asset
|
$ | 20,141 | $ | -- | $ | 20,141 | $ | -- | ||||||||
|
Interest rate swap liability
|
$ | (5,241 | ) | $ | -- | $ | (5,241 | ) | $ | -- | ||||||
|
Impaired real estate assets*
|
$ | 36,658 | $ | -- | $ | -- | $ | 36,658 | ||||||||
| *Represents a non-recurring measurement. See note 6 regarding impairments and loan losses | ||||||||||||||||
The table below sets forth the carrying amounts and fair values of the Company’s financial instruments as of December 31, 2010 and 2009.
|
|
As of December 31, 2010
|
As of December 31, 2009
|
||||||||||||||
|
|
Carrying
Amount
|
Fair Value
|
Carrying
Amount
|
Fair Value
|
||||||||||||
|
Assets
|
||||||||||||||||
|
Loans Receivable
|
$ | 88,937 | $ | 75,868 | $ | 60,567 | $ | 44,092 | ||||||||
|
Liabilities
|
||||||||||||||||
|
Debt
|
$ | 1,774,985 | $ | 1,614,626 | $ | 2,087,990 | $ | 1,748,617 | ||||||||
The Company has determined that the forward purchase equity asset should fall within Level 2 of the fair value hierarchy as its value is based primarily on the value of the Company’s common share price.
The majority of the inputs used to value the Company’s interest rate swap liability fall within Level 2 of the fair value hierarchy, such as observable market interest rate curves; however, the credit valuation associated with the interest rate swap liability utilizes Level 3 inputs, such as estimates of current credit spreads to evaluate the likelihood of default by itself and its counterparties. As of December 31, 2010 and 2009, the Company determined that the credit valuation adjustment relative to the overall interest rate swap liability is not significant. As a result, the entire interest rate swap liability has been classified in Level 2 of the fair value hierarchy.
The Company estimates the fair value of its real estate assets by using income and market valuation techniques. The Company may estimate fair values, using market information such as broker opinions of value, recent sales data for similar assets or discounted cash flow models, which primarily rely on Level 3 inputs. The cash flow models include estimated cash inflows and outflows over a specified holding period. These cash flows may include contractual rental revenues, projected future rental revenues and expenses and forecasted tenant improvements and lease commissions based upon market conditions determined through discussion with local real estate professionals, experience the Company has with its other owned properties in such markets and expectations for growth. Capitalization rates and discount rates utilized in these models are estimated by management based upon rates that management believes to be within a reasonable range of current market rates for the respective properties based upon an analysis of factors such as property and tenant quality, geographical location and local supply and demand observations. To the extent the Company under estimates forecasted cash outflows (tenant improvements, lease commissions and operating costs) or over estimates forecasted cash inflows (rental revenue rates) the estimated fair value of its real estate assets could be overstated.
The Company estimates the fair values of its loans receivable by using an estimated discounted cash flow analysis, utilizing scheduled cash flows and discount rate estimates to approximate those that a willing buyer and seller might use and/or the estimated value of the underlying collateral. The fair value of the Company’s debt is estimated by using a discounted cash flow analysis, based upon estimates of market interest rates.
73
LEXINGTON REALTY TRUST
AND CONSOLIDATED SUBSIDIARIES
Notes to Consolidated Financial Statements (Continued)
($000 except per share/unit amounts)
Fair values cannot be determined with precision, may not be substantiated by comparison to quoted prices in active markets and may not be realized upon sale. Additionally, there are inherent uncertainties in any fair value measurement technique, and changes in the underlying assumptions used, including discount rates, liquidity risks and estimates of future cash flows, could significantly affect the fair value measurement amounts.
Cash Equivalents, Restricted Cash, Accounts Receivable and Accounts
Payable.
The Company estimates that the fair value approximates carrying value due to the relatively short maturity of the instruments.
(9) Investment in Non-Consolidated Entities
Net Lease Strategic Assets Fund L.P. (“NLS”)
. NLS is a co-investment program with a subsidiary of Inland American Real Estate Trust, Inc. (“Inland”). NLS was established to acquire single-tenant net-lease specialty real estate in the United States. During 2008, the Company sold, for cash, leasehold interests in seven properties to NLS and recorded an aggregate gain of $31,806, which was limited by the Company’s aggregate ownership interest in NLS’s common and preferred equity. Inland and the Company own 85% and 15%, respectively, of NLS’s common equity and the Company owns 100% of NLS’s preferred equity.
Inland and the Company are currently entitled to a return on/of their respective investments as follows: (1) Inland, 9% on its common equity ($220,590 in common equity), (2) the Company, 6.5% on its preferred equity ($162,487 in preferred equity), (3) the Company, 9% on its common equity ($38,928 in common equity), (4) return of the Company preferred equity ($162,487 in preferred equity), (5) return of Inland common equity ($220,590 in common equity), (6) return of the Company common equity ($38,928 in common equity) and (7) any remaining cash flow is allocated 65% to Inland and 35% to the Company as long as the Company is the general partner, if not, allocations are 85% to Inland and 15% to the Company.
LRA has entered into a management agreement with NLS whereby LRA will receive (1) a management fee of 0.375% of the equity capital, as defined, (2) a property management fee of up to 3.0% of actual gross revenues from certain assets for which the landlord is obligated to provide property management services (contingent upon the recoverability of such fees from the tenant under the applicable lease) and (3) an acquisition fee of 0.5% of the gross purchase price of each acquired asset by NLS.
During the year ended December 31, 2010, 2009 and 2008, the Company recognized $19,468, $12,364 and $(16,902), respectively, of equity in earnings (losses) relating to NLS based upon the hypothetical liquidation book value method. The difference between the assets contributed to NLS and the fair value of the Company’s equity investment in NLS is $94,723 and is accreted into earnings over the estimated useful lives of NLS’s assets. During 2010, 2009 and 2008, the Company recorded earnings of $3,636, $3,636 and $3,213, respectively, related to this difference, which is included in equity in earnings (losses) of non-consolidated entities on the accompanying Consolidated Statements of Operations.
During 2008, the Company incurred transaction costs relating to the formation of NLS of $1,138, which are included in general and administrative expenses in the Consolidated Statements of Operations.
Concord Debt Holdings LLC (“Concord”), Lex-Win Concord LLC (“Lex-Win Concord”) and CDH CDO LLC (“CDH CDO”)
. On December 31, 2006 in connection with the merger with Newkirk, the Company acquired a 50% interest in a co-investment program, Concord, which owns bonds and loans secured, directly and indirectly, by real estate assets. The other 50% interest in Concord was held by WRT Realty L.P. (“Winthrop”). The Company and Winthrop each contributed its interest in Concord to Lex-Win Concord. During 2008, a wholly-owned subsidiary of Inland America Real Estate Trust (“Inland Concord”) was admitted to Concord as a preferred member. During 2009, the Company reduced its investment in Lex-Win Concord to zero.
During 2010, Concord was restructured upon the effectiveness of a settlement agreement with Inland Concord. As a result of the restructuring (i) Lex-Win Concord was dissolved, (ii) Concord is now owned equally by subsidiaries of the Company, Winthrop and Inland Concord and (iii) a new entity, CDH CDO, was created. The new entity purchased Concord Real Estate CDO 2006-1 LTD from Concord with funds contributed by Inland Concord. CDH CDO is also owned equally by subsidiaries of the Company, Winthrop and Inland Concord. The Company has made no additional contributions and it has not recognized any income or loss as a result of the restructuring. The Company’s investment in these ventures is valued at zero and the Company will recognize future income on the cost basis. The Company determined that Concord and CDH CDO are variable interest entities as the equity at risk is not sufficient to finance the entity’s activities; however, the Company is not the primary beneficiary as it does not have a controlling financial interest in either entity.
74
LEXINGTON REALTY TRUST
AND CONSOLIDATED SUBSIDIARIES
Notes to Consolidated Financial Statements (Continued)
($000 except per share/unit amounts)
Other.
The Company’s investment in and advances to non-consolidated entities includes an investment in a loan receivable (an acquisition, development and construction arrangement) where the Company anticipates that it will participate in residual profits through the loan provisions and other contracts. The loan receivable relates to the funding of the construction of a 672,000 square foot industrial facility in Shelby, North Carolina. As of December 31, 2010, the Company’s investment in the arrangement is $11,258. The Company, through a property owner subsidiary, has agreed to purchase the facility upon completion of construction and the commencement of a 20 year net-lease.
Lex-Win Acquisition LLC (“Lex-Win”)
. During 2007, Lex-Win, an entity in which the Company held a 28% ownership interest, acquired 3.9 million shares of common stock in Piedmont Office Realty Trust, Inc. (formerly known as Wells Real Estate Investment Trust, Inc.) (“Wells”), a non-exchange traded entity, at a price per share of $9.30 in a tender offer. During 2007, the Company funded $12,542 relating to this tender and received $1,890 relating to an adjustment of the number of shares tendered. Winthrop and three other members hold the remaining interests in Lex-Win. The Company’s former Executive Chairman and Director of Strategic Acquisitions is the Chief Executive Officer of the parent of Winthrop. Profits, losses and cash flows of Lex-Win were allocated in accordance with the membership interests. During 2008, Lex-Win incurred losses of $3,847 relating to its investment in Wells and sold its entire interest in Wells for $32,289. During 2010, the Company sold its remaining investment in Lex-Win for $112.
Other Equity Method Investment Limited Partnerships
. During 2009, the Company recognized a gain of $2,000 on the sale of an office building in Columbia, South Carolina, in which the Company held a 40% limited partnership interest. The Company’s share of net proceeds from the sale was $12,513. In addition, the Company sold its interest in a hotel joint venture for $60 during 2009. The Company’s remaining equity method investments consist of interests in five partnerships with ownership percentages ranging between 27% and 35%, which own primarily net-leased properties. All profits, losses and cash flows are distributed in accordance with the respective partnership agreements. The partnerships are encumbered by $25,377 in mortgage debt (the Company’s proportionate share is $7,605) with interest rates ranging from 9.4% to 11.5% with a weighted-average rate of 9.9% and maturity dates ranging from 2011 to 2016.
LRA earns advisory fees from certain of these non-consolidated entities for services related to acquisitions, asset management and debt placement. Advisory fees earned from these non-consolidated investments were $967, $1,140 and $1,105 for the years ended December 31, 2010, 2009 and 2008, respectively.
(10) Mortgages and Notes Payable and Contract Right Payable
The Company had outstanding mortgages and notes payable of $1,481,216 and $1,857,909 as of December 31, 2010 and 2009, respectively, excluding discontinued operations. Interest rates, including imputed rates on mortgages and notes payable, ranged from 3.6% to 7.8% at December 31, 2010 and the mortgages and notes payable mature between 2011 and 2022. Interest rates, including imputed rates, ranged from 3.1% to 10.3% at December 31, 2009. The weighted-average interest rate at December 31, 2010 and 2009 was approximately 5.8% and 5.6%, respectively.
On February 13, 2009, the Company entered into a secured credit facility consisting of a $165,000 term loan and a $85,000 revolving loan with KeyBank N.A. (“KeyBank”), as agent. The secured credit facility bore interest at 285 basis points plus LIBOR and matured in February 2011, but could be extended to February 2012 at the Company’s option. During 2010 and 2009, the Company satisfied the outstanding amounts in full. The secured credit facility was secured by ownership interest pledges and guarantees by certain of the Company’s subsidiaries that in the aggregate owned interests in a borrowing base consisting of 73 properties as of December 31, 2010. The borrowing availability of the facility was based upon the net operating income of the properties comprising the borrowing base as defined in the facility. As of December 31, 2010, the available additional borrowing under the secured revolving credit facility was $215,891 and the Company had $4,109 outstanding letters of credit. In connection with the financing and the subsequent increases in the availability under the facility, the Company incurred $5,738 and $4,977 as of December 31, 2010 and 2009, respectively, in aggregate financing costs and recognized $247 in debt satisfaction charges during the year ended December 31, 2009. The secured credit facility was subject to financial covenants, such as leverage ratio and debt service coverages, which the Company was in compliance with at December 31, 2010. The Company entered into a new secured revolving credit facility with KeyBank, as agent, on January 28, 2011 – see note 23.
During 2008, the Company obtained $25,000 and $45,000 original principal amount secured term loans from KeyBank. The loans are interest only at LIBOR plus 60 basis points and mature in 2013. The net proceeds of the loans of $68,000 were used to partially repay indebtedness on three cross-collateralized mortgages. After such repayment, the amount owed on the three mortgages was $103,511, the three mortgages were combined into one mortgage, which is interest only instead of having a portion as self-amortizing, and matures in September 2014. The Company was in compliance with the financial covenants as of December 31, 2010. These loans have an outstanding principal balance of $25,000 and $35,551, respectively, as of December 31, 2010 and $25,000 and $35,723, respectively, as of December 31, 2009.
75
LEXINGTON REALTY TRUST
AND CONSOLIDATED SUBSIDIARIES
Notes to Consolidated Financial Statements (Continued)
($000 except per share/unit amounts)
Pursuant to the new loan agreements, the Company simultaneously entered into an interest-rate swap agreement with KeyBank to swap the LIBOR rate on the loans for a fixed rate of 4.9196% through March 2013, and the Company assumed a liability for the fair value of the swap at inception of approximately $5,696 ($5,280 and $5,241 at December 31, 2010 and 2009, respectively). The new debt is presented net of a discount at inception of $5,696 ($2,183 and $3,170 at December 31, 2010 and 2009, respectively). The discount is being amortized as interest expense over the term of the loans.
During 2010 and 2009, the Company, through property owner subsidiaries, obtained $59,769 and $11,540 aggregate original principal amount in non-recourse mortgages that bear interest at a weighted-average fixed rate of 5.2% and 6.4%, respectively, and have maturity dates ranging from 2014 to 2028.
Included in the Consolidated Statements of Operations, the Company recognized debt satisfaction gains (charges), net, excluding discontinued operations, of $968, $(85) and $(1,074) for the years ended December 31, 2010, 2009 and 2008, respectively, due to the satisfaction of mortgages and notes payable other than those disclosed elsewhere in these financial statements.
Contract right mortgage payable was a promissory note with a fixed interest rate of 9.68%, which was satisfied in full in 2010.
Mortgages payable and secured loans are generally collateralized by real estate and the related leases. Certain mortgages payable have yield maintenance or defeasance requirements relating to any prepayments. In addition, certain mortgages are cross-collateralized and cross-defaulted.
Scheduled principal and balloon payments for mortgages and notes payable for the next five years and thereafter are as follows:
|
Year ending
December 31,
|
Total
|
|||
|
2011
|
$ | 43,355 | ||
|
2012
|
219,260 | |||
|
2013 (1)
|
320,576 | |||
|
2014
|
262,814 | |||
|
2015
|
287,316 | |||
|
Thereafter
|
347,895 | |||
| $ | 1,481,216 | |||
(1) Amount is net of $2,183 in debt discounts.
(11) Convertible Notes, Exchangeable Notes and Trust Preferred Securities
During 2010, the Company issued $115,000 aggregate principal amount of 6.00% Convertible Guaranteed Notes. The notes pay interest semi-annually in arrears and mature in January 2030. The holders of the notes may require the Company to repurchase their notes in January 2017, January 2020 and January 2025 for cash equal to 100% of the notes to be repurchased, plus any accrued and unpaid interest. The Company may not redeem any notes prior to January 2017, except to preserve its REIT status. Thereafter, the Company may redeem the notes for cash equal to 100% of the notes to be redeemed. The notes have a current conversion rate of 141.1383 common shares per $1,000 principal amount of the notes, representing a conversion price of approximately $7.09 per common share. The conversion rate is subject to adjustment under certain circumstances, including increases in the Company's dividend rate above a certain threshold and the issuance of stock dividends. The notes are convertible by the holders under certain circumstances for cash, common shares or a combination of cash and common shares at the Company’s election. The notes are convertible prior to the close of business on the second business day immediately preceding the stated maturity date, at any time beginning in January 2029 and also upon the occurrence of specified events.
During 2007, the Company issued an aggregate $450,000 original principal amount of 5.45% Exchangeable Guaranteed Notes due in 2027. These notes can be put to the Company commencing in January 2012 and every five years thereafter through maturity and upon certain events. The Company may not redeem any notes prior to January 2012, except to preserve its REIT status. Thereafter, the Company may redeem the notes for cash equal to 100% of the notes to be redeemed. The notes are exchangeable by the holders into common shares of the Company at a current price of $19.49 per share, subject to adjustment upon certain events, including increases in the Company's dividend rate above a certain threshold and the issuance of stock dividends. Upon exchange, the holders of the notes would receive (1) cash equal to the principal amount of the note and (2) to the extent the exchange value exceeds the principal amount of the note, either cash or common shares of the Company at the Company’s option.
76
LEXINGTON REALTY TRUST
AND CONSOLIDATED SUBSIDIARIES
Notes to Consolidated Financial Statements (Continued)
($000 except per share/unit amounts)
Below is a summary of additional disclosures related to the 6.00% Convertible Guaranteed Notes and the 5.45% Exchangeable Guaranteed Notes.
|
6.00% Convertible Guaranteed Notes
|
5.45% Exchangeable Guaranteed Notes
|
|||||||||||||||
|
December 31,
|
December 31,
|
December 31,
|
December 31,
|
|||||||||||||
|
Balance Sheet:
|
2010
|
2009
|
2010
|
2009
|
||||||||||||
|
Principal amount of debt component
|
$ | 115,000 | $ | -- | $ | 62,150 | $ | 87,650 | ||||||||
|
Unamortized discount
|
(11,789 | ) | -- | (712 | ) | (1,941 | ) | |||||||||
|
Carrying amount of debt component
|
$ | 103,211 | $ | -- | $ | 61,438 | $ | 85,709 | ||||||||
|
Carrying amount of equity component
|
$ | 13,134 | $ | -- | $ | 20,293 | $ | 20,293 | ||||||||
|
Effective interest rate
|
7.5 | % | -- | 7.0 | % | 7.0 | % | |||||||||
|
Period through which discount is being amortized, put date
|
01/2017 | -- | 01/2012 | 01/2012 | ||||||||||||
|
Aggregate if-converted value in excess of aggregate principal amount
|
$ | 14,036 | -- | -- | -- | |||||||||||
|
December 31,
|
||||||||||||
|
Income Statement:
|
2010
|
2009
|
2008
|
|||||||||
|
6.00% Convertible Guaranteed Notes:
|
||||||||||||
|
Coupon interest
|
$ | 6,408 | $ | -- | $ | -- | ||||||
|
Discount amortization
|
1,776 | -- | -- | |||||||||
| $ | 8,184 | $ | -- | $ | -- | |||||||
|
5.45% Exchangeable Guaranteed Notes:
|
||||||||||||
|
Coupon interest
|
$ | 3,504 | $ | 7,554 | $ | 17,552 | ||||||
|
Discount amortization
|
689 | 1,479 | 3,544 | |||||||||
| $ | 4,193 | $ | 9,033 | $ | 21,096 | |||||||
During 2010, 2009 and 2008, the Company repurchased $25,500, $123,350 and $239,000, respectively, original principal amount of the 5.45% Exchangeable Guaranteed Notes for cash payments and issuances of common shares of the Company of $25,493, $101,006 and $192,984, respectively. As a result, the Company recognized a gain (charge) on debt extinguishment, net of $(760), $17,355 and $36,042, respectively, during 2010, 2009 and 2008, net of write-offs of $768, $4,989 and $12,793, respectively, of the unamortized debt discount and deferred financing costs.
During 2007, the Company issued $200,000 original principal amount of Trust Preferred Securities. The Trust Preferred Securities, which are classified as debt, are due in 2037, are redeemable by the Company commencing April 2012 and bear interest at a fixed rate of 6.804% through April 2017 and thereafter, at a variable rate of three month LIBOR plus 170 basis points through maturity. During 2008, the Company repurchased $70,880 original principal amount of the Trust Preferred Securities for a cash payment of $44,561, which resulted in a gain on debt extinguishment of $24,742 including a write-off of $1,577 in deferred financing costs. As of December 31, 2010 and 2009, there was $129,120 original principal amount of Trust Preferred Securities outstanding.
77
LEXINGTON REALTY TRUST
AND CONSOLIDATED SUBSIDIARIES
Notes to Consolidated Financial Statements (Continued)
($000 except per share/unit amounts)
Scheduled principal payments for these debt instruments for the next five years and thereafter are as follows:
|
Year ending
December 31,
|
Total
|
|||
|
2011
|
$ | — | ||
|
2012
(1)
|
61,438 | |||
|
2013
|
— | |||
|
2014
|
— | |||
|
2015
|
— | |||
|
Thereafter
(2)
|
232,331 | |||
| $ | 293,769 | |||
__________
|
(1)
|
Although the 5.45% Exchangeable Guaranteed Notes mature in 2027, the notes can be put to the Company in 2012. In addition, amount is net of $712 in debt discounts.
|
|
(2)
|
Amount is net of $11,789 in debt discounts.
|
(12)
Derivatives and Hedging Activities
Risk Management Objective of Using Derivatives
. The Company is exposed to certain risks arising from both its business operations and economic conditions. The Company principally manages its exposures to a wide variety of business and operational risks through management of its core business activities. The Company manages economic risks, including interest rate, liquidity, and credit risk primarily by managing the amount, sources, and duration of its debt funding and the use of derivative financial instruments. Specifically, the Company enters into derivative financial instruments to manage exposures that arise from business activities that result in the receipt or payment of future known and uncertain cash amounts, the value of which are determined by interest rates and other factors. The Company’s derivative financial instruments are used to manage differences in the amount, timing, and duration of the Company’s known or expected cash receipts and its known or expected cash payments principally related to the Company’s investments and borrowings.
Cash Flow Hedges of Interest Rate Risk
. The Company’s objectives in using interest rate derivatives are to add stability to interest expense, to manage its exposure to interest rate movements and therefore manage its cash outflows as it relates to the underlying debt instruments. To accomplish this objective, the Company primarily uses interest rate swaps as part of its interest rate risk management strategy relating to certain of its variable rate debt instruments. Interest rate swaps designated as cash flow hedges involve the receipt of variable-rate amounts from a counterparty in exchange for the Company making fixed-rate payments over the life of the agreements without exchange of the underlying notional amount.
The effective portion of changes in the fair value of derivatives designated and that qualify as cash flow hedges is recorded in accumulated other comprehensive income (loss) and is subsequently reclassified into earnings in the period that the hedged forecasted transaction affects earnings. The ineffective portion of the change in fair value of the derivatives is recognized directly in earnings.
The Company has designated the interest-rate swap agreement with KeyBank as a cash flow hedge of the risk of variability attributable to changes in the LIBOR swap rate on $35,551 and $25,000 of LIBOR-indexed variable-rate secured term loans. Accordingly, changes in the fair value of the swap are recorded in other comprehensive income (loss) and reclassified to earnings as interest becomes receivable or payable. Because the fair value of the swap at inception of the hedge was not zero, the Company cannot assume that there will be no ineffectiveness in the hedging relationship. However, the Company expects the hedging relationship to be highly effective and will measure and report any ineffectiveness in earnings. During 2008, the Company terminated a portion of the swap for a notional amount of $9,277 due to a payment of the same amount on the term loan. The Company recognized $253 of interest expense during 2008 due to the swap’s ineffectiveness and forecasted transactions no longer being probable.
Amounts reported in accumulated other comprehensive income (loss) related to derivatives will be reclassified to interest expense as interest payments are made on these secured term loans. During the next 12 months, the Company estimates that an additional $1,748 will be reclassified to earnings as an increase to interest expense.
78
LEXINGTON REALTY TRUST
AND CONSOLIDATED SUBSIDIARIES
Notes to Consolidated Financial Statements (Continued)
($000 except per share/unit amounts)
As of December 31, 2010, the Company had the following outstanding interest rate derivative that was designated as a cash flow hedge of interest rate risk:
|
Interest Rate Derivative
|
Number of Instruments
|
Notional
|
|
Interest Rate Swap
|
1
|
$60,551
|
Derivatives Not Designated as Hedges
The Company does not use derivatives for trading or speculative purposes. As of December 31, 2010, the Company had the following outstanding derivative that was not designated as a hedge in a qualifying hedging relationship:
|
Product
|
Number of Instruments
|
Notional
|
|
Forward purchase equity commitment
|
1
|
$31,598
|
During 2008, the Company entered into a forward purchase equity commitment with a financial institution to finance the repurchase of 3,500,000 common shares of the Company at $5.60 per share, under the Company’s common share repurchase plan as approved by the Board of Trustees. The Company has prepaid $15,576 with the remainder to be paid in October 2011 through (i) physical settlement or (ii) net cash settlement, net share settlement or a combination of both, at the Company’s option. The Company agreed to make floating payments during the term of the forward purchase at LIBOR plus 250 basis points per annum and the Company retains the cash dividends paid on the common shares, however, the counterparty retains any stock dividends as additional collateral. In addition, the Company may be required to make additional prepayments pursuant to the forward purchase equity commitment. The Company’s third party consultant determined the fair value of the equity commitment to be $27,574 and $20,141 at December 31, 2010 and 2009, respectively, and the Company recognized earnings during 2010 and 2009 of $8,906 and $7,182 and losses of $2,128 during 2008, primarily relating to the increase (decrease) in the fair value of the common shares held as collateral.
The table below presents the fair value of the Company’s derivative financial instruments as well as their classification on the Consolidated Balance Sheets as of December 31, 2010 and 2009.
|
|
As of December 31, 2010
|
As of December 31, 2009
|
||||||||
|
|
Balance Sheet Location
|
Fair Value
|
Balance Sheet Location
|
Fair Value
|
||||||
|
Derivatives designated as hedging instruments
|
|
|
||||||||
|
Interest Rate Swap Liability
|
Accounts Payable and Other Liabilities
|
$ | (5,280 | ) |
Accounts Payable and Other Liabilities
|
$ | (5,241 | ) | ||
|
|
||||||||||
|
|
||||||||||
|
Derivatives
not
designated as hedging instruments
|
||||||||||
|
Forward Purchase Equity Commitment
|
Other Assets
|
$ | 27,574 |
Other Assets
|
$ | 20,141 | ||||
|
|
|
|
||||||||
79
LEXINGTON REALTY TRUST
AND CONSOLIDATED SUBSIDIARIES
Notes to Consolidated Financial Statements (Continued)
($000 except per share/unit amounts)
The tables below present the effect of the Company’s derivative financial instruments on the Consolidated Statements of Operations for 2010 and 2009.
|
Derivatives in Cash Flow Hedging Relationships
|
Amount of Gain (Loss) Recognized in OCI on Derivative (Effective Portion)
December 31,
|
Location of Loss Reclassified from Accumulated OCI into Income (Effective Portion)
|
Amount of Loss Reclassified from Accumulated OCI into Income (Effective Portion)
December 31,
|
||||||||||||||
|
2010
|
2009
|
2010
|
2009
|
||||||||||||||
|
Interest Rate Swap
|
$ | (2,914 | ) | $ | (990 | ) |
Interest expense
|
$ | 2,875 | $ | 2,805 | ||||||
|
Derivatives Not Designated as Hedging Instruments
|
Location of Gain or (Loss) Recognized in Income on Derivative
|
Amount of Gain or (Loss) Recognized in Income on Derivative
December 31,
|
|||||||
|
2010
|
2009
|
||||||||
|
Forward Purchase Equity
Commitment
|
Change in value of forward equity commitment
|
$ | 8,906 | $ | 7,182 | ||||
The Company’s agreement with the swap derivative counterparty contains a provision whereby if the Company defaults on the underlying indebtedness, including default where repayment of the indebtedness has not been accelerated by the lender, then the Company could also be declared in default of the swap derivative obligation. As of December 31, 2010, the Company has not posted any collateral related to the agreement. If the Company had breached any of these provisions at December 31, 2010, it would have been required to settle its obligations under the agreements at the termination value of $5,633, which includes accrued interest.
The Company’s forward purchase equity commitment contains default provisions, which, if triggered, would require the Company to settle the contract. The settlement value of the contract at December 31, 2010 was $4,024, net of prepayments.
(13) Leases
Lessor:
Minimum future rental receipts under the non-cancellable portion of tenant leases, assuming no new or re-negotiated leases, for the next five years and thereafter are as follows:
|
Year ending
December 31,
|
Total
|
|||
|
2011
|
$ | 302,867 | ||
|
2012
|
276,783 | |||
|
2013
|
241,304 | |||
|
2014
|
203,401 | |||
|
2015
|
169,468 | |||
|
Thereafter
|
691,556 | |||
| $ | 1,885,379 | |||
The above minimum lease payments do not include reimbursements to be received from tenants for certain operating expenses and real estate taxes and do not include early termination payments provided for in certain leases.
Certain leases allow for the tenant to terminate the lease if the property is deemed obsolete, as defined, and upon payment of a termination fee to the landlord, as stipulated in the lease. In addition, certain leases provide the tenant with the right to purchase the leased property at fair market value or a stipulated price.
80
LEXINGTON REALTY TRUST
AND CONSOLIDATED SUBSIDIARIES
Notes to Consolidated Financial Statements (Continued)
($000 except per share/unit amounts)
Lessee:
The Company holds, through property owner subsidiaries, leasehold interests in various properties. Generally, the ground rents on these properties are either paid directly by the tenants to the fee holder or reimbursed to the Company as additional rent. Certain properties are economically owned through the holding of industrial revenue bonds and as such neither ground lease payments nor bond debt service payments are made or received, respectively. For certain of these properties, the Company has an option to purchase the fee interest.
Minimum future rental payments under non-cancellable leasehold interests, excluding leases held through industrial revenue bonds and lease payments in the future that are based upon fair market value, for the next five years and thereafter are as follows:
|
Year ending
December 31,
|
Total
|
|||
|
2011
|
$ | 2,267 | ||
|
2012
|
2,488 | |||
|
2013
|
2,299 | |||
|
2014
|
1,888 | |||
|
2015
|
1,701 | |||
|
Thereafter
|
14,909 | |||
| $ | 25,552 | |||
Rent expense for the leasehold interests, including discontinued operations, was $955, $1,039 and $995 in 2010, 2009 and 2008, respectively.
The Company leases its corporate headquarters. The lease expires December 2015, with rent fixed at $1,299 per annum through December 2011 and will be adjusted to fair market value, as defined in the lease, thereafter. The Company is also responsible for its proportionate share of operating expenses and real estate taxes above a base year. As an incentive to enter the lease, the Company received a payment of $845 which it is amortizing as a reduction of rent expense. In addition, the Company leases office space for its two regional offices. The minimum lease payments for the Company’s offices are $1,382 for 2011, $41 for 2012, $42 for 2013 and $11 for 2014. Rent expense for 2010, 2009 and 2008 was $1,272, $1,282 and $958, respectively, and is included in general and administrative expenses.
(14) Noncontrolling Interests
In conjunction with several of the Company’s acquisitions in prior years, sellers were issued OP units as a form of consideration in exchange for properties. Substantially all OP units, other than the OP units held directly or indirectly by the Company, are redeemable at certain times, only at the option of the holders, and are not otherwise mandatorily redeemable by the Company. The OP units are classified as a component of permanent equity as the Company determined that the OP units are not redeemable securities as defined by GAAP. Each OP unit is currently redeemable for approximately 1.13 common shares, subject to future adjustments.
As of December 31, 2010, there were approximately 4,380,000 OP units outstanding, of which approximately 1,474,000 are held by related parties. All OP units receive distributions in accordance with their respective partnership agreements. To the extent that the Company’s dividend per share is less than the stated distribution per unit per the applicable partnership agreement, the stated distributions per unit are reduced by the percentage reduction in the Company’s dividend. The Company is party to a funding agreement with the Company’s operating partnerships under which the Company may be required to fund distributions made on account of OP units. No OP units have a liquidation preference.
81
LEXINGTON REALTY TRUST
AND CONSOLIDATED SUBSIDIARIES
Notes to Consolidated Financial Statements (Continued)
($000 except per share/unit amounts)
The following discloses the effects of changes in the Company’s ownership interests in its noncontrolling interests:
|
Net Income (Loss) Attributable to Lexington Realty Trust Shareholders and Transfers (to) from Noncontrolling Interests
|
||||||||||||
|
2010
|
2009
|
2008
|
||||||||||
|
Net income (loss) attributable to Lexington Realty Trust shareholders
|
$ | (32,960 | ) | $ | (210,152 | ) | $ | 2,754 | ||||
|
Transfers from noncontrolling interests:
|
||||||||||||
|
Increase in additional paid-in-capital/common shares for redemption/repurchase of noncontrolling interest OP units
|
2,685 | 3,580 | 516,696 | |||||||||
|
Decrease in accumulated other comprehensive income for redemption of noncontrolling interest OP units
|
-- | -- | (5,019 | ) | ||||||||
|
Change from net income (loss) attributable to Lexington Realty Trust shareholders and transfers (to) from noncontrolling interest
|
$ | (30,275 | ) | $ | (206,572 | ) | $ | 514,431 | ||||
(15) Shareholders’ Equity
During 2010, the Company issued 22,425,000 common shares in two equity offerings raising net proceeds of $157,795.
During 2009, the Company declared that three of its quarterly common share dividends would be paid in a combination of cash (10% in the aggregate) and common shares. The following details the declared 2009 quarterly common share dividends:
|
Dividend
|
Per common
share amount
|
Dividend
|
Common Shares Issued
|
Cash Paid
|
|||||||||
|
First quarter 2009
|
$ | 0.18 |
April 24, 2009
|
5,097,229 | $ | 1,819 | |||||||
|
Second quarter 2009
|
$ | 0.18 |
July 30, 2009
|
4,333,183 | $ | 1,970 | |||||||
|
Third quarter 2009
|
$ | 0.18 |
October 16, 2009
|
3,873,786 | $ | 2,110 | |||||||
|
Fourth quarter 2009
|
$ | 0.10 |
January 15, 2010
|
- | $ | 12,194 | |||||||
During 2010 and 2009, the Company issued 1,287,980 and 4,338,915 common shares, respectively, under its direct share purchase plan, raising net proceeds of $8,632 and $20,947, respectively.
In June 2009, the Company converted 503,100 shares of its Series C Preferred by issuing 2,955,368 of its common shares. The difference between the fair value of common shares issued and the fair value of common shares issuable pursuant to the original conversion terms of $6,994 is considered a deemed dividend and as such is recorded as a reduction in shareholders' equity and as an increase to preferred dividends paid for calculating earnings (loss) per share, even though the conversion was for equivalent fair values.
During 2008, the Company repurchased and retired 501,700 shares of Series C Preferred by issuing 727,759 of its common shares and paying $7,522 in cash. The difference between the cost to retire these shares of Series C Preferred and the historical cost of these shares was $5,678 and is treated as an increase to shareholders’ equity and as a reduction in preferred dividends paid for calculating earnings (loss) per share.
On June 30, 2008, the Company issued 3,450,000 of its common shares raising net proceeds of approximately $47,237. The proceeds, along with cash held, were used to retire $25,000 original principal amount of the 5.45% Exchangeable Guaranteed Notes at a price plus accrued interest of $22,937, and $67,755 original principal amount of the Trust Preferred Securities at a price plus accrued interest of $43,454.
82
LEXINGTON REALTY TRUST
AND CONSOLIDATED SUBSIDIARIES
Notes to Consolidated Financial Statements (Continued)
($000 except per share/unit amounts)
During 2008, the Company repurchased and retired 1,213,251 of its common shares and OP units under a repurchase plan authorized by the Company’s Board of Trustees. The common shares and OP units were repurchased in the open market and through private transactions with employees and third parties at an average price of $14.28 per common share/OP unit. As of December 31, 2010, approximately 1,057,000 common shares/OP units were eligible for repurchase under the current authorization adopted by the Company’s Board of Trustees in December 2007.
The Company has 2,095,200 shares of Series C Preferred, outstanding at December 31, 2010. The shares have a dividend of $3.25 per share per annum, have a liquidation preference of $104,760, and the Company, if certain common share prices are achieved, can force conversion into common shares of the Company. The shares are currently convertible into 2.4339 common shares. This conversion ratio may increase over time if the Company’s common share dividend exceeds certain quarterly thresholds.
If certain fundamental changes occur, holders may require the Company, in certain circumstances, to repurchase all or part of their Series C Preferred. In addition, upon the occurrence of certain fundamental changes, the Company will, under certain circumstances, increase the conversion rate by a number of additional common shares or, in lieu thereof, may in certain circumstances elect to adjust the conversion rate upon the Series C Preferred becoming convertible into shares of the public acquiring or surviving company.
The Company may, at the Company’s option, cause the Series C Preferred to be automatically converted into that number of common shares that are issuable at the then prevailing conversion rate. The Company may exercise its conversion right only if, at certain times, the closing price of the Company’s common shares equals or exceeds 125% of the then prevailing conversion price of the Series C Preferred.
Investors in the Series C Preferred generally have no voting rights, but will have limited voting rights if the Company fails to pay dividends for six or more quarters and under certain other circumstances. Upon conversion, the Company may choose to deliver the conversion value to investors in cash, common shares, or a combination of cash and common shares.
During 2010, 2009 and 2008, holders of an aggregate of 406,178, 520,487 and 34,377,989 OP units, respectively, redeemed such OP units for common shares of the Company. These redemptions resulted in an aggregate increase in shareholders’ equity and corresponding decrease in noncontrolling interest of $2,685, $3,580 and $511,521, respectively.
During 2010, 2009 and 2008, the Company issued 361,320, 376,400 and 211,125 of its common shares, respectively, to certain employees and trustees. Common shares issued generally vest ratably, on anniversaries of the grant date, however in certain situations the vesting is cliff-based after a specific number of years and/or subject to meeting certain performance criteria. See note 16.
The following represents the components of accumulated other comprehensive income (loss) as of December 31,
|
2010
|
2009
|
2008
|
||||||||||
|
Unrealized gain on foreign currency translation
|
$ | -- | $ | 740 | $ | 759 | ||||||
|
Unrealized loss on interest rate swap, net
|
(106 | ) | (67 | ) | (1,882 | ) | ||||||
|
Unrealized loss from non-consolidated entities
|
-- | -- | (14,527 | ) | ||||||||
|
Total accumulated other comprehensive income (loss)
|
$ | (106 | ) | $ | 673 | $ | (15,650 | ) | ||||
(16) Benefit Plans
The Company maintains an equity award plan pursuant to which qualified and non-qualified options may be issued. The Company granted 1,248,501, 1,265,500 and 2,000,000 common share options on December 31, 2010 (“2010 options”), January 8, 2010 (“2009 options”) and December 31, 2008 (“2008 options”), respectively, at an exercise price of $7.95, $6.39 and $5.60, respectively. The 2010 options (1) vest 20% annually on each December 31, 2011 through 2015 and (2) terminate on the earlier of (x) six months of termination of service with the Company and (y) December 31, 2020. The 2009 options (1) vest 20% annually on each December 31, 2010 through 2014 and (2) terminate on the earlier of (x) six months of termination of service with the Company and (y) December 31, 2019. The 2008 options (1) vest 50% following a 20-day trading period where the average closing price of a common share of the Company on the New York Stock Exchange is $8.00 or higher and 50% following a 20-day trading period where the average closing price is $10.00 or higher and (2) expire December 2018. As a result of the share dividends paid in 2009, each of the 2008 options is exchangeable for approximately 1.13 common shares at an exercise price of $4.97 per common share.
83
LEXINGTON REALTY TRUST
AND CONSOLIDATED SUBSIDIARIES
Notes to Consolidated Financial Statements (Continued)
($000 except per share/unit amounts)
The Company engaged third parties to value the options as of the grant date. The third parties determined the value to be $2,422 and $2,771 for the 2010 options and the 2009 options, respectively, using the Black-Scholes model and $2,480 for the 2008 options using the Monte Carlo simulation model. The options are considered equity awards as they are settled through the issuance of common shares. As such, the options were valued as of the date of the grant and do not require subsequent remeasurement. There were several assumptions used to fair value the options including the expected volatility in the Company’s common share price based upon the fluctuation in the Company’s historical common share price. The more significant assumptions underlying the determination of fair value for options granted were as follows:
|
2010 Options
|
2009 Options
|
2008 Options
|
||||||||||
|
Weighted-average fair value of options granted
|
$ | 1.94 | $ | 2.19 | $ | 1.24 | ||||||
|
Weighted-average risk-free interest rate
|
2.54 | % | 3.29 | % | 1.33 | % | ||||||
|
Weighted-average expected option lives (in years)
|
6.50 | 6.70 | 3.60 | |||||||||
|
Weighted-average expected volatility
|
49.00 | % | 59.08 | % | 59.94 | % | ||||||
|
Weighted-average expected dividend yield
|
7.40 | % | 6.26 | % | 14.40 | % | ||||||
In addition, the Company recognizes compensation expense relating to these options over an average of 5.0 years for the 2010 options and 2009 options and 3.6 years for the 2008 options. The Company recognized $1,824 and $688 in compensation expense during 2010 and 2009, respectively, relating to options, $629 of the 2010 amount reflects the accelerated vesting of certain 2008 options due to performance criteria being met. The Company has unrecognized compensation costs of $5,139 relating to the outstanding options as of December 31, 2010.
Share option activity during the years indicated is as follows:
|
|
Number of
Shares
|
Weighted-Average
Exercise Price
Per Share
|
||||||
|
Balance at December 31, 2007
|
— | $ | — | |||||
|
Granted (1)
|
2,252,000 | 4.97 | ||||||
|
Balance at December 31, 2008
|
2,252,000 | 4.97 | ||||||
|
Granted
|
— | — | ||||||
|
Balance at December 31, 2009
|
2,252,000 | 4.97 | ||||||
|
Granted
|
2,514,001 | 7.16 | ||||||
|
Exercised
|
(352,628 | ) | 4.97 | |||||
|
Forfeited
|
(23,768 | ) | 5.18 | |||||
|
Balance at December 31, 2010
|
4,389,605 | $ | 6.23 | |||||
|
(1)
|
As adjusted as a result of share dividends paid in 2009
|
Non-vested share activity for the years ended December 31, 2010 and 2009, is as follows:
|
Number of
Shares
|
Weighted-Average
Value Per Share
|
|||||||
|
Balance at December 31, 2008
|
487,544 | $ | 19.48 | |||||
|
Granted
|
376,400 | 4.94 | ||||||
|
Vested
|
(120,602 | ) | 12.28 | |||||
|
Balance at December 31, 2009
|
743,342 | 13.28 | ||||||
|
Granted
|
267,170 | 7.95 | ||||||
|
Vested
|
(169,215 | ) | 18.87 | |||||
|
Forfeited
|
(21,720 | ) | 22.10 | |||||
|
Balance at December 31, 2010
|
819,577 | $ | 10.16 | |||||
As of December 31, 2010, of the remaining 819,577 non-vested shares, 395,736 are subject to time vesting and 423,841 are subject to performance vesting. At December 31, 2010, there are 20,158 awards available for grant. The Company has $3,985 in unrecognized compensation costs relating to the non-vested shares that will be charged to compensation expense over an average of approximately 2.6 years.
During 2010, 2009 and 2008, the Company recognized $3,232, $3,369 and $3,980, respectively, in compensation expense relating to share grants to trustees and employees.
84
LEXINGTON REALTY TRUST
AND CONSOLIDATED SUBSIDIARIES
Notes to Consolidated Financial Statements (Continued)
($000 except per share/unit amounts)
The Company has established a trust for certain officers in which vested common shares granted for the benefit of the officers are deposited. The officers exert no control over the common shares in the trust and the common shares are available to the general creditors of the Company. As of December 31, 2010 and 2009, there were 427,531 common shares in the trust.
During 2008, the Company and a former executive officer and his affiliate entered into a Services and Non-Compete Agreement and a Separation and General Release. In addition to an aggregate cash payment of $1,500 paid in 2008, non-vested common shares previously issued to the officer were accelerated and immediately vested which resulted in a charge of $265.
The Company sponsors a 401(k) retirement savings plan covering all eligible employees. The Company matched 100% of the first 1.0% in 2010 and approximately 1.125% in 2009 of employee contributions. In addition, based on its profitability, the Company may make a discretionary contribution at each fiscal year end to all eligible employees. The matching and discretionary contributions are subject to vesting under a schedule providing for 25% annual vesting starting with the first year of employment and 100% vesting after four years of employment. Approximately $311, $321 and $366 of contributions are applicable to 2010, 2009 and 2008, respectively.
(17) Income Taxes
The provision for income taxes relates primarily to the taxable income of the Company’s taxable REIT subsidiaries. The earnings, other than in taxable REIT subsidiaries, of the Company are not generally subject to Federal income taxes at the Company level due to the REIT election made by the Company.
Income taxes have been provided for on the asset and liability method. Under the asset and liability method, deferred income taxes are recognized for the temporary differences between the financial reporting basis and the tax basis of assets and liabilities.
The Company’s provision for income taxes for the years ended December 31, 2010, 2009 and 2008 is summarized as follows:
|
2010
|
2009
|
2008
|
||||||||||
|
Current:
|
||||||||||||
|
Federal
|
$ | -- | $ | (401 | ) | $ | (395 | ) | ||||
|
State and local
|
(1,085 | ) | (2,103 | ) | (1,863 | ) | ||||||
|
NOL utilized
|
-- | 343 | 629 | |||||||||
|
Deferred:
|
||||||||||||
|
Federal
|
(418 | ) | (187 | ) | (972 | ) | ||||||
|
State and local
|
(53 | ) | (26 | ) | (381 | ) | ||||||
| $ | (1,556 | ) | $ | (2,374 | ) | $ | (2,982 | ) | ||||
Deferred tax liabilities of $1,127 and $638 are included in other liabilities on the accompanying Consolidated Balance Sheets at December 31, 2010 and 2009, respectively. These deferred tax liabilities relate primarily to differences in the timing of the recognition of income/(loss) between GAAP and tax, basis of real estate investments and net operating loss carry forwards.
The income tax provision differs from the amount computed by applying the statutory federal income tax rate to pre-tax operating income as follows:
|
2010
|
2009
|
2008
|
||||||||||
|
Federal provision at statutory tax rate (34%)
|
$ | (388 | ) | $ | (376 | ) | $ | (397 | ) | |||
|
State and local taxes, net of federal benefit
|
(31 | ) | (33 | ) | (45 | ) | ||||||
|
Other
|
(1,137 | ) | (1,965 | ) | (2,540 | ) | ||||||
| $ | (1,556 | ) | $ | (2,374 | ) | $ | (2,982 | ) | ||||
For the years ended December 31, 2010, 2009 and 2008, the “other” amount is comprised primarily of state taxes of $1,084, $2,047 and $1,801, respectively, and the write-off of deferred tax assets of $0, $0 and $742, respectively, relating to the dissolution of certain of the Company’s taxable subsidiaries.
As of December 31, 2010 and 2009, the Company has estimated net operating loss carry forwards for federal income tax reporting purposes of $4,156 and $2,549, respectively, which would begin to expire in tax year 2025. No valuation allowances have been recorded against deferred tax assets as the Company believes they are fully realizable, based upon projected future taxable income.
85
LEXINGTON REALTY TRUST
AND CONSOLIDATED SUBSIDIARIES
Notes to Consolidated Financial Statements (Continued)
($000 except per share/unit amounts)
(18) Commitments and Contingencies
In addition to the commitments and contingencies disclosed elsewhere, the Company has the following commitments and contingencies.
From time to time the Company is involved directly or indirectly in legal proceedings arising in the ordinary course of business. Management believes, based on currently available information and after consultation with legal counsel, that the results of such proceedings, in the aggregate, will not have a material adverse effect on the Company’s financial condition, but may be material to the Company’s operating results for any particular period, depending, in part, upon the operating results for such period.
Deutsche Bank Securities, Inc. and SPCP Group LLC v. Lexington Drake, L.P., et al. (Supreme Court of the State of New York-Index No. 603051/08)
On June 30, 2006, one of the Company’s property owner subsidiaries and a property owner subsidiary of a then co-investment program respectively sold to Deutsche Bank Securities, Inc., (“Deutsche Bank”), (1) a $7,680 bankruptcy damage claim against Dana Corporation for $5,376, (“Farmington Hills claim”) and (2) a $7,727 bankruptcy damage claim against Dana Corporation for $5,680, (“Antioch claim”). Under the terms of the agreements covering the sale of the claims, which were guaranteed by the Company, the property owner subsidiaries are obligated to reimburse Deutsche Bank should the claim ever be disallowed, subordinated or otherwise impaired, to the extent of such disallowance, subordination or impairment, plus interest at the rate of 10% per annum from the date of payment of the purchase price by Deutsche Bank. On October 12, 2007, Dana Corporation filed an objection to both claims. The holders of the claims, without the Company's consent, settled the allowed amount of the claims at $6,500 for the Farmington Hills claim and $7,200 for the Antioch claim in order to participate in a special settlement pool for allowed intangible unsecured claims and a preferred share rights offering having a value thought to be equal to, or greater than, the reduction of the claims. Deutsche Bank and SPCP Group, LLC filed a summons and complaint with the Supreme Court of the State of New York, County of New York for the Farmington Hills and Antioch claims, and claimed damages of $1,200 plus interest and expenses.
On November 22, 2010, the court ruled in favor of the plaintiffs on their motion for summary judgment. The court referred the issue of damages to a special referee to determine the value of plaintiffs’ participation in the preferred share rights offering and a settlement pool for allowed intelligible unsecured claims so as to be taken into consideration with respect to computation of damages, if any.
The Company filed a notice of appeal and intends to appeal the court’s ruling if the special referee determines there are damages. The Company has not recorded any liability relating to these claims. The Company is unable to estimate a loss or range of losses, as it relates to these claims.
Experian Information Solutions, Inc. v. Lexington Allen L.P., Lexington Allen Manager LLC and Lexington Realty Trust (United States District Court for the Eastern District of Texas Sherman Division – Civil Action No. 4:10cv144)
On March 29, 2010, Experian Information Solutions, Inc. (“Experian”), filed a complaint against Lexington Allen L.P., a wholly owned subsidiary of NLS, and the Company for breach of lease agreement, fraud/fraudulent inducement, claim under Section 91.004 of the Texas Property Code (breach of lease and ability to obtain a lien on other landlord non-exempt property), promissory estoppel, quantum meruit and that Lexington Allen L.P. was the Company's "alter-ego" in connection with the alleged failure of Lexington Allen L.P. to fund up to $5,854 of tenant improvements.
On January 24, 2011, the Company filed a motion for summary judgment for all claims against it. On February 18, 2011, Experian filed a motion in opposition to the motion for summary judgment. The Company has not recorded any liability relating to these claims. The Company is unable to estimate a loss or range of losses as it relates to these claims.
Other.
Certain employees have employment contracts and are entitled to severance benefits in the case of a change of control, as defined in the employment contract.
The Company, including its non-consolidated entities, are obligated under certain tenant leases to fund tenant improvements and the expansion of the underlying leased properties.
During 2010, the Company, through a property owner subsidiary, executed a purchase and sale agreement to acquire, upon completion of construction and occupancy by the tenant, a 514,000 square foot industrial facility located in Byhalia, Mississippi for an anticipated cost of $27,500. The facility will be leased to ASICS America Corporation, with ASICS Corporation as guarantor, for a term of 15 years upon completion of construction, which is expected to occur in the second quarter of 2011.
During 2010, the Company, through a lender subsidiary, executed a contract to fund the construction of a 672,000 square foot industrial facility located in Shelby, North Carolina for an estimated cost of approximately $24,000. The Company, through a property owner subsidiary, intends to purchase the facility upon completion of construction and commencement of a 20 year net-lease to Clearwater Paper Corporation, which is expected to occur in the second quarter of 2011. The Company has variable interests in the developer entities constructing the facilities but is not the primary beneficiary of the entities as the Company does not have a controlling financial interest.
86
LEXINGTON REALTY TRUST
AND CONSOLIDATED SUBSIDIARIES
Notes to Consolidated Financial Statements (Continued)
($000 except per share/unit amounts)
(19) Related Party Transactions
In addition to related party transactions disclosed elsewhere, the Company was a party to the following related party transactions.
All related party acquisitions, sales and loans were approved by the independent members of the Company’s Board of Trustees or the Audit Committee.
During 2010, the Company advanced a NLS entity $7,614 in the form of a 6.93% interest bearing, non-recourse mortgage note to satisfy a maturing non-recourse mortgage. The mortgage note due the Company is scheduled to mature April 2011.
On March 20, 2008, the Company entered into a Services and Non-Compete Agreement with its former Executive Chairman and Director of Strategic Acquisitions and his affiliate, which provides that the Company’s former Executive Chairman and Director of Strategic Acquisitions and his affiliate will provide the Company with certain asset management services in exchange for $1,500. The $1,500 is included in general and administrative expenses in the Consolidated Statement of Operations for the year ended December 31, 2008.
A mortgage note payable with an outstanding balance as of December 31, 2009 of $3,808 was owed to an entity owned by significant shareholders and the former Executive Chairman and Director of Strategic Acquisitions. The mortgage was assumed in connection with the merger with Newkirk. The mortgage was satisfied in 2010 in connection with the sale of the underlying collateral. In addition, the Company leases four properties to entities owned by significant shareholders and/or the former Executive Chairman and Director of Strategic Acquisitions. During 2010, 2009 and 2008, the Company recognized $905, $1,538 and $1,575, respectively, in rental revenue from these properties. The Company leases its corporate office in New York City from an affiliate of Vornado Realty Trust, a significant shareholder. Rent expense for this property was $1,272, $1,282 and $865 in 2010, 2009 and 2008, respectively.
Winthrop, an affiliate of the Company’s former Executive Chairman and Director of Strategic Acquisitions, is a one-third partner in Concord and CDH CDO and was a 50% partner in Lex-Win Concord (see note 9).
In addition, the Company earns fees from certain of its non-consolidated investments (see note 9).
The Company has an indemnity obligation to Vornado Realty Trust with respect to actions by the Company that affect Vornado Realty Trust’s status as a REIT.
(20) Concentration of Risk
The Company seeks to reduce its operating and leasing risks through diversification achieved by the geographic distribution of its properties, avoiding dependency on a single property and the creditworthiness of its tenants.
For the years ended December 31, 2010, 2009 and 2008, no tenant represented 10% or more of gross revenues.
Cash and cash equivalent balances may exceed insurable amounts. The Company believes it mitigates risk by investing in or through major financial institutions.
(21) Supplemental Disclosure of Statement of Cash Flow Information
In addition to disclosures discussed elsewhere, during 2010, 2009 and 2008, the Company paid $114,031, $132,376 and $160,134, respectively, for interest and $1,019, $2,483 and $767, respectively, for income taxes.
During 2010, the Company sold interests in three properties, which included the assumption of the aggregate related non-recourse mortgage debt of $74,504.
During 2010, 2009 and 2008, the Company had a net increase (decrease) in the non-cash accruals for real estate, deferred leasing costs and deferred financing costs of $1,820, $5,639 and ($14,333), respectively.
During 2009, the Company acquired, through a property owner subsidiary, the remainder interests in land with an estimated fair value of $2,500 in connection with a tenant's lease surrender obligation.
87
LEXINGTON REALTY TRUST
AND CONSOLIDATED SUBSIDIARIES
Notes to Consolidated Financial Statements (Continued)
($000 except per share/unit amounts)
During 2009, the Company conveyed its interests in three properties to lenders in full satisfaction of the aggregate $38,022 non-recourse mortgage notes payable. The Company recognized aggregate net gains on debt satisfaction of $13,180 relating to these transactions.
In connection with the formation of NLS, the Company contributed real estate and intangibles, net of accumulated depreciation and amortization, of $90,200 to NLS in 2008. The Company’s contributed or sold properties to NLS with consolidated mortgage notes payable in the amount of $155,824, which were assumed by NLS.
During 2008, the Company, through a property owner subsidiary, assumed a $7,545 mortgage note payable in connection with a property acquisition.
During 2008, the Company, through a property owner subsidiary, received land in a lease termination transaction with an appraised value of $16,000, which is included in non-operating income in the Consolidated Statement of Operations.
During 2008, the Company entered into a swap obligation with an initial value of $5,696, which was reflected as a reduction of mortgages payable and included in accounts payable and other liabilities.
During 2008, the Company sold its interests in one property through foreclosure with a mortgage principal balance of $6,516 and an asset carrying value of $6,488.
During 2008, the Company issued 1,620,879 common shares (with a value at issuance of $23,505) and cash of $5,432 to repurchase $32,500 of 5.45% Exchangeable Guaranteed Notes.
(22) Unaudited Quarterly Financial Data
|
2010
|
||||||||||||||||
|
|
3/31/2010
|
6/30/2010
|
9/30/2010
|
12/31/2010
|
||||||||||||
|
Total gross revenues(1)
|
$ | 85,818 | $ | 84,636 | $ | 86,719 | $ | 85,682 | ||||||||
|
Net income (loss)
|
$ | (29,326 | ) | $ | (29,701 | ) | $ | 7,340 | $ | 14,277 | ||||||
|
Net income (loss) attributable to common shareholders
|
$ | (33,048 | ) | $ | (30,379 | ) | $ | 58 | $ | 5,273 | ||||||
|
Net income (loss) attributable to common shareholders — basic and diluted per share
|
$ | (0.27 | ) | $ | (0.23 | ) | $ | 0.00 | $ | 0.04 | ||||||
|
2009
|
||||||||||||||||
|
3/31/2009
|
6/30/2009
|
9/30/2009
|
12/31/2009
|
|||||||||||||
|
Total gross revenues(1)
|
$ | 89,310 | $ | 91,107 | $ | 90,089 | $ | 85,810 | ||||||||
|
Net loss
|
$ | (63,821 | ) | $ | (76,393 | ) | $ | (22,131 | ) | $ | (48,927 | ) | ||||
|
Net loss attributable to common shareholders
|
$ | (71,702 | ) | $ | (90,450 | ) | $ | (28,474 | ) | $ | (52,250 | ) | ||||
|
Net loss attributable to common shareholders — basic and diluted per share
|
$ | (0.72 | ) | $ | (0.87 | ) | $ | (0.25 | ) | $ | (0.43 | ) | ||||
__________
|
(1)
|
All periods have been adjusted to reflect the impact of properties sold during the years ended December 31, 2010 and 2009, and properties classified as held for sale, which are reflected in discontinued operations in the Consolidated Statements of Operations.
|
The sum of the quarterly income (loss) per common share amounts may not equal the full year amounts primarily because the computations of the weighted-average number of common shares of the Company outstanding for each quarter and the full year are made independently.
88
LEXINGTON REALTY TRUST
AND CONSOLIDATED SUBSIDIARIES
Notes to Consolidated Financial Statements (Continued)
($000 except per share/unit amounts)
(23) Subsequent Events
Subsequent to December 31, 2010, and in addition to any other events disclosed elsewhere in these consolidated financial statements, the Company:
|
|
·
|
Disposed of interests in five properties to unaffiliated third parties for an aggregate gross disposition price of $78,375, which will result in an anticipated aggregate impairment charge of approximately $27,000 in the first quarter of 2011; and
|
|
|
·
|
refinanced its secured revolving credit facility with a $300,000 secured revolving credit facility with KeyBank, as agent. The new facility bears interest at 2.50% plus LIBOR if the Company’s leverage ratio, as defined, is less than 50%, 2.85% plus LIBOR if the Company’s leverage ratio is between 50% and 60% and 3.10% plus LIBOR if the Company’s leverage ratio exceeds 60%. The new facility matures in January 2014 but can be extended to January 2015, at the Company’s option. The new revolving credit facility is secured by ownership interest pledges and guarantees by certain of the Company’s subsidiaries that in the aggregate currently own interests in a borrowing base consisting of 79 properties. With the consent of the lenders, the Company can increase the size of the secured revolving credit facility by $225,000 (for a total facility size of $525,000).
|
89
LEXINGTON REALTY TRUST
AND CONSOLIDATED SUBSIDIARIES
Real Estate and Accumulated Depreciation and Amortization
Schedule III
($000)
|
Description
|
Location
|
Encumbrances
|
Land and
Land
Estates
|
Buildings
and
Improvements
|
Total
|
Accumulated Depreciation and Amortization
|
Date
Acquired
|
Date
Constructed
|
Useful life computing
depreciation in latest
income statements (years)
|
|||||||||||||||||||||||
|
Industrial
|
Marshall, MI
|
(5 | ) | $ | 0 | $ | 40 | $ | 900 | $ | 940 | $ | 587 |
Aug-87
|
1979 |
12, 20 & 40
|
||||||||||||||||
|
Industrial
|
Memphis, TN
|
(5 | ) | 0 | 1,054 | 11,539 | 12,593 | 11,293 |
Feb-88
|
1987 |
8 &15
|
|||||||||||||||||||||
|
Office
|
Tampa, FL
|
0 | 2,160 | 7,273 | 9,433 | 4,837 |
Jul-88
|
1986 | 9 – 40 | |||||||||||||||||||||||
|
Retail
|
Canton, OH
|
0 | 603 | 3,819 | 4,422 | 1,432 |
Dec-95
|
1987 | 40 | |||||||||||||||||||||||
|
Retail
|
Tulsa, OK
|
(5 | ) | 0 | 447 | 2,432 | 2,879 | 1,888 |
Dec-96
|
1981 |
14 & 24
|
|||||||||||||||||||||
|
Retail
|
Clackamas, OR
|
(5 | ) | 0 | 523 | 2,848 | 3,371 | 2,210 |
Dec-96
|
1981 |
14 & 24
|
|||||||||||||||||||||
|
Retail
|
Lynnwood, WA
|
(5 | ) | 0 | 488 | 2,658 | 3,146 | 2,063 |
Dec-96
|
1981 |
14 & 24
|
|||||||||||||||||||||
|
Retail
|
Honolulu, HI
|
(5 | ) | 0 | 0 | 11,147 | 11,147 | 11,147 |
Dec-96
|
1980 | 5 | |||||||||||||||||||||
|
Industrial
|
New Kingston, PA
|
6,490 | 1,380 | 10,963 | 12,343 | 3,780 |
Mar-97
|
1989 | 40 | |||||||||||||||||||||||
|
Industrial
|
Mechanicsburg, PA
|
4,652 | 1,012 | 8,039 | 9,051 | 2,772 |
Mar-97
|
1985 | 40 | |||||||||||||||||||||||
|
Office
|
Decatur, GA
|
0 | 975 | 18,890 | 19,865 | 5,442 |
Dec-97
|
1983 | 3 – 40 | |||||||||||||||||||||||
|
Office
|
Hebron, OH
|
0 | 1,063 | 4,271 | 5,334 | 965 |
Dec-97
|
2000 | 40 | |||||||||||||||||||||||
|
Industrial
|
Bristol, PA
|
0 | 2,508 | 11,606 | 14,114 | 3,351 |
Mar-98
|
1982 |
10, 30 & 40
|
|||||||||||||||||||||||
|
Office
|
Hebron, KY
|
(5 | ) | 0 | 1,615 | 8,125 | 9,740 | 2,865 |
Mar-98
|
1987 |
6, 12 & 40
|
|||||||||||||||||||||
|
Office
|
Palm Beach Gardens, FL
|
(5 | ) | 0 | 3,578 | 15,685 | 19,263 | 4,716 |
May-98
|
1996 | 11 – 40 | |||||||||||||||||||||
|
Office
|
Herndon, VA
|
0 | 5,127 | 22,610 | 27,737 | 5,797 |
Dec-99
|
1987 |
9, 31, 36 & 40
|
|||||||||||||||||||||||
|
Office
|
Hampton, VA
|
(5 | ) | 0 | 2,333 | 10,454 | 12,787 | 2,352 |
Mar-00
|
1999 |
2.5, 5 & 40
|
|||||||||||||||||||||
|
Office
|
Phoenix, AZ
|
17,663 | 4,666 | 19,966 | 24,632 | 5,797 |
May-00
|
1997 |
6 & 40
|
|||||||||||||||||||||||
|
Office
|
Hampton, VA
|
0 | 1,353 | 6,006 | 7,359 | 1,507 |
Nov-01
|
2000 |
10 & 40
|
|||||||||||||||||||||||
|
Office
|
Phoenix, AZ
|
(5 | ) | 0 | 2,287 | 23,155 | 25,442 | 4,517 |
Nov-01
|
1995/1994 | 5 – 40 | |||||||||||||||||||||
|
Industrial
|
Henderson, NC
|
(5 | ) | 0 | 1,488 | 5,953 | 7,441 | 1,358 |
Nov-01
|
1998 | 40 | |||||||||||||||||||||
|
Retail
|
Canton, OH
|
(5 | ) | 0 | 884 | 3,534 | 4,418 | 806 |
Nov-01
|
1995 | 40 | |||||||||||||||||||||
|
Retail
|
Spartanburg, SC
|
(5 | ) | 0 | 833 | 3,334 | 4,167 | 761 |
Nov-01
|
1996 | 40 | |||||||||||||||||||||
|
Industrial
|
Dillon, SC
|
21,546 | 3,223 | 26,054 | 29,277 | 5,760 |
Dec-01
|
2001/2005 |
22 & 40
|
|||||||||||||||||||||||
|
Industrial
|
Hebron, OH
|
(5 | ) | 0 | 1,681 | 6,779 | 8,460 | 1,552 |
Dec-01
|
1999 |
5 & 40
|
|||||||||||||||||||||
|
Office
|
Lake Forest, CA
|
9,888 | 3,442 | 13,769 | 17,211 | 3,026 |
Mar-02
|
2001 | 40 | |||||||||||||||||||||||
|
Office
|
Fort Mill, SC
|
10,330 | 3,601 | 14,479 | 18,080 | 2,919 |
Dec-02
|
2002 |
5 & 40
|
|||||||||||||||||||||||
|
Office
|
Boca Raton, FL
|
20,400 | 4,290 | 17,160 | 21,450 | 3,378 |
Feb-03
|
1983/2002 | 40 | |||||||||||||||||||||||
|
Industrial
|
Dubuque, IA
|
10,103 | 2,052 | 8,443 | 10,495 | 1,630 |
Jul-03
|
2002 |
11, 12 & 40
|
|||||||||||||||||||||||
|
Industrial
|
Waxahachie, TX
|
(5 | ) | 0 | 652 | 13,045 | 13,697 | 6,460 |
Dec-03
|
1996/1997 |
10, 16 & 40
|
|||||||||||||||||||||
|
Office
|
Wallingford, CT
|
3,202 | 1,049 | 4,773 | 5,822 | 753 |
Dec-03
|
1978/1985 |
8 & 40
|
|||||||||||||||||||||||
|
Office
|
Wall, NJ
|
26,797 | 8,985 | 26,961 | 35,946 | 7,314 |
Jan-04
|
1983 |
22 & 40
|
|||||||||||||||||||||||
|
Industrial
|
Moody, AL
|
6,829 | 654 | 9,943 | 10,597 | 3,592 |
Feb-04
|
2004 |
15 & 40
|
|||||||||||||||||||||||
|
Office
|
Sugar Land, TX
|
12,199 | 1,834 | 16,536 | 18,370 | 2,790 |
Mar-04
|
1997 | 40 | |||||||||||||||||||||||
|
Office
|
Houston, TX
|
46,930 | 16,613 | 52,682 | 69,295 | 8,890 |
Mar-04
|
1976/1984 | 40 | |||||||||||||||||||||||
|
Office
|
Florence, SC
|
(5 | ) | 0 | 3,235 | 12,941 | 16,176 | 2,892 |
May-04
|
1998 | 40 | |||||||||||||||||||||
|
Office
|
Carrollton, TX
|
13,196 | 1,789 | 18,157 | 19,946 | 4,728 |
Jun-04
|
2003 |
19 & 40
|
|||||||||||||||||||||||
|
Office
|
Clive, IA
|
5,514 | 2,761 | 7,453 | 10,214 | 2,944 |
Jun-04
|
2003 |
12, 13 & 40
|
|||||||||||||||||||||||
90
LEXINGTON REALTY TRUST
AND CONSOLIDATED SUBSIDIARIES
Real Estate and Accumulated Depreciation and Amortization
Schedule III ($000) -
(Continued)
|
Description
|
Location
|
Encumbrances
|
Land and
Land
Estates
|
Buildings
and
Improvements
|
Total
|
Accumulated Depreciation and Amortization
|
Date
Acquired
|
Date
Constructed
|
Useful life computing
depreciation in latest
income statements (years)
|
|||||||||||||||||||||||
|
Office
|
Southfield, MI
|
(5 | ) | 0 | 0 | 12,124 | 12,124 | 5,000 |
Jul-04
|
1963/1965 |
7, 16 & 40
|
|||||||||||||||||||||
|
Industrial
|
High Point, NC
|
(5 | ) | 0 | 1,330 | 11,183 | 12,513 | 3,208 |
Jul-04
|
2002 |
18 & 40
|
|||||||||||||||||||||
|
Industrial
|
San Antonio, TX
|
27,058 | 2,482 | 38,535 | 41,017 | 11,984 |
Jul-04
|
2001 |
17 & 40
|
|||||||||||||||||||||||
|
Office
|
Fort Mill, SC
|
19,391 | 1,798 | 25,192 | 26,990 | 8,491 |
Nov-04
|
2004 |
15 & 40
|
|||||||||||||||||||||||
|
Industrial
|
Olive Branch, MS
|
(5 | ) | 0 | 198 | 10,276 | 10,474 | 4,628 |
Dec-04
|
1989 |
8, 15 & 40
|
|||||||||||||||||||||
|
Office
|
Los Angeles, CA
|
10,692 | 5,110 | 10,911 | 16,021 | 3,901 |
Dec-04
|
2000 |
13 & 40
|
|||||||||||||||||||||||
|
Office
|
Foxboro, MA
|
11,233 | 2,231 | 25,653 | 27,884 | 7,852 |
Dec-04
|
1982 |
16 & 40
|
|||||||||||||||||||||||
|
Industrial
|
Knoxville, TN
|
7,282 | 1,079 | 10,762 | 11,841 | 3,312 |
Mar-05
|
2001 |
14 & 40
|
|||||||||||||||||||||||
|
Office
|
Richmond, VA
|
9,904 | 1,100 | 11,919 | 13,019 | 3,632 |
Apr-05
|
2000 |
15 & 40
|
|||||||||||||||||||||||
|
Office
|
Atlanta, GA
|
42,211 | 4,600 | 55,333 | 59,933 | 18,374 |
Apr-05
|
2003 |
13 & 40
|
|||||||||||||||||||||||
|
Office
|
Harrisburg, PA
|
8,547 | 900 | 10,556 | 11,456 | 5,075 |
Apr-05
|
1998 |
9 & 40
|
|||||||||||||||||||||||
|
Office
|
Fort Meyers, FL
|
8,836 | 1,820 | 10,198 | 12,018 | 3,463 |
Apr-05
|
1997 |
13 & 40
|
|||||||||||||||||||||||
|
Office
|
Houston, TX
|
16,467 | 3,750 | 21,149 | 24,899 | 7,182 |
Apr-05
|
2000 |
13 & 40
|
|||||||||||||||||||||||
|
Industrial
|
Millington, TN
|
16,630 | 723 | 19,118 | 19,841 | 5,501 |
Apr-05
|
1997 |
16 & 40
|
|||||||||||||||||||||||
|
Office
|
Indianapolis, IN
|
12,282 | 1,700 | 17,168 | 18,868 | 7,247 |
Apr-05
|
1999 | 3 – 40 | |||||||||||||||||||||||
|
Office
|
Houston, TX
|
12,358 | 1,500 | 14,581 | 16,081 | 4,524 |
Apr-05
|
2003 |
14 & 40
|
|||||||||||||||||||||||
|
Office
|
Suwannee, GA
|
11,240 | 3,200 | 10,903 | 14,103 | 3,970 |
Apr-05
|
2001 |
12 & 40
|
|||||||||||||||||||||||
|
Office
|
San Antonio, TX
|
12,208 | 2,800 | 14,587 | 17,387 | 5,813 |
Apr-05
|
2000 |
11 & 40
|
|||||||||||||||||||||||
|
Office
|
Houston, TX
|
15,818 | 800 | 26,879 | 27,679 | 9,010 |
Apr-05
|
2000 |
11, 12 & 40
|
|||||||||||||||||||||||
|
Office
|
Lakewood, CO
|
8,094 | 1,400 | 8,653 | 10,053 | 3,119 |
Apr-05
|
2002 |
12 & 40
|
|||||||||||||||||||||||
|
Office
|
Indianapolis, IN
|
8,981 | 1,360 | 13,150 | 14,510 | 4,557 |
Apr-05
|
2002 |
12 & 40
|
|||||||||||||||||||||||
|
Office
|
Tulsa, OK
|
7,153 | 2,126 | 8,493 | 10,619 | 3,636 |
Apr-05
|
2000 |
11 & 40
|
|||||||||||||||||||||||
|
Office
|
Philadelphia, PA
|
46,540 | 13,209 | 52,067 | 65,276 | 16,270 |
Jun-05
|
1957 |
4, 5 & 40
|
|||||||||||||||||||||||
|
Industrial
|
Elizabethtown, KY
|
(4 | ) | 14,749 | 890 | 26,868 | 27,758 | 5,135 |
Jun-05
|
1995/2001 |
25 & 40
|
|||||||||||||||||||||
|
Industrial
|
Elizabethtown, KY
|
(4 | ) | 2,784 | 352 | 4,862 | 5,214 | 929 |
Jun-05
|
2001 |
25 & 40
|
|||||||||||||||||||||
|
Industrial
|
Hopkinsville, KY
|
8,647 | 631 | 16,154 | 16,785 | 3,185 |
Jun-05
|
Various
|
25 & 40
|
|||||||||||||||||||||||
|
Industrial
|
Owensboro, KY
|
(4 | ) | 5,337 | 393 | 11,956 | 12,349 | 2,501 |
Jun-05
|
1998/2000 |
25 & 40
|
|||||||||||||||||||||
|
Industrial
|
Dry Ridge, KY
|
(4 | ) | 6,024 | 560 | 12,553 | 13,113 | 2,399 |
Jun-05
|
1988 |
25 & 40
|
|||||||||||||||||||||
|
Office
|
Omaha, NE
|
8,412 | 2,566 | 8,324 | 10,890 | 1,298 |
Nov-05
|
1995 |
30 & 40
|
|||||||||||||||||||||||
|
Office
|
Southington, CT
|
12,796 | 3,240 | 25,339 | 28,579 | 13,591 |
Nov-05
|
1983 |
12, 28 & 40
|
|||||||||||||||||||||||
|
Office
|
Tempe, AZ
|
7,945 | 0 | 9,442 | 9,442 | 1,448 |
Dec-05
|
1998 |
30 & 40
|
|||||||||||||||||||||||
|
Industrial
|
Collierville, TN
|
(5 | ) | 0 | 714 | 2,483 | 3,197 | 520 |
Dec-05
|
2005 |
20 & 40
|
|||||||||||||||||||||
|
Industrial
|
Crossville, TN
|
(5 | ) | 0 | 545 | 6,999 | 7,544 | 1,748 |
Jan-06
|
1989/2006 |
17 & 40
|
|||||||||||||||||||||
|
Office
|
Memphis, TN
|
3,852 | 464 | 4,467 | 4,931 | 760 |
Nov-06
|
1888 |
20 & 40
|
|||||||||||||||||||||||
|
Office
|
Hanover, NJ
|
15,701 | 4,063 | 19,711 | 23,774 | 3,345 |
Nov-06
|
2006 |
20 & 40
|
|||||||||||||||||||||||
|
Office
|
Charleston, SC
|
7,350 | 1,189 | 8,724 | 9,913 | 1,567 |
Nov-06
|
2006 | 40 | |||||||||||||||||||||||
|
Industrial
|
Saugerties, NY
|
(5 | ) | 0 | 508 | 2,837 | 3,345 | 293 |
Dec-06
|
1979 | 40 | |||||||||||||||||||||
|
Office
|
Clinton, CT
|
0 | 285 | 4,043 | 4,328 | 732 |
Dec-06
|
1971 | 40 | |||||||||||||||||||||||
|
Industrial
|
Owensboro, KY
|
(5 | ) | 0 | 819 | 2,439 | 3,258 | 473 |
Dec-06
|
1975 | 40 | |||||||||||||||||||||
|
Office
|
Lisle, IL
|
10,169 | 3,236 | 13,667 | 16,903 | 1,803 |
Dec-06
|
1985 | 40 | |||||||||||||||||||||||
91
LEXINGTON REALTY TRUST
AND CONSOLIDATED SUBSIDIARIES
Real Estate and Accumulated Depreciation and Amortization
Schedule III ($000) -
(Continued)
|
Description
|
Location
|
Encumbrances
|
Land and
Land
Estates
|
Buildings
and
Improvements
|
Total
|
Accumulated Depreciation and Amortization
|
Date
Acquired
|
Date
Constructed
|
Useful life computing
depreciation in latest
income statements (years)
|
|||||||||||||||||||||||
|
Retail
|
Chattanooga, TN
|
(5 | ) | 0 | 556 | 1,241 | 1,797 | 135 |
Dec-06
|
1982 | 40 | |||||||||||||||||||||
|
Retail
|
Paris, TN
|
(5 | ) | 0 | 247 | 547 | 794 | 81 |
Dec-06
|
1982 | 40 | |||||||||||||||||||||
|
Industrial
|
Memphis, TN
|
(5 | ) | 0 | 1,553 | 12,326 | 13,879 | 1,516 |
Dec-06
|
1973 | 40 | |||||||||||||||||||||
|
Office
|
Bridgewater, NJ
|
14,805 | 4,738 | 27,331 | 32,069 | 2,898 |
Dec-06
|
1986 | 40 | |||||||||||||||||||||||
|
Office
|
Atlanta, GA
|
(5 | ) | 0 | 1,014 | 269 | 1,283 | 138 |
Dec-06
|
1972 | 40 | |||||||||||||||||||||
|
Office
|
Atlanta, GA
|
(5 | ) | 0 | 870 | 187 | 1,057 | 111 |
Dec-06
|
1975 | 40 | |||||||||||||||||||||
|
Office
|
Chamblee, GA
|
(5 | ) | 0 | 770 | 186 | 956 | 121 |
Dec-06
|
1972 | 40 | |||||||||||||||||||||
|
Office
|
Cumming, GA
|
(5 | ) | 0 | 1,558 | 1,368 | 2,926 | 302 |
Dec-06
|
1968 | 40 | |||||||||||||||||||||
|
Office
|
Forest Park, GA
|
(5 | ) | 0 | 668 | 1,242 | 1,910 | 210 |
Dec-06
|
1969 | 40 | |||||||||||||||||||||
|
Office
|
Jonesboro, GA
|
(5 | ) | 0 | 778 | 146 | 924 | 98 |
Dec-06
|
1971 | 40 | |||||||||||||||||||||
|
Office
|
Stone Mountain, GA
|
(5 | ) | 0 | 672 | 276 | 948 | 102 |
Dec-06
|
1973 | 40 | |||||||||||||||||||||
|
Retail
|
Thomasville, NC
|
(5 | ) | 0 | 610 | 1,861 | 2,471 | 188 |
Dec-06
|
1998 | 40 | |||||||||||||||||||||
|
Retail
|
Lawrence, IN
|
(5 | ) | 0 | 404 | 1,737 | 2,141 | 183 |
Dec-06
|
1983 | 40 | |||||||||||||||||||||
|
Retail
|
Franklin, OH
|
(5 | ) | 0 | 1,089 | 1,699 | 2,788 | 172 |
Dec-06
|
1961 | 40 | |||||||||||||||||||||
|
Retail
|
Houston, TX
|
(5 | ) | 0 | 1,336 | 5,183 | 6,519 | 667 |
Dec-06
|
1982 | 40 | |||||||||||||||||||||
|
Retail
|
Dallas, TX
|
(5 | ) | 0 | 1,637 | 5,381 | 7,018 | 838 |
Dec-06
|
1960 | 40 | |||||||||||||||||||||
|
Retail
|
Port Richey, FL
|
0 | 1,376 | 1,664 | 3,040 | 304 |
Dec-06
|
1980 | 40 | |||||||||||||||||||||||
|
Retail
|
Billings, MT
|
(5 | ) | 0 | 506 | 3,062 | 3,568 | 442 |
Dec-06
|
1981 | 40 | |||||||||||||||||||||
|
Retail
|
Fort Worth, TX
|
(5 | ) | 0 | 1,003 | 3,304 | 4,307 | 513 |
Dec-06
|
1985 | 40 | |||||||||||||||||||||
|
Office
|
Bridgeton, MO
|
(5 | ) | 0 | 1,853 | 4,469 | 6,322 | 503 |
Dec-06
|
1980 | 40 | |||||||||||||||||||||
|
Office
|
Glenwillow, OH
|
16,557 | 2,228 | 24,530 | 26,758 | 2,670 |
Dec-06
|
1996 | 40 | |||||||||||||||||||||||
|
Office
|
Columbus, IN
|
(1 | ) | (4 | ) | 26,435 | 235 | 45,729 | 45,964 | 4,660 |
Dec-06
|
1983 | 40 | |||||||||||||||||||
|
Retail
|
Greenville, TX
|
(5 | ) | 0 | 562 | 2,743 | 3,305 | 336 |
Dec-06
|
1985 | 40 | |||||||||||||||||||||
|
Retail
|
Lawton, OK
|
(5 | ) | 0 | 663 | 1,288 | 1,951 | 197 |
Dec-06
|
1984 | 40 | |||||||||||||||||||||
|
Office
|
Johnson City, TN
|
(5 | ) | 0 | 1,214 | 7,568 | 8,782 | 847 |
Dec-06
|
1983 | 40 | |||||||||||||||||||||
|
Office
|
Memphis, TN
|
(1 | ) | (4 | ) | 47,335 | 5,291 | 97,032 | 102,323 | 10,108 |
Dec-06
|
1985 | 40 | |||||||||||||||||||
|
Office
|
Orlando, FL
|
(5 | ) | 0 | 586 | 35,012 | 35,598 | 3,633 |
Dec-06
|
1982 | 40 | |||||||||||||||||||||
|
Office
|
Long Beach, CA
|
0 | 21,092 | 72,578 | 93,670 | 7,860 |
Dec-06
|
1981 |
4, 9, 10 & 40
|
|||||||||||||||||||||||
|
Office
|
Little Rock, AR
|
(5 | ) | 0 | 1,353 | 2,260 | 3,613 | 268 |
Dec-06
|
1980 | 40 | |||||||||||||||||||||
|
Land
|
Baltimore, MD
|
0 | 4,605 | 0 | 4,605 | 0 |
Dec-06
|
N/A | N/A | |||||||||||||||||||||||
|
Industrial
|
Lumberton, NC
|
(5 | ) | 0 | 405 | 12,049 | 12,454 | 1,550 |
Dec-06
|
1998 | 40 | |||||||||||||||||||||
|
Office
|
Baltimore, MD
|
0 | 32,959 | 87,268 | 120,137 | 25,517 |
Dec-06
|
1973 |
5, 10, 25 & 40
|
|||||||||||||||||||||||
|
Industrial
|
McDonough, GA
|
23,000 | 2,463 | 24,291 | 26,754 | 2,552 |
Dec-06
|
2000 | 40 | |||||||||||||||||||||||
|
Industrial
|
Columbus, OH
|
(5 | ) | 0 | 1,990 | 10,580 | 12,570 | 1,391 |
Dec-06
|
1973 | 40 | |||||||||||||||||||||
|
Office
|
Palo Alto, CA
|
(5 | ) | 0 | 12,398 | 16,977 | 29,375 | 8,873 |
Dec-06
|
1974 | 40 | |||||||||||||||||||||
|
Industrial
|
Rockford, IL
|
(4 | ) | 0 | 371 | 2,573 | 2,944 | 302 |
Dec-06
|
1998 | 40 | |||||||||||||||||||||
|
Industrial
|
Rockford, IL
|
(4 | ) | 6,710 | 509 | 5,289 | 5,798 | 580 |
Dec-06
|
1992 | 40 | |||||||||||||||||||||
|
Office
|
Rockaway, NJ
|
14,900 | 4,646 | 20,428 | 25,074 | 2,592 |
Dec-06
|
2002 | 40 | |||||||||||||||||||||||
|
Retail
|
Sun City, AZ
|
(5 | ) | 0 | 2,154 | 2,775 | 4,929 | 284 |
Dec-06
|
1982 | 40 | |||||||||||||||||||||
|
Retail
|
Carlsbad, NM
|
(5 | ) | 0 | 918 | 775 | 1,693 | 100 |
Dec-06
|
1980 | 40 | |||||||||||||||||||||
92
LEXINGTON REALTY TRUST
AND CONSOLIDATED SUBSIDIARIES
Real Estate and Accumulated Depreciation and Amortization
Schedule III ($000) -
(Continued)
|
Description
|
Location
|
Encumbrances
|
Land and
Land
Estates
|
Buildings
and
Improvements
|
Total
|
Accumulated Depreciation and Amortization
|
Date
Acquired
|
Date
Constructed
|
Useful life computing
depreciation in latest
income statements (years)
|
|||||||||||||||||||||||
|
Retail
|
Corpus Christi, TX
|
(5 | ) | 0 | 987 | 974 | 1,961 | 104 |
Dec-06
|
1983 | 40 | |||||||||||||||||||||
|
Retail
|
El Paso, TX
|
(5 | ) | 0 | 220 | 1,749 | 1,969 | 181 |
Dec-06
|
1982 | 40 | |||||||||||||||||||||
|
Retail
|
McAllen, TX
|
(5 | ) | 0 | 606 | 1,257 | 1,863 | 132 |
Dec-06
|
2004 | 40 | |||||||||||||||||||||
|
Retail
|
Victoria, TX
|
(5 | ) | 0 | 300 | 1,149 | 1,449 | 121 |
Dec-06
|
1981 | 40 | |||||||||||||||||||||
|
Retail
|
Jacksonville, NC
|
(5 | ) | 0 | 1,151 | 221 | 1,372 | 49 |
Dec-06
|
1982 | 40 | |||||||||||||||||||||
|
Retail
|
Jefferson, NC
|
(5 | ) | 0 | 71 | 884 | 955 | 103 |
Dec-06
|
1979 | 40 | |||||||||||||||||||||
|
Retail
|
Lexington, NC
|
(5 | ) | 0 | 832 | 1,429 | 2,261 | 144 |
Dec-06
|
1983 | 40 | |||||||||||||||||||||
|
Retail
|
Moncks Corner, SC
|
(5 | ) | 0 | 13 | 1,510 | 1,523 | 163 |
Dec-06
|
1982 | 40 | |||||||||||||||||||||
|
Retail
|
Staunton, VA
|
(5 | ) | 0 | 1,028 | 326 | 1,354 | 60 |
Dec-06
|
1971 | 40 | |||||||||||||||||||||
|
Industrial
|
North Berwick, ME
|
11,036 | 1,383 | 32,397 | 33,780 | 3,368 |
Dec-06
|
1965 |
10 & 40
|
|||||||||||||||||||||||
|
Office
|
Orlando, FL
|
0 | 11,498 | 33,989 | 45,487 | 14,489 |
Dec-06
|
1984 | 3 | |||||||||||||||||||||||
|
Retail
|
Port Orchard, WA
|
0 | 147 | 94 | 241 | 4 |
Dec-06
|
1983 | 40 | |||||||||||||||||||||||
|
Industrial
|
Statesville, NC
|
(4 | ) | 13,726 | 891 | 16,696 | 17,587 | 2,436 |
Dec-06
|
1999 |
3 & 40
|
|||||||||||||||||||||
|
Office
|
Beaumont, TX
|
(5 | ) | 0 | 530 | 30,326 | 30,856 | 3,795 |
Dec-06
|
1983 | 3 – 40 | |||||||||||||||||||||
|
Retail
|
Minden, LA
|
(5 | ) | 0 | 334 | 4,888 | 5,222 | 492 |
Dec-06
|
1982 | 40 | |||||||||||||||||||||
|
Retail
|
Garland, TX
|
(5 | ) | 0 | 905 | 3,448 | 4,353 | 788 |
Dec-06
|
1983 | 40 | |||||||||||||||||||||
|
Retail
|
Hillsboro, TX
|
(5 | ) | 0 | 139 | 1,581 | 1,720 | 173 |
Dec-06
|
1982 | 40 | |||||||||||||||||||||
|
Retail
|
Portchester, NY
|
(5 | ) | 0 | 7,086 | 9,313 | 16,399 | 1,873 |
Dec-06
|
1982 | 40 | |||||||||||||||||||||
|
Office
|
Rochester, NY
|
(4 | ) | 18,301 | 645 | 25,892 | 26,537 | 2,807 |
Dec-06
|
1988 | 40 | |||||||||||||||||||||
|
Office
|
Las Vegas, NV
|
(1 | ) | (4 | ) | 32,163 | 12,099 | 53,164 | 65,263 | 5,435 |
Dec-06
|
1982 | 40 | |||||||||||||||||||
|
Industrial
|
Orlando, FL
|
(5 | ) | 0 | 1,030 | 10,869 | 11,899 | 1,226 |
Dec-06
|
1981 | 40 | |||||||||||||||||||||
|
Retail
|
Edmonds, WA
|
(5 | ) | 0 | 0 | 3,947 | 3,947 | 417 |
Dec-06
|
1981 | 40 | |||||||||||||||||||||
|
Industrial
|
Cincinnati, OH
|
(5 | ) | 0 | 1,009 | 7,007 | 8,016 | 849 |
Dec-06
|
1991 | 40 | |||||||||||||||||||||
|
Office
|
Honolulu, HI
|
(5 | ) | 0 | 21,094 | 13,217 | 34,311 | 1,317 |
Dec-06
|
1917/1955/
1960/1980
|
40 | |||||||||||||||||||||
|
Office
|
Orlando, FL
|
9,975 | 3,538 | 9,019 | 12,557 | 2,301 |
Jan-07
|
2003 |
12 & 40
|
|||||||||||||||||||||||
|
Office
|
Boston, MA
|
13,359 | 3,814 | 14,728 | 18,542 | 1,396 |
Mar-07
|
1910 | 40 | |||||||||||||||||||||||
|
Industrial
|
Shreveport, LA
|
19,000 | 860 | 21,840 | 22,700 | 2,070 |
Mar-07
|
2006 | 40 | |||||||||||||||||||||||
|
Industrial
|
Antioch, TN
|
0 | 5,568 | 16,871 | 22,439 | 2,657 |
May-07
|
1983 | 5 – 40 | |||||||||||||||||||||||
|
Office
|
Canonsburg, PA
|
9,080 | 1,055 | 10,910 | 11,965 | 2,074 |
May-07
|
1997 |
8 & 40
|
|||||||||||||||||||||||
|
Retail
|
Galesburg, IL
|
495 | 560 | 2,366 | 2,926 | 344 |
May-07
|
1992 |
12 & 40
|
|||||||||||||||||||||||
|
Retail
|
Lewisburg, WV
|
583 | 501 | 1,985 | 2,486 | 218 |
May-07
|
1993 |
12 & 40
|
|||||||||||||||||||||||
|
Retail
|
Lorain, OH
|
1,250 | 1,893 | 7,024 | 8,917 | 844 |
May-07
|
1993 |
23 & 40
|
|||||||||||||||||||||||
|
Retail
|
Manteca, CA
|
883 | 2,082 | 6,464 | 8,546 | 775 |
May-07
|
1993 |
23 & 40
|
|||||||||||||||||||||||
|
Retail
|
San Diego, CA
|
563 | 0 | 13,310 | 13,310 | 1,271 |
May-07
|
1993 |
23 & 40
|
|||||||||||||||||||||||
|
Retail
|
Watertown, NY
|
830 | 386 | 5,162 | 5,548 | 666 |
May-07
|
1993 |
23 & 40
|
|||||||||||||||||||||||
|
Office
|
Irving, TX
|
37,959 | 7,476 | 42,780 | 50,256 | 8,289 |
May-07
|
1999 |
6 & 40
|
|||||||||||||||||||||||
|
Office
|
Westlake, TX
|
18,219 | 2,361 | 22,396 | 24,757 | 4,516 |
May-07
|
2007 | 5, 40 | |||||||||||||||||||||||
|
Office
|
Westerville, OH
|
(5 | ) | 0 | 2,085 | 9,265 | 11,350 | 1,203 |
May-07
|
2000 | 40 | |||||||||||||||||||||
|
Office
|
Centenial, CO
|
14,341 | 4,851 | 15,187 | 20,038 | 2,899 |
May-07
|
2001 |
10 & 40
|
|||||||||||||||||||||||
|
Office
|
Baton Rouge, LA
|
6,158 | 1,252 | 10,244 | 11,496 | 1,733 |
May-07
|
1997 |
6 & 40
|
|||||||||||||||||||||||
93
LEXINGTON REALTY TRUST
AND CONSOLIDATED SUBSIDIARIES
Real Estate and Accumulated Depreciation and Amortization
Schedule III ($000) -
(Continued)
|
Description
|
Location
|
Encumbrances
|
Land and
Land
Estates
|
Buildings
and
Improvements
|
Total
|
Accumulated Depreciation and Amortization
|
Date
Acquired
|
Date
Constructed
|
Useful life computing
depreciation in latest
income statements (years)
|
|||||||||||||||||||||||
|
Industrial
|
Durham, NH
|
17,921 | 3,464 | 18,094 | 21,558 | 2,516 |
Jun-07
|
1986 | 40 | |||||||||||||||||||||||
|
Office
|
Dallas, TX
|
18,505 | 3,984 | 27,308 | 31,292 | 4,479 |
Jun-07
|
2002 | 40 | |||||||||||||||||||||||
|
Office
|
Kansas City, MO
|
17,552 | 2,433 | 20,154 | 22,587 | 2,869 |
Jun-07
|
1980 |
12 & 40
|
|||||||||||||||||||||||
|
Industrial
|
Streetsboro, OH
|
18,996 | 2,441 | 25,092 | 27,533 | 3,307 |
Jun-07
|
2004 |
12, 20, 25 & 40
|
|||||||||||||||||||||||
|
Office
|
Issaquah, WA
|
31,672 | 5,126 | 13,554 | 18,680 | 2,609 |
Jun-07
|
1987 |
8 & 40
|
|||||||||||||||||||||||
|
Office
|
Issaquah, WA
|
0 | 6,268 | 16,058 | 22,326 | 3,006 |
Jun-07
|
1987 |
8 & 40
|
|||||||||||||||||||||||
|
Office
|
Carrollton, TX
|
19,874 | 3,427 | 22,050 | 25,477 | 3,626 |
Jun-07
|
2003 |
8 & 40
|
|||||||||||||||||||||||
|
Office
|
Overland Park, KS
|
36,797 | 4,769 | 41,956 | 46,725 | 6,001 |
Jun-07
|
1980 |
12 & 40
|
|||||||||||||||||||||||
|
Office
|
Fishers, IN
|
11,298 | 2,808 | 19,115 | 21,923 | 3,354 |
Jun-07
|
1999 |
9, 10, 38 & 40
|
|||||||||||||||||||||||
|
Office
|
Irving, TX
|
0 | 4,889 | 29,598 | 34,487 | 5,375 |
Jun-07
|
1999 | 40 | |||||||||||||||||||||||
|
Industrial
|
Laurens, SC
|
14,899 | 5,552 | 20,886 | 26,438 | 2,985 |
Jun-07
|
1991 | 40 | |||||||||||||||||||||||
|
Office
|
Milford, OH
|
13,727 | 3,124 | 16,022 | 19,146 | 3,336 |
Jun-07
|
1991 |
6, 7 & 40
|
|||||||||||||||||||||||
|
Office
|
Lake Mary, FL
|
0 | 4,535 | 14,701 | 19,236 | 2,815 |
Jun-07
|
1997 |
7 & 40
|
|||||||||||||||||||||||
|
Office
|
Lake Mary, FL
|
0 | 4,438 | 14,957 | 19,395 | 2,758 |
Jun-07
|
1999 |
7 & 40
|
|||||||||||||||||||||||
|
Office
|
Parsippany, NJ
|
0 | 7,478 | 87,071 | 94,549 | 13,501 |
Jun-07
|
2000 | 11, 40 | |||||||||||||||||||||||
|
Industrial
|
Winchester,VA
|
9,861 | 3,823 | 12,226 | 16,049 | 1,826 |
Jun-07
|
2001 | 40 | |||||||||||||||||||||||
|
Industrial
|
Temperance, MI
|
9,988 | 3,040 | 14,738 | 17,778 | 2,061 |
Jun-07
|
1980 | 40 | |||||||||||||||||||||||
|
Office
|
Colorado Springs, CO
|
10,744 | 2,748 | 12,554 | 15,302 | 2,118 |
Jun-07
|
1980 | 40 | |||||||||||||||||||||||
|
Industrial
|
Logan, NJ
|
7,087 | 1,825 | 10,776 | 12,601 | 1,242 |
Jun-07
|
1998 | 40 | |||||||||||||||||||||||
|
Industrial
|
Plymouth, MI
|
10,800 | 2,296 | 13,398 | 15,694 | 2,698 |
Jun-07
|
1996 | 40 | |||||||||||||||||||||||
|
Office
|
Herndon, VA
|
11,371 | 9,409 | 12,853 | 22,262 | 2,537 |
Jun-07
|
1987 | 40 | |||||||||||||||||||||||
|
Office
|
Chicago, IL
|
29,314 | 5,155 | 46,180 | 51,335 | 8,258 |
Jun-07
|
1986 |
15 & 40
|
|||||||||||||||||||||||
|
Office
|
Glen Allen, VA
|
19,427 | 2,361 | 29,579 | 31,940 | 6,845 |
Jun-07
|
1998 | 5 – 40 | |||||||||||||||||||||||
|
Office
|
Cary, NC
|
12,684 | 5,342 | 14,866 | 20,208 | 3,187 |
Jun-07
|
1999 | 40 | |||||||||||||||||||||||
|
Industrial
|
Duncan, SC
|
(5 | ) | 0 | 884 | 8,626 | 9,510 | 799 |
Jun-07
|
2005 | 40 | |||||||||||||||||||||
|
Office
|
Farmington Hills, MI
|
18,436 | 4,876 | 21,115 | 25,991 | 4,154 |
Jun-07
|
1999 |
1, 13 & 40
|
|||||||||||||||||||||||
|
Office
|
Brea, CA
|
75,492 | 37,269 | 45,695 | 82,964 | 8,985 |
Jun-07
|
1983 | 40 | |||||||||||||||||||||||
|
Office
|
Lenexa, KS
|
(5 | ) | 0 | 6,909 | 29,032 | 35,941 | 2,161 |
Jul-08
|
2007 |
15 & 40
|
|||||||||||||||||||||
|
Office
|
Louisville, CO
|
7,310 | 3,657 | 9,605 | 13,262 | 932 |
Sep-08
|
1987 |
8, 9 & 40
|
|||||||||||||||||||||||
|
Retail, Garage
|
Baltimore, MD
|
0 | 0 | 23,429 | 23,429 | 928 |
May-09
|
2009 | 40 | |||||||||||||||||||||||
|
Office
|
Columbus, OH
|
0 | 1,594 | 10,480 | 12,074 | 0 |
Dec-10
|
2005 | 40 | |||||||||||||||||||||||
|
Construction in progress
|
0 | 0 | 20,043 | 20,043 | 0 | |||||||||||||||||||||||||||
|
Subtotal
|
1,413,848 | 546,033 | 2,817,553 | 3,363,586 | 601,239 |
|
||||||||||||||||||||||||||
|
(1)
|
25,000 | |||||||||||||||||||||||||||||||
|
(2)
|
33,368 | |||||||||||||||||||||||||||||||
|
(3)
|
9,000 | |||||||||||||||||||||||||||||||
|
Total
|
$ | 1,481,216 | $ | 546,033 | $ | 2,817,553 | $ | 3,363,586 | $ | 601,239 | ||||||||||||||||||||||
|
(1) -
|
Properties are cross-collateralized for a $25,000 secured term loan at 12/31/10.
|
|
(2) -
|
Certain equity interests are pledged as collateral.
|
|
(3) -
|
Property is classified as a capital lease
|
|
(4) -
|
Properties are cross-collaterized properties.
|
|
(5) -
|
Properties are collateral for the Company's secured revolving credit facility.
|
94
LEXINGTON REALTY TRUST
AND CONSOLIDATED SUBSIDIARIES
Real Estate and Accumulated Depreciation and Amortization
Schedule III ($000) -
(Continued)
(A) The initial cost includes the purchase price paid directly or indirectly by the Company and acquisition fees and expenses. The total cost basis of the Company’s properties at December 31, 2010 for Federal income tax purposes was approximately $3.8 billion.
|
2010
|
2009
|
2008
|
||||||||||
|
Reconciliation of real estate owned:
|
||||||||||||
|
Balance at the beginning of year
|
$ | 3,552,806 | $ | 3,756,188 | $ | 4,109,097 | ||||||
|
Additions during year
|
46,994 | 42,818 | 101,038 | |||||||||
|
Properties sold during year
|
(221,875 | ) | (217,923 | ) | (341,762 | ) | ||||||
|
Property contributed to joint venture during year
|
— | — | (100,415 | ) | ||||||||
|
Reclassified held for sale properties
|
(9,381 | ) | — | (8,782 | ) | |||||||
|
Properties impaired during the year
|
(3,327 | ) | (27,271 | ) | — | |||||||
|
Translation adjustment on foreign currency
|
(1,432 | ) | 467 | (1,250 | ) | |||||||
|
Other reclassifications
|
(199 | ) | (1,473 | ) | (1,738 | ) | ||||||
|
Balance at end of year
|
$ | 3,363,586 | $ | 3,552,806 | $ | 3,756,188 | ||||||
|
Reconciliation of accumulated depreciation and amortization:
|
||||||||||||
|
Balance at the beginning of year
|
$ | 537,406 | $ | 461,661 | $ | 379,831 | ||||||
|
Depreciation and amortization expense
|
115,553 | 113,828 | 142,597 | |||||||||
|
Accumulated depreciation and amortization of properties sold, impaired and held for sale during year
|
(51,478 | ) | (36,749 | ) | (15,859 | ) | ||||||
|
Accumulated depreciation of property contributed to joint venture
|
— | — | (43,018 | ) | ||||||||
|
Translation adjustment on foreign currency
|
(242 | ) | 89 | (152 | ) | |||||||
|
Other reclassifications
|
— | (1,423 | ) | (1,738 | ) | |||||||
|
Balance at end of year
|
$ | 601,239 | $ | 537,406 | $ | 461,661 | ||||||
95
Not applicable.
Evaluation of Disclosure Controls and Procedures
An evaluation of the effectiveness of the design and operation of our “disclosure controls and procedures” (as defined in Rule 13a-15(e) or 15d-15(e) under the Securities Exchange Act of 1934, as amended, which we refer to as the Exchange Act), as of the end of the period covered by this Annual Report was made under the supervision and with the participation of our management, including our Chief Executive Officer and our Chief Financial Officer who are our Principal Executive Officer and Principal Financial/Accounting Officer, respectively. Based upon this evaluation, our Chief Executive Officer and our Chief Financial Officer have concluded that our disclosure controls and procedures (a) are effective to ensure that information required to be disclosed by us in reports filed or submitted under the Exchange Act is timely recorded, processed, summarized and reported and (b) include, without limitation, controls and procedures designed to ensure that information required to be disclosed by us in reports filed or submitted under the Exchange Act is accumulated and communicated to our management, including our Chief Executive Officer and our Chief Financial Officer, as appropriate to allow timely decisions regarding required disclosure.
Management’s Report on Internal Control Over Financial Reporting
Management’s Report on Internal Control Over Financial Reporting, which appears on page 51 of this Annual Report, is incorporated herein by reference.
Attestation Report of our Independent Registered Public Accounting Firm
The Report of our Independent Registered Public Accounting Firm constituting the Attestation Report of our Independent Registered Public Accounting Firm, which appears on page 54 of this Annual Report, is incorporated herein by reference.
Changes in Internal Control Over Financial Reporting
There were no changes to our internal controls over financial reporting during the fourth quarter ended December 31, 2010 that have materially affected, or are reasonably likely to materially affect, our internal controls over financial reporting.
Not applicable.
The information regarding our executive officers required to be furnished pursuant to this item is set forth in Part I following Item 3 of this Annual Report. Information relating to our Code of Business Conduct and Ethics, is included in Part I, Item 1 of this Annual Report. The information relating to our trustees, including the audit committee of our Board of Trustees and our Audit Committee financial expert, and certain information relating to our executive officers will be in our Definitive Proxy Statement for our 2011 Annual Meeting of Shareholders, which we refer to as our Proxy Statement and is incorporated herein by reference.
The information required to be furnished pursuant to this item will be set forth under the appropriate captions in the Proxy Statement, and is incorporated herein by reference.
The information required to be furnished pursuant to this item will be set forth under the appropriate captions in the Proxy Statement, and is incorporated herein by reference.
96
The information required to be furnished pursuant to this item will be set forth under the appropriate captions in the Proxy Statement, and is incorporated herein by reference. In addition, certain information regarding related party transactions is set forth in note 19 to the Consolidated Financial Statements beginning on page 87 of this Annual Report.
The information required to be furnished pursuant to this item will be set forth under the appropriate captions in the Proxy Statement, and is incorporated herein by reference.
|
Page
|
||
|
(a)(1) Financial Statements
|
52
|
|
|
(2) Financial Statement Schedule
|
90
|
|
|
(3) Exhibits
|
97
|
|
Exhibit No.
|
|
|
|
Description
|
|
|
|
|
|
|
|
3.1
|
|
—
|
|
Articles of Merger and Amended and Restated Declaration of Trust of the Company, dated December 31, 2006 (filed as Exhibit 3.1 to the Company’s Current Report on Form 8-K filed January 8, 2007 (the “01/08/07 8-K”))(1)
|
|
3.2
|
|
—
|
|
Articles Supplementary Relating to the 7.55% Series D Cumulative Redeemable Preferred Stock, par value $.0001 per share (filed as Exhibit 3.3 to the Company’s Registration Statement on Form 8A filed February 14, 2007 (the “02/14/07 Registration Statement”))(1)
|
|
3.3
|
|
—
|
|
Amended and Restated By-laws of the Company (filed as Exhibit 3.2 to the 01/08/07 8-K)(1)
|
|
3.4
|
—
|
First Amendment to Amended and Restated By–laws of the Company (filed as Exhibit 3.1 to the Company’s Current Report on Form 8-K filed November 20, 2009)(1)
|
||
|
3.5
|
|
—
|
|
Fifth Amended and Restated Agreement of Limited Partnership of Lepercq Corporate Income Fund L.P. (“LCIF”), dated as of December 31, 1996, as supplemented (the “LCIF Partnership Agreement”) (filed as Exhibit 3.3 to the Company’s Registration Statement on Form S-3/A filed September 10, 1999 (the “09/10/99 Registration Statement”))(1)
|
|
3.6
|
|
—
|
|
Amendment No. 1 to the LCIF Partnership Agreement dated as of December 31, 2000 (filed as Exhibit 3.11 to the Company’s Annual Report on Form 10-K for the year ended December 31, 2003, filed February 26, 2004 (the “2003 10-K”))(1)
|
|
3.7
|
|
—
|
|
First Amendment to the LCIF Partnership Agreement effective as of June 19, 2003 (filed as Exhibit 3.12 to the 2003 10-K)(1)
|
|
3.8
|
|
—
|
|
Second Amendment to the LCIF Partnership Agreement effective as of June 30, 2003 (filed as Exhibit 3.13 to the 2003 10-K)(1)
|
|
3.9
|
|
—
|
|
Third Amendment to the LCIF Partnership Agreement effective as of December 31, 2003 (filed as Exhibit 3.13 to the Company’s Annual Report on Form 10-K for the year ended December 31, 2004, filed on March 16, 2005 (the “2004 10-K”))(1)
|
|
3.10
|
|
—
|
|
Fourth Amendment to the LCIF Partnership Agreement effective as of October 28, 2004 (filed as Exhibit 10.1 to the Company’s Current Report on Form 8-K filed November 4, 2004)(1)
|
|
3.11
|
|
—
|
|
Fifth Amendment to the LCIF Partnership Agreement effective as of December 8, 2004 (filed as Exhibit 10.1 to the Company’s Current Report on Form 8-K filed December 14, 2004 (the “12/14/04 8-K”))(1)
|
|
3.12
|
|
—
|
|
Sixth Amendment to the LCIF Partnership Agreement effective as of June 30, 2003 (filed as Exhibit 10.1 to the Company’s Current Report on Form 8-K filed January 3, 2005 (the “01/03/05 8-K”))(1)
|
|
3.13
|
|
—
|
|
Seventh Amendment to the LCIF Partnership Agreement (filed as Exhibit 10.1 to the Company’s Current Report on Form 8-K filed November 3, 2005)(1)
|
|
3.14
|
|
—
|
|
Eighth Amendment to the LCIF Partnership Agreement effective as of March 26, 2009 (filed as Exhibit 10.1 to the Company’s Current Report on Form 8-K filed April 27, 2009 (the “4/27/09 8-K”)(1)
|
|
3.15
|
|
—
|
|
Second Amended and Restated Agreement of Limited Partnership of Lepercq Corporate Income Fund II L.P. (“LCIF II”), dated as of August 27, 1998 the (“LCIF II Partnership Agreement”) (filed as Exhibit 3.4 to the 9/10/99 Registration Statement)(1)
|
97
|
3.16
|
|
—
|
|
First Amendment to the LCIF II Partnership Agreement effective as of June 19, 2003 (filed as Exhibit 3.14 to the 2003 10-K)(1)
|
|
3.17
|
|
—
|
|
Second Amendment to the LCIF II Partnership Agreement effective as of June 30, 2003 (filed as Exhibit 3.15 to the 2003 10-K)(1)
|
|
3.18
|
|
—
|
|
Third Amendment to the LCIF II Partnership Agreement effective as of December 8, 2004 (filed as Exhibit 10.2 to 12/14/04 8-K)(1)
|
|
3.19
|
|
—
|
|
Fourth Amendment to the LCIF II Partnership Agreement effective as of January 3, 2005 (filed as Exhibit 10.2 to 01/03/05 8-K)(1)
|
|
3.20
|
|
—
|
|
Fifth Amendment to the LCIF II Partnership Agreement effective as of July 23, 2006 (filed as Exhibit 99.5 to the Company’s Current Report on Form 8-K filed July 24, 2006)(1)
|
|
3.21
|
|
—
|
|
Sixth Amendment to the LCIF II Partnership Agreement effective as of December 20, 2006 (filed as Exhibit 10.1 to the Company’s Current Report on Form 8-K filed December 22, 2006)(1)
|
|
3.22
|
|
—
|
|
Seventh Amendment to the LCIF II Partnership Agreement effective as of March 26, 2009 (filed as Exhibit 10.2 to the 4/27/09 8-K)(1)
|
|
4.1
|
|
—
|
|
Specimen of Common Shares Certificate of the Company (filed as Exhibit 4.1 to the Company’s Annual Report on Form 10-K for the year ended December 31, 2006)(1)
|
|
4.2
|
|
—
|
|
Form of 8.05% Series B Cumulative Redeemable Preferred Stock certificate (filed as Exhibit 4.1 to the Company’s Registration Statement on Form 8A filed June 17, 2003)(1)
|
|
4.3
|
|
—
|
|
Form of 6.50% Series C Cumulative Convertible Preferred Stock certificate (filed as Exhibit 4.1 to the Company’s Registration Statement on Form 8A filed December 8, 2004)(1)
|
|
4.4
|
|
—
|
|
Form of 7.55% Series D Cumulative Redeemable Preferred Stock certificate (filed as Exhibit 4.1 to the 02/14/07 Registration Statement)(1)
|
|
4.5
|
|
—
|
|
Indenture, dated as of January 29, 2007, among the Company (as successor by merger), the other guarantors named therein and U.S. Bank National Association, as trustee (filed as Exhibit 4.1 to the Company’s Current Report on Form 8-K filed January 29, 2007 (the “01/29/07 8-K”))(1)
|
|
4.6
|
|
—
|
|
First Supplemental Indenture, dated as of January 29, 2007, among the Company (as successor by merger), the other guarantors named therein and U.S. Bank National Association, as trustee, including the Form of 5.45% Exchangeable Guaranteed Notes due 2027 (filed as Exhibit 4.2 to the 01/29/07 8-K)(1)
|
|
4.7
|
|
—
|
|
Second Supplemental Indenture, dated as of March 9, 2007, among the Company (as successor to the MLP), the other guarantors named therein and U.S. Bank National Association, as trustee (filed as Exhibit 4.3 to the Company’s Current Report on Form 8-K filed on March 9, 2007 (the “03/09/07 8-K”))(1)
|
|
4.8
|
|
—
|
|
Amended and Restated Trust Agreement, dated March 21, 2007, among the Company, The Bank of New York Trust Company, National Association, The Bank of New York (Delaware), the Administrative Trustees (as named therein) and the several holders of the Preferred Securities from time to time (filed as Exhibit 4.1 to the Company’s Current Report on Form 8-K filed on March 27, 2007 (the “03/27/2007 8-K”))(1)
|
|
4.9
|
|
—
|
|
Third Supplemental Indenture, dated as of June 19, 2007, among the Company (as successor to The Lexington Master Limited Partnership), the other guarantors named therein and U.S. Bank National Association, as trustee (filed as Exhibit 4.1 to the Company’s Report on Form 8-K filed on June 22, 2007)(1)
|
|
4.10
|
|
—
|
|
Junior Subordinated Indenture, dated as of March 21, 2007, between Lexington Realty Trust and The Bank of New York Trust Company, National Association (filed as Exhibit 4.2 to the 03/27/07 8-K)(1)
|
|
4.11
|
|
—
|
|
Fourth Supplemental Indenture, dated as of December 31, 2008, among the Company, the other guarantors named therein and U.S. Bank National Association, as trustee (filed as Exhibit 4.1 to the Company’s Report on Form 8-K filed on January 2, 2009 (the “01/02/09 8-K”))(1)
|
|
4.12
|
—
|
Fifth Supplemental Indenture, dated as of June 9, 2009, among the Company (as successor to the MLP), the other guarantors named therein and U.S. Bank National Association, as trustee (filed as Exhibit 4.1 to the Company's Current Report on Form 8-K filed on June 15, 2009)(1)
|
||
|
4.13
|
—
|
Sixth Supplemental Indenture, dated as of January 26, 2010 among the Company, the guarantors named therein and U.S. Bank National Association, as trustee, including the Form of 6.00% Convertible Guaranteed Notes due 2030 (filed as Exhibit 4.1 to the Company’s Current Report on Form 8-K filed January 26, 2010)(1)
|
||
|
10.1
|
|
—
|
|
1994 Employee Stock Purchase Plan (filed as Exhibit D to the Company’s Definitive Proxy Statement dated April 12, 1994)(1, 4)
|
|
10.2
|
|
—
|
|
The Company’s 2007 Equity Award Plan (filed as Annex A to the Company’s Definitive Proxy Statement dated April 19, 2007)(1,4)
|
|
10.3
|
|
—
|
|
Form of Compensation Agreement (Long-Term Compensation) between the Company and each of the following officers: Richard J. Rouse and Patrick Carroll (filed as Exhibit 10.15 to the 2004 10-K)(1, 4)
|
98
|
10.4
|
|
—
|
|
Form of Compensation Agreement (Bonus and Long-Term Compensation) between the Company and each of the following officers: E. Robert Roskind and T. Wilson Eglin (filed as Exhibit 10.16 to the 2004 10-K)(1, 4)
|
|
10.5
|
|
—
|
|
Form of Nonvested Share Agreement (Performance Bonus Award) between the Company and each of the following officers: E. Robert Roskind, T. Wilson Eglin, Richard J. Rouse and Patrick Carroll (filed as Exhibit 10.1 to the Company’s Current Report on Form 8-K filed on February 6, 2006 (the “02/06/06 8-K”))(1, 4)
|
|
10.6
|
|
—
|
|
Form of Nonvested Share Agreement (Long-Term Incentive Award) between the Company and each of the following officers: E. Robert Roskind, T. Wilson Eglin, Richard J. Rouse and Patrick Carroll (filed as Exhibit 10.2 to the 02/06/06 8-K)(1, 4)
|
|
10.7
|
|
—
|
|
Form of the Company’s Nonvested Share Agreement, dated as of December 28, 2006 (filed as Exhibit 10.2 to the Company’s Current Report on Form 8-K filed on January 3, 2007 (the “01/03/07 8-K”))(1,4)
|
|
10.8
|
—
|
Form of 2007 Annual Long-Term Incentive Award Agreement (filed as Exhibit 10.1 to the Company’s Current Report on Form 8-K filed on January 11, 2008)(1,4)
|
||
|
10.9
|
|
—
|
|
Form of Share Option Award Agreement (filed as Exhibit 10.3 to the Company’s Current Report on Form 8-K/A filed on November 24, 2010)(1,4)
|
|
10.10
|
—
|
Form of 2010 Share Option Award Agreement (filed as Exhibit 10.2 to the Company’s Current Report on Form 8-K/A filed November 24, 2010)(1, 4)
|
||
|
10.11
|
—
|
|
Form of December 2010 Share Option Award Agreement (filed as Exhibit 10.1 to the Company’s Current Report on Form 8-K filed January 6, 2011(1,4)
|
|
|
10.12
|
|
—
|
|
Amended and Restated Rabbi Trust Agreement, originally dated January 26, 1999 (filed as Exhibit 10.2 to the 01/02/09 8-K)(1,4)
|
|
10.13
|
|
—
|
|
Form of Employment Agreement between the Company and each of E. Robert Roskind, T. Wilson Eglin, Richard J. Rouse and Patrick Carroll, dated January 15, 2010 (filed as Exhibit 10.1 to the Company’s Current Report on Form 8-K filed January 20, 2010)(1, 4)
|
|
10.14
|
|
—
|
|
Form of Amended and Restated Indemnification Agreement between the Company and certain officers and trustees (filed as Exhibit 10.20 to the Company’s Quarterly Report Form 10-Q for the quarter ended September 30, 2008)(1)
|
|
10.15
|
|
—
|
|
Credit Agreement, dated as of January 28, 2011 among the Company, LCIF and LCIF II as borrowers, certain subsidiaries of the Company, as guarantors, KeyBank National Association, as agent, and each of the financial institutions initially a signatory thereto (filed as Exhibit 10.1 to the Company’s Current Report on Form 8-K filed February 2, 2011)(1)
|
|
10.16
|
|
—
|
|
Master Terms and Conditions for Issuer Forward Transactions between the Company and Citigroup Financial Products Inc., effective as of October 28, 2008 (filed as Exhibit 10.1 to the Company’s Current Report on Form 8-K filed November 6, 2008 (the “11/06/08 8-K”))(1)
|
|
10.17
|
|
—
|
|
Funding Agreement, dated as of July 23, 2006, by and among LCIF, LCIF II and the Company (filed as Exhibit 99.4)(1)
|
|
10.18
|
|
—
|
|
Letter Agreement among the Company (as successor by merger), Apollo Real Estate Investment Fund III, L.P., NKT Advisors LLC, Vornado Realty Trust, VNK Corp., Vornado Newkirk LLC, Vornado MLP GP LLC and WEM-Brynmawr Associates LLC (filed as Exhibit 10.15 to Amendment No. 5 to Newkirk Registration Statement on Form S-11/A filed October 28, 2005 (“Amendment No. 5 to NKT’s S-11”))(1)
|
|
10.19
|
|
—
|
|
Amendment to the Letter Agreement among the Company (as successor by merger), Apollo Real Estate Investment Fund III, L.P., NKT Advisors LLC, Vornado Realty Trust, Vornado Realty L.P., VNK Corp., Vornado Newkirk LLC, Vornado MLP GP LLC, and WEM-Brynmawr Associates LLC (filed as Exhibit 10.25 to Amendment No. 5 to Newkirk’s S-11)(1)
|
|
10.20
|
|
—
|
|
Second Amended and Restated Ownership Limit Waiver Agreement (Vornado), dated as of December 6, 2010, between the Company and Vornado Realty, L.P. (together with certain affiliates) (filed as Exhibit 10.1 to the Company’s Current Report on Form 8-K filed on December 6, 2010)(1)
|
|
10.21
|
|
—
|
|
Ownership Limitation Waiver Agreement (BlackRock), dated as of November 18, 2010 (filed as of Exhibit 10.1 to the Company’s Current Report on Form 8-K filed on November 24, 2010 (the “11/24/10 8-K”)(1)
|
|
10.22
|
—
|
|
Ownership Limitation Waiver Agreement (Cohen & Steers), dated as of November 18, 2010 (filed as Exhibit 10/2 to the 11/24/10 8-K)(1)
|
|
|
10.23
|
|
—
|
|
Registration Rights Agreement, dated as of December 31, 2006, between the Company and Michael L. Ashner (filed as Exhibit 10.10 to the 01/08/07 8-K)(1)
|
|
10.24
|
|
—
|
|
Amended and Restated Registration Rights Agreement, dated as of November 3, 2008, between the Company and Vornado Realty, L.P. and Vornado LXP LLC (filed as Exhibit 10.3 to the 11/06/08 8-K)(1)
|
|
10.25
|
|
—
|
|
Registration Rights Agreement, dated as of January 29, 2007, among the Company, LCIF, LCIF II, Net 3, Lehman Brothers Inc. and Bear, Stearns & Co. Inc., for themselves and on behalf of the initial purchasers named therein (filed as Exhibit 4.3 to the 01/29/07 8-K)(1)
|
|
10.26
|
|
—
|
|
Registration Rights Agreement, dated as of March 9, 2007, among the MLP, the Company, LCIF, LCIF II, Net 3, Lehman Brothers Inc. and Bear, Stearns & Co. Inc., for themselves and on behalf of the initial purchasers named therein (filed as Exhibit 4.4 to the 03/09/07 8-K)(1)
|
99
|
10.27
|
|
—
|
|
Second Amendment and Restated Limited Partnership Agreement of Net Lease Strategic Assets fund L.P. (“NLSAF”), dated as of February 20, 2008, among LMLP GP LLC, the Company (as successor by merger) Inland American (Net Lease) Sub, LLC (filed as Exhibit 10.1 to the Company’s Current Report on Form 8-K filed on February 21, 2008) (1)
|
|
10.28
|
—
|
Management Agreement, dated as of August 10, 2007, between NLSAF and Lexington Realty Advisors, Inc. (filed as Exhibit 10.4 to the Company’s Current Report on Form 8-K filed on August 17, 2007)(1)
|
||
|
10.29
|
—
|
|
Funding Agreement dated as of July 23, 2006, by and among LCIF, LCIF II and the Company (filed as Exhibit 99.4 to Company’s Current Report on Form 8-K filed on July 24, 2006)(1)
|
|
|
—
|
|
Statement of Computation of Ratio of Earnings to Combined Fixed Charges and Preferred Dividends (2)
|
||
|
14.1
|
—
|
Amended and Restated Code of Business Conduct and Ethics (filed as Exhibit 14.1 to the Company’s Current Report on Form 8-K filed on December 8, 2010)(1)
|
||
|
—
|
List of Subsidiaries(2)
|
|||
|
—
|
Consent of KPMG LLP(2)
|
|||
|
—
|
Consent of PricewaterhouseCoopers LLP(2)
|
|||
|
—
|
Consent of KPMG LLP(2)
|
|||
|
—
|
Certification of Chief Executive Officer pursuant to rule 13a-14(a)/15d-14(a) of the Securities Exchange Act of 1934, as adopted pursuant to Section 302 of the Sarbanes-Oxley Act of 2002(3)
|
|||
|
—
|
Certification of Chief Financial Officer pursuant to rule 13a-14(a)/15d-14(a) of the Securities Exchange Act of 1934, as adopted pursuant to Section 302 of the Sarbanes-Oxley Act of 2002(3)
|
|||
|
—
|
Certification of Chief Executive Officer pursuant to 18 U.S.C. Section 1350, as adopted pursuant to Section 906 of the Sarbanes-Oxley Act of 2002(3)
|
|||
|
—
|
Certification of Chief Financial Officer pursuant to 18 U.S.C. Section 1350, as adopted pursuant to Section 906 of the Sarbanes-Oxley Act of 2002(3)
|
|||
|
—
|
|
Financial statements and related financial statement schedule of Lex-Win Concord LLC(2)
|
||
|
—
|
Financial statements and related financial statement schedule of Net Lease Strategic Assets Fund L.P.(2)
|
(1) Incorporated by reference.
(2) Filed herewith.
(3) Furnished herewith.
(4) Management Contract or compensatory plan or arrangement.
100
SIGNATURES
Pursuant to the requirements of Section 13 or 15(d) of the Securities Exchange Act of 1934, the Company has duly caused this report to be signed on its behalf by the undersigned, thereunto duly authorized.
|
Lexington Realty Trust
|
|||
|
By:
|
/s/ T. Wilson Eglin
|
||
|
|
T. Wilson Eglin
|
||
|
Chief Executive Officer
|
|||
POWER OF ATTORNEY
KNOW ALL PERSONS BY THESE PRESENTS, that each person whose signature appears below constitutes and appoints T. Wilson Eglin and Patrick Carroll, and each of them severally, his true and lawful attorney-in-fact with power of substitution and resubstitution to sign in his name, place and stead, in any and all capacities, to do any and all things and execute any and all instruments that such attorney may deem necessary or advisable under the Securities Exchange Act of 1934 and any rules, regulations and requirements of the U.S. Securities and Exchange Commission in connection with this Annual Report on Form 10-K and any and all amendments hereto, as fully for all intents and purposes as he might or could do in person, and hereby ratifies and confirms all said attorneys-in-fact and agents, each acting alone, and his substitute or substitutes, may lawfully do or cause to be done by virtue hereof. Pursuant to the requirements of the Securities Exchange Act of 1934, this report has been signed below by the following persons on behalf of the Company and in the capacities and on the date indicated.
|
Signature
|
Title
|
|
|
/s/ E. Robert Roskind
|
Chairman
|
|
|
E. Robert Roskind
|
||
|
/s/ Richard J. Rouse
|
Vice Chairman
|
|
|
Richard J. Rouse
|
and Chief Investment Officer
|
|
|
/s/ T. Wilson Eglin
|
Chief Executive Officer, President
|
|
|
T. Wilson Eglin
|
and Trustee
|
|
|
/s/ Patrick Carroll
|
Chief Financial Officer, Treasurer and
|
|
|
Patrick Carroll
|
Executive Vice President
|
|
|
/s/ Paul R. Wood
|
Vice President, Chief Tax Compliance Officer
|
|
|
Paul R. Wood
|
and Secretary
|
|
|
/s/ Clifford Broser
|
Trustee
|
|
|
Clifford Broser
|
||
|
/s/ James Grosfeld
|
Trustee
|
|
|
James Grosfeld
|
||
|
/s/ Harold First
|
Trustee
|
|
|
Harold First
|
||
|
/s/ Richard S. Frary
|
Trustee
|
|
|
Richard S. Frary
|
||
|
/s/ Kevin W. Lynch
|
Trustee
|
|
|
Kevin W. Lynch
|
DATE: February 28, 2011
101
TABLE OF CONTENTS
Part IItem 1. BusinessItem 1A. Risk FactorsItem 1B. Unresolved Staff CommentsItem 2. PropertiesItem 3. Legal ProceedingsPart IIItem 5. Market For Registrant S Common Equity, Related Shareholder Matters and Issuer Purchases Of Equity SecuritiesItem 6. Selected Financial DataItem 7. Management S Discussion and Analysis Of Financial Condition and Results Of OperationsItem 7A. Quantitative and Qualitative Disclosure About Market RiskItem 8. Financial Statements and Supplementary DataItem 9. Changes in and Disagreements with Accountants on Accounting and Financial DisclosureItem 9A. Controls and ProceduresItem 9B. Other InformationPart IIIItem 10. Trustees, Executive Officers and Corporate GovernanceItem 11. Executive CompensationItem 12. Security Ownership Of Certain Beneficial Owners and Management and Related Stockholder MattersItem 13. Certain Relationships and Related Transactions, and Director IndependenceItem 14. Principal Accounting Fees and ServicesPart IVItem 15. Exhibits, Financial Statement Schedules