LA-Z-BOY INC
10-Ks and 10-Qs
|
|
|
|
|
|
|
|
|
|
|
|
|
|
|
|
|
|
|
|
|
|
|
|
|
|
|
|
|
|
|
|
|
|
|
|
|
|
|
|
|
|
|
|
|
|
|
|
|
|
|
|
|
|
|
|
|
|
|
|
|
|
UNITED STATES
SECURITIES AND EXCHANGE COMMISSION
Washington, D.C. 20549
FORM 10-K
ANNUAL REPORT PURSUANT TO SECTION 13 OR 15(d) OF THE SECURITIES EXCHANGE ACT OF 1934
For the fiscal year ended April 30, 2011
COMMISSION FILE NUMBER 1-9656
|
LA-Z-BOY INCORPORATED
|
|
(Exact name of registrant as specified in its charter)
|
|
MICHIGAN
|
38-0751137
|
|
(State or other jurisdiction of
|
(I.R.S. Employer
|
|
incorporation or organization)
|
Identification No.)
|
|
1284 North Telegraph Road, Monroe, Michigan
|
48162-3390
|
|
(Address of principal executive offices)
|
(Zip Code)
|
Registrant's telephone number, including area code (734) 242-1444
Securities registered pursuant to Section 12(b) of the Act:
|
Title of each class
|
Name of each exchange on which registered
|
|
Common Shares, $1.00 Par Value
|
New York Stock Exchange
|
Securities registered pursuant to Section 12(g) of the Act: None
Indicate by check mark if the Registrant is a well-known seasoned issuer, as defined in rule 405 of the Securities Act.
|
Yes
¨
|
No
x
|
Indicate by check mark if the Registrant is not required to file reports pursuant to Section 13 or 15(d) of the Exchange Act.
|
Yes
¨
|
No
x
|
Indicate by check mark whether the Registrant (1) has filed all reports required to be filed by Section 13 or 15(d) of the Securities Exchange Act of 1934 during the preceding 12 months (or for such shorter period that the Registrant was required to file such reports), and (2) has been subject to such filing requirements for the past 90 days.
|
Yes
x
|
No
¨
|
Indicate by check mark whether the Registrant has submitted electronically and posted on its corporate Web site, if any, every Interactive Data File required to be submitted and posted pursuant to Rule 405 of Regulation S-T during the preceding 12 months (or for such shorter period that the Registrant was required to submit and post such files).
|
Yes
¨
|
No
¨
|
Indicate by check mark if disclosure of delinquent filers pursuant to Item 405 of Regulation S-K is not contained herein, and will not be contained, to the best of the Registrant’s knowledge, in definitive proxy or information statements incorporated by reference in Part III of this Form 10-K or any amendment to this Form 10-K.
x
Indicate by check mark whether the Registrant is a large accelerated filer, an accelerated filer, a non-accelerated filer or a smaller reporting company. See the definitions of “large accelerated filer,” “accelerated filer,” and “smaller reporting company” in Rule 12b-2 of the Exchange Act. (Check one):
|
Large accelerated filer
¨
|
Accelerated filer
x
|
Non-accelerated filer
¨
|
Smaller reporting company
¨
|
Indicate by check mark whether the Registrant is a shell company (as defined in Rule 12b-2 of the Exchange Act).
|
Yes
¨
|
No
x
|
Based on the closing price on the New York Stock Exchange on October 22, 2010, the aggregate market value of Registrant’s common shares held by non-affiliates of the Registrant on that date was $409.7 million.
The number of common shares outstanding of the Registrant was 51,920,161 as of June 14, 2011.
DOCUMENTS INCORPORATED BY REFERENCE:
|
|
(1)
|
Portions of the Registrant’s Proxy Statement to be filed with the Securities and Exchange Commission pursuant to Regulation 14A for its 2011 Annual Meeting of Shareholders are incorporated by reference into Part III.
|
LA-Z-BOY INCORPORATED
FORM 10-K ANNUAL REPORT FISCAL 2011
TABLE OF CONTENTS
|
Page
Number(s)
|
|
|
Cautionary Statement Concerning Forward-Looking Statements
|
|
|
PART I
|
|
|
Item 1. Business
|
3 |
|
Item 1A. Risk Factors
|
9 |
|
Item 1B. Unresolved Staff Comments
|
12 |
|
Item 2. Properties
|
12 |
|
Item 3. Legal Proceedings
|
12 |
|
Item 4. [Removed and Reserved]
|
13 |
|
Executive Officers of the Registrant
|
13 |
|
PART II
|
|
|
Item 5. Market for Registrant's Common Equity, Related Stockholder Matters and Issuer Purchases of Equity Securities
|
14 |
|
Item 6. Selected Financial Data
|
17 |
|
Item 7. Management's Discussion and Analysis of Financial Condition and Results of Operations
|
21 |
|
Item 7A. Quantitative and Qualitative Disclosures About Market Risk
|
38 |
|
Item 8. Financial Statements and Supplementary Data
|
39 |
|
Item 9. Changes in and Disagreements with Accountants on Accounting and Financial Disclosure
|
73 |
|
Item 9A. Controls and Procedures
|
73 |
|
Item 9B. Other Information
|
73 |
|
PART III
|
|
|
Item 10. Directors, Executive Officers, and Corporate Governance
|
73 |
|
Item 11. Executive Compensation
|
74 |
|
Item 12. Security Ownership of Certain Beneficial Owners and Management and Related Stockholder Matters
|
74 |
|
Item 13. Certain Relationships and Related Transactions, and Director Independence
|
74 |
|
Item 14. Principal Accountant Fees and Services
|
74 |
|
PART IV
|
|
|
Item 15. Exhibits and Financial Statement Schedules
|
75 |
Note: The responses to Items 10 through 14 will be included in the Company’s definitive proxy statement to be filed pursuant to Regulation 14A for the 2011 Annual Meeting of Shareholders. The required information is incorporated into this Form 10-K by reference to that document and is not repeated herein.
2
We are making forward-looking statements in this report, and our representatives may make oral forward-looking statements from time-to-time. Generally, forward-looking statements include information concerning possible or assumed future actions, events or results of operations. More specifically, forward-looking statements may include information regarding:
|
future income, margins and cash flows
|
future economic performance
|
|
future growth
|
industry and importing trends
|
|
adequacy and cost of financial resources
|
management plans
|
Forward-looking statements also include those preceded or followed by the words "anticipates," "believes," "estimates," "hopes," "plans," "intends" and "expects" or similar expressions. With respect to all forward-looking statements, we claim the protection of the safe harbor for forward-looking statements contained in the Private Securities Litigation Reform Act of 1995.
Actual results could differ materially from those we anticipate or project due to a number of factors, including: (a) changes in consumer confidence and demographics; (b) speed of recovery from the recent economic recession or the emergence of a second wave of the recession; (c) changes in the real estate and credit markets and their effects on our customers and suppliers; (d) international political unrest, terrorism or war; (e) volatility in energy and other commodities prices; (f) the impact of logistics on imports; (g) interest rate and currency exchange rate changes; (h) operating factors, such as supply, labor or distribution disruptions or product recalls; (i) restructuring actions; (j) changes in the domestic or international regulatory environment; (k) adoption of new accounting principles; (l) severe weather or other natural events such as hurricanes, earthquakes, tornadoes and tsunamis; (m) our ability to procure fabric rolls and leather hides or cut-and-sewn fabric and leather sets domestically or abroad; (n) fluctuations in our stock price; (o) information technology system failures; (p) effects of our brand awareness and marketing programs; (q) our ability to locate new La-Z-Boy Furniture Galleries® stores owners and negotiate favorable lease terms for new or existing locations; and (r) those matters discussed in Item 1A of this Annual Report and other factors identified from time-to-time in our reports filed with the Securities and Exchange Commission. We undertake no obligation to update or revise any forward-looking statements, whether to reflect new information or new developments or for any other reason.
Edward M. Knabusch and Edwin J. Shoemaker started Floral City Furniture in 1927, and in 1928 the newly formed company introduced its first recliner. In 1941, we were incorporated as La-Z-Boy Chair Company in the state of Michigan, and in 1996 the name was changed to La-Z-Boy Incorporated. Our La-Z-Boy brand is the most recognized brand in the furniture industry.
La-Z-Boy Incorporated manufactures, markets, imports, distributes and retails upholstery products, accessories and casegoods (wood) furniture products. We are the leading global producer of reclining chairs. We sell our products, primarily in the United States and Canada, to furniture retailers and directly to consumers through company-owned stores. The centerpiece of our retail distribution strategy is our network of 304 La-Z-Boy Furniture Galleries® stores and 526 Comfort Studios®, each dedicated to marketing our La-Z-Boy branded products. We own 83 of the La-Z-Boy Furniture Galleries® stores. The rest of the La-Z-Boy Furniture Galleries® stores, as well as all 526 Comfort Studies®, are independently owned and operated, including eight La-Z-Boy Furniture Galleries® stores owned by our single remaining consolidated Variable Interest Entity (VIE). La-Z-Boy Furniture Galleries® stores help consumers furnish their homes by combining the style, comfort and quality of La-Z-Boy furniture with our in-home design service. Comfort Studios® are defined spaces within larger independent retailers that are dedicated to displaying La-Z-Boy branded products. In addition to the La-Z-Boy Comfort Studios®, our Kincaid, England and Lea operating units have their own dedicated in-store gallery programs with over 700 outlets and 1.8 million square feet of floor space.
3
Principal Products and Industry Segments
Our reportable segments are the Upholstery Group, the Casegoods Group and the Retail Group.
Upholstery Group
. In terms of revenue, our largest segment is the Upholstery Group, which includes La-Z-Boy, our largest operating unit, as well as the Bauhaus and England operating units. The Upholstery Group manufactures or imports and sells upholstered furniture such as recliners and motion furniture, sofas, loveseats, chairs, ottomans and sleeper sofas to furniture retailers and proprietary stores. It sells directly to La-Z-Boy Furniture Galleries® stores, operators of Comfort Studios®, general dealers and department stores.
Casegoods Group
. Our Casegoods Group is an importer, marketer, manufacturer and distributor of casegoods (wood) furniture such as bedroom sets, dining room sets, entertainment centers, and accent pieces, as well as some coordinated upholstered furniture. The operating units in the Casegoods Group consist of two subgroups: one consisting of American Drew, Lea and Hammary, and the second being Kincaid. The Casegoods Group primarily sells to proprietary stores and general dealers.
Retail Group
. Our Retail Group consists of 83 company-owned La-Z-Boy Furniture Galleries® stores located in nine markets ranging from the Midwest to the east coast of the United States and also including southeastern Florida and southern California. During the fourth quarter of fiscal 2011, we acquired 15 stores in southern California that were previously operated by one of our consolidated VIEs'. The Retail Group primarily sells upholstered furniture, as well as some casegoods and other accessories, to end consumers through the retail network.
Additional detailed information regarding our segments and the products which compose the segments is contained in Note 14 to our consolidated financial statements and our “Management’s Discussion and Analysis” section, both of which are included in this report.
Raw Materials and Parts
The principal raw materials for the Upholstery Group are purchased cover (primarily fabrics and leather), polyester batting and non-chlorofluorocarbonated polyurethane foam for cushioning and padding, lumber and plywood for frames and steel for motion mechanisms which total about 83% of our total raw material costs. We purchase about 69% of our polyurethane foam from one supplier, although this supplier has several facilities across the United States that ship to our plants.
The largest raw material cost of the Upholstery Group is purchased cover, which represents about 40% of the group’s total material costs. Although we purchase cover from a variety of sources, we do rely on a limited number of major suppliers. If one of these major suppliers experienced financial or other difficulties we could experience temporary disruptions in our manufacturing process until an alternate supplier could be found.
Our cover is purchased either in a raw state (a roll or hide), then cut and sewn into parts in our plants or as cut-and-sewn parts from third-party offshore suppliers. Our cover material costs are evenly divided between fabric rolls and hides and cut-and-sewn parts. There are four primary suppliers of cut-and-sewn leather and fabric products. One supplier manufactures the majority of the leather cut-and-sewn sets we receive from China.
For fiscal 2012, we expect raw material costs to rise due to increased global demand for steel, leather, wood, yarn and polyurethane, as well as other materials used in our upholstery manufacturing processes. Additionally, costs associated with our shipping and transportation activities are expected to increase due to anticipated increases in the cost of crude oil.
4
As the Casegoods Group is an importer, marketer, manufacturer and distributor of casegoods furniture, raw materials represent only about 12% of the total inventory of this group. The principal raw materials used by our manufacturing facility within our Casegoods Group are hardwoods, plywood and chip wood, veneers and liquid stains, paints and finishes and decorative hardware. Hardwood lumber and purchased hardwood components represent about 43% of this segment’s total raw material costs.
Finished Goods Imports
The majority of finished wood furniture marketed and distributed by our Casegoods Group is imported. This import model for our Casegoods Group is effective primarily due to the low labor and overhead costs associated with manufacturing casegoods product overseas. We have continued to make changes to our model in order to improve our service performance levels by improving our supply chain management and distribution networks, which includes the merger of our Hammary operations with our American Drew/Lea operations.
During fiscal 2011, prices on imported casegoods were flat compared to the fiscal 2010. For fiscal 2012, we expect increases in prices on imported casegoods due to inflationary pressures in Asia resulting in increases in labor and raw material costs, as well as increased transportation costs.
Our imported casegoods finished goods sales represented about 77% and 71% for fiscal 2011 and fiscal 2010, respectively of our total casegoods sales. Imported finished goods, for all our segments, represented approximately 12% of our fiscal 2011 consolidated sales.
Seasonal Business
We believe that the demand for furniture generally reflects sensitivity to overall economic conditions, including, but not limited to, unemployment rates, housing market conditions and consumer confidence. Historically, our Upholstery Group and Retail Group has experienced lower levels of sales during the first half of our fiscal year and higher levels of sales during the second half of our fiscal year. Our Casegoods Group historically has experienced a lower level of sales during the first quarter of our fiscal year and a higher level of sales during our fourth fiscal quarter. We believe variations to these historical patterns are a result of economic conditions during those periods and not a change in our historical patterns.
During fiscal 2011, all of our segments experienced their highest level of sales during our fourth fiscal quarter. A substanstial portion of this increase was due to the extra week in that quarter versus fiscal 2010. While our fiscal 2011 year contained 53 weeks versus only 52 weeks in the other fiscal years presented in this report, our fiscal 2012 year will include 52 weeks.
When possible, we schedule production to maintain uniform manufacturing activity throughout the year. However, we shut down our domestic plants for a week in July to perform routine maintenance on our equipment.
Economic Cycle and Purchasing Cycle
In terms of our product segments, upholstered furniture has a shorter life cycle and exhibits a less volatile sales pattern over an economic cycle than does casegoods. This is because upholstered furniture is typically more fashion and design oriented, and is often purchased one or two pieces at a time. In contrast, casegoods products are longer-lived and frequently purchased in groupings or “suites,” resulting in a much larger cost to the consumer.
Practices Regarding Working Capital Items
5
Inventory:
We do not carry significant amounts of upholstered finished goods in inventory at our manufacturing locations as these goods are usually built to order. However, we generally build or import casegoods inventory to stock, in order to attain manufacturing efficiencies and/or to meet delivery requirements of customers. This results in higher levels of finished goods inventory for our casegoods products than our upholstery products. Our company-owned La-Z-Boy Furniture Galleries® stores maintain finished goods inventory at the stores for display purposes.
Over the past few years we have created five regional distribution centers. We created these distribution centers to streamline the warehousing and distribution processes for our La-Z-Boy Furniture Galleries® store network, including both company-owned stores and independently owned stores. Our move to distribution centers allowed us to reduce the number of individual warehouses needed to supply our retail outlets and helped us manage our inventory levels. As of April 30, 2011, our five regional distribution centers had eliminated 27 smaller warehouses, some of which were company operated and some of which were independently operated.
During fiscal 2011 our inventory levels, primarily for raw materials for our Upholstery Group and finished goods for our Casegoods Group, increased with the majority of the increase due to our focus on being in a better service position for our customers. We will continue to manage our inventory levels to make sure they are in line with sales levels, while maintaining our focus on service to our customers.
Accounts Receivable:
During fiscal 2011 our accounts receivables decreased slightly compared to fiscal 2010. Improvements in the economy during fiscal 2010 and fiscal 2011 have resulted in improved liquidity and financial performance of some of our customers. We continue to monitor our customers’ accounts and limit our exposure and credit support to certain independent dealers.
Accounts Payable:
During fiscal 2011 our accounts payable decreased slightly compared to fiscal 2010. Due to our 53
rd
week in fiscal 2011, our fiscal year end corresponded with the calendar month end, which resulted in a larger number of payables being paid before the end of the fiscal 2011 year end.
Customers
We sell to a significant number of furniture retailers primarily throughout the United States and Canada. Additionally, we sell to a number of furniture retailers outside of North America. We also sell to consumers through our company-owned La-Z-Boy Furniture Galleries® stores. We did not have any single customer whose purchases amounted to more than 6% of our fiscal year 2011 consolidated sales for either the Upholstery Group or the Casegoods Group. Sales in our Upholstery and Casegoods Groups are almost entirely to furniture retailers. The Retail Group sales are to end-consumers.
We have formal agreements with many of our retailers for them to display and merchandise products from one or more of our operating units and sell them to consumers in dedicated retail space, either in stand-alone stores or dedicated galleries or studios within their stores. We consider these stores, as well as our own retail stores, to be “proprietary.” For our Upholstery and Casegoods Groups, our 2011 customer mix was about 55% proprietary, 17% major dealers (for example, Art Van Furniture, Berkshire Hathaway, Havertys Furniture, Raymour & Flanigan Furniture) and 28% other independent retail customers.
As of April 30, 2011, we operated 83 stand-alone La-Z-Boy Furniture Galleries® stores. Additionally, we have agreements with independent dealers for 221 stand-alone La-Z-Boy Furniture Galleries® stores, of which eight stores are owned by our sole remaining consolidated Variable Interest Entity (VIE). The success of our product distribution relies heavily on having retail floor space that is dedicated to displaying and marketing our product. This distribution system originated with our La-Z-Boy Furniture Galleries® stores network, which continues to have the largest number of proprietary stores and galleries among our other operating units. According to the May 2011 Top 100 ranking by
Furniture Today,
an industry trade publication, the La-Z-Boy Furniture Galleries® stores retail network is the second largest retailer of single-brand upholstered furniture in North America. In addition to the stand-alone La-Z-Boy Furniture Galleries® stores, the La-Z-Boy brand also has a distribution model known as Comfort Studios®. Comfort Studios® are defined spaces within a larger independent retailer that are dedicated to displaying La-Z-Boy branded furniture with the average size of the space being about 5,000 square feet. Currently there are 526 Comfort Studios® in our distribution system. Our “proprietary” distribution also includes over 700 in-store galleries for England, Kincaid and Lea’s La-Z-Boy Kidz™. Total “proprietary” floor space is approximately 9.0 million square feet.
6
Maintaining, updating, and expanding, when appropriate, our proprietary distribution network is a key part of our marketing strategy. As we continue to maintain and update our current stores, the La-Z-Boy Furniture Galleries® store network plans to open 5 to 10 new stores during fiscal 2012 but anticipates closures to offset this leaving our overall store count unchanged. We select independent dealers for our proprietary distribution network based on factors such as the management and financial qualifications of those potential dealers as well as the potential for distribution in a specific geographical area. This proprietary method of distribution is beneficial to La-Z-Boy, our dealers and the consumer. For La-Z-Boy, it allows us to have a concentration of marketing of our product by sales personnel dedicated to our entire product line, and only that line. For dealers who join this proprietary group, it allows them to take advantage of practices that have proven successful based on past experiences of other proprietary dealers. As a part of this, we facilitate forums and communications for these dealers to share best practices among their peers. For our consumers, these stores provide a full-service shopping experience with knowledgeable sales associates and in-home design consultants to support their purchasing process. The La-Z-Boy Furniture Galleries® stores’ independent dealers and the Comfort Studios® retailers are responsible for displaying and merchandising our product within the dedicated retail space.
The measure of backlog at a point in time may not be indicative of our future sales performance, therefore we do not rely entirely on backlogs to predict future sales. For most operating units, an order cannot be canceled after it has been selected for production. Upholstery orders are primarily built to a specific dealer order (stock order) or a special order with a down payment from a consumer (sold orders). Casegoods are primarily produced to our internal order (not a customer or consumer order), which results in higher finished goods inventory on hand.
As of April 30, 2011 and April 24, 2010, our Upholstery Group backlogs were approximately $71.8 million and $65.5 million, respectively. Our Casegoods Group backlogs as of April 30, 2011, and April 24, 2010, were approximately $11.7 million and $19.3 million, respectively. The increase in our Upholstery Group’s backlog was due primarily to our positive sales trend experienced in the fourth quarter of fiscal 2011 compared to the fourth quarter of fiscal 2010. The decrease in our Casegoods Group’s backlog was primarily a result of the timing of our spring furniture market and new introductions to our product line during fiscal 2010.
Competitive Conditions
According to
Furniture Today
, we are currently the third largest manufacturer/distributor of residential (living and family room, bedroom, and dining room) furniture in the United States, as measured by annual sales volume.
In the Upholstery Group, the largest competitors are Ashley, Bassett Furniture, Bernhardt, Ethan Allen, Flexsteel, Furniture Brands International, Klaussner, Natuzzi, and Palliser.
In the Casegoods Group, our main competitors are Ashley, Bernhardt, Ethan Allen, Furniture Brands International, Hooker Furniture, Stanley Furniture, and Universal. Additionally, there are market pressures related to foreign manufacturers entering the United States market, as well as by increased direct purchasing from overseas by some of the larger United States retailers.
The La-Z-Boy Furniture Galleries® stores operate in the retail furniture industry throughout North America; consequently, they have different competitors. La-Z-Boy Furniture Galleries® stores competitors include: Ashley, Bassett Furniture Direct, Ethan Allen, Thomasville Home Furnishings Stores, several other regional competitors (for example Art Van Furniture, Raymour & Flanigan Furniture, and Havertys Furniture), and family-owned independent furniture stores.
7
In addition to the larger competitors listed above, a substantial number of small and medium-sized firms operate within our business segments, all of which are highly competitive.
Over the past decade there has been an increase in alternative distribution affecting our retail markets. Companies such as Costco, Home Depot, IKEA, Sam’s Club, Target, Wal-Mart, Williams Sonoma, and others are now offering products that compete with some of our product lines. Also, increased ability to purchase furniture products on-line through various furniture manufacturers’ and retailers’ websites has increased competition.
We believe the home furnishings industry competes primarily on the basis of product styling and quality, customer service (product availability and delivery), and price. We believe La-Z-Boy Incorporated competes on the basis of each of these factors, specifically through our distribution models, marketing and customization capabilities.
We compete primarily by emphasizing our brand and the value, comfort, quality, and styling of our products. In addition, we remain committed to innovation within the furniture industry while striving to provide outstanding customer service, exceptional dealer support, and efficient on-time delivery. Also, maintaining, updating and expanding as appropriate our proprietary distribution system is a key initiative for us in striving to remain competitive with others in the furniture industry. We compete in the mid-to-upper price point in the furniture industry. A shift in consumer taste and trends to lower price point products could negatively affect our competitive conditions.
Research and Development Activities
We provide information regarding our research and development activities in Note 1 to our consolidated financial statements, which is included in Item 8 of this report.
Trademarks, Licenses and Patents
We own several trademarks including La-Z-Boy, our most valuable. The La-Z-Boy trademark is essential to the upholstery and retail segments of our business. To protect our trademarks we have registered them in the United States and various other countries where our products are sold. These trademarks have a perpetual life, subject to renewal every ten years. We license the use of the La-Z-Boy trademark on furniture sold outside the United States. We also license the use of the La-Z-Boy trademark on contract office furniture, outdoor furniture and on non-furniture products in the United States for the purpose of enhancing brand awareness. In addition, we license to our proprietary dealers the right to use our La-Z-Boy trademark in connection with the sale of our products and related services, on their signs, and in other ways, which we consider to be a key part of our marketing strategies. We provide more information about those dealers above, under “Customers.”
We hold a number of patents that we actively enforce, but we believe that the loss of any single patent or group of patents would not significantly impact our business.
Compliance with Environmental Regulations
Our manufacturing operations involve the use and disposal of certain substances regulated under environmental protection laws, and we are involved in a small number of remediation actions and site investigations concerning such substances. Based on a review of all currently known facts and our experience with previous environmental matters, we believe we have adequate reserves in respect of probable and reasonably estimable losses arising from environmental matters and currently do not anticipate any significant loss.
8
We employed about 7,910 full-time equivalent persons as of April 30, 2011. The Upholstery Group employed about 6,620, the Casegoods Group employed about 430, the Retail Group employed about 590, with the remainder being corporate and VIE personnel. The majority of our employees are employed on a full-time basis. As of April 24, 2010, we had about 8,290 full-time equivalent employees.
In fiscal 2011, our direct export sales, including sales in Canada, were approximately 13% of our total sales. We have a manufacturing joint venture in Thailand, which distributes furniture in Australia, New Zealand, the United Kingdom, Thailand and other countries in Asia. In addition, we have a sales and marketing joint venture in Asia, which sells and distributes furniture in China, Japan and Korea, among other Asian countries.
We also have a facility in Mexico which provides cut-and-sewn fabric sets for our domestic upholstery manufacturing facilities. Information about sales in the United States, Canada, and other countries is contained in Note 14 to our consolidated financial statements, which is included in Item 8 of this report. Our net property, plant, and equipment in the United States were $110.2 million and $123.4 million at the end of fiscal 2011 and fiscal 2010, respectively. Our net property, plant, and equipment in foreign countries were $10.4 million and $15.5 million in fiscal 2011 and fiscal 2010, respectively. The decrease in our property, plant, and equipment in foreign countries was primarily a result of the deconsolidation in fiscal 2011 of our prior Toronto, Ontario VIE.
See Item 1A of this report for information about the risks related to our foreign operations.
Internet Availability
Available free of charge through our internet website are links to our Forms 10-K, 10-Q, 8-K, proxy statements on Schedule 14A and amendments to those reports. These reports can be found on our internet website
www.la-z-boy.com
as soon as reasonably practicable after being electronically filed with, or furnished to, the Securities and Exchange Commission (SEC). Copies of any materials we file with the SEC can also be obtained free of charge through the SEC’s website at
www.sec.gov
. The information on our website is not part of this report.
Our business is subject to a variety of risks. You should carefully consider the risk factors detailed below in conjunction with the other information contained in this report. Interest rates, consumer confidence, housing starts and the overall housing market, increased unemployment, tightening of the financial and consumer credit markets, downturns in the economy and other general economic factors that affect many other businesses are particularly significant to us because our principal products are consumer goods.
The risks and uncertainties described below are those that we currently believe may significantly affect our business. Additional risks and uncertainties of which we are unaware of or that we do not currently deem significant may also become important factors that affect us at a later date. You should carefully consider the risks and uncertainties described below in addition to all other information provided to you in this document and our subsequent filings with the Securities and Exchange Commission. Any of the following risks could significantly and adversely affect our business, results of operations, and financial condition.
9
The prolonged economic downturn could have a negative material impact on our sales, results of operations and cash flows.
Our business is impacted by international, national and regional economic conditions. The global economy experienced a major recession and continued to be affected by wavering consumer confidence and lower home values, prolonged foreclosure activity and a weak housing market throughout the country, high levels of unemployment and reduced access to consumer credit. While these factors are outside of our control, they could have a negative impact on our sales, results of operations and cash flows. The prolonged economic downturn may cause our current and potential customers to delay their purchases or affect their ability to pay, which could have a negative long-term impact on our sales, results of operations and cash flows.
Our current retail markets and other markets which we may enter into or acquire in the future may not achieve the growth and profitability we anticipated when we acquired them. We could incur charges for the impairment of long-lived assets if we cannot meet our earnings expectations for these markets.
We may remodel and relocate existing stores, as well as close underperforming stores. Profitability will depend on increased retail sales justifying the cost of remodeling and relocating these stores to support the lease carrying costs and our ability to reduce support costs as a percent of sales in advertising, selling and administration. In addition, we may acquire additional retail markets in the future, and if we do, they may be subject to many of the same risks. We may also incur unforeseen costs upon entry into new markets that could negatively impact our results of operations.
Availability of foreign sourcing and economic uncertainty in countries outside of the United States in which we operate or purchase product from could adversely affect our business and results of operations.
We have operations in countries outside the United States, some of which are located in emerging markets. Long-term economic and political uncertainty in some of the countries in which we operate, such as Mexico and Thailand, could result in the disruption of markets and negatively affect our business. We do not believe the natural disaster experienced in Japan will have a significant impact on our business. We have been increasing our offshore capabilities to provide flexibility in product offerings and pricing to meet competitive pressures. Our Casegoods Group is primarily an importer of products manufactured by foreign sources. In addition, our Upholstery Group purchases cut-and-sewn fabric and leather sets and some finished goods from foreign sourced vendors. Our sourcing partners may not be able to produce these goods in a timely fashion, or the quality of their product may be rejected by us, causing delays in shipping to our customers for casegoods and manufacturing disruptions in our upholstery plants due to not receiving rolled fabric, leather hides, and fabric and leather cut-and-sewn sets. The majority of our cut-and-sewn leather sets purchased in China are purchased from one supplier. Additionally we receive cut-and-sewn sets from our facility located in Mexico.
There are other risks that are inherent in our non-U.S. operations, including the potential for changes in socio-economic conditions, changes in laws and regulations, including import, export, labor and environmental laws, tariffs and trade barriers, monetary and fiscal policies, investments, taxation, and exchange controls. Additionally, unsettled political conditions, possible terrorist attacks, organized crime and public health concerns present a risk to our non-U.S. operations. All of these items could make it more difficult to service our customers or cause disruptions in our plants that could reduce our sales, earnings, or both in the future.
Changes in regulation of our international operations could adversely affect our business and results of operations.
Because we have operations outside of the United States and because we sell product in various countries, we are subject to many laws governing international relations, including those that prohibit improper payments to government officials and restrict where we can do business, what information or products we can supply to certain countries and what information we can provide to a non-U.S. government, including the Foreign Corrupt Practices Act and the U.S. Export Administration Act. Violations of these laws, which are complex, may result in criminal penalties or sanctions that could have a significant adverse effect on our business and results of operations. Although we have implemented policies and procedures designed to ensure compliance with these laws, there can be no assurance that our employees, contractors, or agents will not violate our policies.
10
Fluctuations in the price, availability and quality of raw materials could cause delays that could result in our inability to provide goods to our customers or could increase our costs, either of which could decrease our earnings.
We use various types of wood, fabrics, leathers, upholstered filling material, steel, and other raw materials in manufacturing furniture. Because we are dependent on outside suppliers for our raw material needs, fluctuations in the price, availability and quality of the raw materials we use could have a negative effect on our cost of sales and our ability to meet our customers’ demands. Inability to meet our customers’ demands could result in the loss of future sales, and we may not always be able to pass along price increases to our customers due to competitive and marketing pressures. Since we have a higher concentration in upholstery sales (70%) than most of our competitors, the effects of steel, polyurethane foam, leather and fabric price increases or quantity shortages are more significant for our business than for most other furniture companies. About 69% of our polyurethane foam comes from one supplier, although this supplier has several facilities across the United States. A natural disaster or severe weather that affects this supplier could result in delays in shipments of polyurethane foam to our plants. We have attempted to minimize this risk by requiring a minimum of 60 days’ worth of production of the principal raw material to be stored at an off-site facility.
A change in the financial condition of some of our domestic and foreign fabric suppliers could impede their ability to provide these products to us in a timely manner. In addition, upholstered furniture is highly fashion oriented, and if we are not able to acquire sufficient fabric variety, or if we are unable to predict or respond to changes in fashion trends, we may lose sales and have to sell excess inventory at reduced prices. This would lower our earnings as well as reduce our sales.
Business failures of large dealers or customers could result in a decrease in our future sales and earnings.
Although we have no customer who individually represents 6% or more of the annual sales of any of our segments, business failures or consolidation of large dealers or customers could result in a decrease in our future sales and earnings.
The consolidation of manufacturing and warehousing operations into fewer sites may increase our exposure to business disruptions and could result in higher transportation costs.
We have reduced the number of manufacturing sites and consolidated some warehouse operations. If any of these operations experience significant business interruptions, our ability to manufacture and deliver products in a timely manner, would likely be negatively impacted. Additionally, our consolidation of warehouse operations has resulted in longer distances for delivery and could result in higher transportation costs if there are significant increases in fuel costs.
Healthcare reform legislation could have an impact on our business.
While the true cost of the healthcare legislation enacted in the previous year will occur after 2013 due to provisions of the legislation being phased in over time, changes to our healthcare costs structure could have a significant impact on our business. The Patient Protection and Affordable Care Act as well as other healthcare reform legislation being considered by Congress and state legislatures may have an impact on our business. While we are continuing to evaluate the effects of these legislative developments on our business, the impact on the healthcare industry is extensive and includes, among other things, having the federal government assume a greater role in the health care system, expanding healthcare coverage in the United States, mandating basic healthcare benefits and imposing regulations on businesses who provide or do not provide healthcare insurance to their employees. Our current assessment is that this legislation will most likely continue to increase our employee healthcare-related costs.
11
Inability to maintain and enhance our brand and respond to changes in our current and potential customers’ tastes and trends in a timely manner could adversely affect our business and operating results.
The success of our business depends on our ability to maintain and enhance our brands to grow our business by retaining current customers and attracting new ones. Additionally, because furniture product is extremely fashion oriented, changes in consumers’ tastes and trends and the resultant change in our product mix could adversely impact our business and operating results. We attempt to minimize these risks by maintaining a strong advertising and marketing campaign promoting both our brands and our current product designs, styles, quality and prices. If these efforts are unsuccessful, or we incur substantial costs in connection with these efforts, our business, operating results and financial or competitive condition could be adversely affected.
We rely extensively on computer systems to process transactions, summarize results and manage our business. Disruptions in both our primary and back-up systems could adversely affect our business and operating results.
Our primary and back-up computer systems are subject to damage or interruption from power outages, computer and telecommunications failures, computer viruses, security breaches, natural disasters and usage errors by employees. Though some of these issues would be covered by insurance, interruptions of our critical business computer systems and/or failure of our back-up systems could negatively impact our sales or result in longer production times. Additionally, if our critical business computer systems or our back-up systems are damaged or cease to function properly, we may have to make a significant investment to fix or replace them.
None.
We owned or leased approximately 10.5 million square feet of manufacturing, warehousing and distribution centers, office, showroom, and retail facilities, and had approximately 1.6 million square feet of idle facilities at the end of fiscal 2011. Of the 10.5 million square feet occupied at the end of fiscal 2011, our Upholstery Group occupied approximately 6.3 million square feet, our Casegoods Group occupied approximately 2.1 million square feet, our Retail Group occupied approximately 1.5 million square feet and our non-segmented operations occupied the balance.
Our active facilities are located in Arkansas, California, Connecticut, Delaware, Florida, Georgia, Illinois, Indiana, Kansas, Maryland, Massachusetts, Michigan, Mississippi, Missouri, New Hampshire, New Jersey, New York, North Carolina, Pennsylvania, Rhode Island, Tennessee, Virginia, Washington D.C., Coahuila (Mexico) and Bangkok (Thailand). All of our plants are well maintained and insured. We do not expect any major land or building additions will be needed to increase capacity in the foreseeable future for our manufacturing operations. We own all of our domestic plants, some of which have been financed under long-term industrial revenue bonds, and our Thailand plant. We lease the majority of our retail stores and regional distribution centers, as well as our manufacturing facility in Mexico. For information on terms of operating leases for our properties, see Note 8 to our consolidated financial statements, which is included in Item 8 of this report.
We are involved in various legal proceedings arising in the ordinary course of our business. Based on a review of all currently known facts and our experience with previous legal matters, we have recorded expense in respect of probable and reasonably estimable losses arising from legal matters and currently do not anticipate any significant additional loss.
12
EXECUTIVE OFFICERS OF REGISTRANT
Listed below are the names, ages and current positions of our executive officers and, if they have not held those positions for at least five years, their former positions during that period with us or other companies. All executive officers serve at the pleasure of the board of directors.
Kurt L. Darrow, age 56
|
•
|
President and Chief Executive Officer since September 2003
|
Steven M. Kincaid, age 62
|
•
|
Senior Vice President of La-Z-Boy and President of Casegoods since November 2003
|
|
•
|
President, Kincaid Furniture Company, Incorporated since June 1983
|
Louis M. Riccio, Jr., age 48
|
•
|
Senior Vice President of La-Z-Boy and Chief Financial Officer since July 2006
|
|
•
|
Treasurer from April 2007 through August 2007 and February 2010 through April 2010
|
Otis S. Sawyer, age 53
|
•
|
Senior Vice President of La-Z-Boy and President of Non-Branded Upholstery since February 2008
|
|
•
|
President, England, Incorporated since February 2008
|
|
•
|
Senior Vice President Corporate Operations from May 2006 through February 2008
|
Mark S. Bacon, Sr., age 48
|
•
|
Senior Vice President of La-Z-Boy and Chief Retail Officer since October 2008
|
|
•
|
Executive Vice President of Sales, Commercial and Operations of The Pep Boys - Manny, Moe & Jack from March 2004 through September 2007
|
13
Purchases of Equity Securities by the Issuer and Affiliated Purchasers
We did not purchase any of our common shares during the fourth quarter of fiscal year 2011.
Recent Sales of Unregistered Securities
There were no sales of unregistered securities during fiscal year 2011.
Equity Plans
The table below provides information concerning our compensation plans under which common shares may be issued.
|
Plan category
|
Number of
securities to be
issued upon
exercise of
outstanding
options
(i)
|
Weighted-
average
exercise
price of
outstanding
options
(ii)
|
Number of
securities
remaining
available for
future issuance
under
equity
compensation
plans (excluding
securities
reflected in
column (i))
(iii)
|
|||||||||
|
Equity compensation plans approved by
shareholders
|
2,575,955 | (1) | $ | 9.54 | 3,080,947 | (2) | ||||||
Note 1: These options were issued under our 2010 Omnibus Incentive Plan, 2004 Long-Term Equity Award Plan and 1997 Incentive Stock Option Plan. No additional options can be awarded under the 2004 or 1997 plans, but 2,049,563 and 370,345 options are still outstanding under the 2004 and 1997 plans, respectively.
Note 2: This amount is the aggregate number of shares available for future issuance under our 2010 Omnibus Incentive Plan. The omnibus incentive plan provides for awards of stock options, restricted stock, and performance awards (awards of our common stock based on achievement of pre-set goals over a performance period) to selected key employees and non-employee directors.
14
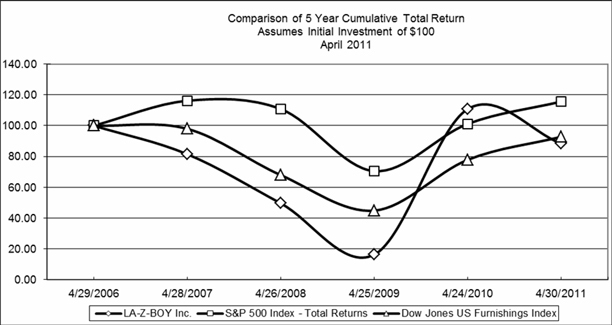
The graph below shows the cumulative total return for our last five fiscal years that would have been realized (assuming reinvestment of dividends) by an investor who invested $100 on April 30, 2006 in our common shares, in the S&P 500 Composite Index and in the Dow Jones U.S. Furnishings Index.
|
Company/Index/Market
|
2006
|
2007
|
2008
|
2009
|
2010
|
2011
|
||||||||||||||||||
|
La-Z-Boy Incorporated
|
$ | 100 | $ | 81.53 | $ | 49.62 | $ | 16.30 | $ | 110.80 | $ | 88.34 | ||||||||||||
|
S&P 500 Composite Index
|
$ | 100 | $ | 116.15 | $ | 110.81 | $ | 70.51 | $ | 101.17 | $ | 115.65 | ||||||||||||
|
Dow Jones U.S. Furnishings Index
|
$ | 100 | $ | 97.97 | $ | 67.96 | $ | 44.87 | $ | 77.87 | $ | 92.79 | ||||||||||||
15
Dividend and Market Information
The New York Stock Exchange is the principal market in which our common stock is traded. The tables below show the high and low sale prices of our common stock on the New York Stock Exchange during each quarter of our last two fiscal years.
|
Market Price
|
||||||||||||
|
Fiscal 2011
Quarter Ended
|
High
|
Low
|
Close
|
|||||||||
|
July 24
|
$ | 14.93 | $ | 6.44 | $ | 8.65 | ||||||
|
October 23
|
$ | 9.15 | $ | 6.47 | $ | 7.90 | ||||||
|
January 22
|
$ | 9.50 | $ | 7.28 | $ | 8.21 | ||||||
|
April 30
|
$ | 11.79 | $ | 7.77 | $ | 11.76 | ||||||
|
Market Price
|
||||||||||||
|
Fiscal 2010
Quarter Ended
|
High
|
Low
|
Close
|
|||||||||
|
July 25
|
$ | 6.60 | $ | 1.81 | $ | 6.59 | ||||||
|
October 24
|
$ | 10.29 | $ | 6.11 | $ | 8.90 | ||||||
|
January 23
|
$ | 11.63 | $ | 6.57 | $ | 11.35 | ||||||
|
April 24
|
$ | 15.46 | $ | 9.04 | $ | 14.75 | ||||||
No dividends were paid during fiscal 2011 or fiscal 2010. Our credit agreement prohibits us from paying dividends if our “excess availability,” as defined in the credit agreement, falls below $30 million. As of April 30, 2011, we had $108.2 million of excess availability under the credit agreement. Refer to Note 7 of the consolidated financial statements in Item 8 for further discussion of our credit agreement. The payment of future cash dividends is within the discretion of our Board of Directors and will depend, among other factors, on our earnings, capital requirements and operating and financial condition, as well as excess availability under the credit agreement.
Shareholders
We had about 13,900 shareholders of record at June 14, 2011.
16
The following table presents our selected financial data. The table should be read in conjunction with Item 7,
Management’s Discussion and Analysis of Financial Condition and Results of Operations
, and Item 8,
Financial Statements and Supplementary Data
, of this Annual Report on Form 10-K. This information is derived from our audited financial statements and should be read in conjunction with those statements, including the related notes.
Consolidated Five-Year Summary of Financial Data
|
(Dollar amounts in thousands, except per
share data)
|
(53 weeks)
|
(52 weeks)
|
(52 weeks)
|
(52 weeks)
|
(52 weeks)
|
|||||||||||||||
|
Fiscal Year Ended
|
4/30/2011
|
4/24/2010
|
4/25/2009
|
4/26/2008
|
4/28/2007
|
|||||||||||||||
|
Sales
|
$ | 1,187,143 | $ | 1,179,212 | $ | 1,226,674 | $ | 1,459,874 | $ | 1,621,460 | ||||||||||
|
Cost of sales
|
||||||||||||||||||||
|
Cost of goods sold
|
832,962 | 803,945 | 878,967 | 1,060,982 | 1,192,020 | |||||||||||||||
|
Restructuring
|
(163 | ) | 2,141 | 9,818 | 5,057 | 3,371 | ||||||||||||||
|
Total cost of sales
|
832,799 | 806,086 | 888,785 | 1,066,039 | 1,195,391 | |||||||||||||||
|
Gross profit
|
354,344 | 373,126 | 337,889 | 393,835 | 426,069 | |||||||||||||||
|
Selling, general and administrative
|
323,314 | 331,405 | 373,125 | 399,305 | 387,769 | |||||||||||||||
|
Restructuring
|
650 | 1,293 | 2,642 | 3,078 | 7,662 | |||||||||||||||
|
Write-down of long-lived assets
|
4,471 | — | 7,503 | — | — | |||||||||||||||
|
Write-down of trade names
|
— | — | 5,541 | — | — | |||||||||||||||
|
Write-down of goodwill
|
— | — | 42,136 | 8,426 | — | |||||||||||||||
|
Operating income (loss)
|
25,909 | 40,428 | (93,058 | ) | (16,974 | ) | 30,638 | |||||||||||||
|
Interest expense
|
2,346 | 2,972 | 5,581 | 13,899 | 10,206 | |||||||||||||||
|
Interest income
|
944 | 724 | 2,504 | 3,614 | 3,952 | |||||||||||||||
|
Income from Continued Dumping and Subsidy Offset Act, net
|
1,054 | 4,436 | 8,124 | 7,147 | 3,430 | |||||||||||||||
|
Other income (expense), net
|
405 | 480 | (7,888 | ) | 5,393 | 728 | ||||||||||||||
|
Income (loss) from continuing operations before income taxes
|
25,966 | 43,096 | (95,899 | ) | (14,719 | ) | 28,542 | |||||||||||||
|
Income tax expense (benefit)
|
8,593 | 11,737 | 26,514 | (7,168 | ) | 9,605 | ||||||||||||||
|
Income (loss) from continuing operations
|
17,373 | 31,359 | (122,413 | ) | (7,551 | ) | 18,937 | |||||||||||||
|
Loss from discontinued operations (net of tax)
|
— | — | — | (6,000 | ) | (15,629 | ) | |||||||||||||
|
Net income (loss)
|
17,373 | 31,359 | (122,413 | ) | (13,551 | ) | 3,308 | |||||||||||||
|
Net (income) loss attributable to noncontrolling interests
|
6,674 | 1,342 | (252 | ) | (277 | ) | (29 | ) | ||||||||||||
|
Net income (loss) attributable to La-Z-Boy Incorporated
|
$ | 24,047 | $ | 32,701 | $ | (122,665 | ) | $ | (13,828 | ) | $ | 3,279 | ||||||||
|
Diluted weighted average shares
|
52,279 | 51,732 | 51,460 | 51,408 | 51,475 | |||||||||||||||
|
Diluted income (loss) per share from continuing operations
|
$ | 0.33 | $ | 0.61 | $ | (2.38 | ) | $ | (0.15 | ) | $ | 0.37 | ||||||||
|
Diluted net income (loss) per share attributable to La-Z-Boy Incorporated
|
$ | 0.45 | $ | 0.62 | $ | (2.39 | ) | $ | (0.27 | ) | $ | 0.06 | ||||||||
|
Dividends declared per share
|
$ | — | $ | — | $ | 0.10 | $ | 0.40 | $ | 0.48 | ||||||||||
|
Book value of year-end shares outstanding
|
$ | 6.96 | $ | 6.56 | $ | 5.81 | $ | 8.67 | $ | 9.36 | ||||||||||
17
Consolidated Five-Year Summary of Financial Data (continued)
|
(Dollar amounts in thousands)
|
(53 weeks)
|
(52 weeks)
|
(52 weeks)
|
(52 weeks)
|
(52 weeks)
|
|||||||||||||||
|
Fiscal Year Ended
|
4/30/2011
|
4/24/2010
|
4/25/2009
|
4/26/2008
|
4/28/2007
|
|||||||||||||||
|
Return on average total equity
(1)
|
4.9 | % | 9.7 | % | (32.5 | )% | (1.6 | )% | 3.8 | % | ||||||||||
|
Gross profit as a percent of sales
|
29.8 | % | 31.6 | % | 27.5 | % | 27.0 | % | 26.3 | % | ||||||||||
|
Operating profit (loss) as a percent of sales
|
2.2 | % | 3.4 | % | (7.6 | )% | (1.2 | )% | 1.9 | % | ||||||||||
|
Effective tax rate
(1)
|
33.1 | % | 27.2 | % | (27.6 | )% | 48.7 | % | 33.7 | % | ||||||||||
|
Return on sales
(1)
|
1.5 | % | 2.7 | % | (10.0 | )% | (0.5 | )% | 1.2 | % | ||||||||||
|
Depreciation and amortization
|
$ | 24,302 | $ | 25,246 | $ | 24,142 | $ | 25,323 | $ | 27,678 | ||||||||||
|
Capital expenditures
|
$ | 10,540 | $ | 10,986 | $ | 15,625 | $ | 27,386 | $ | 25,811 | ||||||||||
|
Property, plant and equipment, net
|
$ | 120,603 | $ | 138,857 | $ | 146,896 | $ | 168,325 | $ | 181,170 | ||||||||||
|
Working capital
|
$ | 300,119 | $ | 279,768 | $ | 220,401 | $ | 263,245 | $ | 312,966 | ||||||||||
|
Current ratio
(2)
|
3.3 to 1
|
2.9 to 1
|
2.7 to 1
|
2.6 to 1
|
2.4 to 1
|
|||||||||||||||
|
Total assets
|
$ | 593,455 | $ | 607,783 | $ | 548,330 | $ | 767,021 | $ | 875,548 | ||||||||||
|
Long-term debt, excluding current portion
|
$ | 29,937 | $ | 46,917 | $ | 52,148 | $ | 99,578 | $ | 113,172 | ||||||||||
|
Total debt
|
$ | 35,057 | $ | 47,983 | $ | 60,872 | $ | 104,370 | $ | 151,248 | ||||||||||
|
Total equity
|
$ | 364,140 | $ | 343,114 | $ | 303,419 | $ | 448,957 | $ | 483,588 | ||||||||||
|
Debt to equity ratio
(3)
|
9.6 | % | 14.0 | % | 20.1 | % | 23.2 | % | 31.3 | % | ||||||||||
|
Debt to capitalization ratio
(4)
|
8.8 | % | 12.3 | % | 16.7 | % | 18.9 | % | 23.8 | % | ||||||||||
|
Shareholders
|
13,900 | 17,400 | 16,700 | 20,200 | 23,900 | |||||||||||||||
|
Employees
|
7,910 | 8,290 | 7,730 | 10,060 | 11,700 | |||||||||||||||
(1) Based on income (loss) from continuing operations
(2) Equal to total current assets divided by total current liabilities
(3) Equal to total debt divided by total equity
(4) Equal to total debt divided by total debt plus total equity
18
Unaudited Quarterly Financial Information Fiscal 2011
|
(Dollar amounts in thousands, except per share data)
|
(13 weeks)
|
(13 weeks)
|
(13 weeks)
|
(14 weeks)
|
||||||||||||
|
Fiscal Quarter Ended
|
7/24/2010
|
10/23/2010
|
1/22/2011
|
4/30/2011
|
||||||||||||
|
Sales
|
$ | 263,313 | $ | 292,982 | $ | 291,943 | $ | 338,905 | ||||||||
|
Cost of sales
|
||||||||||||||||
|
Cost of goods sold
|
190,500 | 207,938 | 203,662 | 230,862 | ||||||||||||
|
Restructuring
|
(21 | ) | (62 | ) | (65 | ) | (15 | ) | ||||||||
|
Total cost of sales
|
190,479 | 207,876 | 203,597 | 230,847 | ||||||||||||
|
Gross profit
|
72,834 | 85,106 | 88,346 | 108,058 | ||||||||||||
|
Selling, general and administrative
|
74,320 | 79,657 | 78,057 | 91,280 | ||||||||||||
|
Restructuring
|
165 | 110 | 297 | 78 | ||||||||||||
|
Write-down of long-lived assets
|
— | — | — | 4,471 | ||||||||||||
|
Operating income (loss)
|
(1,651 | ) | 5,339 | 9,992 | 12,229 | |||||||||||
|
Interest expense
|
590 | 592 | 561 | 603 | ||||||||||||
|
Interest income
|
243 | 223 | 250 | 228 | ||||||||||||
|
Income from Continued Dumping and Subsidy Offset Act, net
|
— | — | 903 | 151 | ||||||||||||
|
Other income (expense), net
|
351 | (418 | ) | 251 | 221 | |||||||||||
|
Income (loss) before income taxes
|
(1,647 | ) | 4,552 | 10,835 | 12,226 | |||||||||||
|
Income tax expense (benefit)
|
(705 | ) | 1,381 | 2,451 | 5,466 | |||||||||||
|
Net income (loss)
|
(942 | ) | 3,171 | 8,384 | 6,760 | |||||||||||
|
Net loss attributable to noncontrolling interests
|
726 | 774 | 1,626 | 3,548 | ||||||||||||
|
Net income (loss) attributable to La-Z-Boy Incorporated
|
$ | (216 | ) | $ | 3,945 | $ | 10,010 | $ | 10,308 | |||||||
|
Diluted weighted average shares
|
51,785 | 52,214 | 52,270 | 52,359 | ||||||||||||
|
Diluted net income per share attributable to La-Z-Boy Incorporated
|
$ | — | $ | 0.07 | $ | 0.19 | $ | 0.19 | ||||||||
19
Unaudited Quarterly Financial Information Fiscal 2010
|
(Dollar amounts in thousands, except per share data)
|
(13 weeks)
|
(13 weeks)
|
(13 weeks)
|
(13 weeks)
|
||||||||||||
|
Fiscal Quarter Ended
|
7/25/2009
|
10/24/2009
|
1/23/2010
|
4/24/2010
|
||||||||||||
|
Sales
|
$ | 262,671 | $ | 300,707 | $ | 305,094 | $ | 310,740 | ||||||||
|
Cost of sales
|
||||||||||||||||
|
Cost of goods sold
|
182,113 | 205,602 | 206,930 | 209,300 | ||||||||||||
|
Restructuring
|
736 | 663 | 392 | 350 | ||||||||||||
|
Total cost of sales
|
182,849 | 206,265 | 207,322 | 209,650 | ||||||||||||
|
Gross profit
|
79,822 | 94,442 | 97,772 | 101,090 | ||||||||||||
|
Selling, general and administrative
|
77,916 | 84,619 | 83,811 | 85,059 | ||||||||||||
|
Restructuring
|
301 | 520 | 201 | 271 | ||||||||||||
|
Operating income
|
1,605 | 9,303 | 13,760 | 15,760 | ||||||||||||
|
Interest expense
|
980 | 831 | 577 | 584 | ||||||||||||
|
Interest income
|
276 | 199 | 140 | 109 | ||||||||||||
|
Income from Continued Dumping and Subsidy Offset Act, net
|
— | — | 4,436 | — | ||||||||||||
|
Other income (expense), net
|
601 | 236 | (593 | ) | 236 | |||||||||||
|
Income before income taxes
|
1,502 | 8,907 | 17,166 | 15,521 | ||||||||||||
|
Income tax expense (benefit)
|
(3 | ) | 3,529 | 6,502 | 1,709 | |||||||||||
|
Net income
|
1,505 | 5,378 | 10,664 | 13,812 | ||||||||||||
|
Net loss attributable to noncontrolling interests
|
73 | 588 | 489 | 192 | ||||||||||||
|
Net income attributable to La-Z-Boy Incorporated
|
$ | 1,578 | $ | 5,966 | $ | 11,153 | $ | 14,004 | ||||||||
|
Diluted weighted average shares
|
51,479 | 51,755 | 51,845 | 52,101 | ||||||||||||
|
Diluted net income per share attributable to La-Z-Boy Incorporated
|
$ | 0.04 | $ | 0.11 | $ | 0.21 | $ | 0.26 | ||||||||
20
We have prepared this Management’s Discussion and Analysis to help you better understand our financial results
.
You should read it in conjunction with the accompanying Consolidated Financial Statements and related Notes to Consolidated Financial Statements. We begin with an introduction to our key businesses, strategies and significant operational events in fiscal 2011. We then provide discussions of our results of operations, liquidity and capital resources, and critical accounting policies.
Introduction
Our Business
La-Z-Boy Incorporated manufactures, markets, imports, distributes and retails upholstery products and casegoods (wood) furniture products. Our La-Z-Boy brand is the most recognized brand in the furniture industry, and we are the leading global producer of reclining chairs.
We sell our products, primarily in the United States and Canada, to furniture retailers and directly to consumers through company-owned stores. The centerpiece of our retail distribution strategy is our network of 304 La-Z-Boy Furniture Galleries® stores, each dedicated to marketing our La-Z-Boy branded products. We own 83 of those stores. The rest are independently owned and operated, including eight stores owned by our single remaining consolidated VIE. La-Z-Boy Furniture Galleries® stores help consumers furnish their homes by combining the style, comfort and quality of La-Z-Boy furniture with our in-home design service. Taken together, the 304 stores in our La-Z-Boy Furniture Galleries® network make up the second largest single-branded upholstered furniture retailer in North America.
We also distribute our products through Comfort Studios®, defined spaces within larger independent retailers that are dedicated to displaying La-Z-Boy branded products. On average, these independent retailers dedicate approximately 5,000 square feet of floor space to the Comfort Studios® located within their stores. As of April 30, 2011, there were 526 Comfort Studios®. In addition to the Comfort Studios®, our Kincaid, England and Lea operating units have their own dedicated in-store gallery programs.
Our reportable segments are the Upholstery Group, the Casegoods Group and the Retail Group.
|
|
·
|
Upholstery Group
. In terms of revenue, our largest segment is the Upholstery Group, which includes La-Z-Boy, our largest operating unit, as well as the Bauhaus and England operating units. The Upholstery Group manufactures or imports and sells upholstered furniture such as recliners and motion furniture, sofas, loveseats, chairs, ottomans and sleeper sofas to furniture retailers and proprietary stores. It sells directly to La-Z-Boy Furniture Galleries® stores, operators of Comfort Studios®, general dealers and department stores.
|
|
|
·
|
Casegoods Group
. Our Casegoods Group is an importer, marketer, manufacturer and distributor of casegoods (wood) furniture such as bedroom sets, dining room sets, entertainment centers, and accent pieces, as well as some coordinated upholstered furniture. The operating units in the Casegoods Group consist of two subgroups: one consisting of American Drew, Lea, and Hammary, and the second being Kincaid. The Casegoods Group sells to proprietary stores and general dealers.
|
|
|
·
|
Retail Group
. Our Retail Group consists of the 83 company-owned La-Z-Boy Furniture Galleries® stores located in nine markets ranging from the Midwest to the east coast of the United States and also including southeastern Florida and southern California. During the fourth quarter of fiscal 2011, we acquired 15 stores in southern California that were previously operated by one of our consolidated VIEs. The Retail Group primarily sells upholstered furniture, as well as some casegoods and other accessories, to end consumers through the retail network.
|
21
Variable Interest Entities
We have a special operating agreement in place with one independent dealer that is a VIE which causes us to be considered its primary beneficiary. Through January 31, 2011, we consolidated a second independent dealer because of a similar special operating agreement. During the fourth quarter of fiscal 2011 we acquired the fifteen stores of this VIE, and those stores are now included in our Retail Group. As a result, our VIEs’ results included 23 stores through January 31, 2011 and 8 stores for the full fiscal year 2011. In comparison, we had three VIEs operating 29 stores during fiscal 2010.
Significant Operational Events in Fiscal 2011
Our consolidated operating results were negatively impacted during fiscal 2011 due to increased raw material costs, coupled with a slight decrease in sales level experienced by our Upholstery Group when taking out the extra week in fiscal 2011 compared to fiscal 2010. We believe the decrease in sales level for our Upholstery Group was a result of weaker demand and a shift to more promotional products decreasing our average selling price.
Our Casegoods Group operating results were positively impacted by our decision to vacate a leased warehouse and convert an owned facility to a warehouse. Efficiencies realized in our remaining casegoods manufacturing facility due to the closure of another facility completed at the end of fiscal 2010 also positively impacted our operating results for this group. Additionally, the combining of our Hammary operations with our American Drew/Lea operations eliminated duplicate selling, general and administrative functions, which had a positive impact on this segment’s operating results.
We continued to improve the operating results of our Retail Group. Increased sales levels for this segment, which we attribute to an effective promotional plan and improved conversion rates on the customer traffic in our stores, combined with solid expense control, resulted in improved operating results for this segment.
As discussed above, we acquired the La-Z-Boy Furniture Galleries® stores operation in Southern California, which we previously consolidated as a VIE. In addition to the change in store count for our Retail Group, the results of operations for these 15 stores are included in our net income attributable to La-Z-Boy Incorporated starting in the fourth quarter of fiscal 2011, instead of our net loss attributable to noncontrolling interests.
22
Results of Operations
Fiscal Year 2011 Compared to Fiscal Year 2010
La-Z-Boy Incorporated
|
(Amounts in thousands, except percentages)
|
(53 weeks)
4/30/2011
|
(52 weeks)
4/24/2010
|
Percent
change
|
|||||||||
|
Consolidated sales
|
$ | 1,187,143 | $ | 1,179,212 | 0.7 | % | ||||||
|
Consolidated operating income
|
25,909 | 40,428 | (35.9 | )% | ||||||||
|
Consolidated operating margin
|
2.2 | % | 3.4 | % | ||||||||
Sales
Consolidated sales increased $7.9 million compared to fiscal 2010. All of our segments experienced an increase in sales during fiscal 2011, mainly due to the additional week in fiscal 2011. This was offset by the deconsolidation of our Toronto, Ontario VIE, which resulted in a decrease of $20.4 million, net of eliminations.
Operating Margin
Our consolidated operating margin decreased by 1.2 percentage points in fiscal 2011.
|
|
·
|
Our gross margin decreased by 1.8 percentage points in fiscal 2011 mainly due to the following:
|
|
|
o
|
Increases in raw material costs resulted in a 1.6 percentage point decrease in our consolidated gross margin.
|
|
|
o
|
Changes in our product mix resulted in a 0.4 percentage point decrease in gross margin.
|
|
|
o
|
Cost reductions partially offset the raw material and product mix changes.
|
|
|
·
|
Our fiscal 2011 operating margin included less than 0.1 percentage points of restructuring charges and 0.4 percentage points for the write-down of long-lived assets, whereas our fiscal 2010 operating margin included 0.3 percentage points of restructuring charges.
|
Upholstery Group
|
(Amounts in thousands, except percentages)
|
(53 weeks)
4/30/2011
|
(52 weeks)
4/24/2010
|
Percent
change
|
|||||||||
|
Sales
|
$ | 916,867 | $ | 904,871 | 1.3 | % | ||||||
|
Operating income
|
72,743 | 95,732 | (24.0 | )% | ||||||||
|
Operating margin
|
7.9 | % | 10.6 | % | ||||||||
Sales
Our Upholstery Group’s sales increased $12.0 million compared to fiscal 2010. This was a result of the additional week in fiscal 2011.
Operating Margin
Our Upholstery Group’s operating margin decreased 2.7 percentage points in fiscal 2011 mainly due to the following:
|
|
·
|
The segment’s gross margin decreased by 2.1 percentage points during fiscal 2011 due to increased raw material costs.
|
|
|
·
|
Decreases in selling prices and changes in the product mix of this segment resulted in a 0.7 percentage point decrease in the segment’s operating margin.
|
|
|
·
|
Increases in our warehousing expense resulted in a 0.3 percentage point decrease in the segment’s operating margin. This increase was the result of the addition of our new regional distribution center opened at the end of fiscal 2010.
|
23
|
|
·
|
Increased advertising expense as a result of the focus on our brand platform resulted in a 0.3 percentage point decrease in the segment’s operating margin.
|
|
|
·
|
Somewhat offsetting the negative impacts to this segment’s operating margin were ongoing cost reductions and a decrease in warranty expense due to the redesign of a mechanism that had historically experienced high claims activity, which resulted in a 0.2 percentage point, improvement in the segment’s operating margin.
|
Casegoods Group
|
(Amounts in thousands, except percentages)
|
(53 weeks)
4/30/2011
|
(52 weeks)
4/24/2010
|
Percent
change
|
|||||||||
|
Sales
|
$ | 152,534 | $ | 146,706 | 4.0 | % | ||||||
|
Operating income (loss)
|
6,698 | (243 | ) | N/M | ||||||||
|
Operating margin
|
4.4 | % | (0.2 | )% | ||||||||
|
N/M – not meaningful
|
||||||||||||
Sales
Our Casegoods Group’s sales increased $5.8 million compared to fiscal 2010. In addition to the extra week during fiscal 2011, the increase in sales was a result of broader placement of our various product lines at independent dealers. Changes in discounting during fiscal 2011 also generated an improvement in sales for this segment.
Operating Margin
Our Casegoods Group’s operating margin increased 4.6 percentage points in fiscal 2011 mainly due to the following:
|
|
·
|
The segment’s gross margin increased 2.4 percentage points in fiscal 2011 mainly due to our decision to vacate a leased warehouse and convert an owned facility to a warehouse, as well as efficiencies realized in its manufacturing facility due to the changes completed at the end of fiscal 2010.
|
|
|
·
|
A decrease in employee expenses for this segment resulted in a 1.5 percentage point increase in operating margin. The combining of our Hammary operations with our American Drew/Lea operations resulted in a reduction in headcount and elimination of duplicate selling, general and administrative functions.
|
Retail Group
|
(Amounts in thousands, except percentages)
|
(53 weeks)
4/30/2011
|
(52 weeks)
4/24/2010
|
Percent
change
|
|||||||||
|
Sales
|
$ | 176,987 | $ | 153,620 | 15.2 | % | ||||||
|
Operating loss
|
(15,078 | ) | (19,825 | ) | 23.9 | % | ||||||
|
Operating margin
|
(8.5 | )% | (12.9 | )% | ||||||||
Sales
Our Retail Group’s sales increased $23.4 million in fiscal 2011. We believe the increase in sales was a result of an effective promotional plan, which led to improved conversion on the customer traffic in our stores, as well as the additional week in fiscal 2011. The segment’s sales were also positively impacted by the acquisition of 15 stores from our previously consolidated California VIE, which increased sales by $9.4 million for our Retail Group.
Operating Margin
Our Retail Group’s operating margin increased 4.4 percentage points in fiscal 2011 mainly due to the following:
24
|
|
·
|
The segment experienced a 1.0 percentage point improvement in gross profit margin during fiscal 2011 due to changes in the segment’s sales initiatives and merchandising.
|
|
|
·
|
The improved operating margin for this segment was primarily a result of the increased sales volume. Additionally, this segment continued to focus on cost containment, which resulted in lower selling, general and administrative expenses as a percent of sales.
|
VIEs/Corporate and Other
Our VIEs’ sales decreased $24.1 million in fiscal 2011, compared to fiscal 2010. This was mainly the result of deconsolidating our Toronto, Ontario VIE, which reduced the number of stores for our VIEs by 8 during fiscal 2011. Also, our Retail Group’s acquisition in the fourth quarter of fiscal 2011 of 15 stores that had previously been operated by our California VIE resulted in a $5.1 million, net of eliminations, decrease in our VIEs sales during fiscal 2011. Our VIEs’ operating loss was $4.9 million in fiscal 2011, compared to an operating loss of $0.8 million in fiscal 2010. The increased operating loss was mainly due to our Toronto, Ontario VIE, which was a profitable VIE, no longer being consolidated in fiscal 2011.
Our Corporate and Other operating loss decreased by $2.5 million in fiscal 2011. The decrease in operating loss was primarily a result of a decrease in employee incentive compensation expenses as a result of our lower operating performance and stock price in fiscal 2011 compared to fiscal 2010.
Income from Continued Dumping and Subsidy Offset Act
The Continued Dumping and Subsidy Offset Act (“CDSOA”) provides for distribution of monies collected by U.S. Customs and Border Protection from anti-dumping cases to domestic producers that supported the anti-dumping petition. We received $1.1 million and $4.4 million in payments and funds related to the anti-dumping order on wooden bedroom furniture from China during fiscal 2011 and fiscal 2010, respectively, for duties collected on imports entered into the United States before October 1, 2007. The decrease in CDSOA funds we received was a result of the smaller total amount available for distribution. The percentage of total distributions allocated to our divisions that supported the petition was similar to prior years. In view of the uncertainties associated with this program, we are unable to predict the amounts, if any; we may receive in the future.
Interest Expense
Interest expense for fiscal 2011 was $0.6 million less than fiscal 2010 due to a $3.2 million decrease in our average debt. Our weighted average interest rate decreased 0.2 percentage points in fiscal 2011 compared to fiscal 2010. Additionally, our interest expense was positively impacted by the deconsolidation of our Toronto, Ontario VIE.
Income Taxes
Our effective tax rate for fiscal 2011 was 33.1% compared to 27.2% for fiscal 2010. The fiscal 2011 effective rate was impacted by changes in the valuation reserve for deferred taxes due to current year temporary differences that resulted in a rate increase of 13.5 percentage points. Offsetting this rate increase was a tax benefit associated with our southern California VIE that resulted in a rate reduction of 17.6 percentage points. This tax benefit related primarily to the amount of accounts receivable written off in excess of the fair value of the assets received from this VIE.
25
Results of Operations
Fiscal Year 2010 Compared to Fiscal Year 2009
La-Z-Boy Incorporated
|
(Amounts in thousands, except percentages)
|
(52 weeks)
4/24/2010
|
(52 weeks)
4/25/2009
|
Percent
Change
|
|||||||||
|
Consolidated sales
|
$ | 1,179,212 | $ | 1,226,674 | (3.9 | )% | ||||||
|
Consolidated operating income (loss)
|
40,428 | (93,058 | ) | 143.4 | % | |||||||
|
Consolidated operating margin
|
3.4 | % | (7.6 | )% | ||||||||
Consolidated sales decreased $47.5 million due to the continued challenging economic climate. The challenging conditions coupled with our decision to limit our exposure and credit support to certain independent dealers was reflected in our overall decrease in sales for fiscal 2010 compared to fiscal 2009.
|
|
·
|
Our fiscal 2010 gross margin increased by 4.1 percentage points mainly due to the efficiencies gained in our upholstery plants, the restructurings completed in our Casegoods Group and improved pricing and merchandising in our retail stores.
|
|
|
·
|
Our fiscal 2010 operating margin included 0.3 percentage points of restructuring charges, whereas our fiscal 2009 operating margin included 3.9 percentage points for the write-down of goodwill and trade names, 1.0 percentage points of restructuring charges and 0.6 percentage points for the write-down of long-lived assets.
|
|
|
·
|
A decrease in our bad debt expense resulted in a 1.5 percentage point improvement in our operating margin. The decrease in bad debt expense was a result of the stabilization of the financial performance of our dealers during fiscal 2010 compared to fiscal 2009. The sudden deterioration in economic conditions during fiscal 2009 affected the liquidity of some of our customers and their ability to pay outstanding past due balances, which resulted in increased bad debt expense during that time period.
|
Upholstery Group
|
(Amounts in thousands, except percentages)
|
(52 weeks)
4/24/2010
|
(52 weeks)
4/25/2009
|
Percent
Change
|
|||||||||
|
Sales
|
$ | 904,871 | $ | 899,204 | 0.6 | % | ||||||
|
Operating income
|
95,732 | 36,367 | 163.2 | % | ||||||||
|
Operating margin
|
10.6 | % | 4.0 | % | ||||||||
Sales
Our Upholstery Group’s sales were flat compared to fiscal 2009. We believe the strength of the La-Z-Boy brand and the inherent quality associated with the brand allowed us to gain market share during this time of economic distress. Additionally, we continued to focus on various sales initiatives and maintained a strong advertising presence throughout the challenging economic climate.
|
|
·
|
While our Upholstery Group’s sales were flat for the full fiscal 2010 year compared with the full fiscal 2009 year, sales comparisons trended upward in the second half of our fiscal year. Sales for our Upholstery Group increased by 14.8% in the second half of fiscal 2010, compared with the second half of fiscal 2009.
|
26
|
|
In fiscal 2009 the reporting of the retail warehouse operations was changed from the Retail Group to the Upholstery Group. Since the warehouse operations were expanded to incorporate the warehousing, staging and delivery of independent La-Z-Boy Furniture Galleries® dealers’ products as well as for our Retail Group, the reporting of those warehouses was more appropriately included in our La-Z-Boy wholesale operating unit which is a part of our Upholstery Group. As a result of this change, sales and operating profit that were previously recorded within our Upholstery Group for product sold to our Retail Group and still in inventory were reversed. A one-time adjustment was recorded in fiscal 2009 that reduced inter-company sales for the Upholstery Group by $12.1 million during that period, with a corresponding offset recorded in our eliminations line. This adjustment did not affect our consolidated sales.
|
|
|
·
|
The adjustment mentioned above was partially offset by an increase in sales resulting from a change in contractual relationships with our third party carriers as reported in our Form 10-K for the fiscal year ended April 26, 2008. This change resulted in an increase of $11.0 million of sales for our Upholstery Group in fiscal 2009.
|
Operating Margin
Our Upholstery Group’s operating margin increased 6.6 percentage points in fiscal 2010.
|
|
·
|
Efficiencies realized in our domestic upholstery manufacturing facilities resulted in an increase in our operating margin of 3.3 percentage points. Our conversion to cellular manufacturing and our various restructurings completed in recent years resulted in more efficient capacity utilization.
|
|
|
·
|
Although we incurred rising raw material costs in the fourth quarter of fiscal 2010, for the full fiscal year, decreases in raw material costs for our Upholstery Group resulted in a 2.1 percentage point improvement in our operating margin.
|
|
|
·
|
A decrease in our bad debt expense for our Upholstery Group resulted in a 1.8 percentage point improvement in our operating margin.
|
|
|
·
|
In fiscal 2009, the Upholstery Group’s operating income was reduced by $3.3 million due to the one-time adjustment for inter-company profit resulting from the previously mentioned change in reporting of the retail warehouse operations. This adjustment did not affect our consolidated operating results.
|
|
|
·
|
This segment’s operating profit increased by $1.5 million during fiscal 2009 as a result of the change in third party freight carrier contracts as noted previously in our sales discussion.
|
Casegoods Group
|
(Amounts in thousands, except percentages)
|
(52 weeks)
4/24/2010
|
(52 weeks)
4/25/2009
|
Percent
change
|
|||||||||
|
Sales
|
$ | 146,706 | $ | 178,000 | (17.6 | )% | ||||||
|
Operating income (loss)
|
(243 | ) | 554 | (143.9 | )% | |||||||
|
Operating margin
|
(0.2 | )% | 0.3 | % | ||||||||
Sales
The $31.3 million decrease in sales volume occurred across all of our casegoods operating units due to weak consumer demand. The challenging economic climate had a negative impact on consumers’ discretionary spending. We believe that consumers are postponing purchases of casegoods product to a greater extent than upholstered furniture because casegoods product tends to be a higher ticket purchase compared to upholstered furniture. In spite of reduced demand, we were able to reduce our sales discounts, which resulted in a 1.6 percentage point increase in sales for our Casegoods Group.
Operating Margin
Our Casegoods Group basically broke even on a 17.6% decrease in sales volume. The 0.5 percentage point decrease in operating margin in fiscal 2010 was a result of the overall decrease in sales volume experienced across all of our casegoods operating units. The decrease in sales volume outpaced our reduction in operating costs and improvement in gross margin.
27
Retail Group
|
(Amounts in thousands, except percentages)
|
(52 weeks)
4/24/2010
|
(52 weeks)
4/25/2009
|
Percent
change
|
|||||||||
|
Sales
|
$ | 153,620 | $ | 160,838 | (4.5 | )% | ||||||
|
Operating loss
|
(19,825 | ) | (34,841 | ) | 43.1 | % | ||||||
|
Operating margin
|
(12.9 | )% | (21.7 | )% | ||||||||
Sales
|
|
·
|
The $7.2 million decrease in sales was mostly the result of a 15.2% decrease in sales in the first quarter of fiscal 2010 compared to the first quarter of fiscal 2009. There were only slight decreases in sales for the second and third quarter of fiscal 2010 compared to the second and third quarter of fiscal 2009, with a slight increase in sales in the fourth quarter of fiscal 2010 compared to fiscal 2009.
|
|
|
·
|
The improvement in sales for our Retail Group in the latter part of fiscal 2010 was due to increased traffic and a 10% increase in our average ticket, as well as better product merchandising.
|
Operating Margin
Our Retail Group’s operating margin increased 8.8 percentage points in fiscal 2010.
|
|
·
|
Our Retail Group experienced a 1.1 percentage point improvement in gross profit margin.
|
|
|
·
|
Changes made to our selling structure resulted in a 4.7 percentage point improvement in our Retail Group’s operating margin.
|
|
|
·
|
A decrease in occupancy related expenses for our Retail Group resulted in a 0.9 percentage point improvement in our Retail Group’s operating margin. This was mainly a result of improved utility management and a decrease in common area maintenance charges for our leased facilities.
|
|
|
·
|
A decrease in advertising expense for our Retail Group resulted in a 0.7 percentage point improvement in the segment’s operating margin, as we continued to focus on cost effectiveness of our advertising expenses.
|
VIEs/Corporate and Other
Our VIEs’ sales increased to $53.2 million in fiscal 2010, compared to $50.9 million in fiscal 2009. Additionally, our VIEs’ operating loss improved to $0.8 million in fiscal 2010, compared to an operating loss of $4.9 million in fiscal 2009 mainly due to operational improvements made at our Toronto, Ontario VIE.
Our Corporate and Other operating loss increased $8.4 million due in part to a $2.7 million decrease in realized gains on property sales. Additionally, a $6.3 million increase in costs for bonus and stock incentives as a result of our improved performance and higher stock price, resulted in an increase in our Corporate and Other operating loss.
Income from Continued Dumping and Subsidy Offset Act
We received $4.4 million and $8.1 million in payments and funds related to an anti-dumping order on wooden bedroom furniture from China during fiscal 2010 and fiscal 2009, respectively, for duties collected on imports entered into the United States before October 1, 2007.
28
Interest Expense
Interest expense for fiscal 2010 was $2.6 million less than fiscal 2009 due to a $56.8 million decrease in our average debt. Our weighted average interest rate increased 1.5 percentage points in fiscal 2010 compared to fiscal 2009 due to fees associated with the unused portion of our credit facility weighing the overall effective interest rate more heavily.
Other Income/ (Expense)
Other income (expense), net, was income of $0.5 million for fiscal 2010, compared to expense of $7.9 million for fiscal 2009. During fiscal 2010, we recognized $0.1 million related to gains on the sale of investments, compared to $5.3 million of losses during fiscal 2009. Of the $5.3 million for fiscal 2009, $5.1 million was an impairment charge related to available-for-sale marketable securities used to fund future obligations of one of our non-qualified retirement plans. The impairment charge was recorded because those losses were considered other-than-temporary.
Income Taxes
Our effective tax rate for fiscal 2010 was 27.2%. During fiscal 2010 we realized a reduction of our tax asset valuation reserves which lowered our tax rate by 5.3 percentage points. The reduction in our valuation reserves was due to the utilization of some tax assets which were previously reserved in addition to reversals of reserves as a result of improved operating performance in certain state tax jurisdictions during fiscal 2010.
Our effective tax rate for fiscal 2009 was (27.6)%. During fiscal 2009 we recorded a substantial valuation reserve against our federal, state, and foreign deferred tax assets, which more than offset the tax benefit of our losses and reduced our effective tax rate from 35.0% to (12.5)%. Our rate was further reduced as a result of a non-deductible goodwill impairment charge and other adjustments.
Restructuring
During fiscal 2008, we committed to a restructuring plan to consolidate all of our North American cutting and sewing operations in Mexico and to transfer production from our Tremonton, Utah plant to our five remaining La-Z-Boy branded upholstery manufacturing facilities. Our Utah facility ceased operations during the first quarter of fiscal 2009. We had a net reduction of estimated restructuring liabilities of $0.2 million and $0.7 million during fiscal 2011 and fiscal 2010, respectively, classified in total cost of sales, covering severance and benefits. During fiscal 2009, we had restructuring charges of $7.7 million classified in total cost of sales, covering severance and benefits and other restructuring charges.
During fiscal 2007 and fiscal 2008, several of our retail warehouses were consolidated into larger facilities and several underperforming stores were closed. In fiscal 2011, fiscal 2010, and fiscal 2009 we had restructuring charges of $0.7 million, $1.3 million, and $1.6 million, respectively, classified as an operating expense line item below selling, general and administrative, due to contract terminations relating to these actions.
In fiscal 2009, we committed to a restructuring plan to consolidate our casegoods manufacturing plants in North Carolina related to our Kincaid and American Drew/Lea operations and convert one of the facilities into a distribution center. The consolidation of these plants was completed in the first quarter of fiscal 2010 and the conversion of the distribution center was completed in the fourth quarter of fiscal 2010. In connection with this plan, we recorded restructuring charges of $2.8 million and $0.2 million in fiscal 2010 and fiscal 2009, respectively, classified in total cost of sales, covering severance and benefits and other restructuring costs.
Additionally, during fiscal 2009 we committed to restructuring plans to close our plant in Sherman, Mississippi, related to our Bauhaus operations, to reduce our company-wide employment to be more in line with sales volume and to close the operations of our La-Z-Boy U.K. subsidiary due to a change in the strategic direction for this operation. In connection with these plans, during fiscal 2009, we recorded $1.8 million in restructuring charges classified in total cost of sales and $1.7 million classified as an operating expense line item below selling, general and administrative, covering severance and benefits, the write-down of fixed assets, the write-down of inventory and other restructuring
29
Our restructuring charges during fiscal 2009 also included a $0.5 million reduction of estimated restructuring liabilities, classified as an operating expense line item below selling, general and administrative, related to a restructuring plan that took place in fiscal 2007.
Long-lived Asset Write-down
Long-lived assets are reviewed for impairment whenever events or changes in circumstances indicate that the carrying value of an asset or asset group may not be recoverable. While our Retail Group's operating results have improved significantly over the past several years, certain of our locations generate operating losses. As a result, the estimated undiscounted cash flows (based upon, among other things, our annual forecasting process) related to certain locations are less than the carrying value of the underlying assets. For those locations, we have concluded that the estimated fair values approximate only the levels of working capital due primarily to the continuing levels of historic operating losses. Consequently, we concluded that the leasehold improvements at these locations were fully impaired and therefore recorded an impairment charge of $1.8 million for several locations owned by our California VIE and $1.3 million for various company owned stores. In addition, during fiscal 2011 we decided to vacate one of our facilities and recorded an impairment charge of $1.3 million representing the full carrying value of leasehold improvements at that location. We did not have any long-lived asset impairments during fiscal 2010.
Based on the results of our fiscal 2009 asset impairment analysis it was determined that the expected future undiscounted cash flows of the assets of our Upholstery Group and Casegoods Group exceeded their carrying value and therefore no impairment existed. Because of the historical operating losses of our Retail Group and the decline in real estate values in fiscal 2009, we recorded an impairment charge of $7.0 million on some of the long-lived assets of our Retail Group. In addition, during fiscal 2009 we recorded an impairment charge of $0.5 million relating to two of our retail properties that were held for sale.
Write-down of Intangibles
We performed our annual fourth quarter testing of our remaining trade names in fiscal 2011 and fiscal 2010 and found no impairments. As of the end of fiscal 2009 we had no goodwill remaining.
During fiscal 2009, we closed the operations of our La-Z-Boy U.K. subsidiary, we reorganized the Toronto, Ontario retail market and we evaluated the remaining goodwill of our Upholstery and Retail Groups and the remaining trade names of our Casegoods Group. As a result of changes made to the above mentioned business and the steep decline in our stock price and its negative impact on our market capitalization at that time, we recognized a $42.1 million non-cash impairment charge relating to the goodwill in our Upholstery and Retail Groups and our VIEs during fiscal 2009. Additionally, we recognized a $5.5 million non-cash impairment charge relating to the trade names in our Casegoods Group during fiscal 2009.
Business Outlook
In light of the difficult operating environment, we are encouraged by the sales performance for the fourth quarter in each of our three operating segments as well as our same-store sales improvement. Importantly, our efficient operating structure will allow us to achieve improved profitability on any increase in volume. Going forward, we believe our industry-leading brand, coupled with our network of La-Z-Boy Furniture Galleries® stores and Comfort Studios®, position us well to further capitalize on a strengthening of the economy, particularly as it relates to consumer confidence and housing. We believe our new brand platform will continue to drive qualified traffic to our dealer network and, importantly, we will continue to invest in our business.
30
Although the spring period showed some strength, from a seasonality perspective, the industry experiences weaker demand throughout the summer period and, as a result, our plants will shut down for one week of vacation and maintenance during the first quarter, which ends in July. Accordingly, our first quarter is typically the weakest in terms of sales and profits because we ship product for 12 weeks instead of the normal 13 weeks.
Liquidity and Capital Resources
Our sources of cash liquidity include cash and equivalents, cash from operations and amounts available under our credit facility. We believe these sources remain adequate to meet our short-term and long-term liquidity requirements, finance our long-term growth plans, meet debt service, and fulfill other cash requirements for day-to-day operations and capital expenditures. We had cash and equivalents of $115.3 million at April 30, 2011, compared to $108.4 million at April 24, 2010.
Under our credit agreement we have certain covenants and restrictions, including a 1.05 to 1.00 fixed charge coverage ratio requirement which would become effective if our excess availability fell below $30.0 million. Excess availability is the difference between our eligible accounts receivable and inventory less the total of our outstanding letters of credit, other reserves as denoted in our credit agreement and our outstanding borrowings on our revolving credit agreement. We do not expect to fall below the required excess availability threshold in the next twelve months. As of April 30, 2011, we had $20.0 million outstanding on our credit facility and $108.2 million of excess availability, compared to $30.0 million outstanding on our credit facility and $90.6 million of excess availability as of April 24, 2010. The increase in our excess availability was mainly the result of the decrease in the amount outstanding on our credit facility during fiscal 2011.
Our borrowing capacity is based on eligible trade accounts receivables and inventory. During fiscal 2011 we reduced the total commitment under our credit facility to $175.0 million. We made this reduction because we expect our borrowing capacity to remain at or below $175.0 million, and the reduction resulted in lower commitment fees on the unused portion of the credit facility. This reduction had no impact on our overall availability to borrow on our credit facility.
Capital expenditures for fiscal 2011 were $10.5 million compared with $11.0 million during fiscal 2010. We have no material purchase commitments for capital expenditures. Capital expenditures are expected to be in the range of $15.0 million to $20.0 million in fiscal 2012.
We expect restructuring costs from all our remaining plans to impact our operating cash flows by approximately $0.2 million during fiscal 2012.
We believe our present cash and equivalents balance of $115.3 million, cash flows from operations and current availability under our credit facility of $108.2 million will be sufficient to fund our business needs, including our fiscal 2012 contractual obligations of $53.1 million as presented in our contractual obligations table.
31
The following table illustrates the main components of our cash flows:
|
Cash Flows Provided By (Used For)
|
Year Ended
|
|||||||
|
(Amounts in thousands)
|
4/30/2011
|
4/24/2010
|
||||||
|
Operating activities
|
||||||||
|
Net income
|
$ | 17,373 | $ | 31,359 | ||||
|
Non-cash add backs and changes in deferred taxes
|
39,771 | 33,787 | ||||||
|
Restructuring
|
487 | 3,434 | ||||||
|
Change in working capital
|
(29,785 | ) | 21,079 | |||||
|
Cash provided by operating activities
|
27,846 | 89,659 | ||||||
|
Investing activities
|
(10,260 | ) | 14,009 | |||||
|
Financing activities
|
||||||||
|
Net decrease in debt
|
(11,033 | ) | (12,890 | ) | ||||
|
Other financing activities
|
270 | 1,035 | ||||||
|
Cash used for financing activities
|
(10,763 | ) | (11,855 | ) | ||||
|
Exchange rate effects
|
12 | (756 | ) | |||||
|
Net increase in cash and equivalents
|
$ | 6,835 | $ | 91,057 | ||||
Operating Activities
During fiscal 2011, net cash provided by operating activities was $27.8 million. Our net income and depreciation and amortization were $41.7 million and our change in working capital primarily consisted of the following:
|
|
·
|
Decrease in accounts payable of $4.4 million.
|
|
|
·
|
Increase in inventory levels of $10.5 million due to our focus on being in a better service position for our customers.
|
|
|
·
|
Decrease in other liabilities of $10.8 million due to payments of accrued benefits and decreases in our estimate income tax liability.
|
|
|
·
|
$4.5 million for pension contributions.
|
During fiscal 2010, net provided by operating activities was $89.7 million. Our net income and depreciation and amortization were $56.6 million and our change in working capital primarily consisted of the following:
|
|
·
|
Increase in accounts receivable of $17.3 million due to improved sales volume at the end of fiscal 2010.
|
|
|
·
|
Increase in accounts payable of $13.1 million.
|
|
|
·
|
Increase in other liabilities of $14.9 million due to an increase in accrued benefit payments and customer deposits.
|
|
|
·
|
Decrease in inventory levels of $7.1 million due to our focus on keeping inventory levels in-line with expected near term sales levels.
|
Investing Activities
During fiscal 2011, net cash used for investing activities was $10.3 million, which consisted primarily of $10.5 million in capital expenditures. During fiscal 2010, net cash provided by investing activities was $14.0 million, which consisted primarily of the following:
32
|
|
·
|
Capital expenditures of $11.0 million.
|
|
|
·
|
Proceeds from the sale of investments and disposal of assets of $12.2 million.
|
|
|
·
|
Purchases of investments of $4.9 million.
|
Financing Activities
We used $10.8 million of cash for financing activities in fiscal 2011, compared to $11.9 million during fiscal 2010. Our financing activities in fiscal 2011 included a net repayment of debt of $11.0 million, compared to a net repayment of debt of $12.9 million in fiscal 2010.
Other
The following table summarizes our contractual obligations of the types specified:
|
Payments Due by Period
|
||||||||||||||||||||
|
(Amounts in thousands)
|
Total
|
Less than
1 Year
|
1-3 Years
|
4-5 Years
|
More than
5 Years
|
|||||||||||||||
|
Long-term debt obligations
|
$ | 34,586 | $ | 4,844 | $ | 22,334 | $ | 7,393 | $ | 15 | ||||||||||
|
Capital lease obligations
|
471 | 276 | 195 | — | — | |||||||||||||||
|
Operating lease obligations
|
323,167 | 42,873 | 75,071 | 66,270 | 138,953 | |||||||||||||||
|
Interest obligations*
|
2,068 | 1,134 | 860 | 56 | 18 | |||||||||||||||
|
Pension contribution obligations**
|
3,946 | 3,946 | — | — | — | |||||||||||||||
|
Total contractual obligations
|
$ | 364,238 | $ | 53,073 | $ | 98,460 | $ | 73,719 | $ | 138,986 | ||||||||||
|
*
|
For our variable interest rate obligations, the interest rate projected for future periods is the average rate for the current fiscal quarter projected over such future fiscal periods. For our fixed rate obligations, it is the fixed rate over the term of such obligation. We have assumed that the debt outstanding at the end of our current fiscal period will be outstanding over the entire term of the various agreements, however this amount could significantly increase or decrease based on the amount of debt we borrow or pay in future periods.
|
|
**
|
For our pension contribution obligations, we are statutorily required to make a contribution at various times during fiscal 2012. Funding projections beyond that are not practical to estimate.
|
Our balance sheet at the end of fiscal 2011 reflected a $4.5 million liability for uncertain income tax positions. We expect that a portion of this liability will be settled within the next twelve months. The amount to be resolved within the next twelve months is composed of gross unrecognized tax benefits of $0.4 million and interest of $0.1 million, net of deferred tax benefits of less than $0.1 million and penalties of less than $0.1 million. The remaining balance, to the extent it is ever paid, will be paid as tax audits are completed or settled; and as such, were not included in our obligations table above because the timing of when they will be settled is difficult to estimate.
Realization of our deferred tax assets is dependent on generating sufficient future taxable income. Valuation allowances of $54.9 million associated with certain U.S. federal, state and foreign deferred tax assets could be reduced in fiscal 2012 based on, among other factors, the level of taxable income expected to be generated in fiscal 2012 and beyond.
Our debt-to-capitalization ratio was 8.8% at April 30, 2011, and 12.3% at April 24, 2010. Capitalization is defined as total debt plus total equity.
Our board of directors has authorized the repurchase of company stock. As of April 30, 2011, 5.4 million additional shares could be purchased pursuant to this authorization. We did not purchase any shares during fiscal 2011.
33
We have guaranteed various leases of dealers with proprietary stores. The total amount of these guarantees was $1.4 million at April 30, 2011. Of this, $1.1 million will expire within one year and $0.3 million in one to two years. At the end of fiscal 2011, we had $40.9 million in open purchase orders with foreign casegoods, leather and fabric sources. Our open purchase orders that have not begun production are cancelable.
During fiscal 2011 we made $4.5 million in contributions to our defined benefit plan. We are required to make $3.9 million in contributions during fiscal 2012.
Continuing compliance with existing federal, state and local statutes dealing with protection of the environment is not expected to have a significant effect upon our capital expenditures, earnings, competitive position or liquidity.
Critical Accounting Policies
Our consolidated financial statements have been prepared in conformity with U.S. generally accepted accounting principles. In some cases, these principles require management to make difficult and subjective judgments regarding uncertainties and, as a result, such estimates and assumptions may significantly impact our financial results and disclosures. Estimates are based on currently known facts and circumstances, prior experience and other assumptions believed to be reasonable. We use our best judgment in valuing these estimates and may, as warranted, use external advice. Actual results could differ from these estimates, assumptions, and judgments and these differences could be significant. Adjustments are recorded when our actual experience differs from the assumptions underlying the estimates. These adjustments could be significant. We make frequent comparisons of actual experience to our assumptions in order to mitigate the likelihood of significant adjustments. The following critical accounting policies affect our consolidated financial statements.
Revenue Recognition and Related Allowances
Substantially all of our shipping agreements with third-party carriers transfer the risk of loss to our customers upon shipment. Accordingly, our shipments using third-party carriers are recognized as revenue upon shipment of the product. In all cases, for product shipped on our company-owned trucks, revenue is recognized upon delivery. This revenue includes amounts billed to customers for shipping. Provisions are made at the time revenue is recognized for estimated product returns and warranties, as well as other incentives that may be offered to customers. We also recognize revenue for amounts received from our customers in connection with our shared advertising cost arrangement. We import certain products from foreign ports, which are shipped directly to our domestic customers. In this case, revenue is not recognized until title is assumed by our customer, which is normally after the goods pass through U.S. Customs.
Incentives offered to customers include cash discounts, advertising agreements and other sales incentive programs. Estimated cash discounts and other sales incentives are recorded as a reduction of revenues when the revenue is recognized. Our advertising agreements give customers advertising allowances based on revenues and such allowances are recorded as a reduction to revenue when earned.
Trade accounts receivable arise from the sale of products on trade credit terms. On a quarterly basis, our management team reviews all significant accounts as to their past due balances, as well as collectability of the outstanding trade accounts receivable for possible write off. It is our policy to write off the accounts receivable against the allowance account when we deem the receivable to be uncollectible. Additionally, for those dealers that are significantly past due, we review their sales orders and ship product when collectability of the incremental sale is reasonably assured.
34
We have notes receivable balances due to us from various customers. These notes receivable generally relate to past due accounts receivable which were replaced by a note receivable in order to secure further collateral from the customer. The collateral from the customer is generally in the form of inventory or real estate. Additionally, we have personal guarantees from some of these customers on these notes receivable. In cases where we do not have sufficient collateral to support the carrying value of the note receivable, our policy is to recognize an allowance for credit losses for this difference.
The allowance for credit losses reflects our best estimate of probable losses inherent in the accounts and notes receivable balances. We determine the allowance based on known troubled accounts, historical experience and other currently available evidence.
Investments
We evaluate our available for sale investments periodically for possible other-than-temporary impairments by reviewing factors such as the length of time and extent to which fair value has been below cost basis, the financial condition of the issuer and our ability and intent to hold the investment for a period of time which may be sufficient for anticipated recovery of market value. If the impairment is determined to be other-than-temporary, the amount of the impairment is recognized as part of earnings. If the impairment is determined to be temporary, then the resulting change in market value is recorded as part of other comprehensive income/(loss) in our statement of changes in equity.
Long-lived Assets
Long-lived assets are reviewed for impairment whenever events or changes in circumstances indicate that the carrying amount of an asset or asset group may not be recoverable. Our assessment of recoverability is based on our best estimates using either quoted market prices or an analysis of the undiscounted projected future cash flows by asset groups in order to determine if the fair value of our long-lived assets exceed their carrying value. Our asset groups consist of our operating units in our Upholstery and Casegoods Group (La-Z-Boy, England, Bauhaus, American Drew and Lea, Hammary, Kincaid) and each of our retail stores (including those of our sole remaining consolidated VIE). As described elsewhere, during fiscal 2011 we recorded impairment charges at certain stores in our retail operations.
Other Loss Reserves
We have various other loss exposures arising from the ordinary course of business, including inventory obsolescence, health insurance, litigation, environmental claims, and self-insured workers’ compensation and product liabilities. Establishing loss reserves requires estimates and the judgment of management with respect to risk and ultimate liability. We use legal counsel or other experts, including actuaries as appropriate, to assist in developing estimates. Due to the uncertainties and potential changes in facts and circumstances, additional charges related to these reserves could be required in the future.
We have various excess loss coverages for auto, product liability and workers’ compensation. Our deductibles generally do not exceed $1.0 million.
Income Taxes
Income taxes are accounted for under the asset and liability method. Deferred tax assets and liabilities are recognized for the estimated future tax consequences attributable to differences between the financial statement carrying amounts of existing assets and liabilities and their respective tax bases and operating loss and tax credit carry-forwards. Deferred tax assets and liabilities are measured using enacted tax rates in effect for the year in which those temporary differences are expected to be recovered or settled. In periods when deferred tax assets are recorded, we are required to estimate whether recoverability is more likely than not, based on forecasts of taxable earnings in the related tax jurisdiction. We consider historical and projected future operating results, the eligible carry-forward period, tax law changes, tax planning opportunities and other relevant considerations when making judgments about realizing the value of our deferred tax assets.
35
Pensions
We maintain a defined benefit pension plan for eligible factory hourly employees at some operating units. The plan does not allow new participants. Active participants at some operating units continue to earn service credits. Annual net periodic expense and benefit liabilities under our defined benefit plan is determined on an actuarial basis using various assumptions and estimates including discount rates, long-term rates of return, estimated remaining years of service and estimated life expectancy. Each year, we compare the actual experience to the more significant assumptions used, and if warranted, we make adjustments to the assumptions.
Our pension plan discount rate assumption is evaluated annually. The discount rate is based upon a single rate developed after matching a pool of high quality bond payments to the plan’s expected future benefit payments. We utilized a discount rate of 5.55% at April 30, 2011, compared with a rate of 5.85% at April 24, 2010, and 7.15% at April 25, 2009. The same methodology was utilized for fiscal 2011, fiscal 2010 and fiscal 2009.
Pension benefits are funded through deposits with trustees and satisfy, at a minimum, the applicable funding regulations.
Besides evaluating the discount rate used to determine our pension obligation, we also evaluate our assumption relating to the expected return on plan assets annually. In selecting the expected long-term rate of return on assets, we considered the average rate of earnings expected on the funds invested or to be invested to provide the benefits of this plan. This included considering the trust’s asset allocation, investment strategy, and the expected returns likely to be earned over the life of the plan. The rate of return assumption as of April 30, 2011, and April 24, 2010, was 8.0%. The expected rate of return assumption as of April 30, 2011, will be used to determine pension expense for fiscal 2012.
Our long-term stated investment objective is to maximize the investment return with the least amount of risk through a combination of capital appreciation and income. The strategic asset allocation targets are 65% equities and 35% fixed income within a range of 5% of the target.
We are required to make $3.9 million in contributions to our qualified defined benefit plan in fiscal 2012. We expect that the fiscal 2012 pension expense for the defined benefit pension plan, after considering all relevant assumptions will be $1.5 million compared with $2.5 million in fiscal 2011. A 25 basis point change in our discount rate or our expected return on plan assets would not have a significant impact on our financial statements.
Financial Guarantees and Product Warranties
We have provided financial guarantees relating to leases in connection with certain La-Z-Boy Furniture Galleries® stores which are not operated by the company. The guarantees are generally for real estate leases and have remaining terms from one to two years. These guarantees enhance the credit of these dealers. We would be required to perform under these agreements only if the dealer were to default on the guaranteed lease.
We have, from time to time, entered into agreements which resulted in indemnifying third parties against certain liabilities, mainly environmental obligations. We believe that judgments, if any, against us related to such agreements would not have a significant effect on our business or financial condition.
Our accounting policy for product warranties is to accrue an estimated liability at the time the revenue is recognized. We estimate future warranty claims based on claim experience and any additional anticipated future costs on previously sold product. Our liability estimates incorporate the cost of repairs including materials consumed, labor and overhead amounts necessary to perform the repair and any costs associated with delivery of the repaired product to the customer. Considerable judgment is used in the determination of our estimate. If actual costs were to differ significantly from our estimates, we would record the impact of these unforeseen costs in subsequent periods.
36
Variable Interest Entities
Financial accounting standards require the “primary beneficiary” of a VIE to include the VIE’s assets, liabilities and operating results in its consolidated financial statements. Among other things, the
guidance requires more qualitative than quantitative analyses to determine the primary beneficiary of a VIE and requires continuous assessments of whether an enterprise is the primary beneficiary of a VIE. Under the guidance, a VIE must be consolidated if the enterprise has both (a) the power to direct the activities of the VIE that most significantly impact the entity's economic performance, and (b) the obligation to absorb losses or the right to receive benefits from the VIE that could potentially be significant to the VIE.
We consolidate entities that are VIEs when we are deemed to be the primary beneficiary of the VIE and we continuously evaluate our VIEs’ primary beneficiaries as facts and circumstances change to determine if our status as primary beneficiary has changed. As of the beginning of fiscal 2011, we deconsolidated our Toronto, Ontario VIE, and during the fourth quarter of fiscal 2011, we acquired our California VIE. As a result, we had only one remaining VIE with eight stores at April 30, 2011.
We have a special operating agreement in place with an independent dealer that is a VIE which causes us to be considered their primary beneficiary. Based on the guidance mentioned above for consolidation of VIEs, we have consolidated this dealer. Our consolidated VIEs were recorded at fair value on the date we became the primary beneficiary. All earnings and losses attributed to our VIEs are recorded as Net income (loss) attributable to noncontrolling interests. Prior to fiscal 2010, all losses of the VIEs in excess of their equity were recorded as Net income (loss) and all earnings of our VIEs to the extent of recouping the losses were recorded as Net income (loss). Earnings in excess of losses were attributed to equity owners and were recorded as minority interest.
Stock-Based Compensation
Stock-based compensation cost is measured at the grant date based on the value of the award and is recognized as expense over the vesting period. Determining the fair value of stock-based awards at the grant date requires judgment, including estimating expected dividends, future stock-price volatility, expected option lives and the amount of share-based awards that are expected to be forfeited. We do not expect that changes in these assumptions would have a significant impact on our results of operations.
The fair value of each option grant was estimated using a Black-Scholes option-pricing model. Expected volatility was estimated based on the historical volatility of our common shares. The average expected life was based on the contractual term of the stock option and expected employee exercise and post-vesting employment termination trends. The risk-free rate was based on U.S. Treasury issues with a term equal to the expected life assumed at the date of grant. Forfeitures were estimated at the date of grant based on historical experience.
Regulatory Developments
Continued Dumping and Subsidy Offset Act of 2000
The Continued Dumping and Subsidy Offset Act of 2000 (“CDSOA”) provides for distribution of monies collected by U.S. Customs and Border Protection from anti-dumping cases to domestic producers that supported the anti-dumping petition. There have been numerous cases before the U.S. Court of International Trade and the Federal Circuit that have been stayed. The resolution of these cases will have a significant impact on the amount of additional CDSOA funds we receive.
37
In view of the uncertainties associated with this program, we are unable to predict the amounts, if any, we may receive in the future under CDSOA. However, assuming CDSOA distributions continue, these distributions could be significant depending on the results of legal appeals and administrative reviews and our actual percentage allocation. We received $1.1 million during fiscal 2011, $4.4 million during fiscal 2010 and $8.1 million during fiscal 2009 in CDSOA payments and funds related to the anti-dumping order on wooden bedroom furniture from China.
Climate Change Legislation
Except for the potential effects of severe weather, which we discuss in Item 1A in regard to foreign sourcing and the availability of raw materials, we do not believe that future climate change or existing or pending laws, regulations, international accords, or business trends relating to climate change are reasonably likely to have a significant effect on our business or financial condition. We currently utilize trucking to transport goods to our distribution centers and in some instances to our customers. In most cases, our customers utilize trucking to obtain goods from us. New laws or regulations resulting in steep increases in the cost of fuel, or new technologies resulting in steep decreases in such costs, would affect our costs and the cost to our customers purchasing from us. If our costs increased, we might not always be able to pass along such increases to our customers due to competitive and marketing pressures, but we would expect our competitors to be similarly affected.
Recent Accounting Pronouncements
Refer to Note 1 of the consolidated financial statements in Item 8 for detailed information regarding accounting pronouncements.
We are exposed to market risk from changes in interest rates. Our exposure to interest rate risk results from our variable rate debt under which we had $13.0 million of borrowings at April 30, 2011. In May 2008, we entered into an interest rate swap agreement to mitigate the impact of changes in interest rates on $20.0 million of our floating rate debt. This interest rate swap agreement expired in May 2011 and was not renewed. Management estimates that a one percentage point change in interest rates would not have a significant impact on our results of operations for fiscal 2012 based upon our current levels of exposed liabilities.
We are exposed to market risk from changes in the value of foreign currencies primarily related to our plant in Mexico, as substantially all purchases of imported parts and finished goods are denominated in U.S. dollars. As a result, gains and losses resulting from market changes in the value of foreign currencies have not had and are not expected to have a significant effect on our consolidated results of operations. A decrease in the value of foreign currencies in relation to the U.S. dollar could impact the profitability of some of our vendors, but we believe any impact would be similar for our competitors.
38
Management’s Responsibility for Financial Information
Management of La-Z-Boy Incorporated is responsible for the preparation, integrity and objectivity of La-Z-Boy Incorporated’s consolidated financial statements and other financial information contained in this Annual Report on Form 10-K. Those consolidated financial statements were prepared in conformity with accounting principles generally accepted in the United States of America. In preparing those consolidated financial statements, Management was required to make certain estimates and judgments, which are based upon currently available information and Management’s view of current conditions and circumstances.
The Audit Committee of the Board of Directors, which consists solely of independent directors, oversees our process of reporting financial information and the audit of our consolidated financial statements. The Audit Committee is informed of the financial condition of La-Z-Boy Incorporated and regularly reviews Management’s critical accounting policies, the independence of our independent auditors, our internal controls and the objectivity of our financial reporting. Both the independent auditors and the internal auditors have free access to the Audit Committee and meet with the Audit Committee periodically, both with and without Management present.
On September 17, 2010, La-Z-Boy Incorporated’s Chief Executive Officer submitted his annual certification to the New York Stock Exchange stating that he was not aware of any violation by the corporation of the Exchange’s corporate governance listing standards. La-Z-Boy filed the certifications by its Chief Executive Officer and Chief Financial Officer required by Section 302 of the Sarbanes-Oxley Act of 2002 as exhibits to this Annual Report on Form 10-K for the fiscal year ended April 30, 2011.
Management’s Report on Internal Control over Financial Reporting
Our management is responsible for establishing and maintaining adequate internal control over financial reporting, as such term is defined in Rule 13a-15(f) of the Exchange Act. Under the supervision and with the participation of our management, including our Chief Executive Officer and Chief Financial Officer, we conducted an evaluation of the effectiveness of our internal controls over financial reporting based upon the framework in “Internal Control – Integrated Framework” issued by the Committee of Sponsoring Organizations of the Treadway Commission. Based on that evaluation, our management concluded that our internal control over financial reporting was effective as of April 30, 2011. The effectiveness of the Company’s internal control over financial reporting as of April 30, 2011, has been audited by PricewaterhouseCoopers, LLP, an independent registered public accounting firm, as stated in their report which appears herein.
/s/ Kurt L. Darrow
Kurt L. Darrow
President and Chief Executive Officer
/s/ Louis M. Riccio, Jr.
Louis M. Riccio, Jr.
Senior Vice President and Chief Financial Officer
39
Report of Independent Registered Public Accounting Firm
To the Board of Directors and Shareholders of La-Z-Boy Incorporated:
In our opinion, the accompanying consolidated balance sheets and the related consolidated statements of operations, of changes in equity and of cash flows present fairly, in all material respects, the financial position of La-Z-Boy Incorporated and its subsidiaries at April 30, 2011 and April 24, 2010, and the results of their operations and their cash flows for each of the three years in the period ended April 30, 2011 in conformity with accounting principles generally accepted in the United States of America. Also in our opinion, the Company maintained, in all material respects, effective internal control over financial reporting as of April 30, 2011, based on criteria established in
Internal Control - Integrated Framework
issued by the Committee of Sponsoring Organizations of the Treadway Commission (COSO). The Company's management is responsible for these financial statements, for maintaining effective internal control over financial reporting and for its assessment of the effectiveness of internal control over financial reporting, included in Management's Report on Internal Control over Financial Reporting on the preceding page. Our responsibility is to express opinions on these financial statements and on the Company's internal control over financial reporting based on our integrated audits. We conducted our audits in accordance with the standards of the Public Company Accounting Oversight Board (United States). Those standards require that we plan and perform the audits to obtain reasonable assurance about whether the financial statements are free of material misstatement and whether effective internal control over financial reporting was maintained in all material respects. Our audits of the financial statements included examining, on a test basis, evidence supporting the amounts and disclosures in the financial statements, assessing the accounting principles used and significant estimates made by management, and evaluating the overall financial statement presentation. Our audit of internal control over financial reporting included obtaining an understanding of internal control over financial reporting, assessing the risk that a material weakness exists, and testing and evaluating the design and operating effectiveness of internal control based on the assessed risk. Our audits also included performing such other procedures as we considered necessary in the circumstances. We believe that our audits provide a reasonable basis for our opinions.
A company’s internal control over financial reporting is a process designed to provide reasonable assurance regarding the reliability of financial reporting and the preparation of financial statements for external purposes in accordance with generally accepted accounting principles. A company’s internal control over financial reporting includes those policies and procedures that (i) pertain to the maintenance of records that, in reasonable detail, accurately and fairly reflect the transactions and dispositions of the assets of the company; (ii) provide reasonable assurance that transactions are recorded as necessary to permit preparation of financial statements in accordance with generally accepted accounting principles, and that receipts and expenditures of the company are being made only in accordance with authorizations of management and directors of the company; and (iii) provide reasonable assurance regarding prevention or timely detection of unauthorized acquisition, use, or disposition of the company’s assets that could have a material effect on the financial statements.
Because of its inherent limitations, internal control over financial reporting may not prevent or detect misstatements. Also, projections of any evaluation of effectiveness to future periods are subject to the risk that controls may become inadequate because of changes in conditions, or that the degree of compliance with the policies or procedures may deteriorate.
|
/s/ PricewaterhouseCoopers LLP
|
|
|
Detroit, Michigan
|
|
|
June 21, 2011
|
40
LA-Z-BOY INCORPORATED
CONSOLIDATED STATEMENT OF OPERATIONS
|
Fiscal Year Ended
|
||||||||||||
|
(Amounts in thousands, except per share data)
|
(53 weeks)
4/30/2011
|
(52 weeks)
4/24/2010
|
(52 weeks)
4/25/2009
|
|||||||||
|
Sales
|
$ | 1,187,143 | $ | 1,179,212 | $ | 1,226,674 | ||||||
|
Cost of sales
|
||||||||||||
|
Cost of goods sold
|
832,962 | 803,945 | 878,967 | |||||||||
|
Restructuring
|
(163 | ) | 2,141 | 9,818 | ||||||||
|
Total cost of sales
|
832,799 | 806,086 | 888,785 | |||||||||
|
Gross profit
|
354,344 | 373,126 | 337,889 | |||||||||
|
Selling, general and administrative
|
323,314 | 331,405 | 373,125 | |||||||||
|
Restructuring
|
650 | 1,293 | 2,642 | |||||||||
|
Write-down of long-lived assets
|
4,471 | — | 7,503 | |||||||||
|
Write-down of trade names
|
— | — | 5,541 | |||||||||
|
Write-down of goodwill
|
— | — | 42,136 | |||||||||
|
Operating income (loss)
|
25,909 | 40,428 | (93,058 | ) | ||||||||
|
Interest expense
|
2,346 | 2,972 | 5,581 | |||||||||
|
Interest income
|
944 | 724 | 2,504 | |||||||||
|
Income from Continued Dumping and Subsidy Offset Act, net
|
1,054 | 4,436 | 8,124 | |||||||||
|
Other income (expense), net
|
405 | 480 | (7,888 | ) | ||||||||
|
Income (loss) before income taxes
|
25,966 | 43,096 | (95,899 | ) | ||||||||
|
Income tax expense
|
8,593 | 11,737 | 26,514 | |||||||||
|
Net income (loss)
|
17,373 | 31,359 | (122,413 | ) | ||||||||
|
Net (income) loss attributable to noncontrolling interests
|
6,674 | 1,342 | (252 | ) | ||||||||
|
Net income (loss) attributable to La-Z-Boy Incorporated
|
$ | 24,047 | $ | 32,701 | $ | (122,665 | ) | |||||
|
Basic average shares
|
51,849 | 51,533 | 51,460 | |||||||||
|
Basic net income (loss) per share attributable to La-Z-Boy Incorporated
|
$ | 0.46 | $ | 0.63 | $ | (2.39 | ) | |||||
|
Diluted average shares
|
52,279 | 51,732 | 51,460 | |||||||||
|
Diluted net income (loss) per share attributable to La-Z-Boy Incorporated
|
$ | 0.45 | $ | 0.62 | $ | (2.39 | ) | |||||
|
Dividends declared per share
|
$ | — | $ | — | $ | 0.10 | ||||||
The accompanying Notes to Consolidated Financial Statements are an integral part of these statements.
41
LA-Z-BOY INCORPORATED
CONSOLIDATED BALANCE SHEET
|
As of
|
||||||||
|
(Amounts in thousands, except par value)
|
4/30/2011
|
4/24/2010
|
||||||
|
Current assets
|
||||||||
|
Cash and equivalents
|
$ | 115,262 | $ | 108,427 | ||||
|
Receivables, net of allowance of $23,937 in 2011 and $20,258 in 2010
|
161,299 | 165,001 | ||||||
|
Inventories, net
|
138,444 | 132,480 | ||||||
|
Deferred income taxes – current
|
— | 2,305 | ||||||
|
Other current assets
|
17,218 | 18,862 | ||||||
|
Total current assets
|
432,223 | 427,075 | ||||||
|
Property, plant and equipment, net
|
120,603 | 138,857 | ||||||
|
Trade names
|
3,100 | 3,100 | ||||||
|
Deferred income taxes – long term
|
2,883 | 458 | ||||||
|
Other long-term assets
|
34,646 | 38,293 | ||||||
|
Total assets
|
$ | 593,455 | $ | 607,783 | ||||
|
Current liabilities
|
||||||||
|
Current portion of long-term debt
|
$ | 5,120 | $ | 1,066 | ||||
|
Accounts payable
|
49,537 | 54,718 | ||||||
|
Accrued expenses and other current liabilities
|
77,447 | 91,523 | ||||||
|
Total current liabilities
|
132,104 | 147,307 | ||||||
|
Long-term debt
|
29,937 | 46,917 | ||||||
|
Other long-term liabilities
|
67,274 | 70,445 | ||||||
|
Contingencies and commitments
|
— | — | ||||||
|
Shareholders' equity
|
||||||||
|
Common shares, $1 par value – 150,000 authorized; 51,909 outstanding in 2011 and 51,770 outstanding in 2010
|
51,909 | 51,770 | ||||||
|
Capital in excess of par value
|
201,589 | 201,873 | ||||||
|
Retained earnings
|
126,622 | 106,466 | ||||||
|
Accumulated other comprehensive loss
|
(18,804 | ) | (20,284 | ) | ||||
|
Total La-Z-Boy Incorporated shareholders’ equity
|
361,316 | 339,825 | ||||||
|
Noncontrolling interests
|
2,824 | 3,289 | ||||||
|
Total equity
|
364,140 | 343,114 | ||||||
|
Total liabilities and equity
|
$ | 593,455 | $ | 607,783 | ||||
The accompanying Notes to Consolidated Financial Statements are an integral part of these statements.
42
LA-Z-BOY INCORPORATED
CONSOLIDATED STATEMENT OF CASH FLOWS
|
Fiscal Year Ended
|
||||||||||||
|
(Amounts in thousands)
|
4/30/2011
|
4/24/2010
|
4/25/2009
|
|||||||||
|
Cash flows from operating activities
|
||||||||||||
|
Net income (loss)
|
$ | 17,373 | $ | 31,359 | $ | (122,413 | ) | |||||
|
Adjustments to reconcile net income (loss) to cash provided by operating activities
|
||||||||||||
|
(Gain) loss on sale of assets
|
201 | (538 | ) | (2,813 | ) | |||||||
|
Write-down of long-lived assets
|
4,471 | — | 7,503 | |||||||||
|
Write-down of trade names
|
— | — | 5,541 | |||||||||
|
Write-down of goodwill
|
— | — | 42,136 | |||||||||
|
Write-down of investments
|
— | — | 5,140 | |||||||||
|
Deferred income tax expense/(benefit)
|
(120 | ) | (2,693 | ) | 39,233 | |||||||
|
Restructuring
|
487 | 3,434 | 12,460 | |||||||||
|
Provision for doubtful accounts
|
7,197 | 6,535 | 25,254 | |||||||||
|
Depreciation and amortization
|
24,302 | 25,246 | 24,142 | |||||||||
|
Stock-based compensation expense
|
3,720 | 5,236 | 3,819 | |||||||||
|
Pension plan contributions
|
(4,495 | ) | — | — | ||||||||
|
Change in receivables
|
1,599 | (17,250 | ) | 27,223 | ||||||||
|
Change in inventories
|
(10,531 | ) | 7,074 | 37,631 | ||||||||
|
Change in other assets
|
(1,092 | ) | 3,225 | 2,967 | ||||||||
|
Change in payables
|
(4,429 | ) | 13,147 | (14,544 | ) | |||||||
|
Change in other liabilities
|
(10,837 | ) | 14,884 | (40,571 | ) | |||||||
|
Total adjustments
|
10,473 | 58,300 | 175,121 | |||||||||
|
Net cash provided by operating activities
|
27,846 | 89,659 | 52,708 | |||||||||
|
|
||||||||||||
|
Cash flows from investing activities
|
||||||||||||
|
Proceeds from disposals of assets
|
506 | 3,338 | 9,060 | |||||||||
|
Capital expenditures
|
(10,540 | ) | (10,986 | ) | (15,625 | ) | ||||||
|
Purchases of investments
|
(10,200 | ) | (4,933 | ) | (11,330 | ) | ||||||
|
Proceeds from sales of investments
|
10,655 | 8,833 | 34,675 | |||||||||
|
Change in restricted cash
|
— | 17,507 | (18,207 | ) | ||||||||
|
Cash effects upon consolidation/(deconsolidation) of VIE
|
(632 | ) | — | 631 | ||||||||
|
Other
|
(49 | ) | 250 | (581 | ) | |||||||
|
Net cash provided by (used for) investing activities
|
(10,260 | ) | 14,009 | (1,377 | ) | |||||||
|
|
||||||||||||
|
Cash flows from financing activities
|
||||||||||||
|
Proceeds from debt
|
30,585 | 41,817 | 50,794 | |||||||||
|
Payments on debt
|
(41,618 | ) | (54,707 | ) | (92,139 | ) | ||||||
|
Stock issued for stock and employee benefit plans
|
270 | 1,035 | — | |||||||||
|
Dividends paid
|
— | — | (5,177 | ) | ||||||||
|
Net cash used for financing activities
|
(10,763 | ) | (11,855 | ) | (46,522 | ) | ||||||
43
Consolidated Statement of Cash Flows (continued)
|
Fiscal Year Ended
|
||||||||||||
|
(Amounts in thousands)
|
4/30/2011
|
4/24/2010
|
4/25/2009
|
|||||||||
|
Effect of exchange rate changes on cash and equivalents
|
12 | (756 | ) | (901 | ) | |||||||
|
Change in cash and equivalents
|
6,835 | 91,057 | 3,908 | |||||||||
|
Cash and equivalents at beginning of period
|
108,427 | 17,370 | 13,462 | |||||||||
|
Cash and equivalents at end of period
|
$ | 115,262 | $ | 108,427 | $ | 17,370 | ||||||
The accompanying Notes to Consolidated Financial Statements are an integral part of these statements.
44
LA-Z-BOY INCORPORATED
CONSOLIDATED STATEMENT OF CHANGES IN EQUITY
|
(Amounts in thousands)
|
Common
Shares
|
Capital in
Excess of Par
Value
|
Retained
Earnings
|
Accumulated
Other
Comprehensive
Income (Loss)
|
Non-
Controlling
Interests
|
Total
|
||||||||||||||||||
|
At April 26, 2008 (previously reported)
|
$ | 51,428 | $ | 209,388 | $ | 188,203 | $ | (943 | ) | $ | 3,298 | $ | 451,374 | |||||||||||
|
Cumulative effect of accounting corrections
|
(2,411 | ) | (6 | ) | (2,417 | ) | ||||||||||||||||||
|
At April 26, 2008 (as revised)
|
$ | 51,428 | $ | 209,388 | $ | 185,792 | $ | (949 | ) | $ | 3,298 | $ | 448,957 | |||||||||||
|
Comprehensive loss
|
||||||||||||||||||||||||
|
Net income (loss)
|
(122,665 | ) | 252 | |||||||||||||||||||||
|
Unrealized loss on marketable securities arising during the period (net of tax)
|
(4,332 | ) | ||||||||||||||||||||||
|
Reclassification adjustment for loss on marketable securities included in net loss
|
5,180 | |||||||||||||||||||||||
|
Translation adjustment
|
(370 | ) | (408 | ) | ||||||||||||||||||||
|
Change in fair value of cash flow hedge
|
(723 | ) | ||||||||||||||||||||||
|
Net actuarial loss
|
(21,974 | ) | ||||||||||||||||||||||
|
Total comprehensive loss
|
(145,040 | ) | ||||||||||||||||||||||
|
Stock issued for stock and employee benefit plans, net of cancellations
|
50 | (7,262 | ) | 7,077 | (135 | ) | ||||||||||||||||||
|
Stock option, restricted stock and performance based stock expense
|
3,819 | 3,819 | ||||||||||||||||||||||
|
Dividends declared
|
(5,177 | ) | (5,177 | ) | ||||||||||||||||||||
|
Change in noncontrolling interest upon consolidation of VIE and other changes in noncontrolling interests
|
995 | 995 | ||||||||||||||||||||||
|
At April 25, 2009
|
51,478 | 205,945 | 65,027 | (23,168 | ) | 4,137 | 303,419 | |||||||||||||||||
45
Consolidated Statement of Changes in Equity (continued)
|
(Amounts in thousands)
|
Common
Shares
|
Capital in
Excess of
Par Value
|
Retained
Earnings
|
Accumulated
Other
Comprehensive
Income (Loss)
|
Non-
Controlling
Interests
|
Total
|
||||||||||||||||||
|
Comprehensive income
|
||||||||||||||||||||||||
|
Net income (loss)
|
32,701 | (1,342 | ) | |||||||||||||||||||||
|
Unrealized gain on marketable securities arising during the period
|
2,685 | |||||||||||||||||||||||
|
Reclassification adjustment for gain on marketable securities included in net income
|
(97 | ) | ||||||||||||||||||||||
|
Translation adjustment
|
(190 | ) | 404 | |||||||||||||||||||||
|
Change in fair value of cash flow hedge
|
146 | |||||||||||||||||||||||
|
Net pension amortization and net actuarial loss
|
340 | |||||||||||||||||||||||
|
Total comprehensive income
|
34,647 | |||||||||||||||||||||||
|
Stock issued for stock and employee benefit plans, net of cancellations
|
292 | (9,294 | ) | 8,738 | (264 | ) | ||||||||||||||||||
|
Stock option, restricted stock and performance based stock expense
|
5,222 | 5,222 | ||||||||||||||||||||||
|
Change in noncontrolling interest
|
90 | 90 | ||||||||||||||||||||||
|
At April 24, 2010
|
51,770 | 201,873 | 106,466 | (20,284 | ) | 3,289 | 343,114 | |||||||||||||||||
|
Comprehensive income
|
||||||||||||||||||||||||
|
Net income (loss)
|
24,047 | (6,674 | ) | |||||||||||||||||||||
|
Unrealized gain on marketable securities arising during the period
|
1,085 | |||||||||||||||||||||||
|
Reclassification adjustment for gain on marketable securities included in net income
|
(495 | ) | ||||||||||||||||||||||
|
Translation adjustment
|
(298 | ) | 353 | |||||||||||||||||||||
|
Change in fair value of cash flow hedge
|
548 | |||||||||||||||||||||||
|
Net pension amortization and net actuarial loss
|
640 | |||||||||||||||||||||||
|
Total comprehensive income
|
19,206 | |||||||||||||||||||||||
|
Stock issued for stock and employee benefit plans, net of cancellations
|
139 | (4,001 | ) | 3,757 | (105 | ) | ||||||||||||||||||
|
Stock option and restricted stock expense
|
3,717 | 3,717 | ||||||||||||||||||||||
|
Acquisition of VIE and other
|
(8,573 | ) | 8,633 | 60 | ||||||||||||||||||||
|
Cumulative effect of change in accounting for noncontrolling interests
|
925 | (2,777 | ) | (1,852 | ) | |||||||||||||||||||
|
At April 30, 2011
|
$ | 51,909 | $ | 201,589 | $ | 126,622 | $ | (18,804 | ) | $ | 2,824 | $ | 364,140 | |||||||||||
The accompanying Notes to Consolidated Financial Statements are an integral part of these statements.
46
NOTES TO CONSOLIDATED FINANCIAL STATEMENTS
The following is a summary of significant accounting policies followed in the preparation of our consolidated financial statements. Our fiscal year ends on the last Saturday of April. Our 2011 fiscal year included 53 weeks, whereas fiscal years 2010 and 2009 included 52 weeks. The additional week in fiscal 2011 was included in our fourth fiscal quarter.
Principles of Consolidation
Our consolidated financial statements include the accounts of La-Z-Boy Incorporated and its majority-owned subsidiaries. All inter-company transactions have been eliminated. Additionally, our consolidated financial statements include the accounts of certain entities in which we hold a controlling interest based on exposure to economic risks and potential rewards (variable interests) for which we are the primary beneficiary.
In June 2009, the Financial Accounting Standards Board amended its guidance on accounting for VIEs. The new accounting guidance resulted in a change in our accounting policy effective April 25, 2010. Among other things, the new guidance requires more qualitative than quantitative analyses to determine the primary beneficiary of a VIE and requires continuous assessments of whether an enterprise is the primary beneficiary of a VIE. Under the new guidance, a VIE must be consolidated if the enterprise has both (a) the power to direct the activities of the VIE that most significantly impact the entity's economic performance, and (b) the obligation to absorb losses or the right to receive benefits from the VIE that could potentially be significant to the VIE. We adopted this new accounting guidance and it was effective for us on April 25, 2010, the first day of our current fiscal year. This guidance is being applied prospectively.
We consolidate entities that are VIEs when we are deemed to be the primary beneficiary of the VIE. We will continuously evaluate our VIEs’ primary beneficiaries as facts and circumstances change to determine if such changes warrant a change in our status as primary beneficiary.
On April 25, 2010, we deconsolidated our Toronto, Ontario VIE as a result of the above mentioned change in accounting policy. This entity is an independent La-Z-Boy Furniture Galleries® dealer operating eight stores and had previously been consolidated due to certain lease guarantees and other financial support we have provided. Although these financial arrangements result in our holding a majority of the variable interests in this VIE, they do not empower us to direct the activities of the VIE that most significantly impact the VIE’s economic performance. Consequently, subsequent to this change in accounting policy, we deconsolidated this VIE.
Sales and operating income, net of eliminations, for our Toronto, Ontario VIE for fiscal 2010 were $20.4 million and $3.4 million, respectively. The most significant impacts on our Consolidated Balance Sheet were a decrease to current assets of $6.9 million, a decrease to long-term assets of $5.0 million, and a decrease to noncontrolling interest of $2.8 million. We recognized a non-cash gain of $0.9 million at April 25, 2010. This gain was categorized as a cumulative effect to retained earnings during fiscal 2011. There was no impact on earnings per share as a result of the deconsolidation.
During fiscal 2011, we corrected our historical financial statements for errors primarily related to inventory, inter-company accounts payable and lease expense related to our VIEs. These corrections did not impact our net income attributable to La-Z-Boy Incorporated on a per share basis for fiscal 2011 or fiscal 2010. These corrections resulted in a $0.5 million increase to our net loss attributable to La-Z-Boy Incorporated for fiscal 2009. Certain of these corrections related to periods prior to fiscal 2009 and as such have been reflected in the accompanying financial statements as an adjustment to our opening retained earnings account.
47
Also during fiscal 2011, we corrected our historical financial statements for lease expense for stores that we are subleasing to an independent dealer which were not recorded on a straight-line basis. This revision resulted in a $0.1 million decrease in our net income attributable to La-Z-Boy Incorporated for fiscal 2010 and $0.1 million increase in our net loss attributable to La-Z-Boy Incorporated for fiscal 2009.
As a result of above mentioned corrections, during the second quarter of fiscal 2011, we also revised our historical financial statements to correct a previously disclosed out-of-period reduction to cost of goods sold, with a corresponding adjustment to accumulated other comprehensive loss. This revision resulted in a $0.6 million decrease in our net income attributable to La-Z-Boy Incorporated for fiscal 2010 and a $0.6 million decrease in our net loss attributable to La-Z-Boy Incorporated for fiscal 2009.
Additionally, during fiscal 2011 it was determined that our tax rate for fiscal 2010 did not reflect a deduction due to write-offs of certain inventory when completing our tax provision for fiscal 2010, and that our tax rate and corresponding tax expense were therefore overstated. This correction resulted in a $0.9 million increase to our net income attributable to La-Z-Boy Incorporated for fiscal 2010.
We determined that the cumulative impact of recording the corrections mentioned above in fiscal 2011 would be material to our fiscal 2011 full year results. However, we determined that the corrections were not material, either individually or in the aggregate, to any of our prior fiscal years or interim periods. Consequently, we revised our historical financial statements for the related prior periods. Because our analysis concluded that these corrections were immaterial to any prior period, we have not amended any of our previous filings with the Securities and Exchange Commission.
The following tables set forth the significant impacts of the corrections to our Consolidated Statement of Operations for fiscal 2010 and fiscal 2009, and our Consolidated Balance Sheet as of April 24, 2010:
|
Year Ended 4/24/2010
|
||||||||||||
|
(Amounts in thousands, except per share data)
|
4/24/2010
(as previously
reported)
|
Adjustments
|
4/24/2010
(as adjusted)
|
|||||||||
|
Net income attributable to La-Z-Boy Incorporated
|
$ | 32,538 | $ | 163 | $ | 32,701 | ||||||
|
Diluted net income attributable to La-Z-Boy Incorporated per share
|
$ | 0.62 | $ | — | $ | 0.62 | ||||||
|
Year Ended 4/25/2009
|
||||||||||||
|
(Amounts in thousands, except per share data)
|
4/25/2009
(as previously
reported)
|
Adjustments
|
4/25/2009
(as adjusted)
|
|||||||||
|
Net loss attributable to La-Z-Boy Incorporated
|
$ | (122,672 | ) | $ | 7 | $ | (122,665 | ) | ||||
|
Diluted net loss attributable to La-Z-Boy Incorporated per share
|
$ | (2.39 | ) | $ | — | $ | (2.39 | ) | ||||
48
|
As of 04/24/10
|
||||||||||||
|
(Amounts in thousands)
|
04/24/10
(as previously
reported)
|
Adjustments
|
04/24/10
(as adjusted)
|
|||||||||
|
Inventories, net
|
$ | 134,187 | $ | (1,707 | ) | $ | 132,480 | |||||
|
Other current assets
|
$ | 18,159 | $ | 703 | $ | 18,862 | ||||||
|
Other long-term liabilities
|
$ | 68,381 | $ | 2,064 | $ | 70,445 | ||||||
|
Retained earnings
|
$ | 108,707 | $ | (2,241 | ) | $ | 106,466 | |||||
|
Accumulated other comprehensive loss
|
$ | (20,251 | ) | $ | (33 | ) | $ | (20,284 | ) | |||
|
Noncontrolling interests
|
$ | 4,141 | $ | (852 | ) | $ | 3,289 | |||||
Use of Estimates
The consolidated financial statements are prepared in conformity with accounting principles generally accepted in the United States of America. These principles require management to make estimates and assumptions that affect the reported amounts or disclosures of assets, liabilities (including contingent assets and liabilities) sales and expenses at the date of the financial statements. Some of the more significant estimates include depreciation, valuation of inventories, valuation of trade names, valuation of deferred taxes, allowances for doubtful accounts, sales returns, legal, environmental, restructuring, product liability, insurance reserves and warranty accruals. Actual results could differ from those estimates.
New Pronouncements
In December 2010, the FASB issued an amendment to the disclosure requirements for business combinations. This amendment requires disclosures to include pro forma information for business combinations that occurred in the current reporting period. The disclosures include pro forma revenue and earnings of the combined entity for the current reporting period, and comparable prior periods if presented, as though the acquisition date for all business combinations that occurred during the year had been as of the beginning of the annual reporting period. This amendment will be effective for our fiscal 2012 year end. We will include the required disclosures relating to any future business combinations.
Cash and Equivalents
For purposes of the consolidated balance sheet and statement of cash flows, we consider all highly liquid debt instruments purchased with initial maturities of three months or less to be cash equivalents.
Inventories
Inventories are stated at the lower of cost or market. Cost is determined using the last-in, first-out (“LIFO”) basis for approximately 71% and 65% of our inventories at April 30, 2011, and April 24, 2010, respectively. Cost is determined for all other inventories on a first-in, first-out (“FIFO”) basis. The FIFO method of accounting is mainly used for our Retail Group’s inventory and the smaller operating companies within our Upholstery Group. We record a profit elimination entry against our Retail Group’s inventory that reduces the inventory to net realizable value in consolidation.
Items capitalized, including significant betterments to existing facilities, are recorded at cost. Capitalized computer software costs include internal and external costs incurred during the software's development stage. Internal costs relate primarily to employee activities related to coding and testing the software under development. Computer software costs are depreciated over three to ten years. All maintenance and repair costs are expensed when incurred. Depreciation is computed using principally straight-line methods over the estimated useful lives of the assets.
Disposal and Impairment of Long-Lived Assets
Retirement or dispositions of long-lived assets are recorded based on carrying value and proceeds received. Any resulting gains or losses are recorded as an operating line item in selling, general and administrative expenses. We review the carrying value of our long-lived assets for impairment annually or whenever events or changes in circumstances indicate that their carrying amounts may not be recoverable.
49
Trade Names and Goodwill
We test indefinite lived intangibles for impairment on an annual basis as of the end of our fiscal year, or more frequently if events or changes in circumstances indicate that the asset might be impaired. In the fourth quarter of fiscal 2011, we performed our annual testing on our trade names and found no impairments. As of April 25, 2009, we had no goodwill remaining.
Investments
Available-for-sale securities are recorded at fair value with the net unrealized gains and losses (that are deemed to be temporary) reported as a component of other comprehensive income/(loss). Realized gains and losses and charges for other-than-temporary impairments are included in determining net income, with related purchase costs based on the first-in, first-out method. For impairments that are other-than-temporary, an impairment loss is recognized in earnings equal to the entire difference between the investment’s cost and its fair value at the balance sheet date of the reporting period for which the assessment is made. The fair value of the investment then becomes the new amortized cost basis of the investment and is not adjusted for subsequent recoveries in fair value.
Life Insurance
Life insurance policies are recorded at the amount that could be realized under the insurance contract as of the date of our consolidated balance sheet. These assets are classified as other long-term assets on our balance sheet. The change in cash surrender or contract value is recorded as income or expense during each period.
Revenue Recognition and Related Allowances for Credit Losses
Substantially all of our shipping agreements with third-party carriers transfer the risk of loss to our customers upon shipment. Accordingly, our shipments using third-party carriers are recognized as revenue upon shipment of the product. In all cases, for product shipped on our company-owned trucks, revenue is recognized upon delivery. This revenue includes amounts billed to customers for shipping. Provisions are made at the time revenue is recognized for estimated product returns and warranties, as well as other incentives that may be offered to customers. We also recognize revenue for amounts received from our customers in connection with our shared advertising cost arrangement. We import certain products from foreign ports, which are shipped directly to our domestic customers. In this case, revenue is not recognized until title is assumed by our customer, which is normally after the goods pass through U.S. Customs.
Incentives offered to customers include cash discounts, advertising agreements and other sales incentive programs. Estimated cash discounts and other sales incentives are recorded as a reduction of revenues when the revenue is recognized. Our advertising agreements give customers advertising allowances based on revenues and such allowances are recorded as a reduction to revenue when earned.
Trade accounts receivable arise from the sale of products on trade credit terms. On a quarterly basis, our management team reviews all significant accounts as to their past due balances, as well as collectability of the outstanding trade accounts receivable for possible write off. It is our policy to write off the accounts receivable against the allowance account when we deem the receivable to be uncollectible. Additionally, for those dealers that are significantly past due, we review their sales orders and ship product when collectability of the incremental sale is reasonably assured.
We have notes receivable balances due to us from various customers. These notes receivable generally relate to past due accounts receivable which were transferred to a note receivable in order to secure further collateral from the customer. The collateral from the customer is generally in the form of inventory or real estate. Additionally, we have personal guarantees from some of these customers on these notes receivable. In cases where we do not have sufficient collateral to support the carrying value of the note receivable, our policy is to recognize an allowance for credit losses for this difference.
50
These allowances for credit losses reflect our best estimate of probable losses inherent in the trade accounts and notes receivable balances. We determine the allowance based on known troubled accounts, historical experience and other currently available evidence.
Cost of Sales
Our cost of sales consists primarily of the cost to manufacture or purchase our merchandise, inspection costs, internal transfer costs, in-bound freight costs, outbound shipping costs, as well as warehousing costs, occupancy costs and depreciation expense related to our manufacturing facilities and equipment.
Selling, General and Administrative Expenses
SG&A expenses include the costs of selling our products and other general and administrative costs. Selling expenses are primarily comprised of commissions, advertising, warranty, bad debt expense and compensation and benefits of employees performing various sales functions. Additionally, the occupancy costs of our retail facilities and the warehousing costs of our regional distribution centers are included as a component of SG&A. Other general and administrative expenses included in SG&A are comprised primarily of compensation and benefit costs for administration employees and other administrative costs.
Research and Development Costs
Research and development costs are charged to expense in the periods incurred. Expenditures for research and development costs were $8.2 million, $7.9 million and $9.5 million for the fiscal years ended April 30, 2011, April 24, 2010, and April 25, 2009, respectively and are included as a component of SG&A.
Advertising Expenses
Production costs of commercials, programming and costs of other advertising, promotion and marketing programs are charged to expense in the period incurred. A portion of our advertising program is a national advertising campaign. This campaign is a shared advertising program with our La-Z-Boy Furniture Galleries® stores, which are reimbursing us for about 34% of the cost of the program. Because of this shared cost arrangement, the advertising expense is reported as a component of SG&A and is partially offset by the reimbursement of the dealers’ portion of the cost which is reported as a component of sales. Advertising expenses were $46.3 million, $44.9 million and $53.9 million for the fiscal years ended April 30, 2011, April 24, 2010, and April 25, 2009, respectively.
Operating Leases
We record rent expense related to operating leases on a straight-line basis for minimum lease payments starting with the beginning of the lease term based on the date that we have the right to control the leased property. Additionally, any lease payments that depend on an existing index or rate are initially included in our minimum lease payments. Our minimum lease payments incorporate step rent provisions or rent escalations.
Income Taxes
Income taxes are accounted for under the asset and liability method. Deferred tax assets and liabilities are recognized for the estimated future tax consequences attributable to differences between the financial statement carrying amounts of existing assets and liabilities and their respective tax bases and operating loss and tax credit carry-forwards. Deferred tax assets and liabilities are measured using enacted tax rates in effect for the year in which those temporary differences are expected to be recovered or settled.
In periods when deferred tax assets are recorded, we are required to estimate whether recoverability is more likely than not, based on forecasts of taxable earnings in the related tax jurisdiction. We consider historical and projected future operating results, the eligible carry-forward period, tax law changes, tax planning opportunities and other relevant considerations when making judgments about realizing the value of our deferred tax assets.
51
Foreign Currency Translation
The functional currency of our Mexico subsidiaries is the U.S. dollar. Transaction gains and losses associated with translating our Mexico subsidiary’s assets and liabilities, which are non-U.S. dollar denominated, are recorded in other income/(expense) in our Consolidated Statement of Operations. The functional currency of each of our other foreign subsidiaries is their respective local currency. Assets and liabilities of those subsidiaries whose functional currency is their local currency are translated at the year-end exchange rates, and revenues and expenses are translated at average exchange rates for the period. When the foreign subsidiary has substantially ended operations, the remaining translation adjustments are recognized in other income/(expense) in our Consolidated Statement of Operations.
Financial Instruments and Hedging
We have a derivative instrument consisting of an interest rate swap agreement that is used to fix the interest rate on a portion of the variable interest rate borrowings on our revolving credit facility. This agreement is designated and accounted for as a cash flow hedge. The effect of marking this contract to fair value is recorded as a component of shareholders’ equity in other comprehensive income. The interest rate swap agreement expired in May 2011. Refer to Note 20 of the consolidated financial statements for detailed information regarding our interest rate swap agreement.
Accounting for Stock-Based Compensation
We estimate the fair value of stock-based awards on the date of grant using an option-pricing model. The value of the portion of the award that is ultimately expected to vest is recognized as expense over the requisite service periods in our Consolidated Statement of Operations using a straight-line single-option method. We account for deferred stock units that will ultimately be paid out in cash, as liability-based awards. The liability is initially measured and recognized based on the market price of our common stock on the grant date. The liability is re-measured and adjusted at the end of each reporting period until paid.
Reclassifications
Certain prior year information has been reclassified to be comparable to the current year presentation. In addition, our Consolidated Statement of Cash Flows for fiscal 2009 was reclassified to present the cash impact of consolidating or deconsolidating VIEs as an investing activity.
Insurance/Self-Insurance
We use a combination of insurance and self-insurance for a number of risks, including workers’ compensation, general liability, vehicle liability and the company-funded portion of employee-related health care benefits. Liabilities associated with these risks are estimated in part by considering historical claims experience, demographic factors, severity factors and other assumptions. Our workers’ compensation is an undiscounted liability. We have various excess loss coverages for auto, product liability and workers’ compensation. Our deductibles generally do not exceed $1.0 million.
As of April 30, 2011, we had notes receivable of $9.6 million from 16 customers, with a corresponding allowance for credit losses of $2.1 million. We have collateral from the customer in the form of inventory or real estate to support the carrying value of the notes receivable. We do not accrue interest income on these notes receivable, but we record interest income when it is received. Of the $9.6 million in notes receivable as of April 30, 2011, $0.8 million is scheduled to be repaid during fiscal 2012 and therefore is included in current assets.
52
The following is an analysis of the allowance for credit losses related to our notes receivable as of April 30, 2011:
|
(Amounts in thousands)
|
4/30/2011
|
|||
|
Beginning balance
|
$ | 1,004 | ||
|
Write-offs
|
(483 | ) | ||
|
Recoveries
|
36 | |||
|
Provision for credit losses
|
1,510 | |||
|
Ending balance
|
$ | 2,067 | ||
|
(Amounts in thousands)
|
4/30/2011
|
4/24/2010
|
||||||
|
Raw materials
|
$ | 70,326 | $ | 60,913 | ||||
|
Work in process
|
11,461 | 11,018 | ||||||
|
Finished goods
|
84,367 | 85,256 | ||||||
|
FIFO inventories
|
166,154 | 157,187 | ||||||
|
Excess of FIFO over LIFO
|
(27,710 | ) | (24,707 | ) | ||||
|
Total inventories
|
$ | 138,444 | $ | 132,480 | ||||
|
(Amounts in thousands)
|
Estimated
Useful
Lives
|
4/30/2011
|
4/24/2010
|
|||||||||
|
Buildings and building fixtures
|
3-40 years
|
$ | 167,302 | $ | 169,307 | |||||||
|
Machinery and equipment
|
3-20 years
|
140,921 | 143,553 | |||||||||
|
Information systems
|
3-10 years
|
41,487 | 42,250 | |||||||||
|
Land
|
— | 15,179 | 14,270 | |||||||||
|
Land improvements
|
3-30 years
|
10,337 | 10,323 | |||||||||
|
Transportation equipment
|
3-10 years
|
16,593 | 17,695 | |||||||||
|
Other
|
3-20 years
|
24,277 | 24,002 | |||||||||
|
Construction in progress
|
5,706 | 4,726 | ||||||||||
| 421,802 | 426,126 | |||||||||||
|
Accumulated depreciation
|
(301,199 | ) | (287,269 | ) | ||||||||
|
Net property, plant and equipment
|
$ | 120,603 | $ | 138,857 | ||||||||
Depreciation expense for the fiscal years ended April 30, 2011, April 24, 2010, and April 25, 2009, was $22.0 million, $22.6 million and $23.6 million, respectively.
Long-lived assets are reviewed for impairment whenever events or changes in circumstances indicate that the carrying value of an asset or asset group may not be recoverable. While our Retail Group's operating results have improved significantly over the past several years, certain of our locations generate operating losses. As a result, the estimated undiscounted cash flows (based upon, among other things, our annual forecasting process) related to certain locations are less than the carrying value of the underlying assets. For those locations, we have concluded that the estimated fair values approximate only the levels of working capital due primarily to the continuing levels of historic operating losses. Consequently, we concluded that the leasehold improvements at these locations were fully impaired and therefore recorded an impairment charge of $1.8 million for several locations owned by our California VIE and $1.3 million for various company owned stores. In addition, during fiscal 2011 we decided to vacate one of our facilities and recorded an impairment charge of $1.3 million representing the full carrying value of leasehold improvements at that location. We did not have any long-lived asset impairments during fiscal 2010.
53
Included in other long-term assets were available-for-sale investments of $11.2 million and trading securities of $1.8 million at April 30, 2011 and available-for-sale investments of $11.0 million at April 24, 2010. These investments fund future obligations of our non-qualified retirement plan and our executive qualified deferred compensation plan. All unrealized gains or losses in the table below which have not been recognized as other-than-temporary losses were included in accumulated other comprehensive income/(loss) within our statement of changes in equity. We did not have any unrealized gains or losses which were considered other-than-temporary during fiscal 2011 or fiscal 2010.
The following is a summary of investments at April 30, 2011, and April 24, 2010:
|
Fiscal 2011
|
||||||||||||
|
(Amounts in thousands)
|
Gross
Unrealized Gains
|
Gross
Unrealized Losses
|
Fair Value
|
|||||||||
|
Equity securities
|
$ | 3,286 | $ | (10 | ) | $ | 8,010 | |||||
|
Fixed income
|
81 | (9 | ) | 3,009 | ||||||||
|
Mutual funds
|
— | — | 1,837 | |||||||||
|
Other
|
— | — | 155 | |||||||||
|
Total securities
|
$ | 3,367 | $ | (19 | ) | $ | 13,011 | |||||
|
Fiscal 2010
|
||||||||||||
|
(Amounts in thousands)
|
Gross
Unrealized Gains
|
Gross
Unrealized Losses
|
Fair Value
|
|||||||||
|
Equity securities
|
$ | 2,681 | $ | (8 | ) | $ | 7,960 | |||||
|
Fixed income
|
92 | (7 | ) | 2,877 | ||||||||
|
Other
|
— | — | 142 | |||||||||
|
Total securities
|
$ | 2,773 | $ | (15 | ) | $ | 10,979 | |||||
The following table summarizes sales of available-for-sale securities (for the fiscal years ended):
|
(Amounts in thousands)
|
4/30/2011
|
4/24/2010
|
4/25/2009
|
|||||||||
|
Proceeds from sales
|
$ | 7,448 | $ | 6,811 | $ | 29,986 | ||||||
|
Gross realized gains
|
592 | 285 | 1,468 | |||||||||
|
Gross realized losses
|
(63 | ) | (184 | ) | (1,540 | ) | ||||||
The fair value of fixed income available-for-sale securities by contractual maturity was $0.3 million within one year, $0.9 million within two to five years, $1.1 million within six to ten years and $0.7 million thereafter.
54
|
(Amounts in thousands)
|
4/30/2011
|
4/24/2010
|
||||||
|
Payroll and other compensation
|
$ | 29,447 | $ | 43,175 | ||||
|
Accrued product warranty, current portion
|
7,977 | 8,564 | ||||||
|
Customer deposits
|
11,203 | 11,912 | ||||||
|
Other current liabilities
|
28,820 | 27,872 | ||||||
|
Accrued expenses and other current liabilities
|
$ | 77,447 | $ | 91,523 | ||||
|
(Amounts in thousands)
|
4/30/2011
|
4/24/2010
|
||||||
|
Revolving credit facility
|
$ | 20,000 | $ | 30,000 | ||||
|
Industrial revenue bonds
|
11,482 | 11,486 | ||||||
|
Other debt
|
3,104 | 5,761 | ||||||
|
Capital leases
|
471 | 736 | ||||||
|
Total debt
|
35,057 | 47,983 | ||||||
|
Less: current portion
|
(5,120 | ) | (1,066 | ) | ||||
|
Long-term debt
|
$ | 29,937 | $ | 46,917 | ||||
Our revolving credit agreement is backed primarily by all of our accounts receivable, inventory, cash deposit and securities accounts, and substantially all patents and trademarks, including the La-Z-Boy brand name. Availability under our revolving credit agreement fluctuates based on a borrowing base calculation consisting of eligible accounts receivable and inventory. This revolving credit agreement includes affirmative and negative covenants, and certain restrictions, including a fixed charge coverage ratio that becomes effective only if our excess availability falls below $30.0 million. Excess availability is the difference between our eligible accounts receivable and inventory less the total of our outstanding letters of credit, other reserves as denoted in our credit agreement and our outstanding borrowings on our revolving credit agreement. As of April 30, 2011, our excess availability was $108.2 million, thus we were not subject to any related financial covenants. We do not expect to fall below the required excess availability threshold in the next twelve months. As of April 30, 2011, however, we would have been in compliance with our 1.05 to 1.00 fixed charge coverage ratio requirement had it been in effect.
During fiscal 2011 we reduced the total commitment under our credit facility to $175.0 million. We made this reduction because we expect our borrowing capacity to remain at or below $175.0 million, and the reduction resulted in lower commitment fees on the unused portion of the credit facility. This reduction had no impact on our overall availability to borrow on our credit facility.
For our revolving credit agreement, we are able to select interest rates based on LIBOR or the prime rate. Our LIBOR spread fluctuates between 1.75% and 2.25% based on liquidity. During fiscal 2011 this spread was 1.75%. Our prime rate spread fluctuates between 0.0% and 0.5% based on liquidity. During fiscal 2011 this spread was 0.0%. At April 30, 2011 our borrowing rates on amounts outstanding under the revolving credit facility was 3.25% based on the prime rate.
Our revolving credit agreement contains customary events of default, including nonpayment of principal when due, nonpayment of interest after a stated grace period, inaccuracy of representations and warranties, violations of covenants, certain acts of bankruptcy and liquidation, defaults of certain material contracts, certain ERISA-related events, certain material environmental claims, and a change in control (as defined in our credit agreement). In the event of a default under our credit agreement, the lenders may terminate the commitments made under our credit agreement, declare amounts outstanding, including accrued interest and fees, payable immediately, and enforce any and all rights and interests. In addition, following an event of default, the lenders could exercise remedies with respect to the collateral including foreclosure and other remedies available to secured creditors.
55
Industrial revenue bonds were used to finance the construction of some of our manufacturing facilities. The facilities constructed from the bond proceeds are mortgaged as collateral for the bonds. Interest for these bonds is at a variable rate and at April 30, 2011, was approximately 0.4%. Maturities range from June 2011 to June 2023.
Other debt includes foreign and domestic debt of $3.1 million. Maturities range from fiscal 2012 to fiscal 2016 with interest rates ranging from 4.9% to 6.0%.
Fair value of our debt approximates the carrying value.
Capital leases consist primarily of long-term commitments for the purchase of IT equipment and transportation equipment and have maturities ranging from fiscal 2012 to fiscal 2016. Interest rates range from 7.7% to 8.6%.
Maturities of long-term debt, subsequent to April 30, 2011, are $5.1 million in fiscal 2012, $22.3 million in fiscal 2013, $0.3 million in fiscal 2014, $7.4 million in fiscal 2015, less than $0.1 million in fiscal 2016 and less than $0.1 million thereafter.
Cash paid for interest during fiscal years 2011, 2010 and 2009 was $1.9 million, $2.6 million and $4.6 million, respectively.
We have operating leases for manufacturing facilities, executive and sales offices, warehouses, showrooms and retail facilities, as well as for transportation and information technology equipment. The operating leases expire at various dates through fiscal 2027. We have certain retail facilities which we sublease to outside parties.
The future minimum rentals for all non-cancelable operating leases and future rental income from subleases are as follows (for the fiscal years):
|
(Amounts in thousands)
|
Future
Minimum
Rentals
|
Future
Minimum
Income
|
||||||
|
2012
|
$ | 42,873 | $ | 3,408 | ||||
|
2013
|
39,201 | 3,768 | ||||||
|
2014
|
35,870 | 3,458 | ||||||
|
2015
|
34,506 | 3,475 | ||||||
|
2016
|
31,764 | 3,575 | ||||||
|
2017 and beyond
|
138,953 | 20,774 | ||||||
|
Total
|
$ | 323,167 | $ | 38,458 | ||||
Rental expense and rental income for operating leases were as follows (for the fiscal years ended):
|
(Amounts in thousands)
|
4/30/2011
|
4/24/2010
|
4/25/2009
|
|||||||||
|
Rental expense
|
$ | 50,318 | $ | 53,279 | $ | 52,346 | ||||||
|
Rental income
|
3,369 | 492 | 1,331 | |||||||||
56
Eligible salaried employees are covered under a trusteed profit sharing retirement plan. Discretionary cash contributions to a trust are made annually based on profits. We did not make any contributions during fiscal 2011 or fiscal 2010.
Voluntary 401(k) retirement plans are offered to eligible employees within certain U.S. operating units. For most operating units, we make matching contributions based on specific formulas. This portion of the plan was suspended during the third quarter of fiscal 2009 and re-instated during the third quarter of fiscal 2010.
We also maintain an Executive Qualified Deferred Compensation plan for eligible highly compensated employees. An element of this plan is the Supplemental Executive Retirement Plan (“SERP”), which allows contributions for eligible highly compensated employees. As of April 30, 2011, and April 24, 2010, we had $8.4 million and $7.6 million, respectively, of obligations for this plan included in other long-term liabilities. We had life insurance contracts and mutual funds at April 30, 2011, with combined cash surrender and market values of $8.4 million included in other long-term assets related to this plan. At April 24, 2010, we had life insurance contracts with cash surrender values of $7.5 million included in other long-term assets related to this plan.
We maintain a non-qualified defined benefit retirement plan for certain former salaried employees. Included in other long-term liabilities were plan obligations of $15.0 million and $14.7 million at April 30, 2011, and April 24, 2010, respectively which represented the unfunded projected benefit obligation of this plan. During fiscal 2011, the interest cost recognized for this plan was $0.8 million, the actuarial loss recognized in accumulated other comprehensive loss was $0.6 million and the benefit payments during the year were $1.1 million. Benefit payments are expected to be approximately $1.1 million annually for the next ten years. The discount rate used to determine the obligations under this plan was 5.3% for fiscal 2011. During fiscal 2010, the interest cost recognized for this plan was $0.9 million, the actuarial loss recognized in accumulated other comprehensive loss was $1.8 million and the benefit payments during the year were $1.0 million. The discount rate used to determine the obligations under this plan was 5.6% for fiscal 2010. This plan is not funded and is excluded from the obligation charts and disclosures that follow. We hold available-for-sale marketable securities to fund future obligations of this plan in a Rabbi trust (see Notes 5 and 19). We are not required to make any contributions to the non-qualified defined benefit plan in fiscal year 2012; however, we have the discretion to make contributions.
We also maintain a defined benefit pension plan for eligible factory hourly employees at some operating units. Active participants at some operating units continue to earn service cost. The measurement dates for the pension plan assets and benefit obligations were April 30, 2011, April 24, 2010, and April 25, 2009, in the years presented.
During fiscal 2011, we recognized $1.2 million principally for pension amortization decreasing net actuarial losses in accumulated other comprehensive loss to $27.1 million pre-tax ($24.1 million after tax). During fiscal 2010, we recognized $2.2 million principally for pension amortization decreasing net actuarial losses in accumulated other comprehensive loss to $28.3 million pre-tax ($25.3 million after tax). In fiscal 2012, we expect to amortize $1.6 million of unrecognized actuarial losses as a component of pension expense.
57
The combined net periodic pension cost and retirement costs for retirement plans were as follows (for the fiscal years ended):
|
(Amounts in thousands)
|
4/30/2011
|
4/24/2010
|
4/25/2009
|
|||||||||
|
Service cost
|
$ | 1,187 | $ | 1,043 | $ | 1,314 | ||||||
|
Interest cost
|
5,531 | 5,600 | 5,436 | |||||||||
|
Expected return on plan assets
|
(6,027 | ) | (4,825 | ) | (6,915 | ) | ||||||
|
Net amortization and deferral
|
1,773 | 2,109 | — | |||||||||
|
Net periodic pension cost (hourly plan)
|
2,464 | 3,927 | (165 | ) | ||||||||
|
Profit sharing/SERP*
|
282 | 276 | 765 | |||||||||
|
401(k)*
|
2,578 | 831 | 3,004 | |||||||||
|
Other*
|
60 | 64 | 82 | |||||||||
|
Total retirement costs (excluding unfunded salaried plan)
|
$ | 5,384 | $ | 5,098 | $ | 3,686 | ||||||
*Not determined by an actuary
The funded status of the defined hourly benefit pension plan was as follows:
|
(Amounts in thousands)
|
4/30/2011
|
4/24/2010
|
||||||
|
Change in benefit obligation
|
||||||||
|
Benefit obligation at beginning of year
|
$ | 95,967 | $ | 79,785 | ||||
|
Service cost
|
1,187 | 1,043 | ||||||
|
Interest cost
|
5,531 | 5,600 | ||||||
|
Actuarial loss
|
3,935 | 14,237 | ||||||
|
Benefits paid
|
(5,018 | ) | (4,698 | ) | ||||
|
Benefit obligation at end of year
|
101,602 | 95,967 | ||||||
|
Change in plan assets
|
||||||||
|
Fair value of plan assets at beginning of year
|
77,232 | 62,816 | ||||||
|
Actual return on plan assets
|
9,742 | 19,422 | ||||||
|
Employer contributions
|
4,495 | — | ||||||
|
Other expenses
|
(351 | ) | (308 | ) | ||||
|
Benefits paid
|
(5,018 | ) | (4,698 | ) | ||||
|
Fair value of plan assets at end of year
|
$ | 86,100 | $ | 77,232 | ||||
|
Funded status
|
$ | (15,502 | ) | $ | (18,735 | ) | ||
Amounts recognized in the Consolidated Balance Sheet consist of:
|
(Amounts in thousands)
|
4/30/2011
|
4/24/2010
|
||||||
|
Other long-term liabilities
|
(15,202 | ) | (18,735 | ) | ||||
The actuarial assumptions for the hourly plan were as follows (for the fiscal years ended):
|
4/30/2011
|
4/24/2010
|
4/25/2009
|
||||||||||
|
Discount rate used to determine benefit obligations
|
5.6 | % | 5.9 | % | 7.2 | % | ||||||
|
Discount rate used to determine net benefit cost
|
5.9 | % | 7.2 | % | 6.6 | % | ||||||
|
Long-term rate of return
|
8.0 | % | 8.0 | % | 8.0 | % | ||||||
58
The discount rate is calculated by matching a pool of high quality bond payments to the plan’s expected future benefit payments. The long-term rate of return was determined based on the average rate of earnings expected on the funds invested or to be invested to provide the benefits of these plans. This included considering the trust’s asset allocation, investment strategy, and the expected returns likely to be earned over the life of the plans. This is based on our goal of earning the highest rate of return while maintaining acceptable levels of risk. We strive to have assets within the plan that are diversified so that unexpected or adverse results from one asset class will not have a significant negative impact on the entire portfolio. This basis is consistent with prior years.
The strategic asset allocation targets are 65% equities and 35% fixed income within a range of 5% of the target. Subsequent to April 24, 2010, our asset allocation was rebalanced in order to be within our target ranges. The weighted average asset allocations at year end were as follows:
|
4/30/2011
|
4/24/2010
|
|||||||
|
Equity securities
|
65 | % | 70 | % | ||||
|
Fixed income
|
32 | % | 28 | % | ||||
|
Cash and equivalents
|
3 | % | 2 | % | ||||
|
Total
|
100 | % | 100 | % | ||||
The long-term stated investment objective of our defined benefit pension plan includes the following objectives:
|
|
·
|
maximize the investment return with the least amount of risk through a combination of capital appreciation and income;
|
|
|
·
|
diversify the portfolio among various asset classes with the goal of reducing volatility of return and reducing principal risk; and
|
|
|
·
|
maintain liquidity sufficient to meet our defined benefit pension plan obligations.
|
Although it is the intent to achieve a long-term above-average return, that intent does not include taking extraordinary risks or engaging in investment practices not commonly considered prudent.
Risks of investing are managed through our asset allocation and diversification. We monitor and re-assess all investments on a quarterly basis. In order to control risk through portfolio diversification, we have placed portfolio market limits, which were discussed above as being within 5% of our target allocations. Investments are reviewed at least quarterly and rebalanced as needed. The overall expected long-term rate of return is determined by using long-term historical returns for equity and debt securities in proportion to their weight in the investment portfolio.
The following table presents the fair value of the assets in our defined benefit pension plan at April 30, 2011, and April 24, 2010.
|
Fiscal 2011
|
||||||||||||
|
(Amounts in thousands)
|
Level 1
|
Level 2
|
Level 3
|
|||||||||
|
Cash and equivalents
|
$ | 392 | $ | 2,521 | $ | — | ||||||
|
Equity funds
|
42,270 | 13,409 | — | |||||||||
|
Debt funds
|
14,760 | 12,748 | — | |||||||||
|
Total
|
$ | 57,422 | $ | 28,678 | $ | — | ||||||
59
|
Fiscal 2010
|
||||||||||||
|
(Amounts in thousands)
|
Level 1
|
Level 2
|
Level 3
|
|||||||||
|
Cash and equivalents
|
$ | 380 | $ | 1,086 | $ | — | ||||||
|
Equity funds
|
41,867 | 11,942 | — | |||||||||
|
Debt funds
|
— | 21,957 | — | |||||||||
|
Total
|
$ | 42,247 | $ | 34,985 | $ | — | ||||||
Level 1 retirement plan assets include U.S. currency held by a designated trustee and equity funds of common and preferred securities issued by U.S. and non-U.S. corporations. These equity funds are traded actively on exchanges and price quotes for these shares are readily available.
Level 2 retirement plan assets include cash and equivalents of commingled funds. Such investments are generally valued using observable market data. Equity funds categorized as Level 2 include common trust funds which are composed of shares or units in open ended funds with active issuances and redemptions. The value of these funds is determined based on the net asset value of the funds, the underlying assets of which are publicly traded on exchanges. Price quotes for the assets held by these funds are readily available. Debt funds categorized as Level 2 consist of corporate fixed income securities issued by U.S. and non-U.S. corporations and fixed income securities issued directly by the U.S. Treasury or by government-sponsored enterprises which are valued using a bid evaluation process with bid data provided by independent pricing sources.
Our funding policy is to contribute to our defined benefit pension plan amounts sufficient to meet the minimum funding requirement as defined by employee benefit and tax laws, plus additional amounts which we determine to be appropriate. During fiscal 2011 we contributed $4.5 million to our defined benefit pension plan. We expect to contribute approximately $3.9 million to our defined benefit pension plan during fiscal 2012.
The expected benefit payments by our pension plan for each of the next five fiscal years and for periods thereafter are presented in the following table:
|
(Amounts in thousands)
|
Benefit
Payments
|
|||
|
2012
|
$ | 4,960 | ||
|
2013
|
5,004 | |||
|
2014
|
5,148 | |||
|
2015
|
5,289 | |||
|
2016
|
5,429 | |||
|
2017 to 2022
|
30,185 | |||
| $ | 56,015 | |||
We have provided financial guarantees relating to leases in connection with certain La-Z-Boy Furniture Galleries® stores which are not operated by the company. The guarantees are generally for real estate leases and have remaining terms of one to two years. These guarantees enhance the credit of these dealers.
We would be required to perform under these agreements only if the dealer were to default on the guaranteed lease. The maximum amount of potential future payments under these guarantees was $1.4 million as of April 30, 2011, compared to $2.1 million as of April 24, 2010.
We have, from time to time, entered into agreements which resulted in indemnifying third parties against certain liabilities, mainly environmental obligations. We believe that judgments, if any, against us related to such agreements would not have a significant effect on our business or financial condition.
60
Our accounting policy for product warranties is to accrue an estimated liability at the time the revenue is recognized. We estimate future warranty claims based on claim experience and any additional anticipated future costs on previously sold products. Our liability incorporates the cost of repairs including materials consumed, labor and overhead amounts necessary to perform the repair and any costs associated with delivery of the repaired product to the customer. Over 90% of our warranty liability relates to our Upholstery Group where we generally warrant our products against defects from one to five years for fabric and padding and up to a lifetime on certain mechanisms and frames. Considerable judgment is used in the determination of these estimates. If actual costs were to differ significantly from our estimates, we would generally record the impact of these unforeseen costs in subsequent periods.
During fiscal 2011, we reduced the levels of our estimated accruals for warranty by $1.0 million. This reduction was the result of the redesign of a mechanism that had historically experienced high claims activity.
A reconciliation of the changes in our product warranty liability is as follows:
|
(Amounts in thousands)
|
4/30/2011
|
4/24/2010
|
||||||
|
Balance as of the beginning of the year
|
$ | 14,773 | $ | 14,394 | ||||
|
Accruals during the year
|
13,971 | 14,248 | ||||||
|
Accrual adjustments
|
(1,031 | ) | — | |||||
|
Settlements during the year
|
(13,859 | ) | (13,869 | ) | ||||
|
Balance as of the end of the year
|
$ | 13,854 | $ | 14,773 | ||||
We have been named as a defendant in various lawsuits arising in the ordinary course of business and as a potentially responsible party at certain environmental clean-up sites. Based on a review of all currently known facts and our experience with previous legal and environmental matters, we have recorded expense in respect of probable and reasonably estimable losses arising from legal and environmental matters and currently do not anticipate any significant additional loss for legal or environmental matters.
In fiscal 2011, our shareholders approved the La-Z-Boy Incorporated 2010 Omnibus Incentive Plan. This plan provides for the grant of stock options, stock appreciation rights, restricted stock, stock units (including deferred stock units), unrestricted stock, dividend equivalent rights, and short-term cash incentive awards. Under this plan, the aggregate number of common shares that may be issued through awards of any form is 4.6 million shares. No grants may be done under our previous plans.
Stock Options.
The La-Z-Boy Incorporated 2010 Omnibus Incentive Plan provides grants to certain employees and directors to purchase common shares at a specified price, which may not be less than 100% of the current market price of the stock at the date of grant. Options granted to retirement eligible employees vest immediately. Granted options generally become exercisable at 25% per year, beginning one year from the date of grant for a term of four years. Granted options outstanding under the former long-term equity award plan and employee incentive stock option plan remain in effect and have a term of five or ten years.
Stock option expense recognized in selling, general and administrative expense for the years ended April 30, 2011, and April 24, 2010, was $1.7 million and $2.4 million, respectively. We received $0.3 million and $1.0 million in cash during fiscal 2011 and fiscal 2010, respectively, for exercises of stock options.
Plan activity for stock options under the above plans is as follows:
61
|
Number of
Shares
(In
Thousands)
|
Weighted
Average
Exercise
Price
|
Weighted
Average
Remaining
Contractual
Term (Years)
|
||||||||||
|
Outstanding at April 24, 2010
|
3,048 | $ | 10.41 | 2.8 | ||||||||
|
Granted
|
164 | 7.75 | ||||||||||
|
Exercised
|
(58 | ) | 4.63 | |||||||||
|
Expired
|
(522 | ) | 14.88 | |||||||||
|
Canceled
|
(56 | ) | 6.70 | |||||||||
|
Outstanding at April 30, 2011
|
2,576 | 9.54 | 2.6 | |||||||||
|
Exercisable at April 30, 2011
|
1,445 | $ | 12.85 | 1.9 | ||||||||
As of April 30, 2011, there was $1.3 million of total unrecognized compensation cost related to non-vested stock option awards, which is expected to be recognized over a weighted-average remaining vesting term of all unvested awards of 1.4 years. During the year ended April 30, 2011, 0.6 million shares vested.
The fair value of each option grant was estimated at the date of the grant using a Black-Scholes option-pricing model, which requires management to make certain assumptions. Expected volatility was estimated based on the historical volatility of our common shares. The average expected life was based on the contractual term of the stock option and expected employee exercise and post-vesting employment termination trends. The risk-free rate was based on U.S. Treasury issues with a term equal to the expected life assumed at the date of grant. The turnover rate was estimated at the date of grant based on historical experience. There were no stock options granted during fiscal 2009. The fair value of stock options granted during the fiscal 2011 and fiscal 2010 were calculated using the following assumptions:
|
4/30/2011
|
4/24/2010
|
|||||||
|
Risk-free interest rate
|
0.75 | % | 1.5 | % | ||||
|
Dividend rate
|
— | — | ||||||
|
Expected life in years
|
3.0 | 4.0 | ||||||
|
Stock price volatility
|
86.6 | % | 80.7 | % | ||||
|
Turnover rate
|
3.0 | % | 3.0 | % | ||||
|
Fair value per share
|
$ | 4.27 | $ | 2.59 | ||||
Restricted Shares.
Under the La-Z-Boy Incorporated 2010 Omnibus Incentive Plan, the Compensation Committee of the Board of Directors is authorized to award restricted common shares to certain employees. The shares are offered at no cost to the employees, and the plan requires that all shares be held in an escrow account until the vesting period ends. In the event of an employee’s termination during the escrow period, the shares are returned at no cost to the company. Compensation expense for restricted stock is equal to the market value of our common shares on the date the award is approved and is recognized over the service period. Expense relating to the restricted shares recorded in selling, general and administrative expense was $1.4 million and $1.9 million during fiscal 2011 and fiscal 2010, respectively. The unrecognized compensation cost at April 30, 2011, was $2.4 million and is expected to be recognized over a weighted-average remaining contractual term of all unvested awards of 2.5 years.
62
The following table summarizes information about non-vested share awards as of and for the year ended April 30, 2011:
|
Number of
Shares
(In Thousands)
|
Weighted
Average
Grant Date Fair
Value
|
|||||||
|
Non-vested shares at April 24, 2010
|
1,039 | $ | 6.88 | |||||
|
Granted
|
176 | 7.63 | ||||||
|
Vested
|
(126 | ) | 12.14 | |||||
|
Canceled
|
(49 | ) | 6.23 | |||||
|
Non-vested at April 30, 2011
|
1,040 | $ | 6.41 | |||||
Performance Awards.
Under the La-Z-Boy Incorporated 2010 Omnibus Incentive Plan and the previous long-term equity award plan, the Compensation Committee of the Board of Directors is authorized to award common shares to certain employees based on the attainment of certain financial goals over a given performance period. The shares are offered at no cost to the employees. In the event of an employee's termination during the vesting period, the potential right to earn shares under this program is generally forfeited. The cost of performance-based awards is expensed over the service period based on the probability that the performance goals will be obtained. Expense of $0.9 million was recognized during fiscal 2010 for service during fiscal 2010 relating to the performance period ended April 26, 2008. There was no expense recognized for performance shares during fiscal 2011. We granted 0.4 million performance awards during fiscal 2011, however no expense was recorded for this grant due to the current probability that the goal will not be obtained. There were 0.2 million shares issued for this award by the company on April 24, 2010. No additional performance shares were issued during fiscal 2011.
Restricted Stock Units.
Under the La-Z-Boy Incorporated 2010 Omnibus Incentive Plan, the Compensation Committee of the Board of Directors is authorized to award restricted stock units to our non-employee directors. These units are offered at no cost to the directors and the award vest upon the director leaving the board. These awards will be paid in shares of our common stock upon exercise and, consequently, we account for them as equity based awards. Compensation expense for these awards is measured and recognized based on the market price of our common shares at the date the grant was approved. During fiscal 2011 we granted 0.1 million restricted stock units to our non-employee directors. Expense relating to the restricted stock units recorded in selling, general and administrative expense was $0.7 million during fiscal 2011.
Previously Granted Deferred Stock Units.
Awards under our deferred stock unit plan for non-employee directors are accounted for as liability-based awards because upon exercise these awards will be paid in cash. Compensation expense is initially measured and recognized based on the market price of our common stock on the grant date. The liability is re-measured and adjusted at the end of each reporting period until paid. For purposes of dividends and for measuring the liability, each deferred stock unit is the equivalent of one common share. As of April 30, 2011, we had 0.1 million deferred stock units outstanding. Expense/(benefit) relating to the deferred stock units recorded in selling, general and administrative expense was $(0.5) million and $2.4 million during fiscal 2011 and fiscal 2010, respectively. The income during fiscal 2011 related to these awards was a result of the decrease in our common stock price during the fiscal year. The liability related to these awards was $1.6 million and $2.4 million at April 30, 2011, and April 24, 2010, respectively, and is included as a component of other long-term liabilities on the accompanying balance sheet.
63
The components of total comprehensive income/(loss) are as follows:
|
(Amounts in thousands)
|
4/30/2011
|
4/24/2010
|
4/25/2009
|
|||||||||
|
Net income (loss)
|
$ | 17,373 | $ | 31,359 | $ | (122,413 | ) | |||||
|
Other comprehensive income (loss):
|
||||||||||||
|
Currency translation adjustment
|
55 | 214 | (778 | ) | ||||||||
|
Change in fair value of cash flow hedge
|
548 | 146 | (723 | ) | ||||||||
|
Net unrealized gains on marketable securities arising during the period
|
590 | 2,588 | 848 | |||||||||
|
Net pension amortization and net actuarial gain (loss)
|
640 | 340 | (21,974 | ) | ||||||||
|
Total other comprehensive income (loss)
|
1,833 | 3,288 | (22,627 | ) | ||||||||
|
Total comprehensive income (loss) before allocation to noncontrolling interest
|
19,206 | 34,647 | (145,040 | ) | ||||||||
|
Comprehensive (income) loss attributable to noncontrolling interest
|
6,321 | 938 | 156 | |||||||||
|
Comprehensive income (loss) attributable to La-Z-Boy Incorporated
|
$ | 25,527 | $ | 35,585 | $ | (144,884 | ) | |||||
The components of accumulated other comprehensive loss are as follows:
|
(Amounts in thousands)
|
4/30/2011
|
4/24/2010
|
||||||
|
Translation adjustment
|
$ | 3,994 | $ | 4,292 | ||||
|
Cash flow hedges
|
(28 | ) | (576 | ) | ||||
|
Unrealized gains/(losses) on marketable securities arising during the period
|
3,348 | 2,758 | ||||||
|
Net actuarial loss (net of tax)
|
(26,118 | ) | (26,758 | ) | ||||
|
Total accumulated other comprehensive loss
|
$ | (18,804 | ) | $ | (20,284 | ) | ||
Our reportable operating segments are the Upholstery Group, the Casegoods Group and the Retail Group.
Upholstery Group
. The operating units in the Upholstery Group are La-Z-Boy, England and Bauhaus. This group manufactures or imports and sells upholstered furniture to furniture retailers. Upholstered furniture includes recliners and motion furniture, sofas, loveseats, chairs, ottomans and sleeper sofas. It sells directly to La-Z-Boy Furniture Galleries ® stores, operators of Comfort Studios, general dealers and department stores.
Casegoods Group
. The operating units in the Casegoods Group consist of two groups, one including American Drew, Lea, and Hammary, the second being Kincaid. This group primarily sells manufactured or imported wood furniture to furniture retailers. Casegoods product includes bedroom, dining room, entertainment centers, accent pieces and some coordinated upholstered furniture. The Casegoods Group sells to proprietary stores and general dealers.
Retail Group
. The Retail Group consists of 83 company-owned La-Z-Boy Furniture Galleries® stores in nine primary markets. The Retail Group sells upholstered furniture, as well as some casegoods and other accessories, to end consumers through the retail network.
64
We have no customer that individually represents 6% or more of the annual sales of any of our segments.
The accounting policies of the operating segments are the same as those described in Note 1. Segment operating income is based on profit or loss from operations before interest expense, other income (expense) and income taxes. Identifiable assets are cash and equivalents, notes and accounts receivable, net inventories, net property, plant and equipment, and trade names. Our unallocated assets include deferred income taxes, corporate assets (including a portion of cash and equivalents), and various other assets. Substantially all of our long-lived assets were located within the U.S. Sales are attributed to countries on the basis of the customer’s location.
|
(Amounts in thousands)
|
4/30/2011
|
4/24/2010
|
4/25/2009
|
|||||||||
|
Sales
|
||||||||||||
|
Upholstery Group
|
$ | 916,867 | $ | 904,871 | $ | 899,204 | ||||||
|
Casegoods Group
|
152,534 | 146,706 | 178,000 | |||||||||
|
Retail Group
|
176,987 | 153,620 | 160,838 | |||||||||
|
VIEs
|
29,105 | 53,173 | 50,856 | |||||||||
|
Corporate and Other
|
1,909 | 4,583 | 4,775 | |||||||||
|
Eliminations
|
(90,259 | ) | (83,741 | ) | (66,999 | ) | ||||||
|
Consolidated Sales
|
$ | 1,187,143 | $ | 1,179,212 | $ | 1,226,674 | ||||||
|
Operating Income (Loss)
|
||||||||||||
|
Upholstery Group
|
$ | 72,743 | $ | 95,732 | $ | 36,367 | ||||||
|
Casegoods Group
|
6,698 | (243 | ) | 554 | ||||||||
|
Retail Group
|
(15,078 | ) | (19,825 | ) | (34,841 | ) | ||||||
|
VIEs
|
(4,949 | ) | (751 | ) | (4,892 | ) | ||||||
|
Corporate and Other
|
(28,547 | ) | (31,051 | ) | (22,606 | ) | ||||||
|
Restructuring
|
(487 | ) | (3,434 | ) | (12,460 | ) | ||||||
|
Write-down of long-lived assets
|
(4,471 | ) | — | (7,503 | ) | |||||||
|
Write-down of trade names
|
— | — | (5,541 | ) | ||||||||
|
Write-down of goodwill
|
— | — | (42,136 | ) | ||||||||
|
Consolidated Operating Income (Loss)
|
$ | 25,909 | $ | 40,428 | $ | (93,058 | ) | |||||
|
Depreciation and Amortization
|
||||||||||||
|
Upholstery Group
|
$ | 13,260 | $ | 13,817 | $ | 12,062 | ||||||
|
Casegoods Group
|
1,655 | 1,770 | 2,042 | |||||||||
|
Retail Group
|
3,174 | 3,308 | 4,704 | |||||||||
|
VIEs
|
942 | 2,078 | 1,688 | |||||||||
|
Corporate and Other
|
5,271 | 4,273 | 3,646 | |||||||||
|
Consolidated Depreciation and Amortization
|
$ | 24,302 | $ | 25,246 | $ | 24,142 | ||||||
|
Capital Expenditures
|
||||||||||||
|
Upholstery Group
|
$ | 5,510 | $ | 7,088 | $ | 11,866 | ||||||
|
Casegoods Group
|
689 | 1,468 | 170 | |||||||||
|
Retail Group
|
141 | 106 | 1,922 | |||||||||
|
VIEs
|
395 | 692 | 200 | |||||||||
|
Corporate and Other
|
3,805 | 1,632 | 1,467 | |||||||||
|
Consolidated Capital Expenditures
|
$ | 10,540 | $ | 10,986 | $ | 15,625 | ||||||
65
|
(Amounts in thousands)
|
4/30/2011
|
4/24/2010
|
4/25/2009
|
|||||||||
|
Assets
|
||||||||||||
|
Upholstery Group
|
$ | 305,363 | $ | 344,776 | $ | 303,898 | ||||||
|
Casegoods Group
|
76,724 | 73,393 | 92,487 | |||||||||
|
Retail Group
|
46,773 | 50,984 | 54,380 | |||||||||
|
VIEs
|
5,022 | 26,961 | 26,014 | |||||||||
|
Unallocated Assets
|
159,573 | 111,669 | 71,551 | |||||||||
|
Consolidated Assets
|
$ | 593,455 | $ | 607,783 | $ | 548,330 | ||||||
|
Sales by Country
|
||||||||||||
|
United States
|
87 | % | 88 | % | 88 | % | ||||||
|
Canada
|
9 | % | 9 | % | 9 | % | ||||||
|
Other
|
4 | % | 3 | % | 3 | % | ||||||
|
Total
|
100 | % | 100 | % | 100 | % | ||||||
During the fourth quarter of fiscal 2011, our Retail Group acquired 15 stores that were previously operated by our California VIE. Additionally, the decrease in our VIEs' assets was a result of our Toronto, Ontario VIE no longer being consolidated during fiscal 2011. See also Note 17 for additional details regarding our VIEs'.
During the past several years, we have committed to various restructuring plans to rationalize our manufacturing facilities, consolidate warehouse distribution centers and close underperforming retail facilities. With these restructuring plans, we have written-down various fixed assets, as well as recorded charges for severance and benefits, contract terminations and other transition costs related to relocating and closing facilities.
During fiscal 2008, we committed to a restructuring plan to consolidate much of our North American cutting and sewing operations in Mexico. During fiscal 2011 and fiscal 2010, we had a net reduction of estimated restructuring liabilities of $0.2 million and $0.7 million, respectively, covering adjustments to benefits accrued under this plan. We expect to incur additional pre-tax restructuring charges of $0.1 million during fiscal 2012.
During fiscal 2007 and fiscal 2008, several of our warehouse distribution centers were consolidated into larger facilities and several underperforming stores were closed. In fiscal 2011 and fiscal 2010, we had restructuring charges of $0.7 million and $1.3 million, respectively, related to contract terminations under this plan. We expect to incur approximately $0.1 million of additional charges in fiscal 2012.
During fiscal 2009, we committed to a restructuring plan to consolidate our casegoods manufacturing plants and to convert another facility into a distribution center. In fiscal 2010 we recorded pre-tax restructuring charges of $2.8 million, covering severance and benefits and other restructuring costs in connection with this plan. We did not have any restructuring charges related to this plan during fiscal 2011.
66
For fiscal 2011 and fiscal 2010, restructuring liabilities along with pre-tax charges to expense and cash payments were as follows
:
|
Fiscal 2011
|
||||||||||||||||
|
(Amounts in thousands)
|
4/24/2010
Balance
|
Charges to
Expense *
|
Cash
Payments
or Asset
Write-Offs
|
4/30/2011
Balance
|
||||||||||||
|
Severance and benefit-related costs
|
$ | 492 | $ | (163 | ) | $ | (316 | ) | $ | 13 | ||||||
|
Contract termination costs
|
292 | 650 | (803 | ) | 139 | |||||||||||
|
Total restructuring
|
$ | 784 | $ | 487 | $ | (1,119 | ) | $ | 152 | |||||||
* Charges to expense include $0.4 million of non-cash charges for contract termination costs.
|
Fiscal 2010
|
||||||||||||||||
|
(Amounts in thousands)
|
4/25/2009
Balance
|
Charges to
Expense *
|
Cash
Payments
or Asset
Write-Offs
|
4/24/2010
Balance
|
||||||||||||
|
Severance and benefit-related costs
|
$ | 2,022 | $ | (189 | ) | $ | (1,341 | ) | $ | 492 | ||||||
|
Contract termination costs
|
530 | 1,293 | (1,531 | ) | 292 | |||||||||||
|
Other
|
— | 2,330 | (2,330 | ) | — | |||||||||||
|
Total restructuring
|
$ | 2,552 | $ | 3,434 | $ | (5,202 | ) | $ | 784 | |||||||
* Charges to expense include $0.2 million of non-cash charges for contract termination costs.
We evaluate our deferred taxes to determine if a valuation allowance is required. Accounting standards require that we assess whether a valuation allowance should be established based on the consideration of all available evidence using a “more likely than not” standard with significant weight being given to evidence that can be objectively verified. Our three year cumulative losses represent the most significant negative evidence as to whether we need to record a valuation allowance against our net deferred tax assets.
During fiscal 2011 we recorded a $3.0 million increase in our valuation allowance for deferred tax assets that are now considered more likely than not to be realized. A summary of the valuation allowance by jurisdiction is as follows:
|
Jurisdiction
(Amounts in thousands)
|
4/24/2010
Valuation
Allowance
|
Change
|
4/30/2011
Valuation
Allowance
|
|||||||||
|
U.S. federal
|
$ | 46,025 | $ | 4,582 | $ | 50,607 | ||||||
|
U.S. state
|
13,555 | (958 | ) | 12,597 | ||||||||
|
Foreign
|
3,140 | (596 | ) | 2,544 | ||||||||
|
Total
|
$ | 62,720 | $ | 3,028 | $ | 65,748 | ||||||
Realization of our deferred tax assets is dependent on generating sufficient future taxable income. Valuation allowances of $54.9 million associated with certain U.S. federal, state and foreign deferred tax assets could be reduced in fiscal 2012 based on, among other factors, the level of taxable income expected to be generated in fiscal 2012 and beyond.
67
The deferred tax assets associated with loss carry forwards and the related expiration dates are as follows:
|
(Amounts in thousands)
|
Amount
|
Expiration
|
|||
|
U.S. federal capital loss
|
$ | 2,164 |
Fiscal 2013
|
||
|
Various U.S. state net operating losses
|
10,297 |
Fiscal 2012 - 2031
|
|||
|
Foreign net operating losses
|
2,462 |
Fiscal 2029
|
|||
The primary components of our deferred tax assets and (liabilities) were as follows:
|
(Amounts in thousands)
|
4/24/2011
|
4/24/2010
|
||||||
|
Assets
|
||||||||
|
Deferred and other compensation
|
$ | 17,465 | $ | 15,363 | ||||
|
Allowance for doubtful accounts
|
10,486 | 8,256 | ||||||
|
Consolidation of variable interest entities
|
— | 3,232 | ||||||
|
State income tax – net operating losses, credits and other
|
10,443 | 12,863 | ||||||
|
Pension
|
5,457 | 6,302 | ||||||
|
Warranty
|
5,409 | 5,803 | ||||||
|
Rent
|
3,731 | 2,538 | ||||||
|
Workers’ compensation
|
3,421 | 3,439 | ||||||
|
Foreign net operating loss
|
2,462 | 3,140 | ||||||
|
Other
|
13,684 | 9,862 | ||||||
|
Valuation reserve
|
(65,748 | ) | (62,720 | ) | ||||
|
Total deferred tax assets
|
6,810 | 8,078 | ||||||
|
Liabilities
|
||||||||
|
Property, plant and equipment
|
(1,026 | ) | (3,086 | ) | ||||
|
Inventory
|
(2,901 | ) | (2,229 | ) | ||||
|
Total deferred tax liabilities
|
(3,927 | ) | (5,315 | ) | ||||
|
Net deferred tax assets
|
$ | 2,883 | $ | 2,763 | ||||
Our effective tax rate differs from the U.S. federal income tax rate for the following reasons:
|
(% of pre-tax income)
|
4/30/2011
|
4/24/2010
|
4/25/2009
|
|||||||||
|
Statutory tax rate
|
35.0 | % | 35.0 | % | 35.0 | % | ||||||
|
Increase (reduction) in income taxes resulting from:
|
||||||||||||
|
State income taxes, net of federal benefit
|
4.1 | 1.9 | — | |||||||||
|
Goodwill impairment
|
— | — | (10.6 | ) | ||||||||
|
U.S. manufacturing benefit
|
(1.9 | ) | (1.7 | ) | — | |||||||
|
Change in valuation allowance
|
13.5 | (5.3 | ) | (47.5 | ) | |||||||
|
Change in value of life insurance contracts
|
(0.6 | ) | (1.5 | ) | (1.7 | ) | ||||||
|
Tax benefit associated with VIE acquisition
|
(17.6 | ) | — | — | ||||||||
|
Miscellaneous items
|
0.6 | (1.2 | ) | (2.8 | ) | |||||||
|
Effective tax rate
|
33.1 | % | 27.2 | % | (27.6 | )% | ||||||
For our Asian operating units, we continue to reinvest the earnings and consequently do not record a deferred tax liability relative to the undistributed earnings. We have reinvested approximately $5.5 million of the earnings. The potential deferred tax attributable to these earnings is not currently estimable.
68
Income tax expense applicable to continuing operations consists of the following components (for the fiscal years ended):
|
(Amounts in thousands)
|
4/30/2011
|
4/24/2010
|
4/25/2009
|
|||||||||
|
Federal – current
|
$ | 5,935 | $ | 11,059 | $ | (11,586 | ) | |||||
|
- deferred
|
— | — | 33,596 | |||||||||
|
State - current
|
930 | 920 | (207 | ) | ||||||||
|
- deferred
|
700 | (2,253 | ) | 3,933 | ||||||||
|
Foreign – current
|
1,848 | 2,451 | (926 | ) | ||||||||
|
- deferred
|
(820 | ) | (440 | ) | 1,704 | |||||||
|
Total income tax expense
|
$ | 8,593 | $ | 11,737 | $ | 26,514 | ||||||
Income (loss) before income taxes consists of the following (for the fiscal years ended):
|
(Amounts in thousands)
|
4/30/2011
|
4/24/2010
|
4/25/2009
|
|||||||||
|
United States
|
$ | 21,331 | $ | 36,233 | $ | (83,789 | ) | |||||
|
Foreign
|
4,635 | 6,863 | (12,110 | ) | ||||||||
|
Total
|
$ | 25,966 | $ | 43,096 | $ | (95,899 | ) | |||||
As of April 30, 2011, we had a gross unrecognized tax benefit of $4.5 million related to uncertain tax positions in various jurisdictions. A reconciliation of the beginning and ending balance of these unrecognized tax benefits is as follows:
|
(
Amounts in thousands
)
|
4/30/2011
|
4/24/2010
|
4/25/2009
|
|||||||||
|
Balance at the beginning of the period
|
$ | 4,805 | $ | 6,019 | $ | 7,231 | ||||||
|
Additions:
|
||||||||||||
|
Positions taken during the current year
|
100 | 211 | 73 | |||||||||
|
Positions taken during the prior year
|
229 | 81 | 118 | |||||||||
|
Reductions:
|
||||||||||||
|
Positions taken during the current year
|
— | — | (38 | ) | ||||||||
|
Positions taken during the prior year
|
(359 | ) | (899 | ) | — | |||||||
|
Decreases related to settlements with taxing authorities
|
(202 | )) | (54 | ) | (908 | ) | ||||||
|
Reductions resulting from the lapse of the statute of limitations
|
(81 | ) | (553 | ) | (457 | ) | ||||||
|
Balance at the end of the period
|
$ | 4,492 | $ | 4,805 | $ | 6,019 | ||||||
We recognize interest and penalties associated with uncertain tax positions in income tax expense. Accrued interest and penalties decreased by less than $0.1 million during fiscal 2011. We had approximately $0.7 million accrued for interest and penalties as of April 30, 2011, and April 24, 2010.
If recognized, $1.5 million of the total $4.5 million of unrecognized tax benefits would decrease our effective tax rate. The majority of this accrual for uncertain income tax positions relates to issues with various state taxing authorities. The issues related to our U.S. federal return are minimal, relating primarily to when income and deductions are recognized for tax purposes. It is reasonably possible that various issues relating to the $0.4 million of the total gross unrecognized tax benefits totaling $4.5 million as of April 30, 2011, will be resolved within the next twelve months.
Our U.S. federal income tax returns for fiscal years 2006 and subsequent are still subject to audit. In addition, we conduct business in various states and their potential audit periods range from our fiscal years ended April 26, 2006 to April 30, 2011.
Cash paid for taxes (net of refunds received) during the fiscal years ended April 30, 2011, April 24, 2010, and April 25, 2009, was $9.1 million, $(0.2) million and $(2.2) million, respectively.
69
We had two consolidated VIEs for the first three quarters of fiscal 2011 representing 23 stores and one consolidated VIE representing eight stores for the entire 2011 fiscal year. During fiscal 2010, we had three consolidated VIEs representing 31 stores. As of April 25, 2010, the first day of our current fiscal year, we deconsolidated our Toronto, Ontario VIE. This resulted in a decrease of eight stores for our VIEs. We deconsolidated our Toronto, Ontario VIE based on a change to our accounting policy as discussed in Note 1.
Additionally, during the fourth quarter of fiscal 2011 we executed an agreement to acquire one of our independent dealers which was previously consolidated as a VIE. The acquisition of this VIE was accounted for as an equity transaction, therefore no gain or loss as a result of this acquisition was recognized in our Consolidated Statement of Operations. Noncontrolling interests in the accumulated deficit of this VIE, in the amount of $8.6 million was reclassified to retained earnings. The operating results of the 15 stores for this VIE were included in our Retail Group for our fourth fiscal quarter. In addition, we realized a tax benefit related to the amount of accounts receivable written off in excess of the fair value of the assets received from this VIE. This benefit reduced our annual effective tax rate and has been reflected in the tax provision computed for our fiscal 2011 year.
The table below shows the amount of assets and liabilities from VIEs included in our Consolidated Balance Sheet as of April 30, 2011, and April 24, 2010 (and also reflects the adjustments described in Note 1):
|
As of
|
||||||||
|
(Amounts in thousands)
|
4/30/2011
|
4/24/2010
|
||||||
|
Cash and equivalents
|
$ | 1,642 | $ | 2,075 | ||||
|
Receivables, net
|
20 | 114 | ||||||
|
Inventories, net
|
2,719 | 11,884 | ||||||
|
Other current assets
|
79 | 1,745 | ||||||
|
Property, plant and equipment, net
|
374 | 8,940 | ||||||
|
Other long-term assets, net
|
188 | 148 | ||||||
|
Total assets
|
$ | 5,022 | $ | 24,906 | ||||
|
Current portion of long-term debt
|
$ | — | $ | 128 | ||||
|
Accounts payable
|
278 | 1,048 | ||||||
|
Accrued expenses and other current liabilities
|
2,198 | 7,776 | ||||||
|
Long-term debt
|
— | 1,770 | ||||||
|
Other long-term liabilities
|
339 | 2,852 | ||||||
|
Total liabilities
|
$ | 2,815 | $ | 13,574 | ||||
The overall decrease in total assets and total liabilities of our VIEs shown in the table above was impacted by the deconsolidation of our Toronto, Ontario VIE, as well as the acquisition of our California VIE by our Retail Group.
In addition to our consolidated VIEs, we had significant interests in three independent La-Z-Boy Furniture Galleries® dealers for which we are not the primary beneficiary. Our total exposure to losses related to these dealers is $5.0 million, which consists primarily of past due accounts receivable as well as notes receivable, net of reserves and collateral on inventory and real estate. We have not provided additional financial or other support to these dealers during fiscal 2011 and have no obligations or commitments to provide further support.
70
A reconciliation of the numerators and denominators used in the computations of basic and diluted earnings per share were as follows:
|
Year Ended
|
||||||||||||
|
(Amounts in thousands)
|
4/30/2011
|
4/24/2010
|
4/25/2009
|
|||||||||
|
Numerator (basic and diluted):
|
||||||||||||
|
Net income (loss) attributable to La-Z-Boy Incorporated
|
$ | 24,047 | $ | 32,701 | $ | (122,665 | ) | |||||
|
Income allocated to participating securities
|
(472 | ) | (619 | ) | — | |||||||
|
Dividends on participating securities
|
— | — | (70 | ) | ||||||||
|
Net income (loss) available to La-Z-Boy Incorporated
|
$ | 23,575 | $ | 32,082 | $ | (122,735 | ) | |||||
|
Year Ended
|
||||||||||||
|
(Amounts in thousands)
|
4/30/2011
|
4/24/2010
|
4/25/2009
|
|||||||||
|
Denominator:
|
||||||||||||
|
Basic common shares (based upon weighted average)
|
51,849 | 51,533 | 51,460 | |||||||||
|
Add:
|
||||||||||||
|
Stock option dilution
|
430 | 199 | — | |||||||||
|
Diluted common shares
|
52,279 | 51,732 | 51,460 | |||||||||
Share-based payment awards that entitle their holders to receive non-forfeitable dividends prior to vesting are considered participating securities. We granted restricted stock awards that contain non-forfeitable rights to dividends on unvested shares; such stock awards are considered participating securities. As participating securities, the unvested shares are required to be included in the calculation of our basic earnings per common share, using the “two-class method.” The two-class method of computing earnings per common share is an allocation method that calculates earnings per share for each class of common stock and participating security according to dividends declared and participation rights in undistributed earnings. Due to their anti-dilutive effect, we did not allocate any loss to the unvested stock awards (participating securities) for the year ended April 25, 2009.
The effect of options to purchase 1.2 million, 1.7 million and 2.4 million shares for the years ended April 30, 2011, April 24, 2010, and April 25, 2009, respectively, with a weighted average exercise price of $15.21, $15.08 and $15.48, respectively, were excluded from the diluted share calculation because the exercise prices of these options were higher than the weighted average share price for the fiscal years and would have been anti-dilutive.
Accounting standards require the categorization of financial assets and liabilities, based on the inputs to the valuation technique, into a three-level fair value hierarchy. The various levels of the fair value hierarchy are described as follows:
|
|
·
|
Level 1 — Financial assets and liabilities whose values are based on unadjusted quoted market prices for identical assets and liabilities in an active market that we have the ability to access.
|
|
·
|
Level 2 — Financial assets and liabilities whose values are based on quoted prices in markets that are not active or model inputs that are observable for substantially the full term of the asset or liability.
|
|
|
·
|
Level 3 — Financial assets and liabilities whose values are based on prices or valuation techniques that require inputs that are both unobservable and significant to the overall fair value measurement.
|
71
Accounting standards require the use of observable market data, when available, in making fair value measurements. When inputs used to measure fair value fall within different levels of the hierarchy, the level within which the fair value measurement is categorized is based on the lowest level input that is significant to the fair value measurement.
In addition to assets and liabilities that are recorded at fair value on a recurring basis, we are required to record assets and liabilities at fair value on a non-recurring basis. Non-financial assets such as trade names and long-lived assets are measured at fair value when there is an indicator of impairment and recorded at fair value only when an impairment is recognized. We recorded various long-lived assets during fiscal 2011 at fair value, as well as one asset currently held for sale. See Note 4 for additional information regarding the impairments recorded on our long-lived assets. We did not measure any significant assets or liabilities at fair value on a non-recurring basis during fiscal 2010.
The following table presents the fair value hierarchy for those assets measured at fair value on a recurring basis as of April 30, 2011, and April 24, 2010:
|
Fiscal 2011
|
Fair Value Measurements
|
|||||||||||
|
(Amounts in thousands)
|
Level 1
|
Level 2
|
Level 3
|
|||||||||
|
Assets
|
||||||||||||
|
Available-for-sale securities
|
$ | 8,645 | $ | 4,366 | $ | — | ||||||
|
Liabilities
|
||||||||||||
|
Interest rate swap
|
— | (28 | ) | — | ||||||||
|
Total
|
$ | 8,645 | $ | 4,338 | $ | — | ||||||
|
Fiscal 2010
|
Fair Value Measurements
|
|||||||||||
|
(Amounts in thousands)
|
Level 1
|
Level 2
|
Level 3
|
|||||||||
|
Assets
|
||||||||||||
|
Available-for-sale securities
|
$ | 8,641 | $ | 2,338 | $ | — | ||||||
|
Liabilities
|
||||||||||||
|
Interest rate swap
|
— | (577 | ) | — | ||||||||
|
Total
|
$ | 8,641 | $ | 1,761 | $ | — | ||||||
We hold available-for-sale marketable securities to fund future obligations of one of our non-qualified retirement plans. The fair value measurements for our available-for-sale securities are based upon quoted prices in active markets, as well as through broker quotes and independent valuation providers, multiplied by the number of shares owned exclusive of any transaction costs and without any adjustments to reflect discounts that may be applied to selling a large block of the securities at one time.
We entered into a three year interest rate swap agreement in order to fix a portion of our floating rate debt.
The fair value of the swap agreement was measured as the present value of all expected future cash flows based on the LIBOR-based swap yield curve as of the date of the valuation and considered counterparty non-performance risk. These assumptions can be derived from observable data or are supported by observable levels at which transactions are executed in the marketplace.
During fiscal 2009, we entered into an interest rate swap agreement (which expired on May 16, 2011), which we accounted for as a cash flow hedge. This swap hedged the interest on $20.0 million of floating rate debt. Under the swap, we were required to pay 3.33% through May 16, 2011, and we received three month LIBOR from the counterparty. This offset the three month LIBOR component of interest which we are required to pay under $20.0 million of floating rate debt. Interest under this debt as of April 30, 2011, was three month LIBOR plus 1.75%.
72
We executed this interest rate cash flow hedge in order to mitigate our exposure to variability in cash flows for the future interest payments on a designated portion of borrowings. The gains and losses are reflected in accumulated other comprehensive loss (with an offset to the hedged item in other current liabilities or other long-term liabilities as appropriate) until the hedged transaction impacts our earnings. Our interest rate swap agreement was tested for ineffectiveness during the first quarter of fiscal 2009 and was determined to be effective. Our agreement also qualified for the “short cut” method of accounting.
For fiscal 2011, we deferred gains of $0.5 million into accumulated other comprehensive loss. For fiscal 2010, we deferred gains of $0.1 million into accumulated other comprehensive loss. The fair value of our interest rate swap at April 30, 2011, was less than $0.1 million, which was included in other current liabilities. The fair value of our interest rate swap at April 24, 2010, was $0.6 million, which was included in other long-term liabilities.
None.
Disclosure Controls and Procedures.
As of the end of the period covered by this report, we carried out an evaluation, under the supervision and with the participation of our management, including our Chief Executive Officer and Chief Financial Officer, of the effectiveness of the design and operation of our disclosure controls and procedures, as such term is defined in Rule 13a-15(e) of the Exchange Act. Based upon that evaluation, our Chief Executive Officer and Chief Financial Officer concluded that such disclosure controls and procedures are effective to ensure that information required to be disclosed in our periodic reports filed under the Exchange Act is recorded, processed, summarized and reported within the time periods specified by the Securities and Exchange Commission's rules and forms and is accumulated and communicated to our management, including our Chief Executive Officer and Chief Financial Officer, as appropriate to allow timely decisions regarding required disclosure.
Management’s Annual Report on Internal Control over Financial Reporting.
Our management's report on internal control over financial reporting is included in Item 8 of this report.
Attestation Report of the Registered Public Accounting Firm.
Our registered public accounting firm’s attestation report on our internal control over financial reporting is included in Item 8 of this report.
Changes in Internal Control over Financial Reporting.
During the second and third quarters of fiscal 2011, we reported a material weakness related to deficiencies in the effectiveness of our internal control over financial reporting related to our VIEs. During the third quarter of fiscal 2011, our internal controls related to VIEs were enhanced. There were no changes in our internal controls over financial reporting during our fourth quarter of fiscal 2011 that have materially affected, or are reasonably likely to materially affect, our internal control over financial reporting.
We have adopted a Code of Business Conduct, which applies to all of our officers, directors, and employees. A current copy of the code is posted at our website "
http://www.la-z-boy.com
".
73
We provide some information about our executive officers in Part I of this report, under the heading “Executive Officers of Registrant.” All other information required to be reported under this item will be included in our proxy statement for our 2011 annual meeting, and all of that information is incorporated in this item by reference.
All information required to be reported under this item will be included in our proxy statement for our 2011 annual meeting, and all of that information is incorporated in this item by reference.
The information required to be reported under Item 201(d) of Regulation S-K is contained in Item 5 of this report. All other information required to be reported under this item will be included in our proxy statement for our 2011 annual meeting, and all of that information is incorporated in this item by reference.
All information required to be reported under this item will be included in our proxy statement for our 2011 annual meeting, and all of that information is incorporated in this item by reference.
All information required to be reported under this item will be included in our proxy statement for our 2011 annual meeting, and all of that information is incorporated in this item by reference.
74
(a) The following documents are filed as part of this report:
|
(1)
|
Financial Statements:
|
|||
| Management’s Report to Our Shareholders | ||||
|
Report of Independent Registered Public Accounting Firm
|
||||
|
Consolidated Statement of Operations for each of the three fiscal years ended April 30, 2011, April 24, 2010 and April 25, 2009
|
||||
|
Consolidated Balance Sheet at April 30, 2011, and April 24, 2010
|
||||
|
Consolidated Statement of Cash Flows for the fiscal years ended April 30, 2011, April 24, 2010, and April 25, 2009
|
||||
|
Consolidated Statement of Changes in Shareholders’ Equity for the fiscal years ended April 30, 2011, April 24, 2010, and April 25, 2009
|
||||
|
Notes to Consolidated Financial Statements
|
||||
|
(2)
|
Financial Statement Schedules:
|
|||
|
Report of Independent Registered Public Accounting Firm on Financial Statement Schedule
|
||||
|
Schedule II — Valuation and Qualifying Accounts for each of the three fiscal years in the period ended April 30, 2011
|
||||
|
The Report of Independent Registered Public Accounting Firm and Schedule II immediately following this item.
|
||||
|
All other schedules are omitted because they are not applicable or not required because the required information is included in the financial statements or notes thereto.
|
||||
75
Note: For all exhibits incorporated by reference, the SEC file number is 1-9656. Exhibits not incorporated by reference are being filed or furnished with this report.
|
(3)
|
Exhibits:
|
|||
|
The following exhibits are filed or furnished as part of this report:
|
|
Exhibit
Number
|
Description
|
|
|
(2)
|
Not applicable
|
|
|
(3.1)
|
La-Z-Boy Incorporated Restated Articles of Incorporation (Incorporated by reference to an exhibit to Form 10-Q for the quarter ended October 26, 1996)
|
|
|
(3.2)
|
Amendment to Restated Articles of Incorporation (Incorporated by reference to an exhibit to Form 10-K/A filed September 27, 1999)
|
|
|
(3.3)
|
La-Z-Boy Incorporated Amendment to Restated Articles of Incorporation effective August 22, 2008 (Incorporated by reference to an exhibit to Form 10-Q for the quarter ended October 25, 2008)
|
|
|
(3.4)
|
La-Z-Boy Incorporated Amended and Restated Bylaws (as of May 3, 2011) (Incorporated by reference to an exhibit to Form 8-K filed May 6, 2011)
|
|
|
(4.1)
|
Credit Agreement dated as of February 6, 2008, among La-Z-Boy Incorporated, certain of its subsidiaries, the lenders named therein, and Wachovia Capital Finance Corporation (Central), as administrative agent for the lenders (Incorporated by reference to an exhibit to Form 8-K filed February 12, 2008)
|
|
|
(4.2)
|
First Amendment to Credit Agreement dated April 1, 2008 among La-Z-Boy Incorporated, certain of its subsidiaries, the lenders named therein, and Wachovia Capital Finance Corporation (Central), as administrative agent for the lenders (Incorporated by reference to an exhibit to Form 10-Q for the quarter ended July 25, 2009)
|
|
|
(4.3)
|
Second Amendment to Credit Agreement dated July 13, 2009 among La-Z-Boy Incorporated, certain of its subsidiaries, the lenders named therein, and Wachovia Capital Finance Corporation (Central), as administrative agent for the lenders (Incorporated by reference to an exhibit to Form 10-Q for the quarter ended July 25, 2009)
|
|
|
(9)
|
Not applicable
|
|
|
(10.1)*
|
La-Z-Boy Incorporated Restricted Stock Plan for Non-Employee Directors, amended and restated through August 12, 2003 (Incorporated by reference to an exhibit to definitive proxy statement dated July 9, 2003)
|
|
|
(10.2)*
|
La-Z-Boy Incorporated Deferred Stock Unit Plan for Non-Employee Directors (Incorporated by reference to an exhibit to Form 10-Q for the quarter ended October 25, 2008)
|
|
|
(10.3)*
|
La-Z-Boy Incorporated 1997 Incentive Stock Option Plan (Incorporated by reference to an exhibit to definitive proxy statement dated June 27, 1997)
|
|
|
(10.4)*
|
Form of Change in Control Agreement in effect for: Kurt L. Darrow. Similar agreements are in effect for Steven M. Kincaid, Louis M. Riccio, Jr., Otis Sawyer and Mark S. Bacon, Sr., except the provisions related to the periods for protection and benefits are twenty-four months (Incorporated by reference to an exhibit to Form 10-K for the fiscal year ended April 24, 2010)
|
|
|
(10.5)*
|
Form of Indemnification Agreement (covering all directors, including employee-directors) (Incorporated by reference to an exhibit to Form 8-K, filed January 22, 2009)
|
|
|
(10.6)*
|
2005 La-Z-Boy Incorporated Executive Deferred Compensation Plan, amended and restated as of November 18, 2008 (Incorporated by reference to an exhibit to Form 10-Q for the quarter ended October 24, 2009)
|
|
|
(10.7)*
|
La-Z-Boy Incorporated 2004 Long-Term Equity Award Plan as amended through June 13, 2008 (Incorporated by reference to an exhibit to Form 10-K for the fiscal year ended April 26, 2008)
|
|
|
(10.8)*
|
First 2009 Amendment to La-Z-Boy Incorporated 2004 Long-Term Equity Award Plan effective June 11, 2009 (Incorporated by reference to an exhibit to Form 10-K for the fiscal year ended April 25, 2009)
|
76
|
(10.9)*
|
Second 2009 Amendment to La-Z-Boy Incorporated 2004 Long-Term Equity Award Plan effective June 15, 2009 (Incorporated by reference to an exhibit to Form 10-K for the fiscal year ended April 25, 2009)
|
|
|
(10.10)*
|
Sample award agreement under the 2004 Long-Term Equity Award Plan (Incorporated by reference to an exhibit to Form 10-K for the fiscal year ended April 29, 2006)
|
|
|
(10.11)*
|
Executive Incentive Compensation Plan - Description as of June 16, 2006 (Incorporated by reference to an exhibit to Form 10-K for the fiscal year ended April 29, 2006)
|
|
|
(10.12)*
|
La-Z-Boy Incorporated 2010 Omnibus Incentive Plan (Incorporated by reference to Annex A to definitive proxy statement for annual meeting of shareholders held August 18, 2010)
|
|
|
(10.13)*
|
La-Z-Boy Incorporated 2010 Omnibus Incentive Plan Sample Award Agreement (Incorporated by reference to an exhibit to Form 10-Q for the quarter ended October 23, 2010)
|
|
|
(10.14)*
|
First 2010 Amendment to La-Z-Boy Incorporated 2004 Long-Term Equity Award Plan effective June 11, 2010 (Incorporated by reference to an exhibit to Form 10-K for the fiscal year ended April 24, 2010)
|
|
|
(10.15)*
|
La-Z-Boy Incorporated Severance Plan for Named Executive Officers (Incorporated by reference to an exhibit to Form 10-K for the fiscal year ended April 24, 2010)
|
|
|
(11)
|
Statement regarding computation of per share earnings (See Note 20 to the Consolidated Financial Statements included in Item 8)
|
|
|
(12)
|
Not applicable
|
|
|
(13)
|
Not applicable
|
|
|
(14)
|
Not applicable
|
|
|
(16)
|
Not applicable
|
|
|
(18)
|
Not applicable
|
|
|
(21)
|
List of subsidiaries of La-Z-Boy Incorporated
|
|
|
(22)
|
Not applicable
|
|
|
(23)
|
Consent of PricewaterhouseCoopers LLP (EDGAR filing only)
|
|
|
(24)
|
Not applicable
|
|
|
(31.1)
|
Certifications of Chief Executive Officer pursuant to Rule 13a-14(a)
|
|
|
(31.2)
|
Certifications of Chief Financial Officer pursuant to Rule 13a-14(a)
|
|
|
(32)
|
Certifications pursuant to 18 U.S.C. Section 1350
|
|
|
(33)
|
Not applicable
|
|
|
(34)
|
Not applicable
|
|
|
(35)
|
Not applicable
|
|
|
(99)
|
Not applicable
|
|
|
(100)
|
Not applicable
|
|
|
(101)
|
Not applicable
|
|
|
*
|
|
Indicates a management contract or compensatory plan or arrangement under which a director
or executive officer may receive benefits.
|
77
Report of Independent Registered Public Accounting Firm on Financial Statement Schedule
To the Board of Directors of La-Z-Boy Incorporated:
Our audits of the consolidated financial statements and of the effectiveness of internal control over financial reporting referred to in our report dated June 21, 2011 appearing in this Form 10-K also included an audit of the financial statement schedule listed in Item 15(a)(2) of this Form 10-K. In our opinion, this financial statement schedule presents fairly, in all material respects, the information set forth therein when read in conjunction with the related consolidated financial statements.
/s/ PricewaterhouseCoopers LLP
Detroit, Michigan
June 21, 2011
78
LA-Z-BOY INCORPORATED
SCHEDULE II VALUATION AND QUALIFYING ACCOUNTS
(Dollars in thousands)
|
Additions
|
||||||||||||||||||||
|
Description
|
Balance at
Beginning
of Year
|
Charged to
Costs and
Expenses
|
Charged to
Other
Accounts
|
Deductions
|
Balance at
End of
Year
|
|||||||||||||||
|
Allowance for doubtful accounts, deducted from accounts receivable:
|
||||||||||||||||||||
|
April 30, 2011
|
$ | 20,196 | $ | 5,687 | $ | — | $ | (1,946 | )(c) | $ | 23,937 | |||||||||
|
April 24, 2010
|
28,385 | 4,090 | (2,597 | )(a) | (9,682 | )(c) | 20,196 | |||||||||||||
|
April 25, 2009
|
17,459 | 21,294 | 2, 869 | (b) | (13,237 | )(c) | 28,385 | |||||||||||||
|
Allowance for doubtful accounts, deducted from notes receivable:
|
||||||||||||||||||||
|
April 30, 2011
|
$ | 1,004 | $ | 1,510 | $ | — | $ | (447 | )(c) | $ | 2,067 | |||||||||
|
April 24, 2010
|
4,309 | 2,445 | 2,597 | (a) | (8,347 | )(c) | 1,004 | |||||||||||||
|
April 25, 2009
|
3,284 | 3,960 | — | (2,935 | )(c) | 4,309 | ||||||||||||||
|
Allowance for deferred tax assets:
|
||||||||||||||||||||
|
April 30, 2011
|
$ | 62,720 | $ | 4,582 | $ | — | $ | (1,554 | )(d) | $ | 65,748 | |||||||||
|
April 24, 2010
|
64,742 | 5,830 | — | (7,852 | )(d) | 62,720 | ||||||||||||||
|
April 25, 2009
|
12,119 | 52,623 | — | — | 64,742 | |||||||||||||||
(a) Represents tranfer of reserve from accounts receivable to notes receivable.
(b) Represents accounts receivable from a VIE that was deconsolidated in fiscal 2009.
(c) Deductions represented uncollectible accounts written off less recoveries of accounts receivable written off in prior years.
(d) Represents utilization of loss carryovers.
79
SIGNATURES
Pursuant to the requirements of Section 13 or 15(d) of the Securities Exchange Act of 1934, the Registrant has duly caused this Form 10-K to be signed on its behalf by the undersigned, thereunto duly authorized.
|
DATE: June 21, 2011
|
LA-Z-BOY INCORPORATED
|
|
|
BY
|
/s/ Kurt L. Darrow
|
|
|
President and Chief Executive Officer
|
80
Pursuant to the requirements of the Securities Exchange Act of 1934, this report has been signed below, as of June 21, 2011, by the following persons on behalf of the Registrant and in the capacities indicated.
|
/s/J.W. Johnston
|
/s/J.H. Foss
|
|
|
J.W. Johnston
|
J.H. Foss
|
|
|
Chairman of the Board of Directors
|
Director
|
|
|
/s/K.L. Darrow
|
/s/D.K. Hehl
|
|
|
K.L. Darrow
|
D.K. Hehl
|
|
|
President and Chief Executive Officer, Director
|
Director
|
|
|
/s/R.M. Gabrys
|
/s/E.J. Holman
|
|
|
R.M. Gabrys
|
E.J. Holman
|
|
|
Director
|
Director
|
|
|
/s/H.G. Levy
|
/s/N.R. Qubein
|
|
|
H.G. Levy
|
N.R. Qubein
|
|
|
Director
|
Director
|
|
|
/s/W.A. McCollough
|
/s/J.L. Gurwitch
|
|
|
W.A. McCollough
|
J.L. Gurwitch
|
|
|
Director
|
Director
|
|
|
/s/J.E. Kerr
|
/s/L.M. Riccio, Jr.
|
|
|
J.E. Kerr
|
L.M. Riccio, Jr.
|
|
|
Director
|
Senior Vice President, Chief Financial Officer
|
|
|
/s/M.L. Mueller
|
||
|
M.L. Mueller
|
||
|
Vice President, Corporate Controller and Chief Accounting Officer
|
81
TABLE OF CONTENTS
Part IItem 1. BusinessItem 1A. Risk FactorsItem 1B. Unresolved Staff CommentsItem 2. PropertiesItem 3. Legal ProceedingsItem 4. [removed and Reserved.]Part IIItem 5. Market For Registrant S Common Equity, Related Stockholder Matters and Issuer Purchases Of Equity SecuritiesItem 6. Selected Financial DataItem 7. Management S Discussion and Analysis Of Financial Condition and Results Of OperationsItem 7A. Quantitative and Qualitative Disclosures About Market RiskItem 8. Financial Statements and Supplementary DataNote 1: Accounting PoliciesNote 2: Allowance For Credit LossesNote 3: InventoriesNote 4: Property, Plant and EquipmentNote 5: InvestmentsNote 6: Accrued Expenses and Other Current LiabilitiesNote 7: DebtNote 8: Operating LeasesNote 9: Retirement and WelfareNote 10: Financial Guarantees and Product WarrantiesNote 11: Contingencies and CommitmentsNote 12: Stock-based CompensationNote 13: Total Comprehensive Income/(loss)Note 14: Segment InformationNote 15: RestructuringNote 16: Income TaxesNote 17: Variable Interest EntitiesNote 18: Earnings Per ShareNote 19: Fair Value MeasurementsNote 20: Hedging ActivitiesItem 9. Changes in and Disagreements with Accountants on Accounting and Financial DisclosureItem 9A. Controls and ProceduresItem 9B. Other InformationPart IIIItem 10. Directors, Executive Officers and Corporate GovernanceItem 11. Executive CompensationItem 12. Security Ownership Of Certain Beneficial Owners and Management and Related Stockholder MattersItem 13. Certain Relationships and Related Transactions, and Director IndependenceItem 14. Principal Accountant Fees and ServicesPart IVItem 15. Exhibits and Financial Statement Schedules