MACY'S, INC.
10-Ks and 10-Qs
|
|
|
|
|
|
|
|
|
|
|
|
|
|
|
|
|
|
|
|
|
|
|
|
|
|
|
|
|
|
|
|
|
|
|
|
|
|
|
|
|
|
|
|
|
|
|
|
|
|
|
|
|
|
|
|
|
|
|
UNITED STATES
SECURITIES AND EXCHANGE COMMISSION
WASHINGTON, D.C. 20549
FORM 10-K
Annual Report Pursuant to Section 13 or 15(d)
of the Securities Exchange Act of 1934
|
For the Fiscal Year Ended
February 1, 2014
|
Commission File Number:
1-13536
|
|

7 West Seventh Street
Cincinnati, Ohio 45202
(513) 579-7000
and
151 West 34th Street
New York, New York 10001
(212) 494-1602
|
Incorporated in Delaware
|
I.R.S. No. 13-3324058
|
|
Securities Registered Pursuant to Section 12(b) of the Act:
|
Title of Each Class
|
Name of Each Exchange on Which Registered
|
|
|
Common Stock, par value $.01 per share
|
New York Stock Exchange
|
|
|
7.45% Senior Debentures due 2017
|
New York Stock Exchange
|
|
|
6.79% Senior Debentures due 2027
|
New York Stock Exchange
|
|
|
7% Senior Debentures due 2028
|
New York Stock Exchange
|
|
Securities registered pursuant to Section 12(g) of the Act:
None
Indicate by check mark if the registrant is a well-known seasoned issuer, as defined in Rule 405 of the Securities Act. Yes
ý
No
¨
Indicate by check mark if the registrant is not required to file reports pursuant to Section 13 or Section 15(d) of the Exchange Act. Yes
¨
No
ý
Indicate by check mark whether the registrant (1) has filed all reports required to be filed by Section 13 or 15(d) of the Securities Exchange Act of 1934 during the preceding 12 months (or for such shorter period that the registrant was required to file such reports), and (2) has been subject to such filing requirements for the past 90 days. Yes
ý
No
¨
Indicate by check mark whether the registrant has submitted electronically and posted on its corporate Web site, if any, every Interactive Data File required to be submitted and posted pursuant to Rule 405 of Regulation S-T during the preceding 12 months (or for such shorter period that the registrant was required to submit and post such files). Yes
ý
No
¨
Indicate by check mark if disclosure of delinquent filers pursuant to Item 405 of Regulation S-K is not contained herein, and will not be contained, to the best of registrant’s knowledge, in definitive proxy or information statements incorporated by reference in Part III of this Form 10-K or any amendment to this Form 10-K.
ý
Indicate by check mark whether the registrant is a large accelerated filer, an accelerated filer, a non-accelerated filer, or a smaller reporting company. See the definitions of “large accelerated filer,” “accelerated filer” and “smaller reporting company” in Rule 12b-2 of the Exchange Act.
|
Large accelerated filer
ý
|
Accelerated filer
o
|
Non-accelerated filer
o
|
Smaller reporting company
o
|
|||
|
(Do not check if a smaller reporting company)
|
||||||
Indicate by check mark whether the registrant is a shell company (as defined in Rule 12b-2 of the Exchange Act). Yes
¨
No
ý
The aggregate market value of the registrant’s common stock held by non-affiliates of the registrant as of the last business day of the registrant’s most recently completed second fiscal quarter (August 3, 2013) was approximately
$18,692,500,000
.
Indicate the number of shares outstanding of each of the issuer’s classes of common stock, as of the latest practicable date.
|
Class
|
Outstanding at February 28, 2014
|
|
|
Common Stock, $0.01 par value per share
|
367,048,648 shares
|
|
DOCUMENTS INCORPORATED BY REFERENCE
|
Document
|
Parts Into
Which Incorporated
|
|
Proxy Statement for the Annual Meeting of Stockholders to be held May 16, 2014 (Proxy Statement)
|
|
Unless the context requires otherwise, references to “Macy’s” or the “Company” are references to Macy’s and its subsidiaries and references to “
2013
,” “
2012
,” “
2011
,” “
2010
” and “
2009
” are references to the Company’s fiscal years ended
February 1, 2014
,
February 2, 2013
,
January 28, 2012
,
January 29, 2011
and
January 30, 2010
, respectively. Fiscal years 2013, 2011, 2010 and 2009 included 52 weeks; fiscal year 2012 included 53 weeks.
Forward-Looking Statements
This report and other reports, statements and information previously or subsequently filed by the Company with the Securities and Exchange Commission (the “SEC”) contain or may contain forward-looking statements. Such statements are based upon the beliefs and assumptions of, and on information available to, the management of the Company at the time such statements are made. The following are or may constitute forward-looking statements within the meaning of the Private Securities Litigation Reform Act of 1995: (i) statements preceded by, followed by or that include the words “may,” “will,” “could,” “should,” “believe,” “expect,” “future,” “potential,” “anticipate,” “intend,” “plan,” “think,” “estimate” or “continue” or the negative or other variations thereof, and (ii) statements regarding matters that are not historical facts. Such forward-looking statements are subject to various risks and uncertainties, including risks and uncertainties relating to:
|
•
|
the possible invalidity of the underlying beliefs and assumptions;
|
|
•
|
competitive pressures from department and specialty stores, general merchandise stores, manufacturers’ outlets, off-price and discount stores, and all other retail channels, including the Internet, mail-order catalogs and television;
|
|
•
|
general consumer-spending levels, including the impact of general economic conditions, consumer disposable income levels, consumer confidence levels, the availability, cost and level of consumer debt, the costs of basic necessities and other goods and the effects of the weather or natural disasters;
|
|
•
|
conditions to, or changes in the timing of, proposed transactions and changes in expected synergies, cost savings and non-recurring charges;
|
|
•
|
possible changes or developments in social, economic, business, industry, market, legal and regulatory circumstances and conditions;
|
|
•
|
possible actions taken or omitted to be taken by third parties, including customers, suppliers, business partners, competitors and legislative, regulatory, judicial and other governmental authorities and officials;
|
|
•
|
changes in relationships with vendors and other product and service providers;
|
|
•
|
currency, interest and exchange rates and other capital market, economic and geo-political conditions;
|
|
•
|
severe or unseasonable weather, possible outbreaks of epidemic or pandemic diseases and natural disasters;
|
|
•
|
unstable political conditions, civil unrest, terrorist activities and armed conflicts;
|
|
•
|
the possible inability of the Company’s manufacturers or transporters to deliver products in a timely manner or meet the Company’s quality standards;
|
|
•
|
the Company’s reliance on foreign sources of production, including risks related to the disruption of imports by labor disputes, regional health pandemics, and regional political and economic conditions;
|
|
•
|
duties, taxes, other charges and quotas on imports; and
|
|
•
|
possible systems failures and/or security breaches, including, any security breach that results in the theft, transfer or unauthorized disclosure of customer, employee or company information, or the failure to comply with various laws applicable to the Company in the event of such a breach.
|
In addition to any risks and uncertainties specifically identified in the text surrounding such forward-looking statements, the statements in the immediately preceding sentence and the statements under captions such as “Risk Factors” and “Special Considerations” in reports, statements and information filed by the Company with the SEC from time to time constitute cautionary statements identifying important factors that could cause actual amounts, results, events and circumstances to differ materially from those expressed in or implied by such forward-looking statements.
|
Item 1.
|
Business.
|
General
The Company is a corporation organized under the laws of the State of Delaware in 1985. The Company and its predecessors have been operating department stores since 1830. As of
February 1, 2014
, the operations of the Company included approximately 840 stores in 45 states, the District of Columbia, Guam and Puerto Rico under the names “Macy’s” and “Bloomingdale’s” as well as macys.com and bloomingdales.com. The Company operates thirteen Bloomingdale’s Outlet stores. Bloomingdale's in Dubai, United Arab Emirates is operated under a license agreement with Al Tayer Insignia, a company of Al Tayer Group, LLC.
The Company’s sells a wide range of merchandise, including apparel and accessories (men’s, women’s and children’s), cosmetics, home furnishings and other consumer goods. The specific assortments vary by size of store, merchandising character and character of customers in the trade areas. Most stores are located at urban or suburban sites, principally in densely populated areas across the United States.
For
2013
,
2012
and
2011
, the following merchandise constituted the following percentages of sales:
|
2013
|
2012
|
2011
|
||||||
|
Feminine Accessories, Intimate Apparel, Shoes and Cosmetics
|
38
|
%
|
38
|
%
|
37
|
%
|
||
|
Feminine Apparel
|
23
|
|
23
|
|
25
|
|
||
|
Men’s and Children’s
|
23
|
|
23
|
|
23
|
|
||
|
Home/Miscellaneous
|
16
|
|
16
|
|
15
|
|
||
|
100
|
%
|
100
|
%
|
100
|
%
|
|||
In
2013
, the Company’s subsidiaries provided various support functions to the Company’s retail operations on an integrated, company-wide basis.
|
•
|
The Company’s bank subsidiary, FDS Bank provides credit processing, certain collections, customer service and credit marketing services in respect of all proprietary and non-proprietary credit card accounts that are owned either by Department Stores National Bank (“DSNB”), a subsidiary of Citibank, N.A., or FDS Bank and that constitute a part of the credit programs of the Company’s retail operations.
|
|
•
|
Macy’s Systems and Technology, Inc. (“MST”), a wholly-owned indirect subsidiary of the Company, provides operational electronic data processing and management information services to all of the Company’s operations.
|
|
•
|
Macy’s Merchandising Group, Inc. (“MMG”), a wholly-owned direct subsidiary of the Company, and its subsidiary Macy's Merchandising Group International, LLC., is responsible for the design, development and marketing of Macy’s private label brands and certain licensed brands. Bloomingdale’s uses MMG for only a very small portion of its private label merchandise. The Company believes that its private label merchandise further differentiates its merchandise assortments from those of its competitors and delivers exceptional value to its customers. MMG also offers its services, either directly or indirectly, to unrelated third parties.
|
The principal private label brands currently offered by the Company include Alfani, American Rag, Aqua, Bar III, Charter Club, Club Room, Epic Threads, first impressions, Giani Bernini, greendog, Greg Norman for Tasso Elba, Home Design, Hotel Collection, Hudson Park, Ideology, I-N-C, jenni by jennifer moore, JM Collection, John Ashford, Karen Scott, Maison Jules, Martha Stewart Collection, Material Girl, Morgan Taylor, so jenni by jennifer moore, Studio Silver, Style & Co., Style & Co. Sport, Sutton Studio, Tasso Elba, the cellar, Tools of the Trade, and Via Europa.
The trademarks associated with all of the foregoing brands, other than American Rag, Greg Norman for Tasso Elba, Martha Stewart Collection, and Material Girl are owned by the Company. The American Rag, Greg Norman, Martha Stewart Collection, and Material Girl brands are owned by third parties, which license the trademarks associated with such brands to Macy’s pursuant to agreements which have renewal rights that extend through 2050, 2020, 2027, and 2030, respectively.
|
•
|
Macy’s Logistics and Operations (“Macy’s Logistics”), a division of a wholly-owned indirect subsidiary of the Company, provides warehousing and merchandise distribution services for the Company’s operations.
|
2
The Company’s executive offices are located at 7 West 7
th
Street, Cincinnati, Ohio 45202, telephone number: (513) 579-7000 and 151 West 34
th
Street, New York, New York 10001, telephone number: (212) 494-1602.
Employees
As of
February 1, 2014
, the Company had approximately 172,500 regular full-time and part-time employees. Because of the seasonal nature of the retail business, the number of employees peaks in the holiday season. Approximately 10% of the Company’s employees as of
February 1, 2014
were represented by unions. Management considers its relations with its employees to be satisfactory.
Seasonality
The retail business is seasonal in nature with a high proportion of sales and operating income generated in the months of November and December. Working capital requirements fluctuate during the year, increasing in mid-summer in anticipation of the fall merchandising season and increasing substantially prior to the holiday season when the Company must carry significantly higher inventory levels.
Purchasing
The Company purchases merchandise from many suppliers, no one of which accounted for more than 5% of the Company’s net purchases during
2013
. The Company has no material long-term purchase commitments with any of its suppliers, and believes that it is not dependent on any one supplier. The Company considers its relations with its suppliers to be satisfactory.
Competition
The retailing industry is intensely competitive. The Company’s operations compete with many retailing formats, including department stores, specialty stores, general merchandise stores, off-price and discount stores, manufacturers’ outlets, online retailers, mail order catalogs and television shopping, among others. The retailers with which the Company competes include Amazon, Bed Bath & Beyond, Belk, Bon Ton, Burlington Coat Factory, Dillard’s, Gap, J.C. Penney, Kohl’s, L Brands, Lord & Taylor, Neiman Marcus, Nordstrom, Ross Stores, Saks, Sears, Target, TJ Maxx and Wal-Mart. The Company seeks to attract customers by offering superior selections, obvious value, and distinctive marketing in stores that are located in premier locations, and by providing an exciting shopping environment and superior service through an omnichannel experience. Other retailers may compete for customers on some or all of these bases, or on other bases, and may be perceived by some potential customers as being better aligned with their particular preferences.
Available Information
The Company makes its annual reports on Form 10-K, quarterly reports on Form 10-Q, current reports on Form 8-K and amendments to those reports filed or furnished pursuant to Section 13(a) or 15(d) of the Exchange Act available free of charge through its internet website at
http://www.macysinc.com
as soon as reasonably practicable after it electronically files such material with, or furnishes it to, the SEC. The public also may read and copy any of these filings at the SEC’s Public Reference Room, 100 F Street, NE, Washington, D.C. 20549. Information on the operation of the Public Reference Room may be obtained by calling the SEC at 1-800-732-0330. The SEC also maintains an Internet site that contains the Company’s filings; the address of that site is
http://www.sec.gov
. In addition, the Company has made the following available free of charge through its website at
http://www.macysinc.com
:
|
•
|
Audit Committee Charter,
|
|
•
|
Compensation and Management Development Committee Charter,
|
|
•
|
Finance Committee Charter,
|
|
•
|
Nominating and Corporate Governance Committee Charter,
|
|
•
|
Corporate Governance Principles,
|
|
•
|
Non-Employee Director Code of Business Conduct and Ethics, and
|
|
•
|
Code of Conduct.
|
Any of these items are also available in print to any shareholder who requests them. Requests should be sent to the Corporate Secretary of Macy’s, Inc. at 7 West 7
th
Street, Cincinnati, OH 45202.
3
Executive Officers of the Registrant
The following table sets forth certain information as of March 21, 2014 regarding the executive officers of the Company:
|
Name
|
Age
|
Position with the Company
|
|||
|
Terry J. Lundgren
|
61
|
|
Chairman of the Board; President and Chief Executive Officer; Director
|
||
|
Timothy M. Adams
|
60
|
|
Chief Private Brand Officer
|
||
|
William S. Allen
|
56
|
|
Chief Human Resources Officer
|
||
|
Jeffrey Gennette
|
52
|
|
Chief Merchandising Officer
|
||
|
Julie Greiner
|
60
|
|
Chief Merchandise Planning Officer
|
||
|
Robert B. Harrison
|
50
|
|
Chief Omnichannel Officer
|
||
|
Karen M. Hoguet
|
57
|
|
Chief Financial Officer
|
||
|
Jeffrey Kantor
|
55
|
|
Chairman of macys.com
|
||
|
Martine Reardon
|
51
|
|
Chief Marketing Officer
|
||
|
Peter Sachse
|
56
|
|
Chief Stores Officer
|
||
|
Joel A. Belsky
|
60
|
|
Executive Vice President and Controller
|
||
|
Dennis J. Broderick
|
65
|
|
Executive Vice President, General Counsel and Secretary
|
||
Terry J. Lundgren has been Chairman of the Board since January 2004 and President and Chief Executive Officer of the Company since February 2003. On March 31, 2014, the Company announced that Jeffrey Gennette had been elected by the Board of Directors as the Company's President, effective immediately, whereupon Mr. Lundgren ceased to serve as the Company's President. Mr. Lundgren continues to hold the titles of Chairman and Chief Executive Officer.
Timothy M. Adams has been the Chief Private Brand Officer of the Company since February 2009.
William S. Allen has been Chief Human Resources Officer of the Company since January 2013; prior thereto he was the Senior Vice President - Group Human Resources of AP Moller-Maersk A/S from January 2008 to December 2012.
Jeffrey Gennette has been Chief Merchandising Officer of the Company since February 2009. On March 31, 2014, the Company announced that Jeffrey Gennette had been elected by the Board of Directors as the Company's President, effective immediately.
Julie Greiner has been Chief Merchandise Planning Officer of the Company since February 2009.
Robert B. Harrison has been Chief Omnichannel Officer since January 2013; prior thereto he served as Executive Vice President - Omnichannel Strategy from July 2012 to January 2013; as Executive Vice President - Finance from 2011 to July 2012, as President - Stores from 2009 to 2011.
Karen M. Hoguet has been Chief Financial Officer of the Company since October 1997.
Jeffrey Kantor has been Chairman of macys.com since February 2012; prior thereto he served as President for Merchandising of macys.com from August 2010 to February 2012, as President - Merchandising for Home from May 2009 to August 2010 and as President for furniture for Macy's Home Store from February 2006 to May 2009.
Martine Reardon has been Chief Marketing Officer since February 2012; prior thereto she served as Executive Vice President for Marketing from February 2009 to February 2012.
Peter Sachse has been Chief Stores Officer since February 2012; prior thereto he served as Chief Marketing Officer of the Company from February 2009 to February 2012, and as Chairman of macys.com from April 2006 to February 2012.
Joel A. Belsky has been Executive Vice President and Controller of the Company since May 2009; prior thereto he served as Senior Vice President and Controller of the Company from October 1996 through April 2009.
4
Dennis J. Broderick has been Secretary of the Company since July 1993 and Executive Vice President and General Counsel of the Company since May 2009; prior thereto he served as Senior Vice President and General Counsel of the Company from January 1990 to April 2009.
|
Item 1A.
|
Risk Factors.
|
In evaluating the Company, the risks described below and the matters described in “Forward-Looking Statements” should be considered carefully. Such risks and matters are numerous and diverse, may be experienced continuously or intermittently, and may vary in intensity and effect. Any of such risks and matters, individually or in combination, could have a material adverse effect on the Company's business, prospects, financial condition, results of operations and cash flows, as well as on the attractiveness and value of an investment in the Company's securities.
The Company faces significant competition in the retail industry.
The Company conducts its retail merchandising business under highly competitive conditions. Although the Company is one of the nation’s largest retailers, it has numerous and varied competitors at the national and local levels, including conventional and specialty department stores, other specialty stores, category killers, mass merchants, value retailers, discounters, and Internet and mail-order retailers. Competition may intensify as the Company’s competitors enter into business combinations or alliances. Competition is characterized by many factors, including assortment, advertising, price, quality, service, location, reputation and credit availability. Any failure by the Company to compete effectively could negatively affect the Company's business and results of operations.
The Company’s sales and operating results depend on consumer preferences and consumer spending.
The fashion and retail industries are subject to sudden shifts in consumer trends and consumer spending. The Company’s sales and operating results depend in part on its ability to predict or respond to changes in fashion trends and consumer preferences in a timely manner. The Company develops new retail concepts and continuously adjusts its industry position in certain major and private-label brands and product categories in an effort to satisfy customers. Any sustained failure to anticipate, identify and respond to emerging trends in lifestyle and consumer preferences could negatively affect the Company’s business and results of operations. The Company’s sales are significantly affected by discretionary spending by consumers. Consumer spending may be affected by many factors outside of the Company’s control, including general economic conditions, consumer disposable income levels, consumer confidence levels, the availability, cost and level of consumer debt and consumer behaviors towards incurring and paying debt, the costs of basic necessities and other goods and the effects of the weather or natural disasters. Any decline in discretionary spending by consumers could negatively affect the Company's business and results of operations.
The Company’s business is subject to unfavorable economic and political conditions and other developments and risks.
Unfavorable global, domestic or regional economic or political conditions and other developments and risks could negatively affect the Company’s business and results of operations. For example, unfavorable changes related to interest rates, rates of economic growth, fiscal and monetary policies of governments, inflation, deflation, consumer credit availability, consumer debt levels, consumer debt payment behaviors, tax rates and policy, unemployment trends, energy prices, and other matters that influence the availability and cost of merchandise, consumer confidence, spending and tourism could negatively affect the Company’s business and results of operations. In addition, unstable political conditions, civil unrest, terrorist activities and armed conflicts may disrupt commerce and could negatively affect the Company’s business and results of operations.
The Company’s revenues and cash requirements are affected by the seasonal nature of its business.
The Company’s business is seasonal, with a high proportion of revenues and operating cash flows generated during the second half of the fiscal year, which includes the fall and holiday selling seasons. A disproportionate amount of the Company's revenues fall in the fourth fiscal quarter, which coincides with the holiday season. In addition, the Company incurs significant additional expenses in the period leading up to the months of November and December in anticipation of higher sales volume in those periods, including for additional inventory, advertising and employees.
5
The Company’s business could be affected by extreme weather conditions, regional or global health pandemics or natural disasters.
Extreme weather conditions in the areas in which the Company’s stores are located could negatively affect the Company’s business and results of operations. For example, frequent or unusually heavy snowfall, ice storms, rainstorms or other extreme weather conditions over a prolonged period could make it difficult for the Company’s customers to travel to its stores and thereby reduce the Company’s sales and profitability. The Company’s business is also susceptible to unseasonable weather conditions. For example, extended periods of unseasonably warm temperatures during the winter season or cool weather during the summer season could reduce demand for a portion of the Company’s inventory and thereby reduce the Company's sales and profitability. In addition, extreme weather conditions could result in disruption or delay of production and delivery of materials and products in the Company's supply chain and cause staffing shortages in the Company's stores.
The Company's business and results of operations could also be negatively affected if a regional or global health pandemic were to occur, depending upon its location, duration and severity. To halt or delay the spread of disease, local, regional or national governments might limit or ban public gatherings or customers might avoid public places, such as the Company's stores. A regional or global health pandemic might also result in disruption or delay of production and delivery of materials and products in the Company's supply chain and cause staffing shortages in the Company's stores.
In addition, natural disasters such as hurricanes, tornadoes and earthquakes, or a combination of these or other factors, could damage or destroy the Company’s facilities or make it difficult for customers to travel to its stores, thereby negatively affecting the Company’s business and results of operations.
The Company’s pension funding could increase at a higher than anticipated rate.
Significant changes in interest rates, decreases in the fair value of plan assets and investment losses on plan assets could affect the funded status of the Company’s plans and could increase future funding requirements of the pension plans. A significant increase in future funding requirements could have a negative impact on the Company’s cash flows, financial condition or results of operations.
Increases in the cost of employee benefits could impact the Company’s financial results and cash flow.
The Company’s expenses relating to employee health benefits are significant. Unfavorable changes in the cost of such benefits could negatively affect the Company’s financial results and cash flow. Healthcare costs have risen significantly in recent years, and recent legislative and private sector initiatives regarding healthcare reform could result in significant changes to the U.S. healthcare system. Due to the breadth and complexity of the healthcare reform legislation, the lack of implementing regulations and interpretive guidance and the phased-in nature of the implementation of the legislation, the Company is not able at this time to fully determine the impact that healthcare reform will have on the Company-sponsored medical plans.
Inability to access capital markets could adversely affect the Company’s business or financial condition.
Changes in the credit and capital markets, including market disruptions, limited liquidity and interest rate fluctuations, may increase the cost of financing or restrict the Company’s access to this potential source of future liquidity. A decrease in the ratings that rating agencies assign to the Company’s short and long-term debt may negatively impact the Company’s access to the debt capital markets and increase the Company’s cost of borrowing. In addition, the Company’s bank credit agreements require the Company to maintain specified interest coverage and leverage ratios. The Company’s ability to comply with the ratios may be affected by events beyond its control, including prevailing economic, financial and industry conditions. If the Company’s results of operations or operating ratios deteriorate to a point where the Company is not in compliance with its debt covenants, and the Company is unable to obtain a waiver, much of the Company’s debt would be in default and could become due and payable immediately. The Company’s assets may not be sufficient to repay in full this indebtedness, resulting in a need for an alternate source of funding. The Company cannot make any assurances that it would be able to obtain such an alternate source of funding on satisfactory terms, if at all, and its inability to do so could cause the holders of its securities to experience a partial or total loss of their investments in the Company.
6
The Company periodically reviews the carrying value of its goodwill for possible impairment; if future circumstances indicate that goodwill is impaired, the Company could be required to write down amounts of goodwill and record impairment charges.
In the fourth quarter of fiscal 2008, the Company reduced the carrying value of its goodwill from $9,125 million to $3,743 million and recorded a related non-cash impairment charge of $5,382 million. The Company continues to monitor relevant circumstances, including consumer spending levels, general economic conditions and the market prices for the Company’s common stock, and the potential impact that such circumstances might have on the valuation of the Company’s goodwill. It is possible that changes in such circumstances, or in the numerous variables associated with the judgments, assumptions and estimates made by the Company in assessing the appropriate valuation of its goodwill, could in the future require the Company to further reduce its goodwill and record related non-cash impairment charges. If the Company were required to further reduce its goodwill and record related non-cash impairment charges, the Company’s financial position and results of operations would be adversely affected.
The Company depends on its ability to attract and retain quality employees.
The Company’s business is dependent upon attracting and retaining quality employees. The Company has a large number of employees, many of whom are in entry level or part-time positions with historically high rates of turnover. The Company’s ability to meet its labor needs while controlling the costs associated with hiring and training new employees is subject to external factors such as unemployment levels, prevailing wage rates, minimum wage legislation and changing demographics. In addition, as a large and complex enterprise operating in a highly competitive and challenging business environment, the Company is highly dependent upon management personnel to develop and effectively execute successful business strategies and tactics. Any circumstances that adversely impact the Company’s ability to attract, train, develop and retain quality employees throughout the organization could negatively affect the Company’s business and results of operations.
The Company depends upon designers, vendors and other sources of merchandise, goods and services. The Company's business could be affected by disruptions in, or other legal, regulatory, political or economic issues associated with, our supply network.
The Company’s relationships with established and emerging designers have been a significant contributor to the Company’s past success. The Company’s ability to find qualified vendors and access products in a timely and efficient manner is often challenging, particularly with respect to goods sourced outside the United States. The Company’s procurement of goods and services from outside the United States is subject to risks associated with political or financial instability, trade restrictions, tariffs, currency exchange rates, transport capacity and costs and other factors relating to foreign trade, including costs and uncertainties associated with efforts to identify and disclose sources of "conflict minerals" used in products that the Company causes to be manufactured and potential sell-through difficulties and reputational damage that may be associated with the inability of the Company to determine that such products are "DRC conflict-free." In addition, the Company’s procurement of all its goods and services is subject to the effects of price increases which the Company may or may not be able to pass through to its customers. All of these factors may affect the Company’s ability to access suitable merchandise on acceptable terms, are beyond the Company’s control and could negatively affect the Company’s business and results of operations.
The Company's sales and operating results could be adversely affected by product safety concerns.
If the Company's merchandise offerings do not meet applicable safety standards or our consumers' expectations regarding safety, the Company could experience decreased sales, experience increased costs and/or be exposed to legal and reputational risk. Events that give rise to actual, potential or perceived product safety concerns could expose the Company to government enforcement action and/or private litigation. Reputational damage caused by real or perceived product safety concerns could negatively affect the Company's business and results of operations.
The Company depends upon the success of its advertising and marketing programs.
The Company’s advertising and promotional costs, net of cooperative advertising allowances, amounted to
$1,166 million
for
2013
. The Company’s business depends on effective marketing and high customer traffic. The Company has many initiatives in this area, and often changes its advertising and marketing programs. There can be no assurance as to the Company’s continued ability to effectively execute its advertising and marketing programs, and any failure to do so could negatively affect the Company’s business and results of operations.
7
Parties with whom the Company does business may be subject to insolvency risks or may otherwise become unable or unwilling to perform their obligations to the Company.
The Company is a party to contracts, transactions and business relationships with various third parties, including vendors, suppliers, service providers, lenders and participants in joint ventures, strategic alliances and other joint commercial relationships, pursuant to which such third parties have performance, payment and other obligations to the Company. In some cases, the Company depends upon such third parties to provide essential leaseholds, products, services or other benefits, including with respect to store and distribution center locations, merchandise, advertising, software development and support, logistics, other agreements for goods and services in order to operate the Company’s business in the ordinary course, extensions of credit, credit card accounts and related receivables, and other vital matters. Current economic, industry and market conditions could result in increased risks to the Company associated with the potential financial distress or insolvency of such third parties. If any of these third parties were to become subject to bankruptcy, receivership or similar proceedings, the rights and benefits of the Company in relation to its contracts, transactions and business relationships with such third parties could be terminated, modified in a manner adverse to the Company, or otherwise impaired. The Company cannot make any assurances that it would be able to arrange for alternate or replacement contracts, transactions or business relationships on terms as favorable as the Company’s existing contracts, transactions or business relationships, if at all. Any inability on the part of the Company to do so could negatively affect the Company’s cash flows, financial condition and results of operations.
A material disruption in the Company’s computer systems could adversely affect the Company’s business or results of operations.
The Company relies extensively on its computer systems to process transactions, summarize results and manage its business. The Company’s computer systems are subject to damage or interruption from power outages, computer and telecommunications failures, computer viruses, cyber-attack or other security breaches, catastrophic events such as fires, floods, earthquakes, tornadoes, hurricanes, acts of war or terrorism, and usage errors by the Company’s employees. If the Company’s computer systems are damaged or cease to function properly, the Company may have to make a significant investment to fix or replace them, and the Company may suffer loss of critical data and interruptions or delays in its operations. Any material interruption in the Company’s computer systems could negatively affect its business and results of operations.
A privacy breach could result in negative publicity and adversely affect the Company’s business or results of operations.
The protection of customer, employee, and company data is critical to the Company. The regulatory environment surrounding information security and privacy is increasingly demanding, with the frequent imposition of new and constantly changing requirements across business units. In addition, customers have a high expectation that the Company will adequately protect their personal information from cyber-attack or other security breaches. A significant breach of customer, employee, or company data could attract a substantial amount of media attention, damage the Company’s customer relationships and reputation and result in lost sales, fines, or lawsuits.
Litigation, legislation or regulatory developments could adversely affect the Company’s business and results of operations.
The Company is subject to various federal, state and local laws, rules, regulations, inquiries and initiatives in connection with both its core business operations and its credit card and other ancillary operations (including the Credit Card Act of 2009 and the Dodd-Frank Wall Street Reform and Consumer Protection Act of 2010 (the “Dodd-Frank Act”)). Recent and future developments relating to such matters could increase the Company's compliance costs and adversely affect the profitability of its credit card and other operations. The Company is also subject to anti-bribery, customs, child labor, truth-in-advertising and other laws, including consumer protection regulations and zoning and occupancy ordinances that regulate retailers generally and/or govern the importation, promotion and sale of merchandise and the operation of retail stores and warehouse facilities. Although the Company undertakes to monitor changes in these laws, if these laws change without the Company's knowledge, or are violated by importers, designers, manufacturers, distributors or agents, the Company could experience delays in shipments and receipt of goods or be subject to fines or other penalties under the controlling regulations, any of which could negatively affect the Company's business and results of operations. In addition, the Company is regularly involved in various litigation matters that arise in the ordinary course of its business. Adverse outcomes in current or future litigation could negatively affect the Company’s financial condition, results of operations and cash flows.
8
Factors beyond the Company’s control could affect the Company’s stock price.
The Company’s stock price, like that of other retail companies, is subject to significant volatility because of many factors, including factors beyond the control of the Company. These factors may include:
|
•
|
general economic and stock and credit market conditions;
|
|
•
|
risks relating to the Company’s business and its industry, including those discussed above;
|
|
•
|
strategic actions by the Company or its competitors;
|
|
•
|
variations in the Company’s quarterly results of operations;
|
|
•
|
future sales or purchases of the Company’s common stock; and
|
|
•
|
investor perceptions of the investment opportunity associated with the Company’s common stock relative to other investment alternatives.
|
In addition, the Company may fail to meet the expectations of its stockholders or of analysts at some time in the future. If the analysts that regularly follow the Company’s stock lower their rating or lower their projections for future growth and financial performance, the Company’s stock price could decline. Also, sales of a substantial number of shares of the Company’s common stock in the public market or the appearance that these shares are available for sale could adversely affect the market price of the Company’s common stock.
|
Item 1B.
|
Unresolved Staff Comments.
|
None.
|
Item 2.
|
Properties.
|
The properties of the Company consist primarily of stores and related facilities, including a logistics network. The Company also owns or leases other properties, including corporate office space in Cincinnati and New York and other facilities at which centralized operational support functions are conducted. As of
February 1, 2014
, the operations of the Company included 840 stores in 45 states, the District of Columbia, Puerto Rico and Guam, comprising a total of approximately 150,100,000 square feet. Of such stores, 460 were owned, 269 were leased and 111 stores were operated under arrangements where the Company owned the building and leased the land. Substantially all owned properties are held free and clear of mortgages. Pursuant to various shopping center agreements, the Company is obligated to operate certain stores for periods of up to 20 years. Some of these agreements require that the stores be operated under a particular name. Most leases require the Company to pay real estate taxes, maintenance and other costs; some also require additional payments based on percentages of sales and some contain purchase options. Certain of the Company’s real estate leases have terms that extend for a significant number of years and provide for rental rates that increase or decrease over time.
Additional information about the Company’s stores as of
February 1, 2014
is as follows:
|
Geographic Region
|
Total
Stores
|
Owned
Stores
|
Leased
Stores
|
Stores
Subject to
a Ground
Lease
|
||||||||
|
Mid-Atlantic
|
128
|
|
68
|
|
40
|
|
20
|
|
||||
|
Northeast
|
119
|
|
62
|
|
48
|
|
9
|
|
||||
|
North Central
|
119
|
|
82
|
|
26
|
|
11
|
|
||||
|
Northwest
|
126
|
|
39
|
|
69
|
|
18
|
|
||||
|
Southeast
|
119
|
|
78
|
|
20
|
|
21
|
|
||||
|
South Central
|
101
|
|
77
|
|
16
|
|
8
|
|
||||
|
Southwest
|
128
|
|
54
|
|
50
|
|
24
|
|
||||
|
840
|
|
460
|
|
269
|
|
111
|
|
|||||
The seven geographic regions detailed in the foregoing table are based on the Company’s Macy’s-branded operational structure. The Company’s retail stores are located at urban or suburban sites, principally in densely populated areas across the United States.
9
Store count activity was as follows:
|
2013
|
2012
|
2011
|
||||||
|
Store count at beginning of fiscal year
|
841
|
|
842
|
|
850
|
|
||
|
Stores opened and other expansions
|
6
|
|
7
|
|
4
|
|
||
|
Stores closed
|
(7
|
)
|
(8
|
)
|
(12
|
)
|
||
|
Store count at end of fiscal year
|
840
|
|
841
|
|
842
|
|
||
Additional information about the Company’s logistics network as of
February 1, 2014
is as follows:
|
Location
|
Primary Function
|
Owned or Leased
|
Square Footage (thousands)
|
||||
|
Cheshire, CT
|
Direct to customer
|
Owned
|
565
|
|
|||
|
Chicago, IL
|
Stores
|
Owned
|
861
|
|
|||
|
Denver, CO
|
Stores
|
Leased
|
20
|
|
|||
|
Goodyear, AZ
|
Direct to customer
|
Owned
|
600
|
|
|||
|
Hayward, CA
|
Stores
|
Owned
|
386
|
|
|||
|
Houston, TX
|
Stores
|
Owned
|
1,124
|
|
|||
|
Joppa, MD
|
Stores
|
Owned
|
850
|
|
|||
|
Kapolei, HI
|
Stores
|
Owned
|
260
|
|
|||
|
Los Angeles, CA
|
Stores
|
Owned
|
1,178
|
|
|||
|
Martinsburg, WV
|
Direct to customer
|
Owned
|
1,300
|
|
|||
|
Miami, FL
|
Stores
|
Leased
|
535
|
|
|||
|
Portland, TN
|
Direct to customer
|
Owned
|
950
|
|
|||
|
Raritan, NJ
|
Stores
|
Owned
|
560
|
|
|||
|
Sacramento, CA
|
Direct to customer
|
Leased
|
96
|
|
|||
|
Secaucus, NJ
|
Stores
|
Leased
|
675
|
|
|||
|
South Windsor, CT
|
Stores
|
Owned
|
668
|
|
|||
|
St. Louis, MO
|
Stores
|
Owned
|
661
|
|
|||
|
Stone Mountain, GA
|
Stores
|
Owned
|
1,000
|
|
|||
|
Tampa, FL
|
Stores
|
Owned
|
670
|
|
|||
|
Tukwila, WA
|
Stores
|
Leased
|
500
|
|
|||
|
Youngstown, OH
|
Stores
|
Owned
|
851
|
|
|||
|
Item 3.
|
Legal Proceedings.
|
The Company and its subsidiaries are involved in various proceedings that are incidental to the normal course of their businesses. As of the date of this report, the Company does not expect that any of such proceedings will have a material adverse effect on the Company’s financial position or results of operations.
|
Item 4.
|
Mine Safety Disclosures.
|
Not Applicable.
10
|
Item 5.
|
Market for Registrant’s Common Equity, Related Stockholder Matters and Issuer Purchases of Equity Securities.
|
The Common Stock is listed on the NYSE under the trading symbol “M.” As of
February 1, 2014
, the Company had approximately 19,000 stockholders of record. The following table sets forth for each fiscal quarter during
2013
and
2012
the high and low sales prices per share of Common Stock as reported on the NYSE Composite Tape and the dividend declared with respect to each fiscal quarter on each share of Common Stock.
|
|
2013
|
2012
|
|||||||||||||||
|
Low
|
High
|
Dividend
|
Low
|
High
|
Dividend
|
||||||||||||
|
1st Quarter
|
38.52
|
|
46.45
|
|
0.2000
|
|
33.18
|
|
41.50
|
|
0.2000
|
|
|||||
|
2nd Quarter
|
45.72
|
|
50.77
|
|
0.2500
|
|
32.31
|
|
42.17
|
|
0.2000
|
|
|||||
|
3rd Quarter
|
42.18
|
|
49.72
|
|
0.2500
|
|
34.89
|
|
41.24
|
|
0.2000
|
|
|||||
|
4th Quarter
|
45.59
|
|
56.65
|
|
0.2500
|
|
36.30
|
|
41.98
|
|
0.2000
|
|
|||||
The declaration and payment of future dividends will be at the discretion of the Company’s Board of Directors, are subject to restrictions under the Company’s credit facility and may be affected by various other factors, including the Company’s earnings, financial condition and legal or contractual restrictions.
The following table provides information regarding the Company’s purchases of Common Stock during the fourth quarter of
2013
.
|
Total
Number
of Shares
Purchased
|
Average
Price per
Share ($)
|
Number of Shares
Purchased under
Program (1)
|
Open
Authorization
Remaining (1)($)
|
||||||||
|
(thousands)
|
|
(thousands)
|
(millions)
|
||||||||
|
November 3, 2013 – November 30, 2013
|
1,252
|
|
51.19
|
|
1,252
|
|
1,684
|
|
|||
|
December 1, 2013 – January 4, 2014
|
3,272
|
|
52.37
|
|
3,272
|
|
1,513
|
|
|||
|
January 5, 2014 – February 1, 2014
|
1,476
|
|
54.57
|
|
1,476
|
|
1,432
|
|
|||
|
6,000
|
|
52.67
|
|
6,000
|
|
||||||
___________________
|
(1)
|
Commencing in January 2000, the Company’s Board of Directors has from time to time approved authorizations to purchase, in the aggregate, up to
$13,500 million
of Common Stock. All authorizations are cumulative and do not have an expiration date. As of
February 1, 2014
,
$1,432 million
of authorization remained unused. The Company may continue, discontinue or resume purchases of Common Stock under these or possible future authorizations in the open market, in privately negotiated transactions or otherwise at any time and from time to time without prior notice.
|
11
The following graph compares the cumulative total stockholder return on the Common Stock with the Standard & Poor’s 500 Composite Index and the Standard & Poor’s Retail Department Store Index for the period from January 31, 2009 through February 1, 2014, assuming an initial investment of $100 and the reinvestment of all dividends, if any.
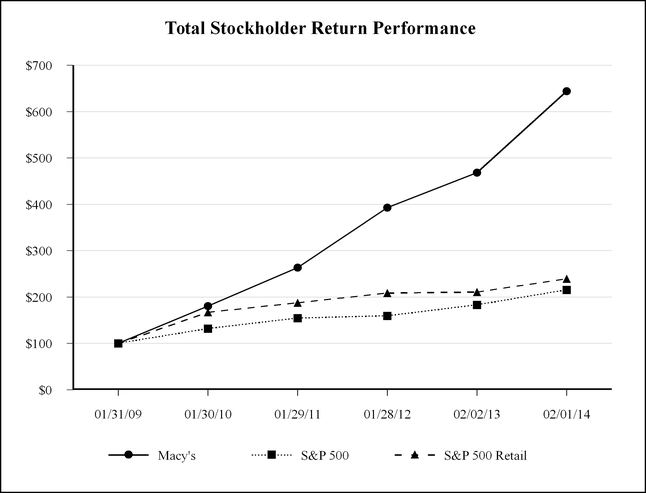
The companies included in the S&P Retail Department Store Index are Macy’s, J.C. Penney, Kohl’s and Nordstrom.
12
|
Item 6.
|
Selected Financial Data.
|
The selected financial data set forth below should be read in conjunction with the Consolidated Financial Statements and the notes thereto and the other information contained elsewhere in this report.
|
2013
|
2012*
|
2011
|
2010
|
2009
|
|||||||||||||||
|
(millions, except per share)
|
|||||||||||||||||||
|
Consolidated Statement of Income Data:
|
|||||||||||||||||||
|
Net sales
|
$
|
27,931
|
|
$
|
27,686
|
|
$
|
26,405
|
|
$
|
25,003
|
|
$
|
23,489
|
|
||||
|
Cost of sales
|
(16,725
|
)
|
(16,538
|
)
|
(15,738
|
)
|
(14,824
|
)
|
(13,973
|
)
|
|||||||||
|
Gross margin
|
11,206
|
|
11,148
|
|
10,667
|
|
10,179
|
|
9,516
|
|
|||||||||
|
Selling, general and administrative expenses
|
(8,440
|
)
|
(8,482
|
)
|
(8,281
|
)
|
(8,260
|
)
|
(8,062
|
)
|
|||||||||
|
Impairments, store closing and other costs, gain on
sale of leases and division consolidation costs |
(88
|
)
|
(5
|
)
|
25
|
|
(25
|
)
|
(391
|
)
|
|||||||||
|
Operating income
|
2,678
|
|
2,661
|
|
2,411
|
|
1,894
|
|
1,063
|
|
|||||||||
|
Interest expense
|
(390
|
)
|
(425
|
)
|
(447
|
)
|
(513
|
)
|
(562
|
)
|
|||||||||
|
Premium on early retirement of debt
|
—
|
|
(137
|
)
|
—
|
|
(66
|
)
|
—
|
|
|||||||||
|
Interest income
|
2
|
|
3
|
|
4
|
|
5
|
|
6
|
|
|||||||||
|
Income before income taxes
|
2,290
|
|
2,102
|
|
1,968
|
|
1,320
|
|
507
|
|
|||||||||
|
Federal, state and local income tax expense
|
(804
|
)
|
(767
|
)
|
(712
|
)
|
(473
|
)
|
(178
|
)
|
|||||||||
|
Net income
|
$
|
1,486
|
|
$
|
1,335
|
|
$
|
1,256
|
|
$
|
847
|
|
$
|
329
|
|
||||
|
Basic earnings per share
|
$
|
3.93
|
|
$
|
3.29
|
|
$
|
2.96
|
|
$
|
2.00
|
|
$
|
0.78
|
|
||||
|
Diluted earnings per share
|
$
|
3.86
|
|
$
|
3.24
|
|
$
|
2.92
|
|
$
|
1.98
|
|
$
|
0.78
|
|
||||
|
Average number of shares outstanding
|
378.3
|
|
405.5
|
|
424.5
|
|
423.3
|
|
421.7
|
|
|||||||||
|
Cash dividends paid per share
|
$
|
.9500
|
|
$
|
.8000
|
|
$
|
.3500
|
|
$
|
.2000
|
|
$
|
.2000
|
|
||||
|
Depreciation and amortization
|
$
|
1,020
|
|
$
|
1,049
|
|
$
|
1,085
|
|
$
|
1,150
|
|
$
|
1,210
|
|
||||
|
Capital expenditures
|
$
|
863
|
|
$
|
942
|
|
$
|
764
|
|
$
|
505
|
|
$
|
460
|
|
||||
|
Balance Sheet Data (at year end):
|
|||||||||||||||||||
|
Cash and cash equivalents
|
$
|
2,273
|
|
$
|
1,836
|
|
$
|
2,827
|
|
$
|
1,464
|
|
$
|
1,686
|
|
||||
|
Total assets
|
21,634
|
|
20,991
|
|
22,095
|
|
20,631
|
|
21,300
|
|
|||||||||
|
Short-term debt
|
463
|
|
124
|
|
1,103
|
|
454
|
|
242
|
|
|||||||||
|
Long-term debt
|
6,728
|
|
6,806
|
|
6,655
|
|
6,971
|
|
8,456
|
|
|||||||||
|
Shareholders’ equity
|
6,249
|
|
6,051
|
|
5,933
|
|
5,530
|
|
4,653
|
|
|||||||||
___________________
|
*
|
53 weeks
|
13
|
Item 7.
|
Management’s Discussion and Analysis of Financial Condition and Results of Operations.
|
The discussion in this Item 7 should be read in conjunction with our Consolidated Financial Statements and the related notes included elsewhere in this report. The discussion in this Item 7 contains forward-looking statements that reflect the Company's plans, estimates and beliefs. The Company's actual results could materially differ from those discussed in these forward-looking statements. Factors that could cause or contribute to those differences include, but are not limited to, those discussed below and elsewhere in this report, particularly in “Risk Factors” and “Forward-Looking Statements.”
Overview
The Company is an omnichannel retail organization operating stores and websites under two brands (Macy's and Bloomingdale's) that sell a wide range of merchandise, including apparel and accessories (men's, women's and children's), cosmetics, home furnishings and other consumer goods in 45 states, the District of Columbia, Guam and Puerto Rico. As of
February 1, 2014
, the Company's operations were conducted through Macy's, macys.com, Bloomingdale's, bloomingdales.com and Bloomingdale's Outlet which are aggregated into one reporting segment in accordance with the Financial Accounting Standards Board (“FASB”) Accounting Standards Codification (“ASC”) Topic 280, “Segment Reporting.”
The Company is focused on three key strategies for continued growth in sales, earnings and cash flow in the years ahead: (i) maximizing the My Macy's localization initiative; (ii) driving the omnichannel business; and (iii) embracing customer centricity, including engaging customers on the selling floor through the Magic Selling program.
Through the My Macy's localization initiative, the Company has invested in talent, technology and marketing which ensures that core customers surrounding each Macy's store find merchandise assortments, size ranges, marketing programs and shopping experiences that are custom-tailored to their needs. My Macy's has provided for more local decision-making in every Macy's community, and involves tailoring merchandise assortments, space allocations, service levels, visual merchandising, marketing and special events on a store-by-store basis.
The Company's omnichannel strategy allows customers to shop seamlessly in stores and online, via computers or mobile devices. A pivotal part of the omnichannel strategy is the Company's ability to allow associates in any store to sell a product that may be unavailable locally by selecting merchandise from other stores or online fulfillment centers for shipment to the customer's door. Likewise, the Company's online fulfillment centers can draw on store inventories nationwide to fill orders that originate online, via computers or mobile devices. As of
February 1, 2014
, 500 Macy's stores were fulfilling orders from other stores and/or online, as compared to 292 Macy's stores as of
February 2, 2013
. During fiscal 2014, nearly all Macy's stores are expected to be fulfilling orders from other stores and/or online. Also in 2014, nearly all stores are expected to be fulfilling orders for pick-up related to online purchases.
Macy's Magic Selling program is an approach to customer engagement that helps Macy's to better understand the needs of customers, as well as to provide options and advice. This comprehensive ongoing training and coaching program is designed to improve the in-store shopping experience and all other customer interactions.
In fiscal 2010, the Company piloted a new Bloomingdale's Outlet store concept. Bloomingdale's Outlet stores are each approximately 25,000 square feet and offer a range of apparel and accessories, including women's ready-to-wear, men's, children's, women's shoes, fashion accessories, jewelry, handbags and intimate apparel.
Additionally, in February 2010, Bloomingdale's opened in Dubai, United Arab Emirates under a license agreement with Al Tayer Insignia, a company of Al Tayer Group, LLC, under which the Company is entitled to a license fee in accordance with the terms of the underlying agreement, generally based upon the greater of the contractually earned or guaranteed minimum amounts.
During 2012, the Company opened two new Macy's stores in Salt Lake City, UT; and Greendale, WI; and five new Bloomingdale's Outlet stores in Livermore, CA; Merrimack, NH; Garden City, NY; Grand Prairie, TX; and Dallas, TX. Also during 2012 the Company opened its new 1.3 million square foot fulfillment center in Martinsburg, WV. During 2013, the Company opened three new Macy's stores in Victorville, CA; Gurnee, IL; and Las Vegas, NV; a Macy's replacement store in Bay Shore, NY; a new Bloomingdale's store in Glendale, CA; and a new Bloomingdale's Outlet store in Rosemont, IL. The Company has announced that in 2014 it intends to open three new Macy's stores and one Bloomingdale's replacement store. Additionally, the Company has announced that in 2015 it intends to open one new Macy's store and one new Bloomingdale's store, and in 2016 it intends to open one new Macy's store and one new Bloomingdale's store.
14
The Company's operations are impacted by competitive pressures from department stores, specialty stores, mass merchandisers, online retailers and all other retail channels. The Company's operations are also impacted by general consumer spending levels, including the impact of general economic conditions, consumer disposable income levels, consumer confidence levels, the availability, cost and level of consumer debt, the costs of basic necessities and other goods and the effects of weather or natural disasters and other factors over which the Company has little or no control.
In recent years, consumer spending levels have been affected to varying degrees by a number of factors, including modest economic growth, a slowly improving housing market, a rising stock market, uncertainty regarding governmental spending and tax policies, high unemployment levels and tightened consumer credit. These factors have affected to varying degrees the amount of funds that consumers are willing and able to spend for discretionary purchases, including purchases of some of the merchandise offered by the Company.
The effects of economic conditions have been, and may continue to be, experienced differently, or at different times, in the various geographic regions in which the Company operates, in relation to the different types of merchandise that the Company offers for sale, or in relation to the Company's Macy's-branded and Bloomingdale's-branded operations. All economic conditions, however, ultimately affect the Company's overall operations.
2013 Highlights
The Company had its fifth consecutive year of improved financial performance in 2013 despite the continued challenging macroeconomic environment. These improvements have been driven by successful implementation of the Company's key strategies.
Selected highlights of 2013 include:
|
•
|
Comparable sales increased
1.9%
, which represents the fourth consecutive year of comparable sales growth. Comparable sales growth including the impact of growth in comparable sales of departments licensed to third parties increased
2.8%
. See pages 16 to 19 for a reconciliation of this non-GAAP financial measure to the most comparable GAAP financial measure and other important information.
|
|
•
|
Operating income for fiscal 2013 was
$2.766 billion
or
9.9%
of sales, excluding impairments, store closing and other costs, an increase of 3.8% and 30 basis points as a percent of sales over 2012 on a comparable basis. See pages 16 to 19 for a reconciliation of this non-GAAP financial measure to the most comparable GAAP financial measure and other important information.
|
|
•
|
Diluted earnings per share, excluding certain items, grew 15.6% to
$4.00
in 2013. See pages 16 to 19 for a reconciliation of this non-GAAP financial measure to the most comparable GAAP financial measure and other important information.
|
|
•
|
Adjusted EBITDA (earnings before interest, taxes, depreciation and amortization, impairments, store closing and other costs) as a percent to net sales reached
13.6%
in 2013, reflecting steady improvement toward the Company's goal of a 14% Adjusted EBITDA rate. See pages 16 to 19 for a reconciliation of this non-GAAP financial measure to the most comparable GAAP financial measure and other important information.
|
|
•
|
Return on invested capital ("ROIC"), a key measure of operating productivity, reached
21.5%
, continuing an improvement trend over the past five years. See pages 16 to 19 for a reconciliation of this non-GAAP financial measure to the most comparable GAAP financial measure and other important information.
|
|
•
|
The Company repurchased
33.6 million
shares of its common stock for
$1,570 million
in 2013, and increased its annualized dividend rate to $1.00 per share.
|
15
Important Information Regarding Non-GAAP Financial Measures
The Company reports its financial results in accordance with generally accepted accounting principles ("GAAP"). However, management believes that certain non-GAAP financial measures provide users of the Company's financial information with additional useful information in evaluating operating performance. Management believes that providing comparable sales growth including the impact of growth in comparable sales of departments licensed to third parties supplementally to its results of operations calculated in accordance with GAAP assists in evaluating the Company's ability to generate sales growth, whether through owned businesses or departments licensed to third parties, on a comparable basis, and in evaluating the impact of changes in the manner in which certain departments are operated (e.g., the conversion in 2013 of most of the Company's previously owned athletic footwear business to licensed Finish Line shops). Management believes that excluding certain items that may vary substantially in frequency and magnitude from diluted earnings per share and from operating income and EBITDA as percentages to sales are useful supplemental measures that assist in evaluating the Company's ability to generate earnings and leverage sales, respectively, and to more readily compare these metrics between past and future periods. Management also believes that EBITDA and Adjusted EBITDA are frequently used by investors and securities analysts in their evaluations of companies, and that such supplemental measures facilitate comparisons between companies that have different capital and financing structures and/or tax rates. In addition, management believes that ROIC is a useful supplemental measure in evaluating how efficiently the Company employs its capital. The Company uses some of these non-GAAP financial measures as performance measures for components of executive compensation.
Non-GAAP financial measures should be viewed as supplementing, and not as an alternative or substitute for, the Company's financial results prepared in accordance with GAAP. Certain of the items that may be excluded or included in non-GAAP financial measures may be significant items that could impact the Company's financial position, results of operations and cash flows and should therefore be considered in assessing the Company's actual financial condition and performance. Additionally, the amounts received by the Company on account of sales licensed to third parties are limited to commissions
received on such sales. The methods used by the Company to calculate its non-GAAP financial measures may differ significantly from methods used by other companies to compute similar measures. As a result, any non-GAAP financial measures presented herein may not be comparable to similar measures provided by other companies.
Comparable Sales Growth Including the Impact of Growth in Comparable Sales of Departments Licensed to Third Parties
The following is a tabular reconciliation of the non-GAAP financial measure comparable sales growth including the impact of growth in comparable sales of departments licensed to third parties, to GAAP comparable sales, which the Company believes to be the most directly comparable GAAP financial measure.
|
2013
|
2012
|
2011
|
2010
|
|||||
|
Increase in comparable sales (note 1)
|
1.9%
|
3.7%
|
5.3%
|
4.6%
|
||||
|
Impact of growth in comparable sales of departments licensed
to third parties (note 2) |
0.9%
|
0.3%
|
0.4%
|
(0.2)%
|
||||
|
Comparable sales growth including the impact of growth in comparable sales of departments licensed to third parties
|
2.8%
|
4.0%
|
5.7%
|
4.4%
|
||||
Notes:
|
(1)
|
Represents the period-to-period percentage change in net sales from stores in operation throughout the year presented and the immediately preceding year and all net Internet sales, adjusting for the 53rd week in 2012, excluding commissions from departments licensed to third parties. Stores undergoing remodeling, expansion or relocation remain in the comparable sales calculation unless the store is closed for a significant period of time. Definitions and calculations of comparable sales differ among companies in the retail industry.
|
|
(2)
|
Represents the impact on comparable sales of including the sales of departments licensed to third parties occurring in stores in operation throughout the year presented and the immediately preceding year and via the Internet in the calculation. The Company licenses third parties to operate certain departments in its stores and online and receives commissions from these third parties based on a percentage of their net sales. In its financial statements prepared in conformity with GAAP, the Company includes these commissions (rather than sales of the departments licensed to third parties) in its net sales. The Company does not, however, include any amounts in respect of licensed department sales in its comparable sales in accordance with GAAP.
|
16
Operating Income, Excluding Certain Items, as a Percent to Net Sales
The following is a tabular reconciliation of the non-GAAP financial measure operating income, excluding certain items, as a percent to net sales to GAAP operating income as a percent to net sales, which the Company believes to be the most directly comparable GAAP financial measure.
|
2013
|
2012
|
2011
|
2010
|
2009
|
||||||||||||||||
|
(millions, except percentages)
|
||||||||||||||||||||
|
Net sales
|
$
|
27,931
|
|
$
|
27,686
|
|
$
|
26,405
|
|
$
|
25,003
|
|
$
|
23,489
|
|
|||||
|
Operating income
|
$
|
2,678
|
|
$
|
2,661
|
|
$
|
2,411
|
|
$
|
1,894
|
|
$
|
1,063
|
|
|||||
|
Operating income as a percent to net sales
|
9.6
|
%
|
9.6
|
%
|
9.1
|
%
|
7.6
|
%
|
4.5
|
%
|
||||||||||
|
Operating income
|
$
|
2,678
|
|
$
|
2,661
|
|
$
|
2,411
|
|
$
|
1,894
|
|
$
|
1,063
|
|
|||||
|
Add back (deduct) impairments, store closing and
other costs, gain on sale of leases and division consolidation costs |
88
|
|
5
|
|
(25
|
)
|
25
|
|
391
|
|
||||||||||
|
Operating income, excluding certain items
|
$
|
2,766
|
|
$
|
2,666
|
|
$
|
2,386
|
|
$
|
1,919
|
|
$
|
1,454
|
|
|||||
|
Operating income, excluding certain items, as a
percent to net sales |
9.9
|
%
|
9.6
|
%
|
9.0
|
%
|
7.7
|
%
|
6.2
|
%
|
||||||||||
Diluted Earnings Per Share, Excluding Certain Items
The following is a tabular reconciliation of the non-GAAP financial measure diluted earnings per share, excluding certain items, to GAAP diluted earnings per share, which the Company believes to be the most directly comparable GAAP measure.
|
2013
|
2012
|
2011
|
2010
|
2009
|
||||||||||||||||
|
Diluted earnings per share
|
$
|
3.86
|
|
$
|
3.24
|
|
$
|
2.92
|
|
$
|
1.98
|
|
$
|
0.78
|
|
|||||
|
Add back the impact of impairments, store closing
and other costs |
0.14
|
|
0.01
|
|
0.04
|
|
0.04
|
|
0.18
|
|
||||||||||
|
Add back the impact of premium on early
retirement of debt |
—
|
|
0.21
|
|
—
|
|
0.09
|
|
—
|
|
||||||||||
|
Deduct the impact of gain on sale of leases
|
—
|
|
—
|
|
(0.08
|
)
|
—
|
|
—
|
|
||||||||||
|
Add back the impact of division consolidation costs
|
—
|
|
—
|
|
—
|
|
—
|
|
0.40
|
|
||||||||||
|
Diluted earnings per share, excluding the impact of
impairments, store closing and other costs, premium on early retirement of debt, gain on sale of leases and division consolidation costs |
$
|
4.00
|
|
$
|
3.46
|
|
$
|
2.88
|
|
$
|
2.11
|
|
$
|
1.36
|
|
|||||
17
Adjusted EBITDA as a Percent to Net Sales
The following is a tabular reconciliation of the non-GAAP financial measure earnings before interest, taxes, depreciation and amortization ("EBITDA"), as adjusted to exclude premium on early retirement of debt, impairments, store closing and other costs, gain on sales of leases and division consolidation costs ("Adjusted EBITDA"), as a percent to net sales to GAAP net income as a percent to net sales, which the Company believes to be the most directly comparable GAAP financial measure.
|
2013
|
2012
|
2011
|
2010
|
2009
|
||||||||||||||||
|
(millions, except percentages)
|
||||||||||||||||||||
|
Net sales
|
$
|
27,931
|
|
$
|
27,686
|
|
$
|
26,405
|
|
$
|
25,003
|
|
$
|
23,489
|
|
|||||
|
Net income
|
$
|
1,486
|
|
$
|
1,335
|
|
$
|
1,256
|
|
$
|
847
|
|
$
|
329
|
|
|||||
|
Net income as a percent to net sales
|
5.3
|
%
|
4.8
|
%
|
4.8
|
%
|
3.4
|
%
|
1.4
|
%
|
||||||||||
|
Net income
|
$
|
1,486
|
|
$
|
1,335
|
|
$
|
1,256
|
|
$
|
847
|
|
$
|
329
|
|
|||||
|
Add back interest expense - net
|
388
|
|
422
|
|
443
|
|
508
|
|
556
|
|
||||||||||
|
Add back premium on early retirement of debt
|
—
|
|
137
|
|
—
|
|
66
|
|
—
|
|
||||||||||
|
Add back federal, state and local income tax expense
|
804
|
|
767
|
|
712
|
|
473
|
|
178
|
|
||||||||||
|
Add back (deduct) impairments, store closing and
other costs, gain on sale of leases and division consolidation costs |
88
|
|
5
|
|
(25
|
)
|
25
|
|
391
|
|
||||||||||
|
Add back depreciation and amortization
|
1,020
|
|
1,049
|
|
1,085
|
|
1,150
|
|
1,210
|
|
||||||||||
|
Adjusted EBITDA
|
$
|
3,786
|
|
$
|
3,715
|
|
$
|
3,471
|
|
$
|
3,069
|
|
$
|
2,664
|
|
|||||
|
Adjusted EBITDA as a percent to net sales
|
13.6
|
%
|
13.4
|
%
|
13.1
|
%
|
12.3
|
%
|
11.3
|
%
|
||||||||||
18
ROIC
The Company defines ROIC as adjusted operating income as a percent to average invested capital. Average invested capital is comprised of an annual two-point (i.e., end of the previous year and the immediately preceding year) average of gross property and equipment, a capitalized value of non-capitalized leases equal to periodic annual reported net rent expense multiplied by a factor of eight and a four-point (i.e., end of each quarter within the period presented) average of other selected assets and liabilities. The calculation of the capitalized value of non-capitalized leases is consistent with industry and credit rating agency practice and the specified assets are subject to a four-point average to compensate for seasonal fluctuations.
The following is a tabular reconciliation of the non-GAAP financial measure of ROIC to operating income as a percent to property and equipment - net, which the Company believes to be the most directly comparable GAAP financial measure.
|
2013
|
2012
|
2011
|
2010
|
2009
|
||||||||||||||||
|
(millions, except percentages)
|
||||||||||||||||||||
|
Operating income
|
$
|
2,678
|
|
$
|
2,661
|
|
$
|
2,411
|
|
$
|
1,894
|
|
$
|
1,063
|
|
|||||
|
Property and equipment - net
|
$
|
8,063
|
|
$
|
8,308
|
|
$
|
8,617
|
|
$
|
9,160
|
|
$
|
9,975
|
|
|||||
|
Operating income as a percent to property and
equipment - net |
33.2
|
%
|
32.0
|
%
|
28.0
|
%
|
20.7
|
%
|
10.7
|
%
|
||||||||||
|
Operating income
|
$
|
2,678
|
|
$
|
2,661
|
|
$
|
2,411
|
|
$
|
1,894
|
|
$
|
1,063
|
|
|||||
|
Add back (deduct) impairments, store closing and
other costs, gain on sale of leases and division consolidation costs |
88
|
|
5
|
|
(25
|
)
|
25
|
|
391
|
|
||||||||||
|
Add back depreciation and amortization
|
1,020
|
|
1,049
|
|
1,085
|
|
1,150
|
|
1,210
|
|
||||||||||
|
Add back rent expense, net
|
||||||||||||||||||||
|
Real estate
|
268
|
|
258
|
|
243
|
|
235
|
|
229
|
|
||||||||||
|
Personal property
|
11
|
|
11
|
|
10
|
|
10
|
|
12
|
|
||||||||||
|
Deferred rent amortization
|
8
|
|
7
|
|
8
|
|
7
|
|
7
|
|
||||||||||
|
Adjusted operating income
|
$
|
4,073
|
|
$
|
3,991
|
|
$
|
3,732
|
|
$
|
3,321
|
|
$
|
2,912
|
|
|||||
|
Property and equipment - net
|
$
|
8,063
|
|
$
|
8,308
|
|
$
|
8,617
|
|
$
|
9,160
|
|
$
|
9,975
|
|
|||||
|
Add back accumulated depreciation and amortization
|
6,007
|
|
5,967
|
|
6,018
|
|
5,916
|
|
5,620
|
|
||||||||||
|
Add capitalized value of non-capitalized leases
|
2,296
|
|
2,208
|
|
2,088
|
|
2,016
|
|
1,984
|
|
||||||||||
|
Add (deduct) other selected assets and liabilities:
|
||||||||||||||||||||
|
Receivables
|
339
|
|
322
|
|
294
|
|
317
|
|
305
|
|
||||||||||
|
Merchandise inventories
|
6,065
|
|
5,754
|
|
5,596
|
|
5,211
|
|
5,170
|
|
||||||||||
|
Prepaid expenses and other current assets
|
398
|
|
390
|
|
409
|
|
283
|
|
231
|
|
||||||||||
|
Other assets
|
662
|
|
579
|
|
528
|
|
526
|
|
497
|
|
||||||||||
|
Merchandise accounts payable
|
(2,520
|
)
|
(2,362
|
)
|
(2,314
|
)
|
(2,085
|
)
|
(1,978
|
)
|
||||||||||
|
Accounts payable and accrued liabilities
|
(2,328
|
)
|
(2,333
|
)
|
(2,309
|
)
|
(2,274
|
)
|
(2,320
|
)
|
||||||||||
|
Total average invested capital
|
$
|
18,982
|
|
$
|
18,833
|
|
$
|
18,927
|
|
$
|
19,070
|
|
$
|
19,484
|
|
|||||
|
ROIC
|
21.5
|
%
|
21.2
|
%
|
19.7
|
%
|
17.4
|
%
|
14.9
|
%
|
||||||||||
19
Results of Operations
|
2013
|
2012 *
|
2011
|
|||||||||||||||||||||||
|
Amount
|
% to Sales
|
Amount
|
% to Sales
|
Amount
|
% to Sales
|
||||||||||||||||||||
|
(dollars in millions, except per share figures)
|
|||||||||||||||||||||||||
|
Net sales
|
$
|
27,931
|
|
$
|
27,686
|
|
$
|
26,405
|
|
||||||||||||||||
|
Increase in sales
|
0.9
|
|
%
|
4.9
|
|
%
|
|||||||||||||||||||
|
Increase in comparable sales
|
1.9
|
|
%
|
3.7
|
|
%
|
|||||||||||||||||||
|
Cost of sales
|
(16,725
|
)
|
(59.9
|
)
|
%
|
(16,538
|
)
|
(59.7
|
)
|
%
|
(15,738
|
)
|
(59.6
|
)
|
%
|
||||||||||
|
Gross margin
|
11,206
|
|
40.1
|
|
%
|
11,148
|
|
40.3
|
|
%
|
10,667
|
|
40.4
|
|
%
|
||||||||||
|
Selling, general and administrative expenses
|
(8,440
|
)
|
(30.2
|
)
|
%
|
(8,482
|
)
|
(30.7
|
)
|
%
|
(8,281
|
)
|
(31.4
|
)
|
%
|
||||||||||
|
Impairments, store closing and other costs
and gain on sale of leases |
(88
|
)
|
(0.3
|
)
|
%
|
(5
|
)
|
—
|
|
%
|
25
|
|
0.1
|
|
%
|
||||||||||
|
Operating income
|
2,678
|
|
9.6
|
|
%
|
2,661
|
|
9.6
|
|
%
|
2,411
|
|
9.1
|
|
%
|
||||||||||
|
Interest expense - net
|
(388
|
)
|
(422
|
)
|
(443
|
)
|
|||||||||||||||||||
|
Premium on early retirement of debt
|
—
|
|
(137
|
)
|
—
|
|
|||||||||||||||||||
|
Income before income taxes
|
2,290
|
|
2,102
|
|
1,968
|
|
|||||||||||||||||||
|
Federal, state and local income tax expense
|
(804
|
)
|
(767
|
)
|
(712
|
)
|
|||||||||||||||||||
|
Net income
|
$
|
1,486
|
|
5.3
|
|
%
|
$
|
1,335
|
|
4.8
|
|
%
|
$
|
1,256
|
|
4.8
|
|
%
|
|||||||
|
Diluted earnings per share
|
$
|
3.86
|
|
$
|
3.24
|
|
$
|
2.92
|
|
||||||||||||||||
|
Supplemental Non-GAAP Financial Measures
|
|||||||||||||||||||||||||
|
Comparable sales growth including the impact
of growth in comparable sales of departments licensed to third parties |
2.8
|
|
%
|
4.0
|
|
%
|
5.7
|
|
%
|
||||||||||||||||
|
Operating income, excluding certain items
|
$
|
2,766
|
|
9.9
|
|
%
|
$
|
2,666
|
|
9.6
|
|
%
|
$
|
2,386
|
|
9.0
|
|
%
|
|||||||
|
Diluted earnings per share, excluding certain items
|
$
|
4.00
|
|
$
|
3.46
|
|
$
|
2.88
|
|
||||||||||||||||
|
Adjusted EBITDA as a percent to net sales
|
13.6
|
|
%
|
13.4
|
|
%
|
13.1
|
|
%
|
||||||||||||||||
|
ROIC
|
21.5
|
|
%
|
21.2
|
|
%
|
19.7
|
|
%
|
||||||||||||||||
|
See pages 16 to 19 for a reconciliation of these non-GAAP financial measures to their most comparable GAAP financial measure and for other important information.
|
|||||||||||||||||||||||||
|
Store information (at year-end)
:
|
|||||||||||||||||||||||||
|
Stores operated
|
840
|
|
841
|
|
842
|
|
|||||||||||||||||||
|
Square footage (in millions)
|
150.1
|
|
150.6
|
|
151.9
|
|
|||||||||||||||||||
|
___________________
* 53 weeks
|
|||||||||||||||||||||||||
20
Comparison of
2013
and
2012
Net Income
Net income for
2013
increased compared to
2012
, reflecting the benefits of the key strategies at Macy's, the continued strong performance at Bloomingdale's and good expense management, including higher income from credit operations, lower depreciation and amortization expense, and gains on the sale of certain office buildings and surplus properties, partially offset by greater investments in the Company's omnichannel operations.
Net Sales
Net sales for
2013
, which had one fewer week than 2012, increased
$245 million
or
0.9%
compared to
2012
. On a comparable basis, net sales for
2013
were up 1.9% compared to
2012
. Together with sales of departments licensed to third parties,
2013
sales on a comparable basis were up 2.8%. (See page 16 for information regarding the Company's calculation of comparable sales, a reconciliation of the non-GAAP measure which takes into account sales of departments licensed to third parties to the most comparable GAAP measure and other important information). The Company continues to benefit from the successful execution of the My Macy's localization, Omnichannel and Magic Selling strategies. Geographically, sales in
2013
were strongest in the southern regions. By family of business, sales in
2013
were strongest in active apparel, handbags, textiles, luggage, furniture and mattresses. Sales in
2013
were less strong in juniors. Sales of the Company's private label brands continued to be strong and represented approximately 20% of net sales in the Macy's-branded stores in
2013
.
Cost of Sales
Cost of sales for
2013
increased
$187 million
from
2012
. The cost of sales rate as a percent to net sales of
59.9%
was 20 basis points higher in
2013
, as compared to
59.7%
in
2012
, primarily due to continued growth of the omnichannel businesses and the resulting impact of free shipping. The application of the last-in, first-out (LIFO) retail inventory method did not result in the recognition of any LIFO charges or credits affecting cost of sales in either period.
Selling, General and Administrative Expenses
Selling, general and administrative (“SG&A”) expenses for
2013
decreased
$42 million
from
2012
. The SG&A rate as a percent to net sales of
30.2%
was 50 basis points lower in
2013
, as compared to
2012
, reflecting the decrease in SG&A expenses and increased net sales. SG&A expenses in
2013
benefited from higher income from credit operations, lower depreciation and amortization expense, and gains on the sale of certain office buildings and surplus properties, partially offset by greater investments in the Company's omnichannel operations. Income from credit operations was
$731 million
in 2013 as compared to
$663 million
in 2012. Depreciation and amortization expense was
$1,020 million
for 2013, compared to
$1,049 million
for 2012. 2013 included gains on the sales of office buildings and surplus properties of $79 million. Advertising expense, net of cooperative advertising allowances, was
$1,166 million
for 2013 compared to
$1,123 million
for 2012. Advertising expense, net of cooperative advertising allowances, as a percent to net sales was 4.2% for 2013 compared to 4.1% for 2012.
Impairments, Store Closing and Other Costs and Gain on Sale of Leases
Impairments, store closing and other costs and gain on sale of leases for
2013
includes costs and expenses primarily associated with cost-reduction initiatives and store closings announced in January 2014. During
2013
, these costs and expenses included $43 million of severance and other human resource-related costs, asset impairment charges of $39 million and $6 million of other related costs and expenses. Impairments, store closing and other costs and gain on sale of leases for
2012
included $4 million of asset impairment charges primarily related to the store closings announced in January 2013.
Net Interest Expense
Net interest expense for
2013
decreased
$34 million
from
2012
. Net interest expense for
2013
benefited from lower rates on outstanding borrowings as compared to
2012
.
21
Premium on Early Retirement of Debt
On
November 28, 2012
, the Company repurchased
$700 million
aggregate principal amount of its outstanding senior unsecured notes, which had a net book value of
$706 million
. The repurchased senior unsecured notes had stated interest rates ranging from
5.9%
to
7.875%
and maturities in
2015
and
2016
. The Company recorded the redemption premium and other costs related to these repurchases as additional interest expense of
$133 million
in 2012. On
March 29, 2012
, the Company redeemed the $173 million of
8.0%
senior debentures due
July 15, 2012
, as allowed under the terms of the indenture. The price for the redemption was calculated pursuant to the indenture and resulted in the recognition of additional interest expense of
$4 million
in 2012. The additional interest expense resulting from these transactions is presented as premium on early retirement of debt on the Consolidated Statements of Income.
Effective Tax Rate
The Company's effective tax rate of
35.1%
for
2013
and
36.5%
for
2012
differ from the federal income tax statutory rate of 35%, and on a comparative basis, principally because of the effect of state and local income taxes, including the settlement of various tax issues and tax examinations. Additionally, income tax expense for 2013 benefited from historic rehabilitation tax credits and a reduction in the valuation allowance related primarily to state net operating loss carryforwards.
Comparison of
2012
and
2011
Net Income
Net income for
2012
increased compared to
2011
, reflecting the benefits of the key strategies at Macy's, the continued strong performance at Bloomingdale's, higher income from credit operations, and the 53rd week in 2012.
Net Sales
Net sales for
2012
, which had one additional week compared to 2011, increased
$1,281 million
or
4.9%
compared to
2011
. On a comparable basis, net sales for
2012
were up 3.7% compared to
2011
. Together with sales of departments licensed to third parties,
2012
sales on a comparable basis were up 4.0%. (See page 16 for information regarding the Company's calculation of comparable sales, a reconciliation of the non-GAAP measure which takes into account sales of departments licensed to third parties to the most comparable GAAP measure and other important information). The Company continued to benefit from the successful execution of the My Macy's localization, Omnichannel and Magic Selling strategies. Geographically, sales in
2012
were strongest in the southern regions as well as some markets in other parts of the country such as Western New York, Oregon and Colorado. By family of business, sales in
2012
were strongest in watches, handbags, cosmetics, textiles, furniture and mattresses. Sales in
2012
were less strong in juniors. Sales of the Company's private label brands continued to be strong with particular growth coming from millennial, classic apparel and home textile brands. Sales of the Company's private label brands represented approximately 20% of net sales in the Macy's-branded stores in
2012
.
Cost of Sales
Cost of sales for
2012
increased
$800 million
from
2011
. The cost of sales rate as a percent to net sales of
59.7%
was 10 basis points higher in
2012
, as compared to
59.6%
in
2011
, primarily due to the growth of the omnichannel businesses and the resulting impact of free shipping. The application of the last-in, first-out (LIFO) retail inventory method did not result in the recognition of any LIFO charges or credits affecting cost of sales in either period.
SG&A Expenses
SG&A expenses for
2012
increased
$201 million
from
2011
. The SG&A rate as a percent to net sales of
30.7%
was 70 basis points lower in
2012
, as compared to
2011
, reflecting increased net sales. SG&A expenses in
2012
were impacted by higher selling costs as a result of stronger sales, higher retirement expenses (including Pension Plan, SERP and 401(k) expenses), and greater investments in the Company's omnichannel operations, partially offset by higher income from credit operations and lower depreciation and amortization expense. Retirement expenses were $232 million in 2012 as compared to $160 million in 2011, primarily due to the lower discount rate. Advertising expense, net of cooperative advertising allowances, was
$1,123 million
for
2012
compared to
$1,060 million
for
2011
. Advertising expense, net of cooperative advertising allowances, as a percent to net sales was 4.3% for both
2012
and
2011
. Income from credit operations was $663 million in
2012
as compared to $582 million in
2011
. Depreciation and amortization expense was
$1,049 million
for
2012
, compared to
$1,085 million
for
2011
.
22
Impairments, Store Closing and Other Costs and Gain on Sale of Leases
Impairments, store closing and other costs and gain on sale of leases for
2012
included $4 million of asset impairment charges primarily related to the store closings announced in January 2013. Impairments and store closing and other costs and gain on sale of leases for
2011
included a $54 million gain from the sale of store leases related to the 2006 divestiture of Lord & Taylor, partially offset by $22 million of asset impairment charges primarily related to the store closings announced in January 2012 and $7 million of other costs and expenses primarily related to the announced store closings.
Net Interest Expense
Net interest expense for
2012
decreased
$21 million
from
2011
. Net interest expense for
2012
benefited from lower levels of borrowings and lower rates on outstanding borrowings as compared to
2011
.
Premium on Early Retirement of Debt
On
November 28, 2012
, the Company repurchased
$700 million
aggregate principal amount of its outstanding senior unsecured notes, which had a net book value of
$706 million
. The repurchased senior unsecured notes had stated interest rates ranging from
5.9%
to
7.875%
and maturities in
2015
and
2016
. The Company recorded the redemption premium and other costs related to these repurchases as additional interest expense of
$133 million
in 2012. On
March 29, 2012
, the Company redeemed the $173 million of
8.0%
senior debentures due
July 15, 2012
, as allowed under the terms of the indenture. The price for the redemption was calculated pursuant to the indenture and resulted in the recognition of additional interest expense of
$4 million
in 2012. The additional interest expense resulting from these transactions is presented as premium on early retirement of debt on the Consolidated Statements of Income.
Effective Tax Rate
The Company's effective tax rate of
36.5%
for
2012
and
36.2%
for
2011
differ from the federal income tax statutory rate of 35%, and on a comparative basis, principally because of the effect of state and local income taxes, including the settlement of various tax issues and tax examinations.
Guidance
Based on its assessment of current and anticipated market conditions and its recent performance, the Company's 2014 assumptions include:
|
•
|
Comparable sales increase in 2014 of approximately 2.5% to 3% from 2013 levels;
|
|
•
|
Diluted earnings per share of $4.40 to $4.50; and
|
|
•
|
Capital expenditures of approximately $1,050 million.
|
The Company's budgeted capital expenditures are primarily related to store remodels, maintenance, the continued renovation of Macy's Herald Square, technology and omnichannel investments, and distribution network improvements, including a new direct to customer fulfillment center in Tulsa County, OK. The Company has announced that in 2014 it intends to open new Macy's stores in the Bronx, NY; Sarasota, FL; Las Vegas, NV; and a Bloomingdale's replacement store in Palo Alto, CA. Additionally, the Company has announced that in 2015 it intends to open a new Macy's store in Ponce, Puerto Rico and a new Bloomingdale's store in Honolulu, HI, and in 2016 it intends to open a new Macy's store and a new Bloomingdale's store in Miami, FL. Management presently anticipates funding such expenditures with cash on hand and cash from operations.
Liquidity and Capital Resources
The Company's principal sources of liquidity are cash from operations, cash on hand and the credit facility described below.
Operating Activities
Net cash provided by operating activities was
$2,549 million
in
2013
compared to
$2,179 million
in
2012
, reflecting higher net income and no pension funding contribution in
2013
. During 2012, the Company made a pension funding contribution totaling $150 million.
23
Investing Activities
Net cash used by investing activities for
2013
was
$788 million
, compared to net cash used by investing activities of
$781 million
for
2012
. Investing activities for
2013
includes purchases of property and equipment totaling
$607 million
and capitalized software of
$256 million
, compared to purchases of property and equipment totaling
$698 million
and capitalized software of
$244 million
for
2012
. Cash flows from investing activities included
$132 million
and
$66 million
from the disposition of property and equipment for
2013
and
2012
, respectively. At
February 1, 2014
, the Company had approximately
$50 million
of cash in a qualified escrow account, included in prepaid expenses and other current assets, to be utilized for potential tax deferred like-kind exchange transactions.
During 2013, the Company opened three new Macy's stores, one Macy's replacement store, one new Bloomingdale's store and one new Bloomingdale's Outlet store. During 2012, the Company opened two new Macy's stores and five new Bloomingdale's Outlet stores. Also during 2012 the Company opened its new 1.3 million square foot fulfillment center in Martinsburg, WV.
Financing Activities
Net cash used by the Company for financing activities was
$1,324 million
for
2013
, including the acquisition of the Company's common stock under its share repurchase program at an approximate cost of $1,570 million, the repayment of
$124 million
of debt and the payment of
$359 million
of cash dividends, partially offset by the issuance of
$400 million
of debt, the issuance of
$315 million
of common stock, primarily related to the exercise of stock options, and an increase in outstanding checks of
$24 million
. $400 million of 4.375% senior notes due 2023 were issued in 2013 and the debt repaid during 2013 included $109 million of 7.625% senior debentures due August 15, 2013 paid at maturity.
Net cash used by the Company for financing activities was
$2,389 million
for
2012
and included the acquisition of the Company's common stock under its share repurchase program at an approximate cost of $1,350 million, the repayment of
$1,803 million
of debt, the payment of
$324 million
of cash dividends and a decrease in outstanding checks of
$88 million
, partially offset by the issuance of
$1,000 million
of debt and the issuance of
$234 million
of common stock, primarily related to the exercise of stock options.
On
November 28, 2012
, the Company repurchased
$700 million
aggregate principal amount of its outstanding senior unsecured notes, which had a net book value of
$706 million
. The repurchased senior unsecured notes had stated interest rates ranging from
5.9%
to
7.875%
and maturities in
2015
and
2016
. The Company recorded the redemption premium and other costs related to these repurchases as additional interest expense of
$133 million
in 2012. On
March 29, 2012
, the Company redeemed the $173 million of
8.0%
senior debentures due
July 15, 2012
, as allowed under the terms of the indenture. The price for the redemption was calculated pursuant to the indenture and resulted in the recognition of additional interest expense of
$4 million
in 2012. On
November 20, 2012
, the Company issued
$750 million
aggregate principal amount of
2.875%
senior unsecured notes due
2023
and
$250 million
aggregate principal amount of
4.3%
senior unsecured notes due
2043
. This debt was used to pay for the notes repurchased on
November 28, 2012
described above, and to retire
$298 million
of
5.875%
senior unsecured notes that matured in January 2013. The debt repaid in 2012 also included $616 million of 5.35% senior notes at maturity. Through these transactions, the Company improved its debt maturity profile, decreased its ongoing interest expense by taking advantage of the current low interest rate environment and reduced its refinancing and interest rate risk.
The Company entered into a new credit agreement with certain financial institutions on May 10, 2013 providing for revolving credit borrowings and letters of credit in an aggregate amount not to exceed $1,500 million (which may be increased to $1,750 million at the option of the Company, subject to the willingness of existing or new lenders to provide commitments for such additional financing) outstanding at any particular time. The agreement is set to expire May 10, 2018 and replaced the prior agreement which was set to expire June 20, 2015. As of
February 1, 2014
and throughout all of
2013
, the Company had no borrowings outstanding under its then existing credit agreements.
24
The credit agreement requires the Company to maintain a specified interest coverage ratio for the latest four quarters of no less than 3.25 and a specified leverage ratio as of and for the latest four quarters of no more than 3.75. The Company's interest coverage ratio for
2013
was
9.40
and its leverage ratio at
February 1, 2014
was
1.85
, in each case as calculated in accordance with the credit agreement. The interest coverage ratio is defined as EBITDA over net interest expense and the leverage ratio is defined as debt over EBITDA. For purposes of these calculations EBITDA is calculated as net income plus interest expense, taxes, depreciation, amortization, non-cash impairment of goodwill, intangibles and real estate, non-recurring cash charges not to exceed in the aggregate $400 million and extraordinary losses less interest income and non-recurring or extraordinary gains. Debt is adjusted to exclude the premium on acquired debt and net interest is adjusted to exclude the amortization of premium on acquired debt and premium on early retirement of debt.
A breach of a restrictive covenant in the Company's credit agreement or the inability of the Company to maintain the financial ratios described above could result in an event of default under the credit agreement. In addition, an event of default would occur under the credit agreement if any indebtedness of the Company in excess of an aggregate principal amount of $150 million becomes due prior to its stated maturity or the holders of such indebtedness become able to cause it to become due prior to its stated maturity. Upon the occurrence of an event of default, the lenders could, subject to the terms and conditions of the credit agreement, elect to declare the outstanding principal, together with accrued interest, to be immediately due and payable.
Moreover, most of the Company's senior notes and debentures contain cross-default provisions based on the non-payment at maturity, or other default after an applicable grace period, of any other debt, the unpaid principal amount of which is not less than $100 million, that could be triggered by an event of default under the credit agreement. In such an event, the Company's senior notes and debentures that contain cross-default provisions would also be subject to acceleration.
At
February 1, 2014
, no notes or debentures contain provisions requiring acceleration of payment upon a debt rating downgrade. However, the terms of approximately $3,700 million in aggregate principal amount of the Company's senior notes outstanding at that date require the Company to offer to purchase such notes at a price equal to 101% of their principal amount plus accrued and unpaid interest in specified circumstances involving both a change of control (as defined in the applicable indenture) of the Company and the rating of the notes by specified rating agencies at a level below investment grade.
The rate of interest payable in respect of $407 million in aggregate principal amount of the Company's 7.875% senior notes outstanding at
February 1, 2014
could increase by up to 2.0 percent per annum from its current level in the event of two or more downgrades of the notes by specified rating agencies.
The Company's board of directors approved an additional authorization to purchase Common Stock of
$1,500 million
on May 15, 2013. During
2013
, the Company repurchased approximately
33.6 million
shares of its common stock for a total of
$1,570 million
. As of
February 1, 2014
, the Company had
$1,432 million
of authorization remaining under its share repurchase program. The Company may continue or, from time to time, suspend repurchases of shares under its share repurchase program, depending on prevailing market conditions, alternate uses of capital and other factors.
On February 28, 2014, the Company's board of directors declared a quarterly dividend of 25 cents per share on its common stock, payable April 1, 2014 to Macy's shareholders of record at the close of business on March 14, 2014.
25
Contractual Obligations and Commitments
At
February 1, 2014
, the Company had contractual obligations (within the scope of Item 303(a)(5) of Regulation S-K) as follows:
|
|
Obligations Due, by Period
|
||||||||||||||||||
|
Total
|
Less than
1 Year
|
1 – 3
Years
|
3 – 5
Years
|
More than
5 Years
|
|||||||||||||||
|
(millions)
|
|||||||||||||||||||
|
Short-term debt
|
$
|
461
|
|
$
|
461
|
|
$
|
—
|
|
$
|
—
|
|
$
|
—
|
|
||||
|
Long-term debt
|
6,522
|
|
—
|
|
1,123
|
|
312
|
|
5,087
|
|
|||||||||
|
Interest on debt
|
4,909
|
|
398
|
|
712
|
|
581
|
|
3,218
|
|
|||||||||
|
Capital lease obligations
|
62
|
|
4
|
|
6
|
|
6
|
|
46
|
|
|||||||||
|
Operating leases
|
2,920
|
|
282
|
|
477
|
|
386
|
|
1,775
|
|
|||||||||
|
Letters of credit
|
34
|
|
34
|
|
—
|
|
—
|
|
—
|
|
|||||||||
|
Other obligations
|
4,548
|
|
3,047
|
|
475
|
|
292
|
|
734
|
|
|||||||||
|
$
|
19,456
|
|
$
|
4,226
|
|
$
|
2,793
|
|
$
|
1,577
|
|
$
|
10,860
|
|
|||||
“Other obligations” in the foregoing table includes post employment and postretirement benefits, self-insurance reserves, group medical/dental/life insurance programs, merchandise purchase obligations and obligations under outsourcing arrangements, construction contracts, energy and other supply agreements identified by the Company and liabilities for unrecognized tax benefits that the Company expects to settle in cash in the next year. The Company's merchandise purchase obligations fluctuate on a seasonal basis, typically being higher in the summer and early fall and being lower in the late winter and early spring. The Company purchases a substantial portion of its merchandise inventories and other goods and services otherwise than through binding contracts. Consequently, the amounts shown as “Other obligations” in the foregoing table do not reflect the total amounts that the Company would need to spend on goods and services in order to operate its businesses in the ordinary course.
The Company has not included in the contractual obligations table
$147 million
of long-term liabilities for unrecognized tax benefits for various tax positions taken or
$51 million
of related accrued federal, state and local interest and penalties. These liabilities may increase or decrease over time as a result of tax examinations, and given the status of examinations, the Company cannot reliably estimate the period of any cash settlement with the respective taxing authorities. The Company has included in the contractual obligations table
$31 million
of liabilities for unrecognized tax benefits that the Company expects to settle in cash in the next year.
Liquidity and Capital Resources Outlook
Management believes that, with respect to the Company's current operations, cash on hand and funds from operations, together with its credit facility and other capital resources, will be sufficient to cover the Company's reasonably foreseeable working capital, capital expenditure and debt service requirements and other cash requirements in both the near term and over the longer term. The Company's ability to generate funds from operations may be affected by numerous factors, including general economic conditions and levels of consumer confidence and demand; however, the Company expects to be able to manage its working capital levels and capital expenditure amounts so as to maintain sufficient levels of liquidity. To the extent that the Company's cash balances from time to time exceed amounts that are needed to fund its immediate liquidity requirements, the Company will consider alternative uses of some or all of such excess cash. Such alternative uses may include, among others, the redemption or repurchase of debt, equity or other securities through open market purchases, privately negotiated transactions or otherwise, and the funding of pension related obligations. Depending upon its actual and anticipated sources and uses of liquidity, conditions in the capital markets and other factors, the Company will from time to time consider the issuance of debt or other securities, or other possible capital markets transactions, for the purpose of raising capital which could be used to refinance current indebtedness or for other corporate purposes including the redemption or repurchase of debt, equity or other securities through open market purchases, privately negotiated transactions or otherwise, and the funding of pension related obligations.
The Company intends from time to time to consider additional acquisitions of, and investments in, retail businesses and other complementary assets and companies. Acquisition transactions, if any, are expected to be financed from one or more of the following sources: cash on hand, cash from operations, borrowings under existing or new credit facilities and the issuance of long-term debt or other securities, including common stock.
26
Critical Accounting Policies
Merchandise Inventories
Merchandise inventories are valued at the lower of cost or market using the last-in, first-out (LIFO) retail inventory method. Under the retail inventory method, inventory is segregated into departments of merchandise having similar characteristics, and is stated at its current retail selling value. Inventory retail values are converted to a cost basis by applying specific average cost factors for each merchandise department. Cost factors represent the average cost-to-retail ratio for each merchandise department based on beginning inventory and the fiscal year purchase activity. At
February 1, 2014
and
February 2, 2013
, merchandise inventories valued at LIFO, including adjustments as necessary to record inventory at the lower of cost or market, approximated the cost of such inventories using the first-in, first-out (FIFO) retail inventory method. The application of the LIFO retail inventory method did not result in the recognition of any LIFO charges or credits affecting cost of sales for
2013
,
2012
or
2011
. The retail inventory method inherently requires management judgments and estimates, such as the amount and timing of permanent markdowns to clear unproductive or slow-moving inventory, which may impact the ending inventory valuation as well as gross margins.
Permanent markdowns designated for clearance activity are recorded when the utility of the inventory has diminished. Factors considered in the determination of permanent markdowns include current and anticipated demand, customer preferences, age of the merchandise and fashion trends. When a decision is made to permanently mark down merchandise, the resulting gross profit reduction is recognized in the period the markdown is recorded.
Physical inventories are generally taken within each merchandise department annually, and inventory records are adjusted accordingly, resulting in the recording of actual shrinkage. Physical inventories are taken at all store locations for substantially all merchandise categories approximately three weeks before the end of the fiscal year. Shrinkage is estimated as a percentage of sales at interim periods and for this approximate three-week period, based on historical shrinkage rates. While it is not possible to quantify the impact from each cause of shrinkage, the Company has loss prevention programs and policies that are intended to minimize shrinkage, including the use of radio frequency devices and interim inventories to keep the Company's merchandise files accurate.
The Company receives certain allowances as reimbursement for markdowns taken and/or to support the gross margins earned in connection with the sales of merchandise. These allowances are generally credited to cost of sales at the time the merchandise is sold in accordance with ASC Subtopic 605-50, “Customer Payments and Incentives.” The Company also receives advertising allowances from approximately 1,000 of its merchandise vendors pursuant to cooperative advertising programs, with some vendors participating in multiple programs. These allowances represent reimbursements by vendors of costs incurred by the Company to promote the vendors' merchandise and are netted against advertising and promotional costs when the related costs are incurred in accordance with ASC Subtopic 605-50. Advertising allowances in excess of costs incurred are recorded as a reduction of merchandise costs. The arrangements pursuant to which the Company's vendors provide allowances, while binding, are generally informal in nature and one year or less in duration. The terms and conditions of these arrangements vary significantly from vendor to vendor and are influenced by, among other things, the type of merchandise to be supported. Although it is highly unlikely that there will be any significant reduction in historical levels of vendor support, if such a reduction were to occur, the Company could experience higher costs of sales and higher advertising expense, or reduce the amount of advertising that it uses, depending on the specific vendors involved and market conditions existing at the time.
Long-Lived Asset Impairment and Restructuring Charges
The carrying values of long-lived assets are periodically reviewed by the Company whenever events or changes in circumstances indicate that the carrying value may not be recoverable, such as historical operating losses or plans to close stores before the end of their previously estimated useful lives. Additionally, on an annual basis, the recoverability of the carrying values of individual stores are evaluated. A potential impairment has occurred if projected future undiscounted cash flows are less than the carrying value of the assets. The estimate of cash flows includes management's assumptions of cash inflows and outflows directly resulting from the use of those assets in operations. When a potential impairment has occurred, an impairment write-down is recorded if the carrying value of the long-lived asset exceeds its fair value. The Company believes its estimated cash flows are sufficient to support the carrying value of its long-lived assets. If estimated cash flows significantly differ in the future, the Company may be required to record asset impairment write-downs.
27
If the Company commits to a plan to dispose of a long-lived asset before the end of its previously estimated useful life, estimated cash flows are revised accordingly, and the Company may be required to record an asset impairment write-down. Additionally, related liabilities arise such as severance, contractual obligations and other accruals associated with store closings from decisions to dispose of assets. The Company estimates these liabilities based on the facts and circumstances in existence for each restructuring decision. The amounts the Company will ultimately realize or disburse could differ from the amounts assumed in arriving at the asset impairment and restructuring charge recorded.
The Company classifies certain long-lived assets as held for disposal by sale and ceases depreciation when the particular criteria for such classification are met, including the probable sale within one year. For long-lived assets to be disposed of by sale, an impairment charge is recorded if the carrying amount of the asset exceeds its fair value less costs to sell. Such valuations include estimations of fair values and incremental direct costs to transact a sale.
Income Taxes
Income taxes are estimated based on the tax statutes, regulations and case law of the various jurisdictions in which the Company operates. Deferred income tax assets and liabilities are recognized for the future tax consequences attributable to differences between the financial statement carrying amounts of existing assets and liabilities and their respective tax bases, and net operating loss and tax credit carryforwards. Deferred income tax assets and liabilities are measured using enacted tax rates expected to apply to taxable income in the years in which those temporary differences are expected to be recovered or settled. Deferred income tax assets are evaluated for recoverability based on all available evidence, including past operating results, estimates of future taxable income, and the feasibility of tax planning strategies. Deferred income tax assets are reduced by a valuation allowance when it is more likely than not that some portion of the deferred income tax assets will not be realized.
Uncertain tax positions are recognized if the weight of available evidence indicates that it is more likely than not that the tax position will be sustained on examination, including resolution of any related appeals or litigation processes, based on the technical merits of the position. Uncertain tax positions meeting the more-likely-than-not recognition threshold are then measured to determine the amount of benefit eligible for recognition in the financial statements. Each uncertain tax position is measured at the largest amount of benefit that is more likely than not to be realized upon ultimate settlement. Uncertain tax positions are evaluated and adjusted as appropriate, while taking into account the progress of audits of various taxing jurisdictions. The Company does not anticipate that resolution of these matters will have a material impact on the Company's consolidated financial position, results of operations or cash flows.
Significant judgment is required in evaluating the Company's uncertain tax positions, provision for income taxes, and any valuation allowance recorded against deferred tax assets. Although the Company believes that its judgments are reasonable, no assurance can be given that the final tax outcome of these matters will not be different from that which is reflected in the Company's historical income provisions and accruals.
Self-Insurance Reserves
The Company, through its insurance subsidiary, is self-insured for workers' compensation and general liability claims up to certain maximum liability amounts. Although the amounts accrued are actuarially determined by third parties based on analysis of historical trends of losses, settlements, litigation costs and other factors, the amounts the Company will ultimately disburse could differ from such accrued amounts.
Pension and Supplementary Retirement Plans
The Company has a funded defined benefit pension plan (the “Pension Plan”) and an unfunded defined benefit supplementary retirement plan (the “SERP”). The Company accounts for these plans in accordance with ASC Topic 715, “Compensation - Retirement Benefits.” Under ASC Topic 715, an employer recognizes the funded status of a defined benefit postretirement plan as an asset or liability on the balance sheet and recognizes changes in that funded status in the year in which the changes occur through comprehensive income. Additionally, pension expense is generally recognized on an accrual basis over employees' approximate service periods. The pension expense calculation is generally independent of funding decisions or requirements.
In February 2013, the Company announced changes to the Pension Plan and SERP whereby eligible employees no longer earn future pension service credits after December 31, 2013, with limited exceptions. All retirement benefits attributable to service in subsequent periods will be provided through defined contribution plans. As a result of these changes, the Company recognized reductions in the projected benefit obligations of the Pension Plan of $254 million and the SERP of $42 million as of February 2, 2013.
28
The Pension Protection Act of 2006 provides the funding requirements for the Pension Plan which are different from the employer's accounting for the plan as outlined in ASC Topic 715. No funding contributions were required, and the Company made no funding contributions to the Pension Plan in 2013. As of the date of this report, the Company does not anticipate making funding contributions to the Pension Plan in 2014. Management believes that, with respect to the Company's current operations, cash on hand and funds from operations, together with available borrowing under its credit facility and other capital resources, will be sufficient to cover the Company's Pension Plan cash requirements in both the near term and also over the longer term.
At
February 1, 2014
, the Company had unrecognized actuarial losses of
$931 million
for the Pension Plan and
$176 million
for the SERP. The unrecognized losses for the Pension Plan and the SERP will be recognized as a component of pension expense in future years in accordance with ASC Topic 715, and is expected to impact
2014
Pension and SERP income by approximately $31 million. The Company generally amortizes unrecognized gains and losses on a straight-line basis over the average remaining lifetime of participants using the corridor approach.
The calculation of pension expense and pension liabilities requires the use of a number of assumptions. Changes in these assumptions can result in different expense and liability amounts, and future actual experience may differ significantly from current expectations. The Company believes that the most critical assumptions relate to the long-term rate of return on plan assets (in the case of the Pension Plan), the discount rate used to determine the present value of projected benefit obligations and the weighted average rate of increase of future compensation levels.
As of February 2, 2013, the Company lowered the assumed annual long-term rate of return for the Pension Plan's assets from 8.00% to 7.50% based on expected future returns on the portfolio. The Company develops its expected long-term rate of return assumption by evaluating input from several professional advisors taking into account the asset allocation of the portfolio and long-term asset class return expectations, as well as long-term inflation assumptions. Pension expense increases or decreases as the expected rate of return on the assets of the Pension Plan decreases or increases, respectively. Lowering or raising the expected long-term rate of return on the Pension Plan's assets by 0.25% would increase or decrease the estimated
2014
pension expense by approximately $8 million.
The Company discounted its future pension obligations using a rate of 4.50% at
February 1, 2014
, compared to 4.15% at
February 2, 2013
. The discount rate used to determine the present value of the Company's Pension Plan and SERP obligations is based on a yield curve constructed from a portfolio of high quality corporate debt securities with various maturities. Each year's expected future benefit payments are discounted to their present value at the appropriate yield curve rate, thereby generating the overall discount rate for Pension Plan and SERP obligations. As the discount rate is reduced or increased, pension liability would increase or decrease, respectively, and future pension expense would decrease or increase, respectively. Lowering the discount rate by 0.25% (from 4.50% to 4.25%) would increase the projected benefit obligation at
February 1, 2014
by approximately $99 million and would decrease estimated
2014
pension expense by approximately $2 million. Increasing the discount rate by 0.25% (from 4.50% to 4.75%) would decrease the projected benefit obligation at
February 1, 2014
by approximately $92 million and would increase estimated
2014
pension expense by approximately $2 million.
The assumed weighted average rate of increase in future compensation levels was 4.1% at
February 1, 2014
and 4.5% at
February 2, 2013
for the Pension Plan, and 4.9% at
February 2, 2013
for the SERP. The Company develops its rate of compensation increase assumption based on recent experience and reflects an estimate of future compensation levels taking into account general increase levels, seniority, promotions and other factors. Pension liabilities and future pension expense both increase or decrease as the weighted average rate of increase of future compensation levels is increased or decreased, respectively. Increasing or decreasing the assumed weighted average rate of increase of future compensation levels by 0.25% would increase or decrease the projected benefit obligation at
February 1, 2014
by approximately $1 million and the change to estimated
2014
pension expense would be less than $1 million.
New Pronouncements
The Company does not anticipate that the adoption of recent accounting pronouncements will have a material impact on the Company's consolidated financial position, results of operations or cash flows.
29
|
Item 7A.
|
Quantitative and Qualitative Disclosures About Market Risk.
|
The Company is exposed to market risk from changes in interest rates that may adversely affect its financial position, results of operations and cash flows. In seeking to minimize the risks from interest rate fluctuations, the Company manages exposures through its regular operating and financing activities and, when deemed appropriate, through the use of derivative financial instruments. The Company does not use financial instruments for trading or other speculative purposes and is not a party to any leveraged financial instruments.
The Company is exposed to interest rate risk through its borrowing activities, which are described in Note 6 to the Consolidated Financial Statements. All of the Company’s borrowings are under fixed rate instruments. However, the Company, from time to time, may use interest rate swap and interest rate cap agreements to help manage its exposure to interest rate movements and reduce borrowing costs. At
February 1, 2014
, the Company was not a party to any derivative financial instruments and based on the Company’s lack of market risk sensitive instruments outstanding at
February 1, 2014
, the Company has determined that there was no material market risk exposure to the Company’s consolidated financial position, results of operations or cash flows as of such date.
|
Item 8.
|
Consolidated Financial Statements and Supplementary Data.
|
Information called for by this item is set forth in the Company’s Consolidated Financial Statements and supplementary data contained in this report and is incorporated herein by this reference. Specific financial statements and supplementary data can be found at the pages listed in the following index:
30
INDEX
|
|
Page
|
|
Consolidated Statements of Comprehensive Income for the fiscal years ended
February 1, 2014, February 2, 2013 and January 28, 2012 |
|
|
Consolidated Statements of Changes in Shareholders’ Equity for the fiscal years ended
February 1, 2014, February 2, 2013 and January 28, 2012 |
|
|
Consolidated Statements of Cash Flows for the fiscal years ended
February 1, 2014, February 2, 2013 and January 28, 2012 |
|
31
|
Item 9.
|
Changes in and Disagreements with Accountants on Accounting and Financial Disclosure.
|
None.
|
Item 9A.
|
Controls and Procedures.
|
a. Disclosure Controls and Procedures
The Company’s Chief Executive Officer and Chief Financial Officer have carried out, as of
February 1, 2014
, with the participation of the Company’s management, an evaluation of the effectiveness of the Company’s disclosure controls and procedures, as defined in Rule 13a-15(e) under the Exchange Act. Based upon this evaluation, the Chief Executive Officer and Chief Financial Officer have concluded that the Company’s disclosure controls and procedures are effective to provide reasonable assurance that information required to be disclosed by the Company in reports the Company files under the Exchange Act is recorded, processed, summarized and reported, within the time periods specified in the SEC rules and forms, and that information required to be disclosed by the Company in the reports the Company files or submits under the Exchange Act is accumulated and communicated to the Company’s management, including its Chief Executive Officer and Chief Financial Officer, as appropriate to allow timely decisions regarding required disclosure.
b. Management’s Report on Internal Control over Financial Reporting
The Company’s management is responsible for establishing and maintaining adequate internal control over financial reporting, as defined in Exchange Act Rule 13a-15(f). The Company’s management conducted an assessment of the Company’s internal control over financial reporting based on the framework established by the Committee of Sponsoring Organizations of the Treadway Commission in
Internal Control – Integrated Framework
. Based on this assessment, the Company’s management has concluded that, as of
February 1, 2014
, the Company’s internal control over financial reporting is effective.
The Company’s independent registered public accounting firm, KPMG LLP, has audited the effectiveness of the Company’s internal control over financial reporting as of
February 1, 2014
and has issued an attestation report expressing an unqualified opinion on the effectiveness of the Company’s internal control over financial reporting, as stated in their report located on page F-3.
c. Changes in Internal Control over Financial Reporting
There were no changes in the Company’s internal controls over financial reporting that occurred during the Company’s most recently completed fiscal quarter that materially affected, or are reasonably likely to materially affect, the Company’s internal control over financial reporting.
d. Certifications
The certifications of the Company’s Chief Executive Officer and Chief Financial Officer required under Section 302 of the Sarbanes-Oxley Act are filed as Exhibits 31.1 and 31.2 to this report. Additionally, in
2013
the Company’s Chief Executive Officer certified to the NYSE that he was not aware of any violation by the Company of the NYSE corporate governance listing standards.
|
Item 10.
|
Directors, Executive Officers and Corporate Governance.
|
Information called for by this item is set forth under “Item 1 – Election of Directors” and “Further Information Concerning the Board of Directors – Committees of the Board” and “Section 16(a) Beneficial Ownership Reporting Compliance” in the Proxy Statement to be delivered to stockholders in connection with our 2014 Annual Meeting of Shareholders (the “Proxy Statement”), and “Item 1. Business – Executive Officers of the Registrant” in this report and incorporated herein by reference.
|
Item 11.
|
Executive Compensation.
|
Information called for by this item is set forth under “Compensation Discussion & Analysis,” “Compensation of the Named Executives for
2013
,” “Compensation Committee Report” and “Compensation Committee Interlocks and Insider Participation” in the Proxy Statement and incorporated herein by reference.
32
|
Item 12.
|
Security Ownership of Certain Beneficial Owners and Management and Related Stockholder Matters.
|
Information called for by this item is set forth under “Stock Ownership – Certain Beneficial Owners” and “Stock Ownership – Stock Ownership of Directors and Executive Officers” in the Proxy Statement and incorporated herein by reference.
|
Item 13.
|
Certain Relationships and Related Transactions, and Director Independence.
|
Information called for by this item is set forth under “Further Information Concerning the Board of Directors – Director Independence” and “Policy on Related Person Transactions” in the Proxy Statement and incorporated herein by reference.
|
Item 14.
|
Principal Accountant Fees and Services.
|
Information called for by this item is set forth under “Item 2 – Appointment of Independent Registered Public Accounting Firm” in the Proxy Statement and incorporated herein by reference.
33
|
Item 15.
|
Exhibits and Financial Statement Schedules.
|
(a) The following documents are filed as part of this report:
1.
Financial Statements:
The list of financial statements required by this item is set forth in Item 8 “Consolidated Financial Statements and Supplementary Data” and is incorporated herein by reference.
2.
Financial Statement Schedules:
All schedules are omitted because they are inapplicable, not required, or the information is included elsewhere in the Consolidated Financial Statements or the notes thereto.
3.
Exhibits:
|
Exhibit
Number
|
Description
|
Document if Incorporated by Reference
|
||
|
3.1
|
Amended and Restated Certificate of Incorporation
|
Exhibit 3.1 to the Company's Current Report on Form 8-K filed on May 18, 2010
|
||
|
3.1.1
|
Certificate of Designations of Series A Junior Participating Preferred Stock
|
Exhibit 3.1.1 to the Company's Annual Report on
Form 10-K (File No. 1-13536) for the fiscal year ended January 28, 1995
|
||
|
3.1.2
|
Article Seventh of the Amended and Restated Certificate of Incorporation
|
Exhibit 3.1 to the Company's Current Report on Form 8-K filed on May 24, 2011 (the “May 24, 2011 Form 8-K”)
|
||
|
3.2
|
Amended and Restated By-Laws
|
Exhibit 3.2 to the May 24, 2011 Form 8-K
|
||
|
4.1
|
Amended and Restated Certificate of Incorporation
|
See Exhibits 3.1, 3.1.1 and 3.1.2
|
||
|
4.2
|
Amended and Restated By-Laws
|
See Exhibit 3.2
|
||
|
4.3
|
Indenture, dated as of January 15, 1991, among the Company (as successor to The May Department Stores Company (“May Delaware”)), Macy's Retail Holdings, Inc. (“Macy's Retail”) (f/k/a The May Department Stores Company (NY) or “May New York”) and The Bank of New York Mellon Trust Company, N.A. (“BNY Mellon”, successor to J.P. Morgan Trust Company and as successor to The First National Bank of Chicago), as Trustee (the “1991 Indenture”)
|
Exhibit 4(2) to May New York’s Current Report on Form 8-K filed on January 15, 1991
|
||
|
4.3.1
|
Guarantee of Securities, dated as of August 30, 2005, by the Company relating to the 1991 Indenture
|
Exhibit 10.13 to the Company's Current Report on
Form 8-K filed on August 30, 2005 (the “August 30, 2005 Form 8-K”)
|
||
|
4.4
|
Indenture, dated as of December 15, 1994, between the Company and U.S. Bank National Association (successor to State Street Bank and Trust Company and The First National Bank of Boston), as Trustee (the “1994 Indenture”)
|
Exhibit 4.1 to the Company's Registration Statement on Form S-3 (Registration No. 33-88328) filed on January 9, 1995
|
||
|
4.4.1
|
Eighth Supplemental Indenture to the 1994 Indenture, dated as of July 14, 1997, between the Company and U.S. Bank National Association (successor to State Street Bank and Trust Company and The First National Bank of Boston), as Trustee
|
Exhibit 2 to the Company's Current Report on Form 8-K filed on July 15, 1997 (the “July 15, 1997 Form 8-K”)
|
||
34
|
Exhibit
Number
|
Description
|
Document if Incorporated by Reference
|
||
|
4.4.2
|
Ninth Supplemental Indenture to the 1994 Indenture, dated as of July 14, 1997, between the Company and U.S. Bank National Association (successor to State Street Bank and Trust Company and The First National Bank of Boston), as Trustee
|
Exhibit 3 to the July 15, 1997 Form 8-K
|
||
|
4.4.3
|
Tenth Supplemental Indenture to the 1994 Indenture, dated as of August 30, 2005, among the Company, Macy's Retail and U.S. Bank National Association (as successor to State Street Bank and Trust Company and as successor to The First National Bank of Boston), as Trustee
|
Exhibit 10.14 to the August 30, 2005 Form 8-K
|
||
|
4.4.4
|
Guarantee of Securities, dated as of August 30, 2005, by the Company relating to the 1994 Indenture
|
Exhibit 10.16 to the August 30, 2005 Form 8-K
|
||
|
4.5
|
Indenture, dated as of September 10, 1997, between the Company and U.S. Bank National Association (successor to Citibank, N.A.), as Trustee (the “1997 Indenture”)
|
Exhibit 4.4 to the Company's Amendment No. 1 to Form S-3 (Registration No. 333-34321) filed on September 11, 1997
|
||
|
4.5.1
|
First Supplemental Indenture to the 1997 Indenture, dated as of February 6, 1998, between the Company and U.S. Bank National Association (successor to Citibank, N.A.), as Trustee
|
Exhibit 2 to the Company's Current Report on Form 8-K filed on February 6, 1998
|
||
|
4.5.2
|
Third Supplemental Indenture to the 1997 Indenture, dated as of March 24, 1999, between the Company and U.S. Bank National Association (successor to Citibank, N.A.), as Trustee
|
Exhibit 4.2 to the Company's Registration Statement on Form S-4 (Registration No. 333-76795) filed on April 22, 1999
|
||
|
4.5.3
|
Seventh Supplemental Indenture to the 1997 Indenture, dated as of August 30, 2005 among the Company, Macy's Retail and U.S. Bank National Association (successor to Citibank, N.A.), as Trustee
|
Exhibit 10.15 to the August 30, 2005 Form 8-K
|
||
|
4.5.4
|
Guarantee of Securities, dated as of August 30, 2005, by the Company relating to the 1997 Indenture
|
Exhibit 10.17 to the August 30, 2005 Form 8-K
|
||
|
4.6
|
Indenture, dated as of June 17, 1996, among the Company (as successor to May Delaware), Macy's Retail (f/k/a May New York) and The Bank of New York Mellon Trust Company, N.A. (“BNY Mellon”, successor to J.P. Morgan Trust Company), as Trustee (the “1996 Indenture”)
|
Exhibit 4.1 to the Registration Statement on Form S-3 (Registration No. 333-06171) filed on June 18, 1996 by May Delaware
|
||
|
4.6.1
|
First Supplemental Indenture to the 1996 Indenture, dated as of August 30, 2005, by and among the Company (as successor to May Delaware), Macy's Retail (f/k/a May New York) and BNY Mellon, as Trustee
|
Exhibit 10.9 to the August 30, 2005 Form 8-K
|
||
|
4.7
|
Indenture, dated as of July 20, 2004, among the Company (as successor to May Delaware), Macy's Retail (f/k/a May New York) and BNY Mellon, as Trustee (the “2004 Indenture”)
|
Exhibit 4.1 to the Current Report on Form 8-K (File No. 001-00079) filed on July 21, 2004 by May Delaware
|
||
|
4.7.1
|
First Supplemental Indenture to the 2004 Indenture, dated as of August 30, 2005 among the Company (as successor to May Delaware), Macy's Retail and BNY Mellon, as Trustee
|
Exhibit 10.10 to the August 30, 2005 Form 8-K
|
||
|
4.8
|
Indenture, dated as of November 2, 2006, by and among Macy's Retail, the Company and U.S. Bank National Association, as Trustee (the “2006 Indenture”)
|
Exhibit 4.6 to the Company's Registration Statement on Form S-3ASR (Registration No. 333-138376) filed on November 2, 2006
|
||
35
|
Exhibit
Number
|
Description
|
Document if Incorporated by Reference
|
||
|
4.8.1
|
First Supplemental Indenture to the 2006 Indenture, dated November 29, 2006, among Macy's Retail, the Company and U.S. Bank National Association, as Trustee
|
Exhibit 4.1 to the Company's Current Report on Form 8-K filed on November 29, 2006
|
||
|
4.8.2
|
Third Supplemental Indenture to the 2006 Indenture, dated March 12, 2007, among Macy's Retail, the Company and U.S. Bank National Association, as Trustee
|
Exhibit 4.2 to the Company's Current Report on Form 8-K filed on March 12, 2007
|
||
|
4.8.3
|
Fifth Supplemental Trust Indenture to the 2006 Indenture, dated as of June 26, 2008, among Macy's Retail, as issuer, the Company, as guarantor, and U.S. Bank National Association, as trustee
|
Exhibit 4.1 to the Company's Current Report on Form 8-K filed on June 26, 2008
|
||
|
4.9
|
Indenture, dated as of January 13, 2012, among Macy's Retail, the Company and BNY Mellon, as Trustee (the "2012 Indenture")
|
Exhibit 4.1 to the Company's Current Report on Form 8-K filed on January 13, 2012 (the “January 13, 2012 Form 8-K”)
|
||
|
4.9.1
|
First Supplemental Trust Indenture to the 2012 Indenture, dated as of January 13, 2012, among Macy's Retail, as issuer, the Company, as guarantor, and BNY Mellon, as trustee
|
Exhibit 4.2 to the January 13, 2012 Form 8-K
|
||
|
4.9.2
|
Second Supplemental Trust Indenture to the 2012 Indenture, dated as of January 13, 2012, among Macy's Retail, as issuer, the Company, as guarantor, and BNY Mellon, as trustee
|
Exhibit 4.3 to the January 13, 2012 Form 8-K
|
||
|
4.9.3
|
Third Supplemental Trust Indenture, dated as of November 20, 2012, among Macy's Retail, as issuer, the Company, as guarantor, and BNY Mellon, as trustee
|
Exhibit 4.2 to the Company's Current Report on Form 8-K filed on November 20, 2012 (the “November 20, 2012 Form 8-K”)
|
||
|
4.9.4
|
Fourth Supplemental Trust Indenture, dated as of November 20, 2012, among Macy's Retail, as issuer, the Company, as guarantor, and BNY Mellon, as trustee
|
Exhibit 4.3 to the November 20, 2012 Form 8-K
|
||
|
4.9.5
|
Fifth Supplemental Trust Indenture, dated as of September 6, 2013, among Macy's Retail, as issuer, the Company, as guarantor, and BNY Mellon, as trustee
|
Exhibit 4.2 to the Company's Current Report on Form 8-K filed on September 6, 2013
|
||
|
10.1+
|
Credit Agreement, dated as of May 10, 2013, among the Company, Macy's Retail, the lenders party thereto and JPMorgan Chase Bank, N.A., as administrative agent and paying agent, and Bank of America, N.A., as administrative agent
|
Exhibit 10.01 to the Company's Current Report on Form 8-K filed on May 14, 2013 (the “May 14, 2013 Form 8-K”)
|
||
|
10.1.1
|
First Amendment, dated as of May 30, 2013, to the Credit Agreement, among Macy's Retail and JPMorgan Chase Bank, N.A. and the Bank of America, N.A., as Administrative Agents
|
Exhibit 10.1.1 to the Company's Quarterly Report on Form 10-Q filed on June 10, 2013
|
||
|
10.2
|
Guarantee Agreement, dated as of May 10, 2013, among the Company, Macy's Retail, certain subsidiary guarantors and JPMorgan Chase Bank, N.A., as paying agent
|
Exhibit 10.02 to the May 14, 2013 Form 8-K
|
||
|
10.3
|
Commercial Paper Dealer Agreement, dated as of August 30, 2005, among the Company, Macy's Retail and Banc of America Securities LLC
|
Exhibit 10.6 to the August 30, 2005 Form 8-K
|
||
|
10.4
|
Commercial Paper Dealer Agreement, dated as of August 30, 2005, among the Company, Macy's Retail and Goldman, Sachs & Co.
|
Exhibit 10.7 to the August 30, 2005 Form 8-K
|
||
36
|
Exhibit
Number
|
Description
|
Document if Incorporated by Reference
|
||
|
10.5
|
Commercial Paper Dealer Agreement, dated as of August 30, 2005, among the Company, Macy's Retail and J.P. Morgan Securities Inc.
|
Exhibit 10.8 to the August 30, 2005 Form 8-K
|
||
|
10.6
|
Commercial Paper Dealer Agreement, dated as of October 4, 2006, among the Company and Loop Capital Markets, LLC
|
Exhibit 10.6 to the Company's Annual Report on Form 10-K (File No. 1-13536) for the fiscal year ended February 3, 2007
|
||
|
10.7
|
Tax Sharing Agreement
|
Exhibit 10.10 to the Company's Registration Statement on Form 10, filed on November 27, 1991, as amended (the “Form 10”)
|
||
|
10.8+
|
Purchase, Sale and Servicing Transfer Agreement, effective as of June 1, 2005, among the Company, FDS Bank, Prime II Receivables Corporation (“Prime II”) and Citibank, N.A. (“Citibank”)
|
Exhibit 10.3 to the Company's Quarterly Report on Form 10-Q filed on September 8, 2009 (the "September 8, 2009 Form 10-Q")
|
||
|
10.8.1
|
Letter Agreement, dated August 22, 2005, among the Company, FDS Bank, Prime II and Citibank
|
Exhibit 10.17.1 to the Company's Annual Report on Form 10-K (File No. 1-13536) for the fiscal year ended January 28, 2006 (the “2005 Form 10-K”)
|
||
|
10.8.2+
|
Second Amendment to Purchase, Sale and Servicing Transfer Agreement, dated October 24, 2005, between the Company and Citibank
|
Exhibit 10.4 to the September 8, 2009 Form 10-Q
|
||
|
10.8.3
|
Third Amendment to Purchase, Sale and Servicing Transfer Agreement, dated May 1, 2006, between the Company and Citibank
|
Exhibit 10.1 to the Company's Current Report on Form 8-K filed on May 3, 2006
|
||
|
10.8.4+
|
Fourth Amendment to Purchase, Sale and Servicing Transfer Agreement, dated May 22, 2006, between the Company and Citibank
|
Exhibit 10.5 to the September 8, 2009 Form 10-Q
|
||
|
10.9+
|
Credit Card Program Agreement, effective as of June 1, 2005, among the Company, FDS Bank, Macy's Credit and Customer Services, Inc. (“MCCS”) (f/k/a FACS Group, Inc.) and Citibank
|
Exhibit 10.6 to the September 8, 2009 Form 10-Q
|
||
|
10.9.1+
|
First Amendment to Credit Card Program Agreement, dated October 24, 2005, between the Company and Citibank
|
Exhibit 10.7 to the September 8, 2009 Form 10-Q
|
||
|
10.9.2+
|
Second Amendment to Credit Card Program Agreement, dated May 22, 2006, between the Company, FDS Bank, MCCS, Macy's West Stores, Inc. (f/k/a Macy's Department Stores, Inc,) (“MWSI”), Bloomingdale’s, Inc. (“Bloomingdale’s”) and Department Stores National Bank (“DSNB”) and Citibank
|
Exhibit 10.8 to the September 8, 2009 Form 10-Q
|
||
|
10.9.3
|
Restated Letter Agreement, dated May 30, 2008 and effective as of December 18, 2006, among the Company, FDS Bank, MCCS, MWSI, Bloomingdale’s, Inc. (“Bloomingdale’s), and DSNB (as assignee of Citibank, N.A.)
|
Exhibit 10.6 to the Company's Quarterly Report on Form 10-Q filed on June 9, 2008 (the “June 9, 2008 Form 10-Q”)
|
||
|
10.9.4
|
Restated Letter Agreement, dated May 30, 2008 and effective as of March 22, 2007, among the Company, FDS Bank, MCCS, MWSI, Bloomingdale’s and DSNB
|
Exhibit 10.7 to the June 9, 2008 Form 10-Q
|
||
|
10.9.5
|
Restated Letter Agreement, dated May 30, 2008 and effective as of April 6, 2007, among the Company, FDS Bank, MCCS, MWSI, Bloomingdale’s and DSNB
|
Exhibit 10.8 to the June 9, 2008 Form 10-Q
|
||
37
|
Exhibit
Number
|
Description
|
Document if Incorporated by Reference
|
||
|
10.9.6
|
Restated Letter Agreement, dated May 30, 2008 and effective as of June 1, 2007, among the Company, FDS Bank, MCCS, MWSI, Bloomingdale’s and DSNB
|
Exhibit 10.9 to the June 9, 2008 Form 10-Q
|
||
|
10.9.7
|
Restated Third Amendment to Credit Card Program Agreement, dated May 31, 2008 and effective as of February 3, 2008, among the Company, FDS Bank, MCCS, MWSI, Bloomingdale’s and DSNB
|
Exhibit 10.10 to the June 9, 2008 Form 10-Q
|
||
|
10.9.8+
|
Fourth Amendment to Credit Card Program Agreement, effective as of August 1, 2008, among the Company, FDS Bank, MCCS, MWSI, Bloomingdale’s and DSNB.
|
Exhibit 10.9 to the September 8, 2009 Form 10-Q
|
||
|
10.9.9+
|
Fifth Amendment to Credit Card Program Agreement, effective as of January 1, 2009, among the Company, FDS Bank, MCCS, MWSI, Bloomingdale’s and DSNB
|
Exhibit 10.10 to the September 8, 2009 Form 10-Q
|
||
|
10.9.10+
|
Sixth Amendment to Credit Card Program Agreement, effective as of June 1, 2009, among the Company, FDS Bank, MCCS, MWSI, Bloomingdale’s and DSNB
|
Exhibit 10.11 to the September 8, 2009 Form 10-Q
|
||
|
10.9.11+
|
Seventh Amendment to Credit Card Program Agreement, effective as of February 26, 2010, among the Company, FDS Bank, MCCS, MWSI, Bloomingdale’s and DSNB
|
Exhibit 10.9.11 to the Company's Annual Report on Form 10-K (File No. 1-13536) for the fiscal year ended January 30, 2010
|
||
|
10.9.12+
|
Eighth Amendment to Credit Card Program Agreement, effective as of April 16, 2012, among the Company, FDS Bank, MCCS, MWSI, Bloomingdale’s and DSNB
|
Exhibit 10.1 to the Company's Quarterly Report on Form 10-Q filed on December 3, 2012
|
||
|
10.9.13+
|
Letter Agreement, dated October 30, 2013, among the Company, FDS Bank, MCCS, MWSI, Bloomingdale’s and DSNB
|
Exhibit 10.1 to the Company's Quarterly Report on Form 10-Q filed on December 9, 2013
|
||
|
10.10
|
1995 Executive Equity Incentive Plan, as amended and restated as of June 1, 2007 (the “1995 Plan”) *
|
Exhibit 10.11 to the Company's Annual Report on Form 10-K (File No. 1-13536) for the fiscal year ended January 31, 2009 (the “2008 Form 10-K”)
|
||
|
10.11
|
Senior Executive Incentive Compensation Plan *
|
Appendix B to the Company's Proxy Statement dated March 28, 2012
|
||
|
10.12
|
1994 Stock Incentive Plan, as amended and restated as of June 1, 2007 *
|
Exhibit 10.13 to the 2008 Form 10-K
|
||
|
10.13
|
Form of Indemnification Agreement *
|
Exhibit 10.14 to the Form 10
|
||
|
10.14
|
Executive Severance Plan, effective November 1, 2009, as revised and restated January 1, 2014 *
|
|||
|
10.15
|
Form of Non-Qualified Stock Option Agreement for the 1995 Plan (for Executives and Key Employees) *
|
Exhibit 10.2 to the Company's Current Report on Form 8-K filed on March 29, 2005
|
||
|
10.15.1
|
Form of Non-Qualified Stock Option Agreement for the 1995 Plan (for Executives and Key Employees), as amended *
|
Exhibit 10.33.1 to the 2005 Form 10-K
|
||
|
10.15.2
|
Form of Non-Qualified Stock Option Agreement for the 1994 Stock Incentive Plan *
|
Exhibit 10.7 to the Current Report on From 8-K (File No. 001-00079) filed on March 23, 2005 by May Delaware (the “March 23, 2005 Form 8-K”)
|
||
|
10.15.3
|
Form of Nonqualified Stock Option Agreement under the 2009 Omnibus Incentive Compensation Plan (for Executives and Key Employees) *
|
Exhibit 10.15.3 to the Company's Annual Report on Form 10-K (File No. 1-13536) for the fiscal year ended February 2, 2013 (the "2012 Form 10-K")
|
||
38
|
Exhibit
Number
|
Description
|
Document if Incorporated by Reference
|
||
|
10.16
|
Nonqualified Stock Option Agreement, dated as of October 26, 2007, by and between the Company and Terry Lundgren *
|
Exhibit 10.1 to the Company’s Current Report on Form 8-K filed on November 1, 2007
|
||
|
10.17
|
Form of Restricted Stock Agreement for the 1994 Stock Incentive Plan *
|
Exhibit 10.4 to the March 23, 2005 Form 8-K
|
||
|
10.17.1
|
Form of Time-Based Restricted Stock Agreement under the 2009 Omnibus Incentive Compensation Plan *
|
Exhibit 10.3 to the Company's Current Report on Form 8-K filed on March 25, 2010
|
||
|
10.18
|
Form of Performance-Based Restricted Stock Unit Agreement under the 2009 Omnibus Incentive Compensation Plan for the 2013-2015 performance period *
|
Exhibit 10.18 to the 2012 Form 10-K
|
||
|
10.18.1
|
Form of Performance-Based Restricted Stock Unit Agreement under the 2009 Omnibus Incentive Compensation Plan for the 2014-2016 performance period *
|
|||
|
10.19
|
Form of Time-Based Restricted Stock Unit Agreement under the 2009 Omnibus Incentive Compensation Plan *
|
Exhibit 10.19 to the 2012 Form 10-K
|
||
|
10.20
|
Supplementary Executive Retirement Plan *
|
Exhibit 10.29 to the 2008 Form 10-K
|
||
|
10.20.1
|
First Amendment to the Supplementary Executive Retirement Plan effective January 1, 2012 *
|
Exhibit 10.21.1 to the Company's Annual Report on Form 10-K (File No. 1-13536) for the fiscal year ended January 28, 2012
|
||
|
10.20.2
|
Second Amendment to Supplementary Executive Retirement Plan effective January 1, 2012 *
|
Exhibit 10.20.2 to the 2012 Form 10-K
|
||
|
10.20.3
|
Third Amendment to Supplementary Executive Retirement Plan effective December 31, 2013 *
|
|||
|
10.21
|
Executive Deferred Compensation Plan *
|
Exhibit 10.30 to the 2008 Form 10-K
|
||
|
10.21.1
|
First Amendment to Executive Deferred Compensation Plan effective December 19, 2013 *
|
|||
|
10.22
|
Macy's, Inc. 401(k) Retirement Investment Plan (the "Plan") (amending and restating the Macy's, Inc. 401(k) Retirement Investment Plan) effective as of January 1, 2014 *
|
|||
|
10.23
|
Director Deferred Compensation Plan *
|
Exhibit 10.33 to the 2008 Form 10-K
|
||
|
10.24
|
Macy's, Inc. 2009 Omnibus Incentive Compensation Plan *
|
Appendix B to the Company's Proxy Statement dated April 1, 2009
|
||
|
10.25
|
Macy's, Inc. Deferred Compensation Plan *
|
Exhibit 4.5 to the Company's Registration Statement on Form S-8 (Registration No. 333-192917) filed on December 18, 2013
|
||
|
10.26
|
Change in Control Plan, effective November 1, 2009, as revised and restated January 1, 2014 *
|
|||
|
10.27
|
Time Sharing Agreement between Macy's, Inc. and Terry J. Lundgren, dated March 25, 2011 *
|
Exhibit 10.33 to the Company's Annual Report on Form 10-K (File No. 1-13536) for the fiscal year ended January 29, 2011
|
||
|
21
|
Subsidiaries
|
|||
39
|
Exhibit
Number
|
Description
|
Document if Incorporated by Reference
|
||
|
23
|
Consent of KPMG LLP
|
|||
|
24
|
Powers of Attorney
|
|||
|
31.1
|
Certification of Chief Executive Officer pursuant to Rule 13a-14(a)
|
|||
|
31.2
|
Certification of Chief Financial Officer pursuant to Rule 13a-14(a)
|
|||
|
32.1
|
Certification by Chief Executive Officer under Section 906 of the Sarbanes-Oxley Act
|
|||
|
32.2
|
Certification by Chief Financial Officer under Section 906 of the Sarbanes-Oxley Act
|
|||
|
101**
|
The following financial statements from Macy's, Inc.’s Annual Report on Form 10-K for the year ended February 1, 2014, filed on April 2, 2014, formatted in XBRL: (i) Consolidated Statements of Income, (ii) Consolidated Statements of Comprehensive Income, (iii) Consolidated Balance Sheets, (iv) Consolidated Statements of Changes in Shareholders’ Equity, (v) Consolidated Statements of Cash Flows, and (vi) the Notes to Consolidated Financial Statements, tagged as blocks of text and in detail.
|
|||
___________________
|
+
|
Portions of the exhibit have been omitted pursuant to a request for confidential treatment. The confidential portions have been provided to the SEC.
|
|
*
|
Constitutes a compensatory plan or arrangement.
|
|
**
|
As provided in Rule 406T of Regulation S-T, this information is furnished and not filed for purposes of Sections 11 and 12 of the Securities Act of 1933 and Section 18 of the Securities Exchange Act of 1934.
|
40
SIGNATURES
Pursuant to the requirements of Section 13 or 15(d) of the Securities Exchange Act of 1934, the Registrant has duly caused this report to be signed on its behalf by the undersigned, thereunto duly authorized.
|
MACY’S, INC.
|
||
|
By:
|
/s/ D
ENNIS
J. B
RODERICK
|
|
|
Dennis J. Broderick
Executive Vice President, General Counsel and Secretary
|
||
Date:
April 2, 2014
Pursuant to the requirements of the Securities Exchange Act of 1934, this report has been signed below by the following persons on behalf of the Registrant and in the capacities indicated on
April 2, 2014
.
|
Signature
|
Title
|
|
|
*
|
Chairman of the Board and Chief Executive Officer (principal executive officer) and Director
|
|
|
Terry J. Lundgren
|
||
|
*
|
Chief Financial Officer (principal financial officer)
|
|
|
Karen M. Hoguet
|
||
|
*
|
Executive Vice President and Controller (principal accounting officer)
|
|
|
Joel A. Belsky
|
||
|
*
|
Director
|
|
|
Stephen F. Bollenbach
|
||
|
*
|
Director
|
|
|
Deirdre Connelly
|
||
|
*
|
Director
|
|
|
Meyer Feldberg
|
||
|
*
|
Director
|
|
|
Sara Levinson
|
||
|
*
|
Director
|
|
|
Joseph Neubauer
|
||
|
*
|
Director
|
|
|
Joyce M. Roché
|
||
|
*
|
Director
|
|
|
Paul C. Varga
|
||
|
*
|
Director
|
|
|
Craig E. Weatherup
|
||
|
*
|
Director
|
|
|
Marna C. Whittington
|
||
___________________
|
*
|
The undersigned, by signing his name hereto, does sign and execute this Annual Report on Form 10-K pursuant to the Powers of Attorney executed by the above-named officers and directors and filed herewith.
|
|
By:
|
/s/ D
ENNIS
J. B
RODERICK
|
|
|
|
Dennis J. Broderick
Attorney-in-Fact
|
|
41
INDEX TO CONSOLIDATED FINANCIAL STATEMENTS
|
|
Page
|
|
Consolidated Statements of Comprehensive Income for the fiscal years ended
February 1, 2014, February 2, 2013 and January 28, 2012 |
|
|
Consolidated Statements of Changes in Shareholders’ Equity for the fiscal years ended
February 1, 2014, February 2, 2013 and January 28, 2012 |
|
|
Consolidated Statements of Cash Flows for the fiscal years ended
February 1, 2014, February 2, 2013 and January 28, 2012 |
|
F-1
REPORT OF MANAGEMENT
To the Shareholders of
Macy’s, Inc.:
The integrity and consistency of the Consolidated Financial Statements of Macy’s, Inc. and subsidiaries, which were prepared in accordance with accounting principles generally accepted in the United States of America, are the responsibility of management and properly include some amounts that are based upon estimates and judgments.
The Company maintains a system of internal accounting controls, which is supported by a program of internal audits with appropriate management follow-up action, to provide reasonable assurance, at appropriate cost, that the Company’s assets are protected and transactions are properly recorded. Additionally, the integrity of the financial accounting system is based on careful selection and training of qualified personnel, organizational arrangements which provide for appropriate division of responsibilities and communication of established written policies and procedures.
The Company’s management is responsible for establishing and maintaining adequate internal control over financial reporting, as defined in Exchange Act Rule 13a-15(f) and has issued Management’s Report on Internal Control over Financial Reporting.
The Consolidated Financial Statements of the Company have been audited by KPMG LLP. Their report expresses their opinion as to the fair presentation, in all material respects, of the financial statements and is based upon their independent audits.
The Audit Committee, composed solely of outside directors, meets periodically with KPMG LLP, the internal auditors and representatives of management to discuss auditing and financial reporting matters. In addition, KPMG LLP and the Company’s internal auditors meet periodically with the Audit Committee without management representatives present and have free access to the Audit Committee at any time. The Audit Committee is responsible for recommending to the Board of Directors the engagement of the independent registered public accounting firm and the general oversight review of management’s discharge of its responsibilities with respect to the matters referred to above.
Terry J. Lundgren
Chairman and Chief Executive Officer
Karen M. Hoguet
Chief Financial Officer
Joel A. Belsky
Executive Vice President and Controller
F-2
Report of Independent Registered Public Accounting Firm
The Board of Directors and Shareholders
Macy’s, Inc.:
We have audited the accompanying consolidated balance sheets of Macy’s, Inc. and subsidiaries as of February 1, 2014 and February 2, 2013, and the related consolidated statements of income, comprehensive income, shareholders’ equity and cash flows for each of the years in the three-year period ended February 1, 2014. We also have audited Macys, Inc.’s internal control over financial reporting as of February 1, 2014, based on criteria established in
Internal Control - Integrated Framework
issued by the Committee of Sponsoring Organizations of the Treadway Commission (COSO). Macy’s, Inc.’s management is responsible for these consolidated financial statements, for maintaining effective internal control over financial reporting, and for its assessment of the effectiveness of internal control over financial reporting, included in the accompanying Item 9A(b), “Management’s Report on Internal Control over Financial Reporting.” Our responsibility is to express an opinion on these consolidated financial statements and an opinion on Macy’s Inc.’s internal control over financial reporting based on our audits.
We conducted our audits in accordance with the standards of the Public Company Accounting Oversight Board (United States). Those standards require that we plan and perform the audits to obtain reasonable assurance about whether the financial statements are free of material misstatement and whether effective internal control over financial reporting was maintained in all material respects. Our audits of the consolidated financial statements included examining, on a test basis, evidence supporting the amounts and disclosures in the financial statements, assessing the accounting principles used and significant estimates made by management, and evaluating the overall financial statement presentation. Our audit of internal control over financial reporting included obtaining an understanding of internal control over financial reporting, assessing the risk that a material weakness exists, and testing and evaluating the design and operating effectiveness of internal control based on the assessed risk. Our audits also included performing such other procedures as we considered necessary in the circumstances. We believe that our audits provide a reasonable basis for our opinions.
A company’s internal control over financial reporting is a process designed to provide reasonable assurance regarding the reliability of financial reporting and the preparation of financial statements for external purposes in accordance with generally accepted accounting principles. A company’s internal control over financial reporting includes those policies and procedures that (1) pertain to the maintenance of records that, in reasonable detail, accurately and fairly reflect the transactions and dispositions of the assets of the company; (2) provide reasonable assurance that transactions are recorded as necessary to permit preparation of financial statements in accordance with generally accepted accounting principles, and that receipts and expenditures of the company are being made only in accordance with authorizations of management and directors of the company; and (3) provide reasonable assurance regarding prevention or timely detection of unauthorized acquisition, use, or disposition of the company’s assets that could have a material effect on the financial statements.
Because of its inherent limitations, internal control over financial reporting may not prevent or detect misstatements. Also, projections of any evaluation of effectiveness to future periods are subject to the risk that controls may become inadequate because of changes in conditions, or that the degree of compliance with the policies or procedures may deteriorate.
In our opinion, the consolidated financial statements referred to above present fairly, in all material respects, the financial position of Macy’s, Inc. and subsidiaries as of February 1, 2014 and February 2, 2013, and the results of their operations and their cash flows for each of the years in the three-year period ended February 1, 2014, in conformity with U.S. generally accepted accounting principles. Also in our opinion, Macy’s, Inc. maintained, in all material respects, effective internal control over financial reporting as of February 1, 2014, based on criteria established in
Internal Control - Integrated Framework
issued by the Committee of Sponsoring Organizations of the Treadway Commission.
/s/ KPMG LLP
Cincinnati, Ohio
April 2, 2014
F-3
MACY’S, INC.
(millions, except per share data)
|
2013
|
2012
|
2011
|
|||||||||
|
Net sales
|
$
|
27,931
|
|
$
|
27,686
|
|
$
|
26,405
|
|
||
|
Cost of sales
|
(16,725
|
)
|
(16,538
|
)
|
(15,738
|
)
|
|||||
|
Gross margin
|
11,206
|
|
11,148
|
|
10,667
|
|
|||||
|
Selling, general and administrative expenses
|
(8,440
|
)
|
(8,482
|
)
|
(8,281
|
)
|
|||||
|
Impairments, store closing and other costs and
gain on sale of leases |
(88
|
)
|
(5
|
)
|
25
|
|
|||||
|
Operating income
|
2,678
|
|
2,661
|
|
2,411
|
|
|||||
|
Interest expense
|
(390
|
)
|
(425
|
)
|
(447
|
)
|
|||||
|
Premium on early retirement of debt
|
—
|
|
(137
|
)
|
—
|
|
|||||
|
Interest income
|
2
|
|
3
|
|
4
|
|
|||||
|
Income before income taxes
|
2,290
|
|
2,102
|
|
1,968
|
|
|||||
|
Federal, state and local income tax expense
|
(804
|
)
|
(767
|
)
|
(712
|
)
|
|||||
|
Net income
|
$
|
1,486
|
|
$
|
1,335
|
|
$
|
1,256
|
|
||
|
Basic earnings per share
|
$
|
3.93
|
|
$
|
3.29
|
|
$
|
2.96
|
|
||
|
Diluted earnings per share
|
$
|
3.86
|
|
$
|
3.24
|
|
$
|
2.92
|
|
||
The accompanying notes are an integral part of these Consolidated Financial Statements.
F-4
MACY’S, INC.
CONSOLIDATED STATEMENTS OF COMPREHENSIVE INCOME
(millions)
|
2013
|
2012
|
2011
|
|||||||||
|
Net income
|
$
|
1,486
|
|
$
|
1,335
|
|
$
|
1,256
|
|
||
|
Other comprehensive income (loss), net of taxes:
|
|||||||||||
|
Actuarial gain (loss) and prior service cost on post employment
and postretirement benefit plans, net of tax effect of $108 million, $24 million and $241 million |
170
|
|
37
|
|
(376
|
)
|
|||||
|
Unrealized loss on marketable securities, net of tax
effect of $1 million |
—
|
|
—
|
|
(2
|
)
|
|||||
|
Reclassifications to net income:
|
|||||||||||
|
Net actuarial loss on post employment and postretirement
benefit plans, net of tax effect of $61 million, $60 million and $35 million |
96
|
|
94
|
|
56
|
|
|||||
|
Prior service credit on post employment and postretirement
benefit plans, net of tax effect of $1 million and $1 million |
—
|
|
(1
|
)
|
(1
|
)
|
|||||
|
Realized gain on marketable securities, net of
tax effect of $4 million |
—
|
|
—
|
|
(8
|
)
|
|||||
|
Total other comprehensive income (loss)
|
266
|
|
130
|
|
(331
|
)
|
|||||
|
Comprehensive income
|
$
|
1,752
|
|
$
|
1,465
|
|
$
|
925
|
|
||
The accompanying notes are an integral part of these Consolidated Financial Statements.
F-5
MACY’S, INC.
(millions)
|
February 1, 2014
|
February 2, 2013
|
||||||
|
ASSETS
|
|||||||
|
Current Assets:
|
|||||||
|
Cash and cash equivalents
|
$
|
2,273
|
|
$
|
1,836
|
|
|
|
Receivables
|
438
|
|
371
|
|
|||
|
Merchandise inventories
|
5,557
|
|
5,308
|
|
|||
|
Prepaid expenses and other current assets
|
420
|
|
361
|
|
|||
|
Total Current Assets
|
8,688
|
|
7,876
|
|
|||
|
Property and Equipment – net
|
7,930
|
|
8,196
|
|
|||
|
Goodwill
|
3,743
|
|
3,743
|
|
|||
|
Other Intangible Assets – net
|
527
|
|
561
|
|
|||
|
Other Assets
|
746
|
|
615
|
|
|||
|
Total Assets
|
$
|
21,634
|
|
$
|
20,991
|
|
|
|
LIABILITIES AND SHAREHOLDERS’ EQUITY
|
|||||||
|
Current Liabilities:
|
|||||||
|
Short-term debt
|
$
|
463
|
|
$
|
124
|
|
|
|
Merchandise accounts payable
|
1,691
|
|
1,579
|
|
|||
|
Accounts payable and accrued liabilities
|
2,810
|
|
2,610
|
|
|||
|
Income taxes
|
362
|
|
355
|
|
|||
|
Deferred income taxes
|
400
|
|
407
|
|
|||
|
Total Current Liabilities
|
5,726
|
|
5,075
|
|
|||
|
Long-Term Debt
|
6,728
|
|
6,806
|
|
|||
|
Deferred Income Taxes
|
1,273
|
|
1,238
|
|
|||
|
Other Liabilities
|
1,658
|
|
1,821
|
|
|||
|
Shareholders’ Equity:
|
|||||||
|
Common stock (364.9 and 387.7 shares outstanding)
|
4
|
|
4
|
|
|||
|
Additional paid-in capital
|
2,522
|
|
3,872
|
|
|||
|
Accumulated equity
|
6,235
|
|
5,108
|
|
|||
|
Treasury stock
|
(1,847
|
)
|
(2,002
|
)
|
|||
|
Accumulated other comprehensive loss
|
(665
|
)
|
(931
|
)
|
|||
|
Total Shareholders’ Equity
|
6,249
|
|
6,051
|
|
|||
|
Total Liabilities and Shareholders’ Equity
|
$
|
21,634
|
|
$
|
20,991
|
|
|
The accompanying notes are an integral part of these Consolidated Financial Statements.
F-6
MACY’S, INC.
CONSOLIDATED STATEMENTS OF CHANGES IN SHAREHOLDERS’ EQUITY
(millions)
|
Common
Stock
|
Additional
Paid-In
Capital
|
Accumulated
Equity
|
Treasury
Stock
|
Accumulated
Other
Comprehensive
Income (Loss)
|
Total
Shareholders’
Equity
|
||||||||||||||||||
|
Balance at January 29, 2011
|
$
|
5
|
|
$
|
5,696
|
|
$
|
2,990
|
|
$
|
(2,431
|
)
|
$
|
(730
|
)
|
$
|
5,530
|
|
|||||
|
Net income
|
1,256
|
|
1,256
|
|
|||||||||||||||||||
|
Other comprehensive loss
|
(331
|
)
|
(331
|
)
|
|||||||||||||||||||
|
Common stock dividends ($.55 per share)
|
(231
|
)
|
(231
|
)
|
|||||||||||||||||||
|
Stock repurchases
|
(502
|
)
|
(502
|
)
|
|||||||||||||||||||
|
Stock-based compensation expense
|
48
|
|
48
|
|
|||||||||||||||||||
|
Stock issued under stock plans
|
(81
|
)
|
242
|
|
161
|
|
|||||||||||||||||
|
Retirement of common stock
|
(255
|
)
|
255
|
|
—
|
|
|||||||||||||||||
|
Deferred compensation plan distributions
|
2
|
|
2
|
|
|||||||||||||||||||
|
Balance at January 28, 2012
|
5
|
|
5,408
|
|
4,015
|
|
(2,434
|
)
|
(1,061
|
)
|
5,933
|
|
|||||||||||
|
Net income
|
1,335
|
|
1,335
|
|
|||||||||||||||||||
|
Other comprehensive income
|
130
|
|
130
|
|
|||||||||||||||||||
|
Common stock dividends ($.60 per share)
|
(242
|
)
|
(242
|
)
|
|||||||||||||||||||
|
Stock repurchases
|
(1,397
|
)
|
(1,397
|
)
|
|||||||||||||||||||
|
Stock-based compensation expense
|
55
|
|
55
|
|
|||||||||||||||||||
|
Stock issued under stock plans
|
(111
|
)
|
345
|
|
234
|
|
|||||||||||||||||
|
Retirement of common stock
|
(1
|
)
|
(1,480
|
)
|
1,481
|
|
—
|
|
|||||||||||||||
|
Deferred compensation plan distributions
|
3
|
|
3
|
|
|||||||||||||||||||
|
Balance at February 2, 2013
|
4
|
|
3,872
|
|
5,108
|
|
(2,002
|
)
|
(931
|
)
|
6,051
|
|
|||||||||||
|
Net income
|
1,486
|
|
1,486
|
|
|||||||||||||||||||
|
Other comprehensive income
|
266
|
|
266
|
|
|||||||||||||||||||
|
Common stock dividends ($.95 per share)
|
(359
|
)
|
(359
|
)
|
|||||||||||||||||||
|
Stock repurchases
|
(1,571
|
)
|
(1,571
|
)
|
|||||||||||||||||||
|
Stock-based compensation expense
|
60
|
|
60
|
|
|||||||||||||||||||
|
Stock issued under stock plans
|
(84
|
)
|
399
|
|
315
|
|
|||||||||||||||||
|
Retirement of common stock
|
—
|
|
(1,326
|
)
|
1,326
|
|
—
|
|
|||||||||||||||
|
Deferred compensation plan distributions
|
1
|
|
1
|
|
|||||||||||||||||||
|
Balance at February 1, 2014
|
$
|
4
|
|
$
|
2,522
|
|
$
|
6,235
|
|
$
|
(1,847
|
)
|
$
|
(665
|
)
|
$
|
6,249
|
|
|||||
The accompanying notes are an integral part of these Consolidated Financial Statements.
F-7
MACY’S, INC.
(millions)
|
2013
|
2012
|
2011
|
|||||||||
|
Cash flows from operating activities:
|
|||||||||||
|
Net income
|
$
|
1,486
|
|
$
|
1,335
|
|
$
|
1,256
|
|
||
|
Adjustments to reconcile net income to net cash
provided by operating activities: |
|||||||||||
|
Impairments, store closing and other costs and gain
on sale of leases |
88
|
|
5
|
|
(25
|
)
|
|||||
|
Depreciation and amortization
|
1,020
|
|
1,049
|
|
1,085
|
|
|||||
|
Stock-based compensation expense
|
62
|
|
61
|
|
70
|
|
|||||
|
Amortization of financing costs and premium on acquired debt
|
(8
|
)
|
(16
|
)
|
(15
|
)
|
|||||
|
Changes in assets and liabilities:
|
|||||||||||
|
(Increase) decrease in receivables
|
(58
|
)
|
7
|
|
(37
|
)
|
|||||
|
Increase in merchandise inventories
|
(249
|
)
|
(191
|
)
|
(359
|
)
|
|||||
|
Increase in prepaid expenses and other current assets
|
(2
|
)
|
(7
|
)
|
(17
|
)
|
|||||
|
(Increase) decrease in other assets not separately identified
|
(1
|
)
|
23
|
|
6
|
|
|||||
|
Increase in merchandise accounts payable
|
101
|
|
23
|
|
143
|
|
|||||
|
Increase (decrease) in accounts payable and accrued
liabilities not separately identified |
48
|
|
(33
|
)
|
109
|
|
|||||
|
Increase (decrease) in current income taxes
|
7
|
|
(16
|
)
|
188
|
|
|||||
|
Increase (decrease) in deferred income taxes
|
(142
|
)
|
14
|
|
153
|
|
|||||
|
Increase (decrease) in other liabilities not separately identified
|
197
|
|
(75
|
)
|
(384
|
)
|
|||||
|
Net cash provided by operating activities
|
2,549
|
|
2,179
|
|
2,173
|
|
|||||
|
Cash flows from investing activities:
|
|||||||||||
|
Purchase of property and equipment
|
(607
|
)
|
(698
|
)
|
(555
|
)
|
|||||
|
Capitalized software
|
(256
|
)
|
(244
|
)
|
(209
|
)
|
|||||
|
Disposition of property and equipment
|
132
|
|
66
|
|
114
|
|
|||||
|
Proceeds from insurance claims
|
—
|
|
—
|
|
6
|
|
|||||
|
Other, net
|
(57
|
)
|
95
|
|
(53
|
)
|
|||||
|
Net cash used by investing activities
|
(788
|
)
|
(781
|
)
|
(697
|
)
|
|||||
|
Cash flows from financing activities:
|
|||||||||||
|
Debt issued
|
400
|
|
1,000
|
|
800
|
|
|||||
|
Financing costs
|
(9
|
)
|
(11
|
)
|
(20
|
)
|
|||||
|
Debt repaid
|
(124
|
)
|
(1,803
|
)
|
(454
|
)
|
|||||
|
Dividends paid
|
(359
|
)
|
(324
|
)
|
(148
|
)
|
|||||
|
Increase (decrease) in outstanding checks
|
24
|
|
(88
|
)
|
49
|
|
|||||
|
Acquisition of treasury stock
|
(1,571
|
)
|
(1,397
|
)
|
(502
|
)
|
|||||
|
Issuance of common stock
|
315
|
|
234
|
|
162
|
|
|||||
|
Net cash used by financing activities
|
(1,324
|
)
|
(2,389
|
)
|
(113
|
)
|
|||||
|
Net increase (decrease) in cash and cash equivalents
|
437
|
|
(991
|
)
|
1,363
|
|
|||||
|
Cash and cash equivalents beginning of period
|
1,836
|
|
2,827
|
|
1,464
|
|
|||||
|
Cash and cash equivalents end of period
|
$
|
2,273
|
|
$
|
1,836
|
|
$
|
2,827
|
|
||
|
Supplemental cash flow information:
|
|||||||||||
|
Interest paid
|
$
|
388
|
|
$
|
585
|
|
$
|
474
|
|
||
|
Interest received
|
2
|
|
2
|
|
4
|
|
|||||
|
Income taxes paid (net of refunds received)
|
835
|
|
738
|
|
401
|
|
|||||
The accompanying notes are an integral part of these Consolidated Financial Statements.
F-8
MACY’S, INC.
NOTES TO CONSOLIDATED FINANCIAL STATEMENTS
|
1.
|
Organization and Summary of Significant Accounting Policies
|
Nature of Operations
Macy’s, Inc. and subsidiaries (the “Company”) is an omnichannel retail organization operating stores and Internet websites under two brands (Macy’s and Bloomingdale’s) that sell a wide range of merchandise, including apparel and accessories (men's, women's and children's), cosmetics, home furnishings and other consumer goods in
45
states, the District of Columbia, Guam and Puerto Rico. As of
February 1, 2014
, the Company’s operations and reportable segments were conducted through Macy’s, macys.com, Bloomingdale’s, bloomingdales.com and Bloomingdale’s Outlet, which are aggregated into one reporting segment in accordance with the Financial Accounting Standards Board (“FASB”) Accounting Standards Codification (“ASC”) Topic 280, “Segment Reporting.” The metrics used by management to assess the performance of the Company’s operating divisions include sales trends, gross margin rates, expense rates, and rates of earnings before interest and taxes (“EBIT”) and earnings before interest, taxes, depreciation and amortization (“EBITDA”). The Company’s operating divisions have historically had similar economic characteristics and are expected to have similar economic characteristics and long-term financial performance in future periods.
For
2013
,
2012
and
2011
, the following merchandise constituted the following percentages of sales:
|
2013
|
2012
|
2011
|
||||||
|
Feminine Accessories, Intimate Apparel, Shoes and Cosmetics
|
38
|
%
|
38
|
%
|
37
|
%
|
||
|
Feminine Apparel
|
23
|
|
23
|
|
25
|
|
||
|
Men’s and Children’s
|
23
|
|
23
|
|
23
|
|
||
|
Home/Miscellaneous
|
16
|
|
16
|
|
15
|
|
||
|
100
|
%
|
100
|
%
|
100
|
%
|
|||
Fiscal Year
The Company’s fiscal year ends on the Saturday closest to January 31. Fiscal years
2013
,
2012
and
2011
ended on
February 1, 2014
,
February 2, 2013
and
January 28, 2012
, respectively. Fiscal years 2013 and 2011 included 52 weeks and fiscal year 2012 included 53 weeks. References to years in the Consolidated Financial Statements relate to fiscal years rather than calendar years.
Basis of Presentation
The Consolidated Financial Statements include the accounts of the Company and its 100%-owned subsidiaries. All significant intercompany transactions have been eliminated.
Certain reclassifications were made to prior years’ amounts to conform with the classifications of such amounts for the most recent year.
Use of Estimates
The preparation of financial statements in conformity with accounting principles generally accepted in the United States of America requires management to make estimates and assumptions that affect the reported amounts of assets and liabilities and disclosure of contingent assets and liabilities at the date of the financial statements and the reported amounts of revenues and expenses during the reporting period. Such estimates and assumptions are subject to inherent uncertainties, which may result in actual amounts differing from reported amounts.
F-9
Net Sales
Net sales include merchandise sales, licensed department income, shipping and handling fees, sales of private brand goods directly to third party retailers and sales of excess inventory to third parties. Sales of merchandise are recorded at the time of delivery to the customer and are reported net of merchandise returns. The Company licenses third parties to operate certain departments in its stores. The Company receives commissions from these licensed departments based on a percentage of net sales. Commissions are recognized as income at the time merchandise is sold to customers. Sales taxes collected from customers are not considered revenue and are included in accounts payable and accrued liabilities until remitted to the taxing authorities.
Cost of Sales
Cost of sales consists of the cost of merchandise, including inbound freight, and shipping and handling costs. An estimated allowance for future sales returns is recorded and cost of sales is adjusted accordingly.
Cash and Cash Equivalents
Cash and cash equivalents include cash and liquid investments with original maturities of three months or less. Cash and cash equivalents includes amounts due in respect of credit card sales transactions that are settled early in the following period in the amount of
$101 million
at
February 1, 2014
and
$99 million
at
February 2, 2013
.
Investments
The Company from time to time invests in debt and equity securities, including companies engaged in complementary businesses. All marketable equity and debt securities held by the Company are accounted for under ASC Topic 320, “Investments – Debt and Equity Securities.” Unrealized holding gains and losses on trading securities are recognized in statement of operations and unrealized holding gains and losses on available-for-sale securities are included as a separate component of accumulated other comprehensive income, net of income tax effect, until realized. At February 1, 2014, the Company did not hold any held-to-maturity or available-for-sale securities.
Receivables
In connection with the sale of most of the Company’s credit assets to Citibank, the Company and Citibank entered into a long-term marketing and servicing alliance pursuant to the terms of a Credit Card Program Agreement (the “Program Agreement”). Income earned under the Program Agreement is treated as a reduction of selling, general and administrative ("SG&A") expenses on the Consolidated Statements of Income. Under the Program Agreement, Citibank offers proprietary and non-proprietary credit to the Company’s customers through previously existing and newly opened accounts.
Loyalty Programs
The Company maintains customer loyalty programs in which customers earn rewards based on their spending. Upon reaching certain levels of qualified spending, customers automatically receive rewards to apply toward future purchases. The Company recognizes the estimated net amount of the rewards that will be earned and redeemed as a reduction to net sales.
Merchandise Inventories
Merchandise inventories are valued at lower of cost or market using the last-in, first-out (LIFO) retail inventory method. Under the retail inventory method, inventory is segregated into departments of merchandise having similar characteristics, and is stated at its current retail selling value. Inventory retail values are converted to a cost basis by applying specific average cost factors for each merchandise department. Cost factors represent the average cost-to-retail ratio for each merchandise department based on beginning inventory and the fiscal year purchase activity. At
February 1, 2014
and
February 2, 2013
, merchandise inventories valued at LIFO, including adjustments as necessary to record inventory at the lower of cost or market, approximated the cost of such inventories using the first-in, first-out (FIFO) retail inventory method. The application of the LIFO retail inventory method did not result in the recognition of any LIFO charges or credits affecting cost of sales for
2013
,
2012
or
2011
. The retail inventory method inherently requires management judgments and estimates, such as the amount and timing of permanent markdowns to clear unproductive or slow-moving inventory, which may impact the ending inventory valuation as well as gross margins.
F-10
Permanent markdowns designated for clearance activity are recorded when the utility of the inventory has diminished. Factors considered in the determination of permanent markdowns include current and anticipated demand, customer preferences, age of the merchandise and fashion trends. When a decision is made to permanently mark down merchandise, the resulting gross margin reduction is recognized in the period the markdown is recorded.
Physical inventories are generally taken within each merchandise department annually, and inventory records are adjusted accordingly, resulting in the recording of actual shrinkage. While it is not possible to quantify the impact from each cause of shrinkage, the Company has loss prevention programs and policies that are intended to minimize shrinkage. Physical inventories are taken at all store locations for substantially all merchandise categories approximately three weeks before the end of the fiscal year. Shrinkage is estimated as a percentage of sales at interim periods and for this approximate three-week period, based on historical shrinkage rates.
Vendor Allowances
The Company receives certain allowances as reimbursement for markdowns taken and/or to support the gross margins earned in connection with the sales of merchandise. These allowances are generally credited to cost of sales at the time the merchandise is sold in accordance with ASC Subtopic 605-50, “Customer Payments and Incentives.” The Company also receives advertising allowances from approximately
1,000
of its merchandise vendors pursuant to cooperative advertising programs, with some vendors participating in multiple programs. These allowances represent reimbursements by vendors of costs incurred by the Company to promote the vendors’ merchandise and are netted against advertising and promotional costs when the related costs are incurred in accordance with ASC Subtopic 605-50. Advertising allowances in excess of costs incurred are recorded as a reduction of merchandise costs and, ultimately, through cost of sales when the merchandise is sold.
The arrangements pursuant to which the Company’s vendors provide allowances, while binding, are generally informal in nature and
one
year or less in duration. The terms and conditions of these arrangements vary significantly from vendor to vendor and are influenced by, among other things, the type of merchandise to be supported.
Advertising
Department store non-direct response advertising and promotional costs are expensed either as incurred or the first time the advertising occurs. Direct response advertising and promotional costs are deferred and expensed over the period during which the sales are expected to occur, generally
one
to
four
months. Advertising and promotional costs and cooperative advertising allowances were as follows:
|
2013
|
2012
|
2011
|
|||||||||
|
(millions)
|
|||||||||||
|
Gross advertising and promotional costs
|
$
|
1,623
|
|
$
|
1,554
|
|
$
|
1,432
|
|
||
|
Cooperative advertising allowances
|
457
|
|
431
|
|
372
|
|
|||||
|
Advertising and promotional costs, net of
cooperative advertising allowances |
$
|
1,166
|
|
$
|
1,123
|
|
$
|
1,060
|
|
||
|
Net sales
|
$
|
27,931
|
|
$
|
27,686
|
|
$
|
26,405
|
|
||
|
Advertising and promotional costs, net of cooperative
advertising allowances, as a percent to net sales |
4.2
|
%
|
4.1
|
%
|
4.0
|
%
|
|||||
Property and Equipment
Depreciation of owned properties is provided primarily on a straight-line basis over the estimated asset lives, which range from
fifteen
to
fifty
years for buildings and building equipment and
three
to
fifteen
years for fixtures and equipment. Real estate taxes and interest on construction in progress and land under development are capitalized. Amounts capitalized are amortized over the estimated lives of the related depreciable assets. The Company receives contributions from developers and merchandise vendors to fund building improvement and the construction of vendor shops. Such contributions are netted against the capital expenditures.
Buildings on leased land and leasehold improvements are amortized over the shorter of their economic lives or the lease term, beginning on the date the asset is put into use.
F-11
The carrying value of long-lived assets is periodically reviewed by the Company whenever events or changes in circumstances indicate that a potential impairment has occurred. For long-lived assets held for use, a potential impairment has occurred if projected future undiscounted cash flows are less than the carrying value of the assets. The estimate of cash flows includes management’s assumptions of cash inflows and outflows directly resulting from the use of those assets in operations. When a potential impairment has occurred, an impairment write-down is recorded if the carrying value of the long-lived asset exceeds its fair value. The Company believes its estimated cash flows are sufficient to support the carrying value of its long-lived assets. If estimated cash flows significantly differ in the future, the Company may be required to record asset impairment write-downs.
If the Company commits to a plan to dispose of a long-lived asset before the end of its previously estimated useful life, estimated cash flows are revised accordingly, and the Company may be required to record an asset impairment write-down. Additionally, related liabilities arise such as severance, contractual obligations and other accruals associated with store closings from decisions to dispose of assets. The Company estimates these liabilities based on the facts and circumstances in existence for each restructuring decision. The amounts the Company will ultimately realize or disburse could differ from the amounts assumed in arriving at the asset impairment and restructuring charge recorded.
The Company classifies certain long-lived assets as held for disposal by sale and ceases depreciation when the particular criteria for such classification are met, including the probable sale within one year. For long-lived assets to be disposed of by sale, an impairment charge is recorded if the carrying amount of the asset exceeds its fair value less costs to sell. Such valuations include estimations of fair values and incremental direct costs to transact a sale.
Leases
The Company recognizes operating lease minimum rentals on a straight-line basis over the lease term. Executory costs such as real estate taxes and maintenance, and contingent rentals such as those based on a percentage of sales are recognized as incurred.
The lease term, which includes all renewal periods that are considered to be reasonably assured, begins on the date the Company has access to the leased property. The Company receives contributions from landlords to fund buildings and leasehold improvements. Such contributions are recorded as deferred rent and amortized as reductions to lease expense over the lease term.
Goodwill and Other Intangible Assets
The carrying value of goodwill and other intangible assets with indefinite lives are reviewed at least annually for possible impairment in accordance with ASC Subtopic 350-20 “Goodwill.” Goodwill and other intangible assets with indefinite lives have been assigned to reporting units for purposes of impairment testing. The reporting units are the Company’s retail operating divisions. Goodwill and other intangible assets with indefinite lives are tested for impairment annually at the end of the fiscal month of May. The Company evaluates qualitative factors to determine if it is more likely than not that the fair value of a reporting unit is less than its carrying value and whether it is necessary to perform the two-step goodwill impairment process. If required, the first step involves a comparison of each reporting unit’s fair value to its carrying value and the Company estimates fair value based on discounted cash flows. The reporting unit’s discounted cash flows require significant management judgment with respect to sales, gross margin and SG&A rates, capital expenditures and the selection and use of an appropriate discount rate. The projected sales, gross margin and SG&A expense rate assumptions and capital expenditures are based on the Company’s annual business plan or other forecasted results. Discount rates reflect market-based estimates of the risks associated with the projected cash flows directly resulting from the use of those assets in operations. The estimates of fair value of reporting units are based on the best information available as of the date of the assessment. If the carrying value of a reporting unit exceeds its estimated fair value in the first step, a second step is performed, in which the reporting unit’s goodwill is written down to its implied fair value. The second step requires the Company to allocate the fair value of the reporting unit derived in the first step to the fair value of the reporting unit’s net assets, with any fair value in excess of amounts allocated to such net assets representing the implied fair value of goodwill for that reporting unit. If the carrying value of an individual indefinite-lived intangible asset exceeds its fair value, such individual indefinite-lived intangible asset is written down by an amount equal to such excess.
Capitalized Software
The Company capitalizes purchased and internally developed software and amortizes such costs to expense on a straight-line basis over
two
to
five
years. Capitalized software is included in other assets on the Consolidated Balance Sheets.
F-12
Gift Cards
The Company only offers no-fee, non-expiring gift cards to its customers. At the time gift cards are sold, no revenue is recognized; rather, the Company records an accrued liability to customers. The liability is relieved and revenue is recognized equal to the amount redeemed at the time gift cards are redeemed for merchandise. The Company records income from unredeemed gift cards (breakage) as a reduction of SG&A expenses, and income is recorded in proportion and over the time period gift cards are actually redeemed. At least
three
years of historical data, updated annually, is used to determine actual redemption patterns.
Self-Insurance Reserves
The Company, through its insurance subsidiary, is self-insured for workers compensation and general liability claims up to certain maximum liability amounts. Although the amounts accrued are actuarially determined based on analysis of historical trends of losses, settlements, litigation costs and other factors, the amounts the Company will ultimately disburse could differ from such accrued amounts.
Post Employment and Postretirement Obligations
The Company, through its actuaries, utilizes assumptions when estimating the liabilities for pension and other employee benefit plans. These assumptions, where applicable, include the discount rates used to determine the actuarial present value of projected benefit obligations, the rate of increase in future compensation levels, the long-term rate of return on assets and the growth in health care costs. The cost of these benefits is generally recognized in the Consolidated Financial Statements over an employee’s term of service with the Company, and the accrued benefits are reported in accounts payable and accrued liabilities and other liabilities on the Consolidated Balance Sheets, as appropriate.
Income Taxes
Income taxes are accounted for under the asset and liability method. Deferred income tax assets and liabilities are recognized for the future tax consequences attributable to differences between the financial statement carrying amounts of existing assets and liabilities and their respective tax bases, and net operating loss and tax credit carryforwards. Deferred income tax assets and liabilities are measured using enacted tax rates expected to apply to taxable income in the years in which those temporary differences are expected to be recovered or settled. The effect on deferred income tax assets and liabilities of a change in tax rates is recognized in the Consolidated Statements of Income in the period that includes the enactment date. Deferred income tax assets are reduced by a valuation allowance when it is more likely than not that some portion of the deferred income tax assets will not be realized.
Derivatives
The Company records derivative transactions according to the provisions of ASC Topic 815 “Derivatives and Hedging,” which establishes accounting and reporting standards for derivative instruments and hedging activities and requires recognition of all derivatives as either assets or liabilities and measurement of those instruments at fair value. The Company makes limited use of derivative financial instruments. The Company does not use financial instruments for trading or other speculative purposes and is not a party to any leveraged financial instruments. On the date that the Company enters into a derivative contract, the Company designates the derivative instrument as either a fair value hedge, a cash flow hedge or as a free-standing derivative instrument, each of which would receive different accounting treatment. Prior to entering into a hedge transaction, the Company formally documents the relationship between hedging instruments and hedged items, as well as the risk management objective and strategy for undertaking various hedge transactions. Derivative instruments that the Company may use as part of its interest rate risk management strategy include interest rate swap and interest rate cap agreements and Treasury lock agreements. At
February 1, 2014
, the Company was not a party to any derivative financial instruments.
Stock Based Compensation
The Company records stock-based compensation expense according to the provisions of ASC Topic 718, “Compensation – Stock Compensation.” ASC Topic 718 requires all share-based payments to employees, including grants of employee stock options, to be recognized in the financial statements based on their fair values. Under the provisions of ASC Topic 718, the Company determines the appropriate fair value model to be used for valuing share-based payments and the amortization method for compensation cost.
F-13
|
2.
|
Impairments, Store Closing and Other Costs and Gain on Sale of Leases
|
Impairments, store closing and other costs and gain on sale of leases consist of the following:
|
2013
|
2012
|
2011
|
|||||||||
|
|
(millions)
|
||||||||||
|
Impairments of properties held and used
|
$
|
39
|
|
$
|
4
|
|
$
|
22
|
|
||
|
Severance
|
43
|
|
3
|
|
4
|
|
|||||
|
Gain on sale of leases
|
—
|
|
—
|
|
(54
|
)
|
|||||
|
Other
|
6
|
|
(2
|
)
|
3
|
|
|||||
|
$
|
88
|
|
$
|
5
|
|
$
|
(25
|
)
|
|||
During January 2014, the Company announced a series of cost-reduction initiatives, including organization changes that combine certain region and district organizations of the My Macy’s store management structure and the realignment and elimination of certain store, central office and administrative functions.
During January 2014, the Company announced the closure of
five
Macy's stores; during January 2013, the Company announced the closure of
six
Macy's and Bloomingdale's stores; and during January 2012, the Company announced the closure of
ten
Macy’s and Bloomingdale's stores.
In connection with these announcements and the plans to dispose of these locations, the Company incurred severance and other human resource-related costs and other costs related to lease obligations and other store liabilities.
As a result of the Company’s projected undiscounted future cash flows related to certain store locations and other assets being less than their carrying value, the Company recorded impairment charges, including properties that were the subject of announced store closings. The fair values of these assets were calculated based on the projected cash flows and an estimated risk-adjusted rate of return that would be used by market participants in valuing these assets or based on prices of similar assets.
The Company expects to pay out the 2013 accrued severance costs, which are included in accounts payable and accrued liabilities on the Consolidated Balance Sheets, prior to May 3, 2014. The 2012 and 2011 accrued severance costs, which were included in accounts payable and accrued liabilities on the Consolidated Balance Sheets, were paid out in the fiscal year subsequent to incurring such severance costs.
During 2011, the Company recognized a gain on the sale of store leases related to the 2006 divestiture of Lord & Taylor, partially offset by impairment charges and other costs and expenses related to store closings.
|
3.
|
Receivables
|
Receivables were
$438 million
at
February 1, 2014
, compared to
$371 million
at
February 2, 2013
.
In connection with the sale of most of the Company's credit card accounts and related receivable balances to Citibank, the Company and Citibank entered into a long-term marketing and servicing alliance pursuant to the terms of a Credit Card Program Agreement (the “Program Agreement”) with an initial term of
10
years expiring on
July 17, 2016
and, unless terminated by either party as of the expiration of the initial term, an additional renewal term of
three
years. The Program Agreement provides for, among other things, (i) the ownership by Citibank of the accounts purchased by Citibank, (ii) the ownership by Citibank of new accounts opened by the Company’s customers, (iii) the provision of credit by Citibank to the holders of the credit cards associated with the foregoing accounts, (iv) the servicing of the foregoing accounts, and (v) the allocation between Citibank and the Company of the economic benefits and burdens associated with the foregoing and other aspects of the alliance.
Pursuant to the Program Agreement, the Company continues to provide certain servicing functions related to the accounts and related receivables owned by Citibank and receives compensation from Citibank for these services. The amounts earned under the Program Agreement related to the servicing functions are deemed adequate compensation and, accordingly, no servicing asset or liability has been recorded on the Consolidated Balance Sheets.
F-14
Amounts received under the Program Agreement were
$928 million
for
2013
,
$865 million
for
2012
and
$772 million
for
2011
, and are treated as reductions of SG&A expenses on the Consolidated Statements of Income. The Company’s earnings from credit operations, net of servicing expenses, were
$731 million
for
2013
,
$663 million
for
2012
, and
$582 million
for
2011
.
|
4.
|
Properties and Leases
|
|
February 1,
2014 |
February 2,
2013 |
||||||
|
(millions)
|
|||||||
|
Land
|
$
|
1,696
|
|
$
|
1,736
|
|
|
|
Buildings on owned land
|
5,405
|
|
5,398
|
|
|||
|
Buildings on leased land and leasehold improvements
|
2,041
|
|
2,057
|
|
|||
|
Fixtures and equipment
|
4,811
|
|
4,909
|
|
|||
|
Leased properties under capitalized leases
|
43
|
|
43
|
|
|||
|
13,996
|
|
14,143
|
|
||||
|
Less accumulated depreciation and amortization
|
6,066
|
|
5,947
|
|
|||
|
$
|
7,930
|
|
$
|
8,196
|
|
||
In connection with various shopping center agreements, the Company is obligated to operate certain stores within the centers for periods of up to
twenty
years. Some of these agreements require that the stores be operated under a particular name.
The Company leases a portion of the real estate and personal property used in its operations. Most leases require the Company to pay real estate taxes, maintenance and other executory costs; some also require additional payments based on percentages of sales and some contain purchase options. Certain of the Company’s real estate leases have terms that extend for significant numbers of years and provide for rental rates that increase or decrease over time. In addition, certain of these leases contain covenants that restrict the ability of the tenant (typically a subsidiary of the Company) to take specified actions (including the payment of dividends or other amounts on account of its capital stock) unless the tenant satisfies certain financial tests.
Minimum rental commitments (excluding executory costs) at
February 1, 2014
, for noncancellable leases are:
|
Capitalized
Leases
|
Operating
Leases
|
Total
|
|||||||||
|
(millions)
|
|||||||||||
|
Fiscal year
|
|||||||||||
|
2014
|
$
|
4
|
|
$
|
282
|
|
$
|
286
|
|
||
|
2015
|
3
|
|
253
|
|
256
|
|
|||||
|
2016
|
3
|
|
224
|
|
227
|
|
|||||
|
2017
|
3
|
|
202
|
|
205
|
|
|||||
|
2018
|
3
|
|
184
|
|
187
|
|
|||||
|
After 2018
|
46
|
|
1,775
|
|
1,821
|
|
|||||
|
Total minimum lease payments
|
62
|
|
$
|
2,920
|
|
$
|
2,982
|
|
|||
|
Less amount representing interest
|
30
|
|
|||||||||
|
Present value of net minimum capitalized lease payments
|
$
|
32
|
|
||||||||
F-15
Capitalized leases are included in the Consolidated Balance Sheets as property and equipment while the related obligation is included in short-term (
$2 million
) and long-term (
$30 million
) debt. Amortization of assets subject to capitalized leases is included in depreciation and amortization expense. Total minimum lease payments shown above have not been reduced by minimum sublease rentals of
$34 million
on operating leases.
The Company is a guarantor with respect to certain lease obligations associated with The May Department Stores Company and previously disposed subsidiaries or businesses. The leases, one of which includes potential extensions to
2070
, have future minimum lease payments aggregating
$334 million
and are offset by payments from existing tenants and subtenants. In addition, the Company is liable for other expenses related to the above leases, such as property taxes and common area maintenance, which are also payable by existing tenants and subtenants. Potential liabilities related to these guarantees are subject to certain defenses by the Company. The Company believes that the risk of significant loss from the guarantees of these lease obligations is remote.
Rental expense consists of:
|
2013
|
2012
|
2011
|
|||||||||
|
(millions)
|
|||||||||||
|
Real estate (excluding executory costs)
|
|||||||||||
|
Capitalized leases –
|
|||||||||||
|
Contingent rentals
|
$
|
—
|
|
$
|
—
|
|
$
|
—
|
|
||
|
Operating leases –
|
|||||||||||
|
Minimum rentals
|
256
|
|
248
|
|
242
|
|
|||||
|
Contingent rentals
|
22
|
|
21
|
|
19
|
|
|||||
|
278
|
|
269
|
|
261
|
|
||||||
|
Less income from subleases –
|
|||||||||||
|
Operating leases
|
(10
|
)
|
(11
|
)
|
(18
|
)
|
|||||
|
$
|
268
|
|
$
|
258
|
|
$
|
243
|
|
|||
|
Personal property – Operating leases
|
$
|
11
|
|
$
|
11
|
|
$
|
10
|
|
||
Included as a reduction to the expense above is deferred rent amortization of
$8 million
,
$7 million
and
$8 million
for
2013
,
2012
and
2011
, respectively, related to contributions received from landlords.
F-16
|
5.
|
Goodwill and Other Intangible Assets
|
The following summarizes the Company’s goodwill and other intangible assets:
|
February 1,
2014 |
February 2,
2013 |
||||||
|
(millions)
|
|||||||
|
Non-amortizing intangible assets
|
|||||||
|
Goodwill
|
$
|
9,125
|
|
$
|
9,125
|
|
|
|
Accumulated impairment losses
|
(5,382
|
)
|
(5,382
|
)
|
|||
|
3,743
|
|
3,743
|
|
||||
|
Tradenames
|
414
|
|
414
|
|
|||
|
$
|
4,157
|
|
$
|
4,157
|
|
||
|
Amortizing intangible assets
|
|||||||
|
Favorable leases
|
$
|
188
|
|
$
|
230
|
|
|
|
Customer relationships
|
188
|
|
188
|
|
|||
|
376
|
|
418
|
|
||||
|
Accumulated amortization
|
|||||||
|
Favorable leases
|
(104
|
)
|
(131
|
)
|
|||
|
Customer relationships
|
(159
|
)
|
(140
|
)
|
|||
|
(263
|
)
|
(271
|
)
|
||||
|
$
|
113
|
|
$
|
147
|
|
||
Intangible amortization expense amounted to
$34 million
for
2013
,
$37 million
for
2012
and
$39 million
for
2011
.
Future estimated intangible amortization expense is shown below:
|
|
(millions)
|
||
|
Fiscal year
|
|||
|
2014
|
$
|
31
|
|
|
2015
|
21
|
|
|
|
2016
|
8
|
|
|
|
2017
|
7
|
|
|
|
2018
|
7
|
|
|
Favorable lease intangible assets are being amortized over their respective lease terms (weighted average life of approximately
twelve
years) and customer relationship intangible assets are being amortized over their estimated useful lives of
ten
years.
F-17
|
6.
|
Financing
|
The Company’s debt is as follows:
|
February 1,
2014 |
February 2,
2013 |
||||||
|
(millions)
|
|||||||
|
Short-term debt:
|
|||||||
|
5.75% Senior notes due 2014
|
$
|
453
|
|
$
|
—
|
|
|
|
7.625% Senior debentures due 2013
|
—
|
|
109
|
|
|||
|
Capital lease and current portion of other long-term obligations
|
10
|
|
15
|
|
|||
|
$
|
463
|
|
$
|
124
|
|
||
|
Long-term debt:
|
|||||||
|
2.875% Senior notes due 2023
|
$
|
750
|
|
$
|
750
|
|
|
|
5.9% Senior notes due 2016
|
577
|
|
577
|
|
|||
|
3.875% Senior notes due 2022
|
550
|
|
550
|
|
|||
|
6.375% Senior notes due 2037
|
500
|
|
500
|
|
|||
|
7.875% Senior notes due 2015 *
|
407
|
|
407
|
|
|||
|
4.375% Senior notes due 2023
|
400
|
|
—
|
|
|||
|
6.9% Senior debentures due 2029
|
400
|
|
400
|
|
|||
|
6.7% Senior debentures due 2034
|
400
|
|
400
|
|
|||
|
7.45% Senior debentures due 2017
|
300
|
|
300
|
|
|||
|
6.65% Senior debentures due 2024
|
300
|
|
300
|
|
|||
|
7.0% Senior debentures due 2028
|
300
|
|
300
|
|
|||
|
6.9% Senior debentures due 2032
|
250
|
|
250
|
|
|||
|
5.125% Senior debentures due 2042
|
250
|
|
250
|
|
|||
|
4.3% Senior notes due 2043
|
250
|
|
250
|
|
|||
|
6.7% Senior debentures due 2028
|
200
|
|
200
|
|
|||
|
6.79% Senior debentures due 2027
|
165
|
|
165
|
|
|||
|
7.875% Senior debentures due 2036
|
108
|
|
108
|
|
|||
|
8.125% Senior debentures due 2035
|
76
|
|
76
|
|
|||
|
7.5% Senior debentures due 2015
|
69
|
|
69
|
|
|||
|
8.75% Senior debentures due 2029
|
61
|
|
61
|
|
|||
|
7.45% Senior debentures due 2016
|
59
|
|
59
|
|
|||
|
8.5% Senior debentures due 2019
|
36
|
|
36
|
|
|||
|
10.25% Senior debentures due 2021
|
33
|
|
33
|
|
|||
|
9.5% amortizing debentures due 2021
|
25
|
|
29
|
|
|||
|
7.6% Senior debentures due 2025
|
24
|
|
24
|
|
|||
|
7.875% Senior debentures due 2030
|
18
|
|
18
|
|
|||
|
9.75% amortizing debentures due 2021
|
14
|
|
16
|
|
|||
|
5.75% Senior notes due 2014
|
—
|
|
453
|
|
|||
|
Premium on acquired debt, using an effective
interest yield of 5.266% to 6.165%
|
176
|
|
191
|
|
|||
|
Capital lease and other long-term obligations
|
30
|
|
34
|
|
|||
|
$
|
6,728
|
|
$
|
6,806
|
|
||
________________
|
*
|
The rate of interest payable in respect of these senior notes was increased by
one percent
per annum to
8.875%
in April 2009 as a result of a downgrade of the notes by specified rating agencies, was decreased by
0.50 percent
per annum to
8.375%
effective in May 2010 as a result of an upgrade of the notes by specified rating agencies, was decreased by
0.25 percent
per annum to
8.125%
effective in May 2011 as a result of an upgrade of the notes by specified rating agencies, and was decreased by
0.25 percent
per annum to
7.875%
, its stated interest rate, effective in January 2012 as a result of an upgrade of the notes by specified rating agencies. The rate of interest payable in respect of these senior notes could increase by up to
2.0%
per annum from its current level in the event of two or more downgrades of the notes by specified rating agencies.
|
F-18
Interest expense and premium on early retirement of debt is as follows:
|
2013
|
2012
|
2011
|
|||||||||
|
(millions)
|
|||||||||||
|
Interest on debt
|
$
|
407
|
|
$
|
449
|
|
$
|
467
|
|
||
|
Amortization of debt premium
|
(15
|
)
|
(19
|
)
|
(23
|
)
|
|||||
|
Amortization of financing costs
|
7
|
|
7
|
|
8
|
|
|||||
|
Interest on capitalized leases
|
2
|
|
3
|
|
3
|
|
|||||
|
401
|
|
440
|
|
455
|
|
||||||
|
Less interest capitalized on construction
|
11
|
|
15
|
|
8
|
|
|||||
|
Interest expense
|
$
|
390
|
|
$
|
425
|
|
$
|
447
|
|
||
|
Premium on early retirement of debt
|
$
|
—
|
|
$
|
137
|
|
$
|
—
|
|
||
On
November 28, 2012
, the Company repurchased
$700 million
aggregate principal amount of its outstanding senior unsecured notes, which had a net book value of
$706 million
. The repurchased senior unsecured notes had stated interest rates ranging from
5.9%
to
7.875%
and maturities in
2015
and
2016
. The Company recorded the redemption premium and other costs related to these repurchases as additional interest expense of
$133 million
in 2012. On
March 29, 2012
, the Company redeemed the $173 million of
8.0%
senior debentures due
July 15, 2012
, as allowed under the terms of the indenture. The price for the redemption was calculated pursuant to the indenture and resulted in the recognition of additional interest expense of
$4 million
in 2012. The additional interest expense resulting from these transactions is presented as premium on early retirement of debt on the Consolidated Statements of Income.
Future maturities of long-term debt, other than capitalized leases and premium on acquired debt, are shown below:
|
|
(millions)
|
||
|
Fiscal year
|
|||
|
2015
|
$
|
481
|
|
|
2016
|
642
|
|
|
|
2017
|
306
|
|
|
|
2018
|
6
|
|
|
|
2019
|
41
|
|
|
|
After 2019
|
5,046
|
|
|
During
2013
,
2012
and
2011
, the Company repaid
$109 million
,
$914 million
and
$439 million
, respectively, of indebtedness at maturity.
On
September 6, 2013
, the Company issued
$400 million
aggregate principal amount of
4.375%
senior notes due
2023
, the proceeds of which were used for general corporate purposes.
On
January 10, 2012
, the Company issued
$550 million
aggregate principal amount of
3.875%
senior notes due
2022
and
$250 million
aggregate principal amount of
5.125%
senior notes due
2042
, the proceeds of which were used to retire indebtedness that matured during the first half of 2012.
On
November 20, 2012
, the Company issued
$750 million
aggregate principal amount of
2.875%
senior unsecured notes due
2023
and
$250 million
aggregate principal amount of
4.3%
senior unsecured notes due
2043
. This debt was used to pay for the notes repurchased on
November 28, 2012
described above, and to retire
$298 million
of
5.875%
senior unsecured notes that matured in January 2013.
F-19
The following table shows the detail of debt repayments:
|
2013
|
2012
|
2011
|
|||||||||
|
|
(millions)
|
||||||||||
|
7.625% Senior debentures due 2013
|
$
|
109
|
|
$
|
—
|
|
$
|
—
|
|
||
|
5.35% Senior notes due 2012
|
—
|
|
616
|
|
—
|
|
|||||
|
5.90% Senior notes due 2016
|
—
|
|
400
|
|
—
|
|
|||||
|
5.875% Senior notes due 2013
|
—
|
|
298
|
|
—
|
|
|||||
|
7.875% Senior notes due 2015
|
—
|
|
205
|
|
—
|
|
|||||
|
8.0% Senior debentures due 2012
|
—
|
|
173
|
|
—
|
|
|||||
|
7.45% Senior debentures due 2016
|
—
|
|
64
|
|
—
|
|
|||||
|
7.5% Senior debentures due 2015
|
—
|
|
31
|
|
—
|
|
|||||
|
6.625% Senior notes due 2011
|
—
|
|
—
|
|
330
|
|
|||||
|
7.45% Senior debentures due 2011
|
—
|
|
—
|
|
109
|
|
|||||
|
9.5% amortizing debentures due 2021
|
4
|
|
4
|
|
4
|
|
|||||
|
9.75% amortizing debentures due 2021
|
2
|
|
2
|
|
2
|
|
|||||
|
Capital leases and other obligations
|
9
|
|
10
|
|
9
|
|
|||||
|
$
|
124
|
|
$
|
1,803
|
|
$
|
454
|
|
|||
The following summarizes certain components of the Company’s debt:
Bank Credit Agreement
The Company entered into a new credit agreement with certain financial institutions on May 10, 2013 providing for revolving credit borrowings and letters of credit in an aggregate amount not to exceed
$1,500 million
(which may be increased to
$1,750 million
at the option of the Company, subject to the willingness of existing or new lenders to provide commitments for such additional financing) outstanding at any particular time. The agreement is set to expire May 10, 2018 and replaced the prior agreement which was set to expire June 20, 2015.
As of
February 1, 2014
, and
February 2, 2013
, there were no revolving credit loans outstanding under these credit agreements, and there were no borrowings under these agreements throughout all of
2013
and
2012
. However, there were less than
$1 million
of standby letters of credit outstanding at
February 1, 2014
and
February 2, 2013
. Revolving loans under the credit agreement bear interest based on various published rates.
The Company's credit agreement, which is an obligation of a 100%-owned subsidiary of Macy’s, Inc. (“Parent”), is not secured. However, Parent has fully and unconditionally guaranteed this obligation, subject to specified limitations.The Company’s interest coverage ratio for
2013
was
9.40
and its leverage ratio at
February 1, 2014
was
1.85
, in each case as calculated in accordance with the credit agreement. The credit agreement requires the Company to maintain a specified interest coverage ratio for the latest four quarters of no less than
3.25
and a specified leverage ratio as of and for the latest four quarters of no more than
3.75
. The interest coverage ratio is defined as EBITDA (earnings before interest, taxes, depreciation and amortization) over net interest expense and the leverage ratio is defined as debt over EBITDA. For purposes of these calculations EBITDA is calculated as net income plus interest expense, taxes, depreciation, amortization, non-cash impairment of goodwill, intangibles and real estate, non-recurring cash charges not to exceed in the aggregate
$400 million
and extraordinary losses less interest income and non-recurring or extraordinary gains. Debt is adjusted to exclude the premium on acquired debt and net interest is adjusted to exclude the amortization of premium on acquired debt and premium on early retirement of debt.
F-20
A breach of a restrictive covenant in the Company’s credit agreement or the inability of the Company to maintain the financial ratios described above could result in an event of default under the credit agreement. In addition, an event of default would occur under the credit agreement if any indebtedness of the Company in excess of an aggregate principal amount of
$150 million
becomes due prior to its stated maturity or the holders of such indebtedness become able to cause it to become due prior to its stated maturity. Upon the occurrence of an event of default, the lenders could, subject to the terms and conditions of the credit agreement, elect to declare the outstanding principal, together with accrued interest, to be immediately due and payable. Moreover, most of the Company’s senior notes and debentures contain cross-default provisions based on the non-payment at maturity, or other default after an applicable grace period, of any other debt, the unpaid principal amount of which is not less than
$100 million
that could be triggered by an event of default under the credit agreement. In such an event, the Company’s senior notes and debentures that contain cross-default provisions would also be subject to acceleration.
Commercial Paper
The Company is a party to a
$1,500 million
unsecured commercial paper program. The Company may issue and sell commercial paper in an aggregate amount outstanding at any particular time not to exceed its then-current combined borrowing availability under the bank credit agreement described above. The issuance of commercial paper will have the effect, while such commercial paper is outstanding, of reducing the Company’s borrowing capacity under the bank credit agreement by an amount equal to the principal amount of such commercial paper. The Company had no commercial paper outstanding under its commercial paper program throughout all of
2013
and
2012
.
This program, which is an obligation of a 100%-owned subsidiary of Macy’s, Inc., is not secured. However, Parent has fully and unconditionally guaranteed the obligations.
Senior Notes and Debentures
The senior notes and the senior debentures are unsecured obligations of a 100%-owned subsidiary of Macy’s, Inc. and Parent has fully and unconditionally guaranteed these obligations (see Note 16, “Condensed Consolidating Financial Information”).
Other Financing Arrangements
At
February 1, 2014
and
February 2, 2013
, the Company had dedicated
$37 million
of cash, included in prepaid expenses and other current assets, which is used to collateralize the Company’s issuances of standby letters of credit. There were
$34 million
of other standby letters of credit outstanding at
February 1, 2014
and
February 2, 2013
.
F-21
|
7.
|
Accounts Payable and Accrued Liabilities
|
|
February 1,
2014 |
February 2,
2013 |
||||||
|
(millions)
|
|||||||
|
Accounts payable
|
$
|
746
|
|
$
|
625
|
|
|
|
Gift cards and customer award certificates
|
840
|
|
801
|
|
|||
|
Accrued wages and vacation
|
190
|
|
226
|
|
|||
|
Taxes other than income taxes
|
157
|
|
195
|
|
|||
|
Lease related liabilities
|
153
|
|
145
|
|
|||
|
Current portion of workers’ compensation and general liability reserves
|
131
|
|
138
|
|
|||
|
Current portion of post employment and postretirement benefits
|
110
|
|
100
|
|
|||
|
Accrued interest
|
89
|
|
78
|
|
|||
|
Allowance for future sales returns
|
85
|
|
81
|
|
|||
|
Severance and relocation
|
43
|
|
3
|
|
|||
|
Other
|
266
|
|
218
|
|
|||
|
$
|
2,810
|
|
$
|
2,610
|
|
||
Adjustments to the allowance for future sales returns, which amounted to charges of
$4 million
,
$5 million
and
$9 million
for
2013
,
2012
and
2011
, respectively, are reflected in cost of sales.
Changes in workers’ compensation and general liability reserves, including the current portion, are as follows:
|
2013
|
2012
|
2011
|
|||||||||
|
(millions)
|
|||||||||||
|
Balance, beginning of year
|
$
|
497
|
|
$
|
493
|
|
$
|
488
|
|
||
|
Charged to costs and expenses
|
147
|
|
157
|
|
144
|
|
|||||
|
Payments, net of recoveries
|
(147
|
)
|
(153
|
)
|
(139
|
)
|
|||||
|
Balance, end of year
|
$
|
497
|
|
$
|
497
|
|
$
|
493
|
|
||
The non-current portion of workers’ compensation and general liability reserves is included in other liabilities on the Consolidated Balance Sheets. At
February 1, 2014
and
February 2, 2013
, workers’ compensation and general liability reserves included
$107 million
and
$103 million
, respectively, of liabilities which are covered by deposits and receivables included in current assets on the Consolidated Balance Sheets.
|
8.
|
Taxes
|
Income tax expense is as follows:
|
|
2013
|
2012
|
2011
|
||||||||||||||||||||||||||||||||
|
Current
|
Deferred
|
Total
|
Current
|
Deferred
|
Total
|
Current
|
Deferred
|
Total
|
|||||||||||||||||||||||||||
|
(millions)
|
|||||||||||||||||||||||||||||||||||
|
Federal
|
$
|
859
|
|
$
|
(98
|
)
|
$
|
761
|
|
$
|
697
|
|
$
|
2
|
|
$
|
699
|
|
$
|
519
|
|
$
|
144
|
|
$
|
663
|
|
||||||||
|
State and local
|
107
|
|
(64
|
)
|
43
|
|
70
|
|
(2
|
)
|
68
|
|
43
|
|
6
|
|
49
|
|
|||||||||||||||||
|
$
|
966
|
|
$
|
(162
|
)
|
$
|
804
|
|
$
|
767
|
|
$
|
—
|
|
$
|
767
|
|
$
|
562
|
|
$
|
150
|
|
$
|
712
|
|
|||||||||
The income tax expense reported differs from the expected tax computed by applying the federal income tax statutory rate of
35%
for
2013
,
2012
and
2011
to income before income taxes. The reasons for this difference and their tax effects are as follows:
F-22
|
2013
|
2012
|
2011
|
|||||||||
|
(millions)
|
|||||||||||
|
Expected tax
|
$
|
801
|
|
$
|
736
|
|
$
|
689
|
|
||
|
State and local income taxes, net of federal income tax benefit
|
45
|
|
47
|
|
34
|
|
|||||
|
Historic rehabilitation tax credit
|
(16
|
)
|
—
|
|
—
|
|
|||||
|
Change in valuation allowance
|
(16
|
)
|
(2
|
)
|
(3
|
)
|
|||||
|
Other
|
(10
|
)
|
(14
|
)
|
(8
|
)
|
|||||
|
$
|
804
|
|
$
|
767
|
|
$
|
712
|
|
|||
The Company participates in the Internal Revenue Service (“IRS”) Compliance Assurance Program ("CAP"). As part of the CAP, tax years are audited on a contemporaneous basis so that all or most issues are resolved prior to the filing of the tax return. The IRS has completed examinations of 2011 and all prior tax years.
The tax effects of temporary differences that give rise to significant portions of the deferred tax assets and deferred tax liabilities are as follows:
|
February 1,
2014 |
February 2,
2013 |
||||||
|
(millions)
|
|||||||
|
Deferred tax assets
|
|||||||
|
Post employment and postretirement benefits
|
$
|
392
|
|
$
|
476
|
|
|
|
Accrued liabilities accounted for on a cash basis for tax purposes
|
289
|
|
237
|
|
|||
|
Long-term debt
|
90
|
|
96
|
|
|||
|
Unrecognized state tax benefits and accrued interest
|
84
|
|
71
|
|
|||
|
State operating loss and credit carryforwards
|
79
|
|
60
|
|
|||
|
Other
|
160
|
|
177
|
|
|||
|
Valuation allowance
|
(23
|
)
|
(39
|
)
|
|||
|
Total deferred tax assets
|
1,071
|
|
1,078
|
|
|||
|
Deferred tax liabilities
|
|||||||
|
Excess of book basis over tax basis of property and equipment
|
(1,569
|
)
|
(1,665
|
)
|
|||
|
Merchandise inventories
|
(587
|
)
|
(577
|
)
|
|||
|
Intangible assets
|
(263
|
)
|
(230
|
)
|
|||
|
Post employment benefits
|
(28
|
)
|
—
|
|
|||
|
Other
|
(297
|
)
|
(251
|
)
|
|||
|
Total deferred tax liabilities
|
(2,744
|
)
|
(2,723
|
)
|
|||
|
Net deferred tax liability
|
$
|
(1,673
|
)
|
$
|
(1,645
|
)
|
|
The valuation allowance at
February 1, 2014
and
February 2, 2013
relates to net deferred tax assets for state net operating loss and credit carryforwards. The net change in the valuation allowance amounted to a decrease of
$16 million
for
2013
and a decrease of
$2 million
for
2012
.
As of
February 1, 2014
, the Company had
no
federal net operating loss carryforwards and state net operating loss and credit carryforwards of
$608 million
, which will expire between
2014
and
2033
.
F-23
A reconciliation of the beginning and ending amount of unrecognized tax benefits is as follows:
|
February 1,
2014 |
February 2,
2013 |
January 28,
2012 |
|||||||||
|
(millions)
|
|||||||||||
|
Balance, beginning of year
|
$
|
170
|
|
$
|
179
|
|
$
|
205
|
|
||
|
Additions based on tax positions related to the current year
|
37
|
|
18
|
|
23
|
|
|||||
|
Additions for tax positions of prior years
|
—
|
|
18
|
|
—
|
|
|||||
|
Reductions for tax positions of prior years
|
(1
|
)
|
(19
|
)
|
(21
|
)
|
|||||
|
Settlements
|
(1
|
)
|
(9
|
)
|
(15
|
)
|
|||||
|
Statute expirations
|
(16
|
)
|
(17
|
)
|
(13
|
)
|
|||||
|
Balance, end of year
|
$
|
189
|
|
$
|
170
|
|
$
|
179
|
|
||
|
Amounts recognized in the Consolidated Balance Sheets at
February 1, 2014, February 2, 2013 and January 28, 2012
|
|||||||||||
|
Current income taxes
|
$
|
31
|
|
$
|
20
|
|
$
|
18
|
|
||
|
Long-term deferred income taxes
|
11
|
|
23
|
|
27
|
|
|||||
|
Other liabilities
|
147
|
|
127
|
|
134
|
|
|||||
|
$
|
189
|
|
$
|
170
|
|
$
|
179
|
|
|||
As of
February 1, 2014
and
February 2, 2013
, the amount of unrecognized tax benefits, net of deferred tax assets, that, if recognized would affect the effective income tax rate, was
$123 million
and
$111 million
, respectively.
The Company classifies unrecognized tax benefits not expected to be settled within
one
year as other liabilities on the Consolidated Balance Sheets.
The Company classifies federal, state and local interest and penalties not expected to be settled within one year as other liabilities on the Consolidated Balance Sheets and follows a policy of recognizing all interest and penalties related to unrecognized tax benefits in income tax expense. Federal, state and local interest and penalties, which amounted to an expense of
$9 million
for
2013
, a credit of
$10 million
for
2012
, and a credit of
$2 million
for
2011
, are reflected in income tax expense.
The Company had
$63 million
and
$55 million
accrued for the payment of federal, state and local interest and penalties at
February 1, 2014
and
February 2, 2013
, respectively. The accrued federal, state and local interest and penalties primarily relates to state tax issues and the amount of penalties paid in prior periods, and the amount of penalties accrued at
February 1, 2014
and
February 2, 2013
are insignificant. At
February 1, 2014
,
$51 million
of federal, state and local interest and penalties is included in other liabilities and
$12 million
is included in current income taxes on the Consolidated Balance Sheets.
The Company or one of its subsidiaries files income tax returns in the U.S. federal jurisdiction and various state and local jurisdictions. The Company is no longer subject to U.S. federal income tax examinations by tax authorities for years before 2010. With respect to state and local jurisdictions, with limited exceptions, the Company and its subsidiaries are no longer subject to income tax audits for years before 2004. Although the outcome of tax audits is always uncertain, the Company believes that adequate amounts of tax, interest and penalties have been accrued for any adjustments that are expected to result from the years still subject to examination.
F-24
|
9.
|
Retirement Plans
|
The Company has a funded defined benefit plan (“Pension Plan”) and defined contribution plans (“Retirement Plans”) which cover substantially all employees who work
1,000
hours or more in a year. In addition, the Company has an unfunded defined benefit supplementary retirement plan (“SERP”), which provides benefits, for certain employees, in excess of qualified plan limitations. Effective January 1, 2012, the Pension Plan was closed to new participants, with limited exceptions, and effective January 2, 2012, the SERP was closed to new participants.
In February 2013, the Company announced changes to the Pension Plan and SERP whereby eligible employees no longer earn future pension service credits after December 31, 2013, with limited exceptions. All retirement benefits attributable to service in subsequent periods will be provided through defined contribution plans. As a result of these changes, the Company recognized reductions in the projected benefit obligations of the Pension Plan of
$254 million
and the SERP of
$42 million
as of February 2, 2013.
Pension Plan
The following provides a reconciliation of benefit obligations, plan assets, and funded status of the Pension Plan as of
February 1, 2014
and
February 2, 2013
:
|
2013
|
2012
|
||||||
|
(millions)
|
|||||||
|
Change in projected benefit obligation
|
|||||||
|
Projected benefit obligation, beginning of year
|
$
|
3,555
|
|
$
|
3,458
|
|
|
|
Service cost
|
112
|
|
117
|
|
|||
|
Interest cost
|
143
|
|
157
|
|
|||
|
Actuarial (gain) loss
|
(117
|
)
|
283
|
|
|||
|
Benefits paid
|
(220
|
)
|
(206
|
)
|
|||
|
Actuarial gain due to curtailment
|
—
|
|
(254
|
)
|
|||
|
Projected benefit obligation, end of year
|
3,473
|
|
3,555
|
|
|||
|
Changes in plan assets
|
|||||||
|
Fair value of plan assets, beginning of year
|
3,387
|
|
3,069
|
|
|||
|
Actual return on plan assets
|
379
|
|
374
|
|
|||
|
Company contributions
|
—
|
|
150
|
|
|||
|
Benefits paid
|
(220
|
)
|
(206
|
)
|
|||
|
Fair value of plan assets, end of year
|
3,546
|
|
3,387
|
|
|||
|
Funded status at end of year
|
$
|
73
|
|
$
|
(168
|
)
|
|
|
Amounts recognized in the Consolidated Balance Sheets at
February 1, 2014 and February 2, 2013 |
|||||||
|
Other assets
|
$
|
73
|
|
$
|
—
|
|
|
|
Other liabilities
|
—
|
|
(168
|
)
|
|||
|
$
|
73
|
|
$
|
(168
|
)
|
||
|
Amounts recognized in accumulated other comprehensive loss at
February 1, 2014 and February 2, 2013 |
|||||||
|
Net actuarial loss
|
$
|
931
|
|
$
|
1,326
|
|
|
The accumulated benefit obligation for the Pension Plan was
$3,453 million
as of
February 1, 2014
and
$3,496 million
as of
February 2, 2013
.
F-25
Net pension costs and other amounts recognized in other comprehensive loss for the Pension Plan included the following actuarially determined components:
|
2013
|
2012
|
2011
|
|||||||||
|
(millions)
|
|||||||||||
|
Net Periodic Pension Cost
|
|||||||||||
|
Service cost
|
$
|
112
|
|
$
|
117
|
|
$
|
102
|
|
||
|
Interest cost
|
143
|
|
157
|
|
160
|
|
|||||
|
Expected return on assets
|
(242
|
)
|
(253
|
)
|
(248
|
)
|
|||||
|
Amortization of net actuarial loss
|
141
|
|
141
|
|
88
|
|
|||||
|
Amortization of prior service credit
|
—
|
|
(1
|
)
|
(1
|
)
|
|||||
|
154
|
|
161
|
|
101
|
|
||||||
|
Other Changes in Plan Assets and Projected Benefit Obligation
Recognized in Other Comprehensive Loss |
|||||||||||
|
Net actuarial (gain) loss
|
(254
|
)
|
(91
|
)
|
530
|
|
|||||
|
Amortization of net actuarial loss
|
(141
|
)
|
(141
|
)
|
(88
|
)
|
|||||
|
Amortization of prior service credit
|
—
|
|
1
|
|
1
|
|
|||||
|
(395
|
)
|
(231
|
)
|
443
|
|
||||||
|
Total recognized in net periodic pension cost and
other comprehensive loss |
$
|
(241
|
)
|
$
|
(70
|
)
|
$
|
544
|
|
||
The estimated net actuarial loss for the Pension Plan that will be amortized from accumulated other comprehensive loss into net periodic benefit cost during
2014
is
$26 million
.
The following weighted average assumptions were used to determine the projected benefit obligations for the Pension Plan at
February 1, 2014
and
February 2, 2013
:
|
2013
|
2012
|
||||
|
Discount rate
|
4.50
|
%
|
4.15
|
%
|
|
|
Rate of compensation increases
|
4.10
|
%
|
4.50
|
%
|
|
The following weighted average assumptions were used to determine the net periodic pension cost for the Pension Plan:
|
2013
|
2012
|
2011
|
||||||
|
Discount rate
|
4.15
|
%
|
4.65
|
%
|
5.40
|
%
|
||
|
Expected long-term return on plan assets
|
7.50
|
%
|
8.00
|
%
|
8.00
|
%
|
||
|
Rate of compensation increases
|
4.50
|
%
|
4.50
|
%
|
4.50
|
%
|
||
The Pension Plan’s assumptions are evaluated annually and updated as necessary.
The discount rate used to determine the present value of the projected benefit obligation for the Pension Plan is based on a yield curve constructed from a portfolio of high quality corporate debt securities with various maturities. Each year’s expected future benefit payments are discounted to their present value at the appropriate yield curve rate, thereby generating the overall discount rate for the projected benefit obligation.
F-26
The Company develops its expected long-term rate of return on plan asset assumption by evaluating input from several professional advisors taking into account the asset allocation of the portfolio and long-term asset class return expectations, as well as long-term inflation assumptions. Expected returns for each major asset class are considered along with their volatility and the expected correlations among them. These expectations are based upon historical relationships as well as forecasts of how future returns may vary from historical returns. Returns by asset class and correlations among asset classes are combined using the target asset allocation to derive an expected return for the portfolio as a whole. Long-term historical returns of the portfolio are also considered. Portfolio returns are calculated net of all expenses, therefore, the Company also analyzes expected costs and expenses, including investment management fees, administrative expenses, Pension Benefit Guaranty Corporation premiums and other costs and expenses. As of February 2, 2013, the Company lowered the assumed annual long-term rate of return for the Pension Plan's assets from 8.00% to 7.50% based on expected future returns on the portfolio.
The Company develops its rate of compensation increase assumption based on recent experience and reflects an estimate of future compensation levels taking into account general increase levels, seniority, promotions and other factors. The salary increase assumption is used to project employees’ pay in future years and its impact on the projected benefit obligation for the Pension Plan.
The assets of the Pension Plan are managed by investment specialists with the primary objectives of payment of benefit obligations to Plan participants and an ultimate realization of investment returns over longer periods in excess of inflation. The Company employs a total return investment approach whereby a mix of domestic and foreign equity securities, fixed income securities and other investments is used to maximize the long-term return on the assets of the Pension Plan for a prudent level of risk. Risks are mitigated through the asset diversification and the use of multiple investment managers. The target allocation for plan assets is currently
50%
equity securities,
40%
debt securities,
5%
real estate and
5%
private equities.
The Company generally employs investment managers to specialize in a specific asset class. These managers are chosen and monitored with the assistance of professional advisors, using criteria that include organizational structure, investment philosophy, investment process, performance compared to market benchmarks and peer groups.
The Company periodically conducts an analysis of the behavior of the Pension Plan’s assets and liabilities under various economic and interest rate scenarios to ensure that the long-term target asset allocation is appropriate given the liabilities.
F-27
The fair values of the Pension Plan assets as of
February 1, 2014
, excluding interest and dividend receivables and pending investment purchases and sales, by asset category are as follows:
|
|
Fair Value Measurements
|
||||||||||||||
|
|
Total
|
Quoted Prices in
Active Markets for
Identical Assets
(Level 1)
|
Significant
Observable
Inputs
(Level 2)
|
Significant
Unobservable
Inputs
(Level 3)
|
|||||||||||
|
|
(millions)
|
||||||||||||||
|
Cash and cash equivalents
|
$
|
211
|
|
$
|
—
|
|
$
|
211
|
|
$
|
—
|
|
|||
|
Equity securities:
|
|||||||||||||||
|
U.S.
|
834
|
|
354
|
|
480
|
|
—
|
|
|||||||
|
International
|
748
|
|
—
|
|
748
|
|
—
|
|
|||||||
|
Fixed income securities:
|
|||||||||||||||
|
U. S. Treasury bonds
|
221
|
|
—
|
|
221
|
|
—
|
|
|||||||
|
Other Government bonds
|
39
|
|
—
|
|
39
|
|
—
|
|
|||||||
|
Agency backed bonds
|
22
|
|
—
|
|
22
|
|
—
|
|
|||||||
|
Corporate bonds
|
388
|
|
—
|
|
388
|
|
—
|
|
|||||||
|
Mortgage-backed securities and forwards
|
95
|
|
—
|
|
95
|
|
—
|
|
|||||||
|
Asset-backed securities
|
20
|
|
—
|
|
20
|
|
—
|
|
|||||||
|
Pooled funds
|
454
|
|
—
|
|
454
|
|
—
|
|
|||||||
|
Other types of investments:
|
|||||||||||||||
|
Real estate
|
214
|
|
—
|
|
—
|
|
214
|
|
|||||||
|
Hedge funds
|
167
|
|
—
|
|
—
|
|
167
|
|
|||||||
|
Private equity
|
167
|
|
—
|
|
—
|
|
167
|
|
|||||||
|
Total
|
$
|
3,580
|
|
$
|
354
|
|
$
|
2,678
|
|
$
|
548
|
|
|||
F-28
The fair values of the Pension Plan assets as of
February 2, 2013
, excluding interest and dividend receivables and pending investment purchases and sales, by asset category are as follows:
|
|
Fair Value Measurements
|
||||||||||||||
|
|
Total
|
Quoted Prices in
Active Markets for
Identical Assets
(Level 1)
|
Significant
Observable
Inputs
(Level 2)
|
Significant
Unobservable
Inputs
(Level 3)
|
|||||||||||
|
|
(millions)
|
||||||||||||||
|
Cash and cash equivalents
|
$
|
204
|
|
$
|
—
|
|
$
|
204
|
|
$
|
—
|
|
|||
|
Equity securities:
|
|||||||||||||||
|
U.S.
|
832
|
|
290
|
|
542
|
|
—
|
|
|||||||
|
International
|
818
|
|
—
|
|
818
|
|
—
|
|
|||||||
|
Fixed income securities:
|
|||||||||||||||
|
U. S. Treasury bonds
|
136
|
|
—
|
|
136
|
|
—
|
|
|||||||
|
Other Government bonds
|
34
|
|
—
|
|
34
|
|
—
|
|
|||||||
|
Agency backed bonds
|
6
|
|
—
|
|
6
|
|
—
|
|
|||||||
|
Corporate bonds
|
338
|
|
—
|
|
338
|
|
—
|
|
|||||||
|
Mortgage-backed securities and forwards
|
102
|
|
—
|
|
102
|
|
—
|
|
|||||||
|
Asset-backed securities
|
24
|
|
—
|
|
24
|
|
—
|
|
|||||||
|
Pooled funds
|
303
|
|
—
|
|
303
|
|
—
|
|
|||||||
|
Other types of investments:
|
|||||||||||||||
|
Real estate
|
280
|
|
—
|
|
—
|
|
280
|
|
|||||||
|
Hedge funds
|
154
|
|
—
|
|
—
|
|
154
|
|
|||||||
|
Private equity
|
160
|
|
—
|
|
—
|
|
160
|
|
|||||||
|
Total
|
$
|
3,391
|
|
$
|
290
|
|
$
|
2,507
|
|
$
|
594
|
|
|||
Corporate bonds consist primarily of investment grade bonds of U.S. issuers from diverse industries.
The fair value of the real estate, hedge funds and private equity investments represents the reported net asset value of shares or underlying assets of the investment. Private equity and real estate investments are valued using fair values per the most recent financial reports provided by the investment sponsor, adjusted as appropriate for any lag between the date of the financial reports and the Company’s reporting date. The real estate investments are diversified across property types and geographical areas primarily in the United States of America. Private equity investments generally consist of limited partnerships in the United States of America, Europe and Asia. The hedge fund investments are through a fund of funds approach.
Due to the nature of the underlying assets of the real estate, hedge funds and private equity investments, changes in market conditions and the economic environment may significantly impact the net asset value of these investments and, consequently, the fair value of the Pension Plan’s investments. These investments are redeemable at net asset value to the extent provided in the documentation governing the investments. However, these redemption rights may be restricted in accordance with the governing documents. Redemption of these investments is subject to restrictions including lock-up periods where no redemptions are allowed, restrictions on redemption frequency and advance notice periods for redemptions. As of
February 1, 2014
and
February 2, 2013
, certain of these investments are generally subject to lock-up periods, ranging from
three
to
fifteen
years, certain of these investments are subject to restrictions on redemption frequency, ranging from daily to twice per year, and certain of these investments are subject to advance notice requirements, ranging from
sixty
-day notification to
ninety
-day notification. As of
February 1, 2014
and
February 2, 2013
, the Pension Plan had unfunded commitments related to certain of these investments totaling
$150 million
and
$144 million
, respectively.
F-29
The following table sets forth a summary of changes in fair value of the Pension Plan’s level 3 assets for
2013
and
2012
:
|
2013
|
2012
|
||||||
|
|
(millions)
|
||||||
|
Balance, beginning of year
|
$
|
594
|
|
$
|
533
|
|
|
|
Actual gain on plan assets:
|
|||||||
|
Relating to assets still held at the reporting date
|
1
|
|
7
|
|
|||
|
Relating to assets sold during the period
|
48
|
|
23
|
|
|||
|
Purchases
|
77
|
|
71
|
|
|||
|
Sales
|
(172
|
)
|
(40
|
)
|
|||
|
Balance, end of year
|
$
|
548
|
|
$
|
594
|
|
|
During
2012
, the Company made a funding contribution to the Pension Plan totaling
$150 million
. The Company does not anticipate making funding contributions to the Pension Plan in 2014.
The following benefit payments are estimated to be paid from the Pension Plan:
|
|
(millions)
|
||
|
Fiscal year
|
|||
|
2014
|
$
|
274
|
|
|
2015
|
256
|
|
|
|
2016
|
248
|
|
|
|
2017
|
244
|
|
|
|
2018
|
240
|
|
|
|
2019-2023
|
1,107
|
|
|
F-30
Supplementary Retirement Plan
The following provides a reconciliation of benefit obligations, plan assets and funded status of the supplementary retirement plan as of
February 1, 2014
and
February 2, 2013
:
|
2013
|
2012
|
||||||
|
(millions)
|
|||||||
|
Change in projected benefit obligation
|
|||||||
|
Projected benefit obligation, beginning of year
|
$
|
795
|
|
$
|
771
|
|
|
|
Service cost
|
6
|
|
6
|
|
|||
|
Interest cost
|
32
|
|
35
|
|
|||
|
Actuarial (gain) loss
|
(17
|
)
|
76
|
|
|||
|
Plan amendment
|
8
|
|
—
|
|
|||
|
Benefits paid
|
(54
|
)
|
(51
|
)
|
|||
|
Actuarial gain due to curtailment
|
—
|
|
(42
|
)
|
|||
|
Projected benefit obligation, end of year
|
770
|
|
795
|
|
|||
|
Change in plan assets
|
|||||||
|
Fair value of plan assets, beginning of year
|
—
|
|
—
|
|
|||
|
Company contributions
|
54
|
|
51
|
|
|||
|
Benefits paid
|
(54
|
)
|
(51
|
)
|
|||
|
Fair value of plan assets, end of year
|
—
|
|
—
|
|
|||
|
Funded status at end of year
|
$
|
(770
|
)
|
$
|
(795
|
)
|
|
|
Amounts recognized in the Consolidated Balance Sheets at
February 1, 2014 and February 2, 2013 |
|||||||
|
Accounts payable and accrued liabilities
|
$
|
(59
|
)
|
$
|
(58
|
)
|
|
|
Other liabilities
|
(711
|
)
|
(737
|
)
|
|||
|
$
|
(770
|
)
|
$
|
(795
|
)
|
||
|
Amounts recognized in accumulated other comprehensive loss at
February 1, 2014 and February 2, 2013 |
|||||||
|
Net actuarial loss
|
$
|
176
|
|
$
|
212
|
|
|
|
Prior service cost
|
8
|
|
—
|
|
|||
|
$
|
184
|
|
$
|
212
|
|
||
The accumulated benefit obligation for the supplementary retirement plan was
$770 million
as of
February 1, 2014
and
$788 million
as of
February 2, 2013
.
F-31
Net pension costs and other amounts recognized in other comprehensive loss for the supplementary retirement plan included the following actuarially determined components:
|
2013
|
2012
|
2011
|
|||||||||
|
(millions)
|
|||||||||||
|
Net Periodic Pension Cost
|
|||||||||||
|
Service cost
|
$
|
6
|
|
$
|
6
|
|
$
|
6
|
|
||
|
Interest cost
|
32
|
|
35
|
|
36
|
|
|||||
|
Amortization of net actuarial loss
|
19
|
|
17
|
|
8
|
|
|||||
|
Amortization of prior service credit
|
—
|
|
(1
|
)
|
(1
|
)
|
|||||
|
57
|
|
57
|
|
49
|
|
||||||
|
Other Changes in Plan Assets and Projected Benefit Obligation
Recognized in Other Comprehensive Loss |
|||||||||||
|
Net actuarial (gain) loss
|
(17
|
)
|
34
|
|
90
|
|
|||||
|
Prior service cost
|
8
|
|
—
|
|
—
|
|
|||||
|
Amortization of net actuarial loss
|
(19
|
)
|
(17
|
)
|
(8
|
)
|
|||||
|
Amortization of prior service credit
|
—
|
|
1
|
|
1
|
|
|||||
|
(28
|
)
|
18
|
|
83
|
|
||||||
|
Total recognized in net periodic pension cost and
other comprehensive loss |
$
|
29
|
|
$
|
75
|
|
$
|
132
|
|
||
The estimated net actuarial loss for the supplementary retirement plan that will be amortized from accumulated other comprehensive loss into net periodic benefit cost during
2014
is
$5 million
.
The following weighted average assumptions were used to determine the projected benefit obligations for the supplementary retirement plan at
February 1, 2014
and
February 2, 2013
:
|
2013
|
2012
|
||||
|
Discount rate
|
4.50
|
%
|
4.15
|
%
|
|
|
Rate of compensation increases
|
N/A
|
|
4.90
|
%
|
|
The following weighted average assumptions were used to determine net pension costs for the supplementary retirement plan:
|
2013
|
2012
|
2011
|
||||||
|
Discount rate
|
4.15
|
%
|
4.65
|
%
|
5.40
|
%
|
||
|
Rate of compensation increases
|
4.90
|
%
|
4.90
|
%
|
4.90
|
%
|
||
The supplementary retirement plan’s assumptions are evaluated annually and updated as necessary.
The discount rate used to determine the present value of the projected benefit obligation for the supplementary retirement plan is based on a yield curve constructed from a portfolio of high quality corporate debt securities with various maturities. Each year’s expected future benefit payments are discounted to their present value at the appropriate yield curve rate, thereby generating the overall discount rate for the projected benefit obligation.
The Company developed its rate of compensation increase assumption based on recent experience and reflected an estimate of future compensation levels taking into account general increase levels, seniority, promotions and other factors. The salary increase assumption was used to project employees’ pay in future years and its impact on the projected benefit obligation for the supplementary retirement plan.
F-32
The following benefit payments are estimated to be funded by the Company and paid from the supplementary retirement plan:
|
|
(millions)
|
||
|
Fiscal year
|
|||
|
2014
|
$
|
59
|
|
|
2015
|
63
|
|
|
|
2016
|
62
|
|
|
|
2017
|
63
|
|
|
|
2018
|
59
|
|
|
|
2019-2023
|
277
|
|
|
Retirement Plans
The Company has a qualified plan that permits participating associates to defer eligible compensation up to the maximum limits allowable under the Internal Revenue Code and beginning January 1, 2014, also has a non-qualified plan which permits participating associates to defer eligible compensation above the limits of the qualified plan. The Company contributes a matching percentage of employee contributions under both the qualified and non-qualified plans. Effective January 1, 2014, the Company's matching contribution to the qualified plan was enhanced for all participating employees, with limited exceptions. Prior to January 1, 2014, the matching contribution rate under the qualified plan was higher for those employees not eligible for the Pension Plan than for employees eligible for the Pension Plan.
At
February 1, 2014
and
February 2, 2013
, the liability under the qualified plan, which is reflected in accounts payable and accrued liabilities on the Consolidated Balance Sheets, was $25 million and $14 million, respectively. Expense related to matching contributions for these plans amounted to
$24 million
for
2013
,
$14 million
for
2012
and
$10 million
for
2011
.
In connection with the non-qualified plan, the Company had mutual fund investments which are included in prepaid expenses and other current assets on the Consolidated Balance Sheets.
The Company has an additional deferred compensation plan wherein eligible executives elected to defer a portion of their compensation each year as either stock credits or cash credits. Effective January 1, 2014, no additional compensation will be deferred, with limited exceptions. The Company has transfered shares to a trust to cover the number estimated for distribution on account of stock credits currently outstanding. At
February 1, 2014
and
February 2, 2013
, the liability under the plan, which is reflected in other liabilities on the Consolidated Balance Sheets, was
$44 million
and
$44 million
, respectively. Expense for
2013
,
2012
and
2011
was immaterial.
F-33
|
10.
|
Postretirement Health Care and Life Insurance Benefits
|
In addition to pension and other supplemental benefits, certain retired employees currently are provided with specified health care and life insurance benefits. Eligibility requirements for such benefits vary by division and subsidiary, but generally state that benefits are available to eligible employees who were hired prior to a certain date and retire after a certain age with specified years of service. Certain employees are subject to having such benefits modified or terminated.
The following provides a reconciliation of benefit obligations, plan assets, and funded status of the postretirement obligations as of
February 1, 2014
and
February 2, 2013
:
|
2013
|
2012
|
||||||
|
(millions)
|
|||||||
|
Change in accumulated postretirement benefit obligation
|
|||||||
|
Accumulated postretirement benefit obligation, beginning of year
|
$
|
250
|
|
$
|
266
|
|
|
|
Service cost
|
—
|
|
—
|
|
|||
|
Interest cost
|
10
|
|
12
|
|
|||
|
Actuarial gain
|
(15
|
)
|
(4
|
)
|
|||
|
Medicare Part D subsidy
|
1
|
|
1
|
|
|||
|
Benefits paid
|
(23
|
)
|
(25
|
)
|
|||
|
Accumulated postretirement benefit obligation, end of year
|
223
|
|
250
|
|
|||
|
Change in plan assets
|
|||||||
|
Fair value of plan assets, beginning of year
|
—
|
|
—
|
|
|||
|
Company contributions
|
23
|
|
25
|
|
|||
|
Benefits paid
|
(23
|
)
|
(25
|
)
|
|||
|
Fair value of plan assets, end of year
|
—
|
|
—
|
|
|||
|
Funded status at end of year
|
$
|
(223
|
)
|
$
|
(250
|
)
|
|
|
Amounts recognized in the Consolidated Balance Sheets at
February 1, 2014 and February 2, 2013 |
|||||||
|
Accounts payable and accrued liabilities
|
$
|
(26
|
)
|
$
|
(28
|
)
|
|
|
Other liabilities
|
(197
|
)
|
(222
|
)
|
|||
|
$
|
(223
|
)
|
$
|
(250
|
)
|
||
|
Amounts recognized in accumulated other comprehensive loss at
February 1, 2014 and February 2, 2013 |
|||||||
|
Net actuarial gain
|
$
|
(35
|
)
|
$
|
(23
|
)
|
|
F-34
Net postretirement benefit costs and other amounts recognized in other comprehensive loss included the following actuarially determined components:
|
2013
|
2012
|
2011
|
|||||||||
|
|
(millions)
|
||||||||||
|
Net Periodic Postretirement Benefit Cost
|
|||||||||||
|
Service cost
|
$
|
—
|
|
$
|
—
|
|
$
|
—
|
|
||
|
Interest cost
|
10
|
|
12
|
|
14
|
|
|||||
|
Amortization of net actuarial gain
|
(3
|
)
|
(4
|
)
|
(5
|
)
|
|||||
|
Amortization of prior service cost
|
—
|
|
—
|
|
—
|
|
|||||
|
7
|
|
8
|
|
9
|
|
||||||
|
Other Changes in Plan Assets and Projected Benefit Obligation
Recognized in Other Comprehensive Loss |
|||||||||||
|
Net actuarial gain
|
(15
|
)
|
(4
|
)
|
(3
|
)
|
|||||
|
Amortization of net actuarial gain
|
3
|
|
4
|
|
5
|
|
|||||
|
Amortization of prior service cost
|
—
|
|
—
|
|
—
|
|
|||||
|
(12
|
)
|
—
|
|
2
|
|
||||||
|
Total recognized in net periodic postretirement benefit cost and other
comprehensive loss
|
$
|
(5
|
)
|
$
|
8
|
|
$
|
11
|
|
||
The estimated net actuarial gain of the postretirement obligations that will be amortized from accumulated other comprehensive loss into net postretirement benefit cost during
2014
is
$4 million
.
The following weighted average assumptions were used to determine the accumulated postretirement benefit obligations at
February 1, 2014
and
February 2, 2013
:
|
2013
|
2012
|
||||
|
Discount rate
|
4.50
|
%
|
4.15
|
%
|
|
The following weighted average assumptions were used to determine the net postretirement benefit costs for the postretirement obligations:
|
2013
|
2012
|
2011
|
||||||
|
Discount rate
|
4.15
|
%
|
4.65
|
%
|
5.40
|
%
|
||
The postretirement benefit obligation assumptions are evaluated annually and updated as necessary.
The discount rate used to determine the present value of the Company’s accumulated postretirement benefit obligations is based on a yield curve constructed from a portfolio of high quality corporate debt securities with various maturities. Each year’s expected future benefit payments are discounted to their present value at the appropriate yield curve rate, thereby generating the overall discount rate for the accumulated postretirement benefit obligations.
The future medical benefits provided by the Company for certain employees are based on a fixed amount per year of service, and the accumulated postretirement benefit obligation is not affected by increases in health care costs. However, the future medical benefits provided by the Company for certain other employees are affected by increases in health care costs.
F-35
In March 2010, President Obama signed into law the “Patient Protection and Affordable Care Act” and the “Health Care and Education Affordability Reconciliation Act of 2010” (the “2010 Acts”). Included among the major provisions of these laws is a change in the tax treatment related to the Medicare Part D subsidy. The Company’s postretirement obligations reflect estimated federal subsidies expected to be received under the Medicare Prescription Drug, Improvement and Modernization Act of 2003. Under the 2010 Acts, the Company’s deductions for retiree prescription drug benefits will be reduced by the amount of Medicare Part D subsidies received beginning February 3, 2013.
The 2010 Acts contain additional provisions which impact the accounting for postretirement obligations. Based on the analysis to date, the impact of provisions in the 2010 Acts on the Company’s postretirement obligations has not and is not expected to have a material impact on the Company’s consolidated financial position, results of operations or cash flows. The Company continues to evaluate the impact of the 2010 Acts on the active and retiree benefit plans offered by the Company.
The following provides the assumed health care cost trend rates related to the Company’s accumulated postretirement benefit obligations at
February 1, 2014
and
February 2, 2013
:
|
2013
|
2012
|
||
|
Health care cost trend rates assumed for next year
|
7.27% - 9.20%
|
7.52% - 9.50%
|
|
|
Rates to which the cost trend rate is assumed to decline (the ultimate trend rate)
|
5.0%
|
5.0%
|
|
|
Year that the rate reaches the ultimate trend rate
|
2025
|
2025
|
|
The assumed health care cost trend rates have an impact on the amounts reported for the accumulated postretirement benefit obligations. A one-percentage-point change in the assumed health care cost trend rates would have the following effects:
|
1 – Percentage
Point Increase
|
1 – Percentage
Point Decrease
|
||
|
(millions)
|
|||
|
Effect on total of service and interest cost
|
$1
|
$(1)
|
|
|
Effect on accumulated postretirement benefit obligations
|
$13
|
$(11)
|
|
The following table reflects the benefit payments estimated to be funded by the Company and paid from the accumulated postretirement benefit obligations and estimated federal subsidies expected to be received under the Medicare Prescription Drug Improvement and Modernization Act of 2003:
|
Expected
Benefit
Payments
|
Expected
Federal
Subsidy
|
||||||
|
|
(millions)
|
||||||
|
Fiscal Year
|
|||||||
|
2014
|
$
|
25
|
|
$
|
1
|
|
|
|
2015
|
22
|
|
1
|
|
|||
|
2016
|
20
|
|
1
|
|
|||
|
2017
|
19
|
|
1
|
|
|||
|
2018
|
19
|
|
1
|
|
|||
|
2019-2023
|
80
|
|
3
|
|
|||
F-36
|
11.
|
Stock Based Compensation
|
During 2009, the Company obtained shareholder approval for the Macy’s 2009 Omnibus Incentive Compensation Plan under which up to
51 million
shares of Common Stock may be issued. This plan is intended to help the Company attract and retain directors, officers, other key executives and employees and is also intended to provide incentives and rewards relating to the Company’s business plans to encourage such persons to devote themselves to the business of the Company. Prior to 2009, the Company had
two
equity plans; the Macy's 1995 Executive Equity Incentive Plan and the Macy's 1994 Stock Incentive Plan. After shareholders approved the 2009 Omnibus Incentive Compensation Plan, Common Stock may no longer be granted under the Macy's 1995 Executive Equity Incentive Plan or the Macy's 1994 Stock Incentive Plan. The following disclosures present the Company’s equity plans on a combined basis. The equity plan is administered by the Compensation and Management Development Committee of the Board of Directors (the “CMD Committee”). The CMD Committee is authorized to grant options, stock appreciation rights, restricted stock and restricted stock units to officers and key employees of the Company and its subsidiaries and to non-employee directors. There have been no grants of stock appreciation rights under the equity plans.
Stock option grants have an exercise price at least equal to the market value of the underlying common stock on the date of grant, have
ten
-year terms and typically vest ratably over
four
years of continued employment. Restricted stock and time-based restricted stock unit awards generally vest
one
to
four
years from the date of grant. Performance-based restricted stock units generally are earned based on the attainment of specified goals achieved over the performance period.
As of
February 1, 2014
,
27.5 million
shares of common stock were available for additional grants pursuant to the Company’s equity plan. Shares awarded are generally issued from the Company's treasury stock.
Stock-based compensation expense included the following components:
|
2013
|
2012
|
2011
|
|||||||||
|
(millions)
|
|||||||||||
|
Stock options
|
$
|
36
|
|
$
|
28
|
|
$
|
28
|
|
||
|
Restricted stock units
|
25
|
|
26
|
|
20
|
|
|||||
|
Restricted stock
|
1
|
|
1
|
|
2
|
|
|||||
|
Stock credits
|
—
|
|
6
|
|
20
|
|
|||||
|
$
|
62
|
|
$
|
61
|
|
$
|
70
|
|
|||
All stock-based compensation expense is recorded in SG&A expense in the Consolidated Statements of Income. The income tax benefit recognized in the Consolidated Statements of Income related to stock-based compensation was
$22 million
,
$22 million
, and
$25 million
, for
2013
,
2012
and
2011
, respectively.
As of
February 1, 2014
, the Company had
$53 million
of unrecognized compensation costs related to nonvested stock options, which is expected to be recognized over a weighted average period of approximately
1.7
years, less than
$1 million
of unrecognized compensation costs related to nonvested restricted stock, which is expected to be recognized over a weighted average period of approximately
1.1
years, and
$26 million
of unrecognized compensation costs related to nonvested restricted stock units, which is expected to be recognized over a weighted average period of approximately
1.4
years.
F-37
During
2013
,
2012
and
2011
, the CMD Committee approved awards of performance-based restricted stock units to certain senior executives of the Company. Each award reflects a target number of shares (“Target Shares”) that may be issued to the award recipient. These awards may be earned upon the completion of
three
-year performance periods ending January 30, 2016, January 31, 2015 and February 1, 2014, respectively. Whether units are earned at the end of the performance period will be determined based on the achievement of certain performance objectives set by the CMD Committee in connection with the issuance of the units. The performance objectives are based on the Company’s business plan covering the performance period. The performance objectives include achieving a cumulative EBITDA level for the performance period and also include an EBITDA as a percent to sales ratio and a return on invested capital ratio. The performance-based restricted stock units awarded during 2012 and 2013 also include a performance objective relating to relative total shareholder return (“TSR”). Relative TSR reflects the change in the value of the Company’s common stock over the performance period in relation to the change in the value of the common stock of a
ten
-company executive compensation peer group over the performance period, assuming the reinvestment of dividends. Depending on the results achieved during the
three
-year performance periods, the actual number of shares that a grant recipient receives at the end of the period may range from
0%
to
150%
of the Target Shares granted.
Also during
2013
,
2012
and
2011
, the CMD Committee approved awards of time-based restricted stock or time-based restricted stock units to certain senior executives of the Company and awards of time-based restricted stock units to the non-employee members of the Company’s board of directors.
Stock Options
The fair value of stock options granted during
2013
,
2012
and
2011
and the weighted average assumptions used to estimate the fair value are as follows:
|
2013
|
2012
|
2011
|
|||||||||
|
Weighted average grant date fair value of stock options
granted during the period |
$
|
12.15
|
|
$
|
12.22
|
|
$
|
7.12
|
|
||
|
Dividend yield
|
2.8
|
%
|
2.2
|
%
|
2.3
|
%
|
|||||
|
Expected volatility
|
41.3
|
%
|
39.8
|
%
|
38.8
|
%
|
|||||
|
Risk-free interest rate
|
0.8
|
%
|
1.2
|
%
|
2.0
|
%
|
|||||
|
Expected life
|
5.7 years
|
|
5.7 years
|
|
5.6 years
|
|
|||||
The fair value of each stock option grant is estimated on the date of grant using the Black-Scholes option-pricing model. The Company estimates the expected volatility and expected option life assumption consistent with ASC Topic 718, “Compensation – Stock Compensation.” The expected volatility of the Company’s common stock at the date of grant is estimated based on a historic volatility rate and the expected option life is calculated based on historical stock option experience as the best estimate of future exercise patterns. The dividend yield assumption is based on historical and anticipated dividend payouts. The risk-free interest rate assumption is based on observed interest rates consistent with the expected life of each stock option grant. The Company uses historical data to estimate pre-vesting option forfeitures and records stock-based compensation expense only for those awards that are expected to vest. Compensation expense is recorded for all stock options expected to vest based on the amortization of the fair value at the date of grant on a straight-line basis primarily over the vesting period of the options.
F-38
Activity related to stock options for
2013
is as follows:
|
Shares
|
Weighted
Average
Exercise
Price
|
Weighted
Average
Remaining
Contractual
Life
|
Aggregate
Intrinsic
Value
|
|||||||||
|
(thousands)
|
|
(years)
|
(millions)
|
|||||||||
|
Outstanding, beginning of period
|
29,792.9
|
|
$
|
29.07
|
|
|||||||
|
Granted
|
3,621.5
|
|
$
|
41.67
|
|
|||||||
|
Canceled or forfeited
|
(485.0
|
)
|
$
|
33.47
|
|
|||||||
|
Exercised
|
(9,615.8
|
)
|
$
|
26.44
|
|
|||||||
|
Outstanding, end of period
|
23,313.6
|
|
$
|
32.02
|
|
|||||||
|
Exercisable, end of period
|
14,365.6
|
|
$
|
30.20
|
|
3.9
|
$
|
330
|
|
|||
|
Options expected to vest
|
7,874.3
|
|
$
|
34.95
|
|
8.1
|
$
|
144
|
|
|||
Additional information relating to stock options is as follows:
|
2013
|
2012
|
2011
|
|||||||||
|
(millions)
|
|||||||||||
|
Intrinsic value of options exercised
|
$
|
207
|
|
$
|
132
|
|
$
|
64
|
|
||
|
Grant date fair value of stock options that vested during the year
|
31
|
|
30
|
|
50
|
|
|||||
|
Cash received from stock options exercised
|
254
|
|
164
|
|
141
|
|
|||||
|
Excess tax benefits realized from exercised stock options
|
51
|
|
36
|
|
20
|
|
|||||
Restricted Stock and Restricted Stock Units
The weighted average grant date fair value of restricted stock and restricted stock units granted during
2013
,
2012
and
2011
are as follows:
|
2013
|
2012
|
2011
|
|||||||||
|
Restricted stock
|
$
|
—
|
|
$
|
—
|
|
$
|
23.43
|
|
||
|
Restricted stock units
|
$
|
42.54
|
|
$
|
39.52
|
|
$
|
23.69
|
|
||
The fair value of the Target Shares and restricted stock awards are based on the fair value of the underlying shares on the date of grant. The fair value of the portion of the Target Shares granted in 2012 and 2013 that relate to a relative TSR performance objective was determined using a Monte Carlo simulation analysis to estimate the total shareholder return ranking of the Company among a ten-company executive compensation peer group over the remaining performance periods. The expected volatility of the Company’s common stock at the date of grant was estimated based on a historical average volatility rate for the approximate
three
-year performance period. The dividend yield assumption was based on historical and anticipated dividend payouts. The risk-free interest rate assumption was based on observed interest rates consistent with the approximate three-year performance measurement period.
Compensation expense is recorded for all restricted stock and restricted stock unit awards based on the amortization of the fair market value at the date of grant over the period the restrictions lapse or over the performance period of the performance-based restricted stock units.
F-39
Activity related to restricted stock awards for
2013
is as follows:
|
Shares
|
Weighted
Average
Grant Date
Fair Value
|
|||||
|
(thousands)
|
||||||
|
Nonvested, beginning of period
|
142.3
|
|
$
|
22.36
|
|
|
|
Granted
|
—
|
|
—
|
|
||
|
Forfeited
|
(5.7
|
)
|
21.84
|
|
||
|
Vested
|
(57.4
|
)
|
22.11
|
|
||
|
Nonvested, end of period
|
79.2
|
|
$
|
22.58
|
|
|
Activity related to restricted stock units for
2013
is as follows:
|
Shares
|
Weighted
Average
Grant Date
Fair Value
|
|||||
|
(thousands)
|
||||||
|
Nonvested, beginning of period
|
2,848.5
|
|
$
|
26.61
|
|
|
|
Granted – performance-based
|
393.1
|
|
42.68
|
|
||
|
Performance adjustment
|
(119.4
|
)
|
39.37
|
|
||
|
Granted – time-based
|
264.9
|
|
42.33
|
|
||
|
Dividend equivalents
|
31.8
|
|
44.12
|
|
||
|
Forfeited
|
(33.6
|
)
|
34.54
|
|
||
|
Vested
|
(1,164.4
|
)
|
21.75
|
|
||
|
Nonvested, end of period
|
2,220.9
|
|
$
|
33.32
|
|
|
Stock Credits
The Company also has a stock credit plan. In 2008, key management personnel became eligible to earn a stock credit grant over a
two
-year performance period ending January 30, 2010. There were a total of
836,268
stock credit awards outstanding as of February 2, 2013, relating to the 2008 grant. In general, with respect to the stock credits awarded to participants in 2008, the value of one-half of the stock credits earned plus reinvested dividend equivalents was paid in cash in early 2012 and amounted to
$28 million
and the value of the other half of such earned stock credits plus reinvested dividend equivalents was paid in cash in early 2013 and amounted to
$32 million
. Compensation expense for stock credit awards was recorded on a straight-line basis primarily over the vesting period and was calculated based on the ending stock price for each reporting period. At
February 2, 2013
, the liability under the stock credit plans, which was reflected in accounts payable and accrued liabilities on the Consolidated Balance Sheets, was
$32 million
. There are no stock credit awards outstanding and no related liability under the stock credit plans as of February 1, 2014.
F-40
|
12.
|
Shareholders’ Equity
|
The authorized shares of the Company consist of
125 million
shares of preferred stock (“Preferred Stock”), par value of
$.01
per share, with
no
shares issued, and
1,000 million
shares of Common Stock, par value of
$.01
per share, with
410.6 million
shares of Common Stock issued and
364.9 million
shares of Common Stock outstanding at
February 1, 2014
, and with
444.6 million
shares of Common Stock issued and
387.7 million
shares of Common Stock outstanding at
February 2, 2013
(with shares held in the Company’s treasury being treated as issued, but not outstanding).
The Company retired
34.0 million
,
42.7 million
and
7.7 million
shares of Common Stock during
2013
,
2012
and
2011
, respectively.
The Company's board of directors approved an additional authorization to purchase Common Stock of
$1,500 million
on May 15, 2013. Combined with previous authorizations commencing in January 2000, the Company’s board of directors has from time to time approved authorizations to purchase, in the aggregate, up to
$13,500 million
of Common Stock. All authorizations are cumulative and do not have an expiration date. During
2013
, the Company purchased approximately
33.6 million
shares of Common Stock under its share repurchase program for a total of
$1,570 million
. During
2012
, the Company purchased approximately
35.6 million
shares of Common Stock under its share repurchase program for a total of
$1,350 million
. During
2011
, the Company purchased approximately
16.4 million
shares of Common Stock under its share repurchase program for a total of
$500 million
. As of
February 1, 2014
,
$1,432 million
of authorization remained unused. The Company may continue or, from time to time, suspend repurchases of its shares under its share repurchase program, depending on prevailing market conditions, alternative uses of capital and other factors.
Common Stock
The holders of the Common Stock are entitled to one vote for each share held of record on all matters submitted to a vote of shareholders. Subject to preferential rights that may be applicable to any Preferred Stock, holders of Common Stock are entitled to receive ratably such dividends as may be declared by the Board of Directors in its discretion, out of funds legally available therefor.
Treasury Stock
Treasury stock contains shares repurchased under the share repurchase program, shares repurchased to cover employee tax liabilities related to stock plan activity and shares maintained in a trust related to deferred compensation plans. Under the deferred compensation plans, shares are maintained in a trust to cover the number estimated to be needed for distribution on account of stock credits currently outstanding.
F-41
Changes in the Company’s Common Stock issued and outstanding, including shares held by the Company’s treasury, are as follows:
|
|
Treasury Stock
|
|||||||||||||
|
Common
Stock
Issued
|
Deferred
Compensation
Plans
|
Other
|
Total
|
Common
Stock
Outstanding
|
||||||||||
|
|
|
|
(thousands)
|
|
|
|||||||||
|
Balance at January 29, 2011
|
495,038.5
|
|
(1,249.0
|
)
|
(70,448.2
|
)
|
(71,697.2
|
)
|
423,341.3
|
|
||||
|
Stock issued under stock plans
|
(87.2
|
)
|
7,274.1
|
|
7,186.9
|
|
7,186.9
|
|
||||||
|
Stock repurchases
|
||||||||||||||
|
Repurchase program
|
(16,356.5
|
)
|
(16,356.5
|
)
|
(16,356.5
|
)
|
||||||||
|
Other
|
(80.1
|
)
|
(80.1
|
)
|
(80.1
|
)
|
||||||||
|
Deferred compensation plan distributions
|
89.4
|
|
89.4
|
|
89.4
|
|
||||||||
|
Retirement of common stock
|
(7,700.0
|
)
|
7,700.0
|
|
7,700.0
|
|
—
|
|
||||||
|
Balance at January 28, 2012
|
487,338.5
|
|
(1,246.8
|
)
|
(71,910.7
|
)
|
(73,157.5
|
)
|
414,181.0
|
|
||||
|
Stock issued under stock plans
|
(89.2
|
)
|
10,325.1
|
|
10,235.9
|
|
10,235.9
|
|
||||||
|
Stock repurchases
|
||||||||||||||
|
Repurchase program
|
(35,572.9
|
)
|
(35,572.9
|
)
|
(35,572.9
|
)
|
||||||||
|
Other
|
(1,269.4
|
)
|
(1,269.4
|
)
|
(1,269.4
|
)
|
||||||||
|
Deferred compensation plan distributions
|
126.5
|
|
126.5
|
|
126.5
|
|
||||||||
|
Retirement of common stock
|
(42,732.7
|
)
|
42,732.7
|
|
42,732.7
|
|
—
|
|
||||||
|
Balance at February 2, 2013
|
444,605.8
|
|
(1,209.5
|
)
|
(55,695.2
|
)
|
(56,904.7
|
)
|
387,701.1
|
|
||||
|
Stock issued under stock plans
|
(85.2
|
)
|
10,891.1
|
|
10,805.9
|
|
10,805.9
|
|
||||||
|
Stock repurchases
|
||||||||||||||
|
Repurchase program
|
(33,625.3
|
)
|
(33,625.3
|
)
|
(33,625.3
|
)
|
||||||||
|
Other
|
(12.2
|
)
|
(12.2
|
)
|
(12.2
|
)
|
||||||||
|
Deferred compensation plan distributions
|
65.5
|
|
65.5
|
|
65.5
|
|
||||||||
|
Retirement of common stock
|
(34,000.0
|
)
|
34,000.0
|
|
34,000.0
|
|
—
|
|
||||||
|
Balance at February 1, 2014
|
410,605.8
|
|
(1,229.2
|
)
|
(44,441.6
|
)
|
(45,670.8
|
)
|
364,935.0
|
|
||||
Accumulated Other Comprehensive Loss
The following tables shows for
2013
,
2012
and
2011
the beginning and ending balance of, and the activity associated with, accumulated other comprehensive loss, net of income tax effects:
|
Unrealized Gains on Marketable Securities
|
Post Employment and Postretirement Benefit Plans
|
Total Accumulated Other Comprehensive (Income) Loss
|
|||||||||
|
(millions)
|
|||||||||||
|
Balance at January 29, 2011
|
$
|
(10
|
)
|
$
|
740
|
|
$
|
730
|
|
||
|
Other comprehensive loss
|
10
|
|
321
|
|
331
|
|
|||||
|
Balance at January 28, 2012
|
—
|
|
1,061
|
|
1,061
|
|
|||||
|
Other comprehensive income
|
—
|
|
(130
|
)
|
(130
|
)
|
|||||
|
Balance at February 2, 2013
|
—
|
|
931
|
|
931
|
|
|||||
|
Other comprehensive income
|
—
|
|
(266
|
)
|
(266
|
)
|
|||||
|
Balance at February 1, 2014
|
$
|
—
|
|
$
|
665
|
|
$
|
665
|
|
||
F-42
The net actuarial gains and losses and prior service costs and credits related to post employment and postretirement benefit plans are reclassified out of accumulated other comprehensive loss and included in the computation of net periodic benefit costs and included in SG&A expenses in the Consolidated Statements of Income. See Note 9, "Retirement Plans," and Note 10, "Postretirement Health Care and Life Insurance Benefits," for further information. On February 25, 2011, the Company sold its investment in The Knot, Inc. and unrecognized gains in accumulated other comprehensive income were reclassified and recognized into SG&A expenses in the Consolidated Statements of Income.
|
13.
|
Fair Value Measurements and Concentrations of Credit Risk
|
The following table shows the Company’s financial assets that are required to be measured at fair value on a recurring basis, by level within the hierarchy as defined by applicable accounting standards:
|
|
February 1, 2014
|
February 2, 2013
|
|||||||||||||||||||||||||||||
|
|
Fair Value Measurements
|
Fair Value Measurements
|
|||||||||||||||||||||||||||||
|
|
Total
|
Quoted Prices
in Active
Markets for
Identical
Assets
(Level 1)
|
Significant
Observable
Inputs
(Level 2)
|
Significant
Unobservable
Inputs
(Level 3)
|
Total
|
Quoted Prices
in Active
Markets for
Identical
Assets
(Level 1)
|
Significant
Observable
Inputs
(Level 2)
|
Significant
Unobservable
Inputs
(Level 3)
|
|||||||||||||||||||||||
|
|
(millions)
|
||||||||||||||||||||||||||||||
|
Marketable
equity and debt securities |
$
|
75
|
|
$
|
—
|
|
$
|
75
|
|
$
|
—
|
|
$
|
68
|
|
$
|
—
|
|
$
|
68
|
|
$
|
—
|
|
|||||||
Other financial instruments not measured at fair value on a recurring basis include cash and cash equivalents, receivables, short-term debt, merchandise accounts payable, accounts payable and accrued liabilities and long-term debt. With the exception of long-term debt, the carrying amount approximates fair value because of the short maturity of these instruments. The fair values of long-term debt, excluding capitalized leases, are generally estimated based on quoted market prices for identical or similar instruments, and are classified as Level 2 measurements within the hierarchy as defined by applicable accounting standards.
The following table shows the estimated fair value of the Company’s long-term debt:
|
|
February 1, 2014
|
February 2, 2013
|
|||||||||||||||||||||
|
|
Notional
Amount
|
Carrying
Amount
|
Fair
Value
|
Notional
Amount
|
Carrying
Amount
|
Fair
Value
|
|||||||||||||||||
|
|
(millions)
|
||||||||||||||||||||||
|
Long-term debt
|
$
|
6,522
|
|
$
|
6,698
|
|
$
|
7,171
|
|
$
|
6,583
|
|
$
|
6,774
|
|
$
|
7,351
|
|
|||||
The following table shows certain of the Company’s non-financial assets that were measured at fair value on a nonrecurring basis during
2013
and
2012
:
|
|
February 1, 2014
|
February 2, 2013
|
|||||||||||||||||||||||||||||
|
|
Fair Value Measurements
|
Fair Value Measurements
|
|||||||||||||||||||||||||||||
|
|
Total
|
Quoted Prices
in Active
Markets for
Identical
Assets
(Level 1)
|
Significant
Observable
Inputs
(Level 2)
|
Significant
Unobservable
Inputs
(Level 3)
|
Total
|
Quoted Prices
in Active
Markets for
Identical
Assets
(Level 1)
|
Significant
Observable
Inputs
(Level 2)
|
Significant
Unobservable
Inputs
(Level 3)
|
|||||||||||||||||||||||
|
|
(millions)
|
||||||||||||||||||||||||||||||
|
Long-lived assets held and used
|
$
|
13
|
|
$
|
—
|
|
$
|
—
|
|
$
|
13
|
|
$
|
1
|
|
$
|
—
|
|
$
|
—
|
|
$
|
1
|
|
|||||||
F-43
During
2013
, long-lived assets held and used with a carrying value of
$52 million
were written down to their fair value of
$13 million
, resulting in asset impairment charges of
$39 million
. During
2012
, long-lived assets held and used with a carrying value of
$5 million
were written down to their fair value of
$1 million
, resulting in asset impairment charges of
$4 million
. The fair values of these locations were calculated based on the projected cash flows and an estimated risk-adjusted rate of return that would be used by market participants in valuing these assets or prices of similar assets.
Financial instruments that potentially subject the Company to concentrations of credit risk consist principally of temporary cash investments. The Company places its temporary cash investments in what it believes to be high credit quality financial instruments.
|
14.
|
Earnings Per Share
|
The following table sets forth the computation of basic and diluted earnings per share:
|
|
2013
|
2012
|
2011
|
|||||||||||||||||||||||||||||
|
|
Net
Income
|
|
Shares
|
Net
Income
|
|
Shares
|
Net Income
|
|
Shares
|
|||||||||||||||||||||||
|
|
(millions, except per share data)
|
|||||||||||||||||||||||||||||||
|
Net income and average number of shares outstanding
|
$
|
1,486
|
|
377.3
|
|
$
|
1,335
|
|
404.4
|
|
$
|
1,256
|
|
423.5
|
|
|||||||||||||||||
|
Shares to be issued under deferred compensation
and other plans |
1.0
|
|
1.1
|
|
1.0
|
|
||||||||||||||||||||||||||
|
$
|
1,486
|
|
378.3
|
|
$
|
1,335
|
|
405.5
|
|
$
|
1,256
|
|
424.5
|
|
||||||||||||||||||
|
Basic earnings per share
|
$
|
3.93
|
|
$
|
3.29
|
|
$
|
2.96
|
|
|||||||||||||||||||||||
|
Effect of dilutive securities –
|
||||||||||||||||||||||||||||||||
|
Stock options, restricted stock and restricted
stock units |
6.5
|
|
6.7
|
|
5.9
|
|
||||||||||||||||||||||||||
|
$
|
1,486
|
|
384.8
|
|
$
|
1,335
|
|
412.2
|
|
$
|
1,256
|
|
430.4
|
|
||||||||||||||||||
|
Diluted earnings per share
|
$
|
3.86
|
|
$
|
3.24
|
|
$
|
2.92
|
|
|||||||||||||||||||||||
In addition to the stock options, restricted stock and restricted stock units reflected in the foregoing table, restricted stock units relating to
0.7 million
shares of common stock were outstanding at
February 1, 2014
, stock options to purchase
7.5 million
shares of common stock and restricted stock units relating to
1.4 million
shares of common stock were outstanding at
February 2, 2013
, and stock options to purchase
9.3 million
of shares of common stock and restricted stock units relating to
2.1 million
shares of common stock were outstanding at
January 28, 2012
, but were not included in the computation of diluted earnings per share for
2013
,
2012
and
2011
, respectively, because their inclusion would have been antidilutive or they were subject to performance conditions that had not been met.
F-44
|
15.
|
Quarterly Results (unaudited)
|
Unaudited quarterly results for the last two years were as follows:
|
First
Quarter
|
Second
Quarter
|
Third
Quarter
|
Fourth
Quarter
|
||||||||||||
|
(millions, except per share data)
|
|||||||||||||||
|
2013:
|
|||||||||||||||
|
Net sales
|
$
|
6,387
|
|
$
|
6,066
|
|
$
|
6,276
|
|
$
|
9,202
|
|
|||
|
Cost of sales
|
(3,911
|
)
|
(3,533
|
)
|
(3,817
|
)
|
(5,464
|
)
|
|||||||
|
Gross margin
|
2,476
|
|
2,533
|
|
2,459
|
|
3,738
|
|
|||||||
|
Selling, general and administrative expenses
|
(2,041
|
)
|
(1,999
|
)
|
(2,099
|
)
|
(2,301
|
)
|
|||||||
|
Impairments, store closing and other costs
and gain on sale of leases |
—
|
|
—
|
|
—
|
|
(88
|
)
|
|||||||
|
Net income
|
217
|
|
281
|
|
177
|
|
811
|
|
|||||||
|
Basic earnings per share
|
.56
|
|
.73
|
|
.47
|
|
2.21
|
|
|||||||
|
Diluted earnings per share
|
.55
|
|
.72
|
|
.47
|
|
2.16
|
|
|||||||
|
2012:
|
|||||||||||||||
|
Net sales
|
$
|
6,143
|
|
$
|
6,118
|
|
$
|
6,075
|
|
$
|
9,350
|
|
|||
|
Cost of sales
|
(3,757
|
)
|
(3,555
|
)
|
(3,672
|
)
|
(5,554
|
)
|
|||||||
|
Gross margin
|
2,386
|
|
2,563
|
|
2,403
|
|
3,796
|
|
|||||||
|
Selling, general and administrative expenses
|
(1,995
|
)
|
(2,009
|
)
|
(2,078
|
)
|
(2,400
|
)
|
|||||||
|
Impairments, store closing and other costs
and gain on sale of leases |
—
|
|
—
|
|
—
|
|
(5
|
)
|
|||||||
|
Net income
|
181
|
|
279
|
|
145
|
|
730
|
|
|||||||
|
Basic earnings per share
|
.43
|
|
.68
|
|
.36
|
|
1.86
|
|
|||||||
|
Diluted earnings per share
|
.43
|
|
.67
|
|
.36
|
|
1.83
|
|
|||||||
|
16.
|
Condensed Consolidating Financial Information
|
Certain debt obligations of the Company described in Note 6, which constitute debt obligations of Parent’s 100%-owned subsidiary, Macy’s Retail Holdings, Inc. (“Subsidiary Issuer”) are fully and unconditionally guaranteed by Parent. In the following condensed consolidating financial statements, “Other Subsidiaries” includes all other direct subsidiaries of Parent, including FDS Bank, West 34th Street Insurance Company (prior to a merger, known separately as Leadville Insurance Company and Snowdin Insurance Company) and its subsidiary West 34th Street Insurance Company New York, Macy's Merchandising Corporation, Macy’s Merchandising Group, Inc. and its subsidiaries Macy's Merchandising Group (Hong Kong) Limited, Macy's Merchandising Group Procurement, LLC, Macy’s Merchandising Group International, LLC, and Macy's Merchandising Group International (Hong Kong) Limited. “Subsidiary Issuer” includes operating divisions and non-guarantor subsidiaries of the Subsidiary Issuer on an equity basis. The assets and liabilities and results of operations of the non-guarantor subsidiaries of the Subsidiary Issuer are also reflected in “Other Subsidiaries.”
Condensed Consolidating Balance Sheets as of
February 1, 2014
and
February 2, 2013
, the related Condensed Consolidating Statements of Comprehensive Income for
2013
,
2012
and
2011
, and the related Condensed Consolidating Statements of Cash Flows for
2013
,
2012
, and
2011
are presented on the following pages.
F-45
MACY’S, INC.
Condensed Consolidating Balance Sheet
As of
February 1, 2014
(millions)
|
Parent
|
Subsidiary
Issuer
|
Other
Subsidiaries
|
Consolidating
Adjustments
|
Consolidated
|
|||||||||||||||
|
ASSETS:
|
|||||||||||||||||||
|
Current Assets:
|
|||||||||||||||||||
|
Cash and cash equivalents
|
$
|
1,955
|
|
$
|
84
|
|
$
|
234
|
|
$
|
—
|
|
$
|
2,273
|
|
||||
|
Receivables
|
—
|
|
102
|
|
336
|
|
—
|
|
438
|
|
|||||||||
|
Merchandise inventories
|
—
|
|
2,896
|
|
2,661
|
|
—
|
|
5,557
|
|
|||||||||
|
Prepaid expenses and other current assets
|
—
|
|
103
|
|
317
|
|
—
|
|
420
|
|
|||||||||
|
Income taxes
|
80
|
|
—
|
|
—
|
|
(80
|
)
|
—
|
|
|||||||||
|
Total Current Assets
|
2,035
|
|
3,185
|
|
3,548
|
|
(80
|
)
|
8,688
|
|
|||||||||
|
Property and Equipment – net
|
—
|
|
4,590
|
|
3,340
|
|
—
|
|
7,930
|
|
|||||||||
|
Goodwill
|
—
|
|
3,315
|
|
428
|
|
—
|
|
3,743
|
|
|||||||||
|
Other Intangible Assets – net
|
—
|
|
97
|
|
430
|
|
—
|
|
527
|
|
|||||||||
|
Other Assets
|
4
|
|
101
|
|
641
|
|
—
|
|
746
|
|
|||||||||
|
Deferred Income Taxes
|
19
|
|
—
|
|
—
|
|
(19
|
)
|
—
|
|
|||||||||
|
Intercompany Receivable
|
—
|
|
—
|
|
3,561
|
|
(3,561
|
)
|
—
|
|
|||||||||
|
Investment in Subsidiaries
|
4,625
|
|
3,157
|
|
—
|
|
(7,782
|
)
|
—
|
|
|||||||||
|
Total Assets
|
$
|
6,683
|
|
$
|
14,445
|
|
$
|
11,948
|
|
$
|
(11,442
|
)
|
$
|
21,634
|
|
||||
|
LIABILITIES AND SHAREHOLDERS’ EQUITY:
|
|||||||||||||||||||
|
Current Liabilities:
|
|||||||||||||||||||
|
Short-term debt
|
$
|
—
|
|
$
|
461
|
|
$
|
2
|
|
$
|
—
|
|
$
|
463
|
|
||||
|
Merchandise accounts payable
|
—
|
|
760
|
|
931
|
|
—
|
|
1,691
|
|
|||||||||
|
Accounts payable and accrued liabilities
|
10
|
|
1,265
|
|
1,535
|
|
—
|
|
2,810
|
|
|||||||||
|
Income taxes
|
—
|
|
80
|
|
362
|
|
(80
|
)
|
362
|
|
|||||||||
|
Deferred income taxes
|
—
|
|
315
|
|
85
|
|
—
|
|
400
|
|
|||||||||
|
Total Current Liabilities
|
10
|
|
2,881
|
|
2,915
|
|
(80
|
)
|
5,726
|
|
|||||||||
|
Long-Term Debt
|
—
|
|
6,708
|
|
20
|
|
—
|
|
6,728
|
|
|||||||||
|
Intercompany Payable
|
362
|
|
3,199
|
|
—
|
|
(3,561
|
)
|
—
|
|
|||||||||
|
Deferred Income Taxes
|
—
|
|
544
|
|
748
|
|
(19
|
)
|
1,273
|
|
|||||||||
|
Other Liabilities
|
62
|
|
522
|
|
1,074
|
|
—
|
|
1,658
|
|
|||||||||
|
Shareholders’ Equity
|
6,249
|
|
591
|
|
7,191
|
|
(7,782
|
)
|
6,249
|
|
|||||||||
|
Total Liabilities and Shareholders’ Equity
|
$
|
6,683
|
|
$
|
14,445
|
|
$
|
11,948
|
|
$
|
(11,442
|
)
|
$
|
21,634
|
|
||||
F-46
MACY’S, INC.
Condensed Consolidating Statement of Comprehensive Income
For
2013
(millions)
|
Parent
|
Subsidiary
Issuer
|
Other
Subsidiaries
|
Consolidating
Adjustments
|
Consolidated
|
|||||||||||||||
|
Net sales
|
$
|
—
|
|
$
|
13,233
|
|
$
|
23,471
|
|
$
|
(8,773
|
)
|
$
|
27,931
|
|
||||
|
Cost of sales
|
—
|
|
(8,168
|
)
|
(17,276
|
)
|
8,719
|
|
(16,725
|
)
|
|||||||||
|
Gross margin
|
—
|
|
5,065
|
|
6,195
|
|
(54
|
)
|
11,206
|
|
|||||||||
|
Selling, general and administrative expenses
|
(8
|
)
|
(4,443
|
)
|
(4,043
|
)
|
54
|
|
(8,440
|
)
|
|||||||||
|
Impairments, store closing and other costs
and gain on sale of leases |
—
|
|
(37
|
)
|
(51
|
)
|
—
|
|
(88
|
)
|
|||||||||
|
Operating income (loss)
|
(8
|
)
|
585
|
|
2,101
|
|
—
|
|
2,678
|
|
|||||||||
|
Interest (expense) income, net:
|
|||||||||||||||||||
|
External
|
1
|
|
(388
|
)
|
(1
|
)
|
—
|
|
(388
|
)
|
|||||||||
|
Intercompany
|
(2
|
)
|
(176
|
)
|
178
|
|
—
|
|
—
|
|
|||||||||
|
Equity in earnings of subsidiaries
|
1,492
|
|
557
|
|
—
|
|
(2,049
|
)
|
—
|
|
|||||||||
|
Income before income taxes
|
1,483
|
|
578
|
|
2,278
|
|
(2,049
|
)
|
2,290
|
|
|||||||||
|
Federal, state and local income
tax benefit (expense) |
3
|
|
33
|
|
(840
|
)
|
—
|
|
(804
|
)
|
|||||||||
|
Net income
|
$
|
1,486
|
|
$
|
611
|
|
$
|
1,438
|
|
$
|
(2,049
|
)
|
$
|
1,486
|
|
||||
|
Comprehensive income
|
$
|
1,752
|
|
$
|
877
|
|
$
|
1,434
|
|
$
|
(2,311
|
)
|
$
|
1,752
|
|
||||
F-47
MACY’S, INC.
Condensed Consolidating Statement of Cash Flows
For
2013
(millions)
|
Parent
|
Subsidiary
Issuer
|
Other
Subsidiaries
|
Consolidating
Adjustments
|
Consolidated
|
|||||||||||||||
|
Cash flows from operating activities:
|
|||||||||||||||||||
|
Net income
|
$
|
1,486
|
|
$
|
611
|
|
$
|
1,438
|
|
$
|
(2,049
|
)
|
$
|
1,486
|
|
||||
|
Impairments, store closing and other costs
and gain on sale of leases |
—
|
|
37
|
|
51
|
|
—
|
|
88
|
|
|||||||||
|
Equity in earnings of subsidiaries
|
(1,492
|
)
|
(557
|
)
|
—
|
|
2,049
|
|
—
|
|
|||||||||
|
Dividends received from subsidiaries
|
911
|
|
4
|
|
—
|
|
(915
|
)
|
—
|
|
|||||||||
|
Depreciation and amortization
|
—
|
|
467
|
|
553
|
|
—
|
|
1,020
|
|
|||||||||
|
(Increase) decrease in working capital
|
(54
|
)
|
12
|
|
(111
|
)
|
—
|
|
(153
|
)
|
|||||||||
|
Other, net
|
(25
|
)
|
158
|
|
(25
|
)
|
—
|
|
108
|
|
|||||||||
|
Net cash provided by
operating activities |
826
|
|
732
|
|
1,906
|
|
(915
|
)
|
2,549
|
|
|||||||||
|
Cash flows from investing activities:
|
|||||||||||||||||||
|
Purchase of property and equipment and capitalized software, net
|
—
|
|
(289
|
)
|
(442
|
)
|
—
|
|
(731
|
)
|
|||||||||
|
Other, net
|
—
|
|
(6
|
)
|
(51
|
)
|
—
|
|
(57
|
)
|
|||||||||
|
Net cash used by investing activities
|
—
|
|
(295
|
)
|
(493
|
)
|
—
|
|
(788
|
)
|
|||||||||
|
Cash flows from financing activities:
|
|||||||||||||||||||
|
Debt issued, net of debt repaid
|
—
|
|
278
|
|
(2
|
)
|
—
|
|
276
|
|
|||||||||
|
Dividends paid
|
(359
|
)
|
—
|
|
(915
|
)
|
915
|
|
(359
|
)
|
|||||||||
|
Common stock acquired, net of
issuance of common stock |
(1,256
|
)
|
—
|
|
—
|
|
—
|
|
(1,256
|
)
|
|||||||||
|
Intercompany activity, net
|
1,310
|
|
(728
|
)
|
(582
|
)
|
—
|
|
—
|
|
|||||||||
|
Other, net
|
(104
|
)
|
56
|
|
63
|
|
—
|
|
15
|
|
|||||||||
|
Net cash used by financing activities
|
(409
|
)
|
(394
|
)
|
(1,436
|
)
|
915
|
|
(1,324
|
)
|
|||||||||
|
Net increase (decrease) in cash
and cash equivalents |
417
|
|
43
|
|
(23
|
)
|
—
|
|
437
|
|
|||||||||
|
Cash and cash equivalents at
beginning of period |
1,538
|
|
41
|
|
257
|
|
—
|
|
1,836
|
|
|||||||||
|
Cash and cash equivalents at
end of period |
$
|
1,955
|
|
$
|
84
|
|
$
|
234
|
|
$
|
—
|
|
$
|
2,273
|
|
||||
F-48
MACY’S, INC.
Condensed Consolidating Balance Sheet
As of
February 2, 2013
(millions)
|
Parent
|
Subsidiary
Issuer
|
Other
Subsidiaries
|
Consolidating
Adjustments
|
Consolidated
|
|||||||||||||||
|
ASSETS:
|
|||||||||||||||||||
|
Current Assets:
|
|||||||||||||||||||
|
Cash and cash equivalents
|
$
|
1,538
|
|
$
|
41
|
|
$
|
257
|
|
$
|
—
|
|
$
|
1,836
|
|
||||
|
Receivables
|
—
|
|
58
|
|
313
|
|
—
|
|
371
|
|
|||||||||
|
Merchandise inventories
|
—
|
|
2,804
|
|
2,504
|
|
—
|
|
5,308
|
|
|||||||||
|
Prepaid expenses and other current assets
|
—
|
|
97
|
|
264
|
|
—
|
|
361
|
|
|||||||||
|
Income taxes
|
30
|
|
—
|
|
—
|
|
(30
|
)
|
—
|
|
|||||||||
|
Total Current Assets
|
1,568
|
|
3,000
|
|
3,338
|
|
(30
|
)
|
7,876
|
|
|||||||||
|
Property and Equipment – net
|
—
|
|
4,649
|
|
3,547
|
|
—
|
|
8,196
|
|
|||||||||
|
Goodwill
|
—
|
|
3,315
|
|
428
|
|
—
|
|
3,743
|
|
|||||||||
|
Other Intangible Assets – net
|
—
|
|
124
|
|
437
|
|
—
|
|
561
|
|
|||||||||
|
Other Assets
|
3
|
|
71
|
|
541
|
|
—
|
|
615
|
|
|||||||||
|
Intercompany Receivable
|
641
|
|
—
|
|
3,190
|
|
(3,831
|
)
|
—
|
|
|||||||||
|
Investment in Subsidiaries
|
4,027
|
|
2,595
|
|
—
|
|
(6,622
|
)
|
—
|
|
|||||||||
|
Total Assets
|
$
|
6,239
|
|
$
|
13,754
|
|
$
|
11,481
|
|
$
|
(10,483
|
)
|
$
|
20,991
|
|
||||
|
LIABILITIES AND SHAREHOLDERS’ EQUITY:
|
|||||||||||||||||||
|
Current Liabilities:
|
|||||||||||||||||||
|
Short-term debt
|
$
|
—
|
|
$
|
121
|
|
$
|
3
|
|
$
|
—
|
|
$
|
124
|
|
||||
|
Merchandise accounts payable
|
—
|
|
733
|
|
846
|
|
—
|
|
1,579
|
|
|||||||||
|
Accounts payable and accrued liabilities
|
119
|
|
1,023
|
|
1,468
|
|
—
|
|
2,610
|
|
|||||||||
|
Income taxes
|
—
|
|
69
|
|
316
|
|
(30
|
)
|
355
|
|
|||||||||
|
Deferred income taxes
|
—
|
|
323
|
|
84
|
|
—
|
|
407
|
|
|||||||||
|
Total Current Liabilities
|
119
|
|
2,269
|
|
2,717
|
|
(30
|
)
|
5,075
|
|
|||||||||
|
Long-Term Debt
|
—
|
|
6,783
|
|
23
|
|
—
|
|
6,806
|
|
|||||||||
|
Intercompany Payable
|
—
|
|
3,831
|
|
—
|
|
(3,831
|
)
|
—
|
|
|||||||||
|
Deferred Income Taxes
|
11
|
|
410
|
|
817
|
|
—
|
|
1,238
|
|
|||||||||
|
Other Liabilities
|
58
|
|
596
|
|
1,167
|
|
—
|
|
1,821
|
|
|||||||||
|
Shareholders’ Equity (Deficit)
|
6,051
|
|
(135
|
)
|
6,757
|
|
(6,622
|
)
|
6,051
|
|
|||||||||
|
Total Liabilities and Shareholders’ Equity
|
$
|
6,239
|
|
$
|
13,754
|
|
$
|
11,481
|
|
$
|
(10,483
|
)
|
$
|
20,991
|
|
||||
F-49
MACY’S, INC.
Condensed Consolidating Statement of Comprehensive Income
For
2012
(millions)
|
Parent
|
Subsidiary
Issuer
|
Other
Subsidiaries
|
Consolidating
Adjustments
|
Consolidated
|
|||||||||||||||
|
Net sales
|
$
|
—
|
|
$
|
13,594
|
|
$
|
22,493
|
|
$
|
(8,401
|
)
|
$
|
27,686
|
|
||||
|
Cost of sales
|
—
|
|
(8,385
|
)
|
(16,500
|
)
|
8,347
|
|
(16,538
|
)
|
|||||||||
|
Gross margin
|
—
|
|
5,209
|
|
5,993
|
|
(54
|
)
|
11,148
|
|
|||||||||
|
Selling, general and administrative expenses
|
(9
|
)
|
(4,584
|
)
|
(3,943
|
)
|
54
|
|
(8,482
|
)
|
|||||||||
|
Impairments, store closing and other costs
and gain on sale of leases |
—
|
|
(8
|
)
|
3
|
|
—
|
|
(5
|
)
|
|||||||||
|
Operating income (loss)
|
(9
|
)
|
617
|
|
2,053
|
|
—
|
|
2,661
|
|
|||||||||
|
Interest (expense) income, net:
|
|||||||||||||||||||
|
External
|
1
|
|
(422
|
)
|
(1
|
)
|
—
|
|
(422
|
)
|
|||||||||
|
Intercompany
|
(2
|
)
|
(146
|
)
|
148
|
|
—
|
|
—
|
|
|||||||||
|
Premium on early retirement of debt
|
—
|
|
(137
|
)
|
—
|
|
—
|
|
(137
|
)
|
|||||||||
|
Equity in earnings of subsidiaries
|
1,342
|
|
638
|
|
—
|
|
(1,980
|
)
|
—
|
|
|||||||||
|
Income before income taxes
|
1,332
|
|
550
|
|
2,200
|
|
(1,980
|
)
|
2,102
|
|
|||||||||
|
Federal, state and local income
tax benefit (expense) |
3
|
|
24
|
|
(794
|
)
|
—
|
|
(767
|
)
|
|||||||||
|
Net income
|
$
|
1,335
|
|
$
|
574
|
|
$
|
1,406
|
|
$
|
(1,980
|
)
|
$
|
1,335
|
|
||||
|
Comprehensive income
|
$
|
1,465
|
|
$
|
704
|
|
$
|
1,477
|
|
$
|
(2,181
|
)
|
$
|
1,465
|
|
||||
F-50
MACY’S, INC.
Condensed Consolidating Statement of Cash Flows
For
2012
(millions)
|
Parent
|
Subsidiary
Issuer
|
Other
Subsidiaries
|
Consolidating
Adjustments
|
Consolidated
|
|||||||||||||||
|
Cash flows from operating activities:
|
|||||||||||||||||||
|
Net income
|
$
|
1,335
|
|
$
|
574
|
|
$
|
1,406
|
|
$
|
(1,980
|
)
|
$
|
1,335
|
|
||||
|
Impairments, store closing and other costs
and gain on sale of leases |
—
|
|
8
|
|
(3
|
)
|
—
|
|
5
|
|
|||||||||
|
Equity in earnings of subsidiaries
|
(1,342
|
)
|
(638
|
)
|
—
|
|
1,980
|
|
—
|
|
|||||||||
|
Dividends received from subsidiaries
|
783
|
|
125
|
|
—
|
|
(908
|
)
|
—
|
|
|||||||||
|
Depreciation and amortization
|
—
|
|
484
|
|
565
|
|
—
|
|
1,049
|
|
|||||||||
|
Increase in working capital
|
(76
|
)
|
(75
|
)
|
(66
|
)
|
—
|
|
(217
|
)
|
|||||||||
|
Other, net
|
31
|
|
(31
|
)
|
7
|
|
—
|
|
7
|
|
|||||||||
|
Net cash provided by
operating activities |
731
|
|
447
|
|
1,909
|
|
(908
|
)
|
2,179
|
|
|||||||||
|
Cash flows from investing activities:
|
|||||||||||||||||||
|
Purchase of property and equipment and capitalized software, net
|
—
|
|
(324
|
)
|
(552
|
)
|
—
|
|
(876
|
)
|
|||||||||
|
Other, net
|
—
|
|
51
|
|
44
|
|
—
|
|
95
|
|
|||||||||
|
Net cash used by
investing activities |
—
|
|
(273
|
)
|
(508
|
)
|
—
|
|
(781
|
)
|
|||||||||
|
Cash flows from financing activities:
|
|||||||||||||||||||
|
Debt repaid, net of debt issued
|
—
|
|
(799
|
)
|
(4
|
)
|
—
|
|
(803
|
)
|
|||||||||
|
Dividends paid
|
(324
|
)
|
—
|
|
(908
|
)
|
908
|
|
(324
|
)
|
|||||||||
|
Common stock acquired, net of
issuance of common stock |
(1,163
|
)
|
—
|
|
—
|
|
—
|
|
(1,163
|
)
|
|||||||||
|
Intercompany activity, net
|
(194
|
)
|
642
|
|
(448
|
)
|
—
|
|
—
|
|
|||||||||
|
Other, net
|
(45
|
)
|
(14
|
)
|
(40
|
)
|
—
|
|
(99
|
)
|
|||||||||
|
Net cash used by financing activities
|
(1,726
|
)
|
(171
|
)
|
(1,400
|
)
|
908
|
|
(2,389
|
)
|
|||||||||
|
Net increase (decrease) in
cash and cash equivalents |
(995
|
)
|
3
|
|
1
|
|
—
|
|
(991
|
)
|
|||||||||
|
Cash and cash equivalents at
beginning of period |
2,533
|
|
38
|
|
256
|
|
—
|
|
2,827
|
|
|||||||||
|
Cash and cash equivalents at
end of period |
$
|
1,538
|
|
$
|
41
|
|
$
|
257
|
|
$
|
—
|
|
$
|
1,836
|
|
||||
F-51
MACY’S, INC.
Condensed Consolidating Statement of Comprehensive Income
For
2011
(millions)
|
Parent
|
Subsidiary
Issuer
|
Other
Subsidiaries
|
Consolidating
Adjustments
|
Consolidated
|
|||||||||||||||
|
Net sales
|
$
|
—
|
|
$
|
13,405
|
|
$
|
21,312
|
|
$
|
(8,312
|
)
|
$
|
26,405
|
|
||||
|
Cost of sales
|
—
|
|
(8,274
|
)
|
(15,721
|
)
|
8,257
|
|
(15,738
|
)
|
|||||||||
|
Gross margin
|
—
|
|
5,131
|
|
5,591
|
|
(55
|
)
|
10,667
|
|
|||||||||
|
Selling, general and administrative expenses
|
5
|
|
(4,585
|
)
|
(3,756
|
)
|
55
|
|
(8,281
|
)
|
|||||||||
|
Impairments, store closing and other costs
and gain on sale of leases |
—
|
|
28
|
|
(3
|
)
|
—
|
|
25
|
|
|||||||||
|
Operating income
|
5
|
|
574
|
|
1,832
|
|
—
|
|
2,411
|
|
|||||||||
|
Interest (expense) income, net:
|
|||||||||||||||||||
|
External
|
1
|
|
(443
|
)
|
(1
|
)
|
—
|
|
(443
|
)
|
|||||||||
|
Intercompany
|
(1
|
)
|
(191
|
)
|
192
|
|
—
|
|
—
|
|
|||||||||
|
Equity in earnings of subsidiaries
|
1,253
|
|
548
|
|
—
|
|
(1,801
|
)
|
—
|
|
|||||||||
|
Income before income taxes
|
1,258
|
|
488
|
|
2,023
|
|
(1,801
|
)
|
1,968
|
|
|||||||||
|
Federal, state and local income
tax benefit (expense) |
(2
|
)
|
27
|
|
(737
|
)
|
—
|
|
(712
|
)
|
|||||||||
|
Net income
|
$
|
1,256
|
|
$
|
515
|
|
$
|
1,286
|
|
$
|
(1,801
|
)
|
$
|
1,256
|
|
||||
|
Comprehensive income
|
$
|
925
|
|
$
|
184
|
|
$
|
1,150
|
|
$
|
(1,334
|
)
|
$
|
925
|
|
||||
F-52
MACY’S, INC.
Condensed Consolidating Statement of Cash Flows
For
2011
(millions)
|
Parent
|
Subsidiary
Issuer
|
Other
Subsidiaries
|
Consolidating
Adjustments
|
Consolidated
|
|||||||||||||||
|
Cash flows from operating activities:
|
|||||||||||||||||||
|
Net income
|
$
|
1,256
|
|
$
|
515
|
|
$
|
1,286
|
|
$
|
(1,801
|
)
|
$
|
1,256
|
|
||||
|
Impairments, store closing and other costs
and gain on sale of leases |
—
|
|
(28
|
)
|
3
|
|
—
|
|
(25
|
)
|
|||||||||
|
Equity in earnings of subsidiaries
|
(1,253
|
)
|
(548
|
)
|
—
|
|
1,801
|
|
—
|
|
|||||||||
|
Dividends received from subsidiaries
|
612
|
|
175
|
|
—
|
|
(787
|
)
|
—
|
|
|||||||||
|
Depreciation and amortization
|
—
|
|
517
|
|
568
|
|
—
|
|
1,085
|
|
|||||||||
|
(Increase) decrease in working capital
|
5
|
|
(59
|
)
|
81
|
|
—
|
|
27
|
|
|||||||||
|
Other, net
|
(18
|
)
|
(166
|
)
|
14
|
|
—
|
|
(170
|
)
|
|||||||||
|
Net cash provided by
operating activities |
602
|
|
406
|
|
1,952
|
|
(787
|
)
|
2,173
|
|
|||||||||
|
Cash flows from investing activities:
|
|||||||||||||||||||
|
Purchase of property and equipment and capitalized software, net
|
—
|
|
(171
|
)
|
(473
|
)
|
—
|
|
(644
|
)
|
|||||||||
|
Other, net
|
38
|
|
(35
|
)
|
(56
|
)
|
—
|
|
(53
|
)
|
|||||||||
|
Net cash provided (used) by
investing activities |
38
|
|
(206
|
)
|
(529
|
)
|
—
|
|
(697
|
)
|
|||||||||
|
Cash flows from financing activities:
|
|||||||||||||||||||
|
Debt issued, net of debt repaid
|
—
|
|
349
|
|
(3
|
)
|
—
|
|
346
|
|
|||||||||
|
Dividends paid
|
(148
|
)
|
—
|
|
(787
|
)
|
787
|
|
(148
|
)
|
|||||||||
|
Common stock acquired, net of
issuance of common stock |
(340
|
)
|
—
|
|
—
|
|
—
|
|
(340
|
)
|
|||||||||
|
Intercompany activity, net
|
1,186
|
|
(529
|
)
|
(657
|
)
|
—
|
|
—
|
|
|||||||||
|
Other, net
|
21
|
|
(23
|
)
|
31
|
|
—
|
|
29
|
|
|||||||||
|
Net cash provided (used) by
financing activities |
719
|
|
(203
|
)
|
(1,416
|
)
|
787
|
|
(113
|
)
|
|||||||||
|
Net increase (decrease) in cash
and cash equivalents |
1,359
|
|
(3
|
)
|
7
|
|
—
|
|
1,363
|
|
|||||||||
|
Cash and cash equivalents at
beginning of period |
1,174
|
|
41
|
|
249
|
|
—
|
|
1,464
|
|
|||||||||
|
Cash and cash equivalents at
end of period |
$
|
2,533
|
|
$
|
38
|
|
$
|
256
|
|
$
|
—
|
|
$
|
2,827
|
|
||||
F-53
TABLE OF CONTENTS
Part IIIItem 1. BusinessItem 1A. Risk FactorsItem 1B. Unresolved Staff CommentsItem 2. PropertiesItem 3. Legal ProceedingsItem 4. Mine Safety DisclosuresPart IIItem 5. Market For Registrant S Common Equity, Related Stockholder Matters and Issuer Purchases Of Equity SecuritiesItem 6. Selected Financial DataItem 7. Management S Discussion and Analysis Of Financial Condition and Results Of OperationsItem 7A. Quantitative and Qualitative Disclosures About Market RiskItem 8. Consolidated Financial Statements and Supplementary DataItem 9. Changes in and Disagreements with Accountants on Accounting and Financial DisclosureItem 9A. Controls and ProceduresItem 10. Directors, Executive Officers and Corporate GovernanceItem 11. Executive CompensationItem 12. Security Ownership Of Certain Beneficial Owners and Management and Related Stockholder MattersItem 13. Certain Relationships and Related Transactions, and Director IndependenceItem 14. Principal Accountant Fees and ServicesPart IVItem 15. Exhibits and Financial Statement Schedules