MASTERCARD INC
10-Ks and 10-Qs
|
|
|
|
|
|
|
|
|
|
|
|
|
|
|
|
|
|
|
|
|
|
|
|
|
|
|
|
|
|
|
|
|
|
|
|
|
|
|
|
|
|
|
|
|
|
|
|
|
|
|
|
|
|
|
|
UNITED STATES
SECURITIES AND EXCHANGE COMMISSION
Washington, D.C. 20549
Form 10-K
|
x
|
ANNUAL REPORT PURSUANT TO SECTION 13 OR 15(d) OF THE SECURITIES EXCHANGE ACT OF 1934
|
For the fiscal year ended
December 31, 2012
Or
|
¨
|
TRANSITION REPORT PURSUANT TO SECTION 13 OR 15(d) OF THE SECURITIES EXCHANGE ACT OF 1934
|
For the transition period from to
Commission file number: 001-32877
MasterCard Incorporated
(Exact name of registrant as specified in its charter)
|
Delaware
|
13-4172551
|
|
(State or other jurisdiction of
incorporation or organization)
|
(IRS Employer
Identification Number)
|
|
2000 Purchase Street
|
10577
|
|
Purchase, NY
|
(Zip Code)
|
|
(Address of principal executive offices)
|
|
(914) 249-2000
(Registrant’s telephone number, including area code)
Title of each Class
Name of each exchange on which registered
Class A common stock, par value $0.0001 per share
New York Stock Exchange
Securities registered pursuant to Section 12(g):
Class B common stock, par value $0.0001 per share
Indicate by check mark if the registrant is a well-known seasoned issuer, as defined in Rule 405 of the Securities Act.
Yes
x
No
¨
Indicate by check mark if the registrant is not required to file reports pursuant to Section 13 or Section 15(d) of the Act.
Yes
¨
No
x
Indicate by check mark whether the registrant (1) has filed all reports required to be filed by Section 13 or 15(d) of the Securities Exchange Act of 1934 during the preceding 12 months (or for such shorter period that the registrant was required to file such reports), and (2) has been subject to such filing requirements for the past 90 days.
Yes
x
No
¨
Indicate by check mark whether the registrant has submitted electronically and posted on its corporate Web site, if any, every Interactive Data File required to be submitted and posted pursuant to Rule 405 of Regulation S-T (§232.405 of this chapter) during the preceding 12 months (or for such shorter period that the registrant was required to submit and post such files)
Yes
x
No
¨
Indicate by check mark if disclosure of delinquent filers pursuant to Item 405 of Regulation S-K (§229.405 of this chapter) is not contained herein, and will not be contained, to the best of the registrant's knowledge, in definitive proxy or information statements incorporated by reference in Part III of this Form 10-K or any amendment to this Form 10-K.
x
Indicate by check mark whether the registrant is a large accelerated filer, an accelerated filer, a non-accelerated filer, or a smaller reporting company. See the definitions of “large accelerated filer,” “accelerated filer” and “smaller reporting company” in Rule 12b-2 of the Exchange Act. (Check One):
|
Large accelerated filer
|
|
x
|
|
Accelerated filer
|
|
o
|
|
Non-accelerated filer
|
|
o
(do not check if a smaller reporting company)
|
|
Smaller reporting company
|
|
o
|
Indicate by check mark whether the registrant is a shell company (as defined in Rule 12b-2 of the Act).
Yes
¨
No
x
The aggregate market value of the registrant's Class A common stock, par value
$0.0001
per share, held by non-affiliates (using the New York Stock Exchange closing price as of
June 29, 2012
, the last business day of the registrant's most recently completed second fiscal quarter) was approximately
$51.5 billion
. There is currently no established public trading market for the registrant's Class B common stock, par value
$0.0001
per share. As of
February 7, 2013
, there wer
e
117,961,825
shares o
utstanding of the registrant’s Class A common stock, par value
$0.0001
per share a
nd
4,808,789
shares outs
tanding of the registrant’s Class B common stock, par value
$0.0001
per share.
Portions of the registrant's definitive proxy statement for the 2013 Annual Meeting of Stockholders are incorporated by reference into Part III hereof.
MASTERCARD INCORPORATED
FISCAL YEAR 2012 FORM 10-K ANNUAL REPORT
TABLE OF CONTENTS
|
|
Page
|
|
|
Item 1.
|
||
|
Item 1A.
|
||
|
Item 1B.
|
||
|
Item 2.
|
||
|
Item 3.
|
||
|
Item 4.
|
|
|
|
Item 5.
|
||
|
Item 6.
|
||
|
Item 7.
|
||
|
Item 7A.
|
||
|
Item 8.
|
||
|
Item 9.
|
||
|
Item 9A.
|
||
|
Item 9B.
|
||
|
|
||
|
Item 10.
|
||
|
Item 11.
|
||
|
Item 12.
|
||
|
Item 13.
|
||
|
Item 14.
|
||
|
|
||
|
Item 15.
|
||
2
Forward-Looking Statements
This Report on Form 10-K contains forward-looking statements pursuant to the safe harbor provisions of the Private Securities Litigation Reform Act of 1995. All statements other than statements of historical facts may be forward-looking statements. When used in this Report, the words “believe”, “expect”, “could”, “may”, “would”, “will”, “trend” and similar words are intended to identify forward-looking statements. These forward-looking statements relate to the Company’s future prospects, developments and business strategies and include, without limitation, statements relating to:
|
•
|
the Company’s focus on growing its credit, debit, prepaid, commercial and payment transaction processing offerings;
|
|
•
|
the Company’s focus on diversifying its business (including seeking new areas of growth, expanding acceptance points and maintaining unsurpassed acceptance and successfully working with new business partners);
|
|
•
|
the Company’s focus on building new businesses through technology and strategic efforts and alliances focused on innovative payment methods;
|
|
•
|
the Company's focus on providing value to stakeholders, including issuers, acquirers, merchants and governments;
|
|
•
|
the Company's focus on chip-enabled technology;
|
|
•
|
the stability of economies around the globe;
|
|
•
|
the Company’s advertising and marketing strategy and investment;
|
|
•
|
the Company's belief that its existing cash, cash equivalents and investment securities balances, its cash flow generating capabilities, its borrowing capacity and its access to capital resources are sufficient to satisfy its future operating cash needs, capital asset purchases, outstanding commitments and other liquidity requirements associated with its existing operations and potential obligations; and
|
|
•
|
the manner and amount of purchases by the Company pursuant to its share repurchase program, dependent upon price and market conditions.
|
Many factors and uncertainties relating to our operations and business environment, all of which are difficult to predict and many of which are outside of our control, influence whether any forward-looking statements can or will be achieved. Any one of those factors could cause our actual results to differ materially from those expressed or implied in writing in any forward-looking statements made by MasterCard or on its behalf. We believe there are certain risk factors that are important to our business, and these could cause actual results to differ from our expectations. Such risk factors include: legislation, regulatory proceedings, central bank regulation and litigation related to interchange fees and other practices; regulation established by the Dodd-Frank Act (as defined below) in the United States; introduction of the no-surcharge rule; requirement to permit U.S. merchants to surcharge credit cards (subject to final approval of the U.S. merchant class litigation); regulation or other legislative or regulatory activity with respect to the payments industry in one jurisdiction or of one product resulting in regulation (or impact on pending regulatory proceedings) in other jurisdictions or of other products; competitive issues caused by preferential or protective government actions; regulation of the payments industry, consumer privacy, data use and/or security; potential or incurred liability and limitations on business resulting from litigation; potential changes in tax laws; substantial and increasingly intense competition in the payments industry; potential future changes in the competitive landscape; competitive pressure on pricing; banking industry consolidation; loss of significant business from significant customers; merchant activity; the relationship of our competitors with our customers; our relationship with our customers; brand perceptions and reputation; global economic events and the overall business environment; decline in cross-border travel; the effect of general economic and global political conditions on consumer spending trends; exposure to loss or illiquidity due to guarantees of settlement and certain other third-party obligations; impact of a failure or breach of our security systems or infrastructure as a result of cyber attacks; disruptions to our transaction processing systems and other services; account data breaches; reputation damage from increases in fraudulent activity; the challenges resulting from rapid technological developments in the payments industry; the effect of adverse currency fluctuation; acquisition, entry into new businesses and other integration issues; and issues relating to our Class A common stock and corporate governance structure. Please see a complete discussion of these risk factors in Part I, Item 1A - Risk Factors. We caution you that the important factors referenced above may not contain all of the factors that are important to you. Our forward-looking statements speak only as of the date of this report or as of the date they are made, and we undertake no obligation to update our forward-looking statements.
3
In this Report, references to the “Company,” “MasterCard,” “we,” “us” or “our” refer to the MasterCard brand generally, and to the business conducted by MasterCard Incorporated and its consolidated subsidiaries, including our operating subsidiary, MasterCard International Incorporated (d/b/a MasterCard Worldwide).
Item 1.
Business
Overview
MasterCard is a technology company in the global payments industry that connects consumers, financial institutions, merchants, governments and businesses worldwide, enabling them to use electronic forms of payment instead of cash and checks. We make payments more convenient, secure and efficient by creating solutions that meet the needs of all of our stakeholders, and thereby drive preference for electronic payments. We offer a wide range of payment solutions that enable the development and implementation of credit, debit, prepaid, commercial and related payment programs and solutions for consumers and merchants. Our customers encompass a vast array of entities, including financial institutions and other entities that act as “issuers” and “acquirers”, merchants, governments, telecommunications companies and other businesses. We manage a family of well-known, widely-accepted payment brands, including MasterCard®, Maestro® and Cirrus®, which our customers use in their payment programs and solutions. We process payment transactions over the MasterCard Worldwide Network and provide support services to our customers and others. We establish and enforce a common set of standards for adherence by our customers for the efficient and secure use of our payments network.
We generate revenue by charging fees to our customers for providing transaction processing and other payment-related services and by assessing our customers based primarily on the dollar volume of activity, or gross dollar volume (“GDV”), on the cards and other devices that carry our brands.
A typical transaction processed over our network involves four parties in addition to us: the cardholder, the merchant, the issuer (the cardholder's financial institution) and the acquirer (the merchant's financial institution). Consequently, the payments network we operate supports what is often referred to as a “four-party” payments system. Using our transaction processing services, issuers and acquirers who are our customers facilitate payment transactions between cardholders and merchants throughout the world, providing merchants with an efficient and secure means of receiving payment, and consumers and businesses with a convenient, quick and secure payment method that is accepted worldwide. We guarantee the settlement of many of these transactions between our issuers and acquirers to ensure the integrity of our payments network. We offer a number of value-added services and solutions to our customers, merchants and consumers, including, among others, loyalty and rewards solutions, fraud prevention and detection services, alert and other controls and information services through our MasterCard Advisors group. In addition, we carry out marketing activities designed to maintain and enhance the value of our brands. While cardholder and merchant transaction relationships are generally managed by our customers, we work with merchants to help provide value to them and benefits to consumers. We provide merchants with the opportunity to increase revenue, build a recurring relationship with consumers, accept sales through new channels, create a better purchase experience, improve efficiencies and address fraud concerns. We do not issue cards, extend credit to cardholders, determine the interest rates (if applicable) or other fees charged to cardholders by issuers, or establish the “merchant discount” rate charged by acquirers in connection with the acceptance of cards that carry our brands.
Our business has a global reach and has continued to experience growth. In
2012
, we processed
34.2 billion
transactions, a
25%
increase over the number of transactions processed in
2011
. GDV on cards carrying the MasterCard logo as reported by our customers was
$3.6 trillion
in
2012
, a
15%
increase in local currency terms and a
12%
increase in U.S. dollar terms over the GDV reported in 2011.
Our ability to grow is based on three drivers:
|
•
|
personal consumption expenditure growth;
|
|
•
|
the trend within the global payments industry away from paper-based forms of payment, such as cash and checks, toward electronic forms of payment (such as those made via payment cards and other devices); and
|
|
•
|
our share in electronic payments through innovative solutions and new technology.
|
We support our focus on these drivers by continuing to:
|
•
|
grow our core businesses globally, including credit, debit, prepaid and commercial programs and solutions, as well as the processing of payment transactions over the MasterCard Worldwide Network,
|
4
|
•
|
diversify our business by seeking new areas of growth in markets around the world, expanding points of acceptance globally, seeking to maintain unsurpassed acceptance, and deepening existing relationships or entering into new relationships with payments industry participants, such as merchants, governments and telecommunications companies, and
|
|
•
|
build new businesses through technology and continued strategic efforts and alliances focused on innovative payment methods like e-commerce and mobile.
|
We operate in a dynamic and rapidly evolving legal and regulatory environment. In recent years, we have faced heightened regulatory and legislative scrutiny and other legal challenges, particularly with respect to interchange fees. Interchange fees balance payments system costs among acquirers and issuers (and in turn, among merchants and cardholders). These fees, however, have been the subject of regulatory review and challenges and legislative action, as well as litigation, as electronic forms of payment have become relatively more important to local economies. Although we establish certain interchange rates and collect and remit interchange fees on behalf of our customers, we do not earn revenues from interchange fees. See “Risk Factors-Legal and Regulatory Risks” in Part I, Item 1A of this Report.
The Global Payments Industry
We operate in the global payments industry, which consists of all forms of payment including:
|
•
|
Paper-based payments - cash, personal checks, money orders, official checks, travelers cheques and other paper-based means of transferring value;
|
|
•
|
Card-based payments - credit cards, charge cards, debit and deferred debit cards (including cash access or Automated Teller Machine (“ATM”) cards), prepaid cards and other types of cards;
|
|
•
|
Contactless, mobile and web-based payments - contactless payments, electronic payments through mobile phones and other handheld devices using a variety of applications, and e-commerce transactions on the Internet and through web browsers; and
|
|
•
|
Other electronic payments - wire transfers, electronic benefits transfers, bill payments and automated clearing house payments, among others.
|
The most common card-based forms of payment are general purpose cards, which are payment cards carrying logos that permit widespread use of the cards within countries, regions or around the world. General purpose cards have different attributes depending on the type of accounts to which they are linked:
|
•
|
credit or charge cards typically access a credit account that either requires payment of the full balance within a specified period (a charge card) or that permits the cardholder to carry a balance in a revolving credit account (a credit card);
|
|
•
|
debit cards typically access a deposit account or other account with accessible funds maintained by the cardholder; and
|
|
•
|
prepaid cards typically access previously-funded monetary value.
|
The primary general purpose card brands include MasterCard, Visa®, American Express®, JCB®, Diners Club®, UnionPay® and Discover®. These brands, including MasterCard, have come to be associated with a variety of forms of payment in the United States and other markets around the world, including (depending on the brand) credit, charge, debit and prepaid cards. Regional and domestic/local debit brands that require a personal identification number (“PIN”) for verification represent alternative, and sometimes primary, brands within many countries. In these markets, issuers have historically relied on the Maestro and Cirrus brands (and other brands) to enable cross-border transactions, which typically constitute a small portion of the overall number of transactions.
In addition to general purpose cards, private label cards comprise a portion of all card-based forms of payment. Typically, private label cards are credit cards issued by, or on behalf of, a merchant (such as a department store or gasoline retailer) and can be used only at that merchant's locations.
Payment Services and Solutions
We provide transaction processing and other payment-related services as well as a wide range of payment solutions to enable our customers to design, package and implement products and programs targeted to the specific needs of their customers. We work with customers to provide customized solutions, as well as more general solutions. Our payment solutions are built upon
5
our expertise in payment programs, product development, payment processing technology, loyalty and rewards solutions, payment security, consulting and information services and marketing.
We also manage and promote our brands for the benefit of all customers through advertising, promotional and interactive programs and sponsorship initiatives.
Transaction Processing on the MasterCard Worldwide Network
Introduction.
We operate the MasterCard Worldwide Network, our proprietary, global payments network that links issuers and acquirers around the globe to facilitate the processing of transactions and, through them, permits MasterCard cardholders to use their cards and other payment devices at millions of merchants worldwide. We process transactions through our network for financial institutions and other entities that are our customers, in more than 150 currencies in more than 210 countries and territories.
Typical Transaction
. A typical transaction processed over the MasterCard Worldwide Network involves four participants in addition to us: cardholder, merchant, issuer (the cardholder's financial institution) and acquirer (the merchant's financial institution). The following diagram depicts a typical point-of-interaction card transaction:
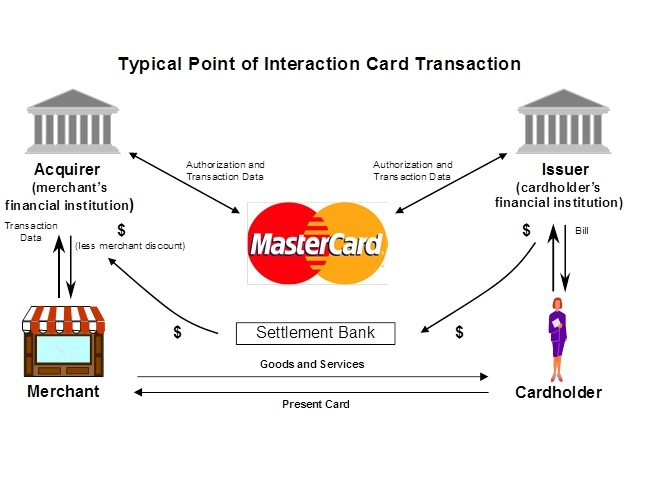
In a typical transaction, a cardholder purchases goods or services from a merchant using a card or other payment device. After the transaction is authorized by the issuer using our network, the issuer pays the acquirer an amount equal to the value of the transaction, minus the interchange fee (described below), and then posts the transaction to the cardholder's account. The acquirer pays the amount of the purchase, net of a discount (referred to as the “merchant discount” rate, as further described below), to the merchant. The merchant discount rate, among other things, takes into consideration the amount of the interchange fee.
Interchange Fees.
Interchange fees represent a sharing of a portion of payments system costs among the issuers and acquirers participating in our four-party payments system. They reflect the value merchants receive from accepting our products and play a key role in balancing the costs consumers and merchants pay. We do not earn revenues from interchange fees. Generally, interchange fees are collected from acquirers and paid to issuers (or netted by issuers against amounts paid to acquirers) to reimburse the issuers for a portion of the costs incurred by them in providing services that benefit all participants in the system, including acquirers and merchants. In some circumstances, such as cash withdrawal transactions, this situation is reversed and interchange fees are paid by issuers to acquirers. We establish default interchange fees that apply when there are no other established settlement terms in place between an issuer and an acquirer. We administer the collection and remittance of interchange fees through the settlement process. Interchange fees can be a significant component of the merchant discount rate, and therefore of the costs that merchants pay to accept electronic payments. These fees are currently subject to regulatory, legislative and/or legal challenges in a number of jurisdictions. We are devoting substantial management and financial resources to the defense of interchange fees and to the other legal and regulatory challenges we face. See “Risk Factors-Legal and Regulatory Risks” in Part I, Item 1A.
Merchant Discount Rate.
The merchant discount rate is established by the acquirer to cover its costs of participating in the four-party system and generally to provide for a profit margin with respect to services rendered to the merchant. The rate takes into consideration the amount of the interchange fee which the acquirer generally pays to the issuer.
6
Additional Fees and Economic Considerations.
Among the parties in a four-party system, various types of fees may be charged to different constituents for various services. For example, acquirers may charge merchants processing and related fees in addition to the merchant discount rate. Issuers may also charge cardholders fees for the transaction, including, for example, fees for extending revolving credit. As described below, we charge issuers and acquirers transaction-based and related fees for the transaction processing and related services we provide them.
In a four-party payments system, the economics of a payment transaction relative to MasterCard vary widely depending on such factors as whether the transaction is domestic (and, if it is domestic, the country in which it takes place) or cross-border, whether it is a point-of-sale purchase transaction or cash withdrawal, and whether the transaction is processed over our network or a third-party network or is handled solely by a financial institution that is both the acquirer for the merchant and the issuer to the cardholder (an “on-us” transaction).
Authentication
. Generally, transactions processed over our network can be authenticated at the point of interaction and across the processing value chain. A typical transaction processed over our network can be authenticated in several ways (depending on the type of card or device being used):
|
•
|
“signature-based” transactions that typically require a cardholder to sign a sales receipt as the primary means of validation at the point of interaction (other than circumstances, such as purchases over the internet and low-value purchases, where a signature is not necessary);
|
|
•
|
“PIN-based” transactions that require the cardholder to input a PIN for verification which can be validated by the issuer at their processing site; and
|
|
•
|
transactions using chip-enabled cards and point-of-interaction devices which allow for automatic authentication between the card and device (as well as, depending on the card or device, signature or PIN authentication).
|
In addition, some payment cards and devices are equipped with an RFID (radio frequency identification) microchip, which provides an advanced authentication technique, and technology that allows contactless payments requiring neither signature nor PIN under established maximum transaction amounts.
MasterCard Worldwide Network Architecture and Operations
. We believe the architecture of the MasterCard Worldwide Network is unique, featuring a globally integrated structure that provides scalability for our customers and enables them to expand into regional and global markets. Our network also features an intelligent architecture that enables it to adapt to the needs of each transaction by blending two distinct processing structures-distributed (peer-to-peer) and centralized (hub-and-spoke). Transactions that require fast, reliable processing, such as those submitted using a contactless card or device at a toll booth, can use the network's distributed processing structure, ensuring they are processed close to where the transaction occurred. Transactions that require value-added processing, such as real-time access to transaction data for fraud scoring or rewards at the point-of-sale, or customization of transaction data for unique consumer-spending controls, use the network's centralized processing structure, ensuring advanced processing services are applied to the transaction. Through the unique architecture of our network, we are able to connect all parties with respect to payments transactions regardless of whether the transaction is occurring at a traditional physical location, at an ATM, on the internet or through a mobile device.
The network typically operates at under 80% capacity and has the capacity to handle more than 160 million transactions per hour with an average network response time of 130 milliseconds. The network can also substantially scale capacity to meet demand. Our transaction processing services are available 24 hours per day, every day of the year. Our global payments network provides multiple levels of back-up protection and related continuity procedures should the issuer, acquirer or payments network experience a service interruption. Moreover, the network features multiple layers of protection against hacking or other cyber-attacks. See our risk factor in "Risk Factors - Business Risks" in Part I, Item 1A of this Report related to a failure or breach of our security systems or infrastructure as a result of cyber-attacks. We supplement this protection with mitigation efforts to strengthen our protection against such threats, both in terms of operability of the network and protection of the information transmitted through the network. To date, we have consistently maintained availability of our global processing systems more than 99.9% of the time.
Processing Capabilities.
|
•
|
Transaction Switching - Authorization, Clearing and Settlement.
We provide transaction switching (authorization, clearing and settlement) through the MasterCard Worldwide Network.
|
|
◦
|
Authorization
. Authorization refers to the process by which a transaction is routed to the issuer for approval and then a decision whether or not to approve the transaction is made by the issuer or, in certain circumstances such as when the issuer's systems are unavailable or cannot be contacted, by MasterCard or others on behalf
|
7
of the issuer in accordance with either the issuer's instructions or applicable rules (also known as “stand-in”). Our standards, which may vary across regions, establish the circumstances under which merchants and acquirers must seek authorization of transactions.
|
◦
|
Clearing
. Clearing refers to the exchange of financial transaction information between issuers and acquirers after a transaction has been successfully conducted at the point of interaction. We clear transactions among customers through our processing systems.
|
|
◦
|
Settlement
. Once transactions have been authorized and cleared, we help to settle the transactions by facilitating the exchange of funds between parties. Once clearing is completed, a daily reconciliation is provided to each customer involved in settlement, detailing the net amounts by clearing cycle and a final settlement position. The actual exchange of funds takes place between a settlement bank, designated by the customer and approved by us, and a settlement bank chosen by us. Customer settlement occurs generally in U.S. dollars or in a limited number of other currencies in accordance with our established rules.
|
|
•
|
Cross-Border and Domestic Processing.
The MasterCard Worldwide Network provides our customers with a flexible structure that enables them to support processing across regions and for domestic markets. The network processes transactions throughout the world on our products where the merchant country and issuer country are different (cross-border transactions). We process transactions denominated in more than 150 currencies through our global system, providing cardholders with the ability to utilize, and merchants to accept, MasterCard cards and other payment devices across multiple country borders. For example, we may process a transaction in a merchant's local currency; however, the charge for the transaction would appear on the cardholder's statement in the cardholder's home currency. We also provide domestic (or intra-country) transaction processing services to customers in every region of the world, which allow customers to facilitate payment transactions between cardholders and merchants within a particular country. We process most of the cross-border transactions using MasterCard, Maestro and Cirrus-branded cards and process the majority of MasterCard-branded domestic transactions in the United States, United Kingdom, Canada, Brazil and a select number of other countries. Outside of these countries, most intra-country (as opposed to cross-border) transaction activity conducted with our payment products is authorized, cleared and/or settled by our customers or other processors without the involvement of the MasterCard Worldwide Network. We continue to invest in our network and build relationships to expand opportunities for domestic transaction processing. In particular, the Single European Payment Area (“SEPA”) initiative creates an open and competitive market in many European countries that were previously mandated to process domestic debit transactions with domestic processors. As a result, in addition to cross-border transactions, we now process some domestic debit transactions in virtually every SEPA country.
|
|
•
|
Extended Processing Capabilities.
In addition to transaction switching, we continually evaluate and invest in ways to strategically extend our processing capabilities in the payments value chain by seeking to provide our customers with an expanded suite of payment processing solutions that meet the unique processing needs of their markets. Examples include:
|
|
◦
|
MasterCard Integrated Processing Solutions
®
.
MasterCard Integrated Processing Solutions (“IPS”) is a debit and prepaid issuer processing platform designed to provide medium to large global issuing customers with a complete processing solution to help create differentiated products and services and allow quick deployment of payments portfolios across banking channels. Through a single processing platform, IPS can, among other things, authorize debit and prepaid transactions, assist issuers in managing risk using fraud detection tools, manage an issuer's card base, and manage and monitor an issuer's ATMs. The proprietary MasterCard Total Portfolio View™ tool provides a user-friendly customer interface to IPS, delivering aggregate cardholder intelligence across accounts and product lines to provide our customers with a view of information that can help them customize their products and programs. We continue to develop opportunities to further enhance our IPS offerings and global presence.
|
|
◦
|
Internet Payment Gateways
. We provide e-commerce processing solutions through internet payment gateways, which are interfaces between merchants and acquirers that help move a transaction through the payments network. Our gateways include DataCash® and MasterCard Internet Gateway Service (MiGS), which offer payment service provider solutions across the globe. These gateways offer a single interface to provide e-commerce merchants with the ability to process secure payments and offer value-added solutions, including outsourced electronic payments, fraud prevention and alternative payment options.
|
|
◦
|
Strategic Investments
. We have invested strategically in various regions around the globe to pursue opportunities in issuer, prepaid, acquirer and third-party processing. These investments support and/or provide, among other
|
8
things, prepaid processing, acquirer processing, third-party processing services and software (as well as switching solutions) and complete processing solutions for mobile payments.
Acceptance
As of December 31, 2012, cards carrying the MasterCard logo were accepted at 35.9 million acceptance locations worldwide, including 2.1 million ATMs and 0.6 million other locations where cash may be obtained. Information on ATM and manual cash access locations is reported by our customers and is partly based on publicly available reports of payments industry associations, government agencies and independent market analysts. Cards bearing the Maestro or Cirrus logos are accepted at many of these same locations.
We seek to maintain unsurpassed acceptance of MasterCard-branded programs by :
|
•
|
Increasing the categories of merchants that accept products carrying our brands
- In addition to expanding acceptance in e-commerce and mobile commerce environments, we leverage the functionality of the MasterCard Worldwide Network to expand acceptance in quick service businesses (such as fast food restaurants) and transportation (such as commuter train systems, buses and taxis) using our contactless technology, as well as public sector payments (such as those involving taxes, fees, fines and tolls), among other categories.
|
|
•
|
Increasing the number of payment channels in which MasterCard programs are accepted
- We continue to introduce MasterCard acceptance in connection with bill payment. We are working with customers to encourage consumers to make bill payments in a variety of categories including rent, utilities and insurance with their MasterCard products.
|
|
•
|
Increasing the number of small merchants and merchants in established accepting categories who have not historically accepted MasterCard products
- We enable parties like Square, iZettle, Intuit and others to provide acceptance to smaller merchants through connected devices (such as card readers), displacing cash. Our Payment Facilitator Program was specifically designed to enable such parties.
|
|
•
|
Increasing usage of our programs at selected merchants
- We sponsor a wide range of promotional programs on a global basis. We also enter into arrangements with selected merchants under which these merchants receive performance incentives for the increased use of MasterCard programs or indicating a preference for MasterCard-branded programs when accepting payments from consumers.
|
MasterCard Programs and Solutions
Our principal payment programs and solutions, which are facilitated through our brands, include consumer credit and charge, debit, prepaid and commercial programs and solutions and emerging payments solutions (including digital and mobile money platforms). Our issuer customers determine the competitive features for the cards and other products issued under our programs, including interest rates and fees. We determine other aspects of our programs, such as required services and the marketing strategy, in order to help ensure consistency.
Consumer Credit and Charge.
We offer a number of consumer credit and charge programs that are designed to meet the needs of our customers. For the year ended December 31, 2012, our consumer credit and charge programs generated $1.8 trillion in GDV globally, representing 50% of our total GDV for this period. As of December 31, 2012, the MasterCard logo appeared on 686 million consumer credit and charge cards worldwide, representing a 5% increase from December 31, 2011.
We offer customized programs around the world to address specific consumer segments. Our consumer credit programs include:
|
•
|
Standard
- general purpose products targeted to entry level consumers with basic credit card needs. Standard products provide payment solutions featuring revolving credit, security and everyday convenience.
|
|
•
|
Premium
- products designed for emerging affluent consumers and featuring higher credit lines and spending limits and a varying level of enhanced services, including insurance coverage and access benefits.
|
|
•
|
Affluent
- product offerings which feature our highest purchasing capacity, as well as a comprehensive range of premium access benefits and top-tier services, and travel, concierge and cardholder protection insurances in some regions. These products are specifically designed to target the needs of the most affluent segments worldwide.
|
9
Debit.
We support a range of payment solutions that allow our customers to provide consumers with convenient access to funds in deposit accounts and other accounts. Our debit and deposit access programs may have the MasterCard, Maestro and/or Cirrus logos, and can be used to obtain cash in bank branches or at ATMs. In addition, MasterCard and Maestro-branded debit products may be used to make purchases and, in some cases, to obtain cash back at the point of sale.
|
•
|
MasterCard-branded Debit Card.
MasterCard-branded debit programs provide functionality for both signature-based and PIN-based authenticated transactions. For the year ended December 31, 2012, our MasterCard-branded debit programs generated $1.5 trillion in GDV globally, representing 42% of our total GDV for this period. As of December 31, 2012, the MasterCard logo appeared on 436 million debit cards worldwide, representing 21% growth from December 31, 2011.
|
|
•
|
Maestro-branded Debit Card.
Maestro is our global PIN-based debit program, and is the only PIN-based solution that operates globally. As of December 31, 2012, the Maestro logo appeared on 743 million cards worldwide, representing 4% growth from December 31, 2011. Maestro has a leading position among PIN-based debit brands in many markets throughout the world, particularly in Europe. The strong presence of Maestro in Europe positions us well as the SEPA initiative creates a more open and competitive payments market in many European countries that had been previously mandated to process domestic debit transactions with domestic processors. The global acceptance of Maestro contributes to the growth of our debit business and adds value to the services that we provide to our customers.
|
|
•
|
MasterCard Global ATM Solutions.
Cirrus is our primary global cash access brand. MasterCard Global ATM Solutions provides domestic (in-country) and cross-border access for varied types of transactions, including cash withdrawal (deposit accounts), cash advance (credit accounts), cash drawdown (prepaid accounts), balance inquiries, account transfers and deposits at ATMs that participate in the MasterCard Worldwide Network.
|
Prepaid.
Prepaid programs involve a balance that is funded with monetary value prior to use. Cardholders access funds via a traditional magnetic stripe or chip-enabled payment card or other device (such as mobile) that may leverage our contactless functionality. MasterCard customers may implement prepaid payment programs using any of our brands. We provide processing services (including transaction switching) in support of either magnetic stripe or chip-enabled prepaid programs. We provide and customize programs to meet unique commercial and consumer needs in all prepaid segments, including programs such as general purpose reloadable, employee benefit, payroll, travel, incentive, government disbursement programs and gift cards. In particular, we focus on three categories:
|
•
|
government, which includes programs targeted to achieve cost savings and efficiencies by moving traditional paper disbursement methods to electronic solutions in government programs such as Social Security payments, unemployment benefits and others;
|
|
•
|
commercial, which includes programs targeted to achieve cost savings and efficiencies by moving traditional paper disbursement methods to electronic solutions in business applications such as payroll, health savings accounts and others; and
|
|
•
|
consumer reloadable, which includes programs to address the payment needs of individuals without formal banking relationships, individuals who are not traditional users of credit or debit cards or devices or individuals who want to segment funds for security or convenience purposes, such as travel.
|
We also provide prepaid card program management services through Access Prepaid Worldwide (“Access”). Through Access, we manage and deliver consumer and commercial prepaid travel cards to business partners around the world, including financial institutions, retailers, travel agents and foreign exchange bureaus. Combined with MasterCard's processing assets (such as IPS) and other strategic alliances, these services augment and support issuers of prepaid cards around the world, with a focus outside of the United States. Access enables us to offer end-to-end prepaid solutions encompassing branded switching, issuer processing and program management services, primarily focused on the travel sector.
Commercial.
We offer commercial payment solutions that help large corporations, mid-sized companies, small businesses and government entities to streamline their procurement and payment processes, manage information and expenses and reduce administrative costs. For the year ended December 31, 2012, our commercial credit and charge programs generated $287 billion in GDV globally, representing 8% of our total GDV for this period. As of December 31, 2012, the MasterCard brand mark appeared on 36 million commercial credit and charge cards worldwide, representing an 8% increase from December 31, 2011. We offer various commercial payment programs and value-added services, including corporate cards, corporate premium cards, corporate purchasing cards and fleet cards (as well as the MasterCard Corporate Multi Card®, which combines the functionality of one or more of these cards) that allow corporations to, among other things, manage travel and entertainment expenses, streamline the procurement process and provide corporations with additional transactional detail. Among the platforms we provide is SmartData,
10
a MasterCard-powered tool which provides information reporting and expense management capabilities. We also offer government entities a variety of payment programs that are similar to the procurement, travel, purchasing, fleet and Multi Card programs offered to corporations. Credit and debit programs targeted at the small-business segment offer business owners the ability to gain access to working capital, to extend payments and to separate business expenses from personal expenses.
Emerging Payments and Innovation.
We focus on innovation to enhance our current programs and extend our products and services to customers (including merchants, telecommunications companies and government entities) and into new geographies. We have a global innovation group, MasterCard Labs, which is dedicated to developing new and innovative products and solutions for our customers and our cardholders. This group incubates new product concepts, builds prototypes, runs pilots and is designed for a rapid evaluation process.
We offer innovative platforms, services and technologies aligned around the following strategic areas:
|
•
|
Digital Infrastructure.
The continued adoption of connected devices (such as mobile smartphones, PCs, and tablet devices) has resulted in the ongoing convergence of the physical and digital worlds, where consumers are increasingly transacting across a range of connected devices in a variety of contexts - in-store, online and on tablets and mobile devices.
To support this convergence, we have developed a digital platform that is designed to allow customers, merchants and others to provide a consistent, fast and secure shopping experience for consumers, whether at a register, or on a PC, tablet or mobile device. The platform is also focused on generating more value and increased sales for merchants (including building preference and loyalty), and delivering new revenue streams and competitive advantages for MasterCard and our customers. We also work with strategic partners to enable consumers to securely use their smartphones to make contactless payments and obtain other related services. We have worked with multiple customers globally to launch digital wallet solutions powered by our mobile contactless technology. In addition, we are supporting the pilot launch of ISIS (a joint venture formed in the United States by AT&T, Verizon and T-Mobile). Also, in December 2012, we made a minority investment in C-SAM, a global mobile wallet software provider.
|
|
•
|
Mobile Money Infrastructure.
We provide a platform and various services to customers and other parties to enable consumers to pay from any type of mobile phone (and in particular, feature phones). These services include linking mobile accounts to virtual MasterCard account numbers, allowing subscribers (many of whom do not have traditional payment cards) to shop online, enabling person-to-person transfers (including our money transfer solution, MasterCard MoneySend®) on behalf of our customers for consumers using mobile devices, and enabling mobile subscribers to send payments to handsets of merchants who otherwise do not accept electronic payments. Mobile Money services are provided through the MasterCard Mobile Payments Gateway, operated through our Mobile Payments Solutions joint venture with Smart Hub. The gateway is a turnkey mobile payment processing platform that facilitates transaction routing and prepaid processing for mobile-initiated transactions for our customers.
In addition, we continue to commercialize our two joint ventures with Telefonica to provide consumers with mobile payments services in multiple countries across Latin America.
|
|
•
|
Chip and Contactless Solutions
. We continue to work with our customers around the world to help them replace their traditional magnetic-stripe based cards and terminals with new chip-enabled products that offer increased security and fraud protection as well as opportunities for new functions and value-added services.
|
|
◦
|
EMV Chip Development and Solutions.
Our chip solutions are developed in accordance with the EMV standard (the international standard for chip technology); we play a leading role in the evolution of the standard via our role as part owner of, and a key contributor to, EMVCo (the industry governing body of the EMV specifications). As we broaden our chip technology deployments into new markets, we remain focused on maintaining global interoperability (a key feature of the MasterCard brand), reducing potential fraud and increasing security. Customers in all regions are actively progressing chip programs with significant numbers of new cards and terminals being deployed. In January 2012, we endorsed EMV as the payments platform technology for the U.S. market and are now engaged at all levels in the industry to bring the benefits of this technology to our U.S. customers and consumers.
|
|
◦
|
Contactless Payment Solutions
.
We leverage the chip platform to drive new, scalable consumer experiences and business opportunities for our customers. In particular, our chip technology facilitates both contactless and mobile payments, which both enable consumers and merchants to transact in new ways leveraging our chip-enabled acceptance and network infrastructure. MasterCard PayPass®, our contactless payment solution, utilizes radio frequency, or near-field communication (NFC) technology, to securely transmit payment details wirelessly from payment devices to PayPass-branded contactless-enabled payment terminals for processing through the MasterCard Worldwide Network. This technology enables consumers simply to tap their payment card or other payment device, such as a key fob, wristband or tag that adheres
|
11
to the back of a mobile device, on a PayPass-enabled terminal to complete a transaction. Our mobile contactless payment solution, MasterCard Mobile PayPass, has been designed to enable consumers to use their mobile devices in a similar way by integrating the necessary hardware and software into the mobile device itself. Our PayPass program primarily targets everyday purchases that rely on speed and convenience (such as supermarkets, fast food restaurants, parking and transit). As of December 31, 2012, PayPass programs had rolled out in nearly 50 countries worldwide.
Value-Added Services and Solutions
We offer a variety of services and solutions across our business, designed to support and enhance our programs and solutions:
MasterCard Advisors
. MasterCard Advisors is our global professional services group which provides proprietary analysis, data-driven consulting and marketing services solutions to help clients optimize, streamline and grow their businesses. It differentiates us from our competitors by transforming data we collect into actionable insights for our customers and other clients. We provide services based on this data through three business lines: Information Services, Consulting Services, and Managed Services.
Information Services provides a suite of data analytics and products (including reports, benchmarks, models and forecasts) to a diversified customer base, enabling them to make better business decisions. Consulting Services combines professional problem-solving skills with payments expertise to provide solutions that address the challenges and opportunities of customers with respect to their payments business, and help to maximize the value of that business. Managed Services provides executional and turnkey solutions via data-driven acquisition of accounts, activation of portfolios, conversion of cards, marketing promotions activities and other customer management services. We charge customers and other clients fees for these professional services, which often add value to our other products.
Authorization, Routing and Alert Controls
. MasterCard inControl® is an innovative platform featuring an array of advanced authorization, transaction routing and alert controls and virtual card number capabilities that uses the functionality of the MasterCard Worldwide Network and is designed to assist financial institutions in creating new and enhanced payment offerings.
Fraud Prevention and Detection Services
. We offer several fraud detection and prevention solutions focused on enhancing safety for consumers. These solutions include MasterCard Expert Monitoring Solutions®, a comprehensive suite of services designed to help our customers detect and prevent fraudulent activity, and DataCash fraud prevention tools for e-commerce merchants.
Loyalty and Rewards Solutions
. We focus on providing value for consumers on MasterCard payment cards and devices through a combination of benefits and services both paid for and arranged by MasterCard on behalf of our customers. We work together with issuers, merchants and other customers to help them increase the value they provide to consumers by providing scalable technology platforms and supporting them with program management capability. In doing so, we provide issuers and merchants with services across all types of payment cards and devices, while providing additional value to cardholders.
Our suite of services for issuers include a scalable rewards platform that enables issuers to provide their consumers with personalized offers and rewards, access to a global airline lounge network, global and local concierge services, a wide range of individual insurance coverages, emergency card replacement, emergency cash advance services and a 24-hour cardholder service center to provide information related to benefits and rewards programs. Our suite of services for merchants include a targeted offers and rewards campaign management service for publishing offers, as well as opportunities for holders of a co-brand or merchants loyalty card or a member of a third-party-managed rewards program to obtain reward points faster.
Marketing
We manage and promote our brands through advertising, promotions, sponsorships and digital, mobile and social media initiatives. These efforts support our strategic vision of an environment where electronic payment is the predominant form of payment. Our marketing activities combine advertising, sponsorships, promotions, digital, mobile and social media, public relations and issuer and merchant engagement as part of an integrated program designed to increase consumer preference for our brands and usage of our products. We also seek to tailor our global marketing messages by customizing them in individual countries. Our initiatives are designed to build the value of the MasterCard brand and enhance stockholder value.
Our advertising plays an important role in building brand visibility, usage and overall preference among cardholders globally. Our award-winning “Priceless®” advertising campaign has run in 53 languages in 112 countries worldwide. The “Priceless” campaign promotes MasterCard usage benefits and acceptance that permit cardholders to pay for what they need, when they need it as well as marketing MasterCard credit, debit, prepaid and commercial products and solutions. It also provides MasterCard
12
with a consistent, recognizable message that supports our brand around the globe. We continue to refine our consumer marketing approach, including by placing greater strategic focus on consumers' spending preferences. For example, Priceless Cities® is a global program intended to increase preference for the MasterCard brand by connecting consumers to their interests by offering them access to special experiences and offers when they are at home or traveling. MasterCard launched Priceless Cities in 2011 in three cities - New York, London and Toronto - and in 2012 the program was extended to include more than 20 cities across all of our regions.
We continue to support our brand by using digital, mobile and social channels to allow us to engage more directly with our stakeholders and allow consumers and customers to engage directly in programs, promotions and merchant offers, as well as provide relevant information on MasterCard products, services and tools. MasterCard has also introduced both global and region-specific smart phone applications, including MasterCard's ATM Hunter®, MasterCard Easy Savings®, PayPass Locator, MCompass, and Budget Pilot that provide consumers with on-the-go utility. MasterCard continues to use digital and mobile channels and social media to develop preference and usage with consumers and more effectively partner with customers and merchants to help them drive their respective businesses. For example, we have used Facebook to run our Priceless music programs which offer music benefits and music mobile applications to MasterCard cardholders in Australia and Mexico.
We also seek to deliver value to customers and consumers through the sponsorship of a variety of sporting, entertainment and charity-related marketing properties. We have partnerships with Major League Baseball, the PGA Tour, the Union of European Football Association Champions League, the Walt Disney Company in Europe, The Grammy Awards and The Brit Awards. In 2012, we continued and expanded our partnership with Stand Up to Cancer, which ties MasterCard cardholder use of MasterCard cards and other payment devices in restaurants and online to our donations to cancer research. We also entered into a sponsorship partnership in 2012 with the Brazilian Football Confederation, Brazil's national football team. Also in 2012, we entered into a sponsorship partnership with Sonoma State University in Northern California to sponsor its new performing arts center. Our approach to sponsorship assets aligns with consumer segments important to us and our customers.
Customer and Stakeholder Relationship Management
We are committed to providing issuers and acquirers, merchants, governments, telecommunications companies and other parties that play a role in the payments industry with coordinated services that leverage our expertise in payment programs, product development, technology, processing, consulting and information services and marketing. We manage our relationships with our customers and other parties (including processors and other third parties) on a global and regional basis, to ensure that their priorities are consistently identified and incorporated into our product, brand, processing, technology and related strategies, and to ensure we provide value to them.
Issuers and Acquirers
. In addition to the many ways described above that we provide value to issuers and acquirers, we enter into business agreements which provide customers with financial incentives and other support benefits to issue, accept, route, prioritize and promote our branded products and other payment programs. These financial incentives may be based on GDV or other performance-based criteria, such as issuance of new payment products, increased acceptance of our products, launch of new programs or execution of marketing initiatives. We believe that our business agreements with these customers have contributed to our volume and revenue growth in recent years.
Merchants.
Merchants are an important constituency in the MasterCard payments system and we are working to further develop and enhance our relationships with them, and provide value to merchants of all sizes. Our core programs enable merchants to receive secure and timely payments from cardholders across the globe. We provide merchants with solutions that help to increase revenues, enable new sales channels, create better purchase experiences, improve efficiencies and address fraud. For example, we provide merchants the opportunity to increase revenue through the suite of information, consulting and managed services offered by MasterCard Advisors, which can help them understand specific activity in their industry, evaluate their sales performance against competitors and focus direct marketing efforts. We enable merchants to build a recurring relationship with their customers through products and solutions such as reloadable prepaid solutions, as well as, in some circumstances, licensing them directly as issuers. Through our Priceless Cities platform, we work with merchants to build consumer affection and deepen their existing customer relationships. In terms of enabling new sales channels, we give merchants a way to accept payments through channels like mobile, and help merchants create better purchase experiences through platforms such as our digital platform supporting payments in-store, online and on tablets and mobile devices. We can also help merchants improve efficiencies with solutions such as our contactless technology and our internet payment gateways. Merchants can address fraud concerns with fraud detection and prevention solutions like our Expert Monitoring System. Finally, we provide merchant forums and anti-piracy programs to inform, educate and share information with merchants on topics that are relevant to them such as fraud.
Despite these opportunities, we also face challenges in our relationships with merchants. We believe that consolidation in the retail industry is producing a set of larger merchants with increasingly global scope. These merchants are having a significant impact on all participants in the global payments industry, including MasterCard. In particular, large merchants have supported
13
many of the litigation, legislative and regulatory challenges related to interchange fees that MasterCard and others in the industry have been defending against. This includes the U.S. merchant litigations as to which the Company recently entered into a settlement agreement (subject to final court approval). See our risk factor in "Risk Factors - Legal and Regulatory Risks" in Part I, Item 1A of this Report related to merchants' continued focus on the costs of accepting electronic forms of payment.
Governments
. We work closely with national, state and local governments (including regulators and agencies) around the world to not only help shape payments regulation, but to work together strategically with governments to help them provide safe, efficient and transparent ways to serve their payment needs and that of their people. We provide governments with solutions that help them reduce costs, gain efficiencies, curtail fraud and corruption and advance social programs. We work with governments to reduce costs by providing electronic payment solutions that save the expense of producing, managing and disbursing currency. In addition, we help drive government efficiency by providing ways to eliminate paper systems, implement identification solutions, manage social payments, improve procurement (through travel and entertainment, procurement cards and purchasing payment automation) and deploy improved transit payment options (using chip and our contactless technology). We also work with governments to provide them with more efficient ways to deliver social benefits (including through prepaid cards), as well as products and solutions to help reduce errors and curtail fraud. Our products and programs can help governments drive financial inclusion by providing initial or improved access to financial services for the underbanked. We work with governments to provide payment solutions such as reloadable, prepaid or debit payroll or other social benefit cards (including cards to aid victims of natural disasters) and products and solutions that enable mobile commerce payments.
MasterCard Revenue Sources
We generate revenues by charging fees to our customers for providing transaction processing and other payment-related services and assessing our customers based on GDV on the cards and other devices that carry our brands. Accordingly, our revenues are impacted both by the number of transactions that we process and by the use of cards and other devices carrying our brands. Our net revenues are classified into the following five categories:
|
•
|
Domestic assessments:
Domestic assessments are fees charged to issuers and acquirers based primarily on the volume of activity on cards and other devices that carry our brands where the merchant country and the issuer country are the same.
|
|
•
|
Cross-border volume fees:
Cross-border volume fees are charged to issuers and acquirers based on the volume of activity on cards and other devices that carry our brands where the merchant country and issuer country are different.
|
|
•
|
Transaction processing fees:
Transaction processing fees are charged for both domestic and cross-border transactions and are primarily based on the number of transactions.
|
|
•
|
Other revenues:
Other revenues for other payment-related services include fees associated with fraud products and services, cardholder service fees, consulting and research fees, program management service fees and a variety of other payment-related services.
|
|
•
|
Rebates and incentives (contra-revenue):
Rebates and incentives are provided to certain MasterCard customers and are recorded as contra-revenue in the same period that performance occurs.
|
Our pricing is complex and is dependent on the nature of the volumes, types of transactions and other products and services we offer to our customers. The following factors impact the pricing:
|
•
|
Domestic or cross-border
|
|
•
|
Signature-based or PIN-based
|
|
•
|
Tiered rates that fluctuate based on volume/transaction hurdles
|
|
•
|
Geographic region or country
|
|
•
|
Retail purchase or cash withdrawal
|
|
•
|
Processed or not processed on the MasterCard Worldwide Network
|
In general, a cross-border transaction generates higher revenue than a domestic transaction since cross-border fees are higher than domestic fees, and in most cases also include fees for currency conversion. We review our pricing and implement pricing changes on an ongoing basis. In addition, standard pricing varies among our regions, and such standard pricing can be modified
14
for our customers through customer-specific incentive and rebate agreements. Revenues from processing cross-border transactions fluctuate with cross-border activities. See our risk factor in "Risk Factors - Business Risks" in Part I, Item 1A of this Report related to cross-border travel.
In 2012, net revenues from our five largest customers accounted for approximately
$1.8 billion
, or
24%
of our total revenue. No single customer generated greater than 10% of total revenue.
See “Management's Discussion and Analysis of Financial Condition and Results of Operations - Revenues” in Part II, Item 7 for more detail.
GDV and Processed Transactions
The tables below provide information regarding two key drivers of our revenue: (1) GDV, which forms the basis of volume-based revenues, and (2) processed transactions.
GDV.
The GDV table below provides information regarding the GDV for all MasterCard-branded cards (excluding Cirrus and Maestro) and for both MasterCard credit and charge programs and MasterCard debit and prepaid programs in all of our regions for the years ended
December 31, 2012
and
2011
. Growth rates are provided on both a U.S. dollar and local currency basis for the periods indicated. GDV represents the aggregate dollar amount of purchases made and cash disbursements obtained with MasterCard-branded cards and includes the impact of balance transfers and convenience checks.
|
Year-over-year growth
|
|||||||||||||
|
Year ended December 31, 2012
|
U.S. $
|
Local Currency
2
|
Year ended December 31, 2011
3
|
||||||||||
|
(in billions, except percentages)
|
|||||||||||||
|
MasterCard Branded GDV
1
|
|||||||||||||
|
All MasterCard Branded Programs
|
|||||||||||||
|
Asia Pacific/Middle East/Africa
|
$
|
980
|
|
21
|
%
|
23
|
%
|
$
|
808
|
|
|||
|
Canada
|
127
|
|
7
|
%
|
8
|
%
|
119
|
|
|||||
|
Europe
|
1,071
|
|
9
|
%
|
16
|
%
|
979
|
|
|||||
|
Latin America
|
302
|
|
9
|
%
|
19
|
%
|
276
|
|
|||||
|
Worldwide less United States
|
2,480
|
|
14
|
%
|
19
|
%
|
2,183
|
|
|||||
|
United States
|
1,167
|
|
9
|
%
|
9
|
%
|
1,069
|
|
|||||
|
Worldwide
|
$
|
3,647
|
|
12
|
%
|
15
|
%
|
$
|
3,252
|
|
|||
|
All MasterCard Credit and Charge Programs
|
|||||||||||||
|
Worldwide less United States
|
$
|
1,558
|
|
11
|
%
|
15
|
%
|
$
|
1,399
|
|
|||
|
United States
|
562
|
|
4
|
%
|
4
|
%
|
543
|
|
|||||
|
Worldwide
|
$
|
2,120
|
|
9
|
%
|
12
|
%
|
$
|
1,942
|
|
|||
|
All MasterCard Debit and Prepaid Programs
|
|||||||||||||
|
Worldwide less United States
|
$
|
923
|
|
18
|
%
|
25
|
%
|
$
|
784
|
|
|||
|
United States
|
604
|
|
15
|
%
|
15
|
%
|
526
|
|
|||||
|
Worldwide
|
$
|
1,527
|
|
17
|
%
|
21
|
%
|
$
|
1,310
|
|
|||
* Note that figures in the above table may not sum due to rounding.
1
GDV generated by Maestro and Cirrus cards is not included. The data for GDV is provided by MasterCard customers and includes information with respect to MasterCard-branded transactions that are not processed by MasterCard and for which MasterCard does not earn significant revenues. All data is subject to revision and amendment by MasterCard's customers subsequent to the date of its release, which revisions and amendments may be material.
2
Local currency growth eliminates the impact of currency fluctuations and represents local market performance.
3
In 2012, certain GDV from the Europe region has been reclassified from All MasterCard Credit and Charge Programs to All MasterCard Debit and Prepaid Programs. The 2011 amounts have been reclassified to be consistent with this presentation. There is no impact at the All MasterCard Programs level.
15
Processed Transactions.
The table below sets forth the total number of transactions processed by MasterCard for the years ended
December 31, 2012
and
2011
:
|
Year ended December 31, 2012
|
Year-over-year growth
|
Year ended December 31, 2011
|
||||||
|
(in millions, except percentages)
|
||||||||
|
Processed Transactions
|
34,156
|
|
25%
|
27,265
|
|
|||
Participation Standards
We establish and enforce our standards surrounding participation in MasterCard and the use and acceptance of cards carrying our brands.
Rulemaking and Application of Standards
Participation in the MasterCard payments network is generally open to financial institutions and other entities that are our customers. Applicants for participation must meet specified requirements. In general, we grant licenses by territory to applicants that meet those specified criteria. Licenses provide customers with certain rights, including access to the network and usage of our brands. Anti-money laundering due diligence reviews and customer risk management reviews are conducted on all new customers prior to issuing a license and existing customers are evaluated applying a risk-based approach. All customers must meet the requirements of our anti-money laundering program, and we can suspend and ultimately terminate participation for non-compliance with the program. As a condition of our licenses, customers agree to comply with our standards, which include requirements in our certificate of incorporation, bylaws, policies, rules and operating regulations and procedures. MasterCard and certain of our affiliates are the governing bodies that establish and apply our standards, which relate to topics such as participation eligibility and financial soundness criteria; the standards, design and features of cards and card programs; the use of our trademarks; merchant acquiring activities (including acceptance standards applicable to merchants); and guaranteed settlement and customer failures.
Customer Risk Management
We guarantee the settlement of many of the transactions between our issuers and acquirers to ensure the integrity of our network ("settlement exposure"). We do not, however, guarantee payments to merchants by their acquirer, or the availability of unspent prepaid cardholder balances held by the issuer. As a guarantor of certain obligations of principal customers, we are exposed to customer credit risk arising from the potential financial failure of any principal customers of MasterCard, Maestro and Cirrus, and affiliate debit licensees. Our gross settlement exposure for MasterCard, Maestro and Cirrus-branded transactions, which is primarily estimated using the average daily card volume during the quarter multiplied by the estimated number of days to settle, was approximately
$38 billion
as of
December 31, 2012
. Principal customers participate directly in MasterCard programs and are responsible for the settlement and other activities of their sponsored affiliate customers.
To minimize the contingent risk to MasterCard of a failure of a customer to meet its settlement obligations, we monitor the financial health of, economic and political operating environments of, and compliance with our standards by, our principal customers, affiliate debit licensees and other entities to which we grant licenses. If the financial condition of a customer or the state of the economy or political environment in which it operates indicates that it may not be able to satisfy its obligations to us or to our customers, or its payment obligations to MasterCard merchants, or its obligations to safeguard funds for prepaid cardholders, we may require the customer to make operational changes and/or post collateral. This collateral is typically in the form of a standby letter of credit, a bank guarantee or a secured cash account and is required to mitigate our exposure. As of
December 31, 2012
, we had customers who had posted approximately
$3.8 billion
in collateral held for settlement exposure. If a customer becomes unable or unwilling to meet its obligations to us or other customers, we are able to draw upon such customer's collateral, if provided, in order to minimize any potential loss to ourselves or our customers. In addition to obtaining collateral from customers, in situations where a customer is potentially unable to meet its obligations to us or other customers, we can suspend and ultimately terminate participation in our network. Additionally, and to further preserve payment system integrity, we reserve the right to terminate a customer's right to participate in our network if, for example, the customer fails or refuses to make payments in the ordinary course of business, or if a liquidating agent, conservator or receiver is appointed for the customer or the customer is insolvent. In addition to these measures, we have also established a
$3 billion
committed credit facility to provide liquidity for general corporate purposes, including to provide liquidity in the event of customer settlement failure. See our risk
16
factor in "Risk Factors - Business Risks" in Part I, Item 1A of this Report related to our role as guarantor of certain third-party obligations. See also our risk factor related to the impact of unprecedented global economic events in financial markets around the world.
Payment System Integrity
The integrity of our payment system can be affected by fraudulent activity and illegal uses of our products and our system. Fraud is most often committed in connection with lost, stolen or counterfeit cards or stolen account information, often resulting from security breaches of third-party systems that insufficiently protect cardholder data that they store, process or transmit. See our risk factor in "Risk Factors - Business Risks" in Part I, Item 1A of this Report related to account data breaches. Fraud is also more likely to occur in transactions where the card is not present, such as e-commerce, mobile commerce, mail order and telephone order transactions. Security and cardholder authentication for these remote channels are particularly critical issues facing our customers and merchants who engage in these forms of commerce, where a signed cardholder sales receipt, verification through use of a PIN or the presence of the card or payment device (along with the embedded security features) or merchant agent is unavailable.
We monitor areas of risk exposure and enforce our standards to combat fraudulent activity. We also operate several compliance programs to help ensure that the integrity of our payment system is maintained by our customers and their agents. Key compliance programs include merchant audits (for high fraud, excessive chargebacks and processing of illegal transactions) and security compliance (including our MasterCard Site Data Protection Service®, which assists customers, merchants and third-party service providers in protecting commercial sites from hacker intrusions and subsequent account data compromises) by requiring proper adherence to the Payment Card Industry Data Security Standards (PCI DSS) and other PCI standards designed to secure payment application and terminals. Our customers are also required to report instances of fraud to us in a timely manner so we can monitor trends and initiate action where appropriate.
Our customers generally are responsible for fraud losses associated with the products they issue and the merchants from which they acquire transactions. However, we have implemented a series of programs and systems to aid them in detecting and preventing the fraudulent use of MasterCard products. We provide education programs and various risk management tools to help prevent fraud and ensure safety, including:
|
•
|
MasterCard SecureCode®, a global internet authentication solution that permits cardholders to authenticate themselves to their issuer using a unique, personal code;
|
|
•
|
Our Site Data Protection program to advance adherence to the PCI DSS and other PCI standards;
|
|
•
|
Our Global Vendor Certification Program (GVCP) to ensure card manufacturers comply with MasterCard-defined physical and logistical security requirements;
|
|
•
|
Our Compliance Assessment and Security Testing (CAST) Program to ensure integrated circuit card and secure elements used in smart cards and mobile payment devices are evaluated against known and state of the art attack scenarios; and
|
|
•
|
Fraud detection and prevention solutions, including our suite of fraud management products and services, Expert Monitoring Solutions, and DataCash fraud prevention tools for e-commerce merchants.
|
Enterprise Risk Management
We face a number of risks in operating our business (for a description of material risks, see “Risk Factors” in Part I, Item 1A of this Report). Managing risk is an integral component of our business activities and the degree to which we manage risk is vital to our financial condition and profitability. We have an Enterprise Risk Management (“ERM”) program which is integrated with the business and designed to ensure appropriate and comprehensive oversight and management of end-to-end risk. The ERM program leverages our business processes to, among other things, ensure: allocation of resources to appropriately address risk; establishment of clear accountability for risk management; and provision of transparency of risks to senior management (including our Risk Management Committee), the Board of Directors and appropriate Board committees. Our ERM program seeks to accomplish these goals by: identifying, prioritizing and monitoring key risks; providing an independent view of our risks; and strengthening business operations by integrating ERM principles and continuing to create a risk aware culture within MasterCard. Our integrated risk management structure balances risk and return by having business units and central functions (such as finance and law) identify, own and manage risks, our executive officers set policy and accountability and our Board of Directors and its committees provide oversight of the process.
17
Intellectual Property
We own a number of valuable trademarks that are essential to our business, including MasterCard®, Maestro® and Cirrus®, through one or more affiliates. We also own numerous other trademarks covering various brands, programs and services offered by MasterCard to support our payment programs. Trademark and service mark registrations are generally valid indefinitely as long as they are used and/or properly maintained. Through license agreements with our customers, we authorize the use of our trademarks in connection with our customers' card issuing and merchant acquiring businesses. In addition, we own a number of patents and patent applications relating to payments solutions, transaction processing, smart cards, contactless, mobile, electronic commerce, security systems and other matters, some of which may be important to our business operations. Patents are of varying duration depending on the jurisdiction and filing date, and will typically expire at the end of their natural term.
Competition
General.
Our programs compete against all forms of payment, including paper-based transactions (principally cash and checks); card-based and other electronic payments systems and solutions, including credit, charge, debit, prepaid, private-label and other types of general purpose and limited use programs; contactless, mobile and web-based payment platforms; and other electronic transactions such as wire transfers and Automated Clearing House payments. As a result of a global trend, electronic forms of payment such as payment cards are increasingly displacing paper forms of payment, and card brands such as MasterCard, Visa, American Express and Discover are benefiting from this displacement. However, cash and checks still capture the largest overall percentage of worldwide payment volume.
Cash and Check
.
|
•
|
Cash and check continue to represent the most widely used forms of payment. Approximately 85% of all payment transactions are represented by paper-based transactions with cash or check.
|
Payment Card, Processing and Alternative Competitors.
|
•
|
General Purpose Payment Card Industry.
Within the general purpose payment card industry, we face substantial and increasingly intense competition worldwide from systems such as Visa (including Plus®, Electron® and Interlink®), American Express and Discover, among others. Within the global general purpose payment card industry, Visa has significantly greater volume than we do. Outside of the United States, some of our competitors such as JCB in Japan and UnionPay in China have leading positions in their domestic markets. Regulation can also play a role in determining competitive market advantages for competitors. For example, UnionPay is the sole domestic processor designated by the Chinese government and operates the sole national cross-bank bankcard information switch network in China as a result of local regulation (although the World Trade Organization's ruling that China's domestic processing industry is a monopoly could open the domestic payments marketplace). Some governments, such as India and Russia, are promoting local networks for domestic processing and there are similar developments in other countries. See our risk factor in "Risk Factors - Legal and Regulatory Risks" in Part I, Item 1A related to government actions that may prevent us from competing effectively against providers of domestic payments services in certain countries.
|
|
•
|
Particular Segments.
We face competition with respect to particular segments of the payments industry, including:
|
|
◦
|
Debit.
We encounter substantial and increasingly intense competition from ATM and point-of-sale debit networks in various countries, such as Interlink, Plus and Visa Electron (owned by Visa Inc.), Star® (owned by First Data Corporation), NYCE® (owned by FIS), and Pulse® (owned by Discover), in the United States; Interac in Canada; EFTPOS in Australia; and Bankserv in South Africa. In addition, in many countries outside of the United States, local debit brands serve as the main brands while our brands are used mostly to enable cross-border transactions, which typically represent a small portion of overall transaction volume.
|
|
◦
|
PIN-Based Debit Transactions.
Our business and revenues could be adversely impacted in the United States by a tendency among U.S. merchants to migrate from signature-based debit transactions to PIN-based debit transactions because we generally earn less revenue from PIN-based debit transactions. In addition, Visa's competitive response to the limitations presented in the United States by the Dodd-Frank Wall Street Reform and Consumer Protection Act of 2010 (the "Dodd-Frank Act") could potentially reduce our PIN debit volumes.
|
|
◦
|
Private-Label.
Private-label cards, which can generally be used to make purchases solely at the sponsoring retail store, gasoline retailer or other types of merchants, also serve as another form of competition.
|
|
•
|
End-to-End Payments Networks.
Our competitors include operators of proprietary end-to-end payments networks, such as American Express and Discover, that have direct acquiring relationships with merchants and direct issuing relationships
|
18
with cardholders. These competitors have certain competitive advantages over four-party payments systems such as ours. Among other things, because these competitors provide an end-to-end service, they do not require formal interchange fees to balance payment system costs between the issuing and acquiring sides of their business, even though they have the ability to internally transfer costs in a manner similar to interchange fees. As a result, to date, operators of end-to-end payments networks have generally avoided the same regulatory and legislative scrutiny and litigation challenges we face.
|
•
|
Competition for Customer Business
. We compete intensely with other payments networks for customer business. Globally, financial institutions typically issue both MasterCard and Visa-branded payment cards, and we compete with Visa for business on the basis of individual card portfolios or programs. In addition, a number of our customers issue American Express and/or Discover-branded payment cards in a manner consistent with a four-party system.
We also compete for new business partners with whom we seek to work, such as merchants, government agencies and telecommunication companies. See our risk factor in "Risk Factors - Business Risks" in Part I, Item 1A of this Report related to the substantial and increasingly intense competition worldwide in the global payments industry. Our ability to compete in the global payments industry for customer business can be affected by the outcome of litigation, regulatory proceedings and legislative activity. For example, in October 2011, the Federal Reserve implemented regulations, pursuant to the enactment into law of the Dodd-Frank Act, prohibiting arrangements under which a debit card or prepaid card can be processed only by one network (or only by a group of affiliated networks). The Dodd-Frank Act also prohibits any restrictions on a merchant's ability to route a transaction over any one of the networks that is enabled on a debit card or prepaid card.
These events have resulted in challenges, as well as potential opportunities to compete for business in this area.
|
|
•
|
Transaction Processors
. We face competition from transaction processors throughout the world, such as First Data Corporation and Total System Services, Inc., some of which are seeking to enhance their networks that link issuers directly with point-of-sale devices for payment transaction authorization and processing services. Certain of these transaction processors could potentially displace us as the provider of these payment processing services.
|
|
•
|
New Entrants and Alternative Payments Systems
. We also compete against relatively new entrants and alternative payment providers, such as PayPal® (a business segment of eBay), which have developed payments systems in e-commerce, across mobile devices and in physical store locations. Internet payments is an increasingly competitive area, with PayPal as an established and important player and a proliferation of new online competitors. Among other services, these competitors provide internet payment services that can be used to buy and sell goods online, and services that support payments to and from deposit accounts or proprietary accounts for internet, mobile commerce and other applications. A number of these new entrants rely principally on the internet and potential wireless communication networks to support their services, and may enjoy lower costs than we do. Additionally, PayPal has been expanding to a presence in physical locations. Specifically, PayPal's partnership with Discover Financial Services will provide PayPal with access to Discover's network and several million merchant locations in the United States, with the potential to expand globally in the future. The electronic payments industry is also facing changes in services and technology related to mobile payments and emerging competition from mobile operators and handset manufacturers. Micro-payments on social networks such as Facebook® are relatively small today, but have the potential to grow rapidly, representing the potential for competition from a new payment form.
|
Financial Institution Customers
.
|
•
|
Pricing.
We face increasingly intense competitive pressure on the prices we charge our customers. We seek to enter into business agreements with customers through which we offer incentives and other support to issue and promote our cards. In order to stay competitive, we may have to increase the amount of rebates and incentives we provide to our customers and merchants, as we have in the last several years. See our risk factor in "Risk Factors - Business Risks" in Part I, Item 1A related to the increasingly intense competitive pressure we face on the prices we charge our customers.
|
|
•
|
Banking Industry Consolidation.
The banking industry has undergone substantial accelerated consolidation over the last several years, and we expect some consolidation to continue in the future. Consolidations have included customers with a substantial MasterCard portfolio being acquired by institutions with a strong relationship with a competitor. Significant ongoing consolidation in the banking industry may result in a substantial loss of business for us. The continued consolidation in the banking industry, whether as a result of an acquisition of a substantial MasterCard portfolio by an institution with a strong relationship with a competitor or the combination of two institutions with which we have a strong relationship, would also produce a smaller number of large customers, which generally have a greater ability to negotiate pricing discounts with us. Consolidations could prompt our customers to renegotiate our business agreements to obtain more favorable terms. This pressure on the prices we charge our customers could materially and adversely affect our revenue and profitability. See our risk factor in "Risk Factors - Business Risks" in Part I, Item 1A of this Report related to additional consolidation or other changes in or affecting the banking industry.
|
19
Competitive Position.
We believe that the principal factors influencing our competitive position in the global payments industry are:
|
•
|
the ability to develop and implement competitive new electronic payment programs, systems and technologies in both physical and digital environments;
|
|
•
|
the ability to participate in new payment forms;
|
|
•
|
customer relationships;
|
|
•
|
the impact of existing and future litigation, legislation and government regulation;
|
|
•
|
the impact of globalization and consolidation of financial institutions and merchants;
|
|
•
|
the acceptance base, reputation and brand recognition of payment cards;
|
|
•
|
pricing;
|
|
•
|
the success and scope of marketing and promotional campaigns;
|
|
•
|
the quality, security and integrity of transaction processing;
|
|
•
|
the relative value of services and products offered; and
|
|
•
|
the impact of new market entrants.
|
Government Regulation
General.
Government regulation impacts key aspects of our business. We are subject to regulations that affect the payments industry in the many countries in which our cards are used. Regulation of the payments industry has increased significantly in the last several years, including in the United States. Regulators in several countries outside of the United States have also become increasingly interested in payment issues, a number of which have launched official proceedings related to payments industry issues. See “Risk Factors-Legal and Regulatory Risks” in Part I, Item 1A of this Report.
Interchange Fees.
Interchange fees associated with four-party payments systems like ours are being reviewed or challenged in various jurisdictions around the world. Examples include:
|
•
|
legislation, including resulting regulations (such as regulations implemented in October 2011 by the Federal Reserve in accordance with the Dodd-Frank Act, which set limits on debit and prepaid “interchange transaction fees”);
|
|
•
|
competition-related regulatory proceedings (such as the European Commission's December 2007 decision restricting our cross-border interchange fees, which is pending appeal, as well as proceedings in several jurisdictions, including Canada and European Union member states);
|
|
•
|
central bank regulation (such as in Australia); and
|
|
•
|
litigation (such as the merchant litigations in the United States and private lawsuits in Canada and the United Kingdom).
|
For more detail, see our risk factors in "Risk Factors - Legal and Regulatory Risks" in Part I, Item 1A of this Report related to interchange fees and related practices receiving significant and increasingly intense legal, regulatory and legislative scrutiny worldwide, and the Dodd-Frank Act. Also see Note 18 (Legal and Regulatory Proceedings) to the consolidated financial statements included in Part II, Item 8.
No-Surcharge Rules.
We have historically implemented policies in certain regions that prohibit merchants from charging higher prices to consumers who pay using MasterCard products instead of other means. Several jurisdictions have indicated interest in either ending or limiting the application of these no-surcharge rules. In particular, the Reserve Bank of Australia (the “RBA”) had enacted regulations prohibiting the networks from enforcing no-surcharge rules. In December 2011, the RBA indicated that it would consider allowing certain limitations to a merchant's ability to surcharge. Our no-surcharge rules in Canada have also been challenged by the Canadian Competition Bureau. In addition to other action being taken in this area, pursuant to the terms of settlement of the U.S. merchant class litigation we entered into in October 2012 (and subject to final court approval), in January 2013 we modified our no-surcharge rules to permit U.S. merchants to surcharge credit cards, subject to certain limitations.
20
Data Protection and Information Security.
Aspects of our operations or business are subject to privacy and data protection regulation in the United States, the European Union and elsewhere. For example, in the United States, we and our customers are respectively subject to Federal Trade Commission and federal banking agency information safeguarding requirements under the Gramm-Leach-Bliley Act. The Federal Trade Commission's information safeguarding rules require us to develop, implement and maintain a written, comprehensive information security program containing safeguards that are appropriate for our size and complexity, the nature and scope of our activities, and the sensitivity of any customer information at issue. Certain of our customers in the United States are subject to similar requirements under the guidelines issued by the federal banking agencies. As part of their compliance with the requirements, each of our U.S. customers is expected to have a program in place for responding to unauthorized access to, or use of, customer information that could result in substantial harm or inconvenience to customers.
Regulatory authorities around the world are considering numerous legislative and regulatory proposals concerning privacy and data protection. In addition, the interpretation and application of these laws in the United States, Europe and elsewhere are often uncertain and in a state of flux. In Europe, the European Parliament and Council is in the process of revising the European Directive 95/46/EC (the “Directive”), which provides for the protection of individuals with regard to the processing of personal data and on the free movement of such data. The revised regulation may increase the obligations of controllers (entities that have the data relationship with an individual) and processors that handle an individual's personal data requiring additional technical and operational measures to protect personal data. These and other legislative and regulatory changes, as well as the manner in which such laws could be interpreted and applied, may be inconsistent with our data practices. If so, in addition to the possibility of fines, this could result in changes to our data practices and could impact such aspects of our business as fraud monitoring and the development of information-based products and solutions. The cost and operational consequences of implementing new and/or additional data protection measures could be significant. See our risk factor in "Risk Factors - Legal and Regulatory Risks" in Part I, Item 1A of this Report related to regulation in the areas of consumer privacy, data use and/or security.
Anti-Money Laundering and Anti-Terrorism.
MasterCard and other participants in the payments industry are also subject to the regulatory requirements of Section 352 of the USA PATRIOT Act, which requires us to maintain a comprehensive anti-money laundering (“AML”) program and imposes similar requirements on our financial institution customers in the United States. We are subject to the AML laws and regulations of India and the activities of our internet payments gateway and prepaid card program management services are also subject to U.S. and other countries' AML laws and regulations. We have an AML compliance program to address these legal and regulatory requirements and assist in managing money laundering and terrorist financing risks. The program is comprised of policies, procedures and internal controls, including the designation of a compliance officer and providing for the training of appropriate personnel regarding AML responsibilities.
We are subject to regulations imposed by the U.S. Office of Foreign Assets Control (“OFAC”) restricting financial transactions and other dealings with Cuba, Iran, Syria and Sudan and with persons and entities included in OFAC's list of Specially Designated Nationals and Blocked Persons (the “SDN List”). Cuba, Iran, Syria and Sudan have been identified by the U.S. State Department as terrorist-sponsoring states. We have no offices, subsidiaries or affiliated entities located in these countries and do not license financial institutions domiciled in these countries. We have established a risk-based compliance program that includes policies, procedures and controls that are designed to protect us against having business dealings with prohibited countries, individuals or entities. We take measures to prevent transactions that do not comply with OFAC sanctions, including obligating our customers to screen cardholders and merchants against the SDN List; however, it is possible that such transactions may be processed through our payments system and that our reputation may suffer due to our customer financial institutions' association with these countries or the existence of any such transactions.
Financial Industry Regulation
. We are or may be subject to regulations related to our role in the financial industry and our relationship with our financial institution customers. Certain of our operations are periodically reviewed by the U.S. Federal Financial Institutions Examination Council (“FFIEC”) under its authority to examine financial institutions' technology service providers. Examinations by the FFIEC cover areas such as data integrity and data security.
Additionally, in July 2010, as part of the Dodd-Frank Act, the Consumer Financial Protection Bureau (the “CFPB”) was created. The CFPB has significant authority to regulate consumer financial products, including consumer credit, deposit, payment, and similar products. It is not entirely clear whether and/or to what extent the CFPB will regulate broader aspects of payment card network operations. In addition, the Dodd-Frank Act created the Financial Stability Oversight Council (“FSOC”) in order to identify risks to the financial stability of the United States that could arise from the material financial distress or failure of, or ongoing activities by, large, interconnected bank holding companies or nonbank financial companies. Among other responsibilities, the FSOC is tasked with identifying payment, clearing and settlement systems that are “systemically important” under the applicable statutory standard. Under the Dodd-Frank Act, such systems will be subject to new regulation, supervision and examination requirements. To date, MasterCard has not been designated “systemically important.” However, the imposition of any additional regulatory or other obligations on MasterCard could result in costly new compliance burdens that could negatively impact our business. See our risk factor in "Risk Factors - Legal and Regulatory Risks" in Part I, Item 1A related to the Dodd-Frank Act.
21
Retail Payments System Regulation
. Regulators in several countries such as Australia, Mexico, Colombia, India, Singapore, Russia, Ukraine and Indonesia have received statutory authority to regulate certain aspects of the payments systems in these countries. Such authority includes, or could include, providing broad regulatory oversight over retail payments system operators to the central banks in such countries, and could result in regulation of various aspects of the payments system. For example, India has created a national domestic debit switch and has created a licensing regime with oversight over all payments system operators in India. In Belgium, MasterCard Europe is subject to oversight as a retail payments system operator in Europe by the National Bank of Belgium pursuant to standards published by the European Central Bank that are principally targeted at managing financial, legal and operations risk. Additionally, in the European Union, the European Commission announced its intention to propose legislation in the second quarter of 2013 that addresses several elements of the payments industry.
National Payments Systems
. Governments in some countries may act to provide resources or preferential treatment or other protection to selected domestic payment card and processing providers or may create a domestic payment provider. This action could develop due to a country's broad oversight of retail payments systems, such as in Russia, Ukraine and India. It could also develop as a result of legislative activity. This action could displace us from, or prevent us from entering into, or substantially restrict us from participating in, particular geographies. See our risk factor in "Risk Factors - Legal and Regulatory Risks" in Part I, Item 1A related to government actions that may prevent us from competing effectively against providers of domestic payments or processing services in certain countries.
Issuer Practice Regulation.
Our customers are subject to numerous regulations and legislation applicable to banks and other financial institutions in the United States and elsewhere in their capacity as issuers and otherwise, and as a consequence MasterCard is impacted by such regulations. For example, in the United States in 2009, the Federal Reserve adopted regulations addressing overdraft fees imposed in connection with ATM and debit card transactions. Additionally, the CFPB launched an investigation into bank overdraft practices in 2012, and it remains to be seen whether the CFPB investigation will result in further regulation in this area. Any new regulation in this area may further restrict the ability of our customers to charge overdraft fees in connection with debit programs, which may diminish the attractiveness of debit card programs to our customers and adversely affect transaction volumes and revenues. Additionally, regulation of issuer practices around the world include regulation of the issuance of prepaid cards. In Germany, additional consumer information is required in connection with prepaid transactions, which could restrict the issuance of prepaid cards. In India, prepaid cards not associated with a bank cannot be issued. Any similar regulation restricting issuance of prepaid cards and devices could directly impact our business and our volumes.
Regulation of Internet Transactions
. In October 2006, the U.S. Congress enacted legislation requiring the coding and blocking of payments for certain types of Internet gambling transactions. The legislation applies to payments system participants, including MasterCard and our U.S. customers, and is implemented through a federal regulation. The federal law requires us and our customers to implement compliance programs. Also, Congress may consider additional legislation to legalize and regulate Internet gambling that could increase our costs and/or could decrease our transaction volumes. In addition, the U.S. Congress continues its consideration of regulatory initiatives in the areas of Internet prescription drug purchases, copyright and trademark infringement, and privacy, among others, that could impose additional compliance burdens on us and/or our customers. Some U.S. states are considering a variety of similar legislation. If implemented, these initiatives could require us or our customers to monitor, filter, restrict, or otherwise oversee various categories of payment card transactions, thereby increasing our costs or decreasing our transaction volumes.
Additional Regulatory Developments.
Various regulatory agencies also continue to examine a wide variety of issues, including identity theft, account management guidelines, privacy, disclosure rules, security and marketing that would impact our customers directly. New requirements and developments may affect our customers' ability to extend credit through the use of payment cards, which could decrease our transaction volumes. In some circumstances, new regulations could have the effect of limiting our customers' ability to offer new types of payment programs or restricting their ability to offer our existing programs such as premium and prepaid cards, which could materially and adversely reduce our revenue and revenue growth.
Seasonality
See “Management's Discussion and Analysis of Financial Condition and Results of Operations-Seasonality” in Part II, Item 7 of this Report.
Financial Information About Geographic Areas
See Note 21 (Segment Reporting) to the consolidated financial statements included in Part II, Item 8 of this Report for certain geographic financial information.
22
Employees
As of December 31, 2012, we employed approximately 7,500 persons, of which approximately 3,400 were employed outside of the United States. We consider our relationship with employees to be good.
Additional Information
MasterCard Incorporated was incorporated as a Delaware stock corporation in May 2001. We conduct our business principally through MasterCard Incorporated's principal operating subsidiary, MasterCard International Incorporated (“MasterCard International”), a Delaware non-stock (or membership) corporation that was formed in November 1966. In May 2006, we completed a plan for a new ownership and governance structure for MasterCard Incorporated (including an initial public offering of a new class of common stock (the “IPO”)) which included the appointment of a new Board of Directors which is comprised almost entirely of directors who are independent from our customers. For more information about our capital structure, including our Class A common stock (our voting stock) and Class B common stock (our non-voting stock), see Note 13 (Stockholders' Equity) to the consolidated financial statements included in Part II, Item 8.
Website and SEC Reports
The Company's internet address is www.mastercard.com. From time to time, we may use our website as a channel of distribution of material company information. Financial and other material information is routinely posted and accessible on the investor relations section of our corporate website. In addition, you may automatically receive e-mail alerts and other information about MasterCard by enrolling your e-mail address by visiting “E-Mail Alerts” in the investor relations section of our corporate website.
Our annual report on Form 10-K, quarterly reports on Form 10-Q, current reports on Form 8-K and amendments to those reports are available, without charge, for review on the investor relations section of our corporate website as soon as reasonably practicable after they are filed with, or furnished to, the U.S. Securities and Exchange Commission (the “SEC”). The information contained on our website is not incorporated by reference into this Report.
Item 1A.
Risk Factors
Legal and Regulatory Risks
Interchange fees and acceptance practices receive significant and intense legal, regulatory and legislative scrutiny worldwide, and the resulting decisions, regulations and legislation may have a material adverse impact on our overall business and results of operations.
Interchange fees, which represent a sharing of a portion of payments system costs among the issuers and acquirers participating in a four-party payments system, are generally the largest component of the costs that acquirers charge merchants in connection with the acceptance of payment cards. Typically, interchange fees are paid by the merchant financial institution (the acquirer) to the cardholder financial institution (the issuer) in connection with transactions initiated on our payments system. Interchange fees play a key role in balancing the costs consumers and merchants pay in a four-party payments system. They are also a factor on which we compete with other payment providers and therefore an important determinant of the volume of transactions we process over our network. We do not earn revenues from interchange fees.
We have historically set default interchange fees in the United States and certain other countries. In some jurisdictions, our interchange fees and related practices are subject to legislation, regulation and litigation as electronic forms of payment have become relatively more important to local economies. Regulators and legislative bodies in a number of countries, as well as merchants, are seeking to reduce these fees through legislation, competition-related regulatory proceedings, central bank regulation and/or litigation.
Examples of legislative activity related to interchange fees include:
|
•
|
In the United States, in July 2010, the Dodd-Frank Act was enacted into law requiring, among other things, debit and prepaid “interchange transaction fees” to be “reasonable and proportional to the cost incurred by the issuer with respect to the transaction.” In October 2011, the U.S. Federal Reserve implemented regulations in accordance with the Dodd-Frank Act limiting interchange fees for debit and prepaid transactions. See our risk factor in "Risk Factors - Legal and Regulatory Risks" in this Part I, Item 1A with respect to the Dodd-Frank Act for more detail.
|
|
•
|
In the European Union, in January 2012, the European Commission issued a “Green-Paper” (typically the first step in the European legislative process) identifying a number of concerns with the payments industry, including concerns about interchange fees. In October 2012, the European Commission announced that it intends to propose legislation in the second quarter of 2013 regulating interchange fees and covering other elements included within the Green Paper.
|
23
|
•
|
In Poland, in 2012, the Polish parliament began drafting legislation that would mandate a significant reduction in interchange fees and limit our ability to enforce our “honor all cards” rule.
|
Examples of competition-related regulatory proceedings or inquiries around the world with respect to interchange fees and acceptance practices include:
|
•
|
In the European Union, in December 2007, the European Commission issued a negative decision (upheld by a judgment of the General Court of the European Union, which we are appealing) with respect to our cross-border interchange fees for consumer credit and debit cards under European Union competition rules.
|
|
•
|
In Canada, in December 2010, the Canadian Competition Bureau filed an application with the Canadian Competition Tribunal to strike down rules related to MasterCard's interchange fees, including its “honor all cards”, “no surcharge” and non-discrimination rules.
|
|
•
|
In France, in January 2013, the French Competition Authority re-opened an investigation concerning our domestic interchange rates and informed us it intends to commence a formal proceeding and issue a statement of objections unless we offer commitments to reduce our interchange fees.
|
|
•
|
In Hungary, MasterCard Europe is appealing the Hungarian Competition Office December 2009 decision ruling that MasterCard Europe's historic domestic interchange fees violate Hungarian competition law and fining MasterCard Europe approximately $3 million. The appeal has been stayed pending the outcome of our appeal of the European Commission decision. Additionally, in 2012, the Hungarian Competition Office began an investigation into whether MasterCard is dominant in Hungary's payments industry and whether we abused that dominance in setting our interchange fees.
|
|
•
|
In the United Kingdom, in February 2007, the Office of Fair Trading ("OFT") commenced a new investigation of MasterCard Europe's U.K. interchange fees, following the voiding by the Competition Appeals Tribunal of the OFT's 2006 decision that our previous domestic interchange fees violated U.K. and European Union competition law. The OFT has suspended its investigation pending the outcome of our appeal of the European Commission decision.
|
Examples of regulation, or potential regulation, by central banks and similar types of regulatory authorities around the world with respect to interchange fees and acceptance practices include:
|
•
|
In Australia, the Reserve Bank of Australia enacted regulations in 2002 (which have been subsequently reviewed and not withdrawn) controlling the costs that can be considered in setting interchange fees for four-party payment card systems such as ours and capping the average of such interchange fees.
|
|
•
|
In South Africa, in September 2010, the South African Reserve Bank commenced a process (including the appointment of an independent consultant) to determine the manner in which interchange fees for all payments systems in South Africa should be set.
|
|
•
|
In Canada, there has been increasing attention by policymakers on payments, and specifically the cost of acceptance, which includes interchange fees. In 2010, the Canadian Department of Finance implemented a voluntary “Code of Conduct” on related issues for payment card industry participants in Canada, by which MasterCard voluntarily agreed to abide. In 2011, the Minister of Finance formed a task force to make non-binding recommendations with respect to the future of Canadian payments, including a focus on the cost of acceptance. The task force issued its final report in March 2012. In response, the Minister of Finance is considering revising the Code of Conduct to specifically address mobile payments, forming an advisory committee to advise his office on matters of payments policy, and evaluating whether and to what extent the domestic payments system governance framework should be revised.
|
|
•
|
In Brazil, in December 2011, the Central Bank of Brazil (together with competition agencies in Brazil) issued a follow-up to its May 2010 report, providing an analysis of the evolution of the payments industry. The report includes indications that it is closely monitoring trends with respect to interchange fees and the cost of acceptance in general, and raises questions about the impact of the no-surcharge rule in the Brazilian consumer protection code.
|
See Note 18 (Legal and Regulatory Proceedings) to the consolidated financial statements included in Part II, Item 8 for a detailed description of regulatory proceedings and inquiries into interchange fees. We believe that regulators are increasingly cooperating on interchange matters and, as a result, developments in any one jurisdiction may influence regulators' approach to interchange fees in other jurisdictions. See our risk factor in "Risk Factors - Legal and Regulatory Risks" in this Part I, Item 1A related to the impact of new regulations or other legislative or regulatory activity in one jurisdiction or of one product.
24
Additionally, merchants are seeking to reduce interchange fees and impact acceptance rules through litigation. Such litigation includes:
|
•
|
In the United States, merchants have filed approximately 50 class action or individual suits alleging that our interchange fees and acceptance rules violate federal antitrust laws. These suits (the settlement of which has been preliminarily approved) alleged, among other things, that our purported setting of interchange fees constitutes horizontal price-fixing between and among MasterCard and its customer banks, and MasterCard, Visa and their customer banks in violation of Section 1 of the Sherman Act, which prohibits contracts, combinations or conspiracies that unreasonably restrain trade. The suits sought treble damages, attorneys' fees and injunctive relief.
|
|
•
|
In Canada, a number of class action suits have been filed against MasterCard, Visa and a number of large Canadian banks relating to MasterCard and Visa interchange fees and rules related to interchange fees, including “honor all cards” and “no surcharge” rules.
|
|
•
|
In the United Kingdom, since May 2012, a number of retailers have filed claims against us for unspecified damages with respect to MasterCard's U.K. interchange fees.
|
See Note 18 (Legal and Regulatory Proceedings) to the consolidated financial statements included in Part II, Item 8 for more details regarding the allegations contained in these complaints and the status of these proceedings.
If issuers cannot collect, or we are forced to reduce, interchange fees, issuers will be unable to use interchange fees to recoup a portion of the costs incurred for their services. This could reduce the number of financial institutions willing to participate in our four-party payments system, lower overall transaction volumes, and/or make proprietary end-to-end networks or other forms of payment more attractive. Issuers could also choose to charge higher fees to consumers to attempt to recoup a portion of the costs incurred for their services, thereby making our card programs less desirable to consumers and reducing our transaction volumes and profitability. In addition, issuers could attempt to decrease the expense of their card and other payment programs by seeking a reduction in the fees that we charge to them. This could also result in less innovation and fewer product offerings. We are devoting substantial management and financial resources to the defense of interchange fees in regulatory proceedings, litigation and legislative activity. The potential outcome of any legislative, regulatory or litigation action could have a more positive or negative impact on MasterCard relative to its competitors. If we are ultimately unsuccessful in our defense of interchange fees, any such legislation, regulation and/or litigation may have a material adverse impact on our overall business and results of operations. In addition, regulatory proceedings and litigation could result in MasterCard being fined and/or having to pay civil damages.
The Dodd-Frank Act may have a material adverse impact on our overall business and results of operations.
The Dodd-Frank Act enacted in the United States includes provisions that provide for the regulation by the Federal Reserve of debit and prepaid interchange fees and certain other network industry practices. Among other things, it requires debit and prepaid “interchange transaction fees” (referred to in the Dodd-Frank Act as fees established, charged or received by a payment card network for the purpose of compensating an issuer for its involvement in an electronic debit transaction) to be “reasonable and proportional to the cost incurred by the issuer with respect to the transaction.” Additionally, it provides that neither an issuer nor a payment card network may establish exclusive network arrangements for debit or prepaid cards or inhibit the ability of a merchant to choose among different networks for routing debit or prepaid transactions.
In October 2011, Federal Reserve regulations went into effect implementing these provisions in accordance with the Dodd-Frank Act (with certain exceptions for issuer compliance with the exclusivity requirements). The regulations limit per-transaction U.S. debit and prepaid interchange fees to 21 cents plus five basis points. The issuer may receive a fraud prevention adjustment of an additional one cent if it meets certain requirements. The interchange limitations are a significant reduction from average interchange fees in effect before the regulations were implemented. The regulations contain exemptions from the interchange limitations for issuers that, together with their affiliates, have less than $10 billion in assets, as well as for debit cards issued pursuant to a government-administered payment program and certain reloadable prepaid cards. Also, while the regulations do not directly regulate network fees, they make clear that network fees cannot be used to circumvent the interchange fee restrictions. See our risk factor in "Risk Factors - Legal and Regulatory Risks" in this Part I, Item 1A with respect to interchange fees and related practices receiving significant and increasingly intense legal, regulatory and legislative scrutiny worldwide. Issuers are required to file various types of information regarding debit and prepaid transactions with the Federal Reserve every two years beginning in 2013, and such information could be used by the Federal Reserve to reexamine and potentially re-set the interchange cap. With respect to network arrangements and transaction routing, the regulations require debit and prepaid cards to be enabled with two unaffiliated payments networks. The regulations also provide that an issuer or payments network may not inhibit the ability of any person that accepts or honors a debit or prepaid card to direct the routing of the card transaction for processing over any network enabled on the card.
25
The Dodd-Frank Act also created two new independent regulatory bodies - the CFPB and FSOC. The CFPB has significant authority to regulate consumer financial products, including consumer credit, deposit, payment, and similar products. It is not yet entirely clear whether and/or to what extent the CFPB will regulate broader aspects of payments network operations. The FSOC is tasked, among other responsibilities, with identifying “systemically important” payment, clearing and settlement systems that will be subject to new regulation, supervision and examination requirements. To date, MasterCard has not been designated “systemically important” under the applicable standard. If MasterCard were designated “systemically important,” it would be subject to new risk management regulations relating to its payment, clearing and settlement activities. New regulations could address areas such as risk management policies and procedures; collateral requirements; participant default policies and procedures; the ability to complete timely clearing and settlement of financial transactions; and capital and financial resource requirements. Also, a “systemically important” payments system could be required to obtain prior approval from the Federal Reserve or another federal agency for changes to its system rules, procedures or operations that could materially affect the level of risk presented by that payments system. These developments or actions could increase the cost of operating our business and may make electronic payment transactions less attractive to card issuers, as well as consumers. This could result in a reduction in our payments volume and revenues.
If issuers, acquirers and/or merchants modify their business operations or otherwise take actions in response to this legislation which have the result of reducing the number of debit or prepaid transactions we process or the network fees we collect, the Dodd-Frank Act could have a material adverse impact on our overall business and results of operations. Failure by our customers or us to adjust our strategies successfully to compete in the new environment would increase this impact.
We recently entered into an agreement to settle the current U.S. merchant class litigation that, among other things, requires us to not restrict U.S. merchants, subject to certain conditions, from surcharging credit card transactions, which could impact the use of electronic payments and result in a decrease in our overall transaction volumes and could in turn materially and adversely impact our results of operations.
We have historically implemented policies, referred to as no-surcharge rules, in certain regions, including the United States, that prohibit merchants from charging higher prices to consumers who pay using MasterCard products instead of other means. As part of the terms of the settlement of the U.S. merchant class litigation entered into by the Company in October 2012 (and subject to final court approval), the Company and Visa have modified their no-surcharge or comparable rules to permit U.S. merchants to surcharge credit cards, subject to certain limitations (including ensuring that MasterCard or Visa cardholders are not unfairly subject to surcharging relative to cardholders of competing credit card networks such as American Express, Discover and PayPal, should those networks enforce rules that restrict surcharging). It is possible that over time U.S. merchants in some or all merchant categories may choose to surcharge as permitted by the rule change, which could make credit card programs less desirable to consumers in the United States. In the event that such merchants surcharge credit cards, this could result in consumers having a less favorable view of our products and/or using alternative means of payment instead of electronic products, which could result in a decrease in our overall transaction volumes, and which in turn could materially and adversely impact our results of operations.
New regulations or other legislative or regulatory activity with respect to the payments industry in one jurisdiction or of one product may lead to new regulations (or impact pending regulatory proceedings) in other jurisdictions or of other products.
Regulators around the world increasingly look at each other's approaches to the regulation of the payments and other industries. Consequently, a development in any one country, state or region may influence regulatory approaches in other countries, states or regions. For example, the December 2007 European Commission decision with respect to cross-border interchange fees could also lead to additional competition authorities in European member states commencing investigations or proceedings regarding domestic interchange fees or initiating regulation. The General Court's judgment in May 2012 upholding the European Commission's decision has increased the possibility of such actions, as well as the possibility of an adverse outcome for us in related and pending matters. Similarly, new laws and regulations in a country, state or region involving one product may cause lawmakers there to extend the regulations to another product. For example, regulations affecting debit transactions (such as the Federal Reserve's final rules implementing the Dodd-Frank Act) could lead to regulation of other consumer products (including credit). See our risk factor in "Risk Factors - Legal and Regulatory Risks" in this Part I, Item 1A with respect to government actions that may prevent us from competing effectively against providers of domestic payment services in certain countries.
As a result, the risks created by any one new law or regulation are magnified by the potential they have to be replicated, affecting our business in another place or involving another product. These include matters like interchange rates, network standards and network exclusivity and routing agreements. Conversely, if widely varying regulations come into existence worldwide, we may have difficulty adjusting our products, services, fees and other important aspects of our business, with the same effect. Either of these outcomes could materially and adversely affect our overall business and results of operations.
26
Government actions preferring or protecting providers of domestic payment services in certain countries may prevent us from competing effectively against those providers, which could adversely affect our ability to maintain or increase our revenues.
Governments in some countries, such as China, Russia, Ukraine and India could act (or have acted) to provide resources or preferential treatment or other protection to selected national payment and processing providers, or may otherwise create (or have created) its own national provider. These governments may take this action to support these providers. They may also take action to displace us from, prevent us from entering into, or substantially restrict us from participating in, particular geographies. As an example, governments in some countries are considering, or may consider, regulatory requirements that mandate processing of domestic payments either entirely in that country or by only domestic companies. Such a development would prevent us from utilizing our global processing capabilities for customers. Our efforts to effect change in, or work with, these countries may not succeed. This could adversely affect our ability to maintain or increase our revenues and extend our global brand.
The payments industry is the subject of increasing global regulatory focus, which may result in the imposition of costly new compliance burdens on us and our customers and may lead to increased costs and decreased transaction volumes and revenues.
We are subject to regulations that affect the payments industry in the many countries in which our cards and other devices are used. In particular, many of our customers are subject to regulations applicable to banks and other financial institutions in the United States and abroad, and, consequently, we are at times affected by such regulations. Regulation of the payments industry, including regulations applicable to us and our customers, has increased significantly in the last several years. See “Business-Government Regulation” in Part I, Item 1 for a detailed description of such regulation and related legislation. In addition to the Dodd-Frank Act, examples include:
|
•
|
Anti-Money Laundering and Anti-Terrorism
- We are subject to AML regulations such as Section 352 of the USA PATRIOT Act in the United States, AML laws enacted in India (which impose requirements on payments systems, such as MasterCard's, and their customers) and various other AML laws with respect to the activities of our internet payment gateway and prepaid card program management services. Money laundering or terrorist financing involving our cards could result in an enforcement action and/or damage to our reputation, which could reduce the use and acceptance of our products or increase our costs, and thereby have a material adverse impact on our business. In addition, regulations imposed by OFAC impose restrictions on financial transactions with certain countries and with persons and entities included on the SDN List. We take measures to prevent transactions that do not comply with OFAC sanctions including obligating our customers to screen cardholders and merchants against the SDN List; however, it is possible that such transactions may be processed through our payments system and that our reputation may suffer due to our customers' association with these countries or the existence of any such transactions.
|
|
•
|
Retail Payment System Regulation
- Several countries, such as India, Russia and Ukraine have implemented, or are authorized to implement, regulation of certain aspects of payments systems, under which payment system operators, such as MasterCard, operate under the authority and broad oversight of a government regulator. Increased regulatory focus in this area could result in additional obligations or restrictions with respect to the types of products that we may offer to consumers, the countries in which our cards and other payment devices may be used and the types of cardholders and merchants who can obtain or accept our cards. Moreover, in countries such as Russia and Ukraine, this oversight could be used to provide resources or preferential treatment or other protection to selected domestic payments and processing providers, which could displace us from, or prevent us from entering into, or substantially restrict us from participating in, particular geographies. See our risk factor in "Risk Factors - Legal and Regulatory Risks" in this Part I, Item 1A, with respect to government actions which may prevent us from competing effectively against providers of domestic payments services in certain countries.
|
|
•
|
Issuer Practice Legislation and Regulation
- Our financial institution customers are subject to numerous regulations applicable to issuers and more generally to banks and other financial institutions, which impact us as a consequence. Examples include the Federal Reserve regulations in the United States addressing any overdraft fees imposed in connection with ATM and debit card transactions, the CFPB's investigation into bank overdraft practices (and any further potential litigation on this) and regulations instituted in Germany requiring the provision of certain consumer identification information in connection with prepaid transactions (with similar legislation being considered in other jurisdictions). These regulations may diminish the attractiveness of our products to our customers.
|
|
•
|
Regulation of Internet Transactions
- Regulation of Internet transactions such as Internet gambling transactions and prescription drug practices can impact our customers and MasterCard as a payments system operator.
|
27
Increased regulatory focus on us, such as in connection with the matters discussed above, may result in costly compliance burdens and/or may otherwise increase our costs, which could materially and adversely impact our financial performance. Similarly, increased regulatory focus on our customers may cause such customers to reduce the volume of transactions processed through our systems, which could reduce our revenues materially and adversely impact our financial performance. Finally, failure to comply with the laws and regulations discussed above to which we are subject could result in fines, sanctions or other penalties, which could materially and adversely affect our overall business and results of operations, as well as have an impact on our reputation.
Regulation in the areas of consumer privacy, data use and/or security could decrease the number of payment cards and devices issued and could increase our costs.
We are subject to regulations related to privacy and data protection and information security in the jurisdictions in which we do business, and we could be negatively impacted by these regulations. Recently, these topics have received heightened legislative and regulatory focus in jurisdictions around the world, in particular in Europe, where the European Directive 95/46/EC is in the process of being revised. Regulation of privacy and data protection and information security may raise concerns and scrutiny of our practices in regard to the collection, use, disclosure or security of personal and sensitive information. Failure to comply with the privacy and data protection and security laws and regulations to which we are subject could result in fines, sanctions or other penalties, which could materially and adversely affect our results of operations and overall business, as well as have an impact on our reputation. Any additional, or changes to, regulations in these areas (as well as the manner in which such laws could be interpreted or applied) may also increase our costs to comply with such regulations. Changes to these laws could also impact our business operations by requiring changes to our data practices and could impact aspects of our business such as fraud monitoring and the development of information-based products and solutions. In addition, these regulations may increase the costs of our customers to issue payment products, which may, in turn, decrease the number of our cards and other payment devices that they issue. Any of these changes could materially and adversely affect our overall business and results of operations.
Liabilities we may incur for any litigation that has been or may be brought against us could materially and adversely affect our results of operations.
We are a defendant on a number of civil litigations and regulatory proceedings and investigations, including among others, those alleging violations of competition and antitrust law. See Note 18 (Legal and Regulatory Proceedings) to the consolidated financial statements included in Part II, Item 8 for more details regarding the allegations contained in these complaints and the status of these proceedings. Except as otherwise discussed in Note 18, we have not established reserves for any of the material legal proceedings in which we are currently involved and we are unable to estimate at this time the amount of charges, if any, that may be required to provide reserves for these matters in the future. In the event we are found liable in any of these material litigations or proceedings, particularly in the event we may be found liable in a large class-action lawsuit or on the basis of an antitrust claim entitling the plaintiff to treble damages or under which we were jointly and severally liable, we could be subject to significant damages, which could materially and adversely affect our financial condition and results of operations.
Limitations on our business resulting from litigation or litigation settlements may materially and adversely affect our overall business and results of operations.
Certain limitations have been placed on our business in recent years because of litigation. For example, as described above, as part of the terms of the settlement of the U.S. merchant class litigation entered into by the Company in October 2012 (and subject to final court approval), the Company and Visa modified their no-surcharge rules in January 2013 to permit U.S. merchants to surcharge credit cards, subject to certain limitations (including ensuring that MasterCard or Visa cardholders are not unfairly subject to surcharging relative to cardholders of competing credit card networks such as American Express, Discover and PayPal, should those networks enforce rules that restrict surcharging). Any future limitations on our business resulting from litigation or litigation settlements could reduce the volume of business that we do with our customers, which may materially and adversely affect our overall business and results of operations.
Potential changes in the tax laws applicable to us could materially increase our tax payments.
Potential changes in existing tax laws, such as recent proposals for fundamental tax reform in the United States, including the treatment of earnings of controlled foreign corporations, may impact our effective tax rate and tax payments. This could adversely impact our results of operations. See also Note 17 (Income Tax) to the consolidated financial statements included in Part II, Item 8.
28
Business Risks
Substantial and increasingly intense competition worldwide in the global payments industry may materially and adversely affect our overall business and results of operations.
The global payments industry is highly competitive. Our payment programs compete against all forms of payment, including paper-based transactions (principally cash and checks); card-based or other electronic payment programs or systems, including credit, charge, debit, prepaid, private-label and other types of general purpose and limited use programs; contactless, mobile and web-based payment platforms; and other electronic transactions such as wire transfers and Automated Clearing House payments. Within the global general purpose payments industry, we face substantial and increasingly intense competition worldwide from systems such as Visa, American Express, Discover, UnionPay, JCB and PayPal among others. Visa has greater volume than we do, and has greater scale and market share, as well as strong brand recognition, which may provide significant competitive advantages. Moreover, some of our traditional competitors, as well as alternative payment service providers, may have substantially greater financial and other resources than we have, may offer a wider range of programs and services than we offer or may use more effective advertising and marketing strategies to achieve broader brand recognition or merchant acceptance than we have. Our ability to compete may also be affected by the outcomes of litigation, competition-related regulatory proceedings, central bank activity and legislative activity.
Certain of our competitors, including American Express, Discover, private-label card networks and certain alternative payments systems, operate end-to-end payments systems with direct connections to both merchants and consumers. These competitors seek to derive competitive advantages from their business models. For example, operators of end-to-end payments systems tend to have greater control over consumer and merchant customer service than operators of four-party payments systems such as ours, in which we must rely on our issuing and acquiring financial institution customers. In addition, even when they operate programs that utilize a four-party system, these competitors have not attracted the same level of regulatory or legislative scrutiny of their pricing and business practices as have operators of four-party payments systems such as ours. If we continue to attract more regulatory scrutiny than these competitors because we operate a four-party system, or we are regulated because of the system we operate in a way in which our competitors are not, we could lose business to these competitors. Certain competitors may also hold competitive advantages as a result of their organizational structures. See “Business-Competition” in Part I, Item 1.
If we are not able to differentiate ourselves from our competitors, drive value for our customers and/or effectively align our resources with our goals and objectives, we may not be able to compete effectively against these threats. Our competitors may also more effectively introduce their own innovative programs and services that adversely impact our growth. Our customers can also develop their own competitive services. We also compete against new entrants that have developed alternative payments systems, e-commerce payments systems and payments systems for mobile devices, as well as physical store locations. A number of these new entrants rely principally on the Internet to support their services and may enjoy lower costs than we do, which could put us at a competitive disadvantage. Our failure to compete effectively against any of the foregoing competitive threats could materially and adversely affect our overall business and results of operations.
Potential future changes in the competitive landscape, including disintermediation from other participants in the payments value chain, also could harm our business.
We also expect that there may be other changes in the competitive landscape in the future, including:
|
•
|
Parties that process our transactions in certain countries may try to eliminate our position as an intermediary in the payment process. For example, merchants could process transactions directly with issuers, or processors could process transactions directly between issuers and acquirers. Large scale consolidation within processors could result in these processors developing bilateral agreements or in some cases processing the entire transaction on their own network, thereby disintermediating us.
|
|
•
|
Rapid and significant technological changes could occur, resulting in new and innovative payment programs that could place us at a competitive disadvantage and that could reduce the use of MasterCard products.
|
|
•
|
Competitors, customers, governments and other industry participants may develop products that compete with or replace value-added services we currently provide to support our transaction processing which could, if significant numbers of cardholders choose to use them, replace our own processing services or could force us to change our pricing or practices for these services.
|
|
•
|
Participants in the payments industry may merge, create joint ventures or form other business combinations that may strengthen their existing business services or create new payment services that compete with our services.
|
29
Our failure to compete effectively against any of the foregoing competitive threats could materially and adversely affect our overall business and results of operations.
We face increasingly intense competitive pressure on the prices we charge our customers, which may materially and adversely affect our business and results of operations.
We generate revenue from the fees that we charge our customers for providing transaction processing and other payment-related services and from assessments on the dollar volume of activity on cards and other devices carrying our brands. In order to increase transaction volumes, enter new markets and expand our card base, we seek to enter into business agreements with customers through which we offer incentives, pricing discounts and other support to customers that issue and promote our products. In order to stay competitive, we may have to increase the amount of these incentives and pricing discounts. Over the past several years, we have experienced continued pricing pressure. The demand from our customers for better pricing arrangements and greater rebates and incentives moderates our growth. We may not be able to continue our expansion strategy to process additional transaction volumes or to provide additional services to our customers at levels sufficient to compensate for such lower fees or increased costs in the future, which could materially and adversely affect our overall business and results of operations. In addition, increased pressure on prices enhances the importance of cost containment and productivity initiatives in areas other than those relating to customer incentives. We may not succeed in these efforts.
In the future, we may not be able to enter into agreements with our customers on terms that we consider favorable, and we may be required to modify existing agreements in order to maintain relationships and to compete with others in the industry. Some of our competitors are larger and have greater financial resources than we do and accordingly may be able to charge lower prices to our customers. In addition, to the extent that we offer discounts or incentives under such agreements, we will need to further increase transaction volumes or the amount of services provided thereunder in order to benefit incrementally from such agreements and to increase revenue and profit, and we may not be successful in doing so, particularly in the current regulatory environment. Our customers also may implement cost reduction initiatives that reduce or eliminate payment product marketing or increase requests for greater incentives or greater cost stability. Furthermore, a number of customers from which we earn substantial revenue are principally aligned with one of our competitors. In addition, customers principally aligned with one of our competitors may outperform customers principally aligned with us. A significant loss of our existing revenue or transaction volumes from these customers could have a material adverse impact on our overall business and results of operations.
Additional consolidation or other changes in or affecting the banking industry could result in a loss of business for us and create pressure on the fees we charge our customers, resulting in lower prices and/or more favorable terms for our customers, which may materially and adversely affect our overall business and results of operations.
The banking industry has undergone substantial, accelerated consolidation in the past, and we expect some consolidation to continue in the future. Consolidations have included customers with a substantial MasterCard portfolio being acquired by institutions with a strong relationship with a competitor. Significant consolidation in the banking industry may result in the substantial loss of business for us, which could have a material adverse impact on our business and prospects. In addition, one or more of our customers could seek to merge with, or acquire, one of our competitors, and any such transaction could also have a material adverse impact on our overall business.
Consolidation in the banking industry, whether as a result of an acquisition of a substantial MasterCard portfolio by an institution with a strong relationship with a competitor or the combination of two institutions with which we have a strong relationship, would also produce a smaller number of large customers, which could increase the bargaining power of our customers. This consolidation could lead to lower prices and/or more favorable terms for our customers. Any such lower prices and/or more favorable terms could materially and adversely affect our results of operations.
If we lose a significant portion of business from one or more of our largest customers, our revenue could fluctuate and decrease significantly in the longer term, which could have a material adverse long-term impact on our business.
Most of our customer relationships are not exclusive and in certain circumstances may be terminated by our customers. Our customers can reassess their commitments to us at any time in the future and/or develop their own competitive services. Accordingly, our business agreements with these customers may not reduce the risk inherent in our business that customers may terminate their relationships with us in favor of relationships with our competitors, or for other reasons, or might not meet their contractual obligations to us.
In addition, a significant portion of our revenue is concentrated among our five largest customers. In 2012, the net revenues from these customers represented an aggregate of approximately
$1.8 billion
, or
24%
, of total revenue. Loss of business from any of our large customers could have a material adverse impact on our overall business and results of operations.
30
Merchants continue to be focused on the costs of accepting electronic forms of payment, which may lead to additional litigation and regulatory proceedings and may increase the costs of our incentive programs, which could materially and adversely affect our profitability.
Merchants are an important constituency in our payments system, and we rely on both our relationships with them, as well as their relationships with our customers, to expand the acceptance of our cards and payment devices. Consolidation in the retail industry is producing a set of larger merchants with increasingly global scope. We believe that these merchants are having a significant impact on all participants in the global payments industry, including MasterCard. Some large merchants have supported the legal, regulatory and legislative challenges to interchange fees that MasterCard has been defending, including the U.S. merchant litigations as to which the Company recently entered into a settlement agreement (subject to final court approval). See our risk factor in this Part I, Item 1A with respect to interchange fees and related practices receiving significant and increasingly intense legal, regulatory and legislative scrutiny worldwide. Also see our risk factor in "Risk Factors - Legal and Regulatory Risks" in this Part I, Item 1A with respect to the Dodd-Frank Act. The increasing focus of merchants on the costs of accepting various forms of payment may lead to additional litigation and regulatory proceedings.
Merchants are also able to negotiate incentives from us and pricing concessions from our customers as a condition to accepting our payment cards and devices. As merchants consolidate and become even larger, we may have to increase the amount of incentives that we provide to certain merchants, which could materially and adversely affect our results of operations. Competitive and regulatory pressures on pricing could make it difficult to offset the costs of these incentives.
Certain customers have exclusive, or nearly exclusive, relationships with our competitors to issue payment products, and these relationships may adversely affect our ability to maintain or increase our revenues and may have a material adverse impact on our business.
Certain customers have exclusive, or nearly-exclusive, relationships with our competitors to issue payment products, and these relationships may make it difficult or cost-prohibitive for us to do significant amounts of business with them to increase our revenues. In addition, these customers may be more successful and may grow faster than the customers that primarily issue our cards, which could put us at a competitive disadvantage. Furthermore, we earn substantial revenue from customers with exclusive or nearly-exclusive relationships with our competitors. Such relationships could provide advantages to the customers to shift business from us to the competitors with which they are principally aligned. A significant loss of our existing revenue or transaction volumes from these customers could have a material adverse impact on our business.
We depend significantly on our relationships with our customers to manage our payments system. If we are unable to maintain those relationships, or if our customers are unable to maintain their relationships with cardholders or merchants that accept our products for payment, our business may be materially and adversely affected.
While we work directly with many stakeholders in the payments system, including merchants and governments, we are, and will continue to be, significantly dependent on our relationships with our issuers and acquirers and their further relationships with cardholders and merchants to support our programs and services. We do not issue cards or other payment devices, extend credit to cardholders or determine the interest rates (if applicable) or other fees charged to cardholders using our products. Each issuer determines these and most other competitive payment program features. In addition, we do not establish the discount rate that merchants are charged for acceptance, which is the responsibility of our acquiring customers. As a result, our business significantly depends on the continued success and competitiveness of our issuing and acquiring customers and the strength of our relationships with them. In turn, our customers' success depends on a variety of factors over which we have little or no influence. If our customers become financially unstable, we may lose revenue or we may be exposed to settlement risk as described below.
With the exception of the United States and a select number of other jurisdictions, most in-country (as opposed to cross-border) transactions conducted using MasterCard, Maestro and Cirrus cards are authorized, cleared and settled by our customers or other processors. Because we do not provide domestic processing services in these countries and do not, as described above, have direct relationships with cardholders, we depend on our close working relationships with our customers to effectively manage our brands, and the perception of our payments system, among consumers in these countries. We also rely on these customers to help manage our brands and perception among regulators and merchants in these countries, alongside our own relationships with these stakeholders. From time to time, our customers may take actions that we do not believe to be in the best interests of our payments system overall, which may materially and adversely impact our business. If our customers' actions cause significant negative perception of the global payments industry or our brands, cardholders may reduce the usage of our programs, which could reduce our revenues and negatively impact our results of operations.
In addition, our competitors may process a greater percentage of domestic transactions in jurisdictions outside the United States than we do. As a result, our inability to control the end-to-end processing on cards and other payment devices carrying our
31
brands in many markets may put us at a competitive disadvantage by limiting our ability to maintain transaction integrity or introduce value-added programs and services that are dependent upon us processing the underlying transactions.
We rely on the continuing expansion of merchant acceptance of our products and programs. Although our business strategy is to invest in strengthening our brands and expanding our acceptance network, there can be no guarantee that our efforts in these areas will continue to be successful. If the rate of merchant acceptance growth slows or reverses itself, our business could suffer.
The marketplace's perception of our brands and reputation may materially and adversely affect our overall business.
Our brands and their attributes are key assets of our business. The ability to attract and retain cardholders to our branded products depends highly upon the external perception of us and our industry. Our business may be affected by actions taken by our customers that impact the perception of our brands. From time to time, our customers may take actions that we do not believe to be in the best interests of our brands, such as creditor practices that may be viewed as “predatory”. Moreover, adverse developments with respect to our industry or the industries of our customers may also, by association, impair our reputation, or result in greater regulatory or legislative scrutiny. We have also been pursuing the use of social media channels at an increasingly rapid pace. Under some circumstances, such use could also cause rapid, widespread reputational harm to our brands. Such perception and damage to our reputation could have a material and adverse effect to our overall business.
Unprecedented global economic events in financial markets around the world have directly and adversely affected, and may continue to affect, many of our customers, merchants that accept our brands and cardholders who use our brands, which could result in a material and adverse impact on our overall business and results of operations.
The competitive and evolving nature of the global payments industry provides both challenges to and opportunities for the continued growth of our business. Unprecedented events which began during 2008 impacted the financial markets around the world, including continued distress in the credit environment, continued equity market volatility and additional government intervention. The economies of the United States and numerous countries around the world were significantly impacted by this economic turmoil. Countries have experienced credit ratings actions by rating agencies, including several in Europe as well as the United States. In addition, some existing customers have been placed in receivership or administration or have a significant amount of their stock owned by their governments. Many financial institutions are facing increased regulatory and governmental influence, including potential further changes in laws and regulations. Many of our financial institution customers, merchants that accept our products and cardholders who use our products have been directly and adversely impacted.
MasterCard's financial results may be negatively impacted by actions taken by individual financial institutions or by governmental or regulatory bodies. The condition of the economic environment may accelerate the timing of or increase the impact of risks to our financial performance. As a result, our revenue may be negatively impacted, or we may be impacted, in several ways, including but not limited to the following:
|
•
|
Declining economies, foreign currency fluctuations and the pace of economic recovery can change consumer spending behaviors; for example, a significant portion of our revenues is dependent on cross-border travel patterns, which may continue to change.
|
|
•
|
Constriction of consumer and business confidence, such as in recessionary environments and those markets experiencing relatively high unemployment, may cause decreased spending by cardholders.
|
|
•
|
Uncertainties in the United States related to the upcoming deadline on the debt limit and budgetary discussions could affect the United States' credit rating and could affect consumer confidence and spending.
|
|
•
|
Our customers may restrict credit lines to cardholders or limit the issuance of new cards to mitigate increasing cardholder defaults.
|
|
•
|
Uncertainty and volatility in the performance of our customers' businesses may make estimates of our revenues, rebates, incentives and realization of prepaid assets less predictable.
|
|
•
|
Our customers may implement cost reduction initiatives that reduce or eliminate payment card marketing or increase requests for greater incentives or greater cost stability.
|
|
•
|
Our customers may decrease spending for value-added services.
|
|
•
|
Government intervention, including the effect of laws, regulations and/or government investments in our customers, may have potential negative effects on our business and our relationships with customers or otherwise alter their strategic direction away from our products.
|
32
|
•
|
Tightening of credit availability could impact the ability of participating financial institutions to lend to us under the terms of our credit facility.
|
|
•
|
Our customers may default on their settlement obligations, including due to an increased probability of sovereign defaults in several European countries causing a liquidity crisis for our customers. See Note 19 (Settlement and Other Risk Management) to the consolidated financial statements included in Part II, Item 8 of this Report for further discussion of our settlement exposure.
|
|
•
|
Our overall business and results of operations could be materially and adversely affected by consolidation of our customers. See our risk factor in "Risk Factors - Business Risks" in this Part I, Item 1A with respect to additional consolidation for further discussion.
|
Any of these developments could have a material adverse impact on our overall business and results of operations.
A decline in cross-border travel could adversely affect our results of operations, as a significant portion of our revenue is generated from cross-border transactions.
We process substantially all cross-border transactions using MasterCard, Maestro and Cirrus-branded cards and generate a significant amount of revenue from cross-border volume fees and transaction processing fees. Revenue from processing cross-border and currency conversion transactions for our customers fluctuates with cross-border travel and our customers' need for transactions to be converted into their base currency. Cross-border travel may be adversely affected by world geopolitical, economic, weather and other conditions. These include the threat of terrorism and outbreaks of flu, viruses and other diseases. Any such decline in cross-border travel could adversely affect our results of operations.
General economic and global political conditions may adversely affect trends in consumer spending, which may materially and adversely impact our results of operations.
The global payments industry depends heavily upon the overall level of consumer, business and government spending. General economic conditions (such as unemployment, housing and changes in interest rates) and other political conditions (such as devaluation of currencies and government restrictions on consumer spending, as well as the impact of events in the United States such as the upcoming deadline on the debt limit) in key countries in which we operate may adversely affect our financial performance by reducing the number or average purchase amount of transactions involving our payment cards and devices. Also, as we are principally based in the United States, a negative perception of the United States could impact the perception of our company, which could adversely affect our business.
As a guarantor of certain third-party obligations, including those of principal customers and affiliate debit licensees, we are exposed to risk of loss or illiquidity.
We may incur liability in connection with transaction settlements if an issuer or acquirer fails to fund its daily settlement obligations due to technical problems, liquidity shortfalls, insolvency or other reasons. If a principal customer or affiliate debit licensee of MasterCard is unable to fulfill its settlement obligations to other customers, we may bear the loss. In addition, although we are not obligated to do so, we may elect to keep merchants whole if an acquirer defaults on its merchant payment obligations, or to keep prepaid cardholders whole if an issuer defaults on its obligation to safeguard unspent prepaid funds. Our MasterCard, Maestro and Cirrus-branded gross legal settlement exposure, which is primarily estimated using the average daily card volume during the quarter multiplied by the estimated number of days to settle, was approximately
$38 billion
as of December 31, 2012. We have a revolving credit facility in the amount of
$3 billion
which could be used for general corporate purposes, including to provide liquidity in the event of one or more settlement failures by our customers. In the event that MasterCard effects a payment on behalf of a failed customer, MasterCard may seek an assignment of the underlying receivables from the failed customer. Subject to approval by our Board of Directors, customers may be charged for the amount of any settlement loss incurred during these ordinary course activities of MasterCard. While we believe that we have sufficient liquidity to cover a settlement failure by our largest customer on its peak day, the term and amount of our guarantee of obligations to principal customers is unlimited. As a result, concurrent settlement failures of more than one of our larger customers or of several of our smaller customers either on a given day or over a condensed period of time may exceed our available resources and could materially and adversely affect our overall business. In addition, even if we have sufficient liquidity to cover a settlement failure, we may not be able to recover the cost of such a payment and may therefore be exposed to significant losses, which could materially and adversely affect our results of operations. Moreover, during 2012, many of our financial institution customers continued to be directly and adversely impacted by the unprecedented events in the financial markets which began during 2008 and the economic turmoil that has ensued. The European financial crisis remains a heightened concern. Our aggregate gross settlement exposures to Greece, Italy, Portugal and Spain, four of the countries most significantly impacted by the Eurozone crisis, are less than
5%
of our total gross settlement
33
exposure and are being managed through various planning and risk mitigation practices. Nonetheless, these conditions present increased risk that we may have to perform under our settlement guarantees.
Separately, MasterCard also provides guarantees to certain customers and other companies indemnifying them from losses stemming from failures of third parties to perform. For more information on our settlement exposure and risk assessment and mitigation practices as of December 31, 2012, see Note 19 (Settlement and Other Risk Management) to the consolidated financial statements included in Part II, Item 8 of this Report.
A failure or breach of our security systems or infrastructure as a result of cyber-attacks could disrupt our business, result in the disclosure or misuse of confidential or proprietary information, damage our reputation, increase our costs and cause losses.
Information security risks for payments and technology companies such as MasterCard have significantly increased in recent years in part because of the proliferation of new technologies, the use of the Internet and telecommunications technologies to conduct financial transactions, and the increased sophistication and activities of organized crime, hackers, terrorists and other external parties. These threats may derive from fraud or malice on the part of our employees or third parties, or may result from human error or accidental technological failure. These threats include cyber-attacks such as computer viruses, malicious code, phishing attacks or information security breaches.
Our operations rely on the secure processing, transmission and storage of confidential, proprietary and other information in our computer systems and networks. Our customers and other parties in the payments value chain, as well as our cardholders, rely on our digital technologies, computer and email systems, software and networks to conduct their operations. In addition, to access our products and services, our customers and cardholders increasingly use personal smartphones, tablet PCs and other mobile devices that may be beyond our control systems. We routinely receive cyber-threats and our technologies, systems and networks have been subject to cyber-attacks. Because of our position in the payments value chain, we believe that such threats may continue, and that we are likely to continue to be a target of such attacks.
To date, we have not experienced any material impact relating to cyber-attacks or other information security breaches. However, if one or more of these events occurs, it could lead to security breaches of the networks, systems or devices that our customers use to access our products and services which could result in the unauthorized disclosure, release, gathering, monitoring, misuse, loss or destruction of confidential, proprietary and other information (including account data information) or data security compromises. Such events could also cause service interruptions, malfunctions or other failures in the physical infrastructure or operations systems that support our businesses and customers (such as the lack of availability of our value-added systems), as well as the operations of our customers or other third parties. Any actual attacks could lead to damage to our reputation with our customers and other parties and the market, additional costs to MasterCard (such as repairing systems, adding new personnel or protection technologies or compliance costs), regulatory penalties, financial losses to both us and our customers and partners and the loss of customers and business opportunities. If such attacks are not detected immediately, their effect could be compounded.
We maintain an information security program, a business continuity program and insurance coverage, and our processing systems incorporate multiple levels of protection, in order to address or otherwise mitigate these risks. We also test our systems to discover and address any potential vulnerabilities. Despite these mitigation efforts, there can be no assurance that we will be immune to these risks and not suffer losses in the future. Our risk and exposure to these matters remain heightened because of, among other things, the evolving nature of these threats, the prominent size and scale of MasterCard and our role in the global payments and technology industries, our plans to continue to implement our digital and mobile channel strategies and develop additional remote connectivity solutions to serve our customers and cardholders when and how they want to be served, our global presence, our extensive use of third party vendors and future joint venture and merger and acquisition opportunities. As a result, cyber-security and the continued development and enhancement of our controls, processes and practices designed to protect our systems, computers, software, data and networks from attack, damage or unauthorized access remain a priority for us. As cyber-threats continue to evolve, we may be required to expend significant additional resources to continue to modify or enhance our protective measures or to investigate and remediate any information security vulnerabilities. Any of the risks described above could materially adversely affect our overall business and results of operations.
If our transaction processing systems and other services are disrupted or we are unable to process transactions or service our customers efficiently or at all, our results of operations would be materially reduced.
Our transaction processing systems and other key service offerings may experience interruptions as a result of a disaster including, but not limited to, technology malfunctions, fire, weather events, power outages, telecommunications disruptions, terrorism, workplace violence, accidents or other catastrophic events. Our visibility in the global payments industry may also put us at greater risk of attack by terrorists, activists, or hackers who intend to disrupt our facilities and/or systems. A disaster that occurs at, or in the vicinity of, our primary and/or back-up facilities in any global location could interrupt our services. Although
34
we maintain a business continuity program to analyze risk, assess potential impacts, and develop effective response strategies, we cannot ensure that our business would be immune to these risks.
Additionally, we rely on third-party service providers for the timely transmission of information across our global data network. Inadequate infrastructure in lesser-developed markets could also result in service disruptions, which could impact our ability to do business in those markets. If one of our service providers fails to provide the communications capacity or services we require, as a result of natural disaster, operational disruptions, terrorism, hacking or any other reason, the failure could interrupt our services. Because of the intrinsic importance of our processing systems to our business, any interruption or degradation could adversely affect the perception of the reliability of products carrying our brands and materially reduce our results of operations.
Account data breaches involving card data stored, processed or transmitted by us or third parties could adversely affect our reputation and results of operations.
We, our issuers and acquirers, merchants and other third parties process, transmit or store cardholder account and other information in connection with payment cards and devices. In addition, our customers may sponsor (or we may certify as PCI-compliant) third-party processors to process transactions generated by cards carrying our brands and merchants may use third parties to provide services related to card use. A breach of the systems on which sensitive cardholder data and account information are processed, transmitted or stored could lead to fraudulent activity involving cards carrying our brands, damage our reputation and lead to claims against us, as well as subject us to regulatory actions. We routinely encounter account data compromise events, some of which have been high profile, involving merchants and third-party payment processors that process, store or transmit payment card data, which affect millions of MasterCard, Visa, Discover, American Express and other types of cardholders. These events typically involve external agents hacking the merchants' or third-party processors' systems and installing malware to compromise the confidentiality and integrity of the servers. As a result of such data security breaches, we may be subject to reputational damage and/or lawsuits involving payment cards carrying our brands. While most of these lawsuits do not involve direct claims against us, we could face damage claims in various circumstances, which, if upheld, could materially and adversely affect our results of operations. Damage to our reputation or that of our brands resulting from an account data breach of either our systems or the systems of our customers, merchants and other third parties could decrease the use and acceptance of our cards and other payment devices, which in turn could have a material adverse impact on our transaction volumes, results of operations and prospects for future growth, or increase our costs by leading to additional regulatory burdens being imposed upon us.
An increase in fraudulent activity using our cards could lead to reputational damage to our brands and/or regulatory intervention, which could reduce the use and acceptance of our cards and other payment devices.
Criminals are using increasingly sophisticated methods to capture cardholder account information to engage in illegal activities such as counterfeiting or other fraud. As outsourcing and specialization become commonplace in the payments industry, there are more third parties involved in processing transactions using our cards. Increased fraud levels involving our cards, or misconduct or negligence by third parties processing or otherwise servicing our cards, could lead to regulatory intervention, such as enhanced security requirements, as well as damage to our reputation, which could reduce the use and acceptance of our cards or increase our compliance costs, and thereby have a material adverse impact on our business.
Rapid technological developments in our industry present both operational and legal challenges (including potential intellectual property exposure) which could impact our results of operations or limit our future growth.
The payments industry is subject to rapid and significant technological changes, including continuing developments of technologies in the areas of smart cards and devices, radio frequency and proximity payment devices (such as contactless payment devices), electronic commerce and mobile commerce, among others. We cannot predict the effect of technological changes on our business. We rely in part on third parties, including some of our competitors and potential competitors, for the development of and access to new technologies. We expect that new services and technologies applicable to the payments industry will continue to emerge, and these new services and technologies may be superior to, or render obsolete, the technologies we currently use in our programs and services. In addition, our ability to adopt new services and technologies that we develop may be inhibited by a need for industry-wide standards and by resistance from customers or merchants to such changes by the complexity of our systems. Our ability to adopt these technologies can also be inhibited by intellectual property rights of third parties. We have received, and we may in the future receive, notices or inquiries from patent holders (for example, other operating companies or non-practicing entities) suggesting that we may be infringing certain patents or that we need to license the use of their patents to avoid infringement. Such notices may, among other things, threaten litigation against us or demand significant license fees. Our future success will depend, in part, on our ability to develop or adapt to technological changes and evolving industry standards.
Failure to keep pace with these technological developments could lead to a decline in the use of our products, which could have a material adverse impact on our results of operations.
35
Adverse currency fluctuations and foreign exchange controls could negatively impact our results of operations.
During 2012, approximately
61%
of our revenue was generated from activities outside the United States. This revenue (and the related expense) could be transacted in a non-functional currency or valued based on a currency other than the functional currency of the entity generating the revenues. Resulting exchange gains and losses are included in our net income. Our risk management activities provide protection with respect to adverse changes in the value of only a limited number of currencies and are based on estimates of exposures to these currencies.
In addition, some of the revenue we generate outside the United States is subject to unpredictable currency fluctuations (including devaluations of currencies) where the values of other currencies change relative to the U.S. dollar. If the U.S. dollar strengthens compared to currencies in which we generate revenue, this revenue may be translated at a materially lower amount than expected. Furthermore, we may become subject to exchange control regulations that might restrict or prohibit the conversion of our other revenue currencies into U.S. dollars.
The occurrence of currency fluctuations or exchange controls could have a material adverse impact on our results of operations.
Acquisitions, strategic investments or entry into new businesses could disrupt our business and harm our results of operations or reputation.
Although we may continue to make strategic acquisitions of, or acquire interests in joint ventures or other entities related to, complementary businesses, products or technologies, we may not be able to successfully partner with or integrate any such acquired businesses, products or technologies. In addition, the integration of any acquisition or investment (including efforts related to an acquisition of an interest in a joint venture or other entity) may divert management's time and resources from our core business and disrupt our operations. Moreover, we may spend time and money on acquisitions or projects that do not meet our expectations or increase our revenue. To the extent we pay the purchase price of any acquisition in cash, it would reduce our cash reserves available to us for other uses, and to the extent the purchase price is paid with our stock, it could be dilutive to our stockholders. Furthermore, we may not be able to successfully finance the business following the acquisition as a result of costs of operations, including any litigation risk which may be inherited from the acquisition. Any acquisition or entry into a new business could subject us to new regulations with which we would need to comply, and we could be subject to liability or reputational harm to the extent we cannot meet any such compliance requirements. Our expansion into new businesses could also result in unanticipated issues which may be difficult to manage. Although we periodically evaluate potential acquisitions of businesses, products and technologies and anticipate continuing to make these evaluations, we cannot guarantee that we will be able to execute and integrate any such acquisitions.
Risks Related to our Class A Common Stock and Governance Structure
Future sales of our shares of Class A common stock could depress the market price of our Class A common stock.
The market price of our Class A common stock could decline as a result of sales of a large number of shares in the market or the perception that such sales could occur. These sales, or the possibility that these sales may occur, also might make it more difficult for us or our stockholders to sell equity securities in the future. As of
February 7, 2013
, we had
117,961,825
outstanding shares of Class A common stock, of which
12,378,831
shares were owned by The MasterCard Foundation (the “Foundation”). Under the terms of the donation of these shares by MasterCard to the Foundation, the Foundation became able to sell its shares of our Class A common stock commencing on the fourth anniversary of the consummation of the IPO in May 2006 to the extent necessary to comply with charitable disbursement requirements. Under Canadian tax law, the Foundation is generally required each year to disburse at least 3.5% of its assets not used in administration of the Foundation in qualified charitable disbursements. Despite permission from the Canadian tax authorities to defer its annual disbursement requirement for up to 15 years and meet its total deferred disbursement obligations at the end of the 15-year period, the Foundation may decide to meet its disbursement obligations on an annual basis or to settle previously accumulated obligations during any given year.
The market price of our common stock could be volatile.
Securities markets worldwide experience significant price and volume fluctuations and have experienced increased volatility in connection with recent unpredictable economic events around the world. This market volatility, as well as the factors listed below, among others, could affect the market price of our common stock:
|
•
|
the continuation of unprecedented economic events around the world in financial markets as well as political conditions and other factors unrelated to our operating performance or the operating performance of our competitors;
|
|
•
|
quarterly variations in our results of operations or the results of operations of our competitors;
|
36
|
•
|
changes in earnings estimates, investors' perceptions, recommendations by securities analysts or our failure to achieve analysts' earnings estimates;
|
|
•
|
the announcement of new products or service enhancements by us or our competitors;
|
|
•
|
announcements related to litigation, regulation or legislative activity;
|
|
•
|
potential acquisitions by us of other companies; and
|
|
•
|
developments in our industry.
|
There are terms in our charter documents and under Delaware law that could be considered anti-takeover provisions or could have an impact on a change in control.
Provisions contained in our amended and restated certificate of incorporation and bylaws and Delaware law could delay or prevent entirely a merger or acquisition that our stockholders consider favorable. These provisions may also discourage acquisition proposals or have the effect of delaying or preventing entirely a change in control, which could harm our stock price. For example, subject to limited exceptions, our amended and restated certificate of incorporation prohibits any person from beneficially owning more than 15% of any of the Class A common stock or any other class or series of our stock with general voting power, or more than 15% of our total voting power. Further, except in limited circumstances, no customer or former customer of MasterCard, or any operator, customer or licensee of any competing general purpose payment card system, or any affiliate of any such person, may beneficially own any share of Class A common stock or any other class or series of our stock entitled to vote generally in the election of directors. In addition,
|
•
|
our stockholders are not entitled to the right to cumulate votes in the election of directors;
|
|
•
|
holders of our Class A common stock are not entitled to act by written consent;
|
|
•
|
our stockholders must provide timely notice for any stockholder proposals and director nominations;
|
|
•
|
a vote of 80% or more of all of the outstanding shares of our stock then entitled to vote is required for stockholders to amend any provision of our bylaws; and
|
|
•
|
any representative of a competitor of MasterCard or of the Foundation is disqualified from service on our board of directors.
|
A substantial portion of our voting power is held by the Foundation, which is restricted from selling shares for an extended period of time and therefore may not have the same incentive to approve a corporate action that may be favorable to the other public stockholders. In addition, the ownership of Class A common stock by the Foundation and the restrictions on transfer could discourage or make more difficult acquisition proposals favored by the other holders of the Class A common stock.
As of
February 7, 2013
, the Foundation owns
12,378,831
shares of Class A common stock, representing approximately
10.5%
of our general voting power. The Foundation may not sell or otherwise transfer its shares of Class A common stock prior to April 26, 2026 (twenty years and eleven months following the IPO), except to the extent necessary to satisfy its charitable disbursement requirements, for which purpose earlier sales are permitted. The directors of the Foundation are required to be independent of us and our customers. The ownership of Class A common stock by the Foundation, together with the restrictions on transfer, could discourage or make more difficult acquisition proposals favored by the other holders of the Class A common stock. In addition, because the Foundation is restricted from selling its shares for an extended period of time, it may not have the same interest in short or medium-term movements in our stock price as, or incentive to approve a corporate action that may be favorable to, our other stockholders.
Our ability to pay regular dividends to our holders of Class A common stock and Class B common stock is subject to the discretion of our board of directors and will be limited by our ability to generate sufficient earnings and cash flows.
MasterCard intends to pay cash dividends on a quarterly basis on our shares of Class A common stock and Class B common stock. Our board of directors may, in its discretion, decrease the level of dividends or discontinue the payment of dividends entirely. The payment of dividends is dependent upon our ability to generate earnings and cash flows so that we may pay our obligations and expenses and pay dividends to our stockholders. However, sufficient cash may not be available to pay such dividends. Payment of future dividends, if any, will be at the discretion of our board of directors after taking into account various factors, including our financial condition, operating results, available cash and current and anticipated cash needs. If, as a
37
consequence of these various factors, we are unable to generate sufficient earnings and cash flows from our business, we may not be able to make or may have to reduce or eliminate the payment of dividends on our shares of Class A common stock and Class B common stock.
Item 1B.
Unresolved Staff Comments
Not applicable.
Item 2.
Properties
As of
December 31, 2012
, MasterCard and its subsidiaries owned or leased 126 commercial properties. We own our corporate headquarters, a 472,600 square foot building located in Purchase, New York. There is no outstanding debt on this building. Our principal technology and operations center is a 528,000 square foot leased facility located in O'Fallon, Missouri. The term of the lease on this facility is 10 years, which commenced on March 1, 2009. Our leased properties in the United States are located in 10 states, Puerto Rico and in the District of Columbia. We also lease and own properties in 57 other countries. These facilities primarily consist of corporate and regional offices, as well as our operations centers.
We believe that our facilities are suitable and adequate for the business that we currently conduct. However, we periodically review our space requirements and may acquire or lease new space to meet the needs of our business, or consolidate and dispose of facilities that are no longer required.
Item 3.
Legal Proceedings
Refer to Notes 10 (Accrued Expenses) and 18 (Legal and Regulatory Proceedings) to the consolidated financial statements included in Part II, Item 8.
Item 4.
Mine Safety Disclosures
Not applicable
38
Item 5.
Market for Registrant's Common Equity, Related Stockholder Matters and Issuer Purchases of Equity Securities
Price Range of Common Stock
Our Class A common stock trades on the New York Stock Exchange under the symbol “MA”. The following table sets forth the intra-day high and low sale prices for our Class A common stock for the four quarterly periods in each of
2012
and
2011
, as reported by the New York Stock Exchange.
At
February 7, 2013
, the Company had
45
stoc
kholders of record for its Class A common stock. We believe that the number of beneficial owners is substantially greater than the number of record holders because a large portion of our Class A common stock is held in “street name” by brokers.
|
2012
|
2011
|
||||||
|
High
|
Low
|
High
|
Low
|
||||
|
First Quarter
|
$437.56
|
$336.26
|
$262.38
|
$219.33
|
|||
|
Second Quarter
|
466.98
|
389.90
|
309.81
|
251.94
|
|||
|
Third Quarter
|
461.79
|
404.70
|
361.94
|
291.67
|
|||
|
Fourth Quarter
|
498.62
|
447.38
|
384.99
|
293.01
|
|||
There is currently no established public trading
market for our Class B common stock. There were approximately
447
holders of record of our Class B common stock as of
February 7, 2013
.
Dividend Declaration and Policy
During the years ended December 31,
2012
and
2011
, we paid the following quarterly cash dividends per share on our Class A common stock and Class B Common stock:
|
Dividend per Share
|
||||
|
2012
|
2011
|
|||
|
First Quarter
|
$0.15
|
$0.15
|
||
|
Second Quarter
|
0.30
|
0.15
|
||
|
Third Quarter
|
0.30
|
0.15
|
||
|
Fourth Quarter
|
0.30
|
0.15
|
||
On December 4, 2012, our Board of Directors declared a quarterly cash dividend of $0.30 per share paid on February 8, 2013 to holders of record on January 9, 2013 of our Class A common stock and Class B common stock. On February 5, 2013, our Board of Directors declared a quarterly cash dividend of $0.60 per share payable on May 9, 2013 to holders of record on April 9, 2013 of our Class A common stock and Class B common stock.
Subject to legally available funds, we intend to continue to pay a quarterly cash dividend on our outstanding Class A common stock and Class B common stock. However, the declaration and payment of future dividends is at the sole discretion of our Board of Directors after taking into account various factors, including our financial condition, operating results, available cash and current and anticipated cash needs.
Issuer Purchases of Equity Securities
In June 2012, the Company’s Board of Directors approved a new share repurchase program authorizing the Company to repurchase up to
$1.5 billion
of its Class A common stock. This program (the "June 2012 Share Repurchase Program") became effective in June 2012 at the completion of the Company’s previously announced
$2 billion
Class A share repurchase program. The cumulative repurchases by the Company under the
$2 billion
repurchase program totaled approximately
6.5 million
shares of Class A common stock, for an aggregate cost of approximately
$2 billion
and at an average price of
$305.60
per share of Class A common stock.
On February 5, 2013, the Company's Board of Directors approved a new share repurchase program authorizing the Company to repurchase up to
$2 billion
of its Class A common stock. The new share repurchase program will become effective at the completion of the Company's June 2012 Share Repurchase Program.
39
During the fourth quarter of
2012
, MasterCard repurchased a total of approximately
1.3 million
shares for
$613 million
at an average price of
$477.39
per share of Class A common stock. The Company’s repurchase activity during the fourth quarter of
2012
consisted of open market share repurchases and is summarized in the following table:
|
Period
|
Total Number
of Shares
Purchased
|
Average Price
Paid per Share
(including
commission cost)
|
Total Number of
Shares Purchased as
Part of Publicly
Announced Plans or
Programs
|
Dollar Value of
Shares that may yet
be Purchased under
the Plans or
Programs
1
|
||||||||||
|
October 1 – 31
|
354,333
|
|
$
|
462.34
|
|
354,333
|
|
$
|
1,053,264,319
|
|
||||
|
November 1 – 30
|
66,497
|
|
$
|
466.31
|
|
66,497
|
|
$
|
1,022,256,193
|
|
||||
|
December 1 – 31
|
862,706
|
|
$
|
484.43
|
|
862,706
|
|
$
|
604,334,421
|
|
||||
|
Total
|
1,283,536
|
|
$
|
477.39
|
|
1,283,536
|
|
|||||||
1
Dollar value of shares that may yet be purchased under the June 2012 Share Repurchase Program is as of the end of the period.
As of
January 25, 2013
, the cumulative repurchases by the Company under the June 2012 Share Repurchase Program totaled approximately
2.3 million
shares of its Class A common stock for an aggregate cost of approximately
$1.1 billion
at an average price of
$467.44
per share of Class A common stock.
Item 6.
Selected Financial Data
The statement of operations data presented below for the years ended December 31,
2012, 2011 and 2010
, and the balance sheet data as of December 31,
2012 and 2011
, were derived from the audited consolidated financial statements of MasterCard Incorporated included in Part II, Item 8 of this Report. The statement of operations data presented below for the years ended December 31,
2009
and
2008
, and the balance sheet data as of December 31,
2010
,
2009
and
2008
, were derived from audited consolidated financial statements not included in this Report. The data set forth below should be read in conjunction with, and are qualified by reference to, “Management's Discussion and Analysis of Financial Condition and Results of Operations” in Part II, Item 7 of this Report and our consolidated financial statements and notes thereto included in Part II, Item 8 of this Report.
|
Years Ended December 31,
|
||||||||||||||||||||
|
2012
|
2011
|
2010
|
2009
|
2008
|
||||||||||||||||
|
(in millions, except per share data)
|
||||||||||||||||||||
|
Statement of Operations Data:
|
||||||||||||||||||||
|
Revenues, net
|
$
|
7,391
|
|
$
|
6,714
|
|
$
|
5,539
|
|
$
|
5,099
|
|
$
|
4,992
|
|
|||||
|
Total operating expenses
|
3,454
|
|
4,001
|
|
2,787
|
|
2,839
|
|
5,526
|
|
||||||||||
|
Operating income (loss)
|
3,937
|
|
2,713
|
|
2,752
|
|
2,260
|
|
(534
|
)
|
||||||||||
|
Net income (loss) attributable to MasterCard
|
2,759
|
|
1,906
|
|
1,846
|
|
1,463
|
|
(254
|
)
|
||||||||||
|
Basic earnings (loss) per share
|
22.02
|
|
14.90
|
|
14.10
|
|
11.19
|
|
(1.94
|
)
|
||||||||||
|
Diluted earnings (loss) per share
|
21.94
|
|
14.85
|
|
14.05
|
|
11.16
|
|
(1.94
|
)
|
||||||||||
|
Balance Sheet Data:
|
||||||||||||||||||||
|
Total assets
|
$
|
12,462
|
|
$
|
10,693
|
|
$
|
8,837
|
|
$
|
7,470
|
|
$
|
6,476
|
|
|||||
|
Long-term debt
|
—
|
|
—
|
|
—
|
|
22
|
|
19
|
|
||||||||||
|
Obligations under litigation settlements, long-term
|
—
|
|
—
|
|
4
|
|
263
|
|
1,023
|
|
||||||||||
|
Equity
|
6,929
|
|
5,877
|
|
5,216
|
|
3,512
|
|
1,932
|
|
||||||||||
|
Cash dividends declared per share
|
1.20
|
|
0.60
|
|
0.60
|
|
0.60
|
|
0.60
|
|
||||||||||
* Note that table may not sum due to rounding.
40
Item 7.
Management’s Discussion and Analysis of Financial Condition and Results of Operations
The following discussion should be read in conjunction with the consolidated financial statements and notes of MasterCard Incorporated and its consolidated subsidiaries, including MasterCard International Incorporated (“MasterCard International”) (together, “MasterCard” or the “Company”), included elsewhere in this Report. Percentage changes provided throughout "Management’s Discussion and Analysis of Financial Condition and Results of Operations" were calculated on amounts rounded to the nearest thousand.
Non-GAAP Financial Information
Non-GAAP financial information is defined as a numerical measure of a company's performance that excludes or includes amounts so as to be different than the most comparable measure calculated and presented in accordance with accounting principles generally accepted in the United States (“GAAP”). Pursuant to the requirements of Regulation S-K, portions of this “Management's Discussion and Analysis of Financial Condition and Results of Operations” include a reconciliation of certain non-GAAP financial measures to the most directly comparable GAAP financial measures. The presentation of non-GAAP financial measures should not be considered in isolation or as a substitute for the Company's related financial results prepared in accordance with GAAP.
MasterCard presents non-GAAP financial measures to enhance an investor's evaluation of MasterCard's ongoing operating results and to facilitate meaningful comparison of its results between periods. MasterCard's management uses these non-GAAP financial measures to, among other things, evaluate its ongoing operations in relation to historical results, for internal planning and forecasting purposes and in the calculation of performance-based compensation. More specifically, the following non-GAAP financial measures are presented in Management’s Discussion and Analysis of Financial Condition and Results of Operations:
|
•
|
Total operating expenses excluding the provisions recorded in 2012 ($20 million) and 2011 ($770 million) for potential litigation settlements relating to U.S. merchant litigations (collectively referred to as the “MDL Provision”).
MasterCard excluded this item because MasterCard's management monitors provisions for material litigation settlements separately from ongoing operations and evaluates ongoing performance without these amounts. See "Operating Expenses" for the table that provides a reconciliation of operating expenses excluding the MDL Provision to the most directly comparable GAAP measure.
|
|
•
|
Effective income tax rate excluding the 2011 portion of the MDL Provision.
MasterCard excluded this item because MasterCard's management monitors provisions for material litigation settlements separately from ongoing operations and evaluates ongoing performance without these amounts. See "Income Taxes" for the table that provides a reconciliation of the effective income tax rate excluding the 2011 portion of the MDL Provision to the most directly comparable 2011 GAAP measure.
|
Overview
We recorded net income of
$2.8 billion
, or
$21.94
per diluted share in
2012
versus net income of
$1.9 billion
, or
$14.85
per diluted share in
2011
, and net income of
$1.8 billion
, or
$14.05
per diluted share in
2010
. Our 2011 net income was significantly impacted by the $770 million portion of the MDL Provision ($495 million after tax) recorded in 2011. In 2012, the Company increased the provision by $20 million ($13 million after tax).
In 2012, net revenue grew at
10%
compared to net revenue growth of
21%
in 2011. Revenue growth in both 2012 and 2011 was driven primarily by growth in the volume of transactions and the number of transactions. We generate revenues from the fees that we charge our customers for providing transaction processing and other payment-related services and by assessing our customers based primarily on the dollar volume of activity on the cards and other devices that carry our brands. In 2012, volume-based revenues (domestic assessments and cross-border volume fees) and transaction-based revenues (transaction processing fees) increased compared to 2011 by
13%
. In 2012, our processed transactions increased
25%
and our MasterCard branded gross dollar volume ("GDV") increased
15%
on a local currency basis. This compares to increased processed transactions of
18%
and increased GDV of
16%
on a local currency basis in 2011. Overall, net revenue growth for 2012 and 2011 was moderated by an increase in rebates and incentives relating to customer and merchant agreement activity. Rebates and incentives as a percentage of gross revenues were
27%
,
25%
and
27%
in 2012, 2011 and 2010, respectively.
We generated net cash flows from operations of
$2.9 billion
for the year ended December 31,
2012
, compared to
$2.7 billion
and
$1.7 billion
for the years ended December 31,
2011
and
2010
, respectively. Operating expenses in 2012 decreased
$547 million
, or
14%
, from 2011 and increased in 2011
$1.2 billion
, or
44%
, from 2010 primarily due to the 2011 portion of the MDL Provision.
41
The following table provides a summary of our operating results for the years ended December 31,
2012
,
2011
and
2010
:
|
|
For the Years Ended December 31,
|
Percent Increase (Decrease)
|
|||||||||||||
|
|
2012
|
2011
|
2010
|
2012
|
2011
|
||||||||||
|
|
(in millions, except per share data and percentages)
|
||||||||||||||
|
Revenues, net
|
$
|
7,391
|
|
$
|
6,714
|
|
$
|
5,539
|
|
10%
|
21%
|
||||
|
Operating expenses
|
3,454
|
|
4,001
|
|
2,787
|
|
(14)%
|
44%
|
|||||||
|
Operating income
|
3,937
|
|
2,713
|
|
2,752
|
|
45%
|
(1)%
|
|||||||
|
Operating margin
1
|
53.3
|
%
|
40.4
|
%
|
49.7
|
%
|
**
|
**
|
|||||||
|
Income tax expense
|
1,174
|
|
842
|
|
910
|
|
40%
|
(8)%
|
|||||||
|
Effective income tax rate
|
29.9
|
%
|
30.6
|
%
|
33.0
|
%
|
**
|
**
|
|||||||
|
Net Income Attributable to MasterCard
|
$
|
2,759
|
|
$
|
1,906
|
|
$
|
1,846
|
|
45%
|
3%
|
||||
|
Diluted Earnings per Share
|
$
|
21.94
|
|
$
|
14.85
|
|
$
|
14.05
|
|
48%
|
6%
|
||||
|
Diluted Weighted-Average Shares Outstanding
|
126
|
|
128
|
|
131
|
|
(2)%
|
(2)%
|
|||||||
** Not meaningful.
1
Operating margin is defined as operating income divided by Revenues, net. Our operating margin was negatively impacted by 1 percentage point and 12 percentage points for the years ended December 31, 2012 and 2011, respectively, due to the MDL Provision.
Business Environment
We process transactions from more than 210 countries and territories and in more than 150 currencies. Net revenue generated in the United States was
39%
,
40%
and
42%
of total net revenue in
2012
,
2011
and
2010
, respectively. No individual country, other than the United States, generated more than 10% of total revenues in any period, but differences in market growth, economic health, and foreign exchange fluctuations in certain countries have increased the proportion of revenues generated outside the United States over time. While the global nature of our business helps protect our operating results from adverse economic conditions in a single or a few countries, the significant concentration of our revenues generated in the United States makes our business particularly susceptible to adverse economic conditions in the United States.
The competitive and evolving nature of the global payments industry provides both challenges to and opportunities for the continued growth of our business. Unprecedented events which began during 2008 impacted the financial markets around the world, including continued distress in the credit environment, continued equity market volatility and additional government intervention. The economies of the United States and numerous countries around the world were significantly impacted by this economic turmoil. Countries have experienced credit ratings actions by ratings agencies, including several in Europe as well as the United States. In addition, some existing customers have been placed in receivership or administration or have a significant amount of their stock owned by their governments. Many financial institutions are facing increased regulatory and governmental influence, including potential further changes in laws and regulations. Many of our financial institution customers, merchants that accept our brands and cardholders who use our brands have been directly and adversely impacted.
MasterCard’s financial results may be negatively impacted by actions taken by individual financial institutions or by governmental or regulatory bodies. The condition of the economic environments may accelerate the timing of or increase the impact of risks to our financial performance. As a result, our revenue may be negatively impacted, or the Company may be impacted in several ways. MasterCard continues to monitor the extent and pace of economic recovery around the world to identify opportunities for the continued growth of our business and to evaluate the evolution of the global payments industry. For example, in our Asia Pacific and Latin American regions, we continue to see significant increases in dollar volume of activity on cards carrying our brands in those regions while in the United States and Europe we have experienced growth in dollar volume despite mixed economic indicators. Notwithstanding recent encouraging trends, the extent and pace of economic recovery in various regions remains uncertain and the overall business environment may present challenges for MasterCard to grow its business. For a full discussion see "Risk Factors - Business Risk" in Part I, Item 1A of this Report.
In addition, our business and our customers’ businesses are subject to regulation in many countries. Regulatory bodies may seek to impose rules and price controls on certain aspects of our business and the payments industry. See Note 18 (Legal and Regulatory Proceedings) to the consolidated financial statements included in Part II, Item 8 and our risk factor in "Risk Factors - Legal and Regulatory Risks" in Part I, Item 1A of this Report for further discussion. Further, information security risks for global payments and technology companies such as MasterCard have significantly increased in recent years. Although to date we have
42
not experienced any material impacts relating to cyber-attacks or other information security breaches, there can be no assurance that we will be immune to these risks and not suffer such losses in the future. See our risk factor in "Risk Factors - Business Risks" in Part I, Item 1A of this Report related to a failure or breach of our security systems or infrastructure as a result of cyber-attacks.
Impact of Foreign Currency Rates
Our overall operating results are impacted by changes in foreign currency exchange rates, especially the strengthening or weakening of the U.S. dollar versus the euro and Brazilian real. The functional currency of MasterCard Europe, our principal European operating subsidiary, is the euro, and the functional currency of our Brazilian subsidiary is the Brazilian real. Accordingly, the strengthening or weakening of the U.S. dollar versus the euro and Brazilian real impacts the translation of our European and Brazilian subsidiaries’ operating results into the U.S. dollar. For 2012 as compared to 2011, the US dollar strengthened against both the euro and the Brazilian real. For 2011 compared to 2010, the U.S. dollar weakened against both the euro and the Brazilian real. Accordingly, the net foreign currency impact of changes in the U.S. dollar average exchange rates against the euro and Brazilian real decreased net income in 2012 compared to 2011 by
7
percentage points. Conversely, net income in 2011 was positively impacted by currency by approximately
2
percentage points.
In addition, changes in foreign currency exchange rates directly impact the calculation of GDV and gross euro volume (“GEV”), which are used in the calculation of our domestic assessments, cross-border volume fees and volume related rebates and incentives. In most non-European regions, GDV is calculated based on local currency spending volume converted to U.S. dollars using average exchange rates for the period. In Europe, GEV is calculated based on local currency spending volume converted to euros using average exchange rates for the period. As a result, our domestic assessments, cross-border volume fees and volume related rebates and incentives are impacted by the strengthening or weakening of the U.S. dollar versus primarily non-European local currencies and the strengthening or weakening of the euro versus primarily European local currencies. The strengthening or weakening of the U.S. dollar is evident when GDV growth on a U.S. dollar converted basis is compared to GDV growth on a local currency basis. In 2012, GDV on a U.S. dollar converted basis increased
12%
, versus GDV growth on a local currency basis of
15%
. In 2011, GDV on a U.S. dollar converted basis increased
19%
, versus GDV growth on a local currency basis of
16%
. The Company attempts to manage these foreign currency exposures through its foreign exchange risk management activities, which are discussed further in Note 20 (Foreign Exchange Risk Management) to the consolidated financial statements included in Part II, Item 8 of this Report.
The Company generates revenues and has financial assets in countries at risk for currency devaluation. While these revenues and financial assets are not material to MasterCard on a consolidated basis, they could be negatively impacted if a devaluation of local currencies occurs relative to the U.S. dollar.
Acquisitions
On April 15, 2011, MasterCard acquired the prepaid card program management operations of Travelex Holdings Ltd., since renamed Access Prepaid Worldwide (“Access”), at a purchase price of 295 million U.K. pound sterling, or $481 million, including adjustments for working capital, with contingent consideration (an “earn-out”) of up to an additional 35 million U.K. pound sterling, or approximately $57 million, if certain performance targets were met. See Note 2 (Acquisitions) to the consolidated financial statements included in Part II, Item 8 of this Report. Through Access, MasterCard manages and delivers consumer and corporate prepaid travel cards through business partners around the world, including financial institutions, retailers, travel agents and foreign exchange bureaus. Access has enabled MasterCard to offer end-to-end prepaid card solutions encompassing branded switching, issuer processing and program management services, primarily focused on the travel sector and in markets outside the United States.
On October 22, 2010, MasterCard acquired all the outstanding shares of DataCash Group plc (“DataCash”), a payment service provider with operations in Europe and Brazil, at a purchase price of 334 million U.K. pound sterling, or $534 million. DataCash provides e-commerce merchants with the ability to process secure payments across the world. DataCash develops and provides outsourced electronic payments solutions, fraud prevention, alternative payment options, back-office reconciliation and solutions for merchants selling via multiple channels. MasterCard believes the acquisition of DataCash creates a long-term growth platform in the e-commerce category while enhancing existing MasterCard payment products and expanding its global presence in the internet gateway business.
43
Financial Results
Revenues
Revenue Description
MasterCard’s business model involves four participants in addition to us: cardholders, merchants, issuers (the cardholders’ financial institutions) and acquirers (the merchants’ financial institutions). Our gross revenues are typically based on the volume of activity on cards and other devices that carry our brands, the number of transactions we process for our customers or the nature of other payment-related services we provide to our customers. Our revenues are based upon transactional information accumulated by our systems or reported by our customers. Our primary revenue billing currencies are the U.S. dollar, euro and Brazilian real.
Our pricing is complex and is dependent on the nature of the volumes, types of transactions and other products and services we offer to our customers. The following factors impact pricing:
|
•
|
Domestic or cross-border
|
|
•
|
Signature-based (credit and debit) or PIN-based (debit, including automated teller machine (“ATM”) cash withdrawals and retail purchases)
|
|
•
|
Tiered rates that fluctuate based on volume/transaction hurdles
|
|
•
|
Geographic region or country
|
|
•
|
Retail purchase or cash withdrawal
|
|
•
|
Processed or not processed by MasterCard
|
In general, a cross-border transaction generates higher revenue than a domestic transaction since cross-border fees are higher than domestic fees, and in most cases also include fees for currency conversion.
We review our pricing and implement pricing changes on an ongoing basis. In addition, standard pricing varies among our regions, and such standard pricing can be modified for our customers through customer-specific incentive and rebate agreements.
The Company classifies its net revenues into the following five categories:
|
1.
|
Domestic assessments:
Domestic assessments are fees charged to issuers and acquirers based primarily on the volume of activity on cards and other devices that carry our brands where the merchant country and the issuer country are the same. A portion of these assessments is estimated based on aggregate transaction information collected from our systems and projected customer performance and is calculated by converting the aggregate volume of usage (purchases, cash disbursements, balance transfers and convenience checks) from local currency to the billing currency and then multiplying by the specific price. In addition, domestic assessments include items such as card assessments, which are fees charged on the number of cards issued or assessments for specific purposes, such as acceptance development or market development programs. Acceptance development fees are charged primarily to U.S. issuers based on components of volume, and support our focus on developing merchant relationships and promoting acceptance at the point of sale. Market development fees are charged primarily to issuers and acquirers based on components of volume, and support our focus on building brand awareness and card activation, increasing purchase volumes, cross-border card usage, and other general marketing purposes.
|
|
2.
|
Cross-border volume fees:
Cross-border volume fees are charged to issuers and acquirers based on the volume of activity on cards that carry our brands where the merchant country and the issuer country are different. Cross-border volume fees are calculated by converting the aggregate volume of usage (purchases and cash disbursements) from local currency to the billing currency and then multiplying by the specific price. Cross-border volume fees also include fees charged to issuers for performing currency conversion services.
|
44
|
3.
|
Transaction processing fees:
Transaction processing fees are charged for both domestic and cross-border transactions and are primarily based on the number of transactions. These fees are calculated by multiplying the number and type of transactions by the specific price for each service. Transaction processing fees include charges for the following:
|
|
•
|
Transaction Switching – Authorization, Clearing and Settlement.
|
|
◦
|
Authorization
refers to the process by which a transaction is routed to the issuer for approval and then a decision whether or not to approve the transaction is made by the issuer or, in certain circumstances such as when the issuer's systems are unavailable or cannot be contacted, by MasterCard or others on behalf of the issuer in accordance with either the issuer's instructions or applicable rules (also known as "stand-in"). Our standards, which may vary across regions, establish the circumstances under which merchants and acquirers must seek authorization of transactions. Fees for authorization are primarily paid by issuers.
|
|
◦
|
Clearing
refers to the exchange of financial transaction information between issuers and acquirers after a transaction has been successfully conducted at the point of interaction. MasterCard clears transactions among customers through our central and regional processing systems. Fees for clearing are primarily paid by issuers.
|
|
◦
|
Settlement.
Once transactions have been authorized and cleared, MasterCard helps to settle the transactions by facilitating the exchange of funds between parties. Once clearing is completed, a daily reconciliation is provided to each customer involved in settlement, detailing the net amounts by clearing cycle and a final settlement position. Fees for settlement are primarily paid by issuers.
|
|
•
|
Connectivity fees
are charged to issuers and acquirers for network access, equipment and the transmission of authorization and settlement messages. These fees are based on the size of the data being transmitted through and the number of connections to the Company’s network.
|
|
4.
|
Other revenues:
Other revenues for other payment-related services are primarily dependent on the nature of the products or services provided to our customers but are also impacted by other factors, such as contractual agreements. Examples of other revenues are fees associated with the following:
|
|
•
|
Fraud products and services
used to prevent or detect fraudulent transactions. This includes warning bulletin fees which are charged to issuers and acquirers for listing invalid or fraudulent accounts either electronically or in paper form and for distributing this listing to merchants.
|
|
•
|
Cardholder services fees
are for benefits provided with MasterCard-branded cards, such as insurance, telecommunications assistance for lost cards and locating ATMs.
|
|
•
|
Consulting and research fees
are primarily generated by MasterCard Advisors, the Company’s professional advisory services group. The Company’s business agreements with certain customers and merchants may include consulting services as an incentive.
|
|
•
|
Program management services
provided to prepaid card issuers. This primarily includes foreign exchange margin, commissions, load fees, and ATM withdrawal fees paid by cardholders on the sale and encashment of prepaid cards. See Note 2 (Acquisitions) to the consolidated financial statements included in Part II, Item 8 of this Report for further discussion
.
|
|
•
|
The Company also charges for a variety of other payment-related services, including rules compliance, account and transaction enhancement services, holograms and publications.
|
|
5.
|
Rebates and incentives (contra-revenue):
Rebates and incentives are provided to certain MasterCard customers and are recorded as contra-revenue in the same period that revenue is earned or performance occurs. Performance periods vary depending on the type of rebate or incentive, including commitments to the agreement term, hurdles for volumes, transactions or issuance of new cards, launch of new programs, or the execution of marketing programs. Rebates and incentives are calculated based on estimated performance, the timing of new and renewed agreements and the terms of the related business agreements.
|
Revenue Analysis
In
2012
and
2011
, gross revenues increased
$1.2
billion and
$1.4
billion, or
13%
and
18%
, respectively. Revenue growth in 2012 and 2011 was primarily due to increased dollar volume of activity on cards carrying our brands and increased transactions.
45
Rebates and incentives in
2012
and
2011
increased
$488
million and
$202
million, or
22%
and
10%
, versus
2011
and
2010
, respectively. Our net revenues in
2012
and
2011
increased
10%
and
21%
versus
2011
and
2010
, respectively.
Our revenues are primarily based on transactions and volumes, which are driven by the number of transactions and the dollar volume of activity on cards and other devices carrying our brands. In
2012
, our processed transactions increased
25%
and our GDV increased
15%
on a local currency basis. In
2011
, our processed transactions increased
18%
and our GDV increased
16%
on a local currency basis. The acquisitions of Access and DataCash contributed approximately
3%
to our net revenue growth in 2011. There was no significant impact on net revenue growth in 2012 from additional acquisitions. The effects of pricing actions implemented in 2012 and 2011 contributed approximately
3
and
2
percentage points to our net revenue growth for 2012 and 2011, respectively.
The following table provides a summary of the trend in volume growth:
|
Years Ended December 31,
|
||||||||||||
|
2012
|
2011
|
|||||||||||
|
Growth (USD)
|
Growth (Local)
|
Growth (USD)
|
Growth (Local)
|
|||||||||
|
MasterCard Branded GDV
1
|
12
|
%
|
15
|
%
|
19
|
%
|
16
|
%
|
||||
|
Asia Pacific/Middle East/Africa
|
21
|
%
|
23
|
%
|
31
|
%
|
23
|
%
|
||||
|
Canada
|
7
|
%
|
8
|
%
|
12
|
%
|
7
|
%
|
||||
|
Europe
|
9
|
%
|
16
|
%
|
21
|
%
|
17
|
%
|
||||
|
Latin America
|
9
|
%
|
19
|
%
|
25
|
%
|
23
|
%
|
||||
|
United States
|
9
|
%
|
9
|
%
|
10
|
%
|
10
|
%
|
||||
|
Cross-border GDV Growth
|
16
|
%
|
19
|
%
|
||||||||
1
GDV generated by Maestro and Cirrus cards is not included in the measurement of the growth rate.
A significant portion of our revenue is concentrated among our five largest customers. In 2012, the net revenues from these customers were approximately
$1.8 billion
, or
24%
, of total net revenues. The loss of any of these customers or their significant card programs could adversely impact our revenues. In addition, as part of our business strategy, MasterCard, among other efforts, enters into business agreements with customers. These agreements can be terminated in a variety of circumstances. See our risk factor in "Risk Factor - Business Risks" in Part I, Item 1A of this Report for further discussion.
The significant components of our net revenues for the years ended December 31,
2012
,
2011
and
2010
were as follows:
|
|
For the Years Ended December 31,
|
Percent Increase (Decrease)
|
|||||||||||||
|
|
2012
|
2011
|
2010
|
2012
|
2011
|
||||||||||
|
|
(in millions, except percentages)
|
||||||||||||||
|
Domestic assessments
|
$
|
3,586
|
|
$
|
3,246
|
|
$
|
2,642
|
|
10%
|
23%
|
||||
|
Cross-border volume fees
|
2,343
|
|
2,094
|
|
1,927
|
|
12%
|
9%
|
|||||||
|
Transaction processing fees
|
3,017
|
|
2,595
|
|
2,198
|
|
16%
|
18%
|
|||||||
|
Other revenues
|
1,154
|
|
1,000
|
|
791
|
|
15%
|
26%
|
|||||||
|
Gross revenues
|
10,100
|
|
8,935
|
|
7,558
|
|
13%
|
18%
|
|||||||
|
Rebates and incentives (contra-revenues)
|
(2,709
|
)
|
(2,221
|
)
|
(2,019
|
)
|
22%
|
10%
|
|||||||
|
Net revenues
|
$
|
7,391
|
|
$
|
6,714
|
|
$
|
5,539
|
|
10%
|
21%
|
||||
46
The following table summarizes the primary drivers of net revenue growth in 2012 versus 2011 and 2011 versus 2010:
|
For the Years Ended December 31,
|
|||||||||||||||||||||||||||||
|
Volume
|
Pricing
|
Foreign Currency
1
|
Other
|
Total Growth
|
|||||||||||||||||||||||||
|
2012
|
2011
|
2012
|
2011
|
2012
|
2011
|
2012
|
2011
|
2012
|
2011
|
||||||||||||||||||||
|
Domestic assessments
|
14
|
%
|
15
|
%
|
2
|
%
|
5
|
%
|
(3
|
)%
|
2
|
%
|
(3
|
)%
|
1
|
%
|
10
|
%
|
23
|
%
|
|||||||||
|
Cross-border volume fees
|
15
|
%
|
19
|
%
|
2
|
%
|
(11
|
)%
|
2
|
(3
|
)%
|
1
|
%
|
(2
|
)%
|
—
|
%
|
12
|
%
|
9
|
%
|
||||||||
|
Transaction processing fees
|
21
|
%
|
16
|
%
|
3
|
%
|
(1
|
)%
|
(3
|
)%
|
2
|
%
|
(5
|
)%
|
3
|
1
|
%
|
16
|
%
|
18
|
%
|
||||||||
|
Other revenues
|
**
|
|
**
|
|
4
|
%
|
3
|
%
|
(3
|
)%
|
2
|
%
|
14
|
%
|
4
|
21
|
%
|
4
|
15
|
%
|
26
|
%
|
|||||||
|
Rebates and incentives
|
10
|
%
|
13
|
%
|
1
|
%
|
(11
|
)%
|
2
|
(3
|
)%
|
1
|
%
|
14
|
%
|
5
|
7
|
%
|
5
|
22
|
%
|
10
|
%
|
||||||
** Not applicable
1
Reflects translation from the euro and Brazilian real to the U.S. dollar.
2
These decreases were due to pricing changes related to the pricing structure change implemented in October 2010.
3
Includes a negative 3% impact from product mix in 2012 compared to 2011.
4
Other revenues were positively impacted by acquisitions (3 percentage points in 2012 and 13 percentage points in 2011) and increased consulting fees, fraud service fees and other payment-related services in 2012 and 2011.
5
Rebates and incentives, other includes the impact from new and renewed agreements and reductions from terminated and expired agreements.
Operating Expenses
Our operating expenses are comprised of general and administrative, advertising and marketing, depreciation and amortization expenses, and in 2012 and 2011, the respective amounts recorded for the MDL Provision. Operating expenses decreased in 2012 by
$547 million
, or
14%
, primarily due to the
$770 million
portion of the MDL Provision recorded in 2011 (versus the
$20 million
portion of the MDL Provision recorded in 2012). Operating expenses increased
$1.2 billion
, or
44%
in 2011, compared to 2010, primarily due to the
$770 million
portion of the MDL Provision and higher general and administrative expenses, including expenses related to recent acquisitions. Excluding the impact of the MDL Provision, operating expenses increased $203 million, or 6%, in 2012 compared to 2011 and $445 million, or 16%, in 2011 compared to 2010. Acquisitions contributed approximately 6 percentage points to the increase in operating expenses in 2011.
The following table compares and reconciles operating expenses, excluding the annual portion of the MDL Provision, which is a non-GAAP financial measure, to the operating expenses including the annual portion of the MDL Provision, which is the most directly comparable GAAP measurement. Management believes this analysis facilitates understanding of our ongoing operating expenses and allows for a more meaningful comparison between periods.
|
For the year ended December 31, 2012
|
For the year ended December 31, 2011
|
|||||||||||||||||||||||
|
Actual
|
MDL Provision
|
Non-GAAP
|
Actual
|
MDL Provision
|
Non-GAAP
|
|||||||||||||||||||
|
(in millions, except percentages)
|
||||||||||||||||||||||||
|
General and administrative
|
$
|
2,429
|
|
$
|
—
|
|
$
|
2,429
|
|
$
|
2,196
|
|
$
|
—
|
|
$
|
2,196
|
|
||||||
|
Advertising and marketing
|
775
|
|
—
|
|
775
|
|
841
|
|
—
|
|
841
|
|
||||||||||||
|
Provision for litigation settlement
|
20
|
|
(20
|
)
|
—
|
|
770
|
|
(770
|
)
|
—
|
|
||||||||||||
|
Depreciation and amortizaton
|
230
|
|
—
|
|
230
|
|
194
|
|
—
|
|
194
|
|
||||||||||||
|
Total operating expenses
|
$
|
3,454
|
|
$
|
(20
|
)
|
$
|
3,434
|
|
$
|
4,001
|
|
$
|
(770
|
)
|
$
|
3,231
|
|
||||||
|
Total operating expenses as a percentage of net revenues
|
46.7
|
%
|
46.5
|
%
|
59.6
|
%
|
48.1
|
%
|
||||||||||||||||
General and Administrative
General and administrative expenses increased
$233 million
, or
11%
in 2012, compared to 2011, primarily driven by increased personnel costs, the net impact of currency hedging activities and the remeasurement of financial assets denominated in a currency other than the functional currency of the entity holding those assets. General and administrative expenses increased in 2011, compared to 2010, by
$339 million
, or
18%
, primarily due to increases related to acquisitions, primarily in personnel and other expenses. The net impact of foreign currency relating to the translation of general and administrative expenses from our functional currencies to U.S. dollars reduced general and administrative expenses by approximately
2
percentage points in 2012, and increased general and administrative expenses by approximately
1
percentage point in 2011.
47
The major components of general and administrative expenses for the years ended
December 31, 2012
,
2011
and
2010
were as follows:
|
|
For the Years Ended December 31,
|
Percent Increase (Decrease)
|
|||||||||||||
|
|
2012
|
2011
|
2010
|
2012
|
2011
|
||||||||||
|
|
(in millions, except percentages)
|
||||||||||||||
|
Personnel
|
$
|
1,565
|
|
$
|
1,453
|
|
$
|
1,219
|
|
8%
|
19%
|
||||
|
Professional fees
|
237
|
|
235
|
|
204
|
|
1%
|
15%
|
|||||||
|
Data processing and telecommunications
|
201
|
|
171
|
|
147
|
|
18%
|
16%
|
|||||||
|
Foreign exchange activity
|
27
|
|
(13
|
)
|
3
|
|
**
|
**
|
|||||||
|
Other
|
399
|
|
350
|
|
284
|
|
14%
|
23%
|
|||||||
|
General and administrative expenses
|
$
|
2,429
|
|
$
|
2,196
|
|
$
|
1,857
|
|
11%
|
18%
|
||||
** Not meaningful
|
•
|
Personnel expense increased
8%
in 2012 compared to 2011 and
19%
in 2011 compared to 2010. The increase in 2012 was primarily due to higher salary and benefit costs, including increased compensation related to an increase in the number of employees to support the Company's strategic initiatives, partially offset by lower incentive payments to employees and a higher amount of capitalized costs related to software development activities compared to 2011. The increase in 2011 compared to 2010 was primarily due to higher salary costs, incentives and benefits costs, including increased compensation related to an increase in the number of employees to support the Company's strategic initiatives, including recent acquisitions.
|
|
•
|
Professional fees consist primarily of third-party consulting services, legal costs to defend our outstanding litigation and the evaluation of regulatory developments that impact our industry and brand. Professional fees increased
1%
in 2012 versus 2011. Professional fees increased
15%
in 2011 versus 2010 primarily due to the legal costs related to regulatory developments, consulting expenses associated with recent acquisitions and other strategic initiatives.
|
|
•
|
Data processing and telecommunication expense consists of expenses to support our global payments network infrastructure, expenses to operate and maintain our computer systems and other telecommunication needs. These expenses vary with business volume growth, system upgrades and usage.
|
|
•
|
Other expenses include loyalty and rewards solutions, travel and entertainment, rental expense for our facilities, litigation settlements not related to the MDL Provision and other miscellaneous operating expenses. The change in other expenses in 2012 compared to 2011 was primarily due to increased costs related to loyalty and rewards solutions and the acquisition of Access in 2011. The 2011 increase in other expenses versus 2010 was primarily due to increased operational expenses in connection with the Company's strategic initiatives, including the 2011 acquisition of Access.
|
Advertising and Marketing
Our brands, principally MasterCard, are valuable strategic assets that drive acceptance and usage of our products and facilitate our ability to successfully introduce new service offerings and access new markets globally. Our advertising and marketing strategy is to increase global MasterCard brand visibility, usage and overall preference among cardholders globally through brand advertising, promotions, sponsorships, and digital, mobile and social media initiatives on a global scale. We will continue to invest in marketing programs at the regional and local levels and sponsor diverse events aimed at multiple target audiences. In 2012, advertising and marketing expenses decreased
$66 million
, or
8%
, mainly due to the non-recurrence of certain promotions and the impact of changes in foreign currency rates. Advertising and marketing expenses increased
$59 million
, or
8%
, in 2011 mainly due to sponsorships and promotional initiatives. The net impact of foreign currency relating to the translation of advertising and marketing expenses from our functional currencies to U.S. dollars decreased advertising and marketing expenses by approximately
3
percentage points in 2012, and increased advertising and marketing expense by
2
percentage points in 2011.
Provision for Litigation Settlement
As of December 31, 2012, the accrued litigation for the Company's MDL Provision was
$726 million
versus
$770 million
as of December 31, 2011. During 2012, the accrued litigation for the MDL Provision decreased due to the payment of
$64 million
to individual merchant plaintiffs, partially offset by an increase of $20 million related to the U.S. merchant class litigation. On December 10, 2012, the Company (in accordance with the settlement agreement) paid
$726 million
into an escrow account to
48
fund future settlement payments to the class merchants. There were no comparable charges in 2010. See Note 18 (Legal and Regulatory Proceedings) to the consolidated financial statements included in Part II, Item 8 of this Report for further discussion.
Depreciation and Amortization
Depreciation and amortization expenses increased
$36 million
, or
18%
, in 2012 and $46 million, or 31%, in 2011. The increase in depreciation and amortization expense in both 2012 and 2011 is primarily due to increased amortization of capitalized software costs.
Other Income (Expense)
Other income (expense) was comprised primarily of investment income, interest expense, our share of income (losses) from equity method investments and other gains and losses. The decrease of total other income (expense) in 2012 versus 2011 of
$38 million
was primarily due to lower investment income, increased expenses from investments in joint ventures and an adjustment to the earnout related to the Company's acquisition of Access in 2011 (see Note 2 (Acquisitions) to the consolidated financial statements included in Part II, Item 8 of this Report). The increase of total other income in 2011 versus 2010 was primarily due to a decrease in the interest accretion on litigation settlements and an adjustment to the earnout related to the Company's acquisition of Access, partially offset by expenses from equity method investments.
Income Taxes
The effective income tax rates for the years ended
December 31, 2012
,
2011
and
2010
were
29.9%
,
30.6%
and
33.0%
, respectively. The effective tax rate for 2012 was lower than the effective tax rate for 2011 primarily due to discrete benefits related to additional export incentives and the conclusion of tax examinations in certain jurisdictions, as well as a larger benefit from the domestic production activities deduction in the U.S. related to our authorization software. The effective tax rate for 2011 was lower than the effective tax rate for 2010 primarily due to a more favorable geographic mix of earnings, including the tax benefit related to the 2011 portion of the MDL Provision, and the recognition of discrete adjustments in 2011.
The provision for income taxes differs from the amount of income tax determined by applying the U.S. federal statutory income tax rate of
35%
to pretax income for the years ended
December 31
, as a result of the following:
|
For the years ended December 31,
|
|||||||||||||||||||||
|
2012
|
2011
|
2010
|
|||||||||||||||||||
|
Amount
|
Percent
|
Amount
|
Percent
|
Amount
|
Percent
|
||||||||||||||||
|
(in millions, except percentages)
|
|||||||||||||||||||||
|
Income before income tax expense
|
$
|
3,932
|
|
$
|
2,746
|
|
$
|
2,757
|
|
||||||||||||
|
|
|
|
|||||||||||||||||||
|
Federal statutory tax
|
1,376
|
|
35.0
|
%
|
961
|
|
35.0
|
%
|
965
|
|
35.0
|
%
|
|||||||||
|
State tax effect, net of federal benefit
|
23
|
|
0.6
|
%
|
14
|
|
0.5
|
%
|
19
|
|
0.7
|
%
|
|||||||||
|
Foreign tax effect
|
(175
|
)
|
(4.4
|
)%
|
(133
|
)
|
(4.9
|
)%
|
(24
|
)
|
(0.9
|
)%
|
|||||||||
|
Non-deductible expenses and other differences
|
(21
|
)
|
(0.5
|
)%
|
34
|
|
1.2
|
%
|
23
|
|
0.9
|
%
|
|||||||||
|
Tax exempt income
|
(2
|
)
|
(0.1
|
)%
|
(3
|
)
|
(0.1
|
)%
|
(5
|
)
|
(0.2
|
)%
|
|||||||||
|
Foreign repatriation
|
(27
|
)
|
(0.7
|
)%
|
(31
|
)
|
(1.1
|
)%
|
(68
|
)
|
(2.5
|
)%
|
|||||||||
|
Income tax expense
|
$
|
1,174
|
|
29.9
|
%
|
$
|
842
|
|
30.6
|
%
|
$
|
910
|
|
33.0
|
%
|
||||||
The Company's GAAP effective tax rate for 2011 was affected by the tax benefits related to the 2011 portion of the MDL Provision. Due to the nature of this item, the Company believes that the calculation of the 2011 effective tax rate excluding the impact of the MDL Provision facilitates meaningful comparison of the effective tax rate for 2011. The effective tax rate was
29.9%
in 2012 including and excluding the portion of the MDL Provision recorded in 2012.
|
GAAP to Non-GAAP effective tax rate reconciliation
|
|||||||||||
|
For the year ended December, 31 2011
|
|||||||||||
|
Actual
|
MDL Provision
|
Non-GAAP
|
|||||||||
|
(in millions, except percentages)
|
|||||||||||
|
Income before income taxes
|
$
|
2,746
|
|
$
|
770
|
|
$
|
3,516
|
|
||
|
Income tax expense
|
(842
|
)
|
(275
|
)
|
(1,117
|
)
|
|||||
|
Loss attributable to non-controlling interests
|
2
|
|
—
|
|
2
|
|
|||||
|
Net income attributable to MasterCard
|
$
|
1,906
|
|
$
|
495
|
|
$
|
2,401
|
|
||
|
Effective tax rate
|
30.6
|
%
|
|
|
31.8
|
%
|
|||||
49
During 2012, the Company's unrecognized tax benefits related to tax positions taken during the current and prior periods increased by
$43 million
. The increase in the Company's unrecognized tax benefits for 2012 is primarily due to judgments related to current year tax positions. As of December 31, 2012, the Company's unrecognized tax benefits related to positions taken during the current and prior period were
$257 million
, all of which would reduce the Company's effective tax rate if recognized.
In 2010, in connection with the expansion of the Company's operations in the Asia Pacific, Middle East and Africa region, the Company's subsidiary in Singapore, MasterCard Asia Pacific Pte. Ltd. (“MAPPL”), received an incentive grant from the Singapore Ministry of Finance. See Note 17 (Income Taxes) to the consolidated financial statements included in Part II, Item 8 of this Report for further discussion.
Liquidity and Capital Resources
We need liquidity and access to capital to fund our global operations, to provide for credit and settlement risk, to finance capital expenditures, to make continued investments in our business and to service our current and potential obligations. The Company generates the cash required to meet these needs through operations. The following table summarizes our cash provided by operating activities during the fiscal years presented, as well as the cash, cash equivalents and investment securities balances and credit available to the Company at December 31:
|
Years Ended December 31,
|
||||||||||||
|
2012
|
2011
|
2010
|
||||||||||
|
|
(in millions, except per share data)
|
|||||||||||
|
Net cash provided by operating activities
|
$
|
2,948
|
|
$
|
2,684
|
|
$
|
1,697
|
|
|||
|
Cash, cash equivalents and available-for-sale investment securities
1
|
5,003
|
|
4,949
|
|
3,898
|
|
||||||
|
Unused line of credit
2
|
3,000
|
|
2,750
|
|
2,750
|
|
||||||
1
The 2012 balance excludes
$726 million
held in escrow to fund the Company's share of the U.S. merchant class litigation.
2
The Company did not use any funds from the line of credit during the periods presented, except for business continuity planning and related purposes.
The increase in net cash provided by operations is primarily due to increases in net income in 2012 and 2011. Cash, cash equivalents and available-for-sale investment securities held by our foreign subsidiaries (i.e., any entities where earnings would be subject to U.S. tax upon repatriation) was
$2.5 billion
and
$1.8 billion
at
December 31, 2012
and
2011
, respectively, or
50%
and
37%
of our total cash, cash equivalents and available-for-sale investment securities as of such dates. It is our present intention to permanently reinvest the undistributed earnings associated with our foreign subsidiaries as of
December 31, 2012
outside of the United States (as disclosed in Note 17 (Income Tax) to the consolidated financial statements included in Part II, Item 8 of this Report), and our current plans do not require repatriation of these earnings. If these earnings are needed for U.S operations or can no longer be permanently reinvested outside of the United States, the Company would be subject to U.S. tax upon repatriation.
Our liquidity and access to capital could be negatively impacted by global credit market conditions. The Company guarantees the settlement of many of the MasterCard, Cirrus and Maestro branded transactions between our issuers and acquirers. See Note 19 (Settlement and Other Risk Management) to the consolidated financial statements in Part II, Item 8 of this Report for a description of these guarantees. Historically, payments under these guarantees have not been significant; however, historical trends may not be an indication of the future. The risk of loss on these guarantees is specific to individual customers, but may also be driven significantly by regional or global economic conditions, including, but not limited to the health of the financial institutions in a country or region.
Our liquidity and access to capital could also be negatively impacted by the outcome of any of the legal or regulatory proceedings to which we are a party. See our risk factor in "Risk Factors - Legal and Regulatory Risks" in Part I, Item 1A and Note 18 (Legal and Regulatory Proceedings) to the consolidated financial statements included in Part II, Item 8 of this Report; and Part II, Item 7 (Business Environment) of this Report for additional discussion of these and other risks facing our business.
50
Cash Flow
The table below shows a summary of the cash flows from operating, investing and financing activities for the years ended December 31:
|
|
2012
|
2011
|
2010
|
||||||||
|
|
(in millions)
|
||||||||||
|
Cash Flow Data:
|
|
||||||||||
|
Net cash provided by operating activities
|
$
|
2,948
|
|
$
|
2,684
|
|
$
|
1,697
|
|
||
|
Net cash used in investing activities
|
(2,839
|
)
|
(748
|
)
|
(641
|
)
|
|||||
|
Net cash (used in) provided by financing activities
|
(1,798
|
)
|
(1,215
|
)
|
19
|
|
|||||
The table below shows a summary of the balance sheet data at December 31:
|
2012
|
2011
|
2010
|
|||||||||
|
(in millions)
|
|||||||||||
|
Balance Sheet Data:
|
|||||||||||
|
Current assets
|
$
|
9,357
|
|
$
|
7,741
|
|
$
|
6,454
|
|
||
|
Current liabilities
|
4,906
|
|
4,217
|
|
3,143
|
|
|||||
|
Long-term liabilities
|
627
|
|
599
|
|
478
|
|
|||||
|
Equity
|
6,929
|
|
5,877
|
|
5,216
|
|
|||||
Net cash provided by operating activities for the
year ended December 31, 2012
was
$2.9 billion
versus
$2.7 billion
for the comparable period in
2011
. Net cash provided by operating activities for the year ended December 31, 2012 was primarily due to net income. Net cash provided by operating activities for the year ended December 31, 2011 was primarily due to net income and the increase in accrued litigation related to the
$770 million
portion of the MDL Provision, partially offset by litigation settlement payments of
$303 million
.
Net cash used in investing activities for the year ended December 31, 2012 was primarily related to purchases of investment securities and the payment related to U.S. merchant class litigations into escrow, partially offset by net proceeds from sales and maturities of investment securities. Net cash used in investing activities for the year ended December 31, 2011 was primarily related to purchases of investment securities, the acquisition of Access and expenditures for our global payments network, partially offset by net proceeds from sales and maturities of investment securities.
Net cash used in financing activities for the years ended December 31, 2012 and 2011 primarily related to the repurchase of the Company’s Class A common stock and dividend payments to our stockholders.
The Company believes that its existing cash, cash equivalents and investment securities balances, its cash flow generating capabilities, its borrowing capacity and its access to capital resources are sufficient to satisfy its future operating cash needs, capital asset purchases, outstanding commitments and other liquidity requirements associated with its existing operations and potential obligations.
Credit Availability
On November 16, 2012, the Company entered into a committed five-year unsecured
$3 billion
revolving credit facility (the “Credit Facility”), which expires on November 16, 2017. The Credit Facility replaced the Company's prior credit facility. Borrowings under the Credit Facility are available to provide liquidity for general corporate purposes, including providing liquidity in the event of one or more settlement failures by the Company's customers. In addition, for business continuity planning and related purposes, we may borrow and repay amounts under the Credit Facility from time to time. The facility fee and borrowing cost under the Credit Facility are contingent upon the Company's credit rating. At December 31, 2012, the applicable facility fee was 10 basis points on the average daily commitment (whether or not utilized). In addition to the facility fee, interest on borrowings under the Credit Facility would be charged at the London Interbank Offered Rate (LIBOR) plus an applicable margin of 90 basis points, or an alternative base rate. MasterCard had no borrowings under the Credit Facility or prior credit facility at December 31, 2012 and 2011.
The Credit Facility contains customary representations, warranties, events of default and affirmative and negative covenants, including a financial covenant limiting the maximum level of consolidated debt to earnings before interest, taxes, depreciation and amortization. MasterCard was in compliance in all material respects with the covenants of the Credit Facility and prior credit facility at December 31, 2012 and 2011. The majority of Credit Facility lenders are customers or affiliates of customers of MasterCard.
51
On August 2, 2012, the Company filed a universal shelf registration statement to provide additional access to capital, if needed. Pursuant to the shelf registration statement, the Company may from time to time offer to sell debt securities, preferred stock, Class A common stock, depository shares, purchase contracts, units or warrants in one or more offerings.
Dividends and Share Repurchases
MasterCard has historically paid quarterly dividends on its outstanding Class A common stock and Class B common stock. Subject to legally available funds, we intend to continue to pay a quarterly cash dividend. However, the declaration and payment of future dividends is at the sole discretion of our Board of Directors after taking into account various factors, including our financial condition, operating results, available cash and current and anticipated cash needs. The following table summarizes the annual, per share dividends paid in the years reflected:
|
Years Ended December 31,
|
|||||||||||||
|
2012
|
2011
|
2010
|
|||||||||||
|
(in millions, except per share data)
|
|||||||||||||
|
Cash dividend, per share
|
$
|
1.05
|
|
$
|
0.60
|
|
$
|
0.60
|
|
||||
|
Cash dividends paid
|
$
|
132
|
|
$
|
77
|
|
$
|
79
|
|
||||
On December 4, 2012, our Board of Directors declared a quarterly cash dividend of $0.30 per share paid on February 8, 2013 to holders of record on January 9, 2013 of our Class A common stock and Class B common stock. The aggregate amount of this dividend was
$37 million
.
On February 5, 2013, our Board of Directors declared a quarterly cash dividend of $0.60 per share payable on May 9, 2013 to holders of record on April 9, 2013 of our Class A common stock and Class B common stock. The aggregate amount of this dividend is estimated to be $74 million.
Shares in the Company's common stock that are repurchased are considered treasury stock. The timing and actual number of additional shares repurchased will depend on a variety of factors, including the operating needs of the business, legal requirements, price, and economic and market conditions. The following table summarizes the Company's share repurchase authorizations of its Class A common stock through December 31, 2012, as well as historical purchases:
|
Authorization Dates
|
||||||||||||
|
|
June 2012
|
April 2011
1
|
Total
|
|||||||||
|
(in millions, except average price data)
|
||||||||||||
|
Board authorization
|
$
|
1,500
|
|
$
|
2,000
|
|
$
|
3,500
|
|
|||
|
Remaining authorization at December 31, 2011
|
**
|
|
$
|
852
|
|
$
|
852
|
|
||||
|
Dollar-value of shares repurchased in 2012
|
$
|
896
|
|
$
|
852
|
|
$
|
1,748
|
|
|||
|
Remaining authorization at December 31, 2012
|
$
|
604
|
|
$
|
—
|
|
$
|
604
|
|
|||
|
Shares repurchased in 2012
|
1.95
|
|
2.11
|
|
4.06
|
|
||||||
|
Average price paid per share in 2012
|
$
|
460.22
|
|
$
|
403.53
|
|
$
|
430.71
|
|
|||
**
Not Applicable
1
The initial authorization in September 2010 for $1 billion was amended in April 2011 to increase the authorization to $2 billion.
As of
January 25, 2013
, the cumulative repurchases by the Company under the June 2012 Share Repurchase Program totaled approximately
2.3 million
shares of its Class A common stock for an aggregate cost of approximately
$1.1 billion
at an average price of
$467.44
per share of Class A common stock.
On February 5, 2013, our Board of Directors approved a new share repurchase program authorizing the Company to repurchase up to
$2 billion
of its Class A common stock. The new share repurchase program will become effective at the completion of the Company's June 2012 Share Repurchase Program.
Off-Balance Sheet Arrangements
MasterCard has no off-balance sheet debt other than lease arrangements and other commitments as presented in the Future Obligations table that follows.
52
Future Obligations
The following table summarizes our obligations as of
December 31, 2012
that are expected to impact liquidity and cash flow in future periods. We believe we will be able to fund these obligations through cash generated from operations and our cash balances.
|
|
Payments Due by Period
|
||||||||||||||||||
|
|
Total
4
|
2013
|
2014-2015
|
2016-2017
|
2018 and
thereafter
|
||||||||||||||
|
|
|
|
(in millions)
|
|
|
||||||||||||||
|
Capital leases
1
|
$
|
51
|
|
$
|
45
|
|
$
|
6
|
|
$
|
—
|
|
$
|
—
|
|
||||
|
Operating leases
|
103
|
|
19
|
|
36
|
|
27
|
|
21
|
|
|||||||||
|
Other long-term obligations
2
|
|||||||||||||||||||
|
Sponsorship, licensing and other
3
|
585
|
|
231
|
|
269
|
|
66
|
|
19
|
|
|||||||||
|
Employee benefits
|
108
|
|
18
|
|
9
|
|
11
|
|
70
|
|
|||||||||
|
Total
|
$
|
847
|
|
$
|
313
|
|
$
|
320
|
|
$
|
104
|
|
$
|
110
|
|
||||
1
The capital lease for the global technology and operations center located in O’Fallon, Missouri has been excluded from this table, since the Company holds refunding revenue bonds equal to the payments due on the lease. See Note 7 (Property, Plant and Equipment) included in Part II, Item 8 of this Report for further information.
2
The table does not include the
$726 million
provision as of December 31, 2012 related to the proposed settlement of the U.S. merchant class litigation since the Company has made a payment into escrow to fund the settlement. See Note 18 (Legal and Regulatory Proceedings) to the consolidated financial statements included in Part II, Item 8 of this Report for further discussion.
3
Amounts primarily relate to sponsorships to promote the MasterCard brand and amounts due in accordance with merchant agreements that are fixed and non-cancelable. Future cash payments that will become due to our customers under agreements which provide pricing rebates on our standard fees and other incentives in exchange for transaction volumes are not included in the table because the amounts due are contingent on future performance. MasterCard has accrued
$1.1 billion
as of
December 31, 2012
related to customer and merchant agreements.
4
The Company has recorded a liability for unrecognized tax benefits of
$257 million
at December 31, 2012 and estimates that approximately
$2 million
of this liability is expected to be settled within the next 12 months. These amounts have been excluded from the table since the settlement period for the non-current portion of this liability cannot be reasonably estimated. The timing of these payments will ultimately depend on the progress of tax examinations with the various authorities.
Seasonality
The Company does not experience meaningful seasonality. No individual quarter in 2012, 2011 or 2010 accounted for more than 30% of net revenues.
Critical Accounting Estimates
The application of U.S. GAAP requires the Company to make estimates and assumptions about certain items and future events that directly affect the Company's reported financial condition. We have established detailed policies and control procedures to provide reasonable assurance that the methods used to make estimates and assumptions are well controlled and are applied consistently from period to period. The accounting estimates and assumptions discussed in this section are those that the Company considers to be the most critical to its financial statements. An accounting estimate is considered critical if both (a) the nature of the estimate or assumption is material due to the levels of subjectivity and judgment involved, and (b) the impact within a reasonable range of outcomes of the estimate and assumption is material to the Company's financial condition. Senior management has discussed the development, selection and disclosure of these estimates with the Audit Committee of the Company's Board of Directors. The Company's significant accounting policies, including recent accounting pronouncements, are described in Note 1 (Summary of Significant Accounting Policies) to the consolidated financial statements included in Part II, Item 8 of this Report.
A quantitative sensitivity analysis is provided where that information is reasonably available, can be reliably estimated and provides material information to investors. The amounts used to assess sensitivity (e.g., 10 percent) are included to allow users of this Report to understand a general direction cause and effect of changes in the estimates and do not represent management's predictions of variability. For all of these estimates, it should be noted that future events rarely develop exactly as forecasted, and estimates require regular review and adjustment.
Rebates and Incentives
Rebates and incentives are recorded as a reduction of revenue based on our estimates of each customer's future performance according to the terms of the related customer agreements. We consider various factors in estimating customer performance, including a review of specific transactions, historical experience with that customer and market and economic conditions. Differences between actual results and the Company's estimates are adjusted in the period the customer reports actual performance.
53
If our customers' actual performance is not consistent with our estimates of their performance, contra-revenues may be materially different than initially estimated. If the Company's estimate of customer performance was 10% higher, net revenue would have been reduced by approximately $25 million in 2012.
Loss Contingencies
The Company is currently involved in various claims and legal proceedings. The Company regularly reviews the status of each significant matter and assesses its potential financial exposure. If the potential loss from any claim or legal proceeding is considered probable and the amount can be reasonably estimated, the Company accrues a liability for the estimated loss. Significant judgment is required in both the determination of probability and the determination of whether an exposure is reasonably estimable. Our judgments are subjective based on the status of the legal or regulatory proceedings, the merits of our defenses and consultation with in-house and outside legal counsel. Because of uncertainties related to these matters, accruals are based only on the best information available at the time. As additional information becomes available, the Company reassesses the potential liability related to its pending claims and litigation and may revise its estimates. Due to the inherent uncertainties of the legal and regulatory process in the multiple jurisdictions in which we operate, our judgments may be materially different than the actual outcomes.
Income Taxes
In calculating our effective tax rate, we need to make estimates regarding the timing and amount of taxable and deductible items which will adjust the pretax income earned in various tax jurisdictions. Through our interpretation of local tax regulations, adjustments to pretax income for income earned in various tax jurisdictions are reflected within various tax filings. Although we believe that our estimates and judgments discussed herein are reasonable, actual results may be materially different than the estimated amounts.
We record a valuation allowance to reduce our deferred tax assets to the amount that is more likely than not to be realized. Significant judgment is required in determining the valuation allowance. We consider projected future taxable income and ongoing tax planning strategies in assessing the need for the valuation allowance. If it is determined that we are able to realize deferred tax assets in excess of the net carrying value or to the extent we are unable to realize a deferred tax asset, we would adjust the valuation allowance in the period in which such a determination is made, with a corresponding increase or decrease to earnings.
We record tax liabilities for uncertain tax positions taken, or expected to be taken, which may not be sustained or may only be partially sustained, upon examination by the relevant taxing authorities. We consider all relevant facts and current authorities in the tax law in assessing whether any benefit resulting from an uncertain tax position is more likely than not to be sustained and, if so, how current law impacts the amount reflected within these financial statements. If upon examination, we realize a tax benefit which is not fully sustained or is more favorably sustained, this would decrease or increase earnings in the period. In certain situations, the Company will have offsetting tax credits or taxes in other jurisdictions.
We do not record U.S. income tax expense for foreign earnings which we intend to reinvest indefinitely to expand our international operations. We consider business plans, planning opportunities, and expected future outcomes in assessing the needs for future expansion and support of our international operations. If our business plans change or our future outcomes differ from our expectations, U.S. income tax expense and our effective tax rate could increase or decrease in that period.
Valuation of Assets
The valuation of assets acquired in a business combination and asset impairment reviews require the use of significant estimates and assumptions. The acquisition method of accounting for business combinations requires the Company to estimate the fair value of assets acquired, liabilities assumed, and any non-controlling interest in the acquiree to properly allocate purchase price consideration between assets that are depreciated and amortized from goodwill. Impairment testing for assets, other than goodwill and indefinite-lived intangible assets, requires the allocation of cash flows to those assets or group of assets and if required, an estimate of fair value for the assets or group of assets. The Company’s estimates are based upon assumptions believed to be reasonable, but which are inherently uncertain and unpredictable. These valuations require the use of management’s assumptions, which would not reflect unanticipated events and circumstances that may occur.
We evaluate goodwill and indefinite-lived intangible assets for impairment on an annual basis or sooner if indicators of impairment exist. In the fourth quarter of 2012, the Company early adopted new Financial Accounting Standards Board (FASB) guidance that simplifies how an entity tests indefinite-lived intangible assets for impairment, allowing a qualitative assessment to be performed, which is similar to the FASB guidance for evaluating goodwill for impairment. In performing these qualitative assessments, we consider relevant events and conditions, including but not limited to, macroeconomic trends, industry and market conditions, overall financial performance, cost factors, company-specific events, legal and regulatory factors and the Company's market capitalization. If the qualitative assessments indicate that it is more likely than not that the fair value of the reporting unit
54
or indefinite-lived intangible assets are less than their carrying amounts, the Company must perform a quantitative impairment test. After performing the annual goodwill and indefinite-lived intangible asset impairment qualitative reviews during the fourth quarter of 2012, the Company determined it was not necessary to perform a quantitative impairment test for goodwill or indefinite-lived intangible assets.
Item 7A.
Quantitative and Qualitative Disclosures About Market Risk
Market risk is the potential for economic losses to be incurred on market risk sensitive instruments arising from adverse changes in market factors such as interest rates, foreign currency exchange rates and equity price risk. Our exposure to market risk from changes in interest rates, foreign exchange rates and equity price risk is limited. Management establishes and oversees the implementation of policies governing our funding, investments and use of derivative financial instruments. We monitor risk exposures on an ongoing basis. The effect of a hypothetical 10% adverse change in foreign currency rates could result in a fair value loss of approximately
$166 million
on our foreign currency derivative contracts outstanding at
December 31, 2012
related to the hedging program. A 100 basis point adverse change in interest rates would not have a material impact on the Company's financial assets or liabilities at
December 31, 2012
and
2011
. In addition, there was no material equity price risk at
December 31, 2012
or
2011
. The Dodd-Frank Act includes provisions related to derivative financial instruments and the Company is determining what impact, if any, such provisions will have on the Company's financial position or results of operations.
Foreign Exchange Risk
We enter into forward contracts to manage foreign exchange risk associated with anticipated receipts and disbursements which are either transacted in a non-functional currency or valued based on a currency other than our functional currencies. We also enter into forward contracts to offset possible changes in value due to foreign exchange fluctuations of assets and liabilities denominated in currencies other than the functional currency of the entity holding the assets and liabilities. The objective of this activity is to reduce our exposure to transaction gains and losses resulting from fluctuations of foreign currencies against our functional currencies, principally the U.S. dollar and euro. The notional value of commitments to sell foreign currency increased to
$1.6 billion
at
December 31, 2012
compared to
$279 million
at
December 31, 2011
due to the hedging of an increase in assets denominated in a currency other than the functional currency of the entity holding the assets and an expanded hedging program to offset the Company's foreign currency exposures arising from anticipated receipts and disbursements. The terms of the forward contracts are generally less than 18 months.
As of
December 31, 2012
, all forward contracts to purchase and sell foreign currency had been entered into with customers of MasterCard. MasterCard’s derivative contracts are summarized below:
|
|
December 31, 2012
|
December 31, 2011
|
|||||||||||||
|
|
Notional
|
Estimated Fair
Value
|
Notional
|
Estimated Fair
Value
|
|||||||||||
|
|
(in millions)
|
||||||||||||||
|
Commitments to purchase foreign currency
|
$
|
76
|
|
$
|
(1
|
)
|
$
|
21
|
|
$
|
—
|
|
|||
|
Commitments to sell foreign currency
|
1,571
|
|
(2
|
)
|
279
|
|
2
|
|
|||||||
Our settlement activities are subject to foreign exchange risk resulting from foreign exchange rate fluctuations. This risk is typically limited to the one business day between setting the foreign exchange rates and clearing the financial transactions.
55
Interest Rate Risk
Our interest rate sensitive assets are our investments in debt securities, which we generally hold as available-for-sale investments. Our general policy is to invest in high quality securities, while providing adequate liquidity and maintaining diversification to avoid significant exposure. The fair value and maturity distribution of the Company's available for sale investments as of December 31 was as follows:
|
Maturity
|
||||||||||||||||||||||||||||||
|
Fair Market Value at December 31, 2012
|
2018 and there- after
|
|||||||||||||||||||||||||||||
|
Financial Instrument
|
Summary Terms
|
2013
|
2014
|
2015
|
2016
|
2017
|
||||||||||||||||||||||||
|
(in millions)
|
||||||||||||||||||||||||||||||
|
Municipal securities
|
Fixed / Variable Interest
|
$
|
531
|
|
$
|
174
|
|
$
|
136
|
|
$
|
78
|
|
$
|
55
|
|
$
|
38
|
|
$
|
50
|
|
||||||||
|
Corporate securities
|
Fixed / Variable Interest
|
1,246
|
|
607
|
|
470
|
|
159
|
|
1
|
|
9
|
|
—
|
|
|||||||||||||||
|
U.S. Government and Agency securities
|
Fixed / Variable Interest
|
582
|
|
355
|
|
150
|
|
37
|
|
22
|
|
8
|
|
10
|
|
|||||||||||||||
|
Taxable short-term bond funds
|
Fixed / Variable Interest
|
210
|
|
1
|
—
|
|
—
|
|
—
|
|
—
|
|
—
|
|
—
|
|
||||||||||||||
|
Asset-backed securities
|
Fixed / Variable Interest
|
316
|
|
259
|
|
45
|
|
8
|
|
—
|
|
4
|
|
—
|
|
|||||||||||||||
|
Auction rate securities
|
Variable Interest
|
32
|
|
—
|
|
—
|
|
—
|
|
—
|
|
—
|
|
32
|
|
|||||||||||||||
|
Other
|
Fixed / Variable Interest
|
66
|
|
23
|
|
27
|
|
15
|
|
1
|
|
—
|
|
—
|
|
|||||||||||||||
|
Total
|
$
|
2,983
|
|
$
|
1,418
|
|
$
|
828
|
|
$
|
297
|
|
$
|
79
|
|
$
|
59
|
|
$
|
92
|
|
|||||||||
1
Short-term bond funds of $210 million have no contractual maturity.
|
Maturity
|
||||||||||||||||||||||||||||||
|
Fair Market Value at December 31, 2011
|
2017 and there- after
|
|||||||||||||||||||||||||||||
|
Financial Instrument
|
Summary Terms
|
2012
|
2013
|
2014
|
2015
|
2016
|
||||||||||||||||||||||||
|
(in millions)
|
||||||||||||||||||||||||||||||
|
Municipal securities
|
Fixed / Variable Interest
|
$
|
393
|
|
$
|
109
|
|
$
|
74
|
|
$
|
62
|
|
$
|
59
|
|
$
|
40
|
|
$
|
49
|
|
||||||||
|
Corporate securities
|
Fixed / Variable Interest
|
325
|
|
146
|
|
91
|
|
88
|
|
—
|
|
—
|
|
—
|
|
|||||||||||||||
|
U.S. Government and Agency securities
|
Fixed / Variable Interest
|
205
|
|
176
|
|
15
|
|
3
|
|
4
|
|
3
|
|
4
|
|
|||||||||||||||
|
Taxable short-term bond funds
|
Fixed / Variable Interest
|
203
|
|
1
|
—
|
|
—
|
|
—
|
|
—
|
|
—
|
|
—
|
|
||||||||||||||
|
Asset-backed securities
|
Fixed / Variable Interest
|
69
|
|
43
|
|
24
|
|
2
|
|
—
|
|
—
|
|
—
|
|
|||||||||||||||
|
Auction rate securities
|
Variable Interest
|
70
|
|
—
|
|
—
|
|
—
|
|
—
|
|
—
|
|
70
|
|
|||||||||||||||
|
Other
|
Fixed / Variable Interest
|
20
|
|
16
|
|
4
|
|
—
|
|
—
|
|
—
|
|
—
|
|
|||||||||||||||
|
Total
|
$
|
1,285
|
|
$
|
490
|
|
$
|
208
|
|
$
|
155
|
|
$
|
63
|
|
$
|
43
|
|
$
|
123
|
|
|||||||||
1
Short-term bond funds of $203 million have no contractual maturity.
At
December 31, 2012
, we have a credit facility which provides liquidity for general corporate purposes, including providing liquidity in the event of one or more settlement failures by the Company's customers. This credit facility has variable rates, which are applied to the borrowing based on terms and conditions set forth in the agreement. See Note 12 (Debt) to the consolidated financial statements in Part II, Item 8 of this Report for additional information on the Company's current and prior credit facilities. We had no borrowings under the current or prior credit facilities at
December 31, 2012
or
2011
.
Equity Price Risk
The Company did not have significant equity price risk as of
December 31, 2012
and
2011
.
56
Item 8.
Financial Statements and Supplementary Data
MASTERCARD INCORPORATED
INDEX TO CONSOLIDATED FINANCIAL STATEMENTS
|
Page
|
||
|
MasterCard Incorporated
|
||
|
As of December 31, 2012 and 2011 and for the years ended December 31, 2012, 2011 and 2010
|
||
57
MANAGEMENT'S REPORT ON INTERNAL CONTROL OVER FINANCIAL REPORTING
The management of MasterCard Incorporated (“MasterCard”) is responsible for establishing and maintaining adequate internal control over financial reporting. Internal control over financial reporting is a process designed to provide reasonable assurance regarding the reliability of financial reporting and the preparation of financial statements for external reporting purposes in accordance with accounting principles generally accepted in the United States of America. Because of its inherent limitations, internal control over financial reporting may not prevent or detect misstatements. As required by Section 404 of the Sarbanes-Oxley Act of 2002, management has assessed the effectiveness of MasterCard's internal control over financial reporting as of
December 31, 2012
. In making its assessment, management has utilized the criteria set forth by the Committee of Sponsoring Organizations of the Treadway Commission (COSO) in its report entitled
Internal Control - Integrated Framework.
Management has concluded that, based on its assessment, MasterCard's internal control over financial reporting was effective as of
December 31, 2012
. The effectiveness of MasterCard's internal control over financial reporting as of
December 31, 2012
has been audited by PricewaterhouseCoopers LLP, an independent registered public accounting firm, as stated in their report which appears on the next page.
58
[PRICEWATERHOUSECOOPERS letterhead]
REPORT OF INDEPENDENT REGISTERED PUBLIC ACCOUNTING FIRM
To the Board of Directors and Shareholders
of MasterCard Incorporated:
In our opinion, the consolidated financial statements listed in the accompanying index present fairly, in all material respects, the financial position of MasterCard Incorporated and its subsidiaries at
December 31, 2012
and
December 31, 2011
, and the results of their operations and their cash flows for each of the three years in the period ended
December 31, 2012
in conformity with accounting principles generally accepted in the United States of America. Also in our opinion, the Company maintained, in all material respects, effective internal control over financial reporting as of
December 31, 2012
, based on criteria established in
Internal Control - Integrated Framework
issued by the Committee of Sponsoring Organizations of the Treadway Commission (COSO). The Company's management is responsible for these financial statements, for maintaining effective internal control over financial reporting and for its assessment of the effectiveness of internal control over financial reporting, included in the accompanying Management's Report on Internal Control Over Financial Reporting. Our responsibility is to express opinions on these financial statements, and on the Company's internal control over financial reporting based on our integrated audits. We conducted our audits in accordance with the standards of the Public Company Accounting Oversight Board (United States). Those standards require that we plan and perform the audits to obtain reasonable assurance about whether the financial statements are free of material misstatement and whether effective internal control over financial reporting was maintained in all material respects. Our audits of the financial statements included examining, on a test basis, evidence supporting the amounts and disclosures in the financial statements, assessing the accounting principles used and significant estimates made by management, and evaluating the overall financial statement presentation. Our audit of internal control over financial reporting included obtaining an understanding of internal control over financial reporting, assessing the risk that a material weakness exists, and testing and evaluating the design and operating effectiveness of internal control based on the assessed risk. Our audits also included performing such other procedures as we considered necessary in the circumstances. We believe that our audits provide a reasonable basis for our opinions.
A company's internal control over financial reporting is a process designed to provide reasonable assurance regarding the reliability of financial reporting and the preparation of financial statements for external purposes in accordance with generally accepted accounting principles. A company's internal control over financial reporting includes those policies and procedures that (i) pertain to the maintenance of records that, in reasonable detail, accurately and fairly reflect the transactions and dispositions of the assets of the company; (ii) provide reasonable assurance that transactions are recorded as necessary to permit preparation of financial statements in accordance with generally accepted accounting principles, and that receipts and expenditures of the company are being made only in accordance with authorizations of management and directors of the company; and (iii) provide reasonable assurance regarding prevention or timely detection of unauthorized acquisition, use, or disposition of the company's assets that could have a material effect on the financial statements.
Because of its inherent limitations, internal control over financial reporting may not prevent or detect misstatements. Also, projections of any evaluation of effectiveness to future periods are subject to the risk that controls may become inadequate because of changes in conditions, or that the degree of compliance with the policies or procedures may deteriorate.
/s/ PricewaterhouseCoopers LLP
New York, New York
February 14, 2013
59
MASTERCARD INCORPORATED
|
December 31,
|
|||||||
|
2012
|
2011
|
||||||
|
|
(in millions, except share data)
|
||||||
|
ASSETS
|
|||||||
|
Cash and cash equivalents
|
$
|
2,052
|
|
$
|
3,734
|
|
|
|
Restricted cash for litigation settlement
|
726
|
|
—
|
|
|||
|
Investment securities available-for-sale, at fair value
|
2,951
|
|
1,215
|
|
|||
|
Accounts receivable
|
925
|
|
808
|
|
|||
|
Settlement due from customers
|
1,117
|
|
601
|
|
|||
|
Restricted security deposits held for customers
|
777
|
|
636
|
|
|||
|
Prepaid expenses and other current assets
|
681
|
|
404
|
|
|||
|
Deferred income taxes
|
128
|
|
343
|
|
|||
|
Total Current Assets
|
9,357
|
|
7,741
|
|
|||
|
Property, plant and equipment, at cost, net
|
472
|
|
449
|
|
|||
|
Deferred income taxes
|
60
|
|
88
|
|
|||
|
Goodwill
|
1,092
|
|
1,014
|
|
|||
|
Other intangible assets, net
|
672
|
|
665
|
|
|||
|
Other assets
|
809
|
|
736
|
|
|||
|
Total Assets
|
$
|
12,462
|
|
$
|
10,693
|
|
|
|
LIABILITIES AND EQUITY
|
|
|
|||||
|
Accounts payable
|
$
|
357
|
|
$
|
360
|
|
|
|
Settlement due to customers
|
1,064
|
|
699
|
|
|||
|
Restricted security deposits held for customers
|
777
|
|
636
|
|
|||
|
Accrued litigation
|
726
|
|
770
|
|
|||
|
Accrued expenses
|
1,748
|
|
1,610
|
|
|||
|
Other current liabilities
|
234
|
|
142
|
|
|||
|
Total Current Liabilities
|
4,906
|
|
4,217
|
|
|||
|
Deferred income taxes
|
104
|
|
113
|
|
|||
|
Other liabilities
|
523
|
|
486
|
|
|||
|
Total Liabilities
|
5,533
|
|
4,816
|
|
|||
|
Commitments and Contingencies
|
|
|
|||||
|
Stockholders’ Equity
|
|
||||||
|
Class A common stock, $0.0001 par value; authorized 3,000,000,000 shares, 133,604,903 and 132,771,392 shares issued and 118,405,075 and 121,618,059 outstanding, respectively
|
—
|
|
—
|
|
|||
|
Class B common stock, $0.0001 par value; authorized 1,200,000,000 shares, 4,838,840 and 5,245,676 issued and outstanding, respectively
|
—
|
|
—
|
|
|||
|
Additional paid-in-capital
|
3,641
|
|
3,519
|
|
|||
|
Class A treasury stock, at cost, 15,199,828 and 11,153,333 shares, respectively
|
(4,139
|
)
|
(2,394
|
)
|
|||
|
Retained earnings
|
7,354
|
|
4,745
|
|
|||
|
Accumulated other comprehensive income (loss)
|
61
|
|
(2
|
)
|
|||
|
Total Stockholders’ Equity
|
6,917
|
|
5,868
|
|
|||
|
Non-controlling interests
|
12
|
|
9
|
|
|||
|
Total Equity
|
6,929
|
|
5,877
|
|
|||
|
Total Liabilities and Equity
|
$
|
12,462
|
|
$
|
10,693
|
|
|
The accompanying notes are an integral part of these consolidated financial statements.
60
MASTERCARD INCORPORATED
|
|
For the Years Ended December 31,
|
||||||||||
|
|
2012
|
2011
|
2010
|
||||||||
|
|
(in millions, except per share data)
|
||||||||||
|
Revenues, net
|
$
|
7,391
|
|
$
|
6,714
|
|
$
|
5,539
|
|
||
|
Operating Expenses
|
|||||||||||
|
General and administrative
|
2,429
|
|
2,196
|
|
1,857
|
|
|||||
|
Advertising and marketing
|
775
|
|
841
|
|
782
|
|
|||||
|
Provision for litigation settlement
|
20
|
|
770
|
|
—
|
|
|||||
|
Depreciation and amortization
|
230
|
|
194
|
|
148
|
|
|||||
|
Total operating expenses
|
3,454
|
|
4,001
|
|
2,787
|
|
|||||
|
Operating income
|
3,937
|
|
2,713
|
|
2,752
|
|
|||||
|
Other Income (Expense)
|
|||||||||||
|
Investment income
|
37
|
|
52
|
|
57
|
|
|||||
|
Interest expense
|
(20
|
)
|
(25
|
)
|
(52
|
)
|
|||||
|
Other income (expense), net
|
(22
|
)
|
6
|
|
—
|
|
|||||
|
Total other income (expense)
|
(5
|
)
|
33
|
|
5
|
|
|||||
|
Income before income taxes
|
3,932
|
|
2,746
|
|
2,757
|
|
|||||
|
Income tax expense
|
1,174
|
|
842
|
|
910
|
|
|||||
|
Net income
|
2,758
|
|
1,904
|
|
1,847
|
|
|||||
|
Loss (income) attributable to non-controlling interests
|
1
|
|
2
|
|
(1
|
)
|
|||||
|
Net Income Attributable to MasterCard
|
$
|
2,759
|
|
$
|
1,906
|
|
$
|
1,846
|
|
||
|
Basic Earnings per Share
|
$
|
22.02
|
|
$
|
14.90
|
|
$
|
14.10
|
|
||
|
Basic Weighted-Average Shares Outstanding
|
125
|
|
128
|
|
131
|
|
|||||
|
Diluted Earnings per Share
|
$
|
21.94
|
|
$
|
14.85
|
|
$
|
14.05
|
|
||
|
Diluted Weighted-Average Shares Outstanding
|
126
|
|
128
|
|
131
|
|
|||||
The accompanying notes are an integral part of these consolidated financial statements.
61
MASTERCARD INCORPORATED
CONSOLIDATED STATEMENT OF COMPREHENSIVE INCOME
|
|
For the Years Ended December 31,
|
||||||||||
|
|
2012
|
2011
|
2010
|
||||||||
|
|
(in millions)
|
||||||||||
|
Net Income
|
$
|
2,758
|
|
$
|
1,904
|
|
$
|
1,847
|
|
||
|
Other comprehensive income (loss):
|
|||||||||||
|
Foreign currency translation adjustments
|
63
|
|
(75
|
)
|
(107
|
)
|
|||||
|
Defined benefit pension and postretirement plans
|
(8
|
)
|
(31
|
)
|
5
|
|
|||||
|
Income tax effect
|
3
|
|
11
|
|
(2
|
)
|
|||||
|
(5
|
)
|
(20
|
)
|
3
|
|
||||||
|
Investment securities available-for-sale
|
9
|
|
(11
|
)
|
17
|
|
|||||
|
Income tax effect
|
(3
|
)
|
4
|
|
(6
|
)
|
|||||
|
6
|
|
(7
|
)
|
11
|
|
||||||
|
Reclassification adjustment for investment securities available-for-sale
|
(2
|
)
|
8
|
|
(9
|
)
|
|||||
|
Income tax effect
|
1
|
|
(3
|
)
|
3
|
|
|||||
|
(1
|
)
|
5
|
|
(6
|
)
|
||||||
|
Other comprehensive income (loss), net of tax
|
63
|
|
(97
|
)
|
(99
|
)
|
|||||
|
Comprehensive Income
|
2,821
|
|
1,807
|
|
1,748
|
|
|||||
|
Loss (income) attributable to non-controlling interests
|
1
|
|
2
|
|
(1
|
)
|
|||||
|
Comprehensive Income Attributable to MasterCard
|
$
|
2,822
|
|
$
|
1,809
|
|
$
|
1,747
|
|
||
The accompanying notes are an integral part of these consolidated financial statements.
62
MASTERCARD INCORPORATED
CONSOLIDATED STATEMENT OF CHANGES IN EQUITY
|
|
Total
|
Retained
Earnings (Accumulated Deficit)
|
Accumulated
Other
Comprehensive
Income (Loss), Net of Tax
|
Common Stock
|
Additional
Paid-In
Capital
|
Class A
Treasury
Stock
|
Non-
Controlling
Interests
|
||||||||||||||||||||||||
|
|
Class A
|
Class B
|
|||||||||||||||||||||||||||||
|
|
(in millions, except per share data)
|
||||||||||||||||||||||||||||||
|
Balance at December 31, 2009
|
$
|
3,512
|
|
$
|
1,148
|
|
$
|
194
|
|
$
|
—
|
|
$
|
—
|
|
$
|
3,412
|
|
$
|
(1,250
|
)
|
$
|
8
|
|
|||||||
|
Investment in majority owned entity
|
2
|
|
—
|
|
—
|
|
—
|
|
—
|
|
—
|
|
—
|
|
2
|
|
|||||||||||||||
|
Net income
|
1,847
|
|
1,846
|
|
—
|
|
—
|
|
—
|
|
—
|
|
—
|
|
1
|
|
|||||||||||||||
|
Other comprehensive loss, net of tax
|
(99
|
)
|
—
|
|
(99
|
)
|
—
|
|
—
|
|
—
|
|
—
|
|
—
|
|
|||||||||||||||
|
Cash dividends declared on Class A and Class B common stock, $0.60 per share
|
(79
|
)
|
(79
|
)
|
—
|
|
—
|
|
—
|
|
—
|
|
—
|
|
—
|
|
|||||||||||||||
|
Share based payments
|
63
|
|
—
|
|
—
|
|
—
|
|
—
|
|
63
|
|
—
|
|
—
|
|
|||||||||||||||
|
Stock units withheld for taxes
|
(126
|
)
|
—
|
|
—
|
|
—
|
|
—
|
|
(126
|
)
|
—
|
|
—
|
|
|||||||||||||||
|
Tax benefit for share based compensation
|
85
|
|
—
|
|
—
|
|
—
|
|
—
|
|
85
|
|
—
|
|
—
|
|
|||||||||||||||
|
Conversion of Class B to Class A common stock
|
—
|
|
—
|
|
—
|
|
—
|
|
—
|
|
—
|
|
—
|
|
—
|
|
|||||||||||||||
|
Exercise of stock options
|
11
|
|
—
|
|
—
|
|
—
|
|
—
|
|
11
|
|
—
|
|
—
|
|
|||||||||||||||
|
Balance at December 31, 2010
|
5,216
|
|
2,915
|
|
95
|
|
—
|
|
—
|
|
3,445
|
|
(1,250
|
)
|
11
|
|
|||||||||||||||
|
Net income (loss)
|
1,904
|
|
1,906
|
|
—
|
|
—
|
|
—
|
|
—
|
|
—
|
|
(2
|
)
|
|||||||||||||||
|
Other comprehensive loss, net of tax
|
(97
|
)
|
—
|
|
(97
|
)
|
—
|
|
—
|
|
—
|
|
—
|
|
—
|
|
|||||||||||||||
|
Cash dividends declared on Class A and Class B common stock, $0.60 per share
|
(76
|
)
|
(76
|
)
|
—
|
|
—
|
|
—
|
|
—
|
|
—
|
|
—
|
|
|||||||||||||||
|
Purchases of treasury stock
|
(1,148
|
)
|
—
|
|
—
|
|
—
|
|
—
|
|
—
|
|
(1,148
|
)
|
—
|
|
|||||||||||||||
|
Issuance of treasury stock for share based compensation
|
—
|
|
—
|
|
—
|
|
—
|
|
—
|
|
(4
|
)
|
4
|
|
—
|
|
|||||||||||||||
|
Share based payments
|
80
|
|
—
|
|
—
|
|
—
|
|
—
|
|
80
|
|
—
|
|
—
|
|
|||||||||||||||
|
Stock units withheld for taxes
|
(33
|
)
|
—
|
|
—
|
|
—
|
|
—
|
|
(33
|
)
|
—
|
|
—
|
|
|||||||||||||||
|
Tax benefit for share based compensation
|
12
|
|
—
|
|
—
|
|
—
|
|
—
|
|
12
|
|
—
|
|
—
|
|
|||||||||||||||
|
Conversion of Class B to Class A common stock
|
—
|
|
—
|
|
—
|
|
—
|
|
—
|
|
—
|
|
—
|
|
—
|
|
|||||||||||||||
|
Exercise of stock options
|
19
|
|
—
|
|
—
|
|
—
|
|
—
|
|
19
|
|
—
|
|
—
|
|
|||||||||||||||
|
Balance at December 31, 2011
|
5,877
|
|
4,745
|
|
(2
|
)
|
—
|
|
—
|
|
3,519
|
|
(2,394
|
)
|
9
|
|
|||||||||||||||
|
Net income (loss)
|
2,758
|
|
2,759
|
|
—
|
|
—
|
|
—
|
|
—
|
|
—
|
|
(1
|
)
|
|||||||||||||||
|
Contribution by non-controlling interest
|
4
|
|
—
|
|
—
|
|
—
|
|
—
|
|
—
|
|
—
|
|
4
|
|
|||||||||||||||
|
Other comprehensive income, net of tax
|
63
|
|
—
|
|
63
|
|
—
|
|
—
|
|
—
|
|
—
|
|
—
|
|
|||||||||||||||
|
Cash dividends declared on Class A and Class B common stock, $1.20 per share
|
(150
|
)
|
(150
|
)
|
—
|
|
—
|
|
—
|
|
—
|
|
—
|
|
—
|
|
|||||||||||||||
|
Purchases of treasury stock
|
(1,748
|
)
|
—
|
|
—
|
|
—
|
|
—
|
|
—
|
|
(1,748
|
)
|
—
|
|
|||||||||||||||
|
Issuance of treasury stock for share based compensation
|
—
|
|
—
|
|
—
|
|
—
|
|
—
|
|
(3
|
)
|
3
|
|
—
|
|
|||||||||||||||
|
Share based payments
|
89
|
|
—
|
|
—
|
|
—
|
|
—
|
|
89
|
|
—
|
|
—
|
|
|||||||||||||||
|
Stock units withheld for taxes
|
(42
|
)
|
—
|
|
—
|
|
—
|
|
—
|
|
(42
|
)
|
—
|
|
—
|
|
|||||||||||||||
|
Tax benefit for share based compensation
|
47
|
|
—
|
|
—
|
|
—
|
|
—
|
|
47
|
|
—
|
|
—
|
|
|||||||||||||||
|
Conversion of Class B to Class A common stock
|
—
|
|
—
|
|
—
|
|
—
|
|
—
|
|
—
|
|
—
|
|
—
|
|
|||||||||||||||
|
Exercise of stock options
|
31
|
|
—
|
|
—
|
|
—
|
|
—
|
|
31
|
|
—
|
|
—
|
|
|||||||||||||||
|
Balance at December 31, 2012
|
$
|
6,929
|
|
$
|
7,354
|
|
$
|
61
|
|
$
|
—
|
|
$
|
—
|
|
$
|
3,641
|
|
$
|
(4,139
|
)
|
$
|
12
|
|
|||||||
|
|
|
||||||||||||||||||||||||||||||
The accompanying notes are an integral part of these consolidated financial statements.
63
MASTERCARD INCORPORATED
|
|
For the Years Ended December 31,
|
||||||||||
|
|
2012
|
2011
|
2010
|
||||||||
|
|
(in millions)
|
||||||||||
|
Operating Activities
|
|||||||||||
|
Net income
|
$
|
2,758
|
|
$
|
1,904
|
|
$
|
1,847
|
|
||
|
Adjustments to reconcile net income to net cash provided by operating activities:
|
|||||||||||
|
Depreciation and amortization
|
230
|
|
194
|
|
148
|
|
|||||
|
Share based payments
|
89
|
|
80
|
|
63
|
|
|||||
|
Stock units withheld for taxes
|
(42
|
)
|
(33
|
)
|
(126
|
)
|
|||||
|
Tax benefit for share based compensation
|
(47
|
)
|
(12
|
)
|
(85
|
)
|
|||||
|
Deferred income taxes
|
241
|
|
(175
|
)
|
248
|
|
|||||
|
Other
|
53
|
|
19
|
|
41
|
|
|||||
|
Changes in operating assets and liabilities:
|
|||||||||||
|
Accounts receivable
|
(121
|
)
|
(162
|
)
|
(115
|
)
|
|||||
|
Income taxes receivable
|
(185
|
)
|
—
|
|
(50
|
)
|
|||||
|
Settlement due from customers
|
(500
|
)
|
(114
|
)
|
(61
|
)
|
|||||
|
Prepaid expenses
|
(81
|
)
|
27
|
|
(48
|
)
|
|||||
|
Obligations under litigation settlements
|
—
|
|
(303
|
)
|
(603
|
)
|
|||||
|
Accrued litigation
|
(44
|
)
|
770
|
|
—
|
|
|||||
|
Accounts payable
|
(2
|
)
|
67
|
|
(19
|
)
|
|||||
|
Settlement due to customers
|
348
|
|
74
|
|
186
|
|
|||||
|
Accrued expenses
|
221
|
|
296
|
|
265
|
|
|||||
|
Net change in other assets and liabilities
|
30
|
|
52
|
|
6
|
|
|||||
|
Net cash provided by operating activities
|
2,948
|
|
2,684
|
|
1,697
|
|
|||||
|
Investing Activities
|
|||||||||||
|
Increase in restricted cash for litigation settlement
|
(726
|
)
|
—
|
|
—
|
|
|||||
|
Acquisition of businesses, net of cash acquired
|
(70
|
)
|
(460
|
)
|
(498
|
)
|
|||||
|
Purchases of property, plant and equipment
|
(96
|
)
|
(77
|
)
|
(61
|
)
|
|||||
|
Capitalized software
|
(122
|
)
|
(100
|
)
|
(90
|
)
|
|||||
|
Purchases of investment securities available-for-sale
|
(2,981
|
)
|
(899
|
)
|
(329
|
)
|
|||||
|
Proceeds from sales of investment securities available-for-sale
|
390
|
|
485
|
|
297
|
|
|||||
|
Proceeds from maturities of investment securities available-for-sale
|
891
|
|
63
|
|
110
|
|
|||||
|
Proceeds from maturities of investment securities held-to-maturity
|
—
|
|
300
|
|
—
|
|
|||||
|
Investment in nonmarketable equity investments
|
(118
|
)
|
(74
|
)
|
(67
|
)
|
|||||
|
Other investing activities
|
(7
|
)
|
14
|
|
(3
|
)
|
|||||
|
Net cash used in investing activities
|
(2,839
|
)
|
(748
|
)
|
(641
|
)
|
|||||
|
Financing Activities
|
|||||||||||
|
Purchases of treasury stock
|
(1,748
|
)
|
(1,148
|
)
|
—
|
|
|||||
|
Dividends paid
|
(132
|
)
|
(77
|
)
|
(79
|
)
|
|||||
|
Payment of debt
|
—
|
|
(21
|
)
|
—
|
|
|||||
|
Tax benefit for share based compensation
|
47
|
|
12
|
|
85
|
|
|||||
|
Cash proceeds from exercise of stock options
|
31
|
|
19
|
|
11
|
|
|||||
|
Other financing activities
|
4
|
|
—
|
|
2
|
|
|||||
|
Net cash (used in) provided by financing activities
|
(1,798
|
)
|
(1,215
|
)
|
19
|
|
|||||
|
Effect of exchange rate changes on cash and cash equivalents
|
7
|
|
(54
|
)
|
(63
|
)
|
|||||
|
Net (decrease) increase in cash and cash equivalents
|
(1,682
|
)
|
667
|
|
1,012
|
|
|||||
|
Cash and cash equivalents - beginning of period
|
3,734
|
|
3,067
|
|
2,055
|
|
|||||
|
Cash and cash equivalents - end of period
|
$
|
2,052
|
|
$
|
3,734
|
|
$
|
3,067
|
|
||
The accompanying notes are an integral part of these consolidated financial statements.
64
MASTERCARD INCORPORATED
NOTES TO CONSOLIDATED FINANCIAL STATEMENTS
Note 1.
Summary of Significant Accounting Policies
Organization
MasterCard Incorporated and its consolidated subsidiaries, including MasterCard International Incorporated (“MasterCard International” and together with MasterCard Incorporated, “MasterCard” or the “Company”), is a technology company in the global payments industry that connects consumers, financial institutions, merchants, governments and businesses worldwide, enabling them to use electronic forms of payment instead of cash and checks. MasterCard primarily (1) offers a wide range of payment solutions, which enable its customers and other parties with which we work (which include financial institutions and other entities that act as “issuers” and “acquirers”, merchants, governments, telecommunications companies and other businesses) to develop and implement credit, debit, prepaid, commercial and related payment programs for consumers; (2) manages a family of well-known, widely-accepted payment brands, including MasterCard®, Maestro® and Cirrus®, which it licenses to its customers for use in their payment programs and solutions; (3) processes payment transactions over the MasterCard Worldwide Network; and (4) provides support services to its customers and others.
Significant Accounting Policies
Consolidation and basis of presentation -
The consolidated financial statements include the accounts of MasterCard and its majority-owned and controlled entities, including any variable interest entities ("VIEs") for which the Company is the primary beneficiary. Intercompany transactions and balances have been eliminated in consolidation. Certain prior period amounts have been reclassified to conform to the 2012 presentation. The Company follows accounting principles generally accepted in the United States of America (“GAAP”).
The Company is a variable interest holder in certain entities. These variable interests arise from contractual, ownership or other monetary interests in the entities. The Company evaluates if the entity has sufficient equity at risk to finance their activities without additional subordinated financial support from other parties, if equity investors lack the ability to control the entity's most significant activities, have voting rights that are disproportionate to their ownership interest, or lack the ability to absorb expected losses or receive expected returns (referred to as VIEs). The Company consolidates a VIE if it is the primary beneficiary, defined as the entity that has both (i) the power to direct the activities that most significantly impact the VIE's economic performance and (ii) the obligation to absorb the losses and/or the right to receive benefits from the VIE that could potentially be significant to the VIE. To determine whether we qualify as the primary beneficiary, the Company considers both qualitative and quantitative factors regarding the nature, size and form of the Company's involvement with the VIE. The Company assesses whether or not it is the primary beneficiary of a VIE on an ongoing basis. Investments in VIEs for which the Company is not considered the primary beneficiary are not consolidated and are accounted for as equity method or cost method investments and recorded in other assets on the consolidated balance sheet. At December 31, 2012 and 2011, there were no VIEs which required consolidation.
Non-controlling interests represent the equity interest not owned by the Company and is recorded for consolidated entities in which the Company owns less than
100%
of the interests. Non-controlling interests are reported as a component of equity. In addition, changes in a parent's ownership interest while the parent retains its controlling interest are accounted for as equity transactions, and upon a gain or loss of control, retained ownership interests are remeasured at fair value, with any gain or loss recognized in earnings.
The Company accounts for investments in common stock or in-substance common stock under the equity method of accounting when it has the ability to exercise significant influence over the investee, generally when it holds between
20%
and
50%
ownership in the entity. In addition, investments in flow-through entities such as limited partnerships and limited liability companies are also accounted for under the equity method when the Company has the ability to exercise significant influence over the investee, generally when the investment ownership percentage is equal to or greater than
5%
of the outstanding ownership interest. The excess of the cost over the underlying net equity of investments accounted for under the equity method is allocated to identifiable tangible and intangible assets and liabilities based on fair values at the date of acquisition. The amortization of the excess of the cost over the underlying net equity of investments and MasterCard's share of net earnings or losses of entities accounted for under the equity method of accounting is included in other income (expense) on the consolidated statement of operations.
The Company accounts for investments in common stock or in-substance common stock under the cost method of accounting when it does not exercise significant influence, generally when it holds less than
20%
ownership in the entity. Investments in companies that MasterCard does not control, but that are not in the form of common stock or in-substance common stock, are also
65
accounted for under the cost method of accounting. When the interest in a limited partnership or limited liability company is less than
5%
and the Company has no significant influence over the operation of the investee, the cost method is used. Investments for which the equity method or cost method of accounting is used are recorded in other assets on the consolidated balance sheet.
Use of estimates
- The preparation of financial statements in conformity with GAAP requires management to make estimates and assumptions that affect the reported amounts of assets and liabilities and disclosure of contingent assets and liabilities at the date of the financial statements and the reported amounts of revenue and expenses during the reporting periods. Future events and their effects cannot be predicted with certainty; accordingly, accounting estimates require the exercise of judgment. The accounting estimates used in the preparation of the Company's consolidated financial statements may change as new events occur, as more experience is acquired, as additional information is obtained and as the Company's operating environment changes. Actual results may differ from these estimates.
Revenue recognition
- Revenues are recognized when persuasive evidence of an arrangement exists, delivery has occurred or services have been rendered, the price is fixed or determinable, and collectibility is reasonably assured. Revenues are generally based upon transactional information accumulated by our systems or reported by our customers. The Company's revenues are based on the volume of activity on cards that carry the Company's brands, the number of transactions processed or the nature of other payment-related services.
Volume-based revenues (domestic assessments and cross-border volume fees) are recorded as revenue in the period they are earned, which is when the related volume is generated on the cards. Certain quarterly revenues are estimated based upon aggregate transaction information and historical and projected customer quarterly volumes. Actual results may differ from these estimates. Transaction-based revenues (transaction processing fees) are calculated by multiplying the number and type of transactions by the contractual price for each service. Transaction-based fees are recognized as revenue in the same period as the related transactions occur. Other payment-related services are dependent on the nature of the products or services provided to our customers and are recognized as revenue in the same period as the related transactions occur or services are rendered.
MasterCard has business agreements with certain customers that provide for fee rebates when the customers meet certain volume hurdles as well as other support incentives such as marketing, which are tied to performance. Rebates and incentives are recorded as a reduction of revenue in the same period as the revenue is earned or performance has occurred. Rebates and incentives are calculated on a monthly basis based upon estimated performance and the terms of the related business agreements. In addition, MasterCard may incur costs directly related to entering into such an agreement, which are deferred and amortized over the life of the agreement on a straight-line basis.
Business combinations
- The Company accounts for businesses acquired in business combinations under the acquisition method of accounting. The Company measures the tangible and intangible identifiable assets acquired, liabilities assumed, and any noncontrolling interest in the acquiree at the acquisition date, at their fair values as of that date. Acquisition-related costs are expensed separately from the business combination and are included in general and administrative expenses. Any excess of purchase price over the fair value of net assets acquired, including identifiable intangible assets, is recorded as goodwill. See Note 8 (Goodwill) for additional information on the Company's goodwill.
Intangible assets
- Intangible assets consist of capitalized software costs, trademarks, tradenames, customer relationships and other intangible assets, which have finite lives, and customer relationships which have indefinite lives. Intangible assets with finite useful lives are amortized over their estimated useful lives, which range from
one
to
ten
years, under the straight-line method. Capitalized software includes internal costs incurred for payroll and payroll related expenses directly related to the design, development and testing phases of each capitalized software project.
Impairment of assets
- Long-lived assets, other than goodwill and indefinite-lived intangible assets, are tested for impairment whenever events or circumstances indicate that their carrying amount may not be recoverable. If the carrying value of the asset cannot be recovered from estimated future cash flows, undiscounted and without interest, the fair value of the asset is calculated using the present value of estimated net future cash flows. If the carrying amount of the asset exceeds its fair value, an impairment is recorded. The Company regularly reviews investments accounted for under the cost and equity methods for possible impairment, which generally involves an analysis of the facts and circumstances influencing the investment, expectations of the entity's cash flows and capital needs, and the viability of the business model.
Goodwill and indefinite-lived intangible assets are tested annually for impairment in the fourth quarter, or sooner when circumstances indicate an impairment may exist, using a qualitative analysis. The impairment evaluation utilizes a qualitative assessment to determine whether it is more likely than not (that is, a likelihood of more than 50 percent) that the fair value of the reporting unit or indefinite-lived intangible asset is less than its carrying amount and whether it is necessary to perform a quantitative
66
impairment test. If, after performing a qualitative assessment, it is determined that it is more likely than not that the fair value of the reporting unit or indefinite-lived intangible asset is less than its carrying amount, then it would be necessary to use the quantitative impairment test to identify potential impairment and measure the amount of an impairment loss to be recognized (if any). The quantitative impairment test is not necessary if, after performing the qualitative assessment, it is determined that it is more likely than not that the fair value of the reporting unit or indefinite-lived intangible assets exceeds its carrying amount. Impairment charges, if any, are recorded in general and administrative expenses. A reporting unit is the operating segment, or a business, which is one level below that operating segment (the "component" level) if discrete financial information is prepared and regularly reviewed by management at the segment level. Components are aggregated as a single reporting unit if they have similar economic characteristics.
Litigation
- The Company is a party to certain legal and regulatory proceedings with respect to a variety of matters. Except as described in Note 18 (Legal and Regulatory Proceedings), MasterCard does not believe that any legal or regulatory proceedings to which it is a party would have a material adverse impact on its business or prospects. The Company evaluates the likelihood of an unfavorable outcome of all legal or regulatory proceedings to which it is a party and accrues a loss contingency when the loss is probable and reasonably estimable. These judgments are subjective based on the status of the legal or regulatory proceedings, the merits of its defenses and consultation with in-house and external legal counsel. The actual outcomes of these proceedings may materially differ from the Company's judgments. Legal costs are expensed as incurred and recorded in general and administrative expenses.
Settlement and other risk management
- MasterCard has global risk management policies and procedures, which include risk standards to provide a framework for managing the Company's settlement exposure. Settlement risk is the legal exposure due to the difference in timing between the payment transaction date and subsequent settlement. MasterCard's rules guarantee the settlement of many of the MasterCard, Cirrus and Maestro-branded transactions between its issuers and acquirers. The term and amount of the guarantee are unlimited. Settlement exposure under the guarantee is short term and typically limited to a few days. In the event that MasterCard effects a payment on behalf of a failed customer, MasterCard may seek an assignment of the underlying receivables. Subject to approval by the Company's Board of Directors, customers may be charged for the amount of any settlement losses incurred during the ordinary activities of the Company. MasterCard has also guaranteed the payment of MasterCard-branded travelers cheques, which are no longer being issued, in the event of issuer default. The term of the guarantee is unlimited, while the amount is limited to cheques issued but not yet cashed. The Company may also have other guarantee obligations in the course of its business. The Company accounts for each of its guarantees issued or modified after December 31, 2002, the adoption date of the relevant accounting standard, by recording the guarantee at its fair value at the inception or modification of the guarantee through earnings. To the extent that a guarantee is significantly modified subsequent to the inception of the guarantee, the Company remeasures the fair value of the guarantee at the date of modification through earnings.
The Company enters into agreements in the ordinary course of business under which the Company agrees to indemnify third parties against damages, losses and expenses incurred in connection with legal and other proceedings arising from relationships or transactions with the Company. As the extent of the Company's obligations under these agreements depends entirely upon the occurrence of future events, the Company's potential future liability under these agreements is not determinable. See Note 5 (Fair Value and Investment Securities) and Note 19 (Settlement and Other Risk Management).
Income taxes
- The Company follows an asset and liability based approach in accounting for income taxes as required under GAAP. Deferred income tax assets and liabilities are recorded to reflect the tax consequences on future years of temporary differences between the financial statement carrying amounts and income tax bases of assets and liabilities. Deferred income taxes are displayed as separate line items or are included in other current liabilities on the consolidated balance sheet. Valuation allowances are provided against assets which are not more likely than not to be realized. The Company recognizes all material tax positions, including all significant uncertain tax positions in which it is more likely than not that the position will be sustained based on its technical merits and if challenged by the relevant taxing authorities. At each balance sheet date, unresolved uncertain tax positions are reassessed to determine whether subsequent developments require a change in the amount of recognized tax benefit. The allowance for uncertain tax positions is recorded in other current and noncurrent liabilities on the consolidated balance sheet.
The Company records interest expense related to income tax matters as interest expense in its statement of operations. The Company includes penalties related to income tax matters in the income tax provision. The Company does not provide for U.S. federal income tax and foreign withholding taxes on undistributed earnings from non-U.S. subsidiaries when such earnings are intended to be reinvested indefinitely outside of the U.S.
Cash and cash equivalents
- Cash and cash equivalents include certain investments with daily liquidity or with a maturity of three months or less from the date of purchase. Cash equivalents are recorded at cost, which approximates fair value.
67
Restricted cash
- The Company classifies cash as restricted when the cash is unavailable for withdrawal or usage. Restrictions may include legally restricted deposits, contracts entered into with others, or the Company's statements of intention with regard to particular deposits. In December 2012, the Company made a
$726 million
payment into a qualified settlement fund related to the U.S. merchant class litigation. The Company has presented these funds as restricted cash since the use of the funds under the qualified settlement fund is restricted for payment under the preliminary settlement agreement. Subject to court approval, all or a portion of the funds would be returned to the Company in the event that the settlement is not finalized or certain merchants opt out of the settlement agreement. See Note 5 (Fair Value and Investment Securities), Note 10 (Accrued Expenses) and Note 18 (Legal and Regulatory Proceedings) for further detail.
Fair value
- The Company measures certain financial assets and liabilities at fair value on a recurring basis by estimating the price that would be received to sell an asset or paid to transfer a liability in an orderly transaction between market participants at the measurement date. The Company classifies these recurring fair value measurements into a three-level hierarchy ("Valuation Hierarchy") and discloses the significant assumptions utilized in measuring all of its assets and liabilities at fair value.
The Valuation Hierarchy is based upon the transparency of inputs to the valuation of an asset or liability as of the measurement date. A financial instrument's categorization within the Valuation Hierarchy is based upon the lowest level of input that is significant to the fair value measurement. The three levels of the Valuation Hierarchy are as follows:
|
l
|
Level 1-inputs to the valuation methodology are quoted prices (unadjusted) for identical assets or liabilities in active markets.
|
|
l
|
Level 2-inputs to the valuation methodology include quoted prices for similar assets and liabilities in active markets, quoted prices for identical assets and liabilities in inactive markets and inputs that are observable for the asset or liability, either directly or indirectly, for substantially the full term of the financial instrument.
|
|
l
|
Level 3-inputs to the valuation methodology are unobservable and significant to the fair value measurement.
|
Certain assets and liabilities are measured at fair value on a nonrecurring basis. The Company's assets and liabilities measured at fair value on a nonrecurring basis include property, plant and equipment, nonmarketable equity investments, goodwill and other intangible assets. These assets are not measured at fair value on an ongoing basis; however, they are subject to fair value adjustments in certain circumstances, such as when there is evidence of impairment.
The valuation methods for goodwill and other intangible assets involve assumptions concerning comparable company multiples, discount rates, growth projections and other assumptions of future business conditions. The Company performs a qualitative analysis to first determine whether the existence of events or circumstances indicate that it is more likely than not that goodwill and indefinite-lived intangible assets are impaired. If, after assessing the totality of events or circumstances, the Company concludes that it is not more likely than not that goodwill and indefinite-lived intangible assets are impaired, then the Company is not required to take further action. However, if the Company concludes otherwise, then it is required to determine the fair value of goodwill and indefinite-lived intangible assets and compare the fair value with the carrying amount. As the assumptions employed to measure these assets and liabilities on a nonrecurring basis are based on management's judgment using internal and external data, these fair value determinations are classified in Level 3 of the Valuation Hierarchy. See Note 5 (Fair Value and Investment Securities) for information about methods and assumptions. The Company has not elected to apply the fair value option to its eligible financial assets and liabilities.
Investment securities
- The Company classifies investments in debt securities as held-to-maturity or available-for-sale and classifies investments in equity securities as available-for-sale or trading, if a readily available fair value can be determined. Available-for-sale securities that are available to meet the Company's current operational needs are classified as current assets. Available-for-sale securities that are not available to meet the Company's current operational needs are classified as non-current assets.
Investments in debt securities are classified as held-to-maturity when the Company has the intent and ability to hold the debt securities to maturity and are stated at amortized cost. Investments in debt securities not classified as held-to-maturity are classified as available-for-sale and are carried at fair value, with unrealized gains and losses, net of applicable taxes, recorded as a separate component of other comprehensive income on the consolidated statement of comprehensive income. Net realized gains and losses on debt securities are recognized in investment income on the consolidated statement of operations.
The fair values of the Company's short-term bond funds are based on quoted prices for identical investments in active markets and are therefore included in Level 1 of the Valuation Hierarchy. The fair values of the Company's available-for-sale municipal securities, U.S. Government and Agency securities, corporate securities, asset-backed securities and other fixed income securities are based on quoted prices for similar assets in active markets and are therefore included in Level 2 of the Valuation
68
Hierarchy. The fair value determination for the Company's Auction Rate Securities ("ARS") is based primarily on an income approach and is therefore included in Level 3 of the Valuation Hierarchy. See Note 5 (Fair Value and Investment Securities) for additional disclosures related to the fair value standard.
The Company has incorporated the considerations of guidance pertaining to determining the fair value of financial assets in inactive markets in its assessment of the fair value of its ARS as of December 31, 2012 and 2011. The guidance provides consideration of how management's internal cash flow and discount rate assumptions should be considered when measuring fair value when relevant observable data does not exist, how observable market information in a market that is not active should be considered when measuring fair value and how the use of market quotes should be considered when assessing the relevance of observable and unobservable data available to measure fair value. See Note 5 (Fair Value and Investment Securities) for further detail.
Investments in equity securities classified as available-for-sale are carried at fair value, with unrealized gains and losses, net of applicable taxes, recorded as a separate component of other comprehensive income on the consolidated statement of comprehensive income. Net realized gains and losses on available-for-sale equity securities are recognized in investment income on the consolidated statement of operations. The specific identification method is used to determine realized gains and losses.
Derivative financial instruments
- The Company accounts for all derivatives, whether designated in hedging relationships or not, by recording them on the balance sheet at fair value in other assets and other liabilities, regardless of the purpose or intent for holding them. The Company's foreign exchange forward contracts are included in level 2 of the Valuation Hierarchy as the fair value of these contracts are based on broker quotes for the same or similar instruments. Changes in the fair value of derivative instruments are reported in current-period earnings. The Company did not have any derivative contracts accounted for under hedge accounting as of
December 31, 2012
and
2011
.
Settlement due from/due to customers
- The Company operates systems for clearing and settling payment transactions among MasterCard customers. Net settlements are generally cleared daily among customers through settlement cash accounts by wire transfer or other bank clearing means. However, some transactions may not settle until subsequent business days, resulting in amounts due from and due to MasterCard customers.
Restricted security deposits held for MasterCard customers
- MasterCard requires collateral from certain customers for settlement of their transactions. Additionally, MasterCard holds cash deposits and certificates of deposit from certain customers of MasterCard as collateral for settlement of their transactions. These assets are fully offset by corresponding liabilities included on the consolidated balance sheet. The majority of collateral for settlement is typically in the form of standby letters of credit and bank guarantees which are not recorded on the balance sheet.
Treasury stock
- The Company records the repurchase of shares of common stock at cost based on the settlement date of the transaction. These shares are considered treasury stock, which is a reduction to stockholders' equity. Treasury stock is included in authorized and issued shares but excluded from outstanding shares.
Property, plant and equipment
- Property, plant and equipment are stated at cost less accumulated depreciation and amortization. Depreciation of equipment and furniture and fixtures is computed using the straight-line method over the related estimated useful lives of the assets, generally ranging from
two
to
five
years. Amortization of leasehold improvements is generally computed using the straight-line method over the lesser of the estimated useful lives of the improvements or the terms of the related leases. Capital leases are amortized using the straight-line method over the lives of the leases. Depreciation on buildings is calculated using the straight-line method over an estimated useful life of
30
years. Amortization of leasehold improvements and capital leases is included in depreciation expense.
Leases
- The Company enters into operating and capital leases for the use of premises, software and equipment. Rent expense related to lease agreements which contain lease incentives is recorded on a straight-line basis over the term of the lease.
Pension and other postretirement plans
- The Company recognizes the overfunded or underfunded status of its single-employer defined benefit plan or postretirement plan as an asset or liability in its balance sheet and recognizes changes in the funded status in the year in which the changes occur through other comprehensive income. The funded status is measured as the difference between the fair value of plan assets and the benefit obligation at December 31, the measurement date. The fair value of plan assets represents the current market value of the pension assets. Overfunded plans are aggregated and recorded in long-term other assets, while underfunded plans are aggregated and recorded as accrued expenses and long-term other liabilities.
Net periodic pension and postretirement benefit cost/(income) is recognized in general and administrative expenses in the consolidated statement of operations. These costs include service costs, interest cost, expected return on plan assets, amortization
69
of prior service costs or credits and gains or losses previously recognized as a component of other comprehensive income or loss. See Note 11 (Pension Plans, Postretirement Plan, Savings Plan and Other Benefits) for information about methods and assumptions.
Defined contribution savings plans
- The Company's contributions to defined contribution savings plans are recorded when the employee renders service to the Company. The charge is recorded in general and administrative expenses.
Share based payments
- The Company recognizes the fair value of all share based payments to employees in its financial statements. The Company measures share based compensation expense at the grant date, based on the estimated fair value of the award and uses the straight-line method of attribution, net of estimated forfeitures, for expensing awards over the employee requisite service period. The Company estimates the fair value of stock option awards using a Black-Scholes valuation model. The fair value of Restricted Stock Units (RSUs), including Performance Stock Units (PSUs), is determined and fixed on the grant date based on the Company's stock price, adjusted for the exclusion of dividend equivalents. All share based compensation expenses are recorded in general and administrative expenses.
The Company recognizes a realized tax benefit associated with dividends on certain equity shares and options as an increase to additional paid-in capital. The benefit is included in the pool of excess tax benefits available to absorb potential future tax liabilities on share based payment awards.
Advertising expense
- The cost of media advertising is expensed when the advertising takes place. Advertising production costs are expensed as incurred. Promotional items are expensed at the time the promotional event occurs. Sponsorship costs are recognized over the period of benefit based on the estimated value of certain events.
Foreign currency remeasurement and translation
- For foreign currency remeasurement from each local currency into the appropriate functional currency, monetary assets and liabilities are remeasured to functional currencies using current exchange rates in effect at the balance sheet date. Non-monetary assets and liabilities are recorded at historical exchange rates, and revenue and expense accounts are remeasured at a weighted-average exchange rate for the period. Resulting exchange gains and losses related to remeasurement are included in general and administrative expenses on the consolidated statement of operations.
Where a non-U.S. currency is the functional currency, translation from that functional currency to U.S. dollars is performed for balance sheet accounts using current exchange rates in effect at the balance sheet date and for revenue and expense accounts using a weighted-average exchange rate for the period. Resulting translation adjustments are reported as a component of other comprehensive income (loss).
Earnings per share
- The Company calculates earnings per share (EPS) by dividing net income attributable to MasterCard by the weighted-average number of common shares outstanding during the year. Diluted EPS is calculated by dividing net income attributable to MasterCard by the weighted-average number of common shares outstanding during the year, adjusted for the potentially dilutive effect of stock options and unvested stock units using the treasury stock method. For the years ended December 31, 2011 and 2010, EPS was calculated using the two-class method. The two-class method clarifies that unvested share based payment awards that contain nonforfeitable rights to dividends or dividend equivalents are considered participating securities and should be included in the calculation of EPS. See Note 3 (Earnings Per Share) for further detail.
Recent accounting pronouncements
Fair value measurement and disclosure
- In May 2011, the fair value accounting guidance was amended by the FASB to change fair value measurement principles and disclosure requirements. The key changes in measurement principles include limiting the concepts of highest and best use and valuation premise to nonfinancial assets, providing a framework for considering whether a premium or discount can be applied in a fair value measurement, and aligning the fair value measurement of instruments classified within an entity's shareholders' equity with the guidance for liabilities. Disclosures are required for all transfers between Levels 1 and 2 within the Valuation Hierarchy, the use of a nonfinancial asset measured at fair value if its use differs from its highest and best use, the level in the Valuation Hierarchy of assets and liabilities not recorded at fair value but for which fair value is required to be disclosed, and for Level 3 measurements, quantitative information about unobservable inputs used, a description of the valuation processes used, and qualitative discussion about the sensitivity of the measurements. The Company adopted the revised accounting guidance effective January 1, 2012 via prospective adoption, as required, and the adoption did not have an impact on the Company's financial position or results of operations.
Impairment testing for goodwill
- In September 2011, a new accounting guidance was issued that is intended to simplify how an entity tests goodwill for impairment. Entities are permitted to perform a qualitative assessment of goodwill impairment to determine whether it is necessary to perform the two-step quantitative goodwill impairment test. This guidance is effective for goodwill impairment tests performed in interim and annual periods for fiscal years beginning after December 15, 2011, with early
70
adoption permitted. The Company adopted the revised accounting guidance October 1, 2011. The adoption did not have an impact on the Company's financial position or results of operations.
Comprehensive income -
In June 2011, new accounting guidance was issued by the FASB that amends existing guidance by allowing only two options for presenting the components of net income and other comprehensive income: (1) in a single continuous statement of comprehensive income or (2) in two separate but consecutive financial statements, consisting of an income statement followed by a separate statement of comprehensive income. Also, items that are reclassified from accumulated other comprehensive income to net income must be presented on the face of the financial statements. In December 2011, new accounting guidance was issued that indefinitely defers the effective date for the requirement to present the reclassification of items from other comprehensive income to net income. The guidance requires retrospective application, and is effective for fiscal years, and interim periods within those years, beginning after December 15, 2011, with early adoption permitted. The Company adopted the revised accounting guidance effective January 1, 2012, and the adoption had a limited impact on the Company's financial disclosures. In February 2013, new accounting guidance was issued by the FASB that will require disclosure of amounts reclassified from accumulated other comprehensive income to net income. The Company will adopt the revised accounting guidance effective January 1, 2013, and anticipates that this adoption will have limited impact on the Company's disclosures.
Impairment testing for indefinite-lived intangible assets
- In July 2012, new accounting guidance was issued by the FASB that is intended to simplify how an entity tests indefinite-lived intangible assets for impairment. Under this guidance, an entity has the option to first assess qualitative factors to determine whether the existence of events or circumstances indicate that it is more likely than not that the indefinite-lived intangible asset is impaired. If, after assessing the totality of events or circumstances, an entity concludes that the indefinite-lived intangible asset is not more likely than not impaired, then the entity would not be required to take further action. However, if an entity concludes otherwise, then it would be required to determine the fair value of the indefinite-lived intangible asset and compare the fair value with the carrying amount. An entity also would have the option to bypass the qualitative assessment for any indefinite-lived intangible asset in any period and proceed directly to calculating its fair value. The amendments are effective for annual and interim impairment tests performed for fiscal years beginning after September 15, 2012, with early adoption permitted. The Company adopted the revised accounting guidance October 1, 2012, and the adoption did not have an impact on the Company's financial position or results of operations.
Balance Sheet Offsetting
- In January 2013, the FASB issued accounting guidance clarifying the scope of its previously issued requirements to disclose gross and net amounts of eligible financial assets and financial liabilities recognized on the balance sheet. The guidance is effective for annual reporting periods beginning after January 1, 2013, and interim periods within those annual periods. The Company will adopt the revised accounting guidance effective January 1, 2013, and anticipates that this adoption will have limited impact on the Company's disclosures.
Note 2.
Acquisitions
2012 Acquisitions
In 2012, the Company completed
three
acquisitions for an aggregate cost of
$70 million
. The excess of purchase consideration over net assets acquired of
$48 million
was recorded as goodwill. None of the goodwill is expected to be deductible for local tax purposes.
2011 Acquisition
Card Program Management Operations
On December 9, 2010, MasterCard entered into an agreement to acquire the prepaid card program management operations of Travelex Holdings Ltd., since renamed Access Prepaid Worldwide (“Access”). Pursuant to the terms of the acquisition agreement, the Company acquired Access on
April 15, 2011
, at a purchase price of
295 million
U.K. pound sterling, or
$481 million
, including adjustments for working capital, and contingent consideration (an “earn-out”) of up to an additional
35 million
U.K. pound sterling, or approximately
$57 million
, based on full year 2011 revenues. The Company recognized a current liability related to the earn-out of
6 million
U.K. pound sterling, or approximately
$9 million
. The fair value of the earn-out arrangement was estimated by applying a probability-weighted income approach. The full year revenues for 2011 did not meet the requirements for payment of the earn-out and therefore the liability was eliminated and the Company recorded other income of
$9 million
in 2011.
Access manages and delivers consumer and corporate prepaid travel cards through business partners around the world, including financial institutions, retailers, travel agents and foreign exchange bureaus. The acquisition of Access enables the Company to offer end-to-end prepaid card solutions encompassing branded switching, issuer processing, and program management services, primarily focused on the travel sector and in markets outside the United States.
71
In connection with the acquisition, the Company recognized
$6 million
of acquisition-related expenses, which consisted primarily of professional fees related to completing the transaction. The Company recognized
$2 million
and
$4 million
during the years ended December 31, 2011 and 2010, respectively. These amounts were included in general and administrative expenses. The consolidated financial statements include the operating results of Access from the date of the acquisition.
2010 Acquisition
DataCash Group plc
On August 19, 2010, MasterCard entered into an agreement to acquire all the outstanding shares of DataCash Group plc ("DataCash"), a European payment service provider. Pursuant to the terms of the acquisition agreement, the Company acquired DataCash on
October 22, 2010
at a purchase price of
334 million
U.K. pound sterling, or
$534 million
. There was no contingent consideration related to the acquisition.
DataCash provides e-commerce merchants with the ability to process secure payments across the world. DataCash develops and provides outsourced electronic payments solutions, fraud prevention, alternative payment options, back-office reconciliation and solutions for merchants selling via multiple channels. The acquisition of DataCash creates a long-term growth platform in the e-commerce category while enhancing existing MasterCard payment products and expanding its global presence in the internet gateway business.
In connection with the acquisition, the Company recognized
$7 million
of acquisition-related expenses during the year ended December 31, 2010, which consisted primarily of professional fees related to closing the transaction. These amounts were included in general and administrative expenses. The consolidated financial statements include the operating results of DataCash from the date of the acquisition.
Balance Sheet Impact of Significant Acquisitions
The following table summarizes the purchase price allocations for the Access and DataCash acquisitions as of April 15, 2011 and October 22, 2010, respectively:
|
Access
|
DataCash
|
||||||
|
(in millions)
|
|||||||
|
Current assets
|
$
|
50
|
|
$
|
48
|
|
|
|
Property, plant and equipment
|
2
|
|
3
|
|
|||
|
Intangible assets
|
164
|
|
129
|
|
|||
|
Goodwill
|
354
|
|
402
|
|
|||
|
Other assets
|
—
|
|
7
|
|
|||
|
Total assets acquired
|
570
|
|
589
|
|
|||
|
Current liabilities
|
(56
|
)
|
(24
|
)
|
|||
|
Non-current liabilities
|
(33
|
)
|
(31
|
)
|
|||
|
Total liabilities assumed
|
(89
|
)
|
(55
|
)
|
|||
|
Net assets acquired
|
$
|
481
|
|
$
|
534
|
|
|
Purchase consideration has been allocated to the tangible and identifiable intangible assets and to liabilities assumed based on their respective fair values on the acquisition date. The excess of purchase consideration over net assets acquired was recorded as goodwill. The amount of goodwill expected to be deductible for local tax purposes is not significant.
72
Intangible assets consist of developed technologies, customer relationships, tradenames and non-compete agreements, which have useful lives ranging from
1
to
10 years
. See Note 9 (Other Intangible Assets). The following table summarizes the fair value of the acquired intangible assets for the Access and DataCash acquisitions as of April 15, 2011 and October 22, 2010, respectively:
|
Access
|
DataCash
|
||||||||||
|
Intangible Asset Fair Values at Acquisition Date
|
Weighted-Average Useful Life
|
Intangible Asset Fair Values at Acquisition Date
|
Weighted-Average Useful Life
|
||||||||
|
(in millions)
|
(in years)
|
(in millions)
|
(in years)
|
||||||||
|
Customer relationships
|
$
|
132
|
|
8
|
$
|
74
|
|
7
|
|||
|
Developed technologies
|
17
|
|
4
|
42
|
|
5
|
|||||
|
Tradenames
|
15
|
|
6
|
11
|
|
5
|
|||||
|
Non-compete agreements
|
—
|
|
2
|
|
1
|
||||||
|
Total intangible assets
|
$
|
164
|
|
$
|
129
|
|
|||||
Pro forma information related to acquisitions was not included because the impact on the Company's consolidated results of operations was not considered to be material.
Note 3.
Earnings Per Share
Basic earnings per share (“EPS”) for the year ended December 31, 2012 is calculated by dividing net income attributable to MasterCard by the weighted-average number of common shares outstanding during the year. Diluted EPS is calculated by dividing net income attributable to MasterCard by the weighted-average number of common shares outstanding during the year, adjusted for the potentially dilutive effect of stock options and unvested stock units using the treasury stock method.
For the years ended December 31, 2011 and 2010, the dilutive effect of stock options is calculated including the effects of certain equity instruments granted in share-based payment transactions under the two-class method. Unvested share-based payment awards which receive non-forfeitable dividend rights, or dividend equivalents, are considered participating securities and are required to be included in computing basic EPS under the two-class method. The Company declared non-forfeitable dividends on unvested restricted stock units and contingently issuable performance stock units (“Unvested Units”) which were granted prior to 2009.
The components of basic and diluted EPS for common shares for each of the years ended December 31 were as follows:
|
|
2012
|
2011
|
2010
|
||||||||
|
|
(in millions, except per share data)
|
||||||||||
|
Numerator:
|
|||||||||||
|
Net income attributable to MasterCard
|
$
|
2,759
|
|
$
|
1,906
|
|
$
|
1,846
|
|
||
|
Less: Net income allocated to Unvested Units
|
—
|
|
—
|
|
3
|
|
|||||
|
Net income attributable to MasterCard allocated to common shares
|
$
|
2,759
|
|
$
|
1,906
|
|
$
|
1,843
|
|
||
|
Denominator:
|
|||||||||||
|
Basic EPS weighted-average shares outstanding
|
125
|
|
128
|
|
131
|
|
|||||
|
Dilutive stock options and stock units
|
1
|
|
—
|
|
—
|
|
|||||
|
Diluted EPS weighted-average shares outstanding *
|
126
|
|
128
|
|
131
|
|
|||||
|
Earnings per Share
|
|||||||||||
|
Basic
|
$
|
22.02
|
|
$
|
14.90
|
|
$
|
14.10
|
|
||
|
Diluted
|
$
|
21.94
|
|
$
|
14.85
|
|
$
|
14.05
|
|
||
* For the years presented, the calculation of diluted EPS excluded a minimal amount of anti-dilutive share-based payment awards.
73
Note 4.
Supplemental Cash Flows
The following table includes supplemental cash flow disclosures for each of the years ended
December 31
:
|
2012
|
2011
|
2010
|
|||||||||
|
|
(in millions)
|
||||||||||
|
Cash paid for income taxes, net of refunds
|
$
|
1,046
|
|
$
|
908
|
|
$
|
520
|
|
||
|
Cash paid for interest
|
—
|
|
—
|
|
3
|
|
|||||
|
Cash paid for legal settlements
1
|
65
|
|
303
|
|
607
|
|
|||||
|
Non-cash investing and financing activities:
|
|||||||||||
|
Dividends declared but not yet paid
|
37
|
|
19
|
|
20
|
|
|||||
|
Assets recorded pursuant to capital lease
|
11
|
|
14
|
|
—
|
|
|||||
|
Fair value of assets acquired, net of cash acquired
2
|
73
|
|
549
|
|
553
|
|
|||||
|
Fair value of liabilities assumed related to acquisitions
2
|
3
|
|
89
|
|
55
|
|
|||||
|
Fair value of non-controlling interest acquired
|
—
|
|
—
|
|
2
|
|
|||||
1
Amounts in 2012 primarily represent payments under settlement agreements related to the U.S. merchant litigations. Amounts paid into escrow related to the U.S. merchant class litigation is not included in this table. Amounts in 2011 and 2010 primarily represent payments under a settlement agreement relating to the U.S. federal antitrust litigation between MasterCard and American Express Company. Under the terms of the American Express Settlement, MasterCard made
12
quarterly payments of
$150 million
beginning in the third quarter of 2008. The Company made its final quarterly payment of
$150 million
in June 2011.
2
See Note 2 (Acquisitions) for further details.
Note 5.
Fair Value and Investment Securities
Financial Instruments – Recurring Measurements
In accordance with accounting requirements for financial instruments, the Company is disclosing the estimated fair values as of
December 31, 2012
and
2011
of the financial instruments that are within the scope of the accounting guidance, as well as the methods and significant assumptions used to estimate the fair value of those financial instruments. Furthermore, the Company classifies its fair value measurements in the Valuation Hierarchy.
No
transfers were made among the three levels in the Valuation Hierarchy during the years ended
December 31, 2012
and
2011
.
74
The distribution of the Company’s financial instruments which are measured at fair value on a recurring basis within the Valuation Hierarchy was as follows:
|
|
December 31, 2012
|
||||||||||||||
|
|
Quoted Prices
in Active
Markets
(Level 1)
|
Significant
Other
Observable
Inputs
(Level 2)
|
Significant
Unobservable
Inputs
(Level 3)
|
Fair
Value
|
|||||||||||
|
(in millions)
|
|||||||||||||||
|
Municipal securities
1
|
$
|
—
|
|
$
|
531
|
|
$
|
—
|
|
$
|
531
|
|
|||
|
U.S. Government and Agency securities
2
|
—
|
|
582
|
|
—
|
|
582
|
|
|||||||
|
Taxable short-term bond funds
|
210
|
|
—
|
|
—
|
|
210
|
|
|||||||
|
Corporate securities
|
—
|
|
1,246
|
|
—
|
|
1,246
|
|
|||||||
|
Asset-backed securities
|
—
|
|
316
|
|
—
|
|
316
|
|
|||||||
|
Auction rate securities
|
—
|
|
—
|
|
32
|
|
32
|
|
|||||||
|
Other
|
—
|
|
63
|
|
—
|
|
63
|
|
|||||||
|
Total
|
$
|
210
|
|
$
|
2,738
|
|
$
|
32
|
|
$
|
2,980
|
|
|||
|
|
December 31, 2011
|
||||||||||||||
|
|
Quoted Prices
in Active
Markets
(Level 1)
|
Significant
Other
Observable
Inputs
(Level 2)
|
Significant
Unobservable
Inputs
(Level 3)
|
Fair
Value
|
|||||||||||
|
|
(in millions)
|
||||||||||||||
|
Municipal securities
1
|
$
|
—
|
|
$
|
393
|
|
$
|
—
|
|
$
|
393
|
|
|||
|
U.S. Government and Agency securities
|
—
|
|
205
|
|
—
|
|
205
|
|
|||||||
|
Taxable short-term bond funds
|
203
|
|
—
|
|
—
|
|
203
|
|
|||||||
|
Corporate securities
|
—
|
|
325
|
|
—
|
|
325
|
|
|||||||
|
Asset-backed securities
|
—
|
|
69
|
|
—
|
|
69
|
|
|||||||
|
Auction rate securities
|
—
|
|
—
|
|
70
|
|
70
|
|
|||||||
|
Other
|
—
|
|
22
|
|
—
|
|
22
|
|
|||||||
|
Total
|
$
|
203
|
|
$
|
1,014
|
|
$
|
70
|
|
$
|
1,287
|
|
|||
1
Available-for-sale municipal securities are carried at fair value and are included in the above tables. However, a held-to-maturity municipal bond is carried at amortized cost and excluded from the above tables.
2
Excludes amounts held in escrow to fund the litigation settlement of
$726 million
which would be included in Levels 1 and 2 of the Valuation Hierarchy. See Note 10 (Accrued Expenses) for further details.
The fair value of the Company's short-term bond funds are based on quoted prices for identical investments in active markets and are therefore included in Level 1 of the Valuation Hierarchy.
The fair value of the Company's available-for-sale municipal securities, U.S. Government and Agency securities, corporate securities, asset-backed securities and fixed income securities included in the Other category are based on quoted prices for similar assets in active markets and are therefore included in Level 2 of the Valuation Hierarchy. The Company's foreign currency derivative contracts have also been classified within Level 2 in the Other category of the Valuation Hierarchy, as the fair value is based on broker quotes for the same or similar derivative instruments. See Note 20 (Foreign Exchange Risk Management) for further details.
The Company's auction rate securities (“ARS”) investments have been classified within Level 3 of the Valuation Hierarchy as their valuation requires substantial judgment and estimation of factors that are not currently observable in the market due to the lack of trading in the securities. This valuation may be revised in future periods as market conditions evolve. The Company has considered the lack of liquidity in the ARS market and the lack of comparable, orderly transactions when estimating the fair value of its ARS portfolio. Therefore, the Company used the income approach, which included a discounted cash flow analysis of the estimated future cash flows adjusted by a risk premium for the ARS portfolio, to estimate the fair value of its ARS portfolio. The Company estimated the fair value of its ARS portfolio to be a
10%
discount to the par value as of
December 31, 2012
and
2011
. The Company did not realize any material losses on its ARS portfolio during the
year ended December 31, 2012
. When a determination is made to classify a financial instrument within Level 3, the determination is based upon the significance of the
75
unobservable parameters to the overall fair value measurement. However, the fair value determination for Level 3 financial instruments may include observable components.
Financial Instruments - Non-Recurring Measurements
Certain financial instruments are carried on the consolidated balance sheet at cost, which approximates fair value due to their short-term, highly liquid nature. These instruments include cash and cash equivalents, restricted cash, accounts receivable, settlement due from customers, restricted security deposits held for customers, prepaid expenses, accounts payable, settlement due to customers and accrued expenses. In addition, nonmarketable equity investments are measured at fair value on a nonrecurring basis for purposes of initial recognition and impairment testing.
Settlement and Other Guarantee Liabilities
The Company estimates the fair value of its settlement and other guarantees using the market pricing approach which applies market assumptions for relevant though not directly comparable undertakings, as the latter are not observable in the market given the proprietary nature of such guarantees. At
December 31, 2012
and
2011
, the carrying value and fair value of settlement and other guarantee liabilities were not material. Settlement and other guarantee liabilities are classified as Level 3 of the fair value hierarchy as their valuation requires substantial judgment and estimation of factors that are not currently observable in the market. For additional information regarding the Company's settlement and other guarantee liabilities, see Note 19 (Settlement and Other Risk Management).
Refunding Revenue Bonds
The Company holds refunding revenue bonds with the same payment terms, and which contain the right of set-off with a capital lease obligation related to the Company's global technology and operations center located in O'Fallon, Missouri. The Company has netted the refunding revenue bonds and the corresponding capital lease obligation in the consolidated balance sheet and estimates that the carrying value approximates the fair value for these bonds. See Note 7 (Property, Plant and Equipment) for further details.
Non-Financial Instruments
Certain assets and liabilities are measured at fair value on a nonrecurring basis for purposes of initial recognition and impairment testing. The Company's non-financial assets and liabilities measured at fair value on a nonrecurring basis include property, plant and equipment, goodwill and other intangible assets. These assets are not measured at fair value on an ongoing basis; however, they are subject to fair value adjustments in certain circumstances, such as when there is evidence of impairment.
The valuation methods for goodwill and other intangible assets involve assumptions concerning comparable company multiples, discount rates, growth projections and other assumptions of future business conditions. The Company uses a weighted income and market approach for estimating the fair value of its reporting unit, when necessary. As the assumptions employed to measure these assets on a nonrecurring basis are based on management's judgment using internal and external data, these fair value determinations are classified in Level 3 of the Valuation Hierarchy.
76
Amortized Costs and Fair Values – Available-for-Sale Investment Securities
The major classes of the Company’s available-for-sale investment securities, for which unrealized gains and losses are recorded as a separate component of other comprehensive income on the consolidated statement of comprehensive income, and their respective amortized cost basis and fair values as of
December 31, 2012
and
2011
were as follows:
|
|
December 31, 2012
|
||||||||||||||
|
|
Amortized
Cost
|
Gross
Unrealized
Gain
|
Gross
Unrealized
Loss
1
|
Fair
Value
|
|||||||||||
|
(in millions)
|
|||||||||||||||
|
Municipal securities
|
$
|
522
|
|
$
|
9
|
|
$
|
—
|
|
$
|
531
|
|
|||
|
U.S. Government and Agency securities
|
582
|
|
—
|
|
—
|
|
582
|
|
|||||||
|
Taxable short-term bond funds
|
209
|
|
1
|
|
—
|
|
210
|
|
|||||||
|
Corporate securities
|
1,245
|
|
2
|
|
(1
|
)
|
1,246
|
|
|||||||
|
Asset-backed securities
|
316
|
|
—
|
|
—
|
|
316
|
|
|||||||
|
Auction rate securities
2
|
35
|
|
—
|
|
(3
|
)
|
32
|
|
|||||||
|
Other
|
66
|
|
—
|
|
—
|
|
66
|
|
|||||||
|
Total
|
$
|
2,975
|
|
$
|
12
|
|
$
|
(4
|
)
|
$
|
2,983
|
|
|||
|
|
December 31, 2011
|
||||||||||||||
|
|
Amortized
Cost
|
Gross
Unrealized
Gain
|
Gross
Unrealized
Loss
1
|
Fair
Value
|
|||||||||||
|
|
(in millions)
|
||||||||||||||
|
Municipal securities
|
$
|
382
|
|
$
|
11
|
|
$
|
—
|
|
$
|
393
|
|
|||
|
U.S. Government and Agency securities
|
205
|
|
—
|
|
—
|
|
205
|
|
|||||||
|
Taxable short-term bond funds
|
206
|
|
—
|
|
(3
|
)
|
203
|
|
|||||||
|
Corporate securities
|
325
|
|
—
|
|
—
|
|
325
|
|
|||||||
|
Asset-backed securities
|
69
|
|
—
|
|
—
|
|
69
|
|
|||||||
|
Auction rate securities
2
|
78
|
|
—
|
|
(8
|
)
|
70
|
|
|||||||
|
Other
|
20
|
|
—
|
|
—
|
|
20
|
|
|||||||
|
Total
|
$
|
1,285
|
|
$
|
11
|
|
$
|
(11
|
)
|
$
|
1,285
|
|
|||
1
The unrealized losses primarily relate to ARS, which have been in an unrealized loss position longer than 12 months, but have not been deemed other-than-temporarily impaired.
2
Included in other assets on the consolidated balance sheet. See Note 6 (Prepaid Expenses and Other Assets).
The municipal securities are primarily comprised of tax-exempt bonds and are diversified across states and sectors. The U.S. Government and Agency securities are invested in U.S. Government Treasury bills and bonds and U.S. government sponsored Agency bonds and discount notes. Short-term bond funds are primarily invested in U.S. government and sponsored Agency securities, corporate bonds and mortgage-backed securities. Corporate securities are comprised of commercial paper and corporate bonds. The asset-backed securities are investments in bonds which are collateralized primarily by automobile loan receivables. The ARS are exempt from U.S. federal income tax and are fully collateralized by student loans with guarantees (ranging from approximately
95%
to
98%
of principal and interest) by the U.S. government via the Department of Education.
Beginning on February 11, 2008, the auction mechanism that normally provided liquidity to the ARS investments began to fail. Since mid-February 2008, all investment positions in the Company’s ARS investment portfolio have experienced failed auctions. The securities for which auctions have failed have continued to pay interest in accordance with the contractual terms of such instruments and will continue to accrue interest and be auctioned at each respective reset date until the auction succeeds, the issuer redeems the securities or they mature. As of
December 31, 2012
, the ARS market remained illiquid, but issuer call and redemption activity in the ARS student loan sector has occurred periodically since the auctions began to fail. During
2012
,
2011
and
2010
, the Company did not sell any ARS in the auction market, but there were calls at par.
77
The table below includes a roll-forward of the Company’s ARS investments from January 1,
2011
to
December 31, 2012
.
|
|
Significant
Unobservable
Inputs (Level 3)
|
||
|
|
(in millions)
|
||
|
Fair value, December 31, 2010
|
$
|
106
|
|
|
Calls, at par
|
(40
|
)
|
|
|
Recovery of unrealized losses due to issuer calls
|
4
|
|
|
|
Fair value, December 31, 2011
|
70
|
|
|
|
Calls, at par
|
(42
|
)
|
|
|
Recovery of unrealized losses due to issuer calls
|
4
|
|
|
|
Fair value, December 31, 2012
|
$
|
32
|
|
The Company evaluated the estimated impairment of its ARS portfolio to determine if it was other-than-temporary. The Company considered several factors including, but not limited to, the following: (1) the reasons for the decline in value (changes in interest rates, credit event, or market fluctuations); (2) assessments as to whether it is more likely than not that it will hold and not be required to sell the investments for a sufficient period of time to allow for recovery of the cost basis; (3) whether the decline is substantial; and (4) the historical and anticipated duration of the events causing the decline in value. The evaluation for other-than-temporary impairments is a quantitative and qualitative process, which is subject to various risks and uncertainties. The risks and uncertainties include changes in credit quality, market liquidity, timing and amounts of issuer calls, and interest rates. The securities are fully collateralized by student loans with guarantees (ranging from approximately
95%
to
98%
of principal and interest) by the U.S. government via the Department of Education. As of
December 31, 2012
, the Company believed that the unrealized losses on the ARS were not related to credit quality but rather due to the lack of liquidity in the market. The Company believes that it is more likely than not that the Company will hold and not be required to sell its ARS investments until recovery of their cost basis which may be at maturity or earlier if called. Therefore, MasterCard does not consider the unrealized losses to be other-than-temporary. The Company estimated a
10%
discount to the par value of the ARS portfolio at
December 31, 2012
and
2011
. The pre-tax impairment included in accumulated other comprehensive income related to the Company’s ARS was
$3 million
and
$8 million
as of
December 31, 2012
and
2011
, respectively. A hypothetical increase of 100 basis points in the discount rate used in the discounted cash flow analysis would have increased the impairment by
$2 million
and
$3 million
at
December 31, 2012
and
2011
, respectively.
Investment Maturities:
The maturity distribution based on the contractual terms of the Company’s investment securities at
December 31, 2012
was as follows:
|
Available-For-Sale
|
|||||||
|
Amortized
Cost
|
Fair Value
|
||||||
|
(in millions)
|
|||||||
|
Due within 1 year
|
$
|
1,418
|
|
$
|
1,418
|
|
|
|
Due after 1 year through 5 years
|
1,254
|
|
1,263
|
|
|||
|
Due after 5 years through 10 years
|
59
|
|
60
|
|
|||
|
Due after 10 years
|
35
|
|
32
|
|
|||
|
No contractual maturity
|
209
|
|
210
|
|
|||
|
Total
|
$
|
2,975
|
|
$
|
2,983
|
|
|
All the securities due after ten years are ARS. Taxable short-term bond funds have been included in the table above in the no contractual maturity category, as these investments do not have a stated maturity date; however, the short-term bond funds have daily liquidity.
78
Investment Income:
Components of net investment income for each of the years ended December 31 were as follows:
|
2012
|
2011
|
2010
|
|||||||||
|
(in millions)
|
|||||||||||
|
Interest income
|
$
|
36
|
|
$
|
44
|
|
$
|
48
|
|
||
|
Investment securities available-for-sale:
|
|||||||||||
|
Gross realized gains
|
2
|
|
10
|
|
9
|
|
|||||
|
Gross realized losses
|
(1
|
)
|
(2
|
)
|
—
|
|
|||||
|
Total investment income, net
|
$
|
37
|
|
$
|
52
|
|
$
|
57
|
|
||
Interest income primarily consists of interest income generated from cash, cash equivalents, investment securities available-for-sale and investment securities held-to-maturity.
Note 6.
Prepaid Expenses and Other Assets
Prepaid expenses and other current assets consisted of the following at December 31:
|
2012
|
2011
|
||||||
|
(in millions)
|
|||||||
|
Customer and merchant incentives
|
$
|
222
|
|
$
|
190
|
|
|
|
Investment securities held-to-maturity
|
36
|
|
—
|
|
|||
|
Prepaid income taxes
|
77
|
|
35
|
|
|||
|
Income taxes receivable
|
163
|
|
35
|
|
|||
|
Other
|
183
|
|
144
|
|
|||
|
Total prepaid expenses and other current assets
|
$
|
681
|
|
$
|
404
|
|
|
Other assets consisted of the following at December 31:
|
2012
|
2011
|
||||||
|
(in millions)
|
|||||||
|
Customer and merchant incentives
|
$
|
404
|
|
$
|
409
|
|
|
|
Nonmarketable equity investments
|
249
|
|
160
|
|
|||
|
Auction rate securities available-for-sale, at fair value
|
32
|
|
70
|
|
|||
|
Investment securities held-to-maturity
|
—
|
|
36
|
|
|||
|
Income taxes receivable
|
72
|
|
15
|
|
|||
|
Other
|
52
|
|
46
|
|
|||
|
Total other assets
|
$
|
809
|
|
$
|
736
|
|
|
Certain customer and merchant business agreements provide incentives upon entering into the agreement. Customer and merchant incentives represent payments made or amounts to be paid to customers and merchants under business agreements. Amounts to be paid for these incentives and the related liability were included in accrued expenses and other liabilities. Once the payment is made, the liability is relieved. Costs directly related to entering into such an agreement are deferred and amortized over the life of the agreement.
Investments for which the equity method or historical cost method of accounting are used are recorded in other assets on the consolidated balance sheet. MasterCard’s share of net earnings or losses of entities accounted for under the equity method of accounting is included in other income (expense) on the consolidated statement of operations. The Company accounts for nonmarketable equity investments under the historical cost method of accounting when those investments do not qualify for the equity method of accounting. The increase in nonmarketable equity investments is primarily due to two additional investments made in 2012.
79
Note 7.
Property, Plant and Equipment
Property, plant and equipment consisted of the following at December 31:
|
2012
|
2011
|
||||||
|
(in millions)
|
|||||||
|
Building and land
|
$
|
419
|
|
$
|
413
|
|
|
|
Equipment
|
314
|
|
298
|
|
|||
|
Furniture and fixtures
|
54
|
|
53
|
|
|||
|
Leasehold improvements
|
71
|
|
55
|
|
|||
|
Property, plant and equipment
|
858
|
|
819
|
|
|||
|
Less accumulated depreciation and amortization
|
(386
|
)
|
(370
|
)
|
|||
|
Property, plant and equipment, net
|
$
|
472
|
|
$
|
449
|
|
|
Effective March 1, 2009, MasterCard executed a
ten
-year lease between MasterCard, as tenant, and the Missouri Development Finance Board (“MDFB”), as landlord, for MasterCard's global technology and operations center located in O'Fallon, Missouri. This lease includes a bargain purchase option and is thus classified as a capital lease. The building and land assets and capital lease obligation were recorded at
$154 million
which represented the lesser of the present value of the minimum lease payments and the fair value of the building and land assets at the inception of the lease. The Company received refunding revenue bonds issued by MDFB in the same amount,
$154 million
, with the same payment terms as the capital lease and which contain the legal right of offset with the capital lease. The Company has netted its investment in the MDFB refunding revenue bonds and the corresponding capital lease obligation in the consolidated balance sheet. The related leasehold improvements will continue to be amortized over the economic life of the improvements.
As of
December 31, 2012
and
2011
, capital leases, excluding the capital lease noted above, of
$23 million
and
$21 million
, respectively, were included in equipment. Accumulated amortization of these capital leases was
$10 million
as of
December 31, 2012
and
2011
.
Depreciation expense for the above property, plant and equipment, including amortization for capital leases, was
$84 million
,
$77 million
and
$70 million
for the years ended
December 31, 2012
,
2011
and
2010
, respectively.
Note 8.
Goodwill
The changes in the carrying amount of goodwill for the years ended
December 31, 2012
and
2011
were as follows:
|
2012
|
2011
|
|||||||
|
(in millions)
|
||||||||
|
Beginning balance
|
$
|
1,014
|
|
$
|
677
|
|
||
|
Goodwill acquired during the year
|
48
|
|
354
|
|
||||
|
Foreign currency translation
|
30
|
|
(17
|
)
|
||||
|
Ending balance
|
$
|
1,092
|
|
$
|
1,014
|
|
||
During 2012, the Company acquired three businesses and recognized
$48 million
of related goodwill. On April 15, 2011, MasterCard acquired Access. The Company recognized
$354 million
of related goodwill as part of the acquisition of Access. See Note 2 (Acquisitions) for further details. The Company had no accumulated impairment losses for goodwill at
December 31, 2012
or
2011
. Based on annual impairment testing, the Company's reporting unit is not at significant risk of goodwill impairment.
80
Note 9.
Other Intangible Assets
The following table sets forth net intangible assets, other than goodwill, at December 31:
|
2012
|
2011
|
|||||||||||||||||||||||
|
Gross Carrying Amount
|
Accumulated Amortization
|
Net Carrying Amount
|
Gross Carrying Amount
|
Accumulated Amortization
|
Net Carrying Amount
|
|||||||||||||||||||
|
(in millions)
|
||||||||||||||||||||||||
|
Amortized intangible assets:
|
||||||||||||||||||||||||
|
Capitalized software
|
$
|
786
|
|
$
|
(506
|
)
|
$
|
280
|
|
$
|
765
|
|
$
|
(502
|
)
|
$
|
263
|
|
||||||
|
Trademarks and tradenames
|
48
|
|
(31
|
)
|
17
|
|
46
|
|
(26
|
)
|
20
|
|
||||||||||||
|
Customer relationships
|
230
|
|
(54
|
)
|
176
|
|
218
|
|
(26
|
)
|
192
|
|
||||||||||||
|
Other
|
11
|
|
(5
|
)
|
6
|
|
4
|
|
(3
|
)
|
1
|
|
||||||||||||
|
Total
|
1,075
|
|
(596
|
)
|
479
|
|
1,033
|
|
(557
|
)
|
476
|
|
||||||||||||
|
Unamortized intangible assets:
|
||||||||||||||||||||||||
|
Customer relationships
|
193
|
|
—
|
|
193
|
|
189
|
|
—
|
|
189
|
|
||||||||||||
|
Total
|
$
|
1,268
|
|
$
|
(596
|
)
|
$
|
672
|
|
$
|
1,222
|
|
$
|
(557
|
)
|
$
|
665
|
|
||||||
Additions to capitalized software in 2012 primarily related to internally developed software, purchased software and acquisitions. Additions to capitalized software in 2011 primarily related to internally developed software and the acquisition of Access in 2011. See Note 2 (Acquisitions) for further details. Certain intangible assets, including amortizable and unamortizable customer relationships and trademarks and tradenames, are denominated in foreign currencies. As such, the change in intangible assets includes a component attributable to foreign currency translation.
Amortization and impairment expense on the assets above amounted to
$149 million
,
$118 million
and
$80 million
in 2012, 2011 and 2010, respectively. The following table sets forth the estimated future amortization expense on amortizable intangible assets on the balance sheet at December 31, 2012 for the years ending December 31:
|
(in millions)
|
||||
|
2013
|
$
|
150
|
|
|
|
2014
|
128
|
|
||
|
2015
|
87
|
|
||
|
2016
|
34
|
|
||
|
2017 and thereafter
|
80
|
|
||
|
$
|
479
|
|
||
Note 10.
Accrued Expenses
Accrued expenses consisted of the following at December 31:
|
2012
|
2011
|
||||||
|
|
(in millions)
|
||||||
|
Customer and merchant incentives
|
$
|
1,058
|
|
$
|
889
|
|
|
|
Personnel costs
|
354
|
|
345
|
|
|||
|
Advertising
|
122
|
|
144
|
|
|||
|
Income and other taxes
|
94
|
|
82
|
|
|||
|
Other
|
120
|
|
150
|
|
|||
|
Total accrued expenses
|
$
|
1,748
|
|
$
|
1,610
|
|
|
As of
December 31, 2012
and
2011
, the Company's provision related to the U.S. merchant litigations was
$726 million
and
$770 million
, respectively. These amounts are not included in the accrued expense table above and are separately reported as accrued litigation on the consolidated balance sheet. On July 13, 2012, MasterCard entered into a memorandum of understanding
81
to settle the merchant class litigation, and separately agreed in principle to settle all claims brought by the individual merchant plaintiffs. MasterCard's financial portion of the settlements was increased by
$20 million
in the second quarter of 2012 to
$790 million
(on a pre-tax basis). On October 31, 2012, MasterCard made a
$64 million
payment for the individual merchant plaintiffs settlement.
In December 2012, the Company made a
$726 million
payment into a qualified settlement fund related to the U.S. merchant class litigation. The Company has presented these funds as restricted cash for litigation settlement since the use of the funds under the qualified settlement fund is restricted for payment under the preliminary settlement agreement. Subject to court approval, all or a portion of the funds would be returned to the Company in the event that the settlement is not finalized or certain merchants opt out of the settlement agreement. See Note 18 (Legal and Regulatory Proceedings) for further discussion.
Note 11.
Pension Plans, Postretirement Plan, Savings Plan and Other Benefits
The Company maintains a non-contributory, qualified, defined benefit pension plan (the “Qualified Plan”) with a cash balance feature covering substantially all of its U.S. employees hired before July 1, 2007. In September 2010, the Company amended the Qualified Plan to phase out participant pay credit percentages in the years 2011 and 2012 and eliminate the pay credit effective January 1, 2013. Plan participants continue to earn interest credits. As a result of the amendment to the Qualified Plan, the Company recognized a curtailment gain of
$6 million
in the third quarter of 2010 and a reduction in pension liability of
$17 million
at December 31, 2010. The Company also recognized corresponding effects in accumulated other comprehensive income and deferred taxes.
The Company also has an unfunded non-qualified supplemental executive retirement plan (the “Non-qualified Plan”) that provides certain key employees with supplemental retirement benefits in excess of limits imposed on qualified plans by U.S. tax laws. The Non-qualified Plan had settlement gains in 2011 resulting from payments to participants. The term “Pension Plans” includes both the Qualified Plan and the Non-qualified Plan.
The Company maintains a postretirement plan (the “Postretirement Plan”) providing health coverage and life insurance benefits for substantially all of its U.S. employees hired before July 1, 2007.
82
The Company uses a December 31 measurement date for its Pension Plans and its Postretirement Plan (collectively the "Plans"). The following table sets forth the Plans' funded status, key assumptions and amounts recognized in the Company's consolidated balance sheet at December 31:
|
|
Pension Plans
|
Postretirement Plan
|
|||||||||||||
|
|
2012
|
2011
|
2012
|
2011
|
|||||||||||
|
|
(in millions)
|
||||||||||||||
|
Change in benefit obligation
|
|||||||||||||||
|
Benefit obligation at beginning of year
|
$
|
244
|
|
$
|
240
|
|
$
|
77
|
|
$
|
60
|
|
|||
|
Service cost
|
11
|
|
14
|
|
1
|
|
1
|
|
|||||||
|
Interest cost
|
10
|
|
12
|
|
3
|
|
3
|
|
|||||||
|
Plan participants' contributions
|
—
|
|
—
|
|
1
|
|
1
|
|
|||||||
|
Actuarial (gain) loss
|
14
|
|
(4
|
)
|
6
|
|
15
|
|
|||||||
|
Benefits paid
|
(11
|
)
|
(18
|
)
|
(4
|
)
|
(3
|
)
|
|||||||
|
Projected benefit obligation at end of year
|
$
|
268
|
|
$
|
244
|
|
$
|
84
|
|
$
|
77
|
|
|||
|
Change in plan assets
|
|||||||||||||||
|
Fair value of plan assets at beginning of year
|
$
|
243
|
|
$
|
236
|
|
$
|
—
|
|
$
|
—
|
|
|||
|
Actual return on plan assets
|
25
|
|
—
|
|
—
|
|
—
|
|
|||||||
|
Employer contributions
|
10
|
|
25
|
|
3
|
|
2
|
|
|||||||
|
Plan participants' contributions
|
—
|
|
—
|
|
1
|
|
1
|
|
|||||||
|
Benefits paid
|
(11
|
)
|
(18
|
)
|
(4
|
)
|
(3
|
)
|
|||||||
|
Fair value of plan assets at end of year
|
$
|
267
|
|
$
|
243
|
|
$
|
—
|
|
$
|
—
|
|
|||
|
Funded status
|
|||||||||||||||
|
Fair value of plan assets at end of year
|
$
|
267
|
|
$
|
243
|
|
$
|
—
|
|
$
|
—
|
|
|||
|
Projected benefit obligation at end of year
|
268
|
|
244
|
|
84
|
|
77
|
|
|||||||
|
Funded status at end of year
|
$
|
(1
|
)
|
$
|
(1
|
)
|
$
|
(84
|
)
|
$
|
(77
|
)
|
|||
|
Amounts recognized on the consolidated balance sheet consist of:
|
|||||||||||||||
|
Prepaid expenses, long term
|
$
|
5
|
|
$
|
3
|
|
$
|
—
|
|
$
|
—
|
|
|||
|
Accrued expenses
|
(3
|
)
|
—
|
|
(4
|
)
|
(4
|
)
|
|||||||
|
Other liabilities, long term
|
(3
|
)
|
(4
|
)
|
(80
|
)
|
(73
|
)
|
|||||||
|
$
|
(1
|
)
|
$
|
(1
|
)
|
$
|
(84
|
)
|
$
|
(77
|
)
|
||||
|
Amounts recognized in accumulated other comprehensive income consist of:
|
|||||||||||||||
|
Net actuarial loss
|
$
|
50
|
|
$
|
50
|
|
$
|
7
|
|
$
|
1
|
|
|||
|
Prior service credit
|
—
|
|
(2
|
)
|
—
|
|
—
|
|
|||||||
|
$
|
50
|
|
$
|
48
|
|
$
|
7
|
|
$
|
1
|
|
||||
|
Weighted-average assumptions used to determine end of year benefit obligations
|
|||||||||||||||
|
Discount rate
|
3.50
|
%
|
4.25
|
%
|
3.75
|
%
|
4.25
|
%
|
|||||||
|
Rate of compensation increase
|
|||||||||||||||
|
Qualified Plan
|
*
|
5.37
|
%
|
*
|
*
|
||||||||||
|
Non-Qualified Plan
|
5.00
|
%
|
5.00
|
%
|
*
|
*
|
|||||||||
|
Postretirement Plan
|
*
|
*
|
5.37
|
%
|
5.37
|
%
|
|||||||||
* Not Applicable
The accumulated benefit obligation of the Pension Plans was
$267 million
and
$243 million
at
December 31, 2012
and
2011
, respectively.
83
At
December 31, 2012
and
2011
, the Qualified Plan had plan assets in excess of benefit obligations; the Non-qualified Plan had benefit obligations in excess of plan assets. The benefit obligations and plan assets of the Non-qualified Plan were as follows at December 31:
|
2012
|
2011
|
|||||||
|
(in millions)
|
||||||||
|
Projected benefit obligation
|
$
|
6
|
|
$
|
4
|
|
||
|
Accumulated benefit obligation
|
5
|
|
4
|
|
||||
|
Fair value of plan assets
|
—
|
|
—
|
|
||||
The assumed health care cost trend rates at December 31 for the Postretirement Plan were as follows:
|
2012
|
2011
|
||||
|
Health care cost trend rate assumed for next year
|
8.00
|
%
|
7.00
|
%
|
|
|
Rate to which the cost trend rate is expected to decline (the ultimate trend rate)
|
5.00
|
%
|
5.00
|
%
|
|
|
Year that the rate reaches the ultimate trend rate
|
2019
|
|
2016
|
|
|
Components of net periodic benefit cost recorded in general and administrative expenses were as follows for the Plans for each of the years ended December 31:
|
Pension Plans
|
Postretirement Plan
|
|||||||||||||||||||||||
|
2012
|
2011
|
2010
|
2012
|
2011
|
2010
|
|||||||||||||||||||
|
(in millions)
|
||||||||||||||||||||||||
|
Service cost
|
$
|
11
|
|
$
|
14
|
|
$
|
16
|
|
$
|
1
|
|
$
|
1
|
|
$
|
1
|
|
||||||
|
Interest cost
|
10
|
|
12
|
|
12
|
|
3
|
|
3
|
|
3
|
|
||||||||||||
|
Expected return on plan assets
|
(14
|
)
|
(19
|
)
|
(17
|
)
|
—
|
|
—
|
|
—
|
|
||||||||||||
|
Curtailment gain
|
—
|
|
—
|
|
(6
|
)
|
—
|
|
—
|
|
—
|
|
||||||||||||
|
Settlement gain
|
—
|
|
(1
|
)
|
—
|
|
—
|
|
—
|
|
—
|
|
||||||||||||
|
Amortization:
|
||||||||||||||||||||||||
|
Actuarial loss (gain)
|
4
|
|
2
|
|
3
|
|
—
|
|
(1
|
)
|
(1
|
)
|
||||||||||||
|
Prior service credit
|
(2
|
)
|
(2
|
)
|
(2
|
)
|
—
|
|
—
|
|
—
|
|
||||||||||||
|
Net periodic benefit cost
|
$
|
9
|
|
$
|
6
|
|
$
|
6
|
|
$
|
4
|
|
$
|
3
|
|
$
|
3
|
|
||||||
Other changes in plan assets and benefit obligations recognized in other comprehensive income for the years ended December 31 were as follows:
|
Pension Plans
|
Postretirement Plan
|
|||||||||||||||||||||||
|
2012
|
2011
|
2010
|
2012
|
2011
|
2010
|
|||||||||||||||||||
|
(in millions)
|
||||||||||||||||||||||||
|
Curtailment gain
|
$
|
—
|
|
$
|
—
|
|
$
|
(10
|
)
|
$
|
—
|
|
$
|
—
|
|
$
|
—
|
|
||||||
|
Settlement gain
|
—
|
|
1
|
|
—
|
|
—
|
|
—
|
|
—
|
|
||||||||||||
|
Current year actuarial loss (gain)
|
4
|
|
15
|
|
8
|
|
6
|
|
15
|
|
(2
|
)
|
||||||||||||
|
Amortization of actuarial (loss) gain
|
(4
|
)
|
(2
|
)
|
(3
|
)
|
—
|
|
1
|
|
1
|
|
||||||||||||
|
Amortization of prior service credit
|
2
|
|
2
|
|
2
|
|
—
|
|
—
|
|
—
|
|
||||||||||||
|
Total recognized in other comprehensive income (loss)
|
$
|
2
|
|
$
|
16
|
|
$
|
(3
|
)
|
$
|
6
|
|
$
|
16
|
|
$
|
(1
|
)
|
||||||
|
Total recognized in net periodic benefit cost and other comprehensive income
|
$
|
11
|
|
$
|
22
|
|
$
|
3
|
|
$
|
10
|
|
$
|
19
|
|
$
|
2
|
|
||||||
84
The estimated amounts that are expected to be amortized from accumulated other comprehensive income into net periodic benefit cost in 2013 are as follows:
|
Pension Plans
|
Postretirement Plan
|
|||||||
|
(in millions)
|
||||||||
|
Actuarial loss
|
$
|
3
|
|
$
|
—
|
|
||
Weighted-average assumptions used to determine net periodic benefit cost were as follows for the years ended December 31:
|
Pension Plans
|
Postretirement Plan
|
|||||||||||||||||
|
2012
|
2011
|
2010
|
2012
|
2011
|
2010
|
|||||||||||||
|
Discount rate
|
4.25
|
%
|
5.00
|
%
|
5.50
|
%
|
4.25
|
%
|
5.25
|
%
|
5.75
|
%
|
||||||
|
Expected return on plan assets
|
6.00
|
%
|
8.00
|
%
|
8.00
|
%
|
*
|
*
|
*
|
|||||||||
|
Rate of compensation increase:
|
||||||||||||||||||
|
Qualified Plan
|
5.37
|
%
|
5.37
|
%
|
5.37
|
%
|
*
|
*
|
*
|
|||||||||
|
Non-Qualified Plan
|
5.00
|
%
|
5.00
|
%
|
5.00
|
%
|
*
|
*
|
*
|
|||||||||
|
Postretirement Plan
|
*
|
*
|
*
|
5.37
|
%
|
5.37
|
%
|
5.37
|
%
|
|||||||||
* Not Applicable
The assumed health care cost trend rates have a significant effect on the amounts reported for the Postretirement Plan. A one-percentage point change in assumed health care cost trend rates for
2012
would have the following effects:
|
1% increase
|
1% decrease
|
||||||
|
(in millions)
|
|||||||
|
Effect on postretirement obligation
|
$
|
9
|
|
$
|
(7
|
)
|
|
The effect on total service and interest cost components would be less than
$1 million
.
The Company's discount rate assumptions are based on a yield curve derived from high quality corporate bonds, which is matched to the expected cash flows to each of the respective Plans.
For the Qualified Plan, the Company considered the following to determine the assumption for the expected weighted-average return on plan assets: (1) historical return data for both the equity and fixed income markets over the past ten-, twenty- and thirty-year periods; (2) projected returns for both equity and fixed income; and (3) the weighting of assets within our portfolio at
December 31, 2012
by class.
Plan assets are managed with a long-term perspective intended to ensure that there is an adequate level of assets to support benefit payments to participants over the life of the Qualified Plan. In 2011, the Company conducted an asset-liability study to assess the preferred target asset allocation. As a result of the study, the Company increased the asset allocation to fixed income from
30%
to
60%
and decreased the asset allocation to equities from
70%
to
40%
. In 2012, the Company further increased the asset allocation to fixed income to
80%
, and decreased the asset allocation to equities to
20%
. Plan assets are managed within asset allocation ranges, towards targets of
80%
fixed income,
12%
large/medium cap U.S. equity,
4%
small cap U.S. equity, and
4%
non-U.S. equity. The Company intends to further increase the asset allocation to fixed income, subject to certain improvements in Plan funded status. Plan assets are managed by external investment managers. Investment manager performance is measured against benchmarks for each asset class and peer group on quarterly, one-, three-, and five-year periods. An external advisor assists management with investment manager selections and performance evaluations. The balance in cash and cash equivalents is available to pay expected benefit payments and expenses. Considering the asset allocation along with intent to maintain a majority of Plan assets in fixed income securities, the Company reduced the 2013 expected return on plan assets assumption from
6%
to
5%
.
The Valuation Hierarchy of the Qualified Plan's assets is determined using a consistent application of the categorization measurements for the Company's financial instruments. See Note 1 (Summary of Significant Accounting Policies).
85
Mutual funds (including small cap U.S. equity securities and non-U.S. equity securities) are public investment vehicles valued at quoted market prices, which represent the net asset value of the shares held by the Qualified Plan and are therefore included in Level 1 of the Valuation Hierarchy. Commingled funds (including large/medium cap U.S. equity securities and fixed income securities) are valued at unit values provided by investment managers, which are based on the fair value of the underlying investments utilizing public information, independent external valuation from third-party services or third-party advisors, and are therefore included in Level 2 of the Valuation Hierarchy.
The following tables set forth by level, within the Valuation Hierarchy, the Qualified Plan's assets at fair value as of
December 31, 2012
and
2011
:
|
December 31, 2012
|
|||||||||||||||
|
Quoted Prices in Active Markets (Level 1)
|
Significant Other Observable Inputs (Level 2)
|
Significant Unobservable Inputs (Level 3)
|
Fair Value
|
||||||||||||
|
(in millions)
|
|||||||||||||||
|
Mutual funds:
|
|||||||||||||||
|
Money market
|
$
|
2
|
|
$
|
—
|
|
$
|
—
|
|
$
|
2
|
|
|||
|
Domestic small cap equity
|
12
|
|
—
|
|
—
|
|
12
|
|
|||||||
|
International equity
|
12
|
|
—
|
|
—
|
|
12
|
|
|||||||
|
Common and collective funds:
|
|||||||||||||||
|
Domestic large cap equity
|
—
|
|
32
|
|
—
|
|
32
|
|
|||||||
|
Domestic fixed income
|
—
|
|
209
|
|
—
|
|
209
|
|
|||||||
|
Total
|
$
|
26
|
|
$
|
241
|
|
$
|
—
|
|
$
|
267
|
|
|||
|
December 31, 2011
|
|||||||||||||||
|
Quoted Prices in Active Markets (Level 1)
|
Significant Other Observable Inputs (Level 2)
|
Significant Unobservable Inputs (Level 3)
|
Fair Value
|
||||||||||||
|
(in millions)
|
|||||||||||||||
|
Mutual funds:
|
|||||||||||||||
|
Money market
|
$
|
2
|
|
$
|
—
|
|
$
|
—
|
|
$
|
2
|
|
|||
|
Domestic small cap equity
|
19
|
|
—
|
|
—
|
|
19
|
|
|||||||
|
International equity
|
16
|
|
—
|
|
—
|
|
16
|
|
|||||||
|
Common and collective funds:
|
|||||||||||||||
|
Domestic large cap equity
|
—
|
|
59
|
|
—
|
|
59
|
|
|||||||
|
Domestic fixed income
|
—
|
|
147
|
|
—
|
|
147
|
|
|||||||
|
Total
|
$
|
37
|
|
$
|
206
|
|
$
|
—
|
|
$
|
243
|
|
|||
Pursuant to the requirements of the Pension Protection Act of 2006, the Company did not have a mandatory contribution to the Qualified Plan in
2012
,
2011
or
2010
. However, the Company did make voluntary contributions of
$10 million
,
$20 million
and
$20 million
to the Qualified Plan in
2012
,
2011
and
2010
, respectively. The Company is not required to contribute to the Qualified Plan in 2013 and does not intend to make a contribution in 2013. The Company does not make any contributions to the Non-qualified Plan or to its Postretirement Plan other than funding benefit payments.
86
The following table summarizes expected benefit payments through 2022 for the Pension Plans and the Postretirement Plan, including those payments expected to be paid from the Company's general assets. Since the majority of the benefit payments for the Pension Plans are made in the form of lump-sum distributions, actual benefit payments may differ from expected benefit payments.
|
Postretirement Plan
|
||||||||||||||||
|
Pension Plans
|
Benefit Payments
|
Expected Subsidy Receipts
|
Net Benefit Payments
|
|||||||||||||
|
(in millions)
|
||||||||||||||||
|
2013
|
$
|
23
|
|
$
|
4
|
|
$
|
—
|
|
$
|
4
|
|
||||
|
2014
|
21
|
|
4
|
|
—
|
|
4
|
|
||||||||
|
2015
|
21
|
|
4
|
|
—
|
|
4
|
|
||||||||
|
2016
|
19
|
|
4
|
|
—
|
|
4
|
|
||||||||
|
2017
|
19
|
|
5
|
|
—
|
|
5
|
|
||||||||
|
2018 - 2022
|
95
|
|
25
|
|
1
|
|
24
|
|
||||||||
Savings Plan
Substantially all of the Company's U.S. employees are eligible to participate in a defined contribution savings plan (the “Savings Plan”) sponsored by the Company. The Savings Plan allows employees to contribute a portion of their base compensation on a pre-tax and after-tax basis in accordance with specified guidelines. The Company matches a percentage of employees' contributions up to certain limits. In addition, the Company has several defined contribution plans outside of the United States. The Company's contribution expense related to all of its defined contribution plans was
$41 million
,
$35 million
and
$33 million
for
2012
,
2011
and
2010
, respectively.
Severance Plan
The Company provides limited postemployment benefits to eligible former U.S. employees, primarily severance under a formal severance plan (the “Severance Plan”). The Company accounts for severance expense by accruing the expected cost of the severance benefits expected to be provided to former employees after employment over their relevant service periods. The Company updates the assumptions in determining the severance accrual by evaluating the actual severance activity and long-term trends underlying the assumptions. As a result of updating the assumptions, the Company recorded adjustments to severance expense related to the Severance Plan which reduced severance expense by
$5 million
in
2012
and increased the expense by
$1 million
and
$3 million
in
2011
and
2010
, respectively. These amounts were part of total severance expense of
$29 million
,
$23 million
and
$39 million
in
2012
,
2011
and
2010
, respectively, included in general and administrative expenses in the accompanying consolidated statement of operations.
Note 12.
Debt
On November 16, 2012, the Company entered into a committed five-year unsecured
$3 billion
revolving credit facility (the “Credit Facility”), which expires on November 16, 2017. The Credit Facility replaced the Company's prior credit facility. Borrowings under the Credit Facility are available to provide liquidity for general corporate purposes, including providing liquidity in the event of one or more settlement failures by the Company's customers. In addition, for business continuity planning and related purposes, we may borrow and repay amounts under the Credit Facility from time to time. The facility fee and borrowing cost under the Credit Facility are contingent upon the Company's credit rating. At December 31, 2012, the applicable facility fee was
10
basis points on the average daily commitment (whether or not utilized). In addition to the facility fee, interest on borrowings under the Credit Facility would be charged at the London Interbank Offered Rate (LIBOR) plus an applicable margin of
90
basis points, or an alternative base rate. MasterCard had no borrowings under the Credit Facility or prior credit facility at December 31, 2012 and 2011.
The Credit Facility contains customary representations, warranties, events of default and affirmative and negative covenants, including a financial covenant limiting the maximum level of consolidated debt to earnings before interest, taxes, depreciation and amortization. MasterCard was in compliance in all material respects with the covenants of the Credit Facility and prior credit facility at December 31, 2012 and 2011. The majority of Credit Facility lenders are customers or affiliates of customers of MasterCard.
87
On August 2, 2012, the Company filed a universal shelf registration statement to provide additional access to capital, if needed. Pursuant to the shelf registration statement, the Company may from time to time offer to sell debt securities, preferred stock, Class A common stock, depository shares, purchase contracts, units or warrants in one or more offerings.
Note 13.
Stockholders’ Equity
Classes of Capital Stock
MasterCard's amended and restated certificate of incorporation authorizes the following classes of capital stock:
|
Class
|
Par Value Per Share
|
Authorized Shares (in millions)
|
Dividend and Voting Rights
|
||||
|
A
|
$0.0001
|
3,000
|
|
One vote per share
Dividend rights |
|||
|
B
|
$0.0001
|
1,200
|
|
Non-voting
Dividend rights |
|||
|
Preferred
|
$0.0001
|
—
|
|
No shares issued or outstanding at December 31, 2012 and 2011, respectively. Dividend and voting rights are to be determined by the Board of Directors of the Company upon issuance.
|
|||
Ownership and Governance Structure
Equity ownership and voting power of the Company's shares were allocated as follows as of December 31:
|
2012
|
2011
|
|||||||||||
|
Equity Ownership
|
General Voting Power
|
Equity Ownership
|
General Voting Power
|
|||||||||
|
Public Investors (Class A stockholders)
|
85.9
|
%
|
89.4
|
%
|
85.7
|
%
|
89.3
|
%
|
||||
|
Principal or Affiliate Customers (Class B stockholders)
|
3.9
|
%
|
—
|
%
|
4.1
|
%
|
—
|
%
|
||||
|
The MasterCard Foundation (Class A stockholders)
|
10.2
|
%
|
10.6
|
%
|
10.2
|
%
|
10.7
|
%
|
||||
Class B Common Stock Conversions
Shares of Class B common stock are convertible on a one-for-one basis into shares of Class A common stock. Entities eligible to hold our Class B common stock are defined in our amended and restated certificate of incorporation (generally our principal or affiliate customers), and they are restricted from retaining ownership of shares of Class A common stock. Class B stockholders are required to subsequently sell or otherwise transfer any shares of Class A common stock received pursuant to such a conversion.
The Company's certificate of incorporation in effect at the time of its initial public offering in May 2006 (the "IPO") provided that shares of the Class B common stock could not be converted into shares of Class A common stock for subsequent sale until May 31, 2010, the fourth anniversary of the IPO. At the annual meeting of stockholders of the Company on June 7, 2007, the Company's stockholders approved amendments to the Company's certificate of incorporation which were designed to facilitate an accelerated, orderly conversion of Class B common stock into Class A common stock for subsequent sale prior to May 2010. Through “conversion transactions,” in amounts and at times designated by the Company, current holders of shares of Class B common stock who elected to participate were eligible to convert their shares, on a one-for-one basis, into shares of Class A common stock for subsequent sale or transfer to public investors, within a 30 day “transitory” ownership period. Holders of Class B common stock were not allowed to participate in any vote of holders of Class A common stock during this “transitory” ownership period. The number of shares of Class B common stock eligible for conversion transactions was limited to an annual aggregate number of up to
10%
of the total combined outstanding shares of Class A common stock and Class B common stock, based upon the total number of shares outstanding as of December 31 of the prior calendar year. In addition, prior to May 31, 2010, a conversion transaction was not permitted that would have caused the number of shares of Class B common stock to represent less than
15%
of the total number of outstanding shares of Class A common stock and Class B common stock outstanding. A series of conversion
88
programs were implemented and completed from 2007 through 2009, decreasing the total number of shares of Class B common stock to be just above the
15%
threshold.
Commencing on May 31, 2010, the fourth anniversary of the IPO, each share of Class B common stock became eligible for conversion, at the holder’s option, into a share of Class A common stock on a
one
for one basis. In February 2010, the Company's Board of Directors authorized programs to facilitate conversions of shares of Class B common stock (without limits as to the number of shares) on a
one
-for-one basis into shares of Class A common stock for subsequent sale or transfer to public investors, beginning after the May 31, 2010 anniversary date. In June 2010, the Company implemented and completed the first 2010 conversion program which consisted of four one-week periods, during which approximately
8 million
shares of Class B common stock were converted on a one-for-one basis into shares of Class A common stock for subsequent sale or transfer to public investors in accordance with the terms of both the program and the Company's certificate of incorporation in effect at that time. In July 2010, the Company commenced a subsequent, continuous conversion program for the remaining shares of Class B common stock, featuring an “open window” for elections of any size.
Class M Common Stock
Prior to June 1, 2010, MasterCard's amended and restated certificate of incorporation that was in effect as of that time had authorized
1 million
shares of Class M common stock,
$0.0001
par value. Class M Common Stock was generally non-voting, but could elect up to three, but no more than one quarter, of the members of the Company's Board of Directors and approve specified significant corporate actions (e.g., the sale of all of the assets of the Company). Class M common stock had no dividend rights.
Effective June 1, 2010, the outstanding shares of the Company's Class B common stock represented for the first time less than
15%
of the aggregate outstanding shares of the Class A common stock and Class B common stock. Accordingly, pursuant to the Company's amended and restated certificate of incorporation in effect at that time, all outstanding shares of the Company's Class M common stock were automatically transferred to the Company and retired, and are no longer available for issue or reissue. Additionally, the Company no longer has authority to issue additional shares of Class M common stock. The retirement of the Class M common stock had no effect on the Company's financial position or basic or diluted EPS.
The MasterCard Foundation
In connection and simultaneously with the IPO, the Company issued and donated
13.5 million
newly authorized shares of Class A common stock to The MasterCard Foundation (the “Foundation”). The Foundation is a private charitable foundation incorporated in Canada that is controlled by directors who are independent of the Company and its principal customers. Under the terms of the donation, the Foundation became able to resell the donated shares in May 2010 and to the extent necessary to meet charitable disbursement requirements dictated by Canadian tax law. Under Canadian tax law, the Foundation is generally required to disburse at least
3.5%
of its assets not used in administration each year for qualified charitable disbursements. However, the Foundation obtained permission from the Canadian tax authorities to defer the giving requirements for up to
ten
years, which was extended in 2011 to
15
years. The Foundation, at its discretion, may decide to meet its disbursement obligations on an annual basis or to settle previously accumulated obligations during any given year. The Foundation will be permitted to sell all of its remaining shares beginning twenty years and eleven months after the consummation of the IPO.
Stock Repurchase Programs
In June 2012, the Company’s Board of Directors approved a share repurchase program authorizing the Company to repurchase up to
$1.5 billion
of its Class A common stock (the "June 2012 Share Repurchase Program"). This program became effective in June 2012 at the completion of the Company’s previously announced
$2 billion
Class A share repurchase program. (This
$2 billion
repurchase program consisted of
$1 billion
authorized in September 2010 and
$1 billion
authorized in
April 2011
.)
89
The following table summarizes the Company's share repurchase authorizations of its Class A common stock through December 31, 2012, as well as historical purchases:
|
Authorization Dates
|
||||||||||||
|
|
June 2012
|
April 2011
1
|
Total
|
|||||||||
|
(in millions, except average price data)
|
||||||||||||
|
Board authorization
|
$
|
1,500
|
|
$
|
2,000
|
|
$
|
3,500
|
|
|||
|
Dollar-value of shares repurchased in 2011
|
**
|
|
$
|
1,148
|
|
$
|
1,148
|
|
||||
|
Remaining authorization at December 31, 2011
|
**
|
|
$
|
852
|
|
$
|
852
|
|
||||
|
Dollar-value of shares repurchased in 2012
|
$
|
896
|
|
$
|
852
|
|
$
|
1,748
|
|
|||
|
Remaining authorization at December 31, 2012
|
$
|
604
|
|
$
|
—
|
|
$
|
604
|
|
|||
|
Shares repurchased in 2011
|
**
|
|
4.43
|
|
4.43
|
|
||||||
|
Average price paid per share in 2011
|
**
|
|
$
|
258.92
|
|
$
|
258.92
|
|
||||
|
Shares repurchased in 2012
|
1.95
|
|
2.11
|
|
4.06
|
|
||||||
|
Average price paid per share in 2012
|
$
|
460.22
|
|
$
|
403.53
|
|
$
|
430.71
|
|
|||
|
Cumulative shares repurchased through December 31, 2012
|
1.95
|
|
6.54
|
|
8.49
|
|
||||||
|
Cumulative average price paid per share
|
$
|
460.22
|
|
$
|
305.60
|
|
$
|
341.04
|
|
|||
**
Not applicable
1
The initial authorization in September 2010 for
$1 billion
was amended in April 2011 to increase the authorization to
$2 billion
.
As of
January 25, 2013
, the cumulative repurchases by the Company under the June 2012 Share Repurchase Program totaled approximately
2.3 million
shares of its Class A common stock for an aggregate cost of approximately
$1.1 billion
at an average price of
$467.44
per share of Class A common stock.
On February 5, 2013, the Company's Board of Directors approved a new share repurchase program authorizing the Company to repurchase up to
$2 billion
of its Class A common stock. The new share repurchase program will become effective at the completion of the Company's June 2012 Share Repurchase Program.
Note 14.
Accumulated Other Comprehensive Income (Loss)
The changes in the balances of each component of accumulated other comprehensive income (loss) for the years ended
December 31, 2012
and
2011
were as follows:
|
Foreign Currency Translation Adjustments
|
Defined Benefit Pension and Other Postretirement Plans, Net of Tax
|
Investment Securities Available-for-Sale, Net of Tax
|
Accumulated Other Comprehensive Income (Loss)
|
|||||||||||||
|
(in millions)
|
||||||||||||||||
|
Balance at December 31, 2010
|
$
|
105
|
|
$
|
(12
|
)
|
$
|
2
|
|
$
|
95
|
|
||||
|
Current period other comprehensive loss
|
(75
|
)
|
(20
|
)
|
(2
|
)
|
(97
|
)
|
||||||||
|
Balance at December 31, 2011
|
30
|
|
(32
|
)
|
—
|
|
(2
|
)
|
||||||||
|
Current period other comprehensive income (loss)
|
63
|
|
(5
|
)
|
5
|
|
63
|
|
||||||||
|
Balance at December 31, 2012
|
$
|
93
|
|
$
|
(37
|
)
|
$
|
5
|
|
$
|
61
|
|
||||
Note 15.
Share Based Payment and Other Benefits
In May 2006, the Company implemented the MasterCard Incorporated 2006 Long-Term Incentive Plan, which was amended and restated as of October 13, 2008 (the “LTIP”). The LTIP is a shareholder-approved omnibus plan that permits the grant of various types of equity awards to employees.
The Company has granted non-qualified stock options (“options”), restricted stock units (“RSUs”) and performance stock units (“PSUs”) under the LTIP. The options, which expire
ten
years from the date of grant, generally vest ratably over
four
years from the date of grant. The RSUs vest after
three
to
four
years. The PSUs vest after
three
years. The Company uses the straight-
90
line method of attribution for expensing equity awards. Compensation expense is recorded net of estimated forfeitures. Estimates are adjusted as appropriate.
Upon termination of employment, a participant's unvested awards are forfeited. However, when a participant terminates employment due to disability or retirement more than six months after receiving the award, the participant retains all of their awards without providing additional service to the Company. Retirement eligibility is dependent upon age and years of service, as follows: age 55 with
ten
years of service, age 60 with
five
years of service and age 65 with
two
years of service. Compensation expense is recognized over the shorter of the vesting periods stated in the LTIP or the date the individual becomes eligible to retire but not less than six months.
There are
11,550,000
shares of Class A common stock reserved for equity awards under the LTIP. Although the LTIP permits the issuance of shares of Class B common stock, no such shares have been reserved for issuance. Shares issued as a result of option exercises and the conversions of RSUs and PSUs were funded primarily with the issuance of new shares of Class A common stock.
Stock Options
The fair value of each option is estimated on the date of grant using a Black-Scholes option pricing model. The following table presents the weighted-average assumptions used in the valuation and the resulting weighted-average fair value per option granted for the years ended December 31:
|
2012
|
2011
|
2010
|
||||||||||
|
Risk-free rate of return
|
1.2
|
%
|
2.6
|
%
|
2.7
|
%
|
||||||
|
Expected term (in years)
|
6.25
|
|
6.25
|
|
6.25
|
|
||||||
|
Expected volatility
|
35.2
|
%
|
33.7
|
%
|
32.7
|
%
|
||||||
|
Expected dividend yield
|
0.3
|
%
|
0.2
|
%
|
0.3
|
%
|
||||||
|
Weighted-average fair value per option granted
|
$
|
148.45
|
|
$
|
89.11
|
|
$
|
84.62
|
|
|||
The risk-free rate of return was based on the U.S. Treasury yield curve in effect on the date of grant. The Company utilizes the simplified method for calculating the expected term of the option based on the vesting terms and the contractual life of the option. The expected volatility for options granted was based on the average of the implied volatility of MasterCard and a blend of the historical volatility of MasterCard and the historical volatility of a group of companies that management believes is generally comparable to MasterCard. The expected dividend yields were based on the Company's expected annual dividend rate on the date of grant.
The following table summarizes the Company's option activity for the
year ended December 31, 2012
:
|
Options
|
Weighted-Average Exercise Price
|
Weighted-Average Remaining Contractual Term
|
Aggregate Intrinsic Value
|
|||||||||
|
(in thousands)
|
(in years)
|
(in millions)
|
||||||||||
|
Outstanding at January 1, 2012
|
766
|
|
$
|
177
|
|
|||||||
|
Granted
|
133
|
|
$
|
420
|
|
|||||||
|
Exercised
|
(253
|
)
|
$
|
121
|
|
|||||||
|
Forfeited/expired
|
(5
|
)
|
$
|
286
|
|
|||||||
|
Outstanding at December 31, 2012
|
641
|
|
$
|
248
|
|
7.2
|
$
|
156
|
|
|||
|
Exercisable at December 31, 2012
|
269
|
|
$
|
185
|
|
6.1
|
$
|
82
|
|
|||
|
Options vested and expected to vest at December 31, 2012
|
632
|
|
$
|
247
|
|
7.2
|
$
|
154
|
|
|||
The total intrinsic value of options exercised during the years ended December 31,
2012, 2011 and 2010
was
$77 million
,
$22 million
and
$26 million
, respectively. As of
December 31, 2012
, there was
$22 million
of total unrecognized compensation cost related to non-vested options. The cost is expected to be recognized over a weighted-average period of
2.6
years.
91
Restricted Stock Units
The following table summarizes the Company's RSU activity for the year ended
December 31, 2012
:
|
Units
|
Weighted-Average Grant-Date Fair Value
|
Weighted-Average Remaining Contractual Term
|
Aggregate Intrinsic Value
|
|||||||||
|
(in thousands)
|
(in years)
|
(in millions)
|
||||||||||
|
Outstanding at January 1, 2012
|
614
|
|
$
|
217
|
|
|||||||
|
Granted
|
165
|
|
$
|
422
|
|
|||||||
|
Converted
|
(215
|
)
|
$
|
163
|
|
|||||||
|
Forfeited/expired
|
(19
|
)
|
$
|
273
|
|
|||||||
|
Outstanding at December 31, 2012
|
545
|
|
$
|
298
|
|
1.2
|
$
|
268
|
|
|||
|
RSUs vested and expected to vest at December 31, 2012
|
528
|
|
$
|
300
|
|
1.3
|
$
|
259
|
|
|||
The fair value of each RSU is the closing stock price on the New York Stock Exchange of the Company's Class A common stock on the date of grant. The weighted-average grant-date fair value of RSUs granted during the years ended December 31,
2012, 2011 and 2010
was
$422
,
$257
and
$231
, respectively. Upon vesting, a portion of the RSU award may be withheld to satisfy the minimum statutory withholding taxes. The remaining RSUs will be settled in shares of the Company's Class A common stock after the vesting period. The total intrinsic value of RSUs converted into shares of Class A common stock during the years ended December 31,
2012, 2011 and 2010
was
$91 million
,
$4 million
and
$234 million
, respectively. As of
December 31, 2012
, there was
$74 million
of total unrecognized compensation cost related to non-vested RSUs. The cost is expected to be recognized over a weighted-average period of
1.8
years.
Performance Stock Units
The following table summarizes the Company's PSU activity for the year ended
December 31, 2012
:
|
Units
|
Weighted-Average Issue-Date Fair Value
1
|
Weighted-Average Remaining Contractual Term
|
Aggregate Intrinsic Value
|
|||||||||
|
(in thousands)
|
(in years)
|
(in millions)
|
||||||||||
|
Outstanding at January 1, 2012
|
151
|
|
$
|
203
|
|
|||||||
|
Issued
|
26
|
|
$
|
391
|
|
|||||||
|
Converted
|
(64
|
)
|
$
|
158
|
|
|||||||
|
Forfeited/expired
|
—
|
|
$
|
—
|
|
|||||||
|
Outstanding at December 31, 2012
|
113
|
|
$
|
272
|
|
0.9
|
$
|
56
|
|
|||
|
PSUs vested and expected to vest at December 31, 2012
|
111
|
|
$
|
272
|
|
0.9
|
$
|
54
|
|
|||
1
Grant date is not established until the performance terms are fixed and the ultimate number of shares to be issued is determined.
The weighted-average issue-date fair value of PSUs issued during the years ended December 31,
2012, 2011 and 2010
was
$391
,
$224
and
$219
, respectively.
Whether or not the PSUs are granted will be based upon MasterCard's performance against a predetermined return on equity goal, with an average of return on equity over the three-year period commencing on January 1 of the grant year, yielding threshold, target or maximum performance, with a potential adjustment determined at the discretion of the MasterCard Human Resources and Compensation Committee of the Board of Directors using subjective quantitative and qualitative goals that are established at the beginning of each year in the performance period. These goals are expected to include MasterCard performance against internal management metrics and external relative metrics. The
2012, 2011 and 2010
grant years beginning January 1 have a performance period ending December 2014, 2013 and 2012, respectively.
These PSUs have been classified as equity awards, will be settled by delivering stock to the employees and contain service and performance conditions. The initial fair value of each PSU is the closing price on the New York Stock Exchange of the
92
Company's Class A common stock on the date of issuance. Given that the performance terms are subjective and not fixed on the date of issuance, the PSUs will be remeasured at the end of each reporting period, at fair value, until the time the performance conditions are fixed and the ultimate number of shares to be issued is determined. Estimates are adjusted as appropriate. Compensation expense is calculated using the number of PSUs expected to vest, multiplied by the period ending price of a share of MasterCard's Class A common stock on the New York Stock Exchange, less previously recorded compensation expense.
With regard to the PSUs issued in 2009, the Company awarded
143%
of the original number of shares issued based on the Company's performance against a predetermined return on equity goal, with an average return on equity per year over the three-year period commencing January 1, 2009 and ending December 31, 2011. The grant-date fair value for each PSU was
$343
.
With regard to the PSUs issued in 2010, the Company expects to award
138%
of the original number of shares issued based on the Company's performance against a predetermined return on equity goal, with an average return on equity per year over the three-year period commencing January 1, 2010 and ending December 31, 2012. The grant-date fair value for each PSU is
$518
.
In
2012, 2011 and 2010
,
64 thousand
,
381 thousand
and
550 thousand
PSUs, respectively, were converted into shares of Class A common stock. The total intrinsic value of PSUs converted into shares of Class A common stock during the years ended December 31,
2012, 2011 and 2010
, was
$27 million
,
$93 million
and
$123 million
, respectively.
As of
December 31, 2012
, there was
$8 million
of total unrecognized compensation cost related to non-vested PSUs. The cost is expected to be recognized over a weighted-average period of
1.6
years.
Additional Information
The following table includes additional share-based payment information for each of the years ended December 31:
|
2012
|
2011
|
2010
|
|||||||||
|
(in millions)
|
|||||||||||
|
Compensation expense: Stock Options, RSUs and PSUs
|
$
|
88
|
|
$
|
79
|
|
$
|
62
|
|
||
|
Income tax benefit recognized for equity awards
|
30
|
|
28
|
|
22
|
|
|||||
|
Income tax benefit related to options exercised
|
27
|
|
7
|
|
9
|
|
|||||
|
Additional paid-in-capital balance attributed to equity awards
|
187
|
|
151
|
|
156
|
|
|||||
On July 18, 2006, the Company's stockholders approved the MasterCard Incorporated 2006 Non-Employee Director Equity Compensation Plan, which was amended and restated as of October 13, 2008 (the “Director Plan”). The Director Plan provides for awards of Deferred Stock Units (“DSUs”) to each director of the Company who is not a current employee of the Company. There are
100 thousand
shares of Class A common stock reserved for DSU awards under the Director Plan. During the years ended
December 31, 2012
,
2011
and
2010
, the Company granted
4 thousand
,
4 thousand
and
5 thousand
DSUs, respectively. The fair value of the DSUs was based on the closing stock price on the New York Stock Exchange of the Company's Class A common stock on the date of grant. The weighted-average grant-date fair value of DSUs granted during the years ended
December 31, 2012
,
2011
and
2010
was
$408
,
$274
and
$217
, respectively. The DSUs vested immediately upon grant and will be settled in shares of the Company's Class A common stock on the fourth anniversary of the date of grant. Accordingly, the Company recorded general and administrative expense of
$1 million
for the DSUs for each of the years ended
December 31, 2012
,
2011
and
2010
. During the years ended
December 31, 2012
,
2011
and
2010
, there were approximately
4 thousand
,
7 thousand
and
25 thousand
DSUs converted into shares of Class A common stock, respectively. The total intrinsic value of these DSUs converted into shares of Class A common stock was
$2 million
,
$2 million
and
$5 million
, respectively.
93
Note 16.
Commitments
At
December 31, 2012
, the Company had the following future minimum payments due under non-cancelable agreements:
|
Total
|
Capital
Leases
|
Operating
Leases
|
Sponsorship,
Licensing &
Other
|
||||||||||||
|
|
(in millions)
|
||||||||||||||
|
2013
|
$
|
295
|
|
$
|
45
|
|
$
|
19
|
|
$
|
231
|
|
|||
|
2014
|
176
|
|
5
|
|
19
|
|
152
|
|
|||||||
|
2015
|
135
|
|
1
|
|
17
|
|
117
|
|
|||||||
|
2016
|
66
|
|
—
|
|
15
|
|
51
|
|
|||||||
|
2017
|
27
|
|
—
|
|
12
|
|
15
|
|
|||||||
|
Thereafter
|
40
|
|
—
|
|
21
|
|
19
|
|
|||||||
|
Total
|
$
|
739
|
|
$
|
51
|
|
$
|
103
|
|
$
|
585
|
|
|||
Included in the table above are capital leases with imputed interest expense of
$2 million
and a net present value of minimum lease payments of
$48 million
. In addition, at
December 31, 2012
,
$66 million
of the future minimum payments in the table above for operating leases, sponsorship, licensing and other agreements was accrued. Consolidated rental expense for the Company’s leased office space, which is recognized on a straight-line basis over the life of the lease, was
$36 million
,
$30 million
and
$27 million
for the years ended
December 31, 2012
,
2011
and
2010
, respectively. Consolidated lease expense for automobiles, computer equipment and office equipment was
$11 million
,
$9 million
and
$8 million
for the years ended
December 31, 2012
,
2011
and
2010
, respectively.
In January 2003, MasterCard purchased a building in Kansas City, Missouri for approximately
$24 million
. During 2003, MasterCard entered into agreements with the City of Kansas City for (i) the sale-leaseback of the building and related equipment which totaled
$36 million
and (ii) the purchase of municipal bonds for the same amount which have been classified as investment securities held-to-maturity. The leaseback has been accounted for as a capital lease as the agreement contains a bargain purchase option at the end of the
ten
-year lease term. The building and related equipment are being depreciated over their estimated economic life in accordance with the Company's policy. Rent of
$2 million
is due annually and is equal to the interest due on the municipal bonds. The future minimum lease payments are
$38 million
and are included in the table above.
Note 17.
Income Taxes
The total income tax provision for the years ended
December 31
is comprised of the following components:
|
2012
|
2011
|
2010
|
||||||||||
|
(in millions)
|
||||||||||||
|
Current
|
||||||||||||
|
Federal
|
$
|
524
|
|
$
|
619
|
|
$
|
379
|
|
|||
|
State and local
|
24
|
|
30
|
|
17
|
|
||||||
|
Foreign
|
390
|
|
369
|
|
301
|
|
||||||
|
938
|
|
1,018
|
|
697
|
|
|||||||
|
Deferred
|
|
|
|
|||||||||
|
Federal
|
248
|
|
(155
|
)
|
225
|
|
||||||
|
State and local
|
7
|
|
(6
|
)
|
8
|
|
||||||
|
Foreign
|
(19
|
)
|
(15
|
)
|
(20
|
)
|
||||||
|
236
|
|
(176
|
)
|
213
|
|
|||||||
|
Total income tax expense
|
$
|
1,174
|
|
$
|
842
|
|
$
|
910
|
|
|||
The domestic and foreign components of income before income taxes for the years ended
December 31
are as follows:
|
2012
|
2011
|
2010
|
||||||||||
|
(in millions)
|
||||||||||||
|
United States
|
$
|
2,508
|
|
$
|
1,415
|
|
$
|
2,198
|
|
|||
|
Foreign
|
1,424
|
|
1,331
|
|
559
|
|
||||||
|
Total income before income taxes
|
$
|
3,932
|
|
$
|
2,746
|
|
$
|
2,757
|
|
|||
94
MasterCard has not provided for U.S. federal income and foreign withholding taxes on approximately
$2.6 billion
of undistributed earnings from non-U.S. subsidiaries as of
December 31, 2012
because such earnings are intended to be reinvested indefinitely outside of the United States. If these earnings were distributed, foreign tax credits may become available under current law to reduce the resulting U.S. income tax liability. However, it is not practicable to determine the amount of the tax and credits.
The provision for income taxes differs from the amount of income tax determined by applying the U.S. federal statutory income tax rate of
35.0%
to pretax income for the years ended
December 31
, as a result of the following:
|
2012
|
2011
|
2010
|
|||||||||||||||||||
|
Amount
|
Percent
|
Amount
|
Percent
|
Amount
|
Percent
|
||||||||||||||||
|
(in millions, except percentages)
|
|||||||||||||||||||||
|
Income before income tax expense
|
$
|
3,932
|
|
$
|
2,746
|
|
$
|
2,757
|
|
||||||||||||
|
Federal statutory tax
|
1,376
|
|
35.0
|
%
|
961
|
|
35.0
|
%
|
965
|
|
35.0
|
%
|
|||||||||
|
State tax effect, net of federal benefit
|
23
|
|
0.6
|
%
|
14
|
|
0.5
|
%
|
19
|
|
0.7
|
%
|
|||||||||
|
Foreign tax effect
|
(175
|
)
|
(4.4
|
)%
|
(133
|
)
|
(4.9
|
)%
|
(24
|
)
|
(0.9
|
)%
|
|||||||||
|
Non-deductible expenses and other differences
|
(21
|
)
|
(0.5
|
)%
|
34
|
|
1.2
|
%
|
23
|
|
0.9
|
%
|
|||||||||
|
Tax exempt income
|
(2
|
)
|
(0.1
|
)%
|
(3
|
)
|
(0.1
|
)%
|
(5
|
)
|
(0.2
|
)%
|
|||||||||
|
Foreign repatriation
|
(27
|
)
|
(0.7
|
)%
|
(31
|
)
|
(1.1
|
)%
|
(68
|
)
|
(2.5
|
)%
|
|||||||||
|
Income tax expense
|
$
|
1,174
|
|
29.9
|
%
|
$
|
842
|
|
30.6
|
%
|
$
|
910
|
|
33.0
|
%
|
||||||
Effective Income Tax Rate
The effective income tax rates for the years ended
December 31, 2012
,
2011
and
2010
were
29.9%
,
30.6%
and
33.0%
, respectively. The effective tax rate for 2012 was lower than the effective tax rate for 2011 primarily due to discrete benefits related to additional export incentives and the conclusion of tax examinations in certain jurisdictions, as well as a larger benefit from the domestic production activities deduction in the U.S. related to our authorization software. The effective tax rate for 2011 was lower than the effective tax rate for 2010 primarily due to a more favorable geographic mix of earnings, including the tax benefit related to the U.S. merchant litigations, and the recognition of discrete adjustments in 2011.
In 2010, in connection with the expansion of the Company's operations in the Asia Pacific, Middle East and Africa region, the Company's subsidiary in Singapore, MasterCard Asia Pacific Pte. Ltd. (“MAPPL”) received an incentive grant from the Singapore Ministry of Finance. The incentive had provided MAPPL with, among other benefits, a reduced income tax rate for the
10
-year period commencing January 1, 2010 on taxable income in excess of a base amount. The Company continued to explore business opportunities in this region, resulting in an expansion of the incentives being granted by the Ministry of Finance, including a further reduction to the income tax rate on taxable income in excess of a revised fixed base amount commencing July 1, 2011 and continuing through December 31, 2025. Without the incentive grant, MAPPL would have been subject to the statutory income tax rate on its 2011 earnings. For
2012
and
2011
, the impact of the incentive grant received from the Ministry of Finance resulted in a reduction of MAPPL's income tax liability of
$64 million
, or
$0.51
per diluted share, and
$44 million
, or
$0.34
per diluted share, respectively.
95
Deferred Taxes
Deferred tax assets and liabilities represent the expected future tax consequences of temporary differences between the carrying amounts and the tax basis of assets and liabilities. The components of deferred tax assets and liabilities at
December 31
are as follows:
|
2012
|
2011
|
|||||||
|
(in millions)
|
||||||||
|
Deferred Tax Assets
|
||||||||
|
Accrued liabilities
|
$
|
91
|
|
$
|
358
|
|
||
|
Compensation and benefits
|
173
|
|
143
|
|
||||
|
State taxes and other credits
|
96
|
|
95
|
|
||||
|
Net operating losses
|
34
|
|
21
|
|
||||
|
Other items
|
31
|
|
34
|
|
||||
|
Less: Valuation allowance
|
(25
|
)
|
(17
|
)
|
||||
|
Total Deferred Tax Assets
|
$
|
400
|
|
$
|
634
|
|
||
|
Deferred Tax Liabilities
|
||||||||
|
Prepaid expenses and other accruals
|
$
|
56
|
|
$
|
54
|
|
||
|
Intangible assets
|
113
|
|
116
|
|
||||
|
Property, plant and equipment
|
122
|
|
113
|
|
||||
|
Other items
|
42
|
|
42
|
|
||||
|
Total Deferred Tax Liabilities
|
$
|
333
|
|
325
|
|
|||
|
Net Deferred Tax Assets
1
|
$
|
67
|
|
$
|
309
|
|
||
1
$17 million
and
$9 million
of current deferred tax liabilities have been included in other current liabilities on the balance sheet at December 31, 2012 and 2011, respectively.
The
2012
and
2011
valuation allowances relate primarily to the Company's ability to recognize tax benefits associated with certain foreign net operating losses. The recognition of these benefits is dependent upon the future taxable income in such foreign jurisdictions and the ability under tax law in these jurisdictions to utilize net operating losses following a change in control.
A reconciliation of the beginning and ending balance for the Company's unrecognized tax benefits for the years ended
December 31
, is as follows:
|
2012
|
2011
|
2010
|
||||||||||
|
(in millions)
|
||||||||||||
|
Beginning balance
|
$
|
214
|
|
$
|
165
|
|
$
|
146
|
|
|||
|
Additions:
|
|
|
|
|||||||||
|
Current year tax positions
|
58
|
|
34
|
|
22
|
|
||||||
|
Prior year tax positions
|
15
|
|
23
|
|
15
|
|
||||||
|
Reductions:
|
|
|
|
|||||||||
|
Prior year tax positions, due to changes in judgments
|
(21
|
)
|
(2
|
)
|
(12
|
)
|
||||||
|
Settlements with tax authorities
|
(2
|
)
|
(1
|
)
|
(6
|
)
|
||||||
|
Expired statute of limitations
|
(7
|
)
|
(5
|
)
|
—
|
|
||||||
|
Ending balance
|
$
|
257
|
|
$
|
214
|
|
$
|
165
|
|
|||
The entire unrecognized tax benefits of
$257 million
, if recognized, would reduce the effective tax rate. It is possible that the amount of unrecognized benefit with respect to the Company's uncertain tax positions may change within the
next twelve months
. An estimate of the range of possible changes cannot be made until the issues are further developed, the examinations close or the statutes expire. The Company is subject to tax in the United States, Belgium, Singapore and various other foreign jurisdictions, as well as state and local jurisdictions. The Company has effectively settled its U.S. federal income tax obligations through 2008. With limited exception, the Company is no longer subject to state and local or foreign examinations by tax authorities for years before
2002
.
It is the Company's policy to account for interest expense related to income tax matters as interest expense in its statement of operations, and to include penalties related to income tax matters in the income tax provision. For the years ended
December 31, 2012
,
2011
and
2010
, the Company recorded tax-related interest income of
$1 million
,
$2 million
and
$5 million
, respectively, in
96
its consolidated statement of operations. At
December 31, 2012
and
2011
the Company had a net income tax-related interest payable of
$15 million
and
$16 million
, respectively, in its consolidated balance sheet. At
December 31, 2012
and
2011
, the amounts the Company had recognized for penalties payable in its consolidated balance sheet were not significant.
Note 18.
Legal and Regulatory Proceedings
MasterCard is a party to legal and regulatory proceedings with respect to a variety of matters in the ordinary course of business. Some of these proceedings are based on complex claims involving substantial uncertainties and unascertainable damages. Accordingly, except as discussed below, it is not possible to determine the probability of loss or estimate damages. Further, except as discussed below, MasterCard has not established reserves for any of these proceedings. Except as identified below, MasterCard does not believe that the outcome of any existing legal or regulatory proceedings to which it is a party will have a material adverse effect on its results of operations, financial condition or overall business. However, with respect to the matters discussed below, an adverse judgment or other outcome or settlement with respect to any such proceedings could result in fines or payments by MasterCard and/or could require MasterCard to change its business practices. In addition, an adverse outcome in a regulatory proceeding could lead to the filing of civil damage claims and possibly result in damage awards in amounts that could be significant. Any of these events could have a material adverse effect on MasterCard's results of operations, financial condition and overall business.
Department of Justice Antitrust Litigation and Related Private Litigations
In October 1998, the U.S. Department of Justice (“DOJ”) filed suit against MasterCard International, Visa U.S.A., Inc. and Visa International Corp. in the U.S. District Court for the Southern District of New York alleging that both MasterCard's and Visa's governance structure and policies violated U.S. federal antitrust laws. The DOJ challenged (1) “dual governance”, where a financial institution has a representative on the Board of Directors of MasterCard or Visa while a portion of its card portfolio is issued under the brand of the other association, and (2) both MasterCard's Competitive Programs Policy (“CPP”) and a Visa bylaw provision that prohibited financial institutions participating in the respective associations from issuing competing proprietary payment cards (such as American Express or Discover). In October 2001, the judge issued an opinion upholding the legality and pro-competitive nature of dual governance. However, the judge also held that MasterCard's CPP and the Visa bylaw constituted unlawful restraints of trade under the federal antitrust laws. The judge subsequently issued a final judgment that ordered MasterCard to repeal the CPP and enjoined MasterCard from enacting or enforcing any bylaw, rule, policy or practice that prohibits its issuers from issuing general purpose credit or debit cards in the United States on any other general purpose card network.
In April 2005, a complaint was filed in California state court on behalf of a putative class of consumers under California unfair competition law (Section 17200) and the Cartwright Act (the “Attridge action”). The claims in this action seek to piggyback on the portion of the DOJ antitrust litigation discussed above with regard to the District Court's findings concerning MasterCard's CPP and Visa's related bylaw. The Court granted the defendants' motion to dismiss the plaintiffs' Cartwright Act claims but denied the defendants' motion to dismiss the plaintiffs' Section 17200 unfair competition claims. The parties have proceeded with discovery. In September 2009, MasterCard executed a settlement agreement that is subject to court approval in the separate California consumer litigations (see “U.S. Merchant and Consumer Litigations”). The agreement includes a release that the parties believe encompasses the claims asserted in the Attridge action. In August 2010, the Court in the California consumer actions granted final approval to the settlement. The plaintiff from the Attridge action and three other objectors filed appeals of the settlement approval. In January 2012, the Appellate Court reversed the trial court's settlement approval and remanded the matter to the trial court for further proceedings. In August 2012, the parties in the California consumer actions filed a motion seeking approval of a revised settlement agreement. In November 2012, the trial court granted preliminary approval of the settlement and scheduled a hearing on the final approval of the settlement for April 2013.
U.S. Merchant and Consumer Litigations
Commencing in October 1996, several class action suits were brought by a number of U.S. merchants against MasterCard International and Visa U.S.A., Inc. challenging certain aspects of the payment card industry under U.S. federal antitrust law. The plaintiffs claimed that MasterCard's “Honor All Cards” rule (and a similar Visa rule), which required merchants who accept MasterCard cards to accept for payment every validly presented MasterCard card, constituted an illegal tying arrangement in violation of Section 1 of the Sherman Act. In June 2003, MasterCard International signed a settlement agreement to settle the claims brought by the plaintiffs in this matter, which the Court approved in December 2003. Pursuant to the settlement, MasterCard agreed, among other things, to create two separate “Honor All Cards” rules in the United States - one for debit cards and one for credit cards.
97
In addition, individual or multiple complaints have been brought in 19 states and the District of Columbia alleging state unfair competition, consumer protection and common law claims against MasterCard International (and Visa) on behalf of putative classes of consumers. The claims in these actions largely mirror the allegations made in the U.S. merchant lawsuit and assert that merchants, faced with excessive interchange fees, have passed these overhead charges to consumers in the form of higher prices on goods and services sold. MasterCard has successfully resolved the cases in all of the jurisdictions except California, where there continues to be outstanding cases. As discussed above under “Department of Justice Antitrust Litigation and Related Private Litigations,” in September 2009, the parties to the California state court actions executed a settlement agreement which required a payment by MasterCard of
$6 million
, subject to approval by the California state court. In August 2010, the court granted final approval of the settlement, subsequent to which MasterCard made the payment required by the settlement agreement. The plaintiff from the Attridge action described above under “Department of Justice Antitrust Litigation and Related Private Litigations” and three other objectors filed appeals of the settlement approval order. In January 2012, the Appellate Court reversed the trial court's settlement approval and remanded the matter to the trial court for further proceedings. As noted above, in August 2012, the parties in the California consumer actions filed a motion seeking approval of a revised settlement agreement. In November 2012, the trial court granted preliminary approval of the settlement and scheduled a hearing on the final approval of the settlement for April 2013.
ATM Non-Discrimination Rule Surcharge Complaints
In October 2011, a trade association of independent Automated Teller Machine (“ATM”) operators and 13 independent ATM operators filed a complaint styled as a class action lawsuit in the U.S. District Court for the District of Columbia against both MasterCard and Visa (the “ATM Operators Complaint”). Plaintiffs seek to represent a class of non-bank operators of ATM terminals that operate ATM terminals in the United States with the discretion to determine the price of the ATM access fee for the terminals they operate. Plaintiffs allege that MasterCard and Visa have violated Section 1 of the Sherman Act by imposing rules that require ATM operators to charge non-discriminatory ATM surcharges for transactions processed over MasterCard's and Visa's respective networks that are not greater than the surcharge charged for transactions over other networks accepted at the same ATM. Plaintiffs seek both injunctive and monetary relief equal to treble the damages they claim to have sustained as a result of the alleged violations and their costs of suit, including attorneys' fees. Plaintiffs have not quantified their damages although they allege that they expect damages to be in the tens of millions of dollars.
Subsequently, multiple related complaints were filed in the U.S. District Court for the District of Columbia alleging both federal antitrust and multiple state unfair competition, consumer protection and common law claims against MasterCard and Visa on behalf of putative classes of users of ATM services (the “ATM Consumer Complaints”). The claims in these actions largely mirror the allegations made in the ATM Operators Complaint described above, although these complaints seek damages on behalf of consumers of ATM services who pay allegedly inflated ATM fees at both bank and non-bank ATM operators as a result of the defendants' ATM rules. Plaintiffs seek both injunctive and monetary relief equal to treble the damages they claim to have sustained as a result of the alleged violations and their costs of suit, including attorneys' fees. Plaintiffs have not quantified their damages although they allege that they expect damages to be in the tens of millions of dollars.
In January 2012, the plaintiffs in the ATM Operators Complaint and the ATM Consumer Complaints filed amended class action complaints that largely mirror their prior complaints. MasterCard has moved to dismiss the complaints for failure to state a claim. Oral argument on the motion was heard by the court in September 2012. On February 13, 2013, the district court granted MasterCard's motion to dismiss the complaints without prejudice. The plaintiffs can attempt to re-plead their complaints.
Interchange Litigation and Regulatory Proceedings
Interchange fees represent a sharing of payment system costs among the financial institutions participating in a four-party payment card system such as MasterCard's. Typically, interchange fees are paid by the acquirer to the issuer in connection with purchase transactions initiated with the payment system's cards. These fees reimburse the issuer for a portion of the costs incurred by it in providing services which are of benefit to all participants in the system, including acquirers and merchants. MasterCard or its customer financial institutions establish default interchange fees in certain circumstances that apply when there is no other interchange fee arrangement between the issuer and the acquirer. MasterCard establishes a variety of interchange rates depending on such considerations as the location and the type of transaction, and collects the interchange fee on behalf of the institutions entitled to receive it and remits the interchange fee to eligible institutions. MasterCard's interchange fees and other practices are subject to regulatory and/or legal review and/or challenges in a number of jurisdictions, including the proceedings described below. At this time, it is not possible to determine the ultimate resolution of, or estimate the liability related to, any of these interchange proceedings (except as otherwise indicated below), as the proceedings involve complex claims and/or substantial uncertainties and, in some cases, could include unascertainable damages or fines. Except as described below, no provision for losses has been provided in connection with them. Some of the proceedings described below could have a significant impact on our customers in the applicable country and on MasterCard's level of business in those countries. The proceedings reflect the significant and
98
intense legal, regulatory and legislative scrutiny worldwide that interchange fees and acceptance practices have been receiving. When taken as a whole, the resulting decisions, regulations and legislation with respect to interchange fees and acceptance practices may have a material adverse effect on the Company's prospects for future growth and its overall results of operations, financial position and cash flows.
United States.
In June 2005, the first of a series of complaints were filed on behalf of merchants (the majority of the complaints are styled as class actions, although a few complaints are filed on behalf of individual merchant plaintiffs) against MasterCard International Incorporated, Visa U.S.A., Inc., Visa International Service Association and a number of customer financial institutions. Taken together, the claims in the complaints are generally brought under both Sections 1 and 2 of the Sherman Act, which prohibit monopolization and attempts or conspiracies to monopolize a particular industry, and some of these complaints contain unfair competition law claims under state law. The complaints allege, among other things, that MasterCard, Visa, and certain of their customer financial institutions conspired to set the price of interchange fees, enacted point of sale acceptance rules (including the no surcharge rule) in violation of antitrust laws and engaged in unlawful tying and bundling of certain products and services. The cases have been consolidated for pre-trial proceedings in the U.S. District Court for the Eastern District of New York in MDL No. 1720. The plaintiffs have filed a consolidated class action complaint that seeks treble damages, as well as attorneys' fees and injunctive relief.
In July 2006, the group of purported merchant class plaintiffs filed a supplemental complaint alleging that MasterCard's initial public offering of its Class A Common Stock in May 2006 (the “IPO”) and certain purported agreements entered into between MasterCard and its customer financial institutions in connection with the IPO: (1) violate U.S. antitrust laws and (2) constitute a fraudulent conveyance because the customer financial institutions are allegedly attempting to release, without adequate consideration, MasterCard's right to assess them for MasterCard's litigation liabilities. In November 2008, the district court granted MasterCard's motion to dismiss the plaintiffs' supplemental complaint in its entirety with leave to file an amended complaint. The class plaintiffs repled their complaint. The causes of action and claims for relief in the complaint generally mirror those in the plaintiffs' original IPO-related complaint although the plaintiffs have attempted to expand their factual allegations based upon discovery that has been garnered in the case. The class plaintiffs seek treble damages and injunctive relief including, but not limited to, an order reversing and unwinding the IPO. In July 2009, the class plaintiffs and individual plaintiffs served confidential expert reports detailing the plaintiffs' theories of liability and alleging damages in the tens of billions of dollars. The defendants served their expert reports in December 2009 rebutting the plaintiffs' assertions both with respect to liability and damages.
In February 2011, MasterCard and MasterCard International Incorporated entered into each of: (1) an omnibus judgment sharing and settlement sharing agreement with Visa Inc., Visa U.S.A. Inc. and Visa International Service Association and a number of customer financial institutions; and (2) a MasterCard settlement and judgment sharing agreement with a number of customer financial institutions. The agreements provide for the apportionment of certain costs and liabilities which MasterCard, the Visa parties and the customer financial institutions may incur, jointly and/or severally, in the event of an adverse judgment or settlement of one or all of the cases in the interchange merchant litigations. Among a number of scenarios addressed by the agreements, in the event of a global settlement involving the Visa parties, the customer financial institutions and MasterCard, MasterCard would pay
12%
of the monetary portion of the settlement. In the event of a settlement involving only MasterCard and the customer financial institutions with respect to their issuance of MasterCard cards, MasterCard would pay
36%
of the monetary portion of such settlement.
On July 13, 2012, MasterCard entered into a Memorandum of Understanding (“MOU”) to settle the merchant class litigation, and separately agreed in principle to settle all claims brought by the individual merchant plaintiffs. The MOU sets out a binding obligation to enter into a settlement agreement, and is subject to: (1) the successful completion of certain appendices, (2) the successful negotiation of a settlement agreement with the individual merchant plaintiffs, (3) final court approval of the class settlement, and (4) any necessary internal approvals for the parties. MasterCard's financial portion of the settlements is estimated to total
$790 million
on a pre-tax basis. Of that total, MasterCard recorded a pre-tax charge of
$770 million
in the fourth quarter of 2011 and an additional
$20 million
pre-tax charge in the second quarter of 2012. In addition to the financial portion of the settlement, U.S. merchant class members would also receive a
10
basis point reduction in default credit interchange fees for a period of eight months, funded by a corresponding reduction in the default credit interchange fees paid by acquirers to issuers. MasterCard would also be required to modify its No Surcharge Rule to permit U.S. merchants to surcharge MasterCard credit cards, subject to certain limitations set forth in the class settlement agreement. On October 19, 2012, the parties entered into a definitive settlement agreement with respect to the merchant class litigation (consistent with the terms of the MOU), and separately also entered into a settlement agreement with the individual merchant plaintiffs. The merchant class litigation settlement agreement is subject to court approval. The parties to the merchant class litigation filed a motion seeking preliminary approval of the settlement on October 19, 2012, and the court granted preliminary approval of the settlement on November 27, 2012 and scheduled a final approval hearing for September 2013. In 2012, the Company paid
$790 million
with respect to the settlements, of which
$726 million
was paid into a qualified settlement fund related to the merchant class litigations. Rule practice changes required by the
99
settlement were implemented in late January 2013. In the event that the merchant class litigation settlement agreement is not approved by the court, or if the class settlement agreement is otherwise terminated by the defendants pursuant to the conditions in the settlement agreement and the litigations are not settled, a negative outcome in the litigation could have a material adverse effect on MasterCard's results of operations, financial position and cash flows.
Canada
. In December 2010, the Canadian Competition Bureau (the “CCB”) filed an application with the Canadian Competition Tribunal to strike down certain MasterCard rules related to point-of-sale acceptance, including the “honor all cards” and “no surcharge” rules. The hearing on the matter was held before the Canadian Competition Tribunal and was completed in June 2012. The parties are awaiting a decision from the Canadian Competition Tribunal. In December 2010, a complaint styled as a class action lawsuit was commenced against MasterCard in Quebec on behalf of Canadian merchants. That suit essentially repeated the allegations and arguments of the CCB application to the Canadian Competition Tribunal and sought compensatory and punitive damages in unspecified amounts, as well as injunctive relief. In March 2011, a second purported class action lawsuit was commenced in British Columbia against MasterCard, Visa and a number of large Canadian financial institutions, and in May 2011 a third purported class action lawsuit was commenced in Ontario against the same defendants. These suits allege that MasterCard, Visa and the financial institutions have engaged in a conspiracy to increase or maintain the fees paid by merchants on credit card transactions and establish rules which force merchants to accept all MasterCard and Visa credit cards and prevent merchants from charging more for payments with MasterCard and Visa premium cards. The British Columbia suit seeks compensatory damages in unspecified amounts, and the Ontario suit seeks compensatory damages of
$5 billion
. The British Columbia and Ontario suits also seek punitive damages in unspecified amounts, as well as injunctive relief, interest and legal costs. In April 2012, the Quebec suit was amended to include the same defendants and similar claims as in the British Columbia and Ontario suits. With respect to status of the proceedings: (1) the Quebec suit was stayed in June 2012 until June 2013, subject to an ongoing obligation to report to the case management judge, (2) the Ontario suit is being temporarily suspended while the British Columbia suit proceeds, and (3) the British Columbia court has scheduled a class certification hearing for April 2013. Additional complaints styled as class actions have been filed in Saskatchewan and Alberta. The claims in these complaints largely mirror the claims in the British Columbia and Ontario suits. If the CCB's challenges and/or the class action law suits are ultimately successful, negative decisions could have a significant adverse impact on the revenues of MasterCard's Canadian customers and on MasterCard's overall business in Canada and, in the case of the private lawsuits, could result in substantial damage awards.
European Union.
In September 2003, the European Commission issued a Statement of Objections challenging MasterCard Europe's cross-border default interchange fees and, in June 2006, it issued a supplemental Statement of Objections covering credit, debit and commercial card fees. In December 2007, the European Commission announced a decision that applies to MasterCard's default cross-border interchange fees for MasterCard and Maestro branded consumer payment card transactions in the European Economic Area (“EEA”) (the European Commission refers to these as “MasterCard's MIF”), but not to commercial card transactions (the European Commission stated publicly that it has not yet finished its investigation of commercial card interchange fees). The decision required MasterCard to stop applying the MasterCard MIF, to refrain from repeating the conduct, and not apply its then recently adopted (but never implemented) Maestro SEPA and Intra-Eurozone default interchange fees to debit card payment transactions within the Eurozone. The decision did not impose a fine on MasterCard, but provides for a daily penalty of up to
3.5%
of MasterCard's daily consolidated global turnover in the preceding business year (which MasterCard estimates to be approximately
$0.7 million
per day) in the event that MasterCard fails to comply. To date, MasterCard has not been assessed any such penalty. In March 2008, MasterCard filed an application for annulment of the European Commission's decision with the General Court of the European Union.
Following discussions with the European Commission, MasterCard announced that, effective June 21, 2008, MasterCard would temporarily repeal its then current default intra-EEA cross-border consumer card interchange fees in conformity with the decision. In October 2008, MasterCard received an information request from the European Commission in connection with the decision concerning certain pricing changes that MasterCard implemented as of October 1, 2008. In March 2009, MasterCard gave certain undertakings to the European Commission and, in response, in April 2009, the Commissioner for competition policy and DG Competition informed MasterCard that, subject to MasterCard's fulfilling its undertakings, they do not intend to pursue proceedings for non-compliance with or circumvention of the December 2007 decision or for infringing the antitrust laws in relation to the October 2008 pricing changes, the introduction of new cross-border consumer default interchange fees or any of the other MasterCard undertakings. MasterCard's undertakings include: (1) repealing the October 2008 pricing changes; (2) adopting a specific methodology for the setting of cross-border consumer default interchange fees; (3) establishing new default cross-border consumer card interchange fees as of July 1, 2009 such that the weighted average interchange fee for credit card transactions does not exceed
30
basis points and for debit card transactions does not exceed
20
basis points; (4) introducing a new rule prohibiting its acquirers from requiring merchants to process all of their MasterCard and Maestro transactions with the acquirer; and (5) introducing a new rule requiring its acquirers to provide merchants with certain pricing information in connection with MasterCard
100
and Maestro transactions. The undertakings were effective until the European Union General Court issued a judgment in May 2012.
In May 2012, the General Court of the European Union issued a judgment dismissing the Company's appeal and upholding the European Commission's decision. The Company appealed the judgment to the European Union Court of Justice in August 2012. Subject to ongoing discussion with the European Commission, MasterCard intends to continue to comply with the terms of the interim agreement with the European Commission, even though that agreement, by its terms, formally ended on the day of the judgment.
Although MasterCard believes that any other business practices it would implement in response to the decision would be in compliance with the December 2007 decision, the European Commission may deem any such practice not in compliance with the decision, or in violation of European competition law, in which case MasterCard may be assessed fines for the period that it is not in compliance. Furthermore, because a balancing mechanism like default cross-border interchange fees constitutes an essential element of MasterCard Europe's operations, the December 2007 decision could also significantly impact MasterCard International's European customers' and MasterCard Europe's business. The European Commission decision could also lead to additional competition authorities in European Union member states commencing investigations or proceedings regarding domestic interchange fees or initiating regulation. The possibility of such actions has increased due to the judgment of the General Court. The judgment also increases the possibility of an adverse outcome for the Company in related and pending matters (such as the interchange proceedings in Hungary, Italy and Poland, as further described below). In addition, the European Commission's decision could, and in the case of the United Kingdom and Belgium has, lead to the filing of private actions against MasterCard Europe by merchants and/or consumers which, if MasterCard is unsuccessful in its appeal of the General Court decision, could result in MasterCard owing substantial damages.
Additional Litigations in Europe
. In the United Kingdom, since May 2012, a number of retailers have filed claims against MasterCard for unspecified damages with respect to MasterCard's cross-border and U.K. and Ireland domestic interchange fees. In Belgium, a retailer filed claims in December 2012 for unspecified damages with respect to MasterCard's cross-border and domestic interchange fees paid in Belgium, Greece and Luxembourg.
Additional Interchange Proceedings
. Regulatory authorities in a number of other jurisdictions around the world have commenced competition-related proceedings or inquiries into interchange fees and acceptance practices. These matters include:
|
•
|
France
. In 2009, the French Competition Authority (the “FCA”) sent an information request to MasterCard as part of an investigation concerning its domestic interchange rates. The investigation was initially suspended until the judgment of the General Court of the European Union with respect to MasterCard's appeal of the December 2007 cross-border interchange fee decision of the European Commission. In January 2013, the investigation was re-opened and the FCA informed MasterCard that it intends to commence a formal proceeding and issue a statement of objections unless MasterCard offers commitments to reduce its interchange fees.
|
|
•
|
Hungary.
In December 2009, the Hungarian Competition Authority (the “HCA”) issued a formal decision that MasterCard's (and Visa's) historic domestic interchange fees violated Hungarian competition law and fined each of MasterCard Europe and Visa Europe approximately
$3 million
, which was paid during the fourth quarter of 2009. MasterCard appealed the decision to the Hungarian courts, which has stayed the proceeding until the completion of MasterCard's appeal to the European Union Court of Justice. If the HCA's decision is not reversed on appeal, it could have a significant adverse impact on the revenues of MasterCard's Hungarian customers and on MasterCard's overall business in Hungary. In June 2012, the HCA commenced a separate investigation of MasterCard's alleged abuse of dominant position in what it refers to as the domestic bankcard market during the period beginning in December 2010.
|
|
•
|
Italy.
In November 2010, the Italian Competition Authority (the “ICA”) adopted a decision in which it determined that MasterCard Europe's domestic interchange fees violate European Union competition law, fined MasterCard
2.7 million
euro (approximately
$4 million
) and ordered MasterCard to refrain in the future from maintaining interchange fees that are not based on economic justifications linked to efficiency criteria and to eliminate any anticompetitive clauses from its licensing agreements. MasterCard appealed the ICA's infringement decision to the Administrative Court, and the decision was annulled by the Administrative Court in July 2011. The ICA has appealed the Administrative Court's judgment to the Council of State. If the ICA's infringement decision ultimately stands, it could have a significant adverse impact on the revenues of MasterCard's Italian customers and on MasterCard's overall business in Italy.
|
|
•
|
Poland.
In January 2007, the Polish Office for Protection of Competition and Consumers (the “PCA”) issued a decision that MasterCard's (and Visa Europe's) domestic credit and debit default interchange fees are unlawful under Polish
|
101
competition law, and imposed fines on MasterCard's (and Visa Europe's) licensed financial institutions, the entities responsible for setting the fees. As part of this decision, the PCA decided that MasterCard (and Visa Europe) had not violated the law because they were not responsible for setting the fees. The decision is currently being appealed. If on appeal the PCA's decision is ultimately allowed to stand, it could have a significant adverse impact on the revenues of MasterCard's Polish customers and on MasterCard's overall business in Poland.
|
•
|
United Kingdom
. In February 2007, the Office for Fair Trading of the United Kingdom (the “OFT”) commenced an investigation of MasterCard's current U.K. default credit card interchange fees and so-called “immediate debit” cards to determine whether such fees contravene U.K. and European Union competition law. The OFT had informed MasterCard that it did not intend to issue a Statement of Objections or otherwise commence formal proceedings with respect to the investigation prior to the judgment of the General Court of the European Union with respect to MasterCard's appeal of the December 2007 cross-border interchange fee decision of the European Commission, and this period was recently extended until the completion of MasterCard's appeal to the Court of Justice. If the OFT ultimately determines that any of MasterCard's U.K. interchange fees contravene U.K. and European Union competition law, it may issue a new decision and possibly levy fines accruing from the date of its first decision. MasterCard would likely appeal a negative decision by the OFT in any future proceeding to the Competition Appeals Tribunal. Such an OFT decision could lead to the filing of private actions against MasterCard by merchants and/or consumers which, if its appeal of such an OFT decision were to fail, could result in an award or awards of substantial damages and could have a significant adverse impact on the revenues of MasterCard International's U.K. customers and MasterCard's overall business in the U.K.
|
Regulatory authorities and/or central banks in certain other jurisdictions, including Brazil, Chile, Germany, Latvia, Lithuania, Portugal, Russia, Singapore and South Africa, are reviewing MasterCard's and/or its customers' interchange fees and/or other practices and may seek to commence proceedings related to, or otherwise regulate, the establishment of such fees and/or such practices.
Other Regulatory Proceedings
In addition to challenges to interchange fees, MasterCard's standards and operations are also subject to regulatory and/or legal review and/or challenges in a number of jurisdictions from time to time. These proceedings tend to reflect the increasing global regulatory focus to which the payments industry is subject and, when taken as a whole with other regulatory and legislative action, such actions could result in the imposition of costly new compliance burdens on MasterCard and its customers and may lead to increased costs and decreased transaction volumes and revenues.
Note 19.
Settlement and Other Risk Management
MasterCard's rules guarantee the settlement of many of the MasterCard, Cirrus and Maestro branded transactions between our issuers and acquirers ("settlement risk"). Settlement exposure is the outstanding settlement risk to customers under MasterCard's rules due to the difference in timing between the payment transaction date and subsequent settlement. While the term and amount of the guarantee are unlimited, the duration of settlement exposure is short term and typically limited to a few days. Settlement exposure is primarily estimated using the average daily card volume during the quarter multiplied by the estimated number of days to settle. The Company has global risk management policies and procedures, which include risk standards, to provide a framework for managing the Company's settlement risk. Customer-reported transaction data and the transaction clearing data underlying the settlement exposure calculation may be revised in subsequent reporting periods.
In the event that MasterCard effects a payment on behalf of a failed customer, MasterCard may seek an assignment of the underlying receivables of the failed customer. Subject to approval by the Board of Directors, customers may be charged for the amount of any settlement loss incurred during these ordinary course activities of the Company.
The Company's global risk management policies and procedures are aimed at managing the settlement exposure. These risk management procedures include interaction with the bank regulators of countries in which the Company operates, requiring customers to make adjustments to settlement processes, and requiring collateral from customers. MasterCard requires certain customers that are not in compliance with the Company's risk standards in effect at the time of review to post collateral, typically in the form of cash, letters of credit, or guarantees. This requirement is based on management's review of the individual risk circumstances for each customer that is out of compliance. In addition to these amounts, MasterCard holds collateral to cover variability and future growth in customer programs. The Company may also hold collateral to pay merchants in the event of merchant bank/acquirer failure. Although the Company is not contractually obligated under our rules to effect such payments to merchants, the Company may elect to do so to protect brand integrity. MasterCard monitors its credit risk portfolio on a regular
102
basis and the adequacy of collateral on hand. Additionally, from time to time, the Company reviews its risk management methodology and standards. As such, the amounts of estimated settlement exposure are revised as necessary.
The Company's estimated settlement exposure from MasterCard, Cirrus and Maestro branded transactions was as follows:
|
December 31,
2012 |
December 31, 2011
|
||||||||
|
(in millions)
|
|||||||||
|
Gross settlement exposure
|
$
|
37,768
|
|
$
|
39,102
|
|
|||
|
Collateral held for settlement exposure
|
(3,775
|
)
|
(3,482
|
)
|
1
|
|
|||
|
Net uncollateralized settlement exposure
|
$
|
33,993
|
|
$
|
35,620
|
|
|||
1
Represents collateral held against MasterCard-branded exposure only.
MasterCard-branded travelers cheques are no longer being issued. For previously issued travelers cheques, MasterCard guarantees the payment of MasterCard-branded travelers cheques in the event of issuer default. The term of the guarantee is unlimited, while the exposure is limited to cheques issued but not yet cashed. The notional amount of cheques issued, but not yet cashed was
$539 million
and
$564 million
at
December 31, 2012
and
2011
, respectively, of which
$434 million
and
$455 million
at
December 31, 2012
and
2011
, respectively, is mitigated by collateral arrangements.
Beginning in 2008, many of the Company's financial institution customers were directly and adversely impacted by the unprecedented events that occurred in the financial markets around the world. The ongoing economic turmoil presents increased risk that the Company may have to perform under its settlement and travelers cheque guarantees. General economic conditions and political conditions in countries in which MasterCard operates also affect the Company's settlement risk. For example, the European sovereign debt crisis introduces a heightened level of risk to the Company. The Company's aggregate gross settlement exposures to Greece, Italy, Portugal and Spain, four of the countries significantly impacted by the eurozone crisis, are less than
5%
of MasterCard's total gross settlement exposure as of
December 31, 2012
and are being managed through various planning and mitigation practices. The Company's global risk management policies and procedures are revised and enhanced from time to time. Historically, the Company has experienced a low level of losses from customer financial institution failures.
MasterCard also provides guarantees to customers and certain other companies indemnifying them from losses stemming from failures of third parties to perform duties. In addition, the Company enters into business agreements in the ordinary course of business under which the Company agrees to indemnify third parties against damages, losses and expenses incurred in connection with legal and other proceedings arising from relationships or transactions with the Company. Certain indemnifications do not provide a stated maximum exposure. As the extent of the Company's obligations under these agreements depends entirely upon the occurrence of future events, the Company's potential future liability under these agreements is not determinable. Historically, payments made by the Company under these types of contractual arrangements have not been material.
Note 20.
Foreign Exchange Risk Management
The Company enters into foreign currency forward contracts to manage risk associated with anticipated receipts and disbursements which are either transacted in a non-functional currency or valued based on a currency other than its functional currencies. The Company also enters into foreign currency forward contracts to offset possible changes in value due to foreign exchange fluctuations of assets and liabilities denominated in currencies other than the functional currency of the entity holding the assets and liabilities. The objective of this activity is to reduce the Company’s exposure to transaction gains and losses resulting from fluctuations of foreign currencies against its functional currencies. The notional value of commitments to sell foreign currency increased to
$1.6 billion
at
December 31, 2012
compared to
$279 million
at
December 31, 2011
due to the hedging of an increase in assets denominated in a currency other than the functional currency of the entity holding the assets and an expanded hedging program to offset the Company's foreign currency exposures arising from anticipated receipts and disbursements.
The Company does not designate foreign currency derivatives as hedging instruments pursuant to the accounting guidance for derivative instruments and hedging activities. The Company records the change in the estimated fair value of the outstanding derivatives at the end of the reporting period to its consolidated balance sheet and consolidated statement of operations.
103
As of
December 31, 2012
, all forward contracts to purchase and sell foreign currency had been entered into with customers of MasterCard. MasterCard’s derivative contracts are summarized below:
|
|
December 31, 2012
|
December 31, 2011
|
|||||||||||||
|
|
Notional
|
Estimated Fair
Value
|
Notional
|
Estimated Fair
Value
|
|||||||||||
|
|
(in millions)
|
||||||||||||||
|
Commitments to purchase foreign currency
|
$
|
76
|
|
$
|
(1
|
)
|
$
|
21
|
|
$
|
—
|
|
|||
|
Commitments to sell foreign currency
|
1,571
|
|
(2
|
)
|
279
|
|
2
|
|
|||||||
|
Balance Sheet Location:
|
|||||||||||||||
|
Accounts Receivable
|
$
|
12
|
|
$
|
4
|
|
|||||||||
|
Other Current Liabilities
|
(15
|
)
|
(2
|
)
|
|||||||||||
The amount of gain (loss) recognized in income for the contracts to purchase and sell foreign currency are summarized below:
|
|
Year Ended December 31,
|
||||||||||
|
|
2012
|
2011
|
2010
|
||||||||
|
|
(in millions)
|
||||||||||
|
Foreign currency derivative contracts
|
|||||||||||
|
General and administrative
|
$
|
22
|
|
$
|
(6
|
)
|
$
|
(17
|
)
|
||
|
Revenues
|
(6
|
)
|
(3
|
)
|
(3
|
)
|
|||||
|
Total
|
$
|
16
|
|
$
|
(9
|
)
|
$
|
(20
|
)
|
||
The fair value of the foreign currency forward contracts generally reflects the estimated amounts that the Company would receive (or pay), on a pre-tax basis, to terminate the contracts at the reporting date based on broker quotes for the same or similar instruments. The terms of the foreign currency forward contracts are generally less than
18 months
. The Company had
no
deferred gains or losses related to foreign exchange in accumulated other comprehensive income as of
December 31, 2012
and
2011
as there were no derivative contracts accounted for under hedge accounting.
The Company’s derivative financial instruments are subject to both market and counterparty credit risk. Market risk is the risk of loss due to the potential change in an instrument’s value caused by fluctuations in interest rates and other variables related to currency exchange rates. The effect of a hypothetical 10% adverse change in foreign currency rates could result in a fair value loss of approximately
$166 million
on the Company's foreign currency derivative contracts outstanding at
December 31, 2012
related to the hedging program. Counterparty credit risk is the risk of loss due to failure of the counterparty to perform its obligations in accordance with contractual terms. To mitigate counterparty credit risk, the Company enters into derivative contracts with selected financial institutions based upon their credit ratings and other factors. Generally, the Company does not obtain collateral related to derivatives because of the high credit ratings of the counterparties.
Note 21.
Segment Reporting
MasterCard has concluded it has one operating and reportable segment, “Payment Solutions.” MasterCard's President and Chief Executive Officer has been identified as the chief operating decision-maker. All of the Company’s activities are interrelated, and each activity is dependent upon and supportive of the other. Accordingly, all significant operating decisions are based upon analysis of MasterCard at the consolidated level.
Revenue by geographic market is based on the location of the Company's customer that issued the card, as well as the location of the merchant acquirer where the card is being used. Revenue generated in the U.S. was approximately
39%
,
40%
, and
42%
of net revenues in 2012, 2011 and 2010, respectively.
No
individual country, other than the U.S., generated more than 10% of total revenues in those periods.
MasterCard did not have any one customer that generated greater than 10% of net revenues in 2012, 2011 or 2010. The following table reflects the geographical location of the Company's property, plant and equipment, net, as of December 31:
|
|
2012
|
2011
|
2010
|
||||||||
|
(in millions)
|
|||||||||||
|
United States
|
$
|
394
|
|
$
|
384
|
|
$
|
376
|
|
||
|
Other countries
|
78
|
|
65
|
|
63
|
|
|||||
|
Total
|
$
|
472
|
|
$
|
449
|
|
$
|
439
|
|
||
104
MASTERCARD INCORPORATED
SUMMARY OF QUARTERLY DATA (Unaudited)
|
2012 Quarter Ended
|
|||||||||||||||||||||
|
March 31
|
June 30
|
September 30
|
December 31
|
2012 Total
|
|||||||||||||||||
|
(in millions, except per share amounts)
|
|||||||||||||||||||||
|
Revenues, net
|
$
|
1,758
|
|
$
|
1,820
|
|
$
|
1,918
|
|
$
|
1,895
|
|
$
|
7,391
|
|
||||||
|
Operating income (loss)
|
1,000
|
|
974
|
|
1,064
|
|
899
|
|
3,937
|
|
|||||||||||
|
Net income attributable to MasterCard
|
682
|
|
700
|
|
772
|
|
605
|
|
2,759
|
|
|||||||||||
|
Basic earnings per share
|
$
|
5.38
|
|
$
|
5.56
|
|
$
|
6.19
|
|
$
|
4.88
|
|
$
|
22.02
|
|
||||||
|
Basic weighted-average shares outstanding
|
127
|
|
126
|
|
125
|
|
124
|
|
125
|
|
|||||||||||
|
Diluted earnings per share
|
$
|
5.36
|
|
$
|
5.55
|
|
$
|
6.17
|
|
$
|
4.86
|
|
$
|
21.94
|
|
||||||
|
Diluted weighted-average shares outstanding
|
127
|
|
126
|
|
125
|
|
125
|
|
126
|
|
|||||||||||
|
2011 Quarter Ended
|
|||||||||||||||||||||
|
March 31
|
June 30
|
September 30
|
December 31
1
|
2011 Total
|
|||||||||||||||||
|
(in millions, except per share amounts)
|
|||||||||||||||||||||
|
Revenues, net
|
$
|
1,501
|
|
$
|
1,667
|
|
$
|
1,818
|
|
$
|
1,728
|
|
$
|
6,714
|
|
||||||
|
Operating income (loss)
|
836
|
|
885
|
|
1,002
|
|
(10
|
)
|
2,713
|
|
|||||||||||
|
Net income attributable to MasterCard
|
562
|
|
608
|
|
717
|
|
19
|
|
1,906
|
|
|||||||||||
|
Basic earnings per share
|
$
|
4.31
|
|
$
|
4.77
|
|
$
|
5.65
|
|
$
|
0.15
|
|
$
|
14.90
|
|
||||||
|
Basic weighted-average shares outstanding
|
130
|
|
127
|
|
127
|
|
127
|
|
128
|
|
|||||||||||
|
Diluted earnings per share
|
$
|
4.29
|
|
$
|
4.76
|
|
$
|
5.63
|
|
$
|
0.15
|
|
$
|
14.85
|
|
||||||
|
Diluted weighted-average shares outstanding
|
131
|
|
128
|
|
127
|
|
127
|
|
128
|
|
|||||||||||
* Tables may not sum due to rounding.
1
Financial results for the three months ended December 31, 2011 include a
$770 million
charge for the U.S. merchant litigation. See Note 18 (Legal and Regulatory Proceedings) to the consolidated financial statements included in Part II, Item 8 of this Report for further discussion.
105
Item 9.
Changes in and Disagreements with Accountants on Accounting and Financial Disclosure
Not applicable.
Item 9A.
Controls and Procedures
Evaluation of Disclosure Controls and Procedures
MasterCard Incorporated’s management, including the President and Chief Executive Officer and Chief Financial Officer, carried out an evaluation of the effectiveness of the design and operation of the Company’s disclosure controls and procedures (as defined in Rule 13a-15(e) and 15d-15(e) under the Securities Exchange Act of 1934, as amended) as of the end of the period covered by this Report. Any controls and procedures, no matter how well designed and operated, can provide only reasonable assurance of achieving the desired control objectives. Based on that evaluation, the Company’s President and Chief Executive Officer and Chief Financial Officer concluded that MasterCard Incorporated’s disclosure controls and procedures were effective as of the end of the period covered by this Report at the reasonable assurance level to accomplish their objectives of (i) recording, processing, summarizing and reporting information that is required to be disclosed in its reports under the Securities Exchange Act of 1934, as amended, within the time periods specified in the Securities and Exchange Commission’s rules and forms and (ii) ensuring that information required to be disclosed in such reports is accumulated and communicated to MasterCard Incorporated’s management, including its President and Chief Executive Officer and Chief Financial Officer, as appropriate to allow timely decisions regarding disclosure.
Internal Control over Financial Reporting
In addition, MasterCard Incorporated’s management assessed the effectiveness of MasterCard’s internal control over financial reporting as of
December 31, 2012
. Management’s report on internal control over financial reporting is included in Part II, Item 8 of this Report. The attestation report of PricewaterhouseCoopers LLP, our independent registered public accounting firm, is also included in Part II, Item 8 of this Report.
There was no change in MasterCard’s internal control over financial reporting that occurred during the three months ended
December 31, 2012
that has materially affected, or is reasonably likely to materially affect, MasterCard’s internal control over financial reporting.
Item 9B.
Other Information
Not applicable.
106
Item 10.
Directors, Executive Officers and Corporate Governance
The information required by this Item with respect to our directors and executive officers, code of ethics, procedures for recommending nominees, audit committee, audit committee financial experts and compliance with Section 16(a) of the Exchange Act will appear in our definitive proxy statement to be filed with the SEC and delivered to stockholders in connection with the Annual Meeting of Stockholders to be held on June 18, 2013 (the “Proxy Statement”).
The aforementioned information in the Proxy Statement is incorporated by reference into this Report.
Item 11.
Executive Compensation
The information required by this Item with respect to executive officer and director compensation will appear in the Proxy Statement and is incorporated by reference into this Report.
Item 12.
Security Ownership of Certain Beneficial Owners and Management and Related Stockholder Matters
The information required by this Item with respect to security ownership of certain beneficial owners and management equity and compensation plans will appear in the Proxy Statement and is incorporated by reference into this Report.
Item 13.
Certain Relationships and Related Transactions, and Director Independence
The information required by this Item with respect to transactions with related persons, the review, approval or ratification of such transactions and director independence will appear in the Proxy Statement and is incorporated by reference into this Report.
Item 14.
Principal Accounting Fees and Services
The information required by this Item with respect to auditors' services and fees will appear in the Proxy Statement and is incorporated by reference into this Report.
Item 15.
Exhibits and Financial Statement Schedules
(a) The following documents are filed as part of this Report:
|
1
|
Consolidated Financial Statements
|
See Index to Consolidated Financial Statements in Part II, Item 8 of this Report.
|
2
|
Consolidated Financial Statement Schedules
|
None.
|
3
|
The following exhibits are filed as part of this Report or, where indicated, were previously filed and are hereby incorporated by reference:
|
Refer to the Exhibit Index included herein.
107
SIGNATURES
Pursuant to the requirements of Section 13 or 15(d) of the Securities Exchange Act of 1934, the registrant has duly caused this Annual Report on Form 10-K to be signed on its behalf by the undersigned, thereunto duly authorized.
|
MASTERCARD INCORPORATED
|
||||
|
(Registrant)
|
||||
|
Date:
|
February 14, 2013
|
By:
|
|
/s/ AJAY BANGA
|
|
|
Ajay Banga
|
|||
|
|
President and Chief Executive Officer
|
|||
|
|
(Principal Executive Officer)
|
|||
Pursuant to the requirements of the Securities Exchange Act of 1934, this report has been signed below by the following persons on behalf of the registrant and in the capacities and on the dates indicated:
|
Date:
|
February 14, 2013
|
By:
|
|
/s/ AJAY BANGA
|
|
|
Ajay Banga
|
|||
|
|
President and Chief Executive Officer; Director
|
|||
|
|
(Principal Executive Officer)
|
|||
|
Date:
|
February 14, 2013
|
By:
|
|
/s/ MARTINA HUND-MEJEAN
|
|
|
Martina Hund-Mejean
|
|||
|
|
Chief Financial Officer
|
|||
|
|
(Principal Financial Officer)
|
|||
|
Date:
|
February 14, 2013
|
By:
|
|
/s/ ANDREA FORSTER
|
|
|
Andrea Forster
|
|||
|
|
Corporate Controller
|
|||
|
|
(Principal Accounting Officer)
|
|||
|
Date:
|
February 14, 2013
|
By:
|
/s/ SILVIO BARZI
|
|
|
Silvio Barzi
|
||||
|
Director
|
||||
|
Date:
|
February 14, 2013
|
By:
|
/s/ DAVID R. CARLUCCI
|
|
|
David R. Carlucci
|
||||
|
Director
|
||||
|
Date:
|
February 14, 2013
|
By:
|
/s/ STEVEN J. FREIBERG
|
|
|
Steven J. Freiberg
|
||||
|
Director
|
||||
|
Date:
|
February 14, 2013
|
By:
|
/s/ RICHARD HAYTHORNTHWAITE
|
|
|
Richard Haythornthwaite
|
||||
|
Chairman of the Board; Director
|
||||
|
Date:
|
February 14, 2013
|
By:
|
/s/ NANCY J. KARCH
|
|
|
Nancy J. Karch
|
||||
|
Director
|
||||
|
Date:
|
February 14, 2013
|
By:
|
/s/
MARC OLIVIÉ
|
|
|
Marc Olivié
|
||||
|
Director
|
||||
108
|
Date:
|
February 14, 2013
|
By:
|
/s/ RIMA QURESHI
|
|
|
Rima Qureshi
|
||||
|
Director
|
||||
|
Date:
|
February 14, 2013
|
By:
|
/s/ JOSÉ OCTAVIO REYES LAGUNES
|
|
|
José Octavio Reyes Lagunes
|
||||
|
Director
|
||||
|
Date:
|
February 14, 2013
|
By:
|
/s/ MARK SCHWARTZ
|
|
|
Mark Schwartz
|
||||
|
Director
|
||||
|
Date:
|
February 14, 2013
|
By:
|
/s/ JACKSON TAI
|
|
|
Jackson Tai
|
||||
|
Director
|
||||
|
Date:
|
February 14, 2013
|
By:
|
/s/ EDWARD SUNING TIAN
|
|
|
Edward Suning Tian
|
||||
|
Director
|
||||
109
EXHIBIT INDEX
|
Exhibit
Number
|
|
Exhibit Description
|
|
3.1(a)
|
Amended and Restated Certificate of Incorporation of MasterCard Incorporated (incorporated by reference to Exhibit 3.1 to the Company's Current Report on Form 8-K filed September 23, 2010 (File No. 001-32877)).
|
|
|
3.1(b)
|
Amended and Restated Bylaws of MasterCard Incorporated (incorporated by reference to Exhibit 3.1 to the Company's Current Report on Form 8-K filed September 23, 2010 (File No. 001-32877)).
|
|
|
3.2(a)
|
Amended and Restated Certificate of Incorporation of MasterCard International Incorporated (incorporated by reference to Exhibit 3.2 (a) to the Company's Quarterly Report on Form 10-Q filed August 2, 2006 (File No. 001-32877)).
|
|
|
3.2(b)
|
Amended and Restated Bylaws of MasterCard International Incorporated (incorporated by reference to Exhibit 3.1 to the Company's Quarterly Report on Form 10-Q filed November 3, 2009 (File No. 001-32877)).
|
|
|
10.1
|
$3,000,000,000 Credit Agreement, dated as of November 16, 2012, among MasterCard Incorporated, the several lenders from time to time parties thereto, Citibank, N.A., as managing administrative agent, and JPMorgan Chase Bank, N.A. as administrative agent (incorporated by reference to Exhibit 10.1 to the Company's Current Report on Form 8-K filed November 21, 2012 (File No. 001-32877)).
|
|
|
10.2
|
Lease, dated as of April 1, 2003, between MasterCard International, LLC and City of Kansas City, Missouri relating to the Kansas City facility (incorporated by reference to Exhibit 10.4 to the Company's Quarterly Report on Form 10-Q filed August 8, 2003 (File No. 000-50250)).
|
|
|
10.3+
|
Employment Agreement between MasterCard International Incorporated and Ajay Banga, dated as of July 1, 2010 (incorporated by reference to Exhibit 10.1 to the Company's Current Report on Form 8-K filed July 8, 2010 (File No. 001-32877)).
|
|
|
10.4+*
|
Employment Agreement between Chris A. McWilton and MasterCard International, amended and restated as of December 24, 2012.
|
|
|
10.5+*
|
Employment Agreement between Martina Hund-Mejean and MasterCard International, amended and restated as of December 24, 2012.
|
|
|
10.6+
|
Description of Employment Arrangement with Gary Flood (incorporated by reference to Exhibit 10.11 to the Company's Annual Report on Form 10-K filed February 18, 2010 (File No. 001-32877)).
|
|
|
10.7+
|
Offer Letter between Ann Cairns and MasterCard International Incorporated, dated June 15, 2011 (incorporated by reference to Exhibit 10.8 to the Company's Annual Report on Form 10-K filed February 16, 2012 (File No. 001-32877)).
|
|
|
10.7.1+
|
Contract of Employment between MasterCard UK Management Services Limited and Ann Cairns, dated July 6, 2011 (incorporated by reference to Exhibit 10.8.1 to the Company's Annual Report on Form 10-K filed February 16, 2012 (File No. 001-32877)).
|
|
|
10.7.2+
|
Deed of Employment between MasterCard UK Management Services Limited and Ann Cairns, dated July 6, 2011 (incorporated by reference to Exhibit 10.8.2 to the Company's Annual Report on Form 10-K filed February 16, 2012 (File No. 001-32877)).
|
|
|
10.8+
|
MasterCard International Incorporated Supplemental Executive Retirement Plan, as amended and restated effective January 1, 2008 (incorporated by reference to Exhibit 10.18 to the Company's Annual Report on Form 10-K filed February 19, 2009 (File No. 001-32877)).
|
|
|
10.9+
|
MasterCard International Senior Executive Annual Incentive Compensation Plan, as amended and restated effective September 21, 2010 (incorporated by reference to Exhibit 10.2 to the Company's Quarterly Report on Form 10-Q filed November 2, 2010 (File No. 001-32877)).
|
|
110
|
10.10+
|
MasterCard International Incorporated Restoration Program, as amended and restated January 1, 2007 unless otherwise provided (incorporated by reference to Exhibit 10.22 to the Company's Annual Report on Form 10-K filed February 19, 2009 (File No. 001-32877)).
|
|
|
10.11+
|
MasterCard Incorporated Deferral Plan, as amended and restated effective December 1, 2008 for account balances established after December 31, 2004 (incorporated by reference to Exhibit 10.25 to the Company's Annual Report on Form 10-K filed February 19, 2009 (File No. 001-32877)).
|
|
|
10.12+
|
MasterCard Incorporated 2006 Long Term Incentive Plan, amended and restated effective June 5, 2012 (incorporated by reference to Exhibit 10.1 to the Company's Quarterly Report on Form 10-Q filed August 1, 2012 (File No. 001-32877)).
|
|
|
10.13+
|
Form of Restricted Stock Unit Agreement for awards under 2006 Long Term Incentive Plan (effective for awards granted on and subsequent to March 1, 2011) (incorporated by reference to Exhibit 10.1 to the Company's Quarterly Report on Form 10-Q filed May 3, 2011 (File No. 001-32877)).
|
|
|
10.14+
|
Form of Stock Option Agreement for awards under 2006 Long Term Incentive Plan (effective for awards granted on and subsequent to March 1, 2011) (incorporated by reference to Exhibit 10.2 to the Company's Quarterly Report on Form 10-Q filed May 3, 2011 (File No. 001-32877)).
|
|
|
10.15+
|
Form of Performance Unit Agreement for awards under 2006 Long Term Incentive Plan (effective for awards granted on and subsequent to March 1, 2011) (incorporated by reference to Exhibit 10.3 to the Company's Quarterly Report on Form 10-Q filed May 3, 2011 (File No. 001-32877)).
|
|
|
10.16+
|
Form of MasterCard Incorporated Long-Term Incentive Plan Non-Competition and Non-Solicitation Agreement for named executive officers (incorporated by reference to Exhibit 10.17 to the Company's Annual Report on Form 10-K filed February 16, 2012 (File No. 001-32877)).
|
|
|
10.17+
|
Amended and Restated MasterCard International Incorporated Executive Severance Plan, amended and restated as of June 5, 2012 (incorporated by reference to Exhibit 10.5 to the Company's Quarterly Report on Form 10-Q filed August 1, 2012 (File No. 001-32877)).
|
|
|
10.18+
|
Amended and Restated MasterCard International Incorporated Change in Control Severance Plan, amended and restated as of June 5, 2012 (incorporated by reference to Exhibit 10.6 to the Company's Quarterly Report on Form 10-Q filed August 1, 2012 (File No. 001-32877)).
|
|
|
10.19+
|
Schedule of Non-Employee Directors' Annual Compensation effective as of June 5, 2012 (incorporated by reference to Exhibit 10.3 to the Company's Quarterly Report on Form 10-Q filed August 1, 2012 (File No. 001-32877)).
|
|
|
10.20+
|
2006 Non-Employee Director Equity Compensation Plan, amended and restated effective as of June 5, 2012 (incorporated by reference to Exhibit 10.2 to the Company's Quarterly Report on Form 10-Q filed August 1, 2012 (File No. 001-32877)).
|
|
|
10.21+
|
Form of Deferred Stock Unit Agreement for awards under 2006 Non-Employee Director Equity Compensation Plan (incorporated by reference to Exhibit 10.2 to the Company's Quarterly Report on Form 10-Q filed November 1, 2006 (File No. 001-32877)).
|
|
|
10.22+
|
Form of Restricted Stock Agreement for awards under 2006 Non-Employee Director Equity Compensation Plan, amended and restated effective June 5, 2012 (incorporated by reference to Exhibit 10.4 to the Company's Quarterly Report on Form 10-Q filed August 1, 2012 (File No. 001-32877)).
|
|
|
10.23
|
Form of Indemnification Agreement between MasterCard Incorporated and certain of its directors (incorporated by reference to Exhibit 10.2 to the Company's Quarterly Report on Form 10-Q filed May 2, 2006 (File No. 000-50250)).
|
|
|
10.24
|
Form of Indemnification Agreement between MasterCard Incorporated and certain of its director nominees (incorporated by reference to Exhibit 10.3 to the Company's Quarterly Report on Form 10-Q filed May 2, 2006 (File No. 000-50250)).
|
|
111
|
10.25
|
Deed of Gift between MasterCard Incorporated and The MasterCard Foundation (incorporated by reference to Exhibit 10.28 to Pre-Effective Amendment No. 5 to the Company's Registration Statement on Form S-1 filed May 3, 2006 (File No. 333-128337)).
|
|
|
10.26
|
Settlement Agreement, dated as of June 4, 2003, between MasterCard International Incorporated and Plaintiffs in the class action litigation entitled In Re Visa Check/MasterMoney Antitrust Litigation (incorporated by reference to Exhibit 10.1 to the Company's Quarterly Report on Form 10-Q filed August 8, 2003 (File No. 000-50250)).
|
|
|
10.27
|
Stipulation and Agreement of Settlement, dated July 20, 2006, between MasterCard Incorporated, the several defendants and the plaintiffs in the consolidated federal class action lawsuit titled In re Foreign Currency Conversion Fee Antitrust Litigation (MDL 1409), and the California state court action titled Schwartz v. Visa Int'l Corp., et al. (incorporated by reference to Exhibit 10.1 to the Company's Quarterly Report on Form 10-Q filed November 1, 2006 (File No. 001-32877)).
|
|
|
10.28
|
Release and Settlement Agreement, dated June 24, 2008, by and among MasterCard Incorporated, MasterCard International Incorporated and American Express (incorporated by reference to Exhibit 10.2 to the Company's Quarterly Report on Form 10-Q filed August 1, 2008. (File No. 001-32877)).
|
|
|
10.29**
|
Judgment Sharing Agreement between MasterCard and Visa in the Discover Litigation, dated July 29, 2008, by and among MasterCard Incorporated, MasterCard International Incorporated, Visa Inc., Visa U.S.A. Inc. and Visa International Service Association (incorporated by reference to Exhibit 10.3 to the Company's Quarterly Report on Form 10-Q filed August 1, 2008. (File No. 001-32877)).
|
|
|
10.30
|
Release and Settlement Agreement dated as of October 27, 2008 by and among MasterCard, Discover and Visa (incorporated by reference to Exhibit 10.1 to the Company's Quarterly Report on Form 10-Q filed November 4, 2008. (File No. 001-32877)).
|
|
|
10.31
|
Agreement dated as of October 27, 2008, by and among MasterCard International Incorporated, MasterCard Incorporated, Morgan Stanley, Visa Inc., Visa U.S.A. Inc. and Visa International Association (incorporated by reference to Exhibit 10.2 to the Company's Quarterly Report on Form 10-Q filed November 4, 2008. (File No. 001-32877)).
|
|
|
10.32
|
Agreement to Prepay Future Payments at a Discount, dated as of July 1, 2009, by and between MasterCard International incorporated and Co-lead Counsel, acting collectively as binding representative and agent of the Plaintiffs (incorporated by reference to Exhibit 10.1 to the Company's Current Report on Form 8-K filed July 2, 2009 (File No. 001-32877)).
|
|
|
10.33
|
Omnibus Agreement Regarding Interchange Litigation Judgment Sharing and Settlement Sharing, dated as of February 7, 2011, by and among MasterCard Incorporated, MasterCard International Incorporated, Visa Inc., Visa U.S.A. Inc., Visa International Service Association and MasterCard's customer banks that are parties thereto (incorporated by reference to Exhibit 10.33 to Amendment No.1 to the Company's Annual Report on Form 10-K/A filed on November 23, 2011).
.
|
|
|
10.34**
|
MasterCard Settlement and Judgment Sharing Agreement, dated as of February 7, 2011, by and among MasterCard Incorporated, MasterCard International Incorporated and MasterCard's customer banks that are parties thereto (incorporated by reference to Exhibit 10.34 to Amendment No.1 to the Company's Annual Report on Form 10-K/A filed on November 23, 2011).
.
|
|
|
10.35
|
Memorandum of Understanding, dated July 13, 2012, by and among Counsel for MasterCard Incorporated and MasterCard International Incorporated; Counsel for Visa, Inc., Visa U.S.A. Inc. and Visa International Service Association; Co-Lead Counsel for Class Plaintiffs; and Attorneys for the Defendant Banks (incorporated by reference to Exhibit 10.1 to the Company's Current Report on Form 8-K filed July 16, 2012 (File No. 001-32877)).
|
|
|
10.36
|
Class Settlement Agreement, dated October 19, 2012, by and among MasterCard Incorporated and MasterCard International Incorporated; Visa, Inc., Visa U.S.A. Inc. and Visa International Service Association; the Class Plaintiffs defined therein; and the Customer Banks defined therein (incorporated by reference to Exhibit 10.2 to the Company's Quarterly Report on Form 10-Q filed October 31, 2012 (File No. 001-32877)).
|
|
|
12.1*
|
|
Computation of Ratio of Earnings to Fixed Charges.
|
|
21*
|
|
List of Subsidiaries of MasterCard Incorporated.
|
112
|
23.1*
|
Consent of PricewaterhouseCoopers LLP.
|
|
|
31.1*
|
|
Certification of Ajay Banga, President and Chief Executive Officer, pursuant to Rule 13a-14(a)/15d-14(a), as adopted pursuant to Section 302 of the Sarbanes-Oxley Act of 2002.
|
|
31.2*
|
|
Certification of Martina Hund-Mejean, Chief Financial Officer, pursuant to Rule 13a-14(a)/15d-14(a), as adopted pursuant to Section 302 of the Sarbanes-Oxley Act of 2002.
|
|
32.1*
|
|
Certification of Ajay Banga, President and Chief Executive Officer, pursuant to 18 U.S.C. Section 1350, as adopted pursuant to Section 906 of the Sarbanes-Oxley Act of 2002.
|
|
32.2*
|
|
Certification of Martina Hund-Mejean, Chief Financial Officer, pursuant to 18 U.S.C. Section 1350, as adopted pursuant to Section 906 of the Sarbanes-Oxley Act of 2002.
|
|
101.INS*
|
|
XBRL Instance Document
|
|
101.SCH*
|
|
XBRL Taxonomy Extension Scheme Document
|
|
101.CAL*
|
|
XBRL Taxonomy Extension Calculation Linkbase Document
|
|
101.DEF*
|
|
XBRL Taxonomy Extension Definition Linkbase Document
|
|
101.LAB*
|
|
XBRL Taxonomy Extension Label Linkbase Document
|
|
101.PRE*
|
|
XBRL Taxonomy Extension Presentation Linkbase Document
|
|
+
|
Management contracts or compensatory plans or arrangements.
|
|
*
|
Filed or furnished herewith.
|
|
**
|
Exhibit omits certain information that has been filed separately with the U.S. Securities and Exchange Commission and has been granted confidential treatment.
|
The agreements and other documents filed as exhibits to this report are not intended to provide factual information or other disclosure other than with respect to the terms of the agreements or other documents themselves, and should not be relied upon for that purpose. In particular, any representations and warranties made by the Company in these agreements or other documents were made solely within the specific context of the relevant agreement or document and may not describe the actual state of affairs as of the date they were made or at any other time.
113
TABLE OF CONTENTS
Item 1. BusinessItem 1A. Risk FactorsItem 1B. Unresolved Staff CommentsItem 2. PropertiesItem 3. Legal ProceedingsItem 4. Mine Safety DisclosuresPart IIItem 5. Market For Registrant's Common Equity, Related Stockholder Matters and Issuer Purchases Of Equity SecuritiesItem 6. Selected Financial DataItem 7. Management S Discussion and Analysis Of Financial Condition and Results Of OperationsItem 7A. Quantitative and Qualitative Disclosures About Market RiskItem 8. Financial Statements and Supplementary DataNote 1. Summary Of Significant Accounting PoliciesNote 2. AcquisitionsNote 3. Earnings Per ShareNote 4. Supplemental Cash FlowsNote 5. Fair Value and Investment SecuritiesNote 6. Prepaid Expenses and Other AssetsNote 7. Property, Plant and EquipmentNote 8. GoodwillNote 9. Other Intangible AssetsNote 10. Accrued ExpensesNote 11. Pension Plans, Postretirement Plan, Savings Plan and Other BenefitsNote 12. DebtNote 13. Stockholders EquityNote 14. Accumulated Other Comprehensive Income (loss)Note 15. Share Based Payment and Other BenefitsNote 16. CommitmentsNote 17. Income TaxesNote 18. Legal and Regulatory ProceedingsNote 19. Settlement and Other Risk ManagementNote 20. Foreign Exchange Risk ManagementNote 21. Segment ReportingItem 9. Changes in and Disagreements with Accountants on Accounting and Financial DisclosureItem 9A. Controls and ProceduresItem 9B. Other InformationPart IIIItem 10. Directors, Executive Officers and Corporate GovernanceItem 11. Executive CompensationItem 12. Security Ownership Of Certain Beneficial Owners and Management and Related Stockholder MattersItem 13. Certain Relationships and Related Transactions, and Director IndependenceItem 14. Principal Accounting Fees and ServicesPart IVItem 15. Exhibits and Financial Statement Schedules