MASTERCARD INC
10-Ks and 10-Qs
|
|
|
|
|
|
|
|
|
|
|
|
|
|
|
|
|
|
|
|
|
|
|
|
|
|
|
|
|
|
|
|
|
|
|
|
|
|
|
|
|
|
|
|
|
|
|
|
|
|
|
|
|
|
|
|
UNITED STATES
SECURITIES AND EXCHANGE COMMISSION
Washington, D.C. 20549
Form 10-K
|
x
|
ANNUAL REPORT PURSUANT TO SECTION 13 OR 15(d) OF THE SECURITIES EXCHANGE ACT OF 1934
|
For the fiscal year ended
December 31, 2018
Or
|
¨
|
TRANSITION REPORT PURSUANT TO SECTION 13 OR 15(d) OF THE SECURITIES EXCHANGE ACT OF 1934
|
For the transition period from to
Commission file number: 001-32877

|
||
Mastercard Incorporated
(Exact name of registrant as specified in its charter)
|
Delaware
|
13-4172551
|
|
(State or other jurisdiction of
incorporation or organization)
|
(IRS Employer
Identification Number)
|
|
2000 Purchase Street
|
10577
|
|
Purchase, NY
|
(Zip Code)
|
|
(Address of principal executive offices)
|
|
(914) 249-2000
(Registrant’s telephone number, including area code)
Title of each Class
Name of each exchange on which registered
Class A common stock, par value $0.0001 per share
New York Stock Exchange
Securities registered pursuant to Section 12(g):
Class B common stock, par value $0.0001 per share
Indicate by check mark if the registrant is a well-known seasoned issuer, as defined in Rule 405 of the Securities Act. Yes
x
No
¨
Indicate by check mark if the registrant is not required to file reports pursuant to Section 13 or Section 15(d) of the Act. Yes
¨
No
x
Indicate by check mark whether the registrant (1) has filed all reports required to be filed by Section 13 or 15(d) of the Securities Exchange Act of 1934 during the preceding 12 months (or for such shorter period that the registrant was required to file such reports), and (2) has been subject to such filing requirements for the past 90 days. Yes
x
No
¨
Indicate by check mark whether the registrant has submitted electronically every Interactive Data File required to be submitted pursuant to Rule 405 of Regulation S-T (§232.405 of this chapter) during the preceding 12 months (or for such shorter period that the registrant was required to submit such files) Yes
x
No
¨
Indicate by check mark if disclosure of delinquent filers pursuant to Item 405 of Regulation S-K (§229.405 of this chapter) is not contained herein, and will not be contained, to the best of the registrant’s knowledge, in definitive proxy or information statements incorporated by reference in Part III of this Form 10-K or any amendment to this Form 10-K.
x
Indicate by check mark whether the registrant is a large accelerated filer, an accelerated filer, a non-accelerated filer, a smaller reporting company, or an emerging growth company. See the definitions of “large accelerated filer,” “accelerated filer,” “smaller reporting company,” and “emerging growth company” in Rule 12b-2 of the Exchange Act. (Check One):
|
Large accelerated filer
|
|
x
|
|
Accelerated filer
|
|
o
|
|
Non-accelerated filer
|
|
o
(do not check if a smaller reporting company)
|
|
Smaller reporting company
|
|
o
|
|
Emerging growth company
|
|
o
|
||||
|
If an emerging growth company, indicate by check mark if the registrant has elected not to use the extended transition period for complying with any new or revised financial accounting standards provided pursuant to Section 13 (a) of the Exchange Act.
|
o
|
|||||
Indicate by check mark whether the registrant is a shell company (as defined in Rule 12b-2 of the Act). Yes
¨
No
x
The aggregate market value of the registrant’s Class A common stock, par value
$0.0001
per share, held by non-affiliates (using the New York Stock Exchange closing price as of
June 29, 2018
, the last business day of the registrant’s most recently completed second fiscal quarter) was approximately
$179.5 billion
. There is currently no established public trading market for the registrant’s Class B common stock, par value
$0.0001
per share. As of
February 8, 2019
, there were
1,014,237,644
shares outstanding of the registrant’s Class A common stock, par value
$0.0001
per share and
11,671,404
shares outstanding of the registrant’s Class B common stock, par value
$0.0001
per share.
Portions of the registrant’s definitive proxy statement for the
2019
Annual Meeting of Stockholders are incorporated by reference into Part III hereof.
MASTERCARD INCORPORATED
FISCAL YEAR
2018
FORM 10-K ANNUAL REPORT
TABLE OF CONTENTS
|
|
Page
|
|
|
ITEM 1.
|
||
|
ITEM 1A.
|
||
|
ITEM 1B.
|
||
|
ITEM 2.
|
||
|
ITEM 3.
|
||
|
ITEM 4.
|
||
|
ITEM 5.
|
||
|
ITEM 6.
|
||
|
ITEM 7.
|
||
|
ITEM 7A.
|
||
|
ITEM 8.
|
||
|
ITEM 9.
|
||
|
ITEM 9A.
|
||
|
ITEM 9B.
|
||
|
ITEM 10.
|
||
|
ITEM 11.
|
||
|
ITEM 12.
|
||
|
ITEM 13.
|
||
|
ITEM 14.
|
||
|
ITEM 15.
|
||
|
ITEM 16.
|
||
2
In this Report on Form 10-K (“Report”), references to the “Company,” “Mastercard,” “we,” “us” or “our” refer to the business conducted by Mastercard Incorporated and its consolidated subsidiaries, including our operating subsidiary, Mastercard International Incorporated, and to the Mastercard brand.
Forward-Looking Statements
This Report contains forward-looking statements pursuant to the safe harbor provisions of the Private Securities Litigation Reform Act of 1995. All statements other than statements of historical facts may be forward-looking statements. When used in this Report, the words “believe”, “expect”, “could”, “may”, “would”, “will”, “trend” and similar words are intended to identify forward-looking statements. Examples of forward-looking statements include, but are not limited to, statements that relate to the Company’s future prospects, developments and business strategies.
Many factors and uncertainties relating to our operations and business environment, all of which are difficult to predict and many of which are outside of our control, influence whether any forward-looking statements can or will be achieved. Any one of those factors could cause our actual results to differ materially from those expressed or implied in writing in any forward-looking statements made by Mastercard or on its behalf, including, but not limited to, the following factors:
|
•
|
regulation directly related to the payments industry (including regulatory, legislative and litigation activity with respect to interchange rates, surcharging and the extension of current regulatory activity to additional jurisdictions or products)
|
|
•
|
the impact of preferential or protective government actions
|
|
•
|
regulation of privacy, data protection, security and the digital economy
|
|
•
|
regulation that directly or indirectly applies to us based on our participation in the global payments industry (including anti-money laundering, counter terrorist financing, economic sanctions and anti-corruption; account-based payment systems; issuer practice regulation; and regulation of internet and digital transactions)
|
|
•
|
the impact of changes in tax laws, as well as regulations and interpretations of such laws or challenges to our tax positions
|
|
•
|
potential or incurred liability and limitations on business related to any litigation or litigation settlements
|
|
•
|
the impact of competition in the global payments industry (including disintermediation and pricing pressure)
|
|
•
|
the challenges relating to rapid technological developments and changes
|
|
•
|
the challenges relating to operating a real-time account-based payment system and to working with new customers and end users
|
|
•
|
the impact of information security incidents, account data breaches, fraudulent activity or service disruptions
|
|
•
|
issues related to our relationships with our financial institution customers (including loss of substantial business from significant customers, competitor relationships with our customers and banking industry consolidation)
|
|
•
|
the impact of our relationships with other stakeholders, including merchants and governments
|
|
•
|
exposure to loss or illiquidity due to our role as guarantor, as well as other contractual obligations
|
|
•
|
the impact of global economic, political, financial and societal events and conditions
|
|
•
|
reputational impact, including impact related to brand perception
|
|
•
|
the inability to attract, hire and retain a highly qualified and diverse workforce, or maintain our corporate culture
|
|
•
|
issues related to acquisition integration, strategic investments and entry into new businesses
|
|
•
|
issues related to our Class A common stock and corporate governance structure
|
Please see “Risk Factors” in Part I, Item 1A for a complete discussion of these risk factors. We caution you that the important factors referenced above may not contain all of the factors that are important to you. Our forward-looking statements speak only as of the date of this Report or as of the date they are made, and we undertake no obligation to update our forward-looking statements.
3
PART I
ITEM 1.
BUSINESS
Overview
Mastercard is a technology company in the global payments industry that connects consumers, financial institutions, merchants, governments, digital partners, businesses and other organizations worldwide, enabling them to use electronic forms of payment instead of cash and checks. We make payments easier and more efficient by creating a wide range of payment solutions and services using our family of well-known brands, including Mastercard®, Maestro® and Cirrus®. We are a multi-rail network. Through our core global payments processing network, we facilitate the switching (authorization, clearing and settlement) of payment transactions and deliver related products and services. With additional payment capabilities that include real-time account-based payments (including automated clearing house (“ACH”) transactions), we offer customers one partner to turn to for their payment needs for both domestic and cross-border transactions across multiple payment flows.
We also provide value-added offerings such as safety and security products, information and analytics services, consulting, loyalty and reward programs and issuer and acquirer processing. Our payment solutions are designed to ensure safety and security for the global payments system.
A typical transaction on our core network involves four participants in addition to us: account holder (a consumer who holds a card or uses another device enabled for payment), issuer (the account holder’s financial institution), merchant and acquirer (the merchant’s financial institution). We do not issue cards, extend credit, determine or receive revenue from interest rates or other fees charged to account holders by issuers, or establish the rates charged by acquirers in connection with merchants’ acceptance of our branded products. In most cases, account holder relationships belong to, and are managed by, our financial institution customers.
We generate revenues from assessing our customers based on the gross dollar volume (“GDV”) of activity on the products that carry our brands, from the fees we charge to our customers for providing transaction switching and from other payment-related products and services.
Our Performance
The following are our key financial and operational results for 2018:
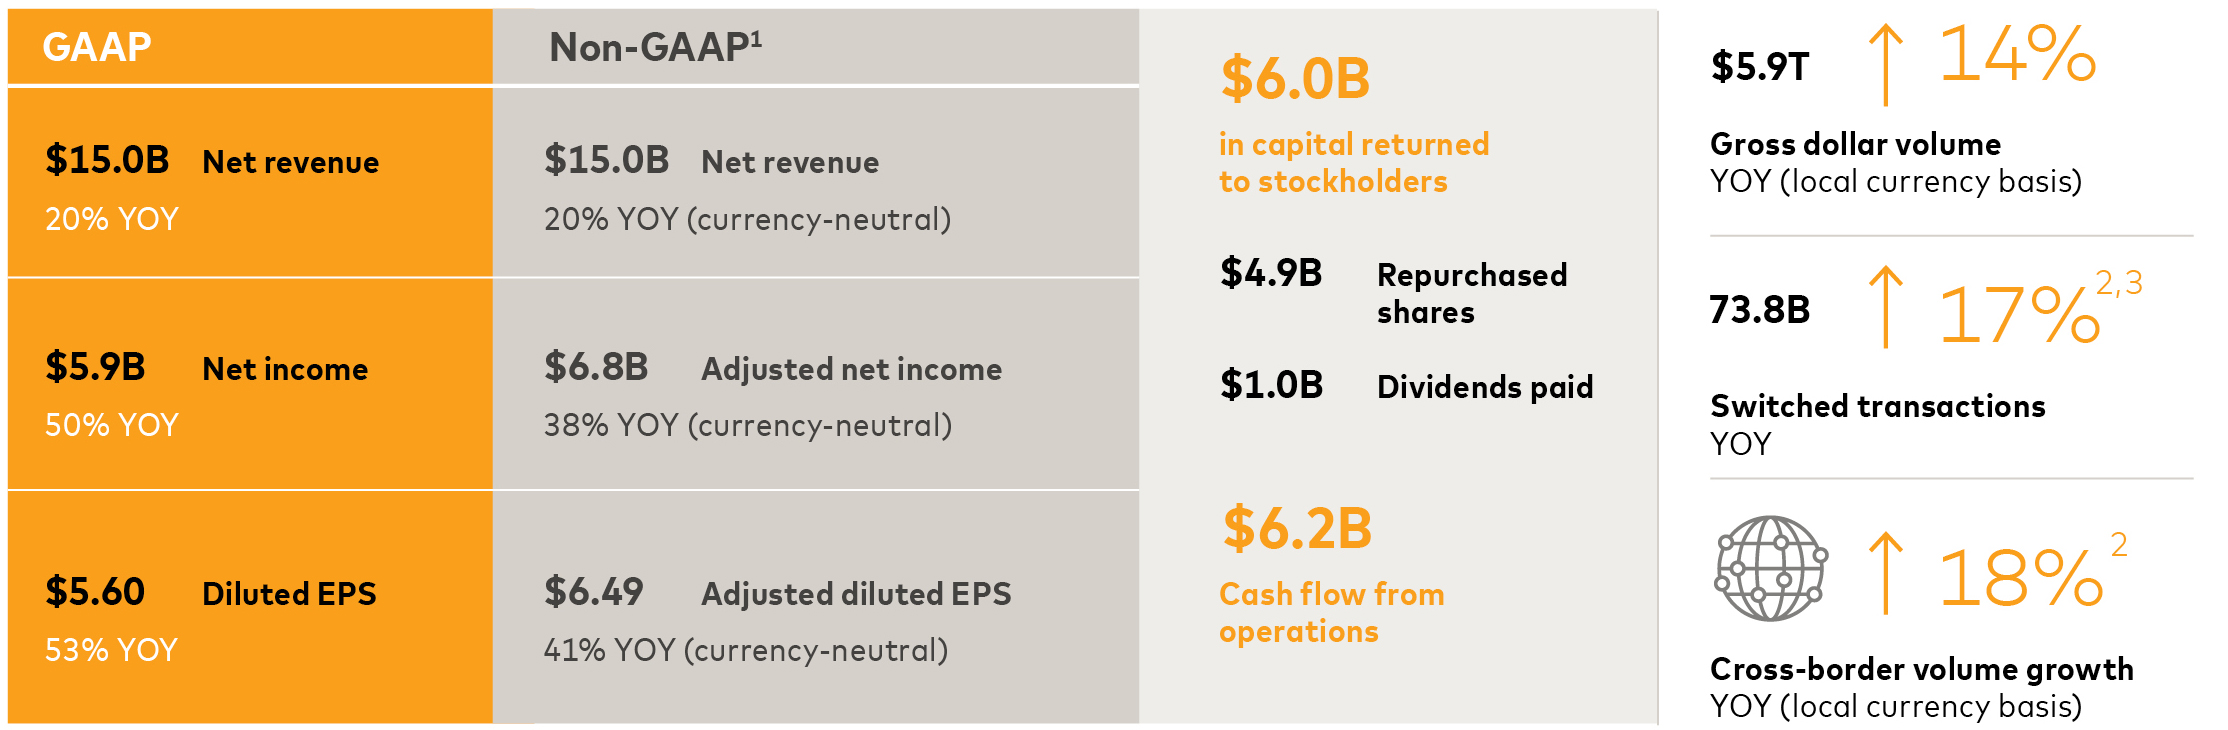
1
Non-GAAP results excludes the impact of Special Items and/or foreign currency. See “Management’s Discussion and Analysis of Financial Condition and Results of Operations - Financial Results Overview” in Part II, Item 7 for the reconciliation to the most direct comparable GAAP financial measures.
2
Adjusted to normalize for the effects of differing switching days between periods.
3
Adjusted for the deconsolidation of our Venezuelan subsidiaries in 2017. See “Management’s Discussion and Analysis of Financial Condition and Results of Operations - Financial Results- Revenue” in Part II, Item 7.
4
Our Strategy
We grow, diversify and build our business through a combination of organic growth and strategic investments. Our ability to grow our business is influenced by personal consumption expenditure (“PCE”) growth, driving cash and check transactions toward electronic forms of payment, increasing our share in electronic payments and providing value-added products and services. In addition, growing our business includes supplementing our core network with enhanced payment capabilities to capture new payment flows, such as business to business (“B2B”), person to person (“P2P”), business to consumer (“B2C”) and government payments, through a combination of product offerings and expanded solutions for our customers.
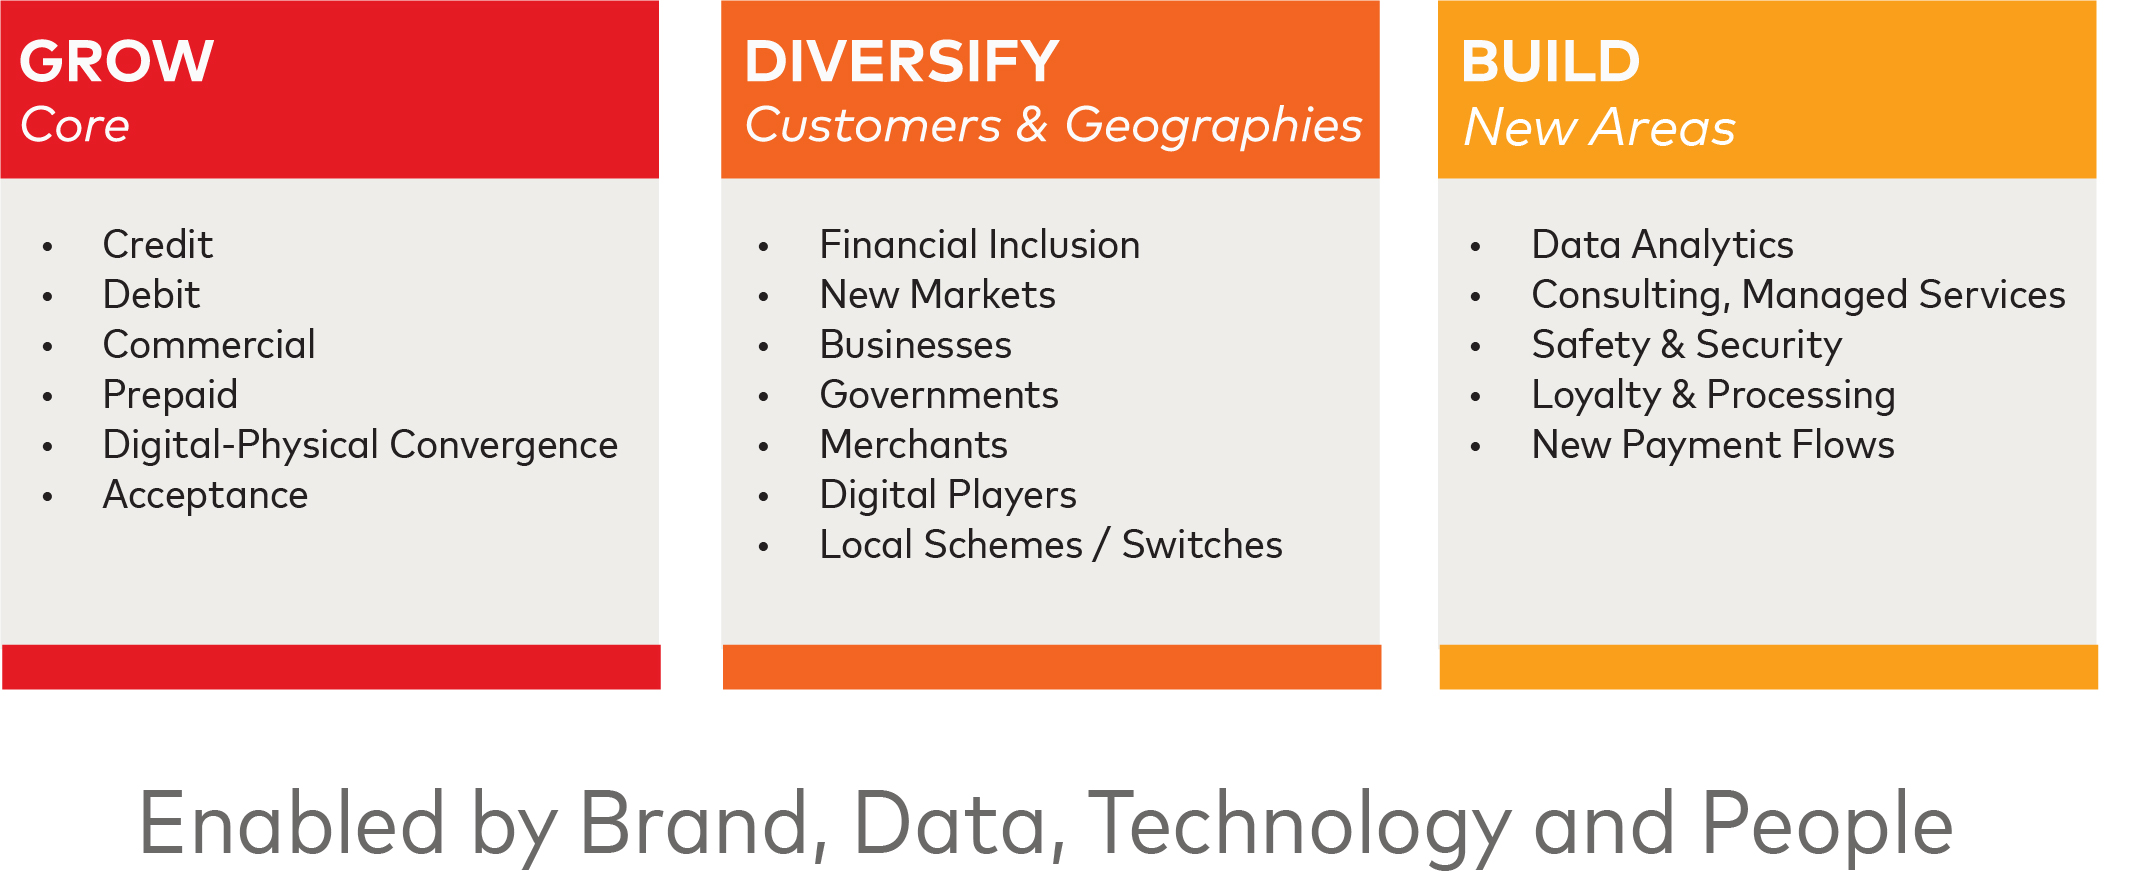
Grow
.
We focus on growing our core business globally, including growing our consumer credit, debit, prepaid and commercial products and solutions, as well as increasing the number of payment transactions we switch. We also look to take advantage of the opportunities presented by the evolving ways people interact and transact in the growing digital economy. This includes expanding merchant access to electronic payments through new technologies in an effort to deliver a better consumer experience, while creating greater efficiencies and security.
Diversify
.
We diversify our business by:
|
•
|
working with new customers, including governments, merchants, financial technology companies, digital players, mobile providers and other corporate businesses
|
|
•
|
scaling our capabilities and business into new geographies, including growing acceptance in markets with limited electronic payments acceptance today
|
|
•
|
broadening financial inclusion for the unbanked and underbanked
|
Build
.
We build our business by:
|
•
|
creating and acquiring differentiated products to provide unique, innovative solutions that we bring to market to support new payment flows, such as real-time account-based payment, Mastercard B2B Hub™ and Mastercard Send™ platforms
|
|
•
|
providing services across data analytics, consulting, managed services, safety and security, loyalty and processing
|
Strategic Partners
.
We work with a variety of stakeholders. We provide financial institutions with solutions to help them increase revenue by driving preference for Mastercard-branded products. We help merchants, financial institutions and other organizations by delivering data-driven insights and other services that help them grow and create simple and secure customer experiences. We partner with technology companies such as digital players and mobile providers to deliver digital payment solutions powered by our technology, expertise and security protocols. We help national and local governments drive increased financial inclusion and efficiency, reduce costs, increase transparency to reduce crime and corruption and advance social programs. For consumers, we provide faster, safer and more convenient ways to pay and transfer funds.
5
Talent and Culture.
Our success is driven by the skills, experience, integrity and mindset of the talent we hire. We attract and retain top talent from diverse backgrounds and industries by building a world-class culture based on decency, respect and inclusion in which people have opportunities to do purpose-driven work that impacts customers, communities and co-workers on a global scale. The diversity and skill sets of our people underpin everything we do.
Recent Business and Legal/Regulatory Developments

|
Digital Payments
.
Technology is increasingly changing the way people get information, interact with each other, shop and make purchases. As a result of these changes, digital commerce is growing significantly. In this digital environment, consumers continue to seek a seamless experience where their payment is simple, secure and familiar. These consumer demands are driving us to think and act differently. Our teams are innovating to create solutions that meet the needs of our consumers and merchants, and applying emerging technologies to maximize our opportunities from those needs. In 2018, we:
|
||
|
•
|
supported the development and implementation of EMVCo’s global standards for a simple and unified digital experience for consumers, issuers and merchants in the form of a common checkout button. This button is designed to provide consumers the same convenience and security in a digital environment that they have when shopping and paying in a store, make it easier for merchants to implement secure digital payments and provide issuers with improved fraud detection and prevention capability.
|
|
•
|
announced plans to enable token services on all cards, removing the primary account number from the transaction flow. Enabling these services will help make the payment process simpler, more seamless and more secure, while supporting our merchant partners in their card on file activities.
|
|
•
|
reinforced our support for contactless payments across all markets, including in Europe, where we are working with issuers, acquirers and merchants to ensure availability and support of contactless payments across the continent by 2020.
|

|
New payment flows.
In order to help grow our business and offer more electronic payment options to consumers, businesses and governments, Mastercard has developed and enhanced solutions beyond the principal switching capabilities available on our core network. We believe this will allow us to capture more payment flows, including B2B, P2P, B2C and government disbursements. In 2018, we:
|
||
|
•
|
advanced business development efforts around the world with our real-time account-based payments capabilities that we acquired with Vocalink in 2017. These efforts include the launch of a real-time payment service in the U.S. in conjunction with The Clearing House that enables consumers and businesses to send and receive immediate payments.
|
|
•
|
combined our proprietary Mastercard Send assets with Vocalink strategic partnerships to enable financial institutions, financial technology companies (or fintechs), digital customers and other businesses to send real-time payments to U.K. bank accounts. Mastercard Send will connect to Faster Payments, enabling a variety of use cases such as P2P payments and B2C disbursements. This effort is part of our continued expansion of Mastercard Send’s capabilities, connecting more people, businesses and governments to facilitate the transfer of funds quickly and securely both domestically and cross-border.
|
|
•
|
expanded the reach of Vocalink’s Pay by Bank application in the United Kingdom, enabling real-time payments directly from a consumer’s bank account using a mobile banking app, with real-time clearing and without the need for a card.
|
|
•
|
continued to invest in and test proprietary permission-based Blockchain, with an initial focus on the cross-border B2B payments space.
|
6

|
Safety and Security.
As new technologies and cyber-security threats evolve, including organized cyber-crime and nation state attacks, there is a growing need to protect the security and resilience of the payments ecosystem for every stakeholder. It is critical to protect all transactional and personal data that is stored, processed or transmitted regardless of the device or channel used to make a purchase, while at the same time continuing to improve the payment experience for all stakeholders. We focus on security across networks, and it is embedded in our policies, products, systems and analytics to prevent fraud. In 2018, we:
|
||
|
•
|
implemented EMVCo’s 3D Secure 2.0 specification as part of a new solution (launched with issuer and merchant partners globally) that supports app-based authentication, integration with digital wallets and browser-based e-commerce. This is complemented by biometrics, machine learning and artificial intelligence solutions, alongside incremental transaction data, to help merchants seamlessly verify a consumer’s identity. At the same time, the solution reduces friction during the checkout process, as well as reduces fraud while increasing payment approvals.
|
|
•
|
continued to extend our investments in Artificial Intelligence (“AI”) by:
|
Ø
introducing AI Express, a new accelerated technology implementation service to help issuers, acquirers and merchants develop AI models to solve priority problems, including anti-money laundering, fraud, risk management and cybersecurity.
Ø
scaling Decision Intelligence™, our fraud scoring technology, to score billions of transactions in real time every day while increasing approvals and reducing false declines.
|
•
|
piloted biometric cards in multiple markets, placing fingerprint readers directly onto a card to authenticate a cardholder’s identity (as an alternative to a PIN or signature) using existing chip and contactless acceptance terminals.
|
|
•
|
modified our rules so that signatures will no longer be required on either cards or receipts and merchants no longer need to capture or compare a signature at the point of sale, helping to provide a faster checkout and more advanced authentication methods.
|

|
Inclusive Growth.
We are dedicated to increasing the opportunity for individuals and micro and small merchants to achieve financial security and greater prosperity, with the benefits of economic growth shared among all segments of society. Together with our partners, we are more than two-thirds of the way toward an important initial step towards that goal by providing access to 500 million people previously excluded from financial services by 2020. We also help communities build the ecosystems that support usage. In 2018, we worked with governments and private sector partners across several geographies to develop and roll out electronic payments solutions, social payment distribution mechanisms and digital identity solutions. We organized a global network of cities to help city leaders address the challenges of urbanization and co-develop solutions to improve life for residents and visitors and promote economic growth. We also deployed our services, partnerships and technologies to develop platforms that help small business owners accept electronic payments, manage their records, access market information, build a financial footprint and use digital communications channels to receive training and business advice.
In 2018, we made an initial $100 million contribution to the Mastercard Impact Fund (formerly referred to as Mastercard’s Center for Inclusive Growth Fund), a non-profit charitable organization. This contribution is part of a $500 million commitment to support initiatives that focus on inclusive growth, such as financial inclusion, economic development, the future of work and data science for social impact.
|
||
7

|
Legal and Regulatory
.
We operate in a dynamic and rapidly evolving legal and regulatory environment, with heightened regulatory and legislative scrutiny, expansion of local regulatory schemes and other legal challenges, particularly with respect to interchange fees (as discussed below under “Our Operations and Network”). These challenges create both risks and opportunities for our industry. Our recent legal and regulatory developments include:
|
||
|
•
|
Payments Regulation
|
|
Ø
|
In December 2018, we announced the anticipated resolution of an investigation by the European Commission (“EC”) related to the interregional interchange rates we set and our central acquiring rule within the European Economic Area (the “EEA”). With respect to interregional interchange fees, the proposed settlement included changes to those fees that, if accepted by the EC following market testing, would avoid prolonged litigation and gain certainty concerning our business practices. With respect to our historic central acquiring rule, the EC issued a negative decision in January 2019. The EC’s negative decision covers a period of time of less than two years before the rule’s modification in 2015. The decision does not require any modification of our current business practices but includes a fine of
€571 million
. We recorded a charge of
$654 million
in the fourth quarter of 2018 in relation to this matter. See
Note 20 (Legal and Regulatory Proceedings)
to the consolidated financial statements included in Part II, Item 8 for further discussion.
|
|
Ø
|
Several jurisdictions have implemented payments regulation or initiated payments reviews in 2018. In the U.K., the Payment Systems Regulator (the “PSR”) published draft terms of reference for a formal review of card-acquiring services provided by Mastercard, Visa and other card scheme operators that could lead to future regulation. The European Commission expects to issue proposals in 2020 to revise the E.U. Interchange Fee Regulation. In Australia, the Productivity Commission released a report recommending, among other things, that regulators ban interchange fees by the end of 2019 and consider regulating merchant service fees. In Brazil, the Central Bank implemented a weighted average and cap for domestic debit interchange.
|
|
Ø
|
Jurisdictions around the globe continue to implement or consider open banking initiatives. Initiatives such as the EEA’s revised Payment Services Directive (commonly referred to as “PSD2”) which went into effect in 2018, require financial institutions to provide third-party payment processors access to consumer payment accounts, as well as requiring additional verification information from consumers to complete transactions. Other jurisdictions considering open banking initiatives include Australia, Canada, Hong Kong, Japan, Singapore and the United States.
|
|
Ø
|
The U.K. Treasury has extended the U.K. payment systems oversight to include our Vocalink business due to its role as a payment service provider.
|
|
•
|
Privacy and Data Protection
|
|
Ø
|
In 2018, the European Union General Data Protection Regulation (the “GDPR”) became effective. The GDPR is a data protection regulation that has increased our compliance burden for collecting, using and processing personal and sensitive data of EEA residents. We have reviewed our products, services and processes involving EEA personal data to ensure privacy and data protection requirements are embedded into their design. We have also launched online data portals to allow EEA residents to request a copy of their personal data, and to ask for their data to be updated, corrected or deleted as appropriate. In addition, we have taken steps to assist our customers with their compliance efforts. As part of our implementation approach, we co-founded with IBM a data trust called Truata to provide anonymization and analytics services in a GDPR-compliant manner.
|
|
Ø
|
Some jurisdictions are currently considering adopting “data localization” requirements, which mandate the collection, processing, and/or storage of data within their borders, including India, Kenya and Vietnam.
|
|
•
|
Litigation -
In September 2018, we entered into an amended class settlement agreement with the merchant damages class plaintiffs to settle their monetary damages claims in a U.S. antitrust litigation that was brought against Mastercard, Visa and a number of financial institutions. Visa and the financial institutions are also parties to the agreement, which is subject to court approval. In addition to the monetary amounts that constituted the financial settlement under the original agreement, the agreement requires an additional
|
8
payment from the defendants. We took a charge during 2018 to reflect our share of this payment. Under the agreement, Mastercard and its customer financial institutions will receive a release of all damages claims that were alleged, or could have been alleged by the merchant class members concerning our interchange and fee structure and merchant acceptance rules. This release covers all retrospective claims, as well as prospective claims for a period of five years after the resolution of all appeals relating to court approval of the agreement. In January 2019, the district court issued an order granting preliminary approval of the settlement. The agreement does not relate to the merchants' claims seeking changes to business practices. Separate settlement negotiations for those claims are ongoing. See
Note 20 (Legal and Regulatory Proceedings)
to the consolidated financial statements included in Part II, Item 8 for further discussion.
Our Business
Our Operations and Network
We operate a unique and proprietary global payments network, our core network, that links issuers and acquirers around the globe to facilitate the switching of transactions, permitting account holders to use a Mastercard product at millions of acceptance locations worldwide. Our core network facilitates an efficient and secure means for receiving payments, a convenient, quick and secure payment method for consumers to access their funds and a channel for businesses to receive insight through information that is derived from our network. We authorize, clear and settle transactions through our core network for our issuer customers in more than
150
currencies and in more than
210
countries and territories. Vocalink expands our range of payment capabilities beyond our core network into real-time account-based payments.
Typical Transaction
.
Our core network supports what is often referred to as a “four-party” payments network. The following diagram depicts a typical transaction on our core network, and our role in that transaction:
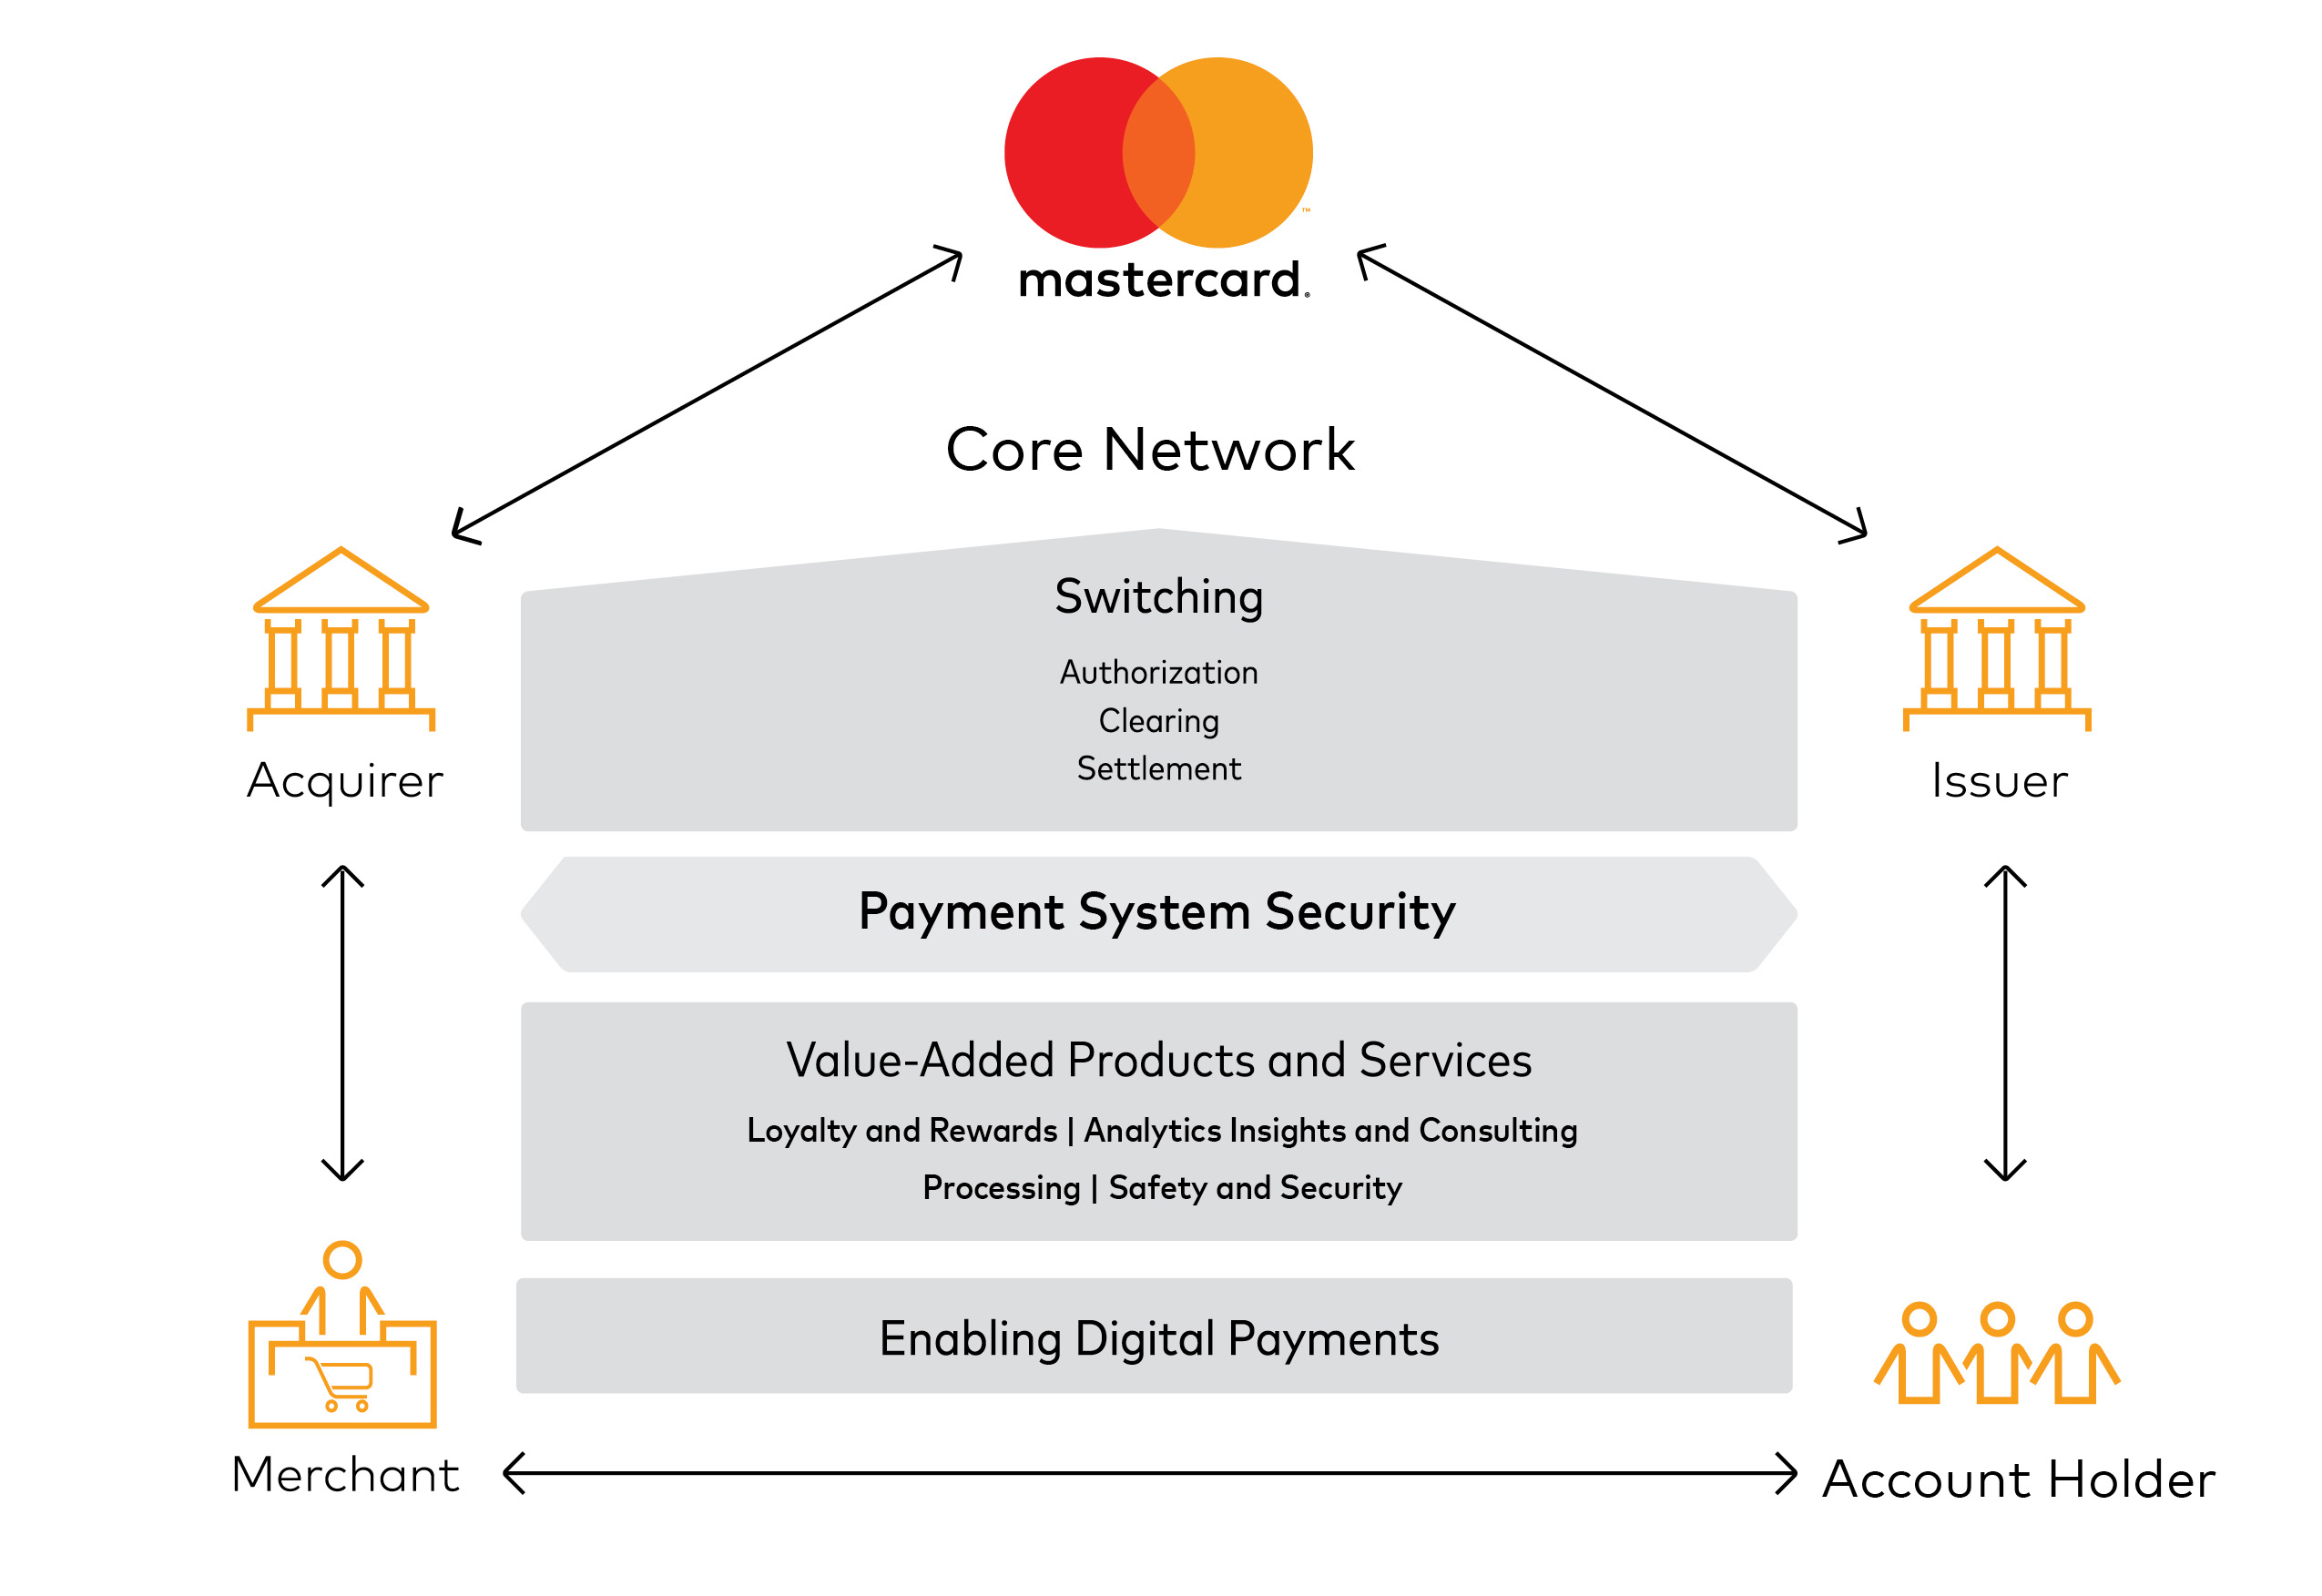
9
In a typical transaction, an account holder purchases goods or services from a merchant using one of our payment products. After the transaction is authorized by the issuer, the issuer pays the acquirer an amount equal to the value of the transaction, minus the interchange fee (described below), and then posts the transaction to the account holder’s account. The acquirer pays the amount of the purchase, net of a discount (referred to as the “merchant discount” rate), to the merchant.
|
•
|
Interchange Fees.
Interchange fees reflect the value merchants receive from accepting our products and play a key role in balancing the costs consumers and merchants incur. We do not earn revenues from interchange fees. Generally, interchange fees are collected from acquirers and paid to issuers to reimburse the issuers for a portion of the costs incurred. These costs are incurred by issuers in providing services that benefit all participants in the system, including acquirers and merchants, whose participation in the network enables increased sales to their existing and new customers, efficiencies in the delivery of existing and new products, guaranteed payments and improved experience for their customers. We (or, alternatively, financial institutions) establish “default interchange fees” that apply when there are no other established settlement terms in place between an issuer and an acquirer. We administer the collection and remittance of interchange fees through the settlement process.
|
|
•
|
Additional Four-Party System Fees.
The merchant discount rate is established by the acquirer to cover its costs of both participating in the four-party system and providing services to merchants. The rate takes into consideration the amount of the interchange fee which the acquirer generally pays to the issuer. Additionally, acquirers may charge merchants processing and related fees in addition to the merchant discount rate, and issuers may also charge account holders fees for the transaction, including, for example, fees for extending revolving credit.
|
Switched Transactions
|
•
|
Authorization, Clearing and Settlement.
Through our core network, we enable the routing of a transaction to the issuer for its approval, facilitate the exchange of financial transaction information between issuers and acquirers after a successfully conducted transaction, and help to settle the transaction by facilitating the determination and exchange of funds between parties via settlement banks chosen by us and our customers.
|
|
•
|
Cross-Border and Domestic.
Our core network switches transactions throughout the world when the acquirer country and issuer country are different (“cross-border transactions”), providing account holders with the ability to use, and merchants to accept, our products and services across country borders. We also provide switched transaction services to customers where the acquirer country and the issuer country are the same (“domestic transactions”). We switch more than half of all transactions for Mastercard and Maestro-branded cards, including nearly all cross-border transactions. We switch the majority of Mastercard and Maestro-branded domestic transactions in the United States, United Kingdom, Canada, Brazil and a select number of other countries. Outside of these countries, most domestic transactions on our products are switched without our involvement.
|
Core Network Architecture.
Our core network features a globally integrated structure that provides scale for our issuers, enabling them to expand into regional and global markets. It is based largely on a distributed (peer-to-peer) architecture with an intelligent edge that enables the network to adapt to the needs of each transaction. Our core network accomplishes this by performing intelligent routing and applying multiple value-added services (such as fraud scoring or rewards at the point of sale) to appropriate transactions in real time. Our core network’s architecture enables us to connect all parties regardless of where or how the transaction is occurring. It has 24-hour a day availability and world-class response time.
Real-time Account-based Payment Systems.
Augmenting our core network, we now offer real-time account-based payment capabilities through our acquisition of Vocalink, which enables payments between bank accounts in near real-time in countries in which it has been deployed.
Payments System Security.
Our payment solutions and products are designed to ensure safety and security for the global payments system. The core network and additional platforms incorporate multiple layers of protection, both for continuity purposes and to provide best-in-class security protection. We engage in many efforts to mitigate information security challenges, including maintaining an information security program, a business continuity program and insurance coverage, as well as regularly testing our systems to address potential vulnerabilities.
As part of our multi-layered approach to protect the global payments system, we also work with issuers, acquirers, merchants, governments and payments industry associations to help develop and put in place standards (e.g., EMV) for safe and secure transactions.
10
Digital Payments.
Our networks support and enable our digital payment platforms, products and solutions, reflecting the growing digital economy where consumers are increasingly seeking to use their payment accounts to pay when, where and how they want.
Customer Risk.
We guarantee the settlement of many of the transactions from issuers to acquirers to ensure the integrity of our core network. We refer to the amount of this guarantee as our settlement exposure. We do not, however, guarantee payments to merchants by their acquirers, or the availability of unspent prepaid account holder account balances.
Our Products and Services
We provide a wide variety of integrated products and services that support payment products that customers can offer to their account holders. These offerings facilitate transactions on our core network among account holders, merchants, financial institutions, businesses, governments and other organizations in markets globally.

Core Products
Consumer Credit.
We offer a number of programs that enable issuers to provide consumers with credit that allow them to defer payment. These programs are designed to meet the needs of our customers around the world and address standard, premium and affluent consumer segments.
11
Debit.
We support a range of payment products and solutions that allow our customers to provide consumers with convenient access to funds in deposit and other accounts. Our debit and deposit access programs can be used to make purchases and to obtain cash in bank branches, at ATMs and, in some cases, at the point of sale. Our branded debit programs consist of Mastercard (including standard, premium and affluent offerings), Maestro (the only PIN-based solution that operates globally) and Cirrus (our primary global cash access solution).
Prepaid.
Prepaid programs involve a balance that is funded prior to use and can be accessed via one of our payment products. We offer prepaid payment programs using any of our brands, which we support with processing products and services. Segments on which we focus include government programs such as Social Security payments, unemployment benefits and others; commercial programs such as payroll, health savings accounts, employee benefits and others; and reloadable programs for consumers without formal banking relationships and non-traditional users of electronic payments.
We also provide prepaid program management services, primarily outside of the United States, that manage and enable switching and issuer processing for consumer and commercial prepaid travel cards for business partners such as financial institutions, retailers, telecommunications companies, travel agents, foreign exchange bureaus, colleges and universities, airlines and governments.
Commercial.
We offer commercial payment products and solutions that help large corporations, midsize companies, small businesses and government entities. Our solutions streamline procurement and payment processes, manage information and expenses (such as travel and entertainment) and reduce administrative costs. Our card offerings include travel, small business (debit and credit), purchasing and fleet cards. Our SmartData platform provides expense management and reporting capabilities. Our Mastercard In Control™ platform generates virtual account numbers which provide businesses with enhanced controls, more security and better data.
The following chart provides GDV and number of cards featuring our brands in
2018
for select programs and solutions:
|
Year Ended December 31, 2018
|
As of December 31, 2018
|
||||||||||||||
|
GDV
|
Cards
|
||||||||||||||
|
(in billions)
|
Growth (Local)
|
% of Total GDV
|
(in millions)
|
Percentage Increase from December 31, 2017
|
|||||||||||
|
Mastercard Branded Programs
1,2
|
|||||||||||||||
|
Consumer Credit
|
$
|
2,520
|
|
11
|
%
|
43
|
%
|
824
|
|
8
|
%
|
||||
|
Consumer Debit and Prepaid
|
2,724
|
|
17
|
%
|
46
|
%
|
1,126
|
|
15
|
%
|
|||||
|
Commercial Credit and Debit
|
657
|
|
13
|
%
|
11
|
%
|
73
|
|
11
|
%
|
|||||
1
Excludes Maestro and Cirrus cards and volume generated by those cards.
2
Prepaid includes both consumer and commercial prepaid.
Additional Platforms.
In addition to the switching capabilities of our core network, we offer additional platforms with payment capabilities that extend to new payment flows:
|
•
|
We offer commercial payment products and solutions, such as the Mastercard B2B Hub, which enables small and midsized businesses to optimize their invoice and payment processes.
|
|
•
|
With Vocalink, we offer real-time account-based payments for ACH transactions. This platform enables payments between bank accounts in real-time and provides enhanced data and messaging capabilities, making them particularly well-suited for B2B and bill payment flows.
|
Value-Added Products and Services
We provide additional integrated products and services to our customers and stakeholders, including financial institutions, retailers and governments that enhance the value proposition of our products and solutions.
Safety and Security.
We offer integrated products and services to prevent, detect and respond to fraud and cyber-attacks and to ensure the safety of transactions made using Mastercard products. We do this using a multi-layered safety and security strategy:
|
•
|
The “Prevent” layer protects infrastructure, devices and data from attacks. We have continued to grow global usage of EMV chip and contactless security technology, helping to reduce fraud. Greater usage of this technology has increased
|
12
the number of EMV cards issued and the transaction volume on EMV cards. While this technology is prevalent in Europe, the U.S. market has been adopting this technology in recent years.
|
•
|
The “Identify” layer allows us to help banks and merchants verify genuine consumers during the payment process. Examples of solutions under this layer include Mastercard Identity Check™, a fingerprint, face and iris scanning biometric technology to verify online purchases on mobile devices, and our recently launched Biometric Card which has a fingerprint scanner built in to the card and is compatible with existing EMV payment terminals.
|
|
•
|
The “Detect” layer spots fraudulent behavior and cyber-attacks and takes action to stop these activities once detected. Examples of our capabilities under this layer include our Early Detection System, Decision Intelligence and Safety Net™ services and technologies.
|
|
•
|
The “Experience” layer improves the security experience for our stakeholders in areas from the speed of transactions, enhancing approvals for online and card-on-file payments, to the ability to differentiate legitimate consumers from fraudulent ones. Our offerings in this space include Mastercard In Control, for consumer alerts and controls and our suite of digital token services available through our Mastercard Digital Enablement Service (“MDES”).
|
We have also worked with our financial institution customers to provide products to consumers globally with increased confidence through the benefit of “zero liability”, or no responsibility for counterfeit or lost card losses in the event of fraud.
Loyalty and Rewards
. We have built a scalable rewards platform that enables financial institutions to provide consumers with a variety of benefits and services, such as personalized offers and rewards, access to a global airline lounge network, concierge services, insurance services, emergency card replacement, emergency cash advances and a 24-hour account holder service center. For merchants, we provide campaigns with targeted offers and rewards, management services for publishing offers, and accelerated points programs for co-brand and rewards program members.
Processing.
We extend our processing capabilities in the payments value chain in various regions and across the globe with an expanded suite of offerings, including:
|
•
|
Issuer solutions designed to provide customers with a complete processing solution to help them create differentiated products and services and allow quick deployment of payments portfolios across banking channels.
|
|
•
|
Payment gateways that offer a single interface to provide e-commerce merchants with the ability to process secure online and in-app payments and offer value-added solutions, including outsourced electronic payments, fraud prevention and alternative payment options.
|
|
•
|
Mobile gateways that facilitate transaction routing and processing for mobile-initiated transactions.
|
Analytics Insights and Consulting
.
We provide proprietary analysis, data-driven consulting and marketing services solutions to help clients optimize, streamline and grow their businesses, as well as deliver value to consumers.
Our capabilities incorporate payments expertise and analytical and executional skills to create end-to-end solutions which are increasingly delivered via platforms embedded in our customers’ day-to-day operations. By observing patterns of payments behavior based on billions of transactions switched globally, we leverage anonymized and aggregated information and a consultative approach to help our customers make better business decisions. Our executional skills such as marketing, digital implementation and staff augmentation allow us to assist clients implement actions based on these insights.
Increasingly, we have been helping financial institutions, retailers and governments innovate. Drawing on rapid prototyping methodologies from our global innovation and development arm, Mastercard Labs, we offer “Launchpad,” a five day app prototyping workshop. Through our Applied Predictive Technology business, a software as a service platform, we can help our customers conduct disciplined business experiments for in-market tests.
Digital Enablement
Leveraging our global innovations capability, we work to digitize payment services across all channels and devices:
|
•
|
Delivering better digital experiences everywhere.
We are using our technologies and security protocols to develop solutions to make digital shopping and selling experiences, such as on smartphones and other connected devices, simpler, faster and safer for both consumers and merchants. We also offer products that make it easier for merchants to accept payments and expand their customer base and are developing products and practices to facilitate acceptance
|
13
via mobile devices. The successful implementation of our loyalty and reward programs is an important part of enabling these digital purchasing experiences.
|
•
|
Securing more transactions.
We are leveraging tokenization, biometrics and machine learning technologies in our push to secure every transaction. These efforts include driving EMV-level security and benefits through all our payment channels.
|
|
•
|
Digitizing personal and business payments.
We provide solutions that enable our customers to offer consumers the ability to send and receive money quickly and securely domestically and around the world. These solutions allow our customers to address new payment flows from any funding source, such as cash, card, bank account or mobile money account, to any destination globally, securely and in real time.
|
|
•
|
Simplifying access to, and integration of, our digital assets.
Our Mastercard Developer platform makes it easy for customers and partners to leverage our many digital assets and services. By providing a single access point with tools and capabilities to find what we believe are some of the best-in-class Application Program Interfaces (“APIs”) across a broad range of Mastercard services, we enable easy integration of our services into new and existing solutions.
|
|
•
|
Identifying and experimenting with future technologies, start-ups and trends.
Through Mastercard Labs, our global innovation and development arm, we continue to bring customers and partners access to thought leadership, innovation methodologies, new technologies and relevant early-stage fintech players.
|
Brand

Our family of well-known brands includes Mastercard, Maestro and Cirrus. We manage and promote our brands through advertising, promotions and sponsorships, as well as digital, mobile and social media initiatives, in order to increase people’s preference for our brands and usage of our products. We sponsor a variety of sporting, entertainment and charity-related marketing properties to align with consumer segments important to us and our customers. Our advertising plays an important role in building brand visibility, usage and overall preference among account holders globally. Our “Priceless®” advertising campaign, which has run in 52 languages in 120 countries worldwide, promotes Mastercard usage benefits and acceptance, markets Mastercard payment products and solutions and provides Mastercard with a consistent, recognizable message that supports our brand around the globe.
Revenue Sources
We generate revenues primarily from assessing our customers based on GDV on the products that carry our brands, from the fees we charge to our customers for providing transaction processing and from other payment-related products and services. Our net revenues are classified into five categories: domestic assessments, cross-border volume fees, transaction processing, other revenues and rebates and incentives (contra-revenue).
See “Management’s Discussion and Analysis of Financial Condition and Results of Operations - Revenue” in Part II, Item 7 for more detail about our revenue, GDV, processed transactions and our other payment-related products and services.
Intellectual Property
We own a number of valuable trademarks that are essential to our business, including Mastercard, Maestro and Cirrus, through one or more affiliates. We also own numerous other trademarks covering various brands, programs and services offered by us to support our payment programs. Trademark and service mark registrations are generally valid indefinitely as long as they are used and/or properly maintained. Through license agreements with our customers, we authorize the use of our trademarks on a royalty-free basis in connection with our customers’ issuing and merchant acquiring businesses. In addition, we own a number of patents and patent applications relating to payment solutions, transaction processing, smart cards, contactless, mobile, biometrics, AI, security systems, blockchain and other matters, many of which are important to our business operations. Patents are of varying duration depending on the jurisdiction and filing date.
14
Competition
We compete in the global payments industry against all forms of payment including:
|
•
|
cash and checks
|
|
•
|
card-based payments, including credit, charge, debit, ATM and prepaid products, as well as limited-use products such as private label
|
|
•
|
contactless, mobile and e-commerce payments, as well as cryptocurrency
|
|
•
|
other electronic payments, including ACH payments, wire transfers, electronic benefits transfers and bill payments
|
We face a number of competitors both within and outside of the global payments industry:
|
•
|
Cash, Check and Legacy ACH
.
Cash and checks continue to represent one of the most widely used forms of payment. However, an even larger share of payments on a U.S. dollar volume basis are made via legacy, or “slow,” ACH platforms.
|
|
•
|
General Purpose Payment Networks
.
We compete worldwide with payment networks such as Visa, American Express, JCB, China UnionPay and Discover, among others. Some competitors have more market share than we do in certain jurisdictions. Some also have different business models that may provide an advantage in pricing, regulatory compliance burdens or otherwise. In addition, several governments are promoting, or considering promoting, local networks for domestic switching. See “Risk Factors” in Part I, Item 1A for a more detailed discussion of the risks related to payments system regulation and government actions that may prevent us from competing effectively.
|
|
•
|
Debit and Local Networks.
We compete with ATM and point-of-sale debit networks in various countries. In addition, in many countries outside of the United States, local debit brands serve as the main domestic brands, while our brands are used mostly to enable cross-border transactions (typically representing a small portion of overall transaction volume). Certain jurisdictions have also created domestic card schemes focused mostly on debit (e.g., MIR in Russia).
|
|
•
|
Competition for Customer Business
.
We compete intensely with other payments companies for customer business. Globally, financial institutions typically issue both Mastercard and Visa-branded payment products, and we compete with Visa for business on the basis of individual portfolios or programs. In addition, a number of our customers issue American Express and/or Discover-branded payment cards in a manner consistent with a four-party system.
We continue to face intense competitive pressure on the prices we charge our issuers and acquirers, and we seek to enter into business agreements with them through which we offer incentives and other support to issue and promote our payment products. We also compete for merchants, governments and mobile providers.
|
|
•
|
Real-time Account-based Payment Systems.
Through Vocalink, we face competition in the real-time account-based payment space from other companies that provide these payment solutions. In addition, real-time account-based payments face competition from other payment methods, such as cash and checks, cards, electronic, mobile and e-commerce payment platforms, cryptocurrencies and other payments networks.
|
|
•
|
Alternative Payments Systems and New Entrants
.
As the global payments industry becomes more complex, we face increasing competition from alternative payment systems and emerging payment providers. Many of these providers have developed payments systems focused on online activity in e-commerce and mobile channels (in some cases, expanding to other channels), and may process payments using in-house account transfers, real-time account-based payment networks or global or local networks. Examples include digital wallet providers (such as Paytm, PayPal, Alipay and Amazon), mobile operator services, mobile phone-based money transfer and microfinancing services (such as mPesa), handset manufacturers and cryptocurrencies. In some circumstances, these providers can be a partner or customer, as well as a competitor.
|
|
•
|
Value-Added Products and Services.
We face competition from companies that provide alternatives to our value-added products and services, including information services and consulting firms that provide consulting services and insights to financial institutions, as well as companies that compete against us as providers of loyalty and program management solutions. In addition, our integrated products and services offerings face competition and potential displacement from transaction processors throughout the world, which are seeking to enhance their networks that link issuers directly with point-of-sale devices for payment transaction authorization and processing services. Regulatory initiatives could also lead to increased competition in this space.
|
15
Our competitive advantages include our:
|
•
|
globally recognized brands
|
|
•
|
highly adaptable global acceptance network built over 50 years which can reach a variety of parties enabling payments
|
|
•
|
global payments network with world-class operating performance
|
|
•
|
expertise in real-time account-based payments through our Vocalink business
|
|
•
|
adoption of innovative products and digital solutions
|
|
•
|
safety and security solutions embedded in our networks
|
|
•
|
analytics insights and consulting services dedicated solely to the payments industry
|
|
•
|
ability to serve a broad array of participants in global payments due to our expanded on-soil presence in individual markets and a heightened focus on working with governments
|
|
•
|
world class talent
|
Government Regulation
General.
Government regulation impacts key aspects of our business. We are subject to regulations that affect the payments industry in the many countries in which our integrated products and services are used. See “Risk Factors” in Part I, Item 1A for more detail and examples.
Payments Oversight
.
Several central banks or similar regulatory bodies around the world have increased, or are seeking to increase, their formal oversight of the electronic payments industry. Actions by these organizations could influence other organizations around the world to adopt or consider adopting similar oversight. As a result, Mastercard could be subject to new regulation, supervisions and examination requirements. For example, in the U.K., the Bank of England has expanded its oversight of systemically important payment systems to include service providers, as well. Also, in the EEA, the implementation of PSD2 will require financial institutions to provide third party payment processors access to consumer payment accounts, which may enable these processors to route transactions away from Mastercard products by offering certain services directly to people who currently use our products. PSD2 will also require a new standard for authentication of transactions, which necessitates additional verification information from consumers to complete transactions. This may increase the number of transactions that consumers abandon if we are unable to ensure a frictionless authentication experience under the new standards.
Interchange Fees.
Interchange fees associated with four-party payments systems like ours are being reviewed or challenged in various jurisdictions around the world via legislation to regulate interchange fees, competition-related regulatory proceedings, central bank regulation and litigation. Examples include statutes in the United States that cap debit interchange for certain regulated activities and European Union legislation capping consumer credit and debit interchange fees on payments issued and acquired within the EEA. For more detail, see our risk factors in “Risk Factors-Regulations Related to Our Participation in the Payments Industry” in Part I, Item 1A. Also see
Note 20 (Legal and Regulatory Proceedings)
to the consolidated financial statements included in Part II, Item 8.
Preferential or Protective Government Actions.
Some governments have taken action to provide resources, preferential treatment or other protection to selected domestic payments and processing providers, as well as to create their own national providers. For example, governments in some countries mandate switching of domestic payments either entirely in that country or by only domestic companies. In China, we are currently excluded from domestic switching and are seeking market access, which is uncertain and subject to a number of factors, including receiving regulatory approval. We are in active discussions to explore different solutions.
Payment Systems Regulation
.
Regulators in several countries around the world either have, or are seeking to establish, authority to regulate certain aspects of the payment systems in their countries. Such authority has resulted in regulation of various aspects of our business. In the European Union, legislation requires us to separate our scheme activities (brand, products, franchise and licensing) from our switched transactions and other processing in terms of how we go to market, make decisions and organize our structure. Additionally, several jurisdictions have created or granted authority to create new regulatory bodies that either have or would have the authority to regulate payment systems, including the United Kingdom’s PSR (Vocalink and Mastercard are both participants in the payments system and are therefore subject to the PSR’s duties and powers), India (which has also
16
designated us as a payments system subject to regulation), the National Bank of Belgium and regulators in Brazil, Hong Kong, Mexico and Russia.
Anti-Money Laundering, Counter Terrorist Financing, Economic Sanctions and Anti-Corruption.
We are subject to anti-money laundering (“AML”) and counter terrorist financing (“CTF”) laws and regulations globally, including the U.S. Bank Secrecy Act and the USA PATRIOT Act, as well as the various economic sanctions programs, including those imposed and administered by the U.S. Office of Foreign Assets Control (“OFAC”). We have implemented a comprehensive AML/CTF program, comprised of policies, procedures and internal controls, including the designation of a compliance officer, which is designed to prevent our payment network from being used to facilitate money laundering and other illicit activity and to address these legal and regulatory requirements and assist in managing money laundering and terrorist financing risks. The economic sanctions programs administered by OFAC restrict financial transactions and other dealings with certain countries and geographies (specifically Crimea, Cuba, Iran, North Korea and Syria) and with persons and entities included in OFAC sanctions lists including its list of Specially Designated Nationals and Blocked Persons (the “SDN List”). We take measures to prevent transactions that do not comply with OFAC and other applicable sanctions, including establishing a risk-based compliance program that has policies, procedures and controls designed to prevent us from having unlawful business dealings with prohibited countries, regions, individuals or entities. As part of this program, we obligate issuers and acquirers to comply with their local sanctions obligations and the U.S. sanctions programs, including requiring the screening of account holders and merchants, respectively, against OFAC sanctions lists (including the SDN List). Iran, Sudan and Syria have been identified by the U.S. State Department as terrorist-sponsoring states, and we have no offices, subsidiaries or affiliated entities located in any of these countries or geographies and do not license entities domiciled there. We are also subject to anti-corruption laws and regulations globally, including the U.S. Foreign Corrupt Practices Act and the U.K. Bribery Act, which, among other things, generally prohibit giving or offering payments or anything of value for the purpose of improperly influencing a business decision or to gain an unfair business advantage. We have implemented policies, procedures and internal controls to proactively manage corruption risk.
Financial Sector Oversight.
We are or may be subject to regulations related to our role in the financial industry and our relationship with our financial institution customers. In addition, we are or may be subject to regulation by a number of agencies charged with oversight of, among other things, consumer protection, financial and banking matters. The regulators have supervisory and independent examination authority as well as enforcement authority that we may be subject to because of the services we provide to financial institutions that issue and acquire our products.
Issuer Practice Legislation and Regulation.
Our customers are subject to numerous regulations and investigations applicable to banks and other financial institutions in their capacity as issuers and otherwise, impacting us as a consequence. Such regulations and investigations have been related to payment card add-on products, campus cards, bank overdraft practices, fees issuers charge to account holders and the transparency of terms and conditions. Additionally, regulations such as PSD2 in the EEA require financial institutions to provide third-party payment-processors access to consumer payment accounts, enabling them to provide payment initiation and account information services directly to consumers.
Regulation of Internet and Digital Transactions
.
Various jurisdictions have enacted or have proposed regulation related to internet transactions. The legislation applies to payments system participants, including us and our U.S. customers, and is implemented through a federal regulation. We may also be impacted by evolving laws surrounding gambling, including fantasy sports. Certain jurisdictions are also considering regulatory initiatives in digital-related areas that could impact us, such as cyber-security and copyright and trademark infringement.
Privacy, Data Protection and Information Security.
Aspects of our operations or business are subject to increasingly complex privacy and data protection laws in the United States, the European Union and elsewhere around the world. For example, in the United States, we and our customers are respectively subject to Federal Trade Commission and federal banking agency information safeguarding requirements under the Gramm-Leach-Bliley Act that require the maintenance of a written, comprehensive information security program. In the European Union, we are subject to the GDPR, which requires a comprehensive privacy and data protection program to protect the personal and sensitive data of EEA residents. A number of regulators and policymakers around the globe are using the GDPR as a reference to adopt new or updated privacy and data protection laws, including in the U.S. (California), Argentina, Brazil, Chile, India, Indonesia and Kenya. Some jurisdictions are currently considering adopting “data localization” requirements, which mandate the collection, processing, and/or storage of data within their borders, including India, Kenya and Vietnam. Due to constant changes to the nature of data and the use of emerging technologies such as artificial intelligence, regulations in this area are constantly evolving with regulatory and legislative authorities in numerous parts of the world adopting proposals to protect information. In addition, the interpretation and application of these privacy and data protection laws are often uncertain and in a state of flux, thus requiring constant monitoring for compliance.
Additional Regulatory Developments.
Various regulatory agencies also continue to examine a wide variety of issues that could impact us, including evolving laws surrounding marijuana, prepaid payroll cards, virtual currencies, identity theft, account management guidelines, disclosure rules, security and marketing that would impact our customers directly.
17
Seasonality
We do not experience meaningful seasonality.
Employees
As of
December 31, 2018
, we employed approximately 14,800 persons, of whom approximately 8,800 were employed outside of the United States.
Additional Information
Mastercard Incorporated was incorporated as a Delaware corporation in May 2001. We conduct our business principally through our principal operating subsidiary, Mastercard International Incorporated, a Delaware non-stock (or membership) corporation that was formed in November 1966. For more information about our capital structure, including our Class A common stock (our voting stock) and Class B common stock (our non-voting stock), see
Note 15 (Stockholders’ Equity)
to the consolidated financial statements included in Part II, Item 8.
Website and SEC Reports
Our internet address is www.mastercard.com. From time to time, we may use our corporate website as a channel of distribution of material company information. Financial and other material information is routinely posted and accessible on the investor relations section of our corporate website. You can also visit “Investor Alerts” in the investor relations section to enroll your email address to automatically receive email alerts and other information about Mastercard.
Our annual report on Form 10-K, quarterly reports on Form 10-Q, current reports on Form 8-K and amendments to those reports are available for review, without charge, on the investor relations section of our corporate website as soon as reasonably practicable after they are filed with, or furnished to, the U.S. Securities and Exchange Commission (the “SEC”). The information contained on our corporate website is not incorporated by reference into this Report. Our filings are also available electronically from the SEC at www.sec.gov.
18
ITEM 1A. RISK FACTORS

Legal and Regulatory
Payments Industry Regulation
Global regulatory and legislative activity directly related to the payments industry may have a material adverse impact on our overall business and results of operations.
Regulators increasingly seek to regulate certain aspects of payments systems such as ours, or establish or expand their authority to do so. Many jurisdictions have enacted such regulations. These regulations have established, and could further expand, obligations or restrictions with respect to the types of products and services that we may offer to financial institutions for consumers, the countries in which our integrated products and services may be used, the way we structure and operate our business and the types of consumers and merchants who can obtain or accept our products or services. New regulations and oversight could also relate to our clearing and settlement activities (including risk management policies and procedures, collateral requirements, participant default policies and procedures, the ability to complete timely switching of financial transactions, and capital and financial resource requirements). In addition, several central banks or similar regulatory bodies around the world
have increased, or are seeking to increase, their formal oversight of the electronic payments industry and, in some cases, are considering designating certain payments networks as “systemically important payment systems” or “critical infrastructure.”
19
These obligations, designations and restrictions may further expand and could conflict with each other as more jurisdictions impose oversight of payment systems.
Some enacted regulations require financial institutions to provide third party payment processors access to consumer payment accounts. This may enable these third party payment processors to route transactions away from Mastercard products by offering account information or payment initiation services directly to people who currently use our products. This may also allow these processors to commoditize the data that are included in the transactions. New authentication standards have been enacted requiring additional verification information from consumers to complete transactions. This may increase the number of transactions that consumers abandon if we are unable to ensure a frictionless authentication experience. An increase in the rate of abandoned transactions could adversely impact our volumes or other operational metrics.
Increased regulation and oversight of payment systems may result in costly compliance burdens or otherwise increase our costs. Such laws or compliance burdens could result in issuers and acquirers being less willing to participate in our payments system, reduce the benefits offered in connection with the use of our products (making our products less desirable to consumers), reduce the volume of domestic and cross-border transactions or other operational metrics, disintermediate us, impact our profitability and limit our ability to innovate or offer differentiated products and services, all of which could materially and adversely impact our financial performance. Regulators could also require us to obtain prior approval for changes to its system rules, procedures or operations, or could require customization with regard to such changes, which could impact market participant risk and therefore risk to us. Such regulatory changes could lead to new or different criteria for participation in and access to our payments system by financial institutions or other customers. Moreover, failure to comply with the laws and regulations to which we are subject could result in fines, sanctions, civil damages or other penalties, which could materially and adversely affect our overall business and results of operations, as well as have an impact on our brand and reputation.
Increased regulatory, legislative and litigation activity with respect to interchange rates could have an adverse impact on our business.
Interchange rates are a significant component of the costs that merchants pay in connection with the acceptance of our products. Although we do not earn revenues from interchange, interchange rates can impact the volume of transactions we see on our payment products. If interchange rates are too high, merchants may stop accepting our products or route debit transactions away from our network. If interchange rates are too low, issuers may stop promoting our integrated products and services, eliminate or reduce loyalty rewards programs or other account holder benefits (e.g., free checking or low interest rates on balances), or charge fees to account holders (e.g., annual fees or late payment fees).
Governments and merchant groups in a number of countries have implemented or are seeking interchange rate reductions through legislation, competition law, central bank regulation and litigation. See “Government Regulation” and
Note 20 (Legal and Regulatory Proceedings)
to the consolidated financial statements included in Part II, Item 8 for more details.
If issuers cannot collect or we are forced to reduce interchange rates, issuers may be less willing to participate in our four-party payments system, or may reduce the benefits offered in connection with the use of our products, reducing the attractiveness of our products to consumers. In particular, potential changes to interregional interchange fees as a result of the proposed resolution of the European Commission’s investigation could impact our cross-border transaction activity disproportionately versus competitors that are not subject to similar reductions. These and other impacts could lower transaction volumes, and/or make proprietary three-party networks or other forms of payment more attractive. Issuers could reduce the benefits associated with our products or choose to charge higher fees to consumers to attempt to recoup a portion of the costs incurred for their services. In addition, issuers could seek to decrease the expense of their payment programs by seeking a reduction in the fees that we charge to them, particularly if regulation has a disproportionate impact on us as compared to our competitors in terms of the fees we can charge. This could make our products less desirable to consumers, reduce the volume of transactions and our profitability, and limit our ability to innovate or offer differentiated products.
We are devoting substantial resources to defending our right to establish interchange rates in regulatory proceedings, litigation and legislative activity. The potential outcome of any of these activities could have a more positive or negative impact on us relative to our competitors. If we are ultimately unsuccessful in defending our ability to establish interchange rates, any resulting legislation, regulation and/or litigation may have a material adverse impact on our overall business and results of operations. In addition, regulatory proceedings and litigation could result (and in some cases has resulted) in us being fined and/or having to pay civil damages, the amount of which could be material.
20
Current regulatory activity could be extended to additional jurisdictions or products, which could materially and adversely affect our overall business and results of operations.
Regulators around the world increasingly replicate other regulators’ approaches with regard to the regulation of payments and other industries. Consequently, regulation in any one country, state or region may influence regulatory approaches in other countries, states or regions. Similarly, new laws and regulations within a country, state or region involving one product may lead to regulation of similar or related products. For example, regulations affecting debit transactions could lead to regulation of other products (such as credit).
As a result, the risks to our business created by any one new law or regulation are magnified by the potential it has to be replicated in other jurisdictions or involve other products within any particular jurisdiction. These include matters like interchange rates, potential direct regulation of our network fees and pricing, network standards and network exclusivity and routing agreements. Conversely, if widely varying regulations come into existence worldwide, we may have difficulty adjusting our products, services, fees and other important aspects of our business to meet the varying requirements. Either of these outcomes could materially and adversely affect our overall business and results of operations.
Limitations on our ability to restrict merchant surcharging could materially and adversely impact our results of operations.
We have historically implemented policies, referred to as no-surcharge rules, in certain jurisdictions, including the United States, that prohibit merchants from charging higher prices to consumers who pay using our products instead of other means. Authorities in several jurisdictions have acted to end or limit the application of these no-surcharge rules (or indicated interest in doing so). Additionally, we have modified our no-surcharge rules to permit U.S. merchants to surcharge credit cards, subject to certain limitations. It is possible that over time merchants in some or all merchant categories in these jurisdictions may choose to surcharge as permitted by the rule change. This could result in consumers viewing our products less favorably and/or using alternative means of payment instead of electronic products, which could result in a decrease in our overall transaction volumes, and which in turn could materially and adversely impact our results of operations.
Preferential or Protective Government Actions
Preferential and protective government actions related to domestic payment services could adversely affect our ability to maintain or increase our revenues.
Governments in some countries have acted, or in the future may act, to provide resources, preferential treatment or other protection to selected national payment and switching providers, or have created, or may in the future create, their own national provider. This action may displace us from, prevent us from entering into, or substantially restrict us from participating in, particular geographies, and may prevent us from competing effectively against those providers. For example:
|
•
|
Governments in some countries are considering, or may consider, regulatory requirements that mandate switching of domestic payments either entirely in that country or by only domestic companies.
|
|
•
|
Some jurisdictions are considering requirements to collect, process and/or store data within their borders, as well as prohibitions on the transfer of data abroad, leading to technological and operational implications.
|
|
•
|
Geopolitical events and resulting OFAC sanctions, adverse trade policies or other types of government actions could lead jurisdictions affected by those sanctions to take actions in response that could adversely affect our business.
|
|
•
|
Regional groups of countries are considering, or may consider, efforts to restrict our participation in the switching of regional transactions.
|
Such developments prevent us from utilizing our global switching capabilities for domestic or regional customers. Our efforts to effect change in, or work with, these countries may not succeed. This could adversely affect our ability to maintain or increase our revenues and extend our global brand.
Privacy, Data Protection and Security
Regulation of privacy, data protection, security and the digital economy could increase our costs, as well as negatively impact our growth.
We are subject to increasingly complex regulations related to privacy, data protection and information security in the jurisdictions in which we do business. These regulations could result in negative impacts to our business. As we continue to develop integrated
21
products and services to meet the needs of a changing marketplace, as well as acquire new companies, we may expand our information profile through the collection of additional data from additional sources and across multiple channels. This expansion could amplify the impact of these regulations on our business. Regulation of privacy and data protection and information security often times require monitoring of and changes to our data practices in regard to the collection, use, disclosure, storage, transfer and/or security of personal and sensitive information. We are also subject to enhanced compliance and operational requirements in the European Union, and policymakers around the globe are using these requirements as a reference to adopt new or updated privacy laws that could result in similar or stricter requirements in other jurisdictions. Some jurisdictions are also considering requirements to collect, process and/or store data within their borders, as well as prohibitions on the transfer of data abroad, leading to technological and operational implications. Other jurisdictions are considering adopting sector-specific regulations for the payments industry, including forced data sharing requirements or additional verification requirements that overlap or conflict with, or diverge from, general privacy rules. Failure to comply with these laws, regulations and requirements could result in fines, sanctions or other penalties, which could materially and adversely affect our results of operations and overall business, as well as have an impact on our reputation.
New requirements or reinterpretations of existing requirements in these areas, or the development of new regulatory schemes related to the digital economy in general, may also increase our costs and could impact the products and services we offer and other aspects of our business, such as fraud monitoring, the development of information-based products and solutions and technology operations. In addition, these requirements may increase the costs to our customers of issuing payment products, which may, in turn, decrease the number of our payment products that they issue. Moreover, due to account data compromise events and privacy abuses by other companies, as well as the disclosure of monitoring activities by certain governmental agencies in combination with the use of artificial intelligence and new technologies, there has been heightened legislative and regulatory scrutiny around the world that could lead to further regulation and requirements and/or future enforcement. Those developments have also raised public attention on companies’ data practices and have changed consumer and societal expectations for enhanced privacy and data protection. Any of these developments could materially and adversely affect our overall business and results of operations.
In addition, fraudulent activity could encourage regulatory intervention, which could damage our reputation and reduce the use and acceptance of our integrated products and services or increase our compliance costs. Criminals are using increasingly sophisticated methods to capture consumer account information to engage in illegal activities such as counterfeiting or other fraud. As outsourcing and specialization become common in the payments industry, there are more third parties involved in processing transactions using our payment products. While we are taking measures to make card and digital payments more secure, increased fraud levels involving our integrated products and services, or misconduct or negligence by third parties switching or otherwise servicing our integrated products and services, could lead to regulatory intervention, such as enhanced security requirements, as well as damage to our reputation.
Other Regulation
Regulations that directly or indirectly apply to Mastercard as a result of our participation in the global payments industry may materially and adversely affect our overall business and results of operations.
We are subject to regulations that affect the payments industry in the many jurisdictions in which our integrated products and services are used. Many of our customers are also subject to regulations applicable to banks and other financial institutions that, at times, consequently affect us. Regulation of the payments industry, including regulations applicable to us and our customers, has increased significantly in the last several years. See “Business - Government Regulation” in Part I, Item 1 for a detailed description of such regulation and related legislation. Examples include:
|
•
|
Anti-Money Laundering, Counter Terrorist Financing, Economic Sanctions and Anti-Corruption
- We are subject to AML and CTF laws and regulations globally, including the U.S. Bank Secrecy Act and the USA PATRIOT Act, as well as the various economic sanctions programs, including those imposed and administered by OFAC. The economic sanctions programs administered by OFAC restrict financial transactions and other dealings with certain countries and geographies (specifically Crimea, Cuba, Iran, North Korea and Syria) and with persons and entities included in OFAC sanctions lists including the SDN List. Iran, Sudan and Syria have been identified by the U.S. State Department as terrorist-sponsoring states. We are also subject to anti-corruption laws and regulations globally, including the U.S. Foreign Corrupt Practices Act and the U.K. Bribery Act, which, among other things, generally prohibit giving or offering payments or anything of value for the purpose of improperly influencing a business decision or to gain an unfair business advantage. A violation and subsequent judgment or settlement against us, or those with whom we may be associated, under these laws could subject us to substantial monetary penalties, damages, and/or have a significant reputational impact.
|
22
|
•
|
Account-based Payment Systems
– In the U.K., the Treasury has expanded the Bank of England’s oversight of certain payment system providers that are systemically important to U.K.’s payment network. As a result of these changes, aspects of our Vocalink business are now subject to the U.K. payment system oversight regime and are directly overseen by the Bank of England.
|
|
•
|
Issuer Practice Legislation and Regulation
- Our financial institution customers are subject to numerous regulations, which impact us as a consequence. In addition, certain regulations (such as PSD2 in the EEA) may disintermediate issuers. If our customers are disintermediated in their business, we could face diminished demand for our integrated products and services. In addition, existing or new regulations in these or other areas may diminish the attractiveness of our products to our customers.
|
|
•
|
Regulation of Internet and Digital Transactions
- Proposed legislation in various jurisdictions relating to Internet gambling and other digital areas such as cyber-security and copyright and trademark infringement could impose additional compliance burdens on us and/or our customers, including requiring us or our customers to monitor, filter, restrict, or otherwise oversee various categories of payment transactions.
|
Increased regulatory focus on us, such as in connection with the matters discussed above, may result in costly compliance burdens and/or may otherwise increase our costs. Similarly, increased regulatory focus on our customers may cause such customers to reduce the volume of transactions processed through our systems, or may otherwise impact the competitiveness of our products. Actions by regulators could influence other organizations around the world to enact or consider adopting similar measures, amplifying any potential compliance burden. Finally, failure to comply with the laws and regulations discussed above to which we are subject could result in fines, sanctions or other penalties. Each may individually or collectively materially and adversely affect our financial performance and/or our overall business and results of operations, as well as have an impact on our reputation.
We could be subject to adverse changes in tax laws, regulations and interpretations or challenges to our tax positions.
We are subject to tax laws and regulations of the U.S. federal, state and local governments as well as various non-U.S. jurisdictions. Potential changes in existing tax laws, including future regulatory guidance, may impact our effective tax rate and tax payments. There can be no assurance that changes in tax laws or regulations, both within the U.S. and the other jurisdictions in which we operate, will not materially and adversely affect our effective tax rate, tax payments, financial condition and results of operations. Similarly, changes in tax laws and regulations that impact our customers and counterparties or the economy generally may also impact our financial condition and results of operations.
In addition, tax laws and regulations are complex and subject to varying interpretations, and any significant failure to comply with applicable tax laws and regulations in all relevant jurisdictions could give rise to substantial penalties and liabilities. Any changes in enacted tax laws, rules or regulatory or judicial interpretations; any adverse outcome in connection with tax audits in any jurisdiction; or any change in the pronouncements relating to accounting for income taxes could materially and adversely impact our effective tax rate, tax payments, financial condition and results of operations.
Litigation
Liabilities we may incur or limitations on our business related to any litigation or litigation settlements could materially and adversely affect our results of operations.
We are a defendant on a number of civil litigations and regulatory proceedings and investigations, including among others, those alleging violations of competition and antitrust law and those involving intellectual property claims. See
Note 20 (Legal and Regulatory Proceedings)
to the consolidated financial statements included in Part II, Item 8 for more details regarding the allegations contained in these complaints and the status of these proceedings. In the event we are found liable in any material litigations or proceedings, particularly in the event we may be found liable in a large class-action lawsuit or on the basis of an antitrust claim entitling the plaintiff to treble damages or under which we were jointly and severally liable, we could be subject to significant damages, which could have a material adverse impact on our overall business and results of operations.
Certain limitations have been placed on our business in recent years because of litigation and litigation settlements, such as changes to our no-surcharge rule in the United States. Any future limitations on our business resulting from litigation or litigation settlements could impact our relationships with our customers, including reducing the volume of business that we do with them, which may materially and adversely affect our overall business and results of operations.
23
Business and Operations
Competition and Technology
Substantial and intense competition worldwide in the global payments industry may materially and adversely affect our overall business and results of operations.
The global payments industry is highly competitive. Our payment programs compete against all forms of payment, including cash and checks; electronic, mobile and e-commerce payment platforms; cryptocurrencies; ACH payment services; and other payments networks, which can have several competitive impacts on our business:
|
•
|
Some of our traditional competitors, as well as alternative payment service providers, may have substantially greater financial and other resources than we have, may offer a wider range of programs and services than we offer or may use more effective advertising and marketing strategies to achieve broader brand recognition or merchant acceptance than we have.
|
|
•
|
Our ability to compete may also be affected by the outcomes of litigation, competition-related regulatory proceedings, central bank activity and legislative activity.
|
Certain of our competitors operate three-party payments systems with direct connections to both merchants and consumers and these competitors may derive competitive advantages from their business models. If we continue to attract more regulatory scrutiny than these competitors because we operate a four-party system, or we are regulated because of the system we operate in a way in which our competitors are not, we could lose business to these competitors. See “Business-Competition” in Part I, Item 1.
If we are not able to differentiate ourselves from our competitors, drive value for our customers and/or effectively align our resources with our goals and objectives, we may not be able to compete effectively against these threats. Our competitors may also more effectively introduce their own innovative programs and services that adversely impact our growth. We also compete against new entrants that have developed alternative payments systems, e-commerce payments systems and payments systems for mobile devices, as well as physical store locations. A number of these new entrants rely principally on the Internet to support their services and may enjoy lower costs than we do, which could put us at a competitive disadvantage. Our failure to compete effectively against any of the foregoing competitive threats could materially and adversely affect our overall business and results of operations.
Disintermediation from stakeholders both within and outside of the payments value chain could harm our business.
As the payments industry continues to develop and change, we face disintermediation and related risks, including:
|
•
|
Parties that process our transactions in certain countries may try to eliminate our position as an intermediary in the payment process. For example, merchants could switch (and in some cases are switching) transactions directly with issuers. Additionally, processors could process transactions directly between issuers and acquirers. Large scale consolidation within processors could result in these processors developing bilateral agreements or in some cases switching the entire transaction on their own network, thereby disintermediating us.
|
|
•
|
Regulation in the EEA may disintermediate us by enabling third-party providers opportunities to route payment transactions away from our networks and towards other forms of payment.
|
|
•
|
Although we partner with technology companies (such as digital players and mobile providers) that leverage our technology, platforms and networks to deliver their products, they could develop platforms or networks that disintermediate us from digital payments and impact our ability to compete in the digital economy. This risk is heightened when we have relationships with these entities where we share Mastercard data. While we share this data in a controlled manner subject to applicable anonymization and privacy and data protection standards, without proper oversight we could inadvertently share too much data which could give the partner a competitive advantage.
|
|
•
|
Competitors, customers, technology companies, governments and other industry participants may develop products that compete with or replace value-added products and services we currently provide to support our switched transaction and payment offerings. These products could replace our own switching and payments offerings or could force us to change our pricing or practices for these offerings. In addition, governments that develop national payment platforms may promote their platforms in such a way that could put us at a competitive disadvantage in those markets.
|
24
|
•
|
Participants in the payments industry may merge, create joint ventures or form other business combinations that may strengthen their existing business services or create new payment products and services that compete with our services.
|
Our failure to compete effectively against any of the foregoing competitive threats could materially and adversely affect our overall business and results of operations.
Continued intense pricing pressure may materially and adversely affect our overall business and results of operations.
In order to increase transaction volumes, enter new markets and expand our Mastercard-branded cards and enabled products and services, we seek to enter into business agreements with customers through which we offer incentives, pricing discounts and other support that promote our products. In order to stay competitive, we may have to increase the amount of these incentives and pricing discounts. Over the past several years, we have experienced continued pricing pressure. The demand from our customers for better pricing arrangements and greater rebates and incentives moderates our growth. We may not be able to continue our expansion strategy to switch additional transaction volumes or to provide additional services to our customers at levels sufficient to compensate for such lower fees or increased costs in the future, which could materially and adversely affect our overall business and results of operations. In addition, increased pressure on prices increases the importance of cost containment and productivity initiatives in areas other than those relating to customer incentives.
In the future, we may not be able to enter into agreements with our customers if they require terms that we are unable or unwilling to offer, and we may be required to modify existing agreements in order to maintain relationships and to compete with others in the industry. Some of our competitors are larger and have greater financial resources than we do and accordingly may be able to charge lower prices to our customers. In addition, to the extent that we offer discounts or incentives under such agreements, we will need to further increase transaction volumes or the amount of services provided thereunder in order to benefit incrementally from such agreements and to increase revenue and profit, and we may not be successful in doing so, particularly in the current regulatory environment. Our customers also may implement cost reduction initiatives that reduce or eliminate payment product marketing or increase requests for greater incentives or greater cost stability. These factors could have a material adverse impact on our overall business and results of operations.
Rapid and significant technological developments and changes could negatively impact our overall business and results of operations or limit our future growth.
The payments industry is subject to rapid and significant technological changes, which can impact our business in several ways:
|
•
|
Technological changes, including continuing developments of technologies in the areas of smart cards and devices, contactless and mobile payments, e-commerce, cryptocurrency and block chain technology, machine learning and AI, could result in new technologies that may be superior to, or render obsolete, the technologies we currently use in our programs and services. Moreover, these changes could result in new and innovative payment methods and products that could place us at a competitive disadvantage and that could reduce the use of our products.
|
|
•
|
We rely in part on third parties, including some of our competitors and potential competitors, for the development of and access to new technologies. The inability of these companies to keep pace with technological developments, or the acquisition of these companies by competitors, could negatively impact our offerings.
|
|
•
|
Our ability to develop and adopt new services and technologies may be inhibited by industry-wide solutions and standards (such as those related to EMV, tokenization or other safety and security technologies), and by resistance from customers or merchants to such changes.
|
|
•
|
Our ability to develop evolving systems and products may be inhibited by any difficulty we may experience in attracting and retaining technology experts.
|
|
•
|
Our ability to adopt these technologies can also be inhibited by intellectual property rights of third parties. We have received, and we may in the future receive, notices or inquiries from patent holders (for example, other operating companies or non-practicing entities) suggesting that we may be infringing certain patents or that we need to license the use of their patents to avoid infringement. Such notices may, among other things, threaten litigation against us or our customers or demand significant license fees.
|
|
•
|
Our ability to develop new technologies and reflect technological changes in our payments offerings will require resources, which may result in additional expenses.
|
25
|
•
|
We work with technology companies (such as digital players and mobile providers) that use our technology to enhance payment safety and security and to deliver their payment-related products and services quickly and efficiently to consumers. Our inability to keep pace technologically could negatively impact the willingness of these customers to work with us, and could encourage them to use their own technology and compete against us.
|
We cannot predict the effect of technological changes on our business, and our future success will depend, in part, on our ability to anticipate, develop or adapt to technological changes and evolving industry standards.
Failure to keep pace with these technological developments or otherwise bring to market products that reflect these technologies could lead to a decline in the use of our products, which could have a material adverse impact on our overall business and results of operations.
Operating a real-time account-based payment network presents risks that could materially affect our business.
Our acquisition of Vocalink in 2017 added real-time account-based payment technology to the suite of capabilities we offer. While expansion into this space presents business opportunities, there are also regulatory and operational risks associated with administering a real-time account-based payment network.
British regulators have designated this platform to be “critical national infrastructure” and regulators in other countries may in the future expand their regulatory oversight of real-time account-based payment systems in similar ways. In addition, any prolonged service outage on this network could result in quickly escalating impacts, including potential intervention by the Bank of England and significant reputational risk to Vocalink and us. For a discussion of the regulatory risks related to our real-time account-based payment platform, see our risk factor in “Risk Factors - Payments Industry Regulation” in this Part I, Item 1A. Furthermore, the complexity of this payment technology requires careful management to address security vulnerabilities that are different from those faced on our core network. Operational difficulties, such as the temporary unavailability of our services or products, or security breaches on our real-time account-based payment network could cause a loss of business for these products and services, result in potential liability for us and adversely affect our reputation.
Working with new customers and end users as we expand our integrated products and services can present operational challenges, be costly and result in reputational damage if the new products or services do not perform as intended.
The payments markets in which we compete are characterized by rapid technological change, new product introductions, evolving industry standards and changing customer and consumer needs. In order to remain competitive and meet the needs of the payments market, we are continually involved in diversifying our integrated products and services. These efforts carry the risks associated with any diversification initiative, including cost overruns, delays in delivery and performance problems. These projects also carry risks associated with working with different types of customers, for example organizations such as corporations that are not financial institutions and non-governmental organizations (“NGOs”), and end users than those we have traditionally worked with. These differences may present new operational challenges in the development and implementation of our new products or services.
Our failure to render these integrated products and services could make our other integrated products and services less desirable to customers, or put us at a competitive disadvantage. In addition, if there is a delay in the implementation of our products or services or if our products or services do not perform as anticipated, we could face additional regulatory scrutiny, fines, sanctions or other penalties, which could materially and adversely affect our overall business and results of operations, as well as negatively impact our brand and reputation.
Information Security and Service Disruptions
Information security incidents or account data compromise events could disrupt our business, damage our reputation, increase our costs and cause losses.
Information security risks for payments and technology companies such as ours have significantly increased in recent years in part because of the proliferation of new technologies, the use of the Internet and telecommunications technologies to conduct financial transactions, and the increased sophistication and activities of organized crime, hackers, terrorists and other external parties. These threats may derive from fraud or malice on the part of our employees or third parties, or may result from human error or accidental technological failure. These threats include cyber-attacks such as computer viruses, malicious code, phishing attacks or information security breaches and could lead to the misappropriation of consumer account and other information and identity theft.
Our operations rely on the secure processing, transmission and storage of confidential, proprietary and other information in our computer systems and networks. Our customers and other parties in the payments value chain, as well as account holders, rely on our digital technologies, computer systems, software and networks to conduct their operations. In addition, to access our
26
integrated products and services, our customers and account holders increasingly use personal smartphones, tablet PCs and other mobile devices that may be beyond our control. We, like other financial technology organizations, routinely are subject to cyber-threats and our technologies, systems and networks have been subject to attempted cyber-attacks. Because of our position in the payments value chain, we believe that we are likely to continue to be a target of such threats and attacks. Additionally, geopolitical events and resulting government activity could also lead to information security threats and attacks by affected jurisdictions and their sympathizers.
To date, we have not experienced any material impact relating to cyber-attacks or other information security breaches. However, future attacks or breaches could lead to security breaches of the networks, systems or devices that our customers use to access our integrated products and services, which in turn could result in the unauthorized disclosure, release, gathering, monitoring, misuse, loss or destruction of confidential, proprietary and other information (including account data information) or data security compromises. Such attacks or breaches could also cause service interruptions, malfunctions or other failures in the physical infrastructure or operations systems that support our businesses and customers (such as the lack of availability of our value-added services), as well as the operations of our customers or other third parties. In addition, they could lead to damage to our reputation with our customers and other parties and the market, additional costs to us (such as repairing systems, adding new personnel or protection technologies or compliance costs), regulatory penalties, financial losses to both us and our customers and partners and the loss of customers and business opportunities. If such attacks are not detected immediately, their effect could be compounded.
Despite various mitigation efforts that we undertake, there can be no assurance that we will be immune to these risks and not suffer material breaches and resulting losses in the future, or that our insurance coverage would be sufficient to cover all losses. Our risk and exposure to these matters remain heightened because of, among other things, the evolving nature of these threats, our prominent size and scale and our role in the global payments and technology industries, our plans to continue to implement our digital and mobile channel strategies and develop additional remote connectivity solutions to serve our customers and account holders when and how they want to be served, our global presence, our extensive use of third-party vendors and future joint venture and merger and acquisition opportunities. As a result, information security and the continued development and enhancement of our controls, processes and practices designed to protect our systems, computers, software, data and networks from attack, damage or unauthorized access remain a priority for us. As cyber-threats continue to evolve, we may be required to expend significant additional resources to continue to modify or enhance our protective measures or to investigate and remediate any information security vulnerabilities. Any of the risks described above could materially adversely affect our overall business and results of operations.
In addition to information security risks for our systems, we also routinely encounter account data compromise events involving merchants and third-party payment processors that process, store or transmit payment transaction data, which affect millions of Mastercard, Visa, Discover, American Express and other types of account holders. Further events of this type may subject us to reputational damage and/or lawsuits involving payment products carrying our brands. Damage to our reputation or that of our brands resulting from an account data breach of either our systems or the systems of our customers, merchants and other third parties could decrease the use and acceptance of our integrated products and services. Such events could also slow or reverse the trend toward electronic payments. In addition to reputational concerns, the cumulative impact of multiple account data compromise events could increase the impact of the fraud resulting from such events by, among other things, making it more difficult to identify consumers. Moreover, while most of the lawsuits resulting from account data breaches do not involve direct claims against us and while we have releases from many issuers and acquirers, we could still face damage claims, which, if upheld, could materially and adversely affect our results of operations. Such events could have a material adverse impact on our transaction volumes, results of operations and prospects for future growth, or increase our costs by leading to additional regulatory burdens being imposed on us.
Service disruptions that cause us to be unable to process transactions or service our customers could materially affect our overall business and results of operations.
Our transaction switching systems and other offerings may experience interruptions as a result of technology malfunctions, fire, weather events, power outages, telecommunications disruptions, terrorism, workplace violence, accidents or other catastrophic events. Our visibility in the global payments industry may also put us at greater risk of attack by terrorists, activists, or hackers who intend to disrupt our facilities and/or systems. Additionally, we rely on third-party service providers for the timely transmission of information across our global data network. Inadequate infrastructure in lesser-developed markets could also result in service disruptions, which could impact our ability to do business in those markets. If one of our service providers fails to provide the communications capacity or services we require, as a result of natural disaster, operational disruptions, terrorism, hacking or any other reason, the failure could interrupt our services. Although we maintain a business continuity program to analyze risk, assess potential impacts, and develop effective response strategies, we cannot ensure that our business would be immune to these risks, because of the intrinsic importance of our switching systems to our business, any interruption or
27
degradation could adversely affect the perception of the reliability of products carrying our brands and materially adversely affect our overall business and our results of operations.
Financial Institution Customers and Other Stakeholder Relationships
Losing a significant portion of business from one or more of our largest financial institution customers could lead to significant revenue decreases in the longer term, which could have a material adverse impact on our business and our results of operations.
Most of our financial institution customer relationships are not exclusive and may be terminated by our customers. Our customers can reassess their commitments to us at any time in the future and/or develop their own competitive services. Accordingly, our business agreements with these customers may not reduce the risk inherent in our business that customers may terminate their relationships with us in favor of relationships with our competitors, or for other reasons, or might not meet their contractual obligations to us.
In addition, a significant portion of our revenue is concentrated among our five largest financial institution customers. Loss of business from any of our large customers could have a material adverse impact on our overall business and results of operations.
Exclusive/near exclusive relationships certain customers have with our competitors may have a material adverse impact on our business.
Certain customers have exclusive, or nearly-exclusive, relationships with our competitors to issue payment products, and these relationships may make it difficult or cost-prohibitive for us to do significant amounts of business with them to increase our revenues. In addition, these customers may be more successful and may grow faster than the customers that primarily issue our payment products, which could put us at a competitive disadvantage. Furthermore, we earn substantial revenue from customers with nearly-exclusive relationships with our competitors. Such relationships could provide advantages to the customers to shift business from us to the competitors with which they are principally aligned. A significant loss of our existing revenue or transaction volumes from these customers could have a material adverse impact on our business.
Consolidation
in the banking industry could materially and adversely affect our overall business and results of operations.
The banking industry has undergone substantial, accelerated consolidation in the past. Consolidations have included customers with a substantial Mastercard portfolio being acquired by institutions with a strong relationship with a competitor. If significant consolidation among customers were to continue, it could result in the substantial loss of business for us, which could have a material adverse impact on our business and prospects. In addition, one or more of our customers could seek to merge with, or acquire, one of our competitors, and any such transaction could also have a material adverse impact on our overall business. Consolidation could also produce a smaller number of large customers, which could increase their bargaining power and lead to lower prices and/or more favorable terms for our customers. These developments could materially and adversely affect our results of operations.
Our business significantly depends on the continued success and competitiveness of our issuing and acquiring customers and, in many jurisdictions, their ability to effectively manage or help manage our brands.
While we work directly with many stakeholders in the payments system, including merchants, governments and large digital companies and other technology companies, we are, and will continue to be, significantly dependent on our relationships with our issuers and acquirers and their respective relationships with account holders and merchants to support our programs and services. Furthermore, we depend on our issuing partners and acquirers to continue to innovate to maintain competitiveness in the market. We do not issue cards or other payment devices, extend credit to account holders or determine the interest rates or other fees charged to account holders. Each issuer determines these and most other competitive payment program features. In addition, we do not establish the discount rate that merchants are charged for acceptance, which is the responsibility of our acquiring customers. As a result, our business significantly depends on the continued success and competitiveness of our issuing and acquiring customers and the strength of our relationships with them. In turn, our customers’ success depends on a variety of factors over which we have little or no influence, including economic conditions in global financial markets or their disintermediation by competitors or emerging technologies, as well as regulation. If our customers become financially unstable, we may lose revenue or we may be exposed to settlement risk. See our risk factor in “Risk Factors - Settlement and Third-Party Obligations” in this Part I, Item 1A with respect to how we guarantee certain third-party obligations for further discussion.
With the exception of the United States and a select number of other jurisdictions, most in-country (as opposed to cross-border) transactions conducted using Mastercard, Maestro and Cirrus cards are authorized, cleared and settled by our customers or other processors. Because we do not provide domestic switching services in these countries and do not, as described above, have direct relationships with account holders, we depend on our close working relationships with our customers to effectively
28
manage our brands, and the perception of our payments system, among consumers in these countries. We also rely on these customers to help manage our brands and perception among regulators and merchants in these countries, alongside our own relationships with them. From time to time, our customers may take actions that we do not believe to be in the best interests of our payments system overall, which may materially and adversely impact our business.
Merchants’ continued focus on acceptance costs may lead to additional litigation and regulatory proceedings and increase our incentive program costs, which could materially and adversely affect our profitability.
Merchants are important constituents in our payments system. We rely on both our relationships with them, as well as their relationships with our issuer and acquirer customers, to continue to expand the acceptance of our integrated products and services. We also work with merchants to help them enable new sales channels, create better purchase experiences, improve efficiencies, increase revenues and fight fraud. In the retail industry, there is a set of larger merchants with increasingly global scope and influence. We believe that these merchants are having a significant impact on all participants in the global payments industry, including Mastercard. Some large merchants have supported the legal, regulatory and legislative challenges to interchange fees that Mastercard has been defending, including the U.S. merchant litigations. See our risk factor in “Risk Factors – Risks Related to Our Participation in the Payments Industry” in this Part I, Item 1A with respect to payments industry regulation, including interchange fees. The continued focus of merchants on the costs of accepting various forms of payment, including in connection with the growth of digital payments, may lead to additional litigation and regulatory proceedings.
Certain larger merchants are also able to negotiate incentives from us and pricing concessions from our issuer and acquirer customers as a condition to accepting our products. We also make payments to certain merchants to incentivize them to create co-branded payment programs with us. As merchants consolidate and become even larger, we may have to increase the amount of incentives that we provide to certain merchants, which could materially and adversely affect our results of operations. Competitive and regulatory pressures on pricing could make it difficult to offset the costs of these incentives. Additionally, if the rate of merchant acceptance growth slows our business could suffer.
Our work with governments exposes us to unique risks that could have a material impact on our business and results of operations.
As we increase our work with national, state and local governments, both indirectly through financial institutions and with them directly as our customers, we may face various risks inherent in associating or contracting directly with governments. These risks include, but are not limited to, the following:
|
•
|
Governmental entities typically fund projects through appropriated monies. Changes in governmental priorities or other political developments, including disruptions in governmental operations, could impact approved funding and result in changes in the scope, or lead to the termination of, the arrangements or contracts we or financial institutions enter into with respect to our payment products and services.
|
|
•
|
Our work with governments subjects us to U.S. and international anti-corruption laws, including the U.S. Foreign Corrupt Practices Act and the U.K. Bribery Act. A violation and subsequent judgment or settlement under these laws could subject us to substantial monetary penalties and damages and have a significant reputational impact.
|
|
•
|
Working or contracting with governments, either directly or via our financial institution customers, can subject us to heightened reputational risks, including extensive scrutiny and publicity, as well as a potential association with the policies of a government as a result of a business arrangement with that government. Any negative publicity or negative association with a government entity, regardless of its accuracy, may adversely affect our reputation.
|
Settlement and Third-Party Obligations
Our role as guarantor, as well as other contractual obligations, expose us to risk of loss or illiquidity.
We are a guarantor of certain third-party obligations, including those of certain of our customers. In this capacity, we are exposed to credit and liquidity risk from these customers and certain service providers. We may incur significant losses in connection with transaction settlements if a customer fails to fund its daily settlement obligations due to technical problems, liquidity shortfalls, insolvency or other reasons. Concurrent settlement failures of more than one of our larger customers or of several of our smaller customers either on a given day or over a condensed period of time may exceed our available resources and could materially and adversely affect our results of operations.
We have significant contractual indemnification obligations with certain customers. Should an event occur that triggers these obligations, such an event could materially and adversely affect our overall business and result of operations.
29
Global Economic and Political Environment
Global economic, political, financial and societal events or conditions could result in a material and adverse impact on our overall business and results of operations.
Adverse economic trends in key countries in which we operate may adversely affect our financial performance. Such impact may include, but is not limited to, the following:
|
•
|
Customers mitigating their economic exposure by limiting the issuance of new Mastercard products and requesting greater incentive or greater cost stability from us.
|
|
•
|
Consumers and businesses lowering spending, which could impact cross-border travel patterns (on which a significant portion of our revenues is dependent).
|
|
•
|
Government intervention (including the effect of laws, regulations and/or government investments on or in our financial institution customers), as well as uncertainty due to changing political regimes in executive, legislative and/or judicial branches of government, that may have potential negative effects on our business and our relationships with customers or otherwise alter their strategic direction away from our products.
|
|
•
|
Tightening of credit availability that could impact the ability of participating financial institutions to lend to us under the terms of our credit facility.
|
Additionally, we switch substantially all cross-border transactions using Mastercard, Maestro and Cirrus-branded cards and generate a significant amount of revenue from cross-border volume fees and fees related to switched transactions. Revenue from switching cross-border and currency conversion transactions for our customers fluctuates with the levels and destinations of cross-border travel and our customers’ need for transactions to be converted into their base currency. Cross-border activity may be adversely affected by world geopolitical, economic, weather and other conditions. These include the threat of terrorism and outbreaks of flu, viruses and other diseases, as well as major environmental events. The uncertainty that could result from such events could decrease cross-border activity. Additionally, any regulation of interregional interchange fees could also negatively impact our cross-border activity. In each case, decreased cross-border activity could decrease the revenue we receive.
Any of these developments could have a material adverse impact on our overall business and results of operations.
Adverse currency fluctuations and foreign exchange controls could negatively impact our results of operations.
During
2018
, approximately
67%
of our revenue was generated from activities outside the United States. This revenue (and the related expense) could be transacted in a non-functional currency or valued based on a currency other than the functional currency of the entity generating the revenues. Resulting exchange gains and losses are included in our net income. Our risk management activities provide protection with respect to adverse changes in the value of only a limited number of currencies and are based on estimates of exposures to these currencies.
In addition, some of the revenue we generate outside the United States is subject to unpredictable currency fluctuations including devaluation of currencies where the values of other currencies change relative to the U.S. dollar. If the U.S. dollar strengthens compared to currencies in which we generate revenue, this revenue may be translated at a materially lower amount than expected. Furthermore, we may become subject to exchange control regulations that might restrict or prohibit the conversion of our other revenue currencies into U.S. dollars, such as what we have experienced in Venezuela.
The occurrence of currency fluctuations or exchange controls could have a material adverse impact on our results of operations.
The United Kingdom’s proposed withdrawal from the European Union could harm our business and financial results.
In June 2016, voters in the United Kingdom approved the withdrawal of the U.K. from the E.U. (commonly referred to as “Brexit”). The U.K. government triggered Article 50 of the Lisbon Treaty on March 29, 2017, which commenced the official E.U. withdrawal process. Uncertainty over the terms of the U.K.’s departure from the E.U. could cause political and economic uncertainty in the U.K. and the rest of Europe, which could harm our business and financial results.
Brexit could lead to legal uncertainty and potentially divergent national laws and regulations in the U.K. and E.U. We, as well as our clients who have significant operations in the U.K., may incur additional costs and expenses as we adapt to potentially divergent regulatory frameworks from the rest of the E.U. We may also face additional complexity with regard to immigration and travel rights for our employees located in the U.K. and the E.U. These factors may impact our ability to operate in the E.U. and U.K. seamlessly. Any of these effects of Brexit, among others, could harm our business and financial results.
30
Brand and Reputational Impact
Negative brand perception may materially and adversely affect our overall business.
Our brands and their attributes are key assets of our business. The ability to attract consumers to our branded products and retain them depends upon the external perception of us and our industry. Our business may be affected by actions taken by our customers, merchants or other organizations that impact the perception of our brands or the payments industry in general. From time to time, our customers may take actions that we do not believe to be in the best interests of our brands, such as creditor practices that may be viewed as “predatory”. Moreover, adverse developments with respect to our industry or the industries of our customers may also, by association, impair our reputation, or result in greater regulatory or legislative scrutiny. We have also been pursuing the use of social media channels at an increasingly rapid pace. Under some circumstances, our use of social media, or the use of social media by others as a channel for criticism or other purposes, could also cause rapid, widespread reputational harm to our brands by disseminating rapidly and globally actual or perceived damaging information about us, our products or merchants or other end users who utilize our products. Also, as we are headquartered in the United States, a negative perception of the United States could impact the perception of our company, which could adversely affect our business. Such perception and damage to our reputation could have a material and adverse effect to our overall business.
Lack of visibility of our brand in our products and services, or in the products and services of our partners who use our technology, may materially and adversely affect our business.
As more players enter the global payments system, the layers between our brand and consumers and merchants increase. In order to compete with other powerful consumer brands that are also becoming part of the consumer payment experience, we often partner with those brands on payment solutions. These brands include large digital companies and other technology companies who are our customers and use our networks to build their own acceptance brands. In some cases, our brand may not be featured in the payment solution or may be secondary to other brands. Additionally, as part of our relationships with some issuers, our payment brand is only included on the back of the card. As a result, our brand may either be invisible to consumers or may not be the primary brand with which consumers associate the payment experience. This brand invisibility, or any consumer confusion as to our role in the consumer payment experience, could decrease the value of our brand, which could adversely affect our business.
Talent and Culture
We may not be able to attract, hire and retain a highly qualified and diverse workforce, or maintain our corporate culture, which could impact our ability to grow effectively.
Our performance largely depends on the talents and efforts of our employees, particularly our key personnel and senior management. We may be unable to retain or to attract highly qualified employees. The market for key personnel is highly competitive, particularly in technology and other skill areas significant to our business. Additionally, changes in immigration and work permit laws and regulations and related enforcement have made it difficult for employees to work in, or transfer among, jurisdictions in which we have operations and could impair our ability to attract and retain qualified employees. Failure to attract, hire, develop, motivate and retain highly qualified and diverse employee talent, or to maintain a corporate culture that fosters innovation, creativity and teamwork could harm our overall business and results of operations.
We rely on key personnel to lead with integrity. To the extent our leaders behave in a manner that is not consistent with our values, we could experience significant impact to our brand and reputation, as well as to our corporate culture.
Acquisitions
Acquisitions, strategic investments or entry into new businesses could disrupt our business and harm our results of operations or reputation.
Although we may continue to evaluate and/or make strategic acquisitions of, or acquire interests in joint ventures or other entities related to, complementary businesses, products or technologies, we may not be able to successfully partner with or integrate them, despite original intentions and focused efforts. In addition, such an integration may divert management’s time and resources from our core business and disrupt our operations. Moreover, we may spend time and money on acquisitions or projects that do not meet our expectations or increase our revenue. To the extent we pay the purchase price of any acquisition in cash, it would reduce our cash reserves available to us for other uses, and to the extent the purchase price is paid with our stock, it could be dilutive to our stockholders. Furthermore, we may not be able to successfully finance the business following the acquisition as a result of costs of operations, including any litigation risk which may be inherited from the acquisition.
31
Any acquisition or entry into a new business could subject us to new regulations with which we would need to comply. This compliance could increase our costs, and we could be subject to liability or reputational harm to the extent we cannot meet any such compliance requirements. Our expansion into new businesses could also result in unanticipated issues which may be difficult to manage.
Class A Common Stock and Governance Structure
Provisions in our organizational documents and Delaware law could be considered anti-takeover provisions and have an impact on change-in-control.
Provisions contained in our amended and restated certificate of incorporation and bylaws and Delaware law could be considered anti-takeover provisions, including provisions that could delay or prevent entirely a merger or acquisition that our stockholders consider favorable. These provisions may also discourage acquisition proposals or have the effect of delaying or preventing entirely a change in control, which could harm our stock price. For example, subject to limited exceptions, our amended and restated certificate of incorporation prohibits any person from beneficially owning more than 15% of any of the Class A common stock or any other class or series of our stock with general voting power, or more than 15% of our total voting power. In addition:
|
•
|
our stockholders are not entitled to the right to cumulate votes in the election of directors
|
|
•
|
our stockholders are not entitled to act by written consent
|
|
•
|
a vote of 80% or more of all of the outstanding shares of our stock then entitled to vote is required for stockholders to amend any provision of our bylaws
|
|
•
|
any representative of a competitor of Mastercard or of Mastercard Foundation is disqualified from service on our board of directors
|
Mastercard Foundation’s substantial stock ownership, and restrictions on its sales, may impact corporate actions or acquisition proposals favorable to, or favored by, the other public stockholders.
As of
February 8, 2019
, Mastercard Foundation owned
112,181,762
shares of Class A common stock, representing approximately
11.1%
of our general voting power. Mastercard Foundation may not sell or otherwise transfer its shares of Class A common stock prior to May 1, 2027, except to the extent necessary to satisfy its charitable disbursement requirements, for which purpose earlier sales are permitted. Mastercard Foundation is permitted to sell all of its remaining shares after May 1, 2027, subject to certain conditions. The directors of Mastercard Foundation are required to be independent of us and our customers. The ownership of Class A common stock by Mastercard Foundation, together with the restrictions on transfer, could discourage or make more difficult acquisition proposals favored by the other holders of the Class A common stock. In addition, because Mastercard Foundation is restricted from selling its shares for an extended period of time, it may not have the same interest in short or medium-term movements in our stock price as, or incentive to approve a corporate action that may be favorable to, our other stockholders.
ITEM 1B. UNRESOLVED STAFF COMMENTS
Not applicable.
ITEM 2. PROPERTIES
As of
December 31, 2018
, Mastercard and its subsidiaries owned or leased 169 commercial properties. We own our corporate headquarters, located in Purchase, New York. The building is approximately 500,000 square feet. There is no outstanding debt on this building. Our principal technology and operations center, a leased facility located in O’Fallon, Missouri, is also approximately 500,000 square feet. Our leased properties in the United States are located in nine states and in the District of Columbia. We also lease and own properties in 74 other countries. These facilities primarily consist of corporate and regional offices, as well as our operations centers.
We believe that our facilities are suitable and adequate for the business that we currently conduct. However, we periodically review our space requirements and may acquire or lease new space to meet the needs of our business, or consolidate and dispose of facilities that are no longer required.
32
ITEM 3. LEGAL PROCEEDINGS
Refer to
Note 12 (Accrued Expenses and Accrued Litigation)
and
Note 20 (Legal and Regulatory Proceedings)
to the consolidated financial statements included in Part II, Item 8.
ITEM 4. MINE SAFETY DISCLOSURES
Not applicable.
33
PART II
ITEM 5. MARKET FOR REGISTRANT’S COMMON EQUITY, RELATED STOCKHOLDER MATTERS AND ISSUER PURCHASES OF EQUITY SECURITIES
Our Class A common stock trades on the New York Stock Exchange under the symbol “MA”. At
February 8, 2019
, we had
73
stockholders of record for our Class A common stock. We believe that the number of beneficial owners is substantially greater than the number of record holders because a large portion of our Class A common stock is held in “street name” by brokers.
There is currently no established public trading market for our Class B common stock. There were approximately
287
holders of record of our non-voting Class B common stock as of
February 8, 2019
, constituting approximately
1.1%
of our total outstanding equity.
Stock Performance Graph
The graph and table below compare the cumulative total stockholder return of Mastercard’s Class A common stock, the S&P 500 Financials and the S&P 500 Index for the five-year period ended
December 31, 2018
. The graph assumes a $100 investment in our Class A common stock and both of the indices and the reinvestment of dividends. Mastercard’s Class B common stock is not publicly traded or listed on any exchange or dealer quotation system.

Total returns to stockholders for each of the years presented were as follows:
|
Indexed Returns
|
|||||||||||||||||||||||
|
Base period
|
For the Years Ended December 31,
|
||||||||||||||||||||||
|
Company/Index
|
2013
|
2014
|
2015
|
2016
|
2017
|
2018
|
|||||||||||||||||
|
Mastercard
|
$
|
100.00
|
|
$
|
103.73
|
|
$
|
118.05
|
|
$
|
126.20
|
|
$
|
186.37
|
|
$
|
233.56
|
|
|||||
|
S&P 500 Financials
|
100.00
|
|
115.20
|
|
113.44
|
|
139.31
|
|
170.21
|
|
148.03
|
|
|||||||||||
|
S&P 500 Index
|
100.00
|
|
113.69
|
|
115.26
|
|
129.05
|
|
157.22
|
|
150.33
|
|
|||||||||||
34
Dividend Declaration and Policy
During the years ended December 31,
2018
and
2017
, we paid the following quarterly cash dividends per share on our Class A common stock and Class B common stock:
|
Dividend per Share
|
|||||||
|
2018
|
2017
|
||||||
|
First Quarter
|
$
|
0.25
|
|
$
|
0.22
|
|
|
|
Second Quarter
|
0.25
|
|
0.22
|
|
|||
|
Third Quarter
|
0.25
|
|
0.22
|
|
|||
|
Fourth Quarter
|
0.25
|
|
0.22
|
|
|||
On December 4, 2018, our Board of Directors declared a quarterly cash dividend of
$0.33
per share paid on February 8, 2019 to holders of record on January 9, 2019 of our Class A common stock and Class B common stock. On February 5, 2019, our Board of Directors declared a quarterly cash dividend of
$0.33
per share payable on May 9, 2019 to holders of record on April 9, 2019 of our Class A common stock and Class B common stock.
Subject to legally available funds, we intend to continue to pay a quarterly cash dividend on our outstanding Class A common stock and Class B common stock. However, the declaration and payment of future dividends is at the sole discretion of our Board of Directors after taking into account various factors, including our financial condition, operating results, available cash and current and anticipated cash needs.
Issuer Purchases of Equity Securities
On December 4, 2017, our Board of Directors approved a share repurchase program authorizing us to repurchase up to
$4 billion
of our Class A common stock (the “2017 Share Repurchase Program”). This program became effective in 2018. On December 4, 2018, our Board of Directors approved a share repurchase program authorizing us to repurchase up to
$6.5 billion
of our Class A common stock (the “2018 Share Repurchase Program”). This program became effective in January 2019.
During the fourth quarter of
2018
, we repurchased a total of approximately
4.4 million
shares for
$888 million
at an average price of
$201.20
per share of Class A common stock. Our repurchase activity during the fourth quarter of
2018
consisted of open market share repurchases and is summarized in the following table:
|
Period
|
Total Number
of Shares
Purchased
|
Average Price
Paid per Share
(including
commission cost)
|
Total Number of
Shares Purchased as
Part of Publicly
Announced Plans or
Programs
|
Dollar Value of
Shares that may yet
be Purchased under
the Plans or
Programs
1
|
||||||||||
|
October 1 – 31
|
2,390,996
|
|
$
|
206.39
|
|
2,390,996
|
|
$
|
695,528,134
|
|
||||
|
November 1 – 30
|
1,027,633
|
|
197.12
|
|
1,027,633
|
|
492,962,254
|
|
||||||
|
December 1 – 31
|
996,945
|
|
192.94
|
|
996,945
|
|
6,800,613,788
|
|
||||||
|
Total
|
4,415,574
|
|
201.20
|
|
4,415,574
|
|
||||||||
1
Dollar value of shares that may yet be purchased under the 2017 Share Repurchase Program and the 2018 Share Repurchase Program are as of the end of each period presented.
35
ITEM 6. SELECTED FINANCIAL DATA
The statement of operations data and the cash dividends declared per share
presented below for the years ended December 31,
2018, 2017 and 2016
, and the balance sheet data as of December 31,
2018 and 2017
, were derived from the audited consolidated financial statements of Mastercard Incorporated included in Part II, Item 8. The statement of operations data and the cash dividends declared per share
presented below for the years ended December 31,
2015
and
2014
, and the balance sheet data as of December 31,
2016
,
2015
and
2014
, were derived from audited consolidated financial statements not included in this Report. The data set forth below should be read in conjunction with, and are qualified by reference to, “Management’s Discussion and Analysis of Financial Condition and Results of Operations” in Part II, Item 7 and our consolidated financial statements and notes thereto included in Part II, Item 8.
|
Years Ended December 31,
|
|||||||||||||||||||
|
2018
|
2017
|
2016
|
2015
|
2014
|
|||||||||||||||
|
(in millions, except per share data)
|
|||||||||||||||||||
|
Statement of Operations Data:
|
|||||||||||||||||||
|
Net revenue
|
$
|
14,950
|
|
$
|
12,497
|
|
$
|
10,776
|
|
$
|
9,667
|
|
$
|
9,441
|
|
||||
|
Total operating expenses
|
7,668
|
|
5,875
|
|
5,015
|
|
4,589
|
|
4,335
|
|
|||||||||
|
Operating income
|
7,282
|
|
6,622
|
|
5,761
|
|
5,078
|
|
5,106
|
|
|||||||||
|
Net income
|
5,859
|
|
3,915
|
|
4,059
|
|
3,808
|
|
3,617
|
|
|||||||||
|
Basic earnings per share
|
5.63
|
|
3.67
|
|
3.70
|
|
3.36
|
|
3.11
|
|
|||||||||
|
Diluted earnings per share
|
5.60
|
|
3.65
|
|
3.69
|
|
3.35
|
|
3.10
|
|
|||||||||
|
Balance Sheet Data:
|
|||||||||||||||||||
|
Total assets
|
$
|
24,860
|
|
$
|
21,329
|
|
$
|
18,675
|
|
$
|
16,250
|
|
$
|
15,329
|
|
||||
|
Long-term debt
|
5,834
|
|
5,424
|
|
5,180
|
|
3,268
|
|
1,494
|
|
|||||||||
|
Total equity
|
5,418
|
|
5,497
|
|
5,684
|
|
6,062
|
|
6,824
|
|
|||||||||
|
Cash dividends declared per share
|
$
|
1.08
|
|
$
|
0.91
|
|
$
|
0.79
|
|
$
|
0.67
|
|
$
|
0.49
|
|
||||
36
ITEM 7. MANAGEMENT’S DISCUSSION AND ANALYSIS OF FINANCIAL CONDITION AND RESULTS OF OPERATIONS
The following discussion should be read in conjunction with the consolidated financial statements and notes of Mastercard Incorporated and its consolidated subsidiaries, including Mastercard International Incorporated (“Mastercard International”) (together, “Mastercard” or the “Company”), included elsewhere in this Report. Certain prior period amounts have been reclassified to conform to the 2018 presentation. For 2017 and 2016,
$127 million
and
$113 million
, respectively, of expenses were reclassified from advertising and marketing expenses to general and administrative expenses. The reclassification had no impact on total operating expenses, operating income or net income. Percentage changes provided throughout “Management’s Discussion and Analysis of Financial Condition and Results of Operations” were calculated on amounts rounded to the nearest thousand.
Business Overview
Mastercard is a technology company in the global payments industry that connects consumers, financial institutions, merchants, governments, digital partners, businesses and other organizations worldwide, enabling them to use electronic forms of payment instead of cash and checks. We make payments easier and more efficient by creating a wide range of payment solutions and services using our family of well-known brands, including Mastercard®, Maestro® and Cirrus®. We are a multi-rail network. Through our core global payments processing network, we facilitate the switching (authorization, clearing and settlement) of payment transactions and deliver related products and services. With additional payment capabilities that include real-time account based payments (including automated clearing house (“ACH”) transactions), we offer customers one partner to turn to for their payment needs for both domestic and cross-border transactions across multiple payment flows. We also provide value-added offerings such as safety and security products, information and analytics services, consulting, loyalty and reward programs and issuer and acquirer processing. Our payment solutions are designed to ensure safety and security for the global payments system.
A typical transaction on our core network involves four participants in addition to us: account holder (a consumer who holds a card or uses another device enabled for payment), issuer (the account holder’s financial institution), merchant and acquirer (the merchant’s financial institution). We do not issue cards, extend credit, determine or receive revenue from interest rates or other fees charged to account holders by issuers, or establish the rates charged by acquirers in connection with merchants’ acceptance of our branded products. In most cases, account holder relationships belong to, and are managed by, our financial institution customers.
37
Financial Results Overview
The following tables provide a summary of our operating results:
|
Year ended December 31,
|
Increase/
(Decrease)
|
Year ended December 31,
|
Increase/
(Decrease)
|
||||||||||||||||
|
2018
|
2017
|
2017
|
2016
|
||||||||||||||||
|
($ in millions, except per share data)
|
|||||||||||||||||||
|
Net revenue
|
$
|
14,950
|
|
$
|
12,497
|
|
20%
|
$
|
12,497
|
|
$
|
10,776
|
|
16%
|
|||||
|
Operating expenses
|
$
|
7,668
|
|
$
|
5,875
|
|
31%
|
$
|
5,875
|
|
$
|
5,015
|
|
17%
|
|||||
|
Operating income
|
$
|
7,282
|
|
$
|
6,622
|
|
10%
|
$
|
6,622
|
|
$
|
5,761
|
|
15%
|
|||||
|
Operating margin
|
48.7
|
%
|
53.0
|
%
|
(4.3) ppt
|
53.0
|
%
|
53.5
|
%
|
(0.5) ppt
|
|||||||||
|
Income tax expense
|
$
|
1,345
|
|
$
|
2,607
|
|
(48)%
|
$
|
2,607
|
|
$
|
1,587
|
|
64%
|
|||||
|
Effective income tax rate
|
18.7
|
%
|
40.0
|
%
|
(21.3) ppt
|
40.0
|
%
|
28.1
|
%
|
11.9 ppt
|
|||||||||
|
Net income
|
$
|
5,859
|
|
$
|
3,915
|
|
50%
|
$
|
3,915
|
|
$
|
4,059
|
|
(4)%
|
|||||
|
Diluted earnings per share
|
$
|
5.60
|
|
$
|
3.65
|
|
53%
|
$
|
3.65
|
|
$
|
3.69
|
|
(1)%
|
|||||
|
Diluted weighted-average shares outstanding
|
1,047
|
|
1,072
|
|
(2)%
|
1,072
|
|
1,101
|
|
(3)%
|
|||||||||
Summary of Non-GAAP Results
1
:
|
Year ended December 31,
|
Increase/(Decrease)
|
Year ended December 31,
|
Increase/(Decrease)
|
||||||||||||||||||||
|
2018
|
2017
|
As adjusted
|
Currency-neutral
|
2017
|
2016
|
As adjusted
|
Currency-neutral
|
||||||||||||||||
|
($ in millions, except per share data)
|
|||||||||||||||||||||||
|
Net revenue
|
$
|
14,950
|
|
$
|
12,497
|
|
20%
|
20%
|
$
|
12,497
|
|
$
|
10,776
|
|
16%
|
15%
|
|||||||
|
Adjusted operating expenses
|
$
|
6,540
|
|
$
|
5,693
|
|
15%
|
15%
|
$
|
5,693
|
|
$
|
4,898
|
|
16%
|
16%
|
|||||||
|
Adjusted operating margin
|
56.2
|
%
|
54.4
|
%
|
1.8 ppt
|
1.8 ppt
|
54.4
|
%
|
54.5
|
%
|
(0.1) ppt
|
(0.2) ppt
|
|||||||||||
|
Adjusted effective income tax rate
|
18.5
|
%
|
26.8
|
%
|
(8.3) ppt
|
(8.2) ppt
|
26.8
|
%
|
28.1
|
%
|
(1.3) ppt
|
(1.3) ppt
|
|||||||||||
|
Adjusted net income
|
$
|
6,792
|
|
$
|
4,906
|
|
38%
|
38%
|
$
|
4,906
|
|
$
|
4,144
|
|
18%
|
17%
|
|||||||
|
Adjusted diluted earnings per share
|
$
|
6.49
|
|
$
|
4.58
|
|
42%
|
41%
|
$
|
4.58
|
|
$
|
3.77
|
|
21%
|
21%
|
|||||||
Note: Tables may not sum due to rounding.
1
The Summary of Non-GAAP Results excludes the impact of Special Items (subsequently defined) and/or foreign currency. See “Non-GAAP Financial Information” for further information on the Special Items, the impact of foreign currency and the reconciliation to GAAP reported amounts.
Key highlights for
2018
were as follows:
|
•
|
Net revenue increased
20%
both as reported and on a currency-neutral basis, in
2018
versus
2017
. Current year results include growth of
4
percentage points from the impact of the adoption of the new revenue standard and an additional
0.5
percentage points from our prior year acquisitions. The remaining
15
percentage points of growth was primarily driven by:
|
Ø
Switched transaction growth of
17%
, adjusted for the impact of the Venezuela deconsolidation
1
Ø
Cross-border growth of
18%
on a local currency basis
1
1
Adjusted to normalize for the effects of differing switching days between periods.
38
Ø
Gross dollar volume growth of
14%
on a local currency basis
Ø
These increases were partially offset by higher rebates and incentives, which increased
18%
both as reported and on a currency-neutral basis.
|
•
|
Operating expenses increased
31%
in
2018
versus
2017
. Excluding the impact of Special Items (defined below), operating expenses increased
15%
both as adjusted and on a currency-neutral basis, primarily driven by:
|
Ø
3
percentage point increase from the adoption of the new revenue guidance
Ø
2
percentage point increase from acquisitions
Ø
2
percentage point increase from the
$100 million
contribution to the Mastercard Impact Fund (formerly referred to as Mastercard’s Center for Inclusive Growth Fund), a non-profit charitable organization.
The remaining
8
percentage points of growth was primarily related to our continued investment in strategic initiatives and higher operating costs.
|
•
|
The effective income tax rate was
18.7%
in
2018
versus
40.0%
in 2017. The lower effective tax rate for the period was primarily due to additional tax expense in 2017 attributable to comprehensive U.S. tax legislation (“U.S. Tax Reform”) passed on December 22, 2017, a lower enacted statutory tax rate in the U.S. and Belgium and a more favorable geographic mix of earnings. The lower effective tax rate for the period was also attributable to discrete tax benefits, relating primarily to the carryback of foreign tax credits due to transition rules, along with provisions for legal matters in the United States. These benefits were partially offset by the non-deductible fine issued by the European Commission.
|
Other financial highlights for
2018
were as follows:
|
•
|
We generated net cash flows from operations of
$6.2 billion
.
|
|
•
|
We completed a debt offering for an aggregate principal amount of
$1.0 billion
.
|
|
•
|
We repurchased
26 million
shares of our common stock for
$4.9 billion
and paid dividends of
$1.0 billion
.
|
|
•
|
We recorded litigation provision charges of
$1.1 billion
. See
Note 20 (Legal and Regulatory Proceedings)
to the consolidated financial statements included in Part II, Item 8 for further discussion.
|
Non-GAAP Financial Information
Non-GAAP financial information is defined as a numerical measure of a company’s performance that excludes or includes amounts so as to be different than the most comparable measure calculated and presented in accordance with accounting principles generally accepted in the United States (“GAAP”). Our non-GAAP financial measures exclude the impact of the following special items (“Special Items”).
Litigation provisions
|
•
|
During 2018, we recorded pre-tax charges of
$1,128 million
(
$1,008 million
after tax, or
$0.96
per diluted share) related to litigation provisions which included pre-tax charges of:
|
Ø
$654 million
related to a fine issued by the European Commission
Ø
$237 million
related to both the U.S. merchant class litigation and the filed and anticipated opt-out U.S. merchant cases
Ø
$237 million
related to litigation settlements with U.K. and Pan-European merchants.
|
•
|
During 2017, we recorded pre-tax charges of
$15 million
(
$10 million
after tax, or
$0.01
per diluted share) related to a litigation settlement with Canadian merchants.
|
|
•
|
During 2016, we recorded pre-tax charges of
$117 million
(
$85 million
after tax, or
$0.08
per diluted share) related to litigation settlements with U.K. merchants.
|
39
Tax act
|
•
|
During 2018, we recorded a
$75 million
net tax benefit (
$0.07
per diluted share) which included a
$90 million
benefit (
$0.09
per diluted share) related to the carryback of foreign tax credits due to transition rules, offset by a net
$15 million
expense (
$0.01
per diluted share) primarily related to the true-up to our 2017 mandatory deemed repatriation tax on accumulated foreign earnings.
|
|
•
|
During 2017, we recorded additional tax expense of
$873 million
(
$0.81
per diluted share) which includes
$825 million
of provisional charges attributable to a one-time deemed repatriation tax on accumulated foreign earnings (the “Transition Tax”), the remeasurement of our net deferred tax asset in the U.S. and the recognition of a deferred tax liability related to a change in assertion regarding reinvestment of foreign earnings, as well as
$48 million
additional tax expense related to a foregone foreign tax credit benefit on 2017 repatriations.
|
Venezuela charge
|
•
|
During 2017, we recorded a pre-tax charge of
$167 million
(
$108 million
after tax, or
$0.10
per diluted share) in general and administrative expenses related to the deconsolidation of our Venezuelan subsidiaries.
|
See
Note 1 (Summary of Significant Accounting Policies)
,
Note 19 (Income Taxes)
and
Note 20 (Legal and Regulatory Proceedings)
to the consolidated financial statements included in Part II, Item 8 for further discussion.
We excluded these Special Items as management evaluates the underlying operations and performance of the Company separately from litigation judgments and settlements related to interchange and other one-time items, as well as the related tax impacts.
In addition, we present growth rates adjusted for the impact of foreign currency, which is a non-GAAP financial measure. Currency-neutral growth rates are calculated by remeasuring the prior period’s results using the current period’s exchange rates for both the translational and transactional impacts on operating results. The impact of foreign currency translation represents the effect of translating operating results where the functional currency is different than our U.S. dollar reporting currency. The impact of the transactional foreign currency represents the effect of converting revenue and expenses occurring in a currency other than the functional currency. We believe the presentation of the impact of foreign currency provides relevant information.
We believe that the non-GAAP financial measures presented facilitate an understanding of our operating performance and provide a meaningful comparison of our results between periods. We use non-GAAP financial measures to, among other things, evaluate our ongoing operations in relation to historical results, for internal planning and forecasting purposes and in the calculation of performance-based compensation.
40
Operating expenses, operating margin, effective income tax rate, net income and diluted earnings per share, adjusted for Special Items, are non-GAAP financial measures and should not be relied upon as substitutes for measures calculated in accordance with GAAP. The following tables reconcile our as-reported financial measures calculated in accordance with GAAP to the respective non-GAAP adjusted financial measures:
|
|
Year ended December 31, 2018
|
||||||||||||||||
|
|
Operating expenses
|
|
Operating margin
|
|
Effective income tax rate
|
|
Net income
|
|
Diluted earnings per share
|
||||||||
|
|
($ in millions, except per share data)
|
||||||||||||||||
|
Reported - GAAP
|
$
|
7,668
|
|
|
48.7
|
%
|
|
18.7
|
%
|
|
$
|
5,859
|
|
|
$
|
5.60
|
|
|
Litigation provisions
|
(1,128
|
)
|
|
7.5
|
%
|
|
(1.1
|
)%
|
|
1,008
|
|
|
0.96
|
|
|||
|
Tax act
|
**
|
|
**
|
|
0.9
|
%
|
(75
|
)
|
(0.07
|
)
|
|||||||
|
Non-GAAP
|
$
|
6,540
|
|
|
56.2
|
%
|
|
18.5
|
%
|
|
$
|
6,792
|
|
|
$
|
6.49
|
|
|
Year ended December 31, 2017
|
|||||||||||||||||
|
Operating expenses
|
Operating margin
|
Effective income tax rate
|
Net income
|
Diluted earnings per share
|
|||||||||||||
|
($ in millions, except per share data)
|
|||||||||||||||||
|
Reported - GAAP
|
$
|
5,875
|
|
53.0
|
%
|
40.0
|
%
|
$
|
3,915
|
|
$
|
3.65
|
|
||||
|
Tax act
|
**
|
|
**
|
|
(13.4
|
)%
|
873
|
|
0.81
|
|
|||||||
|
Venezuela charge
|
(167
|
)
|
1.3
|
%
|
0.2
|
%
|
108
|
|
0.10
|
|
|||||||
|
Litigation provisions
|
(15
|
)
|
0.1
|
%
|
—
|
%
|
10
|
|
0.01
|
|
|||||||
|
Non-GAAP
|
$
|
5,693
|
|
54.4
|
%
|
26.8
|
%
|
$
|
4,906
|
|
$
|
4.58
|
|
||||
|
Year ended December 31, 2016
|
|||||||||||||||||
|
Operating expenses
|
Operating margin
|
Effective income tax rate
|
Net income
|
Diluted earnings per share
|
|||||||||||||
|
($ in millions, except per share data)
|
|||||||||||||||||
|
Reported - GAAP
|
$
|
5,015
|
|
53.5
|
%
|
28.1
|
%
|
$
|
4,059
|
|
$
|
3.69
|
|
||||
|
Litigation provisions
|
(117
|
)
|
1.0
|
%
|
—
|
%
|
85
|
|
0.08
|
|
|||||||
|
Non-GAAP
|
$
|
4,898
|
|
54.5
|
%
|
28.1
|
%
|
$
|
4,144
|
|
$
|
3.77
|
|
||||
Note: Tables may not sum due to rounding.
** Not applicable
41
Net revenue, operating expenses, operating margin, effective income tax rate, net income and diluted earnings per share, adjusted for Special Items and/or the impact of foreign currency, are non-GAAP financial measures and should not be relied upon as substitutes for measures calculated in accordance with GAAP. The following tables represent the reconciliation of our growth rates reported under GAAP to our Non-GAAP growth rates:
|
Year Ended December 31, 2018 as compared to the Year Ended December 31, 2017
|
|||||||||||||||
|
Increase/(Decrease)
|
|||||||||||||||
|
Net revenue
|
Operating expenses
|
Operating margin
|
Effective income tax rate
|
Net income
|
Diluted earnings per share
|
||||||||||
|
Reported - GAAP
|
20
|
%
|
31
|
%
|
(4.3) ppt
|
(21.3) ppt
|
50
|
%
|
53
|
%
|
|||||
|
Litigation provisions
|
**
|
|
(19
|
)%
|
7.4 ppt
|
(1.0) ppt
|
25
|
%
|
26
|
%
|
|||||
|
Tax act
|
**
|
|
**
|
|
**
|
14.2 ppt
|
(33
|
)%
|
(34
|
)%
|
|||||
|
Venezuela charge
|
**
|
|
3
|
%
|
(1.3) ppt
|
(0.2) ppt
|
(3
|
)%
|
(3
|
)%
|
|||||
|
Non-GAAP
|
20
|
%
|
15
|
%
|
1.8 ppt
|
(8.3) ppt
|
38
|
%
|
42
|
%
|
|||||
|
Foreign currency
1
|
—
|
%
|
—
|
%
|
– ppt
|
0.1 ppt
|
—
|
%
|
—
|
%
|
|||||
|
Non-GAAP - currency-neutral
|
20
|
%
|
15
|
%
|
1.8 ppt
|
(8.2) ppt
|
38
|
%
|
41
|
%
|
|||||
|
Year Ended December 31, 2017 as compared to the Year Ended December 31, 2016
|
|||||||||||||||
|
Increase/(Decrease)
|
|||||||||||||||
|
Net revenue
|
Operating expenses
|
Operating margin
|
Effective income tax rate
|
Net income
|
Diluted earnings per share
|
||||||||||
|
Reported - GAAP
|
16
|
%
|
17
|
%
|
(0.5) ppt
|
11.9 ppt
|
(4
|
)%
|
(1
|
)%
|
|||||
|
Tax act
|
**
|
|
**
|
|
**
|
(13.4) ppt
|
21
|
%
|
22
|
%
|
|||||
|
Venezuela charge
|
**
|
|
(3
|
)%
|
1.3 ppt
|
0.2 ppt
|
3
|
%
|
3
|
%
|
|||||
|
Litigation provisions
|
**
|
|
3
|
%
|
(1.0) ppt
|
– ppt
|
(2
|
)%
|
(3
|
)%
|
|||||
|
Non-GAAP
|
16
|
%
|
16
|
%
|
(0.1) ppt
|
(1.3) ppt
|
18
|
%
|
21
|
%
|
|||||
|
Foreign currency
1
|
(1
|
)%
|
(1
|
)%
|
(0.1) ppt
|
– ppt
|
(1
|
)%
|
1
|
%
|
|||||
|
Non-GAAP - currency-neutral
|
15
|
%
|
16
|
%
|
(0.2) ppt
|
(1.3) ppt
|
17
|
%
|
21
|
%
|
|||||
Note: Tables may not sum due to rounding.
** Not applicable
1
Represents the foreign currency translational and transactional impact.
Impact of Foreign Currency Rates
Our primary revenue functional currencies are the U.S. dollar, euro, Brazilian real and the British pound. Our overall operating results are impacted by foreign currency translation, which represents the effect of translating operating results where the functional currency is different than our U.S. dollar reporting currency.
Our operating results can also be impacted by transactional foreign currency. The impact of the transactional foreign currency represents the effect of converting revenue and expense transactions occurring in a currency other than the functional currency. Changes in foreign currency exchange rates directly impact the calculation of gross dollar volume (“GDV”) and gross euro volume (“GEV”), which are used in the calculation of our domestic assessments, cross-border volume fees and volume-related rebates and incentives. In most non-European regions, GDV is calculated based on local currency spending volume converted to U.S. dollars using average exchange rates for the period. In Europe, GEV is calculated based on local currency spending volume converted to euros using average exchange rates for the period. As a result, our domestic assessments, cross-border volume fees and volume-related rebates and incentives are impacted by the strengthening or weakening of the U.S. dollar versus non-European local currencies and the strengthening or weakening of the euro versus other European local currencies. For example, our billing in Australia is in the U.S. dollar, however, consumer spend in Australia is in the Australian dollar. The foreign currency transactional impact of converting Australian dollars to our U.S. dollar billing currency will have an impact on the revenue generated. The strengthening or weakening of the U.S. dollar is evident when GDV growth on a U.S. dollar-converted basis is compared to GDV growth on a local currency basis. In
2018
, GDV on a U.S. dollar-converted basis increased
13.0%
, while GDV
42
on a local currency basis increased
14.0%
versus
2017
. In
2017
, GDV on a U.S. dollar-converted basis increased
8.5%
, while GDV on a local currency basis increased
8.4%
versus
2016
. Further, the impact from transactional foreign currency occurs in transaction processing revenue, other revenue and operating expenses when the local currency of these items are different than the functional currency.
We incur foreign currency gains and losses from remeasuring monetary assets and liabilities that are in a currency other than the functional currency and from remeasuring foreign exchange derivative contracts (“Foreign Exchange Activity”). The impact of Foreign Exchange Activity has not been eliminated in our currency-neutral results (see “Non-GAAP Financial Information”) and is recorded in general and administrative expenses. We manage foreign currency balance sheet remeasurement and cash flow risk through our foreign exchange risk management activities, which are discussed further in
Note 22 (Foreign Exchange Risk Management)
to the consolidated financial statements included in Part II, Item 8. Since we do not designate foreign currency derivatives as hedging instruments pursuant to the accounting standards for derivative instruments and hedging activities, we record gains and losses on foreign exchange derivatives immediately in current-period earnings, with the related hedged item being recognized as the exposures materialize.
We are exposed to currency devaluation in certain countries. In addition, we are subject to exchange control regulations that restrict the conversion of financial assets into U.S. dollars. While these revenues and assets are not material to us on a consolidated basis, we can be negatively impacted should there be a continued and sustained devaluation of local currencies relative to the U.S. dollar and/or a continued and sustained deterioration of economic conditions in these countries. Specifically, in 2017, due to foreign exchange regulations which were restricting access to U.S. dollars in Venezuela, an other-than-temporary lack of exchangeability between the Venezuela bolivar and the U.S. dollar impacted our ability to manage risk, process cross-border transactions and satisfy U.S. dollar denominated liabilities related to our Venezuelan operations. As a result of these factors, we concluded that, effective December 31, 2017, we did not meet the accounting criteria for consolidation of these subsidiaries, and therefore we transitioned to the cost method of accounting. This accounting change resulted in a pre-tax charge of
$167 million
(
$108 million
after tax, or
$0.10
per diluted share) in 2017. We continue to operate and serve our Venezuelan issuers, acquirers, merchants and account holders with our products and services. See
Note 1 (Summary of Significant Accounting Policies)
to the consolidated financial statements included in Part II, Item 8 for further discussion.
Financial Results
Revenue
Gross revenue increased
19%
and
18%
, or
19%
and
17%
on a currency-neutral basis, in
2018
and
2017
, respectively, versus the prior year. The increase in both
2018
and
2017
was primarily driven by an increase in transactions, dollar volume of activity on cards carrying our brands for both domestic and cross-border transactions and other payment-related products and services.
Rebates and incentives increased
18%
and
22%
in
2018
and
2017
, respectively, versus the prior year, both as reported and on a currency-neutral basis. The increases in rebates and incentives in
2018
and
2017
were primarily due to the impact from new and renewed agreements and increased volumes.
Our net revenue increased
20%
and
16%
, or
20%
and
15%
on a currency-neutral basis, in
2018
and
2017
, respectively, versus the prior year. Current year results include growth of
4
percentage points from the impact of the adoption of the new revenue standard and an additional
0.5
percentage points from our prior year acquisitions.
See
Note 1 (Summary of Significant Accounting Policies)
to the consolidated financial statements included in Part II, Item 8 for a further discussion of the new revenue guidance. Additionally, see
Note 3 (Revenue)
to the consolidated financial statements included in Part II, Item 8 for a further discussion of how we recognize revenue.
43
The significant components of our net revenue were as follows:
|
|
For the Years Ended December 31,
|
Percent Increase (Decrease)
|
|||||||||||||
|
|
2018
|
2017
|
2016
|
2018
|
2017
|
||||||||||
|
|
($ in millions)
|
||||||||||||||
|
Domestic assessments
|
$
|
6,138
|
|
$
|
5,130
|
|
$
|
4,411
|
|
20%
|
16%
|
||||
|
Cross-border volume fees
|
4,954
|
|
4,174
|
|
3,568
|
|
19%
|
17%
|
|||||||
|
Transaction processing
|
7,391
|
|
6,188
|
|
5,143
|
|
19%
|
20%
|
|||||||
|
Other revenues
|
3,348
|
|
2,853
|
|
2,431
|
|
17%
|
17%
|
|||||||
|
Gross revenue
|
21,831
|
|
18,345
|
|
15,553
|
|
19%
|
18%
|
|||||||
|
Rebates and incentives (contra-revenue)
|
(6,881
|
)
|
(5,848
|
)
|
(4,777
|
)
|
18%
|
22%
|
|||||||
|
Net revenue
|
$
|
14,950
|
|
$
|
12,497
|
|
$
|
10,776
|
|
20%
|
16%
|
||||
The following table summarizes the primary drivers of net revenue growth:
|
For the Years Ended December 31,
|
|||||||||||||||||||||||||||||||||||
|
Volume
|
Acquisitions
|
Revenue Standard
1
|
Foreign Currency
2
|
Other
3
|
Total
|
||||||||||||||||||||||||||||||
|
2018
|
2017
|
2018
|
2017
|
2018
|
2017
|
2018
|
2017
|
2018
|
2017
|
2018
|
2017
|
||||||||||||||||||||||||
|
Domestic assessments
|
14
|
%
|
10
|
%
|
—
|
%
|
—
|
%
|
6
|
%
|
—
|
%
|
(1
|
)%
|
1
|
%
|
2
|
%
|
4
|
6
|
%
|
4
|
20
|
%
|
16
|
%
|
|||||||||
|
Cross-border volume fees
|
17
|
%
|
14
|
%
|
—
|
%
|
—
|
%
|
1
|
%
|
—
|
%
|
1
|
%
|
—
|
%
|
—
|
%
|
3
|
%
|
19
|
%
|
17
|
%
|
|||||||||||
|
Transaction processing
|
14
|
%
|
15
|
%
|
—
|
%
|
1
|
%
|
—
|
%
|
—
|
%
|
—
|
%
|
1
|
%
|
5
|
%
|
4
|
%
|
19
|
%
|
20
|
%
|
|||||||||||
|
Other revenues
|
**
|
|
**
|
|
2
|
%
|
7
|
%
|
—
|
%
|
—
|
%
|
(1
|
)%
|
1
|
%
|
16
|
%
|
5
|
9
|
%
|
5
|
17
|
%
|
17
|
%
|
|||||||||
|
Rebates and incentives
|
10
|
%
|
10
|
%
|
—
|
%
|
—
|
%
|
(2
|
)%
|
—
|
%
|
(1
|
)%
|
1
|
%
|
11
|
%
|
6
|
11
|
%
|
6
|
18
|
%
|
22
|
%
|
|||||||||
|
Net revenue
|
14
|
%
|
11
|
%
|
0.5
|
%
|
2
|
%
|
4
|
%
|
—
|
%
|
—
|
%
|
1
|
%
|
2
|
%
|
2
|
%
|
20
|
%
|
16
|
%
|
|||||||||||
Note: Table may not sum due to rounding
** Not applicable
1
Represents the impact of our adoption of the new revenue guidance. For a more detailed discussion on the impact of the new revenue guidance, refer to
Note 1 (Summary of Significant Accounting Policies)
to the consolidated financial statements included in Part II, Item 8.
2
Represents the foreign currency translational and transactional impact versus the prior year.
3
Includes impact from pricing and other non-volume based fees.
4
Includes
impact of the allocation of revenue to service deliverables, which are recorded in other revenue when services are performed.
5
Includes impacts from Advisors fees, safety and security fees, loyalty and reward solution fees and other payment-related products and services.
6
Includes the impact from timing of new, renewed and expired agreements.
The following table provides a summary of the trend in volume and transaction growth:
|
Years Ended December 31,
|
|||||||||||
|
2018
|
2017
|
||||||||||
|
Growth (USD)
|
Growth (Local)
|
Growth (USD)
|
Growth (Local)
|
||||||||
|
Mastercard-branded GDV
1
|
13
|
%
|
14
|
%
|
8
|
%
|
8
|
%
|
|||
|
Asia Pacific/Middle East/Africa
|
13
|
%
|
13
|
%
|
8
|
%
|
9
|
%
|
|||
|
Canada
|
10
|
%
|
10
|
%
|
13
|
%
|
10
|
%
|
|||
|
Europe
|
18
|
%
|
19
|
%
|
10
|
%
|
10
|
%
|
|||
|
Latin America
|
8
|
%
|
17
|
%
|
17
|
%
|
15
|
%
|
|||
|
United States
|
10
|
%
|
10
|
%
|
5
|
%
|
5
|
%
|
|||
|
Cross-border volume
1
|
19
|
%
|
15
|
%
|
|||||||
|
Switched transactions
|
13
|
%
|
17
|
%
|
|||||||
1
Excludes volume generated by Maestro and Cirrus cards.
44
In 2016, our GDV was impacted by the EU Interchange Fee Regulation related to card payments which became effective in June 2016. The regulation requires that we no longer collect fees on domestic European Economic Area payment transactions that do not use our network brand. Prior to that, we collected a de minimis assessment fee in a few countries, particularly France, on transactions with Mastercard co-badged cards if the brands of domestic networks (as opposed to Mastercard) were used. As a result, the non Mastercard co-badged volume is no longer being included.
The following table reflects GDV growth rates for Europe and Worldwide Mastercard. For comparability purposes, we adjusted growth rates for the impact of Article 8 of the EU Interchange Fee Regulation related to card payments, to exclude the prior period co-badged volume processed by other networks.
|
For the Years Ended December 31,
|
|||
|
2018
|
2017
|
||
|
Growth (Local)
|
|||
|
GDV
1
|
|||
|
Worldwide as reported
|
14%
|
8%
|
|
|
Worldwide as adjusted for EU Regulation
|
14%
|
10%
|
|
|
Europe as reported
|
19%
|
10%
|
|
|
Europe as adjusted for EU Regulation
|
19%
|
16%
|
|
1
Excludes volume generated by Maestro and Cirrus cards.
The following table reflects cross-border volume and switched transactions growth rates. For comparability purposes, we normalized the growth rates for the effects of differing switching days between periods. Additionally, we adjusted the switched transactions growth rate for the deconsolidation of our Venezuelan subsidiaries in 2017. For a more detailed discussion of the deconsolidation of our Venezuelan subsidiaries, refer to
Note 1 (Summary of Significant Accounting Policies)
to the consolidated financial statements included in Part II, Item 8.
|
For the Years Ended December 31,
|
|||
|
2018
|
2017
|
||
|
Growth (Local)
|
|||
|
Cross-border volume as reported
|
19%
|
15%
|
|
|
Cross-border volume, normalized
|
18%
|
15%
|
|
|
Switched transactions as reported
|
13%
|
17%
|
|
|
Switched transactions, normalized
1
|
17%
|
16%
|
|
1
Adjusted for the deconsolidation of Venezuela subsidiaries.
No individual country, other than the United States, generated more than 10% of total net revenue in any such period. A significant portion of our revenue is concentrated among our five largest customers. In
2018
, the net revenue from these customers was approximately
$3.1 billion
, or
21%
, of total net revenue. The loss of any of these customers or their significant card programs could adversely impact our revenue.
Operating Expenses
Operating expenses increased
31%
and
17%
in
2018
and
2017
, respectively, versus the prior year. Excluding the impact of the Special Items, adjusted operating expenses increased
15%
and
16%
in
2018
and
2017
, respectively, versus the prior year, both as adjusted and on a currency-neutral basis. Acquisitions contributed
2
percentage points of growth in
2018
.
45
The components of operating expenses were as follows:
|
Year ended December 31,
|
Increase (Decrease)
|
||||||||||||||||
|
2018
|
2017
|
2016
|
2018
|
2017
|
|||||||||||||
|
($ in millions)
|
|||||||||||||||||
|
General and administrative
|
$
|
5,174
|
|
$
|
4,653
|
|
$
|
3,827
|
|
11
|
%
|
22
|
%
|
||||
|
Advertising and marketing
|
907
|
|
771
|
|
698
|
|
18
|
%
|
11
|
%
|
|||||||
|
Depreciation and amortization
|
459
|
|
436
|
|
373
|
|
5
|
%
|
17
|
%
|
|||||||
|
Provision for litigation
|
1,128
|
|
15
|
|
117
|
|
**
|
|
**
|
|
|||||||
|
Total operating expenses
|
7,668
|
|
5,875
|
|
5,015
|
|
31
|
%
|
17
|
%
|
|||||||
|
Special Items
1
|
(1,128
|
)
|
(182
|
)
|
(117
|
)
|
**
|
|
**
|
|
|||||||
|
Adjusted total operating expenses (excluding Special Items
1
)
|
$
|
6,540
|
|
$
|
5,693
|
|
$
|
4,898
|
|
15
|
%
|
16
|
%
|
||||
Note: Table may not sum due to rounding.
** Not meaningful
1
See “Non-GAAP Financial Information” for further information on Special Items.
The following table summarizes the primary drivers of changes in operating expenses in
2018
and
2017
:
|
For the Years Ended December 31,
|
|||||||||||||||||||||||||||||||||||||||||
|
Operational
|
Special Items
1
|
Acquisitions
|
Revenue Standard
2
|
Mastercard Impact Fund
3
|
Foreign Currency
4
|
Total
|
|||||||||||||||||||||||||||||||||||
|
2018
|
2017
|
2018
|
2017
|
2018
|
2017
|
2018
|
2017
|
2018
|
2017
|
2018
|
2017
|
2018
|
2017
|
||||||||||||||||||||||||||||
|
General and administrative
|
11
|
%
|
11
|
%
|
(4
|
)%
|
5
|
%
|
1
|
%
|
6
|
%
|
—
|
%
|
—
|
%
|
2
|
%
|
—
|
%
|
—
|
%
|
1
|
%
|
11
|
%
|
22
|
%
|
|||||||||||||
|
Advertising and marketing
|
(4
|
)%
|
9
|
%
|
—
|
%
|
—
|
%
|
—
|
%
|
1
|
%
|
21
|
%
|
—
|
%
|
—
|
%
|
—
|
%
|
—
|
%
|
1
|
%
|
18
|
%
|
11
|
%
|
|||||||||||||
|
Depreciation and amortization
|
(5
|
)%
|
—
|
%
|
—
|
%
|
—
|
%
|
10
|
%
|
17
|
%
|
—
|
%
|
—
|
%
|
—
|
%
|
—
|
%
|
—
|
%
|
—
|
%
|
5
|
%
|
17
|
%
|
|||||||||||||
|
Provision for litigation
|
**
|
|
**
|
|
**
|
|
**
|
|
**
|
|
**
|
|
**
|
|
**
|
|
**
|
|
**
|
|
**
|
|
**
|
|
**
|
|
**
|
|
|||||||||||||
|
Total operating expenses
|
8
|
%
|
10
|
%
|
16
|
%
|
1
|
%
|
2
|
%
|
6
|
%
|
3
|
%
|
—
|
%
|
2
|
%
|
—
|
%
|
—
|
%
|
1
|
%
|
31
|
%
|
17
|
%
|
|||||||||||||
Note: Table may not sum due to rounding.
** Not meaningful
1
See “Non-GAAP Financial Information” for further information on Special Items.
2
Represents the impact of our adoption of the new revenue guidance. For a more detailed discussion on the impact of the new revenue guidance, refer to
Note 1 (Summary of Significant Accounting Policies)
to the consolidated financial statements included in Part II, Item 8.
3
Represents contribution to a non-profit entity.
4
Represents the foreign currency translational and transactional impact versus the prior year.
46
General and Administrative
The significant components of our general and administrative expenses were as follows:
|
|
For the Years Ended December 31,
|
Percent Increase (Decrease)
|
|||||||||||||
|
2018
|
2017
|
2016
|
2018
|
2017
|
|||||||||||
|
|
($ in millions)
|
||||||||||||||
|
Personnel
|
$
|
3,214
|
|
$
|
2,687
|
|
$
|
2,225
|
|
20%
|
21%
|
||||
|
Professional fees
|
377
|
|
355
|
|
337
|
|
6%
|
5%
|
|||||||
|
Data processing and telecommunications
|
600
|
|
504
|
|
420
|
|
19%
|
20%
|
|||||||
|
Foreign exchange activity
1
|
(36
|
)
|
106
|
|
34
|
|
**
|
**
|
|||||||
|
Other
|
1,019
|
|
1,001
|
|
811
|
|
2%
|
23%
|
|||||||
|
General and administrative expenses
|
5,174
|
|
4,653
|
|
3,827
|
|
11%
|
22%
|
|||||||
|
Special Item
2
|
—
|
|
(167
|
)
|
—
|
|
**
|
**
|
|||||||
|
Adjusted general and administrative expenses (excluding Special Item)
2
|
$
|
5,174
|
|
$
|
4,486
|
|
$
|
3,827
|
|
15%
|
17%
|
||||
Note: Table may not sum due to rounding.
** Not meaningful
1
Foreign exchange activity includes gains and losses on foreign exchange derivative contracts and the impact of remeasurement of assets and liabilities denominated in foreign currencies. See
Note 22 (Foreign Exchange Risk Management)
to the consolidated financial statements included in Part II, Item 8 for further discussion.
2
See “Non-GAAP Financial Information” for further information on Special Items.
The primary drivers of general and administrative expenses in
2018
and 2017, versus the prior year, were as follows:
|
•
|
Personnel expenses increased
20%
and
21%
, or
19%
and
20%
on a currency-neutral basis, respectively. The
2018
and
2017
increases were driven by a higher number of employees to support our continued investment in the areas of real-time account-based payments, digital, services, data analytics and geographic expansion. The impact of acquisitions contributed
2
and 6 percentage points of growth for
2018
and
2017
, respectively.
|
|
•
|
Data processing and telecommunication expenses increased
19%
and
20%
, respectively, both as reported and on a currency-neutral basis, due to capacity growth of our business. Acquisitions contributed
3
and
8
percentage points, respectively.
|
|
•
|
Foreign exchange activity contributed a benefit of
3
percentage points in 2018 related to gains from our foreign exchange activity for derivative contracts primarily due to the strengthening of the U.S. dollar, partially offset by balance sheet remeasurement losses. In 2017, foreign exchange activity had a negative impact of 2 percentage points due to greater losses from foreign exchange derivative contracts.
|
|
•
|
Other expenses increased
2%
and
23%
, or
2%
and
25%
on a currency-neutral basis, respectively. In
2018
, other expenses increased primarily due to the
$100 million
contribution to the Mastercard Impact Fund. The remaining increase was due to costs to support our strategic development efforts. These increases were primarily offset by the non-recurring Venezuela charge of
$167 million
recorded in
2017
which was the primary driver of growth for that period. Other expenses include costs to provide loyalty and rewards solutions, travel and meeting expenses and rental expense for our facilities and other costs associated with our business.
|
Advertising and Marketing
In
2018
, advertising and marketing expenses increased
18%
both as reported and on a currency-neutral basis versus
2017
, primarily due to a change in accounting for certain marketing fund arrangements as a result of our adoption of the new revenue guidance, partially offset by a net decrease in spending on certain marketing campaigns. For a more detailed discussion on the impact of the new revenue guidance, refer to
Note 1 (Summary of Significant Accounting Policies)
. In
2017
, advertising and marketing expenses increased
11%
, or
10%
on a currency-neutral basis versus
2016
, mainly due to higher marketing spend primarily related to certain marketing campaigns.
47
Depreciation and Amortization
Depreciation and amortization expenses increased
5%
and
17%
in
2018
and
2017
, respectively, versus the prior year, both as reported and on a currency-neutral basis. The increase in
2018
was primarily due to the impact of acquisitions partially offset by the full amortization of certain intangible assets. In
2017
, the increase was primarily due to the impact of acquisitions.
Provision for Litigation
In
2018
, we recorded pre-tax charges of
$1,128 million
which includes
$654 million
related to a fine issued by the European Commission,
$237 million
related to both the U.S. merchant class litigation and the filed and anticipated opt-out U.S. merchant cases and
$237 million
related to litigation settlements with U.K. and Pan-European merchants. During
2017
and
2016
, we recorded pre-tax charges of
$15 million
and
$117 million
related to litigations with merchants in Canada and the U.K., respectively. See
Note 20 (Legal and Regulatory Proceedings)
to the consolidated financial statements included in Part II, Item 8 for further discussion.
Other Income (Expense)
Other income (expense) is comprised primarily of investment income, interest expense, our share of income (losses) from equity method investments and other gains and losses. Total other expense decreased
$22 million
to
$78 million
in
2018
versus
$100 million
in
2017
due to higher investment income partially offset by higher interest expense related to our debt issuance in February 2018 and higher equity losses in the current year. Total other expense decreased
$15 million
to
$100 million
in
2017
versus
$115 million
in
2016
due to lower impairment charges taken on certain investments last year and a gain on an investment recorded in 2017, partially offset by higher interest expense from debt issued in the fourth quarter of 2017.
Income Taxes
On December 22, 2017, U.S. Tax Reform was enacted into law with the effective date for most provisions being January 1, 2018. U.S. Tax Reform represents significant changes to the U.S. internal revenue code and, among other things:
|
•
|
lowered the corporate income tax rate from 35% to 21%
|
|
•
|
imposed a one-time deemed repatriation tax on accumulated foreign earnings
|
|
•
|
provides for a 100% dividends received deduction on dividends from foreign affiliates
|
|
•
|
requires a current inclusion in U.S. federal taxable income of earnings of foreign affiliates that are determined to be global intangible low taxed income or “GILTI”
|
|
•
|
creates the base erosion anti-abuse tax, or “BEAT”
|
|
•
|
provides for an effective tax rate of 13.125% for certain income derived from outside of the U.S. (referred to as foreign derived intangible income or “FDII”)
|
|
•
|
introduced further limitations on the deductibility of executive compensation
|
|
•
|
permits 100% expensing of qualifying fixed assets acquired after September 27, 2017
|
|
•
|
limits the deductibility of interest expense in certain situations and
|
|
•
|
eliminates the domestic production activities deduction.
|
While the effective date of the law for most provisions was January 1, 2018, GAAP requires the effects of changes in tax rates be accounted for in the reporting period of enactment, which was the 2017 reporting period.
The effective tax rates for the years ended
December 31, 2018, 2017 and 2016
were
18.7%
,
40.0%
and
28.1%
, respectively. The effective income tax rate for
2018
was lower than the effective income tax rate for
2017
primarily due to additional tax expense of
$873 million
attributable to U.S. Tax Reform in 2017, a lower 2018 statutory tax rate in the U.S. and Belgium and a more favorable geographic mix of earnings. The lower effective tax rate is also attributable to discrete tax benefits, relating primarily to
$90 million
of foreign tax credits generated in 2018, which can be carried back and utilized in 2017 under transition rules in the proposed foreign tax credit regulations issued on November 28, 2018, along with provisions for legal matters in the United States. These benefits were partially offset by the nondeductible nature of the fine issued by the European Commission. Excluding the impact of Special Items, the
2018
adjusted effective income tax rate improved by
8.3
percentage points to
18.5%
from
26.8%
in
2017
primarily due to the lower tax rate in the U.S. and a more favorable geographical mix of earnings.
48
The effective income tax rate for 2017 was higher than the effective income tax rate for 2016 primarily due to additional tax expense of
$873 million
attributable to U.S. Tax reform, which included provisional amounts of
$825 million
related to the Transition Tax, the remeasurement of our net deferred tax asset balance in the U.S. and the recognition of a deferred tax liability related to a change in assertion regarding the indefinite reinvestment of a substantial amount of our foreign earnings, as well as
$48 million
due to a foregone foreign tax credit benefit on current year repatriations. Excluding the impact of U.S. Tax Reform and other Special Items, the 2017 adjusted effective income tax rate improved by
1.3
percentage points to
26.8%
from
28.1%
in 2016 primarily due to a more favorable geographical mix of earnings, partially offset by a lower U.S. foreign tax credit benefit.
The provision for income taxes differs from the amount of income tax determined by applying the U.S. federal statutory income tax rate of
21%
for 2018 and
35.0%
for 2017 and 2016 to pretax income for the years ended
December 31,
as a result of the following:
|
For the Years Ended December 31,
|
||||||||||||||||||||
|
2018
|
2017
|
2016
|
||||||||||||||||||
|
Amount
|
Percent
|
Amount
|
Percent
|
Amount
|
Percent
|
|||||||||||||||
|
($ in millions)
|
||||||||||||||||||||
|
Income before income taxes
|
$
|
7,204
|
|
$
|
6,522
|
|
$
|
5,646
|
|
|||||||||||
|
Federal statutory tax
|
1,513
|
|
21.0
|
%
|
2,283
|
|
35.0
|
%
|
1,976
|
|
35.0
|
%
|
||||||||
|
State tax effect, net of federal benefit
|
46
|
|
0.6
|
%
|
43
|
|
0.7
|
%
|
22
|
|
0.4
|
%
|
||||||||
|
Foreign tax effect
|
(92
|
)
|
(1.3
|
)%
|
(380
|
)
|
(5.8
|
)%
|
(188
|
)
|
(3.3
|
)%
|
||||||||
|
European Commission fine
|
194
|
|
2.7
|
%
|
—
|
|
—
|
%
|
—
|
|
—
|
%
|
||||||||
|
Foreign tax credits
1
|
(110
|
)
|
(1.5
|
)%
|
(27
|
)
|
(0.4
|
)%
|
(141
|
)
|
(2.5
|
)%
|
||||||||
|
Transition Tax
|
22
|
|
0.3
|
%
|
629
|
|
9.6
|
%
|
—
|
|
—
|
%
|
||||||||
|
Remeasurement of deferred taxes
|
(7
|
)
|
(0.1
|
)%
|
157
|
|
2.4
|
%
|
—
|
|
—
|
%
|
||||||||
|
Windfall benefit
|
(72
|
)
|
(1.0
|
)%
|
(43
|
)
|
(0.7
|
)%
|
—
|
|
—
|
%
|
||||||||
|
Other, net
|
(149
|
)
|
(2.0
|
)%
|
(55
|
)
|
(0.8
|
)%
|
(82
|
)
|
(1.5
|
)%
|
||||||||
|
Income tax expense
|
$
|
1,345
|
|
18.7
|
%
|
$
|
2,607
|
|
40.0
|
%
|
$
|
1,587
|
|
28.1
|
%
|
|||||
1
Included within the impact of the
2018
foreign tax credits is a
$90 million
tax benefit relating to the carry back of certain foreign tax credits. Additionally, included in 2016 is a
$116 million
benefit associated with the repatriation of 2016 foreign earnings. There was no benefit associated with the repatriation of foreign earnings in
2018
and
2017
due to the enactment of U.S. Tax Reform.
Our GAAP effective income tax rates for
2018
,
2017
and
2016
were affected by the tax benefits related to the Special Items as previously discussed.
Our unrecognized tax benefits related to positions taken during the current and prior periods were
$164 million
and
$183 million
, as of
December 31, 2018
and
2017
, respectively, all of which would reduce our effective tax rate if recognized. Within the next twelve months, we believe that the resolution of certain federal, foreign and state and local tax examinations is reasonably possible and that a change in estimate, reducing unrecognized tax benefits, may occur. It is not possible to provide a range of the potential change until the examinations progress further or the related statute of limitations expire.
In 2010, in connection with the expansion of our operations in the Asia Pacific, Middle East and Africa region, our subsidiary in Singapore, Mastercard Asia Pacific Pte. Ltd. (“MAPPL”), received an incentive grant from the Singapore Ministry of Finance.
See
Note 19 (Income Taxes)
to the consolidated financial statements included in Part II, Item 8 for further discussion.
49
Liquidity and Capital Resources
We rely on existing liquidity, cash generated from operations and access to capital to fund our global operations, credit and settlement exposure, capital expenditures, investments in our business and current and potential obligations. The following table summarizes the cash, cash equivalents, investments and credit available to us at
December 31
:
|
2018
|
2017
|
||||||
|
(in billions)
|
|||||||
|
Cash, cash equivalents and investments
1
|
$
|
8.4
|
|
$
|
7.8
|
|
|
|
Unused line of credit
|
4.5
|
|
3.8
|
|
|||
1
Investments include available-for-sale securities and short-term held-to-maturity securities.
At
December 31, 2018
and
2017
, this amount excludes restricted cash related to the U.S. merchant class litigation settlement of
$553 million
and
$546 million
, respectively. This amount also excludes restricted security deposits held for customers of
$1.1 billion
at both
December 31, 2018
and
2017
.
In 2017, as a result of U.S. Tax Reform, among other things, we changed our assertion regarding the indefinite reinvestment of foreign earnings outside the U.S. for certain of our foreign affiliates and recognized a provisional deferred tax liability of
$36 million
. In 2018, we completed our analysis of global working capital and cash needs. It is our present intention to indefinitely reinvest approximately
$0.9 billion
of our historic undistributed accumulated earnings associated with certain foreign subsidiaries outside of the U.S. See
Note 19 (Income Taxes)
to the consolidated financial statements included in Part II, Item 8 for further discussion.
Our liquidity and access to capital could be negatively impacted by global credit market conditions. We guarantee the settlement of many of the transactions between our customers. See
Note 21 (Settlement and Other Risk Management)
to the consolidated financial statements in Part II, Item 8 for a description of these guarantees. Historically, payments under these guarantees have not been significant; however, historical trends may not be an indication of potential future losses. The risk of loss on these guarantees is specific to individual customers, but may also be driven significantly by regional or global economic conditions, including, but not limited to the health of the financial institutions in a country or region.
Our liquidity and access to capital could also be negatively impacted by the outcome of any of the legal or regulatory proceedings to which we are a party. For additional discussion of these and other risks facing our business, see our risk factor in “Risk Factors - Legal and Regulatory Risks” in Part I, Item 1A and
Note 20 (Legal and Regulatory Proceedings)
to the consolidated financial statements included in Part II, Item 8; and Part II, Item 7 (Business Environment).
Cash Flow
The table below shows a summary of the cash flows from operating, investing and financing activities for the years ended
December 31
:
|
|
2018
|
2017
|
2016
|
||||||||
|
|
(in millions)
|
||||||||||
|
Cash Flow Data:
|
|
||||||||||
|
Net cash provided by operating activities
|
$
|
6,223
|
|
$
|
5,664
|
|
$
|
4,637
|
|
||
|
Net cash used in investing activities
|
(506
|
)
|
(1,781
|
)
|
(1,163
|
)
|
|||||
|
Net cash used in financing activities
|
(4,966
|
)
|
(4,764
|
)
|
(2,344
|
)
|
|||||
Net cash provided by operating activities increased
$559 million
in
2018
versus
2017
, primarily due to higher net income as adjusted for non-cash items, partially offset by deferred payments associated with U.S. Tax Reform in the prior year and the timing of settlement with customers. Net cash provided by operating activities in
2017
versus
2016
, increased by
$1.0 billion
, primarily due to higher net income as adjusted for non-cash items and deferred payments associated with U.S. Tax Reform.
Net cash used in investing activities decreased
$1.3 billion
in
2018
versus
2017
, primarily due to 2017 acquisitions. Net cash used in investing activities increased
$618 million
in
2017
versus
2016
, primarily due to 2017 acquisitions and investments in nonmarketable equity investments, partially offset by higher net proceeds of investment securities.
Net cash used in financing activities increased
$202 million
in
2018
versus
2017
, primarily due to higher repurchases of our Class A common stock and dividends paid, partially offset by the proceeds from debt issued in the current year. Net cash used in financing activities increased
$2.4 billion
in
2017
versus
2016
, primarily due to proceeds from debt issued in 2016, higher repurchases of our Class A common stock and dividends paid.
50
The table below shows a summary of select balance sheet data at
December 31
:
|
2018
|
2017
|
||||||
|
(in millions)
|
|||||||
|
Balance Sheet Data:
|
|||||||
|
Current assets
|
$
|
16,171
|
|
$
|
13,797
|
|
|
|
Current liabilities
|
11,593
|
|
8,793
|
|
|||
|
Long-term liabilities
|
7,778
|
|
6,968
|
|
|||
|
Equity
|
5,418
|
|
5,497
|
|
|||
We believe that our existing cash, cash equivalents and investment securities balances, our cash flow generating capabilities, our borrowing capacity and our access to capital resources are sufficient to satisfy our future operating cash needs, capital asset purchases, outstanding commitments and other liquidity requirements associated with our existing operations and potential obligations.
Debt and Credit Availability
In February 2018, we issued
$500 million
principal amount of notes due in 2028 and an additional
$500 million
principal amount of notes due in 2048. Our total debt outstanding (including the current portion) was
$6.3 billion
and
$5.4 billion
at
December 31, 2018
and
2017
, respectively, with the earliest maturity of
$500 million
of principal occurring in April 2019.
As of December 31, 2018, we have a commercial paper program (the “Commercial Paper Program”), under which we are authorized to issue up to
$4.5 billion
in outstanding notes, with maturities up to
397
days from the date of issuance. In conjunction with the Commercial Paper Program, we have a committed unsecured
$4.5 billion
revolving credit facility (the “Credit Facility”) which expires in November 2023.
Borrowings under the Commercial Paper Program and the Credit Facility are to provide liquidity for general corporate purposes, including providing liquidity in the event of one or more settlement failures by our customers. In addition, we may borrow and repay amounts under these facilities for business continuity purposes. We had no borrowings outstanding under the Commercial Paper Program or the Credit Facility at
December 31, 2018
and
2017
.
In March 2018, we filed a universal shelf registration statement (replacing a previously filed shelf registration statement that was set to expire) to provide additional access to capital, if needed. Pursuant to the shelf registration statement, we may from time to time offer to sell debt securities, guarantees of debt securities, preferred stock, Class A common stock, depository shares, purchase contracts, units or warrants in one or more offerings.
See
Note 14 (Debt)
to the consolidated financial statements included in Part II, Item 8 for further discussion on our debt, the Commercial Paper Program and the Credit Facility.
Dividends and Share Repurchases
We have historically paid quarterly dividends on our outstanding Class A common stock and Class B common stock. Subject to legally available funds, we intend to continue to pay a quarterly cash dividend. However, the declaration and payment of future dividends is at the sole discretion of our Board of Directors after taking into account various factors, including our financial condition, operating results, available cash and current and anticipated cash needs. The following table summarizes the annual, per share dividends paid in the years reflected:
|
Years Ended December 31,
|
|||||||||||
|
2018
|
2017
|
2016
|
|||||||||
|
(in millions, except per share data)
|
|||||||||||
|
Cash dividend, per share
|
$
|
1.00
|
|
$
|
0.88
|
|
$
|
0.76
|
|
||
|
Cash dividends paid
|
$
|
1,044
|
|
$
|
942
|
|
$
|
837
|
|
||
On December 4, 2018, our Board of Directors declared a quarterly cash dividend of
$0.33
per share paid on February 8, 2019 to holders of record on January 9, 2019 of our Class A common stock and Class B common stock. The aggregate amount of this dividend was
$340 million
.
51
On February 5, 2019, our Board of Directors declared a quarterly cash dividend of
$0.33
per share payable on May 9, 2019 to holders of record on April 9, 2019 of our Class A common stock and Class B common stock. The aggregate amount of this dividend is estimated to be
$339 million
.
Repurchased shares of our common stock are considered treasury stock. The timing and actual number of additional shares repurchased will depend on a variety of factors, including the operating needs of the business, legal requirements, price and economic and market conditions. In December 2018, 2017 and 2016, our Board of Directors approved share repurchase programs authorizing us to repurchase up to
$6.5 billion
,
$4 billion
and
$4 billion
, respectively, of our Class A common stock. The program approved in 2018 became effective in January 2019 after completion of the share repurchase program authorized in 2017. The following table summarizes our share repurchase authorizations of our Class A common stock through
December 31, 2018
, under the plans approved in 2018, 2017 and 2016:
|
(in millions, except per share data)
|
|||
|
Board authorization
|
$
|
14,500
|
|
|
Remaining authorization at December 31, 2017
|
$
|
5,234
|
|
|
Dollar-value of shares repurchased in 2018
|
$
|
4,933
|
|
|
Remaining authorization at December 31, 2018
|
$
|
6,801
|
|
|
Shares repurchased in 2018
|
26.2
|
|
|
|
Average price paid per share in 2018
|
$
|
188.26
|
|
See
Note 15 (Stockholders’ Equity)
to the consolidated financial statements included in Part II, Item 8 for further discussion.
Off-Balance Sheet Arrangements
We have no off-balance sheet debt, other than lease arrangements and other commitments as presented in the Future Obligations table that follows.
52
Future Obligations
The following table summarizes our obligations as of
December 31, 2018
that are expected to impact liquidity and cash flow in future periods. We believe we will be able to fund these obligations through cash generated from operations and our cash balances.
|
|
Payments Due by Period
|
||||||||||||||||||
|
|
Total
|
2019
|
2020 - 2021
|
2022 - 2023
|
2024 and thereafter
|
||||||||||||||
|
|
|
|
(in millions)
|
|
|
||||||||||||||
|
Debt
|
$
|
6,389
|
|
$
|
500
|
|
$
|
650
|
|
$
|
801
|
|
$
|
4,438
|
|
||||
|
Interest on debt
|
2,072
|
|
166
|
|
323
|
|
288
|
|
1,295
|
|
|||||||||
|
Capital leases
|
8
|
|
4
|
|
4
|
|
—
|
|
—
|
|
|||||||||
|
Operating leases
|
676
|
|
72
|
|
151
|
|
126
|
|
327
|
|
|||||||||
|
Other obligations
1
|
|||||||||||||||||||
|
Sponsorship, licensing and other
2
|
691
|
|
350
|
|
279
|
|
62
|
|
—
|
|
|||||||||
|
Employee benefits
3
|
273
|
|
72
|
|
49
|
|
46
|
|
106
|
|
|||||||||
|
Transition Tax
4
|
509
|
|
—
|
|
47
|
|
156
|
|
306
|
|
|||||||||
|
Redeemable non-controlling interests
5
|
73
|
|
—
|
|
73
|
|
—
|
|
—
|
|
|||||||||
|
Total
6
|
$
|
10,691
|
|
$
|
1,164
|
|
$
|
1,576
|
|
$
|
1,479
|
|
$
|
6,472
|
|
||||
1
The table does not include the
$1.6 billion
provision as of
December 31, 2018
related to litigation as the timing of payments is not fixed and determinable. See
Note 20 (Legal and Regulatory Proceedings)
to the consolidated financial statements included in Part II, Item 8 for further discussion. The table also does not include the
$219 million
accrual as of
December 31, 2018
related to the contingent consideration attributable to acquisitions made in 2017, which is pending our final assessment in accordance with the terms of the purchase agreement. This payment is expected to be completed in 2019. See
Note 7 (Fair Value and Investment Securities)
to the consolidated financial statements included in Part II, Item 8 for further discussion.
2
Amounts primarily relate to sponsorships to promote the Mastercard brand. Future cash payments that will become due to our customers under agreements which provide pricing rebates on our standard fees and other incentives in exchange for transaction volumes are not included in the table because the amounts due are contingent on future performance. We have accrued
$4.1 billion
as of
December 31, 2018
related to customer and merchant agreements.
3
Amounts relate to severance liabilities along with expected funding requirements for defined benefit pension and postretirement plans.
4
Amounts relate to the U.S. tax liability on the Transition Tax on accumulated non-U.S. earnings of U.S entities. See
Note 19 (Income Taxes)
to the consolidated financial statements included in Part II, Item 8 for further discussion.
5
Amount relates to the fixed-price put option for the Vocalink remaining shareholders to sell their ownership interest to Mastercard on the third and fifth anniversaries of the transaction and quarterly thereafter. See
Note 2 (Acquisitions)
to the consolidated financial statements included in Part II, Item 8 for further discussion.
6
We have recorded a liability for unrecognized tax benefits of
$164 million
at
December 31, 2018
. Within the next twelve months, we believe that the resolution of certain federal, foreign and state and local examinations are reasonably possible and that a change in estimate, reducing unrecognized tax benefits, may occur. It is not possible to provide a range of the potential change until the examinations progress further or the related statute of limitations expire. These amounts have been excluded from the table since the settlement period of this liability cannot be reasonably estimated. The timing of these payments will ultimately depend on the progress of tax examinations with the various authorities.
53
Seasonality
We do not experience meaningful seasonality. No individual quarter in
2018
,
2017
or
2016
accounted for more than
30%
of net revenue.
Critical Accounting Estimates
The application of GAAP requires us to make estimates and assumptions about certain items and future events that directly affect our reported financial condition. We have established detailed policies and control procedures to provide reasonable assurance that the methods used to make estimates and assumptions are well controlled and are applied consistently from period to period. The accounting estimates and assumptions discussed in this section are those that we consider to be the most critical to our financial statements. An accounting estimate is considered critical if both (a) the nature of the estimate or assumption is material due to the levels of subjectivity and judgment involved, and (b) the impact within a reasonable range of outcomes of the estimate and assumption is material to our financial condition. Senior management has discussed the development, selection and disclosure of these estimates with the Audit Committee of our Board of Directors. Our significant accounting policies, including recent accounting pronouncements, are described in
Note 1 (Summary of Significant Accounting Policies)
to the consolidated financial statements included in Part II, Item 8.
Revenue Recognition
Application of the various accounting principles in GAAP related to the measurement and recognition of revenue requires us to make judgments and estimates. Specifically, complex arrangements with nonstandard terms and conditions may require significant contract interpretation to determine the appropriate accounting. Domestic assessment revenue requires an estimate of our customers’ performance in order to recognize this revenue. Rebates and incentives are recorded as a reduction to gross revenue based on these estimates. We consider various factors in estimating customer performance, including a review of specific transactions, historical experience with that customer and market and economic conditions. Differences between actual results and our estimates are adjusted in the period the customer reports actual performance. If our customers’ actual performance is not consistent with our estimates of their performance, net revenue may be materially different.
Loss Contingencies
We are currently involved in various claims and legal proceedings. We regularly review the status of each significant matter and assess its potential financial exposure. If the potential loss from any claim or legal proceeding is considered probable and the amount can be reasonably estimated, we accrue a liability for the estimated loss. Significant judgment is required in both the determination of probability and whether an exposure is reasonably estimable. Our judgments are subjective based on the status of the legal or regulatory proceedings, the merits of our defenses and consultation with in-house and outside legal counsel. Because of uncertainties related to these matters, accruals are based only on the best information available at the time. As additional information becomes available, we reassess the potential liability related to pending claims and litigation and may revise our estimates. Due to the inherent uncertainties of the legal and regulatory process in the multiple jurisdictions in which we operate, our judgments may be materially different than the actual outcomes. See
Note 20 (Legal and Regulatory Proceedings)
to the consolidated financial statements included in Part II, Item 8 for further discussion.
Income Taxes
In calculating our effective income tax rate, we need to make estimates regarding the timing and amount of taxable and deductible items which will adjust the pretax income earned in various tax jurisdictions. Through our interpretation of local tax regulations, adjustments to pretax income for income earned in various tax jurisdictions are reflected within various tax filings. Although we believe that our estimates and judgments discussed herein are reasonable, actual results may be materially different than the estimated amounts.
We record a valuation allowance to reduce our deferred tax assets to the amount that is more likely than not to be realized. Significant judgment is required in determining the valuation allowance. We consider projected future taxable income and ongoing tax planning strategies in assessing the need for the valuation allowance. If it is determined that we are able to realize deferred tax assets in excess of the net carrying value or to the extent we are unable to realize a deferred tax asset, we would adjust the valuation allowance in the period in which such a determination is made, with a corresponding increase or decrease to earnings.
We record tax liabilities for uncertain tax positions taken, or expected to be taken, which may not be sustained or may only be partially sustained, upon examination by the relevant taxing authorities. We consider all relevant facts and current authorities in the tax law in assessing whether any benefit resulting from an uncertain tax position is more likely than not to be sustained
54
and, if so, how current law impacts the amount reflected within these financial statements. If upon examination, we realize a tax benefit which is not fully sustained or is more favorably sustained, this would decrease or increase earnings in the period. In certain situations, we will have offsetting tax credits or taxes in other jurisdictions.
Deferred taxes are established on the estimated foreign exchange gains or losses for foreign earnings that are not considered permanently reinvested, which will be recognized through cumulative translation adjustments as incurred. Ultimately, the working capital requirements of foreign affiliates will determine the amount of cash to be remitted from respective jurisdictions.
Valuation of Assets
The valuation of assets acquired in a business combination and asset impairment reviews require the use of significant estimates and assumptions. The acquisition method of accounting for business combinations requires us to estimate the fair value of assets acquired, liabilities assumed and any non-controlling interest in the acquiree to properly allocate purchase price consideration. Impairment testing for assets, other than goodwill and indefinite-lived intangible assets, requires the allocation of cash flows to those assets or group of assets and if required, an estimate of fair value for the assets or group of assets.
We evaluate goodwill and indefinite-lived intangible assets for impairment on an annual basis or sooner if indicators of impairment exist. Goodwill is tested for impairment at the reporting unit level utilizing a quantitative assessment. We use market capitalization for estimating the fair value of our reporting unit. If the fair value exceeds the carrying value, goodwill is not impaired. If the carrying value exceeds the fair value, then goodwill is impaired and the excess of the reporting unit’s carrying value over the fair value is recognized as an impairment charge.
The impairment test for indefinite-lived intangible assets consists of a qualitative assessment to evaluate all relevant events and circumstances that could affect the significant inputs used to determine the fair value of indefinite-lived intangible assets. In performing these qualitative assessments, we consider relevant events and conditions, including but not limited to, macroeconomic trends, industry and market conditions, overall financial performance, cost factors, company-specific events, and legal and regulatory factors. If the qualitative assessments indicate that it is more likely than not that the fair value of the indefinite-lived intangible assets is less than their carrying amounts, we must perform a quantitative impairment test.
Our estimates in the valuation of these assets are based upon assumptions believed to be reasonable, but which are inherently uncertain and unpredictable. These valuations require the use of management’s assumptions, which would not reflect unanticipated events and circumstances that may occur.
55
ITEM 7A.
QUANTITATIVE AND QUALITATIVE DISCLOSURES ABOUT MARKET RISK
Market risk is the potential for economic losses to be incurred on market risk sensitive instruments arising from adverse changes in market factors such as interest rates and foreign currency exchange rates. Our exposure to market risk from changes in interest rates and foreign exchange rates is limited. Management establishes and oversees the implementation of policies governing our funding, investments and use of derivative financial instruments. We monitor risk exposures on an ongoing basis. The effect of a hypothetical 10% adverse change in foreign exchange rates could result in a fair value loss of approximately
$113 million
on our foreign currency derivative contracts outstanding at
December 31, 2018
related to the hedging program. In addition, a 100 basis point adverse change in interest rates would not have a material impact on our investments at
December 31, 2018
and
2017
.
Foreign Exchange Risk
Our settlement activities are subject to foreign exchange risk resulting from foreign exchange rate fluctuations. This risk is typically limited to the one business day between setting the foreign exchange rates and clearing the financial transactions. We enter into foreign currency contracts to manage risk associated with anticipated receipts and disbursements which are either transacted in a non-functional currency or valued based on a currency other than the functional currencies of the entity.
We may also enter into foreign currency derivative contracts to offset possible changes in value due to foreign exchange fluctuations of earnings, assets and liabilities denominated in currencies other than the functional currency of the entity. The objective of these activities is to reduce our exposure to transaction gains and losses resulting from fluctuations of foreign currencies against our functional and reporting currencies, principally the U.S. dollar and euro.
Foreign currency exposures are managed together through our foreign exchange risk management activities, which are discussed further in
Note 22 (Foreign Exchange Risk Management)
to the consolidated financial statements included in Part II, Item 8. The terms of the forward contracts are generally less than
18 months
.
As of
December 31, 2018
, the majority of derivative contracts to hedge foreign currency fluctuations had been entered into with our customers. Our derivative contracts are summarized below:
|
|
December 31, 2018
|
December 31, 2017
|
|||||||||||||
|
Notional
|
Estimated Fair
Value
|
Notional
|
Estimated Fair
Value
|
||||||||||||
|
|
(in millions)
|
||||||||||||||
|
Commitments to purchase foreign currency
|
$
|
34
|
|
$
|
(1
|
)
|
$
|
27
|
|
$
|
—
|
|
|||
|
Commitments to sell foreign currency
|
1,066
|
|
26
|
|
968
|
|
(26
|
)
|
|||||||
|
Options to sell foreign currency
|
25
|
|
4
|
|
27
|
|
2
|
|
|||||||
We also use foreign currency denominated debt to hedge a portion of our net investment in foreign operations against adverse movements in exchange rates, with changes in the translated value of the debt recorded within currency translation adjustment in accumulated other comprehensive income (loss). We have designated our euro-denominated debt as a net investment hedge for a portion of our net investment in European foreign operations. Our euro-denominated debt is vulnerable to changes in the euro to U.S. dollar exchange rates. The principal amounts of our euro-denominated debt as well as the effective interest rates and scheduled annual maturities of the principal is included in
Note 14 (Debt)
to the consolidated financial statements included in Part II, Item 8.
56
Interest Rate Risk
Our interest rate sensitive assets are our investments in fixed income securities, which we generally hold as available-for-sale investments. Our policy is to invest in high quality securities, while providing adequate liquidity and maintaining diversification to avoid significant exposure. The fair value and maturity distribution of our available-for-sale investments for fixed income securities as of
December 31
was as follows:
|
Maturity
|
||||||||||||||||||||||||||||||
|
Fair Market Value at December 31, 2018
|
2019
|
2020
|
2021
|
2022
|
2023
|
2024 and there-after
|
||||||||||||||||||||||||
|
Financial Instrument
|
Summary Terms
|
|||||||||||||||||||||||||||||
|
(in millions)
|
||||||||||||||||||||||||||||||
|
Municipal securities
|
Fixed / Variable Interest
|
$
|
15
|
|
$
|
13
|
|
$
|
2
|
|
$
|
—
|
|
$
|
—
|
|
$
|
—
|
|
$
|
—
|
|
||||||||
|
Government and agency securities
|
Fixed / Variable Interest
|
157
|
|
84
|
|
28
|
|
45
|
|
—
|
|
—
|
|
—
|
|
|||||||||||||||
|
Corporate securities
|
Fixed / Variable Interest
|
1,043
|
|
271
|
|
381
|
|
316
|
|
71
|
|
3
|
|
1
|
|
|||||||||||||||
|
Asset-backed securities
|
Fixed / Variable Interest
|
217
|
|
8
|
|
77
|
|
93
|
|
33
|
|
6
|
|
—
|
|
|||||||||||||||
|
Total
|
$
|
1,432
|
|
$
|
376
|
|
$
|
488
|
|
$
|
454
|
|
$
|
104
|
|
$
|
9
|
|
$
|
1
|
|
|||||||||
|
Maturity
|
||||||||||||||||||||||||||||||
|
Financial Instrument
|
Summary Terms
|
Fair Market Value at December 31, 2017
|
2018
|
2019
|
2020
|
2021
|
2022
|
2023 and there-after
|
||||||||||||||||||||||
|
(in millions)
|
||||||||||||||||||||||||||||||
|
Municipal securities
|
Fixed / Variable Interest
|
$
|
17
|
|
$
|
12
|
|
$
|
5
|
|
$
|
—
|
|
$
|
—
|
|
$
|
—
|
|
$
|
—
|
|
||||||||
|
Government and agency securities
|
Fixed / Variable Interest
|
185
|
|
87
|
|
59
|
|
16
|
|
23
|
|
—
|
|
—
|
|
|||||||||||||||
|
Corporate securities
|
Fixed / Variable Interest
|
876
|
|
212
|
|
277
|
|
287
|
|
76
|
|
23
|
|
1
|
|
|||||||||||||||
|
Asset-backed securities
|
Fixed / Variable Interest
|
70
|
|
3
|
|
24
|
|
35
|
|
8
|
|
—
|
|
—
|
|
|||||||||||||||
|
Total
|
$
|
1,148
|
|
$
|
314
|
|
$
|
365
|
|
$
|
338
|
|
$
|
107
|
|
$
|
23
|
|
$
|
1
|
|
|||||||||
We also have time deposits that are classified as held-to-maturity securities. At
December 31, 2018
and
2017
, the cost which approximates fair value, of our short-term held-to-maturity securities was
$264 million
and
$700 million
, respectively.
At
December 31, 2018
, we have U.S. dollar-denominated and euro-denominated debt, which is subject to interest rate risk. The principal amounts of this debt as well as the effective interest rates and scheduled annual maturities of the principal is included in
Note 14 (Debt)
to the consolidated financial statements included in Part II, Item 8. See “Future Obligations” for estimated interest payments due by period relating to the U.S. dollar-denominated and euro-denominated debt.
At
December 31, 2018
, we have the Commercial Paper Program and the Credit Facility which provide liquidity for general corporate purposes, including providing liquidity in the event of one or more settlement failures by our customers. Borrowing rates under the Commercial Paper Program are based on market conditions. Borrowing rates under the Credit Facility are variable rates, which are applied to the borrowing based on terms and conditions set forth in the agreement. See
Note 14 (Debt)
to the consolidated financial statements in Part II, Item 8 for additional information on the Credit Facility and the Commercial Paper Program. We had no borrowings under the Commercial Paper Program or the Credit Facility at
December 31, 2018
and
2017
.
57
ITEM 8. FINANCIAL STATEMENTS AND SUPPLEMENTARY DATA
MASTERCARD INCORPORATED
INDEX TO CONSOLIDATED FINANCIAL STATEMENTS
|
Page
|
||
|
Mastercard Incorporated
|
||
|
As of December 31, 2018 and 2017 and for the years ended December 31, 2018, 2017 and 2016
|
||
58
MANAGEMENT’S REPORT ON INTERNAL CONTROL OVER FINANCIAL REPORTING
The management of Mastercard Incorporated (“Mastercard”) is responsible for establishing and maintaining adequate internal control over financial reporting. Internal control over financial reporting is a process designed to provide reasonable assurance regarding the reliability of financial reporting and the preparation of financial statements for external reporting purposes in accordance with accounting principles generally accepted in the United States of America. Because of its inherent limitations, internal control over financial reporting may not prevent or detect misstatements. As required by Section 404 of the Sarbanes-Oxley Act of 2002, management has assessed the effectiveness of Mastercard’s internal control over financial reporting as of
December 31, 2018
. In making its assessment, management has utilized the criteria set forth in
Internal Control - Integrated Framework
(2013) issued by the Committee of Sponsoring Organizations of the Treadway Commission (COSO)
.
Management has concluded that, based on its assessment, Mastercard’s internal control over financial reporting was effective as of
December 31, 2018
. The effectiveness of Mastercard’s internal control over financial reporting as of
December 31, 2018
has been audited by PricewaterhouseCoopers LLP, an independent registered public accounting firm, as stated in their report which appears on the next page.
59
REPORT OF INDEPENDENT REGISTERED PUBLIC ACCOUNTING FIRM
To the Board of Directors and Stockholders
of Mastercard Incorporated:
Opinions on the Financial Statements and Internal Control over Financial Reporting
We have audited the accompanying consolidated balance sheets of Mastercard Incorporated and its subsidiaries (the “Company”) as of
December 31, 2018 and 2017
and the related consolidated statements of operations, comprehensive income, changes in equity and cash flows for each of the three years in the period ended
December 31, 2018
, including the related notes (collectively referred to as the “consolidated financial statements”). We also have audited the Company’s internal control over financial reporting as of
December 31, 2018
, based on criteria established in
Internal Control - Integrated Framework
(2013) issued by the Committee of Sponsoring Organizations of the Treadway Commission (COSO).
In our opinion, the consolidated financial statements referred to above present fairly, in all material respects, the financial position of the Company as of
December 31, 2018 and 2017
, and the results of its operations and its cash flows for each of the three years in the period ended
December 31, 2018
in conformity with accounting principles generally accepted in the United States of America. Also in our opinion, the Company maintained, in all material respects, effective internal control over financial reporting as of
December 31, 2018
, based on criteria established in
Internal Control - Integrated Framework
(2013) issued by the COSO.
Basis for Opinions
The Company’s management is responsible for these consolidated financial statements, for maintaining effective internal control over financial reporting, and for its assessment of the effectiveness of internal control over financial reporting, included in the accompanying Management’s Report on Internal Control over Financial Reporting. Our responsibility is to express opinions on the Company’s consolidated financial statements and on the Company’s internal control over financial reporting based on our audits. We are a public accounting firm registered with the Public Company Accounting Oversight Board (United States) (PCAOB) and are required to be independent with respect to the Company in accordance with the U.S. federal securities laws and the applicable rules and regulations of the Securities and Exchange Commission and the PCAOB.
We conducted our audits in accordance with the standards of the PCAOB. Those standards require that we plan and perform the audits to obtain reasonable assurance about whether the consolidated financial statements are free of material misstatement, whether due to error or fraud, and whether effective internal control over financial reporting was maintained in all material respects.
Our audits of the consolidated financial statements included performing procedures to assess the risks of material misstatement of the consolidated financial statements, whether due to error or fraud, and performing procedures that respond to those risks. Such procedures included examining, on a test basis, evidence regarding the amounts and disclosures in the consolidated financial statements. Our audits also included evaluating the accounting principles used and significant estimates made by management, as well as evaluating the overall presentation of the consolidated financial statements. Our audit of internal control over financial reporting included obtaining an understanding of internal control over financial reporting, assessing the risk that a material weakness exists, and testing and evaluating the design and operating effectiveness of internal control based on the assessed risk. Our audits also included performing such other procedures as we considered necessary in the circumstances. We believe that our audits provide a reasonable basis for our opinions.
Definition and Limitations of Internal Control over Financial Reporting
A company’s internal control over financial reporting is a process designed to provide reasonable assurance regarding the reliability of financial reporting and the preparation of financial statements for external purposes in accordance with generally accepted accounting principles. A company’s internal control over financial reporting includes those policies and procedures that (i) pertain to the maintenance of records that, in reasonable detail, accurately and fairly reflect the transactions and dispositions of the assets of the company; (ii) provide reasonable assurance that transactions are recorded as necessary to permit preparation of financial statements in accordance with generally accepted accounting principles, and that receipts and expenditures of the company are being made only in accordance with authorizations of management and directors of the company; and (iii) provide reasonable assurance regarding prevention or timely detection of unauthorized acquisition, use, or disposition of the company’s assets that could have a material effect on the financial statements.
Because of its inherent limitations, internal control over financial reporting may not prevent or detect misstatements. Also, projections of any evaluation of effectiveness to future periods are subject to the risk that controls may become inadequate because of changes in conditions, or that the degree of compliance with the policies or procedures may deteriorate.
/s/ PricewaterhouseCoopers LLP
New York, New York
February 13, 2019
We have served as the Company’s auditor since 1989.
60
MASTERCARD INCORPORATED
CONSOLIDATED BALANCE SHEET
|
December 31,
|
|||||||
|
2018
|
2017
|
||||||
|
(in millions, except per share data)
|
|||||||
|
ASSETS
|
|||||||
|
Cash and cash equivalents
|
$
|
6,682
|
|
$
|
5,933
|
|
|
|
Restricted cash for litigation settlement
|
553
|
|
546
|
|
|||
|
Investments
|
1,696
|
|
1,849
|
|
|||
|
Accounts receivable
|
2,276
|
|
1,969
|
|
|||
|
Settlement due from customers
|
2,452
|
|
1,375
|
|
|||
|
Restricted security deposits held for customers
|
1,080
|
|
1,085
|
|
|||
|
Prepaid expenses and other current assets
|
1,432
|
|
1,040
|
|
|||
|
Total Current Assets
|
16,171
|
|
13,797
|
|
|||
|
Property, plant and equipment, net
|
921
|
|
829
|
|
|||
|
Deferred income taxes
|
570
|
|
250
|
|
|||
|
Goodwill
|
2,904
|
|
3,035
|
|
|||
|
Other intangible assets, net
|
991
|
|
1,120
|
|
|||
|
Other assets
|
3,303
|
|
2,298
|
|
|||
|
Total Assets
|
$
|
24,860
|
|
$
|
21,329
|
|
|
|
LIABILITIES, REDEEMABLE NON-CONTROLLING INTERESTS AND EQUITY
|
|||||||
|
Accounts payable
|
$
|
537
|
|
$
|
933
|
|
|
|
Settlement due to customers
|
2,189
|
|
1,343
|
|
|||
|
Restricted security deposits held for customers
|
1,080
|
|
1,085
|
|
|||
|
Accrued litigation
|
1,591
|
|
709
|
|
|||
|
Accrued expenses
|
4,747
|
|
3,931
|
|
|||
|
Current portion of long-term debt
|
500
|
|
—
|
|
|||
|
Other current liabilities
|
949
|
|
792
|
|
|||
|
Total Current Liabilities
|
11,593
|
|
8,793
|
|
|||
|
Long-term debt
|
5,834
|
|
5,424
|
|
|||
|
Deferred income taxes
|
67
|
|
106
|
|
|||
|
Other liabilities
|
1,877
|
|
1,438
|
|
|||
|
Total Liabilities
|
19,371
|
|
15,761
|
|
|||
|
Commitments and Contingencies
|
|
|
|||||
|
Redeemable Non-controlling Interests
|
71
|
|
71
|
|
|||
|
Stockholders’ Equity
|
|||||||
|
Class A common stock, $0.0001 par value; authorized 3,000 shares, 1,387 and 1,382 shares issued and 1,019 and 1,040 outstanding, respectively
|
—
|
|
—
|
|
|||
|
Class B common stock, $0.0001 par value; authorized 1,200 shares, 12 and 14 issued and outstanding, respectively
|
—
|
|
—
|
|
|||
|
Additional paid-in-capital
|
4,580
|
|
4,365
|
|
|||
|
Class A treasury stock, at cost, 368 and 342 shares, respectively
|
(25,750
|
)
|
(20,764
|
)
|
|||
|
Retained earnings
|
27,283
|
|
22,364
|
|
|||
|
Accumulated other comprehensive income (loss)
|
(718
|
)
|
(497
|
)
|
|||
|
Total Stockholders’ Equity
|
5,395
|
|
5,468
|
|
|||
|
Non-controlling interests
|
23
|
|
29
|
|
|||
|
Total Equity
|
5,418
|
|
5,497
|
|
|||
|
Total Liabilities, Redeemable Non-controlling Interests and Equity
|
$
|
24,860
|
|
$
|
21,329
|
|
|
The accompanying notes are an integral part of these consolidated financial statements.
61
MASTERCARD INCORPORATED
CONSOLIDATED STATEMENT OF OPERATIONS
|
|
For the Years Ended December 31,
|
||||||||||
|
|
2018
|
2017
|
2016
|
||||||||
|
|
(in millions, except per share data)
|
||||||||||
|
Net Revenue
|
$
|
14,950
|
|
$
|
12,497
|
|
$
|
10,776
|
|
||
|
Operating Expenses
|
|||||||||||
|
General and administrative
|
5,174
|
|
4,653
|
|
3,827
|
|
|||||
|
Advertising and marketing
|
907
|
|
771
|
|
698
|
|
|||||
|
Depreciation and amortization
|
459
|
|
436
|
|
373
|
|
|||||
|
Provision for litigation
|
1,128
|
|
15
|
|
117
|
|
|||||
|
Total operating expenses
|
7,668
|
|
5,875
|
|
5,015
|
|
|||||
|
Operating income
|
7,282
|
|
6,622
|
|
5,761
|
|
|||||
|
Other Income (Expense)
|
|||||||||||
|
Investment income
|
122
|
|
56
|
|
43
|
|
|||||
|
Interest expense
|
(186
|
)
|
(154
|
)
|
(95
|
)
|
|||||
|
Other income (expense), net
|
(14
|
)
|
(2
|
)
|
(63
|
)
|
|||||
|
Total other income (expense)
|
(78
|
)
|
(100
|
)
|
(115
|
)
|
|||||
|
Income before income taxes
|
7,204
|
|
6,522
|
|
5,646
|
|
|||||
|
Income tax expense
|
1,345
|
|
2,607
|
|
1,587
|
|
|||||
|
Net Income
|
$
|
5,859
|
|
$
|
3,915
|
|
$
|
4,059
|
|
||
|
Basic Earnings per Share
|
$
|
5.63
|
|
$
|
3.67
|
|
$
|
3.70
|
|
||
|
Basic weighted-average shares outstanding
|
1,041
|
|
1,067
|
|
1,098
|
|
|||||
|
Diluted Earnings per Share
|
$
|
5.60
|
|
$
|
3.65
|
|
$
|
3.69
|
|
||
|
Diluted weighted-average shares outstanding
|
1,047
|
|
1,072
|
|
1,101
|
|
|||||
The accompanying notes are an integral part of these consolidated financial statements.
62
MASTERCARD INCORPORATED
CONSOLIDATED STATEMENT OF COMPREHENSIVE INCOME
|
|
For the Years Ended December 31,
|
||||||||||
|
|
2018
|
2017
|
2016
|
||||||||
|
|
(in millions)
|
||||||||||
|
Net Income
|
$
|
5,859
|
|
$
|
3,915
|
|
$
|
4,059
|
|
||
|
Other comprehensive income (loss):
|
|||||||||||
|
Foreign currency translation adjustments
|
(319
|
)
|
565
|
|
(275
|
)
|
|||||
|
Income tax effect
|
40
|
|
2
|
|
(11
|
)
|
|||||
|
Foreign currency translation adjustments, net of income tax effect
|
(279
|
)
|
567
|
|
(286
|
)
|
|||||
|
Translation adjustments on net investment hedge
|
96
|
|
(236
|
)
|
60
|
|
|||||
|
Income tax effect
|
(21
|
)
|
83
|
|
(22
|
)
|
|||||
|
Translation adjustments on net investment hedge, net of income tax effect
|
75
|
|
(153
|
)
|
38
|
|
|||||
|
Defined benefit pension and other postretirement plans
|
(18
|
)
|
15
|
|
(2
|
)
|
|||||
|
Income tax effect
|
3
|
|
(1
|
)
|
—
|
|
|||||
|
Defined benefit pension and other postretirement plans, net of income tax effect
|
(15
|
)
|
14
|
|
(2
|
)
|
|||||
|
Investment securities available-for-sale
|
(3
|
)
|
(3
|
)
|
3
|
|
|||||
|
Income tax effect
|
1
|
|
2
|
|
(1
|
)
|
|||||
|
Investment securities available-for-sale, net of income tax effect
|
(2
|
)
|
(1
|
)
|
2
|
|
|||||
|
Other comprehensive income (loss), net of income tax effect
|
(221
|
)
|
427
|
|
(248
|
)
|
|||||
|
Comprehensive Income
|
$
|
5,638
|
|
$
|
4,342
|
|
$
|
3,811
|
|
||
The accompanying notes are an integral part of these consolidated financial statements.
63
MASTERCARD INCORPORATED
CONSOLIDATED STATEMENT OF CHANGES IN EQUITY
|
Stockholders’ Equity
|
|||||||||||||||||||||||||||||||
|
|
Common Stock
|
Additional
Paid-In
Capital
|
Class A
Treasury
Stock
|
Retained
Earnings
|
Accumulated
Other Comprehensive Income (Loss) |
Non-
Controlling
Interests
|
Total
Equity
|
||||||||||||||||||||||||
|
|
Class A
|
Class B
|
|||||||||||||||||||||||||||||
|
|
(in millions, except per share data)
|
||||||||||||||||||||||||||||||
|
Balance at December 31, 2015
|
$
|
—
|
|
$
|
—
|
|
$
|
4,004
|
|
$
|
(13,522
|
)
|
$
|
16,222
|
|
$
|
(676
|
)
|
$
|
34
|
|
$
|
6,062
|
|
|||||||
|
Net income
|
—
|
|
—
|
|
—
|
|
—
|
|
4,059
|
|
—
|
|
—
|
|
4,059
|
|
|||||||||||||||
|
Activity related to non-controlling interests
|
—
|
|
—
|
|
—
|
|
—
|
|
—
|
|
—
|
|
(6
|
)
|
(6
|
)
|
|||||||||||||||
|
Other comprehensive income (loss), net of tax
|
—
|
|
—
|
|
—
|
|
—
|
|
—
|
|
(248
|
)
|
—
|
|
(248
|
)
|
|||||||||||||||
|
Cash dividends declared on Class A and Class B common stock, $0.79 per share
|
—
|
|
—
|
|
—
|
|
—
|
|
(863
|
)
|
—
|
|
—
|
|
(863
|
)
|
|||||||||||||||
|
Purchases of treasury stock
|
—
|
|
—
|
|
—
|
|
(3,503
|
)
|
—
|
|
—
|
|
—
|
|
(3,503
|
)
|
|||||||||||||||
|
Share-based payments
|
—
|
|
—
|
|
179
|
|
4
|
|
—
|
|
—
|
|
—
|
|
183
|
|
|||||||||||||||
|
Conversion of Class B to Class A common stock
|
—
|
|
—
|
|
—
|
|
—
|
|
—
|
|
—
|
|
—
|
|
—
|
|
|||||||||||||||
|
Balance at December 31, 2016
|
—
|
|
—
|
|
4,183
|
|
(17,021
|
)
|
19,418
|
|
(924
|
)
|
28
|
|
5,684
|
|
|||||||||||||||
|
Net income
|
—
|
|
—
|
|
—
|
|
—
|
|
3,915
|
|
—
|
|
—
|
|
3,915
|
|
|||||||||||||||
|
Activity related to non-controlling interests
|
—
|
|
—
|
|
—
|
|
—
|
|
—
|
|
—
|
|
1
|
|
1
|
|
|||||||||||||||
|
Other comprehensive income (loss), net of tax
|
—
|
|
—
|
|
—
|
|
—
|
|
—
|
|
427
|
|
—
|
|
427
|
|
|||||||||||||||
|
Cash dividends declared on Class A and Class B common stock, $0.91 per share
|
—
|
|
—
|
|
—
|
|
—
|
|
(969
|
)
|
—
|
|
—
|
|
(969
|
)
|
|||||||||||||||
|
Purchases of treasury stock
|
—
|
|
—
|
|
—
|
|
(3,747
|
)
|
—
|
|
—
|
|
—
|
|
(3,747
|
)
|
|||||||||||||||
|
Share-based payments
|
—
|
|
—
|
|
182
|
|
4
|
|
—
|
|
—
|
|
—
|
|
186
|
|
|||||||||||||||
|
Conversion of Class B to Class A common stock
|
—
|
|
—
|
|
—
|
|
—
|
|
—
|
|
—
|
|
—
|
|
—
|
|
|||||||||||||||
|
Balance at December 31, 2017
|
—
|
|
—
|
|
4,365
|
|
(20,764
|
)
|
22,364
|
|
(497
|
)
|
29
|
|
5,497
|
|
|||||||||||||||
|
Adoption of revenue standard
|
—
|
|
—
|
|
—
|
|
—
|
|
366
|
|
—
|
|
—
|
|
366
|
|
|||||||||||||||
|
Adoption of intra-entity asset transfers standard
|
—
|
|
—
|
|
—
|
|
—
|
|
(183
|
)
|
—
|
|
—
|
|
(183
|
)
|
|||||||||||||||
|
Net income
|
—
|
|
—
|
|
—
|
|
—
|
|
5,859
|
|
—
|
|
—
|
|
5,859
|
|
|||||||||||||||
|
Activity related to non-controlling interests
|
—
|
|
—
|
|
—
|
|
—
|
|
—
|
|
—
|
|
(6
|
)
|
(6
|
)
|
|||||||||||||||
|
Other comprehensive income (loss), net of tax
|
—
|
|
—
|
|
—
|
|
—
|
|
—
|
|
(221
|
)
|
—
|
|
(221
|
)
|
|||||||||||||||
|
Cash dividends declared on Class A and Class B common stock, $1.08 per share
|
—
|
|
—
|
|
—
|
|
—
|
|
(1,123
|
)
|
—
|
|
—
|
|
(1,123
|
)
|
|||||||||||||||
|
Purchases of treasury stock
|
—
|
|
—
|
|
—
|
|
(4,991
|
)
|
—
|
|
—
|
|
—
|
|
(4,991
|
)
|
|||||||||||||||
|
Share-based payments
|
—
|
|
—
|
|
215
|
|
5
|
|
—
|
|
—
|
|
—
|
|
220
|
|
|||||||||||||||
|
Conversion of Class B to Class A common stock
|
—
|
|
—
|
|
—
|
|
—
|
|
—
|
|
—
|
|
—
|
|
—
|
|
|||||||||||||||
|
Balance at December 31, 2018
|
$
|
—
|
|
$
|
—
|
|
$
|
4,580
|
|
$
|
(25,750
|
)
|
$
|
27,283
|
|
$
|
(718
|
)
|
$
|
23
|
|
$
|
5,418
|
|
|||||||
The accompanying notes are an integral part of these consolidated financial statements.
64
MASTERCARD INCORPORATED
CONSOLIDATED STATEMENT OF CASH FLOWS
|
|
For the Years Ended December 31,
|
||||||||||
|
|
2018
|
2017
|
2016
|
||||||||
|
|
(in millions)
|
||||||||||
|
Operating Activities
|
|||||||||||
|
Net income
|
$
|
5,859
|
|
$
|
3,915
|
|
$
|
4,059
|
|
||
|
Adjustments to reconcile net income to net cash provided by operating activities:
|
|||||||||||
|
Amortization of customer and merchant incentives
|
1,235
|
|
1,001
|
|
860
|
|
|||||
|
Depreciation and amortization
|
459
|
|
437
|
|
373
|
|
|||||
|
Share-based compensation
|
196
|
|
176
|
|
149
|
|
|||||
|
Tax benefit for share-based payments
|
—
|
|
—
|
|
(48
|
)
|
|||||
|
Deferred income taxes
|
(244
|
)
|
86
|
|
(20
|
)
|
|||||
|
Venezuela charge
|
—
|
|
167
|
|
—
|
|
|||||
|
Other
|
31
|
|
59
|
|
29
|
|
|||||
|
Changes in operating assets and liabilities:
|
|||||||||||
|
Accounts receivable
|
(317
|
)
|
(445
|
)
|
(338
|
)
|
|||||
|
Income taxes receivable
|
(120
|
)
|
(8
|
)
|
(1
|
)
|
|||||
|
Settlement due from customers
|
(1,078
|
)
|
(281
|
)
|
(10
|
)
|
|||||
|
Prepaid expenses
|
(1,769
|
)
|
(1,402
|
)
|
(1,073
|
)
|
|||||
|
Accrued litigation and legal settlements
|
869
|
|
(12
|
)
|
17
|
|
|||||
|
Restricted security deposits held for customers
|
(6
|
)
|
94
|
|
96
|
|
|||||
|
Accounts payable
|
101
|
|
290
|
|
145
|
|
|||||
|
Settlement due to customers
|
849
|
|
394
|
|
66
|
|
|||||
|
Accrued expenses
|
439
|
|
589
|
|
520
|
|
|||||
|
Long-term taxes payable
|
(20
|
)
|
577
|
|
—
|
|
|||||
|
Net change in other assets and liabilities
|
(261
|
)
|
27
|
|
(187
|
)
|
|||||
|
Net cash provided by operating activities
|
6,223
|
|
5,664
|
|
4,637
|
|
|||||
|
Investing Activities
|
|||||||||||
|
Purchases of investment securities available-for-sale
|
(1,300
|
)
|
(714
|
)
|
(957
|
)
|
|||||
|
Purchases of investments held-to-maturity
|
(509
|
)
|
(1,145
|
)
|
(867
|
)
|
|||||
|
Proceeds from sales of investment securities available-for-sale
|
604
|
|
304
|
|
277
|
|
|||||
|
Proceeds from maturities of investment securities available-for-sale
|
379
|
|
500
|
|
339
|
|
|||||
|
Proceeds from maturities of investments held-to-maturity
|
929
|
|
1,020
|
|
456
|
|
|||||
|
Purchases of property, plant and equipment
|
(330
|
)
|
(300
|
)
|
(215
|
)
|
|||||
|
Capitalized software
|
(174
|
)
|
(123
|
)
|
(167
|
)
|
|||||
|
Acquisition of businesses, net of cash acquired
|
—
|
|
(1,175
|
)
|
—
|
|
|||||
|
Investment in nonmarketable equity investments
|
(91
|
)
|
(147
|
)
|
(31
|
)
|
|||||
|
Other investing activities
|
(14
|
)
|
(1
|
)
|
2
|
|
|||||
|
Net cash used in investing activities
|
(506
|
)
|
(1,781
|
)
|
(1,163
|
)
|
|||||
|
Financing Activities
|
|||||||||||
|
Purchases of treasury stock
|
(4,933
|
)
|
(3,762
|
)
|
(3,511
|
)
|
|||||
|
Proceeds from debt
|
991
|
|
—
|
|
1,972
|
|
|||||
|
Payment of debt
|
—
|
|
(64
|
)
|
—
|
|
|||||
|
Dividends paid
|
(1,044
|
)
|
(942
|
)
|
(837
|
)
|
|||||
|
Tax benefit for share-based payments
|
—
|
|
—
|
|
48
|
|
|||||
|
Tax withholdings related to share-based payments
|
(80
|
)
|
(47
|
)
|
(51
|
)
|
|||||
|
Cash proceeds from exercise of stock options
|
104
|
|
57
|
|
37
|
|
|||||
|
Other financing activities
|
(4
|
)
|
(6
|
)
|
(2
|
)
|
|||||
|
Net cash used in financing activities
|
(4,966
|
)
|
(4,764
|
)
|
(2,344
|
)
|
|||||
|
Effect of exchange rate changes on cash, cash equivalents, restricted cash and restricted cash equivalents
|
(6
|
)
|
200
|
|
(50
|
)
|
|||||
|
Net increase (decrease) in cash, cash equivalents, restricted cash and restricted cash equivalents
|
745
|
|
(681
|
)
|
1,080
|
|
|||||
|
Cash, cash equivalents, restricted cash and restricted cash equivalents - beginning of period
|
7,592
|
|
8,273
|
|
7,193
|
|
|||||
|
Cash, cash equivalents, restricted cash and restricted cash equivalents - end of period
|
$
|
8,337
|
|
$
|
7,592
|
|
$
|
8,273
|
|
||
The accompanying notes are an integral part of these consolidated financial statements.
65
MASTERCARD INCORPORATED
NOTES TO CONSOLIDATED FINANCIAL STATEMENTS
Note 1.
Summary of Significant Accounting Policies
Organization
Mastercard Incorporated and its consolidated subsidiaries, including Mastercard International Incorporated (“Mastercard International” and together with Mastercard Incorporated, “Mastercard” or the “Company”), is a technology company in the global payments industry that connects consumers, financial institutions, merchants, governments, digital partners, businesses and other organizations worldwide, enabling them to use electronic forms of payment instead of cash and checks. The Company makes payments easier and more efficient by creating a wide range of payment solutions and services through a family of well-known brands, including Mastercard®, Maestro® and Cirrus®. The Company is a multi-rail network. Through its core global payments processing network, Mastercard facilitates the switching (authorization, clearing and settlement) of payment transactions, and delivers related products and services. With additional payment capabilities that include real-time account based payments (including automated clearing house (“ACH”) transactions), Mastercard offers customers one partner to turn to for their payment needs for both domestic and cross-border transactions across multiple payment flows. The Company also provides value-added offerings such as safety and security products, information and analytics services, consulting, loyalty and reward programs and issuer and acquirer processing. The Company’s payment solutions are designed to ensure safety and security for the global payments system.
A typical transaction on the Company’s core network involves four participants in addition to the Company: account holder (a consumer who holds a card or uses another device enabled for payment), issuer (the account holder’s financial institution), merchant and acquirer (the merchant’s financial institution). The Company does not issue cards, extend credit, determine or receive revenue from interest rates or other fees charged to account holders by issuers, or establish the rates charged by acquirers in connection with merchants’ acceptance of the Company’s branded products. In most cases, account holder relationships belong to, and are managed by, the Company’s financial institution customers.
Significant Accounting Policies
Consolidation and basis of presentation -
The consolidated financial statements include the accounts of Mastercard and its majority-owned and controlled entities, including any variable interest entities (“VIEs”) for which the Company is the primary beneficiary. Investments in VIEs for which the Company is not considered the primary beneficiary are not consolidated and are accounted for as equity method or cost method investments and recorded in other assets on the consolidated balance sheet. At
December 31, 2018 and 2017
, there were no significant VIEs which required consolidation and the investments were not considered material to the consolidated financial statements. Intercompany transactions and balances have been eliminated in consolidation. Certain prior period amounts have been reclassified to conform to the 2018 presentation. For 2017 and 2016,
$127 million
and
$113 million
, respectively, of expenses were reclassified from advertising and marketing expenses to general and administrative expenses. The reclassification had no impact on total operating expenses, operating income or net income. The Company follows accounting principles generally accepted in the United States of America (“GAAP”).
Prior to December 31, 2017, the Company included the financial results from its Venezuela subsidiaries in the consolidated financial statements using the consolidation method of accounting. In 2017, due to foreign exchange regulations restricting access to U.S. dollars in Venezuela, an other-than-temporary lack of exchangeability between the Venezuelan bolivar and U.S. dollar impacted the Company’s ability to manage risk, process cross-border transactions and satisfy U.S. dollar denominated liabilities related to operations in Venezuela. As a result of these factors, Mastercard concluded that effective December 31, 2017, it did not meet the accounting criteria for consolidation of these Venezuelan subsidiaries, and therefore would transition to the cost method of accounting as of December 31, 2017. This accounting change resulted in a pre-tax charge of
$167 million
(
$108 million
after tax or
$0.10
per diluted share) that was recorded in general and administrative expenses on the consolidated statement of operations for the year ended
December 31, 2017
.
Non-controlling interests represent the equity interest not owned by the Company and are recorded for consolidated entities in which the Company owns less than
100%
of the interests. Changes in a parent’s ownership interest while the parent retains its controlling interest are accounted for as equity transactions, and upon loss of control, retained ownership interests are remeasured at fair value, with any gain or loss recognized in earnings. For
2018, 2017 and 2016
, losses from non-controlling interests were de minimis and, as a result, amounts are included on the consolidated statement of operations within other income (expense).
The Company accounts for investments in common stock or in-substance common stock under the equity method of accounting when it has the ability to exercise significant influence over the investee, generally when it holds between
20%
and
50%
ownership
66
in the entity. In addition, investments in flow-through entities such as limited partnerships and limited liability companies are also accounted for under the equity method when the Company has the ability to exercise significant influence over the investee, generally when the investment ownership percentage is equal to or greater than
5%
of the outstanding ownership interest. The excess of the cost over the underlying net equity of investments accounted for under the equity method is allocated to identifiable tangible and intangible assets and liabilities based on fair values at the date of acquisition. The amortization of the excess of the cost over the underlying net equity of investments and Mastercard’s share of net earnings or losses of entities accounted for under the equity method of accounting is included in other income (expense) on the consolidated statement of operations.
The Company accounts for investments in common stock or in-substance common stock under the cost method of accounting when it does not exercise significant influence, generally when it holds less than
20%
ownership in the entity or when the interest in a limited partnership or limited liability company is less than
5%
and the Company has no significant influence over the operation of the investee. Investments in companies that Mastercard does not control, but that are not in the form of common stock or in-substance common stock, are also accounted for under the cost method of accounting. These investments for which there is no readily determinable fair value and the cost method of accounting is used are adjusted for changes resulting from observable price changes in orderly transactions for identical or similar investments of the same issuer.
Investments for which the equity method or cost method of accounting is used are classified as nonmarketable equity investments and recorded in other assets on the consolidated balance sheet.
Use of estimates
- The preparation of financial statements in conformity with GAAP requires management to make estimates and assumptions that affect the reported amounts of assets and liabilities and disclosure of contingent assets and liabilities at the date of the financial statements and the reported amounts of revenue and expenses during the reporting periods. Future events and their effects cannot be predicted with certainty; accordingly, accounting estimates require the exercise of judgment. The accounting estimates used in the preparation of the Company’s consolidated financial statements may change as new events occur, as more experience is acquired, as additional information is obtained and as the Company’s operating environment changes. Actual results may differ from these estimates.
Revenue recognition
- Revenue is recognized to depict the transfer of promised goods or services to customers in an amount that reflects the consideration to which the Company expects to be entitled to in exchange for those goods or services. Revenue is generated by charging fees to issuers, acquirers and other stakeholders for providing switching services, as well as by assessing customers based primarily on the dollar volume of activity, or gross dollar volume, on the cards and other devices that carry the Company’s brands. Revenue is generally derived from transactional information accumulated by Mastercard’s systems or reported by customers.
Volume-based revenue (domestic assessments and cross-border volume fees) is recorded as revenue in the period it is earned, which is when the related volume is generated on the cards. Certain volume-based revenue is based upon information reported by customers. Transaction-based revenue is primarily based on the number and type of transactions and is recognized as revenue in the same period in which the related transactions occur. Other payment-related products and services are recognized as revenue in the period in which the related services are performed or transactions occur.
Mastercard has business agreements with certain customers that provide for rebates or other support when the customers meet certain volume hurdles as well as other support incentives such as marketing, which are tied to performance. Rebates and incentives are recorded as a reduction of revenue primarily when volume- and transaction-based revenues are recognized over the contractual term. Rebates and incentives are calculated based upon estimated performance and the terms of the related business agreements. In addition, Mastercard may make payments to a customer directly related to entering into an agreement, which are generally capitalized and amortized over the life of the agreement on a straight-line basis.
Contract assets include unbilled consideration typically resulting from executed consulting, data analytic and research services performed for customers in connection with Mastercard’s payment network service arrangements. Collection for these services typically occurs over the contractual term. Contract assets are included in prepaid expenses and other current assets and other assets on the consolidated balance sheet.
The Company defers the recognition of revenue when consideration has been received prior to the satisfaction of performance obligations. As these performance obligations are satisfied, revenue is subsequently recognized. Deferred revenue is primarily derived from consulting, data analytic and research services. Deferred revenue is included in other current liabilities and other liabilities on the consolidated balance sheet.
Business combinations
- The Company accounts for business combinations under the acquisition method of accounting. The Company measures the tangible and intangible identifiable assets acquired, liabilities assumed and any non-controlling interest
67
in the acquiree, at their fair values at the acquisition date. Acquisition-related costs are expensed as incurred and are included in general and administrative expenses. Any excess of purchase price over the fair value of net assets acquired, including identifiable intangible assets, is recorded as goodwill.
Goodwill and other intangible assets
- Indefinite-lived intangible assets consist of goodwill, which represents the synergies expected to arise after the acquisition date and the assembled workforce, and customer relationships. Finite-lived intangible assets consist of capitalized software costs, trademarks, tradenames, customer relationships and other intangible assets. Intangible assets with finite useful lives are amortized over their estimated useful lives, on a straight-line basis, which range from
one
to
twenty
years. Capitalized software includes internal and external costs incurred directly related to the design, development and testing phases of each capitalized software project.
Impairment of assets -
Goodwill and indefinite-lived intangible assets are not amortized but are tested annually for impairment in the fourth quarter, or sooner when circumstances indicate an impairment may exist. The impairment evaluation for goodwill utilizes a quantitative assessment. If the fair value of a reporting unit exceeds the carrying value, goodwill is not impaired. If the fair value of the reporting unit is less than its carrying value, then goodwill is impaired and the excess of the reporting unit’s carrying value over the fair value is recognized as an impairment charge.
The impairment test for indefinite-lived intangible assets consists of a qualitative assessment to evaluate relevant events and circumstances that could affect the significant inputs used to determine the fair value of indefinite-lived intangible assets. If the qualitative assessment indicates that it is more likely than not that indefinite-lived intangible assets are impaired, then a quantitative assessment is required.
Long-lived assets, other than goodwill and indefinite-lived intangible assets, are tested for impairment whenever events or circumstances indicate that their carrying amount may not be recoverable. If the carrying value of the asset cannot be recovered from estimated future cash flows, undiscounted and without interest, the fair value of the asset is calculated using the present value of estimated net future cash flows. If the carrying amount of the asset exceeds its fair value, an impairment is recorded.
Impairment charges, if any, are recorded in general and administrative expenses on the consolidated statement of operations.
Litigation
- The Company is a party to certain legal and regulatory proceedings with respect to a variety of matters. The Company evaluates the likelihood of an unfavorable outcome of all legal or regulatory proceedings to which it is a party and accrues a loss contingency when the loss is probable and reasonably estimable. These judgments are subjective based on the status of the legal or regulatory proceedings, the merits of its defenses and consultation with in-house and external legal counsel. Legal costs are expensed as incurred and recorded in general and administrative expenses on the consolidated statement of operations.
Settlement and other risk management
- Mastercard’s rules guarantee the settlement of many of the transactions between its customers. Settlement exposure is the outstanding settlement risk to customers under Mastercard’s rules due to the difference in timing between the payment transaction date and subsequent settlement. While the term and amount of the guarantee are unlimited, the duration of settlement exposure is short term and typically limited to a few days.
The Company also enters into agreements in the ordinary course of business under which the Company agrees to indemnify third parties against damages, losses and expenses incurred in connection with legal and other proceedings arising from relationships or transactions with the Company. As the extent of the Company’s obligations under these agreements depends entirely upon the occurrence of future events, the Company’s potential future liability under these agreements is not determinable.
The Company accounts for each of its guarantees by recording the guarantee at its fair value at the inception or modification date through earnings.
Income taxes
- The Company follows an asset and liability based approach in accounting for income taxes as required under GAAP. Deferred income tax assets and liabilities are recorded to reflect the tax consequences on future years of temporary differences between the financial statement carrying amounts and income tax bases of assets and liabilities. Deferred income taxes are displayed separately as noncurrent assets and liabilities on the consolidated balance sheet. Valuation allowances are provided against assets which are not more likely than not to be realized. The Company recognizes all material tax positions, including uncertain tax positions in which it is more likely than not that the position will be sustained based on its technical merits and if challenged by the relevant taxing authorities. At each balance sheet date, unresolved uncertain tax positions are reassessed to determine whether subsequent developments require a change in the amount of recognized tax benefit. The allowance for uncertain tax positions is recorded in other current and noncurrent liabilities on the consolidated balance sheet. The Company
68
records interest expense related to income tax matters as interest expense on the consolidated statement of operations. The Company includes penalties related to income tax matters in the income tax provision.
The Company will recognize earnings of foreign affiliates that are determined to be global intangible low taxed income (“GILTI”) in the period it arises and it will not recognize deferred taxes for basis differences that may reverse as GILTI in future years.
Cash and cash equivalents
- Cash and cash equivalents include certain investments with daily liquidity and with a maturity of three months or less from the date of purchase. Cash equivalents are recorded at cost, which approximates fair value.
Restricted cash
- The Company classifies cash and cash equivalents as restricted when it is unavailable for withdrawal or use in its general operations. The Company has the following types of restricted cash and restricted cash equivalents:
|
•
|
Restricted cash for litigation settlement -
The Company has restricted cash for litigation within a qualified settlement fund related to a preliminary settlement agreement for the U.S. merchant class litigation. The funds continue to be restricted for payments until the litigation matter is resolved.
|
|
•
|
Restricted security deposits held for customers
- The Company requires collateral from certain customers for settlement of their transactions. The majority of collateral for settlement is in the form of standby letters of credit and bank guarantees which are not recorded on the consolidated balance sheet. Additionally, the Company holds cash deposits and certificates of deposit from certain customers as collateral for settlement of their transactions, which are recorded as assets on the consolidated balance sheet. These assets are fully offset by corresponding liabilities included on the consolidated balance sheet. These security deposits are typically held for the duration of the agreement with the customers.
|
|
•
|
Other restricted cash balances -
The Company has other restricted cash balances which include contractually restricted deposits, as well as cash balances that are restricted based on the Company’s intention with regard to usage. These funds are classified on the consolidated balance sheet within prepaid expenses and other current assets and other assets.
|
Fair value
- The Company measures certain financial assets and liabilities at fair value on a recurring basis by estimating the price that would be received upon the sale of an asset or paid to transfer a liability in an orderly transaction between market participants. The Company classifies these recurring fair value measurements into a three-level hierarchy (“Valuation Hierarchy”).
The Valuation Hierarchy is based upon the transparency of inputs to the valuation of an asset or liability as of the measurement date. A financial instrument’s categorization within the Valuation Hierarchy is based upon the lowest level of input that is significant to the fair value measurement. The three levels of the Valuation Hierarchy are as follows:
|
•
|
Level 1 - inputs to the valuation methodology are quoted prices (unadjusted) for identical assets or liabilities in active markets.
|
|
•
|
Level 2 - inputs to the valuation methodology include quoted prices for similar assets and liabilities in active markets, quoted prices for identical or similar assets and liabilities in inactive markets and inputs that are observable for the asset or liability.
|
|
•
|
Level 3 - inputs to the valuation methodology are unobservable and cannot be directly corroborated by observable market data.
|
Certain assets are measured at fair value on a nonrecurring basis. The Company’s non-financial assets measured at fair value on a nonrecurring basis include property, plant and equipment, goodwill and other intangible assets. These assets are subject to fair value adjustments in certain circumstances, such as when there is evidence of impairment.
The valuation methods for goodwill and other intangible assets acquired in business combinations involve assumptions concerning comparable company multiples, discount rates, growth projections and other assumptions of future business conditions. The Company uses various valuation techniques to determine fair value, primarily discounted cash flows analysis, relief-from-royalty, and multi-period excess earnings for estimating the fair value of its intangible assets. The Company uses market capitalization for estimating the fair value of its reporting unit. As the assumptions employed to measure these assets are based on management’s judgment using internal and external data, these fair value determinations are classified in Level 3 of the Valuation Hierarchy.
69
Contingent consideration
- Certain business combinations involve the potential for future payment of consideration that is contingent upon the achievement of performance milestones. These liabilities are classified within Level 3 of the Valuation Hierarchy as the inputs used to measure fair value are unobservable and require management’s judgment. The fair value of the contingent consideration at the acquisition date and subsequent periods is determined utilizing an income approach based on a Monte Carlo technique and is recorded in other current liabilities and other liabilities on the consolidated balance sheet. Changes to projected performance milestones of the acquired businesses could result in a higher or lower contingent consideration liability. Measurement period adjustments, if any, to the preliminary estimated fair value of contingent consideration as of the acquisition date will be recorded to goodwill, however, changes in fair value as a result of updated assumptions will be recorded in general and administrative expenses on the consolidated statement of operations.
Investment securities
- The Company classifies investments in debt securities as available-for-sale. Available-for-sale securities that are available to meet the Company’s current operational needs are classified as current assets. Available-for-sale securities that are not available to meet the Company’s current operational needs are classified as non-current assets on the consolidated balance sheet.
The investments in debt securities are carried at fair value, with unrealized gains and losses, net of applicable taxes, recorded as a separate component of accumulated other comprehensive income (loss) on the consolidated statement of comprehensive income. Net realized gains and losses on debt securities are recognized in investment income on the consolidated statement of operations. The specific identification method is used to determine realized gains and losses.
The Company evaluates its debt securities for other-than-temporary impairment on an ongoing basis. When there has been a decline in fair value of a debt security below the amortized cost basis, the Company recognizes an other-than-temporary impairment if: (1) it has the intent to sell the security; (2) it is more likely than not that it will be required to sell the security before recovery of the amortized cost basis; or (3) it does not expect to recover the entire amortized cost basis of the security. The credit loss component of the impairment would be recognized in other income (expense), net on the consolidated statement of operations while the non-credit loss would remain in accumulated other comprehensive income (loss) until realized from a sale or an other-than-temporary impairment.
The Company classifies time deposits with maturities greater than three months as held-to-maturity. Held-to-maturity securities that mature within one year are classified as current assets while held-to-maturity securities with maturities of greater than one year are classified as non-current assets. Time deposits are carried at amortized cost on the consolidated balance sheet and are intended to be held until maturity.
Derivative financial instruments
- The Company’s derivative financial instruments are recorded as either assets or liabilities on the balance sheet and measured at fair value. The Company’s foreign exchange forward and option contracts are included in Level 2 of the Valuation Hierarchy as the fair value of these contracts are based on inputs, which are observable based on broker quotes for the same or similar instruments. As the Company does not elect hedge accounting for any derivative instruments, realized and unrealized gains and losses from the change in fair value of these contracts are recognized immediately in current-period earnings. The Company’s derivative contracts hedge foreign exchange risk and are not entered into for trading or speculative purposes. The Company did not have any derivative contracts accounted for under hedge accounting as of
December 31, 2018 and 2017
.
The Company has numerous investments in its foreign subsidiaries. The net assets of these subsidiaries are exposed to volatility in foreign currency exchange rates. The Company uses foreign currency denominated debt to hedge a portion of its net investment in foreign operations against adverse movements in exchange rates. The effective portion of the foreign currency gains and losses related to the foreign currency denominated debt are reported in accumulated other comprehensive income (loss) on the consolidated balance sheet as part of the cumulative translation adjustment component of equity. The ineffective portion, if any, is recognized in earnings in the current period. The Company evaluates the effectiveness of the net investment hedge each quarter.
Settlement due from/due to customers
- The Company operates systems for clearing and settling payment transactions among customers. Net settlements are generally cleared daily among customers through settlement cash accounts by wire transfer or other bank clearing means. However, some transactions may not settle until subsequent business days, resulting in amounts due from and due to customers.
Property, plant and equipment
- Property, plant and equipment are stated at cost less accumulated depreciation and amortization. Depreciation and amortization is computed using the straight-line method over the estimated useful lives of the assets.
70
Depreciation of leasehold improvements and amortization of capital leases is included in depreciation and amortization expense on the consolidated statement of operations.
The useful lives of the Company’s assets are as follows:
|
Asset Category
|
Estimated Useful Life
|
|
|
Buildings
|
30 years
|
|
|
Building equipment
|
10 - 15 years
|
|
|
Furniture and fixtures and equipment
|
3 - 5 years
|
|
|
Leasehold improvements
|
Shorter of life of improvement or lease term
|
|
|
Capital leases
|
Shorter of life of the asset or lease term
|
|
Leases
- The Company enters into operating and capital leases for the use of premises and equipment. Rent expense related to lease agreements that contain lease incentives is recorded on a straight-line basis over the term of the lease.
Pension and other postretirement plans
- The Company recognizes the funded status of its single-employer defined benefit pension plans and postretirement plans as assets or liabilities on its consolidated balance sheet and recognizes changes in the funded status in the year in which the changes occur through accumulated other comprehensive income (loss). The funded status is measured as the difference between the fair value of plan assets and the projected benefit obligation at
December 31,
the measurement date. Overfunded plans, if any, are aggregated and recorded in other assets, while underfunded plans are aggregated and recorded as accrued expenses and other liabilities on the consolidated balance sheet.
Net periodic pension and postretirement benefit cost/(income), excluding the service cost component, is recognized in other income (expense) on the consolidated statement of operations. These costs include interest cost, expected return on plan assets, amortization of prior service costs or credits and gains or losses previously recognized as a component of accumulated other comprehensive income (loss). The service cost component is recognized in general and administrative expenses on the consolidated statement of operations.
Defined contribution plans
- The Company’s contributions to defined contribution plans are recorded when employees render service to the Company. The charge is recorded in general and administrative expenses on the consolidated statement of operations.
Advertising and marketing
- Expenses incurred to promote Mastercard’s products, services and brand are recognized in advertising and marketing on the consolidated statement of operations. The cost of media advertising is expensed when the advertising takes place. Advertising production costs are expensed as incurred. Promotional items are expensed at the time the promotional event occurs. Sponsorship costs are recognized over the period of benefit.
Foreign currency remeasurement and translation
- Monetary assets and liabilities are remeasured to functional currencies using current exchange rates in effect at the balance sheet date. Non-monetary assets and liabilities are recorded at historical exchange rates. Revenue and expense accounts are remeasured at the weighted-average exchange rate for the period. Resulting exchange gains and losses related to remeasurement are included in general and administrative expenses on the consolidated statement of operations.
Where a non-U.S. currency is the functional currency, translation from that functional currency to U.S. dollars is performed for balance sheet accounts using current exchange rates in effect at the balance sheet date and for revenue and expense accounts using a weighted-average exchange rate for the period. Resulting translation adjustments are reported as a component of accumulated other comprehensive income (loss).
Treasury stock
- The Company records the repurchase of shares of its common stock at cost on the trade date of the transaction. These shares are considered treasury stock, which is a reduction to stockholders’ equity. Treasury stock is included in authorized and issued shares but excluded from outstanding shares.
Share-based payments
- The Company measures share-based compensation expense at the grant date, based on the estimated fair value of the award and uses the straight-line method of attribution, net of estimated forfeitures, for expensing awards over the requisite employee service period. The Company estimates the fair value of its non-qualified stock option awards (“Options”) using a Black-Scholes valuation model. The fair value of restricted stock units (“RSUs”) is determined and fixed on the grant date based on the Company’s stock price, adjusted for the exclusion of dividend equivalents. The Monte Carlo simulation valuation
71
model is used to determine the grant date fair value of performance stock units (“PSUs”) granted. All share-based compensation expenses are recorded in general and administrative expenses on the consolidated statement of operations.
Redeemable non-controlling interests
- The Company’s business combinations may include provisions allowing non-controlling equity owners the ability to require the Company to purchase additional interests in the subsidiary at their discretion. These interests are initially recorded at fair value and in subsequent reporting periods are accreted or adjusted to their estimated redemption value. These adjustments to the redemption value will impact retained earnings or additional paid-in capital on the consolidated balance sheet, but will not impact the consolidated statement of operations. The redeemable non-controlling interests are considered temporary and reported outside of permanent equity on the consolidated balance sheet at the greater of the carrying amount adjusted for the non-controlling interest’s share of net income (loss) or its redemption value.
Earnings per share
- The Company calculates basic earnings per share (“EPS”) by dividing net income by the weighted-average number of common shares outstanding during the year. Diluted EPS is calculated by dividing net income by the weighted-average number of common shares outstanding during the year, adjusted for the potentially dilutive effect of stock options and unvested stock units using the treasury stock method. The Company may be required to calculate EPS using the two-class method as a result of its redeemable non-controlling interests. If redemption value exceeds the fair value of the redeemable non-controlling interests, the excess would be a reduction to net income for the EPS calculation. For
2018
,
2017
and
2016
, there was no impact to EPS for adjustments related to redeemable non-controlling interests.
Recently adopted accounting pronouncements
Disclosure requirements for defined benefit plans
- In August 2018, the Financial Accounting Standards Board (the “FASB”) issued accounting guidance which modifies disclosure requirements for employers that sponsor defined benefit pension or other postretirement plans by removing, modifying and adding certain disclosures. This guidance is required to be applied retrospectively and is effective for periods ending after December 15, 2020, with early adoption permitted. The Company adopted this guidance effective December 31, 2018, which did not result in a material impact on the Company’s current year consolidated financial statements.
Income taxes
- In March 2018, the FASB incorporated the Securities and Exchange Commission’s (the “SEC’s”) interpretive guidance from Staff Accounting Bulletin No. 118 (“SAB 118”), issued on December 22, 2017, into the income tax accounting codification under GAAP. The guidance allows for the recognition of provisional amounts related to 2017 U.S. tax reform (“U.S. Tax Reform”) during a one year measurement period with changes recorded as a component of income tax expense. This guidance was effective upon issuance. Refer to
Note 19 (Income Taxes)
for further discussion.
Net periodic pension cost and net periodic postretirement benefit cost
- In March 2017, the FASB issued accounting guidance to improve the presentation of net periodic pension cost and net periodic postretirement benefit cost. Under this guidance, the service cost component is required to be reported in the same line item as other compensation costs arising from services rendered by employees during the period. The other components of the net periodic benefit costs are required to be presented on the consolidated statement of operations separately from the service cost component and outside of operating income. This guidance is required to be applied retrospectively and is effective for periods beginning after December 15, 2017. The Company adopted this guidance effective January 1, 2018, which did not result in a material impact on the Company’s current year consolidated financial statements. The Company did not apply this guidance retrospectively, as the impact was de minimis to the prior year consolidated financial statements. Refer to
Note 13 (Pension, Postretirement and Savings Plans)
for the components of the Company’s net periodic pension cost and net periodic postretirement benefit costs.
Restricted cash
- In November 2016, the FASB issued accounting guidance to address diversity in the classification and presentation of changes in restricted cash on the consolidated statement of cash flows. Under this guidance, companies are required to present restricted cash and restricted cash equivalents with cash and cash equivalents when reconciling the beginning-of-period and end-of-period amounts shown on the consolidated statement of cash flows. This guidance is required to be applied retrospectively and is effective for periods beginning after December 15, 2017, with early adoption permitted. The Company adopted this guidance effective January 1, 2018. In accordance with the adoption of this standard, the Company includes restricted cash, which currently consists of restricted cash for litigation settlement, restricted security deposits held for customers and other restricted cash balances in its reconciliation of beginning-of-period and end-of-period amounts shown on the consolidated statement of cash flows. Refer to
Note 5 (Cash, Cash Equivalents, Restricted Cash and Restricted Cash Equivalents)
for related disclosures.
Intra-entity asset transfers
- In October 2016, the FASB issued accounting guidance to simplify the accounting for income tax consequences of intra-entity transfers of assets other than inventory. Under this guidance, companies are required to recognize
72
the income tax consequences of an intra-entity asset transfer when the transfer occurs. This guidance must be applied on a modified retrospective basis through a cumulative-effect adjustment to retained earnings as of the period of adoption. The guidance is effective for periods beginning after December 15, 2017. The Company adopted this guidance effective January 1, 2018. Refer to
Note 19 (Income Taxes)
for further discussion. See the section in this note entitled Cumulative Effect of the Adopted Accounting Pronouncements for a summary of the cumulative impact of adopting this standard as of January 1, 2018.
Financial instruments -
In January 2016, the FASB issued accounting guidance to amend certain aspects of recognition, measurement, presentation and disclosure of financial instruments, including the requirement to measure certain equity investments at fair value with changes in fair value recognized in income. This guidance is required to be applied by means of a cumulative-effect adjustment to the balance sheet as of the beginning of the fiscal year of adoption. Amendments related to equity securities without readily determinable fair values should be applied prospectively to equity investments that exist as of the date of adoption. The guidance is effective for periods beginning after December 15, 2017. The Company adopted this guidance effective January 1, 2018. The cumulative effect of the adoption of the standard was de minimis to the Company’s balance sheet upon adoption. For the year ended December 31, 2018, the Company recorded a gain on non-marketable equity investments, which resulted in a pre-tax increase of
$12 million
.
Revenue recognition
- In May 2014, the FASB issued accounting guidance that provides a single, comprehensive revenue recognition model for all contracts with customers and supersedes most of the existing revenue recognition requirements. Under this guidance, an entity should recognize revenue to depict the transfer of promised goods or services to customers in an amount that reflects the consideration to which the entity expects to be entitled in exchange for those goods or services. The Company adopted this guidance effective January 1, 2018 under the modified retrospective transition method, applying the standard to contracts not completed as of January 1, 2018 and considered the aggregate amount of modifications. See the section in this note entitled Cumulative Effect of the Adopted Accounting Pronouncements for a summary of the cumulative impact of adopting this standard as of January 1, 2018.
This new revenue guidance impacts the timing of certain customer incentives recognized in the Company’s consolidated statement of operations, as they are recognized over the life of the contract. Previously, such incentives were recognized when earned by the customer. The new revenue guidance also impacts the Company’s accounting recognition for certain market development fund contributions and expenditures. Historically, these items were recorded on a net basis in net revenue and will now be recognized on a gross basis, resulting in an increase to both revenues and expenses.
73
The following tables summarize the impact of the revenue standard on the Company’s consolidated statement of operations for the year ended December 31, 2018 and consolidated balance sheet as of
December 31, 2018
:
|
Year Ended December 31, 2018
|
|||||||||||
|
Balances excluding revenue standard
|
Impact of revenue standard
|
As reported
|
|||||||||
|
(in millions)
|
|||||||||||
|
Net Revenue
|
$
|
14,471
|
|
$
|
479
|
|
$
|
14,950
|
|
||
|
Operating Expenses
|
|||||||||||
|
Advertising and marketing
|
743
|
|
164
|
|
907
|
|
|||||
|
Income before income taxes
|
6,889
|
|
315
|
|
7,204
|
|
|||||
|
Income tax expense
|
1,278
|
|
67
|
|
1,345
|
|
|||||
|
Net Income
|
5,611
|
|
248
|
|
5,859
|
|
|||||
|
December 31, 2018
|
|||||||||||
|
Balances excluding revenue standard
|
Impact of revenue standard
|
As reported
|
|||||||||
|
(in millions)
|
|||||||||||
|
Assets
|
|||||||||||
|
Accounts receivable
|
$
|
2,214
|
|
$
|
62
|
|
$
|
2,276
|
|
||
|
Prepaid expenses and other current assets
|
1,176
|
|
256
|
|
1,432
|
|
|||||
|
Deferred income taxes
|
666
|
|
(96
|
)
|
570
|
|
|||||
|
Other assets
|
2,388
|
|
915
|
|
3,303
|
|
|||||
|
Liabilities
|
|||||||||||
|
Accounts payable
|
959
|
|
(422
|
)
|
537
|
|
|||||
|
Accrued expenses
|
4,375
|
|
372
|
|
4,747
|
|
|||||
|
Other current liabilities
|
1,085
|
|
(136
|
)
|
949
|
|
|||||
|
Other liabilities
|
1,145
|
|
732
|
|
1,877
|
|
|||||
|
Equity
|
|||||||||||
|
Retained earnings
|
26,692
|
|
591
|
|
27,283
|
|
|||||
For a more detailed discussion on revenue recognition, refer to
Note 3 (Revenue)
.
74
Cumulative Effect of the Adopted Accounting Pronouncements
The following table summarizes the cumulative impact of the changes made to the January 1, 2018 consolidated balance sheet for the adoption of the new accounting standards pertaining to revenue recognition and intra-entity asset transfers. The prior periods have not been restated and have been reported under the accounting standards in effect for those periods.
|
Balance at December 31, 2017
|
Impact of revenue standard
|
Impact of intra-entity asset transfers standard
|
Balance at
January 1, 2018 |
||||||||||||
|
(in millions)
|
|||||||||||||||
|
Assets
|
|||||||||||||||
|
Accounts receivable
|
$
|
1,969
|
|
$
|
44
|
|
$
|
—
|
|
$
|
2,013
|
|
|||
|
Prepaid expenses and other current assets
|
1,040
|
|
181
|
|
(17
|
)
|
1,204
|
|
|||||||
|
Deferred income taxes
|
250
|
|
(69
|
)
|
186
|
|
367
|
|
|||||||
|
Other assets
|
2,298
|
|
690
|
|
(352
|
)
|
2,636
|
|
|||||||
|
Liabilities
|
|||||||||||||||
|
Accounts payable
|
933
|
|
(495
|
)
|
—
|
|
438
|
|
|||||||
|
Accrued expenses
|
3,931
|
|
391
|
|
—
|
|
4,322
|
|
|||||||
|
Other current liabilities
|
792
|
|
(44
|
)
|
—
|
|
748
|
|
|||||||
|
Other liabilities
|
1,438
|
|
628
|
|
—
|
|
2,066
|
|
|||||||
|
Equity
|
|||||||||||||||
|
Retained earnings
|
22,364
|
|
366
|
|
(183
|
)
|
22,547
|
|
|||||||
Recent accounting pronouncements not yet adopted
Implementation costs incurred in a hosting arrangement that is a service contract
- In August 2018, the FASB issued accounting guidance which aligns the requirements for capitalizing implementation costs incurred in a hosting arrangement that is a service contract with the requirements for capitalizing implementation costs incurred to develop or obtain internal-use software. This guidance is effective for periods beginning after December 15, 2019 and early adoption is permitted. Companies are required to adopt this guidance either retrospectively or by prospectively applying the guidance to all implementation costs incurred after the date of adoption. The Company is in the process of evaluating when it will adopt this guidance and the potential effects this guidance will have on its consolidated financial statements.
Disclosure requirements for fair value measurement
- In August 2018, the FASB issued accounting guidance which modifies disclosure requirements for fair value measurements by removing, modifying and adding certain disclosures. This guidance is effective for periods beginning after December 15, 2019. Companies are permitted to early adopt the removed or modified disclosures and delay adoption of added disclosures until the effective date. Companies are required to adopt the guidance for certain added disclosures prospectively for only the most recent interim or annual period presented in the initial fiscal year of adoption and all other amendments retrospectively to all periods presented upon their effective date. The Company is in the process of evaluating when it will adopt this guidance and the potential effects this guidance will have on its disclosures.
Comprehensive income
- In February 2018, the FASB issued accounting guidance that allows for a one-time reclassification from accumulated other comprehensive income (loss) to retained earnings for stranded tax effects resulting from U.S. Tax Reform. The guidance is effective for periods beginning after December 15, 2018, with early adoption permitted. The Company will adopt this guidance effective January 1, 2019 and does not expect the impacts of this standard to be material.
Derivatives and hedging
- In August 2017, the FASB issued accounting guidance to improve and simplify existing guidance to allow companies to better reflect their risk management activities in the financial statements. The guidance expands the ability to hedge nonfinancial and financial risk components, eliminates the requirement to separately measure and recognize hedge ineffectiveness and eases requirements of an entity’s assessment of hedge effectiveness. This guidance is effective for periods beginning after December 15, 2018 and early adoption is permitted. The Company currently does not account for its foreign currency derivative contracts under hedge accounting. The Company will adopt this guidance effective January 1, 2019 and does not expect the impacts of this standard to be material. For a more detailed discussion of the Company’s foreign exchange risk management activities, refer to
Note 22 (Foreign Exchange Risk Management)
.
75
Credit losses -
In June 2016, the FASB issued accounting guidance to amend the measurement of credit losses for financial instruments. The guidance requires all expected credit losses for most financial assets held at the reporting date to be measured based on historical experience, current conditions, and reasonable and supportable forecasts, generally resulting in the earlier recognition of allowance for losses. The guidance is effective for periods beginning after December 15, 2019, with early adoption permitted. The Company is required to apply the provisions of this guidance as a cumulative effect adjustment to retained earnings as of the beginning of the first reporting period in which the guidance is adopted. The Company will adopt this guidance effective January 1, 2020 and does not expect the impacts of this standard to be material.
Leases
- In February 2016, the FASB issued accounting guidance that will change how companies account for and present lease arrangements. This guidance requires companies to recognize leased assets and liabilities for both financing and operating leases. This guidance is effective for periods beginning after December 15, 2018. The Company will adopt this guidance effective January 1, 2019 using the modified retrospective approach as of the date of adoption with the available practical expedients. Upon adoption of the standard, the estimated impact on the Company’s consolidated financial statements is expected to be an increase in non-current assets with a corresponding increase in current and non-current liabilities. The Company estimates that the increase in assets and liabilities will represent approximately
2%
of the Company’s total assets and total liabilities as of December 31, 2018 and expects no significant impact to retained earnings.
Note 2.
Acquisitions
In
2017
, the Company acquired businesses for total consideration of
$1.5 billion
, representing both cash and contingent consideration. For the businesses acquired, Mastercard allocated the values associated with the assets, liabilities and redeemable non-controlling interests based on their respective fair values on the acquisition dates. Refer to
Note 1 (Summary of Significant Accounting Policies)
, for the valuation techniques Mastercard utilizes to fair value the assets and liabilities acquired in business combinations. The residual value allocated to goodwill is not expected to be deductible for local tax purposes.
The Company has finalized the purchase accounting for businesses acquired during 2017. The final fair values of the purchase price allocations, as of the acquisition dates, are noted below:
|
(in millions)
|
|||
|
Cash consideration
|
$
|
1,286
|
|
|
Contingent consideration
|
202
|
|
|
|
Redeemable non-controlling interests
|
69
|
|
|
|
Gain on previously held minority interest
|
14
|
|
|
|
Total fair value of businesses acquired
|
$
|
1,571
|
|
|
Assets:
|
|||
|
Cash and cash equivalents
|
$
|
111
|
|
|
Other current assets
|
110
|
|
|
|
Other intangible assets
|
488
|
|
|
|
Goodwill
|
1,135
|
|
|
|
Other assets
|
91
|
|
|
|
Total assets
|
1,935
|
|
|
|
Liabilities:
|
|||
|
Short-term debt
1
|
64
|
|
|
|
Other current liabilities
|
170
|
|
|
|
Net pension liability
|
66
|
|
|
|
Other liabilities
|
64
|
|
|
|
Total liabilities
|
364
|
|
|
|
Net assets acquired
|
$
|
1,571
|
|
1
The short-term debt assumed through acquisitions was repaid during 2017.
76
The following table summarizes the identified intangible assets acquired:
|
Acquisition Date
Fair Value
|
Weighted-Average Useful Life
|
||||
|
(in millions)
|
(Years)
|
||||
|
Developed technologies
|
$
|
319
|
|
7.5
|
|
|
Customer relationships
|
166
|
|
9.9
|
||
|
Other
|
3
|
|
1.4
|
||
|
Other intangible assets
|
$
|
488
|
|
8.3
|
|
For the businesses acquired in 2017, the largest acquisition relates to Vocalink, a payment systems and ATM switching platform operator, located principally in the U.K. On April 28, 2017, Mastercard acquired
92.4%
controlling interest in Vocalink for cash consideration of
£719 million
(
$929 million
as of the acquisition date). In addition, the Vocalink sellers have the potential to earn additional contingent consideration of
£169 million
(approximately
$214 million
as of
December 31, 2018
), upon meeting 2018 revenue targets in accordance with terms of the purchase agreement. Refer to
Note 7 (Fair Value and Investment Securities)
for additional information related to the fair value of contingent consideration.
A majority of Vocalink’s shareholders have retained a
7.6%
ownership for at least
three years
, which is recorded as redeemable non-controlling interests on the consolidated balance sheet. These remaining shareholders have a put option to sell their ownership interest to Mastercard on the third and fifth anniversaries of the transaction and quarterly thereafter (the “Third Anniversary Option” and “Fifth Anniversary Option”, respectively). The Third Anniversary Option is exercisable at a fixed price of
£58 million
(approximately
$73 million
as of
December 31, 2018
) (“Fixed Price”). The Fifth Anniversary Option is exercisable at the greater of the Fixed Price or fair value. Additionally, Mastercard has a call option to purchase the remaining interest from Vocalink’s shareholders on the fifth anniversary of the transaction and quarterly thereafter, which is exercisable at the greater of the Fixed Price or fair value. The fair value of the redeemable non-controlling interests was determined utilizing a market approach, which extrapolated the consideration transferred that was discounted for lack of control and marketability.
The consolidated financial statements include the operating results of the acquired businesses from the dates of their respective acquisition. Pro forma information related to the acquisitions was not included because the impact on the Company’s consolidated results of operations was not considered to be material.
Note 3.
Revenue
Mastercard’s business model involves four participants in addition to the Company: account holders, issuers (the account holders’ financial institutions), merchants and acquirers (the merchants’ financial institutions). Revenue from contracts with customers is recognized when services are performed in an amount that reflects the consideration to which the Company expects to be entitled to in exchange for those services. Revenue recognized from domestic assessments, cross-border volume fees and transaction processing are derived from Mastercard’s payment network services. Revenue is generated by charging fees to issuers, acquirers and other stakeholders for providing switching services, as well as by assessing customers based primarily on the dollar volume of activity, or gross dollar volume, on the cards and other devices that carry the Company’s brands. Revenue is generally derived from transactional information accumulated by Mastercard’s systems or reported by customers. In addition, the Company recognizes revenue from other payment-related products and services in the period in which the related transactions occur or services are performed.
The price structure for Mastercard’s products and services is dependent on the nature of volumes, types of transactions and type of products and services offered to customers. Net revenue can be impacted by the following:
|
•
|
domestic or cross-border transactions
|
|
•
|
geographic region or country in which the transaction occurs
|
|
•
|
volumes/transactions subject to tiered rates
|
|
•
|
processed or not processed by the Company
|
|
•
|
amount of usage of the Company’s other products or services
|
|
•
|
amount of rebates and incentives provided to customers
|
77
The Company classifies its net revenue into the following five categories:
Domestic assessments
are fees charged to issuers and acquirers based primarily on the dollar volume of activity on cards and other devices that carry the Company’s brands where the acquirer country and the issuer country are the same. Revenue from domestic assessments is recorded as revenue in the period it is earned, which is when the related volume is generated on the cards or other devices that carry the Company’s brands.
Cross-border volume fees
are charged to issuers and acquirers based on the dollar volume of activity on cards and other devices that carry the Company’s brands where the acquirer country and the issuer country are different. Revenue from cross-border volume is recorded as revenue in the period it is earned, which is when the related volume is generated on the cards or other devices that carry the Company’s brands.
Transaction processing
revenue is recognized for both domestic and cross-border transactions in the period in which the related transactions occur. Transaction processing includes the following:
|
•
|
Switched transaction
revenue is generated from
the following products and services:
|
|
◦
|
Authorization is the process by which a transaction is routed to the issuer for approval. In certain circumstances, such as when the issuer’s systems are unavailable or cannot be contacted, Mastercard or others approve such transactions on behalf of the issuer in accordance with either the issuer’s instructions or applicable rules (also known as “stand-in”).
|
|
◦
|
Clearing is the determination and exchange of financial transaction information between issuers and acquirers after a transaction has been successfully conducted at the point of interaction. Transactions are cleared among customers through Mastercard’s central and regional processing systems.
|
|
◦
|
Settlement is facilitating the exchange of funds between parties.
|
|
•
|
Connectivity fees
are charged to issuers, acquirers and other financial institutions for network access, equipment and the transmission of authorization and settlement messages. These fees are based on the size of the data being transmitted and the number of connections to the Company’s network.
|
|
•
|
Other processing fees
include issuer and acquirer processing solutions; payment gateways for e-commerce merchants; mobile gateways for mobile initiated transactions; and safety and security.
|
Other revenues
consist of value added service offerings that are typically sold with the Company’s payment service offerings and are recognized in the period in which the related services are performed or transactions occur. Other revenues include the following:
|
•
|
Consulting, data analytic and research fees.
|
|
•
|
Safety and security services fees are for products and services offered to prevent, detect and respond to fraud and to ensure the safety of transactions made primarily on Mastercard products.
|
|
•
|
Loyalty and rewards solutions fees are charged to issuers for benefits provided directly to consumers with Mastercard-branded cards, such as access to a global airline lounge network, global and local concierge services, individual insurance coverages, emergency card replacement, emergency cash advance services and a 24-hour cardholder service center. Loyalty and reward solution fees also include rewards campaigns and management services.
|
|
•
|
Program management services provided to prepaid card issuers consist of foreign exchange margin, commissions, load fees and ATM withdrawal fees paid by cardholders on the sale and encashment of prepaid cards.
|
|
•
|
Bank account-based payment services relating to ACH transactions and other ACH related services.
|
|
•
|
Other payment-related products and services, including account and transaction enhancement services, rules compliance and publications.
|
Rebates and incentives (contra-revenue)
are provided to customers that meet certain volume targets and can be in the form of a rebate or other support incentives, which are tied to performance. Rebates and incentives are recorded as a reduction of revenue primarily when volume- and transaction-based revenues are recognized over the contractual term. In addition,
78
Mastercard may make incentive payments to a customer directly related to entering into an agreement, which are generally capitalized and amortized over the life of the agreement on a straight-line basis.
The following table disaggregates the Company’s net revenue by source and geographic region for the
year ended December 31, 2018
:
|
|
(in millions)
|
||
|
Revenue by source:
|
|||
|
Domestic assessments
|
$
|
6,138
|
|
|
Cross-border volume fees
|
4,954
|
|
|
|
Transaction processing
|
7,391
|
|
|
|
Other revenues
|
3,348
|
|
|
|
Gross revenue
|
21,831
|
|
|
|
Rebates and incentives (contra-revenue)
|
(6,881
|
)
|
|
|
Net revenue
|
$
|
14,950
|
|
|
Net revenue by geographic region:
|
|||
|
North American Markets
|
$
|
5,311
|
|
|
International Markets
|
9,441
|
|
|
|
Other
1
|
198
|
|
|
|
Net revenue
|
$
|
14,950
|
|
1
Includes revenues managed by corporate functions.
Receivables from contracts with customers of
$2.1 billion
and
$1.9 billion
as of
December 31, 2018 and 2017
, respectively, are recorded within accounts receivable on the consolidated balance sheet. The Company’s customers are billed quarterly or more frequently dependent upon the nature of the performance obligation and the underlying contractual terms. The Company does not offer extended payment terms to customers.
Contract assets are included in prepaid expenses and other current assets and other assets on the consolidated balance sheet at
December 31, 2018
in the amounts of
$40 million
and
$92 million
, respectively. The Company did not have contract assets at
December 31, 2017
.
Deferred revenue is included in other current liabilities and other liabilities on the consolidated balance sheet at
December 31, 2018
in the amounts of
$218 million
and
$101 million
, respectively. The comparable amounts included in other current liabilities and other liabilities at
December 31, 2017
were
$230 million
and
$17 million
, respectively. Revenue recognized from such performance obligations satisfied during
2018
was
$904 million
.
The Company’s remaining performance periods for its contracts with customers for its payment network services are typically long-term in nature (generally up to
10 years
). As a payment network service provider, the Company provides its customers with continuous access to its global payment processing network and stands ready to provide transaction processing and related services over the contractual term. Consideration is variable based upon the number of transactions processed and volume activity on the cards and other devices that carry the Company’s brands. The Company has elected the optional exemption to not disclose the remaining performance obligations related to its payment network services. The Company also earns revenues from other value added services comprised of bank account-based payment services, consulting and research fees, loyalty programs and other payment-related products and services. At
December 31, 2018
, the estimated aggregate consideration allocated to unsatisfied performance obligations for these other value added services is
$1.0 billion
, which is expected to be recognized through 2022. The estimated remaining performance obligations related to these revenues are subject to change and are affected by several factors, including modifications and terminations and are not expected to be material to any future annual period.
79
Note 4.
Earnings Per Share
The components of basic and diluted EPS for common shares for each of the years ended December 31 were as follows:
|
|
2018
|
2017
|
2016
|
||||||||
|
|
(in millions, except per share data)
|
||||||||||
|
Numerator
|
|||||||||||
|
Net income
|
$
|
5,859
|
|
$
|
3,915
|
|
$
|
4,059
|
|
||
|
Denominator
|
|||||||||||
|
Basic weighted-average shares outstanding
|
1,041
|
|
1,067
|
|
1,098
|
|
|||||
|
Dilutive stock options and stock units
|
6
|
|
5
|
|
3
|
|
|||||
|
Diluted weighted-average shares outstanding
1
|
1,047
|
|
1,072
|
|
1,101
|
|
|||||
|
Earnings per Share
|
|||||||||||
|
Basic
|
$
|
5.63
|
|
$
|
3.67
|
|
$
|
3.70
|
|
||
|
Diluted
|
$
|
5.60
|
|
$
|
3.65
|
|
$
|
3.69
|
|
||
Note: Table may not sum due to rounding.
1
For the years presented, the calculation of diluted EPS excluded a minimal amount of anti-dilutive share-based payment awards.
Note 5.
Cash, Cash Equivalents, Restricted Cash and Restricted Cash Equivalents
The following table provides a reconciliation of cash, cash equivalents, restricted cash and restricted cash equivalents reported on the consolidated balance sheet that total to the amounts shown on the consolidated statement of cash flows.
|
December 31,
|
|||||||||||||||
|
2018
|
2017
|
2016
|
2015
|
||||||||||||
|
(in millions)
|
|||||||||||||||
|
Cash and cash equivalents
|
$
|
6,682
|
|
$
|
5,933
|
|
$
|
6,721
|
|
$
|
5,747
|
|
|||
|
Restricted cash and restricted cash equivalents
|
|||||||||||||||
|
Restricted cash for litigation settlement
|
553
|
|
546
|
|
543
|
|
541
|
|
|||||||
|
Restricted security deposits held for customers
|
1,080
|
|
1,085
|
|
991
|
|
895
|
|
|||||||
|
Prepaid expenses and other current assets
|
22
|
|
28
|
|
3
|
|
—
|
|
|||||||
|
Other assets
|
—
|
|
—
|
|
15
|
|
10
|
|
|||||||
|
Cash, cash equivalents, restricted cash and restricted cash equivalents
|
$
|
8,337
|
|
$
|
7,592
|
|
$
|
8,273
|
|
$
|
7,193
|
|
|||
Note 6.
Supplemental Cash Flows
The following table includes supplemental cash flow disclosures for each of the years ended December 31:
|
2018
|
2017
|
2016
|
|||||||||
|
|
(in millions)
|
||||||||||
|
Cash paid for income taxes, net of refunds
|
$
|
1,790
|
|
$
|
1,893
|
|
$
|
1,579
|
|
||
|
Cash paid for interest
|
153
|
|
135
|
|
74
|
|
|||||
|
Cash paid for legal settlements
|
260
|
|
47
|
|
101
|
|
|||||
|
Non-cash investing and financing activities
|
|||||||||||
|
Dividends declared but not yet paid
|
340
|
|
263
|
|
238
|
|
|||||
|
Capital leases and other
|
10
|
|
30
|
|
3
|
|
|||||
|
Fair value of assets acquired, net of cash acquired
|
—
|
|
1,825
|
|
—
|
|
|||||
|
Fair value of liabilities assumed related to acquisitions
|
—
|
|
365
|
|
—
|
|
|||||
80
Note 7.
Fair Value and Investment Securities
Financial Instruments - Recurring Measurements
The Company classifies its fair value measurements of financial instruments within the Valuation Hierarchy. There were
no
transfers made among the three levels in the Valuation Hierarchy for
2018
.
The distribution of the Company’s financial instruments measured at fair value on a recurring basis within the Valuation Hierarchy were as follows:
|
|
December 31, 2018
|
December 31, 2017
|
|||||||||||||||||||||||||||||
|
|
Quoted Prices
in Active Markets (Level 1) |
Significant
Other Observable Inputs (Level 2) |
Significant
Unobservable Inputs (Level 3) |
Total
|
Quoted Prices
in Active Markets (Level 1) |
Significant
Other Observable Inputs (Level 2) |
Significant
Unobservable Inputs (Level 3) |
Total
|
|||||||||||||||||||||||
|
(in millions)
|
|||||||||||||||||||||||||||||||
|
Assets
|
|||||||||||||||||||||||||||||||
|
Investment securities available for sale
1
:
|
|||||||||||||||||||||||||||||||
|
Municipal securities
|
$
|
—
|
|
$
|
15
|
|
$
|
—
|
|
$
|
15
|
|
$
|
—
|
|
$
|
17
|
|
$
|
—
|
|
$
|
17
|
|
|||||||
|
Government and agency securities
|
65
|
|
92
|
|
—
|
|
157
|
|
81
|
|
104
|
|
—
|
|
185
|
|
|||||||||||||||
|
Corporate securities
|
—
|
|
1,043
|
|
—
|
|
1,043
|
|
—
|
|
876
|
|
—
|
|
876
|
|
|||||||||||||||
|
Asset-backed securities
|
—
|
|
217
|
|
—
|
|
217
|
|
—
|
|
70
|
|
—
|
|
70
|
|
|||||||||||||||
|
Equity securities
|
—
|
|
—
|
|
—
|
|
—
|
|
1
|
|
—
|
|
—
|
|
1
|
|
|||||||||||||||
|
Derivative instruments
2
:
|
|||||||||||||||||||||||||||||||
|
Foreign currency derivative assets
|
—
|
|
35
|
|
—
|
|
35
|
|
—
|
|
6
|
|
—
|
|
6
|
|
|||||||||||||||
|
Deferred compensation plan
3
:
|
|||||||||||||||||||||||||||||||
|
Deferred compensation assets
|
54
|
|
—
|
|
—
|
|
54
|
|
55
|
|
—
|
|
—
|
|
55
|
|
|||||||||||||||
|
Liabilities
|
|||||||||||||||||||||||||||||||
|
Derivative instruments
2
:
|
|||||||||||||||||||||||||||||||
|
Foreign currency derivative liabilities
|
$
|
—
|
|
$
|
(6
|
)
|
$
|
—
|
|
$
|
(6
|
)
|
$
|
—
|
|
$
|
(30
|
)
|
$
|
—
|
|
$
|
(30
|
)
|
|||||||
|
Deferred compensation plan
4
:
|
|||||||||||||||||||||||||||||||
|
Deferred compensation liabilities
|
(54
|
)
|
—
|
|
—
|
|
(54
|
)
|
(54
|
)
|
—
|
|
—
|
|
(54
|
)
|
|||||||||||||||
1
The Company’s U.S. government securities and marketable equity securities are classified within Level 1 of the Valuation Hierarchy as the fair values are based on unadjusted quoted prices for identical assets in active markets. The fair value of the Company’s available-for-sale municipal securities, government and agency securities, corporate securities and asset-backed securities are based on observable inputs such as quoted prices, benchmark yields and issuer spreads for similar assets in active markets and are therefore included in Level 2 of the Valuation Hierarchy.
2
The Company’s foreign currency derivative asset and liability contracts have been classified within Level 2 of the Valuation Hierarchy as the fair value is based on observable inputs such as broker quotes relating to foreign currency exchange rates for similar derivative instruments. See
Note 22 (Foreign Exchange Risk Management)
for further details.
3
The Company has a nonqualified deferred compensation plan where assets are invested primarily in mutual funds held in a rabbi trust, which is restricted for payments to participants of the plan. The Company has elected to use the fair value option for these mutual funds, which are measured using quoted prices of identical instruments in active markets and are included in prepaid expenses and other current assets on the consolidated balance sheet.
4
The deferred compensation liabilities are measured at fair value based on the quoted prices of identical instruments to the investment vehicles selected by the participants. These are included in other liabilities on the consolidated balance sheet.
Settlement and Other Guarantee Liabilities
The Company estimates the fair value of its settlement and other guarantees using market assumptions for relevant though not directly comparable undertakings, as the latter are not observable in the market given the proprietary nature of such guarantees. At
December 31, 2018 and 2017
, the carrying value and fair value of settlement and other guarantee liabilities were not material
81
and accordingly are not included in the Valuation Hierarchy table above. Settlement and other guarantee liabilities are classified within Level 3 of the Valuation Hierarchy as their valuation requires substantial judgment and estimation of factors that are not observable in the market. See
Note 21 (Settlement and Other Risk Management)
for additional information regarding the Company’s settlement and other guarantee liabilities.
Financial Instruments - Non-Recurring Measurements
Held-to-Maturity Securities
Investments on the consolidated balance sheet include both available-for-sale and short-term held-to-maturity securities. Held-to-maturity securities are not measured at fair value on a recurring basis and are not included in the Valuation Hierarchy table above. At
December 31, 2018
and
2017
, the Company held
$264 million
and
$700 million
, respectively, of held-to-maturity securities due within one year. The cost of these securities approximates fair value.
Nonmarketable Equity Investments
The Company’s nonmarketable equity investments are measured at fair value at initial recognition. In addition, nonmarketable equity investments accounted for under the cost method of accounting are adjusted for changes resulting from identifiable price changes in orderly transactions for the identical or similar investments of the same issuer. Nonmarketable equity investments are classified within Level 3 of the Valuation Hierarchy due to the absence of quoted market prices, the inherent lack of liquidity, and the fact that inputs used to measure fair value are unobservable and require management’s judgment. The Company uses discounted cash flows and market assumptions to estimate the fair value of its nonmarketable equity investments when certain events or circumstances indicate that impairment may exist. These investments are included in other assets on the consolidated balance sheet. See
Note 8 (Prepaid Expenses and Other Assets)
for further details.
Debt
The Company estimates the fair value of its long-term debt based on market quotes. These debt instruments are not traded in active markets and are classified as Level 2 of the Valuation Hierarchy. At
December 31, 2018
, the carrying value and fair value of total long-term debt (including the current portion) was
$6.3 billion
and
$6.5 billion
, respectively. At
December 31, 2017
, the carrying value and fair value of long-term debt was
$5.4 billion
and
$5.7 billion
, respectively.
Other Financial Instruments
Certain financial instruments are carried on the consolidated balance sheet at cost, which approximates fair value due to their short-term, highly liquid nature. These instruments include cash and cash equivalents, restricted cash, accounts receivable, settlement due from customers, restricted security deposits held for customers, accounts payable, settlement due to customers and other accrued liabilities.
Contingent Consideration
The contingent consideration attributable to acquisitions made in 2017 is primarily based on the achievement of 2018 revenue targets and is measured at fair value on a recurring basis. This contingent consideration liability is included in other current liabilities on the consolidated balance sheet and is classified within Level 3 of the Valuation Hierarchy due to the absence of quoted market prices. The activity of the Company’s contingent consideration liability for
2018
was as follows:
|
(in millions)
|
|||
|
Balance at December 31, 2017
|
$
|
219
|
|
|
Net change in valuation
|
19
|
|
|
|
Payments
|
(5
|
)
|
|
|
Foreign currency translation
|
(14
|
)
|
|
|
Balance at December 31, 2018
|
$
|
219
|
|
82
Amortized Costs and Fair Values – Available-for-Sale Investment Securities
The major classes of the Company’s available-for-sale investment securities, for which unrealized gains and losses are recorded as a separate component of other comprehensive income (loss) on the consolidated statement of comprehensive income, and their respective amortized cost basis and fair values as of
December 31, 2018 and 2017
were as follows:
|
|
December 31, 2018
|
December 31, 2017
|
|||||||||||||||||||||||||||||
|
|
Amortized
Cost
|
Gross
Unrealized
Gain
|
Gross
Unrealized
Loss
|
Fair
Value
|
Amortized
Cost
|
Gross
Unrealized
Gain
|
Gross
Unrealized
Loss
|
Fair
Value
|
|||||||||||||||||||||||
|
(in millions)
|
|||||||||||||||||||||||||||||||
|
Municipal securities
|
$
|
15
|
|
$
|
—
|
|
$
|
—
|
|
$
|
15
|
|
$
|
17
|
|
$
|
—
|
|
$
|
—
|
|
$
|
17
|
|
|||||||
|
Government and agency securities
|
157
|
|
—
|
|
—
|
|
157
|
|
185
|
|
—
|
|
—
|
|
185
|
|
|||||||||||||||
|
Corporate securities
|
1,044
|
|
1
|
|
(2
|
)
|
1,043
|
|
875
|
|
2
|
|
(1
|
)
|
876
|
|
|||||||||||||||
|
Asset-backed securities
|
217
|
|
—
|
|
—
|
|
217
|
|
70
|
|
—
|
|
—
|
|
70
|
|
|||||||||||||||
|
Equity securities
|
—
|
|
—
|
|
—
|
|
—
|
|
—
|
|
1
|
|
—
|
|
1
|
|
|||||||||||||||
|
Total
|
$
|
1,433
|
|
$
|
1
|
|
$
|
(2
|
)
|
$
|
1,432
|
|
$
|
1,147
|
|
$
|
3
|
|
$
|
(1
|
)
|
$
|
1,149
|
|
|||||||
The Company’s available-for-sale investment securities held at
December 31, 2018
and
2017
, primarily carried a credit rating of A-, or better. The municipal securities are primarily comprised of tax-exempt bonds and are diversified across states and sectors. Government and agency securities include U.S. government bonds, U.S. government sponsored agency bonds and foreign government bonds with similar credit quality to that of the U.S. government bonds. Corporate securities are comprised of commercial paper and corporate bonds. The asset-backed securities are investments in bonds which are collateralized primarily by automobile loan receivables.
Investment Maturities:
The maturity distribution based on the contractual terms of the Company’s investment securities at
December 31, 2018
was as follows:
|
Available-For-Sale
|
|||||||
|
Amortized
Cost
|
Fair Value
|
||||||
|
(in millions)
|
|||||||
|
Due within 1 year
|
$
|
376
|
|
$
|
376
|
|
|
|
Due after 1 year through 5 years
|
1,056
|
|
1,055
|
|
|||
|
Due after 5 years through 10 years
|
1
|
|
1
|
|
|||
|
Total
|
$
|
1,433
|
|
$
|
1,432
|
|
|
Investment Income
Investment income primarily consists of interest income generated from cash, cash equivalents and investments. Gross realized gains and losses are recorded within investment income on the Company’s consolidated statement of operations. The gross realized gains and losses from the sales of available-for-sale securities for
2018
,
2017
and
2016
were not significant.
Note 8.
Prepaid Expenses and Other Assets
Prepaid expenses and other current assets consisted of the following at
December 31
:
|
2018
|
2017
|
||||||
|
(in millions)
|
|||||||
|
Customer and merchant incentives
|
$
|
778
|
|
$
|
464
|
|
|
|
Prepaid income taxes
|
51
|
|
77
|
|
|||
|
Other
|
603
|
|
499
|
|
|||
|
Total prepaid expenses and other current assets
|
$
|
1,432
|
|
$
|
1,040
|
|
|
83
Other assets consisted of the following at
December 31
:
|
2018
|
2017
|
||||||
|
(in millions)
|
|||||||
|
Customer and merchant incentives
|
$
|
2,458
|
|
$
|
1,434
|
|
|
|
Nonmarketable equity investments
|
337
|
|
249
|
|
|||
|
Prepaid income taxes
|
—
|
|
352
|
|
|||
|
Income taxes receivable
|
298
|
|
178
|
|
|||
|
Other
|
210
|
|
85
|
|
|||
|
Total other assets
|
$
|
3,303
|
|
$
|
2,298
|
|
|
Customer and merchant incentives represent payments made to customers and merchants under business agreements. Costs directly related to entering into such an agreement are generally deferred and amortized over the life of the agreement. The increase in customer and merchant incentives and the decrease in prepaid income taxes at
December 31, 2018
from
December 31, 2017
are primarily due to the impact from the adoption of the new accounting standards pertaining to revenue recognition and intra-entity asset transfers, respectively. See
Note 1 (Summary of Significant Accounting Policies)
for additional information on the cumulative impact of the adoption of these accounting pronouncements.
Note 9.
Property, Plant and Equipment
Property, plant and equipment consisted of the following at
December 31
:
|
2018
|
2017
|
||||||
|
(in millions)
|
|||||||
|
Building, building equipment and land
|
$
|
481
|
|
$
|
455
|
|
|
|
Equipment
|
987
|
|
841
|
|
|||
|
Furniture and fixtures
|
85
|
|
81
|
|
|||
|
Leasehold improvements
|
215
|
|
166
|
|
|||
|
Property, plant and equipment
|
1,768
|
|
1,543
|
|
|||
|
Less: accumulated depreciation and amortization
|
(847
|
)
|
(714
|
)
|
|||
|
Property, plant and equipment, net
|
$
|
921
|
|
$
|
829
|
|
|
As of
December 31, 2018 and 2017
, capital leases of
$33 million
and
$32 million
, respectively, were included in equipment. Accumulated amortization of these capital leases was
$24 million
and
$18 million
as of
December 31, 2018 and 2017
, respectively.
Depreciation and amortization expense for the above property, plant and equipment was
$209 million
,
$185 million
and
$151 million
for
2018
,
2017
and
2016
, respectively.
Note 10.
Goodwill
The changes in the carrying amount of goodwill for the years ended
December 31, 2018 and 2017
were as follows:
|
2018
|
2017
|
||||||
|
(in millions)
|
|||||||
|
Beginning balance
|
$
|
3,035
|
|
$
|
1,756
|
|
|
|
Additions
|
2
|
|
1,136
|
|
|||
|
Foreign currency translation
|
(133
|
)
|
143
|
|
|||
|
Ending balance
|
$
|
2,904
|
|
$
|
3,035
|
|
|
The Company had no accumulated impairment losses for goodwill at
December 31, 2018
. Based on annual impairment testing, the Company’s goodwill is not impaired.
84
Note 11.
Other Intangible Assets
The following table sets forth net intangible assets, other than goodwill, at
December 31
:
|
2018
|
2017
|
||||||||||||||||||||||
|
Gross Carrying Amount
|
Accumulated Amortization
|
Net Carrying Amount
|
Gross Carrying Amount
|
Accumulated Amortization
|
Net Carrying Amount
|
||||||||||||||||||
|
(in millions)
|
|||||||||||||||||||||||
|
Finite-lived intangible assets
|
|||||||||||||||||||||||
|
Capitalized software
|
$
|
1,514
|
|
$
|
(898
|
)
|
$
|
616
|
|
$
|
1,572
|
|
$
|
(888
|
)
|
$
|
684
|
|
|||||
|
Customer relationships
|
439
|
|
(232
|
)
|
207
|
|
473
|
|
(214
|
)
|
259
|
|
|||||||||||
|
Other
|
46
|
|
(45
|
)
|
1
|
|
57
|
|
(55
|
)
|
2
|
|
|||||||||||
|
Total
|
1,999
|
|
(1,175
|
)
|
824
|
|
2,102
|
|
(1,157
|
)
|
945
|
|
|||||||||||
|
Indefinite-lived intangible assets
|
|||||||||||||||||||||||
|
Customer relationships
|
167
|
|
—
|
|
167
|
|
175
|
|
—
|
|
175
|
|
|||||||||||
|
Total
|
$
|
2,166
|
|
$
|
(1,175
|
)
|
$
|
991
|
|
$
|
2,277
|
|
$
|
(1,157
|
)
|
$
|
1,120
|
|
|||||
The decrease in the gross carrying amount of amortized intangible assets in
2018
was primarily related to the retirement of fully amortized intangible assets, partially offset by additions to capitalized software. Certain intangible assets are denominated in foreign currencies. As such, the change in intangible assets includes a component attributable to foreign currency translation. Based on the qualitative assessment performed in
2018
, it was determined that the Company’s indefinite-lived intangible assets were not impaired.
Amortization on the assets above amounted to
$250 million
,
$252 million
and
$221 million
in
2018, 2017 and 2016
, respectively. The following table sets forth the estimated future amortization expense on finite-lived intangible assets on the consolidated balance sheet at
December 31, 2018
for the years ending
December 31
:
|
(in millions)
|
|||
|
2019
|
$
|
248
|
|
|
2020
|
187
|
|
|
|
2021
|
127
|
|
|
|
2022
|
51
|
|
|
|
2023 and thereafter
|
211
|
|
|
|
$
|
824
|
|
|
Note 12.
Accrued Expenses and Accrued Litigation
Accrued expenses consisted of the following at
December 31
:
|
2018
|
2017
|
||||||
|
|
(in millions)
|
||||||
|
Customer and merchant incentives
|
$
|
3,275
|
|
$
|
2,648
|
|
|
|
Personnel costs
|
744
|
|
613
|
|
|||
|
Advertising
|
103
|
|
88
|
|
|||
|
Income and other taxes
|
158
|
|
194
|
|
|||
|
Other
|
467
|
|
388
|
|
|||
|
Total accrued expenses
|
$
|
4,747
|
|
$
|
3,931
|
|
|
Customer and merchant incentives represent amounts to be paid to customers under business agreements. The increase in customer and merchant incentives is due to the adoption of the new accounting standard pertaining to revenue recognition and timing of payments to customers. See
Note 1 (Summary of Significant Accounting Policies)
for additional information on the cumulative impact of the adoption of the revenue recognition guidance.
85
As of
December 31, 2018
and
2017
, the Company’s provision for litigation was
$1,591 million
and
$709 million
, respectively. These amounts are not included in the accrued expenses table above and are separately reported as accrued litigation on the consolidated balance sheet. See
Note 20 (Legal and Regulatory Proceedings)
for additional information regarding the Company’s accrued litigation.
Note 13.
Pension, Postretirement and Savings Plans
The Company and certain of its subsidiaries maintain various pension and other postretirement plans that cover substantially all employees worldwide.
Defined Contribution Plans
The Company sponsors defined contribution retirement plans. The primary plan is the Mastercard Savings Plan, a 401(k) plan for substantially all of the Company’s U.S. employees, which is subject to the provisions of the Employee Retirement Income Security Act of 1974 (“ERISA”), as amended. In addition, the Company has several defined contribution plans outside of the U.S. The Company’s total expense for its defined contribution plans was
$98 million
,
$84 million
and
$73 million
in
2018, 2017 and 2016
, respectively.
Defined Benefit and Other Postretirement Plans
The Company sponsors pension and postretirement plans for certain non-U.S. employees (the “non-U.S. Plans”) that cover various benefits specific to their country of employment. In 2017, the Company acquired a majority interest in Vocalink. Vocalink has a defined benefit pension plan (the “Vocalink Plan”) which was permanently closed to new entrants and future accruals as of July 21, 2013, however, plan participants’ obligations are adjusted for future salary changes. The Company has agreed to make contributions of
£15 million
(approximately
$18 million
as of
December 31, 2018
) annually until March 2020. The term “Pension Plans” includes the non-U.S. Plans and the Vocalink Plan.
The Company maintains a postretirement plan providing health coverage and life insurance benefits for substantially all of its U.S. employees hired before July 1, 2007 (the “Postretirement Plan”).
86
The Company uses a
December 31
measurement date for the Pension Plans and its Postretirement Plan (collectively the “Plans”). The Company recognizes the funded status of its Plans, measured as the difference between the fair value of the plan assets and the projected benefit obligation, in the consolidated balance sheet. The following table sets forth the Plans’ funded status, key assumptions and amounts recognized in the Company’s consolidated balance sheet at
December 31
:
|
|
Pension Plans
|
Postretirement Plan
|
|||||||||||||
|
|
2018
|
2017
|
2018
|
2017
|
|||||||||||
|
|
($ in millions)
|
||||||||||||||
|
Change in benefit obligation
|
|||||||||||||||
|
Benefit obligation at beginning of year
|
$
|
468
|
|
$
|
46
|
|
$
|
61
|
|
$
|
59
|
|
|||
|
Benefit obligation acquired during the year
|
—
|
|
410
|
|
—
|
|
—
|
|
|||||||
|
Service cost
|
9
|
|
9
|
|
1
|
|
1
|
|
|||||||
|
Interest cost
|
12
|
|
8
|
|
2
|
|
2
|
|
|||||||
|
Actuarial (gain) loss
|
(7
|
)
|
(44
|
)
|
(2
|
)
|
3
|
|
|||||||
|
Benefits paid
|
(22
|
)
|
(12
|
)
|
(5
|
)
|
(4
|
)
|
|||||||
|
Transfers in
|
1
|
|
3
|
|
—
|
|
—
|
|
|||||||
|
Foreign currency translation
|
(23
|
)
|
48
|
|
—
|
|
—
|
|
|||||||
|
Benefit obligation at end of year
|
438
|
|
468
|
|
57
|
|
61
|
|
|||||||
|
Change in plan assets
|
|||||||||||||||
|
Fair value of plan assets at beginning of year
|
427
|
|
33
|
|
—
|
|
—
|
|
|||||||
|
Fair value of plan assets acquired during the year
|
—
|
|
344
|
|
—
|
|
—
|
|
|||||||
|
Actual (loss) gain on plan assets
|
(8
|
)
|
(4
|
)
|
—
|
|
—
|
|
|||||||
|
Employer contributions
|
33
|
|
23
|
|
5
|
|
4
|
|
|||||||
|
Benefits paid
|
(23
|
)
|
(12
|
)
|
(5
|
)
|
(4
|
)
|
|||||||
|
Transfers in
|
2
|
|
3
|
|
—
|
|
—
|
|
|||||||
|
Foreign currency translation
|
(21
|
)
|
40
|
|
—
|
|
—
|
|
|||||||
|
Fair value of plan assets at end of year
|
410
|
|
427
|
|
—
|
|
—
|
|
|||||||
|
Funded status at end of year
|
$
|
(28
|
)
|
$
|
(41
|
)
|
$
|
(57
|
)
|
$
|
(61
|
)
|
|||
|
Amounts recognized on the consolidated balance sheet consist of:
|
|||||||||||||||
|
Other liabilities, short-term
|
$
|
—
|
|
$
|
—
|
|
$
|
(3
|
)
|
$
|
(3
|
)
|
|||
|
Other liabilities, long-term
|
(28
|
)
|
(41
|
)
|
(54
|
)
|
(58
|
)
|
|||||||
|
$
|
(28
|
)
|
$
|
(41
|
)
|
$
|
(57
|
)
|
$
|
(61
|
)
|
||||
|
Accumulated other comprehensive income consists of:
|
|||||||||||||||
|
Net actuarial (gain) loss
|
$
|
(5
|
)
|
$
|
(22
|
)
|
$
|
(7
|
)
|
$
|
(5
|
)
|
|||
|
Prior service credit
|
1
|
|
—
|
|
(6
|
)
|
(8
|
)
|
|||||||
|
Balance at end of year
|
$
|
(4
|
)
|
$
|
(22
|
)
|
$
|
(13
|
)
|
$
|
(13
|
)
|
|||
|
Weighted-average assumptions used to determine end of year benefit obligations
|
|||||||||||||||
|
Discount rate
|
|||||||||||||||
|
Non-U.S. Plans
|
1.80
|
%
|
1.80
|
%
|
*
|
|
*
|
|
|||||||
|
Vocalink Plan
|
3.10
|
%
|
2.80
|
%
|
*
|
|
*
|
|
|||||||
|
Postretirement Plan
|
*
|
|
*
|
|
4.25
|
%
|
3.50
|
%
|
|||||||
|
Rate of compensation increase
|
|||||||||||||||
|
Non-U.S. Plans
|
2.60
|
%
|
2.60
|
%
|
*
|
|
*
|
|
|||||||
|
Vocalink Plan
|
4.00
|
%
|
3.85
|
%
|
*
|
|
*
|
|
|||||||
|
Postretirement Plan
|
*
|
|
*
|
|
3.00
|
%
|
3.00
|
%
|
|||||||
* Not applicable
87
Each of the Pension Plans had benefit obligations in excess of plan assets at
December 31, 2018 and 2017
. Information on the Pension Plans were as follows:
|
2018
|
2017
|
|||||||
|
(in millions)
|
||||||||
|
Projected benefit obligation
|
$
|
438
|
|
$
|
468
|
|
||
|
Accumulated benefit obligation
|
430
|
|
428
|
|
||||
|
Fair value of plan assets
|
410
|
|
427
|
|
||||
For the year ended December 31, 2018, the Company’s projected benefit obligation related to its Pension Plans decreased
$30 million
attributable primarily to foreign currency translation and benefits paid. For the year ended December 31, 2017, the Company’s projected benefit obligation related to its Pension Plans increased
$422 million
attributable primarily to the acquisition of Vocalink.
Components of net periodic benefit cost recorded in earnings were as follows for the Plans for each of the years ended
December 31
:
|
Pension Plans
|
Postretirement Plan
|
|||||||||||||||||||||||
|
2018
|
2017
|
2016
|
2018
|
2017
|
2016
|
|||||||||||||||||||
|
(in millions)
|
||||||||||||||||||||||||
|
Service cost
|
$
|
9
|
|
$
|
9
|
|
$
|
10
|
|
$
|
1
|
|
$
|
1
|
|
$
|
1
|
|
||||||
|
Interest cost
|
12
|
|
8
|
|
1
|
|
2
|
|
2
|
|
2
|
|
||||||||||||
|
Expected return on plan assets
|
(20
|
)
|
(13
|
)
|
(1
|
)
|
—
|
|
—
|
|
—
|
|
||||||||||||
|
Curtailment gain
|
—
|
|
—
|
|
—
|
|
—
|
|
—
|
|
—
|
|
||||||||||||
|
Amortization of actuarial loss
|
—
|
|
—
|
|
—
|
|
—
|
|
—
|
|
—
|
|
||||||||||||
|
Amortization of prior service credit
|
—
|
|
—
|
|
—
|
|
(2
|
)
|
(2
|
)
|
(1
|
)
|
||||||||||||
|
Pension settlement charge
|
—
|
|
—
|
|
—
|
|
—
|
|
—
|
|
—
|
|
||||||||||||
|
Net periodic benefit cost
|
$
|
1
|
|
$
|
4
|
|
$
|
10
|
|
$
|
1
|
|
$
|
1
|
|
$
|
2
|
|
||||||
Net periodic benefit cost, excluding the service cost component, is recognized in other income (expense) on the consolidated statement of operations. The service cost component is recognized in general and administrative expenses on the consolidated statement of operations.
Other changes in plan assets and benefit obligations recognized in other comprehensive income for the years ended
December 31
were as follows:
|
Pension Plans
|
Postretirement Plan
|
|||||||||||||||||||||||
|
2018
|
2017
|
2016
|
2018
|
2017
|
2016
|
|||||||||||||||||||
|
(in millions)
|
||||||||||||||||||||||||
|
Curtailment gain
|
$
|
—
|
|
$
|
—
|
|
$
|
—
|
|
$
|
—
|
|
$
|
—
|
|
$
|
—
|
|
||||||
|
Current year actuarial loss (gain)
|
17
|
|
(22
|
)
|
1
|
|
(2
|
)
|
5
|
|
—
|
|
||||||||||||
|
Current year prior service credit
|
1
|
|
—
|
|
—
|
|
—
|
|
—
|
|
—
|
|
||||||||||||
|
Amortization of prior service credit
|
—
|
|
—
|
|
—
|
|
2
|
|
2
|
|
1
|
|
||||||||||||
|
Pension settlement charge
|
—
|
|
—
|
|
—
|
|
—
|
|
—
|
|
—
|
|
||||||||||||
|
Total other comprehensive loss (income)
|
$
|
18
|
|
$
|
(22
|
)
|
$
|
1
|
|
$
|
—
|
|
$
|
7
|
|
$
|
1
|
|
||||||
|
Total net periodic benefit cost and other comprehensive loss (income)
|
$
|
19
|
|
$
|
(18
|
)
|
$
|
11
|
|
$
|
1
|
|
$
|
8
|
|
$
|
3
|
|
||||||
88
Assumptions
Weighted-average assumptions used to determine net periodic benefit cost were as follows for the years ended
December 31
:
|
Pension Plans
|
Postretirement Plan
|
|||||||||||||||||
|
2018
|
2017
|
2016
|
2018
|
2017
|
2016
|
|||||||||||||
|
Discount rate
|
||||||||||||||||||
|
Non-U.S. Plans
|
1.80
|
%
|
1.60
|
%
|
1.85
|
%
|
*
|
|
*
|
|
*
|
|
||||||
|
Vocalink Plan
|
2.80
|
%
|
2.50
|
%
|
*
|
|
*
|
|
*
|
|
*
|
|
||||||
|
Postretirement Plan
|
*
|
|
*
|
|
*
|
|
3.50
|
%
|
4.00
|
%
|
4.25
|
%
|
||||||
|
Expected return on plan assets
|
||||||||||||||||||
|
Non-U.S. Plans
|
3.00
|
%
|
3.25
|
%
|
3.25
|
%
|
*
|
|
*
|
|
*
|
|
||||||
|
Vocalink Plan
|
4.75
|
%
|
4.75
|
%
|
*
|
|
*
|
|
*
|
|
*
|
|
||||||
|
Rate of compensation increase
|
||||||||||||||||||
|
Non-U.S. Plans
|
2.60
|
%
|
2.59
|
%
|
2.64
|
%
|
*
|
|
*
|
|
*
|
|
||||||
|
Vocalink Plan
|
3.85
|
%
|
3.95
|
%
|
*
|
|
*
|
|
*
|
|
*
|
|
||||||
|
Postretirement Plan
|
*
|
|
*
|
|
*
|
|
3.00
|
%
|
3.00
|
%
|
3.00
|
%
|
||||||
* Not applicable
The Company’s discount rate assumptions are based on yield curves derived from high quality corporate bonds, which are matched to the expected cash flows of each respective plan. The expected return on plan assets assumptions are derived using the current and expected asset allocations of the Pension Plans’ assets and considering historical as well as expected returns on various classes of plan assets. The rates of compensation increases are determined by the Company, based upon its long-term plans for such increases.
The following additional assumptions were used at
December 31
in accounting for the Postretirement Plan:
|
2018
|
2017
|
|||||
|
Health care cost trend rate assumed for next year
|
6.00
|
%
|
6.50
|
%
|
||
|
Ultimate trend rate
|
5.00
|
%
|
5.00
|
%
|
||
|
Year that the rate reaches the ultimate trend rate
|
2
|
|
3
|
|
||
Assets
Plan assets are managed taking into account the timing and amount of future benefit payments.
The Vocalink Plan assets are managed within the following target asset allocations: non-government fixed income
39%
, government securities (including U.K. governmental bonds)
28%
, investment funds
25%
and other
8%
. The investment funds are currently comprised of approximately
44%
derivatives,
28%
equity,
16%
fixed income and
12%
other. For the non-U.S. Plans, the assets are concentrated primarily in insurance contracts.
The Valuation Hierarchy of the Pension Plans’ assets is determined using a consistent application of the categorization measurements for the Company’s financial instruments. See
Note 1 (Summary of Significant Accounting Policies)
for additional information.
Cash and cash equivalents and other public investment vehicles (including certain mutual funds and government and agency securities) are valued at quoted market prices, which represent the net asset value of the shares held by the Vocalink Plan, and are therefore included in Level 1 of the Valuation Hierarchy. Certain other mutual funds (including commingled funds), governmental and agency securities and insurance contracts are valued at unit values provided by investment managers, which are based on the fair value of the underlying investments utilizing public information, independent external valuation from third-party services or third-party advisors, and are therefore included in Level 2 of the Valuation Hierarchy. Asset-backed securities are classified as Level 3 due to a lack of observable inputs in measuring fair value.
89
The following tables set forth by level, within the Valuation Hierarchy, the Pension Plans’ assets at fair value as of
December 31, 2018 and 2017
:
|
December 31, 2018
|
December 31, 2017
|
||||||||||||||||||||||||||||||
|
Quoted Prices in Active Markets (Level 1)
|
Significant Other Observable Inputs (Level 2)
|
Significant
Unobservable Inputs (Level 3) |
Fair Value
|
Quoted Prices in Active Markets (Level 1)
|
Significant Other Observable Inputs (Level 2)
|
Significant
Unobservable Inputs (Level 3) |
Fair Value
|
||||||||||||||||||||||||
|
(in millions)
|
|||||||||||||||||||||||||||||||
|
Cash and cash equivalents
|
$
|
22
|
|
$
|
—
|
|
$
|
—
|
|
$
|
22
|
|
$
|
21
|
|
$
|
—
|
|
$
|
—
|
|
$
|
21
|
|
|||||||
|
Government and agency securities
|
—
|
|
88
|
|
—
|
|
88
|
|
21
|
|
95
|
|
—
|
|
116
|
|
|||||||||||||||
|
Mutual funds
|
154
|
|
30
|
|
—
|
|
184
|
|
146
|
|
28
|
|
—
|
|
174
|
|
|||||||||||||||
|
Insurance contracts
|
—
|
|
57
|
|
—
|
|
57
|
|
—
|
|
45
|
|
—
|
|
45
|
|
|||||||||||||||
|
Asset-backed securities
|
—
|
|
—
|
|
34
|
|
34
|
|
—
|
|
—
|
|
31
|
|
31
|
|
|||||||||||||||
|
Other
|
—
|
|
25
|
|
—
|
|
25
|
|
2
|
|
16
|
|
22
|
|
40
|
|
|||||||||||||||
|
Total
|
$
|
176
|
|
$
|
200
|
|
$
|
34
|
|
$
|
410
|
|
$
|
190
|
|
$
|
184
|
|
$
|
53
|
|
$
|
427
|
|
|||||||
The following table summarizes expected benefit payments through 2028 for the Pension Plans and the Postretirement Plan, including those payments expected to be paid from the Company’s general assets. Actual benefit payments may differ from expected benefit payments.
|
Pension Plans
|
Postretirement Plan
|
|||||||
|
(in millions)
|
||||||||
|
2019
|
$
|
14
|
|
$
|
3
|
|
||
|
2020
|
10
|
|
4
|
|
||||
|
2021
|
11
|
|
4
|
|
||||
|
2022
|
14
|
|
4
|
|
||||
|
2023
|
13
|
|
4
|
|
||||
|
2024 - 2028
|
64
|
|
20
|
|
||||
90
Note 14.
Debt
Long-term debt consisted of the following at December 31:
|
Notes
|
Issuance
Date
|
Interest Payment Terms
|
Maturity
Date
|
Aggregate Principal Amount
|
Stated
Interest Rate
|
Effective
Interest Rate
|
2018
|
2017
|
||||||||||||||||
|
(in millions, except percentages)
|
||||||||||||||||||||||||
|
2018 USD Notes
|
February 2018
|
Semi-annually
|
2028
|
$
|
500
|
|
3.500
|
%
|
3.598
|
%
|
$
|
500
|
|
$
|
—
|
|
||||||||
|
2048
|
$
|
500
|
|
3.950
|
%
|
3.990
|
%
|
500
|
|
—
|
|
|||||||||||||
|
$
|
1,000
|
|
||||||||||||||||||||||
|
2016 USD Notes
|
November 2016
|
Semi-annually
|
2021
|
$
|
650
|
|
2.000
|
%
|
2.236
|
%
|
650
|
|
650
|
|
||||||||||
|
2026
|
750
|
|
2.950
|
%
|
3.044
|
%
|
750
|
|
750
|
|
||||||||||||||
|
2046
|
600
|
|
3.800
|
%
|
3.893
|
%
|
600
|
|
600
|
|
||||||||||||||
|
$
|
2,000
|
|
||||||||||||||||||||||
|
2015 Euro Notes
|
December 2015
|
Annually
|
2022
|
€
|
700
|
|
1.100
|
%
|
1.265
|
%
|
801
|
|
839
|
|
||||||||||
|
2027
|
800
|
|
2.100
|
%
|
2.189
|
%
|
916
|
|
958
|
|
||||||||||||||
|
2030
|
150
|
|
2.500
|
%
|
2.562
|
%
|
172
|
|
180
|
|
||||||||||||||
|
€
|
1,650
|
|
||||||||||||||||||||||
|
2014 USD Notes
|
March 2014
|
Semi-annually
|
2019
|
$
|
500
|
|
2.000
|
%
|
2.178
|
%
|
500
|
|
500
|
|
||||||||||
|
2024
|
1,000
|
|
3.375
|
%
|
3.484
|
%
|
1,000
|
|
1,000
|
|
||||||||||||||
|
$
|
1,500
|
|
||||||||||||||||||||||
|
6,389
|
|
5,477
|
|
|||||||||||||||||||||
|
Less: Unamortized discount and debt issuance costs
|
(55
|
)
|
(53
|
)
|
||||||||||||||||||||
|
Total debt outstanding
|
6,334
|
|
5,424
|
|
||||||||||||||||||||
|
Less: Current portion
1
|
(500
|
)
|
—
|
|
||||||||||||||||||||
|
Long-term debt
|
$
|
5,834
|
|
$
|
5,424
|
|
||||||||||||||||||
1
Relates to the current portion of the 2014 USD Notes, due in April 2019, classified as current portion of long-term debt on the consolidated balance sheet.
In February 2018, the Company issued
$500 million
principal amount of notes due February 2028 and
$500 million
principal amount of notes due February 2048 (collectively the “2018 USD Notes”). The net proceeds from the issuance of the 2018 USD Notes, after deducting the original issue discount, underwriting discount and offering expenses, were
$991 million
.
The net proceeds, after deducting the original issue discount, underwriting discount and offering expenses, from the issuance of the 2016 USD Notes, the 2015 Euro Notes and the 2014 USD Notes, were
$1.969 billion
,
$1.723 billion
and
$1.484 billion
, respectively.
The outstanding debt, described above, is not subject to any financial covenants and it may be redeemed in whole, or in part, at the Company’s option at any time for a specified make-whole amount. These notes are senior unsecured obligations and would rank equally with any future unsecured and unsubordinated indebtedness. The proceeds of the notes are to be used for general corporate purposes.
91
Scheduled annual maturities of the principal portion of long-term debt outstanding at
December 31, 2018
are summarized below.
|
(in millions)
|
|||
|
2019
|
$
|
500
|
|
|
2020
|
—
|
|
|
|
2021
|
650
|
|
|
|
2022
|
801
|
|
|
|
2023
|
—
|
|
|
|
Thereafter
|
4,438
|
|
|
|
Total
|
$
|
6,389
|
|
On November 15, 2018, the Company increased its commercial paper program (the “Commercial Paper Program”) from
$3.75 billion
to
$4.5 billion
under which the Company is authorized to issue unsecured commercial paper notes with maturities of up to
397
days from the date of issuance. The Commercial Paper Program is available in U.S. dollars.
In conjunction with the Commercial Paper Program, the Company entered into a committed five-year unsecured
$4.5 billion
revolving credit facility (the “Credit Facility”) on November 15, 2018. The Credit Facility, which expires on November 15, 2023, amended and restated the Company’s prior
$3.75 billion
credit facility which was set to expire in October 2022. Borrowings under the Credit Facility are available in U.S. dollars and/or euros. The facility fee under the Credit Facility is determined according to the Company’s credit rating and is payable on the average daily commitment, regardless of usage, per annum. In addition to the facility fee, interest rates on borrowings under the Credit Facility would be based on prevailing market interest rates plus applicable margins that fluctuate based on the Company’s credit rating. The Credit Facility contains customary representations, warranties, events of default and affirmative and negative covenants, including a financial covenant limiting the maximum level of consolidated debt to earnings before interest, taxes, depreciation and amortization (“EBITDA”). The Company was in compliance in all material respects with the covenants of the Credit Facility at
December 31, 2018
and
2017
. The majority of Credit Facility lenders are customers or affiliates of customers of Mastercard.
Borrowings under the Commercial Paper Program and the Credit Facility are used to provide liquidity for general corporate purposes, including providing liquidity in the event of one or more settlement failures by the Company’s customers. The Company may borrow and repay amounts under the Commercial Paper Program and Credit Facility from time to time. The Company had no borrowings under the Credit Facility and the Commercial Paper Program at
December 31, 2018
and
2017
.
In March 2018, the Company filed a universal shelf registration statement (replacing a previously filed shelf registration statement that was set to expire) to provide additional access to capital, if needed. Pursuant to the shelf registration statement, the Company may from time to time offer to sell debt securities, guarantees of debt securities, preferred stock, Class A common stock, depository shares, purchase contracts, units or warrants in one or more offerings.
Note 15.
Stockholders’ Equity
Classes of Capital Stock
Mastercard’s amended and restated certificate of incorporation authorizes the following classes of capital stock:
|
Class
|
Par Value Per Share
|
Authorized Shares
(in millions)
|
Dividend and Voting Rights
|
||||
|
A
|
$0.0001
|
3,000
|
|
One vote per share
Dividend rights |
|||
|
B
|
$0.0001
|
1,200
|
|
Non-voting
Dividend rights |
|||
|
Preferred
|
$0.0001
|
300
|
|
No shares issued or outstanding at December 31, 2018 and 2017, respectively. Dividend and voting rights are to be determined by the Board of Directors of the Company upon issuance.
|
|||
92
Ownership and Governance Structure
Equity ownership and voting power of the Company’s shares were allocated as follows as of
December 31
:
|
2018
|
2017
|
||||||||||
|
Equity Ownership
|
General Voting Power
|
Equity Ownership
|
General Voting Power
|
||||||||
|
Public Investors (Class A stockholders)
|
88.0
|
%
|
89.0
|
%
|
88.0
|
%
|
89.2
|
%
|
|||
|
Principal or Affiliate Customers (Class B stockholders)
|
1.1
|
%
|
—
|
%
|
1.4
|
%
|
—
|
%
|
|||
|
Mastercard Foundation (Class A stockholders)
|
10.9
|
%
|
11.0
|
%
|
10.6
|
%
|
10.8
|
%
|
|||
Class B Common Stock Conversions
Shares of Class B common stock are convertible on a one-for-one basis into shares of Class A common stock. Entities eligible to hold Mastercard’s Class B common stock are defined in the Company’s amended and restated certificate of incorporation (generally the Company’s principal or affiliate customers), and they are restricted from retaining ownership of shares of Class A common stock. Class B stockholders are required to subsequently sell or otherwise transfer any shares of Class A common stock received pursuant to such a conversion.
Mastercard Foundation
In connection and simultaneously with its 2006 initial public offering (the “IPO”), the Company issued and donated
135 million
newly authorized shares of Class A common stock to Mastercard Foundation. Mastercard Foundation is a private charitable foundation incorporated in Canada that is controlled by directors who are independent of the Company and its principal customers. Under the terms of the donation, Mastercard Foundation became able to resell the donated shares in May 2010 to the extent necessary to meet charitable disbursement requirements dictated by Canadian tax law. Under Canadian tax law, Mastercard Foundation is generally required to disburse at least
3.5%
of its assets not used in administration each year for qualified charitable disbursements. However, Mastercard Foundation obtained permission from the Canadian tax authorities to defer the giving requirements until 2021. Mastercard Foundation, at its discretion, may decide to meet its disbursement obligations on an annual basis or to settle previously accumulated obligations during any given year. Mastercard Foundation will be permitted to sell all of its remaining shares beginning May 1, 2027, subject to certain conditions.
Stock Repurchase Programs
The Company’s Board of Directors have approved share repurchase programs authorizing the Company to repurchase shares of its Class A Common Stock. These programs become effective after the completion of the previously authorized share repurchase program.
93
The following table summarizes the Company’s share repurchase authorizations of its Class A common stock through
December 31, 2018
, as well as historical purchases:
|
Board authorization dates
|
December
2018 |
December
2017 |
December
2016 |
December
2015
|
December
2014
|
||||||||||||||||||
|
Date program became effective
|
January 2019
|
March 2018
|
April 2017
|
February 2016
|
January 2015
|
Total
|
|||||||||||||||||
|
(in millions, except average price data)
|
|||||||||||||||||||||||
|
Board authorization
|
$
|
6,500
|
|
$
|
4,000
|
|
$
|
4,000
|
|
$
|
4,000
|
|
$
|
3,750
|
|
$
|
22,250
|
|
|||||
|
Dollar-value of shares repurchased in 2016
|
$
|
—
|
|
$
|
—
|
|
$
|
—
|
|
$
|
3,004
|
|
$
|
507
|
|
$
|
3,511
|
|
|||||
|
Remaining authorization at December 31, 2016
|
$
|
—
|
|
$
|
—
|
|
$
|
4,000
|
|
$
|
996
|
|
$
|
—
|
|
$
|
4,996
|
|
|||||
|
Dollar-value of shares repurchased in 2017
|
$
|
—
|
|
$
|
—
|
|
$
|
2,766
|
|
$
|
996
|
|
$
|
—
|
|
$
|
3,762
|
|
|||||
|
Remaining authorization at December 31, 2017
|
$
|
—
|
|
$
|
4,000
|
|
$
|
1,234
|
|
$
|
—
|
|
$
|
—
|
|
$
|
5,234
|
|
|||||
|
Dollar-value of shares repurchased in 2018
|
$
|
—
|
|
$
|
3,699
|
|
$
|
1,234
|
|
$
|
—
|
|
$
|
—
|
|
$
|
4,933
|
|
|||||
|
Remaining authorization at December 31, 2018
|
$
|
6,500
|
|
$
|
301
|
|
$
|
—
|
|
$
|
—
|
|
$
|
—
|
|
$
|
6,801
|
|
|||||
|
Shares repurchased in 2016
|
—
|
|
—
|
|
—
|
|
31.2
|
|
5.7
|
|
36.9
|
|
|||||||||||
|
Average price paid per share in 2016
|
$
|
—
|
|
$
|
—
|
|
$
|
—
|
|
$
|
96.15
|
|
$
|
89.76
|
|
$
|
95.18
|
|
|||||
|
Shares repurchased in 2017
|
—
|
|
—
|
|
21.0
|
|
9.1
|
|
—
|
|
30.1
|
|
|||||||||||
|
Average price paid per share in 2017
|
$
|
—
|
|
$
|
—
|
|
$
|
131.97
|
|
$
|
109.16
|
|
$
|
—
|
|
$
|
125.05
|
|
|||||
|
Shares repurchased in 2018
|
—
|
|
19.0
|
|
7.2
|
|
—
|
|
—
|
|
26.2
|
|
|||||||||||
|
Average price paid per share in 2018
|
$
|
—
|
|
$
|
194.77
|
|
$
|
171.11
|
|
$
|
—
|
|
$
|
—
|
|
$
|
188.26
|
|
|||||
|
Cumulative shares repurchased through December 31, 2018
|
—
|
|
19.0
|
|
28.2
|
|
40.4
|
|
40.8
|
|
128.4
|
|
|||||||||||
|
Cumulative average price paid per share
|
$
|
—
|
|
$
|
194.77
|
|
$
|
141.99
|
|
$
|
99.10
|
|
$
|
92.03
|
|
$
|
120.44
|
|
|||||
The following table presents the changes in the Company’s outstanding Class A and Class B common stock for the years ended
December 31
:
|
|
Outstanding Shares
|
||||
|
|
Class A
|
Class B
|
|||
|
(in millions)
|
|||||
|
Balance at December 31, 2015
|
1,095.0
|
|
21.3
|
|
|
|
Purchases of treasury stock
|
(36.9
|
)
|
—
|
|
|
|
Share-based payments
|
2.3
|
|
—
|
|
|
|
Conversion of Class B to Class A common stock
|
2.0
|
|
(2.0
|
)
|
|
|
Balance at December 31, 2016
|
1,062.4
|
|
19.3
|
|
|
|
Purchases of treasury stock
|
(30.1
|
)
|
—
|
|
|
|
Share-based payments
|
2.2
|
|
—
|
|
|
|
Conversion of Class B to Class A common stock
|
5.2
|
|
(5.2
|
)
|
|
|
Balance at December 31, 2017
|
1,039.7
|
|
14.1
|
|
|
|
Purchases of treasury stock
|
(26.2
|
)
|
—
|
|
|
|
Share-based payments
|
2.8
|
|
—
|
|
|
|
Conversion of Class B to Class A common stock
|
2.3
|
|
(2.3
|
)
|
|
|
Balance at December 31, 2018
|
1,018.6
|
|
11.8
|
|
|
94
Note 16.
Accumulated Other Comprehensive Income (Loss)
The changes in the balances of each component of accumulated other comprehensive income (loss), net of tax, for the years ended
December 31, 2018 and 2017
were as follows:
|
Foreign Currency Translation Adjustments
1
|
Translation Adjustments on Net Investment Hedge
|
Defined Benefit Pension and Other Postretirement Plans
2
|
Investment Securities Available-for-Sale
3
|
Accumulated Other Comprehensive Income (Loss)
|
|||||||||||||||
|
(in millions)
|
|||||||||||||||||||
|
Balance at December 31, 2016
|
$
|
(949
|
)
|
$
|
12
|
|
$
|
11
|
|
$
|
2
|
|
$
|
(924
|
)
|
||||
|
Other comprehensive income (loss)
|
567
|
|
(153
|
)
|
14
|
|
(1
|
)
|
427
|
|
|||||||||
|
Balance at December 31, 2017
|
(382
|
)
|
(141
|
)
|
25
|
|
1
|
|
(497
|
)
|
|||||||||
|
Other comprehensive income (loss)
|
(279
|
)
|
75
|
|
(15
|
)
|
(2
|
)
|
(221
|
)
|
|||||||||
|
Balance at December 31, 2018
|
$
|
(661
|
)
|
$
|
(66
|
)
|
$
|
10
|
|
$
|
(1
|
)
|
$
|
(718
|
)
|
||||
1
During 2017, the decrease in the accumulated other comprehensive loss related to foreign currency translation adjustments was driven primarily by the appreciation of the euro.
During 2018, the increase in the accumulated other comprehensive loss related to foreign currency translation adjustments was driven primarily by the devaluation of the euro, British pound and Brazilian real.
2
During 2017, the increase in the accumulated other comprehensive gain related to the Company’s postretirement plans was driven primarily by the addition of the Vocalink Plan. Deferred gains related to the Company’s postretirement plans, reclassified from accumulated other comprehensive income (loss) to earnings, were
$2 million
before tax and
$1 million
after tax. During 2018, the decrease in the accumulated other comprehensive gain related to the Company’s postretirement plans was driven primarily by an actuarial loss related to the Vocalink Plan. Deferred gains related to the Company’s postretirement plans, reclassified from accumulated other comprehensive income (loss) to earnings, were
$1 million
before and after tax. See
Note 13 (Pension, Postretirement and Savings Plans)
for additional information.
3
During 2017 and 2018, gains and losses on available-for-sale investment securities, reclassified from accumulated other comprehensive income (loss) to investment income, were not significant.
Note 17.
Share-Based Payments
In May 2006, the Company implemented the Mastercard Incorporated 2006 Long Term Incentive Plan, which was amended and restated as of June 5, 2012 (the “LTIP”). The LTIP is a stockholder-approved plan that permits the grant of various types of equity awards to employees.
The Company has granted Options, RSUs and PSUs under the LTIP. The Options, which expire
ten years
from the date of grant, generally vest ratably over
four years
from the date of grant. The RSUs and PSUs generally vest after
three years
. The Company uses the straight-line method of attribution for expensing equity awards. Compensation expense is recorded net of estimated forfeitures. Estimates are adjusted as appropriate.
For all awards granted prior to March 2017, a participant’s unvested awards are forfeited upon termination of employment. For all awards granted on or after March 1, 2017, in the event of termination due to job elimination (as defined by the Company), a participant will retain a pro-rata portion of the unvested awards for services performed through the date of termination. In the event a participant terminates employment due to disability or retirement more than
six months
(
seven months
for those granted on or after March 1, 2017) after receiving the award, the participant retains all of their awards without providing additional service to the Company. Retirement eligibility is dependent upon age and years of service. Compensation expense is recognized over the shorter of the vesting periods stated in the LTIP or the date the individual becomes eligible to retire but not less than
six months
(or
seven months
for grants awarded on or after March 1, 2017).
There are approximately
116 million
shares of Class A common stock authorized for equity awards under the LTIP. Although the LTIP permits the issuance of shares of Class B common stock, no such shares have been authorized for issuance. Shares issued as a result of Option exercises and the conversions of RSUs and PSUs were funded primarily with the issuance of new shares of Class A common stock.
95
Stock Options
The fair value of each Option is estimated on the date of grant using a Black-Scholes option pricing model. The following table presents the weighted-average assumptions used in the valuation and the resulting weighted-average fair value per option granted for the years ended December 31:
|
2018
|
2017
|
2016
|
|||||||||
|
Risk-free rate of return
|
2.7
|
%
|
2.0
|
%
|
1.3
|
%
|
|||||
|
Expected term (in years)
|
6.00
|
|
5.00
|
|
5.00
|
|
|||||
|
Expected volatility
|
19.7
|
%
|
19.3
|
%
|
23.3
|
%
|
|||||
|
Expected dividend yield
|
0.6
|
%
|
0.8
|
%
|
0.8
|
%
|
|||||
|
Weighted-average fair value per Option granted
|
$
|
40.90
|
|
$
|
21.23
|
|
$
|
18.58
|
|
||
The risk-free rate of return was based on the U.S. Treasury yield curve in effect on the date of grant. The expected term and the expected volatility were based on historical Mastercard information. The expected dividend yields were based on the Company’s expected annual dividend rate on the date of grant.
The following table summarizes the Company’s option activity for the year ended
December 31, 2018
:
|
Options
|
Weighted-Average Exercise Price
|
Weighted-Average Remaining Contractual Term
|
Aggregate Intrinsic Value
|
|||||||||
|
(in millions)
|
(in years)
|
(in millions)
|
||||||||||
|
Outstanding at January 1, 2018
|
8.6
|
|
$
|
77
|
|
|||||||
|
Granted
|
0.9
|
|
$
|
173
|
|
|||||||
|
Exercised
|
(1.8
|
)
|
$
|
57
|
|
|||||||
|
Forfeited/expired
|
(0.1
|
)
|
$
|
112
|
|
|||||||
|
Outstanding at December 31, 2018
|
7.6
|
|
$
|
93
|
|
6.4
|
$
|
726
|
|
|||
|
Exercisable at December 31, 2018
|
4.3
|
|
$
|
72
|
|
5.2
|
$
|
505
|
|
|||
|
Options vested and expected to vest at December 31, 2018
|
7.6
|
|
$
|
93
|
|
6.4
|
$
|
723
|
|
|||
As of
December 31, 2018
, there was
$34 million
of total unrecognized compensation cost related to non-vested Options. The cost is expected to be recognized over a weighted-average period of
2.1 years
.
Restricted Stock Units
The following table summarizes the Company’s RSU activity for the year ended
December 31, 2018
:
|
Units
|
Weighted-Average Grant-Date Fair Value
|
Aggregate Intrinsic Value
|
||||||||
|
(in millions)
|
(in millions)
|
|||||||||
|
Outstanding at January 1, 2018
|
4.1
|
|
$
|
97
|
|
|||||
|
Granted
|
0.9
|
|
$
|
171
|
|
|||||
|
Converted
|
(1.1
|
)
|
$
|
90
|
|
|||||
|
Forfeited
|
(0.2
|
)
|
$
|
110
|
|
|||||
|
Outstanding at December 31, 2018
|
3.7
|
|
$
|
117
|
|
$
|
702
|
|
||
|
RSUs expected to vest at December 31, 2018
|
3.6
|
|
$
|
116
|
|
$
|
680
|
|
||
The fair value of each RSU is the closing stock price on the New York Stock Exchange of the Company’s Class A common stock on the date of grant, adjusted for the exclusion of dividend equivalents. Upon vesting, a portion of the RSU award may be withheld to satisfy the minimum statutory withholding taxes. The remaining RSUs will be settled in shares of the Company’s Class A
96
common stock after the vesting period. As of
December 31, 2018
, there was
$153 million
of total unrecognized compensation cost related to non-vested RSUs. The cost is expected to be recognized over a weighted-average period of
1.7 years
.
Performance Stock Units
The following table summarizes the Company’s PSU activity for the year ended
December 31, 2018
:
|
Units
|
Weighted-Average
Grant-Date Fair Value
|
Aggregate Intrinsic Value
|
||||||||
|
(in millions)
|
(in millions)
|
|||||||||
|
Outstanding at January 1, 2018
|
0.5
|
|
$
|
105
|
|
|||||
|
Granted
|
0.1
|
|
$
|
226
|
|
|||||
|
Converted
|
(0.3
|
)
|
$
|
99
|
|
|||||
|
Other
1
|
0.3
|
|
$
|
94
|
|
|||||
|
Outstanding at December 31, 2018
|
0.6
|
|
$
|
120
|
|
$
|
119
|
|
||
|
PSUs expected to vest at December 31, 2018
|
0.6
|
|
$
|
119
|
|
$
|
118
|
|
||
1
Represents additional shares issued in March 2018 related to the 2015 PSU grant based on performance and market conditions achieved over the three-year measurement period. These shares vested upon issuance.
Since 2013, PSUs containing performance and market conditions have been issued. Performance measures used to determine the actual number of shares that vest after three years include net revenue growth, EPS growth and relative total shareholder return (“TSR”). Relative TSR is considered a market condition, while net revenue and EPS growth are considered performance conditions. The Monte Carlo simulation valuation model is used to determine the grant-date fair value.
Compensation expenses for PSUs are recognized over the requisite service period if it is probable that the performance target will be achieved and subsequently adjusted if the probability assessment changes. As of
December 31, 2018
, there was
$13 million
of total unrecognized compensation cost related to non-vested PSUs. The cost is expected to be recognized over a weighted-average period of
1.3 years
.
Additional Information
The following table includes additional share-based payment information for each of the years ended December 31:
|
2018
|
2017
|
2016
|
|||||||||
|
(in millions, except weighted-average fair value)
|
|||||||||||
|
Share-based compensation expense: Options, RSUs and PSUs
|
$
|
196
|
|
$
|
176
|
|
$
|
148
|
|
||
|
Income tax benefit recognized for equity awards
|
41
|
|
57
|
|
49
|
|
|||||
|
Income tax benefit realized related to Options exercised
|
53
|
|
36
|
|
31
|
|
|||||
|
Options:
|
|||||||||||
|
Total intrinsic value of Options exercised
|
242
|
|
106
|
|
86
|
|
|||||
|
RSUs:
|
|||||||||||
|
Weighted-average grant-date fair value of awards granted
|
171
|
|
112
|
|
91
|
|
|||||
|
Total intrinsic value of RSUs converted into shares of Class A common stock
|
194
|
|
131
|
|
122
|
|
|||||
|
PSUs:
|
|||||||||||
|
Weighted-average grant-date fair value of awards granted
|
226
|
|
126
|
|
92
|
|
|||||
|
Total intrinsic value of PSUs converted into shares of Class A common stock
|
40
|
|
13
|
|
25
|
|
|||||
97
Note 18.
Commitments
At
December 31, 2018
, the Company had the following future minimum payments due under non-cancelable agreements:
|
Total
|
Capital
Leases |
Operating
Leases
|
Sponsorship,
Licensing &
Other
|
||||||||||||
|
|
(in millions)
|
||||||||||||||
|
2019
|
$
|
426
|
|
$
|
4
|
|
$
|
72
|
|
$
|
350
|
|
|||
|
2020
|
259
|
|
4
|
|
75
|
|
180
|
|
|||||||
|
2021
|
175
|
|
—
|
|
76
|
|
99
|
|
|||||||
|
2022
|
121
|
|
—
|
|
68
|
|
53
|
|
|||||||
|
2023
|
67
|
|
—
|
|
58
|
|
9
|
|
|||||||
|
Thereafter
|
327
|
|
—
|
|
327
|
|
—
|
|
|||||||
|
Total
|
$
|
1,375
|
|
$
|
8
|
|
$
|
676
|
|
$
|
691
|
|
|||
Included in the table above are capital leases with a net present value of minimum lease payments of
$8 million
. In addition, at
December 31, 2018
,
$25 million
of the future minimum payments in the table above for sponsorship, licensing and other agreements was accrued. Consolidated rental expense for the Company’s leased office space was
$94 million
,
$77 million
and
$62 million
for
2018
,
2017
and
2016
, respectively. Consolidated lease expense for automobiles, computer equipment and office equipment was
$20 million
,
$22 million
and
$19 million
for
2018
,
2017
and
2016
, respectively.
Note 19.
Income Taxes
On December 22, 2017, U.S. Tax Reform was enacted into law with the effective date for most provisions being January 1, 2018. U.S. Tax Reform represents significant changes to the U.S. internal revenue code and, among other things:
|
•
|
lowered the corporate income tax rate from 35% to 21%
|
|
•
|
imposed a one-time deemed repatriation tax on accumulated foreign earnings (the “Transition Tax”)
|
|
•
|
provides for a 100% dividends received deduction on dividends from foreign affiliates
|
|
•
|
requires a current inclusion in U.S. federal taxable income of earnings of foreign affiliates that are determined to be global intangible low taxed income or “GILTI”
|
|
•
|
creates the base erosion anti-abuse tax, or “BEAT”
|
|
•
|
provides for an effective tax rate of 13.125% for certain income derived from outside of the U.S. (referred to as foreign derived intangible income or “FDII”)
|
|
•
|
introduced further limitations on the deductibility of executive compensation
|
|
•
|
permits 100% expensing of qualifying fixed assets acquired after September 27, 2017
|
|
•
|
limits the deductibility of interest expense in certain situations and
|
|
•
|
eliminates the domestic production activities deduction.
|
While the effective date of the law for most provisions was January 1, 2018, GAAP requires the effects of changes in tax rates be accounted for in the reporting period of enactment, which was the 2017 reporting period.
Components of Income and Income tax expense
The domestic and foreign components of income before income taxes for the years ended
December 31
are as follows:
|
2018
|
2017
|
2016
|
|||||||||
|
(in millions)
|
|||||||||||
|
United States
|
$
|
3,510
|
|
$
|
3,482
|
|
$
|
3,736
|
|
||
|
Foreign
|
3,694
|
|
3,040
|
|
1,910
|
|
|||||
|
Income before income taxes
|
$
|
7,204
|
|
$
|
6,522
|
|
$
|
5,646
|
|
||
98
The total income tax provision for the years ended
December 31
is comprised of the following components:
|
2018
|
2017
|
2016
|
|||||||||
|
(in millions)
|
|||||||||||
|
Current
|
|||||||||||
|
Federal
|
$
|
649
|
|
$
|
1,704
|
|
$
|
1,074
|
|
||
|
State and local
|
69
|
|
65
|
|
36
|
|
|||||
|
Foreign
|
871
|
|
752
|
|
497
|
|
|||||
|
1,589
|
|
2,521
|
|
1,607
|
|
||||||
|
Deferred
|
|||||||||||
|
Federal
|
(228
|
)
|
134
|
|
(6
|
)
|
|||||
|
State and local
|
(11
|
)
|
1
|
|
(2
|
)
|
|||||
|
Foreign
|
(5
|
)
|
(49
|
)
|
(12
|
)
|
|||||
|
(244
|
)
|
86
|
|
(20
|
)
|
||||||
|
Income tax expense
|
$
|
1,345
|
|
$
|
2,607
|
|
$
|
1,587
|
|
||
Effective Income Tax Rate
A reconciliation of the effective income tax rate to the U.S. federal statutory income tax rate for the years ended
December 31,
is as follows:
|
2018
|
2017
|
2016
|
||||||||||||||||||
|
Amount
|
Percent
|
Amount
|
Percent
|
Amount
|
Percent
|
|||||||||||||||
|
(in millions, except percentages)
|
||||||||||||||||||||
|
Income before income taxes
|
$
|
7,204
|
|
$
|
6,522
|
|
$
|
5,646
|
|
|||||||||||
|
Federal statutory tax
|
1,513
|
|
21.0
|
%
|
2,283
|
|
35.0
|
%
|
1,976
|
|
35.0
|
%
|
||||||||
|
State tax effect, net of federal benefit
|
46
|
|
0.6
|
%
|
43
|
|
0.7
|
%
|
22
|
|
0.4
|
%
|
||||||||
|
Foreign tax effect
|
(92
|
)
|
(1.3
|
)%
|
(380
|
)
|
(5.8
|
)%
|
(188
|
)
|
(3.3
|
)%
|
||||||||
|
European Commission fine
|
194
|
|
2.7
|
%
|
—
|
|
—
|
%
|
—
|
|
—
|
%
|
||||||||
|
Foreign tax credits
1
|
(110
|
)
|
(1.5
|
)%
|
(27
|
)
|
(0.4
|
)%
|
(141
|
)
|
(2.5
|
)%
|
||||||||
|
Transition Tax
|
22
|
|
0.3
|
%
|
629
|
|
9.6
|
%
|
—
|
|
—
|
%
|
||||||||
|
Remeasurement of deferred taxes
|
(7
|
)
|
(0.1
|
)%
|
157
|
|
2.4
|
%
|
—
|
|
—
|
%
|
||||||||
|
Windfall benefit
|
(72
|
)
|
(1.0
|
)%
|
(43
|
)
|
(0.7
|
)%
|
—
|
|
—
|
%
|
||||||||
|
Other, net
|
(149
|
)
|
|
(2.0
|
)%
|
|
(55
|
)
|
|
(0.8
|
)%
|
|
(82
|
)
|
|
(1.5
|
)%
|
|||
|
Income tax expense
|
$
|
1,345
|
|
18.7
|
%
|
$
|
2,607
|
|
40.0
|
%
|
$
|
1,587
|
|
28.1
|
%
|
|||||
1
Included within the impact of the
2018
foreign tax credits is a
$90 million
tax benefit relating to the carryback of certain foreign tax credits. Additionally, included in 2016 is a
$116 million
benefit associated with the repatriation of 2016 foreign earnings. There was no benefit associated with the repatriation of foreign earnings in
2018
and
2017
due to the enactment of U.S. Tax Reform.
The effective tax rates for the years ended
December 31, 2018, 2017 and 2016
were
18.7%
,
40.0%
and
28.1%
, respectively. The effective income tax rate for
2018
was lower than the effective income tax rate for
2017
primarily due to additional tax expense of
$873 million
attributable to U.S. Tax Reform in 2017, a lower 2018 statutory tax rate in the U.S. and Belgium and a more favorable geographic mix of earnings. The lower effective tax rate is also attributable to discrete tax benefits, relating primarily to
$90 million
of foreign tax credits generated in 2018, which can be carried back and utilized in 2017 under transition rules in the proposed foreign tax credit regulations issued on November 28, 2018, along with provisions for legal matters in the United States. These benefits were partially offset by the nondeductible nature of the fine issued by the European Commission. See
Note 20 (Legal and Regulatory Proceedings)
for further discussion of the European Commission fine and U.S. merchant class litigation. The impact of U.S. Tax Reform for the period ending December 31, 2018 resulted in a net
$75 million
non-recurring tax benefit due to the carry back of certain foreign tax credits, incremental transition tax and the remeasurement of deferred taxes.
The effective income tax rate for 2017 was higher than the effective income tax rate for 2016 primarily due to additional tax expense of
$873 million
attributable to U.S. Tax reform, which included provisional amounts of
$825 million
related to the Transition Tax, the remeasurement of the Company’s net deferred tax asset balance in the U.S. and the recognition of a deferred tax liability related to a change in assertion regarding the indefinite reinvestment of a substantial amount of the Company’s foreign earnings, as well as
$48 million
due to a foregone foreign tax credit benefit on 2017 repatriations. In addition, the
99
Company’s 2017 effective income tax rate versus 2016 was impacted by a more favorable geographic mix of earnings in 2017, partially offset by a lower U.S. foreign tax credit benefit.
SAB 118
The Company was able to make reasonable estimates at
December 31, 2017
and had recorded a provisional charge of
$629 million
related to the Transition Tax,
$157 million
for the remeasurement of the Company’s net deferred tax asset in the U.S. and
$36 million
related to the change in assertion regarding the indefinite reinvestment of foreign earnings. However, these amounts were adjusted during the measurement period due to evolving analysis and interpretations of law, including issuance by the Internal Revenue Service (the “IRS”) and Treasury of Notices and regulations, discussions with the Department of Treasury (“Treasury”), as well as interpretations of how accounting for income taxes should be applied.
At the close of the measurement period, the Company has finalized its assessment of the impact of U.S. Tax Reform resulting in a Transition Tax liability of
$687 million
and a
$150 million
charge related to the remeasurement of the Company’s net deferred tax assets in the U.S. In 2018, the Company recorded an increase in the transition tax liability of
$36 million
, with an offsetting decrease to its deferred tax liabilities. The Company recorded additional Transition Tax expense of
$22 million
and has recorded a
$7 million
reduction to the charge for the remeasurement of its net deferred tax assets. The adjustments in 2018 were primarily the result of additional administrative guidance and proposed regulations issued by the IRS and Treasury.
The Transition Tax will be paid over
eight
annual installments. The initial installment of
$55 million
was due and paid by April 15, 2018. Additionally, the overpayment appearing on the 2017 U.S. federal tax return has been applied against the Company’s Transition Tax liability. Approximately
$509 million
of the remaining tax due is recorded in other liabilities on the consolidated balance sheet at December 31, 2018. At December 31, 2017 the Company had reflected a current liability of
$52 million
and an other liability of
$577 million
. Under U.S. Tax Reform, for purposes of IRS examination of the Transition Tax, the statute of limitations is extended to six years.
Singapore Income Tax Rate
In connection with the expansion of the Company’s operations in the Asia Pacific, Middle East and Africa region, the Company’s subsidiary in Singapore, Mastercard Asia Pacific Pte. Ltd. (“MAPPL”) received an incentive grant from the Singapore Ministry of Finance in 2010. The incentive had provided MAPPL with, among other benefits, a reduced income tax rate for the
10
-year period commencing January 1, 2010 on taxable income in excess of a base amount. The Company continued to explore business opportunities in this region, resulting in an expansion of the incentives being granted by the Ministry of Finance, including a further reduction to the income tax rate on taxable income in excess of a revised fixed base amount commencing July 1, 2011 and continuing through December 31, 2025. Without the incentive grant, MAPPL would have been subject to the statutory income tax rate on its earnings. For
2018, 2017 and 2016
, the impact of the incentive grant received from the Ministry of Finance resulted in a reduction of MAPPL’s income tax liability of
$212 million
, or
$0.20
per diluted share,
$104 million
, or
$0.10
per diluted share, and
$49 million
, or
$0.04
per diluted share, respectively.
Intra-entity asset transfers
During 2014, the Company implemented an initiative to better align its legal entity and tax structure with its operational footprint outside of the U.S. This initiative resulted in a one-time taxable gain in Belgium relating to the transfer of intellectual property to a related foreign entity in the United Kingdom. The Company recorded a deferred charge related to the income tax expense on intercompany profits that resulted from the transfer. The tax associated with the transfer was deferred and amortized utilizing a
25
-year life. The deferred charge was included in other current assets and other assets on the consolidated balance sheet at
December 31, 2017
in the amounts of
$17 million
and
$352 million
, respectively. The aforementioned deferred charge of
$369 million
at
December 31, 2017
, was written off to retained earnings as a component of the cumulative-effect adjustment as of January 1, 2018. In addition, deferred taxes are a component of the cumulative-effect adjustment whereby the Company has recorded a
$186 million
deferred tax asset in this regard. See
Note 1 (Summary of Significant Accounting Policies)
for additional information related to this guidance.
Indefinite Reinvestment
In 2017, as a result of U.S. Tax Reform, among other things, the Company changed its assertion regarding the indefinite reinvestment of foreign earnings outside the U.S. for certain of our foreign affiliates and recognized a provisional deferred tax liability of
$36 million
. In 2018, the Company completed its analysis of global working capital and cash needs. It is the Company’s
100
present intention to indefinitely reinvest a portion of its historic undistributed accumulated earnings associated with certain foreign subsidiaries outside of the U.S.
As part of its analysis, the Company determined that approximately
$5.8 billion
of the approximately
$6.7 billion
of unremitted foreign earnings as of December 31, 2017, were no longer permanently reinvested. Notwithstanding the fact that some earnings continue to be permanently reinvested, all historical earnings, approximately
$7.0 billion
, were taxed in the U.S. as part of transition tax pursuant to U.S. Tax Reform, of which
$267 million
was repatriated in 2017.
Additionally, during 2018, the Company repatriated approximately
$3.3 billion
. As of December 31, 2018, the Company had approximately
$2.5 billion
of accumulated earnings to be repatriated in the future, for which
$8 million
of deferred tax benefit was recorded. The tax effect is primarily related to the estimated foreign exchange impact recognized when earnings are repatriated. The Company expects that foreign withholding taxes associated with these future repatriated earnings will not be material. Earnings of approximately
$0.9 billion
remain permanently reinvested and the Company estimates that an immaterial U.S. federal and state and local income tax benefit would result, primarily from foreign exchange, if these earnings were to be repatriated.
Deferred Taxes
Deferred tax assets and liabilities represent the expected future tax consequences of temporary differences between the carrying amounts and the tax basis of assets and liabilities. The components of deferred tax assets and liabilities at
December 31
are as follows:
|
2018
|
2017
|
||||||
|
(in millions)
|
|||||||
|
Deferred Tax Assets
|
|||||||
|
Accrued liabilities
|
$
|
297
|
|
$
|
158
|
|
|
|
Compensation and benefits
|
210
|
|
127
|
|
|||
|
State taxes and other credits
|
30
|
|
28
|
|
|||
|
Net operating and capital losses
|
104
|
|
105
|
|
|||
|
Unrealized gain/loss - 2015 Euro Notes
|
28
|
|
48
|
|
|||
|
Recoverable basis of deconsolidated entities
|
—
|
|
35
|
|
|||
|
Intangible assets
1
|
170
|
|
—
|
|
|||
|
Previously taxed earnings and profits
|
7
|
|
—
|
|
|||
|
Other items
|
80
|
|
83
|
|
|||
|
Less: Valuation allowance
|
(94
|
)
|
(91
|
)
|
|||
|
Total Deferred Tax Assets
|
832
|
|
493
|
|
|||
|
Deferred Tax Liabilities
|
|||||||
|
Prepaid expenses and other accruals
|
89
|
|
48
|
|
|||
|
Intangible assets
|
125
|
|
151
|
|
|||
|
Property, plant and equipment
|
97
|
|
83
|
|
|||
|
Previously taxed earnings and profits
|
—
|
|
36
|
|
|||
|
Other items
|
18
|
|
31
|
|
|||
|
Total Deferred Tax Liabilities
|
329
|
|
349
|
|
|||
|
Net Deferred Tax Assets
|
$
|
503
|
|
$
|
144
|
|
|
1
On January 1, 2018 a
$186 million
deferred tax asset was established related to intra-entity transfers as discussed above.
Both the 2018 and 2017 valuation allowances relate primarily to the Company’s ability to recognize tax benefits associated with certain foreign net operating losses. The recognition of the foreign losses is dependent upon the future taxable income in such jurisdictions and the ability under tax law in these jurisdictions to utilize net operating losses following a change in control.
101
A reconciliation of the beginning and ending balance for the Company’s unrecognized tax benefits for the years ended
December 31
, is as follows:
|
2018
|
2017
|
2016
|
|||||||||
|
(in millions)
|
|||||||||||
|
Beginning balance
|
$
|
183
|
|
$
|
169
|
|
$
|
181
|
|
||
|
Additions:
|
|||||||||||
|
Current year tax positions
|
23
|
|
21
|
|
20
|
|
|||||
|
Prior year tax positions
|
5
|
|
9
|
|
13
|
|
|||||
|
Reductions:
|
|||||||||||
|
Prior year tax positions
|
(17
|
)
|
(1
|
)
|
(28
|
)
|
|||||
|
Settlements with tax authorities
|
(18
|
)
|
(4
|
)
|
(2
|
)
|
|||||
|
Expired statute of limitations
|
(12
|
)
|
(11
|
)
|
(15
|
)
|
|||||
|
Ending balance
|
$
|
164
|
|
$
|
183
|
|
$
|
169
|
|
||
The entire unrecognized tax benefit of
$164 million
, if recognized, would reduce the effective tax rate. During 2018, there was a reduction to the balance of the Company’s unrecognized tax benefits. This was primarily due to a favorable court decision and settlements with tax authorities in multiple jurisdictions. Further, the information gained related to these matters was considered in measuring uncertain tax benefits recognized for the periods subsequent to the periods settled.
The Company is subject to tax in the U.S., Belgium, Singapore, the United Kingdom and various other foreign jurisdictions, as well as state and local jurisdictions. Uncertain tax positions are reviewed on an ongoing basis and are adjusted after considering facts and circumstances, including progress of tax audits, developments in case law and closing of statutes of limitation. Within the next twelve months, the Company believes that the resolution of certain federal, foreign and state and local examinations are reasonably possible and that a change in estimate, reducing unrecognized tax benefits, may occur. While such a change may be significant, it is not possible to provide a range of the potential change until the examinations progress further or the related statutes of limitation expire. The Company has effectively settled its U.S. federal income tax obligations through 2011. With limited exception, the Company is no longer subject to state and local or foreign examinations by tax authorities for years before 2010.
At
December 31, 2018 and 2017
, the Company had a net income tax-related interest payable of
$8 million
and
$10 million
, respectively, in its consolidated balance sheet. Tax-related interest income /(expense) in the periods
2018
,
2017
and 2016, were not material. In addition, as of
December 31, 2018 and 2017
, the amounts the Company has recognized for penalties payable in its consolidated balance sheet were not material.
Note 20.
Legal and Regulatory Proceedings
Mastercard is a party to legal and regulatory proceedings with respect to a variety of matters in the ordinary course of business. Some of these proceedings are based on complex claims involving substantial uncertainties and unascertainable damages. Accordingly, except as discussed below, it is not possible to determine the probability of loss or estimate damages, and therefore, Mastercard has not established reserves for any of these proceedings. When the Company determines that a loss is both probable and reasonably estimable, Mastercard records a liability and discloses the amount of the liability if it is material. When a material loss contingency is only reasonably possible, Mastercard does not record a liability, but instead discloses the nature and the amount of the claim, and an estimate of the loss or range of loss, if such an estimate can be made. Unless otherwise stated below with respect to these matters, Mastercard cannot provide an estimate of the possible loss or range of loss based on one or more of the following reasons: (1) actual or potential plaintiffs have not claimed an amount of monetary damages or the amounts are unsupportable or exaggerated, (2) the matters are in early stages, (3) there is uncertainty as to the outcome of pending appeals or motions, (4) there are significant factual issues to be resolved, (5) the existence in many such proceedings of multiple defendants or potential defendants whose share of any potential financial responsibility has yet to be determined and/or (6) there are novel legal issues presented. Furthermore, except as identified with respect to the matters below, Mastercard does not believe that the outcome of any individual existing legal or regulatory proceeding to which it is a party will have a material adverse effect on its results of operations, financial condition or overall business. However, an adverse judgment or other outcome or settlement with respect to any proceedings discussed below could result in fines or payments by Mastercard and/or could require Mastercard to change its business practices. In addition, an adverse outcome in a regulatory proceeding could lead to the filing of civil damage claims and possibly result in significant damage awards. Any of these events could have a material adverse effect on Mastercard’s results of operations, financial condition and overall business.
102
Interchange Litigation and Regulatory Proceedings
Mastercard’s interchange fees and other practices are subject to regulatory, legal review and/or challenges in a number of jurisdictions, including the proceedings described below. When taken as a whole, the resulting decisions, regulations and legislation with respect to interchange fees and acceptance practices may have a material adverse effect on the Company’s prospects for future growth and its overall results of operations, financial position and cash flows.
United States.
In June 2005, the first of a series of complaints were filed on behalf of merchants (the majority of the complaints were styled as class actions, although a few complaints were filed on behalf of individual merchant plaintiffs) against Mastercard International, Visa U.S.A., Inc., Visa International Service Association and a number of financial institutions. Taken together, the claims in the complaints were generally brought under both Sections 1 and 2 of the Sherman Act, which prohibit monopolization and attempts or conspiracies to monopolize a particular industry, and some of these complaints contain unfair competition law claims under state law. The complaints allege, among other things, that Mastercard, Visa, and certain financial institutions conspired to set the price of interchange fees, enacted point of sale acceptance rules (including the no surcharge rule) in violation of antitrust laws and engaged in unlawful tying and bundling of certain products and services. The cases were consolidated for pre-trial proceedings in the U.S. District Court for the Eastern District of New York in MDL No. 1720. The plaintiffs filed a consolidated class action complaint that seeks treble damages.
In July 2006, the group of purported merchant class plaintiffs filed a supplemental complaint alleging that Mastercard’s initial public offering of its Class A Common Stock in May 2006 (the “IPO”) and certain purported agreements entered into between Mastercard and financial institutions in connection with the IPO: (1) violate U.S. antitrust laws and (2) constituted a fraudulent conveyance because the financial institutions allegedly attempted to release, without adequate consideration, Mastercard’s right to assess them for Mastercard’s litigation liabilities. The class plaintiffs sought treble damages and injunctive relief including, but not limited to, an order reversing and unwinding the IPO.
In February 2011, Mastercard and Mastercard International entered into each of: (1) an omnibus judgment sharing and settlement sharing agreement with Visa Inc., Visa U.S.A. Inc. and Visa International Service Association and a number of financial institutions; and (2) a Mastercard settlement and judgment sharing agreement with a number of financial institutions. The agreements provide for the apportionment of certain costs and liabilities which Mastercard, the Visa parties and the financial institutions may incur, jointly and/or severally, in the event of an adverse judgment or settlement of one or all of the cases in the merchant litigations. Among a number of scenarios addressed by the agreements, in the event of a global settlement involving the Visa parties, the financial institutions and Mastercard, Mastercard would pay
12%
of the monetary portion of the settlement. In the event of a settlement involving only Mastercard and the financial institutions with respect to their issuance of Mastercard cards, Mastercard would pay
36%
of the monetary portion of such settlement.
In October 2012, the parties entered into a definitive settlement agreement with respect to the merchant class litigation (including with respect to the claims related to the IPO) and the defendants separately entered into a settlement agreement with the individual merchant plaintiffs. The settlements included cash payments that were apportioned among the defendants pursuant to the omnibus judgment sharing and settlement sharing agreement described above. Mastercard also agreed to provide class members with a short-term reduction in default credit interchange rates and to modify certain of its business practices, including its “no surcharge” rule. The court granted final approval of the settlement in December 2013, and objectors to the settlement appealed that decision to the U.S. Court of Appeals for the Second Circuit. In June 2016, the court of appeals vacated the class action certification, reversed the settlement approval and sent the case back to the district court for further proceedings. The court of appeals’ ruling was based primarily on whether the merchants were adequately represented by counsel in the settlement. As a result of the appellate court ruling, the district court divided the merchants’ claims into two separate classes - monetary damages claims (the “Damages Class”) and claims seeking changes to business practices (the “Rules Relief Class”). The court appointed separate counsel for each class.
Prior to the reversal of the settlement approval, merchants representing slightly more than
25%
of the Mastercard and Visa purchase volume over the relevant period chose to opt out of the class settlement. Mastercard had anticipated that most of the larger merchants who opted out of the settlement would initiate separate actions seeking to recover damages, and over
30
opt-out complaints have been filed on behalf of numerous merchants in various jurisdictions. Mastercard has executed settlement agreements with a number of opt-out merchants. Mastercard believes these settlement agreements are not impacted by the ruling of the court of appeals. The defendants have consolidated all of these matters in front of the same federal district court that approved the merchant class settlement. In July 2014, the district court denied the defendants’ motion to dismiss the opt-out merchant complaints for failure to state a claim.
103
In September 2018, the parties to the Damages Class litigation entered into a class settlement agreement to resolve the Damages Class claims. Mastercard increased its reserve by
$237 million
during 2018 to reflect both its expected financial obligation under the Damages Class settlement agreement and the filed and anticipated opt-out merchant cases. In January 2019, the district court issued an order granting preliminary approval of the settlement and authorized notice of the settlement to class members. Damages Class members will now have the opportunity to opt out of the class settlement agreement, after which the district court will schedule a hearing on final approval. The settlement agreement does not relate to the Rules Relief Class claims. Separate settlement negotiations with the Rules Relief Class are ongoing.
As of
December 31, 2018
and
2017
, Mastercard had accrued a liability of
$915 million
and
$708 million
, respectively, as a reserve for both the merchant class litigation and the filed and anticipated opt-out merchant cases. As of
December 31, 2018
and
2017
, Mastercard had
$553 million
and
$546 million
, respectively, in a qualified cash settlement fund related to the merchant class litigation and classified as restricted cash on its consolidated balance sheet. Mastercard believes the reserve for both the merchant class litigation and the filed and anticipated opt-out merchants represents its best estimate of its probable liabilities in these matters. The portion of the accrued liability relating to both the opt-out merchants and the merchant class litigation settlement does not represent an estimate of a loss, if any, if the matters were litigated to a final outcome. Mastercard cannot estimate the potential liability if that were to occur.
Canada
. In December 2010, a proposed class action complaint was commenced against Mastercard in Quebec on behalf of Canadian merchants. The suit essentially repeated the allegations and arguments of a previously filed application by the Canadian Competition Bureau to the Canadian Competition Tribunal (dismissed in Mastercard’s favor) concerning certain Mastercard rules related to point-of-sale acceptance, including the “honor all cards” and “no surcharge” rules. The Quebec suit sought compensatory and punitive damages in unspecified amounts, as well as injunctive relief. In the first half of 2011, additional purported class action lawsuits were commenced in British Columbia and Ontario against Mastercard, Visa and a number of large Canadian financial institutions. The British Columbia suit sought compensatory damages in unspecified amounts, and the Ontario suit sought compensatory damages of
$5 billion
on the basis of alleged conspiracy and various alleged breaches of the Canadian Competition Act. Additional purported class action complaints were commenced in Saskatchewan and Alberta with claims that largely mirror those in the other suits. In June 2017, Mastercard entered into a class settlement agreement to resolve all of the Canadian class action litigation. The settlement, which requires Mastercard to make a cash payment and modify its “no surcharge” rule, has received court approval in each Canadian province. Objectors to the settlement have sought to appeal the approval orders. In 2017, Mastercard recorded a provision for litigation of
$15 million
related to this matter.
Europe.
In July 2015, the European Commission (“EC”) issued a Statement of Objections related to Mastercard’s interregional interchange fees and central acquiring rule within the European Economic Area (the “EEA”). The Statement of Objections, which followed an investigation opened in 2013, included preliminary conclusions concerning the alleged anticompetitive effects of these practices. In December 2018, Mastercard announced the anticipated resolution of the EC’s investigation. With respect to interregional interchange fees, Mastercard made a settlement proposal whereby it would make changes to its interregional interchange fees. The proposed settlement is subject to market testing by the EC before it is made binding in an EC decision. The EC has announced that Visa has entered into a parallel proposed settlement. In addition, with respect to Mastercard’s historic central acquiring rule, the EC issued a negative decision in January 2019. The EC’s negative decision covers a period of time of less than two years before the rule’s modification. The rule was modified in late 2015 to comply with the requirements of the EEA Interchange Fee Regulation. The decision does not require any modification of Mastercard’s current business practices but includes a fine of
€571 million
. Mastercard incurred a charge of
$654 million
in the fourth quarter of 2018 in relation to this matter.
Since May 2012, a number of United Kingdom (“U.K.”) retailers filed claims or threatened litigation against Mastercard seeking damages for alleged anti-competitive conduct with respect to Mastercard’s cross-border interchange fees and its U.K. and Ireland domestic interchange fees (the “U.K. Merchant claimants”). In addition, Mastercard, has faced similar filed or threatened litigation by merchants with respect to interchange rates in other countries in Europe (the “Pan-European Merchant claimants”). In aggregate, the alleged damages claims from the U.K. and Pan-European Merchant claimants were in the amount of approximately
£3 billion
(approximately
$4 billion
as of
December 31, 2018
). Mastercard has resolved over
£2 billion
(approximately
$3 billion
as of
December 31, 2018
) of these damages claims through settlement or judgment. Since June 2015, Mastercard has recorded litigation provisions for settlements, judgments and legal fees relating to these claims, including charges of
$237 million
and
$117 million
in 2018 and 2016, respectively. There were no litigation charges relating to U.K. and Pan-European Merchant claimants in 2017. As detailed below, Mastercard continues to litigate with the remaining U.K. and Pan-European Merchant claimants and it has submitted statements of defense disputing liability and damages claims.
In January 2017, Mastercard received a liability judgment in its favor on all significant matters in a separate action brought by
ten
of the U.K. Merchant claimants.
Three
of the U.K. Merchant claimants appealed the judgment, and these appeals were
104
combined with Mastercard’s appeal of a 2016 judgment in favor of
one
U.K. merchant. In July 2018, the U.K. appellate court ruled against both Mastercard and Visa on
two
of the
three
legal issues being considered, concluding that U.K. interchange rates restricted competition and that they were not objectively necessary for the payment networks. The appellate court sent the cases back to trial for reconsideration on the remaining issue concerning the “lawful” level of interchange. Mastercard and Visa have been granted permission to appeal the appellate court ruling to the U.K. Supreme Court. Mastercard expects the litigation process to be delayed pending the resolution of its appeal to the U.K. Supreme Court.
In September 2016, a proposed collective action was filed in the United Kingdom on behalf of U.K. consumers seeking damages for intra-EEA and domestic U.K. interchange fees that were allegedly passed on to consumers by merchants between 1992 and 2008. The complaint, which seeks to leverage the European Commission’s 2007 decision on intra-EEA interchange fees, claims damages in an amount that exceeds
£14 billion
(approximately
$18 billion
as of
December 31, 2018
). In July 2017, the court denied the plaintiffs’ application for the case to proceed as a collective action. The plaintiffs were granted permission to appeal the denial of their collective action application and the appellate court heard an oral argument on the appeal in February 2019.
ATM Non-Discrimination Rule Surcharge Complaints
In October 2011, a trade association of independent Automated Teller Machine (“ATM”) operators and
13
independent ATM operators filed a complaint styled as a class action lawsuit in the U.S. District Court for the District of Columbia against both Mastercard and Visa (the “ATM Operators Complaint”). Plaintiffs seek to represent a class of non-bank operators of ATM terminals that operate in the United States with the discretion to determine the price of the ATM access fee for the terminals they operate. Plaintiffs allege that Mastercard and Visa have violated Section 1 of the Sherman Act by imposing rules that require ATM operators to charge non-discriminatory ATM surcharges for transactions processed over Mastercard’s and Visa’s respective networks that are not greater than the surcharge for transactions over other networks accepted at the same ATM. Plaintiffs seek both injunctive and monetary relief equal to treble the damages they claim to have sustained as a result of the alleged violations and their costs of suit, including attorneys’ fees. Plaintiffs have not quantified their damages although they allege that they expect damages to be in the tens of millions of dollars.
Subsequently, multiple related complaints were filed in the U.S. District Court for the District of Columbia alleging both federal antitrust and multiple state unfair competition, consumer protection and common law claims against Mastercard and Visa on behalf of putative classes of users of ATM services (the “ATM Consumer Complaints”). The claims in these actions largely mirror the allegations made in the ATM Operators Complaint, although these complaints seek damages on behalf of consumers of ATM services who pay allegedly inflated ATM fees at both bank and non-bank ATM operators as a result of the defendants’ ATM rules. Plaintiffs seek both injunctive and monetary relief equal to treble the damages they claim to have sustained as a result of the alleged violations and their costs of suit, including attorneys’ fees. Plaintiffs have not quantified their damages although they allege that they expect damages to be in the tens of millions of dollars.
In January 2012, the plaintiffs in the ATM Operators Complaint and the ATM Consumer Complaints filed amended class action complaints that largely mirror their prior complaints. In February 2013, the district court granted Mastercard’s motion to dismiss the complaints for failure to state a claim. On appeal, the Court of Appeals reversed the district court’s order in August 2015 and sent the case back for further proceedings.
U.S. Liability Shift Litigation
In March 2016, a proposed U.S. merchant class action complaint was filed in federal court in California alleging that Mastercard, Visa, American Express and Discover (the “Network Defendants”), EMVCo and a number of issuing banks (the “Bank Defendants”) engaged in a conspiracy to shift fraud liability for card present transactions from issuing banks to merchants not yet in compliance with the standards for EMV chip cards in the United States (the “EMV Liability Shift”), in violation of the Sherman Act and California law. Plaintiffs allege damages equal to the value of all chargebacks for which class members became liable as a result of the EMV Liability Shift on October 1, 2015. The plaintiffs seek treble damages, attorney’s fees and costs and an injunction against future violations of governing law, and the defendants have filed a motion to dismiss. In September 2016, the court denied the Network Defendants’ motion to dismiss the complaint, but granted such a motion for EMVCo and the Bank Defendants. In May 2017, the court transferred the case to New York so that discovery could be coordinated with the U.S. merchant class interchange litigation described above. The plaintiffs have filed a renewed motion for class certification, following the district court’s denial of their initial motion.
105
Telephone Consumer Protection Class Action
Mastercard is a defendant in a Telephone Consumer Protection Act (“TCPA”) class action pending in Florida. The plaintiffs are individuals and businesses who allege that approximately
381,000
unsolicited faxes were sent to them advertising a Mastercard co-brand card issued by First Arkansas Bank (“FAB”). The TCPA provides for uncapped statutory damages of
$500
per fax. Mastercard has asserted various defenses to the claims, and has notified FAB of an indemnity claim that it has (which FAB has disputed). In June 2018, the court granted Mastercard’s motion to stay the proceedings until the Federal Communications Commission makes a decision on the application of the TCPA to online fax services.
Note 21.
Settlement and Other Risk Management
Mastercard’s rules guarantee the settlement of many of the transactions between its customers (“settlement risk”). Settlement exposure is the settlement risk to customers under Mastercard’s rules due to the difference in timing between the payment transaction date and subsequent settlement. While the term and amount of the guarantee are unlimited, the duration of settlement exposure is short term and typically limited to a few days.
Gross settlement exposure is estimated using the average daily payment volume during the three months ended
December 31, 2018
multiplied by the estimated number of days of exposure. The Company has global risk management policies and procedures, which include risk standards, to provide a framework for managing the Company’s settlement risk and exposure. In the event of a failed customer, Mastercard may pursue one or more remedies available under our rules to recover potential losses. Historically, the Company has experienced a low level of losses from customer failures.
As part of its policies, Mastercard requires certain customers that are not in compliance with the Company’s risk standards to post collateral, typically in the form of cash, letters of credit, or guarantees. This requirement is based on a review of the individual risk circumstances for each customer. Mastercard monitors its credit risk portfolio on a regular basis and the adequacy of collateral on hand. Additionally, from time to time, the Company reviews its risk management methodology and standards. As such, the amounts of estimated settlement exposure are revised as necessary.
The Company’s estimated settlement exposure was as follows:
|
December 31,
2018 |
December 31, 2017
|
||||||
|
(in millions)
|
|||||||
|
Gross settlement exposure
|
$
|
49,666
|
|
$
|
47,002
|
|
|
|
Collateral held for settlement exposure
|
(4,711
|
)
|
(4,360
|
)
|
|||
|
Net uncollateralized settlement exposure
|
$
|
44,955
|
|
$
|
42,642
|
|
|
Mastercard also provides guarantees to customers and certain other counterparties indemnifying them from losses stemming from failures of third parties to perform duties. This includes guarantees of Mastercard-branded travelers cheques issued, but not yet cashed of
$377 million
and
$395 million
at
December 31, 2018 and 2017
, respectively, of which
$297 million
and
$313 million
at
December 31, 2018 and 2017
, respectively, is mitigated by collateral arrangements. In addition, the Company enters into agreements in the ordinary course of business under which the Company agrees to indemnify third parties against damages, losses and expenses incurred in connection with legal and other proceedings arising from relationships or transactions with the Company. Certain indemnifications do not provide a stated maximum exposure. As the extent of the Company’s obligations under these agreements depends entirely upon the occurrence of future events, the Company’s potential future liability under these agreements is not determinable. Historically, payments made by the Company under these types of contractual arrangements have not been material.
Note 22.
Foreign Exchange Risk Management
The Company monitors and manages its foreign currency exposures as part of its overall risk management program which focuses on the unpredictability of financial markets and seeks to reduce the potentially adverse effects that the volatility of these markets may have on its operating results. A primary objective of the Company’s risk management strategies is to reduce the financial impact that may arise from volatility in foreign currency exchange rates principally through the use of both foreign currency derivative contracts (Derivatives) and foreign currency denominated debt (Net Investment Hedge).
106
Derivatives
The Company enters into foreign currency derivative contracts to manage risk associated with anticipated receipts and disbursements which are valued based on currencies other than the functional currencies of the entity. The Company may also enter into foreign currency derivative contracts to offset possible changes in value due to foreign exchange fluctuations of earnings, assets and liabilities. The objective of these activities is to reduce the Company’s exposure to gains and losses resulting from fluctuations of foreign currencies against its functional currencies.
As of
December 31, 2018
and
2017
, the majority of derivative contracts to hedge foreign currency fluctuations had been entered into with customers of Mastercard. Mastercard’s derivative contracts are summarized below:
|
|
December 31, 2018
|
December 31, 2017
|
|||||||||||||
|
|
Notional
|
Estimated Fair
Value
|
Notional
|
Estimated Fair
Value
|
|||||||||||
|
|
(in millions)
|
||||||||||||||
|
Commitments to purchase foreign currency
|
$
|
34
|
|
$
|
(1
|
)
|
$
|
27
|
|
$
|
—
|
|
|||
|
Commitments to sell foreign currency
|
1,066
|
|
26
|
|
968
|
|
(26
|
)
|
|||||||
|
Options to sell foreign currency
|
25
|
|
4
|
|
27
|
|
2
|
|
|||||||
|
Balance sheet location
|
|||||||||||||||
|
Accounts receivable
1
|
$
|
—
|
|
$
|
6
|
|
|||||||||
|
Prepaid expenses and other current assets
1
|
35
|
|
—
|
|
|||||||||||
|
Other current liabilities
1
|
(6
|
)
|
(30
|
)
|
|||||||||||
1
The derivative contracts are subject to enforceable master netting arrangements, which contain various netting and setoff provisions.
The amount of gain (loss) recognized on the consolidated statement of operations for the contracts to purchase and sell foreign currency is summarized below:
|
|
Year Ended December 31,
|
||||||||||
|
|
2018
|
2017
|
2016
|
||||||||
|
|
(in millions)
|
||||||||||
|
Foreign currency derivative contracts
|
|||||||||||
|
General and administrative
|
$
|
53
|
|
$
|
(75
|
)
|
$
|
(6
|
)
|
||
The fair value of the foreign currency derivative contracts generally reflects the estimated amounts that the Company would receive (or pay), on a pre-tax basis, to terminate the contracts. The terms of the foreign currency derivative contracts are generally less than
18 months
. The Company had
no
deferred gains or losses related to foreign exchange contracts in accumulated other comprehensive income as of
December 31, 2018 and 2017
, as these contracts were not accounted for under hedge accounting.
The Company’s derivative financial instruments are subject to both market and counterparty credit risk. Market risk is the potential for economic losses to be incurred on market risk sensitive instruments arising from adverse changes in market factors such as foreign currency exchange rates, interest rates and other related variables. The effect of a hypothetical 10% adverse change in U.S. dollar forward rates could result in a fair value loss of approximately
$113 million
on the Company’s foreign currency derivative contracts outstanding at
December 31, 2018
. Counterparty credit risk is the risk of loss due to failure of the counterparty to perform its obligations in accordance with contractual terms. To mitigate counterparty credit risk, the Company enters into derivative contracts with a diversified group of selected financial institutions based upon their credit ratings and other factors. Generally, the Company does not obtain collateral related to derivatives because of the high credit ratings of the counterparties.
Net Investment Hedge
The Company uses foreign currency denominated debt to hedge a portion of its net investment in foreign operations against adverse movements in exchange rates, with changes in the value of the debt recorded within currency translation adjustment in accumulated other comprehensive income (loss). In 2015, the Company designated its
€1.65 billion
euro-denominated debt as a net investment hedge for a portion of its net investment in European foreign operations. As of
December 31, 2018
, the Company had a net foreign currency transaction pre-tax loss of
$120 million
in accumulated other comprehensive income (loss) associated with hedging activity. There was no ineffectiveness in the current period.
107
Note 23.
Segment Reporting
Mastercard has concluded it has one operating and reportable segment, “Payment Solutions.” Mastercard’s President and Chief Executive Officer has been identified as the chief operating decision-maker. All of the Company’s activities are interrelated, and each activity is dependent upon and supportive of the other. Accordingly, all significant operating decisions are based upon analysis of Mastercard at the consolidated level.
Revenue by geographic market is based on the location of the Company’s customer that issued the card, as well as the location of the merchant acquirer where the card is being used. Revenue generated in the U.S. was approximately
33%
of total revenue in
2018
,
35%
in
2017
and
38%
in
2016
. No individual country, other than the U.S., generated more than 10% of total revenue in those periods.
Mastercard did not have any individual customer that generated greater than 10% of net revenue in
2018
,
2017
or
2016
. The following table reflects the geographical location of the Company’s property, plant and equipment, net, as of December 31:
|
2018
|
2017
|
2016
|
|||||||||
|
(in millions)
|
|||||||||||
|
United States
|
$
|
613
|
|
$
|
572
|
|
$
|
504
|
|
||
|
Other countries
|
308
|
|
257
|
|
229
|
|
|||||
|
Total
|
$
|
921
|
|
$
|
829
|
|
$
|
733
|
|
||
108
MASTERCARD INCORPORATED
SUMMARY OF QUARTERLY DATA (Unaudited)
|
2018 Quarter Ended
|
|||||||||||||||||||
|
March 31
|
June 30
|
September 30
|
December 31
|
2018 Total
|
|||||||||||||||
|
(in millions, except per share data)
|
|||||||||||||||||||
|
Net revenue
|
$
|
3,580
|
|
$
|
3,665
|
|
$
|
3,898
|
|
$
|
3,807
|
|
$
|
14,950
|
|
||||
|
Operating income
|
1,825
|
|
1,936
|
|
2,287
|
|
1,234
|
|
7,282
|
|
|||||||||
|
Net income
|
1,492
|
|
1,569
|
|
1,899
|
|
899
|
|
5,859
|
|
|||||||||
|
Basic earnings per share
|
$
|
1.42
|
|
$
|
1.50
|
|
$
|
1.83
|
|
$
|
0.87
|
|
$
|
5.63
|
|
||||
|
Basic weighted-average shares outstanding
|
1,051
|
|
1,043
|
|
1,037
|
|
1,032
|
|
1,041
|
|
|||||||||
|
Diluted earnings per share
|
$
|
1.41
|
|
$
|
1.50
|
|
$
|
1.82
|
|
$
|
0.87
|
|
$
|
5.60
|
|
||||
|
Diluted weighted-average shares outstanding
|
1,057
|
|
1,049
|
|
1,043
|
|
1,038
|
|
1,047
|
|
|||||||||
|
2017 Quarter Ended
|
|||||||||||||||||||
|
March 31
|
June 30
|
September 30
|
December 31
|
2017 Total
|
|||||||||||||||
|
(in millions, except per share data)
|
|||||||||||||||||||
|
Net revenue
|
$
|
2,734
|
|
$
|
3,053
|
|
$
|
3,398
|
|
$
|
3,312
|
|
$
|
12,497
|
|
||||
|
Operating income
|
1,506
|
|
1,653
|
|
1,941
|
|
1,522
|
|
6,622
|
|
|||||||||
|
Net income
|
1,081
|
|
1,177
|
|
1,430
|
|
227
|
|
3,915
|
|
|||||||||
|
Basic earnings per share
|
$
|
1.00
|
|
$
|
1.10
|
|
$
|
1.34
|
|
$
|
0.21
|
|
$
|
3.67
|
|
||||
|
Basic weighted-average shares outstanding
|
1,078
|
|
1,070
|
|
1,063
|
|
1,057
|
|
1,067
|
|
|||||||||
|
Diluted earnings per share
|
$
|
1.00
|
|
$
|
1.10
|
|
$
|
1.34
|
|
$
|
0.21
|
|
$
|
3.65
|
|
||||
|
Diluted weighted-average shares outstanding
|
1,082
|
|
1,075
|
|
1,068
|
|
1,063
|
|
1,072
|
|
|||||||||
Note: Tables may not sum due to rounding.
109
ITEM 9. CHANGES IN AND DISAGREEMENTS WITH ACCOUNTANTS ON ACCOUNTING AND FINANCIAL DISCLOSURE
Not applicable.
ITEM 9A. CONTROLS AND PROCEDURES
Evaluation of Disclosure Controls and Procedures
Our disclosure controls and procedures (as defined in Rules 13a-15(e) and 15d-15(e) under the Securities Exchange Act of 1934, as amended (the “Exchange Act”) are designed to ensure that information required to be disclosed in the reports that we file or submit under the Exchange Act is recorded, processed, summarized and reported within the time periods specified in the rules and forms of the Securities and Exchange Commission and to ensure that information required to be disclosed is accumulated and communicated to management, including our President and Chief Executive Officer and our Chief Financial Officer, to allow timely decisions regarding disclosure. The President and Chief Executive Officer and the Chief Financial Officer, with assistance from other members of management, have reviewed the effectiveness of our disclosure controls and procedures as of
December 31, 2018
and, based on their evaluation, have concluded that the disclosure controls and procedures were effective as of such date.
Internal Control over Financial Reporting
In addition, Mastercard Incorporated’s management assessed the effectiveness of Mastercard’s internal control over financial reporting as of
December 31, 2018
. Management’s report on internal control over financial reporting is included in Part II, Item 8. PricewaterhouseCoopers LLP, an independent registered public accounting firm, has audited the consolidated financial statements included in this Annual Report on Form 10-K and, as part of their audit, has issued their report, included herein, on the effectiveness of our internal control over financial reporting.
Changes in Internal Control over Financial Reporting
There was no change in Mastercard’s internal control over financial reporting that occurred during the three months ended
December 31, 2018
that has materially affected, or is reasonably likely to materially affect, Mastercard’s internal control over financial reporting.
ITEM 9B. OTHER INFORMATION
Pursuant to Section 219 of the Iran Threat Reduction and Syria Human Rights Act of 2012, we hereby incorporate by reference herein the disclosure contained in Exhibit 99.1 of this Report.
110
PART III
ITEM 10. DIRECTORS, EXECUTIVE OFFICERS AND CORPORATE GOVERNANCE
The information required by this Item with respect to our directors and executive officers, code of ethics, procedures for recommending nominees, audit committee, audit committee financial experts and compliance with Section 16(a) of the Exchange Act will appear in our definitive proxy statement to be filed with the SEC and delivered to stockholders in connection with the Annual Meeting of Stockholders to be held on June 25, 2019 (the “Proxy Statement”).
The aforementioned information in the Proxy Statement is incorporated by reference into this Report.
ITEM 11. EXECUTIVE COMPENSATION
The information required by this Item with respect to executive officer and director compensation will appear in the Proxy Statement and is incorporated by reference into this Report.
ITEM 12. SECURITY OWNERSHIP OF CERTAIN BENEFICIAL OWNERS AND MANAGEMENT AND RELATED STOCKHOLDER MATTERS
The information required by this Item with respect to security ownership of certain beneficial owners and management equity and compensation plans will appear in the Proxy Statement and is incorporated by reference into this Report.
ITEM 13. CERTAIN RELATIONSHIPS AND RELATED TRANSACTIONS, AND DIRECTOR INDEPENDENCE
The information required by this Item with respect to transactions with related persons, the review, approval or ratification of such transactions and director independence will appear in the Proxy Statement and is incorporated by reference into this Report.
ITEM 14. PRINCIPAL ACCOUNTANT FEES AND SERVICES
The information required by this Item with respect to auditors’ services and fees will appear in the Proxy Statement and is incorporated by reference into this Report.
PART IV
ITEM 15. EXHIBITS AND FINANCIAL STATEMENT SCHEDULES
(a) The following documents are filed as part of this Report:
|
1
|
Consolidated Financial Statements
|
See Index to Consolidated Financial Statements in Part II, Item 8.
|
2
|
Consolidated Financial Statement Schedules
|
None.
|
3
|
The following exhibits are filed as part of this Report or, where indicated, were previously filed and are hereby incorporated by reference:
|
Refer to the Exhibit Index included herein.
ITEM 16. FORM 10-K SUMMARY
None.
111
EXHIBIT INDEX
|
Exhibit
Number
|
|
Exhibit Description
|
|
|
||
|
|
||
|
|
||
|
|
||
|
|
||
|
101.INS*
|
|
XBRL Instance Document
|
|
101.SCH*
|
|
XBRL Taxonomy Extension Schema Document
|
|
101.CAL*
|
|
XBRL Taxonomy Extension Calculation Linkbase Document
|
|
101.DEF*
|
|
XBRL Taxonomy Extension Definition Linkbase Document
|
|
101.LAB*
|
|
XBRL Taxonomy Extension Label Linkbase Document
|
|
101.PRE*
|
|
XBRL Taxonomy Extension Presentation Linkbase Document
|
|
+
|
Management contracts or compensatory plans or arrangements.
|
|
*
|
Filed or furnished herewith.
|
|
**
|
Exhibit omits certain information that has been filed separately with the U.S. Securities and Exchange Commission and has been granted confidential treatment.
|
The agreements and other documents filed as exhibits to this report are not intended to provide factual information or other disclosure other than with respect to the terms of the agreements or other documents themselves, and should not be relied upon for that purpose. In particular, any representations and warranties made by the Company in these agreements or other documents were made solely within the specific context of the relevant agreement or document and may not describe the actual state of affairs as of the date they were made or at any other time.
112
SIGNATURES
Pursuant to the requirements of Section 13 or 15(d) of the Securities Exchange Act of 1934, the registrant has duly caused this Annual Report on Form 10-K to be signed on its behalf by the undersigned, thereunto duly authorized.
|
MASTERCARD INCORPORATED
|
||||
|
(Registrant)
|
||||
|
Date:
|
February 13, 2019
|
By:
|
|
/s/ AJAY BANGA
|
|
|
Ajay Banga
|
|||
|
|
President and Chief Executive Officer
|
|||
|
|
(Principal Executive Officer)
|
|||
Pursuant to the requirements of the Securities Exchange Act of 1934, this report has been signed below by the following persons on behalf of the registrant and in the capacities and on the dates indicated:
|
Date:
|
February 13, 2019
|
By:
|
|
/s/ AJAY BANGA
|
|
|
Ajay Banga
|
|||
|
|
President and Chief Executive Officer; Director
|
|||
|
|
(Principal Executive Officer)
|
|||
|
Date:
|
February 13, 2019
|
By:
|
|
/s/ MARTINA HUND-MEJEAN
|
|
|
Martina Hund-Mejean
|
|||
|
|
Chief Financial Officer
|
|||
|
|
(Principal Financial Officer)
|
|||
|
Date:
|
February 13, 2019
|
By:
|
|
/s/ SANDRA ARKELL
|
|
|
Sandra Arkell
|
|||
|
|
Corporate Controller
|
|||
|
|
(Principal Accounting Officer)
|
|||
|
Date:
|
February 13, 2019
|
By:
|
/s/ SILVIO BARZI
|
|
|
Silvio Barzi
|
||||
|
Director
|
||||
|
Date:
|
February 13, 2019
|
By:
|
/s/ DAVID R. CARLUCCI
|
|
|
David R. Carlucci
|
||||
|
Director
|
||||
|
Date:
|
February 13, 2019
|
By:
|
/s/ RICHARD K. DAVIS
|
|
|
Richard K. Davis
|
||||
|
Director
|
||||
|
Date:
|
February 13, 2019
|
By:
|
/s/ STEVEN J. FREIBERG
|
|
|
Steven J. Freiberg
|
||||
|
Director
|
||||
|
Date:
|
February 13, 2019
|
By:
|
/s/ JULIUS GENACHOWSKI
|
|
|
Julius Genachowski
|
||||
|
Director
|
||||
|
Date:
|
February 13, 2019
|
By:
|
/s/ CHOON PHONG GOH
|
|
|
Choon Phong Goh
|
||||
|
Director
|
||||
|
Date:
|
February 13, 2019
|
By:
|
/s/ RICHARD HAYTHORNTHWAITE
|
|
|
Richard Haythornthwaite
|
||||
|
Chairman of the Board; Director
|
||||
|
Date:
|
February 13, 2019
|
By:
|
/s/ MERIT E. JANOW
|
|
|
Merit E. Janow
|
||||
|
Director
|
||||
|
Date:
|
February 13, 2019
|
By:
|
/s/ NANCY KARCH
|
|
|
Nancy Karch
|
||||
|
Director
|
||||
|
Date:
|
February 13, 2019
|
By:
|
/s/ OKI MATSUMOTO
|
|
|
Oki Matsumoto
|
||||
|
Director
|
||||
|
Date:
|
February 13, 2019
|
By:
|
/s/ RIMA QURESHI
|
|
|
Rima Qureshi
|
||||
|
Director
|
||||
|
Date:
|
February 13, 2019
|
By:
|
/s/ JOSÉ OCTAVIO REYES LAGUNES
|
|
|
José Octavio Reyes Lagunes
|
||||
|
Director
|
||||
|
Date:
|
February 13, 2019
|
By:
|
/s/ GABRIELLE SULZBERGER
|
|
|
Gabrielle Sulzberger
|
||||
|
Director
|
||||
|
Date:
|
February 13, 2019
|
By:
|
/s/ JACKSON TAI
|
|
|
Jackson Tai
|
||||
|
Director
|
||||
113
TABLE OF CONTENTS
Part IItem 1. BusinessNote 20 (legal and Regulatory Proceedings)Note 15 (stockholders Equity)Item 1A. Risk FactorsItem 1B. Unresolved Staff CommentsItem 2. PropertiesItem 3. Legal ProceedingsNote 12 (accrued Expenses and Accrued Litigation)Item 4. Mine Safety DisclosuresPart IIItem 5. Market For Registrant S Common Equity, Related Stockholder Matters and Issuer Purchases Of Equity SecuritiesItem 6. Selected Financial DataItem 7. Management S Discussion and Analysis Of Financial Condition and Results Of OperationsNote 1 (summary Of Significant Accounting Policies)Note 19 (income Taxes)Note 22 (foreign Exchange Risk Management)Note 3 (revenue)Note 21 (settlement and Other Risk Management)Note 14 (debt)Note 7 (fair Value and Investment Securities)Note 2 (acquisitions)Item 7A. Quantitative and Qualitative Disclosures About Market RiskItem 8. Financial Statements and Supplementary DataNote 1. Summary Of Significant Accounting PoliciesNote 13 (pension, Postretirement and Savings Plans)Note 5 (cash, Cash Equivalents, Restricted Cash and Restricted Cash Equivalents)Note 2. AcquisitionsNote 3. RevenueNote 4. Earnings Per ShareNote 5. Cash, Cash Equivalents, Restricted Cash and Restricted Cash EquivalentsNote 6. Supplemental Cash FlowsNote 7. Fair Value and Investment SecuritiesNote 8 (prepaid Expenses and Other Assets)Note 8. Prepaid Expenses and Other AssetsNote 9. Property, Plant and EquipmentNote 10. GoodwillNote 11. Other Intangible AssetsNote 12. Accrued Expenses and Accrued LitigationNote 13. Pension, Postretirement and Savings PlansNote 14. DebtNote 15. Stockholders EquityNote 16. Accumulated Other Comprehensive Income (loss)Note 17. Share-based PaymentsNote 18. CommitmentsNote 19. Income TaxesNote 20. Legal and Regulatory ProceedingsNote 21. Settlement and Other Risk ManagementNote 22. Foreign Exchange Risk ManagementNote 23. Segment ReportingItem 9. Changes in and Disagreements with Accountants on Accounting and Financial DisclosureItem 9A. Controls and ProceduresItem 9B. Other InformationPart IIIItem 10. Directors, Executive Officers and Corporate GovernanceItem 11. Executive CompensationItem 12. Security Ownership Of Certain Beneficial Owners and Management and Related Stockholder MattersItem 13. Certain Relationships and Related Transactions, and Director IndependenceItem 14. Principal Accountant Fees and ServicesPart IVItem 15. Exhibits and Financial Statement SchedulesItem 16. Form 10-k Summary