MID AMERICA APARTMENT COMMUNITIES INC.
10-Ks and 10-Qs
|
|
|
|
|
|
|
|
|
|
|
|
|
|
|
|
|
|
|
|
|
|
|
|
|
|
|
|
|
|
|
|
|
|
|
|
|
|
|
|
|
|
|
|
|
|
|
|
|
|
|
|
|
|
|
|
|
|
|
|
UNITED STATES
|
|||||
|
SECURITIES AND EXCHANGE COMMISSION
|
|||||
|
Washington, D.C. 20549
|
|||||
|
FORM 10-K
|
|||||
|
(Mark One)
|
|||||
|
ý
|
ANNUAL REPORT PURSUANT TO SECTION 13 OR 15(d) OF THE SECURITIES EXCHANGE ACT OF 1934
For the fiscal year ended December 31, 2018 |
||||
|
OR
|
|||||
|
o
|
TRANSITION REPORT PURSUANT TO SECTION 13 OR 15(d) OF THE SECURITIES EXCHANGE ACT OF 1934
For the transition period from __________ to ___________ |
||||
|
Commission File Number 001-12762 (Mid-America Apartment Communities, Inc.)
|
|||||
|
Commission File Number 333-190028-01 (Mid-America Apartments, L.P.)
|
|||||
|
MID-AMERICA APARTMENT COMMUNITIES, INC.
|
|||||
|
MID-AMERICA APARTMENTS, L.P.
|
|||||
|
(Exact name of registrant as specified in its charter)
|
|||||
|
Tennessee (Mid-America Apartment Communities, Inc.)
|
62-1543819
|
||||
|
Tennessee (Mid-America Apartments, L.P.)
|
62-1543816
|
||||
|
(State or other jurisdiction of incorporation or organization)
|
(I.R.S. Employer Identification No.)
|
||||
|
6815 Poplar Avenue, Suite 500, Germantown, Tennessee, 38138
|
|||||
|
(Address of principal executive offices) (Zip Code)
|
|||||
|
Registrant's telephone number, including area code:
(901) 682-6600
|
|||||
|
Securities registered pursuant to Section 12(b) of the Act:
|
|||||
|
Title of each class
|
Name of each exchange on which registered
|
||||
|
Common Stock, par value $.01 per share (Mid-America Apartment Communities, Inc.)
|
New York Stock Exchange
|
||||
|
8.50% Series I Cumulative Redeemable Preferred Stock, $.01 par value per share (Mid-America Apartment Communities, Inc.)
|
New York Stock Exchange
|
||||
|
Securities registered pursuant to Section 12(g) of the Act: None.
|
|||
|
Indicate by check mark if the registrant is a well-known seasoned issuer, as defined in Rule 405 of the Securities Act.
|
|||
|
Mid-America Apartment Communities, Inc.
|
Yes
ý
|
No
o
|
|
|
Mid-America Apartments, L.P.
|
Yes
o
|
No
ý
|
|
|
Indicate by check mark if the registrant is not required to file reports pursuant to Section 13 or Section 15(d) of the Act.
|
|||
|
Mid-America Apartment Communities, Inc.
|
Yes
o
|
No
ý
|
|
|
Mid-America Apartments, L.P.
|
Yes
o
|
No
ý
|
|
|
Indicate by check mark whether the registrant (1) has filed all reports required to be filed by Section 13 or 15(d) of the Securities Exchange Act of 1934 during the preceding
|
|||
|
12 months (or for such shorter period that the registrant was required to file such reports), and (2) has been subject to such filing requirements for the past 90 days.
|
|||
|
Mid-America Apartment Communities, Inc.
|
Yes
ý
|
No
o
|
|
|
Mid-America Apartments, L.P.
|
Yes
ý
|
No
o
|
|
|
Indicate by check mark whether the registrant has submitted electronically every Interactive Data File required to be submitted pursuant to Rule 405 of Regulation S-T (§232.405 of this chapter)
|
|||
|
during the preceding 12 months (or for such shorter period that the registrant was required to submit such files).
|
|||
|
Mid-America Apartment Communities, Inc.
|
Yes
ý
|
No
o
|
|
|
Mid-America Apartments, L.P.
|
Yes
ý
|
No
o
|
|
|
Indicate by check mark if disclosure of delinquent filers pursuant to Item 405 of Regulation S-K (§229.405 of this chapter) is not contained herein, and will not be contained, to the best of
|
|||
|
registrant's knowledge, in definitive proxy or information statements incorporated by reference in Part III of this Form 10-K or any amendment to this Form 10-K.
o
|
|||
|
Indicate by check mark whether the registrant is a large accelerated filer, an accelerated filer, a non-accelerated filer, a smaller reporting company, or an emerging growth company. See the
|
|||
|
definitions of "large accelerated filer," "accelerated filer," "smaller reporting company," and "emerging growth company" in Rule 12b-2 of the Exchange Act.
|
|||
|
Mid-America Apartment Communities, Inc.
|
||||
|
Large accelerated filer
ý
|
Accelerated filer
o
|
Non-accelerated filer
o
|
Smaller reporting company
o
|
Emerging growth company
o
|
|
Mid-America Apartments, L.P.
|
||||
|
Large accelerated filer
o
|
Accelerated filer
o
|
Non-accelerated filer
ý
|
Smaller reporting company
o
|
Emerging growth company
o
|
|
If an emerging growth company, indicate by check mark if the registrant has elected not to use the extended transition period for complying with any new or revised financial accounting standards provided pursuant to Section 13(a) of the Exchange Act.
o
|
||||
|
Indicate by check mark whether the registrant is a shell company (as defined in Rule 12b-2 of the Exchange Act).
|
|||
|
Mid-America Apartment Communities, Inc.
|
Yes
o
|
No
ý
|
|
|
Mid-America Apartments, L.P.
|
Yes
o
|
No
ý
|
|
The aggregate market value of the 80,246,503 shares of common stock of Mid-America Apartment Communities, Inc. held by non-affiliates was approximately
$8.1 billion
based on the closing price of $100.67 as reported on the New York Stock Exchange on June 29, 2018. This calculation excludes shares of common stock held by the registrant's officers and directors and each person known by the registrant to beneficially own more than 5% of the registrant's outstanding shares, as such persons may be deemed to be affiliates. This determination of affiliate status should not be deemed conclusive for any other purpose. As of
February 18, 2019
there were
113,888,340
shares of Mid-America Apartment Communities, Inc. common stock outstanding.
There is no public trading market for the partnership units of Mid-America Apartments, L.P. As a result, an aggregate market value of the partnership units of Mid-America Apartments, L.P. cannot be determined.
Documents Incorporated by Reference
Portions of the proxy statement for the annual shareholders meeting of Mid-America Apartment Communities, Inc. to be held on May 21, 2019 are incorporated by reference into Part III of this report. We expect to file our proxy statement within 120 days after
December 31, 2018
.
|
MID-AMERICA APARTMENT COMMUNITIES, INC.
MID-AMERICA APARTMENTS, L.P.
|
||
|
|
|
|
|
TABLE OF CONTENTS
|
||
|
Item
|
|
Page
|
|
|
PART I
|
|
|
1.
|
||
|
1A.
|
||
|
1B.
|
||
|
2.
|
||
|
3.
|
||
|
4.
|
||
|
|
|
|
|
|
PART II
|
|
|
|
|
|
|
5.
|
||
|
6.
|
||
|
7.
|
||
|
7A.
|
||
|
8.
|
||
|
9.
|
||
|
9A.
|
||
|
9B.
|
||
|
|
|
|
|
|
PART III
|
|
|
|
|
|
|
10.
|
||
|
11.
|
||
|
12.
|
||
|
13.
|
||
|
14.
|
||
|
|
|
|
|
|
PART IV
|
|
|
|
|
|
|
15.
|
||
|
16.
|
|
|
Explanatory Note
This report combines the Annual Reports on Form 10-K for the year ended
December 31, 2018
of Mid-America Apartment Communities, Inc., a Tennessee corporation, and Mid-America Apartments, L.P., a Tennessee limited partnership, of which Mid-America Apartment Communities, Inc. is the sole general partner. Mid-America Apartment Communities, Inc. and its
96.5%
owned subsidiary, Mid-America Apartments, L.P., are both required to file annual reports under the Securities Exchange Act of 1934, as amended.
Unless the context otherwise requires, all references in this Annual Report on Form 10-K to "MAA" refer only to Mid-America Apartment Communities, Inc., and not any of its consolidated subsidiaries. Unless the context otherwise requires, all references in this report to "we," "us," "our," or the "Company" refer collectively to Mid-America Apartment Communities, Inc., together with its consolidated subsidiaries, including Mid-America Apartments, L.P. Unless the context otherwise requires, all references in this report to the "Operating Partnership" or "MAALP" refer to Mid-America Apartments, L.P. together with its consolidated subsidiaries. "Common stock" refers to the common stock of MAA, "preferred stock" refers to the preferred stock of MAA, and "shareholders" refers to the holders of shares of MAA’s common stock or preferred stock, as applicable. The common units of limited partnership interest in the Operating Partnership are referred to as "OP Units" and the holders of the OP Units are referred to as "common unitholders".
As of
December 31, 2018
, MAA owned
113,844,267
OP Units (
96.5%
of the total number of OP Units). MAA conducts substantially all of its business and holds substantially all of its assets, directly or indirectly, through the Operating Partnership, and by virtue of its ownership of the OP Units and being the Operating Partnership's sole general partner, MAA has the ability to control all of the day-to-day operations of the Operating Partnership.
We believe combining the Annual Reports on Form 10-K of MAA and the Operating Partnership, including the notes to the consolidated financial statements, into this report results in the following benefits:
|
•
|
enhances investors' understanding of MAA and the Operating Partnership by enabling investors to view the business as a whole in the same manner that management views and operates the business;
|
|
•
|
eliminates duplicative disclosure and provides a more streamlined and readable presentation since a substantial portion of the disclosure in this report applies to both MAA and the Operating Partnership; and
|
|
•
|
creates time and cost efficiencies through the preparation of one combined report instead of two separate reports.
|
MAA is a multifamily focused, self-administered and self-managed real estate investment trust, or REIT. Management operates MAA and the Operating Partnership as one business. We believe it is important to understand the few differences between MAA and the Operating Partnership in the context of how MAA and the Operating Partnership operate as a consolidated company. MAA and the Operating Partnership are structured as an "umbrella partnership REIT," or UPREIT. MAA's interest in the Operating Partnership entitles MAA to share in cash distributions from, and in the profits and losses of, the Operating Partnership in proportion to MAA's percentage interest therein and entitles MAA to vote on substantially all matters requiring a vote of the partners. MAA's only material asset is its ownership of limited partnership interests in the Operating Partnership (other than cash held by MAA from time-to-time); therefore, MAA does not conduct business itself, other than acting as the sole general partner of the Operating Partnership, issuing public equity from time-to-time and guaranteeing certain debt of the Operating Partnership. The Operating Partnership holds, directly or indirectly, all of the real estate assets. Except for net proceeds from public equity issuances by MAA, which are contributed to the Operating Partnership in exchange for limited partnership interests, the Operating Partnership generates the capital required by the Company's business through the Operating Partnership's operations, direct or indirect incurrence of indebtedness and issuance of OP Units.
The presentation of MAA's shareholders' equity and the Operating Partnership's capital are the principal areas of difference between the consolidated financial statements of MAA and those of the Operating Partnership. MAA's shareholders' equity may include shares of preferred stock, shares of common stock, additional paid-in capital, cumulative earnings, cumulative distributions, noncontrolling interest, treasury shares, accumulated other comprehensive income and redeemable common stock. The Operating Partnership's capital may include common capital and preferred capital of the general partner (MAA), limited partners' common capital and preferred capital, noncontrolling interest, accumulated other comprehensive income and redeemable common units. Holders of OP Units (other than MAA and its subsidiaries) may require the Operating Partnership to redeem their OP Units from time to time, in which case the Operating Partnership may, at its option, pay the redemption price either in cash (in an amount per OP Unit equal, in general, to the average closing price of MAA's common stock on the New York Stock Exchange, or NYSE, over a specified period prior to the redemption date) or by delivering one share of MAA's common stock (subject to adjustment under specified circumstances) for each OP Unit so redeemed.
1
In order to highlight the material differences between MAA and the Operating Partnership, this Annual Report on Form 10-K includes sections that separately present and discuss areas that are materially different between MAA and the Operating Partnership, including:
|
•
|
the selected financial data in Item 6 of this report;
|
|
•
|
the consolidated financial statements in Item 8 of this report;
|
|
•
|
certain accompanying notes to the consolidated financial statements, including Note 3 - Earnings per Common Share of MAA and Note 4 - Earnings per OP Unit of MAALP; Note 9 - Shareholders' Equity of MAA and Note 10 - Partners' Capital of MAALP; and Note 16 - Selected Quarterly Financial Information of MAA (Unaudited) and Note 17 - Selected Quarterly Financial
Information of MAALP (Unaudited);
|
|
•
|
the controls and procedures in Item 9A of this report; and
|
|
•
|
the certifications included as Exhibits 31 and 32 to this report.
|
In the sections that combine disclosures for MAA and the Operating Partnership, this report refers to actions or holdings as being actions or holdings of the Company. Although the Operating Partnership (directly or indirectly through one of its subsidiaries) is generally the entity that enters into contracts, holds assets and issues debt, management believes this presentation is appropriate for the reasons set forth above and because the business is one enterprise, in that we operate the business through the Operating Partnership.
PART I
Risks Associated with Forward Looking Statements
We consider this and other sections of this Annual Report on Form 10-K to contain forward-looking statements within the meaning of Section 27A of the Securities Act of 1933, as amended, or the Securities Act, and Section 21E of the Securities Exchange Act of 1934, as amended, or the Exchange Act, with respect to our expectations for future periods. Forward-looking statements do not discuss historical fact, but instead include statements related to expectations, projections, intentions or other items related to the future. Such forward-looking statements include, without limitation, statements concerning forecasted operating performance and results, property acquisitions and dispositions, joint venture activity, development and renovation activity as well as other capital expenditures, capital raising activities, rent and expense growth, occupancy, financing activities, and interest rate and other economic expectations. Words such as "expects," "anticipates," "intends," "plans," "believes," "seeks," "estimates," and variations of such words and similar expressions are intended to identify such forward-looking statements. Such forward-looking statements involve known and unknown risks, uncertainties and other factors, as described below, which may cause our actual results, performance or achievements to be materially different from the results of operations, financial conditions or plans expressed or implied by such forward-looking statements. Although we believe that the assumptions underlying the forward-looking statements contained herein are reasonable, any of the assumptions could be inaccurate, and therefore such forward-looking statements included in this report may not prove to be accurate. In light of the significant uncertainties inherent in the forward-looking statements included herein, the inclusion of such information should not be regarded as a representation by us or any other person that the results or conditions described in such statements or our objectives and plans will be achieved.
The following factors, among others, could cause our actual results, performance or achievements to differ materially from those expressed or implied in the forward-looking statements:
|
•
|
inability to generate sufficient cash flows due to market conditions, changes in supply and/or demand, competition, uninsured losses, changes in tax and housing laws, or other factors;
|
|
•
|
exposure, as a multifamily focused REIT, to risks inherent in investments in a single industry and sector;
|
|
•
|
adverse changes in real estate markets, including, but not limited to, the extent of future demand for multifamily units in our significant markets, barriers of entry into new markets which we may seek to enter in the future, limitations on our ability to increase rental rates, competition, our ability to identify and consummate attractive acquisitions or development projects on favorable terms, our ability to consummate any planned dispositions in a timely manner on acceptable terms, and our ability to reinvest sale proceeds in a manner that generates favorable returns;
|
|
•
|
failure of new acquisitions to achieve anticipated results or be efficiently integrated;
|
|
•
|
failure of development communities to be completed, if at all, within budget and on a timely basis or to lease-up as anticipated;
|
|
•
|
unexpected capital needs;
|
|
•
|
changes in operating costs, including real estate taxes, utilities and insurance costs;
|
|
•
|
losses from catastrophes in excess of our insurance coverage;
|
|
•
|
ability to obtain financing at favorable rates, if at all, and refinance existing debt as it matures;
|
2
|
•
|
level and volatility of interest or capitalization rates or capital market conditions;
|
|
•
|
loss of hedge accounting treatment for interest rate swaps;
|
|
•
|
the continuation of the good credit of our interest rate swap providers;
|
|
•
|
price volatility, dislocations and liquidity disruptions in the financial markets and the resulting impact on financing;
|
|
•
|
the effect of any rating agency actions on the cost and availability of new debt financing;
|
|
•
|
significant decline in market value of real estate serving as collateral for mortgage obligations;
|
|
•
|
significant change in the mortgage financing market that would cause single-family housing, either as an owned or rental product, to become a more significant competitive product;
|
|
•
|
our ability to continue to satisfy complex rules in order to maintain our status as a REIT for federal income tax purposes, the ability of the Operating Partnership to satisfy the rules to maintain its status as a partnership for federal income tax purposes, the ability of our taxable REIT subsidiaries to maintain their status as such for federal income tax purposes, and our ability and the ability of our subsidiaries to operate effectively within the limitations imposed by these rules;
|
|
•
|
inability to attract and retain qualified personnel;
|
|
•
|
cyber liability or potential liability for breaches of our privacy or information security systems;
|
|
•
|
potential liability for environmental contamination;
|
|
•
|
adverse legislative or regulatory tax changes;
|
|
•
|
legal proceedings relating to various issues, which, among other things, could result in a class action lawsuit;
|
|
•
|
compliance costs associated with laws requiring access for disabled persons; and
|
|
•
|
other risks identified in this Annual Report on Form 10-K including under the caption "Item 1A. Risk Factors" and, from time to time, in other reports we file with the Securities and Exchange Commission, or the SEC, or in other documents that we publicly disseminate.
|
New factors may also emerge from time to time that could have a material adverse effect on our business. Except as required by law, we undertake no obligation to publicly update or revise forward-looking statements contained in this Annual Report on Form 10-K to reflect events, circumstances or changes in expectations after the date on which this Annual Report on Form 10-K is filed.
Item 1. Business.
Overview
MAA is a multifamily focused, self-administered and self-managed real estate investment trust, or REIT. We own, operate, acquire and selectively develop apartment communities located in the Southeast, Southwest and Mid-Atlantic regions of the United States. As of
December 31, 2018
, we maintained full or partial ownership of apartment communities and commercial properties across 17 states and the District of Columbia, summarized as follows:
|
Multifamily
|
Communities
|
Units
|
|||
|
Consolidated
|
303
|
|
100,595
|
|
|
|
Unconsolidated
|
1
|
|
269
|
|
|
|
Total
|
304
|
|
100,864
|
|
|
|
Commercial
|
Properties
|
Sq. Ft.
(1)
|
|||
|
Consolidated
|
4
|
|
260,000
|
|
|
(1)
Excludes commercial space located at our multifamily apartment communities, which totals approximately
615,000
square feet of gross leasable space.
Our business is conducted principally through the Operating Partnership. MAA is the sole general partner of the Operating Partnership, holding
113,844,267
OP Units, comprising a
96.5%
partnership interest in the Operating Partnership as of
December 31, 2018
. MAA and MAALP were formed in Tennessee in 1993. As of
December 31, 2018
, we had
2,508
full-time employees and
44
part-time employees.
3
Business Objectives
Our primary business objectives are to protect and grow existing property values, to maintain a stable and increasing cash flow that will fund our dividends and distributions through all parts of the real estate investment cycle, and to create shareholder value by growing in a disciplined manner. To achieve these objectives, we intend to continue to pursue the following goals and strategies:
|
•
|
effectively and efficiently operate our existing properties with an intense property and asset management focus and a decentralized structure;
|
|
•
|
manage real estate investment cycles by taking an opportunistic approach to buying, selling, developing and renovating apartment communities;
|
|
•
|
diversify investment capital across markets in which we operate to achieve a balanced portfolio and minimize volatile operating performance; and
|
|
•
|
actively manage our capital structure to enhance predictability of earnings to fund our dividends and distributions.
|
Operations
Our goal is to generate return on investment collectively and in each apartment community by increasing revenues, controlling operating expenses, maintaining high occupancy levels and reinvesting in the income producing capacity of each apartment community as appropriate. The steps taken to meet these objectives include:
|
•
|
providing management information and improved customer services through technology innovations;
|
|
•
|
utilizing systems to enhance property managers’ ability to optimize revenue by adjusting rental rates in response to local market conditions and individual unit amenities;
|
|
•
|
implementing programs to control expenses through investment in cost-saving initiatives;
|
|
•
|
analyzing individual asset productivity performances to identify best practices and improvement areas;
|
|
•
|
maintaining the physical condition of each property through ongoing capital investments;
|
|
•
|
improving the "curb appeal" of the apartment communities through extensive landscaping and exterior improvements, and repositioning apartment communities from time-to-time to enhance or maintain market positions;
|
|
•
|
managing lease expirations to align with peak leasing traffic patterns and to maximize productivity of property staffing;
|
|
•
|
allocating additional capital, including capital for selective interior and exterior improvements;
|
|
•
|
compensating employees through performance-based compensation and stock ownership programs; and
|
|
•
|
maintaining a hands-on management style and "flat" organizational structure that emphasizes property level decision making coupled with asset management and senior management's monitoring.
|
We believe that our decentralized operating structure capitalizes on specific market knowledge, provides greater personal accountability than a centralized structure and is beneficial in the acquisition and redevelopment processes. To support this decentralized operational structure, senior management, along with various asset management functions, are proactively involved in supporting and reviewing property management through extensive reporting processes and frequent on-site visits. To maximize the amount of information shared between senior management and the properties on a real-time basis, we utilize a web-based property management system. The system contains property and accounting modules that allow for operating efficiencies and continued expense control, provide for various expanded revenue management practices, and improve the support provided to on-site property operations. We use a "yield management" pricing program that helps our property managers optimize rental revenues, and we also utilize purchase order and accounts payable software to provide improved controls and management information.
Investment in technology continues to drive operating efficiencies in our business and help us to better meet the changing needs of our residents. Our residents have the ability to conduct business with us 24 hours a day, 7 days a week and complete online leasing applications and renewals via the use of our web-based resident Internet portal. Interacting with our residents through such technology has allowed us to improve resident satisfaction ratings and increase the efficiency of our operating teams.
Acquisitions
One of our growth strategies is to acquire apartment communities that are located in various markets throughout the Southeast, Southwest and Mid-Atlantic regions of the United States. Acquisitions, along with dispositions, help us achieve and maintain our desired product mix, geographic diversification and asset allocation. Portfolio growth allows for maximizing the efficiency of the existing management and overhead structure. We have extensive experience in the acquisition of apartment
4
communities. We will continue to evaluate opportunities that arise, and we will utilize this strategy to increase our number of apartment communities in strong and growing markets.
We acquired the following properties during the year ended
December 31, 2018
:
|
Multifamily Acquisition
|
Market
|
Units
|
Closing Date
|
|||
|
Sync 36
|
Denver, CO
|
374
|
April 26, 2018
|
|||
|
Commercial Acquisition
|
Market
|
Sq Ft
|
Closing Date
|
|||
|
Hue Retail
(1)
|
Raleigh, NC
|
7,500
|
August 1, 2018
|
|||
|
Land Acquisition
|
Market
|
Acres
|
Closing Date
|
|||
|
Westminster
|
Denver, CO
|
10
|
October 1, 2018
|
|||
|
Long Point Road
|
Houston, TX
|
9
|
November 1, 2018
|
|||
(1)
We acquired the ground floor retail portion of one of our existing multifamily apartment communities.
Dispositions
We sell apartment communities and other assets that no longer meet our long-term strategy or when market conditions are favorable, and we redeploy the proceeds from those sales to acquire, develop and redevelop additional apartment communities and rebalance our portfolio across or within geographic regions. Dispositions also allow us to realize a portion of the value created through our investments and provide additional liquidity. We are then able to redeploy the net proceeds from our dispositions in lieu of raising additional capital. In deciding to sell an apartment community, we consider current market conditions and generally solicit competing bids from unrelated parties for these individual properties, considering the sales price and other key terms of each proposal. We also consider portfolio dispositions when such a structure is useful to maximize proceeds and efficiency of execution. During the year ended
December 31, 2018
, we disposed of
five
land parcels totaling approximately 76 acres.
Development
As another part of our growth strategy, we invest in a limited number of development projects. Development activities may be conducted through wholly-owned affiliated companies or through joint ventures with unaffiliated parties. Typically, fixed price construction contracts are signed with unrelated parties to minimize construction risk. We typically manage the leasing portion of the project as units become available for lease. We may also engage in limited expansion development opportunities on existing communities in which we typically serve as the developer. While we seek opportunistic new development investments offering attractive long-term investment returns, we intend to maintain a total development commitment that we consider modest in relation to our total balance sheet and investment portfolio. During the year ended
December 31, 2018
, we incurred
$57.1 million
in development costs and completed 3 development projects.
The following multifamily projects were under development as of
December 31, 2018
(dollars in thousands):
|
Project:
|
Market
|
Total Units
|
Units Completed
|
Cost to Date
|
Budgeted Cost
|
Estimated Cost Per Unit
|
Expected Completion
|
|||||||||
|
Post Parkside at Wade III
|
Raleigh, NC
|
150
|
—
|
$
|
7,235
|
|
$
|
25,000
|
|
$
|
167
|
|
4th Quarter 2019
|
|||
|
Post Sierra at Frisco Bridges II
|
Dallas, TX
|
348
|
—
|
12,013
|
|
69,000
|
|
198
|
|
3rd Quarter 2020
|
||||||
|
Sync 36 II
|
Denver, CO
|
79
|
—
|
11,685
|
|
24,500
|
|
310
|
|
4th Quarter 2019
|
||||||
|
577
|
—
|
$
|
30,933
|
|
$
|
118,500
|
|
|||||||||
Redevelopment
We focus on both interior unit upgrades and exterior amenities above and beyond routine capital upkeep on existing apartment communities across our portfolio that we believe have the ability to support additional rent growth. During the year ended
December 31, 2018
, we renovated
8,155
units at an average cost of
$6,138
per unit, achieving average rental rate increases of
10.5%
above the normal market rate for similar but non-renovated units.
Capital Structure
We use a combination of debt and equity sources to fund our business objectives. We maintain a capital structure, focused on maintaining access, flexibility and low costs, that we believe allows us to proactively source potential investment
5
opportunities in the marketplace. We structure our debt maturities to avoid disproportionate exposure in any given year. Our primary debt financing strategy is to access the unsecured debt markets to provide our debt capital needs, but we also maintain a limited amount of secured debt and maintain our access to both the secured and unsecured debt markets for maximum flexibility. We also believe that we have significant access to the equity capital markets.
As of
December 31, 2018
,
28.6%
of our total market capitalization consisted of debt borrowings, including
25.6%
under unsecured credit facilities and unsecured senior notes and
3.0%
under secured borrowings. We currently intend to target our total debt, net of cash held, to a range of approximately 32% to 38% of the undepreciated book value of our assets. Our charter and bylaws do not limit our debt levels and our Board of Directors can modify this policy at any time. We may issue new equity to maintain our debt within the target range. Covenants for our unsecured senior notes limit our total debt to 60% or less of our adjusted total assets (as defined in the covenants for the bonds issued by MAALP). As of
December 31, 2018
, our total debt was approximately
32.6%
of our adjusted total assets. We continuously review opportunities for lowering our cost of capital. We plan to continue using unsecured debt in order to take advantage of the lower cost of capital and flexibility provided by these markets. We will evaluate opportunities to repurchase shares when we believe that our share price is significantly below our net present value. We also look for opportunities where we can acquire or develop apartment communities, selectively funded or partially funded by sales of equity securities, when appropriate opportunities arise. We focus on improving the net present value of our investments by generating cash flows from our portfolio of assets above the estimated total cost of debt and equity capital. We routinely make new investments when we believe it will be accretive to shareholder value over the life of the investments.
Competition
All of our apartment communities are located in areas that include other apartment communities. Occupancy and rental rates are affected by the number of competitive apartment communities in a particular area. The owners of competing apartment communities may have greater resources than us, and the managers of these apartment communities may have more experience than our management. Moreover, single-family rental housing, manufactured housing, condominiums and the new and existing home markets provide housing alternatives to potential residents of apartment communities. Competition for new residents is generally intense across all of our markets. Some competing apartment communities offer features that our apartment communities do not have. Competing apartment communities can use concessions or lower rents to obtain temporary competitive advantages. Also, some competing apartment communities are larger or newer than our apartment communities. The competitive position of each apartment community is different depending upon many factors including sub-market supply and demand. In addition, other real estate investors compete with us to acquire existing properties and to develop new properties. These competitors include insurance companies, pension and investment funds, public and private real estate companies, investment companies and other public and private apartment REITs, some of which may have greater resources or lower capital costs than we do.
We believe, however, that we are generally well-positioned to compete effectively for residents and investments. We believe our competitive advantages include:
|
•
|
a fully integrated organization with property management, development, redevelopment, acquisition, marketing, sales and financing expertise;
|
|
•
|
scalable operating and support systems, which include automated systems to meet the changing technological needs of our residents;
|
|
•
|
access to a wide variety of debt and equity capital sources;
|
|
•
|
geographic diversification with a presence in 38 defined Metropolitan Statistical Areas across the Southeast, Southwest and Mid-Atlantic regions of the United States; and
|
|
•
|
significant presence in many of our major markets that allows us to be a local operating expert.
|
Moving forward, we plan to continue to optimize lease expiration management, improve expense control, increase resident retention efforts and align employee incentive plans with our performance. We also plan to continue to make capital improvements to both our apartment communities and individual units on a regular basis in order to maintain a competitive position in each individual market. We believe this plan of operation, coupled with the portfolio’s strengths in targeting residents across a geographically diverse platform, should position us for continued operational upside.
Environmental Matters
As a part of our standard apartment community acquisition and development processes, we generally obtain environmental studies of the sites from outside environmental engineering firms. The purpose of these studies is to identify potential sources of contamination at the site and to assess the status of environmental regulatory compliance. These studies
6
generally include historical reviews of the site, reviews of certain public records, preliminary investigations of the site and surrounding properties, inspection for the presence of asbestos, poly-chlorinated biphenyls and underground storage tanks and the preparation and issuance of written reports. Depending on the results of these studies, more invasive procedures, such as soil sampling or ground water analysis, may be performed to investigate potential sources of contamination. These studies must be satisfactorily completed before we take ownership of an acquisition or development property; however, no assurance can be given that the studies or additional documents reviewed identify all significant environmental risks. See "Risk Factors - Risks Relating to Our Real Estate Investments and Our Operations - Environmental problems are possible and can be costly."
The environmental studies we received on properties that we have acquired have not revealed any material environmental liabilities. Should any potential environmental risks or conditions be discovered during our due diligence process, the potential costs of remediation will be assessed carefully and factored into the cost of acquisition, assuming the identified risks and factors are deemed to be manageable and within reason. We are not aware of any existing conditions that we believe would be considered a material environmental liability. Nevertheless, it is possible that the studies do not reveal all environmental risks or that there are material environmental liabilities of which we are not aware. Moreover, no assurance can be given concerning future laws, ordinances or regulations, or the potential introduction of hazardous or toxic substances by neighboring properties or residents.
Merger with Post Properties
We completed our merger with Post Properties, Inc., or Post Properties, on December 1, 2016. Accordingly, the consolidated net assets and results of operations of Post Properties are included in our consolidated financial statements from and after the merger closing date.
Qualification as a Real Estate Investment Trust
MAA has elected to be taxed as a REIT under the Internal Revenue Code of 1986, as amended, or the Code. To continue to qualify as a REIT, MAA must continue to meet certain tests which, among other things, generally require that our assets consist primarily of real estate assets, our income be derived primarily from real estate assets, and that we distribute at least 90% of our REIT taxable income (other than our net capital gains) to our shareholders annually. If MAA maintains its qualification as a REIT, MAA generally will not be subject to U.S. federal income taxes at the corporate level on its net income to the extent it distributes such net income to its shareholders annually. Even if MAA continues to qualify as a REIT, it will continue to be subject to certain federal, state and local taxes on its income and its property. In
2018
, MAA paid total distributions of
$3.69
per share of common stock to its shareholders, which was above the 90% REIT distribution requirement and was in excess of REIT taxable income.
Recent Developments
In February 2019, we closed on the disposition of a 0.4 acre land parcel located in the Atlanta, Georgia market, resulting in a net gain of $9.0 million on the sale of non-depreciable real estate assets recognized in the first quarter of 2019. The gain on sale of non-depreciable real estate assets was not reflected in our initial earnings guidance for the first quarter of 2019 or the full year of 2019. We will review our 2019 earnings guidance in our earnings release and conference call discussing results for the quarter ending March 31, 2019.
In February 2019, we entered into a
$191.3 million
fixed rate secured property mortgage with a fixed rate of 4.43%, maturing in February 2049.
Website Access to Our Reports
MAA and the Operating Partnership file combined periodic reports with the SEC. Our Annual Reports on Form 10-K, along with our Quarterly Reports on Form 10-Q, Current Reports on Form 8-K and any amendments to those reports, are available on our website at https://www.maac.com as soon as reasonably practicable after such material is electronically filed with, or furnished to, the SEC. Reference to our website does not constitute incorporation by reference of the information contained on the site and should not be considered part of this Annual Report on Form 10-K. All of the aforementioned materials may also be obtained free of charge by contacting our Investor Relations Department, 6815 Poplar Avenue, Suite 500, Germantown, TN 38138.
7
Item 1A. Risk Factors.
In addition to the other information contained in this Annual Report on Form 10-K, we have identified the following additional risks and uncertainties that may have a material adverse effect on our business prospects, financial condition or results of operations. Investors should carefully consider the risks described below before making an investment decision. Our business faces significant risks and the risks described below may not be the only risks we face. Additional risks not presently known to us or that we currently believe are immaterial may also significantly impact our business operations. If any of these risks occur, our business prospects, financial condition or results of operations could suffer, the market price of our capital stock and the trading price of our debt securities could decline and you could lose all or part of your investment in our capital stock or debt securities.
Risks Related to Our Real Estate Investments and Our Operations
Unfavorable market and economic conditions could adversely affect occupancy levels, rental revenues and the value of our properties.
Unfavorable market conditions in the areas in which we operate and unfavorable economic conditions may significantly affect our occupancy levels, our rental rates and collections, the value of the properties and our ability to acquire or dispose of apartment communities on economically favorable terms. Our ability to lease our apartment communities at favorable rates is adversely affected by the increase in supply in the multifamily and other rental markets and is dependent upon the overall level in the economy, which is adversely affected by, among other things, job losses and unemployment levels, personal debt levels, a downturn in the housing market, stock market volatility and uncertainty about the future. Some of our major expenses generally do not decline when related rents decline. We would expect that declines in our occupancy levels, rental revenues and/or the values of our apartment communities would cause us to have less cash available to make payments on our debt and to make distributions, which could adversely affect our financial condition or the market value of our securities. Factors that may affect our occupancy levels, our rental revenues, and/or the value of our apartment communities include the following, among others:
|
•
|
downturns in global, national, regional and local economic conditions, particularly increases in unemployment;
|
|
•
|
declines in mortgage interest rates and home pricing, making alternative housing more affordable;
|
|
•
|
government or builder incentives with respect to home ownership, making alternative housing options more attractive;
|
|
•
|
local real estate market conditions, including oversupply of apartments or other housing available for rent, or a reduction in demand for apartments in the area;
|
|
•
|
declines in the financial condition of our residents, which may make it more difficult for us to collect rents from some residents;
|
|
•
|
declines in market rental rates;
|
|
•
|
declines in household formation; and
|
|
•
|
increases in operating costs, if these costs cannot be passed through to our residents.
|
Failure to generate sufficient cash flows could limit our ability to make payments on our debt and to make distributions.
Our ability to make payments on our debt and to make distributions depends on our ability to generate cash flow in excess of operating costs and capital expenditure requirements and/or to have access to the markets for debt and equity financing. Our funds from operations may be insufficient because of factors that are beyond our control. Such events or conditions could include:
|
•
|
competition from other apartment communities;
|
|
•
|
overbuilding of new apartments or oversupply of available apartments in our markets, which might adversely affect occupancy or rental rates and/or require rent concessions in order to lease apartments;
|
|
•
|
conversion of condominiums and single family houses to rental use or the increase in the number of condominiums and single family homes available for sale;
|
|
•
|
weakness in the overall economy, which lowers job growth and the associated demand for apartment housing;
|
|
•
|
increases in operating costs (including real estate taxes, utilities and insurance premiums) due to inflation and other factors, which may not be offset by increased rental rates;
|
|
•
|
inability to initially, or subsequently after lease terminations, rent apartments on favorable economic terms;
|
|
•
|
failure of development communities to be completed, if at all, within budget and on a timely basis or to lease-up as anticipated;
|
|
•
|
changes in governmental regulations and the related costs of compliance;
|
8
|
•
|
changes in laws including, but not limited to, tax laws and housing laws including the enactment of rent control laws or other laws regulating multifamily housing;
|
|
•
|
withdrawal of government support of apartment financing through its financial backing of the Federal National Mortgage Association, or Fannie Mae, or the Federal Home Loan Mortgage Corporation, or Freddie Mac;
|
|
•
|
an uninsured loss, including those resulting from a catastrophic storm, earthquake, or act of terrorism;
|
|
•
|
changes in interest rate levels and the availability of financing, borrower credit standards, and down-payment requirements which could lead renters to purchase homes (if interest rates decrease and home loans are more readily available) or increase our acquisition and operating costs (if interest rates increase and financing is less readily available); and
|
|
•
|
the relative illiquidity of real estate investments.
|
At times, we have relied on external funding sources to fully fund the payment of distributions to shareholders and our capital investment program, including our existing property developments. While we have sufficient liquidity to permit distributions at current rates through additional borrowings, if necessary, any significant and sustained deterioration in operations could result in our financial resources being insufficient to make payments on our debt and to make distributions at the current rate, in which event we would be required to reduce the distribution rate. Any decline in our funds from operations could adversely affect our ability to make distributions or to meet our loan covenants and could have a material adverse effect on our stock price or the trading price of our debt securities.
We are dependent on a concentration of our investments in a single asset class, making our results of operations more vulnerable to a downturn or slowdown in the sector or other economic factors.
As of
December 31, 2018
, substantially all of our investments are concentrated in the multifamily sector. As a result, we will be subject to risks inherent in investments in a single type of property. A downturn or slowdown in the demand for multifamily housing may have more pronounced effects on our results of operations or on the value of our assets than if we had diversified our investments into more than one asset class.
Our operations are concentrated in the Southeast, Southwest and Mid-Atlantic regions of the United States; we are subject to general economic conditions in the regions in which we operate.
As of
December 31, 2018
, approximately
39.4%
of our portfolio is located in our top five markets: Atlanta, Georgia; Dallas, Texas; Austin, Texas; Charlotte, North Carolina; and Orlando, Florida. In addition, our overall operations are concentrated in the Southeast, Southwest and Mid-Atlantic regions of the United States. Our performance could be adversely affected by economic conditions in, and other factors relating to, these geographic areas, including supply and demand for apartments in these areas, zoning and other regulatory conditions and competition from other communities and alternative forms of housing. In particular, our performance is disproportionately influenced by job growth and unemployment. To the extent the economic conditions, job growth and unemployment in any of these markets deteriorate or any of these areas experiences natural disasters, the value of our portfolio, our results of operations and our ability to make payments on our debt and to make distributions could be adversely affected.
Failure to succeed in new markets may have adverse consequences on our performance.
We may make acquisitions outside of our existing market areas if appropriate opportunities arise. Our historical experience in our existing markets does not ensure that we will be able to operate successfully in new markets, should we choose to enter them. We may be exposed to a variety of risks if we choose to enter new markets, including an inability to accurately evaluate local market conditions, to identify appropriate acquisition opportunities, to hire and retain key personnel, and a lack of familiarity with local governmental and permitting procedures. In addition, we may abandon opportunities to enter new markets that we have begun to explore for any reason and may, as a result, fail to recover expenses already incurred.
Substantial competition among apartment communities and real estate companies may adversely affect our revenues and development and acquisition opportunities.
There are numerous other apartment communities and real estate companies, some of which may have greater financial and other resources than we have, within the market area of each of our communities that compete with us for residents and development and acquisition opportunities. The number of competitive apartment communities and real estate companies in these areas could have a material effect on (1) our ability to rent our apartments and generate revenues, and (2) development and acquisition opportunities. The activities of these competitors could cause us to pay a higher price for a new property than we otherwise would have paid or may prevent us from purchasing a desired property at all, which could have a material adverse effect on us and our ability to make payments on our debt and to make distributions.
9
Acts of violence could decrease the value of our assets and could have an adverse effect on our business and results of operations.
Our apartment communities could directly or indirectly be the location or target of actual or threatened terrorist attacks, crimes, shootings or other acts of violence, the occurrence of which could impact the value of our communities through damage, destruction, loss or increased security costs, as well as result in operational losses due to reduced rental demand, and the availability of insurance may be limited or may be subject to substantial costs. If such an incident were to occur at one of our apartment communities, we may also become subject to significant liability claims. In addition, the adverse effects that actual or threatened terrorist attacks could have on national economic conditions, as well as economic conditions in the markets in which we operate, could similarly have a material adverse effect on our business and results of operations.
We rely on information technology systems in our operations, and any breach or security failure of those systems could materially adversely affect our business, financial condition, results of operations and reputation.
We rely on information technology systems to process, transmit and store information and to manage or support our business processes. We maintain confidential financial and business information regarding us and persons with which we do business on our information technology systems. We also collect and hold personally identifiable information of our residents and prospective residents in connection with our leasing and property management activities, and we collect and hold personally identifiable information of our employees in connection with their employment. In addition, we engage third party service providers that may collect and hold personally identifiable information of our residents, prospective residents and employees in connection with providing business services to us, including web hosting, property management, leasing, accounting and payroll services. The protection of the information technology systems on which we rely is critically important to us. We take steps, and generally require third party service providers to take steps, to protect the security of the information maintained in our and our service providers' information technology systems, including the use of systems, software, tools and monitoring to provide security for processing, transmitting and storing of the information. However, we face risks associated with breaches or security failures of the information technology systems on which we rely, which could result from, among other incidents, cyber-attacks or cyber-intrusions over the Internet, malware, computer viruses or employee error or misconduct. This risk of a breach or security failure, particularly through cyber-attacks or cyber-intrusion, has generally increased due to the rise in new technologies and the increased sophistication and activities of the perpetrators of attempted attacks and intrusions.
The security measures put in place by us and our service providers cannot provide absolute security and there can be no assurance that we or our service providers will not suffer a data security incident in the future, that unauthorized parties will not gain access to sensitive information stored on our or our service providers' systems, that such access will not, whether temporarily or permanently, impact, interfere with or interrupt our operations, or that any such incident will be discovered in a timely manner. Even the most well protected information, networks, systems and facilities remain potentially vulnerable as the techniques used in such attempted security breaches evolve and generally are not recognized until launched against a target, and in some cases are designed to not be detected and, in fact, may not be detected. Accordingly, we and our providers may be unable to anticipate these techniques or to implement adequate security barriers or other preventative measures. Further, in the future, we may be required to expend additional resources to continue to enhance information security measures or to investigate and remediate any information security vulnerabilities.
A data security incident could compromise our or our service providers' information technology systems, and the information stored by us or our service providers, including personally identifiable information of residents, prospective residents and employees, could be accessed, misused, publicly disclosed, corrupted, lost or stolen. Any failure to prevent a breach or a security failure of our or our service providers' information technology systems could interrupt our operations, damage our reputation and brand, damage our competitive position, make it difficult for us to attract and retain residents, subject us to liability claims or regulatory penalties and could materially and adversely affect our business, financial condition or results of operations.
Acquisitions of apartment communities involve various risks and may fail to meet expectations.
We have acquired in the past, and if presented with attractive opportunities we intend to acquire in the future, apartment communities that meet our investment criteria. Our acquisition activities and their success are subject to the following risks:
|
•
|
we may be unable to obtain financing for acquisitions on favorable terms or at all;
|
|
•
|
even if we are able to finance the acquisition, cash flow from the acquisition may be insufficient to meet our required principal and interest payments on the acquisition;
|
10
|
•
|
even if we enter into an acquisition agreement for an apartment community, we may be unable to complete the acquisition after incurring certain acquisition-related costs;
|
|
•
|
we may incur significant costs and divert management's attention in connection with the evaluation and negotiation of potential acquisitions, including potential acquisitions that we are subsequently unable to complete;
|
|
•
|
when we acquire an apartment community, we may invest additional amounts in it with the intention of increasing revenues and profitability, and these additional investments may not produce the anticipated improvements in revenues or profitability;
|
|
•
|
we may be unable to quickly and efficiently integrate acquired apartment communities and new personnel into our existing operations, and the failure to successfully integrate such apartment communities or personnel will result in inefficiencies that could adversely affect our expected return on our investments and our overall profitability; and
|
|
•
|
we may acquire properties that are subject to liabilities or that have problems relating to environmental condition, state of title, physical condition or compliance with zoning laws, building codes or other legal requirements and in each case, our acquisition may be without any, or with only limited, recourse with respect to unknown liabilities or conditions and we may be obligated to pay substantial sums to settle or cure it, which could adversely affect our cash flow and operating results.
|
We are subject to certain risks associated with selling apartment communities, which could limit our operational and financial flexibility.
We periodically dispose of apartment communities that no longer meet our strategic objectives, but adverse market conditions may make it difficult to sell apartment communities like the ones we own. We cannot predict whether we will be able to sell any property for the price or on the terms we set, or whether any price or other terms offered by a prospective purchaser would be acceptable to us. We also cannot predict the length of time needed to find a willing purchaser and to close the sale of a property. Furthermore, we may be required to expend funds to correct defects or to make improvements before a property can be sold. These conditions may limit our ability to dispose of properties and to change our portfolio promptly in order to meet our strategic objectives, which may in turn have a material adverse effect on our financial condition and the market value of our securities. We are also subject to the following risks in connection with sales of our apartment communities:
|
•
|
a significant portion of the proceeds from our overall property sales may be held by intermediaries in order for some sales to qualify as like-kind exchanges under Section 1031 of the Code, so that any related capital gain can be deferred for federal income tax purposes. As a result, we may not have immediate access to all of the cash proceeds generated from our property sales. In addition, if a transaction intended to qualify as a Section 1031 exchange is later determined to be taxable, we may face adverse consequences, and if the laws applicable to such transactions are amended or repealed, we may not be able to dispose of properties on a tax deferred basis. Intermediary agents of Section 1031 exchange transactions typically handle large sums of money in trusts. Misappropriation of funds by one of these agents could have a material negative impact on our results of operations. Additionally, misappropriation of funds could result in the disposal of the property not qualifying for a tax deferred basis and adversely affect our financial condition. It is also possible the qualification of a transaction as a Section 1031 exchange could be successfully challenged and determined to be currently taxable. In such case, our taxable income and earnings and profits would increase, which could increase the dividend income to our shareholders by reducing any return of capital they received. In some circumstances, we may be required to pay additional dividends or, in lieu of additional dividends, corporate income tax, possibly including interest and penalties. As a result, we may be required to borrow funds in order to pay additional dividends or taxes and the payment of such taxes could cause us to have less cash available to distribute to our shareholders. In addition, if a Section 1031 exchange were later to be determined to be taxable, we may be required to amend our tax returns for the applicable year in question, including any information reports sent to our shareholders; and
|
|
•
|
federal tax laws applicable to REITs limit our ability to profit on the sale of communities, and this limitation may prevent us from selling communities when market conditions are favorable.
|
Property ownership through joint ventures could limit our ability to act exclusively in our interest.
From time to time, we may acquire and/or develop properties in joint ventures with other persons or entities when we believe circumstances warrant the use of such structures. In that case, we could become engaged in a dispute with one or more of our partners which might affect our ability to operate a jointly-owned property. Moreover, our partners could have business, economic or other objectives that are inconsistent with our objectives, including objectives that relate to the appropriate timing and terms of any sale or refinancing of a property. In some instances, our partners could have competing interests in our markets that could create conflicts of interest. Also, our partners might refuse to make capital contributions when due and we
11
may be responsible to our partners for indemnifiable losses. In general, we and our partners could each have the right to trigger a buy-sell arrangement, which could cause us to sell our interest, or acquire our partners' interest, at a time when we otherwise would not have initiated such a transaction and may result in the valuation of our interest in the joint venture (if we are the seller) or of our partners' interest in the joint venture (if we are the buyer) at levels which may not be representative of the valuation that would result from an arm's length marketing process. Other potential risks of a jointly-owned property include (i) a deadlock if we and our partners are unable to agree upon certain major and other decisions, (ii) a limitation of our ability to liquidate our position in the partnership or joint venture without the consent of the other partners and (iii) a requirement to provide guarantees in favor of lenders with respect to the indebtedness of the joint venture.
Environmental problems are possible and can be costly.
Under various federal, state and local laws, ordinances and regulations, a current or previous owner or operator of real estate may be liable for the costs of removal or remediation of certain hazardous or toxic substances in, on, around or under such property. Such laws often impose such liability without regard to whether the owner or operator knew of, or was responsible for, the presence of such hazardous or toxic substances. The presence of, or failure to properly remediate, hazardous, toxic substances or petroleum product releases may adversely affect the owner's or operator’s ability to sell or rent the affected property or to borrow using the property as collateral. Persons who arrange for the disposal or treatment of hazardous or toxic substances may also be liable for the costs of removal or remediation of hazardous or toxic substances at a disposal or treatment facility, whether or not the facility is owned or operated by the person. Certain environmental laws impose liability for the release of asbestos-containing materials into the air, and third parties may also seek recovery from owners or operators of real property for personal injury associated with asbestos-containing materials and other hazardous or toxic substances. Federal and state laws also regulate the operation and subsequent removal of certain underground storage tanks. In connection with the current or former ownership (direct or indirect), operation, management, development or control of real property, we may be considered an owner or operator of such apartment communities or as having arranged for the disposal or treatment of hazardous or toxic substances and, therefore, may be potentially liable for removal or remediation costs, as well as certain other costs, including governmental fines, and claims for injuries to persons and property.
Our current policy is to obtain a Phase I environmental study on each apartment community that we seek to acquire or develop, which generally does not involve invasive techniques such as soil or ground water sampling, and to proceed accordingly. We cannot assure you, however, that the Phase I environmental studies or other environmental studies undertaken with respect to any of our current or future apartment communities will reveal:
|
•
|
all or the full extent of potential environmental liabilities;
|
|
•
|
that any prior owner or operator of a property did not create any material environmental condition unknown to us;
|
|
•
|
that a material environmental condition does not otherwise exist as to any one or more of such apartment communities; or
|
|
•
|
that environmental matters will not have a material adverse effect on us and our ability to make payments on our debt and to make distributions.
|
Certain environmental laws impose liability on a previous owner of property to the extent that hazardous or toxic substances were present during the prior ownership period. A transfer of the property does not relieve an owner of such liability. Thus, we may have liability with respect to apartment communities previously sold by our predecessors or by us. There have been a number of lawsuits against owners and operators of multifamily apartment communities alleging personal injury and property damage caused by the presence of mold in residential real estate. Some of these lawsuits have resulted in substantial monetary judgments or settlements. Insurance carriers have reacted to these liability awards by excluding mold-related claims from standard policies and pricing mold endorsements separately. We have obtained a separate pollution insurance policy that covers mold-related claims and have adopted programs designed to minimize the existence of mold in any of our apartment communities as well as guidelines for promptly addressing and resolving reports of mold. To the extent not covered by our pollution policy, the presence of mold could expose us to liability from residents and others if property damage or health concerns, or allegations thereof, arise.
Extreme weather or natural disasters may cause property damage or disrupt business, which could harm our business and results of operations.
We have apartment communities located in areas that may be subject to extreme weather and natural disasters, including, but not limited to, earthquakes, winds, floods, hurricanes and fires. Such conditions may damage our properties, disrupt our operations and adversely impact our tenants. There can be no assurances that such conditions will not have a material adverse effect on our properties, operations or business.
12
Losses from catastrophes may exceed our insurance coverage, which may negatively impact our results of operations and reduce the value of our properties.
We carry comprehensive liability and property insurance on our apartment communities and intend to obtain similar coverage for apartment communities we acquire in the future. Some losses, generally of a catastrophic nature, such as losses from floods, hurricanes or earthquakes, are subject to limitations, and thus may be uninsured. We exercise our discretion in determining amounts, coverage limits and deductibility provisions of insurance, with a view to maintaining appropriate insurance on our investments at a reasonable cost and on suitable terms. If we suffer a substantial loss, our insurance coverage may not be sufficient to pay the full current market value or current replacement value of our lost investment. Inflation, changes in building codes and ordinances, environmental considerations and other factors also might make it infeasible to use insurance proceeds to replace a property after it has been damaged or destroyed. Any losses we experience that are not fully covered by our insurance may negatively impact our results of operations and may reduce the value of our properties.
Increasing real estate taxes, utilities and insurance premiums may negatively impact operating results.
As a result of our substantial real estate holdings, the cost of real estate taxes, utilities and insuring our apartment communities is a significant component of expense. Real estate taxes, utilities and insurance premiums are subject to significant increases and fluctuations, which can be widely outside of our control. If the costs associated with real estate taxes, utilities and insurance premiums should rise, without being offset by a corresponding increase in revenues, our results of operations could be negatively impacted, and our ability to make payments on our debt and to make distributions could be adversely affected.
Compliance or failure to comply with laws requiring access to our properties by disabled persons could result in substantial cost.
The Americans with Disabilities Act of 1990, or the ADA, the Fair Housing Act of 1988, or the FHA, and other federal, state and local laws generally require that public accommodations be made accessible to disabled persons. Noncompliance could result in the imposition of fines by the government or the award of damages to private litigants. These laws may require us to modify our existing apartment communities. These laws may also restrict renovations by requiring improved access to such buildings by disabled persons or may require us to add other structural features that increase our construction costs. Legislation or regulations adopted in the future may impose further burdens or restrictions on us with respect to improved access by disabled persons. We cannot ascertain the costs of compliance with these laws, which may be substantial.
Development and construction risks could impact our profitability.
As of
December 31, 2018
, we had
three
development communities under construction totaling
577
units. We may make further investments in these and other development communities as opportunities arise and may do so through joint ventures with unaffiliated parties. Our development and construction activities are subject to the following risks:
|
•
|
we may be unable to obtain, or face delays in obtaining, necessary zoning, land-use, building, occupancy and other required governmental permits and authorizations, which could result in increased development costs, could delay initial occupancy dates for all or a portion of a development community, and could require us to abandon our activities entirely with respect to a project for which we are unable to obtain permits or authorizations;
|
|
•
|
we may be unable to obtain financing for development activities under favorable terms, which could cause a delay in construction resulting in increased costs, decreases in revenue, and potentially cause us to abandon the opportunity;
|
|
•
|
yields may be less than anticipated as a result of delays in completing projects, costs that exceed budget, higher than expected concessions for lease-up and lower rents than initially estimated;
|
|
•
|
bankruptcy of developers in our development projects could impose delays and costs on us with respect to the development of our communities and may adversely affect our financial condition and results of operations;
|
|
•
|
we may abandon development opportunities that we have already begun to explore, and we may fail to recover expenses already incurred in connection with exploring such opportunities;
|
|
•
|
we may be unable to complete construction and lease-up of an apartment community on schedule, or incur development or construction costs that exceed our original estimates, and we may be unable to charge rents that would compensate for any increase in such costs;
|
|
•
|
occupancy rates and rents at a newly developed apartment community may fluctuate depending on a number of factors, including market and economic conditions, preventing us from meeting our profitability goals for that community;
|
13
|
•
|
when we sell to third parties apartment communities or properties that we developed or renovated, we may be subject to warranty or construction defects that are uninsured or exceed the limit of our insurance; and
|
|
•
|
our failure to successfully enter into a joint venture agreement may prohibit an otherwise advantageous investment if we cannot raise the money through other means.
|
Short-term leases expose us to the effects of declining market rents and we may be unable to renew leases or relet units as leases expire.
Our apartment leases are generally for a term of one year or less. As these leases typically permit the residents to leave at the end of the lease term without penalty, our revenues are impacted by declines in market rents more quickly than if our leases were for longer terms. If we are unable to promptly renew the leases or relet the units, or if the rental rates upon renewal or reletting are significantly lower than expected rates, then our financial condition and results of operations may be adversely affected.
Legal proceedings that we become involved in from time to time could affect our business.
As an owner, operator and developer of multifamily apartment communities, we may become involved in various legal proceedings, including, but not limited to, proceedings related to commercial, development, employment, environmental, securities, shareholder, tenant or tort legal issues, some of which could result in a class action lawsuit. For example, as described in more detail in "Legal Proceedings" and Note 12 to the consolidated financial statements included elsewhere in this Annual Report on Form 10-K, we are currently a defendant in two class action lawsuits relating to tenant late fee policies at our Texas apartment communities.
Legal proceedings, if decided adversely to or settled by us, and not covered by insurance, could result in liability material to our financial condition, results of operations or cash flows. Likewise, regardless of outcome, legal proceedings could result in substantial costs and expenses, affect the availability or cost of some of our insurance coverage and significantly divert the attention of our management. There can be no assurance that we will be able to prevail in, or achieve a favorable settlement of, any pending or future legal proceedings to which we become subject.
Risks Related to Our Indebtedness and Financing Activities
Our substantial indebtedness could adversely affect our financial condition and results of operations.
As of
December 31, 2018
, the amount of our total debt was approximately
$4.5 billion
. We may incur additional indebtedness in the future in connection with, among other things, our acquisition, development and operating activities.
The degree of our leverage creates significant risks, including the following:
|
•
|
we may be required to dedicate a substantial portion of our funds from operations to servicing our debt and our cash flow may be insufficient to make required payments of principal and interest;
|
|
•
|
debt service obligations will reduce funds available for distribution and funds available for acquisitions, development and redevelopment;
|
|
•
|
we may be more vulnerable to economic and industry downturns than our competitors that have less debt;
|
|
•
|
we may be limited in our ability to respond to changing business and economic conditions;
|
|
•
|
we may default on our indebtedness, which could result in acceleration of those obligations, assignment of rents and leases and loss of properties to foreclosure; and
|
|
•
|
if one of our subsidiaries defaults, it could trigger a cross default or cross acceleration provision under other indebtedness, which could cause an immediate default or could allow the lenders to declare all funds borrowed thereunder to be due and payable.
|
If any one of these events was to occur, our financial condition and results of operations could be materially and adversely affected.
We may be unable to renew, repay or refinance our outstanding debt, which could negatively impact our financial condition and results of operations.
We are subject to the normal risks associated with debt financing, including the risk that our cash flow will be insufficient to meet required payments of principal and interest, the risk that either secured or unsecured indebtedness will not
14
be able to be renewed, repaid or refinanced when due or that the terms of any renewal or refinancing will not be as favorable as the existing terms of such indebtedness. If we are unable to refinance our indebtedness on acceptable terms, if at all, we might be forced to dispose of one or more of our apartment communities on disadvantageous terms, which might result in losses to us. Such losses could have a material adverse effect on us and our ability to make payments on our debt and to make distributions. Furthermore, if a property is mortgaged to secure payment of indebtedness and we are unable to meet mortgage payments, the mortgagee could foreclose upon the property, appoint a receiver and receive an assignment of rents and leases or pursue other remedies, all with a consequent loss of our revenues and asset value. Foreclosures could also create taxable income without accompanying cash proceeds, thereby hindering our ability to meet the REIT distribution requirements of the Code.
Rising interest rates could adversely affect our results of operations and cash flows.
We have incurred and expect in the future to incur indebtedness that bears interest at variable rates. Interest rates could increase, which could result in higher interest expense on our variable-rate debt or increase interest rates when refinancing maturing fixed-rate debt, which could have a material adverse effect on us and our ability to make payments on our debt and to make distributions or cause us to be in default under certain debt instruments. In addition, an increase in market interest rates may lead holders of shares of our common stock to demand a higher yield on their shares from distributions by us, which could adversely affect the market price for our common stock. During 2018, the Federal Reserve raised the federal funds rate by 0.25 points each quarter, resulting in a range of 2.25 percent to 2.5 percent after the Federal Reserve's December 2018 meeting. These increases in the federal funds rate and any future increases due to other key economic indicators, such as the unemployment rate or inflation, may cause interest rates and borrowing costs to rise, which may negatively impact our ability to access the debt markets on favorable terms. Any continued adverse economic conditions could have a material adverse effect on our business, financial condition and results of operations.
We may incur additional debt in the future, which may adversely impact our financial condition.
We currently fund the acquisition and development of apartment communities partially through borrowings (including our revolving credit facility) as well as from other sources such as sales of apartment communities which no longer meet our investment criteria. In addition, we may fund other of our capital requirements through debt. Our organizational documents do not contain any limitation on the amount of indebtedness that we may incur, and we may incur more debt in the future. Accordingly, subject to limitations on indebtedness set forth in various loan agreements and the indentures governing our senior notes, we could become more highly leveraged, resulting in an increase in debt service and an increased risk of default on our obligations, which could have a material adverse effect on our financial condition, our ability to access debt and equity capital markets in the future and our ability to make payments on our debt and to make distributions.
The restrictive terms of certain of our indebtedness may cause acceleration of debt payments.
As of
December 31, 2018
, we had outstanding borrowings of approximately
$4.5 billion
. Our indebtedness contains financial covenants as to interest coverage ratios, maximum secured debt, maintenance of unencumbered asset value, and total debt to gross assets, among others, and cross default provisions with other material debt. Our ability to comply with these financial covenants may be affected by changes in our operating and financial performance, changes in general business and economic conditions, adverse regulatory developments or other events adversely impacting us. In the event that an event of default occurs, our lenders may declare borrowings under the respective loan agreements to be due and payable immediately, which could have a material adverse effect on our financial condition and our ability to make payments on our debt and to make distributions.
Failure to hedge effectively against interest rates may adversely affect results of operations.
From time to time, we may seek to manage our exposure to interest rate volatility by using interest rate hedging arrangements, such as interest rate swap agreements. These agreements involve risks, such as the risk that the counterparties may fail to honor their obligations under these arrangements, that these arrangements may not be effective in reducing our exposure to interest rate changes and that a court could rule that such an agreement is not legally enforceable. Hedging may reduce overall returns on our investments. Failure to hedge effectively against interest rate changes could have a material adverse effect on us and our ability to make payments on our debt and to make distributions.
A downgrade in our credit ratings could have a material adverse effect on our business, financial condition and results of operations.
We have a significant amount of debt outstanding. We are currently assigned corporate credit ratings from each of the
15
three ratings agencies based on their evaluation of our creditworthiness. These ratings are based on a number of factors, which include their assessment of our financial strength, liquidity, capital structure, asset quality, and sustainability of cash flows and earnings. If our credit ratings are downgraded or other negative action is taken, we could be required to pay additional interest and fees on our outstanding borrowings. In addition, a downgrade may adversely impact our ability to borrow secured and unsecured debt and otherwise limit our access to capital, which could adversely affect our business, financial condition and results of operations.
Financing may not be available and could be dilutive.
Our capital requirements depend on numerous factors, including the occupancy and turnover rates of our apartment communities, development and capital expenditures, costs of operations and potential acquisitions. We cannot accurately predict the timing and amount of our capital requirements. If our capital requirements vary materially from our plans, we may require additional financing sooner than anticipated. We and other companies in the real estate industry have experienced limited availability of financing from time to time. Restricted lending practices could impact our ability to obtain debt financing. If we issue additional equity securities to obtain additional financing, the interest of our existing shareholders could be diluted.
Risks Related to MAA's Organization and Ownership of Its Stock
MAA's ownership limit restricts the transferability of its capital stock.
MAA's charter limits ownership of its capital stock by any single shareholder to 9.9% of the value of all outstanding shares of its capital stock, both common and preferred, unless approved by its Board of Directors. The charter also prohibits anyone from buying shares if the purchase would result in it losing REIT status. This could happen if a share transaction results in fewer than 100 persons owning all of its shares or in five or fewer persons, applying certain broad attribution rules of the Code, owning 50% or more of its shares. If an investor acquires shares in excess of the ownership limit or in violation of the ownership requirements of the Code for REITs, MAA:
|
•
|
will consider the transfer to be null and void;
|
|
•
|
will not reflect the transaction on its books;
|
|
•
|
may institute legal action to enjoin the transaction;
|
|
•
|
will not pay dividends or other distributions with respect to those shares;
|
|
•
|
will not recognize any voting rights for those shares;
|
|
•
|
will consider the shares held in trust for its benefit; and
|
|
•
|
will either direct the holder to sell the shares and turn over any profit to MAA, or MAA will redeem the shares. If MAA redeems the shares, the holder will be paid a price equal to the lesser of:
|
|
◦
|
the principal price paid for the shares by the holder,
|
|
◦
|
a price per share equal to the market price (as determined in the manner set forth in its charter) of the applicable capital stock,
|
|
◦
|
the market price (as so determined) on the date such holder would, but for the restrictions on transfers set forth in its charter, be deemed to have acquired ownership of the shares, and
|
|
◦
|
the maximum price allowed under the Tennessee Greenmail Act (such price being the average of the highest and lowest closing market price for the shares during the 30 trading days preceding the purchase of such shares or, if the holder of such shares has commenced a tender offer or has announced an intention to seek control of MAA, during the 30 trading days preceding the commencement of such tender offer or the making of such announcement).
|
The redemption price may be paid, at MAA's option, by delivering one common unit (subject to adjustment from time to time in the event of, among other things, stock splits, stock dividends, or recapitalizations affecting its common stock or certain mergers, consolidations or asset transfers by MAA) issued by the Operating Partnership for each excess share being redeemed.
If an investor acquires shares in violation of the limits on ownership described above:
|
•
|
the holder may lose its power to dispose of the shares;
|
|
•
|
the holder may not recognize profit from the sale of such shares if the market price of the shares increases; and
|
|
•
|
the holder may be required to recognize a loss from the sale of such shares if the market price decreases.
|
16
Future offerings of debt or equity securities, which may rank senior to our common stock, may adversely affect the market price of our common stock.
If we decide to issue additional debt securities in the future, which would rank senior to our common stock, it is likely that they will be governed by an indenture or other instrument containing covenants restricting our operating flexibility. Additionally, any equity securities or convertible or exchangeable securities that we issue in the future may have rights, preferences and privileges more favorable than those of our common stock and may result in dilution to owners of our common stock. We and, indirectly, our shareholders, will bear the cost of issuing and servicing such securities. Because our decision to issue debt or equity securities in any future offering will depend on market conditions and other factors beyond our control, we cannot predict or estimate the amount, timing or nature of any future offerings. Thus, holders of our common stock will bear the risk of our future offerings reducing the market price of our common stock and diluting the value of their stock holdings.
The form, timing and amount of dividend distributions in future periods may vary and be impacted by economic and other considerations.
Though our Board of Directors has a history of declaring dividends in advance of the quarter they are paid, the form, timing and amount of dividend distributions will be declared, and standing practice changed, at the discretion of the Board of Directors. The form, timing and amount of dividend distributions will depend on actual cash from operations, our financial condition, capital requirements, the annual distribution requirements under the REIT provisions of the Code and other factors as our Board of Directors may consider relevant. Our Board of Directors may modify our dividend policy from time to time.
Provisions of MAA's charter and Tennessee law may limit the ability of a third party to acquire control of MAA.
Ownership Limit
The 9.9% ownership limit discussed above may have the effect of precluding acquisition of control of MAA by a third party without the consent of our Board of Directors.
Preferred Stock
MAA's charter authorizes our Board of Directors to issue up to 20,000,000 shares of preferred stock,
868,000
of which have been designated as 8.50% Series I Cumulative Redeemable Preferred Stock, which we refer to as MAA Series I preferred stock. In addition to the MAA Series I preferred stock, the Board of Directors may establish the preferences and rights of any other series of preferred shares issued. The issuance of preferred stock could have the effect of delaying or preventing someone from taking control of MAA, even if a change in control were in MAA shareholders’ best interests. As of
December 31, 2018
,
867,846
shares of preferred stock were issued and outstanding, all of which shares were MAA Series I preferred stock.
Tennessee Anti-Takeover Statutes
As a Tennessee corporation, MAA is subject to various legislative acts, which impose restrictions on and require compliance with procedures designed to protect shareholders against unfair or coercive mergers and acquisitions. These statutes may delay or prevent offers to acquire MAA and increase the difficulty of consummating any such offers, even if MAA's acquisition would be in MAA shareholders’ best interests.
Market interest rates and low trading volume may have an adverse effect on the market value of MAA's common stock.
The market price of shares of common stock of a REIT may be affected by the distribution rate on those shares, as a
percentage of the price of the shares, relative to market interest rates. If market interest rates increase, prospective purchasers of MAA's common stock may expect a higher annual distribution rate. Higher interest rates would not, however, result in more funds for MAA to distribute and, in fact, would likely increase MAA's borrowing costs and potentially decrease funds available for distribution. This could cause the market price of MAA's common stock to go down. In addition, although MAA's common stock is listed on the NYSE, the daily trading volume of MAA's common stock may be lower than the trading volume for companies in other industries. As a result, MAA's investors who desire to liquidate substantial holdings may find that they are unable to dispose of their shares in the market without causing a substantial decline in the market value of MAA's common stock.
17
Changes in market conditions or a failure to meet the market’s expectations with regard to our results of operations and cash distributions could adversely affect the market price of MAA's common stock.
We believe that the market value of a REIT’s equity securities is based primarily upon the market’s perception of the REIT’s growth potential and its current and potential future cash distributions, and is secondarily based upon the real estate market value of the underlying assets. For that reason, MAA's common stock may trade at prices that are higher or lower than the net asset value per share. To the extent we retain operating cash flow for investment purposes, working capital reserves or other purposes, these retained funds, while increasing the value of our underlying assets, may not correspondingly increase the market price of MAA's common stock. In addition, we are subject to the risk that our cash flow will be insufficient to pay distributions to MAA's shareholders. Our failure to meet the market’s expectations with regard to future earnings and cash distributions would likely adversely affect the market price of MAA's common stock.
The stock markets, including the NYSE, on which MAA lists its common stock, have, at times, experienced significant price and volume fluctuations. As a result, the market price of MAA's common stock could be similarly volatile, and investors in MAA's common stock may experience a decrease in the value of their shares, including decreases unrelated to our operating performance or prospects. Among the market conditions that may affect the market price of MAA's publicly traded securities are the following:
|
•
|
our financial condition and operating performance and the performance of other similar companies;
|
|
•
|
actual or anticipated differences in our quarterly and annual operating results;
|
|
•
|
changes in our revenues or earnings estimates or recommendations by securities analysts;
|
|
•
|
publication of research reports about us or our industry by securities analysts;
|
|
•
|
additions and departures of key personnel;
|
|
•
|
inability to access the capital markets;
|
|
•
|
strategic decisions by us or our competitors, such as acquisitions, dispositions, spin-offs, joint ventures, strategic investments or changes in business strategy;
|
|
•
|
the issuance of additional shares of MAA's common stock, or the perception that such sales may occur, including under MAA's at-the-market offering programs;
|
|
•
|
the reputation of REITs generally and the reputation of REITs with portfolios similar to ours;
|
|
•
|
the attractiveness of the securities of REITs in comparison to securities issued by other entities (including securities issued by other real estate companies);
|
|
•
|
an increase in market interest rates, which may lead prospective investors to demand a higher distribution rate in relation to the price paid for MAA's common stock;
|
|
•
|
the passage of legislation or other regulatory developments that adversely affect us or our industry;
|
|
•
|
speculation in the press or investment community;
|
|
•
|
actions by institutional shareholders or hedge funds;
|
|
•
|
changes in accounting principles;
|
|
•
|
terrorist acts; and
|
|
•
|
general market conditions, including factors unrelated to our performance.
|
In the past, securities class action litigation has often been instituted against companies following periods of volatility in their stock price. This type of litigation could result in substantial costs and divert our management’s attention and resources.
Risks Related to the Operating Partnership's Organization and Ownership of OP Units
The Operating Partnership's existing unitholders have limited approval rights, which may prevent the Operating Partnership's sole general partner, MAA, from completing a change of control transaction that may be in the best interests of all unitholders of the Operating Partnership and all shareholders of MAA.
MAA may not engage in a sale or other disposition of all or substantially all of the assets of the Operating Partnership, dissolve the Operating Partnership or, upon the occurrence of certain triggering events, take any action that would result in any unitholder realizing taxable gain, without the approval of the holders of a majority of the outstanding OP Units held by holders other than MAA or its affiliates, or Class A OP Units. The right of the holders of our Class A OP Units to vote on these transactions could limit MAA's ability to complete a change of control transaction that might otherwise be in the best interest of all unitholders of the Operating Partnership and all shareholders of MAA.
18
In certain circumstances, certain of the Operating Partnership's unitholders must approve the Operating Partnership's sale of certain properties contributed by the unitholders.
In certain circumstances, as detailed in the partnership agreement of the Operating Partnership, the Operating Partnership may not sell or otherwise transfer certain properties unless a specified percentage of the limited partners who were partners in the limited partnership holding such properties at the time of its acquisition by us approves such sale or transfer. The exercise of these approval rights by the Operating Partnership's unitholders could delay or prevent the Operating Partnership from completing a transaction that may be in the best interest of all unitholders of the Operating Partnership and all shareholders of MAA.
MAA, its officers and directors have substantial influence over the Operating Partnership's affairs.
MAA, as the Operating Partnership's sole general partner and acting through its officers and directors, has a substantial influence on the Operating Partnership's affairs. MAA, its officers and directors could exercise their influence in a manner that is not in the best interest of the unitholders of the Operating Partnership. Also, MAA owns approximately
96.5%
of the OP Units and as such, will have substantial influence on the outcome of substantially all matters submitted to the Operating Partnership's unitholders for approval.
Market interest rates and low trading volume may have an adverse effect on the market value of MAA's common stock, which would affect the redemption price of the OP Units.
The market price of shares of common stock of a REIT may be affected by the distribution rate on those shares, as a percentage of the price of the shares, relative to market interest rates. If market interest rates increase, prospective purchasers of MAA's common stock may expect a higher annual distribution rate. Higher interest rates would not, however, result in more funds for MAA to distribute and, in fact, would likely increase MAA's borrowing costs and potentially decrease funds available for distribution. This could cause the market price of MAA's common stock to go down, which would reduce the price received upon redemption of any OP Units, or if MAA so elects, the value of MAA's common stock received in lieu of cash upon redemption of such OP Units. In addition, although MAA's common stock is listed on the NYSE, the daily trading volume of MAA's common stock may be lower than the trading volume for companies in other industries. As a result, MAA's investors who desire to liquidate substantial holdings may find that they are unable to dispose of their shares in the market without causing a substantial decline in the market value of MAA's common stock.
Insufficient cash flow from operations or a decline in the market price of MAA's common stock may reduce the amount of cash available to the Operating Partnership to meet its obligations.
T
he Operating Partnership is subject to the risk that its cash flow will be insufficient to make payments on its debt and to make distributions to its unitholders, which may cause MAA to not have the funds to make distributions to its shareholders. MAA’s failure to meet the market’s expectations with regard to future results of operations and cash distributions would likely adversely affect the market price of its shares and thus potentially reduce MAA’s ability to contribute funds from issuances down to the Operating Partnership, resulting in a lower level of cash available for investment, to make payments on its debt or to make distributions to its unitholders.
Risks Related to Tax Laws
Failure to qualify as a REIT would cause us to be taxed as a corporation, which would significantly reduce funds available for distribution to shareholders.
If MAA fails to qualify as a REIT for federal income tax purposes, MAA will be subject to federal income tax on its taxable income at regular corporate rates without the benefit of the dividends paid deduction applicable to REITs. In addition, unless MAA is entitled to relief under applicable statutory provisions, MAA would be ineligible to make an election for treatment as a REIT for the four taxable years following the year in which it loses its qualification. The additional tax liability resulting from the failure to qualify as a REIT would significantly reduce or eliminate the amount of funds available for distribution to MAA’s shareholders. MAA’s failure to qualify as a REIT also could impair its ability to expand its business and raise capital, and would adversely affect the value of MAA’s common stock.
MAA believes that it is organized and qualified as a REIT, and MAA intends to operate in a manner that will allow it to continue to qualify as a REIT. MAA cannot assure, however, that it is qualified or will remain qualified as a REIT. This is because qualification as a REIT involves the application of highly technical and complex provisions of the Code for which there are only limited judicial and administrative interpretations and involves the determination of a variety of factual matters
19
and circumstances not entirely within MAA’s control. In addition, future legislation, new regulations, administrative interpretations or court decisions may significantly change the tax laws or the application of the tax laws with respect to qualification as a REIT for federal income tax purposes or the federal income tax consequences of qualification as a REIT.
Even if MAA qualifies as a REIT, MAA will be subject to various federal, state and local taxes, including property taxes and income taxes on taxable income that MAA does not timely distribute to its shareholders. In addition, MAA may hold certain assets and engage in certain activities that a REIT could not engage in directly through its taxable REIT subsidiaries, or TRSs, and those TRSs will be subject to federal income tax at regular corporate rates on their taxable income without the benefit of the dividends paid deduction applicable to REITs.
Furthermore, we have a subsidiary that has elected to be treated as a REIT, and if our subsidiary REIT were to fail to qualify as a REIT, it is possible that we also would fail to qualify as a REIT unless we (or the subsidiary REIT) could qualify for certain relief provisions. The qualification of our subsidiary REIT as a REIT will depend on satisfaction, on an annual or quarterly basis, of numerous requirements set forth in highly technical and complex provisions of the Code for which there are only limited judicial or administrative interpretations. A determination as to whether such requirements are satisfied involves various factual matters and circumstances not entirely within our control. The fact that we hold substantially all of our assets through the Operating Partnership and its subsidiaries further complicates the application of the REIT requirements for us. No assurance can be given that our subsidiary REIT will qualify as a REIT for any particular year.
If any REIT previously acquired by us failed to qualify as a REIT for U.S. federal income tax purposes, we would incur adverse tax consequences and our financial condition and results of operations would be materially adversely affected.
Prior to the merger with Post Properties, Post Properties operated in a manner intended to allow it to qualify as a REIT for U.S. federal income tax purposes. If Post Properties, or any other REIT previously acquired by MAA (each, a "Merged REIT"), is determined to have lost its REIT status at any time prior to its merger with MAA, MAA would be subject to serious adverse tax consequences, including:
|
•
|
MAA would be required to pay U.S. federal income tax at regular corporate rates on the taxable income of such Merged REIT without the benefit of the dividends paid deduction for the taxable years that the Merged REIT did not qualify as a REIT and for which the statute of limitations period remains open; and
|
|
•
|
MAA would be required to pay any federal alternative minimum tax liability of the Merged REIT and any applicable state and local tax liability, in each case, for all taxable years that remain open under the applicable statute of limitations periods.
|
MAA is liable for any tax liability of a Merged REIT with respect to any periods prior to the merger of such Merged REIT with MAA. If a Merged REIT failed to qualify as a REIT, then in the event of a taxable disposition by MAA of an asset previously held by the Merged REIT during a specified period of up to 5 years following the merger of the Merged REIT with MAA, MAA will be subject to corporate income tax with respect to any built-in gain inherent in such asset as of the date of such merger. In addition, unless an applicable statutory relief provision applies, if a Merged REIT failed to qualify as a REIT for a taxable year, then the Merged REIT would not have been entitled to re-elect to be taxed as a REIT until the fifth taxable year following the year during which it was disqualified. Furthermore, if both MAA and a Merged REIT were "investment companies" under the "investment company" rules set forth in Section 368 of the Code at the time of the merger of MAA and such Merged REIT, the failure of MAA or such Merged REIT to have qualified as a REIT at the time of their merger could result in such merger being treated as taxable for federal income tax purposes. As a result of all these factors, the failure by a Merged REIT to have qualified as a REIT could jeopardize MAA’s qualification as a REIT and require the Operating Partnership to provide material amounts of cash to MAA to satisfy MAA’s additional tax liabilities and, therefore, could have a material adverse effect on MAA’s business prospects, financial condition or results of operations and on MAA’s ability to make payments on our debt and to make distributions.
The Operating Partnership may fail to be treated as a partnership for federal income tax purposes.
We believe that the Operating Partnership qualifies, and has so qualified since its formation, as a partnership for federal income tax purposes and not as a publicly traded partnership taxable as a corporation. No assurance can be provided, however, that the Internal Revenue Service, or IRS, will not challenge the treatment of the Operating Partnership as a partnership for federal income tax purposes or that a court would not sustain such a challenge. If the IRS were successful in treating the Operating Partnership as a corporation for federal income tax purposes, then the taxable income of the Operating Partnership would be taxable at regular corporate income tax rates. In addition, the treatment of the Operating Partnership as a corporation would cause MAA to fail to qualify as a REIT. See "Failure to qualify as a REIT would cause us to be taxed as a
20
corporation, which would significantly reduce funds available for distribution to shareholders" above.
Certain dispositions of property by us may generate prohibited transaction income, resulting in a 100% penalty tax on any gain attributable to the disposition.
Any gain resulting from a transfer of property that we hold as inventory or primarily for sale to customers in the ordinary course of business would be treated for federal income tax purposes as income from a prohibited transaction that is subject to a 100% penalty tax. Since we acquire properties for investment purposes, we do not believe that our occasional transfers or disposals of property would be considered prohibited transactions. Whether property is held for investment purposes is a question of fact that depends on all the facts and circumstances surrounding the particular transaction. As such, the IRS may contend that certain transfers or disposals of properties by us are prohibited transactions. If the IRS were to argue successfully that a transfer or disposition of property constituted a prohibited transaction, then we would be required to pay a 100% penalty tax on any gain allocable to us from the prohibited transaction. In addition, income from a prohibited transaction might adversely affect our ability to satisfy the income tests for qualification as a REIT for federal income tax purposes. A safe harbor to the characterization of the disposition of property as a prohibited transaction and the resulting imposition of the 100% tax is available; however, we cannot assure that we will be able to comply with such safe harbor in connection with any property dispositions.
The recently enacted legislation informally titled the Tax Cuts and Jobs Act and other legislative, regulatory and administrative developments may adversely affect MAA or its shareholders.
On December 22, 2017, President Trump signed into law P.L. 115-97, informally titled the Tax Cuts and Jobs Act, or the Tax Act. The Tax Act makes major changes to the Code, including a number of provisions of the Code that affect the taxation of REITs and their shareholders. Certain provisions of the Tax Act that may impact us and our shareholders include:
|
•
|
temporarily reducing individual U.S. federal income tax rates on ordinary income; the highest individual U.S. federal income tax rate will be reduced from 39.6% to 37% (through taxable years ending in 2025);
|
|
•
|
reducing the maximum corporate income tax rate from 35% to 21%;
|
|
•
|
permitting a deduction for certain pass-through business income, including dividends received from REITs that are not designated as capital gain dividends or qualified dividend income, which generally will allow individuals, trusts and estates to deduct up to 20% of such amounts, resulting in an effective maximum U.S. federal income tax rate of 29.6% on such dividends (through taxable years ending in 2025);
|
|
•
|
reducing the highest rate of withholding with respect to distributions to non-U.S. shareholders attributable to gains from the sale or exchange of U.S. real property interests from 35% to 21%;
|
|
•
|
limiting the deduction for net operating losses to 80% of taxable income (prior to the application of dividends paid deduction);
|
|
•
|
amending the limitation on the deduction of net interest expense for all businesses, other than certain electing businesses, including real estate businesses (which could adversely affect the taxation of any taxable REIT subsidiaries); and
|
|
•
|
eliminating the corporate alternative minimum tax.
|
The individual and collective impact of these provisions and other provisions of the Tax Act on MAA and its shareholders is uncertain, and may not become evident for some period of time. In addition, other legislative, regulatory or administrative changes may be enacted or promulgated, either prospectively or with retroactive effect, and may adversely affect MAA or its shareholders. MAA's shareholders and prospective shareholders should consult their individual tax advisors regarding the implications of the Tax Act and other potential legislative, regulatory or administrative changes on their investment in MAA's capital stock.
Item 1B. Unresolved Staff Comments.
None.
21
Item 2. Properties.
We seek to acquire newer apartment communities and those with opportunities for repositioning through capital additions and management improvement located in the Southeast, Southwest and Mid-Atlantic regions of the United States with the potential for above average growth and return on investment. Approximately
68%
of our apartment units are located in the Florida, Georgia, North Carolina, and Texas markets. Our strategic focus is to provide our residents high quality apartment units in attractive community settings, characterized by upscale amenities, extensive landscaping and attention to aesthetic detail.
The following table summarizes our apartment community portfolio and occupancy levels by location, as of
December 31, 2018
:
|
Number of Communities
|
Number of Units
(1)
|
Average Unit Size (Square Footage)
|
Average Occupancy
(2)
|
|||||||||
|
Atlanta, GA
|
28
|
|
10,664
|
|
1,040.4
|
|
95.9
|
%
|
||||
|
Dallas, TX
|
29
|
|
9,404
|
|
884.2
|
|
95.3
|
%
|
||||
|
Austin, TX
|
21
|
|
6,475
|
|
935.6
|
|
95.8
|
%
|
||||
|
Charlotte, NC
|
21
|
|
6,149
|
|
965.0
|
|
96.2
|
%
|
||||
|
Tampa, FL
|
14
|
|
5,220
|
|
1,015.6
|
|
96.3
|
%
|
||||
|
Orlando, FL
|
12
|
|
4,498
|
|
1,027.4
|
|
96.2
|
%
|
||||
|
Houston, TX
|
14
|
|
4,479
|
|
882.4
|
|
96.2
|
%
|
||||
|
Raleigh/ Durham, NC
|
14
|
|
4,397
|
|
1,016.5
|
|
96.3
|
%
|
||||
|
Fort Worth, TX
|
11
|
|
4,249
|
|
902.9
|
|
95.8
|
%
|
||||
|
Washington, DC
|
10
|
|
4,080
|
|
926.4
|
|
96.7
|
%
|
||||
|
Nashville, TN
|
10
|
|
3,776
|
|
1,019.6
|
|
95.6
|
%
|
||||
|
Jacksonville, FL
|
10
|
|
3,496
|
|
964.4
|
|
96.6
|
%
|
||||
|
Charleston, SC
|
10
|
|
2,726
|
|
956.9
|
|
95.8
|
%
|
||||
|
Phoenix, AZ
|
7
|
|
2,301
|
|
980.2
|
|
96.7
|
%
|
||||
|
Savannah, GA
|
9
|
|
2,219
|
|
1,021.3
|
|
96.6
|
%
|
||||
|
Memphis, TN
|
4
|
|
1,811
|
|
974.2
|
|
95.7
|
%
|
||||
|
Greenville, SC
|
8
|
|
1,748
|
|
902.0
|
|
96.4
|
%
|
||||
|
Richmond, VA
|
6
|
|
1,668
|
|
862.3
|
|
96.7
|
%
|
||||
|
San Antonio, TX
|
4
|
|
1,504
|
|
910.3
|
|
96.0
|
%
|
||||
|
Birmingham, AL
|
5
|
|
1,462
|
|
1,054.8
|
|
96.2
|
%
|
||||
|
Little Rock, AR
|
5
|
|
1,368
|
|
981.5
|
|
95.4
|
%
|
||||
|
Jackson, MS
|
4
|
|
1,241
|
|
970.1
|
|
96.2
|
%
|
||||
|
Huntsville, AL
|
3
|
|
1,228
|
|
1,089.9
|
|
97.3
|
%
|
||||
|
Chattanooga, TN
|
4
|
|
943
|
|
905.7
|
|
96.2
|
%
|
||||
|
Lexington, KY
|
4
|
|
924
|
|
914.4
|
|
96.2
|
%
|
||||
|
Norfolk / Hampton / Virginia Beach, VA
|
3
|
|
788
|
|
924.5
|
|
96.9
|
%
|
||||
|
Las Vegas, NV
|
2
|
|
721
|
|
953.5
|
|
96.3
|
%
|
||||
|
Tallahassee, FL
|
2
|
|
604
|
|
1,111.2
|
|
96.1
|
%
|
||||
|
Kansas City, MO / KS
|
2
|
|
603
|
|
965.9
|
|
95.9
|
%
|
||||
|
Columbia, SC
|
2
|
|
576
|
|
1,028.6
|
|
96.8
|
%
|
||||
|
South Florida, FL
|
1
|
|
480
|
|
1,189.4
|
|
96.2
|
%
|
||||
|
Gainesville, FL
|
2
|
|
468
|
|
1,137.7
|
|
97.3
|
%
|
||||
|
Louisville, KY
|
1
|
|
384
|
|
845.7
|
|
96.2
|
%
|
||||
|
Gulf Shores, AL
|
1
|
|
324
|
|
993.0
|
|
96.9
|
%
|
||||
|
Panama City, FL
|
1
|
|
254
|
|
1,117.5
|
|
97.6
|
%
|
||||
|
Charlottesville, VA
|
1
|
|
251
|
|
943.5
|
|
97.3
|
%
|
||||
|
Same Store
|
285
|
|
93,483
|
|
968.3
|
|
96.1
|
%
|
||||
|
Atlanta, GA
|
2
|
|
770
|
|
859.1
|
|
61.5
|
%
|
||||
|
Austin, TX
|
1
|
|
642
|
|
788.9
|
|
94.4
|
%
|
||||
|
Charleston, SC
|
1
|
|
442
|
|
939.5
|
|
81.6
|
%
|
||||
|
Dallas, TX
|
2
|
|
362
|
|
957.4
|
|
93.9
|
%
|
||||
|
Denver, CO
|
2
|
|
733
|
|
832.1
|
|
61.6
|
%
|
||||
|
Greenville, SC
|
1
|
|
336
|
|
1,029.5
|
|
94.6
|
%
|
||||
|
Gulf Shores, AL
|
1
|
|
96
|
|
2,145.8
|
|
96.7
|
%
|
||||
|
Houston, TX
|
1
|
|
388
|
|
866.4
|
|
96.2
|
%
|
||||
|
Kansas City, MO
|
1
|
|
507
|
|
1,008.1
|
|
86.3
|
%
|
||||
|
Nashville, TN
|
2
|
|
599
|
|
811.2
|
|
88.1
|
%
|
||||
|
Orlando, FL
|
1
|
|
776
|
|
986.9
|
|
94.9
|
%
|
||||
|
Phoenix, AZ
|
1
|
|
322
|
|
901.3
|
|
95.7
|
%
|
||||
|
Raleigh/Durham, NC
|
1
|
|
803
|
|
892.6
|
|
95.7
|
%
|
||||
|
Richmond, VA
|
1
|
|
336
|
|
994.2
|
|
96.7
|
%
|
||||
|
Non-Same Store
(3)
|
18
|
|
7,112
|
|
918.4
|
|
86.5
|
%
|
||||
|
Total
|
303
|
|
100,595
|
|
|
|
|
|
||||
|
(1)
|
Number of Units excludes development units not yet delivered.
|
|
(2)
|
Average Occupancy is calculated by dividing the average daily number of units occupied in 2018 by the average daily total number of units available in 2018 at each apartment community.
|
|
(3)
|
Non-Same Store total excludes 269 units in a joint venture property in Washington, D.C.
|
Thirty
of our multifamily properties reflected in the above table also include commercial components totaling approximately
615,000
square feet of gross leasable space. We also owned
four
commercial properties totaling approximately
260,000
square feet of combined gross leasable space as of
December 31, 2018
. See "Management's Discussion and Analysis of Financial Condition and Results of Operations" for a discussion of our Same Store and Non-Same Store portfolios.
22
Mortgage Financing
As of
December 31, 2018
, we had
$476.2 million
of indebtedness collateralized, secured, and outstanding as set forth in Schedule III, Real Estate and Accumulated Depreciation included elsewhere in this Annual Report on Form 10-K.
Item 3. Legal Proceedings.
In September 2010, the United States Department of Justice, or the DOJ, filed suit against Post Properties (and by virtue of the merger with Post Properties, MAA) in United States District Court for the District of Columbia alleging that certain of Post Properties' apartments violated accessibility requirements of the FHA and the ADA. The DOJ sought, among other things, an injunction against us, requiring us to retrofit the properties and comply with FHA and ADA standards in future design and construction, as well as monetary damages and civil penalties. In October 2018, we reached an agreement in principle with the DOJ to settle the lawsuit. In November 2018, the settlement agreement was fully executed. In December 2018, a stipulation of dismissal of the case with prejudice was filed with the District Court, concluding the case.
In December 2017, the Equal Rights Center, a non-profit civil rights organization, filed suit against MAA and the Operating Partnership in the United States District Court for the District of Columbia. This suit alleged that we maintained and enforced a criminal records screening policy at certain of our apartment communities, all of which we acquired in the Post Properties merger, which violated the FHA. The suit sought injunctive relief, actual and punitive damages and attorneys' fees and costs. In October 2018, the parties agreed to a settlement, and the District Court entered a Consent Order concluding the case.
In June 2016, plaintiffs Cathi Cleven and Tara Cleven, on behalf of a purported class of plaintiffs, filed a complaint against MAA and the Operating Partnership in the United States District Court for the Western District of Texas, Austin Division. In January 2017, Areli Arellano and Joe L. Martinez joined the lawsuit as additional plaintiffs. The lawsuit alleges that we (but not Post Properties) charged late fees at our Texas properties that violate Section 92.019 of the Texas Property Code, or Section 92.019, which provides that a landlord may not charge a tenant a late fee for failing to pay rent unless, among other things, the fee is a reasonable estimate of uncertain damages to the landlord that are incapable of precise calculation and result from the late payment of rent. The plaintiffs are seeking monetary damages and attorneys' fees and costs. In September 2018, the District Court certified a class proposed by the plaintiffs. Additionally, in September 2018, the District Court denied our motion for summary judgment and granted the plaintiffs’ motion for partial summary judgment. Because the District Court certified a class prior to granting the plaintiffs’ motion for partial summary judgment, the District Court’s ruling applies to the entire class. In October 2018, the Fifth Circuit Court of Appeals accepted our petition to review the District Court’s order granting class certification. We intend to appeal the District Court’s order granting plaintiff’s motion for summary judgment to the Fifth Circuit Court of Appeals if permission to appeal is granted. We will continue to vigorously defend the action and pursue such appeals.
In April 2017, plaintiff Nathaniel Brown, on behalf of a purported class of plaintiffs, filed a complaint against the Operating Partnership, as the successor by merger to Post Properties' primary operating partnership, and MAA in the United States District Court for the Western District of Texas, Austin Division. The lawsuit alleges that Post Properties (and, following the Post Properties merger, the Operating Partnership) charged late fees at its Texas properties that violate Section 92.019. The plaintiffs are seeking monetary damages and attorneys' fees and costs. In September 2018, the District Court certified a class proposed by the plaintiff. Additionally, in September 2018, the District Court denied our motion for summary judgment and granted the plaintiff’s motion for partial summary judgment. Because the District Court certified a class prior to granting the plaintiff’s motion for partial summary judgment, the District Court’s ruling applies to the entire class. In October 2018, the Fifth Circuit Court of Appeals accepted our petition to review the District Court's order granting class certification. We intend to appeal the District Court’s order granting plaintiff’s motion for summary judgment to the Fifth Circuit Court of Appeals if permission to appeal is granted. We will continue to vigorously defend the action and pursue such appeals.
In addition, we are subject to various other legal proceedings arising in the course of our business operations. While no assurances can be given, we do not currently believe that any of these other outstanding matters will have a material adverse effect on our financial condition, results of operations or cash flows in the event of a negative outcome.
Item 4. Mine Safety Disclosures.
Not applicable.
23
PART II
Item 5. Market for Registrant's Common Equity, Related Stockholder Matters and Issuer Purchases of Equity Securities.
Mid-America Apartment Communities, Inc.
Market Information
MAA's common stock has been listed and traded on the NYSE under the symbol "MAA" since its initial public offering in February 1994. On
February 18, 2019
, there were approximately
2,700
holders of record of the common stock. MAA believes it has a significantly larger number of beneficial owners of its common stock.
Direct Stock Purchase and Distribution Reinvestment Plan
We have established the dividend and distribution reinvestment stock purchase plan, or DRSPP, under which holders of common stock, preferred stock and OP Units can elect to automatically reinvest their distributions in shares of MAA common stock. The DRSPP also allows for the optional purchase of MAA common stock of at least $250, but not more than$5,000 in any given month, free of brokerage commissions and charges. In our absolute discretion, we may grant waivers to allow for optional cash payments in excess of $5,000. To fulfill our obligations under the DRSPP, we may either issue additional shares of common stock or repurchase common stock in the open market. We may elect to sell shares under the DRSPP at up to a 5% discount. In
2018
,
2017
, and
2016
, we had issuances with no discounts through our DRSPP of 9,721 shares, 9,568 shares, and 7,906 shares, respectively.
Mid-America Apartments, L.P.
Operating Partnership Units
There is no established public trading market for the Operating Partnership's OP Units. From time-to-time, we issue shares of MAA's common stock in exchange for OP Units tendered to the Operating Partnership for redemption in accordance with the provisions of the Operating Partnership’s limited partnership agreement. As of
December 31, 2018
, there were
117,955,568
OP Units outstanding in the Operating Partnership, of which
113,844,267
OP Units, or
96.5%
, were owned by MAA and
4,111,301
OP Units, or
3.5%
, were owned by limited partners. Under the terms of the Operating Partnership’s limited partnership agreement, the limited partner holders of OP Units have the right to require the Operating Partnership to redeem all or a portion of the OP Units held by the holder in exchange for one share of MAA common stock per one OP Unit or a cash payment based on the market value of MAA's common stock at the time of redemption, at the option of MAA. During the year ended
December 31, 2018
, MAA issued a total of
80,283
shares of common stock upon redemption of OP Units.
At-the-Market Offering
We have entered into distribution agreements with J.P. Morgan Securities LLC, BMO Capital Markets Corp. and KeyBanc Capital Markets Inc. to sell up to an aggregate of 4.0 million shares of common stock, from time-to-time in at-the-market offerings or negotiated transactions through controlled equity offering programs, or ATMs. As of
December 31, 2018
, there were 4.0 million shares available to be sold under the ATMs.
Stock Repurchase Plan
On December 8, 2015, MAA's Board of Directors authorized the repurchase of up to 4.0 million shares of MAA common stock, which represented approximately 5.3% of MAA's common stock outstanding at the time of such authorization. The December 2015 authorization replaced and superseded any previous authorization. From time to time, we may repurchase shares under the current authorization when we believe that shareholder value would be enhanced. Factors affecting this determination include, among others, the share price and expected rates of return. As of
December 31, 2018
, no shares have been repurchased under the current authorization.
24
Purchases of Equity Securities
The following table reflects repurchases of shares of MAA's common stock during the three months ended
December 31, 2018
:
|
Total Number of Shares Purchased
(1)
|
Average Price Paid per Share
(2)
|
Total Number of Shares Purchased as Part of Publicly Announced Plans or Programs
|
Maximum Number of Shares That May Yet be Purchased Under the Plans or Programs
(3)
|
||||||||
|
October 1, 2018 - October 31, 2018
|
—
|
|
$
|
—
|
|
—
|
|
4,000,000
|
|||
|
November 1, 2018 - November 30, 2018
|
—
|
|
$
|
—
|
|
—
|
|
4,000,000
|
|||
|
December 1, 2018 - December 31, 2018
|
93
|
|
$
|
97.20
|
|
—
|
|
4,000,000
|
|||
|
Total
|
93
|
|
|
|
—
|
|
4,000,000
|
||||
|
(1)
|
This column reflects the shares of common stock surrendered by employees to satisfy their statutory minimum federal and state tax obligations associated with the vesting of restricted shares under the Second Amended and Restated 2013 Stock Incentive Plan.
|
|
(2)
|
The price per share is based on the closing price of MAA's common stock as of the date of determination of the statutory minimum for federal and state tax obligations.
|
|
(3)
|
This column reflects the number of shares of MAA's common stock that are available for purchase under the 4.0 million share repurchase program authorized by MAA's Board of Directors in December 2015.
|
Comparison of Five-year Cumulative Total Returns
The following graph compares the cumulative total returns of the shareholders of MAA since December 31, 2013 with the S&P 500 Index and the FTSE NAREIT Equity REIT Index. The graph assumes that the base share price for our common stock and each index is $100 and that all dividends are reinvested. The performance graph is not necessarily indicative of future investment performance.
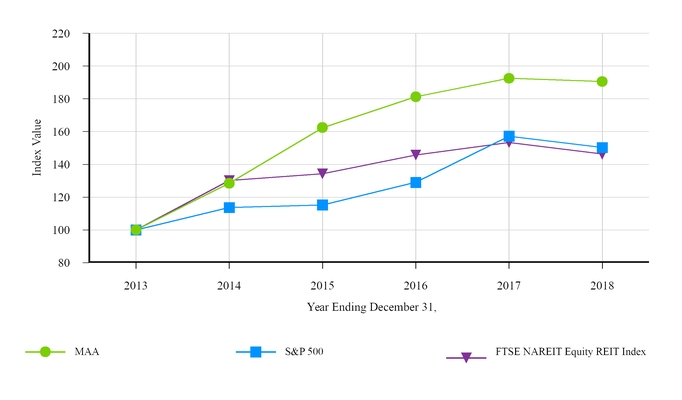
|
Year Ending December 31,
|
||||||||||||||||||||||||
|
|
2013
|
2014
|
2015
|
2016
|
2017
|
2018
|
||||||||||||||||||
|
MAA
|
$
|
100.00
|
|
$
|
128.42
|
|
$
|
162.40
|
|
$
|
181.23
|
|
$
|
192.59
|
|
$
|
190.58
|
|
||||||
|
S&P 500
|
100.00
|
|
113.69
|
|
115.26
|
|
129.05
|
|
157.22
|
|
150.33
|
|
||||||||||||
|
FTSE NAREIT Equity REIT Index
|
100.00
|
|
130.14
|
|
134.30
|
|
145.74
|
|
153.36
|
|
146.27
|
|
||||||||||||
25
Item 6. Selected Financial Data.
The following tables set forth selected financial data on a historical basis for MAA and the Operating Partnership. This data should be read in conjunction with the consolidated financial statements and notes thereto and "Management's Discussion and Analysis of Financial Condition and Results of Operations" included elsewhere in this Annual Report on Form 10-K.
Mid-America Apartment Communities, Inc.
Selected Financial Data
(In thousands, except per share data)
|
|
Year Ended December 31,
|
||||||||||||||||||
|
|
2018
|
2017
|
2016
|
2015
|
2014
|
||||||||||||||
|
Operating Data:
|
|
|
|
|
|
|
|
|
|
|
|||||||||
|
Rental and other property revenues
|
$
|
1,571,346
|
|
$
|
1,528,987
|
|
$
|
1,125,348
|
|
$
|
1,042,779
|
|
$
|
992,332
|
|
||||
|
Income from continuing operations
|
231,022
|
|
340,536
|
|
224,402
|
|
350,745
|
|
150,946
|
|
|||||||||
|
Discontinued operations:
|
|
|
|
|
|
|
|
|
|
|
|||||||||
|
Loss from discontinued operations before gain on sale
|
—
|
|
—
|
|
—
|
|
—
|
|
(63
|
)
|
|||||||||
|
Gain on sale of discontinued operations
|
—
|
|
—
|
|
—
|
|
—
|
|
5,394
|
|
|||||||||
|
Net income
|
231,022
|
|
340,536
|
|
224,402
|
|
350,745
|
|
156,277
|
|
|||||||||
|
Net income attributable to noncontrolling interests
|
8,123
|
|
12,157
|
|
12,180
|
|
18,458
|
|
8,297
|
|
|||||||||
|
Dividends to MAA Series I preferred shareholders
|
3,688
|
|
3,688
|
|
307
|
|
—
|
|
—
|
|
|||||||||
|
Net income available for MAA common shareholders
|
$
|
219,211
|
|
$
|
324,691
|
|
$
|
211,915
|
|
$
|
332,287
|
|
$
|
147,980
|
|
||||
|
Per Common Share Data:
|
|
|
|
|
|
|
|
|
|
|
|||||||||
|
Weighted average shares outstanding:
|
|
|
|
|
|
|
|
|
|
|
|||||||||
|
Basic
|
113,638
|
|
|
113,407
|
|
78,502
|
|
75,176
|
|
74,982
|
|
||||||||
|
Effect of dilutive securities
(1)
|
198
|
|
280
|
|
298
|
|
—
|
|
—
|
|
|||||||||
|
Diluted
|
113,836
|
|
113,687
|
|
78,800
|
|
75,176
|
|
74,982
|
|
|||||||||
|
Earnings per common share - basic:
|
|
|
|
|
|
|
|
|
|
|
|||||||||
|
Income from continuing operations available for common shareholders
|
$
|
1.93
|
|
$
|
2.86
|
|
$
|
2.69
|
|
$
|
4.41
|
|
$
|
1.90
|
|
||||
|
Discontinued property operations
|
—
|
|
—
|
|
—
|
|
—
|
|
0.07
|
|
|||||||||
|
Net income available for common shareholders
|
$
|
1.93
|
|
$
|
2.86
|
|
$
|
2.69
|
|
$
|
4.41
|
|
$
|
1.97
|
|
||||
|
Earnings per common share - diluted:
|
|
|
|
|
|
|
|
|
|
|
|||||||||
|
Income from continuing operations available for common shareholders
|
$
|
1.93
|
|
$
|
2.86
|
|
$
|
2.69
|
|
$
|
4.41
|
|
$
|
1.90
|
|
||||
|
Discontinued property operations
|
—
|
|
—
|
|
—
|
|
—
|
|
0.07
|
|
|||||||||
|
Net income available for common shareholders
|
$
|
1.93
|
|
$
|
2.86
|
|
$
|
2.69
|
|
$
|
4.41
|
|
$
|
1.97
|
|
||||
|
Dividends declared per common share
(2)
|
$
|
3.7275
|
|
$
|
3.5325
|
|
$
|
3.3300
|
|
$
|
3.1300
|
|
$
|
2.9600
|
|
||||
|
Balance Sheet Data:
|
|
|
|
|
|
|
|
|
|
|
|||||||||
|
Real estate owned, at cost
|
$
|
13,700,988
|
|
$
|
13,336,995
|
|
$
|
13,016,663
|
|
$
|
8,217,579
|
|
$
|
8,071,187
|
|
||||
|
Real estate assets, net
|
11,151,701
|
|
11,261,924
|
|
11,341,862
|
|
6,718,366
|
|
6,697,508
|
|
|||||||||
|
Total assets
|
11,323,781
|
|
11,491,919
|
|
11,604,491
|
|
6,847,781
|
|
6,821,778
|
|
|||||||||
|
Total debt
|
4,528,328
|
|
4,502,057
|
|
4,499,712
|
|
3,427,568
|
|
3,512,699
|
|
|||||||||
|
Noncontrolling interest
|
222,349
|
|
233,982
|
|
238,282
|
|
165,726
|
|
161,287
|
|
|||||||||
|
Total MAA shareholders' equity and redeemable stock
|
6,159,254
|
|
6,350,320
|
|
6,413,892
|
|
3,000,347
|
|
2,896,435
|
|
|||||||||
|
Other Data (at end of period):
|
|
|
|
|
|
|
|
|
|
|
|||||||||
|
Funds from operations
|
$
|
712,690
|
|
$
|
699,561
|
|
$
|
463,385
|
|
$
|
452,372
|
|
$
|
404,087
|
|
||||
|
Market capitalization (shares and units)
(3)
|
$
|
11,288,348
|
|
$
|
11,849,463
|
|
$
|
11,528,965
|
|
$
|
7,225,894
|
|
$
|
5,933,985
|
|
||||
|
Ratio of total debt to total capitalization
(4)
|
28.6
|
%
|
27.5
|
%
|
28.1
|
%
|
32.2
|
%
|
37.3
|
%
|
|||||||||
|
Number of multifamily apartment communities, including joint venture ownership interest
(5)
|
304
|
|
302
|
|
303
|
|
254
|
|
268
|
|
|||||||||
|
Number of multifamily units, including joint venture ownership interest
(5)
|
100,864
|
|
99,792
|
|
99,393
|
|
79,496
|
|
82,316
|
|
|||||||||
(1)
See Note 3 to the consolidated financial statements included elsewhere in this Annual Report on Form 10-K.
(2)
Beginning in 2006, at their regularly scheduled meetings, our Board of Directors began routinely declaring dividends for payment in the following quarter. This can result in dividends declared during a calendar year being different from dividends paid during a calendar year.
(3)
Market capitalization includes all shares of common stock, regardless of classification on the balance sheet, as well as OP Units (value based on common stock equivalency).
(4)
Total capitalization is market capitalization plus total debt.
(5)
Multifamily apartment communities and unit totals have not been adjusted to exclude properties held for sale.
26
Mid-America Apartments, L.P.
Selected Financial Data
(In thousands, except per unit data)
|
|
Year Ended December 31,
|
||||||||||||||||||
|
|
2018
|
2017
|
2016
|
2015
|
2014
|
||||||||||||||
|
Operating Data:
|
|
|
|
|
|
|
|
|
|
|
|||||||||
|
Rental and other property revenues
|
$
|
1,571,346
|
|
$
|
1,528,987
|
|
$
|
1,125,348
|
|
$
|
1,042,779
|
|
$
|
992,332
|
|
||||
|
Income from continuing operations
|
231,022
|
|
340,536
|
|
224,402
|
|
350,745
|
|
150,946
|
|
|||||||||
|
Discontinued operations:
|
|
|
|
|
|
|
|
|
|
|
|||||||||
|
Loss from discontinued operations before gain on sale
|
—
|
|
—
|
|
—
|
|
—
|
|
(63
|
)
|
|||||||||
|
Gain on sale of discontinued operations
|
—
|
|
—
|
|
—
|
|
—
|
|
5,394
|
|
|||||||||
|
Net income
|
231,022
|
|
340,536
|
|
224,402
|
|
350,745
|
|
156,277
|
|
|||||||||
|
Dividends to preferred unitholders
|
3,688
|
|
3,688
|
|
307
|
|
—
|
|
—
|
|
|||||||||
|
Net income available for MAALP common unitholders
|
$
|
227,334
|
|
$
|
336,848
|
|
$
|
224,095
|
|
$
|
350,745
|
|
$
|
156,277
|
|
||||
|
Per Common Unit Data:
|
|
|
|
|
|
|
|
|
|
|
|||||||||
|
Weighted average units outstanding:
|
|
|
|
|
|
|
|
|
|
|
|||||||||
|
Basic
|
117,777
|
|
|
117,617
|
|
82,661
|
|
79,361
|
|
79,188
|
|
||||||||
|
Effect of dilutive securities
(1)
|
198
|
|
|
280
|
|
298
|
|
—
|
|
—
|
|
||||||||
|
Diluted
|
117,975
|
|
117,897
|
|
82,959
|
|
79,361
|
|
79,188
|
|
|||||||||
|
Earnings per common unit - basic:
|
|
|
|
|
|
|
|
|
|
|
|||||||||
|
Income from continuing operations available for common unitholders
|
$
|
1.93
|
|
$
|
2.86
|
|
$
|
2.70
|
|
$
|
4.41
|
|
$
|
1.90
|
|
||||
|
Discontinued property operations
|
—
|
|
—
|
|
—
|
|
—
|
|
0.07
|
|
|||||||||
|
Net income available for common unitholders
|
$
|
1.93
|
|
$
|
2.86
|
|
$
|
2.70
|
|
$
|
4.41
|
|
$
|
1.97
|
|
||||
|
Earnings per common unit - diluted:
|
|
|
|
|
|
|
|
|
|
|
|||||||||
|
Income from continuing operations available for common unitholders
|
$
|
1.93
|
|
$
|
2.86
|
|
$
|
2.70
|
|
$
|
4.41
|
|
$
|
1.90
|
|
||||
|
Discontinued property operations
|
—
|
|
—
|
|
—
|
|
—
|
|
0.07
|
|
|||||||||
|
Net income available for common unitholders
|
$
|
1.93
|
|
$
|
2.86
|
|
$
|
2.70
|
|
$
|
4.41
|
|
$
|
1.97
|
|
||||
|
Distributions declared per common unit
(2)
|
$
|
3.7275
|
|
$
|
3.5325
|
|
$
|
3.3300
|
|
$
|
3.1300
|
|
$
|
2.9600
|
|
||||
|
Balance Sheet Data:
|
|
|
|
|
|
|
|
|
|
|
|||||||||
|
Real estate owned, at cost
|
$
|
13,700,988
|
|
$
|
13,336,995
|
|
$
|
13,016,663
|
|
$
|
8,217,579
|
|
$
|
8,071,187
|
|
||||
|
Real estate assets, net
|
11,151,701
|
|
11,261,924
|
|
11,341,862
|
|
6,718,366
|
|
6,697,508
|
|
|||||||||
|
Total assets
|
11,323,781
|
|
11,491,919
|
|
11,604,491
|
|
6,847,781
|
|
6,821,778
|
|
|||||||||
|
Total debt
|
4,528,328
|
|
4,502,057
|
|
4,499,712
|
|
3,427,568
|
|
3,512,699
|
|
|||||||||
|
Total Operating Partnership capital and redeemable units
|
6,379,278
|
|
6,581,977
|
|
6,649,849
|
|
3,166,054
|
|
3,057,703
|
|
|||||||||
|
Other Data (at end of period):
|
|
|
|
|
|
|
|
|
|
|
|||||||||
|
Number of multifamily apartment communities, including joint venture ownership interest
(3)
|
304
|
|
302
|
|
303
|
|
254
|
|
268
|
|
|||||||||
|
Number of multifamily units, including joint venture ownership interest
(3)
|
100,864
|
|
99,792
|
|
99,393
|
|
79,496
|
|
82,316
|
|
|||||||||
(1)
See Note 4 to the consolidated financial statements included elsewhere in this Annual Report on Form 10-K.
(2)
Beginning in 2006, at their regularly scheduled meetings, the Board of Directors began routinely declaring distributions for payment in the following quarter. This can result in distributions declared during a calendar year being different from distributions paid during a calendar year.
(3)
Multifamily apartment communities and unit totals have not been adjusted to exclude properties held for sale.
As previously discussed, the consolidated assets, liabilities, and results of operations of Post Properties are included in MAA's selected financial data from the closing date of the merger, December 1, 2016, through the end of MAA's fiscal year, December 31, 2018. Likewise, the consolidated assets, liabilities, and results of operations of Post Properties’ primary operating partnership are included in the Operating Partnership's selected financial data from the closing date of the merger, December 1, 2016, through the end of the Operating Partnership's fiscal year, December 31, 2018.
Item 7. Management's Discussion and Analysis of Financial Condition and Results of Operations.
The following discussion analyzes the financial condition and results of operations of both MAA and the Operating Partnership, of which MAA is the sole general partner and in which MAA owned a
96.5%
limited partner interest as of
December 31, 2018
. MAA conducts all of its business through the Operating Partnership and its various subsidiaries. This discussion should be read in conjunction with the consolidated financial statements included elsewhere in this Annual Report on Form 10-K.
MAA is a multifamily focused, self-administered and self-managed real estate investment trust, or REIT. We own, operate, acquire and selectively develop apartment communities located in the Southeast, Southwest and Mid-Atlantic regions of the United States. As of
December 31, 2018
, we owned and operated
303
apartment communities through the Operating Partnership and its subsidiaries, and we had an ownership interest in one apartment community through an unconsolidated real estate joint venture. In addition, as of December 31, 2018, we owned four commercial properties, and 30 of our apartment communities included retail components. Our multifamily and commercial properties are located across 17 states and the District of Columbia.
27
We report in two segments, Same Store communities and Non-Same Store and Other. Our Same Store segment represents those communities that have been owned and stabilized for at least 12 months as of the first day of the calendar year. Our Non-Same Store and Other segment includes recently acquired communities, communities being developed or in lease-up, communities undergoing extensive renovations, communities identified for disposition, and communities that have incurred a significant casualty loss. Also included in our Non-Same Store and Other segment are non-multifamily activities.
Effective January 1, 2018, we revised our reportable segment presentation. The revision eliminated the prior distinction between large and secondary same store markets and combined the two previously reportable segments into the Same Store reportable segment referred to above. Additional information regarding the composition of our segments is included in Note 14 to the consolidated financial statements included elsewhere in this Annual Report on Form 10-K.
Overview
For the year ended
December 31, 2018
, net income available for MAA common shareholders was
$219.2 million
compared to
$324.7 million
for the year ended
December 31, 2017
. Results for the year ended
December 31, 2018
included
$2.6 million
of expense related to the mark-to-market adjustment of the bifurcated embedded derivative related to the MAA Series I preferred stock issued in the merger with Post Properties and
$4.5 million
of gains related to the sale of real estate assets. Results for the year ended
December 31, 2017
included
$8.8 million
of income related to the adjustment of the bifurcated embedded derivative and
$127.4 million
of gains related to the sale of real estate assets. Revenues for the year ended
December 31, 2018
increased
2.8%
compared to the year ended
December 31, 2017
, driven by a
1.9%
increase in our Same Store segment and a
13.5%
increase in our Non-Same Store and Other segment. Property operating expenses, excluding depreciation and amortization, for the year ended
December 31, 2018
increased by
3.1%
compared to the year ended
December 31, 2017
, due to a
2.0%
increase in our Same Store segment and to a
14.6%
increase in our Non-Same Store and Other segment. The drivers of these increases are discussed below in the "Results of Operations" section.
Over the past three years, our growth has been driven by our acquisition strategy to invest in growing markets in the Southeast, Southwest and Mid-Atlantic regions of the United States. As a result of the merger with Post Properties, we acquired 61 apartment communities in 2016. We acquired
one
apartment community in
2018
,
two
in
2017
, and
five
in
2016
apart from the merger with Post Properties.
No
apartment communities were disposed in
2018
. We disposed of
five
apartment communities in
2017
and
12
in
2016
.
Trends
During the year ended
December 31, 2018
, demand for apartments continued to be relatively strong, as it was during the year ended
December 31, 2017
. Average daily physical occupancy for our Same Store portfolio was
96.1%
for the year ended
December 31, 2018
, in line with the
96.1%
average daily physical occupancy achieved during the year ended
December 31, 2017
. Average effective rent per unit from our Same Store portfolio continued to increase, up
1.9%
for the year ended
December 31, 2018
as compared to the year ended
December 31, 2017
.
An important part of our portfolio strategy is to maintain diversity of markets, submarkets, product types and price points in the Southeast, Southwest and Mid-Atlantic regions of the United States. This diversity tends to mitigate exposure to economic issues in any one geographic market or area. We believe that a well-balanced portfolio, including inner loop, suburban and downtown/central business district locations and various monthly rent price points, will perform well in “up” cycles as well as weather “down” cycles better. Through our investment in 38 defined Metropolitan Statistical Areas, we are diversified across markets, urban and suburban submarkets, and a variety of monthly rent pricing points.
Though overall demand continues to be strong, the current elevated supply levels are impacting rent growth for our portfolio, particularly for apartment communities located in urban submarkets. Properties in suburban submarkets have been impacted somewhat less by supply, primarily because less new development has occurred in those submarkets. Multifamily permitting is typically a leading indicator of future supply levels. While multifamily permitting across our markets was down in 2017 as compared to 2016, to date, the U.S. Census Bureau's data for 2018 suggested multifamily permitting across our markets was up as compared to 2017. It is difficult to project supply levels based on this data because not all permitted projects are ultimately built. However, given the current supply level and the 2018 permitting data, it is possible that supply in some of our markets could remain elevated over the next couple of years.
Demand for our apartments is primarily driven by general economic conditions in our markets. In particular, job growth relative to new supply is a critical factor in our ability to maintain occupancy and increase rents. To the extent that economic conditions continue to support increased job growth, we believe that we may be able to maintain occupancy more effectively and increase rents. Also, we believe that more disciplined credit terms for residential mortgages should continue to
28
favor rental demand at existing multifamily apartment communities. Furthermore, rental competition from single family homes has not been a major competitive factor impacting our portfolio. For the year ended
December 31, 2018
, total move outs attributable to single family home rentals for our portfolio represented less than 7% of total move outs, as it did in the year ended
December 31, 2017
. We have seen significant rental competition from single family homes in only a few of our submarkets. Long term, we expect demographic trends (including the growth of prime age groups for rentals and immigration and population movement to the Southeast, Southwest and Mid-Atlantic regions) will continue to support apartment rental demand in our markets.
Rising interest rates may have a significant impact on our business and results of operations. As of
December 31, 2018
, we had approximately
$4.5 billion
of debt, of which
25%
had variable rate interest and
75%
had fixed or hedged interest rates. To the extent interest rates rise, our net interest expense on variable rate debt will increase as will potentially our net interest expense on any debt refinancing. Given the short-term nature of our leases, to the extent interest rates rise due to general economic growth, we would expect increases in interest expense to be somewhat offset by positive leasing trends.
Our focus is on maintaining strong physical occupancy while increasing pricing where possible through our revenue management system. As noted above, average daily physical occupancy for the year ended
December 31, 2018
was sustained at
96.1%
. As we continue through the typically slower winter leasing season, we believe that the current level of physical occupancy and continued strong job growth in our markets position us well for this period and sets us up to achieve modestly improved pricing growth in 2019.
Results of Operations
Comparison of the Year Ended
December 31, 2018
to the Year Ended
December 31, 2017
For the year ended
December 31, 2018
, we achieved net income available for MAA common shareholders of
$219.2 million
, a
32.5%
decrease as compared to the
year ended December 31, 2017
, and total revenue growth of
$42.4 million
, representing a
2.8%
increase in property revenues as compared to the
year ended December 31, 2017
. The following discussion describes the primary drivers of the decrease in net income available for MAA common shareholders for the year ended
December 31, 2018
as compared to the
year ended December 31, 2017
.
Property Revenues
The following table reflects our property revenues by segment for the years ended
December 31, 2018
and
December 31, 2017
(dollars in thousands):
|
December 31, 2018
|
December 31, 2017
|
Increase
|
% Increase
|
|||||||||||
|
Same Store
|
$
|
1,441,811
|
|
$
|
1,414,839
|
|
$
|
26,972
|
|
1.9
|
%
|
|||
|
Non-Same Store and Other
|
129,535
|
|
114,148
|
|
15,387
|
|
13.5
|
%
|
||||||
|
Total
|
$
|
1,571,346
|
|
$
|
1,528,987
|
|
$
|
42,359
|
|
2.8
|
%
|
|||
The increase in property revenues for our Same Store segment as compared to the
year ended December 31, 2017
was the primary driver of total property revenue growth. The Same Store segment generated a
1.9%
increase in revenues for the
year ended December 31, 2018
, primarily a result of average effective rent per unit growth of
1.9%
and stable occupancy as compared to the
year ended December 31, 2017
. The increase in property revenues from the Non-Same Store and Other segment for the
year ended December 31, 2018
as compared to
year ended December 31, 2017
was primarily the result of recent property acquisitions and continued lease-up of recent development communities.
Property Operating Expenses
Property operating expenses include costs for property personnel, building repairs and maintenance, real estate taxes and insurance, utilities, landscaping, and other operating expenses. The following table reflects our property operating expenses by segment for the years ended
December 31, 2018
and
December 31, 2017
(dollars in thousands):
|
December 31, 2018
|
December 31, 2017
|
Increase
|
% Increase
|
|||||||||||
|
Same Store
|
$
|
536,055
|
|
$
|
525,663
|
|
$
|
10,392
|
|
2.0
|
%
|
|||
|
Non-Same Store and Other
|
58,533
|
|
51,068
|
|
7,465
|
|
14.6
|
%
|
||||||
|
Total
|
$
|
594,588
|
|
$
|
576,731
|
|
$
|
17,857
|
|
3.1
|
%
|
|||
29
The increase in property operating expenses for our Same Store segment as compared to the
year ended December 31, 2017
was primarily driven by increases in real estate tax expense of
$7.7 million
and personnel expenses of
$4.4 million
, partially offset by a decrease in building repairs and maintenance expense of
$2.5 million
. The increase in property operating expenses from our Non-Same Store and Other segment was primarily the result of increases in real estate tax expense of $4.2 million driven by recently completed communities previously in our development pipeline and other operating expense of $3.0 million.
Depreciation and Amortization
Depreciation and amortization expense for the
year ended December 31, 2018
was
$489.8 million
, a decrease of
$3.9 million
as compared to the
year ended December 31, 2017
. The decrease was primarily due to a $25.8 million decrease in amortization expense, which was driven by certain intangible assets acquired as a result of the merger with Post Properties becoming fully amortized in the second quarter of 2017. As a result, we recognized no amortization expense for those assets in the
year ended December 31, 2018
. The decrease in amortization expense was partially offset by a $21.9 million increase to depreciation expense for the
year ended December 31, 2018
as compared to the
year ended December 31, 2017
. The increase in depreciation expense was primarily driven by the recognition of depreciation expense associated with our capital asset spend during the
year ended December 31, 2018
, which was related to our development and redevelopment activities made in the normal course of business as well as property acquisitions during the year ended
December 31, 2018
.
Other Income and Expenses
Property management expenses for the
year ended December 31, 2018
were
$47.6 million
, an increase of
$4.0 million
as compared to the
year ended December 31, 2017
. The increase was primarily due to increases in personnel costs. General and administrative expenses for the
year ended December 31, 2018
were
$34.8 million
, a decrease of
$5.4 million
as compared to the
year ended December 31, 2017
, primarily due to decreases in legal expense. Merger and integration expenses for the
year ended December 31, 2018
were
$9.1 million
, a decrease of
$10.9 million
as compared to the
year ended December 31, 2017
, primarily due to declining year-over-year integration activities related to the merger with Post Properties.
Interest expense for the year ended
December 31, 2018
was
$173.6 million
, an increase of
$18.8 million
as compared to the year ended
December 31, 2017
. The increase was primarily due to an increase of approximately 18 basis points in our effective interest rate during the
year ended December 31, 2018
compared to the
year ended December 31, 2017
combined with a decrease in interest capitalized from our development pipeline during the
year ended December 31, 2018
compared to the
year ended December 31, 2017
.
We did not dispose of any apartment communities during the
year ended December 31, 2018
. For the
year ended December 31, 2017
, we disposed of
five
apartment communities, resulting in gains on sale of depreciable real estate assets of
$127.4 million
. Gain on sale of non-depreciable assets for the
year ended December 31, 2018
was
$4.5 million
, an increase of
$4.5 million
as compared to the
year ended December 31, 2017
. Although we disposed of only one land parcel more in the year ended December 31, 2018 as compared to the year ended December 31, 2017, the gain on sale of non-depreciable assets increased primarily due to the nature of the real estate assets sold.
Other non-operating income for the year ended
December 31, 2018
was
$5.4 million
, a decrease of
$8.9 million
as compared to the
year ended December 31, 2017
. The decrease was primarily due to the recognition of
$2.6 million
of expense from the net mark-to-market adjustment of the bifurcated embedded derivative related to the MAA Series I preferred stock during the
year ended December 31, 2018
as compared to the recognition of
$8.8 million
of income from the net mark-to-market adjustment of the bifurcated embedded derivative during the
year ended December 31, 2017
.
Comparison of the Year Ended
December 31, 2017
to the Year Ended
December 31, 2016
For the
year ended December 31, 2017
, we achieved net income available for MAA common shareholders of
$324.7 million
, as compared to
$211.9 million
for the
year ended December 31, 2016
. Total revenue grew
$403.6 million
for the
year ended December 31, 2017
as compared to the
year ended December 31, 2016
, representing a
35.9%
increase in property revenues. The following discussion describes the primary drivers of the increase in net income available for MAA common shareholders for the
year ended December 31, 2017
as compared to the
year ended December 31, 2016
. The comparison of the
year ended December 31, 2017
to the
year ended December 31, 2016
shows the segment break down based on our Same Store portfolio for the
year ended December 31, 2017
. A comparison using our
2018
Same Store portfolio would not be comparative due to the nature of the classifications.
30
Property Revenues
The following table reflects our property revenues by segment for the years ended
December 31, 2017
and
December 31, 2016
(dollars in thousands):
|
December 31, 2017
|
December 31, 2016
|
Increase
|
% Increase
|
|||||||||||
|
Same Store
|
$
|
1,021,138
|
|
$
|
992,721
|
|
$
|
28,417
|
|
2.9
|
%
|
|||
|
Non-Same Store and Other
|
507,849
|
|
132,627
|
|
375,222
|
|
282.9
|
%
|
||||||
|
Total
|
$
|
1,528,987
|
|
$
|
1,125,348
|
|
$
|
403,639
|
|
35.9
|
%
|
|||
The Same Store segment generated a
2.9%
increase in revenues for the
year ended December 31, 2017
, primarily a result of average effective rent per unit growth of 3.0% as compared to the
year ended December 31, 2016
. The increase in property revenues for the
year ended December 31, 2017
as compared to the
year ended December 31, 2016
from our Non-Same Store and Other segment was primarily the result of the merger with Post Properties, as we classified the properties we acquired in the merger in our Non-Same Store and Other segment.
Property Operating Expenses
Property operating expenses include costs for property personnel, building repairs and maintenance, real estate taxes and insurance, utilities, landscaping and other operating expenses. The following table reflects our property operating expenses by segment for the years ended
December 31, 2017
and
December 31, 2016
(dollars in thousands):
|
December 31, 2017
|
December 31, 2016
|
Increase
|
% Increase
|
|||||||||||
|
Same Store
|
$
|
380,390
|
|
$
|
372,154
|
|
$
|
8,236
|
|
2.2
|
%
|
|||
|
Non-Same Store and Other
|
196,341
|
|
51,202
|
|
145,139
|
|
283.5
|
%
|
||||||
|
Total
|
$
|
576,731
|
|
$
|
423,356
|
|
$
|
153,375
|
|
36.2
|
%
|
|||
The increase in property operating expenses for our Same Store segment as compared to the
year ended December 31, 2016
was primarily driven by increases in real estate tax expense of $6.2 million and personnel expenses of $2.3 million. The increase in property operating expenses for our Non-Same Store and Other segment was primarily due to the merger with Post Properties.
Depreciation and Amortization
Depreciation and amortization expense for the
year ended December 31, 2017
was
$493.7 million
, an increase of
$170.8 million
as compared to the
year ended December 31, 2016
. The increase was primarily driven by the full year of depreciation and amortization expense resulting from the merger with Post Properties compared to only one month of comparable depreciation and amortization in 2016. As a result of the merger with Post Properties, depreciation expense and amortization expense increased $138.2 million and $23.2 million, respectively, for the
year ended December 31, 2017
as compared to the
year ended December 31, 2016
. The remaining increase was primarily driven by our capital asset spend and other asset acquisition activity.
Other Income and Expenses
Property management expenses for the
year ended December 31, 2017
were
$43.6 million
, an increase of
$9.5 million
as compared to the
year ended December 31, 2016
. The increase was primarily due to the growth in our portfolio as a result of the merger with Post Properties. General and administrative expenses for the
year ended December 31, 2017
were
$40.2 million
, an increase of
$11.2 million
as compared to the
year ended December 31, 2016
, primarily due to increases in legal expense. Merger and integration expenses for the
year ended December 31, 2017
were
$20.0 million
, a decrease of
$20.8 million
as compared to the
year ended December 31, 2016
, as we incurred significant merger related expenses in 2016 to complete the merger with Post Properties on December 1, 2016.
Interest expense for the
year ended December 31, 2017
was
$154.8 million
, an increase of
$24.8 million
as compared to the
year ended December 31, 2016
. The increase was primarily due to increased borrowing as we assumed several loans as a result of the merger with Post Properties, including a secured loan with a face value of $186.0 million and two unsecured loans with face values of $150.0 million and $250.0 million, respectively. We also entered into a new $300.0 million term loan on the closing date of the merger with Post Properties. Interest expense for the
year ended December 31, 2017
increased $16.0 million due to these borrowings resulting from the merger with Post Properties.
31
Gains on sale of depreciable assets totaled
$127.4 million
for the
year ended December 31, 2017
, an increase of
$47.0 million
as compared to the
year ended December 31, 2016
. Although disposition activity decreased year-over-year, the gain on sale of depreciable assets increased primarily due to the nature of the real estate assets sold.
Other non-operating income for the
year ended December 31, 2017
was
$14.4 million
, an increase of
$16.2 million
as compared to the
year ended December 31, 2016
. The increase was primarily due to an
$8.8 million
increase in income from the net mark-to-market adjustment of the bifurcated embedded derivative related to the MAA Series I preferred stock issued in the merger with Post Properties. The increase in other non-operating income was also driven by a $3.3 million net gain on debt extinguishment.
During the
year ended December 31, 2017
, we recorded quarterly dividend distributions to holders of MAA's Series I preferred stock totaling
$3.7 million
. As there were no shares of MAA Series I preferred stock issued and outstanding until completion of the merger with Post Properties on December 1, 2016, preferred dividends only impacted our results of operations for one month totaling
$0.3 million
for the
year ended December 31, 2016
.
Funds from Operations
Funds from operations, or FFO, a non-GAAP financial measure, represent net income available for MAA common shareholders (computed in accordance with the United States generally accepted accounting principles, or GAAP) excluding extraordinary items, asset impairment and gains or losses on disposition of operating properties, plus net income attributable to noncontrolling interests, depreciation and amortization of real estate, and adjustments for joint ventures. Because noncontrolling interest is added back, FFO, when used in this Annual Report on Form 10-K, represents FFO attributable to the Company.
FFO should not be considered as an alternative to net income or any other GAAP measurement, as an indicator of operating performance or as an alternative to cash flow from operating, investing, and financing activities as a measure of liquidity. Management believes that FFO is helpful to investors in understanding our operating performance primarily because its calculation excludes depreciation and amortization expense on real estate assets. We believe that GAAP historical cost depreciation of real estate assets is generally not correlated with changes in the value of those assets, whose value does not diminish predictably over time, as historical cost depreciation implies. While our calculation of FFO is in accordance with the National Association of Real Estate Trust's, or NAREIT's, definition, it may differ from the methodology for calculating FFO utilized by other REITs and, accordingly, may not be comparable to such other REITs.
The following table presents a reconciliation of net income available for MAA common shareholders to FFO for the years ended
December 31, 2018
,
2017
and
2016
, as we believe net income available for MAA common shareholders is the most directly comparable GAAP measure (dollars in thousands):
|
|
Year ended December 31,
|
||||||||||
|
|
2018
|
2017
|
2016
|
||||||||
|
Net income available for MAA common shareholders
|
$
|
219,211
|
|
$
|
324,691
|
|
$
|
211,915
|
|
||
|
Depreciation and amortization of real estate assets
|
484,722
|
|
489,503
|
|
319,528
|
|
|||||
|
Loss (gain) on sale of depreciable real estate assets
|
39
|
|
(127,386
|
)
|
(80,397
|
)
|
|||||
|
Loss on disposition within unconsolidated entities
|
—
|
|
—
|
|
98
|
|
|||||
|
Depreciation and amortization of real estate assets of real estate joint venture
|
595
|
|
596
|
|
61
|
|
|||||
|
Net income attributable to noncontrolling interests
|
8,123
|
|
12,157
|
|
12,180
|
|
|||||
|
Funds from operations attributable to the Company
|
$
|
712,690
|
|
$
|
699,561
|
|
$
|
463,385
|
|
||
FFO for the year ended
December 31, 2018
were
$712.7 million
, an increase of
$13.1 million
as compared to the year ended
December 31, 2017
, primarily as a result of increases in property revenues of
$42.4 million
and gain on sale of non-depreciable assets of
$4.5 million
, in addition to a decrease in merger and integration expenses of
$10.9 million
. The increases to FFO were offset by increases in interest expense of
$18.8 million
and property operating expenses, excluding depreciation and amortization, of
$17.9 million
, in addition to a decrease in other non-operating income of
$8.9 million
.
FFO for the year ended
December 31, 2017
were
$699.6 million
, an increase of
$236.2 million
as compared to the year ended
December 31, 2016
, primarily as a result of increases in property revenues of
$403.6 million
and other non-operating income of
$16.2 million
, in addition to a decrease in merger and integration expenses of
$20.8 million
. The increases to FFO were offset by increases in property operating expenses, excluding depreciation and amortization, of
$153.4 million
, interest expense of
$24.8 million
, general and administrative expenses of
$11.2 million
, property management expenses of
$9.5 million
and preferred dividends of
$3.4 million
.
32
Liquidity and Capital Resources
Our cash flows from operating, investing and financing activities, as well as general economic and market conditions, are the principal factors affecting our liquidity and capital resources.
Operating Activities
Net cash provided by operating activities was
$734.3 million
for the year ended
December 31, 2018
, as compared to
$660.8 million
for the year ended
December 31, 2017
. The increase in operating cash flows was primarily driven by our operating performance as well as the timing of cash payments.
Investing Activities
Net cash used in investing activities was
$366.4 million
for the year ended
December 31, 2018
, as compared to net cash used in investing activities of
$294.2 million
for the year ended
December 31, 2017
. The primary drivers of the change were as follows (dollars in thousands):
|
Primary drivers of cash (outflow) inflow
|
Increase (Decrease) in Net Cash
|
||||||||||
|
during the year ended December 31,
|
|||||||||||
|
2018
|
2017
|
||||||||||
|
Purchases of real estate and other assets
|
$
|
(129,487
|
)
|
$
|
(136,065
|
)
|
$
|
6,578
|
|
||
|
Capital improvements, development and other
|
(254,715
|
)
|
(343,890
|
)
|
89,175
|
|
|||||
|
Proceeds from disposition of real estate assets
|
19,982
|
|
187,245
|
|
(167,263
|
)
|
|||||
The decrease in cash outflows for purchases of real estate and other assets was driven by the acquisition activity during the year ended
December 31, 2018
as compared to the year ended
December 31, 2017
. The decrease in cash outflows for capital improvements, development and other as compared to the prior year was primarily due to the decrease in activity in our development pipeline during the
year ended December 31, 2018
as compared to the prior year. The decrease in cash inflows related to proceeds from disposition of real estate assets was primarily due to the sale of
five
land parcels during the
year ended December 31, 2018
, as compared to the sale of
five
apartment communities and
four
land parcels during the prior year.
Financing Activities
Net cash used in financing activities was
$405.1 million
for the year ended
December 31, 2018
, as compared to net cash used in financing activities of
$399.5 million
for the year ended
December 31, 2017
. The primary drivers of the change were as follows (dollars in thousands):
|
Primary drivers of cash inflow (outflow)
|
Increase (Decrease) in Net Cash
|
||||||||||
|
during the year ended December 31,
|
|||||||||||
|
2018
|
2017
|
||||||||||
|
Net change in credit lines
|
$
|
50,000
|
|
$
|
(160,000
|
)
|
$
|
210,000
|
|
||
|
Proceeds from notes payable
|
869,630
|
|
597,480
|
|
272,150
|
|
|||||
|
Principal payments on notes payable
|
(878,610
|
)
|
(413,557
|
)
|
(465,053
|
)
|
|||||
|
Dividends paid on common shares
|
(419,849
|
)
|
(395,294
|
)
|
(24,555
|
)
|
|||||
The increase in cash inflow related to the net change in credit lines resulted from the increase in net borrowings of
$50.0 million
on our unsecured revolving credit facility during the
year ended December 31, 2018
, as compared to the decrease in net borrowings of
$160.0 million
on the unsecured revolving credit facility during the
year ended December 31, 2017
. The increase in cash inflows from proceeds from notes payable primarily resulted from the issuances of $400.0 million of senior unsecured notes, $172.0 million of secured property mortgages and a $300.0 million unsecured term loan during the
year ended December 31, 2018
, compared to the issuance of $600.0 million of senior unsecured notes during the
year ended December 31, 2017
. The increase in cash outflows from principal payments on notes payable primarily resulted from the retirement of
$568.0 million
of secured property mortgages and an $80.0 million secured credit facility during the
year ended December 31, 2018
, as compared to the retirement of $233.6 million of secured property mortgages and $168.0 million of senior unsecured notes during the
year ended December 31, 2017
. The increase in cash outflows from dividends paid on common shares primarily resulted from the increase in the annual dividend rate to $3.69 per share during the
year ended December 31, 2018
, as compared to the annual dividend rate of $3.48 per share during the
year ended December 31, 2017
.
33
Equity
As of
December 31, 2018
, MAA owned
113,844,267
OP Units, comprising a
96.5%
limited partnership interest in MAALP,
while the remaining
4,111,301
outstanding OP Units were held by limited partners of MAALP other than MAA and its subsidiaries. Holders of OP Units (other than MAA and its subsidiaries) may require us to redeem their OP Units from time to time, in which case MAA may, at its option, pay the redemption price either in cash (in an amount per OP Unit equal, in general, to the average closing price of MAA's common stock on the NYSE over a specified period prior to the redemption date) or by delivering one share of MAA's common stock (subject to adjustment under specified circumstances) for each OP Unit so redeemed. In addition, MAA has registered under the Securities Act
4,111,301
shares of its common stock that, as of
December 31, 2018
, were issuable upon redemption of OP Units, in order for those shares to be sold freely in the public markets.
For more information regarding our equity capital resources, see Note 9 and Note 10 to the consolidated financial statements included elsewhere in this Annual Report on Form 10-K.
Debt
The following schedule reflects our fixed and variable rate debt, including the impact of our interest rate swaps, outstanding as of
December 31, 2018
(dollars in thousands):
|
Principal Balance
|
Average Years to Rate Maturity
|
Effective Rate
|
|||||||
|
Unsecured debt
|
|||||||||
|
Fixed rate or swapped
|
$
|
2,942,000
|
|
6.0
|
|
3.8
|
%
|
||
|
Variable rate
|
1,140,000
|
|
0.1
|
|
3.4
|
%
|
|||
|
Fair market value adjustments, debt issuance costs and discounts
|
(28,698
|
)
|
|||||||
|
Total unsecured rate maturity
|
$
|
4,053,302
|
|
4.3
|
|
3.7
|
%
|
||
|
Secured debt
|
|
|
|
|
|
|
|||
|
Conventional - fixed rate
|
$
|
476,161
|
|
12.2
|
|
4.6
|
%
|
||
|
Fair market value adjustments and debt issuance costs
|
(1,135
|
)
|
|
|
|||||
|
Total secured rate maturity
|
$
|
475,026
|
|
12.2
|
|
4.6
|
%
|
||
|
Total debt
|
$
|
4,528,328
|
|
5.1
|
|
3.8
|
%
|
||
|
Total fixed or hedged debt
|
$
|
3,389,249
|
|
6.8
|
|
3.9
|
%
|
||
As of
December 31, 2018
, we had entered into interest rate swaps totaling a notional amount of
$600.0 million
, of which
$300.0 million
related to issued debt, while the remaining
$300.0 million
hedges the first 10 years of interest payments on debt we anticipate will be issued in 2019. To date, we believe the interest rate swaps have proven to be highly effective hedges.
The following schedule presents the contractual maturity dates of our outstanding debt, net of fair market value adjustments, debt issuance costs and discounts, as of
December 31, 2018
(dollars in thousands):
|
Unsecured Revolving Credit Facility
|
Public Bonds
|
Other Unsecured
|
Secured
|
Total
|
|||||||||||||||
|
2019
|
$
|
—
|
|
$
|
—
|
|
$
|
319,508
|
|
$
|
13,524
|
|
$
|
333,032
|
|
||||
|
2020
|
540,000
|
|
—
|
|
149,883
|
|
159,097
|
|
848,980
|
|
|||||||||
|
2021
|
—
|
|
—
|
|
222,294
|
|
122,837
|
|
345,131
|
|
|||||||||
|
2022
|
—
|
|
248,522
|
|
416,075
|
|
—
|
|
664,597
|
|
|||||||||
|
2023
|
—
|
|
346,826
|
|
12,217
|
|
—
|
|
359,043
|
|
|||||||||
|
Thereafter
|
—
|
|
1,778,037
|
|
19,940
|
|
179,568
|
|
1,977,545
|
|
|||||||||
|
Total
|
$
|
540,000
|
|
$
|
2,373,385
|
|
$
|
1,139,917
|
|
$
|
475,026
|
|
$
|
4,528,328
|
|
||||
34
The following schedule reflects the interest rate maturities of our outstanding fixed or hedged debt, net of fair market value adjustments, debt issuance costs and discounts, as of
December 31, 2018
(dollars in thousands):
|
Fixed Rate Debt
|
Interest Rate Swaps
|
Total Fixed Rate Balances
|
Contract Rate
|
||||||||||||
|
2019
|
$
|
33,508
|
|
$
|
—
|
|
$
|
33,508
|
|
4.4
|
%
|
||||
|
2020
|
159,097
|
|
299,353
|
|
458,450
|
|
3.2
|
%
|
|||||||
|
2021
|
195,459
|
|
—
|
|
195,459
|
|
5.2
|
%
|
|||||||
|
2022
|
365,244
|
|
—
|
|
365,244
|
|
3.6
|
%
|
|||||||
|
2023
|
359,043
|
|
—
|
|
359,043
|
|
4.3
|
%
|
|||||||
|
Thereafter
|
1,977,545
|
|
—
|
|
1,977,545
|
|
3.9
|
%
|
|||||||
|
Total
|
$
|
3,089,896
|
|
$
|
299,353
|
|
$
|
3,389,249
|
|
3.9
|
%
|
||||
Unsecured Revolving Credit Facility
In October 2015, the Operating Partnership entered into an unsecured revolving credit facility agreement with a syndicate of banks led by KeyBank National Association, or KeyBank, and fifteen other banks, which we refer to as the KeyBank Facility. The KeyBank Facility replaced the Operating Partnership's previous unsecured credit facility with KeyBank. The interest rate is determined using an investment grade pricing grid using LIBOR plus a spread of 0.85% to 1.55%. In December 2016, the Operating Partnership amended the KeyBank Facility by increasing the borrowing capacity from $750.0 million to
$1.0 billion
. As of
December 31, 2018
, we had
$540.0 million
borrowed under the KeyBank Facility, bearing interest at a rate of one month LIBOR plus 0.90%. The KeyBank Facility serves as our primary source of short-term liquidity and has an accordion feature that we may use to expand its capacity to $1.5 billion. The KeyBank Facility matures in April 2020, with an option to extend for an additional six months.
Senior Unsecured Notes
We have issued both public and private unsecured notes. As of
December 31, 2018
, we had approximately $2.4 billion (face value) of publicly issued unsecured notes and $242.0 million of unsecured notes issued in two private placements. In October 2013, we publicly issued $350.0 million of senior unsecured notes due October 2023 with a coupon of 4.30%, paid semi-annually on April 15 and October 15. In June 2014, we publicly issued $400.0 million of senior unsecured notes due June 2024 with a coupon of 3.75%, paid semi-annually on June 15 and December 15. In November 2015, we publicly issued $400.0 million senior unsecured notes due November 2025 with a coupon of 4.00%, paid semi-annually on May 15 and November 15. As a result of the merger with Post Properties in December 2016, we assumed $250.0 million of senior unsecured notes due December 2022 with a coupon of 3.38%, paid semi-annually on June 1 and December 1. In May 2017, we publicly issued $600.0 million of senior unsecured notes due June 2027 with a coupon of 3.60%, paid semi-annually on June 1 and December 1. In May 2018, we publicly issued $400.0 million of senior unsecured notes due June 2028 with a coupon of 4.20%, paid semi-annually on June 15 and December 15. The proceeds from the senior unsecured notes issued in May 2018 were used to pay down outstanding amounts under the Key Bank Facility. As of
December 31, 2018
, all of these amounts remained outstanding.
In July 2011, we issued $135.0 million of senior unsecured notes. The notes were offered and sold in a private placement with three maturity tranches: $50.0 million at 4.7% maturing in July 2018, $72.8 million at 5.4% maturing in July 2021; and $12.3 million at 5.6% maturing in July 2023. The $50.0 million tranche was paid off on its maturity date. In August 2012, we issued $175.0 million of senior unsecured notes. The notes were offered and sold in a private placement with four tranches: $18.0 million at 3.15% maturing in November 2017; $20.0 million at 3.61% maturing in November 2019; $117.0 million at 4.17% maturing in November 2022; and $20.0 million at 4.33% maturing in November 2024. The $18.0 million tranche was paid off on its maturity date. The remaining tranches were outstanding as of
December 31, 2018
.
Unsecured Term Loans
In addition to the KeyBank Facility and senior unsecured notes, we maintain four unsecured term loans. We had total borrowings of
$900.0 million
outstanding under these term loan agreements as of
December 31, 2018
, comprised of:
A $300.0 million term loan with Wells Fargo, N.A., or Wells Fargo, that bears interest at a rate of LIBOR plus a spread of 0.75% to 1.65% based on the credit ratings of our unsecured debt. We entered into the six month term loan in December 2018, and the loan matures in June 2019, with an option to extend for an additional six months. As of
December 31, 2018
, this loan was bearing interest at a rate of one month LIBOR plus 0.90%.
35
A $150.0 million term loan with U.S. Bank National Association, or U.S. Bank, that bears interest at a rate of LIBOR plus a spread of 0.90% to 1.90% based on the credit ratings of our unsecured debt. The loan matures in March 2020. As of
December 31, 2018
, this loan was bearing interest at a rate of one month LIBOR plus 0.98%.
A $150.0 million term loan with KeyBank that bears interest at a rate of LIBOR plus a spread of 0.90% to 1.75% based on the credit ratings of our unsecured debt. The loan matures in February 2021. As of
December 31, 2018
, this loan was bearing interest at a rate of one month LIBOR plus 0.95%.
A $300.0 million term loan with Wells Fargo that bears interest at a rate of LIBOR plus a spread of 0.90% to 1.75% based on the credit ratings of our unsecured debt. The loan matures in March 2022. As of
December 31, 2018
, this loan was bearing interest at a rate of one month LIBOR plus 0.95%.
We retired a $250.0 million unsecured term loan with Wells Fargo on its maturity date in August 2018.
Secured Property Mortgages
We maintain secured property mortgages with Fannie Mae, Freddie Mac and various life insurance companies. These mortgages are usually fixed rate and can range from five to 30 years in maturity. As of
December 31, 2018
, we had
$476.2 million
of secured property mortgages. In December 2018, we issued $172.0 million in secured property mortgages with a fixed rate of 4.44%. During the year ended
December 31, 2018
, we retired
$568.0 million
of secured property mortgages.
For more information regarding our debt capital resources, see Note 6 to the consolidated financial statements included elsewhere in this Annual Report on Form 10-K.
Contractual Obligations
The following table reflects our total contractual cash obligations as of
December 31, 2018
, which consist of principal and interest on our long-term debt as well as operating leases (dollars in thousands):
|
Contractual Obligations
|
2019
|
2020
|
2021
|
2022
|
2023
|
Thereafter
|
Total
|
|||||||||||||||||||||
|
Long-term debt obligations
(1)
|
$
|
340,446
|
|
$
|
848,281
|
|
$
|
342,903
|
|
$
|
668,401
|
|
$
|
363,731
|
|
$
|
1,994,399
|
|
$
|
4,558,161
|
|
|||||||
|
Fixed rate or swapped interest
(2)
|
130,639
|
|
122,459
|
|
113,892
|
|
107,209
|
|
93,756
|
|
394,048
|
|
962,003
|
|
||||||||||||||
|
Variable rate interest
(3)
|
32,992
|
|
20,755
|
|
10,681
|
|
1,650
|
|
—
|
|
—
|
|
66,078
|
|
||||||||||||||
|
Operating lease obligations
(4)
|
2,729
|
|
2,744
|
|
2,771
|
|
2,767
|
|
2,761
|
|
68,516
|
|
82,288
|
|
||||||||||||||
|
Total
|
$
|
506,806
|
|
$
|
994,239
|
|
$
|
470,247
|
|
$
|
780,027
|
|
$
|
460,248
|
|
$
|
2,456,963
|
|
$
|
5,668,530
|
|
|||||||
(1)
Represents principal payments gross of discounts, debt issuance costs and fair market value adjustments of debt assumed.
(2)
Swapped interest is subject to the ineffective portion of cash flow hedges as described in Note 7 to the consolidated financial statements included elsewhere in this Annual Report on Form 10-K.
(3)
Interest payments on variable rate debt instruments not subject to interest rate swaps are based on each debt instrument's respective interest rate as of
December 31, 2018
, which is assumed to be in effect through the maturity date of the respective debt instrument.
(4)
Primarily comprised of a ground lease underlying one apartment community we own and the lease for our corporate headquarters.
We have a commitment, which is not reflected in the table above, to make additional capital contributions to a limited partnership in which we hold an equity interest. The capital contributions may be called by the general partner at any time until September 2022 after giving appropriate notice. As of
December 31, 2018
, we had committed to make additional capital contributions totaling up to $13.6 million if and when called by the general partner of the limited partnership and until September 2022.
Off-Balance Sheet Arrangements
As of
December 31, 2018
and
2017
, we had a 35.0% ownership interest in a limited liability company, which owns one apartment community comprised of
269
units, located in Washington, D.C. We also had a
20.7%
ownership interest in a limited partnership as of
December 31, 2018
. Our interests in these investments are unconsolidated and are recorded using the equity method as we do not have a controlling interest.
As of
December 31, 2018
and
2017
, we did not have any relationships, including those with unconsolidated entities or financial partnerships, for the purpose of facilitating off-balance sheet arrangements or other contractually narrow or limited purposes. In addition, we do not engage in trading activities involving non-exchange traded contracts. As such, we are not
36
materially exposed to any financing, liquidity, market or credit risk that could arise if we had engaged in such relationships. We do not have any relationships or transactions with persons or entities that derive benefits from their non-independent relationships with us or our related parties other than those disclosed in Note 13 to the consolidated financial statements included elsewhere in this Annual Report on Form 10-K.
Insurance
We carry comprehensive general liability coverage on our apartment communities, with limits of liability we believe are customary within the multifamily apartment industry, to insure against liability claims and related defense costs. We also maintain insurance against the risk of direct physical damage to reimburse us on a replacement cost basis for costs incurred to repair or rebuild any property, including loss of rental income during the reconstruction period.
We renegotiated our insurance programs effective July 1,
2018
. We believe that the current property and casualty insurance program in place provides appropriate insurance coverage for financial protection against insurable risks such that any insurable loss experienced that can be reasonably anticipated would not have a significant impact on our liquidity, financial position or results of operations.
Inflation
Our resident leases at our apartment communities allow, at the time of renewal, for adjustments in the rent payable thereunder, and thus may enable us to seek rent increases. The majority of our leases are for approximately one year or less. The short-term nature of these leases generally serves to reduce our risk to adverse effects of inflation.
Critical Accounting Policies and Estimates
A critical accounting policy is one that is both important to our financial condition and results of operations and that involves some degree of uncertainty. The preceding discussion and analysis of our financial condition and results of operations are based upon our consolidated financial statements and the notes thereto, which have been prepared in accordance with GAAP. The preparation of financial statements in conformity with GAAP requires management to make a number of estimates and assumptions that affect the reported amounts and disclosures in the consolidated financial statements. On an ongoing basis, we evaluate our estimates and assumptions based upon historical experience and various other factors and circumstances. We believe that our estimates and assumptions are reasonable under the circumstances; however, actual results may differ from these estimates and assumptions.
We believe that the estimates and assumptions listed below are most important to the portrayal of our financial condition and results of operations because they require the greatest subjective determinations and form the basis of accounting policies deemed to be most critical.
Acquisition of real estate assets
We account for our acquisitions of investments in real estate as asset acquisitions in accordance with ASU 2017-01,
Business Combinations (Topic 805): Clarifying the Definition of a Business,
which requires the cost of the real estate acquired to be allocated to the individual acquired tangible assets, consisting of land, buildings and improvements and other, and identified intangible assets, consisting of the value of in-place leases and other contracts, on a relative fair value basis. In calculating the total asset value of acquired tangible assets, management uses stabilized net operating income, or NOI, and market specific capitalization and discount rates. Management analyzes historical stabilized NOI to determine its estimate for forecasted NOI. Management estimates the market capitalization rate by analyzing the market capitalization rates for properties with comparable ages in similarly sized markets. Management then allocates the purchase price of the asset acquisition based on the relative fair value of the individual components as a proportion of the total assets acquired.
Impairment of long-lived assets
We account for long-lived assets in accordance with the provisions of accounting standards for the impairment or disposal of long-lived assets. Management periodically evaluates long-lived assets, including investments in real estate, for indicators that would suggest that the carrying amount of the assets may not be recoverable. The judgments regarding the existence of such indicators are based on factors such as operating performance, market conditions and legal factors. Long-lived assets, such as real estate assets, equipment and purchased intangibles subject to amortization, are reviewed for impairment whenever events or changes in circumstances indicate that the carrying amount of an asset may not be recoverable. Recoverability of assets to be held and used is measured by a comparison of the carrying amount of an asset to estimated
37
undiscounted future cash flows expected to be generated by the asset, which is estimated by analyzing historical cash flows of the asset. If the carrying amount of an asset exceeds its estimated future cash flows, an impairment charge is recognized for the amount by which the carrying amount of the asset exceeds the fair value of the asset. Management calculates the fair value of an asset by dividing historical operating cash flows by a market capitalization rate. Management estimates the market capitalization rate by analyzing the market capitalization rates for properties with comparable ages in similarly sized markets. No material impairment losses have been recognized during the years ended
December 31, 2018
,
2017
, and
2016
.
Cost capitalization
In conformity with GAAP, we capitalize those expenditures that materially enhance the value of an existing asset or substantially extend the useful life of an existing asset. Expenditures necessary to maintain an existing property in ordinary operating condition are expensed as incurred. Therefore, repairs and maintenance costs are expensed as incurred while significant improvements, renovations and replacements are capitalized. The cost to complete any deferred repairs and maintenance at properties acquired by us in order to elevate the condition of the property to our standards are capitalized as incurred. The carrying costs related to development projects, including interest, property taxes, insurance and allocated direct development salary cost during the construction period, are capitalized. Management uses judgment in determining whether costs should be expensed or capitalized. See Note 1 to the consolidated financial statements included elsewhere in this Annual Report on Form 10-K for additional detail.
Loss contingencies
The outcomes of claims, disputes and legal proceedings are subject to significant uncertainty. Management records an accrual for loss contingencies when a loss is probable and the amount of the loss can be reasonably estimated. We also accrue an estimate of defense costs expected to be incurred in connection with legal matters. Management reviews these accruals quarterly and makes revisions based on changes in facts and circumstances. When a loss contingency is not both probable and reasonably estimable, then we do not accrue the loss. However, for material loss contingencies, if the unrecorded loss (or an additional loss in excess of the accrual) is at least a reasonable possibility and material, then management discloses a reasonable estimate of the possible loss, or range of loss, if such reasonable estimate can be made. If we cannot make a reasonable estimate of the possible loss, or range of loss, then that is disclosed.
The assessment of whether a loss is probable or a reasonable possibility, and whether the loss or range of loss is reasonably estimable, often involves a series of complex judgments about future events. Among the factors that we consider in this assessment, including with respect to the matters disclosed in this Annual Report on Form 10-K, are the nature of existing legal proceedings and claims, the asserted or possible damages or loss contingency (if reasonably estimable), the progress of the matter, existing law and precedent, the opinions or views of legal counsel and other advisers, our experience in similar matters, the facts available to us at the time of assessment, and how we intend to respond, or have responded, to the proceeding or claim. Management's assessment of these factors may change over time as individual proceedings or claims progress. For matters where we are not currently able to reasonably estimate a range of reasonably possible loss, the factors that have contributed to this determination include the following: (i) the damages sought are indeterminate; (ii) the proceedings are in the early stages; (iii) the matters involve novel or unsettled legal theories or a large or uncertain number of actual or potential cases or parties; and/or (iv) discussions with the parties in matters that are expected ultimately to be resolved through negotiation and settlement have not reached the point where we believe a reasonable estimate of loss, or range of loss, can be made. In such instances, management believes that there is considerable uncertainty regarding the timing or ultimate resolution of such matters, including a possible eventual loss or business impact, if any.
For more information regarding our significant accounting policies, including a brief description of recent accounting pronouncements that could have a material impact on our financial statements, see Note 1 to the consolidated financial statements included elsewhere in this Annual Report on Form 10-K.
Item 7A. Quantitative and Qualitative Disclosures About Market Risk.
Market risk includes risks that arise from changes in interest rates, foreign currency exchange rates, commodity prices, equity prices and other market changes that affect market sensitive instruments. Our primary market risk exposure is to changes in interest rates on our borrowings. As of
December 31, 2018
,
28.6%
of our total capitalization consisted of borrowings. Our interest rate risk objective is to limit the impact of interest rate fluctuations on earnings and cash flows and to lower our overall borrowing costs. To achieve this objective, we manage our exposure to fluctuations in market interest rates for borrowings through the use of fixed rate debt instruments and interest rate swaps, which mitigate our interest rate risk on a related financial instrument and effectively fix the interest rate on a portion of our variable debt or on future refinancings. We use our best efforts to have our debt instruments mature across multiple years, which we believe limits our exposure to interest rate changes in any one year. We do not
38
enter into derivative instruments for trading or other speculative purposes. As of
December 31, 2018
,
74.8%
of our outstanding debt was subject to fixed rates after considering related derivative instruments. We regularly review interest rate exposure on outstanding borrowings in an effort to minimize the risk of interest rate fluctuations.
The table below provides information about our financial instruments that are sensitive to changes in interest rates. For debt obligations, the table presents principal cash flows and related weighted average interest rates by expected maturity dates. For our interest rate swaps, the table presents the notional amount of the swaps and the years in which they expire. Weighted average variable rates are based on rates in effect as of
December 31, 2018
(dollars in thousands).
|
2019
|
2020
|
2021
|
2022
|
2023
|
Total Thereafter
|
Total
|
Fair Value Liability
|
||||||||||||||||||||||||
|
Long-term debt
|
|
|
|
|
|
|
|
|
|
|
|
|
|
|
|||||||||||||||||
|
Fixed rate
|
$
|
40,446
|
|
$
|
158,281
|
|
$
|
192,903
|
|
$
|
368,401
|
|
$
|
363,731
|
|
$
|
1,994,399
|
|
$
|
3,118,161
|
|
$
|
3,066,546
|
|
|||||||
|
Average interest rate
|
4.40
|
%
|
4.80
|
%
|
5.20
|
%
|
3.64
|
%
|
4.35
|
%
|
3.91
|
%
|
4.06
|
%
|
|
|
|||||||||||||||
|
Variable rate
(1)
|
$
|
300,000
|
|
$
|
690,000
|
|
$
|
150,000
|
|
$
|
—
|
|
$
|
—
|
|
$
|
—
|
|
$
|
1,140,000
|
|
$
|
1,143,795
|
|
|||||||
|
Average interest rate
|
3.36
|
%
|
3.38
|
%
|
3.30
|
%
|
—
|
%
|
—
|
%
|
—
|
%
|
3.36
|
%
|
|
|
|||||||||||||||
|
Interest rate swaps
|
|
|
|
|
|
|
|
|
|
|
|
|
|
|
|||||||||||||||||
|
Variable to fixed
|
$
|
—
|
|
$
|
300,000
|
|
$
|
—
|
|
$
|
—
|
|
$
|
—
|
|
$
|
300,000
|
|
(2)
|
$
|
600,000
|
|
$
|
1,623
|
|
||||||
|
Average pay rate
|
—
|
%
|
2.32
|
%
|
—
|
%
|
—
|
%
|
—
|
%
|
2.91
|
%
|
2.62
|
%
|
|
|
|||||||||||||||
(1)
Excluding the effect of interest rate swap agreements.
(2)
Includes six forward rate swaps totaling $300.0 million, which hedge the first
10
years of interest payments on debt we anticipate issuing in 2019.
Item 8. Financial Statements and Supplementary Data.
The consolidated financial statements and related financial information required to be filed are set forth on pages F-1 to F-44 of this Annual Report on Form 10-K.
Item 9. Changes in and Disagreements with Accountants on Accounting and Financial Disclosure.
None.
Item 9A. Controls and Procedures.
Mid-America Apartment Communities, Inc.
(a) Evaluation of Disclosure Controls and Procedures
MAA is required to maintain disclosure controls and procedures, within the meaning of Exchange Act Rules 13a-15 and 15d-15. MAA's management, with the participation of MAA’s Chief Executive Officer and Chief Financial Officer, carried out an evaluation of the effectiveness of MAA's disclosure controls and procedures as of
December 31, 2018
. Based on that evaluation, MAA’s Chief Executive Officer and Chief Financial Officer concluded that the disclosure controls and procedures were effective as of
December 31, 2018
to ensure that information required to be disclosed by MAA in its Exchange Act filings is accurately recorded, processed, summarized and reported within the time periods specified in the SEC’s rules and forms and is accumulated and communicated to MAA's management, including the Chief Executive Officer and Chief Financial Officer, as appropriate to allow timely decisions regarding required disclosure.
(b) Management’s Report on Internal Control over Financial Reporting
MAA's management is responsible for establishing and maintaining adequate internal control over financial reporting within the meaning of Exchange Act Rules 13a-15 and 15d-15. MAA's management, with the participation of MAA's Chief Executive Officer and Chief Financial Officer, conducted an evaluation of the effectiveness of MAA's internal control over financial reporting as of
December 31, 2018
based on the framework specified in Internal Control - Integrated Framework (2013) published by the Committee of Sponsoring Organizations of the Treadway Commission. Based on such evaluation, MAA's management concluded that MAA's internal control over financial reporting was effective as of
December 31, 2018
.
Ernst & Young LLP, the independent registered public accounting firm that has audited the consolidated financial statements included elsewhere in this Annual Report on Form 10-K, has issued an attestation report on MAA’s internal control
39
over financial reporting, which is included herein.
Because of its inherent limitations, internal control over financial reporting may not prevent or detect misstatements. Therefore, even those systems determined to be effective can only provide reasonable assurance with respect to financial statement preparation and presentation.
(c) Changes in Internal Control over Financial Reporting
There was no change to MAA’s internal control over financial reporting, within the meaning of Exchange Act Rules 13a-15 and 15d-15, that occurred during the quarter ended
December 31, 2018
that has materially affected, or is reasonably likely to materially affect, MAA’s internal control over financial reporting.
Mid-America Apartments, L.P.
(a) Evaluation of Disclosure Controls and Procedures
The Operating Partnership is required to maintain disclosure controls and procedures, within the meaning of Exchange Act Rules 13a-15 and 15d-15. Management of the Operating Partnership, with the participation of the Chief Executive Officer and Chief Financial Officer of MAA, as the general partner of the Operating Partnership, carried out an evaluation of the effectiveness of the Operating Partnership's disclosure controls and procedures as of
December 31, 2018
. Based on that evaluation, the Chief Executive Officer and Chief Financial Officer of MAA, as the general partner of the Operating Partnership, concluded that the disclosure controls and procedures were effective as of
December 31, 2018
to ensure that information required to be disclosed by the Operating Partnership in its in Exchange Act filings is accurately recorded, processed, summarized and reported within the time periods specified in the SEC’s rules and forms and is accumulated and communicated to the Operating Partnership's management, including the Chief Executive Officer and Chief Financial Officer of MAA, as the general partner of the Operating Partnership, as appropriate to allow timely decisions regarding required disclosure.
(b) Management’s Report on Internal Control over Financial Reporting
Management of the Operating Partnership is responsible for establishing and maintaining adequate internal control over financial reporting within the meaning of Exchange Act Rule 13a-15 and 15d-15. Management of the Operating Partnership, with the participation of the Chief Executive Officer and Chief Financial Officer of MAA, as the general partner of the Operating Partnership, conducted an evaluation of the effectiveness of the Operating Partnership’s internal control over financial reporting as of
December 31, 2018
based on the framework specified in Internal Control - Integrated Framework (2013) published by the Committee of Sponsoring Organizations of the Treadway Commission. Based on such evaluation, management of the Operating Partnership has concluded that the Operating Partnership's internal control over financial reporting was effective as of
December 31, 2018
. An attestation report of the independent registered public accounting firm of the Operating Partnership will not be required as long as the Operating Partnership is a non-accelerated filer.
Because of its inherent limitations, internal control over financial reporting may not prevent or detect misstatements. Therefore, even those systems determined to be effective can only provide reasonable assurance with respect to financial statement preparation and presentation.
(c) Changes in Internal Control over Financial Reporting
There was no change to the Operating Partnership’s internal control over financial reporting, within the meaning of Exchange Act Rules 13a-15 and 15d-15, that occurred during the quarter ended
December 31, 2018
that has materially affected, or is reasonably likely to materially affect, the Operating Partnership’s internal control over financial reporting.
Item 9B. Other Information.
None.
40
PART III
Item 10. Directors, Executive Officers and Corporate Governance.
The information contained in MAA's
2019
Proxy Statement in the sections entitled "Board Structure", "Nominees for Election", "Executive Officers of the Registrant" and "Section 16(a) Beneficial Ownership Reporting Compliance," is incorporated herein by reference in response to this Item 10.
Our Board of Directors has adopted a Code of Conduct applicable to all officers, directors and employees, which can be found on our website at https://www.maac.com, on the For Investors page in the "Governance Documents" section under "Corporate Overview". We will provide a copy of this document to any person, without charge, upon request, by writing to the Legal Department at MAA, 6815 Poplar Avenue, Suite 500, Germantown, TN 38138. We intend to satisfy the disclosure requirement under Item 5.05 of Form 8-K regarding an amendment to, or waiver from, a provision of the Code of Conduct by posting such information on our website at the address and the locations specified above. Reference to our website does not constitute incorporation by reference of the information contained on the site and should not be considered part of this Annual Report on Form 10-K.
Item 11. Executive Compensation.
The information contained in MAA's
2019
Proxy Statement in the sections entitled "Executive Compensation Tables", "Director Compensation", "Compensation Committee Interlocks and Insider Participation", "Compensation Committee Report" and "Compensation Discussion and Analysis" is incorporated herein by reference in response to this Item 11.
Item 12. Security Ownership of Certain Beneficial Owners and Management and Related Stockholder Matters.
The information contained in MAA's
2019
Proxy Statement in the sections entitled "Security Ownership of Management", "Security Ownership of Certain Beneficial Owners" and "Securities Authorized for Issuance Under Equity Compensation Plans" is incorporated herein by reference in response to this Item 12.
Item 13. Certain Relationships and Related Transactions, and Director Independence.
The information contained in MAA's
2019
Proxy Statement in the sections entitled "Certain Relationships and Related Transactions" and "Indebtedness of Management" is incorporated herein by reference in response to this Item 13.
Item 14. Principal Accounting Fees and Services.
The information contained in MAA's
2019
Proxy Statement in the section entitled "Audit and Non-Audit Fees," is incorporated herein by reference in response to this Item 14.
41
PART IV
Item 15. Exhibits, Financial Statement Schedules.
|
(a)
|
The following documents are filed as part of this Annual Report on Form 10-K:
|
|
1.
|
||
|
Financial Statements of Mid-America Apartment Communities, Inc.:
|
||
|
|
||
|
|
||
|
|
||
|
|
||
|
|
||
|
Financial Statements of Mid-America Apartments, L.P.:
|
||
|
|
||
|
|
|
|
|
2.
|
Financial Statement Schedule required to be filed by Item 8 and Paragraph (b) of this Item 15:
|
|
|
|
||
|
|
|
|
|
3.
|
The exhibits required by Item 601 of Regulation S-K, except as otherwise noted, have been filed with previous reports by the registrant and are herein incorporated by reference.
|
|
|
|
|
|
|
Exhibit Number
|
Exhibit Description
|
|
2.1
|
|
|
3.1
|
|
|
3.2
|
|
|
3.3
|
|
|
3.4
|
|
|
3.5
|
|
|
4.1
|
|
|
4.2
|
|
42
|
4.3
|
|
|
4.4
|
|
|
4.5
|
|
|
4.6
|
|
|
4.7
|
|
|
4.8
|
|
|
4.9
|
|
|
4.10
|
|
|
4.11
|
|
|
4.12
|
|
|
10.1
|
|
|
10.2
|
|
|
10.3
|
|
|
10.4
|
|
|
10.5
|
|
|
10.6
|
|
|
10.7
|
|
|
10.8
|
|
|
10.9†
|
|
43
|
10.10†
|
|
|
10.11†
|
|
|
10.12†
|
|
|
10.13†
|
|
|
10.14†
|
|
|
10.15†
|
|
|
10.16†
|
|
|
10.17
|
|
|
10.18
|
|
|
10.19†
|
|
|
10.20†
|
|
|
10.21†
|
|
|
10.22†
|
|
|
10.23†
|
|
|
10.24†
|
|
|
10.25†
|
|
|
21.1
|
|
|
23.1
|
|
|
23.2
|
|
|
31.1
|
|
|
31.2
|
|
|
31.3
|
|
|
31.4
|
|
|
32.1*
|
|
|
32.2*
|
|
44
|
32.3*
|
|
|
32.4*
|
|
|
101
|
The following financial information from Mid-America Apartment Communities, Inc.’s and Mid-America Apartments, L.P.'s Annual Report on Form 10-K for the period ended December 31, 2018, filed with the SEC on February 21, 2019, formatted in XBRL (eXtensible Business Reporting Language): (i) the Consolidated Balance Sheets as of December 31, 2018 and December 31, 2017; (ii) the Consolidated Statements of Operations for the years ended December 31, 2018, 2017 and 2016; (iii) the Consolidated Statements of Comprehensive Income for the years ended December 31, 2018, 2017 and 2016; (iv) the Consolidated Statements of Equity/Changes in Capital for the years ended December 31, 2018, 2017 and 2016; (v) the Consolidated Statements of Cash Flows for the years ended December 31, 2018, 2017 and 2016; (vi) Notes to Consolidated Financial Statements; and (vii) Schedule III - Real Estate and Accumulated Depreciation as of December 31, 2018.
|
† Management contract or compensatory plan or arrangement.
* This certification is being furnished solely to accompany this Annual Report on Form 10-K pursuant to 18 U.S.C. Section 1350, and is not being filed for purposes of Section 18 of the Securities Exchange Act of 1934 and is not to be incorporated by reference into any filing of MAA or MAALP, whether made before or after the date hereof, regardless of any general incorporation language in such filings.
|
(b)
|
Exhibits: See Item 15(a)(3) above.
|
|
(c)
|
Financial Statement Schedule: See Item 15(a)(2) above.
|
Item 16. Form 10-K Summary.
None.
45
SIGNATURES
Pursuant to the requirements of Section 13 or 15(d) of the Securities Exchange Act of 1934, the registrant has duly caused this report to be signed on its behalf by the undersigned, thereunto duly authorized.
|
|
MID-AMERICA APARTMENT COMMUNITIES, INC.
|
|
|
|
|
|
|
Date:
|
February 21, 2019
|
/s/ H. Eric Bolton, Jr.
|
|
|
H. Eric Bolton, Jr.
Chairman of the Board of Directors
Chief Executive Officer
(Principal Executive Officer)
|
|
46
Pursuant to the requirements of the Securities Exchange Act of 1934, this report has been signed below by the following persons on behalf of the registrant and in the capacities and on the dates indicated.
|
Date:
|
February 21, 2019
|
/s/ H. Eric Bolton, Jr.
|
|
|
H. Eric Bolton, Jr.
Chairman of the Board of Directors Chief Executive Officer (Principal Executive Officer) |
|
|
|
|
|
|
Date:
|
February 21, 2019
|
/s/ Albert M. Campbell, III
|
|
|
Albert M. Campbell, III
Executive Vice President and Chief Financial Officer (Principal Financial Officer) |
|
|
Date:
|
February 21, 2019
|
/s/ A. Clay Holder
|
|
A. Clay Holder
Senior Vice President and Chief Accounting Officer (Principal Accounting Officer) |
||
|
Date:
|
February 21, 2019
|
/s/ Russell R. French
|
|
|
Russell R. French
Director |
|
|
|
|
|
|
Date:
|
February 21, 2019
|
/s/ Alan B. Graf, Jr.
|
|
|
Alan B. Graf, Jr.
Director |
|
|
Date:
|
February 21, 2019
|
/s/ Toni Jennings
|
|
|
Toni Jennings
Director |
|
|
|
|
|
|
Date:
|
February 21, 2019
|
/s/ James K. Lowder
|
|
James K. Lowder
Director |
||
|
Date:
|
February 21, 2019
|
/s/ Thomas H. Lowder
|
|
Thomas H. Lowder
Director |
||
|
Date:
|
February 21, 2019
|
/s/ Monica McGurk
|
|
Monica McGurk
Director |
||
|
Date:
|
February 21, 2019
|
/s/ Claude B. Nielsen
|
|
Claude B. Nielsen
Director |
||
|
Date:
|
February 21, 2019
|
/s/ Philip W. Norwood
|
|
|
Philip W. Norwood
Director |
|
|
Date:
|
February 21, 2019
|
/s/ W. Reid Sanders
|
|
|
W. Reid Sanders
Director |
|
|
|
|
|
|
Date:
|
February 21, 2019
|
/s/ Gary Shorb
|
|
|
Gary Shorb
Director |
|
|
Date:
|
February 21, 2019
|
/s/ David P. Stockert
|
|
|
David P. Stockert
Director |
|
47
SIGNATURES
Pursuant to the requirements of Section 13 or 15(d) of the Securities Exchange Act of 1934, the registrant has duly caused this report to be signed on its behalf by the undersigned, thereunto duly authorized.
|
|
MID-AMERICA APARTMENTS, L.P.
|
|
|
a Tennessee Limited Partnership
|
||
|
By: Mid-America Apartment Communities, Inc., its general partner
|
||
|
|
|
|
|
Date:
|
February 21, 2019
|
/s/ H. Eric Bolton, Jr.
|
|
|
H. Eric Bolton, Jr.
Chairman of the Board of Directors
Chief Executive Officer
(Principal Executive Officer)
|
|
48
Pursuant to the requirements of the Securities Exchange Act of 1934, this report has been signed below by the following persons on behalf of the registrant as an officer or director of Mid-America Apartment Communities, Inc., in its capacity as the general partner of the registrant and on the dates indicated.
|
Date:
|
February 21, 2019
|
/s/ H. Eric Bolton, Jr.
|
|
|
H. Eric Bolton, Jr.
Chairman of the Board of Directors
Chief Executive Officer
(Principal Executive Officer)
|
|
|
|
|
|
|
Date:
|
February 21, 2019
|
/s/ Albert M. Campbell, III
|
|
|
Albert M. Campbell, III
Executive Vice President and Chief Financial Officer
(Principal Financial Officer)
|
|
|
Date:
|
February 21, 2019
|
/s/ A. Clay Holder
|
|
A. Clay Holder
Senior Vice President and Chief Accounting Officer (Principal Accounting Officer) |
||
|
Date:
|
February 21, 2019
|
/s/ Russell R. French
|
|
|
Russell R. French
Director
|
|
|
|
|
|
|
Date:
|
February 21, 2019
|
/s/ Alan B. Graf, Jr.
|
|
|
Alan B. Graf, Jr.
Director
|
|
|
Date:
|
February 21, 2019
|
/s/ Toni Jennings
|
|
|
Toni Jennings
Director
|
|
|
|
|
|
|
Date:
|
February 21, 2019
|
/s/ James K. Lowder
|
|
James K. Lowder
Director
|
||
|
Date:
|
February 21, 2019
|
/s/ Thomas H. Lowder
|
|
Thomas H. Lowder
Director
|
||
|
Date:
|
February 21, 2019
|
/s/ Monica McGurk
|
|
Monica McGurk
Director
|
||
|
Date:
|
February 21, 2019
|
/s/ Claude B. Nielsen
|
|
Claude B. Nielsen
Director
|
||
|
Date:
|
February 21, 2019
|
/s/ Philip W. Norwood
|
|
|
Philip W. Norwood
Director
|
|
|
Date:
|
February 21, 2019
|
/s/ W. Reid Sanders
|
|
|
W. Reid Sanders
Director
|
|
|
|
|
|
|
Date:
|
February 21, 2019
|
/s/ Gary Shorb
|
|
|
Gary Shorb
Director
|
|
|
Date:
|
February 21, 2019
|
/s/ David P. Stockert
|
|
|
David P. Stockert
Director
|
|
49
Report of Independent Registered Public Accounting Firm
To the Shareholders and the Board of Directors of Mid-America Apartment Communities, Inc.
Opinion on the Financial Statements
We have audited the accompanying consolidated balance sheets of Mid-America Apartment Communities, Inc. (the Company) as of
December 31, 2018
and
2017
, the related consolidated statements of operations, comprehensive income, equity, and cash flows for each of the three years in the period ended
December 31, 2018
, and the related notes and financial statement schedule listed in the Index at Item 15(a)(2) (collectively referred to as the "consolidated financial statements"). In our opinion, the consolidated financial statements present fairly, in all material respects, the financial position of the Company at
December 31, 2018
and
2017
, and the results of its operations and its cash flows for each of the three years in the period ended
December 31, 2018
, in conformity with U.S. generally accepted accounting principles.
We also have audited, in accordance with the standards of the Public Company Accounting Oversight Board (United States) (PCAOB), the Company’s internal control over financial reporting as of
December 31, 2018
, based on criteria established in Internal Control-Integrated Framework issued by the Committee of Sponsoring Organizations of the Treadway Commission (2013 framework) and our report dated
February 21, 2019
expressed an unqualified opinion thereon.
Basis for Opinion
These financial statements are the responsibility of the Company's management. Our responsibility is to express an opinion on the Company's financial statements based on our audits. We are a public accounting firm registered with the PCAOB and are required to be independent with respect to the Company in accordance with the U.S. federal securities laws and the applicable rules and regulations of the Securities and Exchange Commission and the PCAOB.
We conducted our audits in accordance with the standards of the PCAOB. Those standards require that we plan and perform the audit to obtain reasonable assurance about whether the financial statements are free of material misstatement, whether due to error or fraud. Our audits included performing procedures to assess the risks of material misstatement of the financial statements, whether due to error or fraud, and performing procedures that respond to those risks. Such procedures included examining, on a test basis, evidence regarding the amounts and disclosures in the financial statements. Our audits also included evaluating the accounting principles used and significant estimates made by management, as well as evaluating the overall presentation of the financial statements. We believe that our audits provide a reasonable basis for our opinion.
/s/ Ernst & Young LLP
We have served as the Company's auditor since 2005.
Memphis, Tennessee
February 21, 2019
F-1
Report of Independent Registered Public Accounting Firm
To the Partners of Mid-America Apartments, L.P.
Opinion on the Financial Statements
We have audited the accompanying consolidated balance sheets of Mid-America Apartments, L.P. (the Partnership) as of
December 31, 2018
and
2017
, the related consolidated statements of operations, comprehensive income, changes in capital, and cash flows for each of the three years in the period ended
December 31, 2018
, and the related notes and financial statement schedule listed in the Index at Item 15(a)(2) (collectively referred to as the "consolidated financial statements"). In our opinion, the consolidated financial statements present fairly, in all material respects, the financial position of the Partnership at
December 31, 2018
and
2017
, and the results of its operations and its cash flows for each of the three years in the period ended
December 31, 2018
, in conformity with U.S. generally accepted accounting principles.
Basis for Opinion
These financial statements are the responsibility of the Partnership’s management. Our responsibility is to express an opinion on the Partnership's financial statements based on our audits. We are a public accounting firm registered with the Public Company Accounting Oversight Board (United States) (PCAOB) and are required to be independent with respect to the Partnership in accordance with the U.S. federal securities laws and the applicable rules and regulations of the Securities and Exchange Commission and the PCAOB.
We conducted our audits in accordance with the standards of the PCAOB. Those standards require that we plan and perform the audit to obtain reasonable assurance about whether the financial statements are free of material misstatement, whether due to error or fraud. The Partnership is not required to have, nor were we engaged to perform, an audit of its internal control over financial reporting. As part of our audits we are required to obtain an understanding of internal control over financial reporting but not for the purpose of expressing an opinion on the effectiveness of the Partnership’s internal control over financial reporting. Accordingly, we express no such opinion.
Our audits included performing procedures to assess the risks of material misstatement of the financial statements, whether due to error or fraud, and performing procedures that respond to those risks. Such procedures included examining, on a test basis, evidence regarding the amounts and disclosures in the financial statements. Our audits also included evaluating the accounting principles used and significant estimates made by management, as well as evaluating the overall presentation of the financial statements. We believe that our audits provide a reasonable basis for our opinion.
/s/ Ernst & Young LLP
We have served as the Partnership's auditor since 2012.
Memphis, Tennessee
February 21, 2019
F-2
Report of Independent Registered Public Accounting Firm
To the Shareholders and the Board of Directors of Mid-America Apartment Communities, Inc.
Opinion on Internal Control over Financial Reporting
We have audited Mid-America Apartment Communities, Inc.’s internal control over financial reporting as of
December 31, 2018
, based on criteria established in Internal Control-Integrated Framework issued by the Committee of Sponsoring Organizations of the Treadway Commission (2013 framework) (the COSO criteria). In our opinion, Mid-America Apartment Communities, Inc. (the Company) maintained, in all material respects, effective internal control over financial reporting as of
December 31, 2018
, based on the COSO criteria.
We also have audited, in accordance with the standards of the Public Company Accounting Oversight Board (United States) (PCAOB), the consolidated balance sheets of the Company as of
December 31, 2018
and
2017
, the related consolidated statements of operations, comprehensive income, equity, and cash flows for each of the three years in the period ended
December 31, 2018
, and the related notes and financial statement schedule listed in the Index at Item 15(a)(2) and our report dated
February 21, 2019
expressed an unqualified opinion thereon.
Basis for Opinion
The Company’s management is responsible for maintaining effective internal control over financial reporting and for its assessment of the effectiveness of internal control over financial reporting included in the accompanying Management’s Report on Internal Control Over Financial Reporting. Our responsibility is to express an opinion on the Company’s internal control over financial reporting based on our audit. We are a public accounting firm registered with the PCAOB and are required to be independent with respect to the Company in accordance with the U.S. federal securities laws and the applicable rules and regulations of the Securities and Exchange Commission and the PCAOB.
We conducted our audit in accordance with the standards of the PCAOB. Those standards require that we plan and perform the audit to obtain reasonable assurance about whether effective internal control over financial reporting was maintained in all material respects.
Our audit included obtaining an understanding of internal control over financial reporting, assessing the risk that a material weakness exists, testing and evaluating the design and operating effectiveness of internal control based on the assessed risk, and performing such other procedures as we considered necessary in the circumstances. We believe that our audit provides a reasonable basis for our opinion.
Definition and Limitations of Internal Control Over Financial Reporting
A company’s internal control over financial reporting is a process designed to provide reasonable assurance regarding the reliability of financial reporting and the preparation of financial statements for external purposes in accordance with generally accepted accounting principles. A company’s internal control over financial reporting includes those policies and procedures that (1) pertain to the maintenance of records that, in reasonable detail, accurately and fairly reflect the transactions and dispositions of the assets of the company; (2) provide reasonable assurance that transactions are recorded as necessary to permit preparation of financial statements in accordance with generally accepted accounting principles, and that receipts and expenditures of the company are being made only in accordance with authorizations of management and directors of the company; and (3) provide reasonable assurance regarding prevention or timely detection of unauthorized acquisition, use, or disposition of the company’s assets that could have a material effect on the financial statements.
Because of its inherent limitations, internal control over financial reporting may not prevent or detect misstatements. Also, projections of any evaluation of effectiveness to future periods are subject to the risk that controls may become inadequate because of changes in conditions, or that the degree of compliance with the policies or procedures may deteriorate.
/s/ Ernst & Young LLP
Memphis, Tennessee
February 21, 2019
F-3
Mid-America Apartment Communities, Inc.
Consolidated Balance Sheets
December 31, 2018
and
2017
(
Dollars in thousands, except share and per share data)
|
|
December 31, 2018
|
December 31, 2017
|
|||||
|
Assets
|
|
|
|
|
|||
|
Real estate assets:
|
|
|
|
|
|||
|
Land
|
$
|
1,868,828
|
|
$
|
1,836,417
|
|
|
|
Buildings and improvements and other
|
11,670,216
|
|
11,281,504
|
|
|||
|
Development and capital improvements in progress
|
59,506
|
|
116,833
|
|
|||
|
|
13,598,550
|
|
13,234,754
|
|
|||
|
Less: Accumulated depreciation
|
(2,549,287
|
)
|
(2,075,071
|
)
|
|||
|
|
11,049,263
|
|
11,159,683
|
|
|||
|
Undeveloped land
|
58,257
|
|
57,285
|
|
|||
|
Investment in real estate joint venture
|
44,181
|
|
44,956
|
|
|||
|
Real estate assets, net
|
11,151,701
|
|
11,261,924
|
|
|||
|
Cash and cash equivalents
|
34,259
|
|
10,750
|
|
|||
|
Restricted cash
|
17,414
|
|
78,117
|
|
|||
|
Other assets
|
120,407
|
|
135,807
|
|
|||
|
Assets held for sale
|
—
|
|
5,321
|
|
|||
|
Total assets
|
$
|
11,323,781
|
|
$
|
11,491,919
|
|
|
|
Liabilities and equity
|
|
|
|
|
|||
|
Liabilities:
|
|
|
|
|
|||
|
Unsecured notes payable
|
$
|
4,053,302
|
|
$
|
3,525,765
|
|
|
|
Secured notes payable
|
475,026
|
|
976,292
|
|
|||
|
Accrued expenses and other liabilities
|
413,850
|
|
405,560
|
|
|||
|
Total liabilities
|
4,942,178
|
|
4,907,617
|
|
|||
|
Redeemable common stock
|
9,414
|
|
10,408
|
|
|||
|
Shareholders' equity:
|
|
|
|
|
|||
|
Preferred stock,
$0.01 par value per share, 20,000,000 shares authorized; 8.50% Series I Cumulative Redeemable Shares, liquidation preference $50 per share, 867,846 shares issued and outstanding as of December 31, 2018 and December 31, 2017, respectively.
|
9
|
|
9
|
|
|||
|
Common stock
, $0.01 par value per share, 145,000,000 shares authorized; 113,844,267 and 113,643,166 shares issued and outstanding as of December 31, 2018 and December 31, 2017, respectively
(1)
|
1,136
|
|
1,134
|
|
|||
|
Additional paid-in capital
|
7,138,170
|
|
7,121,112
|
|
|||
|
Accumulated distributions in excess of net income
|
(989,263
|
)
|
(784,500
|
)
|
|||
|
Accumulated other comprehensive (loss) income
|
(212
|
)
|
2,157
|
|
|||
|
Total MAA shareholders' equity
|
6,149,840
|
|
6,339,912
|
|
|||
|
Noncontrolling interests - Operating Partnership units
|
220,043
|
|
231,676
|
|
|||
|
Total Company's shareholders' equity
|
6,369,883
|
|
6,571,588
|
|
|||
|
Noncontrolling interest - consolidated real estate entity
|
2,306
|
|
2,306
|
|
|||
|
Total equity
|
6,372,189
|
|
6,573,894
|
|
|||
|
Total liabilities and equity
|
$
|
11,323,781
|
|
$
|
11,491,919
|
|
|
|
(1)
|
Number of shares issued and outstanding represents total shares of common stock regardless of classification on the Consolidated Balance Sheets. The number of shares classified as redeemable common stock on the Consolidated Balance Sheets as of
December 31, 2018
and
December 31, 2017
are
98,371
and
103,504
, respectively.
|
See accompanying notes to consolidated financial statements.
F-4
Mid-America Apartment Communities, Inc.
Consolidated Statements of Operations
Years ended
December 31, 2018
,
2017
and
2016
(
Dollars in thousands, except per share data)
|
|
2018
|
2017
|
2016
|
||||||||
|
Revenues:
|
|
|
|
|
|
|
|||||
|
Rental and other property revenues
|
$
|
1,571,346
|
|
$
|
1,528,987
|
|
$
|
1,125,348
|
|
||
|
Expenses:
|
|
|
|
|
|
|
|||||
|
Operating expense, excluding real estate taxes and insurance
|
371,095
|
|
364,190
|
|
280,572
|
|
|||||
|
Real estate taxes and insurance
|
223,493
|
|
212,541
|
|
142,784
|
|
|||||
|
Depreciation and amortization
|
489,759
|
|
493,708
|
|
322,958
|
|
|||||
|
Total property operating expenses
|
1,084,347
|
|
1,070,439
|
|
746,314
|
|
|||||
|
Property management expenses
|
47,633
|
|
43,588
|
|
34,093
|
|
|||||
|
General and administrative expenses
|
34,786
|
|
40,194
|
|
29,040
|
|
|||||
|
Merger and integration related expenses
|
9,112
|
|
19,990
|
|
40,823
|
|
|||||
|
Interest expense
|
173,594
|
|
154,751
|
|
129,947
|
|
|||||
|
Loss (gain) on sale of depreciable real estate assets
|
39
|
|
(127,386
|
)
|
(80,397
|
)
|
|||||
|
Gain on sale of non-depreciable real estate assets
|
(4,532
|
)
|
(21
|
)
|
(2,171
|
)
|
|||||
|
Other non-operating (income) expense
|
(5,434
|
)
|
(14,353
|
)
|
1,839
|
|
|||||
|
Income before income tax expense
|
231,801
|
|
341,785
|
|
225,860
|
|
|||||
|
Income tax expense
|
(2,611
|
)
|
(2,619
|
)
|
(1,699
|
)
|
|||||
|
Income from continuing operations before real estate joint venture activity
|
229,190
|
|
339,166
|
|
224,161
|
|
|||||
|
Income from real estate joint venture
|
1,832
|
|
1,370
|
|
241
|
|
|||||
|
Net income
|
231,022
|
|
340,536
|
|
224,402
|
|
|||||
|
Net income attributable to noncontrolling interests
|
8,123
|
|
12,157
|
|
12,180
|
|
|||||
|
Net income available for shareholders
|
222,899
|
|
328,379
|
|
212,222
|
|
|||||
|
Dividends to MAA Series I preferred shareholders
|
3,688
|
|
3,688
|
|
307
|
|
|||||
|
Net income available for MAA common shareholders
|
$
|
219,211
|
|
$
|
324,691
|
|
$
|
211,915
|
|
||
|
Earnings per common share - basic:
|
|
|
|
|
|
|
|||||
|
Net income available for MAA common shareholders
|
$
|
1.93
|
|
$
|
2.86
|
|
$
|
2.69
|
|
||
|
Earnings per common share - diluted:
|
|
|
|
|
|
|
|||||
|
Net income available for MAA common shareholders
|
$
|
1.93
|
|
$
|
2.86
|
|
$
|
2.69
|
|
||
See accompanying notes to consolidated financial statements.
F-5
Mid-America Apartment Communities, Inc.
Consolidated Statements of Comprehensive Income
Years ended
December 31, 2018
,
2017
and
2016
(
Dollars in thousands)
|
|
2018
|
2017
|
2016
|
||||||||
|
Net income
|
$
|
231,022
|
|
$
|
340,536
|
|
$
|
224,402
|
|
||
|
Other comprehensive (loss) income:
|
|
|
|
|
|
|
|||||
|
Unrealized (loss) gain from the effective portion of derivative instruments
|
(751
|
)
|
319
|
|
(1,500
|
)
|
|||||
|
Reclassification adjustment for net (gains) losses included in net income for the
effective portion of derivative instruments
|
(1,938
|
)
|
730
|
|
4,364
|
|
|||||
|
Total comprehensive income
|
228,333
|
|
341,585
|
|
227,266
|
|
|||||
|
Less: Comprehensive income attributable to noncontrolling interests
|
(8,036
|
)
|
(12,193
|
)
|
(12,311
|
)
|
|||||
|
Comprehensive income attributable to MAA
|
$
|
220,297
|
|
$
|
329,392
|
|
$
|
214,955
|
|
||
See accompanying notes to consolidated financial statements.
F-6
Mid-America Apartment Communities, Inc.
Consolidated Statements of Equity
Years ended
December 31, 2018
,
2017
and
2016
(
Dollars and shares in thousands)
|
|
Mid-America Apartment Communities, Inc. Shareholders
|
Noncontrolling Interests - Operating Partnership
|
Noncontrolling Interest - Consolidated Real Estate Entity
|
|
|
||||||||||||||||||||||||||||||||||||
|
|
Preferred Stock
|
Common Stock
|
Additional Paid-In Capital
|
Accumulated Distributions in Excess of Net Income
|
Accumulated Other Comprehensive (Loss) Income
|
Total Equity
|
Redeemable Stock
|
||||||||||||||||||||||||||||||||||
|
|
Shares
|
Amount
|
Shares
|
Amount
|
|||||||||||||||||||||||||||||||||||||
|
EQUITY BALANCE DECEMBER 31, 2015
|
—
|
|
$
|
—
|
|
75,318
|
|
$
|
753
|
|
$
|
3,627,074
|
|
$
|
(634,141
|
)
|
$
|
(1,589
|
)
|
$
|
165,726
|
|
$
|
—
|
|
$
|
3,157,823
|
|
$
|
8,250
|
|
||||||||||
|
Net income
|
—
|
|
—
|
|
—
|
|
—
|
|
—
|
|
212,222
|
|
—
|
|
12,180
|
|
—
|
|
224,402
|
|
—
|
|
|||||||||||||||||||
|
Other comprehensive income - derivative instruments
|
—
|
|
—
|
|
—
|
|
—
|
|
—
|
|
—
|
|
2,733
|
|
131
|
|
—
|
|
2,864
|
|
—
|
|
|||||||||||||||||||
|
Issuance and registration of common shares
|
—
|
|
—
|
|
38,097
|
|
380
|
|
3,406,150
|
|
—
|
|
—
|
|
72,759
|
|
—
|
|
3,479,289
|
|
1,240
|
|
|||||||||||||||||||
|
Issuance and registration of preferred shares
|
868
|
|
9
|
|
—
|
|
—
|
|
64,824
|
|
—
|
|
—
|
|
—
|
|
—
|
|
64,833
|
|
—
|
|
|||||||||||||||||||
|
Shares repurchased and retired
|
—
|
|
—
|
|
(23
|
)
|
—
|
|
(2,019
|
)
|
—
|
|
—
|
|
—
|
|
—
|
|
(2,019
|
)
|
—
|
|
|||||||||||||||||||
|
Shares issued in exchange for common units
|
—
|
|
—
|
|
23
|
|
—
|
|
902
|
|
—
|
|
—
|
|
(902
|
)
|
—
|
|
—
|
|
—
|
|
|||||||||||||||||||
|
Shares issued in exchange for redeemable stock
|
—
|
|
—
|
|
—
|
|
—
|
|
122
|
|
—
|
|
—
|
|
—
|
|
—
|
|
122
|
|
(122
|
)
|
|||||||||||||||||||
|
Redeemable stock fair market value adjustment
|
—
|
|
—
|
|
—
|
|
—
|
|
—
|
|
(705
|
)
|
—
|
|
—
|
|
—
|
|
(705
|
)
|
705
|
|
|||||||||||||||||||
|
Adjustment for noncontrolling interests in Operating Partnership
|
—
|
|
—
|
|
—
|
|
—
|
|
(192
|
)
|
—
|
|
—
|
|
192
|
|
—
|
|
—
|
|
—
|
|
|||||||||||||||||||
|
Amortization of unearned compensation
|
—
|
|
—
|
|
—
|
|
—
|
|
12,151
|
|
—
|
|
—
|
|
—
|
|
—
|
|
12,151
|
|
—
|
|
|||||||||||||||||||
|
Noncontrolling interests distribution
|
—
|
|
—
|
|
—
|
|
—
|
|
—
|
|
—
|
|
—
|
|
(226
|
)
|
—
|
|
(226
|
)
|
—
|
|
|||||||||||||||||||
|
Dividends on preferred stock
|
—
|
|
—
|
|
—
|
|
—
|
|
—
|
|
(307
|
)
|
—
|
|
—
|
|
—
|
|
(307
|
)
|
—
|
|
|||||||||||||||||||
|
Dividends on common stock ($3.3300 per share)
|
—
|
|
—
|
|
—
|
|
—
|
|
—
|
|
(284,548
|
)
|
—
|
|
—
|
|
—
|
|
(284,548
|
)
|
—
|
|
|||||||||||||||||||
|
Dividends on noncontrolling interests units ($3.3300 per unit)
|
—
|
|
—
|
|
—
|
|
—
|
|
—
|
|
—
|
|
—
|
|
(13,884
|
)
|
—
|
|
(13,884
|
)
|
—
|
|
|||||||||||||||||||
|
Acquired capital from noncontrolling interest - consolidated real estate entity
|
—
|
|
—
|
|
—
|
|
—
|
|
—
|
|
—
|
|
—
|
|
—
|
|
2,306
|
|
2,306
|
|
—
|
|
|||||||||||||||||||
|
EQUITY BALANCE DECEMBER 31, 2016
|
868
|
|
$
|
9
|
|
113,415
|
|
$
|
1,133
|
|
$
|
7,109,012
|
|
$
|
(707,479
|
)
|
$
|
1,144
|
|
$
|
235,976
|
|
$
|
2,306
|
|
$
|
6,642,101
|
|
$
|
10,073
|
|
||||||||||
|
Net income
|
—
|
|
—
|
|
—
|
|
—
|
|
—
|
|
328,379
|
|
—
|
|
12,157
|
|
—
|
|
340,536
|
|
—
|
|
|||||||||||||||||||
|
Other comprehensive income - derivative instruments
|
—
|
|
—
|
|
—
|
|
—
|
|
—
|
|
—
|
|
1,013
|
|
36
|
|
—
|
|
1,049
|
|
—
|
|
|||||||||||||||||||
|
Issuance and registration of common shares
|
—
|
|
—
|
|
137
|
|
1
|
|
615
|
|
—
|
|
—
|
|
—
|
|
—
|
|
616
|
|
1,588
|
|
|||||||||||||||||||
|
Issuance and registration of preferred shares
|
—
|
|
—
|
|
—
|
|
—
|
|
2,007
|
|
—
|
|
—
|
|
—
|
|
—
|
|
2,007
|
|
—
|
|
|||||||||||||||||||
|
Shares repurchased and retired
|
—
|
|
—
|
|
(51
|
)
|
—
|
|
(4,782
|
)
|
—
|
|
—
|
|
—
|
|
—
|
|
(4,782
|
)
|
—
|
|
|||||||||||||||||||
|
Exercise of stock options
|
—
|
|
—
|
|
10
|
|
—
|
|
218
|
|
—
|
|
—
|
|
—
|
|
—
|
|
218
|
|
—
|
|
|||||||||||||||||||
|
Shares issued in exchange for common units
|
—
|
|
—
|
|
29
|
|
—
|
|
1,602
|
|
—
|
|
—
|
|
(1,602
|
)
|
—
|
|
—
|
|
—
|
|
|||||||||||||||||||
|
Shares issued in exchange for redeemable stock
|
—
|
|
—
|
|
—
|
|
—
|
|
1,482
|
|
—
|
|
—
|
|
—
|
|
—
|
|
1,482
|
|
(1,482
|
)
|
|||||||||||||||||||
|
Redeemable stock fair market value adjustment
|
—
|
|
—
|
|
—
|
|
—
|
|
—
|
|
(229
|
)
|
—
|
|
—
|
|
—
|
|
(229
|
)
|
229
|
|
|||||||||||||||||||
|
Adjustment for noncontrolling interests in Operating Partnership
|
—
|
|
—
|
|
—
|
|
—
|
|
42
|
|
—
|
|
—
|
|
(42
|
)
|
—
|
|
—
|
|
—
|
|
|||||||||||||||||||
|
Amortization of unearned compensation
|
—
|
|
—
|
|
—
|
|
—
|
|
10,916
|
|
(114
|
)
|
—
|
|
—
|
|
—
|
|
10,802
|
|
—
|
|
|||||||||||||||||||
|
Dividends on preferred stock
|
—
|
|
—
|
|
—
|
|
—
|
|
—
|
|
(3,688
|
)
|
—
|
|
—
|
|
—
|
|
(3,688
|
)
|
—
|
|
|||||||||||||||||||
|
Dividends on common stock ($3.5325 per share)
|
—
|
|
—
|
|
—
|
|
—
|
|
—
|
|
(401,369
|
)
|
—
|
|
—
|
|
—
|
|
(401,369
|
)
|
—
|
|
|||||||||||||||||||
|
Dividends on noncontrolling interests units ($3.5325 per unit)
|
—
|
|
—
|
|
—
|
|
—
|
|
—
|
|
—
|
|
—
|
|
(14,849
|
)
|
—
|
|
(14,849
|
)
|
—
|
|
|||||||||||||||||||
|
EQUITY BALANCE DECEMBER 31, 2017
|
868
|
|
$
|
9
|
|
113,540
|
|
$
|
1,134
|
|
$
|
7,121,112
|
|
$
|
(784,500
|
)
|
$
|
2,157
|
|
$
|
231,676
|
|
$
|
2,306
|
|
$
|
6,573,894
|
|
$
|
10,408
|
|
||||||||||
|
Net income
|
—
|
|
—
|
|
—
|
|
—
|
|
—
|
|
222,899
|
|
—
|
|
8,123
|
|
—
|
|
231,022
|
|
—
|
|
|||||||||||||||||||
|
Other comprehensive loss - derivative instruments
|
—
|
|
—
|
|
—
|
|
—
|
|
—
|
|
—
|
|
(2,602
|
)
|
(87
|
)
|
—
|
|
(2,689
|
)
|
—
|
|
|||||||||||||||||||
|
Issuance and registration of common shares
|
—
|
|
—
|
|
142
|
|
1
|
|
(264
|
)
|
—
|
|
—
|
|
—
|
|
—
|
|
(263
|
)
|
1,482
|
|
|||||||||||||||||||
|
Shares repurchased and retired
|
—
|
|
—
|
|
(34
|
)
|
—
|
|
(2,921
|
)
|
—
|
|
—
|
|
—
|
|
—
|
|
(2,921
|
)
|
—
|
|
|||||||||||||||||||
|
Exercise of stock options
|
—
|
|
—
|
|
18
|
|
—
|
|
916
|
|
—
|
|
—
|
|
—
|
|
—
|
|
916
|
|
—
|
|
|||||||||||||||||||
|
Shares issued in exchange for common units
|
—
|
|
—
|
|
80
|
|
1
|
|
4,443
|
|
—
|
|
—
|
|
(4,444
|
)
|
—
|
|
—
|
|
—
|
|
|||||||||||||||||||
|
Shares issued in exchange for redeemable stock
|
—
|
|
—
|
|
—
|
|
—
|
|
1,915
|
|
—
|
|
—
|
|
—
|
|
—
|
|
1,915
|
|
(1,915
|
)
|
|||||||||||||||||||
|
Redeemable stock fair market value adjustment
|
—
|
|
—
|
|
—
|
|
—
|
|
—
|
|
561
|
|
—
|
|
—
|
|
—
|
|
561
|
|
(561
|
)
|
|||||||||||||||||||
|
Adjustment for noncontrolling interests in Operating Partnership
|
—
|
|
—
|
|
—
|
|
—
|
|
66
|
|
—
|
|
—
|
|
(66
|
)
|
—
|
|
—
|
|
—
|
|
|||||||||||||||||||
|
Cumulative adjustment due to adoption of ASU 2017-12
|
—
|
|
—
|
|
—
|
|
(233
|
)
|
233
|
|
—
|
|
—
|
|
—
|
|
|||||||||||||||||||||||||
|
Amortization of unearned compensation
|
—
|
|
—
|
|
—
|
|
—
|
|
12,903
|
|
—
|
|
—
|
|
—
|
|
—
|
|
12,903
|
|
—
|
|
|||||||||||||||||||
|
Dividends on preferred stock
|
—
|
|
—
|
|
—
|
|
—
|
|
—
|
|
(3,688
|
)
|
—
|
|
—
|
|
—
|
|
(3,688
|
)
|
—
|
|
|||||||||||||||||||
|
Dividends on common stock ($3.7275 per share)
|
—
|
|
—
|
|
—
|
|
—
|
|
—
|
|
(424,302
|
)
|
—
|
|
—
|
|
—
|
|
(424,302
|
)
|
—
|
|
|||||||||||||||||||
|
Dividends on noncontrolling interests units ($3.7275 per unit)
|
—
|
|
—
|
|
—
|
|
—
|
|
—
|
|
—
|
|
—
|
|
(15,159
|
)
|
—
|
|
(15,159
|
)
|
—
|
|
|||||||||||||||||||
|
EQUITY BALANCE DECEMBER 31, 2018
|
868
|
|
$
|
9
|
|
113,746
|
|
$
|
1,136
|
|
$
|
7,138,170
|
|
$
|
(989,263
|
)
|
$
|
(212
|
)
|
$
|
220,043
|
|
$
|
2,306
|
|
$
|
6,372,189
|
|
$
|
9,414
|
|
||||||||||
See accompanying notes to consolidated financial statements.
F-7
Mid-America Apartment Communities, Inc.
Consolidated Statements of Cash Flows
Years ended
December 31, 2018
,
2017
and
2016
(
Dollars in thousands)
|
|
2018
|
2017
|
2016
|
||||||||
|
Cash flows from operating activities:
|
|
|
|
|
|
|
|||||
|
Net income
|
$
|
231,022
|
|
$
|
340,536
|
|
$
|
224,402
|
|
||
|
Adjustments to reconcile net income to net cash provided by operating activities:
|
|
|
|
|
|
|
|||||
|
Depreciation and amortization
|
490,995
|
|
494,540
|
|
323,283
|
|
|||||
|
Loss (gain) on sale of depreciable real estate assets
|
39
|
|
(127,386
|
)
|
(80,397
|
)
|
|||||
|
Gain on sale of non-depreciable real estate assets
|
(4,532
|
)
|
(21
|
)
|
(2,171
|
)
|
|||||
|
Stock compensation expense
|
12,444
|
|
10,570
|
|
11,486
|
|
|||||
|
Amortization of debt premium and debt issuance costs
|
(4,990
|
)
|
(9,810
|
)
|
(9,820
|
)
|
|||||
|
Net change in operating accounts and other
|
9,314
|
|
(47,629
|
)
|
18,221
|
|
|||||
|
Net cash provided by operating activities
|
734,292
|
|
660,800
|
|
485,004
|
|
|||||
|
Cash flows from investing activities:
|
|
|
|
|
|
|
|||||
|
Purchases of real estate and other assets
|
(129,487
|
)
|
(136,065
|
)
|
(339,186
|
)
|
|||||
|
Capital improvements, development and other
|
(254,715
|
)
|
(343,890
|
)
|
(183,977
|
)
|
|||||
|
Distributions from real estate joint ventures
|
775
|
|
—
|
|
1,778
|
|
|||||
|
Contributions to affiliates
|
(2,905
|
)
|
(1,500
|
)
|
—
|
|
|||||
|
Proceeds from disposition of real estate assets
|
19,982
|
|
187,245
|
|
296,410
|
|
|||||
|
Acquisition of Post Properties, net of cash acquired
|
—
|
|
—
|
|
(424,156
|
)
|
|||||
|
Net cash used in investing activities
|
(366,350
|
)
|
(294,210
|
)
|
(649,131
|
)
|
|||||
|
Cash flows from financing activities:
|
|
|
|
|
|
|
|||||
|
Proceeds from lines of credit
|
1,540,000
|
|
805,000
|
|
635,000
|
|
|||||
|
Repayments of lines of credit
|
(1,490,000
|
)
|
(965,000
|
)
|
(300,000
|
)
|
|||||
|
Proceeds from notes payable
|
869,630
|
|
597,480
|
|
300,000
|
|
|||||
|
Principal payments on notes payable
|
(878,610
|
)
|
(413,557
|
)
|
(146,026
|
)
|
|||||
|
Payment of deferred financing costs
|
(6,060
|
)
|
(5,358
|
)
|
(2,395
|
)
|
|||||
|
Repurchase of common stock
|
(2,921
|
)
|
(4,782
|
)
|
(2,019
|
)
|
|||||
|
Debt prepayment and extinguishment costs
|
(60
|
)
|
(1,659
|
)
|
(139
|
)
|
|||||
|
Proceeds from issuances of common shares
|
585
|
|
1,557
|
|
291
|
|
|||||
|
Exercise of stock options
|
916
|
|
432
|
|
—
|
|
|||||
|
Distributions to noncontrolling interests
|
(15,079
|
)
|
(14,654
|
)
|
(13,850
|
)
|
|||||
|
Dividends paid on common shares
|
(419,849
|
)
|
(395,294
|
)
|
(247,652
|
)
|
|||||
|
Dividends paid on preferred shares
|
(3,688
|
)
|
(3,688
|
)
|
(924
|
)
|
|||||
|
Net cash (used in) provided by financing activities
|
(405,136
|
)
|
(399,523
|
)
|
222,286
|
|
|||||
|
Net (decrease) increase in cash, cash equivalents and restricted cash
|
(37,194
|
)
|
(32,933
|
)
|
58,159
|
|
|||||
|
Cash, cash equivalents and restricted cash, beginning of period
|
88,867
|
|
121,800
|
|
63,641
|
|
|||||
|
Cash, cash equivalents and restricted cash, end of period
|
$
|
51,673
|
|
$
|
88,867
|
|
$
|
121,800
|
|
||
|
The following table provides a reconciliation of cash, cash equivalents and restricted cash to amounts reported within the Consolidated Balance Sheets:
|
|||||||||||
|
Reconciliation of cash, cash equivalents and restricted cash:
|
|||||||||||
|
Cash and cash equivalents
|
$
|
34,259
|
|
$
|
10,750
|
|
$
|
33,536
|
|
||
|
Restricted cash
|
17,414
|
|
78,117
|
|
88,264
|
|
|||||
|
Total cash, cash equivalents and restricted cash
|
$
|
51,673
|
|
$
|
88,867
|
|
$
|
121,800
|
|
||
|
Supplemental disclosure of cash flow information:
|
|
|
|
|
|
|
|||||
|
Interest paid
|
$
|
184,834
|
|
$
|
166,757
|
|
$
|
144,843
|
|
||
|
Income taxes paid
|
2,550
|
|
2,366
|
|
1,582
|
|
|||||
|
Supplemental disclosure of noncash investing and financing activities:
|
|||||||||||
|
Conversion of OP Units to shares of common stock
|
$
|
4,443
|
|
$
|
1,602
|
|
$
|
902
|
|
||
|
Accrued construction in progress
|
8,581
|
|
7,852
|
|
31,491
|
|
|||||
|
Interest capitalized
|
2,047
|
|
7,238
|
|
2,073
|
|
|||||
|
Mark-to-market adjustment on derivative instruments
|
(6,436
|
)
|
17,806
|
|
5,670
|
|
|||||
|
Fair value adjustment on debt assumed from the Post Properties merger
|
—
|
|
—
|
|
8,864
|
|
|||||
|
Loan assumption from the Post Properties merger
|
—
|
|
—
|
|
586,744
|
|
|||||
|
Purchase price for the Post Properties merger
|
—
|
|
—
|
|
4,006,586
|
|
|||||
See accompanying notes to consolidated financial statements.
F-8
Mid-America Apartments, L.P.
Consolidated Balance Sheets
December 31, 2018
and
2017
(Dollars in thousands, except unit data)
|
|
December 31, 2018
|
December 31, 2017
|
|||||
|
Assets
|
|
|
|||||
|
Real estate assets:
|
|
|
|||||
|
Land
|
$
|
1,868,828
|
|
$
|
1,836,417
|
|
|
|
Buildings and improvements and other
|
11,670,216
|
|
11,281,504
|
|
|||
|
Development and capital improvements in progress
|
59,506
|
|
116,833
|
|
|||
|
|
13,598,550
|
|
13,234,754
|
|
|||
|
Less: Accumulated depreciation
|
(2,549,287
|
)
|
(2,075,071
|
)
|
|||
|
|
11,049,263
|
|
11,159,683
|
|
|||
|
Undeveloped land
|
58,257
|
|
57,285
|
|
|||
|
Investment in real estate joint venture
|
44,181
|
|
44,956
|
|
|||
|
Real estate assets, net
|
11,151,701
|
|
11,261,924
|
|
|||
|
Cash and cash equivalents
|
34,259
|
|
10,750
|
|
|||
|
Restricted cash
|
17,414
|
|
78,117
|
|
|||
|
Other assets
|
120,407
|
|
135,807
|
|
|||
|
Assets held for sale
|
—
|
|
5,321
|
|
|||
|
Total assets
|
$
|
11,323,781
|
|
$
|
11,491,919
|
|
|
|
Liabilities and capital
|
|
|
|
|
|||
|
Liabilities:
|
|
|
|
|
|||
|
Unsecured notes payable
|
$
|
4,053,302
|
|
$
|
3,525,765
|
|
|
|
Secured notes payable
|
475,026
|
|
976,292
|
|
|||
|
Accrued expenses and other liabilities
|
413,850
|
|
405,560
|
|
|||
|
Due to general partner
|
19
|
|
19
|
|
|||
|
Total liabilities
|
4,942,197
|
|
4,907,636
|
|
|||
|
Redeemable common units
|
9,414
|
|
10,408
|
|
|||
|
Operating Partnership capital:
|
|
|
|
|
|||
|
Preferred units, 867,846 preferred units outstanding as of December 31, 2018 and December 31, 2017, respectively
|
66,840
|
|
66,840
|
|
|||
|
Common Units:
|
|||||||
|
General partner,
113,844,267 and 113,643,166 OP Units outstanding as of December 31, 2018 and December 31, 2017, respectively
(1)
|
6,083,142
|
|
6,270,758
|
|
|||
|
Limited partners,
4,111,301 and 4,191,586 OP Units outstanding as of December 31, 2018 and December 31, 2017, respectively
(1)
|
220,043
|
|
231,676
|
|
|||
|
Accumulated other comprehensive (loss) income
|
(161
|
)
|
2,295
|
|
|||
|
Total operating partners' capital
|
6,369,864
|
|
6,571,569
|
|
|||
|
Noncontrolling interest - consolidated real estate entity
|
2,306
|
|
2,306
|
|
|||
|
Total capital
|
6,372,170
|
|
6,573,875
|
|
|||
|
Total liabilities and capital
|
$
|
11,323,781
|
|
$
|
11,491,919
|
|
|
|
(1)
|
Number of units outstanding represents total OP Units regardless of classification on the Consolidated Balance Sheets. The number of units classified as redeemable common units on the Consolidated Balance Sheets as of
December 31, 2018
and
December 31, 2017
are
98,371
and
103,504
, respectively.
|
See accompanying notes to consolidated financial statements.
F-9
Mid-America Apartments, L.P.
Consolidated Statements of Operations
Years ended
December 31, 2018
,
2017
and
2016
(Dollars in thousands, except per unit data)
|
|
2018
|
2017
|
2016
|
||||||||
|
Revenues:
|
|
|
|
||||||||
|
Rental and other property revenues
|
$
|
1,571,346
|
|
$
|
1,528,987
|
|
$
|
1,125,348
|
|
||
|
Expenses:
|
|
|
|
|
|
|
|||||
|
Operating expense, excluding real estate taxes and insurance
|
371,095
|
|
364,190
|
|
280,572
|
|
|||||
|
Real estate taxes and insurance
|
223,493
|
|
212,541
|
|
142,784
|
|
|||||
|
Depreciation and amortization
|
489,759
|
|
493,708
|
|
322,958
|
|
|||||
|
Total property operating expenses
|
1,084,347
|
|
1,070,439
|
|
746,314
|
|
|||||
|
Property management expenses
|
47,633
|
|
43,588
|
|
34,093
|
|
|||||
|
General and administrative expenses
|
34,786
|
|
40,194
|
|
29,040
|
|
|||||
|
Merger and integration related expenses
|
9,112
|
|
19,990
|
|
40,823
|
|
|||||
|
Interest expense
|
173,594
|
|
154,751
|
|
129,947
|
|
|||||
|
Loss (gain) on sale of depreciable real estate assets
|
39
|
|
(127,386
|
)
|
(80,397
|
)
|
|||||
|
Gain on sale of non-depreciable real estate assets
|
(4,532
|
)
|
(21
|
)
|
(2,171
|
)
|
|||||
|
Other non-operating (income) expense
|
(5,434
|
)
|
(14,353
|
)
|
1,839
|
|
|||||
|
Income before income tax expense
|
231,801
|
|
341,785
|
|
225,860
|
|
|||||
|
Income tax expense
|
(2,611
|
)
|
(2,619
|
)
|
(1,699
|
)
|
|||||
|
Income from continuing operations before real estate joint venture activity
|
229,190
|
|
339,166
|
|
224,161
|
|
|||||
|
Income from real estate joint venture
|
1,832
|
|
1,370
|
|
241
|
|
|||||
|
Net income
|
231,022
|
|
340,536
|
|
224,402
|
|
|||||
|
Dividends to preferred unitholders
|
3,688
|
|
3,688
|
|
307
|
|
|||||
|
Net income available for MAALP common unitholders
|
$
|
227,334
|
|
$
|
336,848
|
|
$
|
224,095
|
|
||
|
Earnings per common unit - basic:
|
|
|
|
|
|
|
|||||
|
Net income available for MAALP common unitholders
|
$
|
1.93
|
|
$
|
2.86
|
|
$
|
2.70
|
|
||
|
Earnings per common unit - diluted:
|
|
|
|
|
|
|
|||||
|
Net income available for MAALP common unitholders
|
$
|
1.93
|
|
$
|
2.86
|
|
$
|
2.70
|
|
||
See accompanying notes to consolidated financial statements.
F-10
Mid-America Apartments, L.P.
Consolidated Statements of Comprehensive Income
Years ended
December 31, 2018
,
2017
and
2016
(Dollars in thousands)
|
2018
|
2017
|
2016
|
|||||||||
|
Net income
|
$
|
231,022
|
|
$
|
340,536
|
|
$
|
224,402
|
|
||
|
Other comprehensive (loss) income:
|
|||||||||||
|
Unrealized (loss) gain from the effective portion of derivative instruments
|
(751
|
)
|
319
|
|
(1,500
|
)
|
|||||
|
Reclassification adjustment for net (gains) losses included in net income for the effective portion of derivative instruments
|
(1,938
|
)
|
730
|
|
4,364
|
|
|||||
|
Comprehensive income attributable to MAALP
|
$
|
228,333
|
|
$
|
341,585
|
|
$
|
227,266
|
|
||
|
See accompanying notes to consolidated financial statements.
|
|||||||||||
F-11
Mid-America Apartments, L.P.
Consolidated Statements of Changes in Capital
Years ended
December 31, 2018
,
2017
and
2016
(
Dollars in thousands)
|
|
Mid-America Apartments, L.P. Unitholders
|
Noncontrolling Interest - Consolidated Real Estate Entity
|
Total Partnership Capital
|
Redeemable Units
|
||||||||||||||||||||||||
|
Limited Partner
|
General Partner
|
Preferred Units
|
Accumulated
Other
Comprehensive(Loss) Income
|
|||||||||||||||||||||||||
|
CAPITAL BALANCE DECEMBER 31, 2015
|
$
|
165,726
|
|
$
|
2,993,696
|
|
$
|
—
|
|
$
|
(1,618
|
)
|
$
|
—
|
|
$
|
3,157,804
|
|
$
|
8,250
|
|
|||||||
|
Net income
|
12,180
|
|
211,915
|
|
307
|
|
—
|
|
—
|
|
224,402
|
|
—
|
|
||||||||||||||
|
Other comprehensive income - derivative instruments
|
—
|
|
—
|
|
—
|
|
2,864
|
|
—
|
|
2,864
|
|
—
|
|
||||||||||||||
|
Issuance of units
|
72,759
|
|
3,406,530
|
|
64,833
|
|
—
|
|
—
|
|
3,544,122
|
|
1,240
|
|
||||||||||||||
|
Units repurchased and retired
|
—
|
|
(2,019
|
)
|
—
|
|
—
|
|
—
|
|
(2,019
|
)
|
—
|
|
||||||||||||||
|
General partner units issued in exchange for limited partner units
|
(902
|
)
|
902
|
|
—
|
|
—
|
|
—
|
|
—
|
|
—
|
|
||||||||||||||
|
Units issued in exchange for redeemable units
|
—
|
|
122
|
|
—
|
|
—
|
|
—
|
|
122
|
|
(122
|
)
|
||||||||||||||
|
Redeemable units fair market value adjustment
|
—
|
|
(705
|
)
|
—
|
|
—
|
|
—
|
|
(705
|
)
|
705
|
|
||||||||||||||
|
Adjustment for limited partners' capital at redemption value
|
323
|
|
(323
|
)
|
—
|
|
—
|
|
—
|
|
—
|
|
—
|
|
||||||||||||||
|
Amortization of unearned compensation
|
—
|
|
12,151
|
|
—
|
|
—
|
|
—
|
|
12,151
|
|
—
|
|
||||||||||||||
|
Noncontrolling interest distribution
|
(226
|
)
|
—
|
|
—
|
|
—
|
|
—
|
|
(226
|
)
|
—
|
|
||||||||||||||
|
Distributions to preferred unitholders
|
—
|
|
—
|
|
(307
|
)
|
—
|
|
—
|
|
(307
|
)
|
—
|
|
||||||||||||||
|
Distributions to common unitholders ($3.3300 per unit)
|
(13,884
|
)
|
(284,548
|
)
|
—
|
|
—
|
|
—
|
|
(298,432
|
)
|
—
|
|
||||||||||||||
|
Acquired capital from noncontrolling interest - consolidated real estate entity
|
—
|
|
—
|
|
—
|
|
—
|
|
2,306
|
|
2,306
|
|
—
|
|
||||||||||||||
|
CAPITAL BALANCE DECEMBER 31, 2016
|
$
|
235,976
|
|
$
|
6,337,721
|
|
$
|
64,833
|
|
$
|
1,246
|
|
$
|
2,306
|
|
$
|
6,642,082
|
|
$
|
10,073
|
|
|||||||
|
Net income
|
12,157
|
|
324,691
|
|
3,688
|
|
—
|
|
—
|
|
340,536
|
|
—
|
|
||||||||||||||
|
Other comprehensive income - derivative instruments
|
—
|
|
—
|
|
—
|
|
1,049
|
|
—
|
|
1,049
|
|
—
|
|
||||||||||||||
|
Issuance of units
|
—
|
|
616
|
|
2,007
|
|
—
|
|
—
|
|
2,623
|
|
1,588
|
|
||||||||||||||
|
Units repurchased and retired
|
—
|
|
(4,782
|
)
|
—
|
|
—
|
|
—
|
|
(4,782
|
)
|
—
|
|
||||||||||||||
|
Exercise of unit options
|
—
|
|
218
|
|
—
|
|
—
|
|
—
|
|
218
|
|
—
|
|
||||||||||||||
|
General partner units issued in exchange for limited partner units
|
(1,602
|
)
|
1,602
|
|
—
|
|
—
|
|
—
|
|
—
|
|
—
|
|
||||||||||||||
|
Units issued in exchange for redeemable units
|
—
|
|
1,482
|
|
—
|
|
—
|
|
—
|
|
1,482
|
|
(1,482
|
)
|
||||||||||||||
|
Redeemable units fair market value adjustment
|
—
|
|
(229
|
)
|
—
|
|
—
|
|
—
|
|
(229
|
)
|
229
|
|
||||||||||||||
|
Adjustment for limited partners' capital at redemption value
|
(6
|
)
|
6
|
|
—
|
|
—
|
|
—
|
|
—
|
|
—
|
|
||||||||||||||
|
Amortization of unearned compensation
|
—
|
|
10,802
|
|
—
|
|
—
|
|
—
|
|
10,802
|
|
—
|
|
||||||||||||||
|
Distributions to preferred unitholders
|
—
|
|
—
|
|
(3,688
|
)
|
—
|
|
—
|
|
(3,688
|
)
|
—
|
|
||||||||||||||
|
Distributions to common unitholders ($3.5325 per unit)
|
(14,849
|
)
|
(401,369
|
)
|
—
|
|
—
|
|
—
|
|
(416,218
|
)
|
—
|
|
||||||||||||||
|
CAPITAL BALANCE DECEMBER 31, 2017
|
$
|
231,676
|
|
$
|
6,270,758
|
|
$
|
66,840
|
|
$
|
2,295
|
|
$
|
2,306
|
|
$
|
6,573,875
|
|
$
|
10,408
|
|
|||||||
|
Net income
|
8,123
|
|
219,211
|
|
3,688
|
|
—
|
|
—
|
|
231,022
|
|
—
|
|
||||||||||||||
|
Other comprehensive loss - derivative instruments
|
—
|
|
—
|
|
—
|
|
(2,689
|
)
|
—
|
|
(2,689
|
)
|
—
|
|
||||||||||||||
|
Issuance of units
|
—
|
|
(264
|
)
|
—
|
|
—
|
|
—
|
|
(264
|
)
|
1,482
|
|
||||||||||||||
|
Units repurchased and retired
|
—
|
|
(2,921
|
)
|
—
|
|
—
|
|
—
|
|
(2,921
|
)
|
—
|
|
||||||||||||||
|
Exercise of unit options
|
—
|
|
916
|
|
—
|
|
—
|
|
—
|
|
916
|
|
—
|
|
||||||||||||||
|
General partner units issued in exchange for limited partner units
|
(4,444
|
)
|
4,444
|
|
—
|
|
—
|
|
—
|
|
—
|
|
—
|
|
||||||||||||||
|
Units issued in exchange for redeemable units
|
—
|
|
1,915
|
|
—
|
|
—
|
|
—
|
|
1,915
|
|
(1,915
|
)
|
||||||||||||||
|
Redeemable units fair market value adjustment
|
—
|
|
561
|
|
—
|
|
—
|
|
—
|
|
561
|
|
(561
|
)
|
||||||||||||||
|
Adjustment for limited partners' capital at redemption value
|
(153
|
)
|
153
|
|
—
|
|
—
|
|
—
|
|
—
|
|
—
|
|
||||||||||||||
|
Cumulative adjustment due to adoption of ASU 2017-12
|
—
|
|
(233
|
)
|
—
|
|
233
|
|
—
|
|
—
|
|
—
|
|
||||||||||||||
|
Amortization of unearned compensation
|
—
|
|
12,904
|
|
—
|
|
—
|
|
—
|
|
12,904
|
|
—
|
|
||||||||||||||
|
Distributions to preferred unitholders
|
—
|
|
—
|
|
(3,688
|
)
|
—
|
|
—
|
|
(3,688
|
)
|
—
|
|
||||||||||||||
|
Distributions to common unitholders ($3.7275 per unit)
|
(15,159
|
)
|
(424,302
|
)
|
—
|
|
—
|
|
—
|
|
(439,461
|
)
|
—
|
|
||||||||||||||
|
CAPITAL BALANCE DECEMBER 31, 2018
|
$
|
220,043
|
|
$
|
6,083,142
|
|
$
|
66,840
|
|
$
|
(161
|
)
|
$
|
2,306
|
|
$
|
6,372,170
|
|
$
|
9,414
|
|
|||||||
See accompanying notes to consolidated financial statements.
F-12
Mid-America Apartments, L.P.
Consolidated Statements of Cash Flows
Years ended
December 31, 2018
,
2017
and
2016
(Dollars in thousands)
|
|
2018
|
2017
|
2016
|
||||||||
|
Cash flows from operating activities:
|
|
|
|||||||||
|
Net income
|
$
|
231,022
|
|
$
|
340,536
|
|
$
|
224,402
|
|
||
|
Adjustments to reconcile net income to net cash provided by operating activities:
|
|
|
|
|
|
|
|||||
|
Depreciation and amortization
|
490,995
|
|
494,540
|
|
323,283
|
|
|||||
|
Loss (gain) on sale of depreciable real estate assets
|
39
|
|
(127,386
|
)
|
(80,397
|
)
|
|||||
|
Gain on sale of non-depreciable real estate assets
|
(4,532
|
)
|
(21
|
)
|
(2,171
|
)
|
|||||
|
Stock compensation expense
|
12,444
|
|
10,570
|
|
11,486
|
|
|||||
|
Amortization of debt premium and debt issuance costs
|
(4,990
|
)
|
(9,810
|
)
|
(9,820
|
)
|
|||||
|
Net change in operating accounts and other
|
9,314
|
|
(47,629
|
)
|
18,221
|
|
|||||
|
Net cash provided by operating activities
|
734,292
|
|
660,800
|
|
485,004
|
|
|||||
|
Cash flows from investing activities:
|
|
|
|
|
|
|
|||||
|
Purchases of real estate and other assets
|
(129,487
|
)
|
(136,065
|
)
|
(339,186
|
)
|
|||||
|
Capital improvements, development and other
|
(254,715
|
)
|
(343,890
|
)
|
(183,977
|
)
|
|||||
|
Distributions from real estate joint ventures
|
775
|
|
—
|
|
1,778
|
|
|||||
|
Contributions to affiliates
|
(2,905
|
)
|
(1,500
|
)
|
—
|
|
|||||
|
Proceeds from disposition of real estate assets
|
19,982
|
|
187,245
|
|
296,410
|
|
|||||
|
Acquisition of Post Properties, net of cash acquired
|
—
|
|
—
|
|
(424,156
|
)
|
|||||
|
Net cash used in investing activities
|
(366,350
|
)
|
(294,210
|
)
|
(649,131
|
)
|
|||||
|
Cash flows from financing activities:
|
|
|
|
|
|
|
|||||
|
Proceeds from lines of credit
|
1,540,000
|
|
805,000
|
|
635,000
|
|
|||||
|
Repayments of lines of credit
|
(1,490,000
|
)
|
(965,000
|
)
|
(300,000
|
)
|
|||||
|
Proceeds from notes payable
|
869,630
|
|
597,480
|
|
300,000
|
|
|||||
|
Principal payments on notes payable
|
(878,610
|
)
|
(413,557
|
)
|
(146,026
|
)
|
|||||
|
Payment of deferred financing costs
|
(6,060
|
)
|
(5,358
|
)
|
(2,395
|
)
|
|||||
|
Repurchase of common units
|
(2,921
|
)
|
(4,782
|
)
|
(2,019
|
)
|
|||||
|
Debt prepayment and extinguishment costs
|
(60
|
)
|
(1,659
|
)
|
(139
|
)
|
|||||
|
Proceeds from issuances of common units
|
585
|
|
1,557
|
|
291
|
|
|||||
|
Exercise of unit options
|
916
|
|
432
|
|
—
|
|
|||||
|
Distributions paid on common units
|
(434,928
|
)
|
(409,948
|
)
|
(261,502
|
)
|
|||||
|
Distributions paid on preferred units
|
(3,688
|
)
|
(3,688
|
)
|
(924
|
)
|
|||||
|
Net cash (used in) provided by financing activities
|
(405,136
|
)
|
(399,523
|
)
|
222,286
|
|
|||||
|
Net (decrease) increase in cash, cash equivalents and restricted cash
|
(37,194
|
)
|
(32,933
|
)
|
58,159
|
|
|||||
|
Cash, cash equivalents and restricted cash, beginning of period
|
88,867
|
|
121,800
|
|
63,641
|
|
|||||
|
Cash, cash equivalents and restricted cash, end of period
|
$
|
51,673
|
|
$
|
88,867
|
|
$
|
121,800
|
|
||
|
The following table provides a reconciliation of cash, cash equivalents and restricted cash to amounts reported within the Consolidated Balance Sheets:
|
|||||||||||
|
Reconciliation of cash, cash equivalents and restricted cash:
|
|||||||||||
|
Cash and cash equivalents
|
$
|
34,259
|
|
$
|
10,750
|
|
$
|
33,536
|
|
||
|
Restricted cash
|
17,414
|
|
78,117
|
|
88,264
|
|
|||||
|
Total cash, cash equivalents and restricted cash
|
$
|
51,673
|
|
$
|
88,867
|
|
$
|
121,800
|
|
||
|
Supplemental disclosure of cash flow information:
|
|
|
|
|
|
|
|||||
|
Interest paid
|
$
|
184,834
|
|
$
|
166,757
|
|
$
|
144,843
|
|
||
|
Income taxes paid
|
2,550
|
|
2,366
|
|
1,582
|
|
|||||
|
Supplemental disclosure of noncash investing and financing activities:
|
|||||||||||
|
Accrued construction in progress
|
$
|
8,581
|
|
$
|
7,852
|
|
$
|
31,491
|
|
||
|
Interest capitalized
|
2,047
|
|
7,238
|
|
2,073
|
|
|||||
|
Mark-to-market adjustment on derivative instruments
|
(6,436
|
)
|
17,806
|
|
5,670
|
|
|||||
|
Fair value adjustment on debt assumed from the Post Properties merger
|
—
|
|
—
|
|
8,864
|
|
|||||
|
Loan assumption from the Post Properties merger
|
—
|
|
—
|
|
586,744
|
|
|||||
|
Purchase price for the Post Properties merger
|
—
|
|
—
|
|
4,006,586
|
|
|||||
See accompanying notes to consolidated financial statements.
F-13
Mid-America Apartment Communities, Inc. and Mid-America Apartments, L.P.
Notes to Consolidated Financial Statements
Years ended
December 31, 2018
,
2017
and
2016
|
1.
|
Organization and Summary of Significant Accounting Policies
|
Unless the context otherwise requires, all references to the "Company" refer collectively to Mid-America Apartment Communities, Inc., together with its consolidated subsidiaries, including Mid-America Apartments, L.P. Unless the context otherwise requires, all references to "MAA" refer only to Mid-America Apartment Communities, Inc., and not any of its consolidated subsidiaries. Unless the context otherwise requires, the references to the "Operating Partnership" or "MAALP" refer to Mid-America Apartments, L.P. together with its consolidated subsidiaries. "Common stock" refers to the common stock of MAA and, unless the context otherwise requires, "shareholders" refers to the holders of shares of MAA’s common stock. The common units of limited partnership interests in the Operating Partnership are referred to as "OP Units," and the holders of the OP Units are referred to as "common unitholders".
As of
December 31, 2018
, MAA owned
113,844,267
OP Units (or
96.5%
of the total number of OP Units). MAA conducts substantially all of its business and holds substantially all of its assets, directly or indirectly, through the Operating Partnership, and by virtue of its ownership of the OP Units and being the Operating Partnership's sole general partner, MAA has the ability to control all of the day-to-day operations of the Operating Partnership.
Management believes combining the notes to the consolidated financial statements of MAA and the Operating Partnership results in the following benefits:
|
•
|
enhances a readers' understanding of MAA and the Operating Partnership by enabling the reader to view the business as a whole in the same manner that management views and operates the business;
|
|
•
|
eliminates duplicative disclosure and provides a more streamlined and readable presentation since a substantial portion of the disclosure applies to both MAA and the Operating Partnership; and
|
|
•
|
creates time and cost efficiencies through the preparation of one combined set of notes instead of two separate sets.
|
MAA is a multifamily focused, self-administered and self-managed real estate investment trust, or REIT. Management operates MAA and the Operating Partnership as one business. The management of the Company is comprised of individuals who are officers of MAA and employees of the Operating Partnership. Management believes it is important to understand the few differences between MAA and the Operating Partnership in the context of how MAA and the Operating Partnership operate as a consolidated company. MAA and the Operating Partnership are structured as an "umbrella partnership REIT," or UPREIT. MAA's interest in the Operating Partnership entitles MAA to share in cash distributions from, and in the profits and losses of, the Operating Partnership in proportion to MAA's percentage interest therein and entitles MAA to vote on substantially all matters requiring a vote of the partners. MAA's only material asset is its ownership of limited partnership interests in the Operating Partnership; therefore, MAA does not conduct business itself, other than acting as the sole general partner of the Operating Partnership, issuing public equity from time to time and guaranteeing certain debt of the Operating Partnership. The Operating Partnership holds, directly or indirectly, all of the Company's real estate assets. Except for net proceeds from public equity issuances by MAA, which are contributed to the Operating Partnership in exchange for limited partnership interests, the Operating Partnership generates the capital required by the business through the Operating Partnership's operations, direct or indirect incurrence of indebtedness and issuance of OP Units.
The presentations of MAA's shareholders' equity and the Operating Partnership's capital are the principal areas of difference between the consolidated financial statements of MAA and those of the Operating Partnership. MAA's shareholders' equity may include shares of preferred stock, shares of common stock, additional paid-in capital, cumulative earnings, cumulative distributions, noncontrolling interest, treasury shares, accumulated other comprehensive income and redeemable common stock. The Operating Partnership's capital may include common capital and preferred capital of the general partner (MAA), limited partners' common capital and preferred capital, noncontrolling interest, accumulated other comprehensive income and redeemable common units. Holders of OP Units (other than MAA and its subsidiaries) may require the Operating Partnership to redeem their OP Units from time to time, in which case the Operating Partnership may, at its option, pay the redemption price either in cash (in an amount per OP Unit equal, in general, to the average closing price of MAA's common stock on the New York Stock Exchange, or NYSE, over a specified period prior to the redemption date) or by delivering one share of MAA's common stock (subject to adjustment under specified circumstances) for each OP Unit so redeemed.
Organization of Mid-America Apartment Communities, Inc.
The Company owns, operates, acquires and selectively develops apartment communities located in the Southeast, Southwest
F-14
and Mid-Atlantic regions of the United States. As of
December 31, 2018
, the Company owned and operated
303
apartment communities through the Operating Partnership and its subsidiaries and had an ownership interest in one apartment community through an unconsolidated real estate joint venture. As of
December 31, 2018
, the Company had
three
development communities under construction totaling
577
apartment units. Total expected costs for the
three
development projects are
$118.5 million
, of which
$30.9 million
had been incurred through
December 31, 2018
. The Company expects to complete two of the developments in the second half of 2019 and one development in the second half of 2020.
Thirty
of the Company's apartment communities include retail components with approximately
615,000
square feet of gross leasable space. The Company also has
four
commercial properties with approximately
260,000
square feet of combined gross leasable area. The Company’s multifamily and commercial properties are located across
17
states and the District of Columbia.
Basis of Presentation and Principles of Consolidation
The accompanying consolidated financial statements have been prepared by the Company's management in accordance with United States generally accepted accounting principles, or GAAP, and applicable rules and regulations of the Securities and Exchange Commission, or the SEC. The consolidated financial statements of MAA presented herein include the accounts of MAA, the Operating Partnership and all other subsidiaries in which MAA has a controlling financial interest. MAA owns approximately
92.5%
to
100%
of all consolidated subsidiaries, including the Operating Partnership. The consolidated financial statements of MAALP presented herein include the accounts of MAALP and all other subsidiaries in which MAALP has a controlling financial interest. MAALP owns, directly or indirectly,
92.5%
to
100%
of all consolidated subsidiaries. In management's opinion, all adjustments necessary for a fair presentation of the consolidated financial statements have been included, and all such adjustments were of a normal recurring nature. All significant intercompany accounts and transactions have been eliminated in consolidation.
The Company invests in entities which may qualify as variable interest entities, or VIEs, and MAALP is considered a VIE. A VIE is a legal entity in which the equity investors lack sufficient equity at risk for the entity to finance its activities without additional subordinated financial support or, as a group, the holders of the equity investment at risk lack the power to direct the activities of a legal entity as well as the obligation to absorb its expected losses or the right to receive its expected residual returns. MAALP is classified as a VIE, since the limited partners lack substantive kick-out rights and substantive participating rights. The Company consolidates all VIEs for which it is the primary beneficiary and uses the equity method to account for investments that qualify as VIEs but for which it is not the primary beneficiary. In determining whether the Company is the primary beneficiary of a VIE, management considers both qualitative and quantitative factors, including but not limited to, those activities that most significantly impact the VIE's economic performance and which party controls such activities. The Company uses the equity method of accounting for its investments in entities for which the Company exercises significant influence, but does not have the ability to exercise control. The factors considered in determining whether the Company has the ability to exercise control include ownership of voting interests and participatory rights of investors (see "Investment in Unconsolidated Affiliates" below).
Noncontrolling Interests
As of
December 31, 2018
, the Company had two types of noncontrolling interests with respect to its consolidated subsidiaries, (1) noncontrolling interests related to the common unitholders of its Operating Partnership (see below) and (2) noncontrolling interest related to its consolidated real estate entity (see "Investment in Consolidated Real Estate Entity" below). The noncontrolling interests in the accompanying consolidated financial statements relating to the limited partnership interests in the Operating Partnership are owned by the holders of the Class A OP Units. MAA is the sole general partner of the Operating Partnership and holds all of the outstanding Class B OP Units. Net income (after allocations to preferred ownership interests) is allocated to MAA and the noncontrolling interests based on their respective ownership percentages of the Operating Partnership. Issuance of additional Class A OP Units or Class B OP Units changes the ownership percentage of both the noncontrolling interests and MAA. The issuance of Class B OP Units generally occurs when MAA issues common stock and the issuance proceeds are contributed to the Operating Partnership in exchange for Class B OP Units equal to the number of shares of MAA's common stock issued. At each reporting period, the allocation between total MAA shareholders’ equity and noncontrolling interests is adjusted to account for the change in the respective percentage ownership of the underlying equity of the Operating Partnership. MAA’s Board of Directors established economic rights in respect to each Class A OP Unit that were equivalent to the economic rights in respect to each share of MAA common stock. See Note 10 for additional details.
Use of Estimates
Management has made a number of estimates and assumptions relating to the reporting of assets and liabilities, the disclosure of contingent assets and liabilities, and the reported amounts of revenues and expenses to prepare these financial statements and notes in conformity with GAAP. Actual results could differ from those estimates.
F-15
Revenue Recognition and Real Estate Sales Gain Recognition
The Company primarily leases multifamily residential apartment units under operating leases generally due on a monthly basis with terms of approximately one year or less, which are recorded as operating leases. Rental lease revenues are recognized in accordance with Accounting Standards Codification, or ASC, Topic 840,
Leases
, using a method that represents a straight-line basis over the term of the lease. In addition, in circumstances where a lease incentive is provided to tenants, the incentive is recognized as a reduction of lease revenue on a straight-line basis over the reasonably assured lease term. Rental income represents approximately
93%
of the Company's total revenues and includes gross market rent less adjustments for concessions, vacancy loss and bad debt.
Other non-lease revenues represent the remaining
7%
of the Company's total revenues and are primarily driven by utility reimbursement revenues, which are generally recognized and due on a monthly basis as tenants obtain control of the service. The Company's primary sources of reimbursement revenues are from water and cable utility services, which produced revenues of
$39.1 million
and
$29.8 million
, respectively, for the year ended
December 31, 2018
, revenues of
$38.3 million
and
$30.4 million
, respectively, for the year ended
December 31, 2017
and revenues of
$31.1 million
and
$31.6 million
, respectively, for the year ended December 31, 2016.
Other non-lease revenues are recognized in accordance with ASC Topic 606,
Revenue Recognition
, as a result of the Company's January 1, 2018 adoption of Accounting Standards Update, or ASU, 2014-09,
Revenue from Contracts with Customers
, using the modified retrospective approach. The guidance requires that revenue (outside of the scope of lease revenue accounting rules) is recognized when a customer obtains control of promised goods or services in an amount that reflects the consideration the entity expects to receive in exchange for those goods or services. While ASU 2014-09 requires additional disclosure regarding the nature and timing of the Company's non-lease revenue transactions, which is provided here in Note 1 as well as Note 14, the adoption of the ASU did not have a material impact on the Company's consolidated financial statements or the Company's accounting policies and did not result in an opening adjustment to retained earnings. The Company elected the available practical expedients to the ASU’s requirement for disclosure on remaining performance obligations, which allow an entity to avoid disclosing the amount of the remaining performance obligations for contracts with an original expected duration of less than one year or those that meet the practical expedient in ASC Topic 606 that permits the entity to recognize revenue as invoiced. See Note 14 for the disaggregation of the Company's revenues.
Rental Costs
Costs associated with rental activities are expensed as incurred and include advertising expenses, which were
$20.2 million
,
$18.8 million
, and
$13.0 million
for the years ended
December 31, 2018
,
2017
, and
2016
, respectively.
Real Estate Assets and Depreciation and Amortization
Real estate assets are carried at depreciated cost and consist of land, buildings and improvements and other and development and capital improvements in progress (see "Development Costs" below). Repairs and maintenance costs are expensed as incurred, while significant improvements, renovations, and recurring capital replacements are capitalized and depreciated over their estimated useful lives. Recurring capital replacements typically include scheduled carpet replacement, new roofs, HVAC units, plumbing, concrete, masonry and other paving, pools and various exterior building improvements. In addition to these costs, the Company also capitalizes salary costs directly identifiable with renovation work. These expenditures extend the useful life of the property and increase the property’s fair market value. The cost of interior painting and blinds are typically expensed as incurred.
Depreciation is computed on a straight-line basis over the estimated useful lives of the related assets, which range from
five
to
40
years. The Consolidated Balance Sheets line "Buildings and improvements and other" includes land improvements and buildings, which have a useful life ranging from
eight
to
40
years, as well as furniture, fixtures and equipment, which have a useful life of
five
years.
Development Costs
Development projects and the related carrying costs, including interest, property taxes, insurance and allocated direct development salary cost during the construction period, are capitalized and reported in the accompanying Consolidated Balance Sheets as "Development and capital improvements in progress" during the construction period. Interest is capitalized in accordance with accounting standards governing the capitalization of interest. Upon completion and certification for occupancy of individual buildings or floors within a development, amounts representing the completed portion of total estimated development costs for the project are transferred to "Buildings and improvements and other" as real estate held for investment.
F-16
Capitalization of interest, property taxes, insurance and allocated direct development salary costs cease upon the transfer. The assets are depreciated over their estimated useful lives. Total capitalized costs (including capitalized interest, salaries and real estate taxes) during the years ended
December 31,
2018
,
2017
and
2016
was
$4.2 million
,
$11.0 million
and
$2.7 million
, respectively. Certain costs associated with the lease-up of development projects, including cost of model units, furnishings and signs, are capitalized and amortized over their respective estimated useful lives. All other costs relating to renting development projects are expensed as incurred.
Acquisition of Real Estate Assets
In accordance with ASC Topic 805,
Business Combinations
, most acquisitions of operating properties qualify as an asset acquisition. Accordingly, the cost of the real estate acquired, including acquisition costs, is allocated to the acquired tangible assets, consisting of land, buildings and improvements and other, and identified intangible assets, consisting of the value of in-place leases and other contracts, on a relative fair value basis. Acquisition costs include appraisal fees, title fees, broker fees and other legal costs to acquire the property.
The purchase price of an acquired property is allocated based on the relative fair value of the individual components as a proportion of the total assets acquired. The Company allocates the cost of the tangible assets of an acquired property by valuing the building as if it were vacant, based on management’s determination of the relative fair values of these assets. Management determines the as-if-vacant fair value of a building using methods similar to those used by independent appraisers. These methods include using stabilized net operating income, or NOI, and market specific capitalization and discount rates. In allocating the cost of identified intangible assets of an acquired property, the in-place leases are valued based on current rent rates and time and cost to lease a unit. Management concluded that the residential leases acquired in connection with each of its property acquisitions approximate at-market rates since the residential lease terms generally do not extend beyond one year.
For residential leases, the fair value of the in-place leases and resident relationships is amortized over six months, which represents the estimated remaining term of the tenant leases. For commercial leases, the fair value of in-place leases and resident relationships is amortized over the remaining term of the commercial leases. The net amount of these lease intangibles included in "Other assets" totaled
$3.9 million
and
$7.1 million
as of
December 31, 2018
, and
2017
, respectively. For the accounting policy on larger, portfolio style acquisitions which qualify as business combinations (rather than asset acquisitions), see Note 2.
Impairment of Long-lived Assets
The Company accounts for long-lived assets in accordance with the provisions of accounting standards for the impairment or disposal of long-lived assets. Management periodically evaluates long-lived assets, including investments in real estate, for indicators that would suggest that the carrying amount of the assets may not be recoverable. The judgments regarding the existence of such indicators are based on factors such as operating performance, market conditions and legal factors. Long-lived assets, such as real estate assets, equipment and purchased intangibles subject to amortization, are reviewed for impairment whenever events or changes in circumstances indicate that the carrying amount of an asset may not be recoverable. Recoverability of assets to be held and used is measured by a comparison of the carrying amount of an asset to estimated undiscounted future cash flows expected to be generated by the asset. If the carrying amount of an asset exceeds its estimated future cash flows, an impairment charge is recognized for the amount by which the carrying amount of the asset exceeds the fair value of the asset. Assets to be disposed of are separately presented in the Consolidated Balance Sheets and reported at the lower of the carrying amount or fair value less costs to sell, and are no longer depreciated. The assets and liabilities of a disposed group or a property classified as held for sale are presented separately in the appropriate asset and liability sections of the Consolidated Balance Sheets.
Undeveloped Land
Undeveloped land includes sites intended for future multifamily developments, sites for future commercial development and sites intended for residential use, which are carried at the lower of cost or fair value in accordance with GAAP and any costs incurred prior to commencement of pre-development activities are expensed as incurred.
Investment in Unconsolidated Affiliates
Through its investment in a limited liability company, or the Apartment LLC, the Company together with an institutional investor indirectly owns one apartment community, Post Massachusetts Avenue, located in Washington, D.C. The Company owned a
35.0%
equity interest in the unconsolidated real estate joint venture as of
December 31, 2018
and provides property
F-17
and asset management services to the Apartment LLC for which it earns fees. The joint venture was determined to be a VIE, but the Company is not designated as a primary beneficiary. As a result, the Company accounts for its investment in the Apartment LLC using the equity method of accounting as the Company is able to exert significant influence over the joint venture but does not have a controlling interest. As of
December 31, 2018
, the Company's investment in the Apartment LLC totaled
$44.2 million
.
In September 2017, a subsidiary of the Operating Partnership invested in a limited partnership, Real Estate Technology Ventures, L.P. As of
December 31, 2018
, Operating Partnership indirectly owned
20.7%
of the limited partnership. The limited partnership was determined to be a VIE, but the Company is not designated as a primary beneficiary. As a result, the Company accounts for its investment in the limited partnership using the equity method of accounting as the investment is considered more than minor. As of
December 31, 2018
, the Company's investment in the limited partnership totaled
$3.8 million
and is included in "Other assets" in the accompanying Consolidated Balance Sheet. As of
December 31, 2018
, the Company was committed to make additional capital contributions totaling
$13.6 million
if and when called by the general partner of the limited partnership and until September 2022.
Investment in Consolidated Real Estate Entity
The Company owns a
92.5%
equity interest in a consolidated real estate entity that developed, constructed and operates a
359
-unit apartment community in Denver, Colorado. The owner of the remaining 7.5% equity interest, a private real estate company, was generally responsible for the development and construction of the community, which was completed during the year ended
December 31, 2018
. The Company will continue to operate and manage the community. The entity was determined to be a VIE with the Company designated as the primary beneficiary. As a result, the accounts of the entity are consolidated by the Company. As of
December 31, 2018
, the consolidated assets and liabilities included buildings and improvements and other, net of accumulated depreciation, of
$70.5 million
; land of
$14.9 million
and accrued expenses and other liabilities of
$1.2 million
.
Cash and Cash Equivalents
Investments in money market accounts and certificates of deposit with original maturities of three months or less are considered to be cash equivalents.
Restricted Cash
Restricted cash consists of security deposits required to be held separately, escrow deposits held by lenders for property taxes, insurance, debt service and replacement reserves, and exchanges under Section 1031(b) of the Internal Revenue Code of 1986, as amended, or the Code. Section 1031(b) exchanges are presented within cash, cash equivalents and restricted cash reported in the Consolidated Statements of Cash Flows.
Other Assets
Other assets consist primarily of receivables and deposits from residents, the value of derivative contracts, deferred rental concessions, deferred financing costs relating to lines of credit and other prepaid expenses. Also included in other assets are the fair market value of in-place leases and resident relationships, net of accumulated amortization.
Accrued Expenses and Other Liabilities
Accrued expenses consist of accrued dividends payable, accrued real estate taxes, accrued interest payable, accrued loss contingencies (see Note 12), accounts payable, fair market value of interest rate swaps (see Note 7), security deposits not related to restricted cash, other accrued expenses, and unearned income. Significant accruals include accrued dividends payable of
$113.2 million
and
$108.7 million
as of
December 31, 2018
and
2017
, respectively; accrued real estate taxes of
$123.5 million
and
$99.6 million
as of
December 31, 2018
and
2017
, respectively; unearned income of
$41.1 million
and
$40.8 million
as of
December 31, 2018
and
2017
, respectively; accrued loss contingencies of
$8.7 million
and
$32.1 million
as of
December 31, 2018
and
2017
, respectively; security deposits of
$18.7 million
and
$19.1 million
as of
December 31, 2018
and
2017
, respectively; and accrued interest payable of
$15.1 million
and
$18.1 million
as of
December 31, 2018
and
2017
, respectively.
Income Taxes
MAA has elected to be taxed as a REIT under the Code and intends to continue to operate in such a manner. The current and
F-18
continuing qualification as a REIT depends on MAA's ability to meet the various requirements imposed by the Code, which are related to organizational structure, distribution levels, diversity of stock ownership and certain requirements with respect to the nature and diversity of MAA’s assets and sources of MAA’s gross income. As long as MAA qualifies for taxation as a REIT, it will generally not be subject to United States federal corporate income tax on its taxable income that is currently distributed to shareholders. This treatment substantially eliminates the "double taxation" (i.e., income taxation at both the corporate and shareholder levels) that generally results from an investment in a corporation. Even if MAA qualifies as a REIT, MAA may be subject to United States federal income and excise taxes in certain situations, such as if MAA fails to distribute timely all of its taxable income with respect to a taxable year. MAA also will be required to pay a 100% tax on any net income on non-arm’s length transactions between MAA and one of its taxable REIT subsidiaries, or TRS. Furthermore, MAA and its shareholders may be subject to state or local taxation in various state or local jurisdictions, including those in which MAA transacts business or its shareholders reside, and the applicable state and local tax laws may not conform to the United States federal income tax treatment. Any taxes imposed on MAA would reduce its operating cash flows and net income.
The Company has elected TRS status for certain of its corporate subsidiaries. As a result, the TRS incur both federal and state income taxes on any taxable income after consideration of any net operating losses. The TRS use the liability method of accounting for income taxes. Deferred income tax assets and liabilities are recognized for future tax consequences attributable to differences between the financial statement carrying amounts of existing assets and liabilities and their respective tax bases. Deferred tax assets and liabilities are measured using enacted tax rates expected to apply to taxable income in the years in which those temporary differences are expected to be recovered or settled. The effect on deferred tax assets and liabilities from a change in tax rate is recognized in earnings in the period of the enactment date. A valuation allowance is provided when it is more likely than not that all or some portion of the deferred tax assets will not be realized.
The Company recognizes liabilities for uncertain income tax positions based on a two-step process. The first step is to evaluate the tax position for recognition by determining if the weight of available evidence indicates that it is more likely than not that the position will be sustained on audit, including resolution of related appeals or litigation processes, if any. The second step requires the Company to estimate and measure the tax benefit as the largest amount that is more likely than not to be realized upon ultimate settlement. See Note 8 for additional disclosures regarding income taxes.
Fair Value Measurements
The Company applies the guidance in ASC Topic 820,
Fair Value Measurements and Disclosures
, to the valuation of real estate assets recorded at fair value, if any; to its impairment valuation analysis of real estate assets; to its disclosure of the fair value of financial instruments, principally indebtedness; and to its derivative financial instruments. Fair value disclosures required under ASC Topic 820 as well as the Company's derivative accounting policies are summarized in Note 7 utilizing the following hierarchy:
Level 1 - Quoted prices in active markets for identical assets or liabilities that are accessible at the measurement date.
Level 2 - Inputs other than quoted prices that are observable for the asset or liability, either directly or indirectly.
Level 3 - Unobservable inputs for the assets or liability.
Assets Held for Sale
The Randal Park land parcel that met the criteria for held for sale classification and comprised the asset held for sale balance as of
December 31, 2017
, was sold during the first quarter of 2018 as detailed in Note 15.
Impact of Recently Adopted Accounting Standards on Consolidated Statements of Cash Flows
Effective January 1, 2018, the Company adopted ASU 2016-15, C
lassification of Certain Cash Receipts and Cash Payments
, which clarifies how certain types of cash receipts and cash payments are to be presented and classified in the statement of cash flows. Management determined that three of the eight transactions in the ASU are relevant to the Company and its cash flows and include debt prepayment and extinguishment costs, proceeds from the settlement of insurance claims and distributions received from equity method investees. Upon adoption of ASU 2016-15, net cash provided by operating activities increased by
$1.9 million
and
$0.6 million
, respectively, net cash used in investing activities decreased by
$0.2 million
and
$0.5 million
, respectively, and net cash used in financing activities decreased by
$1.7 million
and
$0.1 million
, respectively, in the Consolidated Statements of Cash Flows for the years ended
December 31, 2017
and
December 31, 2016
.
The Company adopted ASU 2016-18,
Statement of Cash Flows (Topic 230): Restricted Cash
, effective January 1, 2018. The ASU required restricted cash to be presented within cash and cash equivalents when reconciling the beginning and ending amounts in the statement of cash flow with retrospective adjustments to all periods presented. The Company previously
F-19
reported the change in restricted cash within the operating and investing activities in the consolidated statement of cash flows. Upon adoption, cash, cash equivalents and restricted cash reported in the Consolidated Statements of Cash Flows for the years ended
December 31, 2017
and
December 31, 2016
increased by
$78.1 million
and
$88.3 million
, respectively, to reflect the restricted cash balances. Additionally, net cash provided by operating activities increased by
$0.4 million
and
$0.3 million
, respectively, for the years ended
December 31, 2017
and
December 31, 2016
. Net cash used in investing activities decreased by
$10.6 million
for the
year ended December 31, 2017
and increased by
$61.9 million
for the year ended
December 31, 2016
.
Recently Issued Accounting Pronouncements
In 2016, the Financial Accounting Standards Board, or FASB, issued a new lease accounting standard, ASU 2016-02,
Leases (Topic 842)
, which amends existing accounting standards and establishes new principles, presentation and disclosure requirements for lease accounting for both the lessee and lessor. Under the new standard, lessors will use an approach that is substantially equivalent to existing guidance but aligned with the recently adopted revenue recognition standard, while lessees will be required to record most leases on the balance sheet and recognize lease expense in the income statement in a manner similar to current practice. The new standard requires a lessee to recognize a lease liability for the obligation to make lease payments and a right-of-use asset for the right to use the underlying asset for all leases with terms of more than twelve months. Expenses related to leases determined to be operating leases will be recognized on a straight-line basis, while those determined to be financing leases will be recognized following a front-loaded expense profile in which interest and amortization are presented separately in the income statement.
The Company has completed its analysis of lease revenues and the impact this standard will have on the Company. Management elected to apply the modified retrospective transition approach upon adoption of ASU 2016-02 on January 1, 2019. The adoption of the new lease standard has not resulted in significant changes in the accounting for the Company's lease revenues as the Company’s residential and retail/commercial leases, where it is the lessor, will continue to be accounted for as operating leases. Management has elected available practical expedients that provide lessors an option to not separate lease and non-lease components when certain criteria are met, and instead, allows for those components to be accounted for as a single lease component.
The Company is the lessee under certain ground, office, equipment and other operating leases and is required to recognize a right-of-use asset and a corresponding lease obligation on its Consolidated Balance Sheets for those leases effective January 1, 2019. Based on its election of available practical expedients, the Company is not required to reassess the classification of existing leases; therefore, these leases will continue to be accounted for as operating leases. Upon adoption of the standard on January 1, 2019, the Company expects to recognize total right-of-use assets of approximately
$43 million
and related lease obligations of approximately
$33 million
. The guidance does require additional disclosures regarding the nature and timing of the Company's lease transactions upon adoption, which will be included in the Company's first quarter Quarterly Report on Form 10-Q filing in 2019.
2. Business Combinations
The Company completed the merger with Post Properties, Inc., or Post Properties on December 1, 2016, acquiring
61
wholly-owned apartment communities, six apartment communities that were under development at the date of the merger and one apartment community held in an unconsolidated entity. Post Properties had operations in ten markets across the United States. In addition to the apartment communities, the Company also acquired
four
commercial properties. The consolidated net assets and results of operations of Post Properties are included in the Company's consolidated financial statements from the closing date going forward.
The total purchase price of approximately
$4.0 billion
was determined based on the number of shares of Post Properties' common stock, the number of shares of Post Properties’ 8 1/2% Series A Cumulative Redeemable Preferred Stock, and the number of units of Post Apartment Homes, L.P., or Post LP, Class A Units of limited partnership interest outstanding as of December 1, 2016, in addition to cash consideration provided by the Operating Partnership immediately prior to the merger to retire a
$300.0 million
unsecured term loan and a
$162.0 million
line of credit. The total purchase price also included
$2.0 million
of other consideration, a majority of which related to assumed stock compensation plans.
Each share of Post Properties common stock was converted into the right to receive
0.71
of a newly issued share of MAA common stock, including the right, if any, to receive cash in lieu of fractional shares of MAA common stock. In addition, each limited partner interest in Post LP designated as a Class A Unit automatically converted into the right to receive
0.71
of a newly issued limited partnership unit of MAALP. Also, each share of Post Properties' 8 1/2% Series A Cumulative Redeemable Preferred Stock was automatically converted into the right to receive one newly issued share of MAA's 8.50% Series I Cumulative Redeemable Preferred Stock, $0.01 par value per share, which is referred to as MAA Series I preferred stock. In all
F-20
cases in which MAA’s common stock price was a determining factor in arriving at final consideration for the merger, the stock price used to determine the purchase price was the opening price of MAA’s common stock on December 1, 2016 (
$91.41
per share). At the date of acquisition, the MAA Series I preferred stock consideration was valued at
$77.02
per share, which included a
$14.24
per share bifurcated call option (See Notes 7 and 9). As a result of the merger, the Company issued approximately
38.0 million
shares of MAA common stock, approximately
80,000
OP Units, and
867,846
newly issued shares of MAA’s Series I preferred stock.
The merger was accounted for using the acquisition method of accounting in accordance with ASC Topic 805,
Business Combinations
, which requires, among other things, that the assets acquired and liabilities assumed be recognized at their acquisition date fair values. For larger, portfolio style acquisitions, such as the Post Properties merger, management engages a third party valuation specialist to assist with the fair value assessment, which includes an allocation of the purchase price. Similar to management's methods, the third party generally uses cash flow analysis as well as an income approach and a market approach to determine the fair value of assets acquired. The third party specialist uses stabilized NOI and market specific capitalization and discount rates. Management reviews the inputs used by the third party specialist as well as the allocation of the purchase price provided by the third party specialist to ensure reasonableness and the procedures are performed in accordance with management's policies. The allocation of the purchase price valuation described above required a significant amount of judgment and represented management's best estimate of the fair value as of the acquisition date. The following final purchase price allocation for the Post Properties merger was based on the Company's valuation as well as estimates and assumptions of the acquisition date fair value of the tangible and intangible assets acquired and liabilities assumed. The following table summarizes the final purchase price allocation as of the date of the Post Properties merger (in thousands):
|
December 1, 2016
|
|||
|
Land
|
$
|
874,616
|
|
|
Buildings and improvements and other
|
3,479,483
|
|
|
|
Development and capital improvements in progress
|
183,881
|
|
|
|
Undeveloped land
|
24,200
|
|
|
|
Investment in real estate joint venture
|
44,435
|
|
|
|
Cash and cash equivalents
|
34,292
|
|
|
|
Restricted cash
|
3,608
|
|
|
|
Other assets
|
94,899
|
|
|
|
Total assets acquired
|
4,739,414
|
|
|
|
Notes payable
|
(595,609)
|
|
|
|
Accrued expenses and other liabilities
|
(132,906)
|
|
|
|
Total liabilities assumed, including debt
|
(728,515
|
)
|
|
|
Noncontrolling interest - consolidated real estate entity
|
(2,306
|
)
|
|
|
Total purchase price
|
$
|
4,008,593
|
|
The allocation of fair values of the assets acquired and liabilities assumed has not changed from the allocation reported in the Annual Report on Form 10-K for the year ended
December 31, 2017
, filed with the SEC on February 23, 2018. In connection with the Post Properties merger, the Company incurred total merger and integration related expenses of
$9.1 million
,
$20.0 million
, and
$40.8 million
for the years ended
December 31, 2018
,
2017
and
2016
, respectively. The amounts were expensed as incurred and are included in the Consolidated Statements of Operations in "Merger and integration expenses". Merger related expenses primarily consisted of severance and professional costs, and integration related expenses primarily consisted of temporary systems, staffing, and facilities costs.
F-21
3. Earnings per Common Share of MAA
Basic earnings per share is computed by dividing net income available to MAA common shareholders by the weighted average number of common shares outstanding during the period. All outstanding unvested restricted share awards contain rights to non-forfeitable dividends and participate in undistributed earnings with shareholders and, accordingly, are considered participating securities that are included in the two-class method of computing basic earnings per share. Both the unvested restricted shares and other potentially dilutive common shares, and the related impact to earnings, are considered when calculating earnings per share on a diluted basis with diluted earnings per share being the more dilutive of the treasury stock or two-class methods. OP Units are included in dilutive earnings per share calculations when the units are dilutive to earnings per share. For the years ended
December 31, 2018
,
2017
and
2016
, MAA's basic earnings per share was computed using the two-class method and MAA's diluted earnings per share was computed using the more dilutive of the treasury stock method or the two-class method as presented below (dollars and shares in thousands, except per share amounts):
|
|
2018
|
|
2017
|
|
2016
|
|||||||
|
Calculation of Earnings per common share - basic
|
|
|
|
|
|
|
|
|||||
|
Net income
|
$
|
231,022
|
|
$
|
340,536
|
|
$
|
224,402
|
|
|||
|
Net income attributable to noncontrolling interests
|
(8,123
|
)
|
(12,157
|
)
|
(12,180
|
)
|
||||||
|
Unvested restricted stock (allocation of earnings)
|
(291
|
)
|
(535
|
)
|
(572
|
)
|
||||||
|
Preferred dividends
|
(3,688
|
)
|
(3,688
|
)
|
(307
|
)
|
||||||
|
Net income available for common shareholders, adjusted
|
$
|
218,920
|
|
|
$
|
324,156
|
|
$
|
211,343
|
|
||
|
Weighted average common shares - basic
|
113,638
|
|
|
113,407
|
|
78,502
|
|
|||||
|
Earnings per common share - basic
|
$
|
1.93
|
|
|
$
|
2.86
|
|
$
|
2.69
|
|
||
|
Calculation of Earnings per common share - diluted
|
|
|
|
|
|
|
|
|
||||
|
Net income
|
$
|
231,022
|
|
|
$
|
340,536
|
|
$
|
224,402
|
|
||
|
Net income attributable to noncontrolling interests
|
(8,123
|
)
|
(1)
|
(12,157
|
)
|
(1)
|
(12,180
|
)
|
(1)
|
|||
|
Preferred dividends
|
(3,688
|
)
|
(3,688
|
)
|
(307
|
)
|
||||||
|
Net income available for common shareholders, adjusted
|
$
|
219,211
|
|
|
$
|
324,691
|
|
$
|
211,915
|
|
||
|
Weighted average common shares - basic
|
113,638
|
|
|
113,407
|
|
78,502
|
|
|||||
|
Effect of dilutive securities
|
198
|
|
280
|
|
298
|
|
||||||
|
Weighted average common shares - diluted
|
113,836
|
|
|
113,687
|
|
78,800
|
|
|||||
|
Earnings per common share - diluted
|
$
|
1.93
|
|
|
$
|
2.86
|
|
$
|
2.69
|
|
||
(1
)
For the years ended
December 31, 2018
,
2017
and
2016
,
4.1 million
,
4.2 million
and
4.2 million
OP Units and their related income, respectively, are not included in the diluted earnings per share calculations as they are not dilutive.
4. Earnings per OP Unit of MAALP
Basic earnings per common unit is computed by dividing net income available for common unitholders by the weighted average number of OP Units outstanding during the period. All outstanding unvested restricted unit awards contain rights to non-forfeitable distributions and participate in undistributed earnings with common unitholders and, accordingly, are considered participating securities that are included in the two-class method of computing basic earnings per common unit. Diluted earnings per common unit reflects the potential dilution that could occur if securities or other contracts to issue OP Units were exercised or converted into OP Units. A reconciliation of the numerators and denominators of the basic and diluted earnings per common unit computations for the years ended
December 31, 2018
,
2017
and
2016
is presented below (dollars and units in thousands, except per unit amounts):
|
|
2018
|
|
2017
|
|
2016
|
|||||||
|
Calculation of Earnings per common unit - basic
|
|
|
|
|
|
|
|
|
||||
|
Net income
|
$
|
231,022
|
|
$
|
340,536
|
|
$
|
224,402
|
|
|||
|
Unvested restricted stock (allocation of earnings)
|
(291
|
)
|
(535
|
)
|
(574
|
)
|
||||||
|
Preferred unit distributions
|
(3,688
|
)
|
(3,688
|
)
|
(307
|
)
|
||||||
|
Net income available for common unitholders, adjusted
|
$
|
227,043
|
|
$
|
336,313
|
|
$
|
223,521
|
|
|||
|
Weighted average common units - basic
|
117,777
|
|
|
117,617
|
|
|
82,661
|
|
||||
|
Earnings per common unit - basic
|
$
|
1.93
|
|
$
|
2.86
|
|
$
|
2.70
|
|
|||
|
Calculation of Earnings per common unit - diluted
|
|
|
|
|
|
|
|
|
||||
|
Net income
|
$
|
231,022
|
|
$
|
340,536
|
|
$
|
224,402
|
|
|||
|
Preferred unit distributions
|
(3,688
|
)
|
(3,688
|
)
|
(307
|
)
|
||||||
|
Net income available for common unitholders, adjusted
|
$
|
227,334
|
|
$
|
336,848
|
|
$
|
224,095
|
|
|||
|
|
|
|||||||||||
|
Weighted average common units - basic
|
117,777
|
|
117,617
|
|
82,661
|
|
||||||
|
Effect of dilutive securities
|
198
|
|
280
|
|
298
|
|
||||||
|
Weighted average common units - diluted
|
117,975
|
|
117,897
|
|
82,959
|
|
||||||
|
Earnings per common unit - diluted
|
$
|
1.93
|
|
$
|
2.86
|
|
$
|
2.70
|
|
|||
F-22
5.
Stock Based Compensation
Overview
MAA accounts for its stock based employee compensation plans in accordance with accounting standards governing stock based compensation. These standards require an entity to measure the cost of employee services received in exchange for an award of an equity instrument based on the award's fair value on the grant date and recognize the cost over the period during which the employee is required to provide service in exchange for the award, which is generally the vesting period. Any liability awards issued are remeasured at each reporting period.
MAA’s stock compensation plans consist of a number of incentives provided to attract and retain independent directors, executive officers and key employees. Incentives are currently granted under the Second Amended and Restated 2013 Stock Incentive Plan, or the Stock Plan, which was approved at the 2018 annual meeting of MAA shareholders. The Stock Plan allows for the grant of restricted stock and stock options up to
2,000,000
shares. MAA believes that such awards better align the interests of its employees with those of its shareholders.
Compensation expense is generally recognized for service based restricted stock awards using the straight-line method over the vesting period of the shares regardless of cliff or ratable vesting distinctions. Compensation expense for market and performance based restricted stock awards is generally recognized using the accelerated amortization method with each vesting tranche valued as a separate award, with a separate vesting date, consistent with the estimated value of the award at each period end. Additionally, compensation expense is adjusted for actual forfeitures for all awards in the period that the award was forfeited. Compensation expense for stock options is generally recognized on a straight-line basis over the requisite service period. MAA presents stock compensation expense in the Consolidated Statements of Operations in "General and administrative expenses".
Total compensation expense under the Stock Plan was
$12.9 million
,
$10.8 million
and
$12.2 million
for the years ended
December 31, 2018
,
2017
and
2016
, respectively. Of these amounts, total compensation expense capitalized was
$0.5 million
,
$0.2 million
and
$0.7 million
for the years ended
December 31, 2018
,
2017
and
2016
, respectively. As of
December 31, 2018
, the total unrecognized compensation expense was
$13.5 million
. This cost is expected to be recognized over the remaining weighted average period of
1.1 years
. Total cash paid for the settlement of plan shares totaled
$2.9 million
,
$4.8 million
and
$2.0 million
for the years ended
December 31, 2018
,
2017
and
2016
, respectively. Information concerning grants under the Stock Plan is provided below.
Restricted Stock
In general, restricted stock is earned based on either a service condition, performance condition, or market condition, or a combination thereof, and generally vests ratably over a period from
1 year
to
5 years
. Service based awards are earned when the employee remains employed over the requisite service period and are valued on the grant date based upon the market price of MAA common stock on the date of grant. Market based awards are earned when MAA reaches a specified stock price or specified return on the stock price (price appreciation plus dividends) and are valued on the grant date using a Monte Carlo simulation. Performance based awards are earned when MAA reaches certain operational goals such as funds from operations, or FFO, targets and are valued based upon the market price of MAA common stock on the date of grant as well as the probability of reaching the stated targets. MAA remeasures the fair value of the performance based awards each balance sheet date with adjustments made on a cumulative basis until the award is settled and the final compensation is known. The weighted average grant date fair value per share of restricted stock awards granted during the years ended
December 31, 2018
,
2017
and
2016
, was
$71.85
,
$84.53
and
$73.20
, respectively.
The following is a summary of the key assumptions used in the valuation calculations for market based awards granted during the years ended
December 31, 2018
,
2017
and
2016
:
|
2018
|
2017
|
2016
|
||||
|
Risk free rate
|
1.61% - 2.14%
|
0.65% - 1.57%
|
0.49% - 1.27%
|
|||
|
Dividend yield
|
3.884%
|
3.573%
|
3.634%
|
|||
|
Volatility
|
15.05% - 17.18%
|
20.43% - 21.85%
|
18.41% - 19.45%
|
|||
|
Requisite service period
|
3 years
|
3 years
|
3 years
|
|||
The risk free rate was based on a zero coupon risk-free rate. The minimum risk free rate was based on a period of
0.25 years
for the years ended
December 31, 2018
,
2017
and
2016
. The maximum risk free rate was based on a period of
3 years
for the years ended
December 31, 2018
,
2017
and
2016
. The dividend yield was based on the closing stock price of MAA stock on the
F-23
date of grant. Volatility for MAA was obtained by using a blend of both historical and implied volatility calculations. Historical volatility was based on the standard deviation of daily total continuous returns, and implied volatility was based on the trailing month average of daily implied volatilities interpolating between the volatilities implied by stock call option contracts that were closest to the terms shown and closest to the money. The minimum volatility was based on a period of
1 year
,
3 years
and
2 years
for the years ended
December 31, 2018
,
2017
and
2016
, respectively. The maximum volatility was based on a period of
3 years
,
1 year
and
1 year
for the years ended
December 31, 2018
,
2017
and
2016
, respectively. The requisite service period is based on the criteria for the separate programs according to the vesting schedule.
A summary of the status of the nonvested restricted shares as of
December 31, 2018
, and the changes for the year ended
December 31, 2018
, is presented below:
|
Nonvested Shares
|
Shares
|
Weighted Average Grant-Date Fair Value
|
|||||
|
Nonvested as of January 1, 2018
|
180,692
|
|
$
|
81.13
|
|
||
|
Issued
|
115,177
|
|
89.67
|
|
|||
|
Vested
|
(106,434
|
)
|
71.80
|
|
|||
|
Forfeited
|
(1,658
|
)
|
90.30
|
|
|||
|
Nonvested as of December 31, 2018
|
187,777
|
|
$
|
88.79
|
|
||
The total fair value of shares vested during the years ended
December 31, 2018
,
2017
and
2016
was
$7.6 million
,
$10.5 million
and
$5.1 million
, respectively.
Stock Options
Stock options are earned when the employee remains employed over the requisite service period and vest ratably over a period from
0.3 years
to
2.3 years
. Stock options exercised result in new common shares being issued on the open market by the Company. The fair value of stock option awards is determined using the Black-Scholes or Monte Carlo valuation models.
No
stock options were granted during the years ended
December 31, 2018
or
2017
. During the year ended
December 31, 2016
,
108,198
fully vested stock options were granted with a weighted average grant date fair value of
$18.08
per option as a result of options exchanged in the merger with Post Properties.
The following is a summary of the key assumptions used in the Monte Carlo valuation calculations for stock options granted during the year ended
December 31, 2016
:
|
2016
|
||
|
Risk free rate
|
0.64% - 2.63%
|
|
|
Dividend yield
|
3.81%
|
|
|
Volatility
|
21.02% - 21.57%
|
|
|
Expected term
|
1.11 - 2.11 years
|
|
The U.S. Treasury bill rate was used to represent the risk-free rate based on the expected life of the option. The current dividend yield at the time of grant was used to estimate the dividend yield over the life of the option. Volatility is based on the actual changes in the market value of MAA’s stock and is calculated using daily market value changes from the date of grant over a past period equal to the expected term of the stock options. The expected term represents an estimate of the period of time the stock options are expected to remain outstanding.
A summary of the status of the stock options as of
December 31, 2018
and the changes for the year ended
December 31, 2018
is presented below:
|
Stock Options
|
Options
|
Weighted Average Exercise Price
|
|||||
|
Outstanding as of January 1, 2018
|
108,438
|
|
$
|
72.93
|
|
||
|
Granted
|
—
|
|
—
|
|
|||
|
Exercised
|
(17,823
|
)
|
51.42
|
|
|||
|
Expired
|
—
|
|
—
|
|
|||
|
Outstanding as of December 31, 2018
|
90,615
|
|
$
|
77.16
|
|
||
All options outstanding as of
December 31, 2018
were exercisable and had an intrinsic value of
$1.7 million
with a weighted average remaining term of
5.9 years
. There were
17,823
options and
21,006
options exercised during the years ended
December 31, 2018
and
2017
respectively. Cash received from the exercise of stock options totaled
$0.9 million
and
$0.4 million
for the years ended
December 31, 2018
and
2017
, respectively. During the year ended
December 31, 2016
,
no
cash was
F-24
received from the exercise of stock options as
no
options were exercised.
6. Borrowings
The following table summarizes the Company's outstanding debt as of
December 31, 2018
and
2017
(dollars in thousands):
|
Borrowed Balance
|
As of December 31, 2018
|
|||||||||||
|
December 31, 2018
|
December 31, 2017
|
Weighted Average Effective Rate
|
Weighted Average Contract Maturity
|
|||||||||
|
Unsecured debt
|
|
|
|
|
|
|||||||
|
Variable rate revolving credit facility
|
$
|
540,000
|
|
$
|
410,000
|
|
3.4
|
%
|
4/15/2020
|
|||
|
Fixed rate senior notes
|
2,642,000
|
|
2,292,000
|
|
4.0
|
%
|
7/12/2025
|
|||||
|
Term loans fixed with swaps
|
300,000
|
|
550,000
|
|
2.3
|
%
|
3/1/2022
|
|||||
|
Variable rate term loans
|
600,000
|
|
300,000
|
|
3.3
|
%
|
1/22/2020
|
|||||
|
Fair market value adjustments, debt issuance costs and discounts
|
(28,698
|
)
|
(26,235
|
)
|
||||||||
|
Total unsecured debt
|
$
|
4,053,302
|
|
$
|
3,525,765
|
|
3.7
|
%
|
||||
|
Fixed rate secured debt
|
||||||||||||
|
Individual property mortgages
|
$
|
476,161
|
|
$
|
882,752
|
|
4.6
|
%
|
2/23/2031
|
|||
|
Variable rate secured debt
(1)
|
||||||||||||
|
Credit facility
|
$
|
—
|
|
$
|
80,000
|
|
|
|||||
|
Fair market value adjustments and debt issuance costs
|
(1,135
|
)
|
13,540
|
|
||||||||
|
Total secured debt
|
$
|
475,026
|
|
$
|
976,292
|
|
4.6
|
%
|
||||
|
Total outstanding debt
|
$
|
4,528,328
|
|
$
|
4,502,057
|
|
3.8
|
%
|
||||
(1)
Includes capped balances.
Unsecured Revolving Credit Facility
MAALP maintains a
$1.0 billion
unsecured credit facility with a syndicate of banks led by KeyBank National Association, or the KeyBank Facility. The KeyBank Facility includes an expansion option up to
$1.5 billion
. The KeyBank Facility bears an interest rate of the London Interbank Offered Rate, or LIBOR, plus a spread of
0.85%
to
1.55%
based on an investment grade pricing grid and, as of
December 31, 2018
, the interest rate was
3.42%
. The KeyBank Facility expires in April 2020 with an option to extend for an additional six months. As of
December 31, 2018
, MAALP had
$540.0 million
outstanding under the KeyBank facility with another
$4.2 million
of additional capacity used to support outstanding letters of credit.
Senior Unsecured Notes
As of
December 31, 2018
, MAALP had approximately
$2.4 billion
in principal amount of publicly issued senior unsecured notes and
$242.0 million
of privately placed senior unsecured notes. The senior unsecured notes had maturities at issuance ranging from
seven
to
twelve
years, with an average of
6.5
years remaining until maturity as of
December 31, 2018
.
In May 2018, MAALP publicly issued
$400.0 million
in aggregate principal of senior unsecured notes, maturing June 2028 with an interest rate of
4.20%
per annum, or the 2028 Notes. The purchase price paid by the initial purchasers was
99.403%
of the principal amount. The 2028 Notes are general unsecured senior obligations of MAALP and rank equally in right of payment with all other senior unsecured indebtedness of MAALP. Interest on the 2028 Notes is payable on June 15 and December 15 of each year, beginning on December 15, 2018. The net proceeds from the offering, after deducting the original issue discount of
$2.4 million
and underwriting commissions and expenses of
$2.6 million
, were
$395.0 million
. The 2028 Notes have been reflected net of discount and debt issuance costs in the Consolidated Balance Sheets as of
December 31, 2018
. In connection with the issuance of the 2028 Notes, MAALP cash settled
$200.0 million
in forward interest rate swap agreements, which were entered into earlier in the year to effectively lock the interest rate on a portion of the planned transaction, resulting in an effective interest rate of
4.21%
over the
10
year life of the 2028 Notes.
In July 2018, MAALP retired a
$50.0 million
tranche of senior unsecured private placement notes at maturity.
Unsecured Term Loans
MAALP maintains four term loans with a syndicate of banks, one led by KeyBank National Association, or KeyBank, two by Wells Fargo Bank, N.A., or Wells Fargo, and one by U.S. Bank National Association, or U.S. Bank. The KeyBank term loan has a balance of
$150.0 million
, matures in 2021, and has a variable interest rate of LIBOR plus a spread of
0.90%
to
1.75%
F-25
based on the Company's credit ratings. Both Wells Fargo term loans have balances of
$300.0 million
, mature in 2022 and 2019, respectively, and have variable interest rates of LIBOR plus spreads of
0.90%
to
1.75%
and
0.75%
to
1.65%
, respectively, based on the Company's credit ratings. The interest rate of the Wells Fargo term loan due in 2022 is fixed at
2.32%
with a forward swap through the swap's maturity date, January 2020. See Note 7 for additional details on cash flow hedges of interest rate risk. The Wells Fargo term loan due in 2019 was entered into by the Company in December 2018. The U.S. Bank term loan has a balance of
$150.0 million
, matures in 2020, and has a variable interest rate of LIBOR plus a spread of
0.90%
to
1.90%
based on the Company's credit ratings.
In August 2018, MAALP retired a
$250.0 million
unsecured term loan with Wells Fargo at maturity.
Secured Property Mortgages
As of
December 31, 2018
, MAALP had
$476.2 million
of fixed rate conventional property mortgages with a weighted average interest rate of
4.6%
and a weighted average maturity in 2031.
In December 2018, MAALP entered into a
$172.0 million
mortgage with a fixed rate of
4.44%
associated with five apartment communities. The mortgage is scheduled to mature in January 2049.
In February 2018, MAALP retired a
$38.3 million
mortgage associated with an apartment community. The mortgage was scheduled to mature in May 2018.
In November 2018, MAALP retired a
$350.0 million
mortgage associated with eighteen apartment communities. The mortgage was scheduled to mature in February 2019.
In December 2018, MAALP retired a
$179.7 million
mortgage associated with five apartment communities. The mortgage was scheduled to mature in February 2019.
In addition to these retirements, MAALP paid
$10.6 million
associated with property mortgage principal amortizations during the year ended
December 31, 2018
.
Secured Credit Facility
In December 2018, MAALP retired its secured credit facility, an
$80.0 million
secured credit facility with Prudential Mortgage Capital, which was credit enhanced by the Federal National Mortgage Association.
Schedule of Maturities
The following table includes scheduled principal repayments on the Company's outstanding borrowings as of
December 31, 2018
, as well as the amortization of the fair market value of debt assumed, debt discounts and issuance costs (in thousands):
|
Year
|
Maturities
|
Amortization
|
Total
|
|||||||||
|
2019
|
$
|
333,115
|
|
$
|
2,583
|
|
$
|
335,698
|
|
|||
|
2020
|
842,456
|
|
1,291
|
|
843,747
|
|
||||||
|
2021
|
340,618
|
|
(2,138
|
)
|
338,480
|
|
||||||
|
2022
|
667,000
|
|
(2,713
|
)
|
664,287
|
|
||||||
|
2023
|
362,250
|
|
(2,023
|
)
|
360,227
|
|
||||||
|
Thereafter
|
1,992,018
|
|
(6,129
|
)
|
1,985,889
|
|
||||||
|
|
$
|
4,537,457
|
|
$
|
(9,129
|
)
|
$
|
4,528,328
|
|
|||
Guarantees
As of
December 31, 2018
, MAA fully and unconditionally guaranteed
$242.0 million
of the privately placed senior unsecured notes issued by MAALP.
F-26
7. Financial Instruments and Derivatives
Financial Instruments Not Carried at Fair Value
Cash and cash equivalents, restricted cash and accrued expenses and other liabilities are carried at amounts that reasonably approximate their fair value due to their short term nature.
Fixed rate notes payable as of
December 31, 2018
and
December 31, 2017
, totaled
$3.1 billion
and
$3.2 billion
, respectively, and had estimated fair values of
$3.1 billion
and
$3.3 billion
(excluding prepayment penalties) as of
December 31, 2018
and
December 31, 2017
, respectively. The carrying values of variable rate notes payable (excluding the effect of interest rate swap and cap agreements) as of
December 31, 2018
and
December 31, 2017
, totaled
$1.1 billion
and
$1.3 billion
, respectively, and had estimated fair values of
$1.1 billion
and
$1.3 billion
(excluding prepayment penalties) as of
December 31, 2018
and
December 31, 2017
, respectively. The fair values of fixed rate debt are determined by using the present value of future cash outflows discounted with the applicable current market rate plus a credit spread. The fair values of variable rate debt are determined using the stated variable rate plus the current market credit spread. The variable rates reset every 30 to 90 days, and management concluded that these rates reasonably estimate current market rates.
Financial Instruments Measured at Fair Value on a Recurring Basis
The Company uses interest rate swaps to add stability to interest expense and to manage, or hedge, its exposure to interest rate movements associated with our variable rate debt or as hedges in anticipation of future debt transactions. The fair values of interest rate swaps are determined using the market standard methodology of netting the discounted future fixed cash receipts (or payments) and the discounted expected variable cash payments (or receipts). The variable cash payments (or receipts) are based on an expectation of future interest rates (forward curves) derived from observable market interest rate curves.
The fair value of interest rate derivative contracts designated as hedging instruments recorded in "Other assets" in the accompanying Consolidated Balance Sheets was
$3.7 million
and
$3.6 million
as of
December 31, 2018
and
December 31, 2017
, respectively. The fair value of interest rate derivative contract liabilities recorded in "Accrued expenses and other liabilities" in the accompanying Consolidated Balance Sheets was
$5.3 million
and
$1.3 million
as of
December 31, 2018
and
December 31, 2017
, respectively.
To comply with the provisions of ASC Topic 820, management incorporates credit valuation adjustments to appropriately reflect both its nonperformance risk and the respective counterparty’s nonperformance risk in the fair value measurements. In adjusting the fair value of the derivative contracts for the effect of nonperformance risk, the Company has considered the impact of netting and any applicable credit enhancements, such as collateral postings, thresholds, mutual puts and guarantees. Based on guidance issued by the FASB, the Company made an accounting policy election to measure the credit risk of its derivative financial instruments that are subject to master netting agreements on a net basis by counterparty portfolio.
The derivative asset related to the redemption feature embedded in the MAA Series I preferred stock issued in connection with the merger with Post Properties is valued using widely accepted valuation techniques, including a discounted cash flow analysis in which the perpetual value of the preferred shares is compared to the value of the preferred shares assuming the call option is exercised, with the value of the bifurcated call option as the difference between the two values. This analysis reflects the contractual terms of the redeemable preferred shares, which are redeemable at the Company's option beginning on
October 1, 2026
and at the redemption price of
$50
per share (see Note 9). The analysis uses observable market-based inputs, including trading data available on the preferred shares, coupon yields on preferred stock issuances from REITs with similar credit ratings as MAA and treasury rates to determine the fair value of the bifurcated call option.
The redemption feature embedded in the MAA Series I preferred stock is reported as a derivative asset in "Other assets" in the accompanying Consolidated Balance Sheets and is adjusted to its fair value at each reporting date, with a corresponding non-cash adjustment to "Other non-operating (income) expense" in the accompanying Consolidated Statements of Operations. As a result of mark-to-market adjustments of non-cash expense recorded to reflect the change in fair value of the derivative asset during the year ended
December 31, 2018
, the fair value of the embedded derivative asset decreased to
$18.6 million
as of
December 31, 2018
as compared to
$21.2 million
as of
December 31, 2017
.
The Company has determined the majority of the inputs used to value its outstanding debt and derivatives, including its embedded derivative, fall within Level 2 of the fair value hierarchy, and as a result, the fair market valuation of its debt and all of its derivatives held as of
December 31, 2018
and
December 31, 2017
were classified as Level 2 in the fair value hierarchy. The Company’s derivative financial instruments and their related gains and losses are reported in "Net change in operating accounts and other" in the accompanying Consolidated Statements of Cash Flows.
F-27
Cash Flow Hedges of Interest Rate Risk
As of January 1, 2018, the Company early adopted ASU 2017-12,
Derivatives and Hedging (Topic 815),
which clarifies hedge accounting requirements, improves disclosure of hedging arrangements and better aligns risk management activities and financial reporting for hedging relationships. The Company adopted the standard using a modified retrospective approach via the elimination of the previously recorded cumulative ineffectiveness for cash flow and net investment hedges existing at date of adoption as a cumulative-effect adjustment of
$0.2 million
to accumulated other comprehensive income with a corresponding adjustment to the opening balance of retained earnings. The adoption of the ASU did not have a material impact on the consolidated financial statements or the Company's accounting policies.
The changes in the fair value of derivatives designated and that qualify as cash flow hedges is recorded in "Accumulated other comprehensive (loss) income" and is subsequently reclassified into earnings in the period that the hedged forecasted transaction affects earnings. In conjunction with the adoption of ASU 2017-12, as long as a hedging instrument is designated and the results of the effectiveness testing support that the instrument qualifies for hedge accounting treatment, there is no periodic measurement or recognition of ineffectiveness. Rather, the full impact of hedge gains and losses will be recognized in the period in which hedged transactions impact earnings, regardless of whether or not economic mismatches exist in the hedging relationship. Amounts reported in "Accumulated other comprehensive (loss) income" related to derivatives designated as qualifying cash flow hedges will be reclassified to interest expense as interest payments are made on the Company's variable rate or fixed rate debt. During the next twelve months, the Company estimates that an additional
$2.8 million
will be reclassified to earnings as a reduction to "Interest expense", which primarily represents the difference between the fixed interest rate swap payments and the projected variable interest rate swap receipts.
As of
December 31, 2018
, the Company had the following outstanding interest rate derivatives that were designated as cash flow hedges of interest rate risk (dollars in thousands):
|
Interest Rate Derivative
|
Number of Instruments
|
Notional
|
||
|
Interest rate swaps
(1)
|
10
|
$600,000
|
||
|
(1)
|
Includes six forward rate swaps totaling
$300.0 million
, which hedge the first
10
years of interest payments on debt the Company anticipates issuing in 2019. These swaps are not included in the debt discussion in Note 6.
|
Tabular Disclosure of the Effect of Derivative Instruments on the Statements of Operations
The tables below present the effect of the Company's derivative financial instruments on the Consolidated Statements of Operations for the years ended
December 31, 2018
,
2017
and
2016
, respectively (in thousands):
|
Derivatives in Cash Flow Hedging Relationships
|
(Loss) Gain Recognized in OCI on Derivative
|
Location of Gain (Loss) Reclassified from Accumulated OC(L)I into Income
|
Gain (Loss) Reclassified from Accumulated OC(L)I into Interest Expense
(1)
|
|||||||||||||||||||||||
|
Year ended December 31,
|
2018
|
2017
|
2016
|
2018
|
2017
|
2016
|
||||||||||||||||||||
|
Interest rate contracts
|
$
|
(751
|
)
|
$
|
319
|
|
$
|
(1,500
|
)
|
Interest expense
|
$
|
1,938
|
|
$
|
(730
|
)
|
$
|
(4,364
|
)
|
|||||||
|
(1)
|
See the Consolidated Statements of Comprehensive Income for changes in accumulated other comprehensive (loss) income as these changes are presented net of the allocation to noncontrolling interests.
|
|
Derivatives Not Designated as Hedging Instruments
|
Location of (Loss) Gain Recognized in Income on Derivative
|
(Loss) Gain Recognized in Earnings on Derivative
|
||||||||||||
|
For the year ended December 31,
|
2018
|
2017
|
2016
|
|||||||||||
|
Preferred stock embedded derivative
|
Other non-operating (income) expense
|
$
|
(2,576
|
)
|
$
|
8,807
|
|
$
|
—
|
|
||||
Credit-Risk-Related Contingent Features
Certain of the Company's derivative contracts contain a provision where the Company could be declared in default on its derivative obligations if repayment of the underlying indebtedness is accelerated by the lender due to the Company's default on the indebtedness. As of
December 31, 2018
, the Company had not breached the provisions of these agreements. If the provisions had been breached, the Company could have been required to settle its obligations under the agreements at the termination value of
$5.5 million
as of
December 31, 2018
. Although the Company's derivative contracts are subject to master netting arrangements, which serve as credit mitigants to both the Company and its counterparties under certain situations, the Company does not net its derivative fair values or any existing rights or obligations to cash collateral in the Consolidated Balance Sheets.
F-28
8. Income Taxes
Due to the structure of MAA as a REIT and the nature of the operations of its operating properties, no provision for federal income taxes has been made at the MAA level. In addition, as MAALP is structured as a limited partnership, and its partners recognize their proportionate share of income or loss in their tax returns, no provision for federal income taxes has been made at the MAALP level. Historically, the Company has incurred certain state and local income, excise and franchise taxes.
Taxable REIT Subsidiaries
A TRS is an entity that is subject to federal, state and any applicable local corporate income tax without the benefit of the dividends paid deduction applicable to REITs. The Company’s TRS did not generate any material taxable income or income tax expense for the years ended
December 31, 2018
,
2017
and
2016
. The Company’s TRS generally provide the Company with third party services (payroll and other services) for which the Company reimburses its TRS. All intercompany transactions are eliminated in the accompanying consolidated financial statements.
For the years ended
December 31, 2018
,
2017
and
2016
, the reconciliation of income tax attributable to continuing operations for the TRS computed at the U.S. statutory rate to the income tax provision was as follows (in thousands):
|
2018
|
2017
|
2016
|
|||||||||
|
Tax expense at U.S. statutory rates on TRS income subject to tax
|
$
|
115
|
|
$
|
2,177
|
|
$
|
3,185
|
|
||
|
Valuation allowance
|
127
|
|
(2,177
|
)
|
(3,185
|
)
|
|||||
|
TRS income tax provision
|
$
|
242
|
|
$
|
—
|
|
$
|
—
|
|
||
Income tax expense for the years ended
December 31, 2018
,
2017
and
2016
was
$2.6 million
,
$2.6 million
and
$1.7 million
, respectively, and is presented in “Income tax expense” in the accompanying Consolidated Statements of Operations. Income tax expense primarily relates to the Texas-based margin tax for all Texas apartment communities in addition to the Company’s TRS income tax provision discussed above.
The Company’s deferred tax asset and liability balances as of
December 31, 2018
and
2017
were immaterial. The Company had no reserve for uncertain tax positions for the years ended
December 31, 2018
and
2017
, and management does not believe there will be any material changes in the Company's unrecognized tax positions over the next 12 months. If necessary, the Company accrues interest and penalties on unrecognized tax benefits as a component of income tax expense.
As of
December 31, 2018
and
2017
, the Company held federal NOL carryforwards of
$71.5 million
for income tax purposes that expire in years 2019 to 2033. Utilization of any NOL carryforwards is subject to an annual limitation due to ownership change limitations provided by Section 382 of the Code and similar state provisions. The annual limitations may result in the expiration of NOL carryforwards before utilization. The Company may use these NOLs to offset all or a portion of the taxable income generated at the REIT level. Tax years 2015 through 2018 are subject to examination by the Internal Revenue Service.
No
tax examination is currently in process.
For income tax purposes, dividends paid to holders of common stock primarily consist of ordinary income, return of capital, capital gains, qualified dividends and un-recaptured Section 1250 gains, or a combination thereof. For the years ended
December 31, 2018
,
2017
and
2016
, dividends per share held for the entire year were estimated to be taxable as follows:
|
2018
|
2017
|
2016
|
|||||||||||||||||||
|
Amount
|
Percentage
|
Amount
|
Percentage
|
Amount
|
Percentage
|
||||||||||||||||
|
Ordinary income
|
$
|
3.66
|
|
99.3
|
%
|
$
|
2.79
|
|
80.2
|
%
|
$
|
3.28
|
|
100
|
%
|
||||||
|
Capital gain
|
0.02
|
|
0.6
|
%
|
0.31
|
|
8.9
|
%
|
—
|
|
—
|
%
|
|||||||||
|
Un-recaptured Section 1250 gain
|
0.01
|
|
0.1
|
%
|
0.38
|
|
10.9
|
%
|
—
|
|
—
|
%
|
|||||||||
|
$
|
3.69
|
|
100.00
|
%
|
$
|
3.48
|
|
100.00
|
%
|
$
|
3.28
|
|
100.00
|
%
|
|||||||
The Company designated the per share amounts above as capital gain dividends in accordance with the requirements of the Code. The difference between net income available to common shareholders for financial reporting purposes and taxable income before dividend deductions relates primarily to temporary differences such as depreciation and amortization and taxable gains on sold properties.
U.S. Tax Reform
In December 2017, the Tax Cuts and Jobs Act, or the Act, was enacted in the United States, requiring companies to account in
F-29
2017 for the current and future effects of the legislative changes. As REITs are pass-through entities for the purpose of U.S. federal taxation, the legislative changes created by the Act are largely not applicable to the Company. Generally, the effects to REITs resulting from the Act include a reduction in the TRS federal statutory tax rate to 21% and a one-time inclusion in REIT taxable income of foreign subsidiary earnings. As noted above, the Company's TRS recognized no material taxable income in 2018 and 2017, and the Company has no foreign subsidiaries. Management has concluded there was no material effect to the Company’s consolidated financial statements from either a tax or financial statement perspective as a result of the Act.
9. Shareholders' Equity of MAA
As of
December 31, 2018
,
113,844,267
shares of common stock of MAA and
4,111,301
OP Units (excluding the OP Units held by MAA) were issued and outstanding, representing a total of
117,955,568
common shares and units. As of
December 31, 2017
,
113,643,166
shares of common stock of MAA and
4,191,586
OP Units (excluding the OP Units held by MAA) were issued and outstanding, representing a total of
117,834,752
common shares and units.
Preferred Stock
As of
December 31, 2018
, MAA had one outstanding series of cumulative redeemable preferred stock which has the following characteristics:
|
Description
|
Outstanding Shares
|
Liquidation Preference
(1)
|
Optional Redemption Date
|
Redemption Price
(2)
|
Stated Dividend Yield
|
Approximate Dividend Rate
|
||||||
|
Series I
|
867,846
|
$50.00
|
10/1/2026
|
$50.00
|
8.50%
|
$4.25
|
||||||
(1)
The total liquidation preference for the outstanding preferred stock is
$43.4 million
.
(2)
The redemption price is the price at which the preferred stock is redeemable, at MAA's option, for cash.
Direct Stock Purchase and Distribution Reinvestment Plan
MAA has a Dividend and Distribution Reinvestment and Share Purchase Plan, or DRSPP, pursuant to which MAA’s common shareholders have the ability to reinvest all or part of their distributions from MAA into shares of MAA’s common stock and holders of Class A OP Units have the ability to reinvest all or part of their distributions from the Operating Partnership into MAA’s common stock. The DRSPP also provides the opportunity to make optional cash investments in MAA's common stock of at least
$250
, but not more than
$5,000
in any given month, free of brokerage commissions and charges. MAA, in its absolute discretion, may grant waivers to allow for optional cash payments in excess of
$5,000
. To fulfill its obligations under the DRSPP, MAA may either issue additional shares of common stock or repurchase common stock in the open market. MAA currently has registered with the SEC the offer and sale of up to
1,940,500
shares of common stock pursuant to the DRSPP. MAA may elect to sell shares under the DRSPP at up to a
5%
discount. Shares of MAA's common stock totaling
9,721
in
2018
,
9,568
in
2017
, and
7,906
in
2016
were acquired by participants under the DRSPP. MAA did not offer a discount for optional cash purchases in
2018
,
2017
or
2016
.
10. Partners' Capital of MAALP
Common units of limited partnership interests in MAALP are represented by OP Units. As of
December 31, 2018
, there were
117,955,568
OP Units outstanding,
113,844,267
, or
96.5%
, of which represent Class B OP Units (common units issued to or held by MAALP's general partner or any of its subsidiaries), which were owned by MAA, MAALP's general partner. The remaining
4,111,301
OP Units were Class A OP Units owned by Class A limited partners. As of
December 31, 2017
, there were
117,834,752
OP Units outstanding,
113,643,166
, or
96.4%
, of which were owned by MAA and
4,191,586
of which were owned by the Class A limited partners.
MAA, as the sole general partner of MAALP, has full, complete and exclusive discretion to manage and control the business of MAALP subject to the restrictions specifically contained within MAALP's agreement of limited partnership, or the Partnership Agreement. Unless otherwise stated in the Partnership Agreement, this power includes, but is not limited to, acquiring, leasing, or disposing of any real property; constructing buildings and making other improvements to properties owned; borrowing money, modifying or extinguishing current borrowings, issuing evidence of indebtedness, and securing such indebtedness by mortgage, deed of trust, pledge or other lien on MAALP's assets; and distribution of MAALP's cash or other assets in accordance with the Partnership Agreement. MAA can generally, at its sole discretion, issue and redeem OP Units and determine the consideration to be received or the redemption price to be paid, as applicable. The general partner may delegate these and other powers granted if the general partner remains in supervision of the designee.
F-30
Under the Partnership Agreement, MAALP may issue Class A OP Units and Class B OP Units. Class A OP Units are any OP Units other than Class B OP Units, while Class B OP Units are those issued to or held by MAALP's general partner or any of its subsidiaries. In general, the limited partners do not have the power to participate in the management or control of MAALP's business except in limited circumstances including changes in the general partner and protective rights if the general partner acts outside of the provisions provided in the Partnership Agreement. The transferability of Class A OP Units is also limited by the Partnership Agreement.
Net income (after allocations to preferred ownership interests) is allocated to the general partner and limited partners based on their respective ownership percentages of MAALP. Issuance or redemption of additional Class A OP Units or Class B OP Units changes the relative ownership percentage of the partners. The issuance of Class B OP Units generally occurs when MAA issues common stock and the proceeds from that issuance are contributed to MAALP in exchange for the issuance to MAA of a number of OP Units equal to the number of shares of common stock issued. Likewise, if MAA repurchases or redeems outstanding shares of common stock, MAALP generally redeems an equal number of Class B OP Units with similar terms held by MAA for a redemption price equal to the purchase price of those shares of common stock. At each reporting period, the allocation between general partner capital and limited partner capital is adjusted to account for the change in the respective percentage ownership of the underlying capital of MAALP. Holders of the Class A OP Units may require MAA to redeem their Class A OP Units, in which case MAA may, at its option, pay the redemption price either in cash (in an amount per Class A OP Unit equal, in general, to the average closing price of MAA's common stock on the NYSE over a specified period prior to the redemption date) or by delivering one share of MAA common stock (subject to adjustment under specified circumstances) for each Class A OP Unit so redeemed.
As of
December 31, 2018
, a total of
4,111,301
Class A OP Units were outstanding and redeemable for
4,111,301
shares of MAA common stock, with an approximate value of
$393.5 million
, based on the closing price of MAA’s common stock on
December 31, 2018
of
$95.70
per share. As of
December 31, 2017
, a total of
4,191,586
Class A OP Units were outstanding and redeemable for
4,191,586
shares of MAA common stock, with an approximate value of
$421.5 million
, based on the closing price of MAA’s common stock on
December 31, 2017
of
$100.56
per share. MAALP pays the same per unit distributions in respect to the OP Units as the per share dividends MAA pays in respect to its common stock.
As of
December 31, 2018
, MAALP had one outstanding series of cumulative redeemable preferred units, or the MAALP Series I Preferred Units. The MAALP Series I Preferred Units have the same characteristics as the MAA Series I preferred stock described in Note 8. As of
December 31, 2018
,
867,846
units of the MAALP Series I Preferred Units were outstanding.
11. Employee Benefit Plans
The following provides details of the employee benefit plans not previously discussed in Note 5.
401(k) Savings Plans
MAA's 401(k) Savings Plan, or 401(k) Plan, is a defined contribution plan that satisfies the requirements of Section 401(a) and 401(k) of the Code. Subsequent to the merger with Post Properties, eligible employees of Post Properties continued to actively participate in the Post Properties 401(k) Plan, which also is a defined contribution plan that satisfies the requirements of Section 401(a) and 401(k) of the Code. MAA's Board of Directors has the discretion to approve matching contributions to these plans. MAA recognized expense from these plans of
$3.2 million
,
$2.8 million
and
$2.0 million
for the years ended
December 31, 2018
,
2017
and
2016
, respectively.
Non-Qualified Executive Deferred Compensation Retirement Plan
MAA has adopted the MAA Non-Qualified Executive Deferred Compensation Retirement Plan Amended and Restated effective January 1, 2016, or the Deferred Compensation Plan, for certain executive employees. Under the terms of the Deferred Compensation Plan, employees may elect to defer a percentage of their compensation and bonus, and MAA may, but is not obligated to, match a portion of the employees' salary deferral. MAA recognized expense on its match to the Deferred Compensation Plan for the years ended
December 31, 2018
,
2017
and
2016
of
$0.3 million
,
$0.2 million
and
$0.1 million
, respectively.
Non-Qualified Deferred Compensation Plan for Outside Company Directors
MAA has adopted the Non-Qualified Deferred Compensation Plan for Outside Company Directors as Amended effective November 20, 2010, or the Directors Deferred Compensation Plan, which allows non-employee directors to defer their director fees by having the fees held by MAA as shares of MAA's common stock. Directors can also choose to have their annual
F-31
restricted stock grants issued into the Directors Deferred Compensation Plan. Amounts deferred through the Directors Deferred Compensation Plan are distributed to the directors in
two
annual installments beginning in the first
90
days of the year following the director’s departure from the board. Participating directors may choose to have the amount issued to them in shares of MAA's common stock or paid to them as cash at the market value of MAA's common stock as of the end of the year the director ceases to serve on the board.
For the years ended
December 31, 2018
,
2017
and
2016
, directors deferred
12,240
shares,
12,293
shares and
10,166
shares of common stock, respectively, with weighted-average grant date fair values of
$92.63
,
$101.34
and
$97.99
, respectively, into the Directors Deferred Compensation Plan. The shares of common stock held in the Directors Deferred Compensation Plan are classified outside of permanent equity in redeemable stock with changes in redemption amount recorded immediately to retained earnings because the directors have redemption rights not solely within the control of MAA. Additionally, any shares that become mandatorily redeemable because a departed director has elected to receive a cash payout are recorded as a liability. MAA did not record a liability related to mandatorily redeemable shares for the years ended
December 31, 2018
,
2017
and
2016
.
Employee Stock Ownership Plan
MAA’s Employee Stock Ownership Plan, or ESOP, is a non-contributory stock bonus plan that satisfies the requirements of Section 401(a) of the Code. On December 31, 2010, the ESOP was frozen by amendment, whereby effective January 1, 2011, no additional employees became eligible for the plan, no additional contributions were made to the ESOP, and all Participants with an account balance under the ESOP became 100% vested. The Company did not contribute to the ESOP during
2018
,
2017
or
2016
. As of
December 31, 2018
, there were
139,436
shares outstanding with a fair value of
$13.3 million
.
12. Commitments and Contingencies
Land and Equipment Leases
The Company has a ground lease expiring in 2074 related to one of its apartment communities acquired in the merger with Post Properties. This lease contains stated rent increases that generally compensate for the impact of inflation. The Company also has office, equipment and other operating leases. Future minimum lease payments for non-cancelable land, equipment and other operating leases as of
December 31, 2018
were as follows (in thousands):
|
Minimum Lease Payments
|
|||
|
2019
|
$
|
2,729
|
|
|
2020
|
2,744
|
|
|
|
2021
|
2,771
|
|
|
|
2022
|
2,767
|
|
|
|
2023
|
2,761
|
|
|
|
Thereafter
|
68,516
|
|
|
|
Total
|
$
|
82,288
|
|
Legal Proceedings
In September 2010, the United States Department of Justice, or DOJ, filed suit against Post Properties (and by virtue of the merger with Post Properties, MAA) in the United States District Court for the District of Columbia alleging that certain of Post Properties’ apartments violated accessibility requirements of the Fair Housing Act, or FHA, and the Americans with Disabilities Act of 1990, or ADA. The DOJ sought, among other things, an injunction against MAA, requiring MAA to retrofit the properties and comply with FHA and ADA standards in future design and construction, as well as monetary damages and civil penalties. In October 2018, MAA and the DOJ reached an agreement in principle to settle the lawsuit. In November 2018, the settlement agreement was fully executed. In December 2018, a stipulation of dismissal of the case with prejudice was filed with the District Court, concluding the case.
In June 2016, plaintiffs Cathi Cleven and Tara Cleven, on behalf of a purported class of plaintiffs, filed a complaint against MAA and the Operating Partnership in the United States District Court for the Western District of Texas, Austin Division. In January 2017, Areli Arellano and Joe L. Martinez joined the lawsuit as additional plaintiffs. The lawsuit alleges that the Company (but not Post Properties) charged late fees at its Texas properties that violate Section 92.019 of the Texas Property Code, or Section 92.019, which provides that a landlord may not charge a tenant a late fee for failing to pay rent unless, among other things, the fee is a reasonable estimate of uncertain damages to the landlord that are incapable of precise calculation and
F-32
result from the late payment of rent. The plaintiffs are seeking monetary damages and attorneys' fees and costs. In September 2018, the District Court certified a class proposed by the plaintiffs. Additionally, in September 2018, the District Court denied the Company’s motion for summary judgment and granted the plaintiffs’ motion for partial summary judgment. Because the District Court certified a class prior to granting the plaintiffs’ motion for partial summary judgment, the District Court’s ruling applies to the entire class. In October 2018, the Fifth Circuit Court of Appeals accepted the Company’s petition to review the District Court’s order granting class certification. The Company also intends to appeal the District Court’s order granting plaintiff’s motion for summary judgment to the Fifth Circuit Court of Appeals if permission to appeal is granted. The Company will continue to vigorously defend the action and pursue such appeals. Management estimates that the Company's maximum exposure in the lawsuit, given the recent class certification and summary judgment ruling, is
$54.6 million
, which includes both potential damages and attorneys' fees but excludes any prejudgment interest that may be awarded.
In April 2017, plaintiff Nathaniel Brown, on behalf of a purported class of plaintiffs, filed a complaint against the Operating Partnership, as the successor by merger to Post Properties' primary operating partnership, and MAA in the United States District Court for the Western District of Texas, Austin Division. The lawsuit alleges that Post Properties (and, following the Post Properties merger, the Operating Partnership) charged late fees at its Texas properties that violate Section 92.019. The plaintiffs are seeking monetary damages and attorneys' fees and costs. In September 2018, the District Court certified a class proposed by the plaintiff. Additionally, in September 2018, the District Court denied the Company’s motion for summary judgment and granted the plaintiff’s motion for partial summary judgment. Because the District Court certified a class prior to granting the plaintiff’s motion for partial summary judgment, the District Court’s ruling applies to the entire class. In October 2018, the Fifth Circuit Court of Appeals accepted the Company's petition to review the District Court's order granting class certification. The Company also intends to appeal the District Court’s order granting plaintiff’s motion for summary judgment to the Fifth Circuit Court of Appeals if permission to appeal is granted. The Company will continue to vigorously defend the action and pursue such appeals. Management estimates that the Company's maximum exposure in the lawsuit, given the recent class certification and summary judgment ruling, is
$8.4 million
, which includes both potential damages and attorneys' fees but excludes any prejudgment interest that may be awarded.
The Company is subject to various other legal proceedings and claims that arise in the ordinary course of its business operations. Matters which arise out of allegations of bodily injury, property damage and employment practices are generally covered by insurance. While the resolution of these other matters cannot be predicted with certainty, management does not currently believe that such matters, either individually or in the aggregate, will have a material adverse effect on the Company's financial condition, results of operations or cash flows in the event of a negative outcome.
Loss Contingencies
The outcomes of claims, disputes and legal proceedings are subject to significant uncertainty. The Company records an accrual for loss contingencies when a loss is probable and the amount of the loss can be reasonably estimated. The Company also accrues an estimate of defense costs expected to be incurred in connection with legal matters. Management reviews these accruals quarterly and makes revisions based on changes in facts and circumstances. When a loss contingency is not both probable and reasonably estimable, management does not accrue the loss. However, if the loss (or an additional loss in excess of the accrual) is at least a reasonable possibility and material, then management discloses a reasonable estimate of the possible loss, or range of loss, if such reasonable estimate can be made. If the Company cannot make a reasonable estimate of the possible loss, or range of loss, then a statement to that effect is disclosed.
The assessment of whether a loss is probable or a reasonable possibility, and whether the loss or range of loss is reasonably estimable, often involves a series of complex judgments about future events. Among the factors considered in this assessment, are the nature of existing legal proceedings and claims, the asserted or possible damages or loss contingency (if reasonably estimable), the progress of the matter, existing law and precedent, the opinions or views of legal counsel and other advisers, management's experience in similar matters, the facts available to management at the time of assessment, and how the Company intends to respond, or has responded, to the proceeding or claim. Management's assessment of these factors may change over time as individual proceedings or claims progress. For matters where management is not currently able to reasonably estimate a range of reasonably possible loss, the factors that have contributed to this determination include the following: (i) the damages sought are indeterminate; (ii) the proceedings are in the early stages; (iii) the matters involve novel or unsettled legal theories or a large or uncertain number of actual or potential cases or parties; and/or (iv) discussions with the parties in matters that are ultimately expected to be resolved through negotiation and settlement have not reached the point where management believes a reasonable estimate of loss, or range of loss, can be made. The Company believes that there is considerable uncertainty regarding the timing or ultimate resolution of such matters, including a possible eventual loss or business impact, if any.
F-33
As of
December 31, 2018
and
December 31, 2017
, the Company's accrual for loss contingencies relating to unresolved legal matters was
$8.7 million
and
$32.1 million
in the aggregate, respectively. The loss contingencies are presented in "Accrued expenses and other liabilities" in the accompanying Consolidated Balance Sheets.
13. Related Party Transactions
The Company holds investments in unconsolidated affiliates accounted for under the equity method of accounting. All significant intercompany transactions were eliminated in the accompanying consolidated financial statements.
The cash management of the Company is managed by the Operating Partnership. In general, cash receipts are remitted to the Operating Partnership and all cash disbursements are funded by the Operating Partnership. As a result of these transactions, the Operating Partnership had a payable to MAA, its general partner, of
$19,000
as of
December 31, 2018
and
December 31, 2017
, respectively. The Partnership Agreement does not require the due to/due from balance to be settled in cash until liquidation of the Operating Partnership, and therefore, there is no regular settlement schedule for such amounts.
14. Segment Information
As of
December 31, 2018
, the Company owned and operated
303
multifamily apartment communities in
17
different states from which it derived all significant sources of earnings and operating cash flows. The Company views each consolidated apartment community as an operating segment. The Company's chief operating decision maker, which is the Company’s Chief Executive Officer, evaluates performance and determines resource allocations of each of the apartment communities on a Same Store and Non-Same Store and Other basis, as well as an individual apartment community basis. This is consistent with the aggregation criteria under GAAP as each of the apartment communities generally has similar economic characteristics, facilities, services, and tenants. The following reflects the two reportable segments for the Company:
|
•
|
Same Store communities are communities that the Company has owned and have been stabilized for at least a full
12
months as of the first day of the calendar year.
|
|
•
|
Non-Same Store and Other includes recent acquisitions, communities in development or lease-up, communities that have been identified for disposition, and communities that have incurred a significant casualty loss. Also included in Non-Same Store and Other are non-multifamily activities.
|
On the first day of each calendar year, the Company determines the composition of its Same Store and Non-Same Store and Other reportable segments for that year as well as adjusts the previous year, which allows the Company to evaluate full period-over-period operating comparisons. Properties in development or lease-up are added to the Same Store portfolio on the first day of the calendar year after it has been owned and stabilized for at least a full
12
months. Communities are considered stabilized after achieving
90%
occupancy for
90 days
. Communities that have been identified for disposition are excluded from the Same Store portfolio.
The chief operating decision maker utilizes NOI in evaluating the performance of its operating segments. Total NOI represents total property revenues less total property operating expenses, excluding depreciation and amortization, for all properties held during the period regardless of their status as held for sale. Management believes that NOI is a helpful tool in evaluating the operating performance of the segments because it measures the core operations of property performance by excluding corporate level expenses and other items not related to property operating performance.
Effective January 1, 2018, the Company revised its reportable segment presentation. The revision eliminated the distinction between large and secondary same store markets and combined the two previously reported segments into the Same Store reportable segment referred to above. The communities acquired in the merger with Post Properties became eligible for the same store designation on January 1, 2018 as the properties had been owned and stabilized for a full 12 months and are predominantly located in large markets, resulting in a more homogeneous property portfolio in terms of market dynamics. The chief operating decision maker no longer makes decisions about capital resource allocations and does not assess operating performance by large and secondary same store markets. Further, the chief operating decision maker no longer reviews financial information segregating the Company’s operating segments into large and secondary same store markets. The change in the Company’s portfolio caused the distinction between large and secondary markets to no longer be meaningful. As a result, the Company now discloses two reportable segments: Same Store and Non-Same Store and Other. There were no changes in the structure of the Company’s internal organization that prompted the change in reportable segments. Prior year amounts have been revised to conform to the current year presentation shown below.
F-34
Revenues and NOI for each reportable segment for the years ended
December 31, 2018
,
2017
and
2016
were as follows (in thousands):
|
|
2018
|
2017
|
2016
(1)
|
||||||||
|
Revenues:
|
|
|
|
|
|
|
|||||
|
Same Store
|
|||||||||||
|
Rental revenues
|
$
|
1,340,914
|
|
$
|
1,313,836
|
|
$
|
909,688
|
|
||
|
Reimbursable property revenues
|
89,281
|
|
88,774
|
|
74,814
|
|
|||||
|
Other property revenues
|
11,616
|
|
12,229
|
|
8,219
|
|
|||||
|
Total Same Store revenues
|
$
|
1,441,811
|
|
$
|
1,414,839
|
|
$
|
992,721
|
|
||
|
Non-Same Store and Other
|
|||||||||||
|
Rental revenues
|
$
|
123,112
|
|
$
|
105,865
|
|
$
|
121,964
|
|
||
|
Reimbursable property revenues
|
5,483
|
|
5,282
|
|
8,733
|
|
|||||
|
Other property revenues
|
940
|
|
3,001
|
|
1,930
|
|
|||||
|
Total Non-Same Store and Other revenues
|
$
|
129,535
|
|
$
|
114,148
|
|
$
|
132,627
|
|
||
|
Total rental and other property revenues
|
$
|
1,571,346
|
|
$
|
1,528,987
|
|
$
|
1,125,348
|
|
||
|
Net Operating Income:
|
|||||||||||
|
Same Store NOI
|
$
|
905,756
|
|
$
|
889,176
|
|
$
|
620,567
|
|
||
|
Non-Same Store and Other NOI
|
71,002
|
|
63,080
|
|
81,425
|
|
|||||
|
Total NOI
|
976,758
|
|
952,256
|
|
701,992
|
|
|||||
|
Depreciation and amortization
|
(489,759
|
)
|
(493,708
|
)
|
(322,958
|
)
|
|||||
|
Property management expenses
|
(47,633
|
)
|
(43,588
|
)
|
(34,093
|
)
|
|||||
|
General and administrative expenses
|
(34,786
|
)
|
(40,194
|
)
|
(29,040
|
)
|
|||||
|
Merger and integration expenses
|
(9,112
|
)
|
(19,990
|
)
|
(40,823
|
)
|
|||||
|
Interest expense
|
(173,594
|
)
|
(154,751
|
)
|
(129,947
|
)
|
|||||
|
(Loss) gain on sale of depreciable real estate assets
|
(39
|
)
|
127,386
|
|
80,397
|
|
|||||
|
Gain on sale of non-depreciable real estate assets
|
4,532
|
|
21
|
|
2,171
|
|
|||||
|
Other non-operating income (expense)
|
5,434
|
|
14,353
|
|
(1,839
|
)
|
|||||
|
Income tax expense
|
(2,611
|
)
|
(2,619
|
)
|
(1,699
|
)
|
|||||
|
Income from real estate joint ventures
|
1,832
|
|
1,370
|
|
241
|
|
|||||
|
Net income attributable to noncontrolling interests
|
(8,123
|
)
|
(12,157
|
)
|
(12,180
|
)
|
|||||
|
Dividends to MAA Series I preferred shareholders
|
(3,688
|
)
|
(3,688
|
)
|
(307
|
)
|
|||||
|
Net income available for MAA common shareholders
|
$
|
219,211
|
|
$
|
324,691
|
|
$
|
211,915
|
|
||
(1)
The
2016
column shows the segment break down based on the
2017
Same Store portfolio. A comparison using the
2018
Same Store portfolio would not be comparative due to the nature of the segment classifications.
Assets for each reportable segment as of
December 31, 2018
and
2017
were as follows (in thousands):
|
December 31, 2018
|
December 31, 2017
|
||||||
|
Assets:
|
|
|
|
|
|||
|
Same Store
|
$
|
9,589,141
|
|
$
|
9,864,321
|
|
|
|
Non-Same Store and Other
|
1,565,480
|
|
1,427,778
|
|
|||
|
Corporate assets
|
169,160
|
|
199,820
|
|
|||
|
Total assets
|
$
|
11,323,781
|
|
$
|
11,491,919
|
|
|
F-35
15. Real Estate Acquisitions and Dispositions
The following table reflects the Company's acquisition activity for the year ended
December 31, 2018
:
|
Multifamily Acquisition
|
Market
|
Units
|
Date Acquired
|
|||
|
Sync 36
|
Denver, CO
|
374
|
April 26, 2018
|
|||
|
Commercial Acquisition
|
Market
|
Sq Ft
|
Date Acquired
|
|||
|
Hue Retail
(1)
|
Raleigh, NC
|
7,500
|
August 1, 2018
|
|||
|
Land Acquisition
|
Market
|
Acres
|
Date Acquired
|
|||
|
Westminster
|
|
Denver, CO
|
|
10
|
|
October 1, 2018
|
|
Long Point Road
|
|
Houston, TX
|
|
9
|
|
November 1, 2018
|
(1)
The Company acquired the ground floor retail portion of one of its existing multifamily apartment communities.
The following table reflects the Company's disposition activity for the year ended
December 31, 2018
:
|
Land Dispositions
|
Market
|
Acres
|
Date Sold
|
|||
|
Craft Farms Residential
|
Gulf Shores, AL
|
3
|
January 24, 2018
|
|||
|
Randal Park
|
Orlando, FL
|
34
|
February 27, 2018
|
|||
|
Colonial Grand at Azure
|
Las Vegas, NV
|
29
|
April 19, 2018
|
|||
|
Spring Hill
|
Atlanta, GA
|
10
|
July 2, 2018 and December 21, 2018
|
|||
16. Selected Quarterly Financial Information of MAA (Unaudited)
The following table reflects MAA's selected quarterly financial information for the year ended
December 31, 2018
(dollars in thousands, except per share data):
|
Year Ended December 31, 2018
|
|||||||||||||||
|
|
First
|
Second
|
Third
|
Fourth
|
|||||||||||
|
Rental and other property revenues
|
$
|
386,017
|
|
$
|
390,073
|
|
$
|
397,108
|
|
$
|
398,148
|
|
|||
|
Net income
|
50,820
|
|
61,981
|
|
54,704
|
|
63,517
|
|
|||||||
|
Net income available for MAA common shareholders
|
48,097
|
|
58,885
|
|
51,869
|
|
60,360
|
|
|||||||
|
Per share:
|
|
|
|
|
|
|
|
|
|||||||
|
Earnings per common share - basic
|
$
|
0.42
|
|
$
|
0.52
|
|
$
|
0.46
|
|
$
|
0.53
|
|
|||
|
Earnings per common share - diluted
|
0.42
|
|
0.52
|
|
0.46
|
|
0.53
|
|
|||||||
The following table reflects MAA's selected quarterly financial information for the year ended
December 31, 2017
(dollars in thousands, except per share data):
|
|
Year Ended December 31, 2017
|
||||||||||||||
|
|
First
|
Second
|
Third
|
Fourth
|
|||||||||||
|
Rental and other property revenues
|
$
|
378,908
|
|
$
|
382,791
|
|
$
|
384,550
|
|
$
|
382,738
|
|
|||
|
Net income
|
43,416
|
|
50,155
|
|
118,958
|
|
128,007
|
|
|||||||
|
Net income available for MAA common shareholders
|
40,983
|
|
47,393
|
|
113,787
|
|
122,528
|
|
|||||||
|
Per share:
|
|
|
|
|
|
|
|
|
|||||||
|
Earnings per common share - basic
|
$
|
0.36
|
|
$
|
0.42
|
|
$
|
1.00
|
|
$
|
1.08
|
|
|||
|
Earnings per common share - diluted
|
0.36
|
|
0.42
|
|
1.00
|
|
1.08
|
|
|||||||
F-36
17. Selected Quarterly Financial Information of MAALP (Unaudited)
The following table reflects MAALP's selected quarterly financial information for the year ended
December 31, 2018
(dollars in thousands, except per unit data):
|
Year Ended December 31, 2018
|
|||||||||||||||
|
|
First
|
Second
|
Third
|
Fourth
|
|||||||||||
|
Rental and other property revenues
|
$
|
386,017
|
|
$
|
390,073
|
|
$
|
397,108
|
|
$
|
398,148
|
|
|||
|
Net income
|
50,820
|
|
61,981
|
|
54,704
|
|
63,517
|
|
|||||||
|
Net income available for MAALP common unitholders
|
49,898
|
|
61,059
|
|
53,782
|
|
62,595
|
|
|||||||
|
Per unit:
|
|
|
|
|
|||||||||||
|
Earnings per common unit - basic
|
$
|
0.42
|
|
$
|
0.52
|
|
$
|
0.46
|
|
$
|
0.53
|
|
|||
|
Earnings per common unit - diluted
|
0.42
|
|
0.52
|
|
0.46
|
|
0.53
|
|
|||||||
The following table reflects MAALP's selected quarterly financial information for the year ended
December 31, 2017
(dollars in thousands, except per unit data):
|
|
Year Ended December 31, 2017
|
||||||||||||||
|
|
First
|
Second
|
Third
|
Fourth
|
|||||||||||
|
Rental and other property revenues
|
$
|
378,908
|
|
$
|
382,791
|
|
$
|
384,550
|
|
$
|
382,738
|
|
|||
|
Net income
|
43,416
|
|
50,155
|
|
118,958
|
|
128,007
|
|
|||||||
|
Net income available for MAALP common unitholders
|
42,494
|
|
49,233
|
|
118,036
|
|
127,085
|
|
|||||||
|
Per unit:
|
|
|
|
|
|||||||||||
|
Earnings per common unit - basic
|
$
|
0.36
|
|
$
|
0.42
|
|
$
|
1.00
|
|
$
|
1.08
|
|
|||
|
Earnings per common unit - diluted
|
0.36
|
|
0.42
|
|
1.00
|
|
1.08
|
|
|||||||
18. Subsequent Events
Disposition
In February 2019, MAALP closed on the disposition of a
0.4
acre land parcel located in the Atlanta, Georgia market, resulting in a net gain of
$9.0 million
on the sale of non-depreciable real estate assets recognized in the first quarter of 2019.
Financing
In February 2019, MAALP entered into a
$191.3 million
secured property mortgage with a fixed rate of
4.43%
, maturing in February 2049.
F-37
Mid-America Apartment Communities, Inc. and Mid-America Apartments, L.P.
Schedule III - Real Estate and Accumulated Depreciation
December 31, 2018
(Dollars in thousands)
|
Initial Cost
|
Costs Capitalized Subsequent to Acquisition
|
Gross Amount carried as of December 31, 2018
|
|||||||||||||||||||||||||||||||||||||||||||
|
Property
|
Location
|
Encumbrances
|
|
Land
|
Buildings and Fixtures
|
Land
|
Buildings and Fixtures
|
Land
|
Buildings and Fixtures
|
Total
(3)
|
Accumulated Depreciation
(4)
|
Net
|
Date of Construction
|
Date Acquired
|
|||||||||||||||||||||||||||||||
|
Birchall at Ross Bridge
|
Birmingham, AL
|
—
|
|
$
|
2,640
|
|
$
|
28,842
|
|
$
|
—
|
|
$
|
1,619
|
|
$
|
2,640
|
|
$
|
30,463
|
|
$
|
33,103
|
|
$
|
(7,815
|
)
|
$
|
25,288
|
|
2009
|
2011
|
|||||||||||||
|
Colonial Grand at Riverchase Trails
|
Birmingham, AL
|
—
|
|
3,761
|
|
22,079
|
|
—
|
|
3,875
|
|
3,761
|
|
25,954
|
|
29,715
|
|
(6,747
|
)
|
22,968
|
|
2010
|
2013
|
||||||||||||||||||||||
|
Colonial Village at Trussville
|
Birmingham, AL
|
—
|
|
3,402
|
|
31,813
|
|
—
|
|
2,878
|
|
3,402
|
|
34,691
|
|
38,093
|
|
(8,256
|
)
|
29,837
|
|
1996/97
|
2013
|
||||||||||||||||||||||
|
Eagle Ridge
|
Birmingham, AL
|
—
|
|
851
|
|
7,667
|
|
—
|
|
4,467
|
|
851
|
|
12,134
|
|
12,985
|
|
(7,908
|
)
|
5,077
|
|
1986
|
1998
|
||||||||||||||||||||||
|
Colonial Grand at Traditions
|
Gulf Shores,AL
|
—
|
|
3,211
|
|
25,162
|
|
—
|
|
2,589
|
|
3,211
|
|
27,751
|
|
30,962
|
|
(7,063
|
)
|
23,899
|
|
2007
|
2013
|
||||||||||||||||||||||
|
Colonial Grand at Edgewater
|
Huntsville, AL
|
—
|
|
4,943
|
|
38,673
|
|
—
|
|
4,374
|
|
4,943
|
|
43,047
|
|
47,990
|
|
(9,439
|
)
|
38,551
|
|
1990
|
2013
|
||||||||||||||||||||||
|
Paddock Club at Providence
|
Huntsville, AL
|
—
|
|
909
|
|
10,152
|
|
830
|
|
14,269
|
|
1,739
|
|
24,421
|
|
26,160
|
|
(14,497
|
)
|
11,663
|
|
1993
|
1997
|
||||||||||||||||||||||
|
Colonial Grand at Madison
|
Madison, AL
|
—
|
|
3,601
|
|
28,934
|
|
—
|
|
1,653
|
|
3,601
|
|
30,587
|
|
34,188
|
|
(7,467
|
)
|
26,721
|
|
2000
|
2013
|
||||||||||||||||||||||
|
Cypress Village
|
Orange Beach, AL
|
—
|
|
1,290
|
|
12,238
|
|
—
|
|
1,790
|
|
1,290
|
|
14,028
|
|
15,318
|
|
(3,117
|
)
|
12,201
|
|
2008
|
2013
|
||||||||||||||||||||||
|
Colonial Grand at Liberty Park
|
Vestavia Hills, AL
|
—
|
|
3,922
|
|
30,977
|
|
—
|
|
5,387
|
|
3,922
|
|
36,364
|
|
40,286
|
|
(8,819
|
)
|
31,467
|
|
2000
|
2013
|
||||||||||||||||||||||
|
Edge at Lyon's Gate
|
Phoenix, AZ
|
—
|
|
7,901
|
|
27,182
|
|
—
|
|
2,930
|
|
7,901
|
|
30,112
|
|
38,013
|
|
(10,854
|
)
|
27,159
|
|
2007
|
2008
|
||||||||||||||||||||||
|
Residences at Fountainhead
|
Phoenix, AZ
|
—
|
|
12,212
|
|
56,705
|
|
—
|
|
921
|
|
12,212
|
|
57,626
|
|
69,838
|
|
(4,515
|
)
|
65,323
|
|
2015
|
2016
|
||||||||||||||||||||||
|
Sky View Ranch
|
Gilbert, AZ
|
—
|
|
2,668
|
|
14,577
|
|
—
|
|
2,336
|
|
2,668
|
|
16,913
|
|
19,581
|
|
(5,888
|
)
|
13,693
|
|
2007
|
2009
|
||||||||||||||||||||||
|
Talus Ranch
|
Phoenix, AZ
|
—
|
|
12,741
|
|
47,701
|
|
—
|
|
3,879
|
|
12,741
|
|
51,580
|
|
64,321
|
|
(21,278
|
)
|
43,043
|
|
2005
|
2006
|
||||||||||||||||||||||
|
Colonial Grand at Inverness Commons
|
Mesa, AZ
|
—
|
|
4,219
|
|
26,255
|
|
—
|
|
1,755
|
|
4,219
|
|
28,010
|
|
32,229
|
|
(6,523
|
)
|
25,706
|
|
2002
|
2013
|
||||||||||||||||||||||
|
Colonial Grand at Scottsdale
|
Scottsdale, AZ
|
—
|
|
3,612
|
|
20,273
|
|
—
|
|
2,192
|
|
3,612
|
|
22,465
|
|
26,077
|
|
(5,301
|
)
|
20,776
|
|
1999
|
2013
|
||||||||||||||||||||||
|
Colonial Grand at OldTown Scottsdale
|
Scottsdale, AZ
|
—
|
|
7,820
|
|
51,627
|
|
—
|
|
4,843
|
|
7,820
|
|
56,470
|
|
64,290
|
|
(12,886
|
)
|
51,404
|
|
1994/95
|
2013
|
||||||||||||||||||||||
|
SkySong
|
Scottsdale, AZ
|
—
|
|
—
|
|
55,748
|
|
—
|
|
1,602
|
|
—
|
|
57,350
|
|
57,350
|
|
(5,419
|
)
|
51,931
|
|
2014
|
2015
|
||||||||||||||||||||||
|
Calais Forest
|
Little Rock, AR
|
—
|
|
1,026
|
|
9,244
|
|
—
|
|
7,894
|
|
1,026
|
|
17,138
|
|
18,164
|
|
(11,927
|
)
|
6,237
|
|
1987
|
1994
|
||||||||||||||||||||||
|
Napa Valley
|
Little Rock, AR
|
—
|
|
960
|
|
8,642
|
|
—
|
|
5,702
|
|
960
|
|
14,344
|
|
15,304
|
|
(9,664
|
)
|
5,640
|
|
1984
|
1996
|
||||||||||||||||||||||
|
Palisades at Chenal Valley
|
Little Rock, AR
|
—
|
|
2,560
|
|
25,234
|
|
—
|
|
3,804
|
|
2,560
|
|
29,038
|
|
31,598
|
|
(7,613
|
)
|
23,985
|
|
2006
|
2011
|
||||||||||||||||||||||
|
Ridge at Chenal Valley
|
Little Rock, AR
|
—
|
|
2,626
|
|
—
|
|
—
|
|
28,104
|
|
2,626
|
|
28,104
|
|
30,730
|
|
(4,795
|
)
|
25,935
|
|
2012
|
2011
|
||||||||||||||||||||||
|
Westside Creek
|
Little Rock, AR
|
—
|
|
1,271
|
|
11,463
|
|
—
|
|
8,605
|
|
1,271
|
|
20,068
|
|
21,339
|
|
(13,058
|
)
|
8,281
|
|
1984/86
|
1997
|
||||||||||||||||||||||
|
Sync 36 I
|
Denver, CO
|
—
|
|
18,887
|
|
81,317
|
|
134
|
|
4,397
|
|
19,021
|
|
85,714
|
|
104,735
|
|
(1,670
|
)
|
103,065
|
|
2017
|
2018
|
||||||||||||||||||||||
|
Post River North
|
Denver, CO
|
—
|
|
14,500
|
|
28,900
|
|
—
|
|
44,157
|
|
14,500
|
|
73,057
|
|
87,557
|
|
(2,527
|
)
|
85,030
|
|
2018
|
2016
|
||||||||||||||||||||||
|
Tiffany Oaks
|
Altamonte Springs, FL
|
—
|
|
1,024
|
|
9,219
|
|
—
|
|
5,608
|
|
1,024
|
|
14,827
|
|
15,851
|
|
(10,235
|
)
|
5,616
|
|
1985
|
1996
|
||||||||||||||||||||||
|
Indigo Point
|
Brandon, FL
|
—
|
|
1,167
|
|
10,500
|
|
—
|
|
3,985
|
|
1,167
|
|
14,485
|
|
15,652
|
|
(9,125
|
)
|
6,527
|
|
1989
|
2000
|
||||||||||||||||||||||
|
Paddock Club Brandon
|
Brandon, FL
|
—
|
|
2,896
|
|
26,111
|
|
—
|
|
6,690
|
|
2,896
|
|
32,801
|
|
35,697
|
|
(20,855
|
)
|
14,842
|
|
1998
|
1997
|
||||||||||||||||||||||
|
Colonial Grand at Lakewood Ranch
|
Bradenton, FL
|
—
|
|
2,980
|
|
40,230
|
|
—
|
|
3,618
|
|
2,980
|
|
43,848
|
|
46,828
|
|
(9,961
|
)
|
36,867
|
|
1999
|
2013
|
||||||||||||||||||||||
|
The Preserve at Coral Square
|
Coral Springs, FL
|
—
|
|
9,600
|
|
40,004
|
|
—
|
|
11,089
|
|
9,600
|
|
51,093
|
|
60,693
|
|
(24,698
|
)
|
35,995
|
|
1996
|
2004
|
||||||||||||||||||||||
|
Paddock Club Gainesville
|
Gainesville, FL
|
—
|
|
1,800
|
|
15,879
|
|
—
|
|
5,081
|
|
1,800
|
|
20,960
|
|
22,760
|
|
(10,315
|
)
|
12,445
|
|
1999
|
1998
|
||||||||||||||||||||||
|
The Retreat at Magnolia Park
|
Gainesville, FL
|
—
|
|
2,040
|
|
16,338
|
|
—
|
|
876
|
|
2,040
|
|
17,214
|
|
19,254
|
|
(4,568
|
)
|
14,686
|
|
2009
|
2011
|
||||||||||||||||||||||
|
Colonial Grand at Heathrow
|
Heathrow, FL
|
—
|
|
4,101
|
|
35,684
|
|
—
|
|
3,296
|
|
4,101
|
|
38,980
|
|
43,081
|
|
(9,198
|
)
|
33,883
|
|
1997
|
2013
|
||||||||||||||||||||||
|
220 Riverside
|
Jacksonville, FL
|
—
|
|
2,500
|
|
38,416
|
|
—
|
|
3,847
|
|
2,500
|
|
42,263
|
|
44,763
|
|
(3,494
|
)
|
41,269
|
|
2015
|
2012
|
||||||||||||||||||||||
|
Atlantic Crossing
|
Jacksonville, FL
|
—
|
|
4,000
|
|
19,495
|
|
—
|
|
1,759
|
|
4,000
|
|
21,254
|
|
25,254
|
|
(5,820
|
)
|
19,434
|
|
2008
|
2011
|
||||||||||||||||||||||
|
Cooper's Hawk
|
Jacksonville, FL
|
—
|
|
854
|
|
7,500
|
|
—
|
|
3,890
|
|
854
|
|
11,390
|
|
12,244
|
|
(8,391
|
)
|
3,853
|
|
1987
|
1995
|
||||||||||||||||||||||
|
Hunter's Ridge at Deerwood
|
Jacksonville, FL
|
—
|
|
1,533
|
|
13,835
|
|
—
|
|
5,957
|
|
1,533
|
|
19,792
|
|
21,325
|
|
(13,275
|
)
|
8,050
|
|
1987
|
1997
|
||||||||||||||||||||||
|
Lakeside
|
Jacksonville, FL
|
—
|
|
1,430
|
|
12,883
|
|
—
|
|
8,445
|
|
1,430
|
|
21,328
|
|
22,758
|
|
(15,455
|
)
|
7,303
|
|
1985
|
1996
|
||||||||||||||||||||||
|
Lighthouse at Fleming Island
|
Jacksonville, FL
|
—
|
|
4,047
|
|
35,052
|
|
—
|
|
5,515
|
|
4,047
|
|
40,567
|
|
44,614
|
|
(21,171
|
)
|
23,443
|
|
2003
|
2003
|
||||||||||||||||||||||
|
Paddock Club Mandarin
|
Jacksonville, FL
|
—
|
|
1,411
|
|
14,967
|
|
—
|
|
3,190
|
|
1,411
|
|
18,157
|
|
19,568
|
|
(9,523
|
)
|
10,045
|
|
1998
|
1998
|
||||||||||||||||||||||
|
St. Augustine
|
Jacksonville, FL
|
—
|
|
2,857
|
|
6,475
|
|
—
|
|
19,937
|
|
2,857
|
|
26,412
|
|
29,269
|
|
(13,080
|
)
|
16,189
|
|
1987/ 2008
|
1995
|
||||||||||||||||||||||
|
Tattersall at Tapestry Park
|
Jacksonville, FL
|
—
|
|
6,417
|
|
36,069
|
|
—
|
|
1,336
|
|
6,417
|
|
37,405
|
|
43,822
|
|
(9,701
|
)
|
34,121
|
|
2009
|
2011
|
||||||||||||||||||||||
|
Woodhollow
|
Jacksonville, FL
|
—
|
|
1,686
|
|
15,179
|
|
(8
|
)
|
9,049
|
|
1,678
|
|
24,228
|
|
25,906
|
|
(17,118
|
)
|
8,788
|
|
1986
|
1997
|
||||||||||||||||||||||
|
Colonial Grand at Town Park
|
Lake Mary, FL
|
—
|
|
5,742
|
|
56,562
|
|
—
|
|
4,208
|
|
5,742
|
|
60,770
|
|
66,512
|
|
(14,774
|
)
|
51,738
|
|
2005
|
2013
|
||||||||||||||||||||||
|
Colonial Grand at Town Park Reserve
|
Lake Mary, FL
|
—
|
|
3,481
|
|
10,311
|
|
—
|
|
415
|
|
3,481
|
|
10,726
|
|
14,207
|
|
(2,657
|
)
|
11,550
|
|
2004
|
2013
|
||||||||||||||||||||||
|
Colonial Grand at Lake Mary
|
Lake Mary, FL
|
—
|
|
(1)
|
6,346
|
|
41,539
|
|
—
|
|
23,290
|
|
6,346
|
|
64,829
|
|
71,175
|
|
(11,864
|
)
|
59,311
|
|
2012
|
2013
|
|||||||||||||||||||||
|
Colonial Grand at Randal Lakes
|
Orlando, FL
|
—
|
|
5,659
|
|
50,553
|
|
—
|
|
10,940
|
|
5,659
|
|
61,493
|
|
67,152
|
|
(7,653
|
)
|
59,499
|
|
2013
|
2013
|
||||||||||||||||||||||
|
Colonial Grand at Randal Lakes II
|
Orlando, FL
|
—
|
|
3,200
|
|
—
|
|
—
|
|
36,775
|
|
3,200
|
|
36,775
|
|
39,975
|
|
(1,903
|
)
|
38,072
|
|
2013
|
2013
|
||||||||||||||||||||||
|
Retreat at Lake Nona
|
Orlando, FL
|
—
|
|
7,880
|
|
41,175
|
|
—
|
|
4,720
|
|
7,880
|
|
45,895
|
|
53,775
|
|
(10,388
|
)
|
43,387
|
|
2006
|
2012
|
||||||||||||||||||||||
|
Colonial Grand at Heather Glen
|
Orlando, FL
|
—
|
|
4,662
|
|
56,988
|
|
—
|
|
5,547
|
|
4,662
|
|
62,535
|
|
67,197
|
|
(14,061
|
)
|
53,136
|
|
2000
|
2013
|
||||||||||||||||||||||
|
Post Lake at Baldwin Park
|
Orlando, FL
|
—
|
|
18,101
|
|
144,200
|
|
—
|
|
1,747
|
|
18,101
|
|
145,947
|
|
164,048
|
|
(12,134
|
)
|
151,914
|
|
2011
|
2016
|
||||||||||||||||||||||
|
Post Lakeside
|
Orlando, FL
|
—
|
|
7,046
|
|
52,585
|
|
—
|
|
363
|
|
7,046
|
|
52,948
|
|
59,994
|
|
(4,058
|
)
|
55,936
|
|
2013
|
2016
|
||||||||||||||||||||||
|
Post Parkside
|
Orlando, FL
|
—
|
|
5,669
|
|
49,754
|
|
—
|
|
2,399
|
|
5,669
|
|
52,153
|
|
57,822
|
|
(4,332
|
)
|
53,490
|
|
1999
|
2016
|
||||||||||||||||||||||
|
Park Crest at Innisbrook
|
Palm Harbor, FL
|
26,483
|
|
6,900
|
|
26,613
|
|
—
|
|
2,858
|
|
6,900
|
|
29,471
|
|
36,371
|
|
(10,455
|
)
|
25,916
|
|
2000
|
2009
|
||||||||||||||||||||||
|
The Club at Panama Beach
|
Panama City, FL
|
—
|
|
898
|
|
14,276
|
|
(5
|
)
|
3,996
|
|
893
|
|
18,272
|
|
19,165
|
|
(10,384
|
)
|
8,781
|
|
2000
|
1998
|
||||||||||||||||||||||
|
Colonial Village at Twin Lakes
|
Sanford, FL
|
22,778
|
|
3,091
|
|
47,793
|
|
—
|
|
2,329
|
|
3,091
|
|
50,122
|
|
53,213
|
|
(11,617
|
)
|
41,596
|
|
2005
|
2013
|
||||||||||||||||||||||
F-38
|
Initial Cost
|
Costs Capitalized Subsequent to Acquisition
|
Gross Amount carried as of December 31, 2018
|
|||||||||||||||||||||||||||||||||||||||||||
|
Property
|
Location
|
Encumbrances
|
|
Land
|
Buildings and Fixtures
|
Land
|
Buildings and Fixtures
|
Land
|
Buildings and Fixtures
|
Total
(3)
|
Accumulated Depreciation
(4)
|
Net
|
Date of Construction
|
Date Acquired
|
|||||||||||||||||||||||||||||||
|
Paddock Club Tallahassee
|
Tallahassee, FL
|
—
|
|
530
|
|
4,805
|
|
950
|
|
14,783
|
|
1,480
|
|
19,588
|
|
21,068
|
|
(13,247
|
)
|
7,821
|
|
1992
|
1997
|
||||||||||||||||||||||
|
Verandas at Southwood
|
Tallahassee, FL
|
—
|
|
3,600
|
|
25,914
|
|
—
|
|
1,108
|
|
3,600
|
|
27,022
|
|
30,622
|
|
(4,260
|
)
|
26,362
|
|
2003
|
2011
|
||||||||||||||||||||||
|
Belmere
|
Tampa, FL
|
—
|
|
852
|
|
7,667
|
|
—
|
|
7,172
|
|
852
|
|
14,839
|
|
15,691
|
|
(10,394
|
)
|
5,297
|
|
1984
|
1994
|
||||||||||||||||||||||
|
Links at Carrollwood
|
Tampa, FL
|
—
|
|
817
|
|
7,355
|
|
110
|
|
5,753
|
|
927
|
|
13,108
|
|
14,035
|
|
(8,528
|
)
|
5,507
|
|
1980
|
1998
|
||||||||||||||||||||||
|
Post Bay at Rocky Point
|
Tampa, FL
|
—
|
|
4,541
|
|
28,381
|
|
—
|
|
1,017
|
|
4,541
|
|
29,398
|
|
33,939
|
|
(2,378
|
)
|
31,561
|
|
1997
|
2016
|
||||||||||||||||||||||
|
Post Harbour Place
|
Tampa, FL
|
—
|
|
16,296
|
|
116,193
|
|
—
|
|
5,422
|
|
16,296
|
|
121,615
|
|
137,911
|
|
(10,385
|
)
|
127,526
|
|
1997
|
2016
|
||||||||||||||||||||||
|
Post Hyde Park
|
Tampa, FL
|
—
|
|
16,891
|
|
95,259
|
|
—
|
|
3,230
|
|
16,891
|
|
98,489
|
|
115,380
|
|
(8,415
|
)
|
106,965
|
|
1994
|
2016
|
||||||||||||||||||||||
|
Post Rocky Point
|
Tampa, FL
|
—
|
|
35,260
|
|
153,102
|
|
—
|
|
6,858
|
|
35,260
|
|
159,960
|
|
195,220
|
|
(13,220
|
)
|
182,000
|
|
1994-1996
|
2016
|
||||||||||||||||||||||
|
Post Soho Square
|
Tampa, FL
|
—
|
|
5,190
|
|
56,296
|
|
—
|
|
204
|
|
5,190
|
|
56,500
|
|
61,690
|
|
(4,290
|
)
|
57,400
|
|
2012
|
2016
|
||||||||||||||||||||||
|
Village Oaks
|
Tampa, FL
|
—
|
|
2,738
|
|
19,055
|
|
153
|
|
2,619
|
|
2,891
|
|
21,674
|
|
24,565
|
|
(7,809
|
)
|
16,756
|
|
2005
|
2008
|
||||||||||||||||||||||
|
Colonial Grand at Hampton Preserve
|
Tampa, FL
|
—
|
|
6,233
|
|
69,535
|
|
—
|
|
1,595
|
|
6,233
|
|
71,130
|
|
77,363
|
|
(15,289
|
)
|
62,074
|
|
2012
|
2013
|
||||||||||||||||||||||
|
Colonial Grand at Seven Oaks
|
Wesley Chapel, FL
|
—
|
|
3,051
|
|
42,768
|
|
—
|
|
2,611
|
|
3,051
|
|
45,379
|
|
48,430
|
|
(9,952
|
)
|
38,478
|
|
2004
|
2013
|
||||||||||||||||||||||
|
Colonial Grand at Windermere
|
Windermere, FL
|
—
|
|
2,711
|
|
36,710
|
|
—
|
|
1,197
|
|
2,711
|
|
37,907
|
|
40,618
|
|
(8,096
|
)
|
32,522
|
|
2009
|
2013
|
||||||||||||||||||||||
|
Allure at Brookwood
|
Atlanta, GA
|
—
|
|
(1)
|
11,168
|
|
52,758
|
|
—
|
|
4,800
|
|
11,168
|
|
57,558
|
|
68,726
|
|
(13,286
|
)
|
55,440
|
|
2008
|
2012
|
|||||||||||||||||||||
|
Allure in Buckhead Village
|
Atlanta, GA
|
—
|
|
8,633
|
|
19,844
|
|
—
|
|
6,289
|
|
8,633
|
|
26,133
|
|
34,766
|
|
(7,187
|
)
|
27,579
|
|
2002
|
2012
|
||||||||||||||||||||||
|
The High Rise at Post Alexander
|
Atlanta, GA
|
—
|
|
8,435
|
|
92,294
|
|
—
|
|
152
|
|
8,435
|
|
92,446
|
|
100,881
|
|
(10,258
|
)
|
90,623
|
|
2015
|
2016
|
||||||||||||||||||||||
|
Post Alexander
|
Atlanta, GA
|
—
|
|
15,440
|
|
73,278
|
|
—
|
|
1,628
|
|
15,440
|
|
74,906
|
|
90,346
|
|
(4,920
|
)
|
85,426
|
|
2006
|
2016
|
||||||||||||||||||||||
|
Post Briarcliff
|
Atlanta, GA
|
—
|
|
24,645
|
|
114,921
|
|
—
|
|
2,783
|
|
24,645
|
|
117,704
|
|
142,349
|
|
(9,380
|
)
|
132,969
|
|
1996
|
2016
|
||||||||||||||||||||||
|
Post Brookhaven
|
Atlanta, GA
|
—
|
|
29,048
|
|
106,463
|
|
—
|
|
5,284
|
|
29,048
|
|
111,747
|
|
140,795
|
|
(9,425
|
)
|
131,370
|
|
1989/92
|
2016
|
||||||||||||||||||||||
|
Post Chastain
|
Atlanta, GA
|
—
|
|
30,223
|
|
82,964
|
|
—
|
|
1,638
|
|
30,223
|
|
84,602
|
|
114,825
|
|
(6,721
|
)
|
108,104
|
|
1990
|
2016
|
||||||||||||||||||||||
|
Post Crossing
|
Atlanta, GA
|
—
|
|
15,799
|
|
48,054
|
|
—
|
|
1,738
|
|
15,799
|
|
49,792
|
|
65,591
|
|
(4,113
|
)
|
61,478
|
|
1995
|
2016
|
||||||||||||||||||||||
|
Post Gardens
|
Atlanta, GA
|
—
|
|
17,907
|
|
56,093
|
|
—
|
|
2,385
|
|
17,907
|
|
58,478
|
|
76,385
|
|
(5,019
|
)
|
71,366
|
|
1996
|
2016
|
||||||||||||||||||||||
|
Post Glen
|
Atlanta, GA
|
—
|
|
13,878
|
|
51,079
|
|
—
|
|
2,657
|
|
13,878
|
|
53,736
|
|
67,614
|
|
(4,328
|
)
|
63,286
|
|
1996
|
2016
|
||||||||||||||||||||||
|
Post Midtown
|
Atlanta, GA
|
—
|
|
7,000
|
|
44,000
|
|
—
|
|
39,882
|
|
7,000
|
|
83,882
|
|
90,882
|
|
(3,294
|
)
|
87,588
|
|
2017
|
2016
|
||||||||||||||||||||||
|
Post Parkside
|
Atlanta, GA
|
—
|
|
11,025
|
|
34,277
|
|
—
|
|
999
|
|
11,025
|
|
35,276
|
|
46,301
|
|
(2,689
|
)
|
43,612
|
|
1999
|
2016
|
||||||||||||||||||||||
|
Post Peachtree Hills
|
Atlanta, GA
|
—
|
|
11,974
|
|
55,264
|
|
—
|
|
351
|
|
11,974
|
|
55,615
|
|
67,589
|
|
(4,356
|
)
|
63,233
|
|
1992-1994/2009
|
2016
|
||||||||||||||||||||||
|
Post Riverside
|
Atlanta, GA
|
—
|
|
23,765
|
|
89,369
|
|
—
|
|
4,108
|
|
23,765
|
|
93,477
|
|
117,242
|
|
(8,384
|
)
|
108,858
|
|
1996
|
2016
|
||||||||||||||||||||||
|
Post Spring
|
Atlanta, GA
|
—
|
|
18,596
|
|
57,819
|
|
—
|
|
2,412
|
|
18,596
|
|
60,231
|
|
78,827
|
|
(5,262
|
)
|
73,565
|
|
1999
|
2016
|
||||||||||||||||||||||
|
Post Stratford
|
Atlanta, GA
|
—
|
|
—
|
|
30,051
|
|
—
|
|
2,091
|
|
—
|
|
32,142
|
|
32,142
|
|
(2,793
|
)
|
29,349
|
|
1999
|
2016
|
||||||||||||||||||||||
|
Sanctuary at Oglethorpe
|
Atlanta, GA
|
—
|
|
6,875
|
|
31,441
|
|
—
|
|
5,512
|
|
6,875
|
|
36,953
|
|
43,828
|
|
(13,085
|
)
|
30,743
|
|
1994
|
2008
|
||||||||||||||||||||||
|
Post Centennial Park
|
Atlanta, GA
|
—
|
|
13,650
|
|
10,950
|
|
—
|
|
61,120
|
|
13,650
|
|
72,070
|
|
85,720
|
|
(1,344
|
)
|
84,376
|
|
2018
|
2016
|
||||||||||||||||||||||
|
Prescott
|
Duluth, GA
|
—
|
|
(2)
|
3,840
|
|
24,011
|
|
—
|
|
4,565
|
|
3,840
|
|
28,576
|
|
32,416
|
|
(13,745
|
)
|
18,671
|
|
2001
|
2004
|
|||||||||||||||||||||
|
Colonial Grand at Berkeley Lake
|
Duluth, GA
|
—
|
|
1,960
|
|
15,707
|
|
—
|
|
2,080
|
|
1,960
|
|
17,787
|
|
19,747
|
|
(4,889
|
)
|
14,858
|
|
1998
|
2013
|
||||||||||||||||||||||
|
Colonial Grand at River Oaks
|
Duluth, GA
|
—
|
|
4,360
|
|
13,579
|
|
—
|
|
1,952
|
|
4,360
|
|
15,531
|
|
19,891
|
|
(5,275
|
)
|
14,616
|
|
1992
|
2013
|
||||||||||||||||||||||
|
Colonial Grand at River Plantation
|
Duluth, GA
|
—
|
|
2,059
|
|
19,158
|
|
—
|
|
2,051
|
|
2,059
|
|
21,209
|
|
23,268
|
|
(5,773
|
)
|
17,495
|
|
1994
|
2013
|
||||||||||||||||||||||
|
Colonial Grand at McDaniel Farm
|
Duluth, GA
|
—
|
|
3,985
|
|
32,206
|
|
—
|
|
3,951
|
|
3,985
|
|
36,157
|
|
40,142
|
|
(9,744
|
)
|
30,398
|
|
1997
|
2013
|
||||||||||||||||||||||
|
Colonial Grand at Pleasant Hill
|
Duluth, GA
|
—
|
|
6,753
|
|
32,202
|
|
—
|
|
4,304
|
|
6,753
|
|
36,506
|
|
43,259
|
|
(9,415
|
)
|
33,844
|
|
1996
|
2013
|
||||||||||||||||||||||
|
Colonial Grand at Mount Vernon
|
Dunwoody, GA
|
—
|
|
6,861
|
|
23,748
|
|
—
|
|
3,342
|
|
6,861
|
|
27,090
|
|
33,951
|
|
(6,144
|
)
|
27,807
|
|
1997
|
2013
|
||||||||||||||||||||||
|
Lake Lanier Club
|
Gainesville, GA
|
—
|
|
(2)
|
6,710
|
|
40,994
|
|
—
|
|
8,419
|
|
6,710
|
|
49,413
|
|
56,123
|
|
(23,407
|
)
|
32,716
|
|
1998/2001
|
2005
|
|||||||||||||||||||||
|
Colonial Grand at Shiloh
|
Kennesaw, GA
|
—
|
|
4,864
|
|
45,893
|
|
—
|
|
4,098
|
|
4,864
|
|
49,991
|
|
54,855
|
|
(12,220
|
)
|
42,635
|
|
2002
|
2013
|
||||||||||||||||||||||
|
Millstead Village
|
LaGrange, GA
|
—
|
|
3,100
|
|
29,240
|
|
—
|
|
1,263
|
|
3,100
|
|
30,503
|
|
33,603
|
|
(6,527
|
)
|
27,076
|
|
1998
|
2008
|
||||||||||||||||||||||
|
Colonial Grand at Barrett Creek
|
Marietta, GA
|
—
|
|
5,661
|
|
26,186
|
|
—
|
|
2,932
|
|
5,661
|
|
29,118
|
|
34,779
|
|
(8,050
|
)
|
26,729
|
|
1999
|
2013
|
||||||||||||||||||||||
|
Colonial Grand at Godley Station
|
Pooler, GA
|
9,028
|
|
1,800
|
|
35,454
|
|
—
|
|
3,484
|
|
1,800
|
|
38,938
|
|
40,738
|
|
(8,635
|
)
|
32,103
|
|
2001
|
2013
|
||||||||||||||||||||||
|
Colonial Grand at Godley Lake
|
Pooler, GA
|
—
|
|
1,750
|
|
30,893
|
|
—
|
|
1,249
|
|
1,750
|
|
32,142
|
|
33,892
|
|
(7,473
|
)
|
26,419
|
|
2008
|
2013
|
||||||||||||||||||||||
|
Avala at Savannah Quarters
|
Savannah, GA
|
—
|
|
1,500
|
|
24,862
|
|
—
|
|
2,046
|
|
1,500
|
|
26,908
|
|
28,408
|
|
(6,972
|
)
|
21,436
|
|
2009
|
2011
|
||||||||||||||||||||||
|
Georgetown Grove
|
Savannah, GA
|
—
|
|
1,288
|
|
11,579
|
|
—
|
|
3,693
|
|
1,288
|
|
15,272
|
|
16,560
|
|
(10,078
|
)
|
6,482
|
|
1997
|
1998
|
||||||||||||||||||||||
|
Colonial Grand at Hammocks
|
Savannah, GA
|
—
|
|
2,441
|
|
36,863
|
|
—
|
|
4,338
|
|
2,441
|
|
41,201
|
|
43,642
|
|
(9,202
|
)
|
34,440
|
|
1997
|
2013
|
||||||||||||||||||||||
|
Colonial Village at Greentree
|
Savannah, GA
|
—
|
|
1,710
|
|
10,494
|
|
—
|
|
1,739
|
|
1,710
|
|
12,233
|
|
13,943
|
|
(3,430
|
)
|
10,513
|
|
1984
|
2013
|
||||||||||||||||||||||
|
Colonial Village at Huntington
|
Savannah, GA
|
—
|
|
2,521
|
|
8,223
|
|
—
|
|
1,276
|
|
2,521
|
|
9,499
|
|
12,020
|
|
(2,374
|
)
|
9,646
|
|
1986
|
2013
|
||||||||||||||||||||||
|
Colonial Village at Marsh Cove
|
Savannah, GA
|
—
|
|
5,231
|
|
8,555
|
|
—
|
|
1,373
|
|
5,231
|
|
9,928
|
|
15,159
|
|
(2,876
|
)
|
12,283
|
|
1983
|
2013
|
||||||||||||||||||||||
|
Oaks at Wilmington Island
|
Savannah, GA
|
—
|
|
2,910
|
|
25,315
|
|
(46
|
)
|
4,733
|
|
2,864
|
|
30,048
|
|
32,912
|
|
(12,626
|
)
|
20,286
|
|
1999
|
2006
|
||||||||||||||||||||||
|
Highlands of West Village
|
Smyrna, GA
|
—
|
|
14,410
|
|
73,733
|
|
—
|
|
7,056
|
|
14,410
|
|
80,789
|
|
95,199
|
|
(12,206
|
)
|
82,993
|
|
2006/12
|
2014
|
||||||||||||||||||||||
|
Haven at Prairie Trace
|
Overland Park, KS
|
—
|
|
3,500
|
|
40,614
|
|
—
|
|
1,228
|
|
3,500
|
|
41,842
|
|
45,342
|
|
(3,862
|
)
|
41,480
|
|
2015
|
2015
|
||||||||||||||||||||||
|
Grand Reserve at Pinnacle
|
Lexington, KY
|
—
|
|
2,024
|
|
31,525
|
|
—
|
|
5,875
|
|
2,024
|
|
37,400
|
|
39,424
|
|
(18,490
|
)
|
20,934
|
|
2000
|
1998
|
||||||||||||||||||||||
|
Lakepointe
|
Lexington, KY
|
—
|
|
411
|
|
3,699
|
|
—
|
|
2,707
|
|
411
|
|
6,406
|
|
6,817
|
|
(4,737
|
)
|
2,080
|
|
1986
|
1994
|
||||||||||||||||||||||
|
The Mansion
|
Lexington, KY
|
—
|
|
694
|
|
6,242
|
|
—
|
|
3,887
|
|
694
|
|
10,129
|
|
10,823
|
|
(7,501
|
)
|
3,322
|
|
1989
|
1994
|
||||||||||||||||||||||
|
The Village
|
Lexington, KY
|
—
|
|
900
|
|
8,097
|
|
—
|
|
4,776
|
|
900
|
|
12,873
|
|
13,773
|
|
(9,579
|
)
|
4,194
|
|
1989
|
1994
|
||||||||||||||||||||||
|
Stonemill Village
|
Louisville, KY
|
—
|
|
1,169
|
|
10,518
|
|
—
|
|
9,830
|
|
1,169
|
|
20,348
|
|
21,517
|
|
(14,568
|
)
|
6,949
|
|
1985
|
1994
|
||||||||||||||||||||||
|
Crosswinds
|
Jackson, MS
|
—
|
|
1,535
|
|
13,826
|
|
—
|
|
5,735
|
|
1,535
|
|
19,561
|
|
21,096
|
|
(13,735
|
)
|
7,361
|
|
1989
|
1996
|
||||||||||||||||||||||
|
Pear Orchard
|
Jackson, MS
|
—
|
|
1,351
|
|
12,168
|
|
—
|
|
8,855
|
|
1,351
|
|
21,023
|
|
22,374
|
|
(15,488
|
)
|
6,886
|
|
1985
|
1994
|
||||||||||||||||||||||
|
Reflection Pointe
|
Jackson, MS
|
—
|
|
710
|
|
8,770
|
|
138
|
|
8,743
|
|
848
|
|
17,513
|
|
18,361
|
|
(12,444
|
)
|
5,917
|
|
1986
|
1988
|
||||||||||||||||||||||
|
Lakeshore Landing
|
Ridgeland, MS
|
—
|
|
676
|
|
6,284
|
|
—
|
|
3,647
|
|
676
|
|
9,931
|
|
10,607
|
|
(5,141
|
)
|
5,466
|
|
1974
|
1994
|
||||||||||||||||||||||
F-39
|
Initial Cost
|
Costs Capitalized Subsequent to Acquisition
|
Gross Amount carried as of December 31, 2018
|
|||||||||||||||||||||||||||||||||||||||||||
|
Property
|
Location
|
Encumbrances
|
|
Land
|
Buildings and Fixtures
|
Land
|
Buildings and Fixtures
|
Land
|
Buildings and Fixtures
|
Total
(3)
|
Accumulated Depreciation
(4)
|
Net
|
Date of Construction
|
Date Acquired
|
|||||||||||||||||||||||||||||||
|
Market Station
|
Kansas City, MO
|
—
|
|
5,814
|
|
46,241
|
|
—
|
|
2,309
|
|
5,814
|
|
48,550
|
|
54,364
|
|
(10,451
|
)
|
43,913
|
|
2010
|
2012
|
||||||||||||||||||||||
|
The Denton
|
Kansas City, MO
|
—
|
|
750
|
|
8,795
|
|
—
|
|
834
|
|
750
|
|
9,629
|
|
10,379
|
|
(716
|
)
|
9,663
|
|
2014
|
2015
|
||||||||||||||||||||||
|
The Denton II
|
Kansas City, MO
|
—
|
|
770
|
|
—
|
|
—
|
|
24,258
|
|
770
|
|
24,258
|
|
25,028
|
|
(695
|
)
|
24,333
|
|
2017
|
2015
|
||||||||||||||||||||||
|
The Denton III
|
Kansas City, MO
|
—
|
|
4,000
|
|
42,144
|
|
—
|
|
1,372
|
|
4,000
|
|
43,516
|
|
47,516
|
|
(4,530
|
)
|
42,986
|
|
2013/14
|
2015
|
||||||||||||||||||||||
|
Colonial Grand at Desert Vista
|
North Las Vegas, NV
|
—
|
|
4,091
|
|
29,826
|
|
—
|
|
1,534
|
|
4,091
|
|
31,360
|
|
35,451
|
|
(7,505
|
)
|
27,946
|
|
2009
|
2013
|
||||||||||||||||||||||
|
Colonial Grand at Palm Vista
|
North Las Vegas, NV
|
—
|
|
4,909
|
|
25,643
|
|
—
|
|
2,829
|
|
4,909
|
|
28,472
|
|
33,381
|
|
(7,116
|
)
|
26,265
|
|
2007
|
2013
|
||||||||||||||||||||||
|
Colonial Village at Beaver Creek
|
Apex, NC
|
—
|
|
7,491
|
|
34,863
|
|
—
|
|
2,160
|
|
7,491
|
|
37,023
|
|
44,514
|
|
(8,248
|
)
|
36,266
|
|
2007
|
2013
|
||||||||||||||||||||||
|
Hermitage at Beechtree
|
Cary, NC
|
—
|
|
900
|
|
8,099
|
|
—
|
|
5,086
|
|
900
|
|
13,185
|
|
14,085
|
|
(8,663
|
)
|
5,422
|
|
1988
|
1997
|
||||||||||||||||||||||
|
Waterford Forest
|
Cary, NC
|
—
|
|
(2)
|
4,000
|
|
20,250
|
|
—
|
|
3,893
|
|
4,000
|
|
24,143
|
|
28,143
|
|
(11,450
|
)
|
16,693
|
|
1996
|
2005
|
|||||||||||||||||||||
|
1225 South Church I
|
Charlotte, NC
|
—
|
|
9,612
|
|
22,342
|
|
—
|
|
27,932
|
|
9,612
|
|
50,274
|
|
59,886
|
|
(9,111
|
)
|
50,775
|
|
2010
|
2010
|
||||||||||||||||||||||
|
Colonial Grand at Ayrsley
|
Charlotte, NC
|
—
|
|
2,481
|
|
52,119
|
|
—
|
|
13,986
|
|
2,481
|
|
66,105
|
|
68,586
|
|
(13,604
|
)
|
54,982
|
|
2008
|
2013
|
||||||||||||||||||||||
|
Colonial Grand at Beverly Crest
|
Charlotte, NC
|
—
|
|
3,161
|
|
24,004
|
|
—
|
|
2,928
|
|
3,161
|
|
26,932
|
|
30,093
|
|
(6,125
|
)
|
23,968
|
|
1996
|
2013
|
||||||||||||||||||||||
|
Colonial Grand at Legacy Park
|
Charlotte, NC
|
—
|
|
2,891
|
|
28,272
|
|
—
|
|
2,267
|
|
2,891
|
|
30,539
|
|
33,430
|
|
(7,185
|
)
|
26,245
|
|
2001
|
2013
|
||||||||||||||||||||||
|
Colonial Grand at Mallard Creek
|
Charlotte, NC
|
—
|
|
4,591
|
|
27,713
|
|
—
|
|
1,813
|
|
4,591
|
|
29,526
|
|
34,117
|
|
(6,969
|
)
|
27,148
|
|
2005
|
2013
|
||||||||||||||||||||||
|
Colonial Grand at Mallard Lake
|
Charlotte, NC
|
—
|
|
3,250
|
|
31,389
|
|
—
|
|
4,003
|
|
3,250
|
|
35,392
|
|
38,642
|
|
(8,411
|
)
|
30,231
|
|
1998
|
2013
|
||||||||||||||||||||||
|
Colonial Grand at University Center
|
Charlotte, NC
|
—
|
|
1,620
|
|
17,499
|
|
—
|
|
826
|
|
1,620
|
|
18,325
|
|
19,945
|
|
(4,019
|
)
|
15,926
|
|
2005
|
2013
|
||||||||||||||||||||||
|
Colonial Reserve at South End
|
Charlotte, NC
|
—
|
|
4,628
|
|
44,282
|
|
—
|
|
11,654
|
|
4,628
|
|
55,936
|
|
60,564
|
|
(6,741
|
)
|
53,823
|
|
2013
|
2013
|
||||||||||||||||||||||
|
Colonial Village at Chancellor Park
|
Charlotte, NC
|
—
|
|
5,311
|
|
28,016
|
|
—
|
|
4,292
|
|
5,311
|
|
32,308
|
|
37,619
|
|
(7,298
|
)
|
30,321
|
|
1999
|
2013
|
||||||||||||||||||||||
|
Colonial Village at South Tryon
|
Charlotte, NC
|
—
|
|
2,260
|
|
19,489
|
|
—
|
|
1,953
|
|
2,260
|
|
21,442
|
|
23,702
|
|
(4,998
|
)
|
18,704
|
|
2002
|
2013
|
||||||||||||||||||||||
|
Colonial Village at Timber Crest
|
Charlotte, NC
|
—
|
|
2,901
|
|
17,192
|
|
—
|
|
2,416
|
|
2,901
|
|
19,608
|
|
22,509
|
|
(4,294
|
)
|
18,215
|
|
2000
|
2013
|
||||||||||||||||||||||
|
Enclave
|
Charlotte, NC
|
—
|
|
1,461
|
|
18,984
|
|
—
|
|
1,114
|
|
1,461
|
|
20,098
|
|
21,559
|
|
(3,988
|
)
|
17,571
|
|
2008
|
2013
|
||||||||||||||||||||||
|
Post Ballantyne
|
Charlotte, NC
|
—
|
|
16,216
|
|
44,817
|
|
—
|
|
2,063
|
|
16,216
|
|
46,880
|
|
63,096
|
|
(3,760
|
)
|
59,336
|
|
2004
|
2016
|
||||||||||||||||||||||
|
Post Gateway Place
|
Charlotte, NC
|
—
|
|
17,528
|
|
57,444
|
|
—
|
|
2,901
|
|
17,528
|
|
60,345
|
|
77,873
|
|
(5,223
|
)
|
72,650
|
|
2000
|
2016
|
||||||||||||||||||||||
|
Post Park at Phillips Place
|
Charlotte, NC
|
—
|
|
20,869
|
|
65,517
|
|
—
|
|
3,304
|
|
20,869
|
|
68,821
|
|
89,690
|
|
(5,683
|
)
|
84,007
|
|
1996
|
2016
|
||||||||||||||||||||||
|
Post South End
|
Charlotte, NC
|
—
|
|
18,835
|
|
58,795
|
|
—
|
|
1,488
|
|
18,835
|
|
60,283
|
|
79,118
|
|
(4,505
|
)
|
74,613
|
|
2009
|
2016
|
||||||||||||||||||||||
|
Post Uptown Place
|
Charlotte, NC
|
—
|
|
10,888
|
|
30,078
|
|
—
|
|
1,487
|
|
10,888
|
|
31,565
|
|
42,453
|
|
(2,630
|
)
|
39,823
|
|
2000
|
2016
|
||||||||||||||||||||||
|
Colonial Grand at Cornelius
|
Cornelius, NC
|
—
|
|
4,571
|
|
29,151
|
|
—
|
|
1,455
|
|
4,571
|
|
30,606
|
|
35,177
|
|
(7,365
|
)
|
27,812
|
|
2009
|
2013
|
||||||||||||||||||||||
|
Colonial Grand at Patterson Place
|
Durham, NC
|
—
|
|
2,590
|
|
27,126
|
|
—
|
|
3,044
|
|
2,590
|
|
30,170
|
|
32,760
|
|
(6,840
|
)
|
25,920
|
|
1997
|
2013
|
||||||||||||||||||||||
|
Colonial Village at Deerfield
|
Durham, NC
|
—
|
|
3,271
|
|
15,609
|
|
—
|
|
1,510
|
|
3,271
|
|
17,119
|
|
20,390
|
|
(4,695
|
)
|
15,695
|
|
1985
|
2013
|
||||||||||||||||||||||
|
Colonial Grand at Research Park
|
Durham, NC
|
—
|
|
4,201
|
|
37,682
|
|
—
|
|
2,921
|
|
4,201
|
|
40,603
|
|
44,804
|
|
(9,458
|
)
|
35,346
|
|
2002
|
2013
|
||||||||||||||||||||||
|
Colonial Grand at Huntersville
|
Huntersville, NC
|
—
|
|
4,251
|
|
31,948
|
|
—
|
|
2,609
|
|
4,251
|
|
34,557
|
|
38,808
|
|
(8,033
|
)
|
30,775
|
|
2008
|
2013
|
||||||||||||||||||||||
|
Colonial Village at Matthews
|
Matthews, NC
|
—
|
|
3,071
|
|
21,830
|
|
—
|
|
4,630
|
|
3,071
|
|
26,460
|
|
29,531
|
|
(6,991
|
)
|
22,540
|
|
2008
|
2013
|
||||||||||||||||||||||
|
Colonial Grand at Matthews Commons
|
Matthews, NC
|
—
|
|
3,690
|
|
28,536
|
|
—
|
|
2,147
|
|
3,690
|
|
30,683
|
|
34,373
|
|
(7,088
|
)
|
27,285
|
|
2008
|
2013
|
||||||||||||||||||||||
|
Colonial Grand at Arringdon
|
Morrisville, NC
|
—
|
|
6,401
|
|
31,134
|
|
—
|
|
2,948
|
|
6,401
|
|
34,082
|
|
40,483
|
|
(7,917
|
)
|
32,566
|
|
2003
|
2013
|
||||||||||||||||||||||
|
Colonial Grand at Brier Creek
|
Raleigh, NC
|
—
|
|
7,372
|
|
50,202
|
|
—
|
|
2,278
|
|
7,372
|
|
52,480
|
|
59,852
|
|
(11,622
|
)
|
48,230
|
|
2010
|
2013
|
||||||||||||||||||||||
|
Colonial Grand at Brier Falls
|
Raleigh, NC
|
—
|
|
6,572
|
|
48,910
|
|
—
|
|
1,808
|
|
6,572
|
|
50,718
|
|
57,290
|
|
(11,066
|
)
|
46,224
|
|
2008
|
2013
|
||||||||||||||||||||||
|
Colonial Grand at Crabtree Valley
|
Raleigh, NC
|
—
|
|
2,241
|
|
18,434
|
|
—
|
|
1,649
|
|
2,241
|
|
20,083
|
|
22,324
|
|
(4,336
|
)
|
17,988
|
|
1997
|
2013
|
||||||||||||||||||||||
|
Hue
|
Raleigh, NC
|
—
|
|
3,690
|
|
29,910
|
|
—
|
|
2,539
|
|
3,690
|
|
32,449
|
|
36,139
|
|
(7,630
|
)
|
28,509
|
|
2009
|
2010
|
||||||||||||||||||||||
|
Colonial Grand at Trinity Commons
|
Raleigh, NC
|
—
|
|
5,232
|
|
45,138
|
|
—
|
|
3,240
|
|
5,232
|
|
48,378
|
|
53,610
|
|
(11,612
|
)
|
41,998
|
|
2000/02
|
2013
|
||||||||||||||||||||||
|
Post Parkside at Wade
|
Raleigh, NC
|
—
|
|
7,196
|
|
51,972
|
|
—
|
|
673
|
|
7,196
|
|
52,645
|
|
59,841
|
|
(4,150
|
)
|
55,691
|
|
2011
|
2016
|
||||||||||||||||||||||
|
Post Parkside at Wade II
|
Raleigh, NC
|
—
|
|
9,450
|
|
46,316
|
|
587
|
|
1,646
|
|
10,037
|
|
47,962
|
|
57,999
|
|
(5,918
|
)
|
52,081
|
|
2017
|
2016
|
||||||||||||||||||||||
|
Preserve at Brier Creek
|
Raleigh, NC
|
—
|
|
5,850
|
|
21,980
|
|
(19
|
)
|
25,470
|
|
5,831
|
|
47,450
|
|
53,281
|
|
(17,903
|
)
|
35,378
|
|
2004
|
2006
|
||||||||||||||||||||||
|
Providence at Brier Creek
|
Raleigh, NC
|
—
|
|
4,695
|
|
29,007
|
|
—
|
|
1,897
|
|
4,695
|
|
30,904
|
|
35,599
|
|
(11,254
|
)
|
24,345
|
|
2007
|
2008
|
||||||||||||||||||||||
|
Tanglewood
|
Anderson, SC
|
—
|
|
427
|
|
3,853
|
|
—
|
|
3,120
|
|
427
|
|
6,973
|
|
7,400
|
|
(5,346
|
)
|
2,054
|
|
1980
|
1994
|
||||||||||||||||||||||
|
Colonial Grand at Cypress Cove
|
Charleston, SC
|
—
|
|
3,610
|
|
28,645
|
|
—
|
|
2,198
|
|
3,610
|
|
30,843
|
|
34,453
|
|
(7,287
|
)
|
27,166
|
|
2001
|
2013
|
||||||||||||||||||||||
|
Colonial Village at Hampton Pointe
|
Charleston, SC
|
—
|
|
3,971
|
|
22,790
|
|
—
|
|
5,072
|
|
3,971
|
|
27,862
|
|
31,833
|
|
(6,473
|
)
|
25,360
|
|
1986
|
2013
|
||||||||||||||||||||||
|
Colonial Grand at Quarterdeck
|
Charleston, SC
|
—
|
|
920
|
|
24,097
|
|
—
|
|
5,846
|
|
920
|
|
29,943
|
|
30,863
|
|
(6,799
|
)
|
24,064
|
|
1987
|
2013
|
||||||||||||||||||||||
|
Colonial Village at Westchase
|
Charleston, SC
|
—
|
|
4,571
|
|
20,091
|
|
—
|
|
3,457
|
|
4,571
|
|
23,548
|
|
28,119
|
|
(6,236
|
)
|
21,883
|
|
1985
|
2013
|
||||||||||||||||||||||
|
River's Walk
|
Charleston, SC
|
—
|
|
8,831
|
|
39,430
|
|
—
|
|
1,644
|
|
8,831
|
|
41,074
|
|
49,905
|
|
(4,579
|
)
|
45,326
|
|
2013/16
|
2013
|
||||||||||||||||||||||
|
1201 Midtown
|
Charleston, SC
|
—
|
|
11,929
|
|
57,885
|
|
—
|
|
614
|
|
11,929
|
|
58,499
|
|
70,428
|
|
(3,592
|
)
|
66,836
|
|
2015
|
2016
|
||||||||||||||||||||||
|
1201 Midtown II
|
Charleston, SC
|
—
|
|
6,750
|
|
5,874
|
|
—
|
|
15,605
|
|
6,750
|
|
21,479
|
|
28,229
|
|
(87
|
)
|
28,142
|
|
2018
|
2016
|
||||||||||||||||||||||
|
The Fairways
|
Columbia, SC
|
—
|
|
910
|
|
8,207
|
|
—
|
|
3,435
|
|
910
|
|
11,642
|
|
12,552
|
|
(8,718
|
)
|
3,834
|
|
1992
|
1994
|
||||||||||||||||||||||
|
Paddock Club Columbia
|
Columbia, SC
|
—
|
|
1,840
|
|
16,560
|
|
—
|
|
5,143
|
|
1,840
|
|
21,703
|
|
23,543
|
|
(14,550
|
)
|
8,993
|
|
1991
|
1997
|
||||||||||||||||||||||
|
Colonial Village at Windsor Place
|
Goose Creek, SC
|
—
|
|
1,321
|
|
14,163
|
|
—
|
|
2,919
|
|
1,321
|
|
17,082
|
|
18,403
|
|
(4,520
|
)
|
13,883
|
|
1985
|
2013
|
||||||||||||||||||||||
|
Highland Ridge
|
Greenville, SC
|
—
|
|
482
|
|
4,337
|
|
—
|
|
2,790
|
|
482
|
|
7,127
|
|
7,609
|
|
(4,803
|
)
|
2,806
|
|
1984
|
1995
|
||||||||||||||||||||||
|
Howell Commons
|
Greenville, SC
|
—
|
|
1,304
|
|
11,740
|
|
—
|
|
3,900
|
|
1,304
|
|
15,640
|
|
16,944
|
|
(10,801
|
)
|
6,143
|
|
1987
|
1997
|
||||||||||||||||||||||
|
Paddock Club Greenville
|
Greenville, SC
|
—
|
|
1,200
|
|
10,800
|
|
—
|
|
2,427
|
|
1,200
|
|
13,227
|
|
14,427
|
|
(8,894
|
)
|
5,533
|
|
1996
|
1997
|
||||||||||||||||||||||
|
Park Haywood
|
Greenville, SC
|
—
|
|
325
|
|
2,925
|
|
35
|
|
4,640
|
|
360
|
|
7,565
|
|
7,925
|
|
(5,558
|
)
|
2,367
|
|
1983
|
1993
|
||||||||||||||||||||||
|
Spring Creek
|
Greenville, SC
|
—
|
|
597
|
|
5,374
|
|
(14
|
)
|
3,043
|
|
583
|
|
8,417
|
|
9,000
|
|
(5,995
|
)
|
3,005
|
|
1985
|
1995
|
||||||||||||||||||||||
|
Innovation Apartment Homes
|
Greenville, SC
|
—
|
|
4,437
|
|
52,026
|
|
—
|
|
1,226
|
|
4,437
|
|
53,252
|
|
57,689
|
|
(4,168
|
)
|
53,521
|
|
2015
|
2016
|
||||||||||||||||||||||
|
Runaway Bay
|
Mt. Pleasant, SC
|
—
|
|
1,085
|
|
7,269
|
|
12
|
|
6,620
|
|
1,097
|
|
13,889
|
|
14,986
|
|
(9,420
|
)
|
5,566
|
|
1988
|
1995
|
||||||||||||||||||||||
|
Colonial Grand at Commerce Park
|
North Charleston, SC
|
—
|
|
2,780
|
|
33,966
|
|
—
|
|
2,013
|
|
2,780
|
|
35,979
|
|
38,759
|
|
(8,116
|
)
|
30,643
|
|
2008
|
2013
|
||||||||||||||||||||||
F-40
|
Initial Cost
|
Costs Capitalized Subsequent to Acquisition
|
Gross Amount carried as of December 31, 2018
|
||||||||||||||||||||||||||||||||||||||||||||
|
Property
|
Location
|
Encumbrances
|
|
Land
|
Buildings and Fixtures
|
Land
|
Buildings and Fixtures
|
Land
|
Buildings and Fixtures
|
Total
(3)
|
Accumulated Depreciation
(4)
|
Net
|
Date of Construction
|
Date Acquired
|
||||||||||||||||||||||||||||||||
|
535 Brookwood
|
Simpsonville, SC
|
12,011
|
|
1,216
|
|
18,666
|
|
—
|
|
1,565
|
|
1,216
|
|
20,231
|
|
21,447
|
|
(6,068
|
)
|
15,379
|
|
2008
|
2010
|
|||||||||||||||||||||||
|
Park Place
|
Spartanburg, SC
|
—
|
|
723
|
|
6,504
|
|
—
|
|
3,177
|
|
723
|
|
9,681
|
|
10,404
|
|
(6,721
|
)
|
3,683
|
|
1987
|
1997
|
|||||||||||||||||||||||
|
Farmington Village
|
Summerville, SC
|
—
|
|
2,800
|
|
26,295
|
|
—
|
|
2,465
|
|
2,800
|
|
28,760
|
|
31,560
|
|
(11,008
|
)
|
20,552
|
|
2007
|
2007
|
|||||||||||||||||||||||
|
Colonial Village at Waters Edge
|
Summerville, SC
|
—
|
|
2,103
|
|
9,187
|
|
—
|
|
3,787
|
|
2,103
|
|
12,974
|
|
15,077
|
|
(3,937
|
)
|
11,140
|
|
1985
|
2013
|
|||||||||||||||||||||||
|
Hamilton Pointe
|
Chattanooga, TN
|
—
|
|
1,131
|
|
10,632
|
|
—
|
|
4,952
|
|
1,131
|
|
15,584
|
|
16,715
|
|
(8,171
|
)
|
8,544
|
|
1989
|
1992
|
|||||||||||||||||||||||
|
Hidden Creek
|
Chattanooga, TN
|
—
|
|
972
|
|
8,954
|
|
—
|
|
5,978
|
|
972
|
|
14,932
|
|
15,904
|
|
(6,635
|
)
|
9,269
|
|
1987
|
1988
|
|||||||||||||||||||||||
|
Steeplechase
|
Chattanooga, TN
|
—
|
|
217
|
|
1,957
|
|
—
|
|
3,340
|
|
217
|
|
5,297
|
|
5,514
|
|
(3,748
|
)
|
1,766
|
|
1986
|
1991
|
|||||||||||||||||||||||
|
Windridge
|
Chattanooga, TN
|
—
|
|
817
|
|
7,416
|
|
—
|
|
4,464
|
|
817
|
|
11,880
|
|
12,697
|
|
(8,087
|
)
|
4,610
|
|
1984
|
1997
|
|||||||||||||||||||||||
|
Kirby Station
|
Memphis, TN
|
—
|
|
1,148
|
|
10,337
|
|
—
|
|
10,685
|
|
1,148
|
|
21,022
|
|
22,170
|
|
(14,339
|
)
|
7,831
|
|
1978
|
1994
|
|||||||||||||||||||||||
|
Lincoln on the Green
|
Memphis, TN
|
—
|
|
1,498
|
|
20,483
|
|
—
|
|
16,640
|
|
1,498
|
|
37,123
|
|
38,621
|
|
(26,261
|
)
|
12,360
|
|
1992
|
1994
|
|||||||||||||||||||||||
|
Park Estate
|
Memphis, TN
|
—
|
|
178
|
|
1,141
|
|
—
|
|
5,090
|
|
178
|
|
6,231
|
|
6,409
|
|
(4,878
|
)
|
1,531
|
|
1974
|
1977
|
|||||||||||||||||||||||
|
Reserve at Dexter Lake
|
Memphis, TN
|
—
|
|
1,260
|
|
16,043
|
|
2,147
|
|
41,631
|
|
3,407
|
|
57,674
|
|
61,081
|
|
(27,474
|
)
|
33,607
|
|
2000
|
1998
|
|||||||||||||||||||||||
|
Paddock Club Murfreesboro
|
Murfreesboro, TN
|
—
|
|
915
|
|
14,774
|
|
—
|
|
3,649
|
|
915
|
|
18,423
|
|
19,338
|
|
(9,763
|
)
|
9,575
|
|
1999
|
1998
|
|||||||||||||||||||||||
|
Acklen West End
|
Nashville, TN
|
—
|
|
12,761
|
|
58,906
|
|
—
|
|
450
|
|
12,761
|
|
59,355
|
|
72,116
|
|
(2,159
|
)
|
69,957
|
|
2015
|
2017
|
|||||||||||||||||||||||
|
Aventura at Indian Lake Village
|
Nashville, TN
|
—
|
|
4,950
|
|
28,053
|
|
—
|
|
1,676
|
|
4,950
|
|
29,729
|
|
34,679
|
|
(7,663
|
)
|
27,016
|
|
2010
|
2011
|
|||||||||||||||||||||||
|
Avondale at Kennesaw
|
Nashville, TN
|
16,552
|
|
3,456
|
|
22,443
|
|
—
|
|
3,007
|
|
3,456
|
|
25,450
|
|
28,906
|
|
(7,550
|
)
|
21,356
|
|
2008
|
2010
|
|||||||||||||||||||||||
|
Brentwood Downs
|
Nashville, TN
|
—
|
|
1,193
|
|
10,739
|
|
(2
|
)
|
8,590
|
|
1,191
|
|
19,329
|
|
20,520
|
|
(12,321
|
)
|
8,199
|
|
1986
|
1994
|
|||||||||||||||||||||||
|
Charlotte at Midtown
|
Nashville, TN
|
—
|
|
7,898
|
|
54,480
|
|
—
|
|
485
|
|
7,898
|
|
55,305
|
|
63,203
|
|
(2,791
|
)
|
60,412
|
|
2016
|
2017
|
|||||||||||||||||||||||
|
Colonial Grand at Bellevue
|
Nashville, TN
|
20,088
|
|
17,278
|
|
64,196
|
|
(2
|
)
|
3,367
|
|
17,276
|
|
67,563
|
|
84,839
|
|
(11,950
|
)
|
72,889
|
|
1996 / 2015
|
2013
|
|||||||||||||||||||||||
|
Grand View Nashville
|
Nashville, TN
|
—
|
|
2,963
|
|
33,673
|
|
—
|
|
8,552
|
|
2,963
|
|
42,225
|
|
45,188
|
|
(20,057
|
)
|
25,131
|
|
2001
|
1998
|
|||||||||||||||||||||||
|
Monthaven Park
|
Nashville, TN
|
—
|
|
2,736
|
|
28,902
|
|
—
|
|
6,033
|
|
2,736
|
|
34,935
|
|
37,671
|
|
(17,762
|
)
|
19,909
|
|
2000
|
2004
|
|||||||||||||||||||||||
|
Park at Hermitage
|
Nashville, TN
|
—
|
|
1,524
|
|
14,800
|
|
—
|
|
9,014
|
|
1,524
|
|
23,814
|
|
25,338
|
|
(17,472
|
)
|
7,866
|
|
1987
|
1995
|
|||||||||||||||||||||||
|
Venue at Cool Springs
|
Nashville, TN
|
—
|
|
6,670
|
|
—
|
|
—
|
|
51,922
|
|
6,670
|
|
51,922
|
|
58,592
|
|
(8,690
|
)
|
49,902
|
|
2012
|
2010
|
|||||||||||||||||||||||
|
Verandas at Sam Ridley
|
Nashville, TN
|
20,372
|
|
3,350
|
|
28,308
|
|
—
|
|
2,321
|
|
3,350
|
|
30,629
|
|
33,979
|
|
(9,018
|
)
|
24,961
|
|
2009
|
2010
|
|||||||||||||||||||||||
|
Balcones Woods
|
Austin, TX
|
—
|
|
1,598
|
|
14,398
|
|
—
|
|
9,133
|
|
1,598
|
|
23,531
|
|
25,129
|
|
(16,270
|
)
|
8,859
|
|
1983
|
1997
|
|||||||||||||||||||||||
|
Colonial Grand at Canyon Creek
|
Austin, TX
|
13,356
|
|
3,621
|
|
32,137
|
|
—
|
|
1,686
|
|
3,621
|
|
33,823
|
|
37,444
|
|
(7,986
|
)
|
29,458
|
|
2008
|
2013
|
|||||||||||||||||||||||
|
Colonial Grand at Canyon Ranch
|
Austin, TX
|
—
|
|
3,778
|
|
20,201
|
|
—
|
|
2,167
|
|
3,778
|
|
22,368
|
|
26,146
|
|
(5,831
|
)
|
20,315
|
|
2003
|
2013
|
|||||||||||||||||||||||
|
Colonial Grand at Double Creek
|
Austin, TX
|
—
|
|
3,131
|
|
29,375
|
|
—
|
|
914
|
|
3,131
|
|
30,289
|
|
33,420
|
|
(7,172
|
)
|
26,248
|
|
2013
|
2013
|
|||||||||||||||||||||||
|
Colonial Grand at Onion Creek
|
Austin, TX
|
—
|
|
4,902
|
|
33,010
|
|
—
|
|
1,797
|
|
4,902
|
|
34,807
|
|
39,709
|
|
(8,337
|
)
|
31,372
|
|
2009
|
2013
|
|||||||||||||||||||||||
|
Grand Reserve at Sunset Valley
|
Austin, TX
|
—
|
|
3,150
|
|
11,393
|
|
—
|
|
3,819
|
|
3,150
|
|
15,212
|
|
18,362
|
|
(7,409
|
)
|
10,953
|
|
1996
|
2004
|
|||||||||||||||||||||||
|
Colonial Village at Quarry Oaks
|
Austin, TX
|
—
|
|
4,621
|
|
34,461
|
|
—
|
|
5,880
|
|
4,621
|
|
40,341
|
|
44,962
|
|
(10,509
|
)
|
34,453
|
|
1996
|
2013
|
|||||||||||||||||||||||
|
Colonial Grand at Wells Branch
|
Austin, TX
|
—
|
|
3,094
|
|
32,283
|
|
294
|
|
1,624
|
|
3,388
|
|
33,907
|
|
37,295
|
|
(7,568
|
)
|
29,727
|
|
2008
|
2013
|
|||||||||||||||||||||||
|
Legacy at Western Oaks
|
Austin, TX
|
—
|
|
(1)
|
9,100
|
|
49,339
|
|
—
|
|
491
|
|
9,100
|
|
49,830
|
|
58,930
|
|
(11,908
|
)
|
47,022
|
|
2001
|
2009
|
||||||||||||||||||||||
|
Post Barton Creek
|
Austin, TX
|
—
|
|
8,683
|
|
21,497
|
|
—
|
|
905
|
|
8,683
|
|
22,402
|
|
31,085
|
|
(2,076
|
)
|
29,009
|
|
1998
|
2016
|
|||||||||||||||||||||||
|
Post Park Mesa
|
Austin, TX
|
—
|
|
4,653
|
|
19,828
|
|
—
|
|
674
|
|
4,653
|
|
20,502
|
|
25,155
|
|
(1,668
|
)
|
23,487
|
|
1992
|
2016
|
|||||||||||||||||||||||
|
Post South Lamar
|
Austin, TX
|
—
|
|
11,542
|
|
41,293
|
|
—
|
|
858
|
|
11,542
|
|
42,151
|
|
53,693
|
|
(4,271
|
)
|
49,422
|
|
2011
|
2016
|
|||||||||||||||||||||||
|
Post South Lamar II
|
Austin, TX
|
—
|
|
9,000
|
|
32,800
|
|
—
|
|
20,050
|
|
9,000
|
|
52,850
|
|
61,850
|
|
(632
|
)
|
61,218
|
|
2017
|
2016
|
|||||||||||||||||||||||
|
Post West Austin
|
Austin, TX
|
—
|
|
7,805
|
|
48,843
|
|
—
|
|
1,168
|
|
7,805
|
|
50,011
|
|
57,816
|
|
(4,930
|
)
|
52,886
|
|
2009
|
2016
|
|||||||||||||||||||||||
|
Silverado
|
Austin, TX
|
—
|
|
2,900
|
|
24,009
|
|
—
|
|
4,209
|
|
2,900
|
|
28,218
|
|
31,118
|
|
(12,387
|
)
|
18,731
|
|
2003
|
2006
|
|||||||||||||||||||||||
|
Stassney Woods
|
Austin, TX
|
—
|
|
1,621
|
|
7,501
|
|
—
|
|
8,655
|
|
1,621
|
|
16,156
|
|
17,777
|
|
(10,362
|
)
|
7,415
|
|
1985
|
1995
|
|||||||||||||||||||||||
|
Sixty 600
|
Austin, TX
|
—
|
|
2,281
|
|
6,169
|
|
—
|
|
8,019
|
|
2,281
|
|
14,188
|
|
16,469
|
|
(9,227
|
)
|
7,242
|
|
1987
|
1995
|
|||||||||||||||||||||||
|
The Woods on Barton Skyway
|
Austin, TX
|
—
|
|
1,405
|
|
12,769
|
|
—
|
|
9,816
|
|
1,405
|
|
22,585
|
|
23,990
|
|
(10,639
|
)
|
13,351
|
|
1977
|
1997
|
|||||||||||||||||||||||
|
Colonial Village at Shoal Creek
|
Bedford, TX
|
—
|
|
4,982
|
|
27,377
|
|
—
|
|
3,635
|
|
4,982
|
|
31,012
|
|
35,994
|
|
(7,770
|
)
|
28,224
|
|
1996
|
2013
|
|||||||||||||||||||||||
|
Colonial Village at Willow Creek
|
Bedford, TX
|
—
|
|
3,109
|
|
33,488
|
|
—
|
|
7,415
|
|
3,109
|
|
40,903
|
|
44,012
|
|
(10,077
|
)
|
33,935
|
|
1996
|
2013
|
|||||||||||||||||||||||
|
Colonial Grand at Hebron
|
Carrollton, TX
|
—
|
|
4,231
|
|
42,237
|
|
—
|
|
1,277
|
|
4,231
|
|
43,514
|
|
47,745
|
|
(9,268
|
)
|
38,477
|
|
2011
|
2013
|
|||||||||||||||||||||||
|
Colonial Grand at Silverado
|
Cedar Park, TX
|
—
|
|
3,282
|
|
24,935
|
|
—
|
|
1,369
|
|
3,282
|
|
26,304
|
|
29,586
|
|
(6,132
|
)
|
23,454
|
|
2005
|
2013
|
|||||||||||||||||||||||
|
Colonial Grand at Silverado Reserve
|
Cedar Park, TX
|
—
|
|
3,951
|
|
31,705
|
|
—
|
|
1,954
|
|
3,951
|
|
33,659
|
|
37,610
|
|
(7,652
|
)
|
29,958
|
|
2005
|
2013
|
|||||||||||||||||||||||
|
Grand Cypress
|
Cypress, TX
|
—
|
|
3,881
|
|
24,267
|
|
—
|
|
1,316
|
|
3,881
|
|
25,583
|
|
29,464
|
|
(4,560
|
)
|
24,904
|
|
2008
|
2013
|
|||||||||||||||||||||||
|
Courtyards at Campbell
|
Dallas, TX
|
—
|
|
988
|
|
8,893
|
|
—
|
|
4,033
|
|
988
|
|
12,926
|
|
13,914
|
|
(8,572
|
)
|
5,342
|
|
1986
|
1998
|
|||||||||||||||||||||||
|
Deer Run
|
Dallas, TX
|
—
|
|
1,252
|
|
11,271
|
|
—
|
|
5,018
|
|
1,252
|
|
16,289
|
|
17,541
|
|
(10,942
|
)
|
6,599
|
|
1985
|
1998
|
|||||||||||||||||||||||
|
Grand Courtyard
|
Dallas, TX
|
—
|
|
2,730
|
|
22,240
|
|
—
|
|
3,615
|
|
2,730
|
|
25,855
|
|
28,585
|
|
(11,461
|
)
|
17,124
|
|
2000
|
2006
|
|||||||||||||||||||||||
|
Legends at Lowe's Farm
|
Dallas, TX
|
—
|
|
5,016
|
|
41,091
|
|
—
|
|
2,598
|
|
5,016
|
|
43,689
|
|
48,705
|
|
(11,336
|
)
|
37,369
|
|
2008
|
2011
|
|||||||||||||||||||||||
|
Colonial Reserve at Medical District
|
Dallas, TX
|
—
|
|
4,050
|
|
33,779
|
|
—
|
|
2,027
|
|
4,050
|
|
35,806
|
|
39,856
|
|
(7,301
|
)
|
32,555
|
|
2007
|
2013
|
|||||||||||||||||||||||
|
Post Abbey
|
Dallas, TX
|
—
|
|
2,711
|
|
4,369
|
|
—
|
|
112
|
|
2,711
|
|
4,481
|
|
7,192
|
|
(384
|
)
|
6,808
|
|
1996
|
2016
|
|||||||||||||||||||||||
|
Post Addison Circle
|
Dallas, TX
|
—
|
|
12,308
|
|
189,419
|
|
—
|
|
6,637
|
|
12,308
|
|
196,056
|
|
208,364
|
|
(15,940
|
)
|
192,424
|
|
1998-2000
|
2016
|
|||||||||||||||||||||||
|
Post Cole's Corner
|
Dallas, TX
|
—
|
|
13,030
|
|
14,383
|
|
—
|
|
1,541
|
|
13,030
|
|
15,924
|
|
28,954
|
|
(1,481
|
)
|
27,473
|
|
1998
|
2016
|
|||||||||||||||||||||||
|
Post Eastside
|
Dallas, TX
|
—
|
|
7,134
|
|
58,095
|
|
—
|
|
853
|
|
7,134
|
|
58,948
|
|
66,082
|
|
(5,277
|
)
|
60,805
|
|
2008
|
2016
|
|||||||||||||||||||||||
|
Post Gallery
|
Dallas, TX
|
—
|
|
4,391
|
|
7,910
|
|
—
|
|
687
|
|
4,391
|
|
8,597
|
|
12,988
|
|
(870
|
)
|
12,118
|
|
1999
|
2016
|
|||||||||||||||||||||||
|
Post Heights
|
Dallas, TX
|
—
|
|
26,245
|
|
37,922
|
|
—
|
|
823
|
|
26,245
|
|
38,745
|
|
64,990
|
|
(3,439
|
)
|
61,551
|
|
1998-1999/2009
|
2016
|
|||||||||||||||||||||||
|
Post Katy Trail
|
Dallas, TX
|
—
|
|
10,333
|
|
32,456
|
|
—
|
|
621
|
|
10,333
|
|
33,077
|
|
43,410
|
|
(2,524
|
)
|
40,886
|
|
2010
|
2016
|
|||||||||||||||||||||||
|
Post Legacy
|
Dallas, TX
|
—
|
|
6,575
|
|
55,277
|
|
—
|
|
2,264
|
|
6,575
|
|
57,541
|
|
64,116
|
|
(4,616
|
)
|
59,500
|
|
2000
|
2016
|
|||||||||||||||||||||||
|
Post Meridian
|
Dallas, TX
|
—
|
|
8,780
|
|
13,654
|
|
—
|
|
208
|
|
8,780
|
|
13,862
|
|
22,642
|
|
(1,279
|
)
|
21,363
|
|
1991
|
2016
|
|||||||||||||||||||||||
F-41
|
Initial Cost
|
Costs Capitalized Subsequent to Acquisition
|
Gross Amount carried as of December 31, 2018
|
||||||||||||||||||||||||||||||||||||||||||||
|
Property
|
Location
|
Encumbrances
|
|
Land
|
Buildings and Fixtures
|
Land
|
Buildings and Fixtures
|
Land
|
Buildings and Fixtures
|
Total
(3)
|
Accumulated Depreciation
(4)
|
Net
|
Date of Construction
|
Date Acquired
|
||||||||||||||||||||||||||||||||
|
Post Sierra at Frisco Bridges
|
Dallas, TX
|
—
|
|
6,777
|
|
32,553
|
|
—
|
|
580
|
|
6,777
|
|
33,133
|
|
39,910
|
|
(3,291
|
)
|
36,619
|
|
2009
|
2016
|
|||||||||||||||||||||||
|
Post Square
|
Dallas, TX
|
—
|
|
13,178
|
|
24,048
|
|
—
|
|
1,017
|
|
13,178
|
|
25,065
|
|
38,243
|
|
(2,013
|
)
|
36,230
|
|
1996
|
2016
|
|||||||||||||||||||||||
|
Post Uptown Village
|
Dallas, TX
|
—
|
|
34,974
|
|
33,213
|
|
—
|
|
3,464
|
|
34,974
|
|
36,677
|
|
71,651
|
|
(3,231
|
)
|
68,420
|
|
1995/2000
|
2016
|
|||||||||||||||||||||||
|
Post Vineyard
|
Dallas, TX
|
—
|
|
7,966
|
|
7,471
|
|
—
|
|
628
|
|
7,966
|
|
8,099
|
|
16,065
|
|
(691
|
)
|
15,374
|
|
1996
|
2016
|
|||||||||||||||||||||||
|
Post Vintage
|
Dallas, TX
|
—
|
|
13,621
|
|
8,608
|
|
—
|
|
708
|
|
13,621
|
|
9,316
|
|
22,937
|
|
(851
|
)
|
22,086
|
|
1993
|
2016
|
|||||||||||||||||||||||
|
Post Worthington
|
Dallas, TX
|
—
|
|
13,713
|
|
43,268
|
|
—
|
|
917
|
|
13,713
|
|
44,185
|
|
57,898
|
|
(3,598
|
)
|
54,300
|
|
1993/2008
|
2016
|
|||||||||||||||||||||||
|
Watermark
|
Dallas, TX
|
—
|
|
(2)
|
960
|
|
14,438
|
|
—
|
|
3,047
|
|
960
|
|
17,485
|
|
18,445
|
|
(8,672
|
)
|
9,773
|
|
2002
|
2004
|
||||||||||||||||||||||
|
Colonial Grand at Bear Creek
|
Euless, TX
|
—
|
|
6,453
|
|
30,048
|
|
—
|
|
2,874
|
|
6,453
|
|
32,922
|
|
39,375
|
|
(8,561
|
)
|
30,814
|
|
1998
|
2013
|
|||||||||||||||||||||||
|
Colonial Grand at Fairview
|
Fairview, TX
|
—
|
|
2,171
|
|
35,077
|
|
—
|
|
1,041
|
|
2,171
|
|
36,118
|
|
38,289
|
|
(7,590
|
)
|
30,699
|
|
2012
|
2013
|
|||||||||||||||||||||||
|
La Valencia at Starwood
|
Frisco, TX
|
—
|
|
3,240
|
|
26,069
|
|
—
|
|
1,677
|
|
3,240
|
|
27,746
|
|
30,986
|
|
(8,144
|
)
|
22,842
|
|
2009
|
2010
|
|||||||||||||||||||||||
|
Colonial Reserve at Frisco Bridges
|
Frisco, TX
|
—
|
|
1,968
|
|
34,018
|
|
—
|
|
1,445
|
|
1,968
|
|
35,463
|
|
37,431
|
|
(7,350
|
)
|
30,081
|
|
2013
|
2013
|
|||||||||||||||||||||||
|
Colonial Village at Grapevine
|
Grapevine, TX
|
—
|
|
2,351
|
|
29,757
|
|
—
|
|
5,669
|
|
2,351
|
|
35,426
|
|
37,777
|
|
(8,355
|
)
|
29,422
|
|
1985/86
|
2013
|
|||||||||||||||||||||||
|
Greenwood Forest
|
Houston, TX
|
—
|
|
3,465
|
|
23,482
|
|
—
|
|
523
|
|
3,465
|
|
24,005
|
|
27,470
|
|
(4,938
|
)
|
22,532
|
|
1994
|
2013
|
|||||||||||||||||||||||
|
Legacy Pines
|
Houston, TX
|
—
|
|
(2)
|
2,157
|
|
19,066
|
|
(15
|
)
|
4,184
|
|
2,142
|
|
23,250
|
|
25,392
|
|
(12,252
|
)
|
13,140
|
|
1999
|
2003
|
||||||||||||||||||||||
|
Park Place (Houston)
|
Houston, TX
|
—
|
|
2,061
|
|
15,830
|
|
—
|
|
3,285
|
|
2,061
|
|
19,115
|
|
21,176
|
|
(8,141
|
)
|
13,035
|
|
1996
|
2007
|
|||||||||||||||||||||||
|
Post Midtown Square
|
Houston, TX
|
—
|
|
19,038
|
|
89,570
|
|
—
|
|
1,617
|
|
19,038
|
|
91,187
|
|
110,225
|
|
(7,964
|
)
|
102,261
|
|
1999/2013
|
2016
|
|||||||||||||||||||||||
|
Post 510
|
Houston, TX
|
—
|
|
7,227
|
|
33,366
|
|
—
|
|
289
|
|
7,227
|
|
33,655
|
|
40,882
|
|
(3,162
|
)
|
37,720
|
|
2014
|
2016
|
|||||||||||||||||||||||
|
Post Afton Oaks
|
Houston, TX
|
—
|
|
11,503
|
|
65,469
|
|
—
|
|
3,420
|
|
11,503
|
|
68,889
|
|
80,392
|
|
(7,027
|
)
|
73,365
|
|
2017
|
2016
|
|||||||||||||||||||||||
|
Ranchstone
|
Houston, TX
|
—
|
|
1,480
|
|
14,807
|
|
—
|
|
2,771
|
|
1,480
|
|
17,578
|
|
19,058
|
|
(7,245
|
)
|
11,813
|
|
1996
|
2007
|
|||||||||||||||||||||||
|
Reserve at Woodwind Lakes
|
Houston, TX
|
—
|
|
1,968
|
|
19,928
|
|
—
|
|
3,930
|
|
1,968
|
|
23,858
|
|
25,826
|
|
(10,313
|
)
|
15,513
|
|
1999
|
2006
|
|||||||||||||||||||||||
|
Retreat at Vintage Park
|
Houston, TX
|
—
|
|
8,211
|
|
40,352
|
|
—
|
|
887
|
|
8,211
|
|
41,239
|
|
49,450
|
|
(4,417
|
)
|
45,033
|
|
2014
|
2014
|
|||||||||||||||||||||||
|
Yale at 6th
|
Houston, TX
|
—
|
|
(1)
|
13,107
|
|
62,764
|
|
—
|
|
1,104
|
|
13,107
|
|
63,868
|
|
76,975
|
|
(2,447
|
)
|
74,528
|
|
2015
|
2016
|
||||||||||||||||||||||
|
Cascade at Fall Creek
|
Humble, TX
|
—
|
|
5,985
|
|
40,011
|
|
—
|
|
2,806
|
|
5,985
|
|
42,817
|
|
48,802
|
|
(16,666
|
)
|
32,136
|
|
2007
|
2007
|
|||||||||||||||||||||||
|
Bella Casita
|
Irving, TX
|
—
|
|
(2)
|
2,521
|
|
26,432
|
|
—
|
|
2,355
|
|
2,521
|
|
28,787
|
|
31,308
|
|
(8,207
|
)
|
23,101
|
|
2007
|
2010
|
||||||||||||||||||||||
|
Remington Hills
|
Irving, TX
|
—
|
|
4,390
|
|
21,822
|
|
—
|
|
11,820
|
|
4,390
|
|
33,642
|
|
38,032
|
|
(7,517
|
)
|
30,515
|
|
1984
|
2013
|
|||||||||||||||||||||||
|
Colonial Reserve at Las Colinas
|
Irving, TX
|
—
|
|
(1)
|
3,902
|
|
40,691
|
|
—
|
|
1,624
|
|
3,902
|
|
42,315
|
|
46,217
|
|
(8,743
|
)
|
37,474
|
|
2006
|
2013
|
||||||||||||||||||||||
|
Colonial Grand at Valley Ranch
|
Irving, TX
|
22,778
|
|
5,072
|
|
37,397
|
|
—
|
|
12,143
|
|
5,072
|
|
49,540
|
|
54,612
|
|
(12,067
|
)
|
42,545
|
|
1997
|
2013
|
|||||||||||||||||||||||
|
Colonial Village at Oakbend
|
Lewisville, TX
|
—
|
|
5,598
|
|
28,616
|
|
—
|
|
4,037
|
|
5,598
|
|
32,653
|
|
38,251
|
|
(8,001
|
)
|
30,250
|
|
1997
|
2013
|
|||||||||||||||||||||||
|
Times Square at Craig Ranch
|
McKinney, TX
|
—
|
|
1,130
|
|
28,058
|
|
—
|
|
4,324
|
|
1,130
|
|
32,382
|
|
33,512
|
|
(9,932
|
)
|
23,580
|
|
2009
|
2010
|
|||||||||||||||||||||||
|
Venue at Stonebridge Ranch
|
McKinney, TX
|
—
|
|
4,034
|
|
19,528
|
|
—
|
|
1,235
|
|
4,034
|
|
20,763
|
|
24,797
|
|
(3,791
|
)
|
21,006
|
|
2000
|
2013
|
|||||||||||||||||||||||
|
Cityscape at Market Center
|
Plano, TX
|
—
|
|
16,894
|
|
110,705
|
|
—
|
|
2,004
|
|
16,894
|
|
112,709
|
|
129,603
|
|
(11,590
|
)
|
118,013
|
|
2013/15
|
2014
|
|||||||||||||||||||||||
|
Highwood
|
Plano, TX
|
—
|
|
864
|
|
7,783
|
|
—
|
|
3,630
|
|
864
|
|
11,413
|
|
12,277
|
|
(7,612
|
)
|
4,665
|
|
1983
|
1998
|
|||||||||||||||||||||||
|
Los Rios Park
|
Plano, TX
|
—
|
|
3,273
|
|
28,823
|
|
—
|
|
6,720
|
|
3,273
|
|
35,543
|
|
38,816
|
|
(18,242
|
)
|
20,574
|
|
2000
|
2003
|
|||||||||||||||||||||||
|
Boulder Ridge
|
Roanoke, TX
|
—
|
|
3,382
|
|
26,930
|
|
—
|
|
6,364
|
|
3,382
|
|
33,294
|
|
36,676
|
|
(15,517
|
)
|
21,159
|
|
1999
|
2005
|
|||||||||||||||||||||||
|
Copper Ridge
|
Roanoke, TX
|
—
|
|
4,166
|
|
—
|
|
—
|
|
21,641
|
|
4,166
|
|
21,778
|
|
25,944
|
|
(5,880
|
)
|
20,064
|
|
2009
|
2008
|
|||||||||||||||||||||||
|
Colonial Grand at Ashton Oaks
|
Round Rock, TX
|
—
|
|
5,511
|
|
36,241
|
|
—
|
|
2,169
|
|
5,511
|
|
38,410
|
|
43,921
|
|
(8,934
|
)
|
34,987
|
|
2009
|
2013
|
|||||||||||||||||||||||
|
Colonial Grand at Round Rock
|
Round Rock, TX
|
—
|
|
4,691
|
|
45,379
|
|
—
|
|
2,351
|
|
4,691
|
|
47,730
|
|
52,421
|
|
(10,832
|
)
|
41,589
|
|
1997
|
2013
|
|||||||||||||||||||||||
|
Colonial Village at Sierra Vista
|
Round Rock, TX
|
—
|
|
2,561
|
|
16,488
|
|
—
|
|
3,576
|
|
2,561
|
|
20,064
|
|
22,625
|
|
(5,118
|
)
|
17,507
|
|
1999
|
2013
|
|||||||||||||||||||||||
|
Alamo Ranch
|
San Antonio, TX
|
—
|
|
2,380
|
|
26,982
|
|
—
|
|
2,677
|
|
2,380
|
|
29,659
|
|
32,039
|
|
(8,533
|
)
|
23,506
|
|
2009
|
2011
|
|||||||||||||||||||||||
|
Bulverde Oaks
|
San Antonio, TX
|
—
|
|
4,257
|
|
36,759
|
|
—
|
|
1,296
|
|
4,257
|
|
38,055
|
|
42,312
|
|
(4,283
|
)
|
38,029
|
|
2014
|
2014
|
|||||||||||||||||||||||
|
Haven at Blanco
|
San Antonio, TX
|
—
|
|
5,450
|
|
45,958
|
|
—
|
|
3,014
|
|
5,450
|
|
48,972
|
|
54,422
|
|
(11,161
|
)
|
43,261
|
|
2010
|
2012
|
|||||||||||||||||||||||
|
Stone Ranch at Westover Hills
|
San Antonio, TX
|
17,533
|
|
4,000
|
|
24,992
|
|
—
|
|
2,770
|
|
4,000
|
|
27,762
|
|
31,762
|
|
(8,907
|
)
|
22,855
|
|
2009
|
2009
|
|||||||||||||||||||||||
|
Cypresswood Court
|
Spring, TX
|
—
|
|
(2)
|
576
|
|
5,190
|
|
—
|
|
5,203
|
|
576
|
|
10,393
|
|
10,969
|
|
(6,175
|
)
|
4,794
|
|
1984
|
1994
|
||||||||||||||||||||||
|
Villages at Kirkwood
|
Stafford, TX
|
—
|
|
1,918
|
|
15,846
|
|
—
|
|
3,112
|
|
1,918
|
|
18,958
|
|
20,876
|
|
(9,286
|
)
|
11,590
|
|
1996
|
2004
|
|||||||||||||||||||||||
|
Green Tree Place
|
Woodlands, TX
|
—
|
|
(2)
|
539
|
|
4,850
|
|
—
|
|
3,761
|
|
539
|
|
8,611
|
|
9,150
|
|
(6,160
|
)
|
2,990
|
|
1984
|
1994
|
||||||||||||||||||||||
|
Stonefield Commons
|
Charlottesville, VA
|
—
|
|
11,044
|
|
36,689
|
|
—
|
|
872
|
|
11,044
|
|
37,561
|
|
48,605
|
|
(4,500
|
)
|
44,105
|
|
2013
|
2014
|
|||||||||||||||||||||||
|
Adalay Bay
|
Chesapeake, VA
|
—
|
|
5,280
|
|
31,341
|
|
—
|
|
3,176
|
|
5,280
|
|
34,517
|
|
39,797
|
|
(8,461
|
)
|
31,336
|
|
2002
|
2012
|
|||||||||||||||||||||||
|
Colonial Village at Greenbrier
|
Fredericksburg, VA
|
—
|
|
4,842
|
|
21,677
|
|
—
|
|
1,614
|
|
4,842
|
|
23,291
|
|
28,133
|
|
(5,024
|
)
|
23,109
|
|
1980
|
2013
|
|||||||||||||||||||||||
|
Seasons at Celebrate Virginia
|
Fredericksburg, VA
|
—
|
|
14,490
|
|
32,083
|
|
—
|
|
39,598
|
|
14,490
|
|
71,681
|
|
86,171
|
|
(13,240
|
)
|
72,931
|
|
2011
|
2011
|
|||||||||||||||||||||||
|
Station Square at Cosner's Corner
|
Fredericksburg, VA
|
—
|
|
12,825
|
|
51,078
|
|
—
|
|
1,372
|
|
12,825
|
|
52,450
|
|
65,275
|
|
(6,508
|
)
|
58,767
|
|
2013/16
|
2013
|
|||||||||||||||||||||||
|
Apartments at Cobblestone Square
|
Fredericksburg, VA
|
—
|
|
10,990
|
|
48,696
|
|
—
|
|
2,389
|
|
10,990
|
|
51,085
|
|
62,075
|
|
(5,428
|
)
|
56,647
|
|
2012
|
2016
|
|||||||||||||||||||||||
|
Colonial Village at Hampton Glen
|
Glen Allen, VA
|
—
|
|
4,851
|
|
21,678
|
|
—
|
|
2,690
|
|
4,851
|
|
24,368
|
|
29,219
|
|
(5,628
|
)
|
23,591
|
|
1986
|
2013
|
|||||||||||||||||||||||
|
Colonial Village at West End
|
Glen Allen, VA
|
—
|
|
4,661
|
|
18,908
|
|
—
|
|
2,763
|
|
4,661
|
|
21,671
|
|
26,332
|
|
(4,926
|
)
|
21,406
|
|
1987
|
2013
|
|||||||||||||||||||||||
|
Township
|
Hampton, VA
|
—
|
|
1,509
|
|
8,189
|
|
—
|
|
8,439
|
|
1,509
|
|
16,628
|
|
18,137
|
|
(10,777
|
)
|
7,360
|
|
1987
|
1995
|
|||||||||||||||||||||||
|
Colonial Village at Waterford
|
Midlothian, VA
|
—
|
|
6,733
|
|
29,221
|
|
—
|
|
3,903
|
|
6,733
|
|
33,124
|
|
39,857
|
|
(8,040
|
)
|
31,817
|
|
1989
|
2013
|
|||||||||||||||||||||||
|
Ashley Park
|
Richmond, VA
|
—
|
|
4,761
|
|
13,365
|
|
—
|
|
1,934
|
|
4,761
|
|
15,299
|
|
20,060
|
|
(4,160
|
)
|
15,900
|
|
1988
|
2013
|
|||||||||||||||||||||||
|
Colonial Village at Chase Gayton
|
Richmond, VA
|
—
|
|
6,021
|
|
29,004
|
|
—
|
|
3,340
|
|
6,021
|
|
32,344
|
|
38,365
|
|
(7,720
|
)
|
30,645
|
|
1984
|
2013
|
|||||||||||||||||||||||
|
Hamptons at Hunton Park
|
Richmond, VA
|
—
|
|
4,930
|
|
35,598
|
|
—
|
|
5,430
|
|
4,930
|
|
41,028
|
|
45,958
|
|
(10,730
|
)
|
35,228
|
|
2003
|
2011
|
|||||||||||||||||||||||
|
Retreat at West Creek
|
Richmond, VA
|
—
|
|
7,112
|
|
36,136
|
|
—
|
|
1,594
|
|
7,112
|
|
37,730
|
|
44,842
|
|
(3,594
|
)
|
41,248
|
|
2015
|
2015
|
|||||||||||||||||||||||
|
Retreat at West Creek II
|
Richmond, VA
|
—
|
|
3,000
|
|
—
|
|
—
|
|
12,144
|
|
3,000
|
|
12,144
|
|
15,144
|
|
(555
|
)
|
14,589
|
|
2017
|
2015
|
|||||||||||||||||||||||
|
Radius
|
Newport News, VA
|
—
|
|
5,040
|
|
36,481
|
|
—
|
|
2,393
|
|
5,040
|
|
38,874
|
|
43,914
|
|
(3,672
|
)
|
40,242
|
|
2012
|
2015
|
|||||||||||||||||||||||
|
Post Carlyle Square
|
Washington D.C.
|
—
|
|
29,728
|
|
154,309
|
|
—
|
|
1,292
|
|
29,728
|
|
155,601
|
|
185,329
|
|
(12,256
|
)
|
173,073
|
|
2006/13
|
2016
|
|||||||||||||||||||||||
F-42
|
Initial Cost
|
Costs Capitalized Subsequent to Acquisition
|
Gross Amount carried as of December 31, 2018
|
||||||||||||||||||||||||||||||||||||||||||||
|
Property
|
Location
|
Encumbrances
|
|
Land
|
Buildings and Fixtures
|
Land
|
Buildings and Fixtures
|
Land
|
Buildings and Fixtures
|
Total
(3)
|
Accumulated Depreciation
(4)
|
Net
|
Date of Construction
|
Date Acquired
|
||||||||||||||||||||||||||||||||
|
Post Corners at Trinity Center
|
Washington D.C.
|
—
|
|
7,664
|
|
70,012
|
|
—
|
|
1,512
|
|
7,664
|
|
71,524
|
|
79,188
|
|
(5,641
|
)
|
73,547
|
|
1996
|
2016
|
|||||||||||||||||||||||
|
Post Fallsgrove
|
Washington D.C.
|
—
|
|
17,524
|
|
58,896
|
|
—
|
|
1,828
|
|
17,524
|
|
60,724
|
|
78,248
|
|
(4,975
|
)
|
73,273
|
|
2003
|
2016
|
|||||||||||||||||||||||
|
Post Park
|
Washington D.C.
|
—
|
|
5,355
|
|
79,842
|
|
—
|
|
936
|
|
5,355
|
|
80,778
|
|
86,133
|
|
(8,316
|
)
|
77,817
|
|
2010
|
2016
|
|||||||||||||||||||||||
|
Post Pentagon Row
|
Washington D.C.
|
—
|
|
30,452
|
|
125,091
|
|
—
|
|
3,792
|
|
30,452
|
|
128,883
|
|
159,335
|
|
(10,510
|
)
|
148,825
|
|
2001
|
2016
|
|||||||||||||||||||||||
|
Post Tysons Corner
|
Washington D.C.
|
—
|
|
30,776
|
|
82,021
|
|
—
|
|
1,689
|
|
30,776
|
|
83,710
|
|
114,486
|
|
(6,679
|
)
|
107,807
|
|
1990
|
2016
|
|||||||||||||||||||||||
|
Total Residential Properties
|
|
180,979
|
|
|
1,816,760
|
|
9,932,878
|
|
5,279
|
|
1,555,397
|
|
1,822,039
|
|
11,488,753
|
|
13,310,792
|
|
(2,512,538
|
)
|
10,798,254
|
|
|
|||||||||||||||||||||||
|
Colonial Promenade at Huntsville
|
Huntsville, AL
|
—
|
|
2,000
|
|
—
|
|
—
|
|
—
|
|
2,000
|
|
—
|
|
2,000
|
|
—
|
|
2,000
|
|
2017
|
2013
|
|||||||||||||||||||||||
|
Allure in Buckhead
|
Atlanta, GA
|
—
|
|
867
|
|
3,465
|
|
—
|
|
263
|
|
867
|
|
3,728
|
|
4,595
|
|
(790
|
)
|
3,805
|
|
2012
|
2012
|
|||||||||||||||||||||||
|
Highlands of West Village
|
Smyrna, GA
|
—
|
|
2,500
|
|
8,446
|
|
908
|
|
1,208
|
|
3,408
|
|
9,654
|
|
13,062
|
|
(1,388
|
)
|
11,674
|
|
2012
|
2014
|
|||||||||||||||||||||||
|
The Denton
|
Kansas City, MO
|
—
|
|
700
|
|
4,439
|
|
—
|
|
442
|
|
700
|
|
4,881
|
|
5,581
|
|
(415
|
)
|
5,166
|
|
2014
|
2015
|
|||||||||||||||||||||||
|
1225 South Church
|
Charlotte, NC
|
—
|
|
43
|
|
199
|
|
9
|
|
242
|
|
52
|
|
441
|
|
493
|
|
(122
|
)
|
371
|
|
2010
|
2010
|
|||||||||||||||||||||||
|
Bella Casita at Las Colinas
|
Irving, TX
|
—
|
|
(2)
|
46
|
|
186
|
|
—
|
|
152
|
|
46
|
|
338
|
|
384
|
|
(88
|
)
|
296
|
|
2007
|
2010
|
||||||||||||||||||||||
|
Times Square at Craig Ranch
|
McKinney, TX
|
—
|
|
253
|
|
1,310
|
|
—
|
|
2,397
|
|
253
|
|
3,707
|
|
3,960
|
|
(608
|
)
|
3,352
|
|
2009
|
2010
|
|||||||||||||||||||||||
|
Post Rocky Point
|
Tampa, FL
|
—
|
|
34
|
|
51
|
|
—
|
|
272
|
|
34
|
|
323
|
|
357
|
|
(50
|
)
|
307
|
|
1994-1996
|
2016
|
|||||||||||||||||||||||
|
Post Training Facility
|
Atlanta, GA
|
—
|
|
1,092
|
|
968
|
|
—
|
|
—
|
|
1,092
|
|
968
|
|
2,060
|
|
(164
|
)
|
1,896
|
|
1999
|
2016
|
|||||||||||||||||||||||
|
Post Riverside Office
|
Atlanta, GA
|
—
|
|
9,680
|
|
22,108
|
|
—
|
|
5,918
|
|
9,680
|
|
28,026
|
|
37,706
|
|
(2,980
|
)
|
34,726
|
|
1996
|
2016
|
|||||||||||||||||||||||
|
Post Riverside Retail
|
Atlanta, GA
|
—
|
|
889
|
|
2,340
|
|
—
|
|
2,274
|
|
889
|
|
4,614
|
|
5,503
|
|
(306
|
)
|
5,197
|
|
1996
|
2016
|
|||||||||||||||||||||||
|
Post Harbour Place
|
Tampa, FL
|
—
|
|
386
|
|
4,315
|
|
—
|
|
256
|
|
386
|
|
4,571
|
|
4,957
|
|
(398
|
)
|
4,559
|
|
1997
|
2016
|
|||||||||||||||||||||||
|
Post Soho Square Retail
|
Tampa, FL
|
—
|
|
268
|
|
4,033
|
|
—
|
|
6
|
|
268
|
|
4,039
|
|
4,307
|
|
(454
|
)
|
3,853
|
|
2012
|
2016
|
|||||||||||||||||||||||
|
Post Parkside Atlanta Retail
|
Atlanta, GA
|
—
|
|
426
|
|
1,089
|
|
—
|
|
2
|
|
426
|
|
1,091
|
|
1,517
|
|
(99
|
)
|
1,418
|
|
1999
|
2016
|
|||||||||||||||||||||||
|
Post Uptown Place Retail
|
Charlotte, NC
|
—
|
|
319
|
|
1,144
|
|
—
|
|
11
|
|
319
|
|
1,155
|
|
1,474
|
|
(117
|
)
|
1,357
|
|
1998
|
2016
|
|||||||||||||||||||||||
|
Post Uptown Leasing Center
|
Charlotte, NC
|
—
|
|
1,290
|
|
1,488
|
|
—
|
|
114
|
|
1,290
|
|
1,602
|
|
2,892
|
|
(118
|
)
|
2,774
|
|
1998
|
2016
|
|||||||||||||||||||||||
|
Post Park Maryland Retail
|
Washington DC, MD
|
—
|
|
25
|
|
137
|
|
—
|
|
—
|
|
25
|
|
137
|
|
162
|
|
(10
|
)
|
152
|
|
2007
|
2016
|
|||||||||||||||||||||||
|
Post South End Retail
|
Charlotte, NC
|
—
|
|
470
|
|
1,289
|
|
—
|
|
121
|
|
470
|
|
1,410
|
|
1,880
|
|
(143
|
)
|
1,737
|
|
2009
|
2016
|
|||||||||||||||||||||||
|
Post Gateway Place Retail
|
Charlotte, NC
|
—
|
|
318
|
|
1,430
|
|
—
|
|
18
|
|
318
|
|
1,448
|
|
1,766
|
|
(161
|
)
|
1,605
|
|
2000
|
2016
|
|||||||||||||||||||||||
|
Post Parkside at Wade Retail
|
Raleigh, NC
|
—
|
|
317
|
|
4,552
|
|
—
|
|
72
|
|
317
|
|
4,624
|
|
4,941
|
|
(522
|
)
|
4,419
|
|
2011
|
2016
|
|||||||||||||||||||||||
|
Hue Retail
|
Raleigh, NC
|
—
|
|
—
|
|
2,129
|
|
—
|
|
56
|
|
—
|
|
2,185
|
|
2,185
|
|
(30
|
)
|
2,155
|
|
2010
|
2018
|
|||||||||||||||||||||||
|
Post Parkside Orlando Retail
|
Orlando, FL
|
—
|
|
742
|
|
11,924
|
|
—
|
|
983
|
|
742
|
|
12,907
|
|
13,649
|
|
(1,105
|
)
|
12,544
|
|
1999
|
2016
|
|||||||||||||||||||||||
|
Post Carlyle Square Retail
|
Washington DC, VA
|
—
|
|
1,048
|
|
7,930
|
|
—
|
|
39
|
|
1,048
|
|
7,969
|
|
9,017
|
|
(679
|
)
|
8,338
|
|
2006/16
|
2016
|
|||||||||||||||||||||||
|
Post Coles Corner Retail
|
Dallas, TX
|
—
|
|
347
|
|
716
|
|
—
|
|
26
|
|
347
|
|
742
|
|
1,089
|
|
(79
|
)
|
1,010
|
|
1998
|
2016
|
|||||||||||||||||||||||
|
Post Square Retail
|
Dallas, TX
|
—
|
|
1,581
|
|
5,982
|
|
—
|
|
149
|
|
1,581
|
|
6,131
|
|
7,712
|
|
(562
|
)
|
7,150
|
|
1996
|
2016
|
|||||||||||||||||||||||
|
Post Worthington Retail
|
Dallas, TX
|
—
|
|
108
|
|
495
|
|
—
|
|
94
|
|
108
|
|
589
|
|
697
|
|
(39
|
)
|
658
|
|
1993/2008
|
2016
|
|||||||||||||||||||||||
|
Post Heights Retail
|
Dallas, TX
|
—
|
|
1,066
|
|
3,314
|
|
—
|
|
75
|
|
1,066
|
|
3,389
|
|
4,455
|
|
(329
|
)
|
4,126
|
|
1997
|
2016
|
|||||||||||||||||||||||
|
Post Eastside Retail
|
Dallas, TX
|
—
|
|
682
|
|
10,645
|
|
—
|
|
104
|
|
682
|
|
10,749
|
|
11,431
|
|
(966
|
)
|
10,465
|
|
2008
|
2016
|
|||||||||||||||||||||||
|
Post Addison Circle Retail
|
Dallas, TX
|
—
|
|
448
|
|
21,386
|
|
—
|
|
1,195
|
|
448
|
|
22,581
|
|
23,029
|
|
(2,431
|
)
|
20,598
|
|
1998-2000
|
2016
|
|||||||||||||||||||||||
|
Post Addison Circle Office
|
Dallas, TX
|
—
|
|
1,395
|
|
4,280
|
|
—
|
|
444
|
|
1,395
|
|
4,724
|
|
6,119
|
|
(641
|
)
|
5,478
|
|
1998-2000
|
2016
|
|||||||||||||||||||||||
|
Post Sierra Frisco Bridges Retail
|
Dallas, TX
|
—
|
|
779
|
|
6,593
|
|
—
|
|
444
|
|
779
|
|
7,037
|
|
7,816
|
|
(659
|
)
|
7,157
|
|
2009
|
2016
|
|||||||||||||||||||||||
|
Post Katy Trail Retail
|
Dallas, TX
|
—
|
|
465
|
|
4,883
|
|
—
|
|
27
|
|
465
|
|
4,910
|
|
5,375
|
|
(397
|
)
|
4,978
|
|
2010
|
2016
|
|||||||||||||||||||||||
|
Post Midtown Square Retail
|
Houston, TX
|
—
|
|
1,327
|
|
16,005
|
|
—
|
|
89
|
|
1,327
|
|
16,094
|
|
17,421
|
|
(1,350
|
)
|
16,071
|
|
1999/2013
|
2016
|
|||||||||||||||||||||||
|
Rise Condo Devel LP Retail
|
Houston, TX
|
—
|
|
—
|
|
2,280
|
|
—
|
|
1
|
|
—
|
|
2,281
|
|
2,281
|
|
(217
|
)
|
2,064
|
|
1999/2013
|
2016
|
|||||||||||||||||||||||
|
Post Legacy Retail
|
Dallas, TX
|
—
|
|
150
|
|
3,334
|
|
—
|
|
202
|
|
150
|
|
3,536
|
|
3,686
|
|
(289
|
)
|
3,397
|
|
2000
|
2016
|
|||||||||||||||||||||||
|
Post South Lamar Retail
|
Austin, TX
|
—
|
|
421
|
|
3,072
|
|
—
|
|
209
|
|
421
|
|
3,281
|
|
3,702
|
|
(291
|
)
|
3,411
|
|
2011
|
2016
|
|||||||||||||||||||||||
|
Total Commercial Properties
|
|
—
|
|
|
32,482
|
|
167,957
|
|
917
|
|
17,905
|
|
33,399
|
|
185,862
|
|
219,261
|
|
(18,997
|
)
|
200,264
|
|
|
|||||||||||||||||||||||
|
Post Parkside at Wade III
|
Raleigh, NC
|
—
|
|
2,200
|
|
—
|
|
—
|
|
6,134
|
|
2,200
|
|
6,134
|
|
8,334
|
|
—
|
|
8,334
|
|
N/A
|
2016
|
|||||||||||||||||||||||
|
Post Sierra at Frisco Bridges II
|
Dallas, TX
|
—
|
|
6,100
|
|
—
|
|
—
|
|
7,290
|
|
6,100
|
|
7,290
|
|
13,390
|
|
—
|
|
13,390
|
|
N/A
|
2016
|
|||||||||||||||||||||||
|
Sync 36 II
|
Denver, CO
|
—
|
|
5,090
|
|
—
|
|
—
|
|
6,595
|
|
5,090
|
|
6,595
|
|
11,685
|
|
—
|
|
11,685
|
|
N/A
|
2018
|
|||||||||||||||||||||||
|
Total Active Development Properties
|
|
—
|
|
|
13,390
|
|
—
|
|
—
|
|
20,019
|
|
13,390
|
|
20,019
|
|
33,409
|
|
—
|
|
33,409
|
|
|
|||||||||||||||||||||||
|
Total Properties
|
|
180,979
|
|
|
1,862,632
|
|
10,100,835
|
|
6,196
|
|
1,593,321
|
|
1,868,828
|
|
11,694,634
|
|
13,563,462
|
|
(2,531,535
|
)
|
11,031,927
|
|
|
|||||||||||||||||||||||
|
Total Land Held for Future Developments
|
—
|
|
|
58,257
|
|
—
|
|
—
|
|
—
|
|
58,257
|
|
—
|
|
58,257
|
|
—
|
|
58,257
|
|
N/A
|
Various
|
|||||||||||||||||||||||
|
Corporate Properties
|
—
|
|
—
|
|
—
|
|
—
|
|
35,088
|
|
—
|
|
35,088
|
|
35,088
|
|
(17,752
|
)
|
17,336
|
|
Various
|
Various
|
||||||||||||||||||||||||
|
Total Other
|
|
|
58,257
|
|
—
|
|
—
|
|
35,088
|
|
58,257
|
|
35,088
|
|
93,345
|
|
(17,752
|
)
|
75,593
|
|
||||||||||||||||||||||||||
|
Total Real Estate Assets, net of Joint Ventures
|
$
|
180,979
|
|
|
$
|
1,920,889
|
|
$
|
10,100,835
|
|
$
|
6,196
|
|
$
|
1,628,409
|
|
$
|
1,927,085
|
|
$
|
11,729,722
|
|
$
|
13,656,807
|
|
$
|
(2,549,287
|
)
|
$
|
11,107,520
|
|
|
||||||||||||||
|
(1)
|
Encumbered by a $172.1 million secured property mortgage, with a fixed interest rate of 4.44%, which matures on January 10, 2049.
|
|
(2)
|
Encumbered by a $123.2 million loan with a fixed interest rate of 5.08%, which matures on June 10, 2021.
|
|
(3)
|
The aggregate cost for federal income tax purposes was approximately $11.1 billion at December 31, 2018. The aggregate cost for book purposes exceeds the total gross amount of real estate assets for federal income tax purposes, principally due to purchase accounting adjustments recorded under accounting principles generally accepted in the United States of America.
|
|
(4)
|
Depreciation is recognized on a straight-line basis over the estimated useful asset life which ranges from 8 to 40 years for land improvements and buildings, 5 years for furniture, fixtures and equipment, and six months for the fair market value of residential leases.
|
F-43
|
Mid-America Apartment Communities, Inc. and Mid-America Apartments, L.P.
|
||||||||||
|
Schedule III - Real Estate and Accumulated Depreciation
|
||||||||||
|
Years ended December 31, 2018, 2017 and 2016
|
||||||||||
|
A summary of activity for real estate investments and accumulated depreciation is as follows (dollars in thousands):
|
||||||||||
|
|
2018
|
2017
|
2016
|
||||||||
|
Real estate investments:
|
|
|
|
|
|
|
|||||
|
Balance at beginning of year
|
$
|
13,292,039
|
|
$
|
12,972,170
|
|
$
|
8,215,768
|
|
||
|
Acquisitions
(1)
|
130,187
|
|
127,710
|
|
4,961,140
|
|
|||||
|
Less: FMV of leases included in acquisitions
|
(796
|
)
|
(1,488
|
)
|
(51,588
|
)
|
|||||
|
Improvement and development
|
253,954
|
|
322,829
|
|
202,614
|
|
|||||
|
Assets held for sale
|
—
|
|
(5,321
|
)
|
—
|
|
|||||
|
Disposition of real estate assets
(2)
|
(18,577
|
)
|
(123,861
|
)
|
(355,764
|
)
|
|||||
|
Balance at end of year
|
$
|
13,656,807
|
|
$
|
13,292,039
|
|
$
|
12,972,170
|
|
||
|
Accumulated depreciation:
|
|
|
|
|
|
|
|||||
|
Balance at beginning of year
|
$
|
2,075,071
|
|
$
|
1,674,801
|
|
$
|
1,499,213
|
|
||
|
Depreciation
|
485,654
|
|
463,590
|
|
314,076
|
|
|||||
|
Assets held for sale
|
—
|
|
—
|
|
—
|
|
|||||
|
Disposition of real estate assets
(2)
|
(11,438
|
)
|
(63,320
|
)
|
(138,488
|
)
|
|||||
|
Balance at end of year
|
$
|
2,549,287
|
|
$
|
2,075,071
|
|
$
|
1,674,801
|
|
||
(1)
Includes non-cash activity related to acquisitions.
(2)
Includes assets sold, casualty losses, and removal of certain fully depreciated assets.
See accompanying reports of independent registered public accounting firm.
F-44
TABLE OF CONTENTS
Part IItem 1. BusinessItem 1A. Risk FactorsItem 1B. Unresolved Staff CommentsItem 2. PropertiesItem 3. Legal ProceedingsItem 4. Mine Safety DisclosuresPart IIItem 5. Market For Registrant's Common Equity, Related Stockholder Matters and Issuer Purchases Of Equity SecuritiesItem 6. Selected Financial DataItem 7. Management's Discussion and Analysis Of Financial Condition and Results Of OperationsItem 7A. Quantitative and Qualitative Disclosures About Market RiskItem 8. Financial Statements and Supplementary DataItem 9. Changes in and Disagreements with Accountants on Accounting and Financial DisclosureItem 9A. Controls and ProceduresItem 9B. Other InformationPart IIIItem 10. Directors, Executive Officers and Corporate GovernanceItem 11. Executive CompensationItem 12. Security Ownership Of Certain Beneficial Owners and Management and Related Stockholder MattersItem 13. Certain Relationships and Related Transactions, and Director IndependenceItem 14. Principal Accounting Fees and ServicesPart IVItem 15. Exhibits, Financial Statement SchedulesItem 16. Form 10-k Summary