|
|
|
|
|
|
|
|
|
|
|
|
|
|
|
|
|
|
|
|
|
|
|
|
|
|
|
|
|
|
|
|
|
|
|
|
|
|
|
|
|
|
|
|
|
|
|
|
|
|
|
|
|
|
|
|
Table of Contents
UNITED STATES
SECURITIES AND EXCHANGE COMMISSION
WASHINGTON, D.C. 20549
FORM 10-Q
| x | Quarterly Report pursuant to Section 13 or 15(d) of the Securities Exchange Act of 1934 |
For the quarterly period ended June 30, 2016
or
| ¨ | Transition Report Pursuant to Section 13 or 15(d) of the Securities Exchange Act of 1934 |
For the transition period from to

96 South George Street, Suite 520
York, Pennsylvania 17401
(Address of principal executive offices)
(717) 225-4711
(Registrant’s telephone number, including area code)
|
Commission file number |
Exact name of registrant as specified in its charter |
IRS Employer Identification No. |
State or other jurisdiction of incorporation or organization |
|||
| 1-03560 | P. H. Glatfelter Company | 23-0628360 | Pennsylvania |
N/A
(Former name or former address, if changed since last report)
Indicate by check mark whether the registrant (1) has filed all reports required to be filed by Section 13 or 15(d) of the Securities Exchange Act of 1934 during the preceding 12 months (or for such shorter period that the registrant was required to file such reports), and (2) has been subject to such filing requirements for at the past 90 days. Yes x No ¨ .
Indicate by check mark whether the registrant has submitted electronically and posted on its corporate Web site, if any, every Interactive Data File required to be submitted and posted pursuant to Rule 405 of Regulation S-T (§232.405 of this chapter) during the preceding 12 months (or for such shorter period that the registrant was required to submit and post such files). Yes x No ¨ .
Indicate by check mark whether the registrant is a large accelerated filer, an accelerated filer, a non-accelerated filer, or a small reporting company. See the definitions of “large accelerated filer”, “accelerated filer” and “smaller reporting company” in Rule 12b-2 of the Exchange Act.
| Large accelerated filer | x | Accelerated filer | ¨ | |||
| Non-accelerated filer | ¨ (Do not check if a smaller reporting company). | Small reporting company | ¨ | |||
Indicate by check mark whether the registrant is a shell company (as defined in Rule 12b-2 of the Exchange Act) Yes ¨ No x .
Common Stock outstanding on July 29, 2016 totaled 43,547,739 shares.
Table of Contents
P. H. GLATFELTER COMPANY AND
SUBSIDIARIES
REPORT ON FORM 10-Q
For the QUARTERLY PERIOD ENDED
June 30, 2016
Table of Contents
P. H. GLATFELTER COMPANY AND SUBSIDIARIES
(unaudited)
|
Three months ended
June 30 |
Six months ended
June 30 |
|||||||||||||||
|
In thousands, except per share |
2016 | 2015 | 2016 | 2015 | ||||||||||||
|
Net sales |
$ | 406,413 | $ | 410,803 | $ | 808,631 | $ | 828,272 | ||||||||
|
Energy and related sales, net |
2,001 | 715 | 2,667 | 2,783 | ||||||||||||
|
|
|
|
|
|
|
|
|
|||||||||
|
Total revenues |
408,414 | 411,518 | 811,298 | 831,055 | ||||||||||||
|
Costs of products sold |
365,691 | 378,685 | 710,732 | 746,114 | ||||||||||||
|
|
|
|
|
|
|
|
|
|||||||||
|
Gross profit |
42,723 | 32,833 | 100,566 | 84,941 | ||||||||||||
|
Selling, general and administrative expenses |
37,191 | 29,137 | 69,049 | 60,409 | ||||||||||||
|
(Gains) losses on dispositions of plant, equipment and timberlands, net |
2 | (111 | ) | 26 | (2,765 | ) | ||||||||||
|
|
|
|
|
|
|
|
|
|||||||||
|
Operating income |
5,530 | 3,807 | 31,491 | 27,297 | ||||||||||||
|
Non-operating income (expense) |
||||||||||||||||
|
Interest expense |
(3,953 | ) | (4,352 | ) | (8,069 | ) | (8,860 | ) | ||||||||
|
Interest income |
61 | 77 | 152 | 142 | ||||||||||||
|
Other, net |
317 | 215 | (383 | ) | 28 | |||||||||||
|
|
|
|
|
|
|
|
|
|||||||||
|
Total non-operating expense |
(3,575 | ) | (4,060 | ) | (8,300 | ) | (8,690 | ) | ||||||||
|
|
|
|
|
|
|
|
|
|||||||||
|
Income (loss) before income taxes |
1,955 | (253 | ) | 23,191 | 18,607 | |||||||||||
|
Income tax (benefit) provision |
(10 | ) | (3,101 | ) | 5,058 | 1,834 | ||||||||||
|
|
|
|
|
|
|
|
|
|||||||||
|
Net income |
$ | 1,965 | $ | 2,848 | $ | 18,133 | $ | 16,773 | ||||||||
|
|
|
|
|
|
|
|
|
|||||||||
|
Earnings per share |
||||||||||||||||
|
Basic |
$ | 0.05 | $ | 0.07 | $ | 0.42 | $ | 0.39 | ||||||||
|
Diluted |
0.04 | 0.06 | 0.41 | 0.38 | ||||||||||||
|
Cash dividends declared per common share |
$ | 0.125 | $ | 0.12 | $ | 0.25 | $ | 0.24 | ||||||||
|
Weighted average shares outstanding |
||||||||||||||||
|
Basic |
43,558 | 43,377 | 43,539 | 43,315 | ||||||||||||
|
Diluted |
44,062 | 44,032 | 43,963 | 43,992 | ||||||||||||
The accompanying notes are an integral part of these condensed consolidated financial statements.
- 2 -
GLATFELTER
6.30.16 Form 10-Q
Table of Contents
P. H. GLATFELTER COMPANY AND SUBSIDIARIES
CONDENSED CONSOLIDATED STATEMENTS OF COMPREHENSIVE INCOME
(unaudited)
|
Three months ended
June 30 |
Six months ended
June 30 |
|||||||||||||||
|
In thousands |
2016 | 2015 | 2016 | 2015 | ||||||||||||
|
Net income |
$ | 1,965 | $ | 2,848 | $ | 18,133 | $ | 16,773 | ||||||||
|
Foreign currency translation adjustments |
(14,864 | ) | 16,704 | (1,445 | ) | (24,633 | ) | |||||||||
|
Net change in: |
||||||||||||||||
|
Deferred gains on cash flow hedges, net of taxes of $(258), $956, $(201) and $(107), respectively |
944 | (2,501 | ) | 1,010 | 265 | |||||||||||
|
Unrecognized retirement obligations, net of taxes of $(1,442), $(1,769), $(2,809) and $(3,779), respectively |
2,381 | 2,884 | 4,638 | 6,170 | ||||||||||||
|
|
|
|
|
|
|
|
|
|||||||||
|
Other comprehensive income (loss) |
(11,539 | ) | 17,087 | 4,203 | (18,198 | ) | ||||||||||
|
|
|
|
|
|
|
|
|
|||||||||
|
Comprehensive income (loss) |
$ | (9,574 | ) | $ | 19,935 | $ | 22,336 | $ | (1,425 | ) | ||||||
|
|
|
|
|
|
|
|
|
|||||||||
The accompanying notes are an integral part of these condensed consolidated financial statements.
- 3 -
GLATFELTER
6.30.16 Form 10-Q
Table of Contents
P. H. GLATFELTER COMPANY AND SUBSIDIARIES
(unaudited)
| June 30 | December 31 | |||||||
|
In thousands |
2016 | 2015 | ||||||
| Assets | ||||||||
|
Cash and cash equivalents |
$ | 58,532 | $ | 105,304 | ||||
|
Accounts receivable, net |
175,336 | 167,199 | ||||||
|
Inventories |
257,623 | 247,214 | ||||||
|
Prepaid expenses and other current assets |
33,094 | 32,650 | ||||||
|
|
|
|
|
|||||
|
Total current assets |
524,585 | 552,367 | ||||||
|
Plant, equipment and timberlands, net |
748,036 | 698,864 | ||||||
|
Goodwill |
77,044 | 76,056 | ||||||
|
Intangible assets |
61,625 | 63,057 | ||||||
|
Other assets |
113,894 | 110,072 | ||||||
|
|
|
|
|
|||||
|
Total assets |
$ | 1,525,184 | $ | 1,500,416 | ||||
|
|
|
|
|
|||||
| Liabilities and Shareholders’ Equity | ||||||||
|
Current portion of long-term debt |
$ | 9,098 | $ | 7,366 | ||||
|
Accounts payable |
169,869 | 172,735 | ||||||
|
Dividends payable |
5,455 | 5,231 | ||||||
|
Environmental liabilities |
11,361 | 12,544 | ||||||
|
Other current liabilities |
115,610 | 106,444 | ||||||
|
|
|
|
|
|||||
|
Total current liabilities |
311,393 | 304,320 | ||||||
|
Long-term debt |
358,366 | 353,296 | ||||||
|
Deferred income taxes |
75,155 | 76,458 | ||||||
|
Other long-term liabilities |
104,047 | 103,095 | ||||||
|
|
|
|
|
|||||
|
Total liabilities |
848,961 | 837,169 | ||||||
|
Commitments and contingencies |
— | — | ||||||
|
Shareholders’ equity |
||||||||
|
Common stock |
544 | 544 | ||||||
|
Capital in excess of par value |
54,530 | 54,912 | ||||||
|
Retained earnings |
970,374 | 963,143 | ||||||
|
Accumulated other comprehensive loss |
(186,283 | ) | (190,486 | ) | ||||
|
|
|
|
|
|||||
| 839,165 | 828,113 | |||||||
|
Less cost of common stock in treasury |
(162,942 | ) | (164,866 | ) | ||||
|
|
|
|
|
|||||
|
Total shareholders’ equity |
676,223 | 663,247 | ||||||
|
|
|
|
|
|||||
|
Total liabilities and shareholders’ equity |
$ | 1,525,184 | $ | 1,500,416 | ||||
|
|
|
|
|
|||||
The accompanying notes are an integral part of these condensed consolidated financial statements.
- 4 -
GLATFELTER
6.30.16 Form 10-Q
Table of Contents
P. H. GLATFELTER COMPANY AND SUBSIDIARIES
(unaudited)
|
Six months ended
June 30 |
||||||||
|
In thousands |
2016 | 2015 | ||||||
|
Operating activities |
||||||||
|
Net income |
$ | 18,133 | $ | 16,773 | ||||
|
Adjustments to reconcile to net cash provided by operations: |
||||||||
|
Depreciation, depletion and amortization |
33,411 | 31,602 | ||||||
|
Amortization of debt issue costs |
574 | 599 | ||||||
|
Pension expense, net of unfunded benefits paid |
1,964 | 3,699 | ||||||
|
Deferred income tax (benefit) provision |
(2,672 | ) | 2,501 | |||||
|
Losses (gains) on dispositions of plant, equipment and timberlands, net |
26 | (2,765 | ) | |||||
|
Share-based compensation |
2,803 | 3,663 | ||||||
|
Change in operating assets and liabilities |
||||||||
|
Accounts receivable |
(8,471 | ) | (20,783 | ) | ||||
|
Inventories |
(12,295 | ) | (8,609 | ) | ||||
|
Prepaid and other current assets |
(163 | ) | (1,678 | ) | ||||
|
Accounts payable |
(3,027 | ) | (989 | ) | ||||
|
Accruals and other current liabilities |
5,252 | 2,735 | ||||||
|
Other |
1,105 | (1,235 | ) | |||||
|
|
|
|
|
|||||
|
Net cash provided by operating activities |
36,640 | 25,513 | ||||||
|
Investing activities |
||||||||
|
Expenditures for purchases of plant, equipment and timberlands |
(80,391 | ) | (44,575 | ) | ||||
|
Proceeds from disposals of plant, equipment and timberlands, net |
53 | 3,051 | ||||||
|
Other |
(300 | ) | (1,600 | ) | ||||
|
|
|
|
|
|||||
|
Net cash used by investing activities |
(80,638 | ) | (43,124 | ) | ||||
|
Financing activities |
||||||||
|
Net repayments of revolving credit facility |
(11,403 | ) | — | |||||
|
Payments of borrowing costs |
(136 | ) | (1,329 | ) | ||||
|
Proceeds from term loans |
19,428 | — | ||||||
|
Repayment of term loans |
(3,803 | ) | (1,492 | ) | ||||
|
Payments of dividends |
(10,679 | ) | (9,992 | ) | ||||
|
Proceeds from government grants |
4,443 | — | ||||||
|
Payments related to share-based compensation awards and other |
(976 | ) | (2,000 | ) | ||||
|
|
|
|
|
|||||
|
Net cash used by financing activities |
(3,126 | ) | (14,813 | ) | ||||
|
Effect of exchange rate changes on cash |
352 | (1,651 | ) | |||||
|
|
|
|
|
|||||
|
Net decrease in cash and cash equivalents |
(46,772 | ) | (34,075 | ) | ||||
|
Cash and cash equivalents at the beginning of period |
105,304 | 99,837 | ||||||
|
|
|
|
|
|||||
|
Cash and cash equivalents at the end of period |
$ | 58,532 | $ | 65,762 | ||||
|
|
|
|
|
|||||
|
Supplemental cash flow information |
||||||||
|
Cash paid for: |
||||||||
|
Interest, net of amounts capitalized |
$ | 7,509 | $ | 8,281 | ||||
|
Income taxes, net |
8,486 | 10,234 | ||||||
The accompanying notes are an integral part of these condensed consolidated financial statements.
- 5 -
GLATFELTER
6.30.16 Form 10-Q
Table of Contents
P. H. GLATFELTER COMPANY AND SUBSIDIARIES
NOTES TO CONDENSED CONSOLIDATED FINANCIAL STATEMENTS
(unaudited)
- 6 -
GLATFELTER
6.30.16 Form 10-Q
Table of Contents
- 7 -
GLATFELTER
6.30.16 Form 10-Q
Table of Contents
| 4. | ACCUMULATED OTHER COMPREHENSIVE INCOME |
The following table sets forth details of the changes in accumulated other comprehensive income (losses) for the three months and six months ended June 30, 2016 and 2015.
|
in thousands |
Currency
translation adjustments |
Unrealized gain
(loss) on cash flow hedges |
Change in
pensions |
Change in other
postretirement defined benefit plans |
Total | |||||||||||||||
|
Balance at April 1, 2016 |
$ | (59,622 | ) | $ | (159 | ) | $ | (118,399 | ) | $ | 3,436 | $ | (174,744 | ) | ||||||
|
Other comprehensive income before reclassifications (net of tax) |
(14,864 | ) | 837 | — | — | (14,027 | ) | |||||||||||||
|
Amounts reclassified from accumulated other comprehensive income (net of tax) |
— | 107 | 2,613 | (232 | ) | 2,488 | ||||||||||||||
|
|
|
|
|
|
|
|
|
|
|
|||||||||||
|
Net current period other comprehensive income (loss) |
(14,864 | ) | 944 | 2,613 | (232 | ) | (11,539 | ) | ||||||||||||
|
|
|
|
|
|
|
|
|
|
|
|||||||||||
|
Balance at June 30, 2016 |
$ | (74,486 | ) | $ | 785 | $ | (115,786 | ) | $ | 3,204 | $ | (186,283 | ) | |||||||
|
|
|
|
|
|
|
|
|
|
|
|||||||||||
|
Balance at April 1, 2015 |
$ | (75,561 | ) | $ | 5,122 | $ | (116,994 | ) | $ | (2,722 | ) | $ | (190,155 | ) | ||||||
|
Other comprehensive income before reclassifications (net of tax) |
16,704 | (1,220 | ) | — | — | 15,484 | ||||||||||||||
|
Amounts reclassified from accumulated other comprehensive income (net of tax) |
— | (1,281 | ) | 2,918 | (34 | ) | 1,603 | |||||||||||||
|
|
|
|
|
|
|
|
|
|
|
|||||||||||
|
Net current period other comprehensive income (loss) |
16,704 | (2,501 | ) | 2,918 | (34 | ) | 17,087 | |||||||||||||
|
|
|
|
|
|
|
|
|
|
|
|||||||||||
|
Balance at June 30, 2015 |
$ | (58,857 | ) | $ | 2,621 | $ | (114,076 | ) | $ | (2,756 | ) | $ | (173,068 | ) | ||||||
|
|
|
|
|
|
|
|
|
|
|
|||||||||||
|
in thousands |
Currency
translation adjustments |
Unrealized gain
(loss) on cash flow hedges |
Change in
pensions |
Change in other
postretirement defined benefit plans |
Total | |||||||||||||||
|
Balance at January 1, 2016 |
$ | (73,041 | ) | $ | (225 | ) | $ | (120,714 | ) | $ | 3,494 | $ | (190,486 | ) | ||||||
|
Other comprehensive income before reclassifications (net of tax) |
(1,445 | ) | 1,089 | — | — | (356 | ) | |||||||||||||
|
Amounts reclassified from accumulated other comprehensive income (net of tax) |
— | (79 | ) | 4,928 | (290 | ) | 4,559 | |||||||||||||
|
|
|
|
|
|
|
|
|
|
|
|||||||||||
|
Net current period other comprehensive income (loss) |
(1,445 | ) | $ | 1,010 | 4,928 | (290 | ) | 4,203 | ||||||||||||
|
|
|
|
|
|
|
|
|
|
|
|||||||||||
|
Balance at June 30, 2016 |
$ | (74,486 | ) | $ | 785 | $ | (115,786 | ) | $ | 3,204 | $ | (186,283 | ) | |||||||
|
|
|
|
|
|
|
|
|
|
|
|||||||||||
|
Balance at January 1, 2015 |
$ | (34,224 | ) | $ | 2,356 | $ | (120,260 | ) | $ | (2,742 | ) | $ | (154,870 | ) | ||||||
|
Other comprehensive income before reclassifications (net of tax) |
(24,633 | ) | 2,174 | — | — | (22,459 | ) | |||||||||||||
|
Amounts reclassified from accumulated other comprehensive income (net of tax) |
— | (1,909 | ) | 6,184 | (14 | ) | 4,261 | |||||||||||||
|
|
|
|
|
|
|
|
|
|
|
|||||||||||
|
Net current period other comprehensive income (loss) |
(24,633 | ) | 265 | 6,184 | (14 | ) | (18,198 | ) | ||||||||||||
|
|
|
|
|
|
|
|
|
|
|
|||||||||||
|
Balance at June 30, 2015 |
$ | (58,857 | ) | $ | 2,621 | $ | (114,076 | ) | $ | (2,756 | ) | $ | (173,068 | ) | ||||||
|
|
|
|
|
|
|
|
|
|
|
|||||||||||
- 8 -
GLATFELTER
6.30.16 Form 10-Q
Table of Contents
Reclassifications out of accumulated other comprehensive income were as follows:
|
Three months ended
June 30 |
Six months ended
June 30 |
|||||||||||||||||
|
In thousands |
2016 | 2015 | 2016 | 2015 | ||||||||||||||
| Description | Line Item in Statements of Income | |||||||||||||||||
|
Cash flow hedges (Note 12) |
||||||||||||||||||
|
(Gains) losses on cash flow hedges |
$ | 215 | $ | (1,750 | ) | $ | (83 | ) | $ | (2,623 | ) | Costs of products sold | ||||||
|
Tax expense (benefit) |
(108 | ) | 469 | 4 | 714 | Income tax provision | ||||||||||||
|
|
|
|
|
|
|
|
|
|||||||||||
|
Net of tax |
107 | (1,281 | ) | (79 | ) | (1,909 | ) | |||||||||||
|
Retirement plan obligations (Note 7) |
||||||||||||||||||
|
Amortization of deferred benefit pension plan items |
||||||||||||||||||
|
Prior service costs |
509 | 574 | 1,013 | 1,142 | Costs of products sold | |||||||||||||
| 166 | 187 | 336 | 379 | Selling, general and administrative | ||||||||||||||
|
Actuarial losses |
2,618 | 2,924 | 4,900 | 6,288 | Costs of products sold | |||||||||||||
| 915 | 1,023 | 1,687 | 2,165 | Selling, general and administrative | ||||||||||||||
|
|
|
|
|
|
|
|
|
|||||||||||
| 4,208 | 4,708 | 7,936 | 9,974 | |||||||||||||||
|
Tax benefit |
(1,595 | ) | (1,790 | ) | (3,008 | ) | (3,790 | ) | Income tax provision | |||||||||
|
|
|
|
|
|
|
|
|
|||||||||||
|
Net of tax |
2,613 | 2,918 | 4,928 | 6,184 | ||||||||||||||
|
Amortization of deferred benefit other plan items |
||||||||||||||||||
|
Prior service costs |
(38 | ) | (57 | ) | (75 | ) | (115 | ) | Costs of products sold | |||||||||
| (8 | ) | (13 | ) | (16 | ) | (25 | ) | Selling, general and administrative | ||||||||||
|
Actuarial losses |
(269 | ) | 12 | (311 | ) | 94 | Costs of products sold | |||||||||||
| (58 | ) | 3 | (67 | ) | 21 | Selling, general and administrative | ||||||||||||
|
|
|
|
|
|
|
|
|
|||||||||||
| (373 | ) | (55 | ) | (469 | ) | (25 | ) | |||||||||||
|
Tax expense |
141 | 21 | 179 | 11 | Income tax provision | |||||||||||||
|
|
|
|
|
|
|
|
|
|||||||||||
|
Net of tax |
(232 | ) | (34 | ) | (290 | ) | (14 | ) | ||||||||||
|
|
|
|
|
|
|
|
|
|||||||||||
|
Total reclassifications, net of tax |
$ | 2,488 | $ | 1,603 | $ | 4,559 | $ | 4,261 | ||||||||||
|
|
|
|
|
|
|
|
|
|||||||||||
- 9 -
GLATFELTER
6.30.16 Form 10-Q
Table of Contents
- 10 -
GLATFELTER
6.30.16 Form 10-Q
Table of Contents
- 11 -
GLATFELTER
6.30.16 Form 10-Q
Table of Contents
- 12 -
GLATFELTER
6.30.16 Form 10-Q
Table of Contents
|
- 13 - GLATFELTER 6.30.16 Form 10-Q |
Table of Contents
- 14 -
GLATFELTER
6.30.16 Form 10-Q
Table of Contents
|
- 15 - GLATFELTER 6.30.16 Form 10-Q |
Table of Contents
- 16 -
GLATFELTER
6.30.16 Form 10-Q
Table of Contents
- 17 -
GLATFELTER
6.30.16 Form 10-Q
Table of Contents
- 18 -
GLATFELTER
6.30.16 Form 10-Q
Table of Contents
- 19 -
GLATFELTER
6.30.16 Form 10-Q
Table of Contents
- 20 -
GLATFELTER
6.30.16 Form 10-Q
Table of Contents
| 14. | SEGMENT INFORMATION |
The following tables set forth financial and other information by business unit for the period indicated:
| Three months ended June 30 | Composite Fibers |
Advanced Airlaid
Materials |
Specialty Papers | Other and Unallocated | Total | |||||||||||||||||||||||||||||||||||
|
Dollars in millions |
||||||||||||||||||||||||||||||||||||||||
| 2016 | 2015 | 2016 | 2015 | 2016 | 2015 | 2016 | 2015 | 2016 | 2015 | |||||||||||||||||||||||||||||||
|
Net sales |
$ | 136.4 | $ | 140.4 | $ | 60.8 | $ | 57.5 | $ | 209.3 | $ | 212.9 | $ | — | $ | — | $ | 406.4 | $ | 410.8 | ||||||||||||||||||||
|
Energy and related sales, net |
— | — | — | — | 2.0 | 0.7 | — | — | 2.0 | 0.7 | ||||||||||||||||||||||||||||||
|
|
|
|
|
|
|
|
|
|
|
|
|
|
|
|
|
|
|
|
|
|||||||||||||||||||||
|
Total revenue |
136.4 | 140.4 | 60.8 | 57.5 | 211.3 | 213.6 | — | — | 408.4 | 411.5 | ||||||||||||||||||||||||||||||
|
Cost of products sold |
109.0 | 112.4 | 51.8 | 52.3 | 202.9 | 211.9 | 2.0 | 2.1 | 365.7 | 378.7 | ||||||||||||||||||||||||||||||
|
|
|
|
|
|
|
|
|
|
|
|
|
|
|
|
|
|
|
|
|
|||||||||||||||||||||
|
Gross profit (loss) |
27.4 | 28.0 | 9.0 | 5.2 | 8.4 | 1.7 | (2.0 | ) | (2.1 | ) | 42.7 | 32.8 | ||||||||||||||||||||||||||||
|
SG&A |
12.1 | 11.3 | 2.2 | 2.1 | 14.2 | 11.7 | 8.7 | 4.0 | 37.2 | 29.1 | ||||||||||||||||||||||||||||||
|
Gains on dispositions of plant, equipment and timberlands, net |
— | — | — | — | — | — | — | (0.1 | ) | — | (0.1 | ) | ||||||||||||||||||||||||||||
|
|
|
|
|
|
|
|
|
|
|
|
|
|
|
|
|
|
|
|
|
|||||||||||||||||||||
|
Total operating income (loss) |
15.3 | 16.7 | 6.8 | 3.1 | (5.8 | ) | (10.0 | ) | (10.7 | ) | (6.0 | ) | 5.5 | 3.8 | ||||||||||||||||||||||||||
|
Non-operating expense |
— | — | — | — | — | — | (3.6 | ) | (4.1 | ) | (3.6 | ) | (4.1 | ) | ||||||||||||||||||||||||||
|
|
|
|
|
|
|
|
|
|
|
|
|
|
|
|
|
|
|
|
|
|||||||||||||||||||||
|
Income (loss) before income taxes |
$ | 15.3 | $ | 16.7 | $ | 6.8 | $ | 3.1 | $ | (5.8 | ) | $ | (10.0 | ) | $ | (14.3 | ) | $ | (10.1 | ) | $ | 2.0 | $ | (0.3 | ) | |||||||||||||||
|
|
|
|
|
|
|
|
|
|
|
|
|
|
|
|
|
|
|
|
|
|||||||||||||||||||||
|
Supplementary Data |
||||||||||||||||||||||||||||||||||||||||
|
Net tons sold (thousands) |
40.7 | 39.4 | 24.4 | 22.6 | 194.7 | 191.3 | — | — | 259.7 | 253.3 | ||||||||||||||||||||||||||||||
|
Depreciation, depletion and amortization |
$ | 7.2 | $ | 6.7 | $ | 2.4 | $ | 2.1 | $ | 6.5 | $ | 6.3 | $ | 0.7 | $ | 0.5 | $ | 16.8 | $ | 15.6 | ||||||||||||||||||||
|
Capital expenditures |
2.3 | 5.6 | 6.1 | 1.5 | 28.7 | 15.6 | — | 0.1 | 37.1 | 22.8 | ||||||||||||||||||||||||||||||
| Six months ended June 30 | Composite Fibers |
Advanced Airlaid
Materials |
Specialty Papers | Other and Unallocated | Total | |||||||||||||||||||||||||||||||||||
|
Dollars in millions |
||||||||||||||||||||||||||||||||||||||||
| 2016 | 2015 | 2016 | 2015 | 2016 | 2015 | 2016 | 2015 | 2016 | 2015 | |||||||||||||||||||||||||||||||
|
Net sales |
$ | 259.9 | $ | 275.7 | $ | 121.5 | $ | 119.8 | $ | 427.2 | $ | 432.8 | $ | — | $ | — | $ | 808.6 | $ | 828.3 | ||||||||||||||||||||
|
Energy and related sales, net |
— | — | — | — | 2.7 | 2.8 | — | — | 2.7 | 2.8 | ||||||||||||||||||||||||||||||
|
|
|
|
|
|
|
|
|
|
|
|
|
|
|
|
|
|
|
|
|
|||||||||||||||||||||
|
Total revenue |
259.9 | 275.7 | 121.5 | 119.8 | 429.9 | 435.6 | — | — | 811.3 | 831.1 | ||||||||||||||||||||||||||||||
|
Cost of products sold |
210.3 | 221.5 | 104.1 | 107.3 | 394.0 | 412.3 | 2.3 | 5.0 | 710.7 | 746.1 | ||||||||||||||||||||||||||||||
|
|
|
|
|
|
|
|
|
|
|
|
|
|
|
|
|
|
|
|
|
|||||||||||||||||||||
|
Gross profit (loss) |
49.6 | 54.2 | 17.4 | 12.5 | 35.9 | 23.3 | (2.3 | ) | (5.0 | ) | 100.6 | 84.9 | ||||||||||||||||||||||||||||
|
SG&A |
23.2 | 22.9 | 4.2 | 4.0 | 26.6 | 23.9 | 15.0 | 9.5 | 69.0 | 60.4 | ||||||||||||||||||||||||||||||
|
Gains on dispositions of plant, equipment and timberlands, net |
— | — | — | — | — | — | — | (2.8 | ) | — | (2.8 | ) | ||||||||||||||||||||||||||||
|
|
|
|
|
|
|
|
|
|
|
|
|
|
|
|
|
|
|
|
|
|||||||||||||||||||||
|
Total operating income (loss) |
26.4 | 31.3 | 13.2 | 8.5 | 9.3 | (0.6 | ) | (17.3 | ) | (11.7 | ) | 31.5 | 27.3 | |||||||||||||||||||||||||||
|
Non-operating expense |
— | — | — | — | — | — | (8.3 | ) | (8.7 | ) | (8.3 | ) | (8.7 | ) | ||||||||||||||||||||||||||
|
|
|
|
|
|
|
|
|
|
|
|
|
|
|
|
|
|
|
|
|
|||||||||||||||||||||
|
Income (loss) before income taxes |
$ | 26.4 | $ | 31.3 | $ | 13.2 | $ | 8.5 | $ | 9.3 | $ | (0.6 | ) | $ | (25.6 | ) | $ | (20.4 | ) | $ | 23.2 | $ | 18.6 | |||||||||||||||||
|
|
|
|
|
|
|
|
|
|
|
|
|
|
|
|
|
|
|
|
|
|||||||||||||||||||||
|
Supplementary Data |
||||||||||||||||||||||||||||||||||||||||
|
Net tons sold (thousands) |
77.6 | 77.3 | 48.9 | 46.7 | 400.5 | 390.0 | — | — | 527.0 | 514.0 | ||||||||||||||||||||||||||||||
|
Depreciation, depletion and amortization |
$ | 14.3 | $ | 13.4 | $ | 4.7 | $ | 4.3 | $ | 13.2 | $ | 12.9 | $ | 1.2 | $ | 1.0 | $ | 33.4 | $ | 31.6 | ||||||||||||||||||||
|
Capital expenditures |
8.6 | 11.5 | 20.7 | 2.8 | 50.8 | 28.8 | 0.3 | 1.5 | 80.4 | 44.6 | ||||||||||||||||||||||||||||||
The sum of individual amounts set forth above may not agree to the consolidated financial statements included herein due to rounding.
- 21 -
GLATFELTER
6.30.16 Form 10-Q
Table of Contents
| 15. | CONDENSED CONSOLIDATING FINANCIAL STATEMENTS |
Our 5.375% Notes issued by P. H. Glatfelter Company (the “Parent”) are fully and unconditionally guaranteed, on a joint and several basis, by certain of our 100%-owned domestic subsidiaries, PHG Tea Leaves, Inc., Mollanvick, Inc., Glatfelter Composite Fibers N. A., Inc. (“CFNA”), Glatfelter Advance Materials N.A., Inc. (“GAMNA”), and Glatfelter Holdings, LLC. The guarantees are subject to certain customary release provisions including i) the designation of such subsidiary as an unrestricted or excluded subsidiary; (ii) in connection with any sale or disposition of the capital stock of the subsidiary guarantor; and (iii) upon our exercise of our legal defeasance option or our covenant defeasance option, all of which are more fully described in the Indenture dated as of October 3, 2012 and the First Supplemental Indenture dated as of October 27, 2015, among us, the Guarantors and US Bank National Association, as Trustee, relating to the 5.375% Notes.
The following presents our condensed consolidating statements of income, including comprehensive income for the three months and six months ended June 30, 2016, our condensed consolidating cash flows for the six months ended June 30, 2016 and 2015 and our condensed consolidating balance sheets as of June 30, 2016 and December 31, 2015. The condensed consolidating financial statements set forth below include the addition of CFNA and GAMNA as guarantors during 2015.
Condensed Consolidating Statement of Income for the Three months ended June 30, 2016
|
In thousands |
Parent
Company |
Guarantors |
Non
Guarantors |
Adjustments/
Eliminations |
Consolidated | |||||||||||||||
|
Net sales |
$ | 209,269 | $ | 17,561 | $ | 196,675 | $ | (17,092 | ) | $ | 406,413 | |||||||||
|
Energy and related sales, net |
2,001 | — | — | — | 2,001 | |||||||||||||||
|
|
|
|
|
|
|
|
|
|
|
|||||||||||
|
Total revenues |
211,270 | 17,561 | 196,675 | (17,092 | ) | 408,414 | ||||||||||||||
|
Costs of products sold |
204,495 | 16,711 | 161,577 | (17,092 | ) | 365,691 | ||||||||||||||
|
|
|
|
|
|
|
|
|
|
|
|||||||||||
|
Gross profit |
6,775 | 850 | 35,098 | — | 42,723 | |||||||||||||||
|
Selling, general and administrative expenses |
22,622 | (36 | ) | 14,605 | — | 37,191 | ||||||||||||||
|
Loss on dispositions of plant, equipment and timberlands, net |
2 | — | — | — | 2 | |||||||||||||||
|
|
|
|
|
|
|
|
|
|
|
|||||||||||
|
Operating income (loss) |
(15,849 | ) | 886 | 20,493 | — | 5,530 | ||||||||||||||
|
Other non-operating income (expense) |
||||||||||||||||||||
|
Interest expense |
(4,289 | ) | — | (814 | ) | 1,150 | (3,953 | ) | ||||||||||||
|
Interest income |
169 | 1,001 | 41 | (1,150 | ) | 61 | ||||||||||||||
|
Equity in earnings of subsidiaries |
16,385 | 16,071 | — | (32,456 | ) | — | ||||||||||||||
|
Other, net |
(575 | ) | (1,421 | ) | 2,313 | — | 317 | |||||||||||||
|
|
|
|
|
|
|
|
|
|
|
|||||||||||
|
Total other non-operating income (expense) |
11,690 | 15,651 | 1,540 | (32,456 | ) | (3,575 | ) | |||||||||||||
|
|
|
|
|
|
|
|
|
|
|
|||||||||||
|
Income (loss) before income taxes |
(4,159 | ) | 16,537 | 22,033 | (32,456 | ) | 1,955 | |||||||||||||
|
Income tax provision (benefit) |
(6,124 | ) | 152 | 5,962 | — | (10 | ) | |||||||||||||
|
|
|
|
|
|
|
|
|
|
|
|||||||||||
|
Net income |
1,965 | 16,385 | 16,071 | (32,456 | ) | 1,965 | ||||||||||||||
|
Other comprehensive income (loss) |
(11,539 | ) | (13,937 | ) | (13,490 | ) | 27,427 | (11,539 | ) | |||||||||||
|
|
|
|
|
|
|
|
|
|
|
|||||||||||
|
Comprehensive income (loss) |
$ | (9,574 | ) | $ | 2,448 | $ | 2,581 | $ | (5,029 | ) | $ | (9,574 | ) | |||||||
|
|
|
|
|
|
|
|
|
|
|
|||||||||||
- 22 -
GLATFELTER
6.30.16 Form 10-Q
Table of Contents
Condensed Consolidating Statement of Income for the Six months ended June 30, 2016
|
In thousands |
Parent
Company |
Guarantors |
Non
Guarantors |
Adjustments/
Eliminations |
Consolidated | |||||||||||||||
|
Net sales |
$ | 427,157 | $ | 36,207 | $ | 381,141 | $ | (35,874 | ) | $ | 808,631 | |||||||||
|
Energy and related sales, net |
2,667 | — | — | — | 2,667 | |||||||||||||||
|
|
|
|
|
|
|
|
|
|
|
|||||||||||
|
Total revenues |
429,824 | 36,207 | 381,141 | (35,874 | ) | 811,298 | ||||||||||||||
|
Costs of products sold |
396,454 | 34,761 | 315,391 | (35,874 | ) | 710,732 | ||||||||||||||
|
|
|
|
|
|
|
|
|
|
|
|||||||||||
|
Gross profit |
33,370 | 1,446 | 65,750 | — | 100,566 | |||||||||||||||
|
Selling, general and administrative expenses |
41,067 | (221 | ) | 28,203 | — | 69,049 | ||||||||||||||
|
Loss on dispositions of plant, equipment and timberlands, net |
4 | — | 22 | — | 26 | |||||||||||||||
|
|
|
|
|
|
|
|
|
|
|
|||||||||||
|
Operating income (loss) |
(7,701 | ) | 1,667 | 37,525 | — | 31,491 | ||||||||||||||
|
Other non-operating income (expense) |
||||||||||||||||||||
|
Interest expense |
(8,704 | ) | — | (1,601 | ) | 2,236 | (8,069 | ) | ||||||||||||
|
Interest income |
350 | 1,993 | 45 | (2,236 | ) | 152 | ||||||||||||||
|
Equity in earnings of subsidiaries |
29,257 | 27,825 | — | (57,082 | ) | — | ||||||||||||||
|
Other, net |
(1,117 | ) | (1,401 | ) | 2,135 | — | (383 | ) | ||||||||||||
|
|
|
|
|
|
|
|
|
|
|
|||||||||||
|
Total other non-operating income (expense) |
19,786 | 28,417 | 579 | (57,082 | ) | (8,300 | ) | |||||||||||||
|
|
|
|
|
|
|
|
|
|
|
|||||||||||
|
Income before income taxes |
12,085 | 30,084 | 38,104 | (57,082 | ) | 23,191 | ||||||||||||||
|
Income tax provision (benefit) |
(6,048 | ) | 827 | 10,279 | — | 5,058 | ||||||||||||||
|
|
|
|
|
|
|
|
|
|
|
|||||||||||
|
Net income |
18,133 | 29,257 | 27,825 | (57,082 | ) | 18,133 | ||||||||||||||
|
Other comprehensive income (loss) |
4,203 | (384 | ) | (373 | ) | 757 | 4,203 | |||||||||||||
|
|
|
|
|
|
|
|
|
|
|
|||||||||||
|
Comprehensive income |
$ | 22,336 | $ | 28,873 | $ | 27,452 | $ | (56,325 | ) | $ | 22,336 | |||||||||
|
|
|
|
|
|
|
|
|
|
|
|||||||||||
- 23 -
GLATFELTER
6.30.16 Form 10-Q
Table of Contents
Condensed Consolidating Statement of Income for the Three months ended June 30, 2015
|
In thousands |
Parent
Company |
Guarantors |
Non
Guarantors |
Adjustments/
Eliminations |
Consolidated | |||||||||||||||
|
Net sales |
$ | 212,920 | $ | 22,667 | $ | 194,779 | $ | (19,563 | ) | $ | 410,803 | |||||||||
|
Energy and related sales, net |
715 | — | — | — | 715 | |||||||||||||||
|
|
|
|
|
|
|
|
|
|
|
|||||||||||
|
Total revenues |
213,635 | 22,667 | 194,779 | (19,563 | ) | 411,518 | ||||||||||||||
|
Costs of products sold |
212,472 | 21,921 | 163,855 | (19,563 | ) | 378,685 | ||||||||||||||
|
|
|
|
|
|
|
|
|
|
|
|||||||||||
|
Gross profit |
1,163 | 746 | 30,924 | — | 32,833 | |||||||||||||||
|
Selling, general and administrative expenses |
15,661 | 458 | 13,018 | — | 29,137 | |||||||||||||||
|
Loss on dispositions of plant, equipment and timberlands, net |
(51 | ) | — | (60 | ) | — | (111 | ) | ||||||||||||
|
|
|
|
|
|
|
|
|
|
|
|||||||||||
|
Operating income (loss) |
(14,447 | ) | 288 | 17,966 | — | 3,807 | ||||||||||||||
|
Other non-operating income (expense) |
||||||||||||||||||||
|
Interest expense |
(4,608 | ) | — | (6,370 | ) | 6,626 | (4,352 | ) | ||||||||||||
|
Interest income |
169 | 6,498 | 36 | (6,625 | ) | 77 | ||||||||||||||
|
Equity in earnings of subsidiaries |
17,478 | 11,305 | — | (28,783 | ) | — | ||||||||||||||
|
Other, net |
(746 | ) | (29 | ) | 990 | — | 215 | |||||||||||||
|
|
|
|
|
|
|
|
|
|
|
|||||||||||
|
Total other non-operating income (expense) |
12,293 | 17,774 | (5,344 | ) | (28,782 | ) | (4,060 | ) | ||||||||||||
|
|
|
|
|
|
|
|
|
|
|
|||||||||||
|
Income (loss) before income taxes |
(2,154 | ) | 18,062 | 12,622 | (28,782 | ) | (253 | ) | ||||||||||||
|
Income tax provision (benefit) |
(5,002 | ) | 584 | 1,317 | — | (3,101 | ) | |||||||||||||
|
|
|
|
|
|
|
|
|
|
|
|||||||||||
|
Net income |
2,848 | 17,478 | 11,305 | (28,782 | ) | 2,848 | ||||||||||||||
|
Other comprehensive income (loss) |
17,087 | 13,680 | (9,958 | ) | (3,722 | ) | 17,087 | |||||||||||||
|
|
|
|
|
|
|
|
|
|
|
|||||||||||
|
Comprehensive income |
$ | 19,935 | $ | 31,158 | $ | 1,347 | $ | (32,504 | ) | $ | 19,935 | |||||||||
|
|
|
|
|
|
|
|
|
|
|
|||||||||||
- 24 -
GLATFELTER
6.30.16 Form 10-Q
Table of Contents
Condensed Consolidating Statement of Income for the Six months ended June 30, 2015
|
In thousands |
Parent
Company |
Guarantors |
Non
Guarantors |
Adjustments/
Eliminations |
Consolidated | |||||||||||||||
|
Net sales |
$ | 432,796 | $ | 42,817 | $ | 392,877 | $ | (40,218 | ) | $ | 828,272 | |||||||||
|
Energy and related sales, net |
2,783 | — | — | — | 2,783 | |||||||||||||||
|
|
|
|
|
|
|
|
|
|
|
|||||||||||
|
Total revenues |
435,579 | 42,817 | 392,877 | (40,218 | ) | 831,055 | ||||||||||||||
|
Costs of products sold |
416,154 | 41,255 | 328,923 | (40,218 | ) | 746,114 | ||||||||||||||
|
|
|
|
|
|
|
|
|
|
|
|||||||||||
|
Gross profit |
19,425 | 1,562 | 63,954 | — | 84,941 | |||||||||||||||
|
Selling, general and administrative expenses |
32,843 | 955 | 26,611 | — | 60,409 | |||||||||||||||
|
Gains on dispositions of plant, equipment and timberlands, net |
(1,522 | ) | (1,183 | ) | (60 | ) | — | (2,765 | ) | |||||||||||
|
|
|
|
|
|
|
|
|
|
|
|||||||||||
|
Operating income (loss) |
(11,896 | ) | 1,790 | 37,403 | — | 27,297 | ||||||||||||||
|
Other non-operating income (expense) |
||||||||||||||||||||
|
Interest expense |
(9,425 | ) | — | (12,764 | ) | 13,329 | (8,860 | ) | ||||||||||||
|
Interest income |
331 | 13,097 | 41 | (13,327 | ) | 142 | ||||||||||||||
|
Equity in earnings of subsidiaries |
34,562 | 21,499 | — | (56,061 | ) | — | ||||||||||||||
|
Other, net |
(1,460 | ) | (159 | ) | 1,649 | (2 | ) | 28 | ||||||||||||
|
|
|
|
|
|
|
|
|
|
|
|||||||||||
|
Total other non-operating income (expense) |
24,008 | 34,437 | (11,074 | ) | (56,061 | ) | (8,690 | ) | ||||||||||||
|
|
|
|
|
|
|
|
|
|
|
|||||||||||
|
Income before income taxes |
12,112 | 36,227 | 26,329 | (56,061 | ) | 18,607 | ||||||||||||||
|
Income tax provision (benefit) |
(4,661 | ) | 1,665 | 4,830 | — | 1,834 | ||||||||||||||
|
|
|
|
|
|
|
|
|
|
|
|||||||||||
|
Net income |
16,773 | 34,562 | 21,499 | (56,061 | ) | 16,773 | ||||||||||||||
|
Other comprehensive income (loss) |
(18,198 | ) | (24,870 | ) | 28,890 | (4,020 | ) | (18,198 | ) | |||||||||||
|
|
|
|
|
|
|
|
|
|
|
|||||||||||
|
Comprehensive income (loss) |
$ | (1,425 | ) | $ | 9,692 | $ | 50,389 | $ | (60,081 | ) | $ | (1,425 | ) | |||||||
|
|
|
|
|
|
|
|
|
|
|
|||||||||||
- 25 -
GLATFELTER
6.30.16 Form 10-Q
Table of Contents
Condensed Consolidating Balance Sheet as of June 30, 2016
|
In thousands |
Parent
Company |
Guarantors |
Non
Guarantors |
Adjustments/
Eliminations |
Consolidated | |||||||||||||||
| Assets | ||||||||||||||||||||
|
Cash and cash equivalents |
$ | 6,512 | $ | 2,545 | $ | 49,475 | $ | — | $ | 58,532 | ||||||||||
|
Other current assets |
207,168 | 255,574 | 266,025 | (262,714 | ) | 466,053 | ||||||||||||||
|
Plant, equipment and timberlands, net |
329,041 | 18,507 | 400,488 | — | 748,036 | |||||||||||||||
|
Investments in subsidiaries |
783,479 | 535,117 | — | (1,318,596 | ) | — | ||||||||||||||
|
Other assets |
112,876 | — | 139,687 | — | 252,563 | |||||||||||||||
|
|
|
|
|
|
|
|
|
|
|
|||||||||||
|
Total assets |
$ | 1,439,076 | $ | 811,743 | $ | 855,675 | $ | (1,581,310 | ) | $ | 1,525,184 | |||||||||
|
|
|
|
|
|
|
|
|
|
|
|||||||||||
| Liabilities and Shareholders’ Equity | ||||||||||||||||||||
|
Current liabilities |
$ | 401,540 | $ | 28,180 | $ | 144,387 | $ | (262,714 | ) | $ | 311,393 | |||||||||
|
Long-term debt |
247,381 | — | 110,985 | — | 358,366 | |||||||||||||||
|
Deferred income taxes |
26,905 | (229 | ) | 48,479 | — | 75,155 | ||||||||||||||
|
Other long-term liabilities |
87,027 | 313 | 16,707 | — | 104,047 | |||||||||||||||
|
|
|
|
|
|
|
|
|
|
|
|||||||||||
|
Total liabilities |
762,853 | 28,264 | 320,558 | (262,714 | ) | 848,961 | ||||||||||||||
|
Shareholders’ equity |
676,223 | 783,479 | 535,117 | (1,318,596 | ) | 676,223 | ||||||||||||||
|
|
|
|
|
|
|
|
|
|
|
|||||||||||
|
Total liabilities and shareholders’ equity |
$ | 1,439,076 | $ | 811,743 | $ | 855,675 | $ | (1,581,310 | ) | $ | 1,525,184 | |||||||||
|
|
|
|
|
|
|
|
|
|
|
|||||||||||
Condensed Consolidating Balance Sheet as of December 31, 2015
|
In thousands |
Parent
Company |
Guarantors |
Non
Guarantors |
Adjustments/
Eliminations |
Consolidated | |||||||||||||||
| Assets | ||||||||||||||||||||
|
Cash and cash equivalents |
$ | 59,130 | $ | 465 | $ | 45,709 | $ | — | $ | 105,304 | ||||||||||
|
Other current assets |
199,690 | 238,515 | 239,367 | (230,509 | ) | 447,063 | ||||||||||||||
|
Plant, equipment and timberlands, net |
286,334 | 1,114 | 411,416 | — | 698,864 | |||||||||||||||
|
Investments in subsidiaries |
737,450 | 507,116 | — | (1,244,566 | ) | — | ||||||||||||||
|
Other assets |
106,586 | — | 142,599 | — | 249,185 | |||||||||||||||
|
|
|
|
|
|
|
|
|
|
|
|||||||||||
|
Total assets |
$ | 1,389,190 | $ | 747,210 | $ | 839,091 | $ | (1,475,075 | ) | $ | 1,500,416 | |||||||||
|
|
|
|
|
|
|
|
|
|
|
|||||||||||
| Liabilities and Shareholders’ Equity | ||||||||||||||||||||
|
Current liabilities |
$ | 363,037 | $ | 9,725 | $ | 162,081 | $ | (230,523 | ) | $ | 304,320 | |||||||||
|
Long-term debt |
247,075 | — | 106,221 | — | 353,296 | |||||||||||||||
|
Deferred income taxes |
28,561 | (79 | ) | 47,976 | — | 76,458 | ||||||||||||||
|
Other long-term liabilities |
87,270 | — | 15,825 | — | 103,095 | |||||||||||||||
|
|
|
|
|
|
|
|
|
|
|
|||||||||||
|
Total liabilities |
725,943 | 9,646 | 332,103 | (230,523 | ) | 837,169 | ||||||||||||||
|
Shareholders’ equity |
663,247 | 737,564 | 506,988 | (1,244,552 | ) | 663,247 | ||||||||||||||
|
|
|
|
|
|
|
|
|
|
|
|||||||||||
|
Total liabilities and shareholders’ equity |
$ | 1,389,190 | $ | 747,210 | $ | 839,091 | $ | (1,475,075 | ) | $ | 1,500,416 | |||||||||
|
|
|
|
|
|
|
|
|
|
|
|||||||||||
- 26 -
GLATFELTER
6.30.16 Form 10-Q
Table of Contents
Condensed Consolidating Statement of Cash Flows for the Six months ended June 30, 2016
|
In thousands |
Parent
Company |
Guarantors |
Non
Guarantors |
Adjustments/
Eliminations |
Consolidated | |||||||||||||||
|
Net cash provided (used) by |
||||||||||||||||||||
|
Operating activities |
$ | 17,067 | $ | 2,821 | $ | 16,752 | $ | — | $ | 36,640 | ||||||||||
|
Investing activities |
||||||||||||||||||||
|
Expenditures for purchases of plant, equipment and timberlands |
(51,043 | ) | (18,861 | ) | (10,487 | ) | — | (80,391 | ) | |||||||||||
|
Proceeds from disposals of plant, equipment and timberlands, net |
41 | — | 12 | — | 53 | |||||||||||||||
|
Repayments from intercompany loans |
— | 7,500 | — | (7,500 | ) | — | ||||||||||||||
|
Advances of intercompany loans |
— | (7,880 | ) | — | 7,880 | — | ||||||||||||||
|
Intercompany capital contributed |
(17,000 | ) | (500 | ) | — | 17,500 | — | |||||||||||||
|
Other |
(300 | ) | — | — | — | (300 | ) | |||||||||||||
|
|
|
|
|
|
|
|
|
|
|
|||||||||||
|
Total investing activities |
(68,302 | ) | (19,741 | ) | (10,475 | ) | 17,880 | (80,638 | ) | |||||||||||
|
Financing activities |
||||||||||||||||||||
|
Net long-term borrowings |
— | — | 4,222 | — | 4,222 | |||||||||||||||
|
Payments of borrowing costs |
(51 | ) | — | (85 | ) | — | (136 | ) | ||||||||||||
|
Payment of dividends to shareholders |
(10,679 | ) | — | — | — | (10,679 | ) | |||||||||||||
|
Repayments of intercompany loans |
— | — | (7,500 | ) | 7,500 | — | ||||||||||||||
|
Borrowings of intercompany loans |
7,880 | — | — | (7,880 | ) | — | ||||||||||||||
|
Intercompany capital (returned) received |
— | 17,000 | 500 | (17,500 | ) | — | ||||||||||||||
|
Proceeds from government grants |
2,443 | 2,000 | — | — | 4,443 | |||||||||||||||
|
Payments related to share-based compensation awards and other |
(976 | ) | — | — | — | (976 | ) | |||||||||||||
|
|
|
|
|
|
|
|
|
|
|
|||||||||||
|
Total financing activities |
(1,383 | ) | 19,000 | (2,863 | ) | (17,880 | ) | (3,126 | ) | |||||||||||
|
Effect of exchange rate on cash |
— | — | 352 | — | 352 | |||||||||||||||
|
|
|
|
|
|
|
|
|
|
|
|||||||||||
|
Net increase (decrease) in cash |
(52,618 | ) | 2,080 | 3,766 | — | (46,772 | ) | |||||||||||||
|
Cash at the beginning of period |
59,130 | 465 | 45,709 | — | 105,304 | |||||||||||||||
|
|
|
|
|
|
|
|
|
|
|
|||||||||||
|
Cash at the end of period |
$ | 6,512 | $ | 2,545 | $ | 49,475 | $ | — | $ | 58,532 | ||||||||||
|
|
|
|
|
|
|
|
|
|
|
|||||||||||
- 27 -
GLATFELTER
6.30.16 Form 10-Q
Table of Contents
Condensed Consolidating Statement of Cash Flows for the Six months ended June 30, 2015
|
In thousands |
Parent
Company |
Guarantors |
Non
Guarantors |
Adjustments/
Eliminations |
Consolidated | |||||||||||||||
|
Net cash provided (used) by |
||||||||||||||||||||
|
Operating activities |
$ | (4,343 | ) | $ | (695 | ) | $ | 30,551 | $ | — | $ | 25,513 | ||||||||
|
Investing activities |
||||||||||||||||||||
|
Expenditures for purchases of plant, equipment and timberlands |
(30,241 | ) | — | (14,334 | ) | — | (44,575 | ) | ||||||||||||
|
Proceeds from disposals of plant, equipment and timberlands, net |
1,581 | 1,213 | 257 | — | 3,051 | |||||||||||||||
|
Repayments from intercompany loans |
— | 48,855 | — | (48,855 | ) | — | ||||||||||||||
|
Advances of intercompany loans |
— | (38,690 | ) | — | 38,690 | — | ||||||||||||||
|
Intercompany capital (contributed) returned |
10,500 | (300 | ) | — | (10,200 | ) | — | |||||||||||||
|
Other |
(1,600 | ) | — | — | — | (1,600 | ) | |||||||||||||
|
|
|
|
|
|
|
|
|
|
|
|||||||||||
|
Total investing activities |
(19,760 | ) | 11,078 | (14,077 | ) | (20,365 | ) | (43,124 | ) | |||||||||||
|
Financing activities |
||||||||||||||||||||
|
Net repayments of indebtedness |
— | — | (1,492 | ) | — | (1,492 | ) | |||||||||||||
|
Payments of borrowing costs |
(1,329 | ) | — | — | — | (1,329 | ) | |||||||||||||
|
Payment of dividends to shareholders |
(9,992 | ) | — | — | — | (9,992 | ) | |||||||||||||
|
Repayments of intercompany loans |
(9,158 | ) | — | (39,697 | ) | 48,855 | — | |||||||||||||
|
Borrowings of intercompany loans |
38,690 | — | — | (38,690 | ) | — | ||||||||||||||
|
Intercompany capital (returned) received |
— | (10,500 | ) | 300 | 10,200 | — | ||||||||||||||
|
Payments related to share-based compensation awards and other |
(2,000 | ) | — | — | — | (2,000 | ) | |||||||||||||
|
|
|
|
|
|
|
|
|
|
|
|||||||||||
|
Total financing activities |
16,211 | (10,500 | ) | (40,889 | ) | 20,365 | (14,813 | ) | ||||||||||||
|
Effect of exchange rate on cash |
— | — | (1,651 | ) | — | (1,651 | ) | |||||||||||||
|
|
|
|
|
|
|
|
|
|
|
|||||||||||
|
Net decrease in cash |
(7,892 | ) | (117 | ) | (26,066 | ) | — | (34,075 | ) | |||||||||||
|
Cash at the beginning of period |
42,208 | 509 | 57,120 | — | 99,837 | |||||||||||||||
|
|
|
|
|
|
|
|
|
|
|
|||||||||||
|
Cash at the end of period |
$ | 34,316 | $ | 392 | $ | 31,054 | $ | — | $ | 65,762 | ||||||||||
|
|
|
|
|
|
|
|
|
|
|
|||||||||||
- 28 -
GLATFELTER
6.30.16 Form 10-Q
Table of Contents
- 29 -
GLATFELTER
6.30.16 Form 10-Q
Table of Contents
- 30 -
GLATFELTER
6.30.16 Form 10-Q
Table of Contents
Business Unit Performance
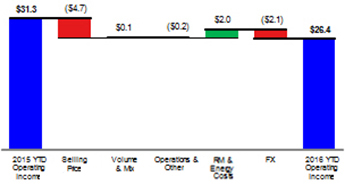
| Six months ended June 30 | Composite Fibers |
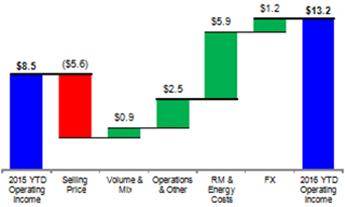
Advanced
Airlaid Materials |
Specialty Papers | Other and Unallocated | Total | |||||||||||||||||||||||||||||||||||
|
Dollars in millions |
||||||||||||||||||||||||||||||||||||||||
| 2016 | 2015 | 2016 | 2015 | 2016 | 2015 | 2016 | 2015 | 2016 | 2015 | |||||||||||||||||||||||||||||||
|
Net sales |
$ | 259.9 | $ | 275.7 | $ | 121.5 | $ | 119.8 | $ | 427.2 | $ | 432.8 | $ | — | $ | — | $ | 808.6 | $ | 828.3 | ||||||||||||||||||||
|
Energy and related sales, net |
— | — | — | — | 2.7 | 2.8 | — | — | 2.7 | 2.8 | ||||||||||||||||||||||||||||||
|
|
|
|
|
|
|
|
|
|
|
|
|
|
|
|
|
|
|
|
|
|||||||||||||||||||||
|
Total revenue |
259.9 | 275.7 | 121.5 | 119.8 | 429.9 | 435.6 | — | — | 811.3 | 831.1 | ||||||||||||||||||||||||||||||
|
Cost of products sold |
210.3 | 221.5 | 104.1 | 107.3 | 394.0 | 412.3 | 2.3 | 5.0 | 710.7 | 746.1 | ||||||||||||||||||||||||||||||
|
|
|
|
|
|
|
|
|
|
|
|
|
|
|
|
|
|
|
|
|
|||||||||||||||||||||
|
Gross profit (loss) |
49.6 | 54.2 | 17.4 | 12.5 | 35.9 | 23.3 | (2.3 | ) | (5.0 | ) | 100.6 | 84.9 | ||||||||||||||||||||||||||||
|
SG&A |
23.2 | 22.9 | 4.2 | 4.0 | 26.6 | 23.9 | 15.0 | 9.5 | 69.0 | 60.4 | ||||||||||||||||||||||||||||||
|
Gains on dispositions of plant, equipment and timberlands, net |
— | — | — | — | — | — | — | (2.8 | ) | — | (2.8 | ) | ||||||||||||||||||||||||||||
|
|
|
|
|
|
|
|
|
|
|
|
|
|
|
|
|
|
|
|
|
|||||||||||||||||||||
|
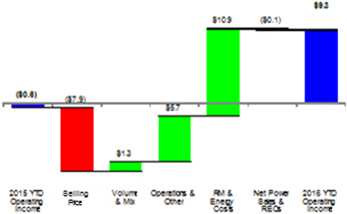
Total operating income (loss) |
26.4 | 31.3 | 13.2 | 8.5 | 9.3 | (0.6 | ) | (17.3 | ) | (11.7 | ) | 31.5 | 27.3 | |||||||||||||||||||||||||||
|
Non-operating expense |
— | — | — | — | — | — | (8.3 | ) | (8.7 | ) | (8.3 | ) | (8.7 | ) | ||||||||||||||||||||||||||
|
|
|
|
|
|
|
|
|
|
|
|
|
|
|
|
|
|
|
|
|
|||||||||||||||||||||
|
Income (loss) before income taxes |
$ | 26.4 | $ | 31.3 | $ | 13.2 | $ | 8.5 | $ | 9.3 | $ | (0.6 | ) | $ | (25.6 | ) | $ | (20.4 | ) | $ | 23.2 | $ | 18.6 | |||||||||||||||||
|
|
|
|
|
|
|
|
|
|
|
|
|
|
|
|
|
|
|
|
|
|||||||||||||||||||||
|
Supplementary Data |
||||||||||||||||||||||||||||||||||||||||
|
Net tons sold (thousands) |
77.6 | 77.3 | 48.9 | 46.7 | 400.5 | 390.0 | — | — | 527.0 | 514.0 | ||||||||||||||||||||||||||||||
|
Depreciation, depletion and amortization |
$ | 14.3 | $ | 13.4 | $ | 4.7 | $ | 4.3 | $ | 13.2 | $ | 12.9 | $ | 1.2 | $ | 1.0 | $ | 33.4 | $ | 31.6 | ||||||||||||||||||||
|
Capital expenditures |
8.6 | 11.5 | 20.7 | 2.8 | 50.8 | 28.8 | 0.3 | 1.5 | 80.4 | 44.6 | ||||||||||||||||||||||||||||||
The sum of individual amounts set forth above may not agree to the consolidated financial statements included herein due to rounding.
- 31 -
GLATFELTER
6.30.16 Form 10-Q
Table of Contents
- 32 -
GLATFELTER
6.30.16 Form 10-Q
Table of Contents
- 33 -
GLATFELTER
6.30.16 Form 10-Q
Table of Contents
Business Unit Performance
| Three months ended June 30 | Composite Fibers |
Advanced Airlaid
Materials |
Specialty Papers | Other and Unallocated | Total | |||||||||||||||||||||||||||||||||||
|
Dollars in millions |
||||||||||||||||||||||||||||||||||||||||
| 2016 | 2015 | 2016 | 2015 | 2016 | 2015 | 2016 | 2015 | 2016 | 2015 | |||||||||||||||||||||||||||||||
|
Net sales |
$ | 136.4 | $ | 140.4 | $ | 60.8 | $ | 57.5 | $ | 209.3 | $ | 212.9 | $ | — | $ | — | $ | 406.4 | $ | 410.8 | ||||||||||||||||||||
|
Energy and related sales, net |
— | — | — | — | 2.0 | 0.7 | — | — | 2.0 | 0.7 | ||||||||||||||||||||||||||||||
|
|
|
|
|
|
|
|
|
|
|
|
|
|
|
|
|
|
|
|
|
|||||||||||||||||||||
|
Total revenue |
136.4 | 140.4 | 60.8 | 57.5 | 211.3 | 213.6 | — | — | 408.4 | 411.5 | ||||||||||||||||||||||||||||||
|
Cost of products sold |
109.0 | 112.4 | 51.8 | 52.3 | 202.9 | 211.9 | 2.0 | 2.1 | 365.7 | 378.7 | ||||||||||||||||||||||||||||||
|
|
|
|
|
|
|
|
|
|
|
|
|
|
|
|
|
|
|
|
|
|||||||||||||||||||||
|
Gross profit (loss) |
27.4 | 28.0 | 9.0 | 5.2 | 8.4 | 1.7 | (2.0 | ) | (2.1 | ) | 42.7 | 32.8 | ||||||||||||||||||||||||||||
|
SG&A |
12.1 | 11.3 | 2.2 | 2.1 | 14.2 | 11.7 | 8.7 | 4.0 | 37.2 | 29.1 | ||||||||||||||||||||||||||||||
|
Gains on dispositions of plant, equipment and timberlands, net |
— | — | — | — | — | — | — | (0.1 | ) | — | (0.1 | ) | ||||||||||||||||||||||||||||
|
|
|
|
|
|
|
|
|
|
|
|
|
|
|
|
|
|
|
|
|
|||||||||||||||||||||
|
Total operating income (loss) |
15.3 | 16.7 | 6.8 | 3.1 | (5.8 | ) | (10.0 | ) | (10.7 | ) | (6.0 | ) | 5.5 | 3.8 | ||||||||||||||||||||||||||
|
Non-operating expense |
— | — | — | — | — | — | (3.6 | ) | (4.1 | ) | (3.6 | ) | (4.1 | ) | ||||||||||||||||||||||||||
|
|
|
|
|
|
|
|
|
|
|
|
|
|
|
|
|
|
|
|
|
|||||||||||||||||||||
|
Income (loss) before income taxes |
$ | 15.3 | $ | 16.7 | $ | 6.8 | $ | 3.1 | $ | (5.8 | ) | $ | (10.0 | ) | $ | (14.3 | ) | $ | (10.1 | ) | $ | 2.0 | $ | (0.3 | ) | |||||||||||||||
|
|
|
|
|
|
|
|
|
|
|
|
|
|
|
|
|
|
|
|
|
|||||||||||||||||||||
|
Supplementary Data |
||||||||||||||||||||||||||||||||||||||||
|
Net tons sold (thousands) |
40.7 | 39.4 | 24.4 | 22.6 | 194.7 | 191.3 | — | — | 259.7 | 253.3 | ||||||||||||||||||||||||||||||
|
Depreciation, depletion and amortization |
$ | 7.2 | $ | 6.7 | $ | 2.4 | $ | 2.1 | $ | 6.5 | $ | 6.3 | $ | 0.7 | $ | 0.5 | $ | 16.8 | $ | 15.6 | ||||||||||||||||||||
|
Capital expenditures |
2.3 | 5.6 | 6.1 | 1.5 | 28.7 | 15.6 | — | 0.1 | 37.1 | 22.8 | ||||||||||||||||||||||||||||||
The sum of individual amounts set forth above may not agree to the consolidated financial statements included herein due to rounding.
- 34 -
GLATFELTER
6.30.16 Form 10-Q
Table of Contents
- 35 -
GLATFELTER
6.30.16 Form 10-Q
Table of Contents
- 36 -
GLATFELTER
6.30.16 Form 10-Q
Table of Contents
- 37 -
GLATFELTER
6.30.16 Form 10-Q
Table of Contents
- 38 -
GLATFELTER
6.30.16 Form 10-Q
Table of Contents
| Year Ended December 31 | June 30, 2016 | |||||||||||||||||||||||||||
|
Dollars in thousands |
2017 | 2018 | 2019 | 2020 | 2021 |
Carrying
Value |
Fair Value | |||||||||||||||||||||
|
Long-term debt |
||||||||||||||||||||||||||||
|
Average principal outstanding |
||||||||||||||||||||||||||||
|
At fixed interest rates – Bond |
$ | 250,000 | $ | 250,000 | $ | 250,000 | $ | 250,000 | $ | 250,000 | $ | 250,000 | $ | 255,625 | ||||||||||||||
|
At fixed interest rates – Term Loans |
62,403 | 52,625 | 42,166 | 31,708 | 21,249 | 71,502 | 68,087 | |||||||||||||||||||||
|
At variable interest rates |
48,851 | 48,851 | 48,851 | 48,851 | 48,851 | 48,851 | 48,851 | |||||||||||||||||||||
|
|
|
|
|
|||||||||||||||||||||||||
| $ | 370,353 | $ | 372,563 | |||||||||||||||||||||||||
|
|
|
|
|
|||||||||||||||||||||||||
|
Weighted-average interest rate |
||||||||||||||||||||||||||||
|
On fixed rate debt – Bond |
5.375 | % | 5.375 | % | 5.375 | % | 5.375 | % | 5.375 | % | ||||||||||||||||||
|
On fixed rate debt – Term Loans |
2.17 | % | 2.17 | % | 2.17 | % | 2.17 | % | 2.17 | % | ||||||||||||||||||
|
On variable rate debt |
1.25 | % | 1.25 | % | 1.25 | % | 1.25 | % | 1.25 | % | ||||||||||||||||||
- 39 -
GLATFELTER
6.30.16 Form 10-Q
Table of Contents
The following exhibits are filed herewith or incorporated by reference as indicated.
| 31.1 | Certification of Dante C. Parrini, Chairman and Chief Executive Officer of Glatfelter, pursuant to Section 302(a) of the Sarbanes-Oxley Act of 2002. | |
| 31.2 | Certification of John P. Jacunski, Executive Vice President, Chief Financial Officer and President, Specialty Papers of Glatfelter, pursuant to Section 302(a) of the Sarbanes-Oxley Act of 2002. | |
| 32.1 | Certification of Dante C. Parrini, Chairman and Chief Executive Officer of Glatfelter, pursuant to Section 906 of the Sarbanes-Oxley Act of 2002, 18 U.S.C. Section 1350. | |
| 32.2 | Certification of John P. Jacunski, Executive Vice President, Chief Financial Officer and President, Specialty Papers of Glatfelter, pursuant to Section 906 of the Sarbanes-Oxley Act of 2002, 18 U.S.C. Section 1350. | |
| 101.INS | XBRL Instance Document, filed herewith | |
| 101.SCH | XBRL Taxonomy Extension Schema, filed herewith | |
| 101.CAL | XBRL Extension Calculation Linkbase, filed herewith | |
| 101.DEF | XBRL Extension Definition Linkbase, filed herewith | |
| 101.LAB | XBRL Extension Label Linkbase, filed herewith | |
| 101.PRE | XBRL Extension Presentation Linkbase, filed herewith | |
Pursuant to the requirements of Section 13 or 15(d) of the Securities Exchange Act of 1934, the Registrant has duly caused this report to be signed on its behalf by the undersigned, thereunto duly authorized.
| P. H. GLATFELTER COMPANY | ||||||
| (Registrant) | ||||||
| August 2, 2016 | ||||||
| By |
/s/ David C. Elder |
|||||
| David C. Elder | ||||||
| Vice President, Finance | ||||||
- 40 -
GLATFELTER
6.30.16 Form 10-Q
Table of Contents
EXHIBIT INDEX
|
Exhibit
|
Description |
|
| 31.1 | Certification of Dante C. Parrini, Chairman and Chief Executive Officer of Glatfelter, pursuant to Section 302(a) of the Sarbanes-Oxley Act of 2002, 18 U.S.C. Section 1350 – Chief Executive Officer, filed herewith. | |
| 31.2 | Certification of John P. Jacunski, Executive Vice President, Chief Financial Officer and President, Specialty Papers of Glatfelter, pursuant to Section 302(a) of the Sarbanes-Oxley Act of 2002 – Chief Financial Officer, filed herewith. | |
| 32.1 | Certification of Dante C. Parrini, Chairman and Chief Executive Officer of Glatfelter, pursuant to Section 906 of the Sarbanes-Oxley Act of 2002 – Chief Executive Officer, filed herewith. | |
| 32.2 | Certification of John P. Jacunski, Executive Vice President, Chief Financial Officer and President, Specialty Papers Glatfelter, pursuant to Section 906 of the Sarbanes-Oxley Act of 2002, 18 U.S.C. Section 1350 – Chief Financial Officer, filed herewith. | |
| 101.INS | XBRL Instance Document, filed herewith | |
| 101.SCH | XBRL Taxonomy Extension Schema, filed herewith | |
| 101.CAL | XBRL Extension Calculation Linkbase, filed herewith | |
| 101.DEF | XBRL Extension Definition Linkbase, filed herewith | |
| 101.LAB | XBRL Extension Label Linkbase, filed herewith | |
| 101.PRE | XBRL Extension Presentation Linkbase, filed herewith | |
- 41 -
GLATFELTER
6.30.16 Form 10-Q