MAGNERA CORP
10-Ks and 10-Qs
|
|
|
|
|
|
|
|
|
|
|
|
|
|
|
|
|
|
|
|
|
|
|
|
|
|
|
|
|
|
|
|
|
|
|
|
|
|
|
|
|
|
|
|
|
|
|
|
|
|
|
|
|
|
|
|
UNITED STATES
SECURITIES AND EXCHANGE COMMISSION
WASHINGTON, D.C. 20549
FORM
10-Q
|
|
Quarterly Report pursuant to Section 13 or 15(d) of the Securities Exchange Act of 1934 | ||||
For the quarterly period ended
June 30, 2023
or
|
|
Transition Report Pursuant to Section 13 or 15(d) of the Securities Exchange Act of 1934 | ||||
For the transition period from to
(Address of principal executive offices)
(
704
)
885-2555
(Registrant's telephone number, including area code)
|
Commission file
number
|
Exact name of registrant as
specified in its charter
|
IRS Employer
Identification No.
|
State or other jurisdiction of
incorporation or organization
|
|||||||||||||||||||||||
|
|
|
|
|
|||||||||||||||||||||||
(N/A)
Former name or former address, if changed since last report
Securities registered pursuant to Section 12(b) of the Act:
| Title of each class | Trading Symbol(s) | Name of each exchange on which registered | ||||||||||||
|
|
|
|
||||||||||||
Indicate by check mark whether the registrant (1) has filed all reports required to be filed by Section 13 or 15(d) of the Securities Exchange Act of 1934 during the preceding 12 months (or for such shorter period that the registrant was required to file such reports), and (2) has been subject to such filing requirements for at the past 90 days.
Yes
☒
No
☐
.
Indicate by check mark whether the registrant has submitted electronically every Interactive Data File required to be submitted pursuant to Rule 405 of Regulation S-T (§232.405 of this chapter) during the preceding 12 months (or for such shorter period that the registrant was required to submit such files).
Yes
☒
No
☐
.
Indicate by check mark whether the registrant is a large accelerated filer, an accelerated filer, a non-accelerated filer, a small reporting company or emerging growth company. See the definitions of “large accelerated filer”, “accelerated filer”, “smaller reporting company” and “emerging growth company” in Rule 12b-2 of the Exchange Act.
| Large Accelerated Filer | ☐ |
|
☒ | ||||||||||||||
| Non-accelerated filer | ☐ | Smaller reporting company |
|
||||||||||||||
| Emerging growth company |
|
||||||||||||||||
|
If an emerging growth company, indicate by check mark if the registrant has elected not to use the extended transition period for complying with any new or revised financial accounting standards provided pursuant to Section 13(a) of the Exchange Act.
|
☐ | ||||||||||||||||
Indicate by check mark whether the registrant is a shell company (as defined in Rule 12b-2 of the Exchange Act) Yes
☐
No
☒
.
Common Stock outstanding on July 28, 2023 totaled
45,045,910
shares.
GLATFELTER CORPORATION AND SUBSIDIARIES
REPORT ON FORM 10-Q
For the Quarterly Period Ended
June 30, 2023
Table of Contents
|
|
Page | |||||||||||||
|
Condensed Consolidated Statements of Income for the three months and six months ended June 30, 2023 and 2022 (unaudited)
|
||||||||||||||
|
Condensed Consolidated Statements of Comprehensive Income for the
three months and six months ended June 30, 2023 and 2022
(unaudited)
|
||||||||||||||
|
Condensed Consolidated Balance Sheets as of
June 30, 2023
and
December 31, 2022
(unaudited)
|
||||||||||||||
|
Condensed Consolidated Statements of Cash Flows for the
six months ended June 30, 2023 and 2022
(unaudited)
|
||||||||||||||
|
Statements of Shareholders’ Equity for the
three months and six months ended June 30, 2023 and 2022
(unaudited)
|
||||||||||||||
| 3 | ||||||||||||||
| 4 | ||||||||||||||
| 5 | ||||||||||||||
| 6 | ||||||||||||||
| 7 | ||||||||||||||
| 8 | ||||||||||||||
| 9 | ||||||||||||||
| 10 | ||||||||||||||
| 11 | ||||||||||||||
| 12 | ||||||||||||||
| 13 | ||||||||||||||
| 14 | ||||||||||||||
| 15 | ||||||||||||||
| 16 | ||||||||||||||
| 17 | ||||||||||||||
| 18 | ||||||||||||||
| 19 | ||||||||||||||
| 20 | ||||||||||||||
| Item 1B | ||||||||||||||
PART I
Item 1 – Financial Statements
GLATFELTER CORPORATION AND SUBSIDIARIES
CONDENSED CONSOLIDATED STATEMENTS OF INCOME
(unaudited)
|
Three months ended
June 30, |
Six months ended
June 30, |
||||||||||||||||||||||
| In thousands, except per share | 2023 | 2022 | 2023 | 2022 | |||||||||||||||||||
| Net sales | $ |
|
$ |
|
$ |
|
$ |
|
|||||||||||||||
| Costs of products sold |
|
|
|
|
|||||||||||||||||||
| Gross profit |
|
|
|
|
|||||||||||||||||||
| Selling, general and administrative expenses |
|
|
|
|
|||||||||||||||||||
| Goodwill and other asset impairment charges |
|
|
|
|
|||||||||||||||||||
| Gains (losses) on dispositions of plant, equipment and timberlands, net |
(
|
|
(
|
(
|
|||||||||||||||||||
| Operating income (loss) |
(
|
|
(
|
(
|
|||||||||||||||||||
| Non-operating income (expense) | |||||||||||||||||||||||
| Interest expense |
(
|
(
|
(
|
(
|
|||||||||||||||||||
| Interest income |
|
|
|
|
|||||||||||||||||||
| Other, net |
(
|
(
|
(
|
(
|
|||||||||||||||||||
| Total non-operating expense |
(
|
(
|
(
|
(
|
|||||||||||||||||||
| Income (loss) from continuing operations before income taxes |
(
|
|
(
|
(
|
|||||||||||||||||||
| Income tax provision (benefit) |
|
|
|
(
|
|||||||||||||||||||
| Loss from continuing operations |
(
|
(
|
(
|
(
|
|||||||||||||||||||
| Discontinued operations: | |||||||||||||||||||||||
| Income (loss) before income taxes |
(
|
|
(
|
|
|||||||||||||||||||
| Income tax provision |
|
|
|
|
|||||||||||||||||||
| Income (loss) from discontinued operations |
(
|
|
(
|
|
|||||||||||||||||||
| Net loss | $ |
(
|
$ |
(
|
$ |
(
|
$ |
(
|
|||||||||||||||
| Basic earnings per share | |||||||||||||||||||||||
| Loss from continuing operations | $ |
(
|
$ |
(
|
$ |
(
|
$ |
(
|
|||||||||||||||
| Income (loss) from discontinued operations |
(
|
|
(
|
|
|||||||||||||||||||
| Basic loss per share | $ |
(
|
$ |
(
|
$ |
(
|
$ |
(
|
|||||||||||||||
| Diluted earnings per share | |||||||||||||||||||||||
| Loss from continuing operations | $ |
(
|
$ |
(
|
$ |
(
|
$ |
(
|
|||||||||||||||
| Income (loss) from discontinued operations |
(
|
|
(
|
|
|||||||||||||||||||
| Diluted loss per share | $ |
(
|
$ |
(
|
$ |
(
|
$ |
(
|
|||||||||||||||
| Weighted average shares outstanding | |||||||||||||||||||||||
| Basic |
|
|
|
|
|||||||||||||||||||
| Diluted |
|
|
|
|
|||||||||||||||||||
The accompanying notes are an integral part of these condensed consolidated financial statements.
- 2 -
GLATFELTER CORPORATION AND SUBSIDIARIES
CONDENSED CONSOLIDATED STATEMENTS OF COMPREHENSIVE INCOME
(unaudited)
|
Three months ended
June 30, |
Six months ended
June 30, |
||||||||||||||||||||||
| In thousands | 2023 | 2022 | 2023 | 2022 | |||||||||||||||||||
| Net loss | $ |
(
|
$ |
(
|
$ |
(
|
$ |
(
|
|||||||||||||||
| Foreign currency translation adjustments |
|
(
|
|
(
|
|||||||||||||||||||
| Net change in: | |||||||||||||||||||||||
|
Deferred gains (losses) on derivatives, net of taxes
of $
|
(
|
|
|
|
|||||||||||||||||||
|
Unrecognized retirement obligations, net of taxes
of $(
|
|
|
|
|
|||||||||||||||||||
| Other comprehensive income (loss) |
|
(
|
|
(
|
|||||||||||||||||||
| Comprehensive loss | $ |
(
|
$ |
(
|
$ |
(
|
$ |
(
|
|||||||||||||||
The accompanying notes are an integral part of these condensed consolidated financial statements.
- 3 -
GLATFELTER CORPORATION AND SUBSIDIARIES
CONDENSED CONSOLIDATED BALANCE SHEETS
(unaudited)
| In thousands |
June 30,
2023 |
December 31,
2022 |
|||||||||
| Assets | |||||||||||
| Cash and cash equivalents | $ |
|
$ |
|
|||||||
| Accounts receivable, net |
|
|
|||||||||
| Inventories |
|
|
|||||||||
| Prepaid expenses and other current assets |
|
|
|||||||||
| Total current assets |
|
|
|||||||||
| Plant, equipment and timberlands, net |
|
|
|||||||||
| Goodwill |
|
|
|||||||||
| Intangible assets, net |
|
|
|||||||||
| Other assets |
|
|
|||||||||
| Total assets | $ |
|
$ |
|
|||||||
| Liabilities and Shareholders' Equity | |||||||||||
| Current portion of long-term debt | $ |
|
$ |
|
|||||||
| Short-term debt |
|
|
|||||||||
| Accounts payable |
|
|
|||||||||
| Environmental liabilities |
|
|
|||||||||
| Other current liabilities |
|
|
|||||||||
| Total current liabilities |
|
|
|||||||||
| Long-term debt |
|
|
|||||||||
| Deferred income taxes |
|
|
|||||||||
| Other long-term liabilities |
|
|
|||||||||
| Total liabilities |
|
|
|||||||||
| Commitments and contingencies |
|
|
|||||||||
| Shareholders’ equity | |||||||||||
| Common stock |
|
|
|||||||||
| Capital in excess of par value |
|
|
|||||||||
| Retained earnings |
|
|
|||||||||
| Accumulated other comprehensive loss |
(
|
(
|
|||||||||
|
|
|
||||||||||
| Less cost of common stock in treasury |
(
|
(
|
|||||||||
| Total shareholders’ equity |
|
|
|||||||||
| Total liabilities and shareholders’ equity | $ |
|
$ |
|
|||||||
The accompanying notes are an integral part of these condensed consolidated financial statements.
- 4 -
GLATFELTER CORPORATION AND SUBSIDIARIES
CONDENSED CONSOLIDATED STATEMENTS OF CASH FLOWS
(unaudited)
The accompanying notes are an integral part of these condensed consolidated financial statements.
| Six months ended June 30, | |||||||||||
| In thousands | 2023 | 2022 | |||||||||
| Operating activities | |||||||||||
| Net loss | $ |
(
|
$ |
(
|
|||||||
| Loss (income) from discontinued operations, net of taxes |
|
(
|
|||||||||
| Adjustments to reconcile to net cash used by continuing operations: | |||||||||||
| Depreciation, depletion and amortization |
|
|
|||||||||
| Amortization of debt issue costs and original issue discount |
|
|
|||||||||
| Pension settlement charge |
|
|
|||||||||
| Goodwill and other asset impairment charges |
|
|
|||||||||
| Russia/Ukraine conflict charges |
|
|
|||||||||
| Deferred income tax expense (benefit) |
|
(
|
|||||||||
| Gains on dispositions of plant, equipment and timberlands, net |
(
|
(
|
|||||||||
| Share-based compensation |
|
|
|||||||||
| Change in operating assets and liabilities: | |||||||||||
| Accounts receivable |
|
(
|
|||||||||
| Inventories |
(
|
(
|
|||||||||
| Prepaid and other current assets |
|
|
|||||||||
| Accounts payable |
(
|
|
|||||||||
| Accruals and other current liabilities |
|
(
|
|||||||||
| Other |
|
(
|
|||||||||
| Net cash used by operating activities from continuing operations |
(
|
(
|
|||||||||
| Investing activities | |||||||||||
| Expenditures for purchases of plant, equipment and timberlands |
(
|
(
|
|||||||||
| Proceeds from disposals of plant, equipment and timberlands, net |
|
|
|||||||||
| Acquisition, net of cash acquired |
|
|
|||||||||
| Other |
|
(
|
|||||||||
| Net cash used by investing activities from continuing operations |
(
|
(
|
|||||||||
| Financing activities | |||||||||||
| Proceeds from term loan |
|
|
|||||||||
| Repayment of term loans |
(
|
(
|
|||||||||
| Net borrowings (repayments) under revolving credit facility |
(
|
|
|||||||||
| Payments of borrowing costs |
(
|
(
|
|||||||||
| Payments of dividends |
|
(
|
|||||||||
| Payments related to share-based compensation awards and other |
(
|
(
|
|||||||||
| Net cash provided by financing activities from continuing operations |
|
|
|||||||||
| Effect of exchange rate changes on cash |
|
(
|
|||||||||
| Net decrease in cash, cash equivalents and restricted cash |
(
|
(
|
|||||||||
| Decrease in cash, cash equivalents and restricted cash from discontinued operations |
(
|
(
|
|||||||||
| Cash, cash equivalents and restricted cash at the beginning of period |
|
|
|||||||||
| Cash, cash equivalents and restricted cash at the end of period |
|
|
|||||||||
| Less: restricted cash in Prepaid expenses and other current assets |
(
|
(
|
|||||||||
| Less: restricted cash in Other assets |
(
|
(
|
|||||||||
| Cash and cash equivalents at the end of period | $ |
|
$ |
|
|||||||
| Supplemental cash flow information | |||||||||||
| Cash paid for: | |||||||||||
| Interest | $ |
|
$ |
|
|||||||
| Income taxes, net |
|
|
|||||||||
- 5 -
GLATFELTER CORPORATION AND SUBSIDIARIES
STATEMENTS OF SHAREHOLDERS’ EQUITY
(unaudited)
| In thousands |
Common
stock
|
Capital in
Excess of
Par Value
|
Retained
Earnings
|
Accumulated
Other
Comprehensive
Loss
|
Treasury
Stock
|
Total
Shareholders’
Equity
|
|||||||||||||||||||||||||||||
| Balance at April 1, 2023 | $ |
|
$ |
|
$ |
|
$ |
(
|
$ |
(
|
$ |
|
|||||||||||||||||||||||
| Net loss |
(
|
(
|
|||||||||||||||||||||||||||||||||
| Other comprehensive income |
|
|
|||||||||||||||||||||||||||||||||
| Comprehensive loss |
(
|
||||||||||||||||||||||||||||||||||
| Share-based compensation expense |
|
|
|||||||||||||||||||||||||||||||||
| Delivery of treasury shares: | |||||||||||||||||||||||||||||||||||
| RSUs and PSAs |
(
|
|
(
|
||||||||||||||||||||||||||||||||
| Balance at June 30, 2023 | $ |
|
$ |
|
$ |
|
$ |
(
|
$ |
(
|
$ |
|
|||||||||||||||||||||||
| Balance at April 1, 2022 | $ |
|
$ |
|
$ |
|
$ |
(
|
$ |
(
|
$ |
|
|||||||||||||||||||||||
| Net loss |
(
|
(
|
|||||||||||||||||||||||||||||||||
| Other comprehensive loss |
(
|
(
|
|||||||||||||||||||||||||||||||||
| Comprehensive loss |
(
|
||||||||||||||||||||||||||||||||||
|
Cash dividends declared ($
|
(
|
(
|
|||||||||||||||||||||||||||||||||
| Share-based compensation expense |
|
|
|||||||||||||||||||||||||||||||||
| Delivery of treasury shares: | |||||||||||||||||||||||||||||||||||
| RSUs and PSAs |
(
|
|
(
|
||||||||||||||||||||||||||||||||
| Balance at June 30, 2022 | $ |
|
$ |
|
$ |
|
$ |
(
|
$ |
(
|
$ |
|
|||||||||||||||||||||||
|
Balance at January 1, 2023
|
$ |
|
$ |
|
$ |
|
$ |
(
|
$ |
(
|
$ |
|
|||||||||||||||||||||||
| Net loss |
(
|
(
|
|||||||||||||||||||||||||||||||||
| Other comprehensive income |
|
|
|||||||||||||||||||||||||||||||||
| Comprehensive loss |
(
|
||||||||||||||||||||||||||||||||||
| Share-based compensation expense |
|
|
|||||||||||||||||||||||||||||||||
| Delivery of treasury shares: | |||||||||||||||||||||||||||||||||||
| RSUs and PSAs |
(
|
|
(
|
||||||||||||||||||||||||||||||||
| Balance at June 30, 2023 | $ |
|
$ |
|
$ |
|
$ |
(
|
$ |
(
|
$ |
|
|||||||||||||||||||||||
|
Balance at January 1, 2022
|
$ |
|
$ |
|
$ |
|
$ |
(
|
$ |
(
|
$ |
|
|||||||||||||||||||||||
| Net loss |
(
|
(
|
|||||||||||||||||||||||||||||||||
| Other comprehensive loss |
(
|
(
|
|||||||||||||||||||||||||||||||||
| Comprehensive loss |
(
|
||||||||||||||||||||||||||||||||||
|
Cash dividends declared (
|
(
|
(
|
|||||||||||||||||||||||||||||||||
| Share-based compensation expense |
|
|
|||||||||||||||||||||||||||||||||
| Delivery of treasury shares: | |||||||||||||||||||||||||||||||||||
| RSUs and PSAs |
(
|
|
(
|
||||||||||||||||||||||||||||||||
| Balance at June 30, 2022 | $ |
|
$ |
|
$ |
|
$ |
(
|
$ |
(
|
$ |
|
|||||||||||||||||||||||
The accompanying notes are an integral part of these condensed consolidated financial statements.
- 6 -
GLATFELTER CORPORATION AND SUBSIDIARIES
NOTES TO CONDENSED CONSOLIDATED FINANCIAL STATEMENTS
(unaudited)
1.
ORGANIZATION
2.
ACCOUNTING POLICIES
Basis of Presentation
The unaudited condensed consolidated financial statements (“financial statements”) include the accounts of Glatfelter and its wholly-owned subsidiaries. All intercompany balances and transactions have been eliminated.
We prepared these financial statements in accordance with accounting principles generally accepted in the United States of America (“generally accepted accounting principles” or “GAAP”) and pursuant to the rules and regulations of the Securities and Exchange Commission pertaining to interim financial statements. In our opinion, the financial statements reflect all normal, recurring adjustments needed to present fairly our results for the interim periods. When preparing these financial statements, we have assumed you have read the audited consolidated financial statements included in our 2022 Annual Report on Form 10-K.
3.
REVENUE
The following tables set forth disaggregated information pertaining to our net sales:
|
Three months ended
June 30, |
Six months ended
June 30, |
||||||||||||||||||||||
| In thousands | 2023 | 2022 | 2023 | 2022 | |||||||||||||||||||
| Revenue by product category | |||||||||||||||||||||||
| Airlaid Materials | |||||||||||||||||||||||
| Feminine hygiene | $ |
|
$ |
|
$ |
|
$ |
|
|||||||||||||||
| Specialty wipes |
|
|
|
|
|||||||||||||||||||
| Tabletop |
|
|
|
|
|||||||||||||||||||
| Food pads |
|
|
|
|
|||||||||||||||||||
| Home care |
|
|
|
|
|||||||||||||||||||
| Adult incontinence |
|
|
|
|
|||||||||||||||||||
- 7 -
| Other |
|
|
|
|
|||||||||||||||||||
|
|
|
|
|
||||||||||||||||||||
| Composite Fibers | |||||||||||||||||||||||
| Food & beverage |
|
|
|
|
|||||||||||||||||||
| Wallcovering |
|
|
|
|
|||||||||||||||||||
| Technical specialties |
|
|
|
|
|||||||||||||||||||
| Composite laminates |
|
|
|
|
|||||||||||||||||||
| Metallized |
|
|
|
|
|||||||||||||||||||
|
|
|
|
|
||||||||||||||||||||
| Spunlace | |||||||||||||||||||||||
| Consumer wipes |
|
|
|
|
|||||||||||||||||||
| Critical cleaning |
|
|
|
|
|||||||||||||||||||
| Health care |
|
|
|
|
|||||||||||||||||||
| Hygiene |
|
|
|
|
|||||||||||||||||||
| High performance |
|
|
|
|
|||||||||||||||||||
| Beauty care |
|
|
|
|
|||||||||||||||||||
|
|
|
|
|
||||||||||||||||||||
| Inter-segment sales elimination |
(
|
|
(
|
|
|||||||||||||||||||
| Total | $ |
|
$ |
|
$ |
|
$ |
|
|||||||||||||||
| Revenue by geography | |||||||||||||||||||||||
| Airlaid Materials | |||||||||||||||||||||||
| Americas | $ |
|
$ |
|
$ |
|
$ |
|
|||||||||||||||
| Europe, Middle East and Africa |
|
|
|
|
|||||||||||||||||||
| Asia Pacific |
|
|
|
|
|||||||||||||||||||
|
|
|
|
|
||||||||||||||||||||
| Composite Fibers | |||||||||||||||||||||||
| Americas |
|
|
|
|
|||||||||||||||||||
| Europe, Middle East and Africa |
|
|
|
|
|||||||||||||||||||
| Asia Pacific |
|
|
|
|
|||||||||||||||||||
|
|
|
|
|
||||||||||||||||||||
| Spunlace | |||||||||||||||||||||||
| Americas |
|
|
|
|
|||||||||||||||||||
| Europe, Middle East and Africa |
|
|
|
|
|||||||||||||||||||
| Asia Pacific |
|
|
|
|
|||||||||||||||||||
|
|
|
|
|
||||||||||||||||||||
| Inter-segment sales elimination |
(
|
|
(
|
|
|||||||||||||||||||
| Total | $ |
|
$ |
|
$ |
|
$ |
|
|||||||||||||||
- 8 -
4.
CLOSURE OF OBER-SCHMITTEN, GERMANY FACILITY
In the second quarter of 2023
,
we announced our plans to close Composite Fibers’ Ober-Schmitten, Germany facility as part of the Company’s turnaround strategy that aimed at improving financial performance of the Company’s overall business. Pending the completion of negotiations with the Ober-Schmitten Economic Committee and Works Council (“Works Council”), we expect to cease operations at the site during the third quarter of 2023 with some final finishing, shipping wind-down and decommissioning to follow.
In connection with the planned closure, we recognized the following costs which are included in our condensed consolidated statements of income:
|
Three months ended
June 30, |
Six months ended
June 30, |
||||||||||
| In thousands | 2023 | 2023 | |||||||||
| Severance and benefit continuation |
|
|
|||||||||
| Other costs |
|
|
|||||||||
| Total | $ |
|
$ |
|
|||||||
The Company now estimates that it will incur approximately $
10.4
million of cash expenses in connection with employee severance and benefit costs associated with the termination of the employees at the Facility and has recognized an expense for this amount included in “Cost of Goods Sold” in its condensed consolidated financial statements for the three and six months ended June 30, 2023. This estimate is based on the Company’s estimate of the cost of the current proposed compromise of interest and social plan made to the Works Council. As negotiations between the Company and the Works Council have not been finalized, the total amount of severance and benefit continuation costs that will ultimately be recognized is subject to change until such time as negotiations with the local works council are concluded.
The accrued and unpaid severance and benefit continuation totaled approximately $
10.4
million as of June 30, 2023.
5.
GAINS ON DISPOSITION OF PLANT, EQUIPMENT AND TIMBERLANDS
| Dollars in thousands | Acres | Proceeds | Gain (loss) | ||||||||||||||
| 2023 | |||||||||||||||||
| Timberlands |
|
$ |
|
$ |
|
||||||||||||
| Other | n/a |
|
|
||||||||||||||
| Total | $ |
|
$ |
|
|||||||||||||
| 2022 | |||||||||||||||||
| Timberlands |
|
$ |
|
$ |
|
||||||||||||
| Other | n/a |
|
(
|
||||||||||||||
| Total | $ |
|
$ |
|
|||||||||||||
6.
GOODWILL AND OTHER ASSET IMPAIRMENT
- 9 -
During the first quarter of 2022, in connection with an assessment of potential impairment of long-lived and indefinite lived intangible assets stemming from the compounding impacts resulting from the Russia/Ukraine military conflict and related sanctions, we recorded a $
117.3
million non-cash asset impairment charge related to Composite Fibers' Dresden facility and an impairment of Composite Fibers' goodwill. Dresden is a single-line facility that produces wallcover base paper, the majority of which is sold into the Russian and Ukrainian markets. As a direct result of the economic impacts from the conflict, and the disruptions in the underlying financial systems and restrictions on our ability to export wallcover base paper to Russia due to related sanctions, management expected a significant reduction in wallcover revenues and associated cash flows for the foreseeable future. In addition, the conflict also impacted other Composite Fibers products that are also subject to export sanctions into this region, and continued to significantly impact energy prices. Accordingly, a charge was recorded to reduce the carrying value of the Dresden fixed assets and intangible assets (technological know-how, customer relationships, and an indefinite-lived trade name), along with Composite Fibers’ goodwill to fair value.
The following table summarizes the impairment charges recorded during the six months ended June 30, 2023 and 2022, respectively, in the accompanying condensed consolidated statements of income under the caption “Goodwill and other asset impairment charges:”
| In thousands | 2023 | 2022 | |||||||||
| Plant, property and equipment | $ |
|
$ |
|
|||||||
| Technological know-how |
|
|
|||||||||
| Customer relationships |
|
|
|||||||||
| Tradename |
|
|
|||||||||
| Goodwill |
|
|
|||||||||
| Total | $ |
|
$ |
|
|||||||
The fair value of the underlying assets was estimated using discounted cash flow models, independent appraisals and similar methods, all of which are Level 3 fair value classification.
7.
DISCONTINUED OPERATIONS
For the three and six months ended June 30, 2023, we recognized a loss in discontinued operations of $
0.3
million and $
0.7
million, respectively, primarily related to an insurance claim and legal costs. For both the three and six months ended June 30 2022, we recognized income of $
0.4
million which primarily represents the successful appeal of a sales and use tax audit partially offset by legal costs.
The following table sets forth a summary of cash flows from discontinued operations which is included in the condensed consolidated statements of cash flows:
| Six months ended June 30, | |||||||||||
| In thousands | 2023 | 2022 | |||||||||
| Net cash used by operating activities | $ |
(
|
$ |
(
|
|||||||
| Net cash used by investing activities |
|
|
|||||||||
| Net cash provided by financing activities |
|
|
|||||||||
| Change in cash and cash equivalents from discontinued operations | $ |
(
|
$ |
(
|
|||||||
8.
EARNINGS PER SHARE
The following table sets forth the details of basic and diluted earnings per share (“EPS”) from continuing operations:
- 10 -
| Three months ended June 30, | Six months ended June 30, | ||||||||||||||||||||||
| In thousands, except per share | 2023 | 2022 | 2023 | 2022 | |||||||||||||||||||
| Loss from continuing operations | $ |
(
|
$ |
(
|
$ |
(
|
$ |
(
|
|||||||||||||||
| Weighted average common shares outstanding used in basic EPS |
|
|
|
|
|||||||||||||||||||
|
Common shares issuable upon exercise of dilutive stock options
and PSAs / RSUs
|
|
|
|
|
|||||||||||||||||||
|
Weighted average common shares outstanding and common share
equivalents used in diluted EPS
|
|
|
|
|
|||||||||||||||||||
| Loss per share from continuing operations | |||||||||||||||||||||||
| Basic | $ |
(
|
$ |
(
|
$ |
(
|
$ |
(
|
|||||||||||||||
| Diluted |
(
|
(
|
(
|
(
|
|||||||||||||||||||
The following table sets forth potential common shares outstanding that were not included in the computation of diluted EPS for the periods indicated, because their effect would be anti-dilutive:
| Three months ended June 30, | Six months ended June 30, | ||||||||||||||||||||||
| In thousands | 2023 | 2022 | 2023 | 2022 | |||||||||||||||||||
| Potential common shares |
|
|
|
|
|||||||||||||||||||
- 11 -
9.
ACCUMULATED OTHER COMPREHENSIVE INCOME
The following table sets forth details of the changes in accumulated other comprehensive income (losses) for the three months and six months ended June 30, 2023 and 2022.
| In thousands | Currency translation adjustments | Unrealized gain (loss) on derivatives | Change in pensions | Change in other postretirement defined benefit plans | Total | ||||||||||||||||||||||||
| Balance at April 1, 2023 | $ |
(
|
$ |
|
$ |
(
|
$ |
|
$ |
(
|
|||||||||||||||||||
| Other comprehensive income before reclassifications (net of tax) |
|
|
|
|
|
||||||||||||||||||||||||
|
Amounts reclassified from accumulated
other comprehensive income (net of tax)
|
|
(
|
|
(
|
(
|
||||||||||||||||||||||||
| Net current period other comprehensive income (loss) |
|
(
|
|
(
|
|
||||||||||||||||||||||||
| Balance at June 30, 2023 | $ |
(
|
$ |
|
$ |
(
|
$ |
|
$ |
(
|
|||||||||||||||||||
| Balance at April 1, 2022 | $ |
(
|
$ |
|
$ |
(
|
$ |
(
|
$ |
(
|
|||||||||||||||||||
| Other comprehensive income (loss) before reclassifications (net of tax) |
(
|
|
|
|
(
|
||||||||||||||||||||||||
|
Amounts reclassified from accumulated
other comprehensive income (net of tax)
|
|
(
|
|
|
(
|
||||||||||||||||||||||||
| Net current period other comprehensive income (loss) |
(
|
|
|
|
(
|
||||||||||||||||||||||||
| Balance at June 30, 2022 | $ |
(
|
$ |
|
$ |
(
|
$ |
(
|
$ |
(
|
|||||||||||||||||||
| Balance at January 1, 2023 | $ |
(
|
$ |
|
$ |
(
|
$ |
|
$ |
(
|
|||||||||||||||||||
| Other comprehensive income before reclassifications (net of tax) |
|
|
|
|
|
||||||||||||||||||||||||
|
Amounts reclassified from accumulated other comprehensive income (net of tax)
|
|
(
|
|
(
|
(
|
||||||||||||||||||||||||
| Net current period other comprehensive income (loss) |
|
|
|
(
|
|
||||||||||||||||||||||||
| Balance at June 30, 2023 | $ |
(
|
$ |
|
$ |
(
|
$ |
|
$ |
(
|
|||||||||||||||||||
| Balance at January 1, 2022 | $ |
(
|
$ |
|
$ |
(
|
$ |
(
|
$ |
(
|
|||||||||||||||||||
| Other comprehensive income (loss) before reclassifications (net of tax) |
(
|
|
|
|
(
|
||||||||||||||||||||||||
|
Amounts reclassified from accumulated other comprehensive income (net of tax)
|
|
(
|
|
|
(
|
||||||||||||||||||||||||
| Net current period other comprehensive income (loss) |
(
|
|
|
|
(
|
||||||||||||||||||||||||
| Balance at June 30, 2022 | $ |
(
|
$ |
|
$ |
(
|
$ |
(
|
$ |
(
|
|||||||||||||||||||
- 12 -
Reclassifications out of accumulated other comprehensive income and into the condensed consolidated statements of income were as follows:
|
Three months ended
June 30, |
Six months ended
June 30, |
|||||||||||||||||||||||||||||||
| In thousands | 2023 | 2022 | 2023 | 2022 | ||||||||||||||||||||||||||||
| Description | Line Item in Statements of Income | |||||||||||||||||||||||||||||||
| Cash flow hedges (Note 18) | ||||||||||||||||||||||||||||||||
| Gains on cash flow hedges | $ |
(
|
$ |
(
|
$ |
(
|
$ |
(
|
Costs of products sold | |||||||||||||||||||||||
| Tax expense (benefit) |
|
|
(
|
|
Income tax provision | |||||||||||||||||||||||||||
| Net of tax |
(
|
(
|
(
|
(
|
||||||||||||||||||||||||||||
| Loss (gain) on interest rate swaps |
|
(
|
|
|
Interest expense | |||||||||||||||||||||||||||
| Tax expense |
|
|
|
|
Income tax provision | |||||||||||||||||||||||||||
| Net of tax |
|
(
|
|
|
||||||||||||||||||||||||||||
| Total cash flow hedges |
(
|
(
|
(
|
(
|
||||||||||||||||||||||||||||
| Retirement plan obligations (Note 11) | ||||||||||||||||||||||||||||||||
| Amortization of deferred benefit pension plans | ||||||||||||||||||||||||||||||||
| Prior service costs |
|
|
|
|
Other, net | |||||||||||||||||||||||||||
| Actuarial losses |
|
|
|
|
Other, net | |||||||||||||||||||||||||||
| Pension settlement |
|
|
|
|
Other, net | |||||||||||||||||||||||||||
|
|
|
|
|
|||||||||||||||||||||||||||||
| Tax benefit |
(
|
(
|
(
|
(
|
Income tax provision | |||||||||||||||||||||||||||
| Net of tax |
|
|
|
|
||||||||||||||||||||||||||||
| Amortization of deferred benefit other plans | ||||||||||||||||||||||||||||||||
| Prior service costs |
|
|
|
|
Other, net | |||||||||||||||||||||||||||
| Actuarial gain |
(
|
|
(
|
|
Other, net | |||||||||||||||||||||||||||
|
(
|
|
(
|
|
|||||||||||||||||||||||||||||
| Tax expense |
|
|
|
|
Income tax provision | |||||||||||||||||||||||||||
| Net of tax |
(
|
|
(
|
|
||||||||||||||||||||||||||||
| Total reclassifications, net of tax | $ |
(
|
$ |
(
|
$ |
(
|
$ |
(
|
||||||||||||||||||||||||
- 13 -
10.
SHARE-BASED COMPENSATION
On May 5, 2023 (the “Effective Date”), the Board and shareholders approved an amendment and restatement of the Glatfelter Corporation 2022 Long-Term Incentive Plan (the “Equity Plan”) to increase the number of shares available for grant under the Equity Plan (as amended and restated, the “Amended Plan”) (collectively, the “LTIP”). The LTIP is a long-term incentive plan, pursuant to which awards may be granted to full-time or part-time employees, officers, non-employee directors, and consultants of the Company or any subsidiary or affiliate of the Company, including stock options, stock-only stock appreciation rights (“SOSARs”), restricted stock awards, restricted stock units (“RSUs”), performance share awards (“PSAs”), and other share-based awards. The Amended Plan was adopted primarily to increase the number of shares of Company common stock reserved for equity-based awards by
675,000
shares (in addition to any shares that remained available for awards under the Equity Plan as of the Effective Date and any shares subject to outstanding awards granted under the Equity Plan as of the Effective Date). As of June 30, 2023, there were
2,386,035
shares of common stock available for future issuance under the LTIP.
Pursuant to terms of the LTIP, we have issued to eligible participants RSUs, PSAs and SOSARs.
Restricted Stock Units and Performance Share Awards
In the first six months of 2023 and 2022, we granted RSUs and PSAs to employees under our LTIP. In both 2023 and 2022,
50
% of fair value of the awards granted were RSUs, which vest based on the passage of time, generally over a graded
three-year
period or, in certain instances, the RSUs were cliff vesting after
or
three years
. The remaining
50
% of the fair value of the awards granted in 2023 and 2022 were PSAs. The PSAs awarded vest based on either the achievement of cumulative financial performance targets covering a
two-year
period or based on the
three-year
total shareholder return relative to a broad market index. The performance measures include a minimum, target and maximum performance level providing the grantees an opportunity to receive more or less shares than targeted depending on actual financial performance.
For RSUs, the grant date fair value of the awards, or the closing price per common share on the date of the award, is used to determine the amount of expense to be recognized over the applicable service period. For PSAs, the grant date fair value is estimated using a lattice model. The significant inputs include the stock price, volatility, dividend yield, and risk-free rate of return. Settlement of RSUs and PSAs will be made in shares of our common stock currently held in treasury.
The following table summarizes RSU and PSA activity during periods indicated:
| Units | 2023 | 2022 | |||||||||
| Balance at January 1, |
|
|
|||||||||
| Granted |
|
|
|||||||||
| Forfeited |
(
|
(
|
|||||||||
| Shares delivered |
(
|
(
|
|||||||||
| Balance at June 30, |
|
|
|||||||||
The amount granted in 2023 and 2022 includes
698,741
and
341,429
, respectively, of PSAs exclusive of reinvested dividends.
The following table sets forth aggregate RSU and PSA compensation expense included in continuing operations for the periods indicated:
| June 30, | |||||||||||
| In thousands | 2023 | 2022 | |||||||||
| Three months ended | $ |
|
$ |
|
|||||||
| Six months ended | $ |
|
$ |
|
|||||||
Stock-Only Stock Appreciation Rights
Under terms of the SOSAR, a recipient receives the right to a payment in the form of shares of common stock equal to the difference, if any, in the fair market value of
one
share of common stock at the time of exercising the SOSAR and the exercise price. All SOSARs are vested and have a term of
ten years
. No SOSARs have been awarded since 2016.
The following table sets forth information related to outstanding SOSARs:
- 14 -
| 2023 | 2022 | ||||||||||||||||||||||
| Shares |
Wtd Avg
Exercise
Price
|
Shares |
Wtd Avg
Exercise
Price
|
||||||||||||||||||||
| Outstanding at January 1, |
|
$ |
|
|
$ |
|
|||||||||||||||||
| Granted |
|
|
|
|
|||||||||||||||||||
| Exercised |
|
|
|
|
|||||||||||||||||||
| Canceled / forfeited |
(
|
|
(
|
|
|||||||||||||||||||
| Outstanding at June 30, |
|
$ |
|
|
$ |
|
|||||||||||||||||
11.
RETIREMENT PLANS AND OTHER POST-RETIREMENT BENEFITS
The following tables provide information with respect to the net periodic costs of our pension and post-retirement medical benefit plans included in continuing operations.
|
Three months ended
June 30, |
Six months ended
June 30, |
||||||||||||||||||||||
| In thousands | 2023 | 2022 | 2023 | 2022 | |||||||||||||||||||
| Pension Benefits | |||||||||||||||||||||||
| Service cost | $ |
|
$ |
|
$ |
|
$ |
|
|||||||||||||||
| Interest cost |
|
|
|
|
|||||||||||||||||||
| Amortization of prior service cost |
|
|
|
|
|||||||||||||||||||
| Amortization of actuarial loss |
|
|
|
|
|||||||||||||||||||
| Pension settlement charge |
|
|
|
|
|||||||||||||||||||
| Total net periodic benefit expense | $ |
|
$ |
|
$ |
|
$ |
|
|||||||||||||||
| Other Benefits | |||||||||||||||||||||||
| Service cost | $ |
|
$ |
|
$ |
|
$ |
|
|||||||||||||||
| Interest cost |
|
|
|
|
|||||||||||||||||||
| Amortization of prior service cost |
|
|
|
|
|||||||||||||||||||
| Amortization of actuarial gain |
(
|
|
(
|
|
|||||||||||||||||||
| Total net periodic benefit expense | $ |
|
$ |
|
$ |
|
$ |
|
|||||||||||||||
During the six months ended June 30, 2023, we made a $
5.8
million lump-sum payment to our former CEO under the terms of his non-qualified pension plan. In accordance with pension settlement accounting, we recorded a $
0.6
million settlement charge reflecting the recognition of amounts previously included in accumulated other comprehensive income.
12.
INCOME TAXES
Income taxes are recognized for the amount of taxes payable or refundable for the current year, and deferred tax liabilities and assets for the future tax consequences of events that have been recognized in our condensed consolidated financial statements or tax returns. The effects of income taxes are measured based on enacted tax laws and rates.
For the six months ended June 30, 2023, we had a pretax loss from continuing operations of $
39.7
million and income tax expense of $
10.1
million. The effective income tax rate for the six months ended June 30, 2023 was unfavorably impacted by the jurisdictional mix of pretax results among the Company and its subsidiaries and losses which generated no tax benefit in domestic and certain foreign jurisdictions.
For the six months ended June 30, 2023, we recorded an increase in the valuation allowance of $
11.4
million for U.S. federal and certain foreign jurisdictions against our net deferred tax assets. In assessing the need for a valuation allowance, management considers all available positive and negative evidence in its analysis. Based on this analysis, we recorded a valuation allowance for the portion of deferred tax assets where the weight of the evidence indicated it is more likely than not that the deferred assets will not be realized.
- 15 -
As of June 30, 2023 and December 31, 2022, we had $
60.5
million and $
56.5
million, respectively, of gross unrecognized tax benefits. As of June 30, 2023, if such benefits were to be recognized, approximately $
57.4
million would be recorded as a component of income tax expense, thereby affecting our effective tax rate.
The amount of income taxes we pay is subject to ongoing audits by federal, state and foreign tax authorities, which often result in proposed assessments. Management performs a comprehensive review of its global tax positions on a quarterly basis and accrues amounts for uncertain tax positions. Based on these reviews and the result of discussions and resolutions of matters with tax authorities and the closure of tax years subject to tax audit, reserves are adjusted as necessary. However, future results may include favorable or unfavorable adjustments to our estimated tax liabilities in the period the assessments are determined or resolved or as statutes are closed. Due to potential resolution of federal, state and foreign examinations, and the lapse of various statutes of limitation, it is reasonably possible our gross unrecognized tax benefits may decrease within the next twelve months by a range of
zero
to $
8.5
million. We recognize interest and penalties related to uncertain tax
positions as income tax expense.
The following table summarizes information included in continuing operations related to interest on uncertain tax positions:
| Six months ended June 30, | |||||||||||
| In millions | 2023 | 2022 | |||||||||
| Interest expense | $ |
|
$ |
|
|||||||
|
June 30,
2023 |
December 31,
2022 |
||||||||||
| Accrued interest payable | $ |
|
$ |
|
|||||||
| Accrued penalties |
|
|
|||||||||
13.
INVENTORIES
Inventories, net of reserves, were as follows:
| In thousands |
June 30,
2023 |
December 31,
2022 |
|||||||||
| Raw materials | $ |
|
$ |
|
|||||||
| In-process and finished |
|
|
|||||||||
| Supplies |
|
|
|||||||||
| Total | $ |
|
$ |
|
|||||||
- 16 -
14.
GOODWILL AND OTHER INTANGIBLE ASSETS
The following table sets forth changes in the amounts of goodwill and other intangible assets recorded by each of our segments during the periods indicated:
| In thousands |
December 31,
2022 |
Purchase price allocation adjustment | Translation |
June 30,
2023 |
|||||||||||||||||||
| Goodwill | |||||||||||||||||||||||
| Airlaid Materials | $ |
|
$ |
|
$ |
|
$ |
|
|||||||||||||||
| Total | $ |
|
$ |
|
$ |
|
$ |
|
|||||||||||||||
| Other Intangible Assets |
December 31,
2022 |
Amortization | Translation |
June 30,
2023 |
|||||||||||||||||||
| Airlaid Materials | |||||||||||||||||||||||
| Tradename | $ |
|
$ | — | $ |
|
$ |
|
|||||||||||||||
| Accumulated amortization |
(
|
(
|
(
|
(
|
|||||||||||||||||||
| Net |
|
(
|
|
|
|||||||||||||||||||
| Technology and related |
|
— |
|
|
|||||||||||||||||||
| Accumulated amortization |
(
|
(
|
(
|
(
|
|||||||||||||||||||
| Net |
|
(
|
|
|
|||||||||||||||||||
| Customer relationships and related |
|
— |
|
|
|||||||||||||||||||
| Accumulated amortization |
(
|
(
|
(
|
(
|
|||||||||||||||||||
| Net |
|
(
|
|
|
|||||||||||||||||||
| Spunlace | |||||||||||||||||||||||
| Products and Tradenames |
|
— |
|
|
|||||||||||||||||||
| Accumulated amortization |
(
|
(
|
|
(
|
|||||||||||||||||||
| Net |
|
(
|
|
|
|||||||||||||||||||
| Technology and related |
|
— |
|
|
|||||||||||||||||||
| Accumulated amortization |
(
|
(
|
(
|
(
|
|||||||||||||||||||
| Net |
|
(
|
|
|
|||||||||||||||||||
| Customer relationships and related |
|
— |
|
|
|||||||||||||||||||
| Accumulated amortization |
(
|
(
|
(
|
(
|
|||||||||||||||||||
| Net |
|
(
|
|
|
|||||||||||||||||||
| Total intangibles |
|
— |
|
|
|||||||||||||||||||
| Total accumulated amortization |
(
|
(
|
(
|
(
|
|||||||||||||||||||
| Net intangibles | $ |
|
$ |
(
|
$ |
|
$ |
|
|||||||||||||||
15.
LEASES
We enter into a variety of arrangements in which we are the lessee for the use of automobiles, forklifts and other production equipment, production facilities, warehouses, office space and land. We determine if an arrangement contains a lease at inception. All our lease arrangements are operating leases and are recorded in the condensed consolidated balance sheet under the caption “Other assets” and the lease obligation is under “Other current liabilities” and “Other long-term liabilities.” We do not have any finance leases.
Operating lease right of use (“ROU”) assets and operating lease liabilities are recognized based on the present value of the future minimum lease payments over the lease term at commencement date. ROU assets also include any initial direct
- 17 -
costs incurred and any lease payments made at or before the lease commencement date, less lease incentives received. We use our incremental borrowing rate based on information available at the commencement date in determining the lease liabilities as our leases generally do not provide an implicit rate. For purposes of recording the lease arrangement, the term of lease may include options to extend or terminate when we are reasonably certain that the option will be exercised. Lease expense is recognized on a straight-line basis over the lease term.
The following table sets forth information related to our leases as of the periods indicated.
| Dollars in thousands |
June 30,
2023 |
December 31,
2022 |
|||||||||
| R | $ |
|
$ |
|
|||||||
| Weighted average discount rate |
|
% |
|
% | |||||||
|
Weighted average remaining maturity
(years)
|
|
|
|||||||||
The following table sets forth operating lease expense for the periods indicated:
| June 30, | ||||||||||||||
| In thousands | 2023 | 2022 | ||||||||||||
| Three months ended | $ |
|
$ |
|
||||||||||
| Six months ended | $ |
|
$ |
|
||||||||||
The following table sets forth required remaining future minimum lease payments during the years indicated:
| In thousands | |||||
| 2023 | $ |
|
|||
| 2024 |
|
||||
| 2025 |
|
||||
| 2026 |
|
||||
| 2027 |
|
||||
| Thereafter |
|
||||
- 18 -
16.
LONG-TERM DEBT
Long-term debt is summarized as follows:
| In thousands |
June 30,
2023 |
December 31,
2022 |
|||||||||
|
Revolving credit facility, due Sep 2026
|
$ |
|
$ |
|
|||||||
|
|
|
|
|||||||||
|
|
|
|
|||||||||
|
Term loan, due Feb 2024
|
|
|
|||||||||
|
|
|
|
|||||||||
|
|
|
|
|||||||||
|
|
|
|
|||||||||
|
|
|
|
|||||||||
|
|
|
|
|||||||||
| Total long-term debt |
|
|
|||||||||
| Less current portion |
(
|
(
|
|||||||||
| Unamortized deferred issuance costs |
(
|
(
|
|||||||||
| Long-term debt, net of current portion | $ |
|
$ |
|
|||||||
On September 2, 2021, we entered into a restatement agreement as part of a Fourth Amended and Restated $
400.0
million Revolving Credit Facility and a €
220.0
million Term Loan (collectively, the “Credit Agreement”).
On March 30, 2023, we entered into an amendment to the Credit Agreement which reduced the Revolving Credit Facility to $
250.0
million and had us fully extinguish the €
220.0
million Term Loan. The amendment: i) modifies the “leverage ratio” to be the ratio of consolidated senior secured debt to consolidated adjusted EBITDA ; ii) increases the maximum interest rate borrowing margin to be applied to the applicable index by
275
basis points; and iii) pledges as collateral substantially all domestic and Canadian assets to secure obligations owed under the Credit Agreement, as well as, on a second lien basis, the European assets that secure the AG Loan (as defined below). As amended, we are obligated to maintain a leverage ratio under
4.25
to 1.0 through the quarter ended December 31, 2024, stepping down to
4.0
to 1.0 at March 31, 2025, and
3.50
to 1.0 at March 31, 2026.
Borrowing rates for the Revolving Loans are determined at our option at the time of each borrowing. For all U.S. Dollar denominated Revolving Loan borrowings, the borrowing rate is either, (a) the bank’s base rate which is equal to the greater of i) the prime rate; ii) the overnight bank funding rate plus
50
basis points; or iii) the daily Simple Secured Overnight Financing Rate (“SOFR”) rate plus
100
basis points plus an applicable spread over either i), ii) or iii) ranging from
250
basis points to
400
basis points based on the Company’s leverage ratio; or (b) the daily Term SOFR-rate plus an applicable margin ranging from
350
basis points to
500
basis points based on the Company’s leverage ratio. For non-U.S. Dollar denominated borrowings, interest is based on the Euro-rate or EURIBOR-rate plus an applicable margin ranging from
350
basis points to
500
basis points based on the Company’s leverage ratio.
The Credit Agreement contains a number of customary covenants for financings of this type that, among other things, restrict our ability to dispose of or create liens on assets, incur additional indebtedness, limits certain intercompany financing arrangements, make acquisitions and engage in mergers or consolidations. The Credit Agreement also contains covenants requiring a minimum debt coverage ratio.
Revolving Loans borrowings are available in U.S. Dollars, Euros, British Pound Sterling, and Canadian Dollars.
All remaining principal outstanding and accrued interest under the Revolving Credit Facility will be due and payable on September 2, 2026.
As of June 30, 2023, the leverage ratio, as calculated in accordance with the definition in our Credit Agreement, was
3.4
x. A breach of these requirements would give rise to certain remedies under the Revolving Credit Facility, among which is the termination of the agreement.
- 19 -
On March 30, 2023, we entered into a €
250.0
million Term Loan with certain affiliates of Angelo, Gordon & Co., L.P. (“AG Loan”). The net proceeds from the AG Loan were used to extinguish the €
220.0
million Term Loan, to repay a portion of outstanding revolving borrowings under the Revolving Credit Facility, for working capital and general corporate purposes and to pay estimated fees and expenses.
The AG Loan will mature on March 23, 2029. Interest on the AG Loan accrues at the rate of
11.25
% per annum and is payable quarterly in arrears on March 31, June 30, September 30, and December 31 each year, commencing on June 30, 2023.
The AG Loan is prepayable, in whole or in part, at any time at the prepayable premium specified in the Term Loan Agreement. Prior to September 30, 2024, we may prepay some or all of the AG Loan at a "make-whole" premium as specified.
Under the terms of the AG Loan, we have pledged as collateral substantially all assets of our subsidiaries in Germany, Luxembourg, United Kingdom, Malta and Switzerland, as well as, on a second lien basis, the domestic and Canadian assets that secure the Revolving Credit Facility.
All covenants contained in the AG Loan agreement are substantially consistent with the Credit Agreement.
On October 25, 2021, we issued $
500.0
million aggregate principal amount of
4.750
% senior notes due 2029 (the “Notes”). The Notes are guaranteed on a senior unsecured basis, jointly and severally, by each of our existing and future domestic restricted subsidiaries that guarantees our obligations under the Credit Agreement, and/or certain other indebtedness.
The Notes were issued pursuant to an indenture dated as of October 25, 2021 (the “Base Indenture”), as supplemented by the supplemental indenture dated as of October 25, 2021 (the “Supplemental Indenture” and, together with the Base Indenture, the “Indenture”) among the Company, certain subsidiaries of the Company party thereto, as guarantors, and Wilmington Trust, National Association, as trustee.
The net proceeds from the offering of the Notes, together with cash on hand, were used to pay the purchase price of the Jacob Holm acquisition, to repay certain indebtedness of Jacob Holm, to repay outstanding revolving borrowings under the Revolving Credit Facility, and to pay estimated fees and expenses.
The Notes will mature on November 15, 2029. Interest on the Notes accrues at the rate of
4.750
% per annum and is payable semi-annually in arrears on May 15 and November 15 of each year, commencing on May 15, 2022.
The Notes are redeemable, in whole or in part, at any time at the redemption prices specified in the Indenture. Prior to November 15, 2024, we may redeem some or all of the Notes at a "make-whole" premium as specified in the Indenture.
The Notes contain various covenants customary to indebtedness of this nature, including limitations on i) the amount of indebtedness that may be incurred; ii) certain restricted payments including common stock dividends; iii) distributions from certain subsidiaries; iv) sales of assets; v) transactions amongst subsidiaries; and vi) incurrence of liens on assets. In addition, the Notes contain cross default provisions that could result in all such notes becoming due and payable in the event of a failure to repay debt outstanding under the Credit Agreement at maturity or a default under the Credit Agreement that accelerates the debt outstanding thereunder. As of March 31, 2023, we met all of the requirements of our debt covenants.
Glatfelter Gernsbach GmbH (“Gernsbach”), a wholly-owned subsidiary of ours, entered into a series of borrowing agreements with IKB Deutsche Industriebank AG, Düsseldorf (“IKB”). Each of the borrowings require quarterly repayments of principal and interest and provide for representations, warranties and covenants customary for financings of these types. The financial covenants of these borrowings are calculated by reference to the Credit Agreement. These borrowings were fully extinguished on March 14, 2023.
In 2021, Gernsbach also entered into
two
fixed-rate non-amortizing term loans with certain financial institutions. Similar to the IKB loans discussed above, the financial covenants of these borrowings are calculated by reference to the Credit Agreement. On February 28, 2023,
one
of these term loans for €
20.0
million was fully extinguished. The remaining term loan has a principal balance of $
3.0
million and matures in March 2024.
Aggregated unamortized deferred debt issuance costs incurred in connection with all of our outstanding debt totaled $
18.9
million at June 30, 2023. The deferred costs are being amortized on a straight-line basis over the life of the
- 20 -
underlying instruments. Amortization expense related to deferred debt issuance costs totaled $
3.1
million and $
1.9
million in 2023 and 2022, respectively.
The following schedule sets forth the amortization of our term loan agreements together with the maturity of our other long-term debt during the indicated year.
| In thousands | ||||||||
| 2023 | $ |
|
||||||
| 2024 |
|
|||||||
| 2025 |
|
|||||||
| 2026 |
|
|||||||
| 2027 |
|
|||||||
| Thereafter |
|
|||||||
Glatfelter Corporation guarantees all debt obligations of its subsidiaries. All such obligations are recorded in these consolidated financial statements.
As of June 30, 2023 and December 31, 2022, we had $
5.3
million and $
4.7
million, respectively, of letters of credit issued to us by certain financial institutions. The letters of credit, which reduce amounts available under our Revolving Credit Facility, provide financial assurances for the performance of long-term monitoring activities associated with the Fox River environmental matter and for the benefit of certain state workers compensation insurance agencies in conjunction with our self-insurance program. We bear the credit risk on this amount to the extent that we do not comply with the provisions of certain agreements.
No
amounts are outstanding under the letters of credit.
- 21 -
17.
FAIR VALUE OF FINANCIAL INSTRUMENTS
The amounts reported on the condensed consolidated balance sheets for cash and cash equivalents, accounts receivable, accounts payable and short-term debt approximate their respective fair value.
The following table sets forth carrying value and fair value of long-term debt:
| June 30, 2023 | December 31, 2022 | ||||||||||||||||||||||
| In thousands |
Carrying
Value
|
Fair Value |
Carrying
Value
|
Fair Value | |||||||||||||||||||
|
Revolving credit facility, due Sep 2026
|
$ |
|
$ |
|
$ |
|
$ |
|
|||||||||||||||
|
|
|
|
|
|
|||||||||||||||||||
|
|
|
|
|
|
|||||||||||||||||||
|
Term loan, due Feb 2024
|
|
|
|
|
|||||||||||||||||||
|
|
|
|
|
|
|||||||||||||||||||
|
|
|
|
|
|
|||||||||||||||||||
|
|
|
|
|
|
|||||||||||||||||||
|
|
|
|
|
|
|||||||||||||||||||
|
|
|
|
|
|
|||||||||||||||||||
| Total | $ |
|
$ |
|
$ |
|
$ |
|
|||||||||||||||
18.
FINANCIAL DERIVATIVES AND HEDGING ACTIVITIES
As part of our overall risk management practices, we enter into financial derivatives primarily designed to either i) hedge foreign currency risks associated with forecasted transactions (“cash flow hedges”); ii) mitigate the impact that changes in currency exchange rates have on intercompany financing transactions and foreign currency denominated receivables and payables (“foreign currency hedges”); or iii) convert variable-interest-rate debt to fixed rates.
Derivatives Designated as Hedging Instruments - Cash Flow Hedges
We use currency forward contracts as cash flow hedges to manage our exposure to fluctuations in the currency exchange rates on certain forecasted production costs. Currency forward contracts involve fixing the exchange for delivery of a specified amount of foreign currency on a specified date. As of June 30, 2023, the maturity of currency forward contracts ranged from
one month
to
18
months.
We designate certain currency forward contracts as cash flow hedges of forecasted raw material purchases, certain production costs or capital expenditures with exposure to changes in foreign currency exchange rates. Changes in the fair value of derivatives designated and that qualify as cash flow hedges of foreign exchange risk is deferred as a component of accumulated other comprehensive income in the accompanying condensed consolidated balance sheets. With respect to hedges of forecasted raw material purchases or production costs, the amount deferred is subsequently reclassified into costs of products sold in the period that, inventory produced using the hedged transaction, affects earnings. For hedged capital expenditures, deferred gains or losses are reclassified and included in the historical cost of the capital asset and subsequently affect earnings as depreciation is recognized.
- 22 -
We had the following outstanding derivatives that were used to hedge foreign exchange risks associated with forecasted transactions and designated as hedging instruments:
| In thousands |
June 30,
2023 |
December 31,
2022 |
|||||||||
| Derivative | |||||||||||
| Sell/Buy - sell notional | |||||||||||
| Euro / British Pound |
|
|
|||||||||
| U.S. Dollar / British Pound |
|
|
|||||||||
| U.S. Dollar / Euro |
|
|
|||||||||
| Sell/Buy - buy notional | |||||||||||
| Euro / Philippine Peso |
|
|
|||||||||
| British Pound / Philippine Peso |
|
|
|||||||||
| Euro / U.S. Dollar |
|
|
|||||||||
| U.S. Dollar / Canadian Dollar |
|
|
|||||||||
On June 15, 2022, we terminated a €
180
million notional value floating-to-fixed interest rate swap agreement with certain financial institutions that was entered into in October 2019 and was to mature in December 2022. During the life of the swap, we paid a fixed interest rate of the applicable margin plus
0.0395
% on €
180
million of the underlying variable rate term loan. We received the greater of
0.00
% or the EURIBOR-rate. At termination, we recognized a deferred gain of $
0.4
million that was amortized into interest expense through December 2022.
Derivatives Designated as Hedging Instruments – Net Investment Hedge
The €
220
million Term Loan discussed in Note 16 – “
Long-Term Debt”
was designated as a net investment hedge of our Euro functional currency foreign subsidiaries and was extinguished on March 30, 2023 in conjunction with the amendment of the Credit Facility. During the first six months of 2023 and 2022, we recognized a pre-tax loss of $
3.7
million and a pre-tax gain of $
15.7
million, respectively, on the remeasurement of the term loan from changes in currency exchange rates. Such amounts are recorded as a component of Other Comprehensive Income (Loss).
On September 6, 2022, we terminated a $
150.0
million cross currency swap agreement with certain financial institutions that was entered into in March 2022 and was to mature in May 2025. Pursuant to the terms of the swap, we agreed to receive
4.750
% interest denominated in U.S. dollars and we agreed to pay
3.06
% interest denominated in euros. We designated the cross-currency swap as a hedge of our net investment in certain euro functional currency subsidiaries. We collected cash proceeds of approximately $
15.2
million upon termination. The gain associated with the swap remains in accumulated other comprehensive loss.
Derivatives Not Designated as Hedging Instruments - Foreign Currency Hedges
We also entered into forward foreign exchange contracts to mitigate the impact changes in currency exchange rates have on balance sheet monetary assets and liabilities. None of these contracts are designated as hedges for financial accounting purposes and, accordingly, changes in value of the foreign exchange forward contracts and in the offsetting underlying on-balance-sheet transactions are reflected in the accompanying condensed consolidated statements of income under the caption “Other, net.”
The following sets forth derivatives used to mitigate the impact changes in currency exchange rates have on balance sheet monetary assets and liabilities:
- 23 -
| In thousands |
June 30,
2023 |
December 31,
2022 |
|||||||||
| Derivative | |||||||||||
| Sell/Buy - sell notional | |||||||||||
| U.S. Dollar / British Pound |
|
|
|||||||||
| British Pound / Euro |
|
|
|||||||||
| U.S. Dollar / Swiss Franc |
|
|
|||||||||
| British Pound / Swiss Franc |
|
|
|||||||||
| Euro / Swiss Franc |
|
|
|||||||||
| Euro / U.S. Dollar |
|
|
|||||||||
| Sell/Buy - buy notional | |||||||||||
| Euro / U.S. Dollar |
|
|
|||||||||
| British Pound / Euro |
|
|
|||||||||
| Swiss Franc / Euro |
|
|
|||||||||
| Swiss Franc / U.S. Dollar |
|
|
|||||||||
| Chinese Yuan / U.S. Dollar |
|
|
|||||||||
These contracts have maturities of one month from the date originally entered into.
Fair Value Measurements
The following table summarizes the fair values of derivative instruments for the period indicated and the line items in the accompanying condensed consolidated balance sheets where the instruments are recorded:
| In thousands |
June 30,
2023 |
December 31, 2022 |
June 30,
2023 |
December 31, 2022 | |||||||||||||||||||
| Balance sheet caption |
Prepaid Expenses and Other
Current Assets |
Other
Current Liabilities |
|||||||||||||||||||||
| Designated as hedging: | |||||||||||||||||||||||
| Forward foreign currency exchange contracts | $ |
|
$ |
|
$ |
|
$ |
|
|||||||||||||||
| Not designated as hedging: | |||||||||||||||||||||||
| Forward foreign currency exchange contracts | $ |
|
|
$ |
|
$ |
|
||||||||||||||||
The amounts set forth in the table above represent the net asset or liability giving effect to rights of offset with each counterparty. The effect of netting the amounts presented above did not have a material effect on our consolidated financial position.
The fair value hierarchy consists of three broad levels, which gives the highest priority to unadjusted quoted prices in active markets for identical assets or liabilities (Level 1) and the lowest priority to unobservable inputs (Level 3). The fair values of the foreign exchange forward contracts are considered to be Level 2. Foreign currency forward contracts are valued using foreign currency forward and interest rate curves. The fair value of each contract is determined by comparing the contract rate to the forward rate and discounting to present value. Contracts in a gain position are recorded in the condensed consolidated balance sheets under the caption “Prepaid expenses and other current assets” and the value of contracts in a loss position is recorded under the caption “Other current liabilities.”
- 24 -
|
Three months ended
June 30, |
Six months ended
June 30, |
||||||||||||||||||||||
| In thousands | 2023 | 2022 | 2023 | 2022 | |||||||||||||||||||
| Designated as hedging: | |||||||||||||||||||||||
| Forward foreign currency exchange contracts: | |||||||||||||||||||||||
| Cost of products sold | $ |
(
|
$ |
(
|
$ |
(
|
$ |
(
|
|||||||||||||||
| Interest expense |
|
(
|
|
|
|||||||||||||||||||
| Not designated as hedging: | |||||||||||||||||||||||
| Forward foreign currency exchange contracts: | |||||||||||||||||||||||
| Other – net | $ |
|
$ |
|
$ |
(
|
$ |
|
|||||||||||||||
The impact of activity not designated as hedging was substantially all offset by the remeasurement of the underlying on-balance-sheet item.
A rollforward of fair value amounts recorded as a component of accumulated other comprehensive income (loss), before taxes, is as follows:
| In thousands | 2023 | 2022 | |||||||||
| Balance at January 1, | $ |
|
$ |
|
|||||||
| Deferred gains on cash flow hedges |
|
|
|||||||||
| Reclassified to earnings |
(
|
(
|
|||||||||
| Balance at June 30, | $ |
|
$ |
|
|||||||
We expect substantially all of the amounts recorded as a component of accumulated other comprehensive income will be recorded in results of operations within the next
12
to
18
months and the amount ultimately recognized will vary depending on actual market rates.
Credit risk related to derivative activity arises in the event the counterparty fails to meet its obligations to us. This exposure is generally limited to the amounts, if any, by which the counterparty’s obligations exceed our obligation to them. Our policy is to enter into contracts only with financial institutions which meet certain minimum credit ratings.
19.
COMMITMENTS, CONTINGENCIES AND LEGAL PROCEEDINGS
Fox River - Neenah, Wisconsin
Background
We have previously reported that we face liabilities associated with environmental claims arising out of the presence of polychlorinated biphenyls (“PCBs”) in sediments in the lower Fox River, on which our former Neenah facility was located, and in the Bay of Green Bay, Wisconsin (collectively, the “Site”). Since the early 1990s, the United States, the State of Wisconsin and two Indian tribes (collectively, the “Governments”) have pursued a cleanup of a 39-mile stretch of river from Little Lake Butte des Morts into Green Bay and natural resource damages (“NRDs”). The United States originally notified several entities that they were potentially responsible parties (“PRPs”); however, after giving effect to settlements reached with the Governments, the remaining PRPs exposed to continuing obligations to implement the remainder of the cleanup consist of us, Georgia-Pacific Consumer Products, L.P. (“Georgia-Pacific”) and NCR Corporation. The United States Environmental Protection Agency (“EPA”) has divided the Site into
five
“operable units”, including the most upstream portion of the Site on which our facility was located (“OU1”) and four downstream reaches of the river and bay (“OU2-5”).
Over the past several years, we and certain other PRPs completed all remedial actions pursuant to applicable consent decrees or a Unilateral Administrative Order. In January 2019, we reached an agreement with the United States, the State of Wisconsin, and Georgia-Pacific to resolve all remaining claims among those parties. Under the Glatfelter consent decree, we are primarily responsible for long-term monitoring and maintenance in OU2-OU4a and for reimbursement of government oversight costs paid after October 2018. Finally, we remain responsible for our obligation to continue long-term monitoring and maintenance under our OU1 consent decree.
- 25 -
Cost estimates
Our remaining obligations under the OU1 consent decree consist of long-term monitoring and maintenance. Furthermore, we are primarily responsible for long-term monitoring and maintenance in OU2-OU4a over a period of at least
30
years. The monitoring activities consist of, among others, testing fish tissue, sampling water quality and sediment, and inspections of the engineered caps. In 2018, we entered into a fixed-price,
30-year
agreement with a third party for the performance of all of our monitoring and maintenance obligations in OU1 through OU4a with limited exceptions, such as, for extraordinary amounts of cap maintenance or replacement. Our obligation under this agreement is included in our total reserve for the Site. We are obligated to make the regular payments under that fixed-price contract until the remaining amount due is less than the OU1 escrow account balance. We are permitted to pay for this contract using the remaining balance of the escrow account established by us and WTM I Company (“WTM I”) another PRP, under the OU1 consent decree during any period that the balance in the escrow account exceeds the amount due under our fixed-price contract. As of June 30, 2023, the balance in the escrow is less than amounts due under the fixed-price contract by approximately $
1.1
million. Our obligation to pay this difference is secured by a letter of credit
.
At June 30, 2023, the escrow account balance totaled $
8.9
million which is included in the condensed consolidated balance sheet under the caption “Other assets.”
Under the consent decree, we are responsible for reimbursement of government oversight costs paid from October 2018 and later over approximately the next
30
years. We anticipate that oversight costs will decline as activities at the site have transitioned from remediation to long-term monitoring and maintenance.
Reserves for the Site
Our reserve for past and future government oversight costs and long-term monitoring and maintenance totaled $
14.2
million at June 30, 2023, of which $
2.0
million is recorded in the accompanying June 30, 2023 condensed consolidated balance sheet under the caption “Environmental liabilities” and the remaining $
12.2
million is recorded under the caption “Other long-term liabilities.”
- 26 -
20.
SEGMENT INFORMATION
The following tables set forth financial and other information by segment for the period indicated:
|
Three months ended
June 30, |
Six months ended
June 30, |
||||||||||||||||||||||
| Dollars in thousands | 2023 | 2022 | 2023 | 2022 | |||||||||||||||||||
| Net Sales | |||||||||||||||||||||||
| Airlaid Material | $ |
|
$ |
|
$ |
|
$ |
|
|||||||||||||||
| Composite Fibers |
|
|
|
|
|||||||||||||||||||
| Spunlace |
|
|
|
|
|||||||||||||||||||
| Inter-segment sales elimination |
(
|
|
(
|
|
|||||||||||||||||||
| Total | $ |
|
$ |
|
$ |
|
$ |
|
|||||||||||||||
| Operating income (loss) | |||||||||||||||||||||||
| Airlaid Material | $ |
|
$ |
|
$ |
|
$ |
|
|||||||||||||||
| Composite Fibers |
|
|
|
|
|||||||||||||||||||
| Spunlace |
(
|
(
|
(
|
(
|
|||||||||||||||||||
| Other and unallocated |
(
|
(
|
(
|
(
|
|||||||||||||||||||
| Total | $ |
(
|
$ |
|
$ |
(
|
$ |
(
|
|||||||||||||||
| Depreciation and amortization | |||||||||||||||||||||||
| Airlaid Material | $ |
|
$ |
|
$ |
|
$ |
|
|||||||||||||||
| Composite Fibers |
|
|
|
|
|||||||||||||||||||
| Spunlace |
|
|
|
|
|||||||||||||||||||
| Other and unallocated |
|
|
|
|
|||||||||||||||||||
| Total | $ |
|
$ |
|
$ |
|
$ |
|
|||||||||||||||
| Capital expenditures | |||||||||||||||||||||||
| Airlaid Material | $ |
|
$ |
|
$ |
|
$ |
|
|||||||||||||||
| Composite Fibers |
|
|
|
|
|||||||||||||||||||
| Spunlace |
|
|
|
|
|||||||||||||||||||
| Other and unallocated |
|
|
|
|
|||||||||||||||||||
| Total | $ |
|
$ |
|
$ |
|
$ |
|
|||||||||||||||
| Tons shipped (metric) | |||||||||||||||||||||||
| Airlaid Material |
|
|
|
|
|||||||||||||||||||
| Composite Fibers |
|
|
|
|
|||||||||||||||||||
| Spunlace |
|
|
|
|
|||||||||||||||||||
| Total |
|
|
|
|
|||||||||||||||||||
Segments
Results of individual operating segments are presented based on our management accounting practices and management structure. There is no comprehensive, authoritative body of guidance for management accounting equivalent to accounting principles generally accepted in the United States of America; therefore, the financial results of individual segments are not necessarily comparable with similar information for any other company. The management accounting process uses assumptions and allocations to measure performance of the segments. Methodologies are refined from time to time as management accounting practices are enhanced and businesses change. The costs incurred by support areas not directly aligned with the segment are allocated primarily based on an estimated utilization of support area services or are included in “Other and Unallocated” in the table set forth above.
- 27 -
- 28 -
ITEM 2. MANAGEMENT'S DISCUSSION AND ANALYSIS OF FINANCIAL CONDITION AND RESULTS OF OPERATIONS
The following discussion should be read in conjunction with the information in the unaudited condensed consolidated financial statements and notes thereto included herein and Glatfelter’s Financial Statements and Management’s Discussion and Analysis of Financial Condition and Results of Operations included in our 2022 Annual Report on Form 10-K ("2022 Form 10-K").
Forward-Looking Statements
This Quarterly Report on Form 10-Q includes forward-looking statements within the meaning of the Private Securities Litigation Reform Act of 1995. All statements other than statements of historical fact, including statements regarding industry prospects and future consolidated financial position or results of operations, made in this Report on Form 10-Q are forward looking. We use words such as “anticipates”, “believes”, “expects”, “future”, “intends” and similar expressions to identify forward-looking statements. Forward-looking statements reflect management’s current expectations and are inherently uncertain. Our actual results may differ significantly from such expectations. The following discussion includes forward-looking statements all of which are inherently difficult to predict. Although we make such statements based on assumptions that we believe to be reasonable, there can be no assurance that actual results will not differ materially from our expectations. Accordingly, we identify the following important factors, among others, which could cause our results to differ from any results that might be projected, forecasted or estimated in any such forward-looking statements:
i.
risks related to the military conflict between Russia and Ukraine and its impact on our production, sales, supply chain, cost of energy, and availability of energy due to natural gas supply issues into Europe from the Nord Stream 1 pipeline;
ii.
risks associated with the impact of the COVID-19 pandemic, including global and regional economic conditions, changes in demand for our products, interruptions in our global supply chain, ability to continue production by our facilities, credit conditions of our customers or suppliers, or potential legal actions that could arise due to our operations during the pandemic;
iii.
disruptions of our global supply chain, including the availability of key raw materials and transportation for the delivery of critical inputs and of products to customers, and the increase in the costs of transporting materials and products;
iv.
risks associated with our ability to increase selling prices quickly or sufficiently enough to recover rapid cost inflation in our raw materials, energy, freight and other costs, and the potential reduction or loss of sales due to price increases;
v.
variations in demand for our products, including the impact of unplanned market-related downtime, variations in product pricing, or product substitution;
vi.
the impact of competition, changes in industry production capacity, including the construction of new facilities or new machines, the closing of facilities and incremental changes due to capital expenditures or productivity increases;
vii.
risks associated with our international operations, including local economic and political environments and fluctuations in currency exchange rates;
viii.
our ability to develop new, high value-added products;
ix.
changes in the price or availability of raw materials we use, particularly woodpulp, pulp substitutes, synthetic pulp, other specialty fibers and abaca fiber;
x.
changes in energy-related prices and commodity raw materials with an energy component;
xi.
the impact of unplanned production interruption at our facilities or at any of our key suppliers;
xii.
disruptions in production and/or increased costs due to labor disputes;
xiii.
the gain or loss of significant customers and/or on-going viability of such customers;
xiv.
the impact of war and terrorism;
xv.
the impact of unfavorable outcomes of audits by various state, federal or international tax authorities or changes in pre-tax income and its impact on the valuation of deferred taxes;
xvi.
enactment of adverse state, federal or foreign tax or other legislation or changes in government legislation, policy or regulation; and
xvii.
our ability to finance, consummate and integrate acquisitions,
including our acquisitions of Mount Holly and Jacob Holm
.
Introduction
We manufacture a wide array of engineered materials and manage our company along three operating segments:
•
Airlaid Materials
with sales of airlaid nonwoven fabric-like materials used in feminine hygiene products, adult incontinence products, tabletop, specialty wipes, home care products and other airlaid applications;
- 29 -
•
Composite Fibers
with sales of single-serve tea and coffee filtration papers, wallcovering base materials, composite laminate papers, technical specialties including substrates for electrical applications, and metallized products; and
•
Spunlace
with sales of premium quality spunlace nonwovens for critical cleaning, high-performance materials, personal care, hygiene and medical applications.
The former Specialty Papers business’ results of operations and financial condition are reported as discontinued operations. Following is a discussion and analysis primarily of the financial results of operations and financial condition of our continuing operations.
RESULTS OF OPERATIONS
Six months ended June 30, 2023 versus the six months ended June 30, 2022
Overview
For the first six months of 2023, we reported a loss from continuing operations of $49.8 million, or $1.11 per share compared with a loss of $110.8 million or $2.47 per share in the year earlier period. The following table sets forth summarized consolidated results of operations:
| Six months ended June 30, | |||||||||||
| In thousands, except per share | 2023 | 2022 | |||||||||
| Net sales | $ | 735,213 | $ | 745,643 | |||||||
| Gross profit | 54,347 | 69,062 | |||||||||
| Operating loss | (4,372) | (106,965) | |||||||||
| Continuing operations | |||||||||||
| Loss | (49,813) | (110,750) | |||||||||
| Loss per share | (1.11) | (2.47) | |||||||||
| Net loss | (50,524) | (110,379) | |||||||||
| Loss per share | (1.13) | (2.46) | |||||||||
The reported results are in accordance with generally accepted accounting principles in the United States (“GAAP”) and reflect the impact of a number of significant items including debt refinancing, turnaround strategy costs, strategic initiatives, CEO transition costs, and cost optimization, among others. Our operating results for the first six months of 2023 reflect: i) the impact of market softness and customer destocking resulting in lower sales volumes and sales, as well as, lower production, ii) higher interest expense stemming from the debt refinancing in the first quarter of 2023, iii) costs incurred related to the planned closure of our Ober-Schmitten, Germany facility and our turnaround strategy.
In addition to the results reported in accordance with GAAP, we evaluate our performance using financial metrics not calculated in accordance with GAAP, including adjusted earnings and adjusted earnings before interest expense, interest income, income taxes, depreciation and amortization and share-based compensation (“Adjusted EBITDA”). On an adjusted earnings basis, a non-GAAP measure, we had an adjusted loss from continuing operations of $26.3 million, or $0.58 per share for the first six months of 2023, compared with a loss of $7.8 million, or $0.17 per share, a year ago. Our Adjusted EBITDA, also a non-GAAP measure, was $42.0 million for the six months ended June 30, 2023 as compared to $50.2 million for the same period in 2022. We disclose this information to allow investors to evaluate our performance exclusive of certain items that impact the comparability of results from period to period and we believe it is helpful in understanding underlying operating trends and cash flow generation.
Adjusted earnings consists of net income determined in accordance with GAAP adjusted to exclude the impact of the following:
Goodwill and other asset impairment charges.
This adjustment represents non-cash charges recorded to reduce the carrying amount of certain long-lived assets of our Dresden, Germany facility and goodwill of our Composite Fibers reporting segment.
Turnaround strategy costs.
This adjustment reflects costs incurred in connection with the Company's turnaround strategy initiated in 2022 under its new chief executive officer to drive operational and financial improvement. These costs are primarily related to professional services fees and employee separation costs.
Russia/Ukraine conflict charges
. This adjustment represents a non-cash charge recorded to reduce the carrying amount of accounts receivable and inventory directly related to the Russia/Ukraine military conflict.
- 30 -
Strategic initiatives.
These adjustments primarily reflect professional and legal fees incurred directly related to evaluating and executing certain strategic initiatives including costs associated with acquisitions, related integrations, and charges incurred to step-up acquired inventory to fair-value.
Ober-Schmitten closure costs.
These adjustments reflect employee separation costs and professional and other costs directly associated with the closure of the Ober-Schmitten, Germany facility.
Debt refinancing costs.
Represents charges to write-off unamortized debt issuance costs in connection with the extinguishment of the Company’s €220.0 million Term Loan and IKB loans, as well as the amendment to the Company's credit facility. These costs also include an early repayment penalty related to the extinguishment of the IKB loans.
CEO transition costs.
This adjustment reflects a non-cash pension settlement charge associated with the separation of our former CEO related to a lump-sum distribution made in Q1 2023 under the terms of his non-qualified pension plan agreement.
Corporate headquarters relocation.
These adjustments reflect costs incurred in connection with the strategic relocation of the Company’s corporate headquarters to Charlotte, NC. The costs are primarily related to employee relocation costs and exit costs at the former corporate headquarters.
Cost optimization actions.
These adjustments reflect charges incurred in connection with initiatives to optimize the cost structure of the Company, improve efficiencies or other objectives. Such actions may include asset rationalization, headcount reductions, or similar actions. These adjustments, which have occurred at various times in the past, are irregular in timing and relate to specific identified programs to reduce or optimize the cost structure of a particular operating segment or the corporate function.
COVID-19 ERC recovery.
This adjustment reflects the benefit recognized from employee retention credits claimed under the Coronavirus Aid, Relief, and Economic Security Act (“CARES”) Act and the Taxpayer Certainty and Disaster Tax Relief Act of 2020 and professional services fees directly associated with claiming this benefit.
Timberland sales and related costs.
These adjustments exclude gains from the sales of timberlands as these items are not considered to be part of our core business, ongoing results of operations or cash flows. These adjustments are irregular in timing and amount and may benefit our operating results.
These adjustments are each unique and not considered to be on-going in nature. The transactions are irregular in timing and amount and may significantly impact our operating performance. As such, these items may not be indicative of our past or future performance and therefore are excluded for comparability purposes.
Adjusted earnings and adjusted earnings per share are considered measures not calculated in accordance with GAAP, and therefore are non-GAAP measures. The non-GAAP financial information should not be considered in isolation from, or as a substitute for, measures of financial performance prepared in accordance with GAAP.
The following table sets forth the reconciliation of net loss to adjusted loss from continuing operations for the periods indicated:
- 31 -
| Six months ended June 30, | |||||||||||||||||||||||
| 2023 | 2022 | ||||||||||||||||||||||
| In thousands, except per share | Amount | EPS | Amount | EPS | |||||||||||||||||||
| Net loss | $ | (50,524) | $ | (1.13) | $ | (110,379) | $ | (2.46) | |||||||||||||||
| Exclude: Loss (income) from discontinued operations, net of tax | 711 | 0.02 | (371) | (0.01) | |||||||||||||||||||
| Loss from continuing operations | (49,813) | (1.11) | (110,750) | (2.47) | |||||||||||||||||||
|
Adjustments
(pre-tax):
|
|||||||||||||||||||||||
|
Goodwill and other asset impairment charges
(1)
|
— | 117,349 | |||||||||||||||||||||
|
Turnaround strategy costs
(2)
|
6,682 | — | |||||||||||||||||||||
|
Russia/Ukraine conflict charges
(3)
|
— | 3,948 | |||||||||||||||||||||
|
Strategic initiatives
(4)
|
1,670 | 2,488 | |||||||||||||||||||||
|
Ober-Schmitten closure costs
(5)
|
10,742 | — | |||||||||||||||||||||
|
Debt refinancing
(6)
|
1,883 | — | |||||||||||||||||||||
|
CEO transition costs
(7)
|
633 | — | |||||||||||||||||||||
| Corporate headquarters relocation | — | 223 | |||||||||||||||||||||
|
Cost optimization actions
(8)
|
— | 941 | |||||||||||||||||||||
|
COVID-19 ERC recovery
(9)
|
(233) | — | |||||||||||||||||||||
| Timberland sales and related costs | (617) | (2,962) | |||||||||||||||||||||
| Total adjustments (pre-tax) | 20,760 | 121,987 | |||||||||||||||||||||
|
Income taxes
(10)
|
(61) | (19,167) | |||||||||||||||||||||
|
Other tax adjustments
(11)
|
2,798 | 175 | |||||||||||||||||||||
| Total after-tax adjustments | 23,497 | 0.52 | 102,995 | 2.30 | |||||||||||||||||||
| Adjusted loss from continuing operations | $ | (26,316) | $ | (0.58) | $ | (7,755) | $ | (0.17) | |||||||||||||||
(1)
Reflects goodwill impairment charge of $56.1 million and other asset impairment charges of $61.3 million recognized in Q1 2022.
(2)
Reflects employee separation costs of $4.0 million and $2.7 million in professional fees.
(3)
Reflects bad debt expense charges of $2.9 million and inventory reserves charges of $1.0 million recognized in Q1 2022.
(4)
For 2023, primarily reflects integration activities including consulting and legal fees of $0.7 million, the write-off of construction in process asset deemed unusable of $0.5 million, employee separation costs of $0.1 million, and other costs of $0.4 million. For 2022, reflects professional, consulting and legal fees of $1.7 million, employee separation and other costs of $0.8 million, all of which are directly related to acquisitions.
(5)
Reflects employee separation costs of $10.4 million and professional services fees and other costs of $0.3 million in connection with the closure of the Ober-Schmitten facility.
(6)
Reflects $1.8 million write-off of deferred debt issuance costs in connection with the Company’s debt refinancing in Q1 2023, and $0.1 million in early repayment penalties and write-off of unamortized financing fees on the IKB loans.
(7)
Reflects pension settlement charge related to former CEO's separation.
(8)
Primarily reflects employee separation costs of $0.4 million, equipment write-down of $0.4 million and other costs of $0.1 million directly associated with closure of a synthetic fiber production facility in the U.K. recognized in Q1 2022.
(9)
Reflects $0.2 million of interest income on employee retention credits claimed under the CARES Act of 2020 and the subsequent related amendments.
(10)
Tax effect on adjustments calculated based on the incremental effective tax rate of the jurisdiction in which each adjustment originated. For items originating in the U.S., no tax effect is recognized due to the previously established valuation allowance on the net deferred tax assets.
(11)
Tax effect of applying certain provisions of the CARES Act of 2020. The amount in 2023 also includes $2.4 million of deferred tax expense resulting from valuation allowance for Ober-Schmitten facility.
The following table sets forth the reconciliation of net loss to adjusted EBITDA for the periods indicated:
- 32 -
| Adjusted EBITDA | Six months ended June 30, | |||||||||||||
| In thousands | 2023 | 2022 | ||||||||||||
| Net loss | $ | (50,524) | $ | (110,379) | ||||||||||
| Exclude: Loss (income) from discontinued operations, net of tax | 711 | (371) | ||||||||||||
| Add back: Taxes on continuing operations | 10,093 | (13,489) | ||||||||||||
| Depreciation and amortization | 31,701 | 34,936 | ||||||||||||
| Interest expense, net | 29,025 | 15,479 | ||||||||||||
| EBITDA | 21,006 | (73,824) | ||||||||||||
| Adjustments: | ||||||||||||||
| Goodwill and other asset impairment charges | — | 117,349 | ||||||||||||
| Turnaround strategy costs | 7,196 | — | ||||||||||||
| Russia/Ukraine conflict charges | — | 3,948 | ||||||||||||
| Strategic initiatives | 1,670 | 2,488 | ||||||||||||
| Ober-Schmitten closure costs | 10,742 | — | ||||||||||||
| Debt refinancing | 59 | — | ||||||||||||
| CEO transition costs | 633 | — | ||||||||||||
| Corporate headquarters relocation | — | 223 | ||||||||||||
| Share-based compensation | 1,307 | 2,419 | ||||||||||||
| Cost optimization actions, excluding accelerated depreciation | — | 589 | ||||||||||||
| COVID-19 ERC recovery | 41 | — | ||||||||||||
| Timberland sales and related costs | (617) | (2,962) | ||||||||||||
| Adjusted EBITDA | $ | 42,037 | $ | 50,230 | ||||||||||
EBITDA is a measure used by management to assess our operating performance and is calculated using
income (loss) from continuing operations and excludes interest expense, interest income, income taxes, and
depreciation and amortization. Adjusted EBITDA is calculated using EBITDA and further excludes certain items management considers to be unrelated to the company’s core operations. The adjustments include, among others, goodwill and other asset impairment charges, the costs of strategic initiatives, turnaround strategy costs, Ober-Schmitten closure costs, CEO transition costs, and share-based compensation expense, as well as the elimination of gains from sales of timberlands, among others. Adjusted EBITDA is a performance measure that excludes costs that we do not consider to be indicative of our ongoing operating performance.
- 33 -
Segment Financial Performance
| Six months ended June 30, | |||||||||||
| Dollars in thousands | 2023 | 2022 | |||||||||
| Net Sales | |||||||||||
| Airlaid Material | $ | 311,952 | $ | 293,172 | |||||||
| Composite Fibers | 258,316 | 259,167 | |||||||||
| Spunlace | 166,143 | 193,304 | |||||||||
| Inter-segment sales elimination | (1,198) | — | |||||||||
| Total | $ | 735,213 | $ | 745,643 | |||||||
| Operating income (loss) | |||||||||||
| Airlaid Material | $ | 23,640 | $ | 24,165 | |||||||
| Composite Fibers | 7,025 | 5,444 | |||||||||
| Spunlace | (3,337) | (3,380) | |||||||||
| Other and unallocated | (31,700) | (133,194) | |||||||||
| Total | $ | (4,372) | $ | (106,965) | |||||||
| Depreciation and amortization | |||||||||||
| Airlaid Material | $ | 15,323 | $ | 15,171 | |||||||
| Composite Fibers | 7,862 | 11,315 | |||||||||
| Spunlace | 6,568 | 5,859 | |||||||||
| Other and unallocated | 1,948 | 2,591 | |||||||||
| Total | $ | 31,701 | $ | 34,936 | |||||||
| Capital expenditures | |||||||||||
| Airlaid Material | $ | 4,414 | $ | 5,532 | |||||||
| Composite Fibers | 5,773 | 10,258 | |||||||||
| Spunlace | 5,210 | 3,886 | |||||||||
| Other and unallocated | 2,061 | 3,021 | |||||||||
| Total | $ | 17,458 | $ | 22,697 | |||||||
| Tons shipped (metric) | |||||||||||
| Airlaid Material | 79,073 | 83,733 | |||||||||
| Composite Fibers | 49,784 | 52,457 | |||||||||
| Spunlace | 31,611 | 40,094 | |||||||||
| Total | 160,468 | $ | 176,284 | ||||||||
Segments
Results of individual operating segments are presented based on our management accounting practices and management structure. There is no comprehensive, authoritative body of guidance for management accounting equivalent to accounting principles generally accepted in the United States of America; therefore, the financial results of individual segments are not necessarily comparable with similar information for any other company. The management accounting process uses assumptions and allocations to measure performance of the segments. Methodologies are refined from time to time as management accounting practices are enhanced and businesses change. The costs incurred by support areas not directly aligned with the segment are allocated primarily based on an estimated utilization of support area services or are included in “Other and Unallocated” in the table set forth above.
Management evaluates results of operations of the operating segments before certain corporate level costs and the effects of certain gains or losses not considered to be related to the core business operations. Management believes that this is a more meaningful representation of the operating performance of its core businesses, the profitability of the segments and the extent of cash flow generated from these core operations. Such amounts are presented under the caption “Other and Unallocated.” In the evaluation of operating segments results, management does not use any measures of total assets. This
- 34 -
presentation is aligned with the management and operating structure of our company. It is also on this basis that the Company’s performance is evaluated internally and by the Company’s Board of Directors.
Sales and Costs of Products Sold
| Six months ended June 30, | |||||||||||||||||
| In thousands | 2023 | 2022 | Change | ||||||||||||||
| Net sales | $ | 735,213 | $ | 745,643 | $ | (10,430) | |||||||||||
| Costs of products sold | 680,866 | 676,581 | 4,285 | ||||||||||||||
| Gross profit | $ | 54,347 | $ | 69,062 | $ | (14,715) | |||||||||||
| Gross profit as a percent of Net sales | 7.4 | % | 9.3 | % | |||||||||||||
The following table sets forth the contribution to consolidated net sales by each segment:
| Six months ended June 30, | |||||||||||
| Percent of Total | 2023 | 2022 | |||||||||
| Segment | |||||||||||
| Airlaid Materials | 42.4 | % | 34.8 | % | |||||||
| Composite Fibers | 35.1 | 39.3 | |||||||||
| Spunlace | 22.5 | 25.9 | |||||||||
| Total | 100.0 | % | 100.0 | % | |||||||
Net sales
totaled $735.2 million and $745.6 million in the first six months of 2023 and 2022, respectively. Net sales for Airlaid Materials and Composite Fibers increased by 8.9% and 2.0%, respectively, on a constant currency basis. The Spunlace segment'’s net sales decreased by 8.6% on a constant currency basis.
Airlaid Materials’
net sales increased $18.8 million in the year-over-year comparison mainly driven by higher selling prices from cost-pass-through arrangements with customers and pricing actions to recover significant inflation in raw materials and energy. Shipments were 5.6% lower mainly due to feminine hygiene and tabletop categories and currency translation was unfavorable by $1.8 million.
Airlaid Materials’ first six months operating income of $23.6 million was $0.5 million lower when compared to the first six months of 2022. Lower shipments lowered r
esults by $1.2 million. Selling price increases and energy surcharges of $32.2 million more than offset higher raw material and energy costs of $29.5 million. In the first six months of 2023, primary raw material input costs increased $28 million, or 19%, and energy costs increased $1 million, or 7%, compared to the first six months of 2022. The increase in primary raw material input costs was approximately in-line with broader market indices, and energy prices were less volatile with the government legislation in Europe capping energy prices. We expect prices for both energy and raw materials to steadily decline in 2023. As of June 30, 2023, Airlaid Materials had approximately 74% of its net sales with contracts with pass-through provisions. Operations were unfavorable by $3.6 million mainly driven by lower production to manage customer demand as some
customers slowed ordering patterns to manage inventory levels built up at the end of 2022 to avoid anticipated energy and supply chain disruptions in the beginning of 2023. The impact of currency and related hedging positively impacted earnings by $1.7 million. The primary drivers of the change in Airlaid Materials’ operating income are summarized in the following chart (presented in millions):
- 35 -
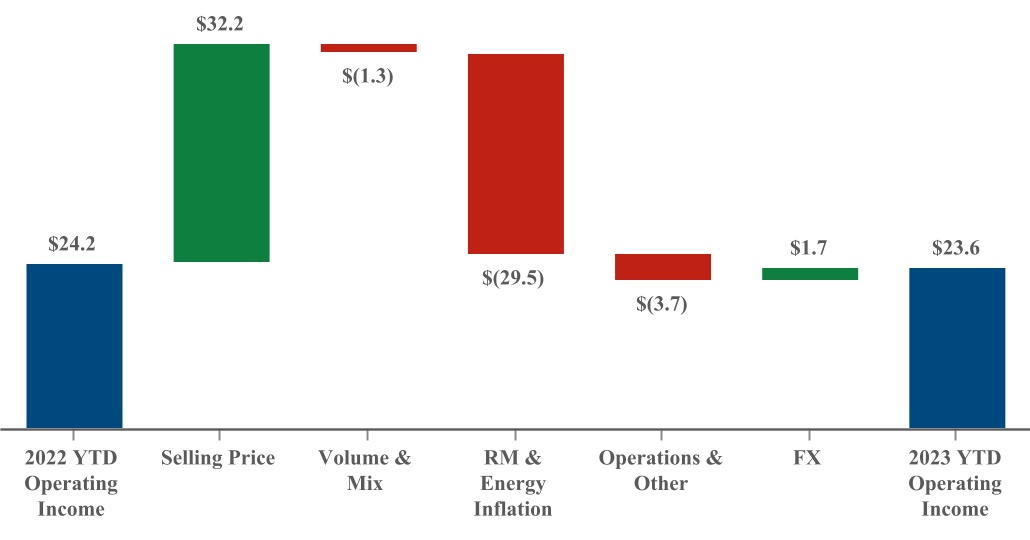
Composite Fibers’
net sales was $0.9 million lower in the first six months of 2023, compared to the year-ago period as lower shipment of 5.1% and unfavorable currency translation of $4.6 million was partially offset by higher selling prices of $17.5 million.
Composite Fibers had operating income for the first six months of $7.0 million compared with operating income of $5.4 million in the first six months of 2022. Higher selling prices a
nd energy surcharges more than offset the continued inflation in energy, raw material, and freight and was a net favorable benefit to results of $5.2 million. In the first six months of 2023, energy costs increased $2.7 million, or 7%, and primary raw material input costs increased $9.6 million, or 10%, compared to the first six months of 2022. The increase in primary raw material input costs was approximately in-line with broader market indices, and energy prices were less volatile with the government legislation in Europe capping energy prices. We expect prices for both energy and raw materials to steadily decline in 2023. As of June 30, 2023, Composite Fibers had approximately 46% of its net sales with contracts with pass-through provisions. Operations was unfavorable by $0.9 million mainly driven by lower pro
duction volume to match customer demand and manage inventory levels, largely offset by cost savings from headcount reduction actions taken related to the turnaround strategy, lower energy consumption due to lower production volume and lower depreciation expense due to the Dresden and Ober-Schmitten asset impairments in 2022. The Ober-Schmitten site negatively impacted year-over-year results by $5.5 million. The impact of currency and related hedging positively impacted earnings by $0.1 million. The primary drivers of the change in Composite Fibers’ operating income are summarized in the following chart (presented in millions):
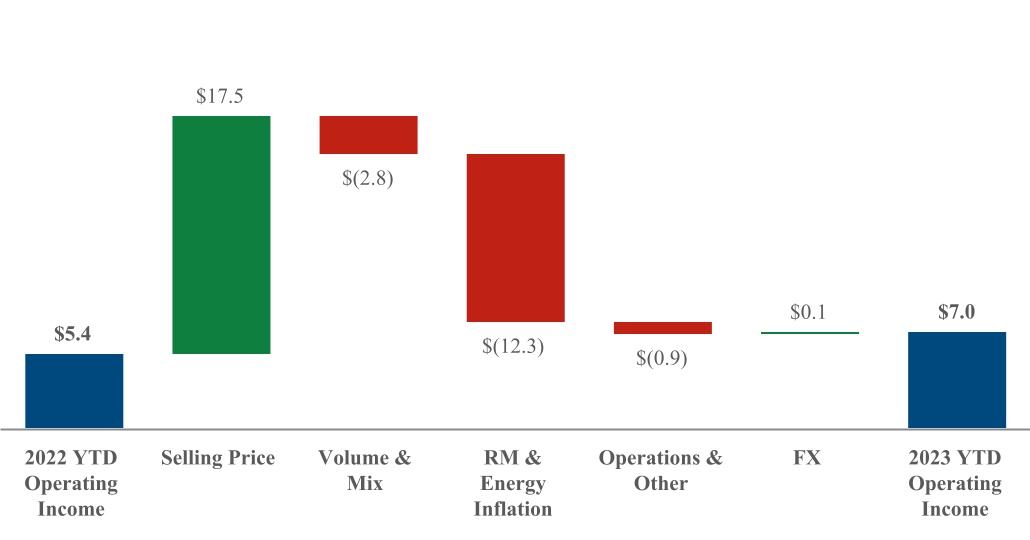
Spunlace’s
net sales was $27.2 million lower in the first six months of 2023, compared to the year-ago period as lower shipment of 21.2% and unfavorable currency translation of $0.9 million was partially offset by higher selling prices of $14.1 million.
- 36 -
Spunlace had an operating loss of $3.3 million in the first six months of this year compared with an operating loss of $3.4 million in the first six months of 2022. Higher selling prices and energy surcharges were partially offset by higher raw material and energy costs favorably impacting earnings by $5.7 mil
lion. In the first six months of 2023, primary raw material input costs increased $10.0 million, or 10%, and energy costs decreased $1.4 million, or 9%, compared to the first six months of 2022. The increase in primary raw material input costs was approximately in-line with broader market indices and energy prices were less volatile with the government legislation in Europe capping energy prices. We expect prices for both energy and raw materials to decline in 2023. Volume was unfavorable by $3.8 million driven by lower shipments in almost all categories. As of June 30, 2023, Spunlace h
ad approximately 37% of its net sales with contracts with pass-through provisions. The primary drivers of the change in Spunlace’s operating income are summarized in the following chart (presented in millions):

Asset Impairment
During the first quarter of 2022, in connection with an assessment of potential impairment of long-lived and indefinite-lived intangible assets stemming from the compounding impacts resulting from the Russia/Ukraine military conflict and related sanctions, we recorded a $117.3 million non-cash asset impairment charge related to Composite Fibers' Dresden facility and an impairment of Composite Fibers' goodwill. Dresden is a single-line facility that produces wallcover base paper, the majority of which is directly sold into the Russian and Ukrainian markets.
In addition, as a result of economic sanctions and disruptions to the financial markets, certain customers were not able to satisfy outstanding accounts receivables. As such, during the first quarter of 2022, we recognized bad debt expense of approximately $2.9 million directly related to Russian and Ukrainian customers which is included in “Selling, general and administrative expenses” in the accompanying condensed consolidated statements of income. Furthermore, during the first quarter of 2022, we increased inventory reserves by approximately $1.0 million, primarily related to wallcover products. The charge related to inventory reserves is included in “Cost of products sold” in the accompanying condensed consolidated statements of income.
Other and
Unallocated
The amount of net operating expenses not allocated to an operating segment, and reported as “Other and Unallocated” in our table of Segment Financial Performance, totaled $31.7 million in the first six months of 2023 compared with $133.2 million in the same period a year ago. Excluding the items identified to present “adjusted earnings,” unallocated expenses for the first six months of 2023 increased $1.9 million compared to the same period in 2022 mainly driven by higher professional services costs, travel expenses and wage inflation.
Income Taxes
For the six months ended June 30, 2023, we recorded a $10.1 million income tax provision on a pretax loss of $39.7 million from continuing operations. The comparable amounts for 2022 were $13.5 million income tax benefit on a pre-tax loss of $124.2 million. The income tax provision in both periods reflects valuation allowances recorded for the operating losses in the U.S. and certain foreign jurisdictions for which no income tax benefit was recorded. The income tax benefit in 2022 also includes deferred tax benefits associated with the asset impairment charges and related bad debt and inventory reserves.
Foreign Currency
We own and operate facilities in Canada, Germany, France, the United Kingdom, Spain, and the Philippines. The functional currency of our Canadian operations is the U.S. dollar. However, in Germany, France and Spain, it is the euro, in the UK, it is the British pound sterling, and in the Philippines the functional currency is the peso. On an annual basis, our euro denominated net sales exceeds euro expenses by an estimated €190 million. For the first six
- 37 -
months of 2023, the average currency exchange rate was 1.08 dollar/euro compared with 1.09 in the same period of 2022. With respect to the British pound sterling, Canadian dollar, and Philippine peso, we have differing amounts of inflows and outflows of these currencies, although to a lesser degree than the euro. As a result, we are exposed to changes in currency exchange rates and such changes could be significant. The translation of the results from international operations into U.S. dollars is subject to changes in foreign currency exchange rates.
The table below summarizes the translation impact on reported results that changes in currency exchange rates had on our non-U.S. based operations from the conversion of these operation’s results for the first six months of 2023.
| In thousands |
Six months ended
June 30, |
||||
|
Favorable
(unfavorable) |
|||||
| Net sales | $ | (7,316) | |||
| Costs of products sold | 8,540 | ||||
| SG&A expenses | 449 | ||||
| Income taxes and other | 41 | ||||
| Net loss | $ | 1,714 | |||
The above table only presents the financial reporting impact of foreign currency translations assuming currency exchange rates in 2023 were the same as 2022. It does not present the impact of certain competitive advantages or disadvantages of operating or competing in multi-currency markets.
Three months ended June 30, 2023 versus the three months ended June 30, 2022
Overview
For the second quarter of 2023, we reported a loss from continuing operations of $36.6 million, or $0.82 per share compared with a loss of $2.5 million or $0.05 per share in the same period in 2022. The following table sets forth summarized consolidated results of operations:
| Three months ended June 30, | |||||||||||
| In thousands, except per share | 2023 | 2022 | |||||||||
| Net sales | $ | 357,005 | $ | 363,963 | |||||||
| Gross profit | 18,133 | 37,397 | |||||||||
| Operating income (loss) | (10,485) | 8,924 | |||||||||
| Continuing operations | |||||||||||
| Loss | (36,631) | (2,460) | |||||||||
| Loss per share | (0.82) | (0.05) | |||||||||
| Net loss | (36,940) | (2,052) | |||||||||
| Loss per share | (0.83) | (0.04) | |||||||||
The reported results are in accordance with generally accepted accounting principles in the United States (“GAAP”) and reflect the impact of a number of significant items including debt refinancing, turnaround strategy costs, strategic initiatives, CEO transition costs, and cost optimization, among others. Our operating results for the three months ended June 30, 2023 reflect: i) the impact of market softness and customer destocking resulting in lower sales volumes and sales, as well as, lower production, ii) higher interest expense stemming from the debt refinancing in the first quarter of 2023, iii) costs incurred related to the planned closure of our Ober-Schmitten, Germany facility and our turnaround strategy.
In addition to the results reported in accordance with GAAP, we evaluate our performance using financial metrics not calculated in accordance with GAAP, including adjusted earnings and adjusted earnings before interest expense, interest income, income taxes, depreciation and amortization and share-based compensation (“Adjusted EBITDA”). On an adjusted earnings basis, a non-GAAP measure, we had an adjusted loss from continuing operations of $20.5 million, or $(0.45) per share for the second quarter of 2023, compared with a loss of $1.6 million, or $(0.04) per share, a year ago. Our Adjusted EBITDA, also a non-GAAP measure, was $17.3 million for the three months ended June 30, 2023 as compared to $27.2 million for the same period in 2022. We disclose this information to allow investors to evaluate our performance exclusive of certain items that impact the comparability of results from period to period and we believe it is helpful in understanding underlying operating trends and cash flow generation.
- 38 -
Adjusted earnings and adjusted earnings per share are considered measures not calculated in accordance with GAAP, and therefore are non-GAAP measures. The non-GAAP financial information should not be considered in isolation from, or as a substitute for, measures of financial performance prepared in accordance with GAAP.
The following table sets forth the reconciliation of net loss to adjusted loss from continuing operations for the periods indicated:
| Three months ended June 30, | |||||||||||||||||||||||
| 2023 | 2022 | ||||||||||||||||||||||
| In thousands, except per share | Amount | EPS | Amount | EPS | |||||||||||||||||||
| Net loss | $ | (36,940) | $ | (0.83) | $ | (2,052) | $ | (0.04) | |||||||||||||||
| Exclude: Loss (income) from discontinued operations, net of tax | 309 | 0.01 | (408) | (0.01) | |||||||||||||||||||
| Loss from continuing operations | (36,631) | (0.82) | (2,460) | (0.05) | |||||||||||||||||||
|
Adjustments
(pre-tax):
|
|||||||||||||||||||||||
|
Turnaround strategy costs
(1)
|
2,199 | — | |||||||||||||||||||||
|
Strategic initiatives
(2)
|
889 | 653 | |||||||||||||||||||||
|
Ober-Schmitten closure costs
(3)
|
10,793 | — | |||||||||||||||||||||
| Corporate headquarters relocation | — | 135 | |||||||||||||||||||||
|
COVID-19 ERC recovery
(4)
|
(233) | — | |||||||||||||||||||||
| Total adjustments (pre-tax) | 13,648 | 788 | |||||||||||||||||||||
|
Income taxes
(5)
|
(58) | (20) | |||||||||||||||||||||
|
Other tax adjustments
(6)
|
2,591 | 96 | |||||||||||||||||||||
| Total after-tax adjustments | 16,181 | 0.36 | 864 | 0.01 | |||||||||||||||||||
| Adjusted loss from continuing operations | $ | (20,450) | $ | (0.45) | $ | (1,596) | $ | (0.04) | |||||||||||||||
(1)
Reflects professional services fees of $1.5 million and employee separation costs of $0.7 million.
(2)
For 2023, primarily reflects integration activities including the write-off of construction in process asset deemed unusable of $0.5 million, consulting and legal fees of $0.3 million, and other costs of $0.1 million. For 2022, primarily reflects professional services fees (including legal, audit, valuation specialists and consulting) of $0.5 million, employee separation and other costs of $0.4 million, all of which are directly related to acquisitions.
(3)
Reflects employee separation costs of $10.4 million and professional services fees and other costs of $0.4 million in connection with the closure of the Ober-Schmitten facility.
(4)
Reflects $0.2 million of interest income on employee retention credits claimed under the CARES Act of 2020 and the subsequent related amendments.
(5)
Tax effect on adjustments calculated based on the incremental effective tax rate of the jurisdiction in which each adjustment originated. For items originating in the U.S., no tax effect is recognized due to the previously established valuation allowance on the net deferred tax assets.
(6)
Tax effect of applying certain provisions of the CARES Act of 2020. The amount in 2023 also includes $2.4 million of deferred tax expense resulting from valuation allowance for Ober-Schmitten facility.
The following table sets forth the reconciliation of net loss to adjusted EBITDA for the periods indicated:
- 39 -
| Adjusted EBITDA | Three months ended June 30, | |||||||||||||
| In thousands | 2023 | 2022 | ||||||||||||
| Net loss | $ | (36,940) | $ | (2,052) | ||||||||||
| Exclude: Loss (income) from discontinued operations, net of tax | 309 | (408) | ||||||||||||
| Add back: Taxes on continuing operations | 6,399 | 3,295 | ||||||||||||
| Depreciation and amortization | 15,970 | 16,452 | ||||||||||||
| Interest expense, net | 16,702 | 7,634 | ||||||||||||
| EBITDA | 2,440 | 24,921 | ||||||||||||
| Adjustments: | ||||||||||||||
| Turnaround strategy costs | 2,713 | — | ||||||||||||
| Strategic initiatives | 889 | 653 | ||||||||||||
| Ober-Schmitten closure costs | 10,793 | — | ||||||||||||
| Corporate headquarters relocation | — | 135 | ||||||||||||
| Share-based compensation | 376 | 1,510 | ||||||||||||
| COVID-19 ERC recovery | 41 | — | ||||||||||||
| Adjusted EBITDA | $ | 17,252 | $ | 27,219 | ||||||||||
EBITDA is a measure used by management to assess our operating performance and is calculated using
income (loss) from continuing operations and excludes interest expense, interest income, income taxes, and
depreciation and amortization. Adjusted EBITDA is calculated using EBITDA and further excludes certain items management considers to be unrelated to the company’s core operations. The adjustments include, among others, Ober-Schmitten closure costs, turnaround strategy costs, strategic initiative costs, corporate headquarters relocation expenses, and share-based compensation expense. Adjusted EBITDA is a performance measure that excludes costs that we do not consider to be indicative of our ongoing operating performance.
- 40 -
Segment Financial Performance
| Three months ended June 30, | |||||||||||
| Dollars in thousands | 2023 | 2022 | |||||||||
| Net Sales | |||||||||||
| Airlaid Material | $ | 152,511 | $ | 143,708 | |||||||
| Composite Fibers | 125,725 | 123,338 | |||||||||
| Spunlace | 79,420 | 96,917 | |||||||||
| Inter-segment sales elimination | (651) | — | |||||||||
| Total | $ | 357,005 | $ | 363,963 | |||||||
| Operating income (loss) | |||||||||||
| Airlaid Material | $ | 9,726 | $ | 11,944 | |||||||
| Composite Fibers | 898 | 5,779 | |||||||||
| Spunlace | (1,314) | (1,808) | |||||||||
| Other and unallocated | (19,795) | (6,991) | |||||||||
| Total | $ | (10,485) | $ | 8,924 | |||||||
| Depreciation and amortization | |||||||||||
| Airlaid Material | $ | 7,637 | $ | 7,542 | |||||||
| Composite Fibers | 3,897 | 4,796 | |||||||||
| Spunlace | 3,476 | 2,945 | |||||||||
| Other and unallocated | 960 | 1,169 | |||||||||
| Total | $ | 15,970 | $ | 16,452 | |||||||
| Capital expenditures | |||||||||||
| Airlaid Material | $ | 2,332 | $ | 2,064 | |||||||
| Composite Fibers | 2,110 | 4,131 | |||||||||
| Spunlace | 2,509 | 1,801 | |||||||||
| Other and unallocated | 1,007 | 2,353 | |||||||||
| Total | $ | 7,958 | $ | 10,349 | |||||||
| Tons shipped (metric) | |||||||||||
| Airlaid Material | 39,246 | 40,681 | |||||||||
| Composite Fibers | 24,966 | 24,246 | |||||||||
| Spunlace | 15,191 | 19,358 | |||||||||
| Total | 79,403 | $ | 84,285 | ||||||||
Segments
Results of individual operating segments are presented based on our management accounting practices and management structure. There is no comprehensive, authoritative body of guidance for management accounting equivalent to accounting principles generally accepted in the United States of America; therefore, the financial results of individual segments are not necessarily comparable with similar information for any other company. The management accounting process uses assumptions and allocations to measure performance of the segments. Methodologies are refined from time to time as management accounting practices are enhanced and businesses change. The costs incurred by support areas not directly aligned with the segment are allocated primarily based on an estimated utilization of support area services or are included in “Other and Unallocated” in the table set forth above.
Management evaluates results of operations of the operating segments before certain corporate level costs and the effects of certain gains or losses not considered to be related to the core business operations. Management believes that this is a more meaningful representation of the operating performance of its core businesses, the profitability of the segments and the extent of cash flow generated from these core operations. Such amounts are presented under the caption “Other and Unallocated.” In the evaluation of operating segments results, management does not use any measures of total assets. This
- 41 -
presentation is aligned with the management and operating structure of our company. It is also on this basis that the Company’s performance is evaluated internally and by the Company’s Board of Directors.
Sales and Costs of Products Sold
| Three months ended June 30, | |||||||||||||||||
| In thousands | 2023 | 2022 | Change | ||||||||||||||
| Net sales | $ | 357,005 | $ | 363,963 | $ | (6,958) | |||||||||||
| Costs of products sold | 338,872 | 326,566 | 12,306 | ||||||||||||||
| Gross profit | $ | 18,133 | $ | 37,397 | $ | (19,264) | |||||||||||
| Gross profit as a percent of Net sales | 5.1 | % | 10.3 | % | |||||||||||||
The following table sets forth the contribution to consolidated net sales by each segment:
| Three months ended June 30, | |||||||||||
| Percent of Total | 2023 | 2022 | |||||||||
| Segment | |||||||||||
| Airlaid Materials | 42.6 | % | 33.9 | % | |||||||
| Composite Fibers | 35.2 | 39.5 | |||||||||
| Spunlace | 22.2 | 26.6 | |||||||||
| Total | 100.0 | % | 100.0 | % | |||||||
Net sales
totaled $357.0 million and $364.0 million in the three months ended June 30, 2023 and 2022, respectively. Net sales for Airlaid Materials and Composite Fibers increased by 8.9% and 2.0%, respectively, on a constant currency basis. The Spunlace segment'’s net sales decreased by 8.6% on a constant currency basis.
Airlaid Materials’
second quarter net sales increased $8.8 million in the year-over-year comparison mainly driven by higher selling prices from cost pass-through arrangements and pricing actions to recover significant inflation in raw materials and energy. Shipments were 3.5% lower mainly due to the feminine hygiene category where feminine hygiene customers were destocking inventory and closely managing inventory levels. Currency translation was favorable by $1.6 million.
Airlaid Materials’ second quarter operating income of $9.7 million was $2.2 million lower when compared to the second quarter of 2022. Shipments were lower primarily in the feminine hygiene category with some offset in wipes and tabletop categories, lowering results by $1.1 million. Selling price increases and energy surcharges of $11.7 million offset the higher raw material and energy cost
s of $11.5 million. In the three months ended June 30, 2023, primary raw material input costs increased $11.0 million, or 16%, and energy costs was in-line with the second quarter of 2022. The increase in primary raw material input costs was approximately in-line with broader market indices and energy prices were less volatile with the government legislation in Europe capping energy prices. We expect prices for both energy and raw materials to steadily decline in 2023. As of June 30, 2023, Airlaid Materials had approximately 74% of its net sales with contracts with pass-through provisions. Operations were unfavorable by $2.1 million primarily due to a fire at our Fort Smith, Arkansas facility in June and wage i
nflation. The impact of currency and related hedging positively impacted earnings by $0.9 million. The primary drivers of the change in Airlaid Materials’ operating income are summarized in the following chart (presented in millions):
- 42 -
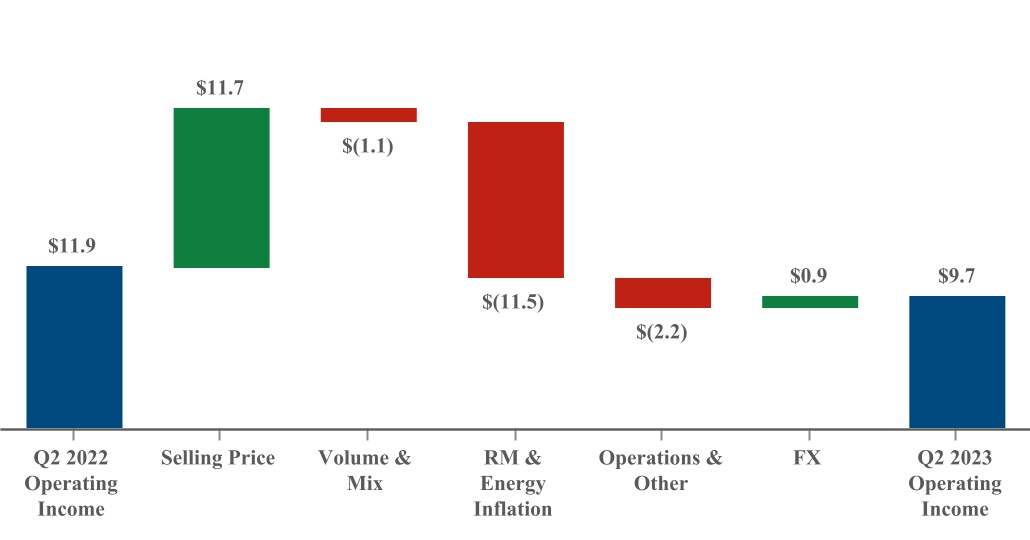
Composite Fibers’
revenue was $2.4 million higher in the second quarter of 2023, compared to the year-ago quarter due to higher selling prices of $5.5 million, partly offset by unfavorable mix. Shipments were up 3.0% on strong wallcover sales which was substantially offset by lower food and beverage, composite laminates and metallized products shipments. Currency translation was favorable by $1.4 million.
Composite Fibers had operating income for the second quarter of $0.9 million compared with operating income of $5.8 million in the second quarter of 2022. Higher selling prices and energy surcharges more than offset the continued inflation in energy and raw materials and was a net favorable benefit to results of $1.7 million.
The strong wallcover shipments were more than offset by lower shipments of higher margin food and beverage and composite laminates categories that negatively impacted income by $1.1 million. In the second quarter of 2023, energy costs increased $1.6 million, or 11%, and primary raw material input costs increased $2.2 million, or 5%, compared to the second quarter of 2022. The increase in primary raw material input costs was approximately in-line with broader market indices, however, and energy prices were less volatile with the government legislation in Europe capping energy prices. We expect prices for both energy and raw materials to steadily decline in 2023. As of June 30, 2023, freight inflation reported as part of raw material, energy and other inflation decreased as global supply chain disruptions experienced in 2022 significantly improved in 2023. As of June 30, 2023, Composite Fibers had approximately 46% of its net sales with contracts with pass-through provisions. During the three months ended June 30, 2023, operations was unfavorable compared to the second quarter of 2022 by $5.0 million mainly driv
en by lower production volume to match customer demand and manage inventory levels. The Ober-Schmitten site negatively impacted year-over-year results by $4.2 million. The impact of currency and related hedging negatively impacted earnings by $0.5 million. The primary drivers of the change in Composite Fibers’ operating income are summarized in the following chart (presented in millions):
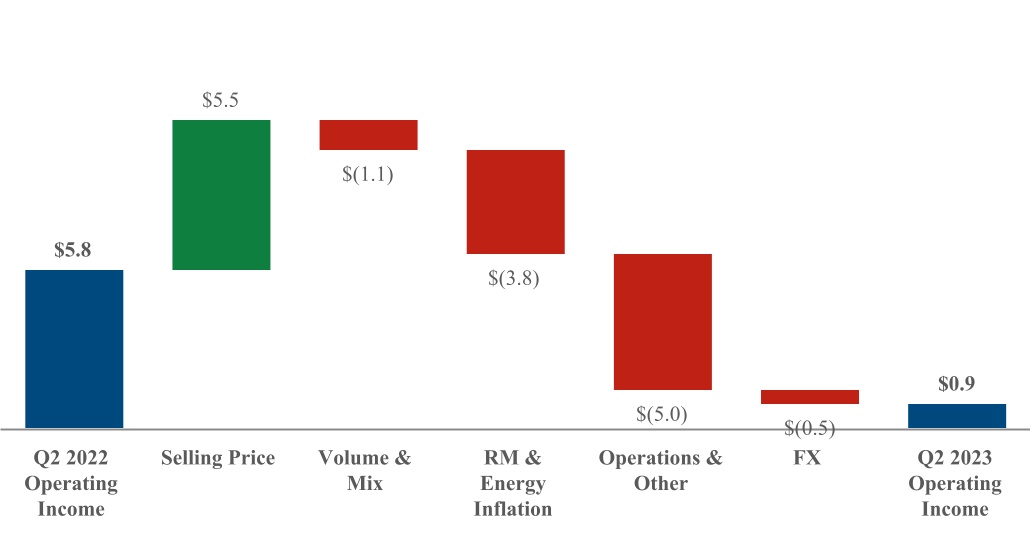
- 43 -
Spunlace’s
revenue was $17.5 million lower in the second quarter of 2023, compared to the year-ago quarter as lower shipments of 21.5% were partially offset by higher selling prices of $2.1 million and favorable currency translation of $0.5 million.
Spunlace had an operating l
oss of $1.3 million in the second quarter of this year compared with an operating loss of $1.8 million in the second quarter of 2022.In the second quarter of 2023, primary raw material input costs were in-line with Q2 2022 and energy costs decreased $0.6 million, or 8%, compared to the second quarter of 2022. The increase in primary raw material input costs was approximately in-line with broader market indices and energy prices were less volatile with the government legislation in Europe capping energy prices. We expect prices for both energy and raw materials to decline in 2023. Volume was unfavorable $1.7 million driven by lower shipments in all categories. As of June 30, 2023, Spunlace had approxima
tely 37% of its net sales with contracts with pass-through provisions. Operations was unfavorable by $0.4 million mainly driven by lower production to manage inventory and a fire at our Asheville, North Carolina facility partially offset by lower costs due to the headcount actions taken in 2022, improved converting and lower spending. The impact of currency positively impacted earnings by $0.1 million. The primary drivers of the change in Spunlace’s operating income are summarized in the following chart (presented in millions):
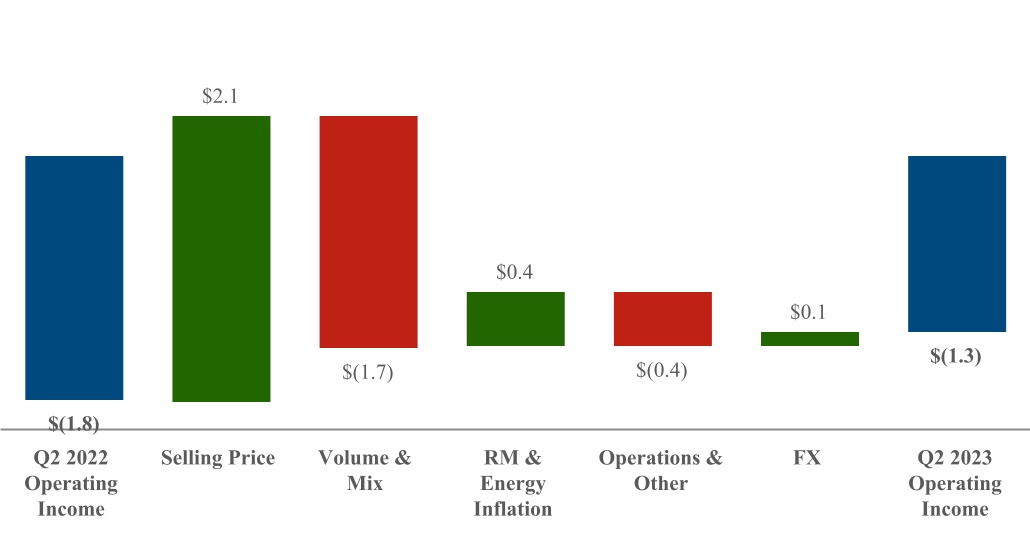
Other and Unallocated
The amount of net operating expenses not allocated to an operating segment, and reported as “Other and Unallocated” in our table of Segment Financial Performance, totaled $19.8 million in the first three months of 2023 compared with $7.0 million in the same period a year ago. Excluding the items identified to present “adjusted earnings,” unallocated expenses for the second quarter of 2023 decreased $0.3 million compared to the same period in 2022.
Income taxes
For the three months ended June 30, 2023, we recorded a $6.4 million income tax provision on a pretax loss of $30.2 million from continuing operations. The comparable amounts for 2022 were $3.3 million income tax provision on pre-tax income of $0.8 million. The income tax provision in both periods reflects valuation allowances recorded for the operating losses in the U.S. and certain foreign jurisdictions for which no income tax benefit was recorded.
Foreign Currency
We own and operate facilities in Canada, Germany, France, the United Kingdom, Spain, and the Philippines. The functional currency of our Canadian operations is the U.S. dollar. However, in Germany, France and Spain, it is the euro, in the UK, it is the British pound sterling, and in the Philippines the functional currency is the peso. On an annual basis, our euro denominated net sales exceeds euro expenses by an estimated €190 million. For the three months ended June 30, 2023, the average currency exchange rate was 1.09 dollar/euro compared with 1.07 in the same period of 2022. With respect to the British pound sterling, Canadian dollar, and Philippine peso, we have differing amounts of inflows and outflows of these currencies, although to a lesser degree than the euro. As a result, we are exposed to changes in currency exchange rates and such changes could be significant. The translation of the results from international operations into U.S. dollars is subject to changes in foreign currency exchange rates.
The table below summarizes the translation impact on reported results that changes in currency exchange rates had on our non-U.S. based operations from the conversion of these operation’s results for the second quarter of 2023.
- 44 -
| In thousands | Three months ended June 30, | ||||
|
Favorable
(unfavorable) |
|||||
| Net sales | $ | 2,874 | |||
| Costs of products sold | (2,237) | ||||
| SG&A expenses | (240) | ||||
| Income taxes and other | (11) | ||||
| Net loss | $ | 386 | |||
The above table only presents the financial reporting impact of foreign currency translations assuming currency exchange rates in 2023 were the same as 2022. It does not present the impact of certain competitive advantages or disadvantages of operating or competing in multi-currency markets.
LIQUIDITY AND CAPITAL RESOURCES
Our business requires significant expenditures for new or enhanced equipment, to support our research and development efforts, and to support our business strategy. In addition, we have mandatory debt service requirements of both principal and interest. The following table summarizes cash flow information for each of the periods presented:
| Six months ended June 30, | |||||||||||
| In thousands | 2023 | 2022 | |||||||||
| Cash, cash equivalents and restricted cash at the beginning of period | $ | 119,162 | $ | 148,814 | |||||||
| Cash provided (used) by | |||||||||||
| Operating activities | (53,021) | (79,535) | |||||||||
| Investing activities | (16,723) | (18,136) | |||||||||
| Financing activities | 10,515 | 33,546 | |||||||||
| Effect of exchange rate changes on cash | 1,096 | (3,587) | |||||||||
| Change in cash and cash equivalents from discontinued operations | (428) | (231) | |||||||||
| Net cash used | (58,561) | (67,943) | |||||||||
| Cash, cash equivalents and restricted cash at the end of period | 60,601 | 80,871 | |||||||||
| Less: restricted cash in Prepaid and other current assets | (3,600) | (2,000) | |||||||||
| Less: restricted cash in Other assets | (3,137) | (7,395) | |||||||||
| Cash and cash equivalents at the end of period | $ | 53,864 | $ | 71,476 | |||||||
At June 30, 2023, we had $53.9 million in cash and cash equivalents (“cash”) held by both domestic and foreign subsidiaries. Approximately 97.2% of our cash and cash equivalents is held by our foreign subsidiaries but could be repatriated without incurring a significant amount of additional taxes.
Cash used by operating activities in the first six months of 2023 totaled $53.0 million compared with $79.5 million in the same period a year ago. Th
e decrease in cash used was primarily due to a decrease in working capital usage of approximately $33.0 million, primarily due to: i) accounts receivable, which was driven by higher accounts receivables in the first six months of 2022 due in part to the termination of the Spunlace factoring program in the U.S., ii) inventory, which was driven by higher inventory values in 2022 due to raw material and energy inflation, partially offset by iii) accounts payable which declined in 2023 due to inflationary impacts in 2022. Operating cash also improved $10.6 million from a decrease in income
taxes paid due to higher Canadian income taxes and withholding tax in the first six months of 2022 and a U.K. income tax refund in Q1 2023. Interest paid increased $
11.1
million due to higher interest rates on our debt stemming from the debt refinancing in the first quarter of 2023.
Net cash used by investing activities was $16.7 million compared with $18.1 million in the same period a year ago. Capital expenditures totaled $17.5 million and $22.7 million for the six months ended June 30, 2023 and 2022, respectively. Capital expenditures are expected to total between $30 million and $35 million in 2023.
- 45 -
Net cash provided by financing activities totaled $10.5 million in the first six months of 2023 compared with $33.5 million in the same period of 2022. The change in financing activities primarily reflects the new €250.0 million Term Loan we entered into in which the proceeds were used to fully extinguish the €220.0 million Term Loan, the IKB term loans and reduced the revolving credit facility balance. In 2022, we used borrowings under the revolving credit facility for working capital and other operating expenditures.
As discussed in Item 1 - Financial Information, Note - 15, our Credit Agreement contains a number of customary compliance covenants. As of June 30, 2023, the leverage ratio, as calculated in accordance with the definition in our Credit Agreement, was 3.4x, well within the maximum limit allowed under our Credit Agreement. A breach of these requirements would give rise to certain remedies under the Revolving Credit Facility, among which are the termination of the agreement and accelerated repayment of the outstanding borrowings plus accrued and unpaid interest under the Credit Agreement and the Term loan. As discussed in Note 16 -
“Long Term Debt,”
on March 30, 2023, we amended our Credit Agreement to permit the maximum leverage ratio (calculated as consolidated senior secured debt to consolidated adjusted EBITDA) to be 4.25 to 1.0 through the quarter ended December 31, 2024, stepping down to 4.0 to 1.0 at March 31, 2025, and 3.50 to 1.0 at March 31, 2026.
Details of our outstanding long-term indebtedness are set forth under Item 1 - Financial Statements – Note 16 -“
Long-Term Debt
.
"
Financing activities include cash used for common stock dividends. Our Board of Directors determines what, if any, dividends will be paid to our shareholders. In the third quarter of 2022, our Board of Directors suspended the Company’s quarterly cash dividend to focus efforts on optimizing the operational and financial results of the business. As such, we paid no cash dividends in the first six months of 2023. In the first six months of 2022, we paid $12.5 million of cash for dividends on our common stock.
We are subject to various federal, state and local laws and regulations intended to protect the environment, as well as human health and safety. At various times, we have incurred significant costs to comply with these regulations and we could incur additional costs as new regulations are developed or regulatory priorities change.
At June 30, 2023, we had ample liquidity consisting of $53.9 million of cash on hand and $89.6 million of capacity under our revolving credit facility. We expect to meet all of our near and long-term cash needs from a combination of operating cash flow, cash and cash equivalents, our existing credit facility and other long-term debt.
On April 13, 2023, our credit rating from Moody’s Investor Service was upgraded to B3, in part due to our successful refinancing of our €220.0 million Term Loan with the €250.0 million AG Loan as discussed in Note 16 -
“Long Term Debt,”.
In October 2022, our credit rating was downgraded by S&P Global Ratings to CCC+ based on its latest assessment of our business, and no further action has been taken to date. Although the Moody’s Investor Service ratings upgrade action is positive, it does not impact our current interest costs, or reduce the possibility of default on any of our debt.
Off-Balance-Sheet Arrangements
As of June 30, 2023 and December 31, 2022, we had not entered into any off-balance-sheet arrangements. Financial derivative instruments, to which we are a party, and guarantees of indebtedness, which solely consist of obligations of subsidiaries, are reflected in the condensed consolidated balance sheets included herein in Item 1 – Financial Statements.
- 46 -
ITEM 3. QUANTITATIVE AND QUALITATIVE DISCLOSURES ABOUT MARKET RISKS
| Year Ended December 31 | June 30, 2023 | ||||||||||||||||||||||||||||||||||||||||
| In thousands, except percentages | 2023 | 2024 | 2025 | 2026 | 2027 | Carrying Value | Fair Value | ||||||||||||||||||||||||||||||||||
| Long-term debt | |||||||||||||||||||||||||||||||||||||||||
| Average principal outstanding | |||||||||||||||||||||||||||||||||||||||||
| At variable interest rates | $ | 299,764 | $ | 105,534 | $ | 105,534 | $ | 71,127 | $ | — | $ | 105,534 | $ | 105,534 | |||||||||||||||||||||||||||
| At fixed interest rates | 785,477 | 767,204 | 766,217 | 766,217 | 766,217 | 769,337 | 600,302 | ||||||||||||||||||||||||||||||||||
| $ | 874,871 | $ | 705,836 | ||||||||||||||||||||||||||||||||||||||
| Weighted-average interest rate | |||||||||||||||||||||||||||||||||||||||||
| On variable rate debt | 3.56 | % | 8.01 | % | 8.01 | % | 5.40 | % | — | % | |||||||||||||||||||||||||||||||
| On fixed rate debt | 5.91 | % | 7.00 | % | 7.01 | % | 7.01 | % | 7.01 | % | |||||||||||||||||||||||||||||||
Our market risk exposure primarily results from changes in interest rates and currency exchange rates. The table above presents the average principal outstanding and related interest rates for the next five years for debt outstanding as of June 30, 2023. Fair values included herein have been determined based upon rates currently available to us for debt with similar terms and remaining maturities.
At June 30, 2023, we had $874.9 million of long-term debt, of which $105.5 million was at variable interest rates. Variable-rate debt represents borrowings under our credit agreement. Borrowing rates under our credit agreement are determined at our option at the time of each borrowing. For all U.S. Dollar denominated borrowings, the borrowing rate is either, (a) the bank’s base rate which is equal to the greater of i) the prime rate; ii) the overnight bank funding rate plus 50 basis points; or iii) the daily Simple Secured Overnight Financing Rate (“SOFR”) rate plus 100 basis points plus an applicable spread over either i), ii) or iii) ranging from 250 basis points to 400 basis points based on the Company’s leverage ratio; or (b) the daily Term SOFR-rate plus an applicable margin ranging from 350 basis points to 500 basis points based on the Company’s leverage ratio. For non-U.S. Dollar denominated borrowings, interest is based on the Euro-rate or EURIBOR-rate plus an applicable margin ranging from 350 basis points to 500 basis points based on the Company’s leverage ratio.
At June 30, 2023, the weighted-average interest rate paid was equal to 8.01%. A hypothetical 100 basis point increase in the interest rate on variable rate debt would increase annual interest expense by $1.1 million. In the event rates are 100 basis points lower, interest expense would be $1.1 million lower.
We are subject to certain risks associated with changes in foreign currency exchange rates to the extent our operations are conducted in currencies other than the U.S. dollar. On an annual basis, our euro denominated revenue exceeds euro expenses by an estimated €190 million. With respect to the British pound sterling, Canadian dollar, and Philippine peso, we have differing amounts of inflows and outflows of these currencies, although to a lesser degree than the euro. As a result, particularly with respect to the euro, we are exposed to changes in currency exchange rates and such changes could be significant.
As part of our overall risk management practices, we enter into financial derivatives primarily designed to either i) hedge foreign currency risks associated with forecasted transactions – “cash flow hedges”; or ii) mitigate the impact that changes in currency exchange rates have on intercompany financing transactions and foreign currency denominated receivables and payables – “foreign currency hedges.” For a more complete discussion of this activity, refer to Item 1 – Financial Statements – Note 18.
Critical Accounting Estimates
The preceding discussion and analysis of our consolidated financial position and results of operations is based upon our consolidated financial statements, which have been prepared in accordance with accounting principles generally accepted in the United States of America. The preparation of these consolidated financial statements requires us to make estimates and assumptions that affect the reported amounts of assets, liabilities, net sales and expenses, and related disclosures of contingent assets and liabilities. On an ongoing basis, we evaluate our estimates, including those related to long-lived assets, environmental liabilities, and income taxes. We base our estimates on historical experience and on various other assumptions that we believe are reasonable under the circumstances, the results of which form the basis for making judgments about the carrying values of assets and liabilities that are not readily apparent from other sources. Actual results may differ from these estimates. We believe that our policies for long- and indefinite-lived assets, environmental
- 47 -
liabilities and income taxes represent the most significant and subjective estimates used in the preparation of our consolidated financial statements and are therefore considered our critical accounting policies and estimates.
During the six months ended June 30, 2023, there were no changes in our critical accounting policies or estimates. See Note 2 — Accounting Policies, of the Condensed Consolidated Financial Statements included elsewhere in this Report on Form 10-Q and in our Annual Report on Form 10-K for the year ended December 31, 2022, as filed with the SEC, for additional information regarding our critical accounting policies.
Long- and indefinite-lived Assets
We evaluate the recoverability of our long- and indefinite-lived assets, including plant, equipment, timberlands, goodwill, and other intangible assets periodically or whenever events or changes in circumstances indicate that the carrying amounts may not be recoverable. Goodwill is reviewed for impairment annually during the fourth quarter, or more frequently if impairment indicators are present.
The fair value of our reporting units, which are also our operating segments, is determined using a market approach and a discounted cash flow model. Our evaluations include a variety of qualitative factors and analyses based on estimates of future cash flows expected to be generated from the use of the underlying assets, trends or other determinants of fair value. If the value of an asset determined by these evaluations is less than its carrying amount, a loss is recognized for the difference between the fair value and the carrying value of the asset. In 2022, all the goodwill of our Composite Fibers and Spunlace operating segments was fully impaired. Our Airlaid Materials segment’s fair value substantially exceeded its carrying value at the time of its last valuation performed in connection with the last annual impairment test in the fourth quarter of 2022. Airlaid Material’s fair value, as well as the asset groups within each of our operating segment, could be impacted by factors such as unexpected changes in inflation, significant disruptions in the delivery of energy to our sites, particularly in Europe, among other factors. Future adverse changes such as these or in market conditions or poor operating results of the related business may indicate an inability to recover the carrying value of the assets, thereby possibly requiring an impairment charge in the future.
ITEM 4. CONTROLS AND PROCEDURES
Evaluation of Disclosure Controls and Procedures
Our Chief Executive Officer and our principal financial officer, after evaluating the effectiveness of our disclosure controls and procedures (as defined in Exchange Act Rules 13a-15(e) and 15d-15(e)) as of June 30, 2023, have concluded that, as of the evaluation date, our disclosure controls and procedures are effective.
Changes in Internal Controls
During the three months ended June 30, 2023, we completed the implementation of new enterprise resource planning and manufacturing systems for Spunlace’s Old Hickory, Tennessee, U.S.A and Asturias, Spain locations. There were no other changes in our internal control over financial reporting during the three months ended June 30, 2023 that have materially affected or are reasonably likely to materially affect our internal control over financial reporting.
- 48 -
PART II – OTHER INFORMATION
ITEM 1. LEGAL PROCEEDINGS
See the discussion of legal proceedings contained in Note 19 -
“Commitments, Contingencies and Legal Proceedings”
to our unaudited consolidated financial statements in Part I, Item 1 of this report, which is incorporated herein by reference.
ITEM 5. OTHER INFORMATION
During the three months ended June 30, 2023, none of the Company’s directors or “officers,” as defined in Rule 16a-1(f) of the Exchange Act,
adopted
, modified, or
terminated
a “Rule 10b5-1 trading arrangement” or a “non-Rule 10b5-1 trading arrangement,” as each term is defined in Item 408 of Regulation S-K.
ITEM 6. EXHIBITS
The following exhibits are filed or furnished herewith or incorporated by reference as indicated.
|
Incorporated by reference to
|
||||||||
| 10.1 | Appendix A to the Proxy Statement filed March 31, 2023 | |||||||
| 10.2 | ||||||||
| 10.3 | ||||||||
| 10.4 | ||||||||
| 31.1 | ||||||||
| 31.2 | ||||||||
| 32.1 | ||||||||
| 32.2 | ||||||||
| 101.INS | Inline XBRL Instance Document – the instance document does not appear in the Interactive Data file because its iXBRL tags are embedded within the Inline XBRL document. | |||||||
| 101.SCH | Inline XBRL Taxonomy Extension Schema. | |||||||
| 101.CAL | Inline XBRL Extension Calculation Linkbase. | |||||||
| 101.DEF | Inline XBRL Extension Definition Linkbase. | |||||||
| 101.LAB | Inline XBRL Extension Label Linkbase. | |||||||
| 101.PRE | Inline XBRL Extension Presentation Linkbase. | |||||||
| 104 | Cover Page Interactive Data File (formatted as an inline XBRL and contained in Exhibit 101). | |||||||
**Management contract or compensatory plan
- 49 -
SIGNATURES
Pursuant to the requirements of Section 13 or 15(d) of the Securities Exchange Act of 1934, the Registrant has duly caused this report to be signed on its behalf by the undersigned, thereunto duly authorized.
|
Glatfelter Corporation
(Registrant)
|
|||||||||||
| August 3, 2023 | |||||||||||
| By | /s/ David C. Elder | ||||||||||
| David C. Elder | |||||||||||
|
Vice President, Finance and Chief Accounting Officer
|
|||||||||||
| (Principal accounting officer) | |||||||||||
- 50 -
TABLE OF CONTENTS
Part IItem 1 Financial StatementsItem 2. Management's Discussion and Analysis Of Financial Condition and Results Of OperationsItem 3. Quantitative and Qualitative Disclosures About Market RisksItem 4. Controls and ProceduresPart II Other InformationItem 1. Legal ProceedingsItem 5. Other InformationItem 6. Exhibits