MARRIOTT INTERNATIONAL INC /MD/
10-Ks and 10-Qs
|
|
|
|
|
|
|
|
|
|
|
|
|
|
|
|
|
|
|
|
|
|
|
|
|
|
|
|
|
|
|
|
|
|
|
|
|
|
|
|
|
|
|
|
|
|
|
|
|
|
|
|
|
|
|
|
UNITED STATES
SECURITIES AND EXCHANGE COMMISSION
Washington, D.C. 20549
FORM 10-K
|
ý
|
ANNUAL REPORT PURSUANT TO SECTION 13 OR 15(d) OF THE SECURITIES EXCHANGE ACT OF 1934
|
For the Fiscal Year Ended
December 31, 2015
or
|
o
|
TRANSITION REPORT PURSUANT TO SECTION 13 OR 15(d) OF THE SECURITIES EXCHANGE ACT OF 1934
|
For the transition period from to
Commission File No. 1-13881
MARRIOTT INTERNATIONAL, INC.
(Exact name of registrant as specified in its charter)
|
Delaware
|
52-2055918
|
|
(State or other jurisdiction of
incorporation or organization)
|
(IRS Employer
Identification No.)
|
|
10400 Fernwood Road, Bethesda, Maryland
|
20817
|
|
(Address of Principal Executive Offices)
|
(Zip Code)
|
Registrant’s Telephone Number, Including Area Code (301) 380-3000
Securities registered pursuant to Section 12(b) of the Act:
|
Title of Each Class
|
|
Name of Each Exchange on Which Registered
|
|
Class A Common Stock, $0.01 par value
(253,481,935 shares outstanding as of February 5, 2016)
|
|
Nasdaq Global Select Market
Chicago Stock Exchange
|
Securities registered pursuant to Section 12(g) of the Act: NONE
Indicate by check mark if the registrant is a well-known seasoned issuer, as defined in rule 405 of the Securities Act. Yes
ý
No
o
Indicate by check mark if the registrant is not required to file reports pursuant to Section 13 or Section 15(d) of the Act. Yes
o
No
ý
Indicate by check mark whether the registrant: (1) has filed all reports required to be filed by Section 13 or 15(d) of the Securities Exchange Act of 1934 during the preceding 12 months (or for such shorter period that the registrant was required to file such reports), and (2) has been subject to such filing requirements for the past 90 days. Yes
ý
No
o
Indicate by check mark whether the registrant has submitted electronically and posted on its corporate Web site, if any, every Interactive Data File required to be submitted and posted pursuant to Rule 405 of Regulation S-T during the preceding 12 months (or for such shorter period that the registrant was required to submit and post such files). Yes
ý
No
o
Indicate by check mark if disclosure of delinquent filers pursuant to Item 405 of Regulation S-K is not contained herein, and will not be contained, to the best of the registrant’s knowledge, in definitive proxy or information statements incorporated by reference in Part III of this Form 10-K or any amendment to this Form 10-K.
o
Indicate by check mark whether the registrant is a large accelerated filer, an accelerated filer, a non-accelerated filer, or a small reporting company. See definitions of “large accelerated filer,” “accelerated filer” and “smaller reporting company” in Rule 12b-2 of the Exchange Act.
|
Large accelerated filer
x
|
|
Accelerated filer
o
|
|
Non-accelerated filer
o
|
|
Smaller reporting company
o
|
|
|
(Do not check if a smaller reporting company)
|
|||||
Indicate by check mark whether the registrant is a shell company (as defined in Rule 12b-2 of the Exchange Act). Yes
¨
No
ý
The aggregate market value of shares of common stock held by non-affiliates at
June 30, 2015
, was
$14,801,193,156
DOCUMENTS INCORPORATED BY REFERENCE
Portions of the Proxy Statement prepared for the
2016
Annual Meeting of Shareholders are incorporated by reference into
Part III of this report.
MARRIOTT INTERNATIONAL, INC.
FORM 10-K TABLE OF CONTENTS
FISCAL YEAR ENDED
DECEMBER 31, 2015
|
|
|
Page No.
|
1
Throughout this report, we refer to Marriott International, Inc.,
together with its consolidated subsidiaries, as “we,” “us,” or “the Company
.”
Beginning in 2013, we changed our financial reporting cycle to a calendar year-end reporting cycle and an end-of-month quarterly reporting cycle.
Historically, our fiscal year was a 52-53 week fiscal year that ended on the Friday nearest to December 31.
Unless otherwise specified, each reference to a particular year means the fiscal year ended on the date and containing the specified number of days that we show in the table under the caption “Fiscal Year” in Footnote No.
1
, “
Basis of Presentation
,” to the Notes to our Consolidated Financial Statements.
In order to make this report easier to read, we also refer throughout to (i) our Consolidated Financial Statements as our “Financial Statements,” (ii) our Consolidated Statements of Income as our “Income Statements,” (iii) our Consolidated Balance Sheets as our “Balance Sheets,” (iv) our properties, brands, or markets in the United States (“U.S.”) and Canada as “North America” or “North American,” and (v) our properties, brands, or markets outside of the United States and Canada as “International.”
References throughout to numbered “Footnotes” refer to the numbered Notes to our Financial Statements that we include in the Financial Statements section of this report.
Corporate Structure and Business
We are a worldwide operator, franchisor, and licensor of hotels and timeshare properties under numerous brand names at different price and service points. Consistent with our focus on management, franchising, and licensing, we own very few of our lodging properties. We also operate, market, and develop residential properties and provide services to home/condominium owner associations.
We were organized as a corporation in Delaware in 1997 and became a public company in 1998 when we were “spun off” as a separate entity by the company formerly named “Marriott International, Inc.” We operate, franchise, or license
4,424
properties worldwide, with
759,330
rooms as of year-end
2015
. We believe that our portfolio of brands is the broadest of any lodging company in the world. Our principal brands are listed in the following table:
|
• The Ritz-Carlton
®
|
• Gaylord Hotels
®
|
|
• Bulgari
®
Hotels & Resorts
|
• AC Hotels by Marriott
®
|
|
• EDITION
®
|
• Courtyard by Marriott
®
(“Courtyard
®
”)
|
|
• JW Marriott
®
|
• Residence Inn by Marriott
®
(“Residence Inn
®
”)
|
|
• Autograph Collection
®
Hotels
|
• SpringHill Suites by Marriott
®
(“SpringHill Suites
®
”)
|
|
• Renaissance
®
Hotels
|
• Fairfield Inn & Suites by Marriott
®
(“Fairfield Inn & Suites
®
”)
|
|
• Marriott Hotels
®
|
• TownePlace Suites by Marriott
®
(“TownePlace Suites
®
”)
|
|
• Delta Hotels and Resorts
®
|
• Protea Hotels
®
|
|
• Marriott Executive Apartments
®
|
• Moxy Hotels
®
|
|
• Marriott Vacation Club
®
|
|
As of year-end
2015
, we group operations into
three
business segments: North American Full-Service, North American Limited-Service, and International, and provide financial information by segment for
2015
,
2014
, and
2013
in Footnote No.
16
, “
Business Segments
” and Footnote No.
12
, “
Property and Equipment
.”
Pending Combination with Starwood Hotels & Resorts Worldwide, Inc.
On November 15, 2015, we entered into an Agreement and Plan of Merger (the “Merger Agreement”) to combine with Starwood Hotels & Resorts Worldwide, Inc. (“Starwood”). The Merger Agreement provides for the Company to combine with Starwood in a series of transactions after which Starwood will be an indirect wholly owned subsidiary of the Company (the “Starwood Combination”). If these transactions are completed, shareholders of Starwood will receive 0.920 shares of our Class A Common Stock, par value $0.01 per share, and $2.00 in cash, without interest, for each share of Starwood common stock, par value $0.01 per share, that they own immediately before these transactions. We expect that the combination will close in mid-2016, after customary conditions are satisfied, including shareholder approvals, required antitrust approvals, and the
2
completion of Starwood’s previously announced spin-off of its vacation ownership business, or another spin-off, split-off, analogous disposition, or sale of its vacation ownership business.
Company-Operated Properties
At year-end
2015
, we operated
1,116
properties (
300,305
rooms) under long-term management agreements with property owners,
41
properties (
9,206
rooms) under long-term lease agreements with property owners (management and lease agreements together, “the Operating Agreements”), and
six
properties (
1,437
rooms) that we own. In addition, we operated under long-term management agreements
41
home and condominium products (
4,203
units) for which we manage the related owners’ associations.
Terms of our management agreements vary, but we earn a management fee that is typically composed of a base management fee, which is a percentage of the revenues of the hotel, and an incentive management fee, which is based on the profits of the hotel. Our management agreements also typically include reimbursement of costs of operations (both direct and indirect). Such agreements are generally for initial periods of 20 to 30 years, with options for us to renew for up to 50 or more additional years. Our lease agreements also vary, but may include fixed annual rentals plus additional rentals based on a percentage of annual revenues in excess of a fixed amount. Many of our Operating Agreements are subordinated to mortgages or other liens securing indebtedness of the owners. Many of our Operating Agreements also permit the owners to terminate the agreement if we do not meet certain performance metrics and financial returns fail to meet defined levels for a period of time and we have not cured such deficiencies. In certain circumstances, some of our management agreements allow owners to convert company-operated properties to franchised properties under our brands.
For lodging facilities that we operate, we generally are responsible for hiring, training, and supervising the managers and employees who are needed to operate the facilities and for purchasing supplies, and owners are required to reimburse us for those costs. We provide centralized reservation services and national advertising, marketing, and promotional services, as well as various accounting and data processing services, and owners are also required to reimburse us for those costs.
Franchised, Licensed, and Unconsolidated Joint Venture Properties
We have franchising, licensing, and joint venture programs that permit other hotel owners and operators and Marriott Vacations Worldwide Corporation (“MVW”), our former timeshare subsidiary that we spun off in 2011, to use many of our lodging brand names and systems. Under our franchising program, we generally receive an initial application fee and continuing royalty fees, which typically range from four to six percent of room revenues for all brands, plus two to three percent of food and beverage revenues for certain full-service hotels. We are a partner in unconsolidated joint ventures that manage hotels. Some of these joint ventures also provide services to franchised hotels. We recognize our share of these joint ventures’ net income or loss in the “Equity in earnings (losses)” caption of our Income Statements. Franchisees and joint ventures contribute to our national marketing and advertising programs and pay fees for use of our centralized reservation systems. Under license agreements with us, MVW is both the exclusive developer and operator of timeshare, fractional, and related products under the Marriott brand and the exclusive developer of fractional and related products under The Ritz-Carlton brand. We receive license fees under licensing agreements with MVW consisting of a fixed annual fee, adjusted for inflation, of
$50 million
plus
two
percent of the gross sales price paid to MVW for initial developer sales of interests in vacation ownership units and residential real estate units and
one
percent of the gross sales price paid to MVW for resales of interests in vacation ownership units and residential real estate units, in each case that are identified with or use the Marriott or The Ritz-Carlton marks.
At year-end
2015
, we had
3,074
franchised properties (
420,562
rooms),
88
unconsolidated joint venture properties (
10,810
rooms), and
58
licensed timeshare, fractional, and related properties (
12,807
units).
Residential
We use or license our trademarks for the sale of residential real estate, typically in conjunction with hotel development and receive branding fees for sales of such branded residential real estate by others. Residences are typically constructed and sold by third-party owners with limited amounts, if any, of our capital at risk. We have used or licensed our The Ritz-Carlton, Bulgari Hotels & Resorts, EDITION, Autograph Collection Hotels, JW Marriott, and Marriott Hotels brand names and trademarks for residential real estate sales. While the worldwide residential market is very large, we believe the luxurious nature of our residential properties, the quality and exclusivity associated with our brands, and the hospitality services that we provide, all serve to make our residential properties distinctive.
3
Seasonality
In general, business at company-operated and franchised properties fluctuates only moderately with the seasons and is relatively stable. Business at some resort properties may be seasonal depending on location.
Relationship with Major Customer
We operate a number of properties under long-term management agreements that are owned or leased by Host Hotels & Resorts, Inc. (“Host”). In addition, Host is a partner in several partnerships that own properties operated by us under long-term management agreements. See Footnote No.
18
, “
Relationship with Major Customer
,” for more information.
Intellectual Property
We operate in a highly competitive industry and our brand names, trademarks, service marks, trade names, and logos are very important to the sales and marketing of our properties and services. We believe that our brand names and other intellectual property have come to represent the highest standards of quality, caring, service, and value to our customers and the traveling public. Accordingly, we register and protect our intellectual property where we deem appropriate and otherwise protect against its unauthorized use.
4
Our Brand Portfolio
At year-end
2015
, we operated, franchised, or licensed properties in the following geographical regions:
|
North America
|
Europe
|
Middle East & Africa
|
Asia Pacific
|
Caribbean & Latin America
|
Total
|
|||||||||
|
U.S.
|
Canada
|
|||||||||||||
|
Properties
|
39
|
1
|
12
|
10
|
27
|
7
|
96
|
||||||
|
Rooms
|
11,572
|
267
|
2,929
|
3,166
|
7,231
|
1,966
|
27,131
|
|||||||
|
Countries and Territories
|
1
|
1
|
10
|
6
|
8
|
6
|
32
|
|||||||

|
Properties
|
—
|
—
|
2
|
—
|
1
|
—
|
3
|
||||||
|
Rooms
|
—
|
—
|
143
|
—
|
59
|
—
|
202
|
|||||||
|
Countries and Territories
|
—
|
—
|
2
|
—
|
1
|
—
|
3
|
|||||||

|
Properties
|
2
|
—
|
2
|
—
|
—
|
—
|
4
|
||||||
|
Rooms
|
568
|
—
|
251
|
—
|
—
|
—
|
819
|
|||||||
|
Countries and Territories
|
1
|
—
|
2
|
—
|
—
|
—
|
3
|
|||||||

|
Properties
|
24
|
1
|
6
|
4
|
29
|
13
|
77
|
||||||
|
Rooms
|
13,938
|
221
|
2,065
|
2,708
|
11,764
|
3,346
|
34,042
|
|||||||
|
Countries and Territories
|
1
|
1
|
6
|
3
|
7
|
9
|
27
|
|||||||

|
Properties
|
53
|
2
|
30
|
1
|
3
|
6
|
95
|
||||||
|
Rooms
|
12,675
|
460
|
4,344
|
446
|
785
|
4,098
|
22,808
|
|||||||
|
Countries and Territories
|
1
|
1
|
13
|
1
|
3
|
6
|
25
|
|||||||
|
Properties
|
80
|
2
|
36
|
3
|
31
|
8
|
160
|
||||||
|
Rooms
|
26,798
|
561
|
8,632
|
921
|
12,116
|
2,565
|
51,593
|
|||||||
|
Countries and Territories
|
1
|
1
|
16
|
2
|
7
|
8
|
35
|
|||||||

|
Properties
|
327
|
15
|
94
|
18
|
45
|
27
|
526
|
||||||
|
Rooms
|
129,070
|
5,355
|
23,071
|
6,206
|
15,804
|
7,771
|
187,277
|
|||||||
|
Countries and Territories
|
1
|
1
|
19
|
8
|
9
|
16
|
54
|
|||||||

|
Properties
|
—
|
36
|
—
|
—
|
—
|
—
|
36
|
||||||
|
Rooms
|
—
|
9,385
|
—
|
—
|
—
|
—
|
9,385
|
|||||||
|
Countries and Territories
|
—
|
1
|
—
|
—
|
—
|
—
|
1
|
|||||||
|
Properties
|
—
|
—
|
5
|
6
|
15
|
2
|
28
|
||||||
|
Rooms
|
—
|
—
|
408
|
759
|
2,774
|
240
|
4,181
|
|||||||
|
Countries and Territories
|
—
|
—
|
5
|
4
|
5
|
2
|
16
|
|||||||

|
Properties
|
5
|
—
|
—
|
—
|
—
|
—
|
5
|
||||||
|
Rooms
|
8,098
|
—
|
—
|
—
|
—
|
—
|
8,098
|
|||||||
|
Countries and Territories
|
1
|
—
|
—
|
—
|
—
|
—
|
1
|
|||||||
|
Properties
|
5
|
—
|
78
|
—
|
—
|
—
|
83
|
||||||
|
Rooms
|
911
|
—
|
9,551
|
—
|
—
|
—
|
10,462
|
|||||||
|
Countries and Territories
|
1
|
—
|
6
|
—
|
—
|
—
|
7
|
|||||||

|
Properties
|
891
|
25
|
49
|
5
|
37
|
30
|
1,037
|
||||||
|
Rooms
|
124,630
|
4,411
|
9,220
|
1,041
|
9,243
|
4,872
|
153,417
|
|||||||
|
Countries and Territories
|
1
|
1
|
18
|
3
|
8
|
15
|
46
|
|||||||

|
Properties
|
669
|
21
|
3
|
3
|
—
|
1
|
697
|
||||||
|
Rooms
|
81,387
|
3,025
|
307
|
301
|
—
|
109
|
85,129
|
|||||||
|
Countries and Territories
|
1
|
1
|
3
|
3
|
—
|
1
|
9
|
|||||||

|
Properties
|
334
|
2
|
—
|
—
|
—
|
—
|
336
|
||||||
|
Rooms
|
39,451
|
299
|
—
|
—
|
—
|
—
|
39,750
|
|||||||
|
Countries and Territories
|
1
|
1
|
—
|
—
|
—
|
—
|
2
|
|||||||
5
|
North America
|
Europe
|
Middle East & Africa
|
Asia Pacific
|
Caribbean & Latin America
|
Total
|
|||||||||
|
U.S.
|
Canada
|
|||||||||||||
|
Properties
|
743
|
18
|
—
|
—
|
2
|
5
|
768
|
||||||
|
Rooms
|
67,946
|
2,024
|
—
|
—
|
314
|
788
|
71,072
|
|||||||
|
Countries and Territories
|
1
|
1
|
—
|
—
|
1
|
1
|
4
|
|||||||
|
Properties
|
263
|
7
|
—
|
—
|
—
|
—
|
270
|
||||||
|
Rooms
|
26,272
|
856
|
—
|
—
|
—
|
—
|
27,128
|
|||||||
|
Countries and Territories
|
1
|
1
|
—
|
—
|
—
|
—
|
2
|
|||||||

|
Properties
|
—
|
—
|
—
|
102
|
—
|
—
|
102
|
||||||
|
Rooms
|
—
|
—
|
—
|
9,609
|
—
|
—
|
9,609
|
|||||||
|
Countries and Territories
|
—
|
—
|
—
|
8
|
—
|
—
|
8
|
|||||||

|
Properties
|
—
|
—
|
1
|
—
|
—
|
—
|
1
|
||||||
|
Rooms
|
—
|
—
|
162
|
—
|
—
|
—
|
162
|
|||||||
|
Countries and Territories
|
—
|
—
|
1
|
—
|
—
|
—
|
1
|
|||||||
|
Residences
(1)
|
Properties
|
31
|
2
|
2
|
—
|
2
|
5
|
42
|
||||||
|
Rooms
|
3,623
|
214
|
106
|
—
|
63
|
252
|
4,258
|
|||||||
|
Countries and Territories
|
1
|
1
|
2
|
—
|
2
|
2
|
8
|
|||||||
|
Timeshare
(2)
|
Properties
|
45
|
—
|
5
|
—
|
3
|
5
|
58
|
||||||
|
Rooms
|
10,540
|
—
|
919
|
—
|
332
|
1,016
|
12,807
|
|||||||
|
Countries and Territories
|
1
|
—
|
3
|
—
|
1
|
3
|
8
|
|||||||
|
Total Properties
|
3,511
|
132
|
325
|
152
|
195
|
109
|
4,424
|
|||||||
|
Total Rooms
|
557,479
|
27,078
|
62,108
|
25,157
|
60,485
|
27,023
|
759,330
|
|||||||
|
(1)
|
Figures include home and condominium products for which we manage the related owners’ association.
|
|
(2)
|
Timeshare properties are licensed by MVW under the Marriott Vacation Club, The Ritz-Carlton Destination Club, The Ritz-Carlton Residences, and Grand Residences by Marriott brand names.
|
The Ritz-Carlton
is a luxury hospitality brand where the genuine care and comfort of guests is the highest mission. Ritz-Carlton properties provide the finest personal service and facilities for its guests so that they will enjoy a warm, relaxed, yet refined ambience. The Ritz-Carlton experience enlivens the senses, instills well-being, and fulfills even the unexpressed wishes and needs of its guests. Established in 1983 with the purchase of The Ritz-Carlton, Boston and the rights to the name, the brand has grown worldwide with award-winning luxury hotels, residences, golf communities, elegant spas, innovative retail outlets, and acclaimed restaurants.
Bulgari Hotels & Resorts
,
developed in partnership with jeweler and luxury goods designer Bulgari Spa, is a collection of sophisticated, intimate luxury properties located in exclusive destinations. With properties in London, Milan, and Bali and food and beverage outlets in Tokyo, premium individuality is the rule - no detail is too small, no experience too grand. Each intimate location offers guests an exclusive celebration of contemporary design and superior service.
EDITION
is a luxury lifestyle hotel brand that combines a personal, individualized, and unique hotel experience with the global reach and scale of Marriott International and creative vision of Ian Schrager. EDITION encompasses not only great design and true innovation, but also great personal, friendly, modern service as well as outstanding, one-of-a-kind food, beverage, and entertainment offerings. Each hotel with its rare individuality, authenticity, originality, and unique ethos reflects the best of the cultural and social milieu of its location and of the time.
JW Marriott
is a global luxury brand of beautiful hotels and resorts located in gateway cities and exotic destinations around the world. JW Marriott properties have awe-inspiring spaces influenced by modern residential design, exceptional amenities and culinary experiences, and warm and engaging associates delivering intuitive service. JW Marriott's elegant yet approachable positioning provides a differentiated offering in the luxury hotel market, bridging the gap between full-service hotel brands and the super luxury brands at the top of the tier.
Autograph Collection Hotels
are high personality upper-upscale and luxury independent hotels that deliver unique experiences and design across a global portfolio. Each property has been selected for its originality, rich character, uncommon details, remarkable design, or for its best-in-class resort amenities. From iconic to chic and artsy to luxurious, Autograph Collection is designed to attract guests who prefer original, locally authentic, and unique hotel experiences that other conventional brands do not offer.
6
Renaissance Hotels
is a global, full-service brand in the upper-upscale tier that targets lifestyle-oriented business travelers. Each Renaissance hotel offers its own personality, local flavor, and distinctive style. Innovations include the Navigator program, which helps guests discover the soul of the neighborhood, and Evenings at Renaissance, which helps guests experience the unexpected with live music, mixology demonstrations, art exhibits, and more in the comfort of the hotel lobby bars and lounges. The diverse portfolio of properties includes historic icons, modern boutiques, resorts, and convention hotels.
Marriott Hotels
is the Company’s global flagship premium brand, primarily serving business and leisure upper-upscale travelers and meeting groups. Marriott Hotels properties deliver premium choices, sophisticated style, and well-crafted details. Properties are located in downtown, urban, and suburban areas, near airports, and at resort locations. Typically, properties offer well-appointed guest rooms, convention and banquet facilities, destination-driven restaurants and lounges, concierge lounges, fitness centers, and swimming pools. Many resort properties have additional recreational facilities, such as tennis courts, golf courses, additional restaurants and lounges, and spa facilities.
Delta Hotels and Resorts
is a full-service brand, primarily serving business travelers within the upscale and upper-upscale tiers. Delta Hotels and Resorts are focused on elevating and delivering on the essentials of business travel, through pragmatic and efficient design, thoughtfully appointed guest rooms, large functional work spaces, and complimentary Wi-Fi. Located in gateway cities, suburban areas, near airports, and resort locations, properties also feature flexible meeting spaces, food and beverage options, and premium fitness centers.
Marriott Executive Apartments
provides international, five-star serviced apartments in emerging market gateway cities, designed for business executives who require housing outside their home country, usually for a month or longer. These one-, two-, and three-bedroom apartments are designed with upscale finishes, amenities, and services, including on-site gyms and other recreational facilities, a 24-hour front desk, weekly housekeeping services, laundry facilities within the apartment, and often on-site restaurants.
Gaylord Hotels
offers guests an entertaining, upscale experience at world-class group and convention-oriented hotels. Gaylord Hotels is a leader in the group and meetings business and complements the Company’s network of large convention hotels. Properties are designed to celebrate the heritage of their destinations near Washington, D.C., Nashville, Tennessee, Orlando, Florida, Dallas, Texas, and opening late 2018 in Aurora, Colorado. Gaylord Hotels properties typically have between 1,400 rooms and 2,900 rooms, 400,000 to 600,000 square feet of meeting and convention space, world-class dining and entertainment offerings, and retail outlets in magnificent settings.
AC Hotels by Marriott
is designed to attract the next generation design-conscious business traveler in the upper-moderate tier, who seeks a sleek, modern hotel with unique European touches. With hotels across Europe, and now in North America, and coming soon to South America, AC Hotels by Marriott properties are located in destination, downtown, and lifestyle centers. Properties feature the “AC Lounge,” offering cocktails, tapas-inspired appetizers, and shareable plates, where guests can work and collaborate during the day and relax and unwind in the evening.
Courtyard
is our hotel product designed for the upscale tier, and is focused primarily on transient business travel. Hotels feature functionally designed guest rooms and meeting rooms, and offer free Wi-Fi, a swimming pool, an exercise room, and The Bistro (a self-serve food store open 24 hours a day). Courtyard Refreshing Business lobby fuses functionality, aesthetics, and technology to offer guests greater control of their environment. High-tech and high-touch meet high-style, providing flexibility to work, relax, eat, drink, and socialize all at one's own pace.
Residence Inn
is the leading upscale extended-stay hotel brand designed for frequent and extended stay business and leisure travelers staying five or more nights. Residence Inn provides upscale design and style with spacious suites that feature separate living, sleeping, and working areas, as well as kitchens with full-size appliances. Guests can maintain their own pace and routines through free Wi-Fi, on-site exercise rooms, and comfortable places to work and relax. Additional amenities include free hot breakfast, evening social events three times a week, free grocery shopping services, 24-hour friendly and knowledgeable staffing, and on-site laundry facilities.
SpringHill Suites
is the largest all-suites style hotel brand in the upscale tier that delivers industry leading service to guests who are enthusiastic about travel. The brand delivers a fresh and interesting hotel, focused on fusing form and function with modern décor. The suites feature proprietary West Elm furniture as a new standard. In addition, properties offer enhanced food and beverage choices, with craft beers and wine available in most markets, free hot breakfast, and fitness and wellness zones.
Fairfield Inn & Suites
is a well-established leader in the moderate tier and targets no-nonsense travelers seeking a stress-free stay experience. Fairfield is committed to supporting guests’ desire to maintain balance and momentum by providing healthy options with our free hot breakfast, 24/7 Corner Market offerings, and on property fitness facilities. The hotels feature a
7
multi-functional lobby and guest rooms and suite rooms that are uniquely designed for restful sleep and productivity. Fairfield is our second largest distributed brand, located across three continents from urban gateway cities and exciting leisure destinations to secondary and tertiary markets.
TownePlace Suites
is our extended-stay hotel brand in the upper-moderate tier, designed to appeal to business and leisure travelers who stay for five nights or more. Each suite provides functional spaces for living and working, including a full kitchen and a home office. Each hotel specializes in delivering service that helps guests make the best of long trips by helping them stay productive and upbeat. Additional amenities include daily housekeeping services, free hot breakfast, exercise facilities, a pool, 24-hour In A Pinch (food and beverage) Market, laundry facilities, and free Wi-Fi.
Protea Hotels
is the leading hospitality brand in Africa and boasts the highest brand awareness and largest strategic footprint among all the major hospitality brands in Africa. Competing in the moderate and upper moderate tiers, Protea Hotels is ideal for both business and leisure travelers by offering properties in primary and secondary business centers and desirable leisure destinations. Protea Hotels offers modern facilities, proactive and friendly service, and consistent amenities such as full-service restaurants, meeting spaces, complimentary Wi-Fi, and well-appointed rooms, ensuring global standards for a high quality, relaxed, and successful stay.
Moxy Hotels
is a design-led, lifestyle moderate tier brand with a chic, modern, and edgy personality. Moxy Hotels offers a vibrant and stylish public space and a fun, energetic, and lively social scene. The brand opened its first hotel in Italy in 2014 and is expanding to other European countries and the United States.
Licensed Brands
In 2011 we spun off our timeshare operations and timeshare development business through a special tax-free dividend to our shareholders of all of the issued and outstanding common stock of our then wholly owned subsidiary MVW. Before the spin-off, we developed, operated, marketed, and sold timeshare interval, fractional ownership, and residential properties as part of our former Timeshare segment under the brand names discussed below, and in conjunction with the spin-off, we entered into licensing agreements with MVW for those brands.
Under those licensing agreements, MVW is the exclusive worldwide developer, marketer, seller, and manager of vacation ownership and related products under the Marriott Vacation Club and Grand Residences by Marriott brands. MVW is also the exclusive global developer, marketer, and seller of vacation ownership and related products under The Ritz-Carlton Destination Club brand. The Ritz-Carlton generally provides on-site management for Ritz-Carlton branded properties. We receive license fees under the licensing agreements with MVW for the following brands:
Marriott Vacation Club
is MVW’s signature offering in the upscale tier of the vacation ownership industry. Marriott Vacation Club resorts typically combine spacious accommodations with one-, two-, and three-bedroom options, living and dining areas, and in-unit kitchens and laundry facilities, with resort amenities.
Grand Residences by Marriott
is an upscale tier vacation ownership and whole ownership residence brand. The ownership structure and physical products for these locations are similar to those MVW offers to Marriott Vacation Club owners, although the time period for each Grand Residences by Marriott ownership interest ranges between three and 13 weeks. MVW also offers whole ownership residential products under this brand.
The Ritz-Carlton Destination Club
is MVW’s vacation ownership offering in the luxury tier of the industry. The Ritz-Carlton Destination Club provides luxurious vacation experiences commensurate with The Ritz-Carlton brand. The Ritz-Carlton Destination Club resorts typically feature luxurious two-, three- and four-bedroom units, and luxury resort amenities.
MVW offers Marriott Rewards
®
Points and The Ritz-Carlton Rewards
®
Points to its owners or potential owners as sales, tour, and financing incentives, in exchange for vacation ownership usage rights, for customer referrals, and to resolve customer service issues. MVW buys these points from our Marriott Rewards and The Ritz-Carlton Rewards programs.
At year-end
2015
, MVW operated
58
properties, primarily in the United States, but also in other countries and territories. Many of MVW’s resorts are located adjacent to hotels we operate, such as Marriott Hotels and The Ritz-Carlton, and owners have access to certain hotel facilities during their vacation.
Other Activities
Credit Card Programs
.
At year-end
2015
, we had six credit card programs in the United States, Canada, and the United Kingdom, which include both Marriott Rewards and The Ritz-Carlton Rewards credit cards. We earn licensing fees based on card usage, and the cards are designed to encourage loyalty to our brands.
8
Sales and Marketing, Reservation Systems, and Loyalty Programs
.
We focus on increasing value for the consumer and “selling the way the customer wants to buy.” Our Look No Further
®
Best Rate Guarantee gives customers access to the same rates whether they book through our telephone reservation system, our website, or any other Marriott reservation channel and ensures best rate integrity, strengthening consumer confidence in our brand. Our strong Marriott Rewards and The Ritz-Carlton Rewards guest recognition programs and our information-rich and easy-to-use Marriott.com website and mobile app are also integral to our success.
Marriott.com and Marriott Mobile are two of our fastest growing booking channels. Now averaging over 60 million visitors each month, and with updated designs, personalized experiences, and a new direct booking campaign - It Pays to Book Direct - Marriott.com is making it easier and more rewarding for our guests to book directly with us. Beyond the booking, Marriott Mobile also now gives our guests unprecedented access to services on-the-go, like mobile check-in and check-out (one of our most widely-used digital features). In 2015, we also launched mobile service requests at all full-service hotels around the globe where guests can use the Marriott Mobile App to engage in a two-way chat with the hotel prior to their arrival and throughout their stay. Marriott Rewards members now enjoy a superior stay experience thanks to these member-exclusive digital services. We continue to explore and test other digital offerings that could make the hotel booking and the hotel stay experience at any one of our hotels more convenient, easy, and personalized.
At year-end
2015
, we operated
17
hotel reservation centers,
eight
in the United States and Canada and
nine
in other countries and territories, which handle reservation requests for our lodging brands worldwide, including franchised properties. We own one of the U.S. facilities and either lease the others or share space with an existing Marriott property. While pricing is set by our hotels, our reservation system manages and controls inventory and allows us to utilize third party agents where cost effective. Economies of scale enable us to minimize costs per occupied room, drive profits for our owners and franchisees, and enhance our fee revenue.
We believe our global sales and revenue management organization is a key competitive advantage due to our unrelenting focus on optimizing our investment in people, processes, and systems. Our above-property sales deployment strategy aligns our sales efforts around the customer, reducing duplication of sales efforts by individual hotels and allowing us to cover a larger number of accounts. We also utilize innovative sophisticated revenue management systems, many of which are proprietary, which we believe provide a competitive advantage in pricing decisions, increase efficiency in analysis and decision making, and produce higher property-level revenue for the hotels in our system. Most of the hotels in our system utilize web-based programs to effectively manage the rate set up and modification processes which provides for greater pricing flexibility, reduces time spent on rate program creation and maintenance, and increases the speed to market of new products and services.
Our customer loyalty programs, Marriott Rewards and The Ritz-Carlton Rewards, had over 54 million members and 16 participating brands as of year-end
2015
. MVW and other program partners also participate in our rewards programs. The rewards programs yield repeat guest business by rewarding frequent stays with points toward free hotel stays and other rewards, or airline miles with any of 41 participating airline programs. We believe that our rewards programs generate substantial repeat business that might otherwise go to competing hotels. In
2015
, rewards program members purchased over 50 percent of our room nights. We continue to enhance our rewards program offerings and strategically market to this large and growing customer base. Our loyal rewards member base provides a low cost and high impact vehicle for our revenue generation efforts. See the “Rewards Programs” caption in Footnote No.
2
, “
Summary of Significant Accounting Policies
” for more information.
As we further discuss in Part I, Item 1A “Risk Factors” later in this report, we utilize sophisticated technology and systems in our reservation, revenue management, and property management systems, in our Marriott Rewards and The Ritz-Carlton Rewards programs, and in other aspects of our business. We also make certain technologies available to our guests. Keeping pace with developments in technology is important for our operations and our competitive position. Furthermore, the integrity and protection of customer, employee, and company data is critical to us as we use such data for business decisions and to maintain operational efficiency.
Environmental Responsibility and Sustainable Hotels
.
Our sustainability strategy supports business growth, conservation of natural resources, and protecting our planet through wide-reaching environmental initiatives. Marriott’s environmental goals are to: (1) reduce energy and water consumption by 20 percent by 2020; (2) empower our hotel development partners to build sustainable hotels; (3) green our multi-billion dollar supply chain; (4) educate and inspire associates and guests to conserve and preserve; and (5) address environmental challenges through innovative conservation initiatives including rainforest protection and water conservation. We recently achieved our goal of reducing water consumption by 20 percent by 2020 and are continuing to make progress on our other 2020 goals.
We recognize our responsibility to reduce waste as well as water and energy consumption in our hotels and corporate offices. Our focus remains on continually integrating greater environmental sustainability throughout our business. In the year
9
ahead, we intend to build upon our progress and begin to set the stage for our next generation of sustainability goals. We were the first major hotel chain to calculate our carbon footprint and launch a plan to improve energy efficiency, conserve water, and support globally significant projects that reduce deforestation. We use Energy and Environmental Action (EEAP) plans, our best-practice auditing tool, to help our properties achieve energy and water reduction goals. Working in partnership with the U.S. Green Building Council’s (USGBC) Leadership in Energy and Environmental Design (LEED®) certification, Marriott is empowering our hotel development partners to build sustainable hotels. We developed the first LEED Volume Program (LVP) for the hospitality industry to provide a streamlined path to certification through a pre-certified hotel prototype. The LEED Volume Program can save our owners 25 percent in energy and water consumption for the life of their buildings and should recover their initial investment in two to six years. Marriott has one of the largest portfolios of LEED-certified buildings in the hospitality industry (over 50), with dozens more in the development pipeline.
Global Design Division
. Our Global Design division provides design, development, construction, refurbishment, and procurement services to owners and franchisees of lodging properties on a voluntary basis outside the scope of and separate from our management or franchise contracts. Similar to third-party contractors, Global Design provides these services on a fee basis to owners and franchisees of our branded properties.
Marriott Golf
.
At year-end
2015
, Marriott Golf managed
35
golf course facilities as part of our management of hotels and for other golf course owners. In addition, we provide similar services to three facilities operated by others.
Competition
We encounter strong competition both as a lodging operator and as a franchisor. There are approximately 873 lodging management companies in the United States, including approximately 11 that operate more than 100 properties. These operators are primarily private management firms, but also include several large national and international chains that own and operate their own hotels and also franchise their brands. Our management contracts are typically long-term in nature, but most allow the hotel owner to replace the management firm if it does not meet certain financial or performance criteria.
During the last recession, demand for hotel rooms declined significantly, particularly in 2009, and we took steps to reduce operating costs and improve efficiency. Due to the competitive nature of our industry, we focused these efforts on areas that had limited or no impact on the guest experience. While demand trends globally improved from 2010 through 2015, cost reductions could again become necessary if demand trends reverse. We would expect to implement any such efforts in a manner designed to maintain customer loyalty, owner preference, and associate satisfaction, in order to help maintain or increase our market share.
Affiliation with a national or regional brand is common in the U.S. lodging industry, and we believe that our brand recognition assists us in attracting and retaining guests, owners, and franchisees. In
2015
, approximately 70 percent of U.S. hotel rooms were brand-affiliated. Most of the branded properties are franchises, under which the operator pays the franchisor a fee for use of its hotel name and reservation system. In the franchising business, we face a number of competitors that have strong brands and customer appeal, including Hilton, Intercontinental Hotels Group, Hyatt, Starwood, Wyndham, Accor, Choice, Carlson Rezidor, Best Western, La Quinta, and others.
Outside the United States, branding is much less prevalent and most markets are served primarily by independent operators, although branding is more common for new hotel development. We believe that chain affiliation will increase in many overseas markets as local economies grow, trade barriers decline, international travel accelerates, and hotel owners seek the economies of centralized reservation systems and marketing programs.
Based on lodging industry data, we have more than a 10 percent share of the U.S. hotel market (based on number of rooms) and we estimate less than a two percent share of the lodging market outside the United States. We believe that our hotel brands are attractive to hotel owners seeking a management company or franchise affiliation because our hotels typically generate higher Revenue per Available Room (“RevPAR”) than our direct competitors in most market areas. We attribute this performance premium to our success in achieving and maintaining strong customer preference. We believe that the location and quality of our lodging facilities, our marketing programs, our reservation systems, and our emphasis on guest service and guest and associate satisfaction contribute to customer preference across all of our brands.
Properties that we operate, franchise, or license are regularly upgraded to maintain their competitiveness. Most of our management agreements provide for the allocation of funds to be set aside, generally a fixed percentage of revenue, for periodic renovation of buildings and replacement of furnishings. These ongoing refurbishment programs, along with periodic brand initiatives, are generally adequate to preserve or enhance the competitive position and earning power of the properties. Properties converting to one of our brands typically complete renovations as needed in conjunction with the conversion.
10
Employee Relations
At year-end
2015
, we had approximately 127,500 employees, approximately 11,000 of whom were represented by labor unions. We believe relations with our employees are positive.
Environmental Compliance
The properties we operate or develop are subject to national, state, and local laws and regulations that govern the discharge of materials into the environment or otherwise relate to protecting the environment. Those environmental provisions include requirements that address health and safety; the use, management, and disposal of hazardous substances and wastes; and emission or discharge of wastes or other materials. We believe that our operation and development of properties complies, in all material respects, with environmental laws and regulations. Compliance with such provisions has not materially impacted our capital expenditures, earnings, or competitive position, and we do not anticipate that it will have a material impact in the future.
Internet Address and Company SEC Filings
Our Internet address is Marriott.com. On the investor relations portion of our website, Marriott.com/investor, we provide a link to our electronic filings with the U.S. Securities and Exchange Commission (the “SEC”), including our annual report on Form 10-K, our quarterly reports on Form 10-Q, our current reports on Form 8-K and any amendments to these reports. We make all such filings available free of charge as soon as reasonably practicable after filing. The information found on our website is not part of this or any other report we file with or furnish to the SEC.
11
Forward-Looking Statements
We make forward-looking statements in Management’s Discussion and Analysis of Financial Condition and Results of Operations and elsewhere in this report based on the beliefs and assumptions of our management and on information currently available to us. Forward-looking statements include information about our possible or assumed future results of operations, which follow under the headings “Business and Overview,” “Liquidity and Capital Resources,” and other statements throughout this report preceded by, followed by or that include the words “believes,” “expects,” “anticipates,” “intends,” “plans,” “estimates” or similar expressions.
Any number of risks and uncertainties could cause actual results to differ materially from those we express in our forward-looking statements, including the risks and uncertainties we describe below and other factors we describe from time to time in our periodic filings with the U.S. Securities and Exchange Commission (the “SEC”). We therefore caution you not to rely unduly on any forward-looking statement. The forward-looking statements in this report speak only as of the date of this report, and we undertake no obligation to update or revise any forward-looking statement, whether as a result of new information, future developments, or otherwise.
Risks and Uncertainties
We are subject to various risks that could have a negative effect on us or on our financial condition. You should understand that these risks could cause results to differ materially from those we express in forward-looking statements contained in this report or in other Company communications. Because there is no way to determine in advance whether, or to what extent, any present uncertainty will ultimately impact our business, you should give equal weight to each of the following:
Our industry is highly competitive, which may impact our ability to compete successfully with other hotel properties and home and apartment sharing services for customers.
We operate in markets that contain many competitors. Each of our hotel brands competes with major hotel chains, as well as home and apartment sharing services, in national and international venues and with independent companies in regional markets. Our ability to remain competitive and to attract and retain business and leisure travelers depends on our success in distinguishing the quality, value, and efficiency of our lodging products and services, including our loyalty programs and consumer-facing technology platforms and services, from those offered by others. If we cannot compete successfully in these areas, our operating margins could contract, our market share could decrease, and our earnings could decline. Further, new lodging supply in individual markets could have a negative impact on the hotel industry and hamper our ability to increase room rates or occupancy in those markets.
Economic uncertainty could continue to impact our financial results and growth.
Weak economic conditions in Europe and other parts of the world, the strength or continuation of recovery in countries that have experienced improved economic conditions, changes in oil prices and currency values, potential disruptions in the U.S. economy as a result of governmental action or inaction on the federal deficit, budget, and related issues, political instability in some areas, and the uncertainty over how long any of these conditions will continue, could continue to have a negative impact on the lodging industry. U.S. government travel is also a significant part of our business, and this aspect of our business may continue to suffer due to U.S. federal spending cuts and any further limitations that may result from congressional action or inaction. As a result of such current economic conditions and uncertainty, we continue to experience weakened demand for our hotel rooms in some markets. Recent improvements in demand trends in other markets may not continue, and our future financial results and growth could be further harmed or constrained if the recovery stalls or conditions worsen.
Risks Relating to the Starwood Combination
We will be subject to various uncertainties and contractual restrictions, including the risk of litigation, while the Starwood Combination is pending that could cause disruption and may make it more difficult to maintain relationships with employees, hotel owners, hotel franchisees, suppliers or customers.
Uncertainty about the effect of the Starwood Combination on employees, hotel owners, hotel franchisees, suppliers and customers may have an adverse effect on our business. Although we intend to take steps designed to reduce any adverse effects, these uncertainties could impair our ability to attract, retain and motivate key personnel until the Starwood Combination is completed and for a period of time after that, and could cause customers, suppliers and others that deal with us to seek to change our existing business relationships.
The pursuit of the Starwood Combination and the preparation for the integration may place a significant burden on our management and internal resources. The diversion of management’s attention away from day-to-day business concerns and any difficulties encountered in the transition and integration process could adversely affect our financial results.
12
In addition, the Merger Agreement restricts each company, without the other’s consent, from making certain acquisitions and taking other specified actions until the Starwood Combination closes or the Merger Agreement terminates. These restrictions could prevent us from pursuing otherwise attractive business opportunities and making other changes to our business before completion of the Starwood Combination or termination of the Merger Agreement.
A number of lawsuits challenging the Starwood Combination were filed on behalf of purported shareholders of Starwood, naming various combinations of Starwood’s directors, Starwood, Marriott, and others, as defendants. Although Marriott was dismissed from these lawsuits, an adverse ruling in any pending or future actions may prevent or delay the Starwood Combination from being completed. Starwood’s board of directors has also received demand letters from purported shareholders alleging that Starwood’s board of directors breached its fiduciary duties in connection with its approval of the Starwood Combination and demanding that Starwood’s board of directors conduct an investigation and take other actions. Similar lawsuits could be filed and similar demand letters could in the future be received by Starwood, Marriott, and their respective boards of directors. One of the conditions to the closing of the Starwood Combination is the absence of any judgment, order, law or other legal restraint by a court or other governmental entity of competent jurisdiction that prevents the consummation of the Starwood Combination. Accordingly, if any of the plaintiffs is successful in obtaining an injunction prohibiting the consummation of the Starwood Combination, then such injunction could prevent the Starwood Combination from becoming effective, or delay its becoming effective within the expected time frame.
Failure to complete the Starwood Combination could negatively impact our stock price and our future business and financial results.
If we do not complete the Starwood Combination, our ongoing business could be adversely affected, and we may be subject to several risks, including the following:
|
•
|
being required to pay a termination fee under certain circumstances as provided in the Merger Agreement;
|
|
•
|
having to pay certain costs relating to the Starwood Combination, such as legal, accounting, financial advisor and other fees and expenses;
|
|
•
|
our stock price could decline to the extent that the current market prices reflect a market assumption that the Starwood Combination will be completed; and
|
|
•
|
having had our management focus on the Starwood Combination instead of on pursuing other opportunities that could have been beneficial to us.
|
If the Starwood Combination is not completed, we cannot assure you that these risks will not materialize and will not materially adversely affect our business, financial results and stock price.
Our ability to complete the Starwood Combination is subject to certain closing conditions and the receipt of consents and approvals from government entities which may impose conditions that could adversely affect us or cause the Starwood Combination to be abandoned.
The Merger Agreement contains certain closing conditions, including, among others:
|
•
|
the approval by the holders of a majority of all outstanding shares of Starwood common stock of the transactions;
|
|
•
|
the approval by the holders of a majority of the votes cast at the special meeting of Marriott shareholders in favor of the proposal to issue shares of Marriott common stock to Starwood shareholders;
|
|
•
|
the absence of any judgment, order, law or other legal restraint by a court or other governmental entity of competent jurisdiction that prevents the consummation of the Starwood Combination;
|
|
•
|
the approval for listing by NASDAQ of the shares of Marriott common stock issuable in the Starwood Combination; and
|
|
•
|
the spin-off of Starwood’s Vistana vacation ownership business (“Vistana”), or, if the spin-off of Vistana and Vistana’s subsequent merger with a wholly owned subsidiary of Interval Leisure Group, Inc. is not consummated, the completion of another spin-off, split-off or analogous distribution of Vistana or the sale of Vistana by Starwood.
|
We cannot assure you that the various closing conditions will be satisfied, or that any required conditions will not materially adversely affect the combined company after the Starwood Combination closes, or will not result in the abandonment or delay of the Starwood Combination. For instance, the consummation of the disposition of Starwood’s Vistana business may be delayed or not occur, which could cause the Starwood Combination to be delayed or abandoned.
In addition, before the Starwood Combination may be completed, various approvals and declarations of non-objection must be obtained from certain regulatory and governmental authorities, including the expiration or termination of the applicable waiting period under the Hart-Scott Rodino Antitrust Improvements Act and receipt of consents and approvals from the
13
European Commission and various other governmental entities. These regulatory and governmental entities could impose conditions on the granting of such approvals. Such conditions and the process of obtaining regulatory approvals could have the effect of delaying closing of the Starwood Combination or of imposing additional costs or limitations on the combined company following the closing. The regulatory approvals may not be received at all, may not be received in a timely fashion, or may contain conditions. In addition, Starwood’s and Marriott’s respective obligations to complete the Starwood Combination are conditioned on the receipt of certain regulatory approvals or waiver by the other party of such condition.
Any delay in completing the Starwood Combination could reduce or eliminate the benefits that we expect to achieve.
As discussed above, the Starwood Combination is subject to a number of conditions beyond Starwood’s and our control that could prevent, delay or otherwise materially adversely affect the completion of the combination. We cannot predict whether and when these conditions will be satisfied. Any delay in completing the Starwood Combination could cause the combined company not to realize some or all of the synergies that we expect to achieve if the Starwood Combination is successfully completed within the expected time frame.
The combined company may not be able to integrate successfully and many of the anticipated benefits of combining Starwood and Marriott may not be realized.
We entered into the Merger Agreement with the expectation that the Starwood Combination will result in various benefits, including, among other things, operating efficiencies. Achieving those anticipated benefits is subject to a number of uncertainties, including whether we can integrate the business of Starwood in an efficient and effective manner.
The integration process could also take longer than we anticipate and could result in the loss of valuable employees, the disruption of each company’s ongoing businesses, processes and systems or inconsistencies in standards, controls, procedures, practices, policies and compensation arrangements, any of which could adversely affect the combined company’s ability to achieve the benefits we anticipate. The combined company’s resulting portfolio of approximately 30 brands could be challenging for us to maintain and grow, and the harmonization of our different reservations and other systems and business practices could be more difficult, disruptive, and time consuming than we anticipate. The combined company’s results of operations could also be adversely affected by any issues attributable to either company’s operations that arise or are based on events or actions that occur before the Starwood Combination closes. The combined company may also have difficulty addressing possible differences in corporate cultures and management philosophies. The integration process is subject to a number of uncertainties, and we cannot assure you that the benefits we anticipate will be realized at all or as quickly as we expect. If we don’t achieve those benefits, our costs could increase, our expected net income could decrease, and the combined company’s future business, financial condition, operating results and prospects could suffer.
We will incur substantial transaction costs in connection with the Starwood Combination.
We expect to incur a number of non-recurring expenses both before and after completing the Starwood Combination, including in obtaining necessary consents and approvals and combining the operations of the two companies. These fees and costs will be substantial. We may also incur unanticipated costs in the integration of the businesses of Starwood and Marriott. Although we expect that the elimination of certain duplicative costs, as well as the realization of other efficiencies related to the integration of the two businesses, will offset the incremental transaction-related costs over time, this net benefit may not be achieved in the near term, or at all. Further, if the Starwood Combination is not completed, we would have to recognize certain of these expenses without realizing the expected benefits of the combination.
Our shareholders will be diluted by the Starwood Combination.
The Starwood Combination will dilute the ownership position of our current shareholders. We currently estimate that, upon completion of the combination, our shareholders before the merger will own approximately 61% and former Starwood shareholders will own approximately 39% of the combined company’s outstanding common stock. Because of this, our current shareholders may have less influence on the management and policies of the combined company than they now have on us.
Our future results will suffer if we do not effectively manage our expanded operations following the completion of the Starwood Combination.
Following the completion of the Starwood Combination, the size of the business of the combined company will increase significantly beyond the current size of our business. Our future success depends, in part, upon our ability to manage this expanded business, which will pose substantial challenges for management, including challenges related to the management and monitoring of new operations and associated increased costs and complexity. We cannot assure you that we will be successful or that we will realize the expected operating efficiencies, cost savings and other benefits from the combination that we currently anticipate.
The combined company may not be able to retain Marriott and/or Starwood personnel successfully after the Starwood Combination is completed.
The success of the Starwood Combination will depend in part on the combined company’s ability to retain the talents and dedication of key employees that Marriott and Starwood currently employ. It is possible that these employees may decide not to remain with Marriott or Starwood, as applicable, while the Starwood Combination is pending or
14
with the combined company after the combination is consummated. If key employees terminate their employment, or if the combined company cannot maintain a sufficient number of employees to maintain effective operations, the combined company’s business activities could be adversely affected and management’s attention could be diverted from successfully integrating Starwood to hiring suitable replacements, all of which may cause the combined company’s business to suffer. In addition, we may not be able to locate suitable replacements for any key employees who leave either company, or offer employment to potential replacements on reasonable terms.
Risks Relating to Our Business
Operational Risks
Premature termination of our management or franchise agreements could hurt our financial performance.
Our hotel management and franchise agreements may be subject to premature termination in certain circumstances, such as the bankruptcy of a hotel owner or franchisee, or a failure under some agreements to meet specified financial or performance criteria that are subject to the risks described in this section, which we fail or elect not to cure. In addition, some courts have applied principles of agency law and related fiduciary standards to managers of third-party hotel properties, including us (or have interpreted hotel management agreements as “personal services contracts”). This means, among other things, that property owners may assert the right to terminate management agreements even where the agreements provide otherwise, and some courts have upheld such assertions about our management agreements and may do so in the future. In addition, some management and franchise agreements may be terminated, or property owners may attempt to terminate such agreements, in connection with the Starwood Combination. If terminations occur for these or other reasons, we may need to enforce our right to damages for breach of contract and related claims, which may cause us to incur significant legal fees and expenses. Any damages we ultimately collect could be less than the projected future value of the fees and other amounts we would have otherwise collected under the management agreement. A significant loss of agreements due to premature terminations could hurt our financial performance or our ability to grow our business.
Our lodging operations are subject to global, regional, and national conditions.
Because we conduct our business on a global platform, changes in global and regional economies impact our activities. In recent years, decreases in travel resulting from weak economic conditions and the heightened travel security measures that have resulted from the threat of further terrorism have hurt our business. Our future performance could be similarly affected by the economic environment in each of our operating regions, the resulting unknown pace of business travel, and any future incidents in those regions.
The growing significance of our operations outside of the United States, particularly following the Starwood Combination, makes us increasingly susceptible to the risks of doing business internationally, which could lower our revenues, increase our costs, reduce our profits, disrupt our business, or damage our reputation.
We currently operate or franchise hotels and resorts in
87
countries, and our operations outside the United States represented approximately
19
percent of our revenues in
2015
. In addition, Starwood reported that as of September 30, 2015 it operated or franchised hotels and resorts in approximately 100 countries, and its operations outside the United States (including operations associated with Starwood’s Vistana vacation ownership business which it is to spin off prior to our combination) represented a majority of Starwood’s revenues in both 2014 and the nine months ending September 30, 2015. We expect that our international revenues will continue to grow, particularly following the Starwood Combination. As a result, we are increasingly exposed to the challenges and risks of doing business outside the United States, many of which are outside of our control, and which could reduce our revenues or profits, increase our costs, result in significant liabilities or sanctions, otherwise disrupt our business, or damage our reputation. These challenges include: (1) compliance with complex and changing laws, regulations and government policies that may impact our operations, such as foreign ownership restrictions, import and export controls, and trade restrictions; (2) compliance with U.S. and foreign laws that affect the activities of companies abroad, such as competition laws, currency regulations, and other laws affecting dealings with certain nations; (3) limitations on our ability to repatriate non-U.S. earnings in a tax effective manner; (4) the difficulties involved in managing an organization doing business in many different countries; (5) uncertainties as to the enforceability of contract and intellectual property rights under local laws; (6) rapid changes in government policy, political or civil unrest in the Middle East and elsewhere, acts of terrorism, or the threat of international boycotts or U.S. anti-boycott legislation; and (7) currency exchange rate fluctuations, which may impact the results and cash flows of our international operations.
Any failure by our international operations to comply with anti-corruption laws or trade sanctions could increase our costs, reduce our profits, limit our growth, harm our reputation, or subject us to broader liability.
We are subject to restrictions imposed by the U.S. Foreign Corrupt Practices Act and anti-corruption laws and regulations of other countries applicable to our operations, such as the UK Bribery Act. Anti-corruption laws and regulations generally prohibit companies and their intermediaries from making improper payments to government officials or other persons in order to receive or retain business. The compliance programs, internal controls and policies we maintain and enforce to promote compliance with applicable anti-bribery and anti-corruption laws may not prevent our associates, contractors or agents from acting in ways prohibited by these
15
laws and regulations. We are also subject to trade sanctions administered by the Office of Foreign Assets Control and the U.S. Department of Commerce. Our compliance programs and internal controls also may not prevent conduct that is prohibited under these rules. The United States may impose additional sanctions at any time against any country in which or with whom we do business. Depending on the nature of the sanctions imposed, our operations in the relevant country could be restricted or otherwise adversely affected. Any violations of anti-corruption laws and regulations or trade sanctions could result in significant civil and criminal penalties, reduce our profits, disrupt our business or damage our reputation. In addition, an imposition of further restrictions in these areas could increase our cost of operations, reduce our profits or cause us to forgo development opportunities that would otherwise support growth.
Exchange rate fluctuations and foreign exchange hedging arrangements could result in significant foreign currency gains and losses and affect our business results.
We earn revenues and incur expenses in foreign currencies as part of our operations outside of the United States. Accordingly, fluctuations in currency exchange rates may significantly increase the amount of U.S. dollars required for foreign currency expenses or significantly decrease the U.S. dollars we receive from foreign currency revenues. We are also exposed to currency translation risk because the results of our business outside of the U.S. are generally reported in local currency, which we then translate to U.S. dollars for inclusion in our consolidated financial statements. As a result, changes between the foreign exchange rates and the U.S. dollar affect the amounts we record for our foreign assets, liabilities, revenues and expenses, and could have a negative effect on our financial results. We expect that our exposure to foreign currency exchange rate fluctuations will grow as the relative contribution of our non-U.S. operations increases. Our efforts to mitigate some of our foreign currency exposure by entering into foreign exchange hedging agreements with financial institutions to reduce exposures to some of the principal currencies in which we receive management and franchise fees may not be successful. In this regard, these hedging agreements do not cover all currencies in which we do business, do not eliminate foreign currency risk entirely for the currencies that they do cover, and involve costs and risks of their own in the form of transaction costs, credit requirements and counterparty risk.
Some of our management agreements and related contracts require us to make payments to owners if the hotels do not achieve specified levels of operating profit.
Some of our contracts with hotel owners require that we fund shortfalls if the hotels do not attain specified levels of operating profit. We may not be able to recover any fundings of such performance guarantees, which could lower our profits and reduce our cash flows.
Our new programs and new branded products may not be successful.
We cannot assure you that recently launched, newly acquired, or recently announced brands, such as EDITION, AC Hotels by Marriott in the Americas, Protea Hotels, Moxy Hotels, and Delta Hotels and Resorts, and those expected to be acquired as a result of the Starwood Combination, or any other new programs or products we may launch in the future will be accepted by hotel owners, potential franchisees, or the traveling public or other customers. We also cannot be certain that we will recover the costs we incurred in developing or acquiring the brands or any new programs or products, or that the brands or any new programs or products will be successful. In addition, some of our new brands involve or may involve cooperation and/or consultation with one or more third parties, including some shared control over product design and development, sales and marketing, and brand standards. Disagreements with these third parties could slow the development of these new brands and/or impair our ability to take actions we believe to be advisable for the success and profitability of such brands.
Risks relating to natural or man-made disasters, contagious disease, terrorist activity, and war could reduce the demand for lodging, which may adversely affect our revenues.
So called “Acts of God,” such as hurricanes, earthquakes, tsunamis, and other natural disasters, such as Hurricane Sandy in the Northeastern United States, the earthquake and tsunami in Japan, and man-made disasters in recent years as well as the potential spread of contagious diseases such as MERS (Middle East Respiratory Syndrome), Zika virus, and Ebola in locations where we own, manage, or franchise significant properties and areas of the world from which we draw a large number of customers, could cause a decline in business or leisure travel and reduce demand for lodging. Actual or threatened war, terrorist activity, political unrest, or civil strife, such as recent events in Ukraine and Russia, the Middle East, and other geopolitical uncertainty could have a similar effect. Any one or more of these events may reduce the overall demand for hotel rooms and corporate apartments or limit the prices that we can obtain for them, both of which could adversely affect our profits.
Disagreements with owners of hotels that we manage or franchise may result in litigation or may delay implementation of product or service initiatives.
Consistent with our focus on management and franchising, we own very few of our lodging properties. The nature of our responsibilities under our management agreements to manage each hotel and enforce the standards required for our brands under both management and franchise agreements may be subject to interpretation and will from time to time give rise to disagreements, which may include disagreements over the need for or payment for new product or service initiatives and the timing and amount of capital investments. Such disagreements may be more likely when hotel returns are weaker. We seek to resolve any disagreements in order to develop and maintain positive relations with current and potential hotel owners and joint venture partners, but we are not always able to do so. Failure to resolve such disagreements has resulted in litigation, and could do so in the future. If any such litigation results in a significant adverse judgment, settlement, or court
16
order, we could suffer significant losses, our profits could be reduced, or our future ability to operate our business could be constrained.
Our business depends on the quality and reputation of our brands, and any deterioration in the quality or reputation of these brands could have an adverse impact on our market share, reputation, business, financial condition, or results of operations.
Events that may be beyond our control could affect the reputation of one or more of our properties or more generally impact the reputation of our brands. If the reputation or perceived quality of our brands declines, our market share, reputation, business, financial condition, or results of operations could be affected.
Actions by our franchisees and licensees could adversely affect our image and reputation.
We franchise and license many of our brand names and trademarks to third parties in connection with lodging, timeshare, residential services, and our credit card programs. Under the terms of their agreements with us, our franchisees and licensees interact directly with customers and other third parties under our brand and trade names. If these franchisees or licensees fail to maintain or act in accordance with applicable brand standards; experience operational problems, including any data breach involving customer information; or project a brand image inconsistent with ours, our image and reputation could suffer. Although our franchise and license agreements provide us with recourse and remedies in the event of a breach by the franchisee or licensee, including termination of the agreements under certain circumstances, pursuing any such recourse, remedy, or termination could be expensive and time consuming
.
In addition, we cannot assure you that a court would ultimately enforce our contractual termination rights in every instance.
Damage to, or losses involving, properties that we own, manage, or franchise may not be covered by insurance.
We have comprehensive property and liability insurance policies for our managed, leased, and owned properties with coverage features and insured limits that we believe are customary, and require our franchisees to maintain similar levels of insurance. Market forces beyond our control may nonetheless limit the scope of the insurance coverage we or our franchisees can obtain, or our or their ability to obtain coverage at reasonable rates. Certain types of losses, generally of a catastrophic nature, such as earthquakes, hurricanes and floods, or terrorist acts, or liabilities that result from breaches in the security of our information systems, may be uninsurable or too expensive to justify obtaining insurance. As a result, we and our franchisees may not be successful in obtaining insurance without increases in cost or decreases in coverage levels. In addition, in the event of a substantial loss, the insurance coverage we or our franchisees carry may not be sufficient to pay the full market value or replacement cost of any lost investment or in some cases could result in certain losses being totally uninsured. As a result, we could lose some or all of any capital that we have invested in a property, as well as the anticipated future revenue from the property, and we could remain obligated for guarantees, debt, or other financial obligations for the property.
Development and Financing Risks
While
w
e are predominantly a manager and franchisor of hotel properties, our hotel owners depend on capital to buy, develop, and improve hotels, and our hotel owners may be unable to access capital when necessary.
In order to fund new hotel investments, as well as refurbish and improve existing hotels, both we and current and potential hotel owners must periodically spend money. The availability of funds for new investments and improvement of existing hotels by our current and potential hotel owners depends in large measure on capital markets and liquidity factors, over which we can exert little control. The difficulty of obtaining financing on attractive terms may be constrained by the capital markets for hotel and real estate investments. In addition, owners of existing hotels that we franchise or manage may have difficulty meeting required debt service payments or refinancing loans at maturity.
Our growth strategy depends upon third-party owners/operators, and future arrangements with these third parties may be less favorable.
Our growth strategy for development of additional lodging facilities entails entering into and maintaining various arrangements with property owners. The terms of our management agreements, franchise agreements, and leases for each of our lodging facilities are influenced by contract terms offered by our competitors, among other things. We cannot assure you that any of our current arrangements will continue or that we will be able to enter into future collaborations, renew agreements, or enter into new agreements in the future on terms that are as favorable to us as those that exist today.
Our ability to grow our management and franchise systems is subject to the range of risks associated with real estate investments.
Our ability to sustain continued growth through management or franchise agreements for new hotels and the conversion of existing facilities to managed or franchised Marriott brands is affected, and may potentially be limited, by a variety of factors influencing real estate development generally. These include site availability, financing, planning, zoning and other local approvals, and other limitations that may be imposed by market and submarket factors, such as projected room occupancy, changes in growth in demand compared to projected supply, territorial restrictions in our management and franchise agreements, costs of construction, and anticipated room rate structure.
Our development activities expose us to project cost, completion, and resale risks.
We develop new hotel and residential properties, both directly and through partnerships, joint ventures, and other business structures with third parties. As
17
demonstrated by the impairment charges that we recorded in 2015 and 2014 in connection with our development and construction of three EDITION hotels and residences, our ongoing involvement in the development of properties presents a number of risks, including that: (1) continued weakness in the capital markets may limit our ability, or that of third parties with whom we do business, to raise capital for completion of projects that have commenced or for development of future properties; (2) properties that we develop could become less attractive due to decreases in demand for hotel and residential properties, market absorption or oversupply, with the result that we may not be able to sell such properties for a profit or at the prices or selling pace we anticipate, potentially requiring additional changes in our pricing strategy that could result in further charges; (3) construction delays, cost overruns, lender financial defaults, or so called “Acts of God” such as earthquakes, hurricanes, floods, or fires may increase overall project costs or result in project cancellations; and (4) we may be unable to recover development costs we incur for any projects that we do not pursue to completion.
Development activities that involve our co-investment with third parties may result in disputes that could increase project costs, impair project operations, or increase project completion risks.
Partnerships, joint ventures, and other business structures involving our co-investment with third parties generally include some form of shared control over the operations of the business and create added risks, including the possibility that other investors in such ventures could become bankrupt or otherwise lack the financial resources to meet their obligations, or could have or develop business interests, policies, or objectives that are inconsistent with ours. Although we actively seek to minimize such risks before investing in partnerships, joint ventures, or similar structures, actions by another investor may present additional risks of project delay, increased project costs, or operational difficulties following project completion. Such disputes may also be more likely in difficult business environments.
Risks associated with development and sale of residential properties associated with our lodging properties or brands may reduce our profits.
In certain hotel and timeshare projects we participate, directly or through noncontrolling interests and/or licensing agreements, in the development and sale of residential properties associated with our brands, including residences and condominiums under our The Ritz-Carlton, EDITION, JW Marriott, Autograph Collection, and Marriott brand names and trademarks. Such projects pose further risks beyond those generally associated with our lodging business, which may reduce our profits or compromise our brand equity, including the following: (1) weakness in residential real estate and demand generally may reduce our profits and could make it more difficult to convince future hotel development partners of the value added by our brands; (2) increases in interest rates, reductions in mortgage availability, or increases in the costs of residential ownership could prevent potential customers from buying residential products or reduce the prices they are willing to pay; and (3) residential construction may be subject to warranty and liability claims, and the costs of resolving such claims may be significant.
Some hotel openings in our existing development pipeline and approved projects may be delayed or not result in new hotels, which could adversely affect our growth prospects.
We report a significant number of hotels in our development pipeline, including hotels under construction and under signed contracts, as well as hotels approved for development but not yet under signed contracts. The eventual opening of such pipeline hotels and, in particular, the hotels approved for development that are not yet under contract, is subject to numerous risks, including in some cases the owner’s or developer’s ability to obtain adequate financing or governmental or regulatory approvals. Accordingly, we cannot assure you that our development pipeline, and in particular hotels not yet under contract, will result in new hotels that enter our system, or that those hotels will open when we anticipate.
If we incur losses on loans or loan guarantees that we have made to third parties, our profits could decline.
At times, we make loans for hotel development or renovation expenditures in connection with entering into or amending management or franchise agreements. From time to time we also provide third-party lenders financial guarantees for the timely repayment of all or a portion of debt related to hotels that we manage or franchise, generally subject to an obligation that the owner reimburse us for any fundings. We could suffer losses if hotel owners or franchisees default on loans that we provide or fail to reimburse us for loan guarantees that we have funded.
If owners of hotels that we manage or franchise cannot repay or refinance mortgage loans secured by their properties, our revenues and profits could decrease and our business could be harmed.
The owners of many of our managed or franchised properties have pledged their hotels as collateral for mortgage loans that they entered into when those properties were purchased or refinanced. If those owners cannot repay or refinance maturing indebtedness on favorable terms or at all, the lenders could declare a default, accelerate the related debt, and repossess the property. Such sales or repossessions could, in some cases, result in the termination of our management or franchise agreements and eliminate our anticipated income and cash flows, which could negatively affect our results of operations.
Planned transactions we announce may be delayed, not occur at all, or involve unanticipated costs.
From time to time we announce transactions that we expect will close at a future date, such as our anticipated acquisition of Starwood Hotels &
18
Resorts. If the conditions to consummating these transactions are neither satisfied nor waived by the time we expect, the closings could be delayed or not occur at all.
Technology, Information Protection, and Privacy Risks
A failure to keep pace with developments in technology could impair our operations or competitive position.
The lodging industry continues to demand the use of sophisticated technology and systems, including those used for our reservation, revenue management, and property management systems, our Marriott Rewards and The Ritz-Carlton Rewards programs, and technologies we make available to our guests. These technologies and systems must be refined, updated, and/or replaced with more advanced systems on a regular basis, and if we cannot do so as quickly as our competitors or within budgeted costs and time frames, our business could suffer. We also may not achieve the benefits that we anticipate from any new technology or system, and a failure to do so could result in higher than anticipated costs or could impair our operating results.
An increase in the use of third-party Internet services to book online hotel reservations could adversely impact our business.
Some of our hotel rooms are booked through Internet travel intermediaries such as Expedia.com
®
, Priceline.com
®
, Booking.com™, Travelocity.com
®
, and Orbitz.com
®
, as well as lesser-known online travel service providers. These intermediaries initially focused on leisure travel, but now also provide offerings for corporate travel and group meetings. Although Marriott’s Look No Further
®
Best Rate Guarantee has helped prevent customer preference shift to the intermediaries and greatly reduced the ability of intermediaries to undercut the published rates at our hotels, intermediaries continue to use a variety of aggressive online marketing methods to attract customers, including the purchase, by certain companies, of trademarked online keywords such as “Marriott” from Internet search engines such as Google
®
, Bing
®
, Yahoo
®
, and Baidu
®
to steer customers toward their websites (a practice that has been challenged by various trademark owners in federal court). Although Marriott has successfully limited these practices through contracts with key online intermediaries, the number of intermediaries and related companies that drive traffic to intermediaries’ websites is too large to permit us to eliminate this risk entirely. Our business and profitability could be harmed if online intermediaries succeed in significantly shifting loyalties from our lodging brands to their travel services, diverting bookings away from Marriott.com, or through their fees increasing the overall cost of Internet bookings for our hotels. In addition, if we fail to reach satisfactory agreements with intermediaries as our contracts with them come up for periodic renewal, our hotels might no longer appear on their websites and we could lose business as a result.
We are exposed to risks and costs associated with protecting the integrity and security of internal and customer data.
Our businesses process, use, and transmit large volumes of internal employee and customer data, including credit card numbers and other personal information in various information systems that we maintain and in those maintained by third parties, including our owners, franchisees and licensees, as well as our service providers, in areas such as human resources outsourcing, website hosting, and various forms of electronic communications. The integrity and protection of that customer, employee, and company data is critical to our business. If that data is inaccurate or incomplete, we could make faulty decisions.
Our customers and employees also have a high expectation that we, as well as our owners, franchisees, licensees, and service providers, will adequately protect their personal information. The information, security, and privacy requirements imposed by governmental regulation and the requirements of the payment card industry are also increasingly demanding, in both the United States and other jurisdictions where we operate. Our systems and the systems maintained or used by our owners, franchisees, licensees, and service providers may not be able to satisfy these changing requirements and employee and customer expectations, or may require significant additional investments or time in order to do so.
Cyber-attacks could have a disruptive effect on our business.
Efforts to hack or breach security measures, failures of systems or software to operate as designed or intended, viruses, operator error, or inadvertent releases of data may materially impact our, including our owners’, franchisees’, licensees’, or service providers’, information systems and records. Our reliance on computer, Internet-based and mobile systems and communications and the frequency and sophistication of efforts by hackers to gain unauthorized access to such systems have increased significantly in recent years. A significant theft, loss, or fraudulent use of customer, employee, or company data could adversely impact our reputation and could result in remedial and other expenses, fines, or litigation. Breaches in the security of our information systems or those of our owners, franchisees, licensees, or service providers or other disruptions in data services could lead to an interruption in the operation of our systems, resulting in operational inefficiencies and a loss of profits. In addition, although we carry cyber/privacy liability insurance that is designed to protect us against certain losses related to cyber risks, such insurance coverage may be insufficient to cover all losses or all types of claims that may arise in connection with cyber-attacks, security breaches, and other related breaches.
Changes in privacy law could increase our operating costs and adversely affect our ability to market our products effectively.
We are subject to numerous laws, regulations, and contractual obligations designed to protect personal information, including foreign data protection laws, various U.S. federal and state laws, and credit card industry security standards and other
19
applicable information privacy and security standards. Compliance with changes in applicable privacy regulations may increase our operating costs.
Additionally, we rely on a variety of direct marketing techniques, including email marketing, online advertising, and postal mailings. Any further restrictions in laws such as the CANSPAM Act, and various U.S. state laws, or new federal laws on marketing and solicitation or international data protection laws that govern these activities could adversely affect the continuing effectiveness of email, online advertising, and postal mailing techniques and could force further changes in our marketing strategy. If this occurs, we may not be able to develop adequate alternative marketing strategies, which could impact the amount and timing of our sales of certain products. We also obtain access to potential customers from travel service providers or other companies with whom we have substantial relationships and market to some individuals on these lists directly or by including our marketing message in the other company’s marketing materials. If access to these lists was prohibited or otherwise restricted, our ability to develop new customers and introduce them to our products could be impaired.
Any disruption in the functioning of our reservation system, such as in connection with the Starwood Combination, could adversely affect our performance and results.
We manage a global reservation system that communicates reservations to our branded hotels that individuals make directly with us online, through our mobile app, or through our telephone call centers, or through intermediaries like travel agents, Internet travel web sites and other distribution channels. The cost, speed, accuracy and efficiency of our reservation system are critical aspects of our business and are important considerations for hotel owners when choosing our brands. Our business may suffer if we fail to maintain, upgrade, or prevent disruption to our reservation system. In addition, the risk of disruption in the functioning of our global reservation system could increase in connection with the system integration that we anticipate undertaking following consummation of the Starwood Combination. Disruptions in or changes to our reservation system could result in a disruption to our business and the loss of important data.
Other Risks
Changes in laws and regulations could reduce our profits or increase our costs.
We are subject to a wide variety of laws, regulations, and policies in jurisdictions around the world, including those for financial reporting, taxes, healthcare, and the environment. Changes to these laws, regulations, or policies, including those associated with health care, tax or financial reforms, could reduce our profits. We also anticipate that many of the jurisdictions where we do business will continue to review taxes and other revenue raising measures, and any resulting changes could impose new restrictions, costs, or prohibitions on our current practices or reduce our profits. In particular, governments may revise tax laws, regulations, or official interpretations in ways that could significantly impact us, including modifications that could reduce the profits that we can effectively realize from our non-U.S. operations, or that could require costly changes to those operations, or the way in which they are structured. For example, most U.S. company effective tax rates reflect the fact that income earned and reinvested outside the United States is generally taxed at local rates, which are often much lower than U.S. tax rates. If changes in tax laws, regulations, or interpretations significantly increase the tax rates on non-U.S. income, our effective tax rate could increase and our profits could be reduced. If such increases resulted from our status as a U.S. company, those changes could place us at a disadvantage to our non-U.S. competitors if those competitors remain subject to lower local tax rates.
If we cannot attract and retain talented associates, our business could suffer.
We compete with other companies both within and outside of our industry for talented personnel. If we cannot recruit, train, develop, and retain sufficient numbers of talented associates, we could experience increased associate turnover, decreased guest satisfaction, low morale, inefficiency, or internal control failures. Insufficient numbers of talented associates could also limit our ability to grow and expand our businesses. Any shortage of skilled labor could also require higher wages that would increase our labor costs, which could reduce our profits.
Delaware law and our governing corporate documents contain, and our Board of Directors could implement, anti-takeover provisions that could deter takeover attempts.
Under the Delaware business combination statute, a shareholder holding 15 percent or more of our outstanding voting stock could not acquire us without Board of Director consent for at least three years after the date the shareholder first held 15 percent or more of the voting stock. Our governing corporate documents also, among other things, require supermajority votes for mergers and similar transactions. In addition, our Board of Directors could, without shareholder approval, implement other anti-takeover defenses, such as a shareholder rights plan.
None.
|
Item 2.
|
Properties.
|
We describe our company-operated properties in Part I, Item 1. “Business” earlier in this report, and under the “
Properties by Segment
” caption in Part II, Item 7. “Management’s Discussion and Analysis of Financial Condition and Results of
20
Operations.” We believe our properties are in generally good physical condition with the need for only routine repairs and maintenance and periodic capital improvements. Most of our regional offices and reservation centers are located in leased facilities. We also lease space in a number of buildings with combined space of approximately 1.1 million square feet in Maryland where our corporate and The Ritz-Carlton headquarters are located.
|
Item 3.
|
Legal Proceedings.
|
See the information under “Legal Proceedings” in Footnote No.
7
, “
Commitments and Contingencies
” which we incorporate here by reference.
From time to time, we are also subject to other legal proceedings and claims in the ordinary course of business, including adjustments proposed during governmental examinations of the various tax returns we file. While management presently believes that the ultimate outcome of these proceedings, individually and in the aggregate, will not materially harm our financial position, cash flows, or overall trends in results of operations, legal proceedings are inherently uncertain, and unfavorable rulings could, individually or in aggregate, have a material adverse effect on our business, financial condition, or operating results.
|
Item 4.
|
Mine Safety Disclosures.
|
Not applicable.
Executive Officers of the Registrant
See the information under “Executive Officers of the Registrant” in Part III, Item 10 of this report for information about our executive officers, which we incorporate here by reference.
21
|
Item 5.
|
Market for Registrant’s Common Equity, Related Stockholder Matters, and Issuer Purchases of Equity Securities.
|
Market Information and Dividends
The table below presents the price range of our Class A Common Stock (our “common stock”) and the per share cash dividends we declared for each fiscal quarter during the last two years.
|
|
|
Stock Price
|
Dividends
Declared per
Share
|
|||||||||
|
|
|
High
|
Low
|
|||||||||
|
2015
|
First Quarter
|
$
|
85.00
|
|
|
$
|
72.77
|
|
|
$
|
0.2000
|
|
|
Second Quarter
|
84.33
|
|
|
73.77
|
|
|
0.2500
|
|
||||
|
Third Quarter
|
78.76
|
|
|
63.95
|
|
|
0.2500
|
|
||||
|
Fourth Quarter
|
79.88
|
|
|
64.64
|
|
|
0.2500
|
|
||||
|
|
|
Stock Price
|
Dividends
Declared per
Share
|
|||||||||
|
|
|
High
|
Low
|
|||||||||
|
2014
|
First Quarter
|
$
|
56.20
|
|
$
|
47.21
|
|
$
|
0.1700
|
|
||
|
Second Quarter
|
64.31
|
|
55.00
|
|
0.2000
|
|
||||||
|
Third Quarter
|
73.28
|
|
63.37
|
|
0.2000
|
|
||||||
|
Fourth Quarter
|
79.25
|
|
59.61
|
|
0.2000
|
|
||||||
At February 5, 2016,
253,481,935
shares of our common stock were outstanding and were held by
32,947
shareholders of record. Since October 21, 2013, our common stock has traded on the NASDAQ Global Select Market (“NASDAQ”) and the Chicago Stock Exchange. Before October 21, 2013, our common stock traded on the New York Stock Exchange and the Chicago Stock Exchange. The fiscal year-end closing price for our stock was $67.04 on December 31,
2015
, and $78.03 on December 31,
2014
. All prices are reported on the consolidated transaction reporting system.
Fourth Quarter 2015 Issuer Purchases of Equity Securities
|
(in millions, except per share amounts)
|
|
||||||||||
|
Period
|
Total Number
of Shares
Purchased
|
Average Price
per Share
|
Total Number of
Shares Purchased as Part of Publicly
Announced Plans or
Programs (1) |
Maximum Number
of Shares That May Yet Be Purchased
Under the Plans or
Programs (1) |
|||||||
|
October 1, 2015-October 31, 2015
|
0.7
|
|
74.24
|
|
0.7
|
|
15.0
|
|
|||
|
November 1, 2015-November 30, 2015
|
—
|
|
—
|
|
—
|
|
15.0
|
|
|||
|
December 1, 2015-December 31, 2015
|
0.6
|
|
68.54
|
|
0.6
|
|
14.4
|
|
|||
|
(1)
|
On February 12, 2015, we announced that our Board of Directors had increased the authorization to repurchase our common stock by 25 million shares as part of an ongoing share repurchase program. At year-end
2015
,
14.4 million
shares remained available for repurchase under previous authorizations.
In addition, on
February 11, 2016
, we announced that our Board of Directors further increased our common stock repurchase authorization by
25 million
shares. We repurchase shares in the open market and in privately negotiated transactions.
|
22
The following table presents a summary of our selected historical financial data derived from our last 10 years of Financial Statements. Because this information is only a summary and does not provide all of the information contained in our Financial Statements, including the related notes, you should read “Management’s Discussion and Analysis of Financial Condition and Results of Operations” and our Financial Statements for each year for more detailed information including, among other items, restructuring costs and other charges we incurred in 2008 and 2009, timeshare strategy-impairment charges we incurred in 2009 and 2011, and our 2011 spin-off of our former timeshare operations and timeshare development business. For periods before the 2011 spin-off, we continue to include our former Timeshare segment in our historical financial results as a component of continuing operations because of our significant continuing involvement in MVW’s future operations.
|
|
Fiscal Year
(1)
|
||||||||||||||||||||||||||||||||||||||
|
($ in millions, except per share data)
|
2015
|
2014
|
2013
|
2012
|
2011
|
2010
|
2009
|
2008
|
2007
|
2006
|
|||||||||||||||||||||||||||||
|
Income Statement Data:
|
|
||||||||||||||||||||||||||||||||||||||
|
Revenues
(2)
|
$
|
14,486
|
|
$
|
13,796
|
|
$
|
12,784
|
|
$
|
11,814
|
|
$
|
12,317
|
|
$
|
11,691
|
|
$
|
10,908
|
|
$
|
12,879
|
|
$
|
12,990
|
|
$
|
11,995
|
|
|||||||||
|
Operating income (loss)
(2)
|
$
|
1,350
|
|
$
|
1,159
|
|
$
|
988
|
|
$
|
940
|
|
$
|
526
|
|
$
|
695
|
|
$
|
(152
|
)
|
$
|
765
|
|
$
|
1,183
|
|
$
|
1,089
|
|
|||||||||
|
Income (loss) from continuing operations attributable to Marriott
|
$
|
859
|
|
$
|
753
|
|
$
|
626
|
|
$
|
571
|
|
$
|
198
|
|
$
|
458
|
|
$
|
(346
|
)
|
$
|
359
|
|
$
|
697
|
|
$
|
712
|
|
|||||||||
|
Cumulative effect of change in accounting principle
(3)
|
—
|
|
—
|
|
—
|
|
—
|
|
—
|
|
—
|
|
—
|
|
—
|
|
—
|
|
(109
|
)
|
|||||||||||||||||||
|
Discontinued operations
(4)
|
—
|
|
—
|
|
—
|
|
—
|
|
—
|
|
—
|
|
—
|
|
3
|
|
(1
|
)
|
5
|
|
|||||||||||||||||||
|
Net income (loss) attributable to Marriott
|
$
|
859
|
|
$
|
753
|
|
$
|
626
|
|
$
|
571
|
|
$
|
198
|
|
$
|
458
|
|
$
|
(346
|
)
|
$
|
362
|
|
$
|
696
|
|
$
|
608
|
|
|||||||||
|
Per Share Data
(5)
:
|
|
||||||||||||||||||||||||||||||||||||||
|
Diluted earnings (losses) per share from continuing operations attributable to Marriott shareholders
|
$
|
3.15
|
|
$
|
2.54
|
|
$
|
2.00
|
|
$
|
1.72
|
|
$
|
0.55
|
|
$
|
1.21
|
|
$
|
(0.97
|
)
|
$
|
0.97
|
|
$
|
1.73
|
|
$
|
1.64
|
|
|||||||||
|
Diluted losses per share from cumulative effect of accounting change
|
—
|
|
—
|
|
—
|
|
—
|
|
—
|
|
—
|
|
—
|
|
—
|
|
—
|
|
(0.25
|
)
|
|||||||||||||||||||
|
Diluted earnings per share from discontinued operations attributable to Marriott shareholders
|
—
|
|
—
|
|
—
|
|
—
|
|
—
|
|
—
|
|
—
|
|
0.01
|
|
—
|
|
0.01
|
|
|||||||||||||||||||
|
Diluted earnings (losses) per share attributable to Marriott shareholders
|
$
|
3.15
|
|
$
|
2.54
|
|
$
|
2.00
|
|
$
|
1.72
|
|
$
|
0.55
|
|
$
|
1.21
|
|
$
|
(0.97
|
)
|
$
|
0.98
|
|
$
|
1.73
|
|
$
|
1.40
|
|
|||||||||
|
Cash dividends declared per share
|
$
|
0.9500
|
|
$
|
0.7700
|
|
$
|
0.6400
|
|
$
|
0.4900
|
|
$
|
0.3875
|
|
$
|
0.2075
|
|
$
|
0.0866
|
|
$
|
0.3339
|
|
$
|
0.2844
|
|
$
|
0.2374
|
|
|||||||||
|
Balance Sheet Data (at year-end):
|
|
||||||||||||||||||||||||||||||||||||||
|
Total assets
(8)
|
$
|
6,082
|
|
$
|
6,833
|
|
$
|
6,794
|
|
$
|
6,342
|
|
$
|
5,910
|
|
$
|
8,983
|
|
$
|
7,933
|
|
$
|
8,903
|
|
$
|
8,942
|
|
$
|
8,588
|
|
|||||||||
|
Long-term debt
(8)
|
3,807
|
|
3,447
|
|
3,147
|
|
2,528
|
|
1,816
|
|
2,691
|
|
2,234
|
|
2,975
|
|
2,790
|
|
1,818
|
|
|||||||||||||||||||
|
Shareholders’ (deficit) equity
|
(3,590
|
)
|
(2,200
|
)
|
(1,415
|
)
|
(1,285
|
)
|
(781
|
)
|
1,585
|
|
1,142
|
|
1,380
|
|
1,429
|
|
2,618
|
|
|||||||||||||||||||
|
Other Data:
|
|
||||||||||||||||||||||||||||||||||||||
|
Base management fees
|
$
|
698
|
|
$
|
672
|
|
$
|
621
|
|
$
|
581
|
|
$
|
602
|
|
$
|
562
|
|
$
|
530
|
|
$
|
635
|
|
$
|
620
|
|
$
|
553
|
|
|||||||||
|
Franchise fees
|
853
|
|
745
|
|
666
|
|
607
|
|
506
|
|
441
|
|
400
|
|
451
|
|
439
|
|
390
|
|
|||||||||||||||||||
|
Incentive management fees
|
319
|
|
302
|
|
256
|
|
232
|
|
195
|
|
182
|
|
154
|
|
311
|
|
369
|
|
281
|
|
|||||||||||||||||||
|
Total fees
|
$
|
1,870
|
|
$
|
1,719
|
|
$
|
1,543
|
|
$
|
1,420
|
|
$
|
1,303
|
|
$
|
1,185
|
|
$
|
1,084
|
|
$
|
1,397
|
|
$
|
1,428
|
|
$
|
1,224
|
|
|||||||||
|
Fee Revenue-Source:
|
|
||||||||||||||||||||||||||||||||||||||
|
North America
(6)
|
$
|
1,458
|
|
$
|
1,319
|
|
$
|
1,186
|
|
$
|
1,074
|
|
$
|
970
|
|
$
|
878
|
|
$
|
806
|
|
$
|
1,038
|
|
$
|
1,115
|
|
$
|
955
|
|
|||||||||
|
Total Outside North America
(7)
|
412
|
|
400
|
|
357
|
|
346
|
|
333
|
|
307
|
|
278
|
|
359
|
|
313
|
|
269
|
|
|||||||||||||||||||
|
Total fees
|
$
|
1,870
|
|
$
|
1,719
|
|
$
|
1,543
|
|
$
|
1,420
|
|
$
|
1,303
|
|
$
|
1,185
|
|
$
|
1,084
|
|
$
|
1,397
|
|
$
|
1,428
|
|
$
|
1,224
|
|
|||||||||
|
(1)
|
In 2013, we changed to a calendar year-end reporting cycle. All fiscal years presented before 2013 included 52 weeks, except for 2008 which included 53 weeks.
|
|
(2)
|
Balances do not reflect the impact of discontinued operations. Also, for periods prior to 2009, we reclassified our provision for loan losses associated with our lodging operations to the “General, administrative, and other” caption of our Income Statements to conform to our presentation for periods beginning in 2009. This reclassification only affected operating income.
|
|
(3)
|
We adopted certain provisions of Accounting Standards Certification Topic 978 (previously Statement of Position 04-2, “Accounting for Real Estate Time Sharing Transactions”), in 2006, which we reported in our Income Statements as a cumulative effect of change in accounting principle.
|
|
(4)
|
The following businesses became discontinued operations in the year we announced that we would sell or exit them: synthetic fuel (2007).
|
|
(5)
|
We issued stock dividends in the third and fourth quarters of 2009, and a stock split in the form of a stock dividend on June 9, 2006. We have adjusted all per share data retroactively to reflect those stock dividends.
|
|
(6)
|
Represents fee revenue from the United States (but not Hawaii before 2011) and Canada.
|
|
(7)
|
Represents fee revenue outside of North America, as defined in footnote (6) above.
|
|
(8)
|
Effective year-end 2014, we adopted ASU No. 2015-03, which changes the presentation of debt issuance costs, and ASU No. 2015-17, which changes the classification of deferred taxes. Prior periods have not been adjusted for these new accounting standards.
|
23
|
Item 7.
|
Management’s Discussion and Analysis of Financial Condition and Results of Operations.
|
BUSINESS AND OVERVIEW
Overview
We are a worldwide operator, franchisor, and licensor of hotels and timeshare properties in
87
countries and territories under 19 brand names. We also develop, operate, and market residential properties and provide services to home/condominium owner associations. Under our business model, we typically manage or franchise hotels, rather than own them. We group our operations into
three
business segments:
North American Full-Service
,
North American Limited-Service
, and
International
.
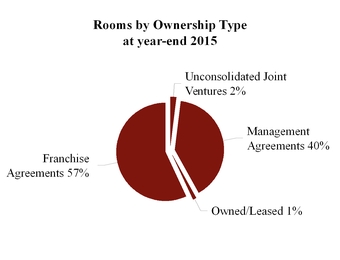
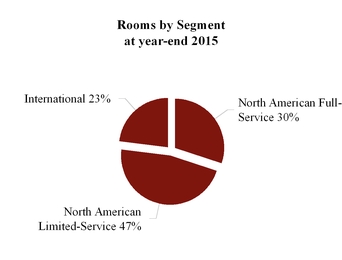
We earn base management fees and in many cases incentive management fees from the properties that we manage, and we earn franchise fees on the properties that others operate under franchise agreements with us. Base fees typically consist of a percentage of property-level revenue while incentive fees typically consist of a percentage of net house profit adjusted for a specified owner return. Net house profit is calculated as gross operating profit (house profit) less non-controllable expenses such as insurance, real estate taxes, and capital spending reserves.
Our emphasis on long-term management contracts and franchising tends to provide more stable earnings in periods of economic softness, while adding new hotels to our system generates growth, typically with little or no investment by the Company. This strategy has driven substantial growth while minimizing financial leverage and risk in a cyclical industry. In addition, we believe minimizing our capital investments and adopting a strategy of recycling the investments that we do make maximizes and maintains our financial flexibility.
We remain focused on doing the things that we do well; that is, selling rooms, taking care of our guests, and making sure we control costs both at company-operated properties and at the corporate level (“above-property”). Our brands remain strong as a result of skilled management teams, dedicated associates, superior customer service with an emphasis on guest and associate satisfaction, significant distribution, our Marriott Rewards and The Ritz-Carlton Rewards loyalty programs, a multichannel reservations system, and desirable property amenities. We strive to effectively leverage our size and broad distribution.
We, along with owners and franchisees, continue to invest in our brands by means of new, refreshed, and reinvented properties, new room and public space designs, and enhanced amenities and technology offerings. We address, through various means, hotels in our system that do not meet standards. We continue to enhance the appeal of our proprietary, information-rich, and easy-to-use website, Marriott.com, and of our associated mobile smartphone applications and mobile website that connect to Marriott.com, through functionality and service improvements, and we expect to continue capturing an increasing proportion of property-level reservations via this cost-efficient channel.
Our profitability, as well as that of owners and franchisees, has benefited from our approach to property-level and above-property productivity. Properties in our system continue to maintain very tight cost controls. We also control above-property costs, some of which we allocate to hotels, by remaining focused on systems, processing, and support areas.
24
Pending Combination with Starwood Hotels & Resorts Worldwide, Inc.
On November 15, 2015, we entered into an Agreement and Plan of Merger (the “Merger Agreement”) to combine with Starwood Hotels & Resorts Worldwide, Inc. (“Starwood”). The Merger Agreement provides for the Company to combine with Starwood in a series of transactions after which Starwood will be an indirect wholly owned subsidiary of the Company (the “Starwood Combination”). If these transactions are completed, shareholders of Starwood will receive 0.920 shares of our Class A Common Stock, par value $0.01 per share, and $2.00 in cash, without interest, for each share of Starwood common stock, par value $0.01 per share, that they own immediately before these transactions. We expect that the combination will close in mid-2016, after customary conditions are satisfied, including shareholder approvals, required antitrust approvals, and the completion of Starwood’s previously announced spin-off of its vacation ownership business, or another spin-off, split-off, analogous disposition, or sale of its vacation ownership business.
Performance Measures
We believe Revenue per Available Room (“RevPAR”), which we calculate by dividing room sales for comparable properties by room nights available for the period, is a meaningful indicator of our performance because it measures the period-over-period change in room revenues for comparable properties. RevPAR may not be comparable to similarly titled measures, such as revenues. We also believe occupancy and average daily rate (“ADR”), which are components of calculating RevPAR, are meaningful indicators of our performance. Occupancy, which we calculate by dividing occupied rooms by total rooms available, measures the utilization of a property’s available capacity. ADR, which we calculate by dividing property room revenue by total rooms sold, measures average room price and is useful in assessing pricing levels.
References to year-end
2015
RevPAR statistics throughout this report, including occupancy and ADR, reflect the twelve months ended December 31,
2015
, as compared to the twelve months ended December 31,
2014
. For the properties located in countries that use currencies other than the U.S. dollar, the comparisons to the prior year period are on a constant U.S. dollar basis. We calculate constant dollar statistics by applying exchange rates for the current period to the prior comparable period.
We define our comparable properties as those that were open and operating under one of our brands since the beginning of the last full calendar year (since January 1, 2014 for the current period), and have not, in either the current or previous year: (i) undergone significant room or public space renovations or expansions, (ii) been converted between company-operated and franchised, or (iii) sustained substantial property damage or business interruption. Comparable properties represented the following percentages of our properties for each year indicated: (1) 86% of North American properties (87% excluding Delta Hotels and Resorts) in
2015
, 87% in
2014
, and 89% in
2013
; (2) 57% of International properties (68% excluding Protea Hotels) in
2015
, 57% (71% excluding Protea Hotels) in
2014
, and 75% in
2013
; and (3) 82% of total properties (85% excluding Protea Hotels and Delta Hotels and Resorts) in
2015
, 82% of total properties (85% excluding Protea Hotels) in
2014
, and 87% in
2013
.
We also believe company-operated house profit margin, which is the ratio of property-level gross operating profit to total property-level revenue, is a meaningful indicator of our performance because this ratio measures our overall ability as the operator to produce property-level profits by generating sales and controlling the operating expenses over which we have the most direct control. House profit includes room, food and beverage, and other revenue and the related expenses including payroll and benefits expenses, as well as repairs and maintenance, utility, general and administrative, and sales and marketing expenses. House profit does not include the impact of management fees, furniture, fixtures and equipment replacement reserves, insurance, taxes, or other fixed expenses.
Business Trends
Our
2015
results reflected a favorable economic climate and demand for our brands in many markets around the world, reflecting generally low supply growth in the U.S. and Europe, moderate GDP growth in North America, improved pricing in most North American markets, and a year-over-year increase in the number of properties in our system. Comparable worldwide systemwide RevPAR for
2015
increased
5.2 percent
to
$112.25
, average daily rates increased
4.1 percent
on a constant dollar basis to
$152.30
, and occupancy increased
0.8
percentage points to
73.7
percent, compared to
2014
.
Generally strong U.S. group business and transient demand contributed to increased room rate growth in
2015
, allowing us to eliminate discounts, shift business into higher rated price categories, and raise room rates. The growth was partially constrained by new select-service lodging supply and moderating GDP growth late in the year.
In
2015
, bookings for future group business in the U.S. improved. New group business booked in 2015 for any period in the future increased 9 percent year over year. The
2016
group revenue pace for systemwide full-service hotels (Marriott, JW Marriott, Renaissance, The Ritz-Carlton, and Gaylord brands) in North America was up more than 6 percent as of year-end
2015
, compared to the
2015
group booking pace measured as of year-end
2014
. In North America, RevPAR from transient
25
guests increased 5 percent in
2015
reflecting strong demand from professional services, technology, and defense firms moderated somewhat by weaker demand from manufacturing, pharmaceutical, and energy companies.
The Europe region experienced higher demand in
2015
across most countries, primarily due to increased group and transient business driven by special events and the weak currency, partially constrained by weaker demand in France, particularly late in the year. Results improved in Russia due to increased domestic travel. In the Asia Pacific region, demand increased led by growth from corporate and other transient business in Japan, India, Thailand, and Indonesia. The growth was partially offset by weaker results in South Korea. RevPAR in Greater China moderated in 2015 due to the impact of supply growth in certain Southern China markets, continued austerity in Beijing, and lower inbound travel to Hong Kong, while demand in Shanghai remained strong. Middle East demand was weaker in 2015, reflecting the region’s instability and lower oil prices, partially offset by strong government and group demand in Saudi Arabia. Demand in the United Arab Emirates was constrained mainly by new supply and, to a lesser extent, a reduction in travelers from Russia. In Africa, results were favorable in 2015. In the Caribbean and Latin America, strong performance in the region in 2015 was driven by greater demand in Mexico and increased leisure travel to our Caribbean and Mexican resorts for most of the year, constrained somewhat by oversupply of hotels in Panama and weaker economies in Brazil and Puerto Rico.
We monitor market conditions and provide the tools for our hotels to price rooms daily in accordance with individual property demand levels, generally adjusting room rates as demand changes. Our hotels modify the mix of business to improve revenue as demand changes. Demand for higher rated rooms improved in most markets in 2015, which allowed our hotels to reduce discounting and special offers for transient business in many markets. This mix improvement benefited ADR. For our company-operated properties, we continue to focus on enhancing property-level house profit margins and making productivity improvements.
CONSOLIDATED RESULTS
The following discussion presents an analysis of results of our operations for
2015
,
2014
, and
2013
.
Revenues
2015 Compared to 2014
|
($ in millions)
|
December 31,
2015 |
December 31,
2014 |
Increase (decrease) from prior year
|
Percentage change from prior year
|
||||||||||
|
Base management fees
|
$
|
698
|
|
$
|
672
|
|
$
|
26
|
|
4
|
%
|
|||
|
Franchise fees
|
853
|
|
745
|
|
108
|
|
14
|
%
|
||||||
|
Incentive management fees
|
319
|
|
302
|
|
17
|
|
6
|
%
|
||||||
|
1,870
|
|
1,719
|
|
151
|
|
9
|
%
|
|||||||
|
Owned, leased, and other revenue
|
986
|
|
1,022
|
|
(36
|
)
|
(4
|
)%
|
||||||
|
Cost reimbursements
|
11,630
|
|
11,055
|
|
575
|
|
5
|
%
|
||||||
|
$
|
14,486
|
|
$
|
13,796
|
|
$
|
690
|
|
5
|
%
|
||||
The
$26 million
increase in base management fees reflected stronger RevPAR ($29 million) and the impact of unit growth across our system ($25 million),
partially offset by the impact of unfavorable foreign exchange rates ($11 million), lower fees due to properties that converted from managed to franchised ($7 million), and decreased recognition of previously deferred fees ($8 million).
The
$108 million
increase in total franchise fees reflected the impact of unit growth across our system ($55 million), stronger RevPAR due to increased demand ($31 million), increased relicensing and application fees ($22 million), and higher fees from properties that converted to franchised from managed ($7 million), partially offset by the impact of unfavorable foreign exchange rates ($7 million).
The
$17 million
increase in incentive management fees reflected higher RevPAR and house profit margins primarily at company-managed North American properties, particularly at a few large portfolios of managed hotels whose improved net house profits allowed them to reach their owners priority threshold and begin to record incentive fees. Higher incentive fees also reflected the addition of hotels included in the Delta Hotels and Resorts acquisition, partially offset by $15 million in unfavorable foreign exchange rates and $7 million of lower incentive fees from properties under renovation.
The
$36 million
decrease
in owned, leased, and other revenue reflected $44 million of lower owned and leased revenue, partially offset by $8 million in higher other revenue predominantly from branding fees and hotel service programs that we
26
acquired as part of our acquisition of Protea Hotels in the 2014 second quarter. Lower owned and leased revenue reflected net weaker performance impacted by unfavorable foreign exchange rates, a decrease of $27 million attributable to properties that converted to managed or franchised or left our system, and $16 million net unfavorable impact of properties under renovation, partially offset by increases of $10 million from Protea Hotel leases we acquired in the 2014 second quarter and $6 million from The Miami Beach EDITION hotel, which opened in the 2014 fourth quarter and which we subsequently sold in the 2015 first quarter as discussed in Footnote No.
3
, “
Acquisitions and Dispositions
.”
Cost reimbursements revenue represents reimbursements of costs incurred on behalf of managed and franchised properties and relates, predominantly, to payroll costs at managed properties where we are the employer but also includes reimbursements for other costs, such as those associated with our rewards programs, reservations, and marketing programs. As we record cost reimbursements based upon costs incurred with no added markup, this revenue and related expense has no impact on either our operating or net income. The
$575 million
increase in total cost reimbursements revenue reflected the impact of higher occupancies and growth across our system. Since the end of 2014, our managed rooms increased by
12,668
rooms and our franchised rooms increased by
31,883
rooms, net of rooms at hotels exiting our system.
2014 Compared to 2013
|
($ in millions)
|
December 31,
2014 |
December 31,
2013 |
Increase from prior year
|
Percentage change from prior year
|
||||||||||
|
Base management fees
|
$
|
672
|
|
$
|
621
|
|
$
|
51
|
|
8
|
%
|
|||
|
Franchise fees
|
745
|
|
666
|
|
79
|
|
12
|
%
|
||||||
|
Incentive management fees
|
302
|
|
256
|
|
46
|
|
18
|
%
|
||||||
|
1,719
|
|
1,543
|
|
176
|
|
11
|
%
|
|||||||
|
Owned, leased, and other revenue
|
1,022
|
|
950
|
|
72
|
|
8
|
%
|
||||||
|
Cost reimbursements
|
11,055
|
|
10,291
|
|
764
|
|
7
|
%
|
||||||
|
$
|
13,796
|
|
$
|
12,784
|
|
$
|
1,012
|
|
8
|
%
|
||||
The $51 million increase in total base management fees, largely reflected stronger RevPAR due to increased demand ($34 million), the impact of unit growth across our system ($21 million),
and increased recognition of previously deferred fees ($16 million), partially offset by a decrease in fees from terminated units ($8 million), decreased fees due to properties that converted from managed to franchised ($8 million), unfavorable foreign exchange rates ($6 million), and three fewer days of activity ($2 million).
The $79 million increase in total franchise fees, reflected stronger RevPAR due to increased demand ($35 million), new unit growth across our system ($35 million), increased relicensing fees ($10 million), and fees from properties that converted to franchised from managed ($7 million), partially offset by a decrease in fees from terminated units ($4 million) and three fewer days of activity ($3 million).
The $46 million increase in incentive management fees largely reflected higher net house profit at our North American and International managed hotels in addition to unit growth in International markets, partially offset by the impact of unfavorable foreign exchange rates ($5 million) and higher North American Full-Service deferred fees recognized in 2013 ($5 million). We estimate that the three fewer days of activity in 2014 compared to 2013 reduced fee revenues by approximately $5 million.
The $72 million increase in owned, leased, and other revenue, predominantly reflected $56 million of higher owned and leased revenue, $17 million in revenue from various Protea Hotels programs, $9 million in higher branding fees, and $2 million in other program revenue, partially offset by $14 million lower termination fee revenue in 2014. Higher owned and leased revenue reflected $43 million from Protea Hotel leases associated with the acquisition, $30 million in revenue from a North American Full-Service managed property that we acquired in the 2013 fourth quarter, and stronger performance across our new and existing owned and leased International properties, partially offset by $37 million attributable to five International properties that converted to managed or franchised properties. Combined branding fees for credit card endorsements and the sale of branded residential real estate by others totaled $127 million in 2014 and $118 million in 2013.
The $764 million increase in total cost reimbursements revenue reflected the impact of higher occupancies at our properties and growth across our system.
27
Operating Income
2015 Compared to 2014
Operating income increased by
$191 million
to
$1,350 million
in
2015
from
$1,159 million
in
2014
. The
$191 million
increase in operating income reflected a
$108 million
increase in franchise fees, a
$26 million
increase in base management fees, a
$25 million
decrease in general, administrative, and other expenses, a
$17 million
increase in incentive management fees, a
$9 million
decrease in depreciation, amortization, and other expense, and
$6 million
of higher owned, leased, and other revenue, net of direct expenses. We discuss the reasons for the increases in base management fees, franchise fees, and incentive management fees compared to
2014
in the preceding “Revenues” section.
The
$6 million
(
2 percent
) increase in owned, leased, and other revenue, net of direct expenses was largely attributable to $4 million in higher branding fees. Owned and leased revenue, net of direct expenses was unchanged as stronger results at several of our International properties, including $4 million of lower lease payments for properties that moved to managed, franchised, or left our system, were offset by $10 million of weaker performance due to renovations.
Depreciation, amortization and other expense decreased by
$9 million
(
6 percent
) to
$139 million
in
2015
from
$148 million
in
2014
. The decrease reflected a $25 million favorable variance to the 2014 impairment charge on the EDITION hotels, partially offset by the 2015 impairment charges of $6 million for The Miami Beach EDITION residences and $6 million for The New York (Madison Square Park) EDITION, which are both discussed in Footnote No.
3
, “
Acquisitions and Dispositions
,” and
a $4 million impairment charge on corporate equipment.
General, administrative, and other expenses decreased by
$25 million
(
4 percent
) to
$634 million
in
2015
from
$659 million
in
2014
. The decrease largely reflected a $28 million net favorable impact to our legal expenses associated with litigation resolutions, $24 million of development costs that we deferred in 2015 related to our growing franchise pipeline, and $5 million in lower foreign exchange losses compared to the 2014 devaluation of assets denominated in Venezuelan Bolivars, partially offset by $20 million of higher costs incurred to grow our brands globally, $5 million of transaction costs related to the Starwood Combination, and $5 million from the Delta Hotels and Resorts acquisition.
2014 Compared to 2013
Operating income increased by $171 million to $1,159 million in 2014 from $988 million in 2013. The $171 million increase in operating income reflected a $79 million increase in franchise fees, a $51 million increase in base management fees, a $46 million increase in incentive management fees, and $26 million of higher owned, leased, and other revenue, net of direct expenses, partially offset by a $21 million increase in depreciation, amortization, and other expense, and a $10 million increase in general, administrative, and other expenses. We discuss the reasons for the increases in base management fees, franchise fees, and incentive management fees compared to 2013 in the preceding “Revenues” section.
The $26 million (12 percent) increase in owned, leased, and other revenue, net of direct expenses was largely attributable to $23 million of higher owned and leased revenue, net of direct expenses, $9 million in higher branding fees, $4 million from various programs at Protea Hotels, and $2 million in other program revenue, partially offset by $14 million in higher termination fees in 2013. Higher owned and leased revenue, net of direct expenses of $23 million primarily reflects $14 million in net favorable results at several leased properties, $10 million of revenue, net of direct expenses for a North American Full-Service managed property that we acquired in the 2013 fourth quarter, and $7 million of revenue, net of direct expenses for new Protea Hotel leases, partially offset by $6 million attributable to International properties that converted to managed or franchised.
Depreciation, amortization and other expense increased by $21 million (17 percent) to $148 million in 2014 from $127 million in 2013. The increase reflected the $25 million net impairment charge on the EDITION hotels discussed in Footnote No.
3
, “
Acquisitions and Dispositions
,” $5 million in accelerated amortization related to contract terminations, $5 million in higher contract amortization primarily from Protea Hotels, and $3 million in higher depreciation related to a North American Full-Service property that we acquired in the 2013 fourth quarter, partially offset by $13 million of accelerated amortization related to contract terminations in 2013 and $5 million of 2013 depreciation for two International properties that converted to managed contracts.
General, administrative, and other expenses increased by $10 million (2 percent) to $659 million in 2014 from $649 million in 2013. The increase largely reflected $9 million from the addition of Protea Hotels and related transition costs, $7 million from net unfavorable foreign exchange rates, primarily from the devaluation of assets denominated in Venezuelan Bolivars, and $6 million of increased guarantee funding, partially offset by $8 million litigation settlements recognized in 2013, and a $5 million performance cure payment in 2013 for an International property.
28
Gains and Other Income, Net
2015 Compared to 2014
Gains and other income, net increased by
$19 million
(
238 percent
) to
$27 million
in
2015
compared to
$8 million
in
2014
. The increase primarily reflects the $41 million gain on the redemption of our preferred equity ownership interest, discussed in Footnote No.
14
, “
Fair Value of Financial Instruments
.” The increase was partially offset by an $11 million disposal loss for an International property and a $4 million expected disposal loss for a North American Limited-Service segment plot of land, both discussed in Footnote No.
3
, “
Acquisitions and Dispositions
.”
2014 Compared to 2013
Gains and other income, net decreased by $3 million (27 percent) to $8 million in 2014 compared to $11 million in 2013. This decrease in gains and other income, net reflected a gain of $8 million on the sale of a portion of our shares of a publicly traded company in the 2013 second quarter, partially offset by $4 million in net distribution from cost method investments (not allocated to any of our segments) in 2014.
Interest Expense
2015 Compared to 2014
Interest expense increased by
$52 million
(
45 percent
) to
$167 million
in
2015
compared to
$115 million
in
2014
. The increase was due to net lower capitalized interest expense as a result of the completion of The Miami Beach EDITION in the 2014 fourth quarter and The New York (Madison Square Park) EDITION in the 2015 second quarter ($25 million), interest on the Series O Notes and Series P Notes that we issued in the 2015 third quarter and the Series N Notes that we issued in the 2014 fourth quarter ($17 million), and an unfavorable variance to the 2014 debt premium accretion true-up ($7 million).
2014 Compared to 2013
Interest expense decreased by $5 million (4 percent) to $115 million in 2014 compared to $120 million in 2013. This decrease was principally from $8 million in higher debt premium accretion which included a true-up, $2 million in lower interest on an exited lease obligation, $2 million decrease due to lower interest rates on our Marriott Rewards program, and a $2 million increase in capitalized interest primarily related to development of EDITION hotels in Miami Beach and New York, offset by completion of The London EDITION in the 2013 fourth quarter. This was partially offset by a net $8 million increase due to the issuance of higher net senior note borrowings.
Interest Income
2015 Compared to 2014
Interest income decreased by
$1 million
(
3 percent
) to
$29 million
in
2015
compared to
$30 million
in
2014
. This decrease was primarily due to lower interest income on the preferred equity ownership interest that was redeemed in the 2015 second quarter ($5 million), partially offset by higher interest income on the $85 million mezzanine loan (net of a $15 million discount) we provided to an owner in conjunction with entering into a franchise agreement for an International property in the 2014 second quarter ($5 million).
2014 Compared to 2013
Interest income increased by $7 million (30 percent) to $30 million in 2014 compared to $23 million in 2013. The increase was primarily due to $6 million earned on the $85 million mezzanine loan (net of a $15 million discount) provided to an owner in conjunction with entering into a franchise agreement for an International property in the 2014 second quarter, and $2 million earned on the mandatorily redeemable preferred equity ownership interest acquired in the 2013 second quarter. See Footnote No.
13
, “
Notes Receivable
” for more information on the mezzanine loan.
Equity in Earnings (Losses)
2015 Compared to 2014
Equity in earnings of
$16 million
in
2015
increased by
$10 million
from equity in earnings of
$6 million
in
2014
. The increase reflects a $22 million year-over-year impact from the reversal in 2015 of an $11 million litigation reserve that was recorded in 2014 and associated with an equity investment and a $5 million benefit recorded in 2015 following an adjustment to an International investee’s liabilities. The increase was partially offset by a $6 million impairment charge relating to an
29
International joint venture and an unfavorable variance to a $9 million benefit recorded in 2014 for two of our International investments, following the reversal of their liabilities associated with a tax law change in a country in which they operate.
2014 Compared to 2013
Equity in earnings of $6 million in 2014 improved by $11 million from equity in losses of $5 million in 2013. The increase was driven by a $9 million reversal of deferred tax liabilities associated with a tax law change in a country in which two of our International joint ventures operate, $9 million in higher earnings from three of our International and one of our North American Full-Service joint ventures, and a favorable variance from a $4 million impairment charge in the 2013 second quarter associated with a corporate investment (not allocated to any of our segments) that we determined was fully impaired because we do not expect to recover the investment. This was partially offset by an $11 million litigation reserve associated with another equity investment discussed above (not allocated to any of our segments).
Provision for Income Tax
2015 Compared to 2014
Our tax provision increased by
$61 million
(
18 percent
) to
$396 million
in
2015
from
$335 million
in
2014
. The increase was primarily due to higher pre-tax earnings and unfavorable comparisons to the 2014 resolution of a U.S. federal tax issue relating to a guest marketing program, the 2014 release of an international valuation allowance, and the 2014 resolution of an international financing activity tax issue. The increase was partially offset by a favorable IRS settlement relating to share-based compensation ($12 million), a tax benefit from an International property disposition ($7 million), and a favorable comparison to the 2014 tax on unrealized foreign exchange gains that were taxed within a foreign jurisdiction ($5 million).
2014 Compared to 2013
Our tax provision increased by $64 million (24 percent) to $335 million in 2014 from $271 million in 2013. The increase was primarily due to higher pre-tax earnings, unrealized foreign exchange gains that were taxed within a foreign jurisdiction, and non-recurring favorable foreign true-ups in 2013. The increase was partially offset by the favorable resolution of a U.S. federal tax issue relating to a guest marketing program ($21 million), the release of an international valuation allowance ($7 million), and the resolution of an international financing activity tax issue ($5 million).
Adjusted Earnings Before Interest Expense, Taxes, Depreciation and Amortization (“Adjusted EBITDA”)
Earnings Before Interest Expense, Taxes, Depreciation and Amortization (“EBITDA”), a financial measure not required by, or presented in accordance with, U.S. generally accepted accounting principles (“GAAP”), reflects net income excluding the impact of interest expense, provision for income taxes, and depreciation and amortization. Our non-GAAP measure of Adjusted EBITDA further adjusts EBITDA to exclude (1) the pre-tax EDITION impairment charges of $12 million in 2015 and $25 million in 2014, which we recorded in the “Depreciation, amortization, and other” caption of our Income Statements following an evaluation of our EDITION hotels and residences for recovery; (2) the $15 million pre-tax loss on dispositions of real estate, which we recorded in the “Gains and other income, net” caption of our Income Statements in 2015; (3) the $41 million pre-tax gain triggered by a mandatory redemption feature of a preferred equity investment in 2015; and (4) share-based compensation expense for all periods presented.
We believe that Adjusted EBITDA is a meaningful indicator of our operating performance because it permits period-over-period comparisons of our ongoing core operations before the excluded items and facilitates our comparison of results before these items with results from other lodging companies, and because it excludes certain items that can vary widely across different industries or among companies within the lodging industry. For example, interest expense can be dependent on a company’s capital structure, debt levels, and credit ratings, and accordingly interest expense’s impact on earnings varies significantly among companies. Similarly, tax positions will vary among companies as a result of their differing abilities to take advantage of tax benefits and the tax policies of the jurisdictions in which they operate. As a result, effective tax rates and provision for income taxes can vary considerably among companies. Our Adjusted EBITDA also excludes depreciation and amortization expense which we report under “Depreciation, amortization, and other,” as well as depreciation included under “Reimbursed costs” in our Income Statements, because companies utilize productive assets of different ages and use different methods of both acquiring and depreciating productive assets. These differences can result in considerable variability in the relative costs of productive assets and the depreciation and amortization expense among companies. We also exclude share-based compensation expense to address the considerable variability among companies in recording compensation expense because companies use share-based payment awards differently, both in the type and quantity of awards granted.
Adjusted EBITDA has limitations and should not be considered in isolation or a substitute for performance measures calculated under GAAP. This non-GAAP measure excludes certain cash expenses that we are obligated to make. In addition,
30
other companies in our industry may calculate Adjusted EBITDA differently than we do or may not calculate it at all, which limits the usefulness of Adjusted EBITDA as a comparative measure.
We present our
2015
and
2014
Adjusted EBITDA calculations that reflect the changes we describe above and reconcile this measure with Net Income in the following table:
|
($ in millions)
|
2015
|
2014
|
|||||
|
Net Income
|
$
|
859
|
|
$
|
753
|
|
|
|
Interest expense
|
167
|
|
115
|
|
|||
|
Tax provision
|
396
|
|
335
|
|
|||
|
Depreciation and amortization
|
127
|
|
123
|
|
|||
|
Depreciation classified in Reimbursed costs
|
58
|
|
51
|
|
|||
|
Interest expense from unconsolidated joint ventures
|
2
|
|
3
|
|
|||
|
Depreciation and amortization from unconsolidated joint ventures
|
10
|
|
10
|
|
|||
|
EBITDA
|
$
|
1,619
|
|
$
|
1,390
|
|
|
|
EDITION impairment charge
|
12
|
|
25
|
|
|||
|
Loss on dispositions of real estate
|
15
|
|
—
|
|
|||
|
Gain on redemption of preferred equity ownership interest
|
(41
|
)
|
—
|
|
|||
|
Share-based compensation (including share-based compensation reimbursed by third-party owners)
|
113
|
|
109
|
|
|||
|
Adjusted EBITDA
|
$
|
1,718
|
|
$
|
1,524
|
|
|
BUSINESS SEGMENTS
We are a diversified global lodging company with operations in three reportable business segments: North American Full-Service, North American Limited-Service, and International. See Footnote No.
16
, “
Business Segments
,” to our Financial Statements for other information about each segment, including revenues and a reconciliation of segment profits to net income.
31
Properties by Segment
At year-end
2015
, we operated, franchised, and licensed the following properties by segment and brand:
|
|
Company-Operated
|
Franchised / Licensed
|
Other
(2)
|
||||||||||||||
|
Properties
|
Rooms
|
Properties
|
Rooms
|
Properties
|
Rooms
|
||||||||||||
|
North American Full-Service
|
|||||||||||||||||
|
Marriott Hotels
|
132
|
|
69,954
|
|
200
|
|
61,556
|
|
—
|
|
—
|
|
|||||
|
JW Marriott
|
15
|
|
9,690
|
|
10
|
|
4,469
|
|
—
|
|
—
|
|
|||||
|
Marriott Conference Centers
|
10
|
|
2,915
|
|
—
|
|
—
|
|
—
|
|
—
|
|
|||||
|
Renaissance Hotels
|
28
|
|
12,229
|
|
54
|
|
15,130
|
|
—
|
|
—
|
|
|||||
|
Autograph Collection Hotels
|
3
|
|
1,065
|
|
52
|
|
12,070
|
|
—
|
|
—
|
|
|||||
|
Delta Hotels and Resorts
|
26
|
|
6,828
|
|
10
|
|
2,557
|
|
—
|
|
—
|
|
|||||
|
Gaylord Hotels
|
5
|
|
8,098
|
|
—
|
|
—
|
|
—
|
|
—
|
|
|||||
|
The Ritz-Carlton
|
39
|
|
11,410
|
|
1
|
|
429
|
|
—
|
|
—
|
|
|||||
|
The Ritz-Carlton Residences
(1)
|
31
|
|
3,757
|
|
1
|
|
55
|
|
—
|
|
—
|
|
|||||
|
EDITION
|
2
|
|
568
|
|
—
|
|
—
|
|
—
|
|
—
|
|
|||||
|
EDITION Residences
(1)
|
1
|
|
25
|
|
—
|
|
—
|
|
—
|
|
—
|
|
|||||
|
Total North American Full-Service
|
292
|
|
126,539
|
|
328
|
|
96,266
|
|
—
|
|
—
|
|
|||||
|
North American Limited-Service
|
|||||||||||||||||
|
Courtyard
|
276
|
|
43,890
|
|
640
|
|
85,151
|
|
—
|
|
—
|
|
|||||
|
Residence Inn
|
111
|
|
16,719
|
|
579
|
|
67,693
|
|
—
|
|
—
|
|
|||||
|
Fairfield Inn & Suites
|
5
|
|
1,324
|
|
756
|
|
68,646
|
|
—
|
|
—
|
|
|||||
|
SpringHill Suites
|
30
|
|
4,720
|
|
306
|
|
35,030
|
|
—
|
|
—
|
|
|||||
|
TownePlace Suites
|
15
|
|
1,740
|
|
255
|
|
25,388
|
|
—
|
|
—
|
|
|||||
|
AC Hotels by Marriott
|
—
|
|
—
|
|
—
|
|
—
|
|
5
|
|
911
|
|
|||||
|
Total North American Limited-Service
|
437
|
|
|
68,393
|
|
|
2,536
|
|
|
281,908
|
|
|
5
|
|
|
911
|
|
|
Total North American Locations
|
729
|
|
|
194,932
|
|
|
2,864
|
|
|
378,174
|
|
|
5
|
|
|
911
|
|
|
International
|
|||||||||||||||||
|
Marriott Hotels
|
145
|
|
41,201
|
|
39
|
|
11,651
|
|
—
|
|
—
|
|
|||||
|
JW Marriott
|
48
|
|
18,789
|
|
4
|
|
1,094
|
|
—
|
|
—
|
|
|||||
|
Marriott Executive Apartments
|
28
|
|
4,181
|
|
—
|
|
—
|
|
—
|
|
—
|
|
|||||
|
Renaissance Hotels
|
53
|
|
17,194
|
|
25
|
|
7,040
|
|
—
|
|
—
|
|
|||||
|
Autograph Collection Hotels
|
3
|
|
584
|
|
32
|
|
8,741
|
|
5
|
|
348
|
|
|||||
|
Protea Hotels
|
47
|
|
5,680
|
|
55
|
|
3,929
|
|
—
|
|
—
|
|
|||||
|
The Ritz-Carlton
|
52
|
|
14,713
|
|
—
|
|
—
|
|
—
|
|
—
|
|
|||||
|
The Ritz-Carlton Residences
(1)
|
8
|
|
416
|
|
—
|
|
—
|
|
—
|
|
—
|
|
|||||
|
The Ritz-Carlton Serviced Apartments
|
4
|
|
579
|
|
—
|
|
—
|
|
—
|
|
—
|
|
|||||
|
Bulgari Hotels & Resorts
|
2
|
|
117
|
|
1
|
|
85
|
|
—
|
|
—
|
|
|||||
|
Bulgari Residences
(1)
|
1
|
|
5
|
|
—
|
|
—
|
|
—
|
|
—
|
|
|||||
|
EDITION
|
1
|
|
173
|
|
1
|
|
78
|
|
—
|
|
—
|
|
|||||
|
Courtyard
|
73
|
|
15,354
|
|
48
|
|
9,022
|
|
—
|
|
—
|
|
|||||
|
Residence Inn
|
5
|
|
517
|
|
2
|
|
200
|
|
—
|
|
—
|
|
|||||
|
Fairfield Inn & Suites
|
5
|
|
716
|
|
2
|
|
386
|
|
—
|
|
—
|
|
|||||
|
AC Hotels by Marriott
|
—
|
|
—
|
|
—
|
|
—
|
|
78
|
|
9,551
|
|
|||||
|
Moxy Hotels
|
—
|
|
—
|
|
1
|
|
162
|
|
—
|
|
—
|
|
|||||
|
Total International
|
475
|
|
|
120,219
|
|
|
210
|
|
|
42,388
|
|
|
83
|
|
|
9,899
|
|
|
Timeshare
(3)
|
—
|
|
—
|
|
58
|
|
12,807
|
|
—
|
|
—
|
|
|||||
|
Total
|
1,204
|
|
|
315,151
|
|
|
3,132
|
|
|
433,369
|
|
|
88
|
|
|
10,810
|
|
|
(1)
|
Represents projects where we manage the related owners’ association. We include residential properties once they possess a certificate of occupancy.
|
|
(2)
|
We present results for all AC Hotels by Marriott properties and five International Autograph Collection properties in the “Equity in earnings (losses)” caption of our Income Statements.
|
|
(3)
|
Timeshare properties licensed by MVW under the Marriott Vacation Club, The Ritz-Carlton Destination Club, The Ritz-Carlton Residences, and Grand Residences by Marriott brand names. Includes products that are in active sales as well as those sold out. MVW reports its property and room counts on a fiscal year basis for the MVW fiscal year ended
January 1, 2016
.
|
32
The following discussion reflects all
three
of our reportable segments. We consider total segment revenues and total segment profits (as defined in Footnote No.
16
, “
Business Segments
”) to be meaningful indicators of our performance because they measure our growth in profitability and enable investors to compare the revenues and profits of our operations to our competitors.
2015 Compared to 2014
We added
300
properties (
51,547
rooms) and
51
properties (
6,328
rooms) exited our system in
2015
.
Total segment revenues increased by
$678 million
to
$14,218 million
in
2015
, a
five percent
increase from revenues of
$13,540 million
in
2014
, and total segment profits increased by
$111 million
to
$1,504 million
in
2015
, an
eight percent
increase from
$1,393 million
in
2014
.
The year-over-year increase in segment revenues of
$678 million
was a result of a
$572 million
increase in cost reimbursements revenue, a
$109 million
increase in franchise fees, a
$26 million
increase in base management fees, and a
$17 million
increase in incentive management fees, partially offset by a
$46 million
decrease in owned, leased, and other revenue. The year-over-year increase of
$111 million
in segment profits reflected a
$109 million
increase in franchise fees, a
$26 million
increase in base management fees, and a
$17 million
increase in incentive management fees, partially offset by a
$20 million
decrease in gains and other income, net, a
$12 million
decrease in equity in earnings, a
$6 million
increase in general, administrative, and other expenses, and a
$3 million
decrease in owned, leased, and other revenue, net of direct expenses. For more information on the variances, see the preceding sections beginning with “Revenues.”
In
2015
, 68 percent of our managed properties paid incentive management fees to us versus 50 percent in
2014
. Managed properties that paid incentive management fees in
2015
represented 63 percent of properties in North America and 74 percent outside of North America, compared to 36 percent in North America and 73 percent outside of North America in
2014
. The percentage of North American properties that paid incentive management fees to us increased compared to 2014 due to a few large North American Limited-Service portfolios of properties that paid incentive management fees in 2015 but did not do so in 2014. In addition, in
2015
, 51 percent of our incentive fees came from properties outside of North America versus 56 percent in
2014
.
Compared to
2014
, worldwide comparable company-operated house profit margins in
2015
increased by
80
basis points and worldwide comparable company-operated house profit per available room (“HP-PAR”) increased by
7.5 percent
on a constant U.S. dollar basis, reflecting higher occupancy, rate increases, improved productivity, and solid cost controls. These same factors contributed to North American company-operated house profit margins increasing by
80
basis points compared to
2014
. HP-PAR at those same properties increased by
7.8 percent
. International company-operated house profit margins increased by
70
basis points, and HP-PAR at those properties increased by
6.9 percent
reflecting increased demand and higher RevPAR in most locations and improved productivity.
See “Statistics” below for detailed information on Systemwide RevPAR and Company-operated RevPAR by segment, region, and brand.
2014 Compared to 2013
We added 311 properties (46,050 rooms) and 52 properties (6,418 rooms) exited our system in 2014. These figures do not include residential units. During 2014, we also added two residential properties (30 units) and no residential properties or units exited our system.
Total segment revenues increased by $1,022 million to $13,540 million in 2014, an 8 percent increase from revenues of $12,518 million in 2013, and total segment profits increased by $196 million to $1,393 million in 2014 from $1,197 million in 2013.
The year-over-year increase in segment revenues of $1,022 million was a result of a $787 million increase in cost reimbursements revenue, an $80 million increase in franchise fees, a $58 million increase in owned, leased, and other revenue, a $51 million increase in base management fees, and a $46 million increase in incentive management fees. The year-over-year increase of $196 million in segment profits reflected an $80 million increase in franchise fees, a $51 million increase in base management fees, a $46 million increase in incentive management fees, $19 million of lower joint venture equity losses, a $11 million increase in owned, leased, and other revenue, net of direct expenses, and $4 million of lower depreciation, amortization, and other expense, partially offset by a $16 million increase in general, administrative, and other expenses. For more information on the variances, see the preceding sections beginning with “Revenues.”
In 2014, 50 percent of our managed properties paid incentive management fees to us versus 38 percent in 2013. Managed properties that paid incentive management fees in 2014 represented 36 percent of properties in North America and 73 percent
33
outside of North America, compared to 21 percent in North America and 70 percent outside of North America in 2013. In addition, in 2014, 56 percent of our incentive fees came from properties outside of North America versus 58 percent in 2013. Further, we earned $24 million in incentive management fees in 2014 from properties that did not earn any incentive management fees in 2013.
Compared to 2013, worldwide comparable company-operated house profit margins in 2014 increased by 120 basis points and HP-PAR increased by 9.7 percent on a constant U.S. dollar basis, reflecting higher occupancy, rate increases, improved productivity, and solid cost controls. These same factors contributed to North American company-operated house profit margins increasing by 150 basis points compared to 2013. HP-PAR at those same properties increased by 11.4 percent. International company-operated house profit margins increased by 70 basis points, and HP-PAR at those properties increased by 6.6 percent reflecting increased demand and higher RevPAR in most locations and improved productivity. Note that 2014 had three fewer days of activity when compared to 2013.
See “Statistics” below for detailed information on Systemwide RevPAR and Company-operated RevPAR by segment, region, and brand.
Development
In
2015
, we added
300
properties with
51,547
rooms across our brands, including 9,590 rooms from the acquisition of Delta Hotels and Resorts, and
51
properties (
6,328
rooms) left our system.
No
residential properties entered or left our system. Highlights of the year included:
|
•
|
Converting
39
properties (
7,301
rooms), or
14 percent
of our gross room additions for the year, to our brands;
|
|
•
|
Adding approximately
32 percent
of all the new rooms outside North America; and
|
|
•
|
Adding
173
properties (
19,712
rooms) to our North American Limited-Service brands.
|
We have over
270,000
hotel rooms in our development pipeline as of year-end
2015
, which includes hotel rooms under construction and under signed contracts, as well as nearly 27,000 hotel rooms approved for development but not yet under signed contracts. We expect the number of our open hotel rooms (gross) to increase approximately 8 percent in 2016. This development pipeline and expected hotel room growth information does not include rooms that will join our system through the Starwood Combination.
We believe that we have access to sufficient financial resources to finance our growth, as well as to support our ongoing operations and meet debt service and other cash requirements. Nonetheless, our ability to develop and update our brands and the ability of hotel developers to build or acquire new Marriott-branded properties, both of which are important parts of our growth plan, depend in part on capital access, availability and cost for other hotel developers and third-party owners. These growth plans are subject to numerous risks and uncertainties, many of which are outside of our control. See the “Forward-Looking Statements” and “Risks and Uncertainties” captions earlier in this report and the “Liquidity and Capital Resources” caption later in this report.
Statistics
The following tables show occupancy, average daily rate, and RevPAR for comparable properties, for each of the brands in our North American Full-Service and North American Limited-Service segments, and for our International properties by region. Systemwide statistics include data from our franchised properties, in addition to our owned, leased, and managed properties.
34
|
|
Comparable Company-Operated
North American Properties |
|
Comparable Systemwide
North American Properties
|
|
||||||||||
|
|
2015
|
|
Change vs. 2014
|
|
2015
|
|
Change vs. 2014
|
|
||||||
|
Marriott Hotels
|
||||||||||||||
|
Occupancy
|
75.4
|
%
|
0.6
|
%
|
pts.
|
72.6
|
%
|
0.6
|
%
|
pts.
|
||||
|
Average Daily Rate
|
$
|
195.28
|
|
3.8
|
%
|
$
|
175.53
|
|
4.2
|
%
|
||||
|
RevPAR
|
$
|
147.33
|
|
4.7
|
%
|
$
|
127.52
|
|
5.0
|
%
|
||||
|
Renaissance Hotels
|
||||||||||||||
|
Occupancy
|
75.2
|
%
|
0.8
|
%
|
pts.
|
73.9
|
%
|
0.8
|
%
|
pts.
|
||||
|
Average Daily Rate
|
$
|
182.13
|
|
4.4
|
%
|
$
|
164.02
|
|
4.3
|
%
|
||||
|
RevPAR
|
$
|
136.91
|
|
5.5
|
%
|
$
|
121.20
|
|
5.4
|
%
|
||||
|
Autograph Collection Hotels
|
||||||||||||||
|
Occupancy
|
*
|
|
*
|
|
pts.
|
77.5
|
%
|
1.1
|
%
|
pts.
|
||||
|
Average Daily Rate
|
*
|
|
*
|
|
$
|
229.90
|
|
1.9
|
%
|
|||||
|
RevPAR
|
*
|
|
*
|
|
$
|
178.16
|
|
3.5
|
%
|
|||||
|
The Ritz-Carlton
|
||||||||||||||
|
Occupancy
|
72.1
|
%
|
(0.1
|
)%
|
pts.
|
72.1
|
%
|
(0.1
|
)%
|
pts.
|
||||
|
Average Daily Rate
|
$
|
359.92
|
|
2.9
|
%
|
$
|
359.92
|
|
2.9
|
%
|
||||
|
RevPAR
|
$
|
259.41
|
|
2.7
|
%
|
$
|
259.41
|
|
2.7
|
%
|
||||
|
Composite North American Full-Service
|
||||||||||||||
|
Occupancy
|
74.9
|
%
|
0.6
|
%
|
pts.
|
73.1
|
%
|
0.6
|
%
|
pts.
|
||||
|
Average Daily Rate
|
$
|
209.72
|
|
3.5
|
%
|
$
|
187.40
|
|
3.8
|
%
|
||||
|
RevPAR
|
$
|
157.10
|
|
4.3
|
%
|
$
|
136.95
|
|
4.6
|
%
|
||||
|
Courtyard
|
||||||||||||||
|
Occupancy
|
72.8
|
%
|
0.7
|
%
|
pts.
|
73.1
|
%
|
0.8
|
%
|
pts.
|
||||
|
Average Daily Rate
|
$
|
139.08
|
|
5.2
|
%
|
$
|
136.58
|
|
5.0
|
%
|
||||
|
RevPAR
|
$
|
101.18
|
|
6.3
|
%
|
$
|
99.88
|
|
6.1
|
%
|
||||
|
Residence Inn
|
||||||||||||||
|
Occupancy
|
78.5
|
%
|
0.4
|
%
|
pts.
|
79.4
|
%
|
0.1
|
%
|
pts.
|
||||
|
Average Daily Rate
|
$
|
143.14
|
|
6.0
|
%
|
$
|
139.51
|
|
5.3
|
%
|
||||
|
RevPAR
|
$
|
112.33
|
|
6.5
|
%
|
$
|
110.75
|
|
5.5
|
%
|
||||
|
Fairfield Inn & Suites
|
||||||||||||||
|
Occupancy
|
nm
|
|
nm
|
|
pts.
|
70.6
|
%
|
0.3
|
%
|
pts.
|
||||
|
Average Daily Rate
|
nm
|
|
nm
|
|
$
|
108.71
|
|
4.2
|
%
|
|||||
|
RevPAR
|
nm
|
|
nm
|
|
$
|
76.70
|
|
4.7
|
%
|
|||||
|
TownePlace Suites
|
||||||||||||||
|
Occupancy
|
72.7
|
%
|
0.1
|
%
|
pts.
|
74.8
|
%
|
0.3
|
%
|
pts.
|
||||
|
Average Daily Rate
|
$
|
102.99
|
|
8.2
|
%
|
$
|
101.83
|
|
4.6
|
%
|
||||
|
RevPAR
|
$
|
74.83
|
|
8.3
|
%
|
$
|
76.15
|
|
5.0
|
%
|
||||
|
SpringHill Suites
|
||||||||||||||
|
Occupancy
|
76.0
|
%
|
1.6
|
%
|
pts.
|
74.8
|
%
|
0.3
|
%
|
pts.
|
||||
|
Average Daily Rate
|
$
|
125.24
|
|
5.1
|
%
|
$
|
118.64
|
|
4.8
|
%
|
||||
|
RevPAR
|
$
|
95.21
|
|
7.5
|
%
|
$
|
88.80
|
|
5.2
|
%
|
||||
|
Composite North American Limited-Service
|
||||||||||||||
|
Occupancy
|
74.5
|
%
|
0.7
|
%
|
pts.
|
74.4
|
%
|
0.5
|
%
|
pts.
|
||||
|
Average Daily Rate
|
$
|
137.92
|
|
5.5
|
%
|
$
|
127.65
|
|
4.9
|
%
|
||||
|
RevPAR
|
$
|
102.76
|
|
6.5
|
%
|
$
|
94.99
|
|
5.6
|
%
|
||||
|
Composite North American - All
|
||||||||||||||
|
Occupancy
|
74.7
|
%
|
0.6
|
%
|
pts.
|
73.9
|
%
|
0.5
|
%
|
pts.
|
||||
|
Average Daily Rate
|
$
|
179.53
|
|
4.2
|
%
|
$
|
148.53
|
|
4.5
|
%
|
||||
|
RevPAR
|
$
|
134.18
|
|
5.0
|
%
|
$
|
109.83
|
|
5.2
|
%
|
||||
* There are no company-operated comparable properties.
nm means not meaningful as the brand is predominantly franchised.
35
|
|
Comparable Company-Operated
Properties |
|
Comparable Systemwide
Properties |
|
||||||||||
|
|
2015
|
Change vs. 2014
|
|
2015
|
Change vs. 2014
|
|
||||||||
|
Caribbean and Latin America
|
||||||||||||||
|
Occupancy
|
72.4
|
%
|
0.2
|
%
|
pts.
|
70.7
|
%
|
0.6
|
%
|
pts.
|
||||
|
Average Daily Rate
|
$
|
248.05
|
|
4.9
|
%
|
$
|
210.46
|
|
3.3
|
%
|
||||
|
RevPAR
|
$
|
179.58
|
|
5.2
|
%
|
$
|
148.86
|
|
4.1
|
%
|
||||
|
Europe
|
||||||||||||||
|
Occupancy
|
75.9
|
%
|
1.7
|
%
|
pts.
|
74.3
|
%
|
1.5
|
%
|
pts.
|
||||
|
Average Daily Rate
|
$
|
173.07
|
|
4.1
|
%
|
$
|
167.63
|
|
4.0
|
%
|
||||
|
RevPAR
|
$
|
131.43
|
|
6.5
|
%
|
$
|
124.59
|
|
6.2
|
%
|
||||
|
Middle East and Africa
|
||||||||||||||
|
Occupancy
|
61.2
|
%
|
2.7
|
%
|
pts.
|
61.6
|
%
|
2.8
|
%
|
pts.
|
||||
|
Average Daily Rate
|
$
|
181.16
|
|
(3.5
|
)%
|
$
|
178.37
|
|
(3.0
|
)%
|
||||
|
RevPAR
|
$
|
110.85
|
|
0.9
|
%
|
$
|
109.80
|
|
1.6
|
%
|
||||
|
Asia Pacific
|
||||||||||||||
|
Occupancy
|
74.1
|
%
|
3.4
|
%
|
pts.
|
74.6
|
%
|
3.2
|
%
|
pts.
|
||||
|
Average Daily Rate
|
$
|
153.83
|
|
—
|
%
|
$
|
155.24
|
|
0.9
|
%
|
||||
|
RevPAR
|
$
|
114.00
|
|
4.7
|
%
|
$
|
115.77
|
|
5.5
|
%
|
||||
|
Total International
(1)
|
||||||||||||||
|
Occupancy
|
72.9
|
%
|
2.3
|
%
|
pts.
|
72.5
|
%
|
2.1
|
%
|
pts.
|
||||
|
Average Daily Rate
|
$
|
176.24
|
|
1.7
|
%
|
$
|
171.20
|
|
2.1
|
%
|
||||
|
RevPAR
|
$
|
128.50
|
|
5.0
|
%
|
$
|
124.13
|
|
5.1
|
%
|
||||
|
Total Worldwide
(2)
|
||||||||||||||
|
Occupancy
|
74.1
|
%
|
1.2
|
%
|
pts.
|
73.7
|
%
|
0.8
|
%
|
pts.
|
||||
|
Average Daily Rate
|
$
|
178.46
|
|
3.4
|
%
|
$
|
152.30
|
|
4.1
|
%
|
||||
|
RevPAR
|
$
|
132.30
|
|
5.0
|
%
|
$
|
112.25
|
|
5.2
|
%
|
||||
|
(1)
|
Includes properties located outside of the United States and Canada for The Ritz-Carlton, Bulgari Hotels & Resorts, EDITION, Autograph Collection Hotels, Renaissance Hotels, Marriott Hotels, Courtyard, Residence Inn, and Fairfield Inn & Suites brands.
|
|
(2)
|
Includes properties worldwide for The Ritz-Carlton, Bulgari Hotels & Resorts, EDITION, Autograph Collection Hotels, Renaissance Hotels, Marriott Hotels, Gaylord Hotels, Courtyard, Residence Inn, SpringHill Suites, Fairfield Inn & Suites, and TownePlace Suites brands.
|
36
|
|
Comparable Company-Operated
North American Properties (1) |
|
Comparable Systemwide
North American Properties (1) |
|
||||||||||
|
|
2014
|
Change vs. 2013
|
|
2014
|
Change vs. 2013
|
|
||||||||
|
Marriott Hotels
|
||||||||||||||
|
Occupancy
|
75.1
|
%
|
1.6
|
%
|
pts.
|
72.6
|
%
|
1.5
|
%
|
pts.
|
||||
|
Average Daily Rate
|
$
|
188.39
|
|
3.5
|
%
|
$
|
171.43
|
|
4.0
|
%
|
||||
|
RevPAR
|
$
|
141.42
|
|
5.7
|
%
|
$
|
124.49
|
|
6.2
|
%
|
||||
|
Renaissance Hotels
|
||||||||||||||
|
Occupancy
|
73.1
|
%
|
1.1
|
%
|
pts.
|
72.6
|
%
|
1.9
|
%
|
pts.
|
||||
|
Average Daily Rate
|
$
|
177.42
|
|
3.7
|
%
|
$
|
160.77
|
|
3.9
|
%
|
||||
|
RevPAR
|
$
|
129.76
|
|
5.2
|
%
|
$
|
116.69
|
|
6.7
|
%
|
||||
|
Autograph Collection Hotels
|
||||||||||||||
|
Occupancy
|
*
|
|
*
|
|
pts.
|
75.4
|
%
|
(1.0
|
)%
|
pts.
|
||||
|
Average Daily Rate
|
*
|
|
*
|
|
$
|
229.58
|
|
8.9
|
%
|
|||||
|
RevPAR
|
*
|
|
*
|
|
$
|
173.04
|
|
7.5
|
%
|
|||||
|
The Ritz-Carlton North America
|
||||||||||||||
|
Occupancy
|
72.9
|
%
|
1.5
|
%
|
pts.
|
72.9
|
%
|
1.5
|
%
|
pts.
|
||||
|
Average Daily Rate
|
$
|
338.48
|
|
4.0
|
%
|
$
|
338.48
|
|
4.0
|
%
|
||||
|
RevPAR
|
$
|
246.89
|
|
6.2
|
%
|
$
|
246.89
|
|
6.2
|
%
|
||||
|
Composite North American Full-Service
|
||||||||||||||
|
Occupancy
|
74.5
|
%
|
1.6
|
%
|
pts.
|
72.8
|
%
|
1.5
|
%
|
pts.
|
||||
|
Average Daily Rate
|
$
|
200.77
|
|
3.6
|
%
|
$
|
182.00
|
|
4.1
|
%
|
||||
|
RevPAR
|
$
|
149.48
|
|
5.8
|
%
|
$
|
132.44
|
|
6.4
|
%
|
||||
|
Residence Inn
|
||||||||||||||
|
Occupancy
|
78.4
|
%
|
2.2
|
%
|
pts.
|
79.3
|
%
|
1.9
|
%
|
pts.
|
||||
|
Average Daily Rate
|
$
|
135.58
|
|
4.4
|
%
|
$
|
130.82
|
|
4.2
|
%
|
||||
|
RevPAR
|
$
|
106.24
|
|
7.4
|
%
|
$
|
103.79
|
|
6.7
|
%
|
||||
|
Courtyard
|
||||||||||||||
|
Occupancy
|
71.8
|
%
|
3.0
|
%
|
pts.
|
72.5
|
%
|
2.3
|
%
|
pts.
|
||||
|
Average Daily Rate
|
$
|
129.72
|
|
5.0
|
%
|
$
|
129.32
|
|
4.5
|
%
|
||||
|
RevPAR
|
$
|
93.18
|
|
9.6
|
%
|
$
|
93.77
|
|
7.8
|
%
|
||||
|
Fairfield Inn & Suites
|
||||||||||||||
|
Occupancy
|
nm
|
|
nm
|
|
pts.
|
70.1
|
%
|
2.2
|
%
|
pts.
|
||||
|
Average Daily Rate
|
nm
|
|
nm
|
|
|
$
|
102.80
|
|
3.9
|
%
|
||||
|
RevPAR
|
nm
|
|
nm
|
|
$
|
72.11
|
|
7.3
|
%
|
|||||
|
TownePlace Suites
|
||||||||||||||
|
Occupancy
|
72.6
|
%
|
6.3
|
%
|
pts.
|
74.7
|
%
|
3.2
|
%
|
pts.
|
||||
|
Average Daily Rate
|
$
|
95.23
|
|
8.7
|
%
|
$
|
96.84
|
|
5.3
|
%
|
||||
|
RevPAR
|
$
|
69.09
|
|
19.0
|
%
|
$
|
72.38
|
|
9.9
|
%
|
||||
|
SpringHill Suites
|
||||||||||||||
|
Occupancy
|
73.8
|
%
|
1.9
|
%
|
pts.
|
74.6
|
%
|
2.6
|
%
|
pts.
|
||||
|
Average Daily Rate
|
$
|
112.14
|
|
4.8
|
%
|
$
|
112.16
|
|
3.9
|
%
|
||||
|
RevPAR
|
$
|
82.78
|
|
7.5
|
%
|
$
|
83.65
|
|
7.6
|
%
|
||||
|
Composite North American Limited-Service
|
||||||||||||||
|
Occupancy
|
73.7
|
%
|
2.8
|
%
|
pts.
|
74.0
|
%
|
2.3
|
%
|
pts.
|
||||
|
Average Daily Rate
|
$
|
128.82
|
|
4.9
|
%
|
$
|
120.36
|
|
4.2
|
%
|
||||
|
RevPAR
|
$
|
94.95
|
|
9.0
|
%
|
$
|
89.11
|
|
7.5
|
%
|
||||
|
Composite North American - All
|
||||||||||||||
|
Occupancy
|
74.2
|
%
|
2.0
|
%
|
pts.
|
73.6
|
%
|
2.0
|
%
|
pts.
|
||||
|
Average Daily Rate
|
$
|
173.11
|
|
3.8
|
%
|
$
|
143.27
|
|
4.1
|
%
|
||||
|
RevPAR
|
$
|
128.39
|
|
6.7
|
%
|
$
|
105.39
|
|
7.0
|
%
|
||||
* There are no company-operated comparable properties.
nm means not meaningful as the brand is predominantly franchised.
|
(1)
|
Statistics include only properties located in the United States.
|
37
|
|
Comparable Company-Operated
Properties (1) |
|
Comparable Systemwide
Properties (1) |
|
||||||||||
|
|
2014
|
Change vs. 2013
|
|
2014
|
Change vs. 2013
|
|
||||||||
|
Caribbean and Latin America
|
||||||||||||||
|
Occupancy
|
73.6
|
%
|
2.7
|
%
|
pts.
|
71.3
|
%
|
2.2
|
%
|
pts.
|
||||
|
Average Daily Rate
|
$
|
239.95
|
|
6.9
|
%
|
$
|
205.88
|
|
5.9
|
%
|
||||
|
RevPAR
|
$
|
176.66
|
|
11.0
|
%
|
$
|
146.83
|
|
9.4
|
%
|
||||
|
Europe
|
||||||||||||||
|
Occupancy
|
74.9
|
%
|
1.4
|
%
|
pts.
|
73.1
|
%
|
1.3
|
%
|
pts.
|
||||
|
Average Daily Rate
|
$
|
193.20
|
|
1.3
|
%
|
$
|
185.06
|
|
0.9
|
%
|
||||
|
RevPAR
|
$
|
144.61
|
|
3.2
|
%
|
$
|
135.28
|
|
2.7
|
%
|
||||
|
Middle East and Africa
|
||||||||||||||
|
Occupancy
|
60.1
|
%
|
5.8
|
%
|
pts.
|
60.3
|
%
|
5.4
|
%
|
pts.
|
||||
|
Average Daily Rate
|
$
|
190.60
|
|
(2.5
|
)%
|
$
|
186.19
|
|
(1.6
|
)%
|
||||
|
RevPAR
|
$
|
114.47
|
|
7.9
|
%
|
$
|
112.26
|
|
8.1
|
%
|
||||
|
Asia Pacific
|
||||||||||||||
|
Occupancy
|
73.7
|
%
|
1.9
|
%
|
pts.
|
74.1
|
%
|
1.8
|
%
|
pts.
|
||||
|
Average Daily Rate
|
$
|
176.48
|
|
2.1
|
%
|
$
|
176.43
|
|
2.4
|
%
|
||||
|
RevPAR
|
$
|
130.04
|
|
4.8
|
%
|
$
|
130.71
|
|
5.0
|
%
|
||||
|
Total International
(2)
|
||||||||||||||
|
Occupancy
|
72.6
|
%
|
2.2
|
%
|
pts.
|
71.9
|
%
|
2.0
|
%
|
pts.
|
||||
|
Average Daily Rate
|
$
|
192.04
|
|
2.2
|
%
|
$
|
185.39
|
|
2.1
|
%
|
||||
|
RevPAR
|
$
|
139.35
|
|
5.4
|
%
|
$
|
133.37
|
|
5.1
|
%
|
||||
|
Total Worldwide
(3)
|
||||||||||||||
|
Occupancy
|
73.7
|
%
|
2.1
|
%
|
pts.
|
73.3
|
%
|
2.0
|
%
|
pts.
|
||||
|
Average Daily Rate
|
$
|
178.96
|
|
3.3
|
%
|
$
|
150.23
|
|
3.7
|
%
|
||||
|
RevPAR
|
$
|
131.83
|
|
6.3
|
%
|
$
|
110.09
|
|
6.6
|
%
|
||||
|
(1)
|
International includes properties located outside the United States and Canada, except for worldwide, which includes the United States.
|
|
(2)
|
Company-operated statistics include the Marriott Hotels, Renaissance Hotels, Autograph Collection Hotels, The Ritz-Carlton, Bulgari Hotels & Resorts, Courtyard, and Residence Inn brands. In addition to the foregoing brands, systemwide statistics also include the Fairfield Inn & Suites brand.
|
|
(3)
|
Company-operated and systemwide statistics include properties worldwide for the Marriott Hotels, Renaissance Hotels, Autograph Collection Hotels, Gaylord Hotels, The Ritz-Carlton, Bulgari Hotels & Resorts, Courtyard, Residence Inn, Fairfield Inn & Suites, TownePlace Suites, and SpringHill Suites brands.
|
North American Full-Service
includes The Ritz-Carlton, EDITION, JW Marriott, Autograph Collection Hotels, Renaissance Hotels, Marriott Hotels, Delta Hotels and Resorts, and Gaylord Hotels located in the United States and Canada.
|
($ in millions)
|
Annual Change
|
||||||||||||||||
|
|
2015
|
2014
|
2013
|
Change 2015/2014
|
Change 2014/2013
|
||||||||||||
|
Segment revenues
|
$
|
8,825
|
|
$
|
8,323
|
|
$
|
7,978
|
|
6
|
%
|
4
|
%
|
||||
|
Segment profits
|
$
|
561
|
|
$
|
524
|
|
$
|
490
|
|
7
|
%
|
7
|
%
|
||||
2015
Compared to
2014
In
2015
, across our North American Full-Service segment we added
57
properties (
15,345
rooms), including 37 properties (9,590 rooms) from the Delta Hotels and Resorts acquisition, and
five
properties (
1,398
rooms) left our system.
For the twelve months ended December 31,
2015
, compared to the twelve months ended December 31,
2014
, RevPAR for comparable systemwide North American Full-Service properties increased by
4.6 percent
to
$136.95
, occupancy for these properties increased by
0.6
percentage points to
73.1 percent
, and average daily rates increased by
3.8 percent
to
$187.40
.
The
$37 million
increase in segment profits, compared to
2014
, was driven by
$44 million
of higher base management and franchise fees and
$10 million
of higher incentive management fees, partially offset by
$6 million
of lower owned, leased, and other revenue, net of direct expenses,
$4 million
of higher general, administrative, and other expenses,
$4 million
of lower gains and other income, net, and
$3 million
of higher depreciation, amortization, and other expense.
Base management and franchise fees were higher due to stronger RevPAR driven by rate and unit growth, partially offset by $5 million of contract modifications and terminations. Increased incentive management fees were primarily driven by higher net house profits at managed hotels.
38
Lower owned, leased, and other revenue, net of direct expenses primarily reflected $8 million of weaker performance at a North American Full-Service property under renovation.
General, administrative, and other expenses were higher due to $5 million from the Delta Hotels and Resorts acquisition and $2 million in higher reserves for guarantee funding, partially offset by $3 million of other property expenses incurred in 2014.
Cost reimbursements revenue and expenses for our North American Full-Service segment properties totaled
$7,911 million
in
2015
, compared to
$7,465 million
in
2014
.
2014 Compared to 2013
In 2014, across our North American Full-Service segment we added 23 properties (5,093 rooms) and no properties (zero rooms) left our system.
For the twelve months ended December 31, 2014, compared to the twelve months ended December 31, 2013, RevPAR for comparable systemwide North American Full-Service properties increased by 6.4 percent to $132.44, occupancy for these properties increased by 1.5 percentage points to 72.8 percent, and average daily rates increased by 4.1 percent to $182.00.
The $34 million increase in segment profits, compared to 2013, was driven by $30 million of higher base management and franchise fees, $17 million of higher incentive management fees, and $5 million of lower depreciation, amortization, and other expense, partially offset by $11 million of lower owned, leased, and other revenue, net of direct expenses, and $8 million of higher general, administrative, and other expenses.
Base management and franchise fees were higher due to stronger RevPAR as a result of increased demand and unit growth, partially offset by $7 million from terminated units. The increase in incentive management fees was primarily driven by higher net house profit at managed hotels, partially offset by $5 million in deferred fees recognized in 2013.
The decrease in depreciation, amortization, and other expense primarily reflected $11 million of accelerated amortization related to contract terminations in 2013, partially offset by $3 million of higher depreciation for a property that we acquired in the 2013 fourth quarter and $2 million in higher accelerated amortization related to contract terminations in 2014.
The decrease in owned, leased, and other revenue, net of direct expenses primarily reflected $7 million of lower termination fees, $6 million of lower branding fees, and $6 million of pre-opening costs, partially offset by $10 million in revenue, net of direct expenses, for a property we acquired in the 2013 fourth quarter.
General, administrative, and other expenses increased primarily due to a $4 million increase in guarantee funding and $3 million of other property expenses.
Cost reimbursements revenue and expenses for our North American Full-Service segment properties totaled $7,465 million in 2014, compared to $7,190 million in 2013.
North American Limited-Service
includes AC Hotels by Marriott, Courtyard, Residence Inn, SpringHill Suites, Fairfield Inn & Suites, and TownePlace Suites located in the United States and Canada.
|
($ in millions)
|
Annual Change
|
||||||||||||||||
|
|
2015
|
2014
|
2013
|
Change 2015/2014
|
Change 2014/2013
|
||||||||||||
|
Segment revenues
|
$
|
3,193
|
|
$
|
2,962
|
|
$
|
2,583
|
|
8
|
%
|
15
|
%
|
||||
|
Segment profits
|
$
|
651
|
|
$
|
574
|
|
$
|
479
|
|
13
|
%
|
20
|
%
|
||||
2015
Compared to
2014
In
2015
, across our North American Limited-Service segment we added
173
properties (
19,712
rooms) and
26
properties (
2,820
rooms) left our system. The majority of the properties that left our system were Fairfield Inn & Suites and Residence Inn properties.
For the twelve months ended December 31,
2015
, compared to the twelve months ended December 31,
2014
, RevPAR for comparable systemwide North American Limited-Service properties increased by
5.6 percent
to
$94.99
, occupancy for these properties increased by
0.5
percentage points to
74.4 percent
, and average daily rates increased by
4.9 percent
to
$127.65
.
The
$77 million
increase in segment profits, compared to
2014
, reflected
$73 million
of higher base management and franchise fees,
$13 million
of higher incentive management fees,
$2 million
of lower general, administrative, and other
39
expenses, and
$1 million
of lower depreciation, amortization, and other expense, partially offset by
$5 million
of lower owned, leased, and other revenue, net of direct expenses,
$4 million
of lower gains and other income, net, and
$3 million
of lower equity in earnings.
Base management and franchise fees were higher due to unit growth and stronger room rates, including $19 million of higher franchise licensing and application fees, partially offset by a $5 million reduction in previously deferred fees and $3 million of contract terminations. Increased incentive management fees were primarily driven by a few large portfolios of managed hotels whose improved net house profits allowed them to reach their owners priority threshold and begin to record incentive fees.
Lower owned, leased, and other revenue, net of direct expenses primarily reflected $7 million of lower termination fees, partially offset by $3 million of higher net earnings at several leased properties.
Gains and other income, net were lower due to a $4 million expected disposal loss on a plot of land. See Footnote No.
3
, “
Acquisitions and Dispositions
” for more information.
Lower equity in earnings was driven by the redemption of our investment in an entity that owns two hotels.
Cost reimbursements revenue and expenses for our North American Limited-Service segment properties totaled
$2,366 million
in
2015
, compared to
$2,217 million
in
2014
.
2014 Compared to 2013
In 2014, across our North American Limited-Service segment we added 120 properties (13,928 rooms) and 32 properties (3,030 rooms) left our system. The majority of the properties that left our system were Fairfield Inn & Suites and Residence Inn properties.
For the twelve months ended December 31, 2014, compared to the twelve months ended December 31, 2013, RevPAR for comparable systemwide North American Limited-Service properties increased by 7.5 percent to $89.11, occupancy for these properties increased by 2.3 percentage points to 74.0 percent, and average daily rates increased by 4.2 percent to $120.36.
The $95 million increase in segment profits, compared to 2013, primarily reflected $80 million of higher base management and franchise fees, $11 million of higher owned, leased, and other revenue, net of direct expenses, and $7 million of higher incentive management fees.
Higher base management and franchise fees were primarily driven by higher RevPAR for comparable properties and unit growth, and included $15 million of higher deferred management fees and $10 million of higher relicensing fees. Increased incentive management fees resulted from net house profit growth at managed hotels.
The increase in owned, leased, and other revenue, net of direct expenses, primarily reflected $5 million of higher net earnings at several leased properties and $4 million of higher termination fees.
Cost reimbursements revenue and expenses for our North American Limited-Service segment properties totaled $2,217 million in 2014, compared to $1,939 million in 2013.
International
includes properties, regardless of brand, that are located outside the United States and Canada.
|
($ in millions)
|
Annual Change
|
||||||||||||||||
|
|
2015
|
2014
|
2013
|
Change 2015/2014
|
Change 2014/2013
|
||||||||||||
|
Segment revenues
|
$
|
2,200
|
|
$
|
2,255
|
|
$
|
1,957
|
|
(2
|
)%
|
15
|
%
|
||||
|
Segment profits
|
$
|
292
|
|
$
|
295
|
|
$
|
228
|
|
(1
|
)%
|
29
|
%
|
||||
2015
Compared to
2014
In
2015
, across our International regions we added
70
properties (
16,490
rooms) and
20
properties (
2,110
rooms) left our system.
For the twelve months ended December 31,
2015
, compared to the twelve months ended December 31,
2014
, RevPAR for comparable systemwide international properties increased by
5.1 percent
to
$124.13
, occupancy for these properties increased by
2.1
percentage points to
72.5 percent
, and average daily rates increased by
2.1 percent
to
$171.20
. See “Business and Overview” for a discussion of trends in the various International regions.
40
The
$3 million
decrease in segment profits in 2015, compared to
2014
, consisted of
$12 million
of lower gains and other income, net,
$9 million
of lower equity in earnings,
$6 million
of lower incentive management fees, and
$4 million
of higher general, administrative, and other expenses, partially offset by
$18 million
of higher base management and franchise fees,
$8 million
of higher owned, leased, and other revenue, net of direct expenses, and
$2 million
of lower depreciation, amortization, and other expense.
Base management and franchise fees increased due to stronger RevPAR, driven by both occupancy and rate, and unit growth, partially offset by the impact of $16 million in unfavorable foreign exchange rates. Lower incentive management fees reflected $15 million in unfavorable foreign exchange rates, partially offset by higher net house profit at managed hotels and unit growth.
Higher owned, leased, and other revenue, net of direct expenses largely reflected favorable operating results at several of our properties, including $4 million of lower lease payments for properties that moved to managed, franchised, or left our system, and $7 million of increased termination fees, partially offset by $4 million in lower branding fees, and $2 million from a property that converted to managed.
Lower depreciation, amortization, and other expense was driven by amortization true-ups and lower depreciation from an International property sold in 2015, partially offset by $5 million of higher depreciation at several of our leased properties.
General, administrative, and other expenses increased primarily due to higher costs for branding and service initiatives to grow our brands globally.
Lower gains and other income, net primarily reflected an $11 million loss on the sale of an International property discussed in Footnote No.
3
, “
Acquisitions and Dispositions
.”
Lower equity in earnings reflected an unfavorable variance to a $9 million benefit recorded in 2014 for two of our International investments, following the reversal of their liabilities associated with a tax law change in a country in which they operate, and a $6 million impairment charge relating to an International joint venture, partially offset by a $5 million benefit recorded in 2015 following an adjustment to an International investee’s liabilities.
Cost reimbursements revenue and expenses for our International properties totaled
$1,282 million
in
2015
, compared to
$1,305 million
in 2014.
2014 Compared to 2013
In 2014, across our International regions we added 170 properties (26,737 rooms) and 16 properties (3,130 rooms) left our system.
For the twelve months ended December 31, 2014, compared to the twelve months ended December 31, 2013, RevPAR for comparable systemwide international properties increased by 5.1 percent to $133.37, occupancy for these properties increased by 2.0 percentage points to 71.9 percent, and average daily rates increased by 2.1 percent to $185.39. See “Business and Overview” for a discussion of results in the various International regions.
The $67 million increase in segment profits in 2014, compared to 2013, primarily consisted of $22 million in higher incentive management fees, $21 million of higher base management and franchise fees, $17 million of higher equity in earnings, and $11 million of higher owned, leased, and other revenue, net of direct expenses, partially offset by $6 million higher general, administrative, and other expenses.
The increase in base management and franchise fees was driven by unit growth and higher RevPAR, partially offset by the impact of $3 million in unfavorable foreign exchange rates and $4 million from terminated units. Increased incentive management fees were primarily driven by higher net house profit at managed hotels and unit growth, partially offset by the impact of $4 million in unfavorable foreign exchange rates.
The increase of equity in earnings was driven by a $9 million reversal of deferred tax liabilities associated with a tax law change in a country in which two of our International joint ventures operate and $7 million in increased earnings at three of our joint ventures.
The increase in owned, leased, and other revenue, net of direct expenses largely reflected $10 million from Protea Hotels programs and leases acquired in the 2014 second quarter, $5 million in higher costs in 2013 related to three leases we terminated, $5 million of pre-opening costs in 2013, $4 million from new units, and $4 million of favorable operating profits, partially offset by an unfavorable variance of $12 million in termination fees recognized in 2013, and $6 million in earnings from properties that converted to managed or franchised.
41
The increase in general, administrative, and other expenses was primarily due to $5 million related to the Protea Hotels acquisition and $5 million in higher compensation, partially offset by a $5 million performance cure payment for one property in 2013.
Cost reimbursements revenue and expenses for our International properties totaled $1,305 million in 2014, compared to $1,071 million in 2013.
SHARE-BASED COMPENSATION
Under our Stock and Cash Incentive Plan, we award: (1) stock options to purchase our common stock; (2) stock appreciation rights (“SARs”) for our common stock; (3) restricted stock units (“RSUs”) of our common stock; and (4) deferred stock units. We also issue performance-based RSUs (“PSUs”) to named executive officers and some of their direct reports under the Stock and Cash Incentive Plan.
During
2015
, we granted
1.3 million
RSUs,
0.1 million
PSUs, and
0.3 million
SARs. See Footnote No.
5
, “
Share-Based Compensation
,” for more information.
NEW ACCOUNTING STANDARDS
See Footnote No.
2
“
Summary of Significant Accounting Policies
,” to our Financial Statements for information on our anticipated adoption of recently issued accounting standards.
LIQUIDITY AND CAPITAL RESOURCES
Cash Requirements and Our Credit Facilities
Our multicurrency revolving credit agreement (the “Credit Facility”)
provides for
$2,000 million
of aggregate effective borrowings to support general corporate needs, including working capital, capital expenditures, share repurchases, letters of credit, and acquisitions. The availability of the Credit Facility also supports our commercial paper program. In addition, we may use borrowings under the Credit Facility, or commercial paper supported by the Credit Facility, to finance all or part of the cash component of the consideration to Starwood shareholders in connection with the Starwood Combination and certain fees and expenses incurred in connection with the combination. Borrowings under the Credit Facility generally bear interest at LIBOR (the London Interbank Offered Rate) plus a spread, based on our public debt rating.
We also pay quarterly fees on the Credit Facility at a rate based on our public debt rating. The term of the Credit Facility
expires on July 18, 2018
.
The Credit Facility contains certain covenants, including a single financial covenant that limits our maximum leverage (consisting of the ratio of Adjusted Total Debt to Consolidated EBITDA, each as defined in the Credit Facility) to not more than 4 to 1. Our outstanding public debt does not contain a corresponding financial covenant or a requirement that we maintain certain financial ratios. We currently satisfy the covenants in our Credit Facility and public debt instruments, including the leverage covenant under the Credit Facility, and do not expect that the covenants will restrict our ability to meet our anticipated borrowing and guarantee levels or increase those levels should we decide to do so in the future.
We believe the Credit Facility and our access to capital markets, together with cash we expect to generate from operations, remain adequate to meet our short-term and long-term liquidity requirements, finance our long-term growth plans, meet debt service, and fulfill other cash requirements.
We issue commercial paper in the United States. We do not have purchase commitments from buyers for our commercial paper; therefore, our ability to issue commercial paper is subject to market demand. We classify any outstanding commercial paper and Credit Facility borrowings as long-term based on our ability and intent to refinance them on a long-term basis. We reserve unused capacity under our Credit Facility to repay outstanding commercial paper borrowings in the event that the commercial paper market is not available to us for any reason when outstanding borrowings mature. We do not expect that fluctuations in the demand for commercial paper will affect our liquidity, given our borrowing capacity under the Credit Facility.
At year-end
2015
, our available borrowing capacity amounted to
$1,158 million
and reflected borrowing capacity of
$1,062 million
under our Credit Facility and our cash balance of
$96 million
. We calculated that borrowing capacity by taking
$2,000 million
of effective aggregate bank commitments under our Credit Facility and subtracting
$938 million
of outstanding commercial paper (there being
no
outstanding letters of credit under our Credit Facility).
We monitor the status of the capital markets and regularly evaluate the effect that changes in capital market conditions may have on our ability to execute our announced growth plans. We expect to continue meeting part of our financing and liquidity needs primarily through commercial paper borrowings, issuances of senior notes, and access to long-term committed
42
credit facilities. If conditions in the lodging industry deteriorate, or if disruptions in the capital markets take place as they did in the immediate aftermath of both the 2008 worldwide financial crisis and the events of September 11, 2001, we may be unable to place some or all of our commercial paper on a temporary or extended basis and may have to rely more on borrowings under the Credit Facility, which we believe will be adequate to fund our liquidity needs, including repayment of debt obligations, but which may or may not carry a higher cost than commercial paper. Since we continue to have ample flexibility under the Credit Facility’s covenants, we expect that undrawn bank commitments under the Credit Facility will remain available to us even if business conditions were to deteriorate markedly.
Cash from Operations
Cash from operations and non-cash items for the last three fiscal years are as follows:
|
($ in millions)
|
2015
|
2014
|
2013
|
||||||||
|
Cash from operations
|
$
|
1,430
|
|
$
|
1,224
|
|
$
|
1,140
|
|
||
|
Non-cash items
(1)
|
395
|
|
328
|
|
316
|
|
|||||
|
(1)
|
Includes depreciation, amortization, impairments, share-based compensation, and deferred income taxes.
|
Our ratio of current assets to current liabilities was
0.4
to 1.0 at year-end
2015
and 0.5 to 1.0 at year-end
2014
. We minimize working capital through cash management, strict credit-granting policies, and aggressive collection efforts. We also have significant borrowing capacity under our Credit Facility should we need additional working capital.
Our ratios of earnings to fixed charges for the last five fiscal years, the calculations of which we detail in Exhibit 12 to this
2015
Annual Report on Form 10-K, are as follows:
|
Fiscal Years
|
||||||||
|
2015
|
2014
|
2013
|
2012
|
2011
|
||||
|
6.4x
|
6.2x
|
5.1x
|
4.6x
|
2.3x
|
||||
Spin-off Cash Tax Benefits
Tax matters that could affect our cash tax benefits related to the 2011 spin-off of our timeshare operations and timeshare development business were resolved in 2013. As we expected, the spin-off resulted in our realization through 2015 of approximately $480 million of cash tax benefits, relating to the value of the timeshare business. We realized $447 million of those benefits through 2014 and expect to realize approximately $33 million of cash tax benefits in 2015.
Investing Activities Cash Flows
Capital Expenditures and Other Investments.
We made capital expenditures of
$305 million
in
2015
,
$411 million
in
2014
, and
$296 million
in
2013
. These included expenditures related to the development and construction of new hotels and acquisitions of hotel properties, improvements to existing properties, and systems initiatives. Capital expenditures in
2015
decreased by
$106 million
compared to
2014
, primarily related to the 2014 development of two EDITION hotels, partially offset by 2015 renovations at a North American Full-Service property and investments in our reservations system. Capital expenditures in
2014
increased by
$115 million
compared to
2013
, primarily related to developing two EDITION hotels and our 2014 acquisition of an International property, partially offset by the completion of The London EDITION in the 2013 fourth quarter.
We expect
2016
investment spending will total approximately
$450 million
to
$550 million
, including approximately
$100 million
for maintenance capital spending. Investment spending also includes other capital expenditures, loan advances, contract acquisition costs, acquisitions, and equity and other investments. See our Condensed Consolidated Statements of Cash Flows for information on investment spending for
2015
. Our anticipated investment spending does not include additional investments we may make in connection with the Starwood Combination, which we expect will close in mid-2016, after customary conditions are satisfied, including shareholder approvals, required antitrust approvals, and the completion of Starwood’s previously announced spin-off of its vacation ownership business, or another spin-off, split-off, analogous disposition, or sale of its vacation ownership business. See Footnote No.
3
, “
Acquisitions and Dispositions
,” for more information about the Starwood Combination.
43
Over time, we have sold lodging properties, both completed and under development, subject to long-term management agreements. The ability of third-party purchasers to raise the debt and equity capital necessary to acquire such properties depends in part on the perceived risks inherent in the lodging industry and other constraints inherent in the capital markets as a whole. We monitor the status of the capital markets and regularly evaluate the potential impact of changes in capital market conditions on our business operations. We expect to continue making selective and opportunistic investments to add units to our lodging business, which may include loans and noncontrolling equity investments.
Fluctuations in the values of hotel real estate generally have little impact on our overall business results because: (1) we own less than one percent of hotels that we operate or franchise; (2) management and franchise fees are generally based upon hotel revenues and profits rather than current hotel property values; and (3) our management agreements generally do not terminate upon hotel sale or foreclosure.
Dispositions.
Property and asset sales generated
$673 million
cash proceeds in
2015
and $435 million in
2014
. See Footnote No.
3
, “
Acquisitions and Dispositions
,” for more information on completed dispositions and planned dispositions.
Loan Activity.
From time to time we make loans to owners of hotels that we operate or franchise. Loan collections, net of loan advances, amounted to
$26 million
in
2015
compared to net advances of $69 million in
2014
. At year-end
2015
, we had a $3 million senior loan (current) and $218 million of mezzanine and other loans ($215 million noncurrent and $3 million current) outstanding, compared with a $3 million senior loan (current) and $239 million of mezzanine and other loans ($215 million noncurrent and $24 million current) outstanding at year-end
2014
. In
2015
, our notes receivable balance for senior, mezzanine, and other loans decreased by
$21 million
, primarily reflecting $86 million of collections on MVW notes receivable issued to us in 2011 in conjunction with our Timeshare spin-off, partially offset by the issuance of the $58 million mezzanine loan (net of a $6 million discount) described in Footnote No.
13
, “
Notes Receivable
.”
Equity and Cost Method Investments.
Cash outflows of
$7 million
in
2015
,
$6 million
in
2014
, and
$16 million
in
2013
for equity and cost method investments primarily reflects our investments in a number of joint ventures.
Cash from Financing Activities
Debt.
Debt increased by
$336 million
in
2015
, to
$4,107 million
at year-end
2015
from
$3,771 million
at year-end
2014
, and reflected
$790 million
(
$800 million
face amount) in Series O and P Notes issuances, partially offset by $314 million from the redemption of Series G Notes and a
$134 million
decrease in commercial paper borrowings. See Footnote No.
10
, “
Long-Term Debt
” for additional information on the debt issuances.
Our financial objectives include diversifying our financing sources, optimizing the mix and maturity of our long-term debt, and reducing our working capital. At year-end
2015
, our long-term debt had an average interest rate of 2.9 percent and an average maturity of approximately 4.6 years. The ratio of our fixed-rate long-term debt to our total long-term debt was 0.8 to 1.0 at year-end
2015
.
See the “Cash Requirements and Our Credit Facilities,” caption in this “Liquidity and Capital Resources” section for more information on our Credit Facility.
Share Repurchases.
We purchased
25.7 million
shares of our common stock in
2015
at an average price of $75.48 per share, 24.2 million shares in
2014
at an average price of $62.09 per share, and 20.0 million shares in
2013
at an average price of $41.46 per share. At year-end
2015
,
14.4 million
shares remained available for repurchase under authorizations from our Board of Directors. On
February 11, 2016
, we announced that our Board of Directors increased, by
25 million
shares, the authorization to repurchase our common stock. We purchase shares in the open market and in privately negotiated transactions.
Dividends.
Our Board of Directors declared and paid the following quarterly cash dividends in 2015: (1) $0.20 per share declared on February 12, 2015 and paid March 27, 2015 to shareholders of record on February 27, 2015; (2) $0.25 per share declared on May 8, 2015 and paid June 26, 2015 to shareholders of record on May 22, 2015; (3) $0.25 per share declared on August 6, 2015 and paid September 25, 2015 to shareholders of record on August 20, 2015; and (4) $0.25 per share declared November 5 and paid December 28 to shareholders of record on November 19. Our Board of Directors declared a cash dividend of $0.25 per share on February 11, 2016, payable on March 31, 2016 to shareholders of record on February 25, 2016.
44
Contractual Obligations and Off Balance Sheet Arrangements
Contractual Obligations
The following table summarizes our contractual obligations at year-end
2015
:
|
|
Payments Due by Period
|
||||||||||||||||||
|
($ in millions)
|
Total
|
Less Than
1 Year
|
1-3 Years
|
3-5 Years
|
After
5 Years
|
||||||||||||||
|
Debt
(1)
|
$
|
4,661
|
|
$
|
415
|
|
$
|
1,429
|
|
$
|
1,105
|
|
$
|
1,712
|
|
||||
|
Capital lease obligations
(1)
|
5
|
|
1
|
|
2
|
|
1
|
|
1
|
|
|||||||||
|
Operating leases where we are the primary obligor:
|
|||||||||||||||||||
|
Recourse
|
776
|
|
114
|
|
209
|
|
136
|
|
317
|
|
|||||||||
|
Nonrecourse
|
186
|
|
12
|
|
26
|
|
18
|
|
130
|
|
|||||||||
|
Purchase obligations
|
173
|
|
71
|
|
99
|
|
3
|
|
—
|
|
|||||||||
|
Other noncurrent liabilities
|
48
|
|
1
|
|
8
|
|
2
|
|
37
|
|
|||||||||
|
Total contractual obligations
|
$
|
5,849
|
|
$
|
614
|
|
$
|
1,773
|
|
$
|
1,265
|
|
$
|
2,197
|
|
||||
|
(1)
|
Includes principal as well as interest payments.
|
The preceding table does not reflect unrecognized tax benefits at year-end
2015
of
$24 million
. See Footnote No.
6
, “
Income Taxes
” for additional information.
In addition to the purchase obligations noted in the preceding table, in the normal course of business we enter into purchase commitments to manage the daily operating needs of the hotels that we manage. Since we are reimbursed from the cash flows of the hotels, these obligations have minimal impact on our net income and cash flow.
Guarantee Commitments
The following table summarizes our guarantee commitments at year-end
2015
:
|
|
Amount of Guarantee Commitments Expiration by Period
|
||||||||||||||||||
|
($ in millions)
|
Total
Amounts
Committed
|
Less Than
1 Year
|
1-3 Years
|
3-5 Years
|
After
5 Years
|
||||||||||||||
|
Total guarantees where we are the primary obligor
|
$
|
228
|
|
$
|
5
|
|
$
|
29
|
|
$
|
97
|
|
$
|
97
|
|
||||
|
Total guarantees where we are secondarily liable
|
92
|
|
24
|
|
51
|
|
9
|
|
8
|
|
|||||||||
|
Total guarantee commitments
|
$
|
320
|
|
$
|
29
|
|
$
|
80
|
|
$
|
106
|
|
$
|
105
|
|
||||
In conjunction with financing obtained for specific projects or properties owned by joint ventures in which we are a party, we may provide industry standard indemnifications to the lender for loss, liability or damage occurring as a result of our actions or the actions of the other joint venture owner.
Investment and Loan Commitments
We also had the following investment and loan commitments outstanding at year-end
2015
:
|
|
Amount of Expected Funding by Period
|
||||||||||||||||||
|
($ in millions)
|
Total
Amounts
Committed
|
Less Than
1 Year
|
1-3 Years
|
3-5 Years
|
After
5 Years
|
||||||||||||||
|
Total investment and loan commitments
|
$
|
85
|
|
$
|
38
|
|
$
|
47
|
|
$
|
—
|
|
$
|
—
|
|
||||
For further information on our investment and loan commitments, including the nature of the commitments and their expirations, see the “Commitments” caption in Footnote No.
7
, “
Commitments and Contingencies
.”
Letters of Credit
At year-end
2015
, we also had
$82 million
of letters of credit outstanding (all outside the Credit Facility), the majority of which were for our self-insurance programs.
Surety bonds issued as of year-end
2015
totaled
$159 million
, the majority of which federal, state, and local governments requested in connection with our self-insurance programs.
45
RELATED PARTY TRANSACTIONS
Equity Method Investments
We have equity method investments in entities that own properties for which we provide management and/or franchise services and receive fees. We also have equity method investments in entities that provide management and/or franchise services to hotels and receive fees. In addition, in some cases we provide loans, preferred equity, or guarantees to these entities.
Other Related Parties
We provide management services for and receive fees from properties owned by JWM Family Enterprises, L.P., which is beneficially owned and controlled by J.W. Marriott, Jr., Deborah Marriott Harrison, and other members of the Marriott family.
For more information, including the impact to our financial statements of transactions with these related parties, see Footnote No.
17
, “
Related Party Transactions
.”
CRITICAL ACCOUNTING POLICIES AND ESTIMATES
Our preparation of financial statements in accordance with GAAP requires management to make estimates and assumptions that affect reported amounts and related disclosures. Management considers an accounting estimate to be critical if: (1) we must make assumptions that were uncertain at the time the estimate was made; and (2) changes in the estimate, or selection of a different estimate methodology could have a material effect on our consolidated results of operations or financial condition.
While we believe that our estimates, assumptions, and judgments are reasonable, they are based on information available at the time the estimate or assumption was made. Actual results may differ significantly. Additionally, changes in our assumptions, estimates or assessments as a result of unforeseen events or otherwise could have a material impact on our financial position or results of operations.
Management has discussed the development and selection of its critical accounting policies with the Audit Committee of the Board of Directors, and the Audit Committee has reviewed the disclosure presented below relating to them.
See Footnote No.
2
, “
Summary of Significant Accounting Policies
,” for further information on our critical accounting policies and estimates, which are as follows:
Rewards Programs
, including how members earn points, how we estimate the value of future redemption obligation, and how we recognize revenue for these programs;
Goodwill
, including how we evaluate the fair value of reporting units and when we record an impairment loss on goodwill;
Intangibles and Long-Lived Assets
, including how we evaluate the fair value of intangibles and long-lived assets and when we record impairment losses on intangibles and long-lived assets;
Investments
, including information on how we evaluate the fair value of investments and when we record impairment losses on investments;
Loan Loss Reserves,
including information on how we measure impairment on senior, mezzanine, and other loans of these types; and
Income Taxes
, including information on how we determine our current year amounts payable or refundable, as well as our estimate of deferred tax assets and liabilities.
|
Item 7A.
|
Quantitative and Qualitative Disclosures About Market Risk.
|
We are exposed to market risk from changes in interest rates, stock prices, currency exchange rates, and debt prices. We manage our exposure to these risks by monitoring available financing alternatives, through development and application of credit granting policies and by entering into derivative arrangements. We do not foresee any significant changes in either our exposure to fluctuations in interest rates or currency rates or how we manage such exposure in the future.
We are exposed to interest rate risk on our floating-rate notes receivable and floating-rate debt. Changes in interest rates also impact the fair value of our fixed-rate notes receivable and the fair value of our fixed-rate long-term debt.
46
We are also subject to risk from changes in debt prices from our investments in debt securities and fluctuations in stock price from our investment in a publicly traded company. Changes in the price of the underlying stock can impact the fair value of our investment. We account for our investments as available-for-sale securities under the guidance for accounting for certain investments in debt and equity securities. At year-end
2015
, our investments had a fair value of
$37 million
.
We use derivative instruments, including cash flow hedges, net investment in non-U.S. operations hedges, and other derivative instruments, as part of our overall strategy to manage our exposure to market risks associated with fluctuations in interest rates and currency exchange rates. As a matter of policy, we only enter into transactions that we believe will be highly effective at offsetting the underlying risk, and we do not use derivatives for trading or speculative purposes. See Footnote No.
2
, “
Summary of Significant Accounting Policies
,” for more information on derivative instruments.
The following table sets forth the scheduled maturities and the total fair value as of year-end
2015
for our financial instruments that are impacted by market risks:
|
|
Maturities by Period
|
||||||||||||||||||||||||||||||
|
($ in millions)
|
2016
|
2017
|
2018
|
2019
|
2020
|
There-
after
|
Total
Carrying
Amount
|
Total
Fair
Value
|
|||||||||||||||||||||||
|
Assets
- Maturities represent expected principal receipts, fair values represent assets.
|
|||||||||||||||||||||||||||||||
|
Fixed-rate notes receivable
|
$
|
2
|
|
$
|
2
|
|
$
|
19
|
|
$
|
1
|
|
$
|
2
|
|
$
|
39
|
|
$
|
65
|
|
$
|
65
|
|
|||||||
|
Average interest rate
|
2.09
|
%
|
|||||||||||||||||||||||||||||
|
Floating-rate notes receivable
|
$
|
4
|
|
$
|
1
|
|
$
|
41
|
|
$
|
4
|
|
$
|
—
|
|
$
|
106
|
|
$
|
156
|
|
$
|
151
|
|
|||||||
|
Average interest rate
|
5.73
|
%
|
|||||||||||||||||||||||||||||
|
Liabilities
- Maturities represent expected principal payments, fair values represent liabilities.
|
|||||||||||||||||||||||||||||||
|
Fixed-rate debt
|
$
|
(299
|
)
|
$
|
(301
|
)
|
$
|
(9
|
)
|
$
|
(605
|
)
|
$
|
(357
|
)
|
$
|
(1,593
|
)
|
$
|
(3,164
|
)
|
$
|
(2,943
|
)
|
|||||||
|
Average interest rate
|
3.68
|
%
|
|||||||||||||||||||||||||||||
|
Floating-rate debt
|
$
|
—
|
|
$
|
—
|
|
$
|
(938
|
)
|
$
|
—
|
|
$
|
—
|
|
$
|
—
|
|
$
|
(938
|
)
|
$
|
(938
|
)
|
|||||||
|
Average interest rate
|
0.62
|
%
|
|||||||||||||||||||||||||||||
47
|
Item 8.
|
Financial Statements and Supplementary Data.
|
The following financial information is included on the pages indicated:
|
Page
|
|
48
MANAGEMENT’S REPORT ON
INTERNAL CONTROL OVER FINANCIAL REPORTING
Management of Marriott International, Inc. (the “Company”) is responsible for establishing and maintaining adequate internal control over financial reporting and for assessing the effectiveness of internal control over financial reporting. The Company has designed its internal control over financial reporting to provide reasonable assurance on the reliability of financial reporting and the preparation of the consolidated financial statements in accordance with U.S. generally accepted accounting principles.
The Company’s internal control over financial reporting includes those policies and procedures that: (1) pertain to the maintenance of records that, in reasonable detail, accurately and fairly reflect the Company’s transactions and dispositions of the Company’s assets; (2) provide reasonable assurance that transactions are recorded as necessary to permit preparation of the consolidated financial statements in accordance with U.S. generally accepted accounting principles, and that receipts and expenditures of the Company are being made only in accordance with authorizations of the Company’s management and directors; and (3) provide reasonable assurance regarding prevention or timely detection of unauthorized acquisition, use, or disposition of the Company’s assets that could have a material effect on the consolidated financial statements.
Because of inherent limitations in internal control over financial reporting, such controls may not prevent or detect misstatements. Also, projections of any evaluation of the effectiveness of internal controls to future periods are subject to the risk that controls may become inadequate because of changes in conditions, or that the degree of compliance with the policies or procedures may deteriorate.
In connection with the preparation of the Company’s annual consolidated financial statements, management assessed the effectiveness of the Company’s internal control over financial reporting as of
December 31, 2015
, based on criteria established in the Internal Control-Integrated Framework issued by the Committee of Sponsoring Organizations of the Treadway Commission (2013 Framework) (the “COSO criteria”).
Based on this assessment, management has concluded that, applying the COSO criteria, as of
December 31, 2015
, the Company’s internal control over financial reporting was effective to provide reasonable assurance of the reliability of financial reporting and the preparation of financial statements for external purposes in accordance with U.S. generally accepted accounting principles.
Ernst & Young LLP, the independent registered public accounting firm that audited the Company’s consolidated financial statements included in this report, has issued an attestation report on the effectiveness of the Company’s internal control over financial reporting, a copy of which appears on the following page.
49
REPORT OF INDEPENDENT REGISTERED PUBLIC ACCOUNTING FIRM
The Board of Directors and Shareholders of Marriott International, Inc.
We have audited Marriott International, Inc.’s internal control over financial reporting as of
December 31, 2015
, based on criteria established in Internal Control-Integrated Framework issued by the Committee of Sponsoring Organizations of the Treadway Commission (2013 Framework) (the COSO criteria). Marriott International, Inc.’s management is responsible for maintaining effective internal control over financial reporting, and for its assessment of the effectiveness of internal control over financial reporting included in the accompanying Management’s Report on Internal Control Over Financial Reporting. Our responsibility is to express an opinion on the company’s internal control over financial reporting based on our audit.
We conducted our audit in accordance with the standards of the Public Company Accounting Oversight Board (United States). Those standards require that we plan and perform the audit to obtain reasonable assurance about whether effective internal control over financial reporting was maintained in all material respects. Our audit included obtaining an understanding of internal control over financial reporting, assessing the risk that a material weakness exists, testing and evaluating the design and operating effectiveness of internal control based on the assessed risk, and performing such other procedures as we considered necessary in the circumstances. We believe that our audit provides a reasonable basis for our opinion.
A company’s internal control over financial reporting is a process designed to provide reasonable assurance regarding the reliability of financial reporting and the preparation of financial statements for external purposes in accordance with generally accepted accounting principles. A company’s internal control over financial reporting includes those policies and procedures that (1) pertain to the maintenance of records that, in reasonable detail, accurately and fairly reflect the transactions and dispositions of the assets of the company; (2) provide reasonable assurance that transactions are recorded as necessary to permit preparation of financial statements in accordance with generally accepted accounting principles, and that receipts and expenditures of the company are being made only in accordance with authorizations of management and directors of the company; and (3) provide reasonable assurance regarding prevention or timely detection of unauthorized acquisition, use, or disposition of the company’s assets that could have a material effect on the financial statements.
Because of its inherent limitations, internal control over financial reporting may not prevent or detect misstatements. Also, projections of any evaluation of effectiveness to future periods are subject to the risk that controls may become inadequate because of changes in conditions, or that the degree of compliance with the policies or procedures may deteriorate.
In our opinion, Marriott International, Inc. maintained, in all material respects, effective internal control over financial reporting as of
December 31, 2015
, based on the COSO criteria.
We also have audited, in accordance with the standards of the Public Company Accounting Oversight Board (United States), the consolidated balance sheets of Marriott International, Inc. as of
December 31, 2015
and
2014
, and the related consolidated statements of income, comprehensive income, shareholders’ (deficit) equity and cash flows for each of the three fiscal years in the period ended
December 31, 2015
of Marriott International, Inc. and our report dated
February 18, 2016
expressed an unqualified opinion thereon.
|
/s/ Ernst & Young LLP
|
McLean, Virginia
February 18, 2016
50
REPORT OF INDEPENDENT REGISTERED PUBLIC ACCOUNTING FIRM
The Board of Directors and Shareholders of Marriott International, Inc.
We have audited the accompanying consolidated balance sheets of Marriott International, Inc. as of
December 31, 2015
and
2014
, and the related consolidated statements of income, comprehensive income, shareholders’ (deficit) equity and cash flows for each of the three fiscal years in the period ended
December 31, 2015
. These financial statements are the responsibility of the Company’s management. Our responsibility is to express an opinion on these financial statements based on our audits.
We conducted our audits in accordance with the standards of the Public Company Accounting Oversight Board (United States). Those standards require that we plan and perform the audit to obtain reasonable assurance about whether the financial statements are free of material misstatement. An audit includes examining, on a test basis, evidence supporting the amounts and disclosures in the financial statements. An audit also includes assessing the accounting principles used and significant estimates made by management, as well as evaluating the overall financial statement presentation. We believe that our audits provide a reasonable basis for our opinion.
In our opinion, the financial statements referred to above present fairly, in all material respects, the consolidated financial position of Marriott International, Inc. at
December 31, 2015
and
2014
, and the consolidated results of its operations and its cash flows for each of the three fiscal years in the period ended
December 31, 2015
, in conformity with U.S. generally accepted accounting principles.
We also have audited, in accordance with the standards of the Public Company Accounting Oversight Board (United States), Marriott International, Inc.’s internal control over financial reporting as of
December 31, 2015
, based on criteria established in Internal Control-Integrated Framework issued by the Committee of Sponsoring Organizations of the Treadway Commission (2013 Framework) and our report dated
February 18, 2016
expressed an unqualified opinion thereon.
|
/s/ Ernst & Young LLP
|
McLean, Virginia
February 18, 2016
51
MARRIOTT INTERNATIONAL, INC.
Fiscal Years
2015
,
2014
, and
2013
($ in millions, except per share amounts)
|
|
December 31,
2015 |
December 31,
2014 |
December 31,
2013 |
||||||||
|
REVENUES
|
|||||||||||
|
Base management fees
(1)
|
$
|
698
|
|
$
|
672
|
|
$
|
621
|
|
||
|
Franchise fees
|
853
|
|
745
|
|
666
|
|
|||||
|
Incentive management fees
(1)
|
319
|
|
302
|
|
256
|
|
|||||
|
Owned, leased, and other revenue
(1)
|
986
|
|
1,022
|
|
950
|
|
|||||
|
Cost reimbursements
(1)
|
11,630
|
|
11,055
|
|
10,291
|
|
|||||
|
14,486
|
|
13,796
|
|
12,784
|
|
||||||
|
OPERATING COSTS AND EXPENSES
|
|||||||||||
|
Owned, leased, and other-direct
|
733
|
|
775
|
|
729
|
|
|||||
|
Reimbursed costs
(1)
|
11,630
|
|
11,055
|
|
10,291
|
|
|||||
|
Depreciation, amortization, and other
(1)
|
139
|
|
148
|
|
127
|
|
|||||
|
General, administrative, and other
(1)
|
634
|
|
659
|
|
649
|
|
|||||
|
13,136
|
|
12,637
|
|
11,796
|
|
||||||
|
OPERATING INCOME
|
1,350
|
|
1,159
|
|
988
|
|
|||||
|
Gains and other income, net
(1)
|
27
|
|
8
|
|
11
|
|
|||||
|
Interest expense
(1)
|
(167
|
)
|
(115
|
)
|
(120
|
)
|
|||||
|
Interest income
(1)
|
29
|
|
30
|
|
23
|
|
|||||
|
Equity in earnings (losses)
(1)
|
16
|
|
6
|
|
(5
|
)
|
|||||
|
INCOME BEFORE INCOME TAXES
|
1,255
|
|
1,088
|
|
897
|
|
|||||
|
Provision for income taxes
|
(396
|
)
|
(335
|
)
|
(271
|
)
|
|||||
|
NET INCOME
|
$
|
859
|
|
$
|
753
|
|
$
|
626
|
|
||
|
EARNINGS PER SHARE
|
|||||||||||
|
Earnings per share - basic
|
$
|
3.22
|
|
$
|
2.60
|
|
$
|
2.05
|
|
||
|
Earnings per share - diluted
|
$
|
3.15
|
|
$
|
2.54
|
|
$
|
2.00
|
|
||
|
(1)
|
See Footnote No.
17
, “
Related Party Transactions
,” to our Consolidated Financial Statements for disclosure of related party amounts.
|
See Notes to Consolidated Financial Statements.
52
MARRIOTT INTERNATIONAL, INC.
CONSOLIDATED STATEMENTS OF COMPREHENSIVE INCOME
Fiscal Years
2015
,
2014
, and
2013
($ in millions)
|
|
December 31,
2015 |
December 31,
2014 |
December 31,
2013 |
||||||||
|
Net income
|
$
|
859
|
|
$
|
753
|
|
$
|
626
|
|
||
|
Other comprehensive (loss) income:
|
|||||||||||
|
Foreign currency translation adjustments
|
(123
|
)
|
(41
|
)
|
1
|
|
|||||
|
Other derivative instrument adjustments, net of tax
|
10
|
|
8
|
|
—
|
|
|||||
|
Unrealized (loss) gain on available-for-sale securities, net of tax
|
(7
|
)
|
5
|
|
5
|
|
|||||
|
Reclassification of (gains) losses, net of tax
|
(6
|
)
|
2
|
|
(6
|
)
|
|||||
|
Total other comprehensive (loss) income, net of tax
|
(126
|
)
|
(26
|
)
|
—
|
|
|||||
|
Comprehensive income
|
$
|
733
|
|
$
|
727
|
|
$
|
626
|
|
||
See Notes to Consolidated Financial Statements.
53
MARRIOTT INTERNATIONAL, INC.
Fiscal Years-Ended
2015
and
2014
($ in millions)
|
December 31,
2015 |
December 31,
2014 |
||||||
|
ASSETS
|
|||||||
|
Current assets
|
|||||||
|
Cash and equivalents
|
$
|
96
|
|
$
|
104
|
|
|
|
Accounts and notes receivable, net
(1)
|
1,103
|
|
1,100
|
|
|||
|
Prepaid expenses
|
77
|
|
64
|
|
|||
|
Other
(1)
|
30
|
|
109
|
|
|||
|
Assets held for sale
|
78
|
|
233
|
|
|||
|
1,384
|
|
1,610
|
|
||||
|
Property and equipment, net
|
1,029
|
|
1,460
|
|
|||
|
Intangible assets
|
|||||||
|
Contract acquisition costs and other
(1)
|
1,451
|
|
1,351
|
|
|||
|
Goodwill
|
943
|
|
894
|
|
|||
|
2,394
|
|
2,245
|
|
||||
|
Equity and cost method investments
(1)
|
165
|
|
224
|
|
|||
|
Notes receivable, net
|
215
|
|
215
|
|
|||
|
Deferred taxes, net
(1)
|
672
|
|
819
|
|
|||
|
Other noncurrent assets
(1)
|
223
|
|
260
|
|
|||
|
$
|
6,082
|
|
$
|
6,833
|
|
||
|
LIABILITIES AND SHAREHOLDERS’ DEFICIT
|
|||||||
|
Current liabilities
|
|||||||
|
Current portion of long-term debt
|
$
|
300
|
|
$
|
324
|
|
|
|
Accounts payable
(1)
|
593
|
|
605
|
|
|||
|
Accrued payroll and benefits
|
861
|
|
799
|
|
|||
|
Liability for guest loyalty programs
|
952
|
|
677
|
|
|||
|
Accrued expenses and other
(1)
|
527
|
|
633
|
|
|||
|
3,233
|
|
3,038
|
|
||||
|
Long-term debt
|
3,807
|
|
3,447
|
|
|||
|
Liability for guest loyalty programs
|
1,622
|
|
1,657
|
|
|||
|
Other noncurrent liabilities
(1)
|
1,010
|
|
891
|
|
|||
|
Shareholders’ deficit
|
|||||||
|
Class A Common Stock
|
5
|
|
5
|
|
|||
|
Additional paid-in-capital
|
2,821
|
|
2,802
|
|
|||
|
Retained earnings
|
4,878
|
|
4,286
|
|
|||
|
Treasury stock, at cost
|
(11,098
|
)
|
(9,223
|
)
|
|||
|
Accumulated other comprehensive loss
|
(196
|
)
|
(70
|
)
|
|||
|
(3,590
|
)
|
(2,200
|
)
|
||||
|
$
|
6,082
|
|
$
|
6,833
|
|
||
|
(1)
|
See Footnote No.
17
, “
Related Party Transactions
,” to our Consolidated Financial Statements for disclosure of related party amounts.
|
See Notes to Consolidated Financial Statements.
54
MARRIOTT INTERNATIONAL, INC.
Fiscal Years
2015
,
2014
, and
2013
($ in millions)
|
|
December 31,
2015 |
December 31,
2014 |
December 31,
2013 |
||||||||
|
OPERATING ACTIVITIES
|
|||||||||||
|
Net income
|
$
|
859
|
|
$
|
753
|
|
$
|
626
|
|
||
|
Adjustments to reconcile to cash provided by operating activities:
|
|||||||||||
|
Depreciation, amortization, and other
|
139
|
|
148
|
|
127
|
|
|||||
|
Share-based compensation
|
113
|
|
109
|
|
116
|
|
|||||
|
Income taxes
|
143
|
|
71
|
|
73
|
|
|||||
|
Liability for guest loyalty program
|
233
|
|
175
|
|
99
|
|
|||||
|
Working capital changes
|
(126
|
)
|
(120
|
)
|
50
|
|
|||||
|
Other
|
69
|
|
88
|
|
49
|
|
|||||
|
Net cash provided by operating activities
|
1,430
|
|
1,224
|
|
1,140
|
|
|||||
|
INVESTING ACTIVITIES
|
|||||||||||
|
Capital expenditures
|
(305
|
)
|
(411
|
)
|
(296
|
)
|
|||||
|
Dispositions
|
673
|
|
435
|
|
—
|
|
|||||
|
Loan advances
|
(66
|
)
|
(103
|
)
|
(7
|
)
|
|||||
|
Loan collections
|
92
|
|
34
|
|
77
|
|
|||||
|
Equity and cost method investments
|
(7
|
)
|
(6
|
)
|
(16
|
)
|
|||||
|
Contract acquisition costs
|
(121
|
)
|
(65
|
)
|
(61
|
)
|
|||||
|
Acquisition of a business, net of cash acquired
|
(137
|
)
|
(184
|
)
|
(112
|
)
|
|||||
|
Redemption of / (investment in) debt security
|
121
|
|
—
|
|
(65
|
)
|
|||||
|
Other
|
117
|
|
(13
|
)
|
(39
|
)
|
|||||
|
Net cash provided by (used in) investing activities
|
367
|
|
(313
|
)
|
(519
|
)
|
|||||
|
FINANCING ACTIVITIES
|
|||||||||||
|
Commercial paper/Credit Facility, net
|
(140
|
)
|
235
|
|
311
|
|
|||||
|
Issuance of long-term debt
|
790
|
|
394
|
|
345
|
|
|||||
|
Repayment of long-term debt
|
(325
|
)
|
(7
|
)
|
(407
|
)
|
|||||
|
Issuance of Class A Common Stock
|
40
|
|
178
|
|
199
|
|
|||||
|
Dividends paid
|
(253
|
)
|
(223
|
)
|
(196
|
)
|
|||||
|
Purchase of treasury stock
|
(1,917
|
)
|
(1,510
|
)
|
(834
|
)
|
|||||
|
Other
|
—
|
|
—
|
|
(1
|
)
|
|||||
|
Net cash used in financing activities
|
(1,805
|
)
|
(933
|
)
|
(583
|
)
|
|||||
|
(DECREASE) INCREASE IN CASH AND EQUIVALENTS
|
(8
|
)
|
(22
|
)
|
38
|
|
|||||
|
CASH AND EQUIVALENTS, beginning of period
|
104
|
|
126
|
|
88
|
|
|||||
|
CASH AND EQUIVALENTS, end of period
|
$
|
96
|
|
$
|
104
|
|
$
|
126
|
|
||
See Notes to Consolidated Financial Statements.
55
MARRIOTT INTERNATIONAL, INC.
CONSOLIDATED STATEMENTS OF SHAREHOLDERS’ (DEFICIT) EQUITY
Fiscal Years
2015
,
2014
, and
2013
(in millions)
|
|
|
|
||||||||||||||||||||||||
|
Common
Shares
Outstanding
|
|
Total
|
Class A
Common
Stock
|
Additional
Paid-in-
Capital
|
Retained
Earnings
|
Treasury
Stock, at
Cost
|
Accumulated
Other
Comprehensive Loss
|
|||||||||||||||||||
|
310.9
|
|
Balance at December 28, 2012
|
$
|
(1,285
|
)
|
$
|
5
|
|
$
|
2,585
|
|
$
|
3,509
|
|
$
|
(7,340
|
)
|
$
|
(44
|
)
|
||||||
|
—
|
|
Net income
|
626
|
|
—
|
|
—
|
|
626
|
|
—
|
|
—
|
|
||||||||||||
|
—
|
|
Other comprehensive income
|
—
|
|
—
|
|
—
|
|
—
|
|
—
|
|
—
|
|
||||||||||||
|
—
|
|
Dividends
|
(195
|
)
|
—
|
|
—
|
|
(195
|
)
|
—
|
|
—
|
|
||||||||||||
|
7.1
|
|
Employee stock plan
|
269
|
|
—
|
|
131
|
|
(103
|
)
|
241
|
|
—
|
|
||||||||||||
|
(20
|
)
|
Purchase of treasury stock
|
(830
|
)
|
—
|
|
—
|
|
—
|
|
(830
|
)
|
—
|
|
||||||||||||
|
298.0
|
|
Balance at December 31, 2013
|
(1,415
|
)
|
5
|
|
2,716
|
|
3,837
|
|
(7,929
|
)
|
(44
|
)
|
||||||||||||
|
—
|
|
Net income
|
753
|
|
—
|
|
—
|
|
753
|
|
—
|
|
—
|
|
||||||||||||
|
—
|
|
Other comprehensive income
|
(26
|
)
|
—
|
|
—
|
|
—
|
|
—
|
|
(26
|
)
|
||||||||||||
|
—
|
|
Dividends
|
(223
|
)
|
—
|
|
—
|
|
(223
|
)
|
—
|
|
—
|
|
||||||||||||
|
6.1
|
|
Employee stock plan
|
211
|
|
—
|
|
86
|
|
(81
|
)
|
206
|
|
—
|
|
||||||||||||
|
(24.2
|
)
|
Purchase of treasury stock
|
(1,500
|
)
|
—
|
|
—
|
|
—
|
|
(1,500
|
)
|
—
|
|
||||||||||||
|
279.9
|
|
Balance at December 31, 2014
|
(2,200
|
)
|
5
|
|
2,802
|
|
4,286
|
|
(9,223
|
)
|
(70
|
)
|
||||||||||||
|
—
|
|
Net income
|
859
|
|
—
|
|
—
|
|
859
|
|
—
|
|
—
|
|
||||||||||||
|
—
|
|
Other comprehensive loss
|
(126
|
)
|
—
|
|
—
|
|
—
|
|
—
|
|
(126
|
)
|
||||||||||||
|
—
|
|
Dividends
|
(253
|
)
|
—
|
|
—
|
|
(253
|
)
|
—
|
|
—
|
|
||||||||||||
|
2.1
|
|
Employee stock plan
|
70
|
|
—
|
|
19
|
|
(14
|
)
|
65
|
|
—
|
|
||||||||||||
|
(25.7
|
)
|
Purchase of treasury stock
|
(1,940
|
)
|
—
|
|
—
|
|
—
|
|
(1,940
|
)
|
—
|
|
||||||||||||
|
256.3
|
|
(1)
|
Balance at December 31, 2015
|
$
|
(3,590
|
)
|
$
|
5
|
|
$
|
2,821
|
|
$
|
4,878
|
|
$
|
(11,098
|
)
|
$
|
(196
|
)
|
|||||
|
(1)
|
Our restated certificate of incorporation authorizes
800 million
shares of our common stock, with a par value of
$.01
per share and
10 million
shares of preferred stock, without par value. At year-end
2015
, we had
265.3 million
of these authorized shares of our common stock and
no
preferred stock outstanding.
|
See Notes to Consolidated Financial Statements.
56
MARRIOTT INTERNATIONAL, INC.
NOTES TO CONSOLIDATED FINANCIAL STATEMENTS
1
.
BASIS OF PRESENTATION
The consolidated financial statements present the results of operations, financial position, and cash flows of Marriott International, Inc. (“Marriott,” and
together with its consolidated subsidiaries, as “we,” “us,” or “the Company
”).
In order to make this report easier to read, we also refer throughout to (i) our Consolidated Financial Statements as our “Financial Statements,” (ii) our Consolidated Statements of Income as our “Income Statements,” (iii) our Consolidated Balance Sheets as our “Balance Sheets,” (iv) our properties, brands, or markets in the United States (“U.S.”) and Canada as “North America” or “North American,” and (v) our properties, brands, or markets outside of the United States and Canada as “International.”
In addition, references throughout to numbered “Footnotes” refer to the numbered Notes in these Notes to Consolidated Financial Statements, unless otherwise noted.
Preparation of financial statements that conform with U.S. generally accepted accounting principles (“GAAP”) requires management to make estimates and assumptions that affect the reported amounts of assets and liabilities as of the date of the financial statements, the reported amounts of revenues and expenses during the reporting periods, and the disclosures of contingent liabilities. Accordingly, ultimate results could differ from those estimates.
The accompanying Financial Statements reflect all normal and recurring adjustments necessary to present fairly our financial position at fiscal year-end
2015
and fiscal year-end
2014
and the results of our operations and cash flows for fiscal years
2015
,
2014
, and
2013
. We have eliminated all material intercompany transactions and balances between entities consolidated in these Financial Statements. In addition, in 2015, we recorded a cumulative $
25 million
adjustment to “Retained earnings” to correct immaterial errors attributable to excess tax benefits for share-based compensation that we allocated to foreign affiliates, which had previously resulted in immaterial overstatements in both the “Provision for income taxes” in our Income Statements and “Additional paid-in-capital” in our Balance Sheets for the years 2003-2014.
Fiscal Year
Beginning with our 2013 fiscal year, we changed our financial reporting cycle to a calendar year-end reporting cycle and an end-of-month quarterly reporting cycle. Accordingly, our 2013 fiscal year began on December 29, 2012 (the day after the end of the 2012 fiscal year) and ended on December 31, 2013.
Historically, our fiscal year was a 52-53 week fiscal year that ended on the Friday nearest to December 31.
As a result, our
2015
and
2014
fiscal years had
three
fewer days than our
2013
fiscal year.
The table below presents each completed fiscal year we refer to in this report, the date the fiscal year ended, and the number of days in that fiscal year, and unless otherwise specified, each reference to a particular year means the fiscal year ended on the date shown below:
|
Fiscal Year
|
Fiscal Year-End Date
|
Number of Days
|
Fiscal Year
|
Fiscal Year-End Date
|
Number of Days
|
|||||
|
2015
|
December 31, 2015
|
365
|
2010
|
December 31, 2010
|
364
|
|||||
|
2014
|
December 31, 2014
|
365
|
2009
|
January 1, 2010
|
364
|
|||||
|
2013
|
December 31, 2013
|
368
|
2008
|
January 2, 2009
|
371
|
|||||
|
2012
|
December 28, 2012
|
364
|
2007
|
December 28, 2007
|
364
|
|||||
|
2011
|
December 30, 2011
|
364
|
2006
|
December 29, 2006
|
364
|
|||||
Beginning in 2014, our fiscal years are the same as the corresponding calendar year (each beginning on January 1 and ending on December 31, and containing
365
or
366
days).
57
2
.
SUMMARY OF SIGNIFICANT ACCOUNTING POLICIES
Revenue Recognition
Our revenues include: (1) base management and incentive management fees; (2) franchise fees (including licensing fees from MVW after the spin-off of
$59 million
for
2015
,
$60 million
for
2014
, and
$61 million
for
2013
); (3) revenues from lodging properties we own or lease; and (4) cost reimbursements. Management fees are typically composed of a base fee, which is a percentage of the revenues of hotels, and an incentive fee, which is generally based on hotel profitability. Franchise fees are typically composed of initial application fees and continuing royalties generated from our franchise programs, which permit the hotel owners and operators to use certain of our brand names. Cost reimbursements include direct and indirect costs that are reimbursed to us by properties that we manage, franchise, or license.
Base Management and Incentive Management Fees
: We recognize base management fees as revenue when we earn them under the contracts. In interim periods and at year-end, we recognize incentive management fees that would be due as if the contracts were to terminate at that date, exclusive of any termination fees payable or receivable by us.
Franchise Fee and License Fee Revenue
: We recognize franchise fees and license fees as revenue in each accounting period as we earn those fees from the franchisee or licensee under the contracts.
Owned and Leased Units
: We recognize room sales and revenues from other guest services for our owned and leased units when rooms are occupied and when we have rendered the services.
Cost Reimbursements
: We recognize cost reimbursements from managed, franchised, and licensed properties when we incur the related reimbursable costs. These costs primarily consist of payroll and related expenses at managed properties where we are the employer and also include certain operational and administrative costs as provided for in our contracts with the owners. As these costs have no added markup, the revenue and related expense have no impact on either our operating or net income.
Other Revenue
: Includes other third-party licensing fees, branding fees for third-party residential sales and credit card licensing, land rental income, and other revenue. We generally recognize other revenue as services are rendered and when collection is reasonably assured. Amounts received in advance are deferred as liabilities.
Real Estate Sales
We reduce gains on sales of real estate by our maximum exposure to loss if we have continuing involvement with the property and do not transfer substantially all of the risks and rewards of ownership. In sales transactions where we retain a management contract, the terms and conditions of the management contract are generally comparable to the terms and conditions of the management contracts obtained directly with third-party owners in competitive bid processes.
Rewards Programs
Marriott Rewards and The Ritz-Carlton Rewards are our frequent guest loyalty programs. Program members earn points based on the money they spend at our hotels, purchases of timeshare interval, fractional ownership, and residential products and, to a lesser degree, through participation in affiliated partners’ programs, such as those offered by car rental and credit card companies. Members can redeem points, which we track on their behalf, for stays at most of our hotels, airline tickets, airline frequent flyer program miles, rental cars, and a variety of other awards. Points cannot be redeemed for cash. We provide Marriott Rewards and The Ritz-Carlton Rewards as marketing programs to participating properties, with the objective of operating the programs on a break-even basis to us. We collect amounts that we expect will, in the aggregate, equal the costs of point redemptions and program operating costs over time.
We defer revenue we receive from managed, franchised, and Marriott-owned/leased hotels and program partners. Our management and franchise agreements require that properties reimburse us currently for the costs of operating the rewards programs, including marketing, promotion, communication with, and performing member services for rewards program members. Due to the requirement that properties reimburse us for program operating costs as incurred, we recognize the related cost reimbursements revenues from properties for our rewards programs when we incur and expense such costs. We also recognize the component of revenue from program partners that corresponds to program maintenance services when we incur and expense such costs. When points are redeemed we recognize the amounts we previously deferred as revenue and the corresponding expense relating to the costs of the awards redeemed.
The recorded liability related to these programs totaled
$2,574 million
at year-end
2015
and
$2,334 million
at year-end
2014
. We estimate the reasonableness and the value of the future redemption obligations using statistical formulas that project timing of future point redemptions based on historical levels, including an estimate of the “breakage” for points that members
58
will never redeem, and an estimate of the points that members will eventually redeem. A
ten percent
reduction in the estimate of “breakage” would have increased the estimated
year-end
2015
liability by
$164 million
.
Profit Sharing Plan
We contribute to a profit sharing plan for the benefit of employees meeting certain eligibility requirements who elect to participate in the plan. Participating employees specify the percentage of salary deferred. We recognized compensation costs from profit sharing of
$80 million
in
2015
,
$76 million
in
2014
, and
$75 million
in
2013
.
Non-U.S. Operations
The U.S. dollar is the functional currency of our consolidated and unconsolidated entities operating in the United States. The functional currency of our consolidated and unconsolidated entities operating outside of the United States is generally the principal currency of the economic environment in which the entity primarily generates and expends cash. We translate the financial statements of consolidated entities whose functional currency is not the U.S. dollar into U.S. dollars, and we do the same, as needed, for unconsolidated entities whose functional currency is not the U.S. dollar. We translate assets and liabilities at the exchange rate in effect as of the financial statement date, and translate income statement accounts using the weighted average exchange rate for the period. We include translation adjustments from currency exchange and the effect of exchange rate changes on intercompany transactions of a long-term investment nature as a separate component of shareholders’ equity. We report gains and losses from currency exchange rate changes for intercompany receivables and payables that are not of a long-term investment nature, as well as gains and losses from non-U.S. currency transactions, currently in operating costs and expenses, and those amounted to losses of
$6 million
in
2015
,
$16 million
in
2014
, and
$5 million
in
2013
.
Share-Based Compensation
We grant share-based compensation awards at exercise prices or strike prices that equal the market price of our common stock on the date of grant. For all share-based awards, we measure compensation costs for our share-based payment transactions at fair value on the grant date, and we recognize those costs in our Financial Statements over the vesting period during which the employee provides service (“the service period”) in exchange for the award.
On the grant date, we use a binomial lattice-based valuation model to estimate the fair value of each stock appreciation right and stock option granted. This valuation model uses a range of possible stock price outcomes over the term of the award, discounted back to a present value using a risk-free rate. Because of the limitations with closed-form valuation models, such as the Black-Scholes model, we have determined that this more flexible binomial model provides a better estimate of the fair value of our stock appreciation rights and stock options because it takes into account employee and non-employee director exercise behavior based on changes in the price of our stock and also allows us to use other dynamic assumptions. See Footnote No.
5
, “
Share-Based Compensation
” for further information.
Income Taxes
We record the amounts of taxes payable or refundable for the current year, as well as deferred tax liabilities and assets for the future tax consequences of events we have recognized in our Financial Statements or tax returns, using judgment in assessing future profitability and the likely future tax consequences of those events. We base our estimates of deferred tax assets and liabilities on current tax laws, rates and interpretations, and, in certain cases, business plans and other expectations about future outcomes. We develop our estimates of future profitability based on our historical data and experience, industry projections, micro and macro general economic condition projections, and our expectations.
Changes in existing tax laws and rates, their related interpretations, and the uncertainty generated by the current economic environment may affect the amounts of our deferred tax liabilities or the valuations of our deferred tax assets over time. Our accounting for deferred tax consequences represents management’s best estimate of future events that can be appropriately reflected in the accounting estimates.
For tax positions we have taken or expect to take in a tax return, we apply a more likely than not threshold, under which we must conclude a tax position is more likely than not to be sustained, assuming that the position will be examined by the appropriate taxing authority that has full knowledge of all relevant information, in order to continue to recognize the benefit. In determining our provision for income taxes, we use judgment, reflecting our estimates and assumptions, in applying the more likely than not threshold. We recognize accrued interest and penalties for our unrecognized tax benefits as a component of tax expense. See Footnote No.
6
,
“
Income Taxes
,” for further information.
59
Cash and Equivalents
We consider all highly liquid investments with an initial maturity of three months or less at date of purchase to be cash equivalents.
Accounts Receivable
Our accounts receivable primarily consist of amounts due from hotel owners with whom we have management and franchise agreements and include reimbursements of costs we incurred on behalf of managed and franchised properties. We generally collect these receivables within 30 days. We record an accounts receivable reserve when losses are probable, based on an assessment of historical collection activity and current business conditions. Our accounts receivable reserve was
$25 million
at year-end
2015
and
$33 million
at year-end
2014
.
Assets Held for Sale
We consider properties to be assets held for sale when (1) management commits to a plan to sell the property; (2) it is unlikely that the disposal plan will be significantly modified or discontinued; (3) the property is available for immediate sale in its present condition; (4) actions required to complete the sale of the property have been initiated; (5) sale of the property is probable and we expect the completed sale will occur within one year; and (6) the property is actively being marketed for sale at a price that is reasonable given our estimate of current market value. Upon designation of a property as an asset held for sale, we record the property’s value at the lower of its carrying value or its estimated fair value, less estimated costs to sell, and we cease depreciation. See Footnote No.
3
, “
Acquisitions and Dispositions
” for additional information on planned dispositions.
Goodwill
We assess goodwill for potential impairment at the end of each fiscal year, or during the year if an event or other circumstance indicates that we may not be able to recover the carrying amount of the net assets of the reporting unit. In evaluating goodwill for impairment, we may first assess qualitative factors to determine whether it is more likely than not (that is, a likelihood of more than 50 percent) that the fair value of
a reporting unit is less than its carrying amount. Qualitative factors that we consider include, for example, macroeconomic and industry conditions, overall financial performance, and other relevant entity-specific events. If we bypass the qualitative assessment, or if we conclude that it is more likely than not that the fair value of a reporting unit is less than its carrying value, then we perform a two-step goodwill impairment test to identify potential goodwill impairment and measure the amount of goodwill impairment we will recognize, if any.
In the first step of the two-step goodwill impairment test (“Step 1”), we compare the estimated fair value of the reporting unit with its carrying value. If the estimated fair value of the reporting unit exceeds its carrying amount, no further analysis is needed. If, however, the estimated fair value of the reporting unit is less than its carrying amount, we proceed to the second step and calculate the implied fair value of the reporting unit goodwill to determine whether any impairment is required. We calculate the implied fair value of the reporting unit goodwill by allocating the estimated fair value of the reporting unit to all of the unit’s assets and liabilities as if the unit had been acquired in a business combination. If the carrying value of the reporting unit’s goodwill exceeds the implied fair value of the goodwill, we recognize an impairment loss in the amount of that excess. In allocating the estimated fair value of the reporting unit to all of the assets and liabilities of the reporting unit, we use industry and market data, as well as knowledge of the industry and our past experience.
We calculate the estimated fair value of a reporting unit using the income approach. For the income approach, we use internally developed discounted cash flow models that include the following assumptions, among others: projections of revenues, expenses, and related cash flows based on assumed long-term growth rates and demand trends; expected future investments to grow new units; and estimated discount rates. We base these assumptions on our historical data and experience, third-party appraisals, industry projections, micro and macro general economic condition projections, and our expectations.
We have had
no
goodwill impairment charges for the last three fiscal years.
Intangibles and Long-Lived Assets
We assess indefinite-lived intangible assets for potential impairment and continued indefinite use at the end of each fiscal year, or during the year if an event or other circumstance indicates that we may not be able to recover the carrying amount of the asset. Similar to goodwill, we may first assess qualitative factors to determine whether it is more likely than not that the fair value of the indefinite-lived intangible is less than its carrying amount. If the carrying value of the asset exceeds the implied fair value, we recognize an impairment loss in the amount of that excess.
We test definite-lived intangibles and long-lived asset groups for recoverability when changes in circumstances indicate that we may not be able to recover the carrying value; for example, when there are material adverse changes in projected
60
revenues or expenses, significant under performance relative to historical or projected operating results, or significant negative industry or economic trends. We also test recoverability when management has committed to a plan to sell or otherwise dispose of an asset group and we expect to complete the plan within a year. We evaluate recoverability of an asset group by comparing its carrying value to the future net undiscounted cash flows that we expect the asset group will generate. If the comparison indicates that we will not be able to recover the carrying value of an asset group, we recognize an impairment loss for the amount by which the carrying value exceeds the estimated fair value. When we recognize an impairment loss for assets to be held and used, we depreciate the adjusted carrying amount of those assets over their remaining useful life.
We calculate the estimated fair value of an intangible asset or asset group using the income approach or the market approach. We utilize the same assumptions and methodology for the income approach that we describe in the “Goodwill” caption. For the market approach, we use internal analyses based primarily on market comparables and assumptions about market capitalization rates, growth rates, and inflation.
Investments
We may hold an equity interest in ventures established to develop or acquire and own hotel properties. These ventures are generally limited liability companies or limited partnerships. We account for investments in such entities using the cost method of accounting when we own a minimal investment and the equity method of accounting when we own more than a minimal investment. We account for investments in other ventures using the equity method of accounting when we exercise significant influence over the entities. If we do not exercise significant influence, we account for the investment using the cost method of accounting. We consolidate entities that we control.
Under the accounting guidance for the consolidation of variable interest entities, we analyze our variable interests, including equity investments, loans, and guarantees, to determine if an entity in which we have a variable interest is a variable interest entity. Our analysis includes both quantitative and qualitative reviews. We base our quantitative analysis on the forecasted cash flows of the entity, and our qualitative analysis on our review of the design of the entity, its organizational structure including decision-making ability, and relevant financial agreements. We also use our qualitative analysis to determine if we must consolidate a variable interest entity as its primary beneficiary.
We evaluate an investment for impairment when circumstances indicate that we may not be able to recover the carrying value. For example, when evaluating our ventures, we consider loan defaults, significant under-performance relative to historical or projected operating performance, or significant negative industry or economic trends.
We impair investments we account for using the equity and cost methods of accounting when we determine that there has been an “other-than-temporary” decline in the venture’s estimated fair value compared to its carrying value. Additionally, a venture’s commitment to a plan to sell some or all of its assets could cause us to evaluate the recoverability of the venture’s individual long-lived assets and possibly the venture itself.
We calculate the estimated fair value of an investment using either a market approach or an income approach. We utilize the same assumptions and methodology for the income approach that we describe in the “Goodwill” caption. For the market approach, we use internal analyses based primarily on market comparables and assumptions about market capitalization rates, growth rates, and inflation.
For investments in securities classified as available-for-sale, we determine the cost basis of the securities sold using specific identification, meaning that we track our securities individually.
Fair Value Measurements
We have various financial instruments we must measure at fair value on a recurring basis, including certain marketable securities and derivatives. See Footnote No.
14
, “
Fair Value of Financial Instruments
” for further information. We also apply the provisions of fair value measurement to various nonrecurring measurements for our financial and nonfinancial assets and liabilities.
Accounting standards define fair value as the price that would be received to sell an asset or paid to transfer a liability in an orderly transaction between market participants at the measurement date (an exit price). We measure our assets and liabilities using inputs from the following three levels of the fair value hierarchy:
Level 1 inputs are unadjusted quoted prices in active markets for identical assets or liabilities that we have the ability to access at the measurement date.
Level 2 inputs include quoted prices for similar assets and liabilities in active markets, quoted prices for identical or similar assets or liabilities in markets that are not active, inputs other than quoted prices that are observable for the
61
asset or liability (i.e., interest rates, yield curves, etc.), and inputs that are derived principally from or corroborated by observable market data by correlation or other means (market corroborated inputs).
Level 3 includes unobservable inputs that reflect our assumptions about what factors market participants would use in pricing the asset or liability. We develop these inputs based on the best information available, including our own data.
Derivative Instruments
We record derivatives at fair value. The designation of a derivative instrument as a hedge and its ability to meet the hedge accounting criteria determine how we reflect the change in fair value of the derivative instrument in our Financial Statements. A derivative qualifies for hedge accounting if, at inception, we expect the derivative will be highly effective in offsetting the underlying hedged cash flows or fair value and we fulfill the hedge documentation standards at the time we enter into the derivative contract. We designate a hedge as a cash flow hedge, fair value hedge, or a net investment in non-U.S. operations hedge based on the exposure we are hedging. For the effective portion of qualifying cash flow hedges, we record changes in fair value in other comprehensive income (“OCI”). We release the derivative’s gain or loss from OCI to match the timing of the underlying hedged items’ effect on earnings.
We review the effectiveness of our hedging instruments quarterly, recognize current period hedge ineffectiveness immediately in earnings, and discontinue hedge accounting for any hedge that we no longer consider to be highly effective. We recognize changes in fair value for derivatives not designated as hedges or those not qualifying for hedge accounting in current period earnings. Upon termination of cash flow hedges, we release gains and losses from OCI based on the timing of the underlying cash flows or revenue recognized, unless the termination results from the failure of the intended transaction to occur in the expected time frame. Such untimely transactions require us to immediately recognize in earnings the gains and/or losses that we previously recorded in OCI.
Changes in interest rates, currency exchange rates, and equity securities expose us to market risk. We manage our exposure to these risks by monitoring available financing alternatives, as well as through development and application of credit granting policies. We also use derivative instruments, including cash flow hedges, net investment in non-U.S. operations hedges, fair value hedges, and other derivative instruments, as part of our overall strategy to manage our exposure to market risks. As a matter of policy, we only enter into transactions that we believe will be highly effective at offsetting the underlying risk, and we do not use derivatives for trading or speculative purposes.
Loan Loss Reserves
We may make senior, mezzanine, and other loans to owners of hotels that we operate or franchise, generally to facilitate the development of a hotel and sometimes to facilitate brand programs or initiatives. We expect the owners to repay the loans in accordance with the loan agreements, or earlier as the hotels mature and capital markets permit. We use metrics such as loan-to-value ratios and debt service coverage, and other information about collateral and from third party rating agencies to assess the credit quality of the loan receivable, both upon entering into the loan agreement and on an ongoing basis as applicable.
On a regular basis, we individually assess loans for impairment. We use internally generated cash flow projections to determine if we expect the loans to be repaid under the terms of the loan agreements. If we conclude that it is probable a borrower will not repay a loan in accordance with its terms, we consider the loan impaired and begin recognizing interest income on a cash basis. To measure impairment, we calculate the present value of expected future cash flows discounted at the loan’s original effective interest rate or the estimated fair value of the collateral. If the present value or the estimated collateral is less than the carrying value of the loan receivable, we establish a specific impairment reserve for the difference.
If it is likely that a loan will not be collected based on financial or other business indicators, including our historical experience, our policy is to charge off the loan in the quarter in which we deem it uncollectible.
Guarantees
We measure and record our liability for the fair value of a guarantee on a nonrecurring basis, that is when we issue or modify a guarantee, using Level 3 internally developed inputs, as described above in this footnote under the heading “
Fair Value Measurements
.” We base our calculation of the estimated fair value of a guarantee on the income approach or the market approach, depending on the type of guarantee. For the income approach, we use internally developed discounted cash flow and Monte Carlo simulation models that include the following assumptions, among others: projections of revenues and expenses and related cash flows based on assumed growth rates and demand trends; historical volatility of projected performance; the guaranteed obligations; and applicable discount rates. We base these assumptions on our historical data and experience, industry projections, micro and macro general economic condition projections, and our expectations. For the market approach,
62
we use internal analyses based primarily on market comparable data and our assumptions about market capitalization rates, credit spreads, growth rates, and inflation.
The offsetting entry for the guarantee liability depends on the circumstances in which the guarantee was issued. Funding under the guarantee reduces the recorded liability. In most cases, when we do not forecast any funding, we amortize the liability into income on a straight-line basis over the remaining term of the guarantee. On a quarterly basis, we evaluate all material estimated liabilities based on the operating results and the terms of the guarantee. If we conclude that it is probable that we will be required to fund a greater amount than previously estimated, we record a loss except to the extent that the applicable contracts provide that the advance can be recovered as a loan.
Self-Insurance Programs
We self-insure for certain levels of property, liability, workers’ compensation and employee medical coverage. We accrue estimated costs of these self-insurance programs at the present value of projected settlements for known and incurred but not reported claims. We use a discount rate of
2.0
percent to determine the present value of the projected settlements, which we consider to be reasonable given our history of settled claims, including payment patterns and the fixed nature of the individual settlements.
We are subject to a variety of assessments for our insurance activities, including those by state guaranty funds and workers’ compensation second-injury funds. We record our liabilities for these assessments in the “Accrued expenses and other” caption of our Balance Sheets. These liabilities, which are not discounted, totaled
$5 million
at year-end
2015
and
$4 million
at year-end
2014
. We expect to pay the
$5 million
liability for assessments by the end of
2016
.
Legal Contingencies
We are subject to various legal proceedings and claims, the outcomes of which are uncertain. We record an accrual for legal contingencies when we determine that it is probable that we have incurred a liability and we can reasonably estimate the amount of the loss. In making such determinations we evaluate, among other things, the probability of an unfavorable outcome and, when we believe it probable that a liability has been incurred, our ability to make a reasonable estimate of the loss. We review these accruals each reporting period and make revisions based on changes in facts and circumstances.
Business Combinations
We allocate the purchase price of an acquisition to the tangible and intangible assets acquired and liabilities assumed based on their estimated fair values at the acquisition date. We recognize as goodwill the amount by which the purchase price of an acquired entity exceeds the net of the fair values assigned to the assets acquired and liabilities assumed. In determining the fair values of assets acquired and liabilities assumed, we use various recognized valuation methods including the income and market approaches. Further, we make assumptions within certain valuation techniques, including discount rates, royalty rates, and timing of future cash flows. We record the net assets and results of operations of an acquired entity in our Financial Statements from the acquisition date. We initially perform these valuations based upon preliminary estimates and assumptions by management or independent valuation specialists under our supervision, where appropriate, and make revisions as estimates and assumptions are finalized. We expense acquisition-related costs as incurred.
New Accounting Standards
Accounting Standards Update No. 2014-09 - “Revenue from Contracts with Customers” (“ASU No. 2014-09”)
ASU No. 2014-09 supersedes the revenue recognition requirements in Topic 605,
Revenue Recognition
, as well as most industry-specific guidance, and significantly enhances comparability of revenue recognition practices across entities and industries by providing a principles-based, comprehensive framework for addressing revenue recognition issues. In order for a provider of promised goods or services to recognize as revenue the consideration that it expects to receive in exchange for the promised goods or services, the provider should apply the following five steps: (1) identify the contract with a customer(s); (2) identify the performance obligations in the contract; (3) determine the transaction price; (4) allocate the transaction price to the performance obligations in the contract; and (5) recognize revenue when (or as) the entity satisfies a performance obligation. ASU No. 2014-09 also specifies the accounting for some costs to obtain or fulfill a contract with a customer and provides enhanced disclosure requirements. The Financial Accounting Standards Board (“FASB”) has deferred ASU No. 2014-09 for one year, and with that deferral, the standard will be effective for annual reporting periods beginning after December 15, 2017, including interim periods within that reporting period, which for us will be our 2018 first quarter. We are permitted to use either the retrospective or the modified retrospective method when adopting ASU No. 2014-09. We are still assessing the potential impact that ASU No. 2014-09 will have on our financial statements and disclosures, but we believe that there could be changes to the revenue recognition of real estate sales, franchise fees, and incentive management fees.
63
Accounting Standards Update No. 2015-03 - “Simplifying the Presentation of Debt Issuance Costs” (“ASU No. 2015-03”)
In April 2015, the FASB issued ASU No. 2015-03, which requires entities to present debt issuance costs in the balance sheet as a direct deduction from the related debt liability rather than as an asset. We adopted the standard in the 2015 fourth quarter and retrospectively applied the standard to the 2014 Balance Sheet by reclassifying $
10 million
of debt issuance costs from “Other noncurrent assets” to “Long-term debt.”
Accounting Standards Update No. 2015-17 - “Balance Sheet Classification of Deferred Taxes” (“ASU No. 2015-17”)
In November 2015, the FASB issued ASU No. 2015-17, which requires entities with a classified balance sheet to present all deferred tax assets and liabilities as noncurrent. We adopted the standard in the 2015 fourth quarter and retrospectively applied the standard to the 2014 Balance Sheet, resulting in reclassifications of $
311
million of current deferred tax assets and $
22
million of current deferred tax liabilities to noncurrent deferred tax assets.
3
.
ACQUISITIONS AND DISPOSITIONS
2016 Planned Acquisition
On November 15, 2015, we entered into an Agreement and Plan of Merger (the “Merger Agreement”) to combine with Starwood Hotels & Resorts Worldwide, Inc. (“Starwood”). The Merger Agreement provides for the Company to combine with Starwood in a series of transactions after which Starwood will be an indirect wholly owned subsidiary of the Company. If these transactions are completed, shareholders of Starwood will receive
0.920
shares of our common stock, par value $
0.01
per share, and $
2.00
in cash, without interest, for each share of Starwood common stock, par value $0.01 per share, that they own immediately before these transactions. We expect that the combination will close in mid-2016, after customary conditions are satisfied, including shareholder approvals, required antitrust approvals, and the completion of Starwood’s previously announced spin-off of its vacation ownership business, or another spin-off, split-off, analogous disposition, or sale of its vacation ownership business.
2015 Acquisitions
In the 2015 second quarter, we acquired the Delta Hotels and Resorts brand, management and franchise business, together with related intellectual property, from Delta Hotels Limited Partnership, a subsidiary of British Columbia Investment Management Corporation (“bcIMC”) for approximately
$134 million
(
C$170 million
), plus
$2 million
(
C$2 million
) of working capital, for a total purchase price of
$136 million
(
C$172 million
) in cash. We finalized the purchase accounting during the 2015 third quarter and recognized approximately:
$127 million
(
C$161 million
) in intangible assets consisting of contract assets of
$17 million
(
C$22 million
), an indefinite-lived brand intangible of
$91 million
(
C$115 million
), and goodwill of
$19 million
(
C$24 million
); and
$9 million
(
C$11 million
) of tangible assets consisting of property and equipment and other assets. As a result of the transaction, we added
37
open hotels and resorts with
9,590
rooms across Canada, including
27
properties under management agreements (
13
of which have new 30-year management agreements with bcIMC-affiliated entities) and
10
properties under franchise agreements, plus
five
hotels under development (including
one
under a new 30-year management agreement with a bcIMC-affiliated entity).
2015 Dispositions and Planned Dispositions as of Year-End 2015
We sold The Miami Beach EDITION during the 2015 first quarter, and we sold The New York (Madison Square Park) EDITION at the beginning of the 2015 second quarter. We received total cash proceeds of
$566 million
in 2015. In the 2015 first quarter, we recorded a
$6 million
impairment charge for The New York (Madison Square Park) EDITION in the “Depreciation, amortization, and other” caption of our Income Statements as our cost estimates exceeded our total fixed sales price. We did not allocate the charge to any of our segments.
In the 2015 first quarter, we sold our interest in an International property and received
$27 million
(
€24 million
) in cash.
In the 2015 third quarter, our equity method investment in an entity that owns two hotels was redeemed. We received $
42 million
in cash, which was our basis in the investment, and included the proceeds in the “other” caption of our Investing Activities section of our Consolidated Statements of Cash Flows.
In the 2015 fourth quarter, we sold an International property and received
$62 million
in cash. We recorded a loss of
$11 million
in the “Gains and other income, net” caption of our Income Statements.
At year-end
2015
, we held
$78 million
of assets classified as “Assets held for sale” and
$3 million
of liabilities associated with those assets, which we recorded under “Accrued expenses and other” on our Balance Sheet for assets that we expect to
64
sell by early 2016. We determined that the carrying values of those assets exceeded their fair values, which we estimated using a market approach and Level 3 inputs. Consequently, we recorded charges for the expected disposal loss, which represents the amount by which the carrying values, including any goodwill we must allocate, exceeds the fair values, less our anticipated cost to sell. We classified assets as held for sale and associated liabilities that relate to the following:
|
•
|
$47 million
in assets and
$1 million
in liabilities for a North American Limited-Service segment plot of land. During the 2015 second quarter, we determined that achieving certain milestones outlined in a signed purchase and sale agreement was likely, and we recorded a
$4 million
expected loss in the “Gains and other income, net” caption of our Income Statements.
|
|
•
|
$31 million
in assets and
$2 million
in liabilities for The Miami Beach EDITION residences (the “residences”). During the 2015 first quarter, we recorded a
$6 million
charge, which we did not allocate to any of our segments, following a review of comparable property values. We classified the residences charge in the “Depreciation, amortization, and other” caption of our Income Statements because it is part of a larger mixed-use project for which we had recorded similar charges in prior periods. During 2015, we sold
five
residences and received
$20 million
in cash.
|
2014 Acquisitions
In the 2014 second quarter, we acquired the Protea Hotel Group’s brands and hotel management business (“Protea Hotels”) for
$195 million
(ZAR
2.059 billion
) in cash. We finalized the purchase accounting during the 2015 second quarter, adjusting fair value amounts that we had provisionally recognized in the 2014 second quarter following refinements to our intangible valuation models. The 2015 second quarter adjustments included a decrease to our contract assets of
$40 million
and a decrease to our indefinite-lived brand intangible of
$12 million
, with a corresponding increase to goodwill. These adjustments, and the related contract asset amortization impacts, did not have a significant impact on our previously reported Financial Statements, and accordingly, we did not retrospectively adjust those Financial Statements.
In the 2014 fourth quarter, we acquired a property under construction in Brazil for
$31 million
(
R$74 million
) in cash.
2014 Dispositions
In the 2014 first quarter, we sold The London EDITION to a third party, received approximately $
233
million in cash, and simultaneously entered into definitive agreements to sell The Miami Beach and The New York (Madison Square Park) EDITION hotels upon completion of construction to the same third party. The total sales price for the
three
EDITION hotels was approximately $
816
million in cash and assumed liabilities.
We retained long-term management agreements for each of the hotels. During 2014, we evaluated the
three
hotels for recovery and recorded a $
25
million net impairment charge, primarily attributable to The Miami Beach EDITION, in the “Depreciation, amortization, and other” caption of our Income Statements as our cost estimates exceeded our total fixed sales price. We did not allocate the charge to any of our segments.
At year-end 2014, we had $
233
million in assets related to The Miami Beach EDITION hotel and residences (the hotel representing $
157
million in property and equipment and $
17
million in current assets) classified in the “Assets held for sale” caption of the Balance Sheet and $
26
million in liabilities (the hotel representing $
14
million) classified in liabilities held for sale in the “Accrued expenses and other” caption of the Balance Sheet. We did not classify The New York (Madison Square Park) EDITION assets and liabilities as held for sale because the hotel was under construction and not yet available for immediate sale in its present condition.
In the 2014 fourth quarter, we sold a portion of The Miami Beach EDITION residences and received approximately $
100
million in cash.
In the 2014 fourth quarter, we sold for approximately $
42
million in cash a land parcel to a third-party that agreed to develop a property. We retained certain repurchase rights in the event the buyer breaches covenants. We reclassified the property to “Other” current assets and offset this amount with a liability for the cash received.
In the 2014 first quarter, we sold our right to acquire the landlord’s interest in a leased real estate property and certain attached assets of the property, consisting of $
106
million (€
77
million) in property and equipment and $
48
million (€
35
million) in liabilities. We received $
62
million (€
45
million) in cash and transferred $
45
million (€
33
million) of related obligations. We continue to operate the property under a long-term management agreement.
65
4
.
EARNINGS PER SHARE
The table below illustrates the reconciliation of the earnings and number of shares used in our calculations of basic and diluted earnings per share:
|
|
2015
|
2014
|
2013
|
||||||||
|
(in millions, except per share amounts)
|
|
|
|||||||||
|
Computation of Basic Earnings Per Share
|
|||||||||||
|
Net income
|
$
|
859
|
|
$
|
753
|
|
$
|
626
|
|
||
|
Weighted average shares outstanding
|
267.3
|
|
289.9
|
|
305.0
|
|
|||||
|
Basic earnings per share
|
$
|
3.22
|
|
$
|
2.60
|
|
$
|
2.05
|
|
||
|
Computation of Diluted Earnings Per Share
|
|||||||||||
|
Net income
|
$
|
859
|
|
$
|
753
|
|
$
|
626
|
|
||
|
Weighted average shares outstanding
|
267.3
|
|
289.9
|
|
305.0
|
|
|||||
|
Effect of dilutive securities
|
|||||||||||
|
Employee stock option and appreciation right plans
|
2.3
|
|
3.1
|
|
4.0
|
|
|||||
|
Deferred stock incentive plans
|
0.6
|
|
0.7
|
|
0.8
|
|
|||||
|
Restricted stock units
|
2.6
|
|
3.1
|
|
3.2
|
|
|||||
|
Shares for diluted earnings per share
|
272.8
|
|
296.8
|
|
313.0
|
|
|||||
|
Diluted earnings per share
|
$
|
3.15
|
|
$
|
2.54
|
|
$
|
2.00
|
|
||
We compute the effect of dilutive securities using the treasury stock method and average market prices during the period. We excluded the following antidilutive stock options and stock appreciation rights in our calculation of diluted earnings per share because their exercise prices were greater than the average market prices for the applicable periods:
0.2 million
for
2015
,
zero
for
2014
, and
0.4 million
for
2013
.
5
.
SHARE-BASED COMPENSATION
Under our Stock and Cash Incentive Plan (the “Stock Plan”), we award: (1) stock options (our “Stock Option Program”) to purchase our Class A Common Stock (“common stock”); (2) stock appreciation rights (“SARs”) for our common stock (our “SAR Program”); (3) restricted stock units (“RSUs”) of our common stock; and (4) deferred stock units. We also issue performance-based RSUs (“PSUs”) to named executive officers and some of their direct reports under the Stock Plan. We grant awards at exercise prices or strike prices that equal the market price of our common stock on the date of grant.
During
2015
, we granted
1.3 million
RSUs,
0.1 million
PSUs, and
0.3 million
SARs.
We recorded share-based compensation expense for award grants of
$113 million
in
2015
,
$109 million
in
2014
, and
$116 million
in
2013
. Deferred compensation costs for unvested awards totaled
$116 million
at year-end
2015
and
$114 million
at year-end
2014
. As of year-end
2015
, we expect to recognize these deferred compensation expenses over a weighted average period of
two
years.
We present the tax benefits and costs resulting from the exercise or vesting of share-based awards as financing cash flows. The exercise of share-based awards resulted in tax benefits of
$34 million
in
2015
,
$92 million
in
2014
, and
$121 million
in
2013
.
We received cash from the exercise of stock options of
$6 million
in
2015
,
$86 million
in
2014
, and
$78 million
in
2013
.
RSUs and PSUs
We issue RSUs under the Stock Plan to certain officers and key employees, and those units vest generally over
four
years in equal annual installments commencing one year after the grant date. We recognize compensation expense for RSUs over the service period equal to the fair market value of the stock units on the date of issuance. Upon vesting, RSUs convert to shares of our common stock which we distribute from treasury shares. In addition to being subject to pro-rata annual vesting conditioned on continued service consistent with the standard form of RSUs, PSUs are also subject to the satisfaction of certain performance conditions based on achievement of pre-established targets for EBITDA, RevPAR Index, room openings, and net administrative expense over, or at the end of, a
three
-year vesting period. The following information on RSUs includes PSUs.
66
We had deferred compensation costs for RSUs of approximately
$112 million
at year-end
2015
and
$109 million
at year-end
2014
. The weighted average remaining term for RSU grants outstanding at year-end
2015
was
two
years.
The following table provides additional information on RSUs for the last three fiscal years:
|
2015
|
2014
|
2013
|
|||||||||
|
Share-based compensation expense (in millions)
|
$
|
103
|
|
$
|
98
|
|
$
|
101
|
|
||
|
Weighted average grant-date fair value (per RSU)
|
$
|
78
|
|
$
|
52
|
|
$
|
38
|
|
||
|
Aggregate intrinsic value of converted and distributed RSUs (in millions)
|
$
|
195
|
|
$
|
144
|
|
$
|
125
|
|
||
The following table presents the
2015
changes in our outstanding RSU grants and the associated weighted average grant-date fair values:
|
Number of RSUs
(in millions)
|
Weighted
Average
Grant-Date
Fair Value
(per RSU)
|
|||||
|
Outstanding at year-end 2014
|
6.0
|
|
$
|
42
|
|
|
|
Granted during 2015
(1)
|
1.4
|
|
78
|
|
||
|
Distributed during 2015
|
(2.4
|
)
|
39
|
|
||
|
Forfeited during 2015
|
(0.1
|
)
|
52
|
|
||
|
Outstanding at year-end 2015
|
4.9
|
|
$
|
53
|
|
|
|
(1)
|
Includes
0.1 million
PSUs granted to named executive officers.
|
SARs
We may grant SARs to officers and key employees (“Employee SARs”) at exercise prices or strike prices equal to the market price of our common stock on the grant date. Employee SARs expire
ten
years after the grant date and both vest and may be exercised in cumulative installments of one quarter at the end of each of the first
four
years following the grant date. We may grant SARs to directors (“Director SARs”) at exercise prices or strike prices equal to the market price of our common stock on the grant date. Director SARs generally expire
ten
years after the date of grant and vest upon grant; however, they are generally not exercisable until
one
year after grant. On exercise of SARs, holders receive the number of shares of our common stock equal to the number of SARs that are being exercised multiplied by the quotient of (a) the stock price on the date of exercise minus the exercise price, divided by (b) the stock price on the date of exercise.
We recognized compensation expense for Employee SARs and Director SARs of
$7 million
in
2015
,
$8 million
in
2014
, and
$12 million
in
2013
. We had deferred compensation costs related to SARs of approximately
$3 million
in
2015
and
$3 million
in
2014
. Upon the exercise of SARs, we issue shares from treasury shares.
The following table presents the
2015
changes in our outstanding SARs and the associated weighted average exercise prices:
|
Number of SARs
(in millions)
|
Weighted Average
Exercise Price
|
|||||
|
Outstanding at year-end 2014
|
5.8
|
|
$
|
33
|
|
|
|
Granted during 2015
|
0.3
|
|
83
|
|
||
|
Exercised during 2015
|
(0.5
|
)
|
34
|
|
||
|
Forfeited during 2015
|
—
|
|
76
|
|
||
|
Outstanding at year-end 2015
|
5.6
|
|
$
|
36
|
|
|
67
The following tables show the number of Employee SARs and Director SARs we granted in the last three fiscal years, the associated weighted average exercise prices, and the associated weighted average grant-date fair values:
|
Employee SARs
|
2015
|
2014
|
2013
|
||||||||
|
Employee SARs granted (in millions)
|
0.3
|
|
0.3
|
|
0.7
|
|
|||||
|
Weighted average exercise price (per SAR)
|
$
|
83
|
|
$
|
53
|
|
$
|
39
|
|
||
|
Weighted average grant-date fair value (per SAR)
|
$
|
26
|
|
$
|
17
|
|
$
|
13
|
|
||
|
Director SARs
|
2015
|
2014
|
2013
|
||||||||
|
Director SARs granted
|
2,773
|
|
3,277
|
|
5,903
|
|
|||||
|
Weighted average exercise price (per SAR)
|
$
|
80
|
|
$
|
59
|
|
$
|
44
|
|
||
|
Weighted average grant-date fair value (per SAR)
|
$
|
29
|
|
$
|
22
|
|
$
|
15
|
|
||
Outstanding SARs had total intrinsic values of
$232 million
at year-end
2015
and
$264 million
at year-end
2014
. Exercisable SARs had total intrinsic values of
$209 million
at year-end
2015
and
$197 million
at year-end
2014
. SARs exercised during
2015
had total intrinsic values of
$23 million
and SARs exercised in
2014
had total intrinsic values of
$33 million
.
We used the following assumptions to determine the fair value of the SARs and stock options we granted to employees and non-employee directors in
2015
,
2014
, and
2013
:
|
2015
|
2014
|
2013
|
||||||
|
Expected volatility
|
30
|
%
|
29 - 30%
|
|
30 - 31%
|
|
||
|
Dividend yield
|
1.04
|
%
|
1.14
|
%
|
1.17
|
%
|
||
|
Risk-free rate
|
1.9 - 2.3%
|
|
2.2 - 2.8%
|
|
1.8 - 1.9%
|
|
||
|
Expected term (in years)
|
6 - 10
|
|
6 - 10
|
|
8 - 10
|
|
||
In making these assumptions, we base expected volatility on the historical movement of the Company’s stock price. We base risk-free rates on the corresponding U.S. Treasury spot rates for the expected duration at the date of grant, which we convert to a continuously compounded rate. The dividend yield assumption takes into consideration both historical levels and expectations of future dividend payout. The weighted average expected terms for SARs are an output of our valuation model which utilizes historical data in estimating the period of time that the SARs are expected to remain unexercised. We calculate the expected terms for SARs for separate groups of retirement eligible and non-retirement eligible employees and non-employee directors. Our valuation model also uses historical data to estimate exercise behaviors, which includes determining the likelihood that employees will exercise their SARs before expiration at a certain multiple of stock price to exercise price. In recent years, non-employee directors have generally exercised grants in their last year of exercisability.
Deferred Stock Units
We also issue deferred stock units to non-employee directors. These non-employee directors deferred stock units vest within
one
year and are
distributed upon election
.
The following table presents the share-based compensation expense, the number of deferred stock units we granted, the weighted average grant-date fair value, and the aggregate intrinsic value for the last three fiscal years for non-employee director deferred stock units:
|
2015
|
2014
|
2013
|
|||||||||
|
Share-based compensation expense (in millions)
|
$
|
1.1
|
|
$
|
1.2
|
|
$
|
1.4
|
|
||
|
Non-employee director deferred stock units granted
|
15,000
|
|
21,000
|
|
31,000
|
|
|||||
|
Weighted average grant-date fair value (per share)
|
$
|
80
|
|
$
|
59
|
|
$
|
44
|
|
||
|
Aggregate intrinsic value of shares distributed (in millions)
|
$
|
1.8
|
|
$
|
0.8
|
|
$
|
0.7
|
|
||
We had
261,000
outstanding non-employee deferred stock units at year-end
2015
, and
268,000
outstanding at year-end
2014
. The weighted average grant-date fair value of those outstanding deferred stock units was
$33
for
2015
and
$30
for
2014
.
Other Information
At year-end
2015
, we had
24 million
remaining shares authorized under the Stock Plan, including
6 million
shares under the Stock Option Program and the SAR Program.
68
6
.
INCOME TAXES
The components of our earnings before income taxes for the last three fiscal years consisted of:
|
($ in millions)
|
2015
|
2014
|
2013
|
||||||||
|
U.S.
|
$
|
896
|
|
$
|
808
|
|
$
|
630
|
|
||
|
Non-U.S.
|
359
|
|
280
|
|
267
|
|
|||||
|
$
|
1,255
|
|
$
|
1,088
|
|
$
|
897
|
|
|||
Our provision for income taxes for the last three fiscal years consists of:
|
($ in millions)
|
2015
|
2014
|
2013
|
|||||||||
|
Current
|
-U.S. Federal
|
$
|
(167
|
)
|
$
|
(224
|
)
|
$
|
(139
|
)
|
||
|
-U.S. State
|
(40
|
)
|
(43
|
)
|
(17
|
)
|
||||||
|
-Non-U.S.
|
(50
|
)
|
(47
|
)
|
(44
|
)
|
||||||
|
(257
|
)
|
(314
|
)
|
(200
|
)
|
|||||||
|
Deferred
|
-U.S. Federal
|
(131
|
)
|
(21
|
)
|
(68
|
)
|
|||||
|
-U.S. State
|
(7
|
)
|
(5
|
)
|
(10
|
)
|
||||||
|
-Non-U.S.
|
(1
|
)
|
5
|
|
7
|
|
||||||
|
(139
|
)
|
(21
|
)
|
(71
|
)
|
|||||||
|
$
|
(396
|
)
|
$
|
(335
|
)
|
$
|
(271
|
)
|
||||
Our current tax provision does not reflect the following benefits attributable to us for the vesting or exercise of employee share-based awards:
$34 million
in
2015
,
$89 million
in
2014
, and
$66 million
in
2013
. The preceding table includes tax credits of
$4 million
in
2015
,
$4 million
in
2014
, and
$3 million
in
2013
. We had tax applicable to other comprehensive income of
$2 million
in
2015
,
$5 million
in
2014
, and
$2 million
in
2013
.
We have made no provision for U.S. income taxes or additional non-U.S. taxes on the cumulative unremitted earnings of non-U.S. subsidiaries (
$1,109 million
as of year-end
2015
). We consider the earnings for substantially all non-U.S. subsidiaries to be indefinitely reinvested. These earnings could become subject to additional taxes if the non-U.S. subsidiaries dividend or loan those earnings to a U.S. affiliate or if we sell our interests in the non-U.S. subsidiaries. We cannot practically estimate the amount of additional taxes that might be payable on the unremitted earnings.
Unrecognized Tax Benefits
The following table reconciles our unrecognized tax benefit balance for each year from the beginning of
2013
to the end of
2015
:
|
($ in millions)
|
Amount
|
||
|
Unrecognized tax benefit at beginning of 2013
|
$
|
29
|
|
|
Change attributable to tax positions taken during the current period
|
8
|
|
|
|
Decrease attributable to settlements with taxing authorities
|
(2
|
)
|
|
|
Decrease attributable to lapse of statute of limitations
|
(1
|
)
|
|
|
Unrecognized tax benefit at year-end 2013
|
34
|
|
|
|
Change attributable to tax positions taken during the current period
|
3
|
|
|
|
Decrease attributable to settlements with taxing authorities
|
(27
|
)
|
|
|
Decrease attributable to lapse of statute of limitations
|
—
|
|
|
|
Unrecognized tax benefit at year-end 2014
|
10
|
|
|
|
Change attributable to tax positions taken during the current period
|
15
|
|
|
|
Decrease attributable to settlements with taxing authorities
|
—
|
|
|
|
Decrease attributable to lapse of statute of limitations
|
(1
|
)
|
|
|
Unrecognized tax benefit at year-end 2015
|
$
|
24
|
|
These unrecognized tax benefits reflect the following year-over-year changes: (1) a
$14 million
increase in
2015
, largely attributable to a U.S. federal tax issue regarding transfer pricing; (2) a
$24 million
decrease in
2014
, largely attributable to the favorable settlements reached with taxing authorities on both federal and international positions taken in prior years; and (3) a
69
$5 million
increase in
2013
, primarily due to a U.S. federal tax issue, offset by a settlement with international taxing authorities.
Our unrecognized tax benefit balances included
$15 million
at year-end
2015
,
$7 million
at year-end
2014
, and
$12 million
at year-end
2013
of tax positions that, if recognized, would impact our effective tax rate.
We file income tax returns, including returns for our subsidiaries, in various jurisdictions around the world. The Internal Revenue Service (“IRS”) has examined our federal income tax returns, and we have settled all issues for tax years through 2013. We participate in the IRS Compliance Assurance Program, which accelerates IRS examination of key transactions with the goal of resolving any issues before the taxpayer files its return. As a result, our 2014 tax year audit is complete, pending the resolution of one issue. Our 2015 tax year audit is currently ongoing. Various foreign, state, and local income tax returns are also under examination by the applicable taxing authorities. We believe it is reasonably possible that we will resolve a transfer pricing issue for 2014 and 2015 during the next
12
months for which we have an unrecognized tax balance of
$15 million
.
Deferred Income Taxes
Deferred income tax balances reflect the effects of temporary differences between the carrying amounts of assets and liabilities and their tax bases, as well as from net operating loss and tax credit carry-forwards. We state those balances at the enacted tax rates we expect will be in effect when we actually pay or recover the taxes. Deferred income tax assets represent amounts available to reduce income taxes we will pay on taxable income in future years. We evaluate our ability to realize these future tax deductions and credits by assessing whether we expect to have sufficient future taxable income from all sources, including reversal of taxable temporary differences, forecasted operating earnings, and available tax planning strategies to utilize these future deductions and credits. We establish a valuation allowance when we no longer consider it more likely than not that a deferred tax asset will be realized.
We had the following total deferred tax assets and liabilities at year-end
2015
and year-end
2014
:
|
($ in millions)
|
At Year-End 2015
|
At Year-End 2014
|
|||||
|
Deferred tax assets
|
$
|
672
|
|
$
|
819
|
|
|
|
Deferred tax liabilities
|
(16
|
)
|
(16
|
)
|
|||
|
Net deferred taxes
|
$
|
656
|
|
$
|
803
|
|
|
The following table presents the tax effect of each type of temporary difference and carry-forward that gave rise to a significant portion of our deferred tax assets and liabilities as of year-end
2015
and year-end
2014
:
|
($ in millions)
|
At Year-End 2015
|
At Year-End 2014
|
|||||
|
Employee benefits
|
$
|
348
|
|
$
|
347
|
|
|
|
Net operating loss carry-forwards
|
205
|
|
257
|
|
|||
|
Tax credits
|
111
|
|
182
|
|
|||
|
Reserves
|
63
|
|
57
|
|
|||
|
Frequent guest program
|
68
|
|
47
|
|
|||
|
Self-insurance
|
21
|
|
24
|
|
|||
|
Deferred income
|
21
|
|
20
|
|
|||
|
Joint venture interests
|
(49
|
)
|
(34
|
)
|
|||
|
Other, net
|
31
|
|
48
|
|
|||
|
Deferred taxes
|
819
|
|
948
|
|
|||
|
Less: valuation allowance
|
(163
|
)
|
(145
|
)
|
|||
|
Net deferred taxes
|
$
|
656
|
|
$
|
803
|
|
|
At year-end
2015
, we had approximately
$34 million
of tax credits that expire through
2025
and
$77 million
of tax credits that do not expire. We recorded
$5 million
of net operating loss benefits in
2015
and
$10 million
in
2014
. At year-end
2015
, we had approximately
$961 million
of primarily state and foreign net operating losses, of which
$413 million
expire through
2035
.
70
Reconciliation of U.S. Federal Statutory Income Tax Rate to Actual Income Tax Rate
The following table reconciles the U.S. statutory tax rate to our effective income tax rate for the last three fiscal years:
|
2015
|
2014
|
2013
|
||||||
|
U.S. statutory tax rate
|
35.0
|
%
|
35.0
|
%
|
35.0
|
%
|
||
|
U.S. state income taxes, net of U.S. federal tax benefit
|
2.9
|
|
2.7
|
|
2.6
|
|
||
|
Nondeductible expenses
|
0.2
|
|
0.2
|
|
0.5
|
|
||
|
Non-U.S. income
|
(5.2
|
)
|
(4.8
|
)
|
(5.7
|
)
|
||
|
Change in valuation allowance
|
1.2
|
|
(0.4
|
)
|
0.3
|
|
||
|
Tax credits
|
(0.3
|
)
|
(0.3
|
)
|
(0.4
|
)
|
||
|
Other, net
|
(2.3
|
)
|
(1.6
|
)
|
(2.1
|
)
|
||
|
Effective rate
|
31.5
|
%
|
30.8
|
%
|
30.2
|
%
|
||
We paid cash for income taxes, net of refunds of
$218 million
in
2015
,
$172 million
in
2014
, and
$77 million
in
2013
.
7
.
COMMITMENTS AND CONTINGENCIES
Guarantees
We issue guarantees to certain lenders and hotel owners, chiefly to obtain long-term management contracts. The guarantees generally have a stated maximum funding amount and a term of
four
to
ten
years. The terms of guarantees to lenders generally require us to fund if cash flows from hotel operations are inadequate to cover annual debt service or to repay the loan at maturity. The terms of the guarantees to hotel owners generally require us to fund if the hotels do not attain specified levels of operating profit. Guarantee fundings to lenders and hotel owners are generally recoverable as loans repayable to us out of future hotel cash flows and/or proceeds from the sale of hotels. We also enter into project completion guarantees with certain lenders in conjunction with hotels that we or our joint venture partners are building.
We present the maximum potential amount of our future guarantee fundings and the carrying amount of our liability for guarantees for which we are the primary obligor at year-end
2015
in the following table:
|
($ in millions)
Guarantee Type
|
Maximum Potential
Amount
of Future Fundings
|
Liability for
Guarantees
|
|||||
|
Debt service
|
$
|
113
|
|
$
|
23
|
|
|
|
Operating profit
|
103
|
|
43
|
|
|||
|
Other
|
12
|
|
1
|
|
|||
|
Total guarantees where we are the primary obligor
|
$
|
228
|
|
$
|
67
|
|
|
Our liability at year-end
2015
for guarantees for which we are the primary obligor is reflected in our Balance Sheets as
$4 million
of “Accrued expenses and other” and
$63 million
of “Other noncurrent liabilities.”
Our guarantees listed in the preceding table include
$11 million
of debt service guarantees,
$42 million
of operating profit guarantees, and
$1 million
of other guarantees that will not be in effect until the underlying properties open and we begin to operate the properties or certain other events occur.
The table above does not include a “contingent purchase obligation,” which is not currently in effect, that we entered into in the 2014 first quarter to provide credit support to lenders for a construction loan. We entered into that agreement in conjunction with signing a management agreement for The Times Square EDITION hotel in New York City (currently projected to open in 2017), and the hotel’s ownership group obtaining acquisition financing and entering into agreements concerning future construction financing for the mixed use project (which includes both the hotel and adjacent retail space). Under the agreement, we granted the lenders the right, upon an uncured event of default by the hotel owner under, and an acceleration of, the mortgage loan, to require us to purchase the hotel component of the property for
$315 million
during the first
two
years after opening. Because we would acquire the building upon exercise of the put option, we have not included the amount in the table above. The lenders may extend this period for up to
three
years to complete foreclosure if the loan has been accelerated and certain other conditions are met. We do not currently expect that the lenders will require us to purchase the hotel component. We have no ownership interest in this hotel.
71
The preceding table also does not include the following guarantees:
|
•
|
$62 million
of guarantees for Senior Living Services lease obligations of
$46 million
(expiring in
2019
) and lifecare bonds of
$16 million
(estimated to expire in
2019
), for which we are secondarily liable. Sunrise Senior Living, Inc. (“Sunrise”) is the primary obligor on both the leases and
$3 million
of the lifecare bonds; HCP, Inc., as successor by merger to CNL Retirement Properties, Inc. (“CNL”), is the primary obligor on
$13 million
of the lifecare bonds. Before we sold the Senior Living Services business in
2003
, these were our guarantees of obligations of our then consolidated Senior Living Services subsidiaries. Sunrise and CNL have indemnified us for any fundings we may be called upon to make under these guarantees. Our liability for these guarantees had a carrying value of
$3 million
at year-end
2015
. In conjunction with our consent to the 2011 extension of certain lease obligations until
2018
, Sunrise provided us with
$1 million
of cash collateral and an
$85 million
letter of credit issued by Key Bank to secure our continued exposure under the lease guarantees during the extension term and certain other obligations of Sunrise. The letter of credit balance was
$55 million
at year-end
2015
, which decreased as a result of lease payments made and lifecare bonds redeemed. During the extension term, Sunrise agreed to make an annual payment to us from the cash flow of the continuing lease facilities, subject to a
$1 million
annual minimum. In the 2013 first quarter, Sunrise merged with Health Care REIT, Inc. (“HCN”), and Sunrise’s management business was acquired by an entity formed by affiliates of Kohlberg Kravis Roberts & Co. LP, Beecken Petty O’Keefe & Co., Coastwood Senior Housing Partners LLC, and HCN. In April of 2014, HCN and Revera Inc., a private provider of senior living services, acquired Sunrise’s management business.
|
|
•
|
Lease obligations, for which we became secondarily liable when we acquired the Renaissance Hotel Group N.V. in
1997
, consisting of annual rent payments of approximately
$4 million
and total remaining rent payments through the initial term of approximately
$19 million
. The majority of these obligations expire by the end of
2020
. CTF Holdings Ltd. (“CTF”) had originally provided
€35 million
in cash collateral in the event that we are required to fund under such guarantees, approximately
$3 million
(
€2 million
) of which remained at year-end
2015
. Our exposure for the remaining rent payments through the initial term will decline to the extent that CTF obtains releases from the landlords or these hotels exit our system. Since the time we assumed these guarantees, we have not funded any amounts, and we do not expect to fund any amounts under these guarantees in the future.
|
|
•
|
A guarantee relating to the timeshare business, which was outstanding at the time of the 2011 Timeshare spin-off and for which we became secondarily liable as part of the spin-off. The guarantee relates to a Marriott Vacations Worldwide Corporation (“MVW”) payment obligation, for which we had an exposure of
$5 million
(
7 million
Singapore Dollars) at year-end. MVW has indemnified us for this obligation, which we expect will expire in
2022
. We have not funded any amounts under this obligation, and do not expect to do so in the future. Our liability for this obligation had a carrying value of
$1 million
at year-end
2015
.
|
|
•
|
A guarantee for a lease, originally entered into in 2000, for which we became secondarily liable in 2012 as a result of our sale of the ExecuStay corporate housing business to Oakwood Worldwide (“Oakwood”). Oakwood has indemnified us for the obligations under this guarantee. Our total exposure at year-end
2015
for this guarantee was
$6 million
in future rent payments through the end of the lease in 2019. Our liability for this guarantee had a carrying value of
$1 million
at year-end
2015
.
|
In addition to the guarantees described in the preceding paragraphs, in conjunction with financing obtained for specific projects or properties owned by joint ventures in which we are a party, we may provide industry standard indemnifications to the lender for loss, liability, or damage occurring as a result of the actions of the other joint venture owner or our own actions.
Commitments
In addition to the guarantees we note in the preceding paragraphs, at year-end
2015
, we had the following commitments outstanding, which are not recorded on our Balance Sheets:
|
•
|
A commitment to invest up to
$7 million
of equity for a non-controlling interest in a partnership that plans to purchase North American full-service and limited-service properties, or purchase or develop hotel-anchored mixed-use real estate projects. We do not expect to fund this commitment, which expires in 2016.
|
|
•
|
A commitment to invest up to
$22 million
of equity for non-controlling interests in a partnership that plans to purchase or develop limited-service properties in Asia. We expect to fund
$3 million
of this commitment
in 2016. We do not expect to fund the remaining
$19 million
of this commitment prior to the end of the commitment period in 2016.
|
|
•
|
A commitment, with no expiration date, to invest up to
$11 million
in a joint venture for development of a new property. We do not expect to fund this commitment.
|
72
|
•
|
We have a right and under certain circumstances an obligation to acquire our joint venture partner’s remaining interests in
two
joint ventures over the next
six years
at a price based on the performance of the ventures. In conjunction with this contingent obligation, we advanced
$20 million
(
€15 million
) in deposits,
$13 million
(
€11 million
) of which is remaining. The amounts on deposit are refundable to the extent we do not acquire our joint venture partner’s remaining interests.
|
|
•
|
A loan commitment of
$75 million
related to the construction of a North American Full-Service property. We funded
$3 million
in
2015
and expect to fund
$25 million
in
2016
and
$47 million
in
2017
.
|
|
•
|
A $
5 million
loan commitment that we extended to the operating tenant of a property to cover the cost of renovation shortfalls. We expect to fund this commitment in 2016.
|
|
•
|
Various commitments to purchase information technology hardware, software, accounting, finance, and maintenance services in the normal course of business totaling
$173 million
. We expect to purchase goods and services subject to these commitments as follows:
$71 million
in
2016
,
$52 million
in
2017
,
$47 million
in
2018
, and
$3 million
thereafter.
|
|
•
|
Several commitments aggregating
$29 million
with no expiration date and which we do not expect to fund.
|
Letters of Credit
At year-end
2015
, we had
$82 million
of letters of credit outstanding (all outside the Credit Facility, as defined in Footnote No.
10
, “
Long-Term Debt
”), the majority of which were for our self-insurance programs. Surety bonds issued as of year-end
2015
, totaled
$159 million
, the majority of which federal, state, and local governments requested in connection with our self-insurance programs.
Legal Proceedings
On January 19, 2010, several former Marriott employees (the “plaintiffs”) filed a putative class action complaint against us and the Stock Plan (the “defendants”), alleging that certain equity awards of deferred bonus stock granted to the plaintiffs and other current and former employees for fiscal years 1963 through 1989 are subject to vesting requirements under the Employee Retirement Income Security Act of 1974, as amended (“ERISA”), that are in certain circumstances more rapid than those set forth in the awards. The action was brought in the United States District Court for the District of Maryland (Greenbelt Division), and Dennis Walter Bond Sr. and Michael P. Steigman were the remaining named plaintiffs. Class certification was denied, and on January 16, 2015, the court granted Marriott’s motion for summary judgment and dismissed the case. Plaintiffs appealed to the U.S. Court of Appeals for the Fourth Circuit, and we cross-appealed on statute of limitation grounds. Oral arguments were held before the Fourth Circuit on October 28, 2015, and on January 29, 2016, the Fourth Circuit unanimously granted Marriott’s motion for summary judgment on the grounds that the action was untimely and affirmed the judgment in Marriott’s favor.
In March 2012, the Korea Fair Trade Commission (“KFTC”) obtained documents from
two
of our managed hotels in Seoul, Korea in connection with an investigation which we believe is focused on pricing of hotel services within the Seoul region. Since then, the KFTC has conducted additional fact-gathering at those
two
hotels and also has collected information from another Marriott managed hotel located in Seoul. We understand that the KFTC also has sought documents from numerous other hotels in Seoul and other parts of Korea that we do not operate, own, or franchise. We have not received a complaint or other legal process. We are cooperating with this investigation.
Between November 18, 2015 and December 18, 2015,
seven
lawsuits challenging the Starwood Combination were filed in the Circuit Court for Baltimore City, Maryland on behalf of purported shareholders of Starwood, naming various combinations of Starwood’s directors, Starwood, Marriott, and others, as defendants. On February 4, 2016, the parties filed a stipulation and proposed order in which the plaintiffs in all actions agreed to the dismissal, without prejudice, of all counts against Marriott and Marriott’s subsidiaries. On February 11, 2016, pursuant to the parties’ stipulation, the Court issued an order dismissing, without prejudice, all claims and all counts against Marriott.
73
8
.
LEASES
The following table presents our future obligations under operating leases as of year-end
2015
:
|
($ in millions)
|
Minimum Lease
Payments
|
||
|
2016
|
$
|
126
|
|
|
2017
|
123
|
|
|
|
2018
|
112
|
|
|
|
2019
|
87
|
|
|
|
2020
|
67
|
|
|
|
Thereafter
|
447
|
|
|
|
Total minimum lease payments where we are the primary obligor
|
$
|
962
|
|
Most leases have initial terms of up to
20
years and contain
one
or more renewal options, generally for
five
- or
10
-year periods. These leases generally provide for minimum rentals plus additional rentals based on the operating performance of the leased property. The total minimum lease payments above includes
$186 million
of obligations of our consolidated subsidiaries that are non-recourse to us.
The following table details the composition of rent expense for operating leases for the last three years:
|
($ in millions)
|
2015
|
2014
|
2013
|
||||||||
|
Minimum rentals
|
$
|
138
|
|
$
|
143
|
|
$
|
159
|
|
||
|
Additional rentals
|
65
|
|
64
|
|
56
|
|
|||||
|
$
|
203
|
|
$
|
207
|
|
$
|
215
|
|
|||
9
.
SELF-INSURANCE RESERVE FOR LOSSES AND LOSS ADJUSTMENT EXPENSES
The following table summarizes the activity in our self-insurance reserve for losses and loss adjustment expenses as of year-end
2015
and
2014
:
|
($ in millions)
|
2015
|
2014
|
|||||
|
Balance at beginning of year
|
$
|
384
|
|
$
|
362
|
|
|
|
Less: reinsurance recoverable
|
(4
|
)
|
(5
|
)
|
|||
|
Net balance at beginning of year
|
380
|
|
357
|
|
|||
|
Incurred related to:
|
|||||||
|
Current year
|
141
|
|
126
|
|
|||
|
Prior years
|
(11
|
)
|
(2
|
)
|
|||
|
Total incurred
|
130
|
|
124
|
|
|||
|
Paid related to:
|
|||||||
|
Current year
|
(27
|
)
|
(24
|
)
|
|||
|
Prior years
|
(70
|
)
|
(77
|
)
|
|||
|
Total paid
|
(97
|
)
|
(101
|
)
|
|||
|
Net balance at end of year
|
413
|
|
380
|
|
|||
|
Add: reinsurance recoverable
|
3
|
|
4
|
|
|||
|
Balance at end of year
|
$
|
416
|
|
$
|
384
|
|
|
|
Current portion classified in “Accrued expenses and other”
|
$
|
115
|
|
$
|
120
|
|
|
|
Noncurrent portion classified in “Other noncurrent liabilities”
|
301
|
|
264
|
|
|||
|
$
|
416
|
|
$
|
384
|
|
||
Our provision for incurred losses for the current year increased by
$15 million
over
2014
, primarily due to an increase in medical benefit costs and growth in business activity. We decreased our provision for incurred losses for prior years by
$11 million
in
2015
and by
$2 million
in
2014
as a result of changes in estimates from insured events from prior years due to changes in underwriting experience and frequency and severity trends.
74
|
10
.
|
|
We provide detail on our long-term debt balances in the following table at year-end
2015
and
2014
:
|
($ in millions)
|
At Year-End 2015
|
At Year-End 2014
|
|||||
|
Senior Notes:
|
|||||||
|
Series G Notes, interest rate of 5.8%, face amount of $316, matured November 10, 2015
(effective interest rate of 6.6%) |
$
|
—
|
|
$
|
314
|
|
|
|
Series H Notes, interest rate of 6.2%, face amount of $289, maturing June 15, 2016
(effective interest rate of 6.3%) |
289
|
|
289
|
|
|||
|
Series I Notes, interest rate of 6.4%, face amount of $293, maturing June 15, 2017
(effective interest rate of 6.5%) |
293
|
|
293
|
|
|||
|
Series K Notes, interest rate of 3.0%, face amount of $600, maturing March 1, 2019
(effective interest rate of 4.4%) |
595
|
|
594
|
|
|||
|
Series L Notes, interest rate of 3.3%, face amount of $350, maturing September 15, 2022
(effective interest rate of 3.4%) |
348
|
|
347
|
|
|||
|
Series M Notes, interest rate of 3.4%, face amount of $350, maturing October 15, 2020
(effective interest rate of 3.6%) |
347
|
|
346
|
|
|||
|
Series N Notes, interest rate of 3.1%, face amount of $400, maturing October 15, 2021
(effective interest rate of 3.4%) |
395
|
|
394
|
|
|||
|
Series O Notes, interest rate of 2.9%, face amount of $450, maturing March 1, 2021
(effective interest rate of 3.1%) |
446
|
|
—
|
|
|||
|
Series P Notes, interest rate of 3.8%, face amount of $350, maturing October 1, 2025
(effective interest rate of 4.0%) |
343
|
|
—
|
|
|||
|
Commercial paper, average interest rate of 0.6% at December 31, 2015
|
938
|
|
1,072
|
|
|||
|
$2,000 Credit Facility
|
—
|
|
—
|
|
|||
|
Other
|
113
|
|
122
|
|
|||
|
$
|
4,107
|
|
$
|
3,771
|
|
||
|
Less: Current portion of long-term debt
|
(300
|
)
|
(324
|
)
|
|||
|
$
|
3,807
|
|
$
|
3,447
|
|
||
All of our long-term debt is recourse to us but unsecured. We paid cash for interest, net of amounts capitalized, of
$114 million
in
2015
,
$79 million
in
2014
, and
$83 million
in
2013
.
In the 2015 third quarter, we issued
$800 million
aggregate principal amount of
2.875 percent
Series O Notes due 2021 (the “Series O Notes”) and
3.750 percent
Series P Notes due 2025 (the “Series P Notes” and together with the Series O Notes, the “Notes”). We received net proceeds of approximately
$790 million
from the offering of the Notes, after deducting the underwriting discount and expenses. We expect to use these proceeds for general corporate purposes, which may include working capital, capital expenditures, acquisitions, stock repurchases, or repayment of commercial paper or other borrowings as they become due. We will pay interest on the Series O Notes on March 1 and September 1 of each year, commencing on March 1, 2016, and we will pay interest on the Series P Notes on April 1 and October 1 of each year, commencing on April 1, 2016.
In the 2014 fourth quarter, we issued
$400 million
aggregate principal amount of
3.1 percent
Series N Notes due 2021 (the “Series N Notes”). We received net proceeds of approximately
$394 million
from the offering, after deducting the underwriting discount and expenses. We will pay interest on the Series N Notes on April 15 and October 15 of each year, commencing on April 15, 2015.
We issued the Notes under an indenture dated as of November 16, 1998 with The Bank of New York Mellon, as successor to JPMorgan Chase Bank, N.A. (formerly known as The Chase Manhattan Bank), as trustee. We may redeem some or all of each series of the Notes prior to maturity under the terms provided in the applicable form of Note.
We are party to a multicurrency revolving credit agreement (the “Credit Facility”) that
provides for
$2,000 million
of aggregate effective borrowings to support general corporate needs, including working capital, capital expenditures, share repurchases, letters of credit, and acquisitions. The availability of the Credit Facility also supports our commercial paper program. In addition, we may use borrowings under the Credit Facility, or commercial paper supported by the Credit Facility, to finance all or part of the cash component of the consideration to Starwood shareholders in connection with the Starwood Combination and certain fees and expenses incurred in connection with the combination. Borrowings under the Credit Facility generally bear interest at LIBOR (the London Interbank Offered Rate) plus a spread, based on our public debt rating.
We also pay quarterly fees on the Credit Facility at a rate based on our public debt rating. While any outstanding commercial paper
75
borrowings and/or borrowings under our Credit Facility generally have short-term maturities, we classify the outstanding borrowings as long-term based on our ability and intent to refinance the outstanding borrowings on a long-term basis. The Credit Facility
expires on July 18, 2018
.
The following table presents future principal payments for our debt as of year-end
2015
:
|
Debt Principal Payments (net of unamortized discounts)
($ in millions)
|
Amount
|
||
|
2016
|
$
|
300
|
|
|
2017
|
302
|
|
|
|
2018
|
947
|
|
|
|
2019
|
605
|
|
|
|
2020
|
357
|
|
|
|
Thereafter
|
1,596
|
|
|
|
Balance at year-end 2015
|
$
|
4,107
|
|
11
.
INTANGIBLE ASSETS AND GOODWILL
The following table details the composition of our acquired intangible assets at year-end
2015
and
2014
:
|
($ in millions)
|
At Year-End 2015
|
At Year-End 2014
|
|||||
|
Definite-lived Intangible Assets
|
|||||||
|
Contract acquisition costs and other
|
$
|
1,702
|
|
$
|
1,735
|
|
|
|
Accumulated amortization
|
(380
|
)
|
(461
|
)
|
|||
|
1,322
|
|
1,274
|
|
||||
|
Indefinite-lived Intangible Assets
|
|||||||
|
Brands
|
129
|
|
77
|
|
|||
|
Total Intangible Assets
|
$
|
1,451
|
|
$
|
1,351
|
|
|
We capitalize both direct and incremental costs that we incur to acquire management, franchise, and license agreements. We amortize these costs on a straight-line basis over the initial term of the agreements, ranging from
15
to
30
years. Our amortization expense totaled
$65 million
in
2015
,
$64 million
in
2014
, and
$68 million
in
2013
. We estimate that our aggregate amortization expense for each of the next five fiscal years will be as follows:
$67 million
for
2016
;
$67 million
for
2017
;
$67 million
for
2018
;
$67 million
for
2019
; and
$67 million
for
2020
.
The following table details the carrying amount of our goodwill at year-end
2015
and
2014
:
|
($ in millions)
|
North American
Full-Service
Segment
|
North American
Limited-Service
Segment
|
International
|
Total
Goodwill
|
|||||||||||
|
Year-end 2014 balance:
|
|||||||||||||||
|
Goodwill
|
$
|
392
|
|
$
|
125
|
|
$
|
431
|
|
$
|
948
|
|
|||
|
Accumulated impairment losses
|
—
|
|
(54
|
)
|
—
|
|
(54
|
)
|
|||||||
|
392
|
|
71
|
|
431
|
|
894
|
|
||||||||
|
Additions
|
$
|
19
|
|
$
|
—
|
|
$
|
—
|
|
$
|
19
|
|
|||
|
Adjustments
|
—
|
|
—
|
|
57
|
|
57
|
|
|||||||
|
Foreign currency translation
|
(2
|
)
|
—
|
|
(25
|
)
|
(27
|
)
|
|||||||
|
Year-end 2015 balance:
|
|||||||||||||||
|
Goodwill
|
$
|
409
|
|
$
|
125
|
|
$
|
463
|
|
$
|
997
|
|
|||
|
Accumulated impairment losses
|
—
|
|
(54
|
)
|
—
|
|
(54
|
)
|
|||||||
|
$
|
409
|
|
$
|
71
|
|
$
|
463
|
|
$
|
943
|
|
||||
The table reflects goodwill added as a result of our acquisitions of Delta Hotels and Resorts in 2015 and Protea Hotels in 2014. See Footnote No.
3
, “
Acquisitions and Dispositions
” for more information.
76
12
.
PROPERTY AND EQUIPMENT
The following table presents the composition of our property and equipment balances at year-end
2015
and
2014
:
|
($ in millions)
|
At Year-End 2015
|
At Year-End 2014
|
|||||
|
Land
|
$
|
299
|
|
$
|
457
|
|
|
|
Buildings and leasehold improvements
|
729
|
|
781
|
|
|||
|
Furniture and equipment
|
768
|
|
775
|
|
|||
|
Construction in progress
|
130
|
|
365
|
|
|||
|
1,926
|
|
2,378
|
|
||||
|
Accumulated depreciation
|
(897
|
)
|
(918
|
)
|
|||
|
$
|
1,029
|
|
$
|
1,460
|
|
||
We record property and equipment at cost, including interest and real estate taxes we incur during development and construction. Interest we capitalized as a cost of property and equipment totaled
$9 million
in
2015
,
$33 million
in
2014
, and
$31 million
in
2013
. We capitalize the cost of improvements that extend the useful life of property and equipment when we incur them. These capitalized costs may include structural costs, equipment, fixtures, floor, and wall coverings. We expense all repair and maintenance costs when we incur them. We compute depreciation using the straight-line method over the estimated useful lives of the assets (
three
to
40
years), and we amortize leasehold improvements over the shorter of the asset life or lease term. Our gross depreciation expense totaled
$132 million
in
2015
,
$135 million
in
2014
, and
$107 million
in
2013
(of which
$58 million
in
2015
,
$51 million
in
2014
, and
$48 million
in
2013
we included in reimbursed costs). Fixed assets attributed to operations located outside the United States were
$229 million
in
2015
and
$291 million
in
2014
.
See Footnote No.
3
, “
Acquisitions and Dispositions
” for information on impairment charges we recorded in the “Depreciation, amortization, and other” and “Gains and other income, net” captions of our Income Statements.
13
.
NOTES RECEIVABLE
The following table presents the composition of our notes receivable balances (net of reserves and unamortized discounts) at year-end
2015
and
2014
:
|
($ in millions)
|
At Year-End 2015
|
At Year-End 2014
|
|||||
|
Senior, mezzanine, and other loans
|
$
|
221
|
|
$
|
242
|
|
|
|
Less current portion
|
(6
|
)
|
(27
|
)
|
|||
|
$
|
215
|
|
$
|
215
|
|
||
We classify notes receivable due within one year as current assets in the caption “Accounts and notes receivable, net” in our Balance Sheets. We did not have any past due notes receivable amounts at the end of either
2015
or
2014
. In 2015, we issued a
$58 million
mezzanine loan (net of a
$6 million
discount) to an owner in conjunction with entering into a franchise agreement for a North American Limited-Service property. In 2014, we provided an
$85 million
mezzanine loan (net of a
$15 million
discount) to an owner in conjunction with entering into a franchise agreement for an International property. The unamortized discounts for our notes receivable were
$31 million
at year-end
2015
and
$25 million
at year-end
2014
.
77
The following table presents the expected future principal payments (net of reserves and unamortized discounts) as well as interest rates for our notes receivable as of year-end
2015
:
|
Notes Receivable Principal Payments (net of reserves and unamortized discounts) and Interest Rates
($ in millions)
|
Amount
|
||
|
2016
|
$
|
6
|
|
|
2017
|
3
|
|
|
|
2018
|
60
|
|
|
|
2019
|
5
|
|
|
|
2020
|
2
|
|
|
|
Thereafter
|
145
|
|
|
|
Balance at year-end 2015
|
$
|
221
|
|
|
Weighted average interest rate at year-end 2015
|
7.8
|
%
|
|
|
Range of stated interest rates at year-end 2015
|
0 - 15%
|
|
|
Senior, Mezzanine, and Other Loans
Generally, all of the loans we make have similar characteristics in that they are loans to owners and operators of hotels and hospitality properties. We reflect interest income for “Senior, mezzanine, and other loans” in the “Interest income” caption in our Income Statements. At year-end
2015
, our recorded investment in impaired “Senior, mezzanine, and other loans” was
$72 million
. We had a
$55 million
notes receivable reserve representing an allowance for credit losses, leaving
$17 million
of our investment in impaired loans, for which we had no related allowance for credit losses. At year-end
2014
, our recorded investment in impaired “Senior, mezzanine, and other loans” was
$63 million
, and we had a
$50 million
notes receivable reserve representing an allowance for credit losses, leaving
$13 million
of our investment in impaired loans, for which we had no related allowance for credit losses. Our average investment in impaired “Senior, mezzanine, and other loans” totaled
$67 million
during
2015
,
$81 million
during
2014
, and
$96 million
during
2013
.
The following table summarizes the activity for our “Senior, mezzanine, and other loans” notes receivable reserve for
2013
,
2014
, and
2015
:
|
($ in millions)
|
Notes
Receivable
Reserve
|
||
|
Balance at year-end 2012
|
$
|
79
|
|
|
Reversals
|
(2
|
)
|
|
|
Transfers and other
|
13
|
|
|
|
Balance at year-end 2013
|
90
|
|
|
|
Write-offs
|
(45
|
)
|
|
|
Transfers and other
|
5
|
|
|
|
Balance at year-end 2014
|
50
|
|
|
|
Transfers and other
|
5
|
|
|
|
Balance at year-end 2015
|
$
|
55
|
|
78
14
.
FAIR VALUE OF FINANCIAL INSTRUMENTS
We believe that the fair values of our current assets and current liabilities approximate their reported carrying amounts. We present the carrying values and the fair values of noncurrent financial assets and liabilities that qualify as financial instruments, determined under current guidance for disclosures on the fair value of financial instruments, in the following table:
|
|
At Year-End 2015
|
At Year-End 2014
|
|||||||||||||
|
($ in millions)
|
Carrying
Amount
|
Fair Value
|
Carrying
Amount
|
Fair Value
|
|||||||||||
|
Senior, mezzanine, and other loans
|
$
|
215
|
|
$
|
209
|
|
$
|
215
|
|
$
|
214
|
|
|||
|
Marketable securities
|
37
|
|
37
|
|
44
|
|
44
|
|
|||||||
|
Total noncurrent financial assets
|
$
|
252
|
|
$
|
246
|
|
$
|
259
|
|
$
|
258
|
|
|||
|
Senior notes
|
$
|
(2,766
|
)
|
$
|
(2,826
|
)
|
$
|
(2,262
|
)
|
$
|
(2,370
|
)
|
|||
|
Commercial paper
|
(938
|
)
|
(938
|
)
|
(1,072
|
)
|
(1,072
|
)
|
|||||||
|
Other long-term debt
|
(99
|
)
|
(108
|
)
|
(108
|
)
|
(122
|
)
|
|||||||
|
Other noncurrent liabilities
|
(63
|
)
|
(63
|
)
|
(57
|
)
|
(57
|
)
|
|||||||
|
Total noncurrent financial liabilities
|
$
|
(3,866
|
)
|
$
|
(3,935
|
)
|
$
|
(3,499
|
)
|
$
|
(3,621
|
)
|
|||
We estimate the fair value of our senior, mezzanine, and other loans, including the current portion, by discounting cash flows using risk-adjusted rates, both of which are Level 3 inputs.
We carry our marketable securities at fair value. Our marketable securities include debt securities of the U.S. Government, its sponsored agencies and other U.S. corporations invested for our self-insurance programs, as well as shares of publicly traded companies, which we value using directly observable Level 1 inputs. The carrying value of these marketable securities at year-end
2015
was
$37 million
.
In the 2015 second quarter, the sale of an entity that owns
three
hotels that we manage triggered the mandatory redemption feature of our preferred equity ownership interest in that entity. We received $
121 million
in cash and realized a gain of $
41 million
for the redemption, which we recorded in the “Gains and other income, net” caption of our Income Statements. At the date of redemption, it had an amortized cost of $
80 million
, including accrued interest. We continue to manage the hotels under long-term agreements. At year-end 2014, we accounted for this investment as a debt security and classified it as a current asset in our Balance Sheet. Based on qualitative and quantitative analyses, at year-end 2014, we concluded that the entity in which we invested was a variable interest entity because it was capitalized primarily with debt. We did not consolidate the entity because we did not have the power to direct the activities that most significantly impact the entity’s economic performance.
We estimate the fair value of our other long-term debt, including the current portion and excluding leases, using expected future payments discounted at risk-adjusted rates, which are Level 3 inputs. We determine the fair value of our senior notes using quoted market prices, which are directly observable Level 1 inputs. As noted in Footnote No.
10
, “
Long-Term Debt
,” even though our commercial paper borrowings generally have short-term maturities of
30 days
or less, we classify outstanding commercial paper borrowings as long-term based on our ability and intent to refinance them on a long-term basis. As we are a frequent issuer of commercial paper, we use pricing from recent transactions as Level 2 inputs in estimating fair value. At year-end
2015
and year-end
2014
, we determined that the carrying value of our commercial paper approximated its fair value due to the short maturity. Our other long-term liabilities largely consist of guarantees. As we note in the “Guarantees” caption of Footnote No.
2
, “
Summary of Significant Accounting Policies
,” we measure our liability for guarantees at fair value on a nonrecurring basis that is when we issue or modify a guarantee, using Level 3 internally developed inputs. At year-end
2015
and year-end
2014
, we determined that the carrying values of our guarantee liabilities approximated their fair values based on Level 3 inputs.
See the “Fair Value Measurements” caption of Footnote No.
2
, “
Summary of Significant Accounting Policies
” for more information on the input levels we use in determining fair value.
79
15
.
ACCUMULATED OTHER COMPREHENSIVE (LOSS) INCOME
The following table details the accumulated other comprehensive (loss) income activity for
2015
,
2014
, and
2013
:
|
($ in millions)
|
Foreign Currency Translation Adjustments
|
Derivative Instrument Adjustments
|
Available-For-Sale Securities Unrealized Adjustments
(1)
|
Accumulated Other Comprehensive Loss
|
|||||||||||
|
Balance at year-end 2012
|
$
|
(32
|
)
|
$
|
(19
|
)
|
$
|
7
|
|
$
|
(44
|
)
|
|||
|
Other comprehensive income before reclassifications
(2)
|
1
|
|
—
|
|
5
|
|
6
|
|
|||||||
|
Amounts reclassified from accumulated other comprehensive loss
|
—
|
|
—
|
|
(6
|
)
|
(6
|
)
|
|||||||
|
Net other comprehensive income (loss)
|
1
|
|
—
|
|
(1
|
)
|
—
|
|
|||||||
|
Balance at year-end 2013
|
$
|
(31
|
)
|
$
|
(19
|
)
|
$
|
6
|
|
$
|
(44
|
)
|
|||
|
Other comprehensive (loss) income before reclassifications
(2)
|
(41
|
)
|
8
|
|
5
|
|
(28
|
)
|
|||||||
|
Amounts reclassified from accumulated other comprehensive loss
|
—
|
|
2
|
|
—
|
|
2
|
|
|||||||
|
Net other comprehensive (loss) income
|
(41
|
)
|
10
|
|
5
|
|
(26
|
)
|
|||||||
|
Balance at year-end 2014
|
$
|
(72
|
)
|
$
|
(9
|
)
|
$
|
11
|
|
$
|
(70
|
)
|
|||
|
Other comprehensive (loss) income before reclassifications
(2)
|
(123
|
)
|
10
|
|
(7
|
)
|
(120
|
)
|
|||||||
|
Amounts reclassified from accumulated other comprehensive loss
|
3
|
|
(9
|
)
|
—
|
|
(6
|
)
|
|||||||
|
Net other comprehensive (loss) income
|
(120
|
)
|
1
|
|
(7
|
)
|
(126
|
)
|
|||||||
|
Balance at year-end 2015
|
$
|
(192
|
)
|
$
|
(8
|
)
|
$
|
4
|
|
$
|
(196
|
)
|
|||
|
(1)
|
We present the portions of other comprehensive (loss) income before reclassifications that relate to unrealized gains (losses) on available-for-sale securities net of deferred taxes of
$4 million
for
2015
,
$3 million
for
2014
, and
$2 million
for
2013
.
|
|
(2)
|
Other comprehensive (loss) income before reclassifications for foreign currency translation adjustments includes gains on intra-entity foreign currency transactions that are of a long-term investment nature of
$48 million
for
2015
and
$28 million
for
2014
and a loss of
$20 million
for
2013
.
|
The following table details the effect on net income of amounts we reclassified out of accumulated other comprehensive loss for
2015
:
|
($ in millions)
|
Reclassification of Gains (Losses) from Accumulated Other Comprehensive Loss
|
|||||
|
Accumulated Other Comprehensive Loss Components
|
2015
|
Income Statement Line Affected
|
||||
|
Foreign Currency Translation Adjustments
|
||||||
|
Property disposition
|
$
|
(3
|
)
|
Gains and other income, net
|
||
|
(3
|
)
|
Income before income taxes
|
||||
|
—
|
|
Provision for income taxes
|
||||
|
$
|
(3
|
)
|
Net income
|
|||
|
Derivative Instrument Adjustments
|
||||||
|
Cash flow hedges
|
$
|
10
|
|
Base management and franchise fees
|
||
|
Net investment hedge - property disposition
|
3
|
|
Gains and other income, net
|
|||
|
Interest rate contracts
|
(5
|
)
|
Interest expense
|
|||
|
8
|
|
Income before income taxes
|
||||
|
2
|
|
Provision for income taxes
|
||||
|
$
|
10
|
|
Net income
|
|||
80
16
.
BUSINESS SEGMENTS
We are a diversified global lodging company. During the 2014 first quarter, we modified the information that our President and Chief Executive Officer, who is our “chief operating decision maker” (“CODM”), reviews to be consistent with our continent structure. This structure aligns our business around geographic regions and is designed to enable us to operate more efficiently and to accelerate our worldwide growth. As a result of modifying our reporting information, we revised our operating segments to eliminate our former Luxury segment, which we allocated between our existing North American Full-Service operating segment, and the following
four
new operating segments: Asia Pacific, Caribbean and Latin America, Europe, and Middle East and Africa.
Although our North American Full-Service and North American Limited-Service segments meet the applicable accounting criteria to be reportable business segments, our
four
International operating segments do not meet the criteria for separate disclosure as reportable business segments. Accordingly, we combine our
four
operating segments into an “all other” category which we refer to as “International” and have revised our business segment information for earlier periods to conform to our new business segment presentation.
Our
three
reportable business segments include the following principal brands:
|
•
|
North American Full-Service
, which includes The Ritz-Carlton, EDITION, JW Marriott, Autograph Collection Hotels, Renaissance Hotels, Marriott Hotels, Delta Hotels and Resorts, and Gaylord Hotels located in the United States and Canada;
|
|
•
|
North American Limited-Service
, which includes AC Hotels by Marriott, Courtyard, Residence Inn, SpringHill Suites, Fairfield Inn & Suites, and TownePlace Suites properties, located in the United States and Canada; and
|
|
•
|
International
, which includes The Ritz-Carlton, Bulgari Hotels & Resorts, EDITION, JW Marriott, Autograph Collection Hotels, Renaissance Hotels, Marriott Hotels, Marriott Executive Apartments, AC Hotels by Marriott, Courtyard, Residence Inn, Fairfield Inn & Suites, Protea Hotels, and Moxy Hotels located outside the United States and Canada.
|
We evaluate the performance of our operating segments using “segment profits” which is based largely on the results of the segment without allocating corporate expenses, income taxes, or indirect general, administrative, and other expenses. We allocate gains and losses, equity in earnings or losses from our joint ventures, and direct general, administrative, and other expenses to each of our segments. “Other unallocated corporate” represents a portion of our revenues, general, administrative, and other expenses, equity in earnings or losses, and other gains or losses that we do not allocate to our segments. It also includes license fees we receive from our credit card programs and license fees from MVW.
Our CODM monitors assets for the consolidated company but does not use assets by operating segment when assessing performance or making operating segment resource allocations.
Segment Revenues
|
($ in millions)
|
2015
|
2014
|
2013
|
||||||||
|
North American Full-Service Segment
|
$
|
8,825
|
|
$
|
8,323
|
|
$
|
7,978
|
|
||
|
North American Limited-Service Segment
|
3,193
|
|
2,962
|
|
2,583
|
|
|||||
|
International
|
2,200
|
|
2,255
|
|
1,957
|
|
|||||
|
Total segment revenues
(1)
|
14,218
|
|
13,540
|
|
12,518
|
|
|||||
|
Other unallocated corporate
|
268
|
|
256
|
|
266
|
|
|||||
|
Total consolidated revenues
|
$
|
14,486
|
|
$
|
13,796
|
|
$
|
12,784
|
|
||
|
(1)
|
Revenues attributed to operations located outside the United States were
$2,761 million
in
2015
,
$2,518 million
in
2014
, and
$2,149 million
in
2013
.
|
81
Segment Profits
|
($ in millions)
|
2015
|
2014
|
2013
|
||||||||
|
North American Full-Service Segment
|
$
|
561
|
|
$
|
524
|
|
$
|
490
|
|
||
|
North American Limited-Service Segment
|
651
|
|
574
|
|
479
|
|
|||||
|
International
|
292
|
|
295
|
|
228
|
|
|||||
|
Total segment profits
(1)
|
1,504
|
|
1,393
|
|
1,197
|
|
|||||
|
Other unallocated corporate
|
(111
|
)
|
(220
|
)
|
(203
|
)
|
|||||
|
Interest expense and interest income
|
(138
|
)
|
(85
|
)
|
(97
|
)
|
|||||
|
Income taxes
|
(396
|
)
|
(335
|
)
|
(271
|
)
|
|||||
|
$
|
859
|
|
$
|
753
|
|
$
|
626
|
|
|||
|
(1)
|
Segment profits attributed to operations located outside the United States were
$329 million
in
2015
,
$327 million
in
2014
, and
$269 million
in
2013
. The
2015
segment profits consisted of segment profits of
$98 million
from Asia Pacific,
$94 million
from Europe,
$63 million
from the Caribbean and Latin America,
$37 million
from Canada, and
$37 million
from the Middle East and Africa.
|
Depreciation and Amortization
|
($ in millions)
|
2015
|
2014
|
2013
|
||||||||
|
North American Full-Service Segment
|
$
|
55
|
|
$
|
52
|
|
$
|
57
|
|
||
|
North American Limited-Service Segment
|
21
|
|
22
|
|
21
|
|
|||||
|
International
|
40
|
|
42
|
|
42
|
|
|||||
|
Total segment depreciation and amortization
|
116
|
|
116
|
|
120
|
|
|||||
|
Other unallocated corporate
(1)
|
23
|
|
32
|
|
7
|
|
|||||
|
$
|
139
|
|
$
|
148
|
|
$
|
127
|
|
|||
|
(1)
|
Includes impairment charges of
$12 million
in 2015 and
$25 million
in 2014 on EDITION hotels and residences. See Footnote No.
3
, “
Acquisitions and Dispositions
” for more information.
|
Capital Expenditures
|
($ in millions)
|
2015
|
2014
|
2013
|
||||||||
|
North American Full-Service Segment
|
$
|
120
|
|
$
|
251
|
|
$
|
145
|
|
||
|
North American Limited-Service Segment
|
7
|
|
5
|
|
8
|
|
|||||
|
International
|
86
|
|
87
|
|
93
|
|
|||||
|
Total segment capital expenditures
|
213
|
|
343
|
|
246
|
|
|||||
|
Other unallocated corporate
|
92
|
|
68
|
|
50
|
|
|||||
|
$
|
305
|
|
$
|
411
|
|
$
|
296
|
|
|||
17
.
RELATED PARTY TRANSACTIONS
Equity Method Investments
We have equity method investments in entities that own properties for which we provide management and/or franchise services and receive fees. We also have equity method investments in entities that provide management and/or franchise services to hotels and receive fees. In addition, in some cases we provide loans, preferred equity, or guarantees to these entities. Undistributed earnings attributable to our equity method investments represented approximately
$2 million
of our consolidated retained earnings at year-end
2015
.
82
The following tables present financial data resulting from transactions with these related parties:
Income Statement Data
|
($ in millions)
|
2015
|
2014
|
2013
|
||||||||
|
Base management fees
|
$
|
15
|
|
$
|
17
|
|
$
|
17
|
|
||
|
Incentive management fees
|
3
|
|
6
|
|
1
|
|
|||||
|
Owned, leased, and other revenue
|
1
|
|
1
|
|
1
|
|
|||||
|
Cost reimbursements
|
197
|
|
226
|
|
236
|
|
|||||
|
Total revenue
|
$
|
216
|
|
$
|
250
|
|
$
|
255
|
|
||
|
Reimbursed costs
|
$
|
(197
|
)
|
$
|
(226
|
)
|
$
|
(236
|
)
|
||
|
Depreciation, amortization, and other
|
(2
|
)
|
(2
|
)
|
(2
|
)
|
|||||
|
General, administrative, and other
|
(1
|
)
|
(2
|
)
|
(3
|
)
|
|||||
|
Interest income
|
5
|
|
5
|
|
4
|
|
|||||
|
Equity in earnings (losses)
|
16
|
|
6
|
|
(5
|
)
|
|||||
Balance Sheet Data
|
($ in millions)
|
At Year-End 2015
|
At Year-End 2014
|
|||||
|
Current assets
|
|||||||
|
Accounts and notes receivable, net
|
$
|
29
|
|
$
|
26
|
|
|
|
Other
|
1
|
|
1
|
|
|||
|
Intangible assets
|
|||||||
|
Contract acquisition costs and other
|
30
|
|
20
|
|
|||
|
Equity and cost method investments
|
159
|
|
210
|
|
|||
|
Deferred taxes, net
|
(4
|
)
|
13
|
|
|||
|
Other noncurrent assets
|
17
|
|
19
|
|
|||
|
Current liabilities
|
|
|
|||||
|
Accounts payable
|
(10
|
)
|
(10
|
)
|
|||
|
Accrued expenses and other
|
(12
|
)
|
(20
|
)
|
|||
|
Other noncurrent liabilities
|
(3
|
)
|
(3
|
)
|
|||
Summarized information for the entities in which we have equity method investments is as follows:
Income Statement Data
|
($ in millions)
|
2015
|
2014
|
2013
|
||||||||
|
Sales
|
$
|
615
|
|
$
|
752
|
|
$
|
727
|
|
||
|
Net income
|
$
|
44
|
|
$
|
38
|
|
$
|
11
|
|
||
Balance Sheet Summary
|
($ in millions)
|
At Year-End 2015
|
At Year-End 2014
|
|||||
|
Assets (primarily composed of hotel real estate managed by us)
|
$
|
1,218
|
|
$
|
1,499
|
|
|
|
Liabilities
|
$
|
1,110
|
|
$
|
1,287
|
|
|
Other Related Parties
We received management fees of approximately $
13 million
in 2015, $
12 million
in 2014, and $
11 million
in 2013, plus reimbursement of certain expenses, from our operation of properties owned by JWM Family Enterprises, L.P., which is beneficially owned and controlled by J.W. Marriott, Jr., Deborah Marriott Harrison, and other members of the Marriott family.
18
.
RELATIONSHIP WITH MAJOR CUSTOMER
Host Hotels & Resorts, Inc., formerly known as Host Marriott Corporation, and its affiliates (“Host”) owned or leased
58
lodging properties at year-end
2015
,
61
lodging properties at year-end
2014
, and
66
lodging properties at year-end
2013
that we operated under long-term agreements. Over the last three years, we recognized revenues, including cost reimbursements
83
revenue, of
$1,888 million
in
2015
,
$1,927 million
in
2014
, and
$2,016 million
in
2013
from those lodging properties, and included those revenues in all
three
of our business segments.
Host is also a partner in certain unconsolidated partnerships that own lodging properties that we operate under long-term agreements. Host was affiliated with
nine
such properties at year-end
2015
,
nine
such properties at year-end
2014
, and
ten
such properties at year-end
2013
. We recognized revenues, including cost reimbursements revenue, of
$103 million
in
2015
,
$106 million
in
2014
, and
$87 million
in
2013
from those lodging properties, and included those revenues in our North American Full-Service and International segments.
84
SUPPLEMENTARY DATA
QUARTERLY FINANCIAL DATA – UNAUDITED
|
($ in millions, except per share data)
|
2015
|
||||||||||||||||||
|
|
First
Quarter
|
Second
Quarter
|
Third
Quarter
|
Fourth
Quarter
|
Fiscal
Year
|
||||||||||||||
|
Revenues
|
$
|
3,513
|
|
$
|
3,689
|
|
$
|
3,578
|
|
$
|
3,706
|
|
$
|
14,486
|
|
||||
|
Operating income
|
$
|
332
|
|
$
|
369
|
|
$
|
339
|
|
$
|
310
|
|
$
|
1,350
|
|
||||
|
Net income
|
$
|
207
|
|
$
|
240
|
|
$
|
210
|
|
$
|
202
|
|
$
|
859
|
|
||||
|
Diluted earnings per share
|
$
|
0.73
|
|
$
|
0.87
|
|
$
|
0.78
|
|
$
|
0.77
|
|
$
|
3.15
|
|
||||
|
($ in millions, except per share data)
|
2014
|
||||||||||||||||||
|
|
First
Quarter
|
Second
Quarter
|
Third
Quarter
|
Fourth
Quarter
|
Fiscal
Year
|
||||||||||||||
|
Revenues
|
$
|
3,293
|
|
$
|
3,484
|
|
$
|
3,460
|
|
$
|
3,559
|
|
$
|
13,796
|
|
||||
|
Operating income
|
$
|
254
|
|
$
|
316
|
|
$
|
298
|
|
$
|
291
|
|
$
|
1,159
|
|
||||
|
Net income
|
$
|
172
|
|
$
|
192
|
|
$
|
192
|
|
$
|
197
|
|
$
|
753
|
|
||||
|
Diluted earnings per share
|
$
|
0.57
|
|
$
|
0.64
|
|
$
|
0.65
|
|
$
|
0.68
|
|
$
|
2.54
|
|
||||
|
Item 9.
|
Changes in and Disagreements with Accountants on Accounting and Financial Disclosure.
|
None.
|
Item 9A.
|
Controls and Procedures.
|
Disclosure Controls and Procedures
As of the end of the period covered by this annual report, we evaluated, under the supervision and with the participation of our management, including our Chief Executive Officer and Chief Financial Officer, the effectiveness of our disclosure controls and procedures (as such term is defined in Rules 13a-15(e) and 15d-15(e) of the Securities Exchange Act of 1934 (the “Exchange Act”)). Management necessarily applied its judgment in assessing the costs and benefits of those controls and procedures, which by their nature, can provide only reasonable assurance about management’s control objectives. You should note that the design of any system of controls is based in part upon certain assumptions about the likelihood of future events, and we cannot assure you that any design will succeed in achieving its stated goals under all potential future conditions, regardless of how remote. Based upon this evaluation, our Chief Executive Officer and the Chief Financial Officer concluded that our disclosure controls and procedures were effective and operating to provide reasonable assurance that we record, process, summarize and report the information we are required to disclose in the reports that we file or submit under the Exchange Act within the time periods specified in the rules and forms of the SEC, and to provide reasonable assurance that we accumulate and communicate such information to our management, including our Chief Executive Officer and Chief Financial Officer, as appropriate to allow timely decisions about required disclosure.
Internal Control Over Financial Reporting
We have set forth management’s report on internal control over financial reporting and the attestation report of our independent registered public accounting firm on the effectiveness of our internal control over financial reporting in Item 8 of this Form 10-K, and we incorporate those reports here by reference.
We made no changes in internal control over financial reporting during the
fourth
quarter of
2015
that materially affected, or are reasonably likely to materially affect, our internal control over financial reporting.
|
Item 9B.
|
Other Information.
|
None.
85
Items 10, 11, 12, 13, 14.
As described below, we incorporate by reference in this Annual Report on Form 10-K certain information appearing in the Proxy Statement that we will furnish to our shareholders in connection with our
2016
Annual Meeting of Shareholders.
|
|
We incorporate this information by reference to “Our Board of Directors,” “Section 16(a) Beneficial Ownership Reporting Compliance,” “Audit Committee,” “Transactions with Related Persons,” and “Selection of Director Nominees” sections of our Proxy Statement. We have included information regarding our executive officers and our Code of Ethics below.
|
|
|
We incorporate this information by reference to the “Executive and Director Compensation” and “Compensation Committee Interlocks and Insider Participation” sections of our Proxy Statement.
|
|
|
We incorporate this information by reference to the “Securities Authorized for Issuance Under Equity Compensation Plans” and the “Stock Ownership” sections of our Proxy Statement.
|
|
|
We incorporate this information by reference to the “Transactions with Related Persons,” and “Director Independence” sections of our Proxy Statement.
|
|
|
We incorporate this information by reference to the “Independent Registered Public Accounting Firm Fee Disclosure” and the “Pre-Approval of Independent Auditor Fees and Services Policy” sections of our Proxy Statement.
|
86
EXECUTIVE OFFICERS OF THE REGISTRANT
We include below certain information on our executive officers. This information is as of February 1, 2016, except where indicated.
|
Name and Title
|
Age
|
Business Experience
|
|||
|
J.W. Marriott, Jr.
Executive Chairman and
Chairman of the Board
|
83
|
|
J.W. Marriott, Jr. was elected Executive Chairman effective March 31, 2012, having decided to relinquish his position as Chief Executive Officer. He served as Chief Executive Officer of the Company and its predecessors since 1972. He joined Marriott Corporation (now known as Host Hotels & Resorts, Inc.) in 1956, became President and a Director in 1964. Mr. Marriott serves on the Board of The J. Willard & Alice S. Marriott Foundation. He is a member of the National Business Council and the Executive Committee of the World Travel & Tourism Council. Mr. Marriott has served as a Director of the Company and its predecessors since 1964.
|
||
|
Arne M. Sorenson
President and Chief Executive Officer
|
57
|
|
Arne M. Sorenson became President and Chief Executive Officer of the Company on March 31, 2012 and was appointed to the Board of Directors in February 2011. Mr. Sorenson joined Marriott in 1996 as Senior Vice President of Business Development, was named Executive Vice President and Chief Financial Officer in 1998, assumed the additional title of President, Continental European Lodging, in 2003 and was appointed Marriott’s President and Chief Operating Officer in 2009. Before joining Marriott, he was a Partner in the law firm of Latham & Watkins in Washington, D.C. Mr. Sorenson serves as the Chair of the Board of Directors for Brand USA, on the Board of Regents of Luther College, on the Board of Trustees of Brookings, and as Vice Chair of the President of the United States’ Export Council.
|
||
|
Bao Giang Val Bauduin
Controller and Chief
Accounting Officer |
39
|
|
Val Bauduin became our Controller and Chief Accounting Officer in June 2014, with responsibility for the accounting operations of the Company including oversight of Financial Reporting & Analysis, Accounting Policy, Governance, Risk Management (Insurance, Claims, Business Continuity, Fire & Life Safety), Accenture Hospitality Services and the Corporate Finance Business Partners. Prior to joining Marriott, Mr. Bauduin was a Partner and U.S. Hospitality leader of Deloitte & Touche LLP from 2011 to 2014, where he has served as a Travel, Hospitality & Leisure industry expert for Deloitte teams globally. Prior to that, Mr. Bauduin was a Senior Manager of Deloitte from 2005 to 2011. He has a strong international background, and has built and led cross-functional (tax, valuation and IT) international professional service teams engaged at diverse client organizations, including several large and well-known public hospitality clients. He has supported complex capital market transactions, spinoffs and real estate development projects related to gaming and hospitality. Mr. Bauduin earned a Bachelor of Arts in Economics from the University of Notre Dame and a Master of Business Administration in Finance from The Wharton School at the University of Pennsylvania. He is also a Certified Public Accountant.
|
||
|
Anthony G. Capuano
Executive Vice President
and Global Chief Development Officer
|
50
|
|
Anthony G. Capuano became Marriott’s Executive Vice President and Global Chief Development Officer in 2009. He is responsible for the global development of all Marriott lodging brands and supervises 20 offices outside of North America as well as multiple offices across North America. Mr. Capuano began his Marriott International career in 1995 as part of the Market Planning and Feasibility team. Between 1997 and 2005, he led Marriott’s full service development efforts in the Western U.S. and Canada. In early 2008, his responsibilities expanded to include North America, the Caribbean and Latin America. Mr. Capuano began his professional career in Laventhol and Horwath’s Boston-based Leisure Time Advisory Group. He then joined Kenneth Leventhal and Company’s hospitality consulting group in Los Angeles, CA. Mr. Capuano earned his bachelor’s degree in Hotel Administration from Cornell University. He is an active member of the Cornell Society of Hotelmen and a member of The Cornell School of Hotel Administration Dean’s Advisory Board. Mr. Capuano is also a member of the American Hotel and Lodging Association’s Industry Real Estate Financial Advisory Council.
|
||
87
|
Name and Title
|
Age
|
Business Experience
|
|||
|
David Grissen
Group President |
58
|
|
David Grissen became Group President effective February 2014, assuming additional responsibility for The Ritz-Carlton and Global Operations Services. He became the Group President for The Americas in 2012, with responsibility for all business activities including operations, sales and marketing, revenue management, human resources, engineering, rooms operations, food and beverage, retail, spa, information technology and development. Prior to this, he served as President, Americas from 2010; Executive Vice President of the Eastern Region from 2005; Senior Vice President of the Mid-Atlantic Region and Senior Vice President of Finance and Business Development from 2000. Mr. Grissen is chair of the Americas’ Hotel Development Committee and a member of the Lodging Strategy Group and Corporate Growth Committee. He is a member of the Board of Directors of Regis Corporation and also Vice Chairman of the Board of Directors for Back on My Feet, an organization that helps individuals experiencing homelessness. Mr. Grissen holds a bachelor’s degree from Michigan State University and a master’s degree from Loyola University in Chicago.
|
||
|
Alex Kyriakidis
President & Managing Director
Middle East & Africa
|
|
63
|
|
|
Alex Kyriakidis joined Marriott in January 2012 as President and Managing Director, Middle East and Africa with responsibility for all business activities for the Middle East and Africa Region (MEA), including operations, sales and marketing, finance and hotel development. Before joining Marriott, Mr. Kyriakidis served for 10 years as Global Managing Director - Travel, Hospitality and Leisure for Deloitte LLP. In this role, Mr. Kyriakidis led the Global Travel, Hospitality and Leisure Industry team, where he was responsible for a team of 4,500 professionals that generated $700 million in revenues. Mr. Kyriakidis has 40 years of experience providing strategic, financial, M&A, operational, asset management and integration services to the travel, hospitality and leisure sectors. He has served clients in 25 countries, predominantly in the Europe, MEA and Asia Pacific regions. He is a fellow of the Arab Society of Certified Accountants, the British Association of Hotel Accountants and the Institute of Chartered Accountants in England and Wales. Mr. Kyriakidis holds a bachelor of science degree in computer science and mathematics from Leeds University in the United Kingdom.
|
|
Stephanie Linnartz
Executive Vice President and
Global Chief Marketing and Commercial Officer
|
47
|
|
Stephanie Linnartz became the Global Chief Marketing and Commercial Officer in March 2013 and was named an executive officer in February 2014. She has responsibility for the Company’s brand management, marketing, eCommerce, sales, reservations, revenue management, consumer insight, and information technology functions. Prior to assuming her current position, Ms. Linnartz served as Global Officer, Sales and Revenue Management from 2009 to 2013; Senior Vice President, Global Sales from 2008 to 2009; and Senior Vice President, Sales and Marketing Planning and Support from 2005 to 2008. She holds a master of business administration from the College of William and Mary.
|
||
|
Amy C. McPherson
President & Managing Director
Europe
|
54
|
|
Amy C. McPherson was appointed President and Managing Director of Europe, a division that encompasses Continental Europe, the United Kingdom, and Ireland, in July 2009. Ms. McPherson joined Marriott in 1986 and most recently served as Executive Vice President of Global Sales and Marketing responsible for the Company’s global and field sales, marketing, Marriott Rewards program, revenue management and eCommerce from 2005 until she was named to her current position. Other key positions held by Ms. McPherson include Senior Vice President of Business Transformation and Integration, and Vice President of Finance and Business Development. Before joining Marriott, she worked for Air Products & Chemicals in Allentown, PA.
|
||
88
|
Name and Title
|
Age
|
Business Experience
|
|||
|
Kathleen K. Oberg
Executive Vice President and Chief
Financial Officer
|
55
|
|
Kathleen ("Leeny") K. Oberg was appointed Executive Vice President and Chief Financial Officer of Marriott, effective January 1, 2016. Ms. Oberg most recently served, from 2013 to December 2015, as the Chief Financial Officer for The Ritz-Carlton Hotel Company, L.L.C., an operator of luxury hotels and resorts worldwide, and a subsidiary of Marriott. Prior to that, she served as Marriott’s Senior Vice President, Corporate and Development Finance from 2008 to 2013, leading a team providing a broad range of corporate finance and valuation support to senior management. Ms. Oberg was a key member of the leadership team that structured and executed the spin-off of Marriott’s timeshare business in 2011. From 2006 to 2008, she served as Senior Vice President, International Project Finance and Asset Management for Europe, the Middle East and Africa and served as the region’s senior finance executive. Ms. Oberg originally joined Marriott in 1999 in Investor Relations and served as one of the company’s primary contacts with institutional investors and analysts. In 2004, she was promoted to Vice President of Project Finance and served in this role for two years before moving to London. Ms. Oberg has also held numerous financial leadership positions with such organizations as Sodexo (previously Sodexho Marriott Services), Sallie Mae, Goldman Sachs and Chase Manhattan Bank. She earned her Bachelor of Science in Finance/Management Information Systems from the University of Virginia, McIntyre School of Business and received her MBA from Stanford University Graduate School of Business.
|
||
|
David A. Rodriguez
Executive Vice President
and Global Chief Human Resources Officer
|
57
|
|
David A. Rodriguez was appointed Executive Vice President and Global Chief Human Resources Officer in 2006. Dr. Rodriguez joined Marriott as Senior Vice President-Staffing & Development in 1998 and was appointed Executive Vice President Human Resources for Marriott Lodging in 2003. Before joining Marriott, he held several senior roles in human resources at Citicorp (now Citigroup) from 1989 through 1998. Dr. Rodriguez holds a doctorate degree in industrial/organizational psychology from New York University and is an elected fellow of the National Academy of Human Resources.
|
||
|
Edward A. Ryan
Executive Vice President and
General Counsel
|
62
|
|
Edward A. Ryan was named Executive Vice President and General Counsel in November 2006. He joined Marriott in 1996 as Assistant General Counsel, was promoted to Senior Vice President and Associate General Counsel in 1999, when he had responsibility for all new management agreements and real estate development worldwide for full-service and limited-service hotels; in 2005 he also assumed responsibility for all corporate transactions and corporate governance. Before joining Marriott, Mr. Ryan was a Partner at the law firm of Hogan & Hartson (now Hogan Lovells) in Washington, D.C.
|
||
|
Craig S. Smith
President & Managing Director
Asia Pacific
|
53
|
|
Craig S. Smith became President and Managing Director of Asia Pacific in June 2015, assuming the responsibility for the strategic leadership of all operational and development functions spanning 15 countries and 11 brands. Mr. Smith began his career with Marriott in February 1988. Prior to his current position, Mr. Smith served as President of Marriott’s Caribbean and Latin American region from 2011 to 2015. Before moving to the Caribbean and Latin American region in 2011, he was Executive Vice President and Chief Operations Officer for Asia Pacific. As the son of an American diplomat, Mr. Smith has lived in 13 countries, working in North America, the Caribbean, Latin America, Asia-Pacific, and Australia. He is fluent in Spanish and conversant in Portuguese. Mr. Smith earned his MBA from the Rotman School of Management at the University of Toronto, and a Bachelor of Science from Brigham Young University.
|
||
89
Code of Ethics and Business Conduct Guide
We have long maintained and enforced a Code of Ethics that applies to
all
Marriott associates, including our Executive Chairman, Chief Executive Officer, Chief Financial Officer, and Principal Accounting Officer, and to each member of our Board of Directors. Our Code of Ethics is encompassed in our Business Conduct Guide, which you can find in the Investor Relations section of our website (Marriott.com/investor) by clicking on “Corporate Governance” and then “Governance Documents.” We will post on the Investor Relations section of our website any future changes or amendments to our Code of Ethics, and any waiver of our Code of Ethics that applies to our Chairman of the Board, any of our executive officers, or member of the Board of Directors, within four business days following the date of such amendment or waiver.
90
|
Item 15.
|
Exhibits and Financial Statement Schedules.
|
LIST OF DOCUMENTS FILED AS PART OF THIS REPORT
(1) FINANCIAL STATEMENTS
We include this portion of Item 15 under Item 8 of this Report on Form 10-K.
(2) FINANCIAL STATEMENT SCHEDULES
We include the financial statement schedule information required by the applicable accounting regulations of the SEC in the notes to our financial statements and incorporate that information in this Item 15 by reference.
(3) EXHIBITS
Any shareholder who wants a copy of the following Exhibits may obtain one from us upon request at a charge that reflects the reproduction cost of such Exhibits. Requests should be made to the Secretary, Marriott International, Inc., 10400 Fernwood Road, Department 52/862, Bethesda, MD 20817.
|
Exhibit No.
|
Description
|
Incorporation by Reference
(where a report is indicated below, that
document has been previously filed with the SEC
and the applicable exhibit is incorporated by
reference thereto)
|
||
|
2.1
|
Agreement and Plan of Merger, dated as of November 15, 2015, by and among Marriott International, Inc., Starwood Hotels & Resorts Worldwide, Inc., and certain of their subsidiaries.
|
Exhibit No. 2.1 to our Form 8-K filed
November 16, 2015 (File No. 001-13881).
|
||
|
3.1
|
|
Restated Certificate of Incorporation.
|
|
Exhibit No. 3(i) to our Form 8-K filed
August 22, 2006 (File No. 001-13881).
|
|
3.2
|
|
Amended and Restated Bylaws.
|
|
Exhibit No. 3(ii) to our Form 8-K filed
June 18, 2014 (File No. 001-13881).
|
|
4.1
|
|
Form of Common Stock Certificate.
|
|
Exhibit No. 4.5 to our Form S-3ASR filed
December 8, 2005 (File No. 333-130212).
|
|
4.2
|
|
Indenture dated as of November 16, 1998, between the Company and The Bank of New York Mellon, as successor to JPMorgan Chase Bank, N.A., formerly known as The Chase Manhattan Bank.
|
Exhibit No. 4.1 to our Form 10-K for the fiscal year ended January 1, 1999 (File No. 001-13881).
|
|
|
4.3
|
|
Form of 6.200% Series H Note due 2016.
|
|
Exhibit No. 4.2 to our Form 8-K filed June 14, 2006 (File No. 001-13881).
|
|
4.4
|
|
Form of 6.375% Series I Note due 2017.
|
|
Exhibit No. 4.2 to our Form 8-K filed June 25, 2007 (File No. 001-13881).
|
|
4.5
|
Form of 3.000% Series K Note No. R-1 due 2019.
|
Exhibit No. 4.1 to our Form 8-K filed February 27, 2012 (File No. 001-13881).
|
||
|
4.6
|
Form of 3.000% Series K Note No. R-2 due 2019.
|
Exhibit No. 4 to our Form 8-K filed March 14, 2012 (File No. 001-13881).
|
||
|
4.7
|
Form of 3.250% Series L Note due 2022.
|
Exhibit No. 4.1 to our Form 8-K filed September 10, 2012 (File No. 001-13881).
|
||
|
4.8
|
Form of 3.375% Series M Note due 2020.
|
Exhibit No. 4.1 to our Form 8-K filed September 27, 2013 (File No. 001-13881).
|
||
|
4.9
|
Form of 3.125% Series N Note due 2021.
|
Exhibit No. 4.1 to our Form 8-K filed October 9, 2014 (File No. 001-13881).
|
||
91
|
Exhibit No.
|
Description
|
Incorporation by Reference
(where a report is indicated below, that
document has been previously filed with the SEC
and the applicable exhibit is incorporated by
reference thereto)
|
||
|
4.10
|
Form of 2.875% Series O Note due 2021.
|
Exhibit No. 4.1 to our Form 8-K filed September 14, 2015 (File No. 001-13881).
|
||
|
4.11
|
Form of 3.750% Series P Note due 2025.
|
Exhibit No. 4.2 to our Form 8-K filed September 14, 2015 (File No. 001-13881).
|
||
|
10.1
|
|
U.S. $2,000,000,000 Third Amended and Restated Credit Agreement dated as of July 18, 2013 with Bank of America, N.A. as administrative agent and certain banks.
|
|
Exhibit No. 10 to our Form 8-K filed July 19, 2013 (File No. 001-13881).
|
|
*10.2
|
|
Marriott International, Inc. Stock and Cash Incentive Plan, as Amended Through February 13, 2014.
|
|
Exhibit A to our Definitive Proxy Statement filed April 4, 2014 (File No. 001-13881).
|
|
*10.2.1
|
Amendment dated August 7, 2014 to the Marriott International, Inc. Stock and Cash Incentive Plan.
|
Exhibit No. 10 to our Form 10-Q filed October 29, 2014 (File No. 001-13881).
|
||
|
*10.3
|
|
Marriott International, Inc. Executive Deferred Compensation Plan, Amended and Restated as of January 1, 2009.
|
|
Exhibit No. 99 to our Form 8-K filed August 6, 2009 (File No. 001-13881).
|
|
*10.4
|
|
Form of Employee Non-Qualified Stock Option Agreement for the Marriott International, Inc. Stock and Cash Incentive Plan.
|
|
Exhibit No. 10.4 to our Form 10-K filed February 15, 2008 (File No. 001-13881).
|
|
*10.5
|
|
Form of Employee Non-Qualified Stock Option Agreement for the Marriott International, Inc. Stock and Cash Incentive Plan (Off-Cycle Grants).
|
|
Exhibit No. 10.5 to our Form 10-K filed February 12, 2009 (File No. 001-13881).
|
|
*10.6
|
|
Form of Employee Non-Qualified Stock Option Agreement for the Marriott International, Inc. Stock and Cash Incentive Plan (Annual Grants).
|
|
Exhibit No. 10.6 to our Form 10-K filed February 12, 2009 (File No. 001-13881).
|
|
*10.7
|
|
Form of Executive Restricted Stock Unit Agreement for the Marriott International, Inc. Stock and Cash Incentive Plan.
|
Exhibit No. 10.5 to our Form 10-K filed February 15, 2008 (File No. 001-13881).
|
|
|
*10.8
|
|
Form of Executive Restricted Stock Unit Agreement for the Marriott International, Inc. Stock and Cash Incentive Plan, as Amended as of May 1, 2009.
|
|
Exhibit No. 10.2 to our Form 10-Q filed July 17, 2009 (File No. 001-13881).
|
|
*10.9
|
Form of MI Shares Agreement for the Marriott International, Inc. Stock and Cash Incentive Plan.
|
|
Exhibit No. 10.6 to our Form 10-K filed February 15, 2008 (File No. 001-13881).
|
|
|
*10.10
|
Form of MI Shares Agreement for the Marriott International, Inc. Stock and Cash Incentive Plan (Off-Cycle Grants).
|
|
Exhibit No. 10.9 to our Form 10-K filed February 12, 2009 (File No. 001-13881).
|
|
|
*10.11
|
Form of MI Shares Agreement for the Marriott International, Inc. Stock and Cash Incentive Plan (Annual Grants).
|
|
Exhibit No. 10.10 to our Form 10-K filed February 12, 2009 (File No. 001-13881).
|
|
|
*10.12
|
Form of MI Shares Agreement for the Marriott International, Inc. Stock and Cash Incentive Plan (Annual Grants), as Amended as of May 1, 2009.
|
|
Exhibit No. 10.3 to our Form 10-Q filed July 17, 2009 (File No. 001-13881).
|
|
|
*10.12.1
|
Form of MI Shares Agreement (EBITDA version) under the Marriott International, Inc. Stock and Cash Incentive Plan, as amended and restated as of May 1, 2009 and amended as of May 7, 2010.
|
Exhibit No. 10.1 to our Form 8-K filed February 13, 2012 (File No. 001-13881).
|
||
|
*10.13
|
|
Form of Stock Appreciation Right Agreement for the Marriott International, Inc. Stock and Cash Incentive Plan.
|
|
Exhibit No. 10.7 to our Form 10-K filed February 15, 2008 (File No. 001-13881).
|
92
|
Exhibit No.
|
Description
|
Incorporation by Reference
(where a report is indicated below, that
document has been previously filed with the SEC
and the applicable exhibit is incorporated by
reference thereto)
|
||
|
*10.14
|
|
Form of Stock Appreciation Right Agreement for the Marriott International, Inc. Stock and Cash Incentive Plan (Off-Cycle Grants).
|
|
Exhibit No. 10.12 to our Form 10-K filed February 12, 2009 (File No. 001-13881).
|
|
*10.15
|
|
Form of Stock Appreciation Right Agreement for the Marriott International, Inc. Stock and Cash Incentive Plan (Annual Grants).
|
|
Exhibit No. 10.13 to our Form 10-K filed February 12, 2009 (File No. 001-13881).
|
|
*10.16
|
|
Form of Stock Appreciation Right Agreement for the Marriott International, Inc. Stock and Cash Incentive Plan (For Non-Employee Directors).
|
|
Exhibit No. 10.8 to our Form 10-K filed February 15, 2008 (File No. 001-13881).
|
|
*10.17
|
Form of Performance Share Award Agreement for the Marriott International, Inc. Stock and Cash Incentive Plan.
|
Filed with this report.
|
||
|
*10.18
|
|
Summary of Marriott International, Inc. Director Compensation.
|
|
Filed with this report.
|
|
*10.19
|
|
Marriott International, Inc. Executive Officer Incentive Plan and Executive Officer Individual Performance Plan.
|
|
Exhibit No. 10.10 to our Form 10-K filed February 15, 2008 (File No. 001-13881).
|
|
10.20
|
License, Services and Development Agreement entered into on November 17, 2011, among Marriott International, Inc., Marriott Worldwide Corporation, Marriott Vacations Worldwide Corporation and the other signatories thereto.
|
Exhibit No. 10.1 to our Form 8-K filed November 21, 2011 (File No. 001-13881).
|
||
|
10.21
|
License, Services and Development Agreement entered into on November 17, 2011, among The Ritz-Carlton Hotel Company, L.L.C., Marriott Vacations Worldwide Corporation and the other signatories thereto.
|
Exhibit No. 10.2 to our Form 8-K filed November 21, 2011 (File No. 001-13881).
|
||
|
10.22
|
Marriott Rewards Affiliation Agreement entered into on November 17, 2011, among Marriott International, Inc., Marriott Rewards, L.L.C., Marriott Vacations Worldwide Corporation and certain of its subsidiaries, Marriott Ownership Resorts, Inc. and the other signatories thereto.
|
Exhibit No. 10.5 to our Form 8-K filed November 21, 2011 (File No. 001-13881).
|
||
|
10.23
|
Non-Competition Agreement entered into on November 17, 2011, with Marriott Vacations Worldwide Corporation.
|
Exhibit No. 10.6 to our Form 8-K filed November 21, 2011 (File No. 001-13881).
|
||
|
12
|
|
Statement of Computation of Ratio of Earnings to Fixed Charges.
|
|
Filed with this report.
|
|
21
|
|
Subsidiaries of Marriott International, Inc.
|
|
Filed with this report.
|
|
23
|
|
Consent of Ernst & Young LLP.
|
|
Filed with this report.
|
|
31.1
|
|
Certification of Chief Executive Officer Pursuant to Rule 13a-14(a).
|
|
Filed with this report.
|
|
31.2
|
|
Certification of Chief Financial Officer Pursuant to Rule 13a-14(a).
|
|
Filed with this report.
|
|
32
|
|
Section 1350 Certifications.
|
|
Furnished with this report.
|
|
101.INS
|
|
XBRL Instance Document.
|
|
Submitted electronically with this report.
|
|
101.SCH
|
|
XBRL Taxonomy Extension Schema Document.
|
|
Submitted electronically with this report.
|
|
101.CAL
|
|
XBRL Taxonomy Calculation Linkbase Document.
|
|
Submitted electronically with this report.
|
93
|
Exhibit No.
|
Description
|
Incorporation by Reference
(where a report is indicated below, that
document has been previously filed with the SEC
and the applicable exhibit is incorporated by
reference thereto)
|
||
|
101.DEF
|
|
XBRL Taxonomy Extension Definition Linkbase.
|
|
Submitted electronically with this report.
|
|
101.LAB
|
|
XBRL Taxonomy Label Linkbase Document.
|
|
Submitted electronically with this report.
|
|
101.PRE
|
|
XBRL Taxonomy Presentation Linkbase Document.
|
|
Submitted electronically with this report.
|
|
*
|
Denotes management contract or compensatory plan.
|
We have submitted electronically the following documents formatted in XBRL (Extensible Business Reporting Language) as Exhibit 101 to this report: (i) the Consolidated Statements of Income for the year-ended
December 31, 2015
,
December 31, 2014
, and
December 31, 2013
; (ii) the Consolidated Balance Sheets at
December 31, 2015
, and
December 31, 2014
; (iii) the Consolidated Statements of Cash Flows for the year-ended
December 31, 2015
,
December 31, 2014
, and
December 31, 2013
; (iv) the Consolidated Statements of Comprehensive Income for the year-ended
December 31, 2015
,
December 31, 2014
, and
December 31, 2013
; (v) the Consolidated Statements of Shareholders’ (Deficit) Equity for the year-ended
December 31, 2015
,
December 31, 2014
, and
December 31, 2013
; and (vi) Notes to Consolidated Financial Statements.
94
SIGNATURES
Pursuant to the requirements of Section 13 or 15(d) of the Securities Exchange Act of 1934, we have duly caused this Form 10-K to be signed on our behalf by the undersigned, thereunto duly authorized, on this
18
th
day of February 2016
.
MARRIOTT INTERNATIONAL, INC.
|
By:
|
/s/ Arne M. Sorenson
|
|
|
Arne M. Sorenson
|
||
|
President and Chief Executive Officer
|
||
Pursuant to the requirements of the Securities Exchange Act of 1934, this Form 10-K has been signed by the following persons on our behalf in the capacities indicated and on the date indicated above.
|
PRINCIPAL EXECUTIVE OFFICER:
|
||
|
/s/ Arne M. Sorenson
|
President, Chief Executive Officer and Director
|
|
|
Arne M. Sorenson
|
||
|
PRINCIPAL FINANCIAL OFFICER:
|
|
|
|
/s/ Kathleen K. Oberg
|
|
Executive Vice President, Chief Financial Officer
|
|
Kathleen K. Oberg
|
||
|
PRINCIPAL ACCOUNTING OFFICER:
|
||
|
/s/ Bao Giang Val Bauduin
|
Controller and Chief Accounting Officer
|
|
|
Bao Giang Val Bauduin
|
||
|
DIRECTORS:
|
||
|
/s/ J.W. Marriott, Jr.
|
/s/ Debra L. Lee
|
|
|
J.W. Marriott, Jr., Chairman of the Board
|
Debra L. Lee, Director
|
|
|
/s/ Mary K. Bush
|
/s/ George Muñoz
|
|
|
Mary K. Bush, Director
|
George Muñoz, Director
|
|
|
/s/ Deborah Marriott Harrison
|
/s/ Steven S Reinemund
|
|
|
Deborah Marriott Harrison, Director
|
Steven S Reinemund, Director
|
|
|
/s/ Frederick A. Henderson
|
/s/ W. Mitt Romney
|
|
|
Frederick A. Henderson, Director
|
W. Mitt Romney, Director
|
|
|
/s/ Lawrence W. Kellner
|
/s/ Susan C. Schwab
|
|
|
Lawrence W. Kellner, Director
|
Susan C. Schwab, Director
|
|
95
TABLE OF CONTENTS
Part IItem 1. BusinessItem 1A. Risk FactorsItem 1B. Unresolved Staff CommentsItem 2. PropertiesItem 3. Legal ProceedingsItem 4. Mine Safety DisclosuresPart IIItem 5. Market For Registrant S Common Equity, Related Stockholder Matters, and Issuer Purchases Of Equity SecuritiesItem 6. Selected Financial DataItem 7. Management S Discussion and Analysis Of Financial Condition and Results Of OperationsItem 7A. Quantitative and Qualitative Disclosures About Market RiskItem 8. Financial Statements and Supplementary DataItem 9. Changes in and Disagreements with Accountants on Accounting and Financial DisclosureItem 9A. Controls and ProceduresItem 9B. Other InformationPart IIIItem 10. Directors, Executive Officers, and Corporate GovernanceItem 11. Executive CompensationItem 12. Security Ownership Of Certain Beneficial Owners and Management and Related Stockholder MattersItem 13. Certain Relationships and Related Transactions, and Director IndependenceItem 14. Principal Accounting Fees and ServicesPart IVItem 15. Exhibits and Financial Statement Schedules