MARRIOTT INTERNATIONAL INC /MD/
10-Ks and 10-Qs
|
|
|
|
|
|
|
|
|
|
|
|
|
|
|
|
|
|
|
|
|
|
|
|
|
|
|
|
|
|
|
|
|
|
|
|
|
|
|
|
|
|
|
|
|
|
|
|
|
|
|
|
|
|
|
|
UNITED STATES
SECURITIES AND EXCHANGE COMMISSION
Washington, D.C. 20549
_______________________________________
FORM 10-Q
_______________________________________
|
ý
|
QUARTERLY REPORT PURSUANT TO SECTION 13 OR 15(d) OF THE SECURITIES EXCHANGE ACT OF 1934
|
For the quarterly period ended
September 30, 2017
OR
|
o
|
TRANSITION REPORT PURSUANT TO SECTION 13 OR 15(d) OF THE SECURITIES EXCHANGE ACT OF 1934
|
For the transition period from to
Commission File No. 1-13881
_________________________________________________

MARRIOTT INTERNATIONAL, INC.
(Exact name of registrant as specified in its charter)
_______________________________________
|
Delaware
|
|
52-2055918
|
|
(State or other jurisdiction of
incorporation or organization)
|
|
(IRS Employer
Identification No.)
|
|
10400 Fernwood Road, Bethesda, Maryland
(Address of principal executive offices)
|
|
20817
(Zip Code)
|
(301) 380-3000
(Registrant’s telephone number, including area code)
_______________________________________
Indicate by check mark whether the registrant (1) has filed all reports required to be filed by Section 13 or 15(d) of the Securities Exchange Act of 1934 during the preceding 12 months (or for such shorter period that the registrant was required to file such reports), and (2) has been subject to such filing requirements for the past 90 days. Yes
ý
No
¨
Indicate by check mark whether the registrant has submitted electronically and posted on its corporate Web site, if any, every Interactive Data File required to be submitted and posted pursuant to Rule 405 of Regulation S-T during the preceding 12 months (or for such shorter period that the registrant was required to submit and post such files). Yes
ý
No
¨
Indicate by check mark whether the registrant is a large accelerated filer, an accelerated filer, a non-accelerated filer, smaller reporting company, or an emerging growth company. See the definitions of “large accelerated filer,” “accelerated filer,” “smaller reporting company,” and “emerging growth company” in Rule 12b-2 of the Exchange Act.
|
Large accelerated filer
|
|
ý
|
|
Accelerated filer
|
|
¨
|
|
Non-accelerated filer
|
|
¨
(Do not check if a smaller reporting company)
|
Smaller Reporting Company
|
|
¨
|
|
|
Emerging growth company
|
¨
|
|||||
|
If an emerging growth company, indicate by check mark if the registrant has elected not to use the extended transition period for complying with any new or revised financial accounting standards provided pursuant to Section 13(a) of the Exchange Act.
¨
|
||||||
Indicate by checkmark whether the registrant is a shell company (as defined in Rule 12b-2 of the Exchange Act). Yes
¨
No
ý
Indicate the number of shares outstanding of each of the issuer’s classes of common stock, as of the latest practicable date:
364,581,283
shares of Class A Common Stock, par value $0.01 per share, outstanding at
October 26, 2017
.
MARRIOTT INTERNATIONAL, INC.
FORM 10-Q TABLE OF CONTENTS
|
|
|
Page No.
|
|
Part I.
|
||
|
Item 1.
|
||
|
Item 2.
|
||
|
Item 3.
|
||
|
Item 4.
|
||
|
Part II.
|
||
|
Item 1.
|
||
|
Item 1A.
|
||
|
Item 2.
|
||
|
|
|
|
|
Item 6.
|
||
1
Item 1
.
Financial Statements
MARRIOTT INTERNATIONAL, INC.
($ in millions, except per share amounts)
(Unaudited)
|
Three Months Ended
|
Nine Months Ended
|
||||||||||||||
|
|
September 30, 2017
|
|
September 30, 2016
|
September 30, 2017
|
September 30, 2016
|
||||||||||
|
REVENUES
|
|||||||||||||||
|
Base management fees
|
$
|
269
|
|
$
|
180
|
|
$
|
818
|
|
$
|
538
|
|
|||
|
Franchise fees
|
426
|
|
290
|
|
1,207
|
|
813
|
|
|||||||
|
Incentive management fees
|
136
|
|
81
|
|
437
|
|
276
|
|
|||||||
|
831
|
|
551
|
|
2,462
|
|
1,627
|
|
||||||||
|
Owned, leased, and other revenue
|
452
|
|
239
|
|
1,349
|
|
650
|
|
|||||||
|
Cost reimbursements
|
4,380
|
|
3,152
|
|
13,208
|
|
9,339
|
|
|||||||
|
5,663
|
|
3,942
|
|
17,019
|
|
11,616
|
|
||||||||
|
OPERATING COSTS AND EXPENSES
|
|||||||||||||||
|
Owned, leased, and other - direct
|
356
|
|
194
|
|
1,069
|
|
533
|
|
|||||||
|
Reimbursed costs
|
4,380
|
|
3,152
|
|
13,208
|
|
9,339
|
|
|||||||
|
Depreciation, amortization, and other
|
68
|
|
36
|
|
218
|
|
97
|
|
|||||||
|
General, administrative, and other
|
199
|
|
161
|
|
635
|
|
470
|
|
|||||||
|
Merger-related costs and charges
|
28
|
|
228
|
|
100
|
|
250
|
|
|||||||
|
5,031
|
|
3,771
|
|
15,230
|
|
10,689
|
|
||||||||
|
OPERATING INCOME
|
632
|
|
171
|
|
1,789
|
|
927
|
|
|||||||
|
Gains and other income, net
|
6
|
|
3
|
|
31
|
|
3
|
|
|||||||
|
Interest expense
|
(73
|
)
|
(55
|
)
|
(216
|
)
|
(159
|
)
|
|||||||
|
Interest income
|
9
|
|
9
|
|
24
|
|
22
|
|
|||||||
|
Equity in earnings
|
6
|
|
3
|
|
29
|
|
8
|
|
|||||||
|
INCOME BEFORE INCOME TAXES
|
580
|
|
131
|
|
1,657
|
|
801
|
|
|||||||
|
Provision for income taxes
|
(188
|
)
|
(61
|
)
|
(486
|
)
|
(265
|
)
|
|||||||
|
NET INCOME
|
$
|
392
|
|
$
|
70
|
|
$
|
1,171
|
|
$
|
536
|
|
|||
|
EARNINGS PER SHARE
|
|||||||||||||||
|
Earnings per share - basic
|
$
|
1.05
|
|
$
|
0.26
|
|
$
|
3.09
|
|
$
|
2.08
|
|
|||
|
Earnings per share - diluted
|
$
|
1.04
|
|
$
|
0.26
|
|
$
|
3.06
|
|
$
|
2.04
|
|
|||
|
CASH DIVIDENDS DECLARED PER SHARE
|
$
|
0.33
|
|
$
|
0.30
|
|
$
|
0.96
|
|
$
|
0.85
|
|
|||
See Notes to Condensed Consolidated Financial Statements.
2
MARRIOTT INTERNATIONAL, INC.
CONDENSED CONSOLIDATED STATEMENTS OF COMPREHENSIVE INCOME
($ in millions)
(Unaudited)
|
Three Months Ended
|
Nine Months Ended
|
||||||||||||||
|
September 30, 2017
|
September 30, 2016
|
September 30, 2017
|
September 30, 2016
|
||||||||||||
|
Net income
|
$
|
392
|
|
$
|
70
|
|
$
|
1,171
|
|
$
|
536
|
|
|||
|
Other comprehensive income (loss):
|
|||||||||||||||
|
Foreign currency translation adjustments
|
107
|
|
2
|
|
457
|
|
27
|
|
|||||||
|
Derivative instrument adjustments, net of tax
|
(5
|
)
|
1
|
|
(13
|
)
|
(3
|
)
|
|||||||
|
Unrealized gain (loss) on available-for-sale securities, net of tax
|
1
|
|
—
|
|
(1
|
)
|
—
|
|
|||||||
|
Reclassification of losses, net of tax
|
4
|
|
1
|
|
5
|
|
3
|
|
|||||||
|
Total other comprehensive income, net of tax
|
107
|
|
4
|
|
448
|
|
27
|
|
|||||||
|
Comprehensive income
|
$
|
499
|
|
$
|
74
|
|
$
|
1,619
|
|
$
|
563
|
|
|||
See Notes to Condensed Consolidated Financial Statements.
3
MARRIOTT INTERNATIONAL, INC.
($ in millions)
|
(Unaudited)
|
|||||||
|
September 30,
2017 |
December 31,
2016 |
||||||
|
ASSETS
|
|||||||
|
Current assets
|
|||||||
|
Cash and equivalents
|
$
|
508
|
|
$
|
858
|
|
|
|
Accounts and notes receivable, net
|
1,914
|
|
1,695
|
|
|||
|
Prepaid expenses and other
|
225
|
|
230
|
|
|||
|
Assets held for sale
|
297
|
|
588
|
|
|||
|
2,944
|
|
3,371
|
|
||||
|
Property and equipment, net
|
1,894
|
|
2,335
|
|
|||
|
Intangible assets
|
|||||||
|
Brands
|
5,898
|
|
6,509
|
|
|||
|
Contract acquisition costs and other
|
2,860
|
|
2,761
|
|
|||
|
Goodwill
|
9,182
|
|
7,598
|
|
|||
|
17,940
|
|
16,868
|
|
||||
|
Equity and cost method investments
|
720
|
|
728
|
|
|||
|
Notes receivable, net
|
228
|
|
245
|
|
|||
|
Deferred tax assets
|
110
|
|
116
|
|
|||
|
Other noncurrent assets
|
400
|
|
477
|
|
|||
|
$
|
24,236
|
|
$
|
24,140
|
|
||
|
LIABILITIES AND SHAREHOLDERS’ EQUITY
|
|||||||
|
Current liabilities
|
|||||||
|
Current portion of long-term debt
|
$
|
398
|
|
$
|
309
|
|
|
|
Accounts payable
|
733
|
|
687
|
|
|||
|
Accrued payroll and benefits
|
1,133
|
|
1,174
|
|
|||
|
Liability for guest loyalty programs
|
1,959
|
|
1,866
|
|
|||
|
Accrued expenses and other
|
1,385
|
|
1,111
|
|
|||
|
5,608
|
|
5,147
|
|
||||
|
Long-term debt
|
8,271
|
|
8,197
|
|
|||
|
Liability for guest loyalty programs
|
2,824
|
|
2,675
|
|
|||
|
Deferred tax liabilities
|
927
|
|
1,020
|
|
|||
|
Other noncurrent liabilities
|
2,094
|
|
1,744
|
|
|||
|
Shareholders’ equity
|
|||||||
|
Class A Common Stock
|
5
|
|
5
|
|
|||
|
Additional paid-in-capital
|
5,744
|
|
5,808
|
|
|||
|
Retained earnings
|
7,310
|
|
6,501
|
|
|||
|
Treasury stock, at cost
|
(8,498
|
)
|
(6,460
|
)
|
|||
|
Accumulated other comprehensive loss
|
(49
|
)
|
(497
|
)
|
|||
|
4,512
|
|
5,357
|
|
||||
|
$
|
24,236
|
|
$
|
24,140
|
|
||
See Notes to Condensed Consolidated Financial Statements.
4
MARRIOTT INTERNATIONAL, INC.
($ in millions)
(Unaudited)
|
Nine Months Ended
|
|||||||
|
|
September 30, 2017
|
September 30, 2016
|
|||||
|
OPERATING ACTIVITIES
|
|||||||
|
Net income
|
$
|
1,171
|
|
$
|
536
|
|
|
|
Adjustments to reconcile to cash provided by operating activities:
|
|||||||
|
Depreciation, amortization, and other
|
218
|
|
97
|
|
|||
|
Share-based compensation
|
139
|
|
117
|
|
|||
|
Income taxes
|
73
|
|
1
|
|
|||
|
Liability for guest loyalty programs
|
236
|
|
179
|
|
|||
|
Merger-related charges
|
(117
|
)
|
172
|
|
|||
|
Working capital changes
|
98
|
|
27
|
|
|||
|
Other
|
98
|
|
77
|
|
|||
|
Net cash provided by operating activities
|
1,916
|
|
1,206
|
|
|||
|
INVESTING ACTIVITIES
|
|||||||
|
Acquisition of a business, net of cash acquired
|
—
|
|
(2,412
|
)
|
|||
|
Capital expenditures
|
(155
|
)
|
(132
|
)
|
|||
|
Dispositions
|
482
|
|
53
|
|
|||
|
Loan advances
|
(85
|
)
|
(24
|
)
|
|||
|
Loan collections
|
91
|
|
61
|
|
|||
|
Contract acquisition costs
|
(129
|
)
|
(55
|
)
|
|||
|
Other
|
(14
|
)
|
22
|
|
|||
|
Net cash provided by (used in) investing activities
|
190
|
|
(2,487
|
)
|
|||
|
FINANCING ACTIVITIES
|
|||||||
|
Commercial paper/Credit facility, net
|
455
|
|
1,657
|
|
|||
|
Issuance of long-term debt
|
1
|
|
1,483
|
|
|||
|
Repayment of long-term debt
|
(305
|
)
|
(296
|
)
|
|||
|
Issuance of Class A Common Stock
|
4
|
|
22
|
|
|||
|
Dividends paid
|
(362
|
)
|
(257
|
)
|
|||
|
Purchase of treasury stock
|
(2,105
|
)
|
(248
|
)
|
|||
|
Share-based compensation withholding taxes
|
(144
|
)
|
(74
|
)
|
|||
|
Other
|
—
|
|
(24
|
)
|
|||
|
Net cash (used in) provided by financing activities
|
(2,456
|
)
|
2,263
|
|
|||
|
(DECREASE) INCREASE IN CASH AND EQUIVALENTS
|
(350
|
)
|
982
|
|
|||
|
CASH AND EQUIVALENTS, beginning of period
|
858
|
|
96
|
|
|||
|
CASH AND EQUIVALENTS, end of period
|
$
|
508
|
|
$
|
1,078
|
|
|
See Notes to Condensed Consolidated Financial Statements.
5
MARRIOTT INTERNATIONAL, INC.
NOTES TO CONDENSED CONSOLIDATED FINANCIAL STATEMENTS
(Unaudited)
1
.
BASIS OF PRESENTATION
The condensed consolidated financial statements present the results of operations, financial position, and cash flows of Marriott International, Inc. and subsidiaries (referred to in this report as “we,” “us,” “Marriott,” or “the Company”). In order to make this report easier to read, we also refer throughout to (i) our Condensed Consolidated Financial Statements as our “Financial Statements,” (ii) our Condensed Consolidated Statements of Income as our “Income Statements,” (iii) our Condensed Consolidated Balance Sheets as our “Balance Sheets,” (iv) our Condensed Consolidated Statements of Cash Flows as our “Statements of Cash Flows,” (v) our properties, brands, or markets in the United States (“U.S.”) and Canada as “North America” or “North American,” and (vi) our properties, brands, or markets outside of the U.S. and Canada as “International.” In addition, references throughout to numbered “Footnotes” refer to the numbered Notes in these Notes to Condensed Consolidated Financial Statements, unless otherwise noted.
These Financial Statements have not been audited. We have condensed or omitted certain information and footnote disclosures normally included in financial statements presented in accordance with U.S. generally accepted accounting principles (“GAAP”). The financial statements in this report should be read in conjunction with the consolidated financial statements and notes thereto in our Annual Report on Form 10-K for the fiscal year ended
December 31, 2016
(“
2016
Form 10-K”). Certain terms not otherwise defined in this Form 10-Q have the meanings specified in our
2016
Form 10-K.
Preparation of financial statements that conform with GAAP requires management to make estimates and assumptions that affect the reported amounts of assets and liabilities as of the date of the financial statements, the reported amounts of revenues and expenses during the reporting periods, and the disclosures of contingent liabilities. Accordingly, ultimate results could differ from those estimates.
The accompanying Financial Statements reflect all normal and recurring adjustments necessary to present fairly our financial position as of
September 30, 2017
and
December 31, 2016
, the results of our operations for the
three and nine months ended
September 30, 2017
and
September 30, 2016
, and cash flows for the
nine months ended
September 30, 2017
and
September 30, 2016
. Interim results may not be indicative of fiscal year performance because of seasonal and short-term variations. We have eliminated all material intercompany transactions and balances between entities consolidated in these Financial Statements.
Beginning in the 2017 first quarter, we reclassified branding fees for third-party residential sales and credit card licensing to the “
Franchise fees
” caption from the “
Owned, leased, and other revenue
” caption on our Income Statements, as we believe branding fees are more akin to franchise royalties than owned and leased hotel profits. Branding fees totaled
$68 million
for the
three months ended
September 30, 2017
and
$195 million
for the
nine months ended
September 30, 2017
. We reclassified the prior period amounts, which totaled
$40 million
for the
three months ended
September 30, 2016
and
$121 million
for the
nine months ended
September 30, 2016
, to conform to our current presentation.
In the 2017 first quarter, our Asia Pacific operating segment met the applicable accounting criteria to be a reportable segment. Our Europe, Middle East and Africa, and Caribbean and Latin America operating segments do not individually meet the criteria for separate disclosure as reportable segments, and accordingly we combined them into an “all other category” which we refer to as “
Other International
.” We reclassified prior period amounts to conform to our current presentation. See Footnote
11
“
Business Segments
.”
Acquisition of Starwood Hotels & Resorts Worldwide
On September 23, 2016 (the “Merger Date”), we completed the acquisition of Starwood Hotels & Resorts Worldwide, LLC, formerly known as Starwood Hotels & Resorts Worldwide, Inc. (“Starwood”), through a series of transactions (the “Starwood Combination”), after which Starwood became an indirect wholly-owned subsidiary of the Company. Accordingly, our Income Statements include Starwood’s results of operations from the Merger Date.
6
We refer to our business associated with brands that were in our portfolio before the Starwood Combination as “Legacy-Marriott” and to the Starwood business and brands that we acquired as “Legacy-Starwood.” See Footnote
2
“
Acquisitions and Dispositions
” for more information on the Starwood Combination.
New Accounting Standards
Accounting Standards Update No. 2014-09 - “Revenue from Contracts with Customers” (“ASU 2014-09”)
ASU 2014-09 supersedes the revenue recognition requirements in Topic 605,
Revenue Recognition
,
as well as most industry-specific guidance, and enhances comparability of revenue recognition practices across entities and industries by providing a principles-based, comprehensive framework for addressing revenue recognition issues. ASU 2014-09 also specifies the accounting for some costs to obtain or fulfill a contract with a customer and provides enhanced disclosure requirements. The standard will be effective for us beginning in our 2018 first quarter. We are permitted to use either the full retrospective or the modified retrospective method when adopting ASU 2014-09, and we are evaluating the available adoption methods.
We are still assessing the potential impact that ASU 2014-09 will have on our financial statements and disclosures, but we believe that recognition of base management fees, franchise royalty fees, and owned and leased revenues will remain largely unchanged. We expect to recognize gains from the sale of real estate assets when control of the asset is transferred to the buyer, generally at the time the sale closes. Under current guidance, we defer gains on sales of real estate assets if we maintain substantial continuing involvement. We do not expect that this change will have a material impact on our Financial Statements, as we typically do not have real estate sale transactions that require us to defer significant gains. There likely will be changes to our revenue recognition policies related to the following:
|
•
|
We expect to recognize franchise application and relicensing fees over the term of the franchise contract rather than at hotel opening or relicensing.
|
|
•
|
We expect to present the amortization of contract acquisition costs paid to customers as a reduction of revenue rather than including such costs in “
Depreciation, amortization, and other
” on our Income Statements.
|
|
•
|
We expect to capitalize fewer contract acquisition costs as certain costs will not meet the capitalization criteria specified by ASU 2014-09.
|
|
•
|
We expect to recognize incentive management fees throughout the year to the extent that we determine that it is probable that a significant reversal will not occur as a result of future hotel profits or cash flows. This may result in a different pattern of recognition for incentive management fees from quarter to quarter than under the current guidance, but we do not expect a material impact on the total incentive management fees we will recognize during the full fiscal year.
|
|
•
|
Under the new guidance, we will generally be considered an agent in the transaction when loyalty program awards are redeemed. As a result, we will only recognize revenue for the net amount of consideration to which we are entitled for arranging for the redemption award, rather than the gross amount. While we have not yet fully quantified the impact of this change, it will have no impact on our operating or net income.
|
|
•
|
We expect to recognize temporary timing differences between costs incurred for centralized programs and services and the related reimbursement from hotel owners in our operating and net income in the period they occur. We operate these programs with the objective of breaking even, and under current guidance, we record any temporary timing differences on our Balance Sheets.
|
Accounting Standards Update No. 2016-02 - “Leases” (“ASU 2016-02”)
ASU 2016-02 introduces a lessee model that brings substantially all leases onto the balance sheet. Under the new standard, a lessee will recognize on its balance sheet a lease liability and a right-of-use asset for most leases, including operating leases. The new standard will also distinguish leases as either finance leases or operating leases. This distinction will affect how leases are measured and presented in the income statement and statement of cash flows. The standard is effective for us beginning in our 2019 first quarter, and we will be required to use a modified
7
retrospective transition approach, which means that we will apply the provisions of ASU 2016-02 to each lease that existed at the beginning of the earliest comparative period presented in the financial statements, as well as leases entered into after that date. We are still assessing the potential impact that ASU 2016-02 will have on our financial statements and disclosures, but we expect that it will have a material effect on our Balance Sheets.
Accounting Standards Update No. 2016-09 - “Stock Compensation” (“ASU 2016-09”)
We adopted ASU 2016-09 in the 2017 first quarter, which involves several aspects of the accounting for share-based payments. The new guidance had the following impacts on our Financial Statements:
|
•
|
We now record excess tax benefits (or deficiencies) as income tax benefit (or expense) in our Income Statements. Previously, we recorded excess tax benefits (deficiencies) in additional paid-in-capital in our Balance Sheets. As required, we prospectively applied this amendment in our Income Statements, which resulted in a benefit of
$62 million
to our provision for income taxes, approximately
$0.16
per diluted share, for the
nine months ended
September 30, 2017
.
|
|
•
|
We now classify excess tax benefits (or deficiencies) along with other income taxes in operating activities in our Statements of Cash Flows. ASU 2016-09 allowed for this amendment to be applied either prospectively or retrospectively. For consistency with our application of ASU 2016-09 in our Income Statements, we applied this amendment prospectively in our Statements of Cash Flows. For the
nine months ended
September 30, 2017
, operating activities in our Statements of Cash Flows include
$62 million
from excess tax benefits. For the
nine months ended
September 30, 2016
, we classified
$21 million
of excess tax benefits as financing inflows.
|
|
•
|
We now classify cash paid to taxing authorities when we withhold shares for employee tax-withholding purposes as a financing activity. As required, we retrospectively applied this amendment in our Statements of Cash Flows, and accordingly we reclassified
$74 million
of cash outflows from operating activities to financing activities for the
nine months ended
September 30, 2016
.
|
Accounting Standards Update No. 2016-16 - “Accounting for Income Taxes: Intra-Entity Transfers of Assets Other than Inventory” (“ASU 2016-16”)
ASU 2016-16 requires companies to recognize the income tax effects of intercompany sales of assets other than inventory when the transfer occurs. Under current GAAP, the tax effects of intercompany sales are deferred until the transferred asset is sold to a third party or otherwise recovered through use. ASU 2016-16 will be effective for us beginning in our 2018 first quarter, and we will be required to use a modified retrospective transition approach with a cumulative-effect adjustment to retained earnings as of the beginning of the period of adoption. We are still assessing the potential impact that the standard will have on our financial statements and disclosures.
Accounting Standards Update No. 2017-01 - “Clarifying the Definition of a Business” (“ASU 2017-01”)
We prospectively adopted ASU 2017-01 in the 2017 first quarter, which clarifies the definition of a business to help companies evaluate whether transactions should be accounted for as acquisitions or disposals of assets or businesses. We expect that under this new guidance, our hotel sales will generally qualify as asset disposals, with the result that no goodwill of the reporting unit will be assigned to the carrying value of the asset when calculating the gain or loss on sale.
8
2
.
ACQUISITIONS AND DISPOSITIONS
Starwood Combination
The following table presents the fair value of each type of consideration that we transferred in the Starwood Combination:
|
(in millions, except per share amounts)
|
|||
|
Equivalent shares of Marriott common stock issued in exchange for Starwood outstanding shares
|
134.4
|
|
|
|
Marriott common stock price as of Merger Date
|
$
|
68.44
|
|
|
Fair value of Marriott common stock issued in exchange for Starwood outstanding shares
|
9,198
|
|
|
|
Cash consideration to Starwood shareholders, net of cash acquired of $1,116
|
2,412
|
|
|
|
Fair value of Marriott equity-based awards issued in exchange for vested Starwood equity-based awards
|
71
|
|
|
|
Total consideration transferred, net of cash acquired
|
$
|
11,681
|
|
Fair Values of Assets Acquired and Liabilities Assumed
. The following table presents our estimates of fair values of the assets that we acquired and the liabilities that we assumed on the Merger Date as preliminarily reported at year-end
2016
and as finalized at the end of the
2017 third quarter
:
|
($ in millions)
|
September 23, 2016
(as reported at
December 31, 2016)
|
Adjustments
(2)
|
September 23, 2016
(as finalized) |
||||||||
|
Working capital
|
$
|
(180
|
)
|
$
|
(56
|
)
|
$
|
(236
|
)
|
||
|
Property and equipment, including assets held for sale
|
1,999
|
|
(293
|
)
|
1,706
|
|
|||||
|
Identified intangible assets
|
7,957
|
|
(719
|
)
|
7,238
|
|
|||||
|
Equity and cost method investments
|
579
|
|
(42
|
)
|
537
|
|
|||||
|
Other noncurrent assets
|
224
|
|
(24
|
)
|
200
|
|
|||||
|
Deferred income taxes, net
|
(1,516
|
)
|
52
|
|
(1,464
|
)
|
|||||
|
Guest loyalty program
|
(1,631
|
)
|
(7
|
)
|
(1,638
|
)
|
|||||
|
Debt
|
(1,871
|
)
|
(6
|
)
|
(1,877
|
)
|
|||||
|
Other noncurrent liabilities
|
(654
|
)
|
(323
|
)
|
(977
|
)
|
|||||
|
Net assets acquired
|
4,907
|
|
(1,418
|
)
|
3,489
|
|
|||||
|
Goodwill
(1)
|
6,774
|
|
1,418
|
|
8,192
|
|
|||||
|
$
|
11,681
|
|
$
|
—
|
|
$
|
11,681
|
|
|||
|
(1)
|
Goodwill primarily represents the value that we expect to obtain from synergies and growth opportunities from our combined operations, and it is not deductible for tax purposes. See Footnote
11
“
Business Segments
” for our assignment of goodwill by reportable segment.
|
|
(2)
|
Adjustments primarily reflect refinements of our valuation models related to certain acquired IT systems, our assumptions for capital expenditures of owned and leased hotels, discount rates, certain assumptions related to operating lease agreements, and our assumptions related to certain brands and management and franchise agreements, including contract terms (including renewal assumptions), tax rates, and royalty and growth rates used in the relief-from-royalty valuation models.
|
We estimated the value of the acquired property and equipment using a combination of the income, cost, and market approaches, which are primarily based on significant Level 2 and Level 3 assumptions, such as estimates of future income growth, capitalization rates, discount rates, and capital expenditure needs of the hotel properties. Our equity method investments consist primarily of partnership and joint venture interests in entities that own hotel real estate. We estimated the value of the underlying real estate using the same methods as for property and equipment described above. We primarily valued debt using quoted market prices, which are considered Level 1 inputs as they are observable in the market.
9
The following table presents our estimates of the fair values of Starwood’s identified intangible assets and their related estimated useful lives:
|
Estimated Fair Value
($ in millions)
|
Estimated Useful
Life (in years)
|
|||||
|
Brands
|
$
|
5,664
|
|
indefinite
|
||
|
Management agreements and lease contract intangibles
|
751
|
|
10 - 25
|
|||
|
Franchise agreements
|
746
|
|
10 - 80
|
|||
|
Loyalty program marketing rights
|
77
|
|
30
|
|||
|
$
|
7,238
|
|
||||
We estimated the value of Starwood’s brands using the relief-from-royalty method, which applies an estimated royalty rate to forecasted future cash flows, discounted to present value. We estimated the value of management and franchise agreements using the multi-period excess earnings method, which is a variation of the income approach. This method estimates an intangible asset’s value based on the present value of the incremental after-tax cash flows attributable to the intangible asset. We valued the lease contract intangibles using an income approach. These valuation approaches utilize Level 3 inputs.
In connection with the Starwood Combination, we are currently assessing various regulatory compliance matters at several foreign Legacy-Starwood locations, including compliance with the U.S. Foreign Corrupt Practices Act (“FCPA”). The results of this assessment may give rise to contingencies that could require us to accrue expenses. While any such amounts are not currently estimable, we will continue to evaluate potential contingencies as we gather more information.
Pro Forma Results of Operations
. For the nine months ended September 30, 2016, pro forma revenues totaled
$17,033 million
, and pro forma net income totaled
$878 million
. Pro forma net income includes
$54 million
of integration costs, and it excludes
$295 million
of transaction and employee termination costs. As required by GAAP, these unaudited pro forma results assume we completed the
Starwood Combination
on January 1, 2015, use our estimates of the fair values of assets and liabilities as of the Merger Date, and do not reflect any cost saving synergies from operating efficiencies. They are not necessarily indicative of what the actual results of operations of the combined company would have been if the Starwood Combination had occurred on January 1, 2015, nor are they indicative of future results of operations.
Dispositions and Planned Dispositions
In the 2017 fourth quarter, we announced that the owners of Avendra LLC have reached a binding agreement to sell Avendra LLC to Aramark. We expect to receive approximately
$650 million
for our
55 percent
interest in Avendra LLC. We committed to the owners of the hotels in our system that the benefits derived from Avendra LLC, including any dividends or sale proceeds above our original investment, would be used for the benefit of the hotels in our system. Accordingly, our share of the proceeds will be invested for the benefit of our system of hotels. We are currently developing these investment plans.
At the end of the
2017 third quarter
, we held
$297 million
of assets classified as “Assets held for sale” on our Balance Sheets related to a North American Full-Service hotel acquired in the Starwood Combination and the remaining Miami Beach EDITION residences. In the 2017 fourth quarter, we sold the North American Full-Service hotel and received C
$337 million
(
$269 million
) in cash.
In the 2017 second quarter, we sold a North American Full-Service hotel and received
$169 million
in cash. We recognized a
$24 million
gain in the “
Gains and other income, net
” caption of our Income Statements.
In the 2017 first quarter, we sold a North American Full-Service hotel, which we had acquired in the Starwood Combination and previously classified as “Assets held for sale,” and received
$306 million
in cash. In conjunction with the sale, we also transferred the associated ground lease, as a result of which our future minimum operating lease obligations decreased by approximately
$194 million
as of the date of the sale as follows: $
3 million
in
2017
, $
4 million
in
2018
, $
4 million
in
2019
, $
4 million
in
2020
, $
4 million
in
2021
, and $
175 million
thereafter.
10
3
.
MERGER-RELATED COSTS AND CHARGES
The following table presents pre-tax merger-related costs and other charges that we incurred in connection with the Starwood Combination:
|
Three Months Ended
|
Nine Months Ended
|
||||||||||||||
|
($ in millions)
|
September 30, 2017
|
September 30, 2016
|
September 30, 2017
|
September 30, 2016
|
|||||||||||
|
Merger-related costs and charges
|
|||||||||||||||
|
Transaction costs
|
$
|
4
|
|
$
|
18
|
|
$
|
14
|
|
$
|
31
|
|
|||
|
Employee termination costs
|
(3
|
)
|
186
|
|
9
|
|
186
|
|
|||||||
|
Integration costs
|
27
|
|
24
|
|
77
|
|
33
|
|
|||||||
|
28
|
|
228
|
|
100
|
|
250
|
|
||||||||
|
Interest expense
|
—
|
|
9
|
|
—
|
|
22
|
|
|||||||
|
$
|
28
|
|
$
|
237
|
|
$
|
100
|
|
$
|
272
|
|
||||
Transaction costs represent costs related to the planning and execution of the Starwood Combination, primarily for financial advisory, legal, and other professional service fees. Employee termination costs represent adjustments or charges for employee severance, retention, and other termination related benefits. Integration costs primarily represent integration employee salaries and share-based compensation, change management consultants, and technology-related costs. Merger-related interest expense in the
2016 first three quarters
reflects costs that we incurred for a bridge term loan facility commitment and incremental interest expense for debt incurred related to the Starwood Combination.
In connection with the Starwood Combination, we initiated a restructuring program to achieve cost synergies from our combined operations. We did not allocate costs associated with our restructuring program to any of our business segments. The following table presents our restructuring reserve activity during the
2017 first three quarters
:
|
($ in millions)
|
Liability for employee termination costs
|
||
|
Balance at year-end 2016
|
$
|
192
|
|
|
Charges
|
4
|
|
|
|
Cash payments
|
(110
|
)
|
|
|
Adjustments
(1)
|
(13
|
)
|
|
|
Balance at September 30, 2017, classified in “Accrued expenses and other”
|
$
|
73
|
|
|
(1)
|
Adjustments primarily reflect the reversal of accruals for certain employees who accepted other positions at the Company or resigned and the impact of cumulative translation adjustments.
|
11
4
.
EARNINGS PER SHARE
The table below presents the reconciliation of the earnings and number of shares used in our calculations of basic and diluted earnings per share:
|
Three Months Ended
|
Nine Months Ended
|
||||||||||||||
|
(in millions, except per share amounts)
|
September 30, 2017
|
September 30, 2016
|
September 30, 2017
|
September 30, 2016
|
|||||||||||
|
Computation of Basic Earnings Per Share
|
|||||||||||||||
|
Net income
|
$
|
392
|
|
$
|
70
|
|
$
|
1,171
|
|
$
|
536
|
|
|||
|
Shares for basic earnings per share
|
372.3
|
|
266.2
|
|
378.5
|
|
258.3
|
|
|||||||
|
Basic earnings per share
|
$
|
1.05
|
|
$
|
0.26
|
|
$
|
3.09
|
|
$
|
2.08
|
|
|||
|
Computation of Diluted Earnings Per Share
|
|||||||||||||||
|
Net income
|
$
|
392
|
|
$
|
70
|
|
$
|
1,171
|
|
$
|
536
|
|
|||
|
Shares for basic earnings per share
|
372.3
|
|
266.2
|
|
378.5
|
|
258.3
|
|
|||||||
|
Effect of dilutive securities
|
|||||||||||||||
|
Share-based compensation
|
4.3
|
|
4.3
|
|
4.7
|
|
4.4
|
|
|||||||
|
Shares for diluted earnings per share
|
376.6
|
|
270.5
|
|
383.2
|
|
262.7
|
|
|||||||
|
Diluted earnings per share
|
$
|
1.04
|
|
$
|
0.26
|
|
$
|
3.06
|
|
$
|
2.04
|
|
|||
5
.
SHARE-BASED COMPENSATION
We recorded share-based compensation expense of
$44 million
in the
2017 third quarter
and
$39 million
in the
2016 third quarter
,
$139 million
for the
2017 first three quarters
, and
$98 million
for the
2016 first three quarters
. Deferred compensation costs for unvested awards totaled
$209 million
at
September 30, 2017
and
$192 million
at
December 31, 2016
.
RSUs and PSUs
We granted
1.7 million
RSUs during the
2017 first three quarters
to certain officers, key employees, and non-employee directors, and those units vest generally over
four years
in equal annual installments commencing
one year
after the grant date. We granted
0.2 million
PSUs in the
2017 first three quarters
to certain executive officers, subject to continued employment and the satisfaction of certain performance conditions based on achievement of pre-established targets for Adjusted EBITDA, RevPAR Index, room openings, and/or net administrative expense over, or at the end of, a
three
-year performance period. RSUs, including PSUs, granted in the
2017 first three quarters
had a weighted average grant-date fair value of
$84
.
SARs
We granted
0.3 million
SARs to officers and key employees during the
2017 first three quarters
. These SARs generally expire
ten years
after the grant date and both vest and may be exercised in
four
equal annual installments commencing
one year
following the grant date. The weighted average grant-date fair value of SARs granted in the
2017 first three quarters
was
$30
, and the weighted average exercise price was
$88
.
We used the following assumptions as part of a binomial lattice-based valuation model to estimate the fair value of the SARs we granted during the
2017 first three quarters
:
|
Expected volatility
|
30.9
|
%
|
|
Dividend yield
|
1.3
|
%
|
|
Risk-free rate
|
2.4
|
%
|
|
Expected term (in years)
|
8
|
|
12
6
.
INCOME TAXES
Our effective tax rate
decreased
to
32.5%
for the
2017 third quarter
from
46.4%
for the
2016 third quarter
, primarily compared to the limited tax benefit we recognized in 2016 from certain merger-related costs that we incurred in jurisdictions with lower tax rates and a tax benefit of
$6 million
from our adoption of ASU 2016-09.
Our effective tax rate
decreased
to
29.3%
for the
2017 first three quarters
from
33.1%
for the
2016 first three quarters
, primarily due to a tax benefit of
$62 million
from the adoption of ASU 2016-09 and the release of a tax reserve of
$12 million
due to the favorable settlement of an uncertain tax position. The decrease was partially offset by an unfavorable comparison to the 2016 release of a valuation allowance of
$15 million
.
We paid cash for income taxes, net of refunds, of
$413 million
in the
2017 first three quarters
and
$243 million
in the
2016 first three quarters
.
7
.
COMMITMENTS AND CONTINGENCIES
Guarantees
We present the maximum potential amount of our future guarantee fundings and the carrying amount of our liability for our debt service, operating profit, and other guarantees for which we are the primary obligor at
September 30, 2017
in the following table:
|
($ in millions)
Guarantee Type
|
Maximum Potential Amount of Future Fundings
|
Recorded Liability for Guarantees
|
||||||
|
Debt service
|
$
|
136
|
|
$
|
19
|
|
||
|
Operating profit
|
248
|
|
117
|
|
||||
|
Other
|
10
|
|
2
|
|
||||
|
$
|
394
|
|
$
|
138
|
|
|||
Contingent Purchase Obligations
Times Square EDITION
. We granted the lenders the right, upon an uncured event of default by the hotel owner under, and an acceleration of, the mortgage loan, to require us to purchase the hotel component of the property for
$315 million
during a period of
two
years after opening, which the lenders may extend for up to
three
years to complete foreclosure if the loan has been accelerated and certain other conditions are met. We accounted for this contingent purchase obligation as a guarantee, and our recorded liability at September 30, 2017 was
$2 million
.
Sheraton Grand Chicago
. We granted the owner a one-time right, exercisable in 2022, to require us to purchase the leasehold interest in the land and the hotel for
$300 million
in cash (the “put option”). If the owner exercises the put option, we have the option to purchase, at the same time the put transaction closes, the underlying fee simple interest in the land for an additional
$200 million
in cash. We accounted for the put option as a guarantee, and our recorded liability at September 30, 2017 was
$57 million
.
We concluded that the entity that owns the Sheraton Grand Chicago hotel is a variable interest entity. We did not consolidate the entity because we do not have the power to direct the activities that most significantly impact the entity’s economic performance. Our maximum exposure to loss related to the entity is equal to the difference between the purchase price and the fair value of the hotel at the time that the put option is exercised, plus the maximum funding amount of an operating profit guarantee that we provided for the hotel.
Other Contingencies
See a description of certain contingencies relating to the Starwood Combination in Footnote
2
“
Acquisitions and Dispositions
.”
13
8
.
LONG-TERM DEBT
We provide detail on our long-term debt balances, net of discounts, premiums, and debt issuance costs, in the following table at the end of the
2017 third quarter
and year-end
2016
:
|
At Period End
|
|||||||
|
($ in millions)
|
September 30, 2017
|
December 31, 2016
|
|||||
|
Senior Notes:
|
|||||||
|
Series I Notes, interest rate of 6.4%, face amount of $293, matured June 15, 2017
(effective interest rate of 6.5%) |
$
|
—
|
|
$
|
293
|
|
|
|
Series K Notes, interest rate of 3.0%, face amount of $600, maturing March 1, 2019
(effective interest rate of 4.4%) |
598
|
|
597
|
|
|||
|
Series L Notes, interest rate of 3.3%, face amount of $350, maturing September 15, 2022
(effective interest rate of 3.4%) |
348
|
|
348
|
|
|||
|
Series M Notes, interest rate of 3.4%, face amount of $350, maturing October 15, 2020
(effective interest rate of 3.6%) |
348
|
|
347
|
|
|||
|
Series N Notes, interest rate of 3.1%, face amount of $400, maturing October 15, 2021
(effective interest rate of 3.4%) |
396
|
|
396
|
|
|||
|
Series O Notes, interest rate of 2.9%, face amount of $450, maturing March 1, 2021
(effective interest rate of 3.1%) |
447
|
|
446
|
|
|||
|
Series P Notes, interest rate of 3.8%, face amount of $350, maturing October 1, 2025
(effective interest rate of 4.0%) |
344
|
|
344
|
|
|||
|
Series Q Notes, interest rate of 2.3%, face amount of $750, maturing January 15, 2022
(effective interest rate of 2.5%) |
743
|
|
742
|
|
|||
|
Series R Notes, interest rate of 3.1%, face amount of $750, maturing June 15, 2026
(effective interest rate of 3.3%) |
743
|
|
742
|
|
|||
|
Series S Notes, interest rate of 6.8%, face amount of $324, maturing May 15, 2018
(effective interest rate of 1.7%) |
334
|
|
346
|
|
|||
|
Series T Notes, interest rate of 7.2%, face amount of $181, maturing December 1, 2019
(effective interest rate of 2.3%) |
199
|
|
206
|
|
|||
|
Series U Notes, interest rate of 3.1%, face amount of $291, maturing February 15, 2023
(effective interest rate of 3.1%) |
291
|
|
291
|
|
|||
|
Series V Notes, interest rate of 3.8%, face amount of $318, maturing March 15, 2025
(effective interest rate of 2.8%) |
338
|
|
340
|
|
|||
|
Series W Notes, interest rate of 4.5%, face amount of $278, maturing October 1, 2034
(effective interest rate of 4.1%) |
293
|
|
293
|
|
|||
|
Commercial paper
|
2,791
|
|
2,311
|
|
|||
|
Credit Facility
|
—
|
|
—
|
|
|||
|
Capital lease obligations
|
172
|
|
173
|
|
|||
|
Other
|
284
|
|
291
|
|
|||
|
8,669
|
|
8,506
|
|
||||
|
Less: Current portion of long-term debt
|
(398
|
)
|
(309
|
)
|
|||
|
$
|
8,271
|
|
$
|
8,197
|
|
||
We paid cash for interest, net of amounts capitalized, of
$171 million
in the
2017 first three quarters
and
$99 million
in the
2016 first three quarters
.
We are party to a multicurrency revolving credit agreement (the “Credit Facility”) that provides for up to
$4,000 million
of aggregate effective borrowings. See the “
Cash Requirements and Our Credit Facility
” caption later in this report in the “Liquidity and Capital Resources” section for further information on our Credit Facility and available borrowing capacity at
September 30, 2017
.
14
9
.
FAIR VALUE OF FINANCIAL INSTRUMENTS
We believe that the fair values of our current assets and current liabilities approximate their reported carrying amounts. We present the carrying values and the fair values of noncurrent financial assets and liabilities that qualify as financial instruments, determined under current guidance for disclosures on the fair value of financial instruments, in the following table:
|
|
September 30, 2017
|
December 31, 2016
|
|||||||||||||
|
($ in millions)
|
Carrying
Amount
|
Fair Value
|
Carrying
Amount
|
Fair Value
|
|||||||||||
|
Senior, mezzanine, and other loans
|
$
|
228
|
|
$
|
216
|
|
$
|
245
|
|
$
|
231
|
|
|||
|
Total noncurrent financial assets
|
$
|
228
|
|
$
|
216
|
|
$
|
245
|
|
$
|
231
|
|
|||
|
Senior Notes
|
$
|
(5,088
|
)
|
$
|
(5,161
|
)
|
$
|
(5,438
|
)
|
$
|
(5,394
|
)
|
|||
|
Commercial paper
|
(2,791
|
)
|
(2,791
|
)
|
(2,311
|
)
|
(2,311
|
)
|
|||||||
|
Other long-term debt
|
(226
|
)
|
(230
|
)
|
(280
|
)
|
(284
|
)
|
|||||||
|
Other noncurrent liabilities
|
(186
|
)
|
(186
|
)
|
(59
|
)
|
(59
|
)
|
|||||||
|
Total noncurrent financial liabilities
|
$
|
(8,291
|
)
|
$
|
(8,368
|
)
|
$
|
(8,088
|
)
|
$
|
(8,048
|
)
|
|||
See the “Fair Value Measurements” caption of Footnote 2 “Summary of Significant Accounting Policies” of our
2016
Form 10-K for more information on the input levels we use in determining fair value.
10
.
OTHER COMPREHENSIVE (LOSS) INCOME AND SHAREHOLDERS' EQUITY
The following tables detail the accumulated other comprehensive (loss) income activity for the
2017 first three quarters
and
2016 first three quarters
:
|
($ in millions)
|
Foreign Currency Translation Adjustments
|
Derivative Instrument Adjustments
|
Available-For-Sale Securities Unrealized Adjustments
|
Pension and Postretirement Adjustments
|
Accumulated Other Comprehensive Loss
|
||||||||||||||
|
Balance at year-end 2016
|
$
|
(503
|
)
|
$
|
(5
|
)
|
$
|
6
|
|
$
|
5
|
|
$
|
(497
|
)
|
||||
|
Other comprehensive income (loss) before reclassifications
(1)
|
457
|
|
(13
|
)
|
(1
|
)
|
—
|
|
443
|
|
|||||||||
|
Amounts reclassified from accumulated other comprehensive loss
|
—
|
|
5
|
|
—
|
|
—
|
|
5
|
|
|||||||||
|
Net other comprehensive income (loss)
|
457
|
|
(8
|
)
|
(1
|
)
|
—
|
|
448
|
|
|||||||||
|
Balance at September 30, 2017
|
$
|
(46
|
)
|
$
|
(13
|
)
|
$
|
5
|
|
$
|
5
|
|
$
|
(49
|
)
|
||||
|
($ in millions)
|
Foreign Currency Translation Adjustments
|
Derivative Instrument Adjustments
|
Available-For-Sale Securities Unrealized Adjustments
|
Pension and Postretirement Adjustments
|
Accumulated Other Comprehensive Loss
|
||||||||||||||
|
Balance at year-end 2015
|
$
|
(192
|
)
|
$
|
(8
|
)
|
$
|
4
|
|
$
|
—
|
|
$
|
(196
|
)
|
||||
|
Other comprehensive income (loss) before reclassifications
(1)
|
27
|
|
(3
|
)
|
—
|
|
—
|
|
24
|
|
|||||||||
|
Amounts reclassified from accumulated other comprehensive loss
|
—
|
|
3
|
|
—
|
|
—
|
|
3
|
|
|||||||||
|
Net other comprehensive income
|
27
|
|
—
|
|
—
|
|
—
|
|
27
|
|
|||||||||
|
Balance at September 30, 2016
|
$
|
(165
|
)
|
$
|
(8
|
)
|
$
|
4
|
|
$
|
—
|
|
$
|
(169
|
)
|
||||
|
(1)
|
Other comprehensive income before reclassifications for foreign currency translation adjustments includes losses on intra-entity foreign currency transactions that are of a long-term investment nature of
$142 million
for the
2017 first three quarters
and
$1 million
for the
2016 first three quarters
.
|
15
The following table details the changes in common shares outstanding and shareholders’ equity for the
2017 first three quarters
:
|
(in millions, except per share amounts)
|
|
|||||||||||||||||||||||||
|
Common
Shares
Outstanding
|
|
Total
|
Class A
Common
Stock
|
Additional
Paid-in-
Capital
|
Retained
Earnings
|
Treasury Stock,
at Cost
|
Accumulated
Other
Comprehensive
Loss
|
|||||||||||||||||||
|
386.1
|
|
Balance at year-end 2016
|
$
|
5,357
|
|
$
|
5
|
|
$
|
5,808
|
|
$
|
6,501
|
|
$
|
(6,460
|
)
|
$
|
(497
|
)
|
||||||
|
—
|
|
Net income
|
1,171
|
|
—
|
|
—
|
|
1,171
|
|
—
|
|
—
|
|
||||||||||||
|
—
|
|
Other comprehensive income
|
448
|
|
—
|
|
—
|
|
—
|
|
—
|
|
448
|
|
||||||||||||
|
—
|
|
Dividends ($0.96 per share)
|
(362
|
)
|
—
|
|
—
|
|
(362
|
)
|
—
|
|
—
|
|
||||||||||||
|
2.1
|
|
Employee stock plan
|
(2
|
)
|
—
|
|
(64
|
)
|
—
|
|
62
|
|
—
|
|
||||||||||||
|
(21.8
|
)
|
Purchase of treasury stock
|
(2,100
|
)
|
—
|
|
—
|
|
—
|
|
(2,100
|
)
|
—
|
|
||||||||||||
|
366.4
|
|
Balance at September 30, 2017
|
$
|
4,512
|
|
$
|
5
|
|
$
|
5,744
|
|
$
|
7,310
|
|
$
|
(8,498
|
)
|
$
|
(49
|
)
|
||||||
11
.
BUSINESS SEGMENTS
We are a diversified global lodging company with operations in the following reportable business segments:
|
•
|
North American Full-Service
, which includes our Luxury and Premium brands located in the United States and Canada;
|
|
•
|
North American Limited-Service
, which includes our Select brands located in the United States and Canada;
|
|
•
|
Asia Pacific
, which includes all brand tiers in our Asia Pacific region; and
|
|
•
|
Other International
, which includes all brand tiers in our Europe, Middle East and Africa, and Caribbean and Latin America regions.
|
Our
North American Full-Service
,
North American Limited-Service
, and
Asia Pacific
segments meet the applicable accounting criteria to be reportable segments. Our Europe, Middle East and Africa, and Caribbean and Latin America operating segments individually do not meet the criteria for separate disclosure as reportable segments, and accordingly we combined them into an “all other category” which we refer to as “
Other International
.”
We evaluate the performance of our operating segments using “segment profits” which is based largely on the results of the segment without allocating corporate expenses, income taxes, indirect general, administrative, and other expenses, or merger-related costs and charges. We assign gains and losses, equity in earnings or losses from our joint ventures, and direct general, administrative, and other expenses to each of our segments. “Other unallocated corporate” represents a portion of our revenues, general, administrative, and other expenses, merger-related costs and charges, equity in earnings or losses, and other gains or losses that we do not allocate to our segments. It also includes license fees we receive from our credit card programs and fees from vacation ownership licensing agreements, which we present in the “
Franchise fees
” caption of our Income Statements.
Our President and Chief Executive Officer, who is our chief operating decision maker, monitors assets for the consolidated company but does not use assets by operating segment when assessing performance or making operating segment resource allocations.
We did not allocate Legacy-Starwood’s results to our segments for the eight days ended September 30, 2016. Therefore, in the tables below, for the three and nine months ended September 30, 2016, the impact of Legacy-Starwood operations after the Merger Date is included in “Other unallocated corporate” and not in the segment results.
16
Segment Revenues
|
Three Months Ended
|
Nine Months Ended
|
||||||||||||||
|
($ in millions)
|
September 30, 2017
|
|
September 30, 2016
|
September 30, 2017
|
September 30, 2016
|
||||||||||
|
North American Full-Service
|
$
|
3,436
|
|
$
|
2,222
|
|
$
|
10,631
|
|
$
|
6,903
|
|
|||
|
North American Limited-Service
|
1,061
|
|
936
|
|
3,017
|
|
2,675
|
|
|||||||
|
Asia Pacific
|
337
|
|
141
|
|
968
|
|
428
|
|
|||||||
|
Other International
|
688
|
|
404
|
|
1,966
|
|
1,244
|
|
|||||||
|
Total segment revenues
|
5,522
|
|
3,703
|
|
16,582
|
|
11,250
|
|
|||||||
|
Other unallocated corporate
|
141
|
|
239
|
|
437
|
|
366
|
|
|||||||
|
Total consolidated revenues
|
$
|
5,663
|
|
$
|
3,942
|
|
$
|
17,019
|
|
$
|
11,616
|
|
|||
Segment Profits
|
Three Months Ended
|
Nine Months Ended
|
||||||||||||||
|
($ in millions)
|
September 30, 2017
|
September 30, 2016
|
September 30, 2017
|
September 30, 2016
|
|||||||||||
|
North American Full-Service
|
$
|
258
|
|
$
|
148
|
|
$
|
879
|
|
$
|
506
|
|
|||
|
North American Limited-Service
|
228
|
|
193
|
|
629
|
|
539
|
|
|||||||
|
Asia Pacific
|
88
|
|
24
|
|
237
|
|
78
|
|
|||||||
|
Other International
|
120
|
|
43
|
|
304
|
|
139
|
|
|||||||
|
Total segment profits
|
694
|
|
408
|
|
2,049
|
|
1,262
|
|
|||||||
|
Other unallocated corporate
|
(51
|
)
|
(231
|
)
|
(201
|
)
|
(324
|
)
|
|||||||
|
Interest expense, net of interest income
|
(63
|
)
|
(46
|
)
|
(191
|
)
|
(137
|
)
|
|||||||
|
Income taxes
|
(188
|
)
|
(61
|
)
|
(486
|
)
|
(265
|
)
|
|||||||
|
Net income
|
$
|
392
|
|
$
|
70
|
|
$
|
1,171
|
|
$
|
536
|
|
|||
Goodwill
|
($ in millions)
|
North American
Full-Service
|
North American
Limited-Service
|
Asia Pacific
|
Other International
|
Total
Goodwill
|
||||||||||||||
|
Year-end 2016 balance:
|
|||||||||||||||||||
|
Goodwill
|
$
|
2,905
|
|
$
|
1,558
|
|
$
|
1,572
|
|
$
|
1,617
|
|
$
|
7,652
|
|
||||
|
Accumulated impairment losses
|
—
|
|
(54
|
)
|
—
|
|
—
|
|
(54
|
)
|
|||||||||
|
2,905
|
|
1,504
|
|
1,572
|
|
1,617
|
|
7,598
|
|
||||||||||
|
Adjustments
(1)
|
$
|
664
|
|
$
|
255
|
|
$
|
276
|
|
$
|
223
|
|
$
|
1,418
|
|
||||
|
Foreign currency translation
|
19
|
|
12
|
|
54
|
|
81
|
|
166
|
|
|||||||||
|
September 30, 2017 balance:
|
|||||||||||||||||||
|
Goodwill
|
$
|
3,588
|
|
$
|
1,825
|
|
$
|
1,902
|
|
$
|
1,921
|
|
$
|
9,236
|
|
||||
|
Accumulated impairment losses
|
—
|
|
(54
|
)
|
—
|
|
—
|
|
(54
|
)
|
|||||||||
|
$
|
3,588
|
|
$
|
1,771
|
|
$
|
1,902
|
|
$
|
1,921
|
|
$
|
9,182
|
|
|||||
|
(1)
|
The table reflects adjustments to our goodwill from the Starwood Combination during the measurement period. See Footnote
2
“
Acquisitions and Dispositions
” for more information.
|
17
Item 2.
Management’s Discussion and Analysis of Financial Condition and Results of Operations
Forward-Looking Statements
We make forward-looking statements in Management’s Discussion and Analysis of Financial Condition and Results of Operations and elsewhere in this report based on the beliefs and assumptions of our management and on information currently available to us. Forward-looking statements include information about our possible or assumed future results of operations, which follow under the headings “Business and Overview,” “Liquidity and Capital Resources,” and other statements throughout this report preceded by, followed by, or that include the words “believes,” “expects,” “anticipates,” “intends,” “plans,” “estimates,” or similar expressions.
Any number of risks and uncertainties could cause actual results to differ materially from those we express in our forward-looking statements, including the risks and uncertainties we describe below and other factors we describe from time to time in our periodic filings with the U.S. Securities and Exchange Commission (the “SEC”). We therefore caution you not to rely unduly on any forward-looking statement. The forward-looking statements in this report speak only as of the date of this report, and we undertake no obligation to update or revise any forward-looking statement, whether as a result of new information, future developments, or otherwise.
In addition, see the “
Item 1A.
Risk Factors
” caption in the “Part II-OTHER INFORMATION” section of this report.
BUSINESS AND OVERVIEW
We are a worldwide operator, franchisor, and licensor of hotels and timeshare properties in
126
countries and territories under
30
brands at the end of the
2017 third quarter
. We also develop, operate, and market residential properties and provide services to home/condominium owner associations. Under our business model, we typically manage or franchise hotels, rather than own them. We report our operations in
four
segments:
North American Full-Service
,
North American Limited-Service
,
Asia Pacific
, and
Other International
.
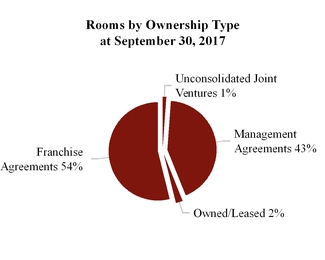
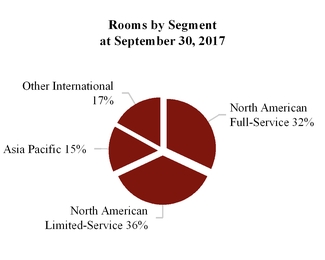
We earn base management fees and in many cases incentive management fees from the properties that we manage, and we earn franchise fees on the properties that others operate under franchise agreements with us. In most markets, base fees typically consist of a percentage of property-level revenue while incentive fees typically consist of a percentage of net house profit adjusted for a specified owner return. In the Middle East and Asia, incentive fees typically consist of a percentage of gross operating profit without adjustment for a specified owner return. Net house profit is calculated as gross operating profit (house profit) less non-controllable expenses such as insurance, real estate taxes, and capital spending reserves.
Our emphasis on long-term management contracts and franchising tends to provide more stable earnings in periods of economic softness, while adding new hotels to our system generates growth, typically with little or no investment by the Company. This strategy has driven substantial growth while minimizing financial leverage and
18
risk in a cyclical industry. In addition, we believe minimizing our capital investments and adopting a strategy of recycling our investments maximizes and maintains our financial flexibility.
We remain focused on doing the things that we do well; that is, selling rooms, taking care of our guests, and making sure we control costs both at company-operated properties and at the corporate level (“above-property”). Our brands remain strong as a result of skilled management teams, dedicated associates, superior customer service with an emphasis on guest and associate satisfaction, significant distribution, our Loyalty Programs (Marriott Rewards and The Ritz-Carlton Rewards, and Starwood Preferred Guest, which we refer to collectively as “
Loyalty Programs
”), multichannel reservation systems, and desirable property amenities. We strive to effectively leverage our size and broad distribution.
We, along with owners and franchisees, continue to invest in our brands by means of new, refreshed, and reinvented properties, new room and public space designs, and enhanced amenities and technology offerings. We address, through various means, hotels in our system that do not meet standards. We continue to enhance the appeal of our proprietary, information-rich, and easy-to-use websites, and of our associated mobile smartphone applications, through functionality and service improvements.
Our profitability, as well as that of owners and franchisees, has benefited from our approach to property-level and above-property productivity. Managed properties in our system continue to maintain very tight cost controls. We also control above-property costs, some of which we allocate to hotels, by remaining focused on systems, processing, and support areas.
Performance Measures
We believe Revenue per Available Room (“RevPAR”), which we calculate by dividing room sales for comparable properties by room nights available for the period, is a meaningful indicator of our performance because it measures the period-over-period change in room revenues for comparable properties. RevPAR may not be comparable to similarly titled measures, such as revenues. We also believe occupancy and average daily rate (“ADR”), which are components of calculating RevPAR, are meaningful indicators of our performance. Occupancy, which we calculate by dividing occupied rooms by total rooms available, measures the utilization of a property’s available capacity. ADR, which we calculate by dividing property room revenue by total rooms sold, measures average room price and is useful in assessing pricing levels.
Our RevPAR statistics for the
2017 first three quarters
and
third
quarter, and for
2017
periods compared to the corresponding
2016
periods, include Legacy-Starwood comparable properties for all periods even though Marriott did not own the Legacy-Starwood brands before the Starwood Combination. Therefore, our RevPAR statistics include Legacy-Starwood properties for periods during which fees from the Legacy-Starwood properties are not included in our Income Statements. We provide these RevPAR statistics as an indicator of the performance of our brands and to allow for comparison to industry metrics, and they should not be viewed as necessarily correlating with our fee revenue. For the properties located in countries that use currencies other than the U.S. dollar, the comparisons to the prior year period are on a constant U.S. dollar basis. We calculate constant dollar statistics by applying exchange rates for the current period to the prior comparable period.
We define our comparable properties as our properties, including those that we acquired through the Starwood Combination, that were open and operating under one of our Legacy-Marriott or Legacy-Starwood brands since the beginning of the last full calendar year (since January 1,
2016
for the current period) and have not, in either the current or previous year: (i) undergone significant room or public space renovations or expansions, (ii) been converted between company-operated and franchised, or (iii) sustained substantial property damage or business interruption.
We also believe company-operated house profit margin, which is the ratio of property-level gross operating profit to total property-level revenue, is a meaningful indicator of our performance because this ratio measures our overall ability as the operator to produce property-level profits by generating sales and controlling the operating expenses over which we have the most direct control. House profit includes room, food and beverage, and other revenue and the related expenses including payroll and benefits expenses, as well as repairs and maintenance,
19
utility, general and administrative, and sales and marketing expenses. House profit does not include the impact of management fees, furniture, fixtures and equipment replacement reserves, insurance, taxes, or other fixed expenses.
Business Trends
Our
2017 first three quarters
results reflected a year-over-year increase in the number of properties in our system, including those from the Starwood Combination, favorable demand for our brands in many markets around the world, and slow but steady economic growth. For the
three months ended
September 30, 2017
, comparable worldwide systemwide RevPAR
increased
2.1 percent
to
$120.22
, ADR
increased
0.7 percent
on a constant dollar basis to
$157.02
, and occupancy
increased
1.1
percentage points to
76.6 percent
, compared to the same period a year ago. For the
nine months ended
September 30, 2017
, comparable worldwide systemwide RevPAR
increased
2.6 percent
to
$115.99
, ADR
increased
0.9 percent
on a constant dollar basis to
$156.96
, and occupancy
increased
1.2
percentage points to
73.9 percent
, compared to the same period a year ago.
In North America, RevPAR increased in the
2017 first three quarters
, partially driven by higher demand in Washington, D.C. and growth in transient leisure business. RevPAR was somewhat enhanced by increased demand in impacted areas following the September hurricanes in Florida and Texas. RevPAR growth was constrained in certain markets by new lodging supply and only moderate GDP growth.
Our Europe region experienced higher demand in the
2017 first three quarters
, led by strong transient business in most countries. In our Asia Pacific region in the
2017 first three quarters
, RevPAR growth was strong in Greater China, India, and Indonesia with strong leisure demand. In our Middle East and Africa region, demand continued to be impacted by geopolitical instability, political sanctions on Qatar, and lower oil prices, offset by favorable results in South Africa. Growth in the Caribbean and Latin America regions reflected strength in Mexico and improving leisure demand in the Caribbean, but was partially constrained by weak economic conditions in many markets in South America. In September 2017, several managed and franchised Caribbean hotels closed due to significant damage from hurricanes in the region.
We monitor market conditions and provide the tools for our hotels to price rooms daily in accordance with individual property demand levels, generally adjusting room rates as demand changes. Our hotels modify the mix of business to improve revenue as demand changes. For our company-operated properties, we continue to focus on enhancing property-level house profit margins and making productivity improvements.
In the
2017 first three quarters
compared to the
2016 first three quarters
, worldwide company-operated house profit margins at comparable properties, including comparable Legacy-Starwood properties, increased by 70 basis points, and worldwide comparable house profit per available room (“HP-PAR”) increased by 4.2 percent on a constant U.S. dollar basis, reflecting improved productivity, solid cost controls and procurement savings, higher occupancy, and rate increases. North American company-operated house profit margins increased by 20 basis points, and HP-PAR increased by 1.4 percent. International company-operated house profit margins increased by 130 basis points, and HP-PAR increased by 8.3 percent.
System Growth and Pipeline
During the
2017 first three quarters
, we added
341
properties (
55,528
rooms) while
56
properties (
10,166
rooms) exited our system, increasing our total properties to
6,401
(
1,239,221
rooms). Approximately
37
percent of added rooms are located outside North America, and
16
percent of the room additions are conversions from competitor brands.
Since the end of the
2016 third quarter
, we added
457
properties (
77,571
rooms) while
66
properties (
12,616
rooms) exited our system.
At the end of the
2017 third quarter
, we had
450,000
rooms in our development pipeline, which includes hotel rooms under construction, hotel rooms under signed contracts, and roughly
41,000
hotel rooms approved for development but not yet under signed contracts. More than half of the rooms in our development pipeline are outside North America.
20
Properties and Rooms
At
September 30, 2017
, we operated, franchised, and licensed the following properties and rooms:
|
|
Managed
|
Franchised/Licensed
|
Owned/Leased
|
Other
(1)
|
Total
|
||||||||||||||||||||||||
|
Properties
|
Rooms
|
Properties
|
Rooms
|
Properties
|
Rooms
|
Properties
|
Rooms
|
Properties
|
Rooms
|
||||||||||||||||||||
|
North American
Full-Service
|
421
|
|
187,073
|
|
660
|
|
193,112
|
|
11
|
|
6,607
|
|
—
|
|
—
|
|
1,092
|
|
386,792
|
|
|||||||||
|
North American
Limited-Service
|
414
|
|
65,306
|
|
3,138
|
|
359,988
|
|
20
|
|
3,006
|
|
25
|
|
4,423
|
|
3,597
|
|
432,723
|
|
|||||||||
|
Asia
Pacific
|
521
|
|
158,085
|
|
87
|
|
24,650
|
|
4
|
|
953
|
|
—
|
|
—
|
|
612
|
|
183,688
|
|
|||||||||
|
Other
International
|
519
|
|
121,012
|
|
364
|
|
71,962
|
|
33
|
|
9,071
|
|
96
|
|
12,086
|
|
1,012
|
|
214,131
|
|
|||||||||
|
Timeshare
|
—
|
|
—
|
|
88
|
|
21,887
|
|
—
|
|
—
|
|
—
|
|
—
|
|
88
|
|
21,887
|
|
|||||||||
|
Total
|
1,875
|
|
531,476
|
|
4,337
|
|
671,599
|
|
68
|
|
19,637
|
|
121
|
|
16,509
|
|
6,401
|
|
1,239,221
|
|
|||||||||
|
(1)
|
Other represents unconsolidated equity method investments, which we present in the “
Equity in earnings
” caption of our Income Statements.
|
Segment and Brand Statistics
The following tables present RevPAR, occupancy, and ADR statistics for comparable properties, including Legacy-Starwood comparable properties even though Marriott did not own the Legacy-Starwood brands before the Starwood Combination. Systemwide statistics include data from our franchised properties, in addition to our company-operated properties.
21
|
Comparable Company-Operated North American Properties
|
||||||||||||||||||||
|
RevPAR
|
Occupancy
|
Average Daily Rate
|
||||||||||||||||||
|
Three Months Ended September 30, 2017
|
Change vs. Three Months Ended September 30, 2016
|
Three Months Ended September 30, 2017
|
Change vs. Three Months Ended September 30, 2016
|
Three Months Ended September 30, 2017
|
Change vs. Three Months Ended September 30, 2016
|
|||||||||||||||
|
JW Marriott
|
$
|
149.62
|
|
(2.9
|
)%
|
75.4
|
%
|
(1.0
|
)%
|
pts.
|
$
|
198.35
|
|
(1.5
|
)%
|
|||||
|
The Ritz-Carlton
|
$
|
242.43
|
|
1.8
|
%
|
73.4
|
%
|
—
|
%
|
pts.
|
$
|
330.37
|
|
1.8
|
%
|
|||||
|
W Hotels
|
$
|
241.20
|
|
(3.3
|
)%
|
84.6
|
%
|
(0.6
|
)%
|
pts.
|
$
|
284.93
|
|
(2.6
|
)%
|
|||||
|
Composite North American
Luxury (1) |
$
|
229.18
|
|
(0.9
|
)%
|
77.9
|
%
|
(0.6
|
)%
|
pts.
|
$
|
294.09
|
|
(0.1
|
)%
|
|||||
|
Marriott Hotels
|
$
|
145.20
|
|
(0.8
|
)%
|
78.1
|
%
|
—
|
%
|
pts.
|
$
|
185.79
|
|
(0.8
|
)%
|
|||||
|
Sheraton
|
$
|
156.57
|
|
(0.5
|
)%
|
80.1
|
%
|
(0.6
|
)%
|
pts.
|
$
|
195.55
|
|
0.3
|
%
|
|||||
|
Westin
|
$
|
179.58
|
|
(0.8
|
)%
|
80.6
|
%
|
(0.5
|
)%
|
pts.
|
$
|
222.86
|
|
(0.2
|
)%
|
|||||
|
Composite North American
Upper Upscale (2) |
$
|
150.81
|
|
(0.4
|
)%
|
78.7
|
%
|
(0.2
|
)%
|
pts.
|
$
|
191.62
|
|
(0.1
|
)%
|
|||||
|
North American
Full-Service (3) |
$
|
164.62
|
|
(0.6
|
)%
|
78.6
|
%
|
(0.3
|
)%
|
pts.
|
$
|
209.52
|
|
(0.2
|
)%
|
|||||
|
Courtyard
|
$
|
105.21
|
|
(0.5
|
)%
|
75.6
|
%
|
—
|
%
|
pts.
|
$
|
139.10
|
|
(0.5
|
)%
|
|||||
|
Residence Inn
|
$
|
130.82
|
|
(0.8
|
)%
|
83.8
|
%
|
—
|
%
|
pts.
|
$
|
156.16
|
|
(0.8
|
)%
|
|||||
|
Composite North American
Limited-Service (4) |
$
|
110.81
|
|
(0.5
|
)%
|
78.0
|
%
|
(0.1
|
)%
|
pts.
|
$
|
142.07
|
|
(0.3
|
)%
|
|||||
|
North American - All
(5)
|
$
|
147.91
|
|
(0.5
|
)%
|
78.4
|
%
|
(0.2
|
)%
|
pts.
|
$
|
188.69
|
|
(0.2
|
)%
|
|||||
|
Comparable Systemwide North American Properties
|
||||||||||||||||||||
|
RevPAR
|
Occupancy
|
Average Daily Rate
|
||||||||||||||||||
|
Three Months Ended September 30, 2017
|
Change vs. Three Months Ended September 30, 2016
|
Three Months Ended September 30, 2017
|
Change vs. Three Months Ended September 30, 2016
|
Three Months Ended September 30, 2017
|
Change vs. Three Months Ended September 30, 2016
|
|||||||||||||||
|
JW Marriott
|
$
|
157.22
|
|
(0.7
|
)%
|
76.8
|
%
|
(0.4
|
)%
|
pts.
|
$
|
204.83
|
|
(0.1
|
)%
|
|||||
|
The Ritz-Carlton
|
$
|
242.43
|
|
1.8
|
%
|
73.4
|
%
|
—
|
%
|
pts.
|
$
|
330.37
|
|
1.8
|
%
|
|||||
|
W Hotels
|
$
|
241.20
|
|
(3.3
|
)%
|
84.6
|
%
|
(0.6
|
)%
|
pts.
|
$
|
284.93
|
|
(2.6
|
)%
|
|||||
|
Composite North American
Luxury (1) |
$
|
220.67
|
|
(0.2
|
)%
|
78.2
|
%
|
(0.3
|
)%
|
pts.
|
$
|
282.23
|
|
0.2
|
%
|
|||||
|
Marriott Hotels
|
$
|
128.24
|
|
(0.3
|
)%
|
75.1
|
%
|
(0.5
|
)%
|
pts.
|
$
|
170.87
|
|
0.4
|
%
|
|||||
|
Sheraton
|
$
|
123.23
|
|
(0.9
|
)%
|
77.4
|
%
|
(0.8
|
)%
|
pts.
|
$
|
159.29
|
|
0.1
|
%
|
|||||
|
Westin
|
$
|
162.47
|
|
(0.4
|
)%
|
80.0
|
%
|
(1.1
|
)%
|
pts.
|
$
|
203.02
|
|
0.9
|
%
|
|||||
|
Composite North American
Upper Upscale (2) |
$
|
134.65
|
|
(0.3
|
)%
|
76.7
|
%
|
(0.6
|
)%
|
pts.
|
$
|
175.53
|
|
0.5
|
%
|
|||||
|
North American
Full-Service (3) |
$
|
143.65
|
|
(0.3
|
)%
|
76.9
|
%
|
(0.6
|
)%
|
pts.
|
$
|
186.88
|
|
0.5
|
%
|
|||||
|
Courtyard
|
$
|
108.12
|
|
0.8
|
%
|
76.9
|
%
|
0.5
|
%
|
pts.
|
$
|
140.53
|
|
0.1
|
%
|
|||||
|
Residence Inn
|
$
|
125.47
|
|
0.4
|
%
|
83.6
|
%
|
—
|
%
|
pts.
|
$
|
150.14
|
|
0.4
|
%
|
|||||
|
Fairfield Inn & Suites
|
$
|
89.87
|
|
2.5
|
%
|
77.2
|
%
|
1.7
|
%
|
pts.
|
$
|
116.37
|
|
0.3
|
%
|
|||||
|
Composite North American
Limited-Service (4) |
$
|
105.89
|
|
1.2
|
%
|
79.0
|
%
|
0.5
|
%
|
pts.
|
$
|
134.10
|
|
0.6
|
%
|
|||||
|
North American - All
(5)
|
$
|
122.69
|
|
0.4
|
%
|
78.0
|
%
|
—
|
%
|
pts.
|
$
|
157.23
|
|
0.4
|
%
|
|||||
|
(1)
|
Includes
JW Marriott
,
The Ritz-Carlton
,
W Hotels
,
The Luxury Collection
,
St. Regis
, and
EDITION
.
|
|
(2)
|
Includes
Marriott Hotels
,
Sheraton
,
Westin
,
Renaissance Hotels
,
Autograph Collection Hotels
,
Delta Hotels
,
Gaylord Hotels
,
Le Méridien
, and
Tribute Portfolio
.
|
|
(3)
|
Includes Composite North American Luxury and Composite North American Upper Upscale.
|
|
(4)
|
Includes
Courtyard
,
Residence Inn
,
Fairfield Inn & Suites
,
SpringHill Suites
,
Four Points
,
TownePlace Suites
, and
AC Hotels by Marriott
. Systemwide also includes
Aloft Hotels
and
Element Hotels
.
|
|
(5)
|
Includes North American Full-Service and Composite North American Limited-Service.
|
22
|
Comparable Company-Operated International Properties
|
||||||||||||||||||||
|
RevPAR
|
Occupancy
|
Average Daily Rate
|
||||||||||||||||||
|
Three Months Ended September 30, 2017
|
Change vs. Three Months Ended September 30, 2016
|
Three Months Ended September 30, 2017
|
Change vs. Three Months Ended September 30, 2016
|
Three Months Ended September 30, 2017
|
Change vs. Three Months Ended September 30, 2016
|
|||||||||||||||
|
Greater China
|
$
|
92.60
|
|
10.6
|
%
|
75.1
|
%
|
6.6
|
%
|
pts.
|
$
|
123.30
|
|
0.9
|
%
|
|||||
|
Rest of Asia Pacific
|
$
|
119.30
|
|
6.2
|
%
|
77.0
|
%
|
3.5
|
%
|
pts.
|
$
|
154.99
|
|
1.4
|
%
|
|||||
|
Asia Pacific
|
$
|
102.03
|
|
8.7
|
%
|
75.8
|
%
|
5.5
|
%
|
pts.
|
$
|
134.67
|
|
0.8
|
%
|
|||||
|
Caribbean & Latin America
|
$
|
109.80
|
|
—
|
%
|
63.8
|
%
|
1.7
|
%
|
pts.
|
$
|
172.08
|
|
(2.6
|
)%
|
|||||
|
Europe
|
$
|
172.62
|
|
8.0
|
%
|
79.9
|
%
|
3.0
|
%
|
pts.
|
$
|
216.16
|
|
3.9
|
%
|
|||||
|
Middle East & Africa
|
$
|
84.98
|
|
(0.7
|
)%
|
62.9
|
%
|
0.9
|
%
|
pts.
|
$
|
135.13
|
|
(2.2
|
)%
|
|||||
|
Other International
(1)
|
$
|
131.58
|
|
4.8
|
%
|
71.2
|
%
|
2.1
|
%
|
pts.
|
$
|
184.69
|
|
1.7
|
%
|
|||||
|
International - All
(2)
|
$
|
116.77
|
|
6.5
|
%
|
73.5
|
%
|
3.8
|
%
|
pts.
|
$
|
158.85
|
|
1.0
|
%
|
|||||
|
Worldwide
(3)
|
$
|
132.65
|
|
2.4
|
%
|
76.0
|
%
|
1.7
|
%
|
pts.
|
$
|
174.54
|
|
—
|
%
|
|||||
|
Comparable Systemwide International Properties
|
||||||||||||||||||||
|
RevPAR
|
Occupancy
|
Average Daily Rate
|
||||||||||||||||||
|
Three Months Ended September 30, 2017
|
Change vs. Three Months Ended September 30, 2016
|
Three Months Ended September 30, 2017
|
Change vs. Three Months Ended September 30, 2016
|
Three Months Ended September 30, 2017
|
Change vs. Three Months Ended September 30, 2016
|
|||||||||||||||
|
Greater China
|
$
|
92.38
|
|
10.6
|
%
|
74.3
|
%
|
6.6
|
%
|
pts.
|
$
|
124.33
|
|
0.8
|
%
|
|||||
|
Rest of Asia Pacific
|
$
|
120.83
|
|
5.3
|
%
|
76.0
|
%
|
2.5
|
%
|
pts.
|
$
|
159.00
|
|
1.8
|
%
|
|||||
|
Asia Pacific
|
$
|
104.50
|
|
7.9
|
%
|
75.0
|
%
|
4.8
|
%
|
pts.
|
$
|
139.29
|
|
1.0
|
%
|
|||||
|
Caribbean & Latin America
|
$
|
90.89
|
|
1.9
|
%
|
62.6
|
%
|
1.9
|
%
|
pts.
|
$
|
145.10
|
|
(1.2
|
)%
|
|||||
|
Europe
|
$
|
153.25
|
|
8.7
|
%
|
79.0
|
%
|
3.7
|
%
|
pts.
|
$
|
194.03
|
|
3.7
|
%
|
|||||
|
Middle East & Africa
|
$
|
82.23
|
|
(0.3
|
)%
|
62.9
|
%
|
1.1
|
%
|
pts.
|
$
|
130.70
|
|
(2.1
|
)%
|
|||||
|
Other International
(1)
|
$
|
121.56
|
|
5.9
|
%
|
71.3
|
%
|
2.6
|
%
|
pts.
|
$
|
170.42
|
|
2.0
|
%
|
|||||
|
International - All
(2)
|
$
|
114.12
|
|
6.7
|
%
|
72.9
|
%
|
3.6
|
%
|
pts.
|
$
|
156.46
|
|
1.5
|
%
|
|||||
|
Worldwide
(3)
|
$
|
120.22
|
|
2.1
|
%
|
76.6
|
%
|
1.1
|
%
|
pts.
|
$
|
157.02
|
|
0.7
|
%
|
|||||
|
(1)
|
Includes
Caribbean & Latin America
,
Europe
, and
Middle East & Africa
.
|
|
(2)
|
Includes
Asia Pacific
and Other International.
|
|
(3)
|
Includes North American - All and International - All.
|
23
|
Comparable Company-Operated North American Properties
|
||||||||||||||||||||
|
RevPAR
|
Occupancy
|
Average Daily Rate
|
||||||||||||||||||
|
Nine Months Ended September 30, 2017
|
Change vs. Nine Months Ended September 30, 2016
|
Nine Months Ended September 30, 2017
|
Change vs. Nine Months Ended September 30, 2016
|
Nine Months Ended September 30, 2017
|
Change vs. Nine Months Ended September 30, 2016
|
|||||||||||||||
|
JW Marriott
|
$
|
176.63
|
|
2.5
|
%
|
77.6
|
%
|
1.0
|
%
|
pts.
|
$
|
227.64
|
|
1.2
|
%
|
|||||
|
The Ritz-Carlton
|
$
|
260.23
|
|
4.0
|
%
|
74.6
|
%
|
1.4
|
%
|
pts.
|
$
|
348.69
|
|
2.0
|
%
|
|||||
|
W Hotels
|
$
|
241.42
|
|
(1.1
|
)%
|
82.5
|
%
|
—
|
%
|
pts.
|
$
|
292.55
|
|
(1.0
|
)%
|
|||||
|
Composite North American
Luxury (1) |
$
|
243.40
|
|
2.0
|
%
|
78.3
|
%
|
0.9
|
%
|
pts.
|
$
|
310.99
|
|
0.8
|
%
|
|||||
|
Marriott Hotels
|
$
|
147.52
|
|
1.3
|
%
|
77.4
|
%
|
0.7
|
%
|
pts.
|
$
|
190.72
|
|
0.4
|
%
|
|||||
|
Sheraton
|
$
|
150.62
|
|
2.1
|
%
|
78.1
|
%
|
—
|
%
|
pts.
|
$
|
192.81
|
|
2.1
|
%
|
|||||
|
Westin
|
$
|
175.28
|
|
1.4
|
%
|
78.2
|
%
|
(0.2
|
)%
|
pts.
|
$
|
224.07
|
|
1.8
|
%
|
|||||
|
Composite North American
Upper Upscale (2) |
$
|
150.48
|
|
1.7
|
%
|
77.3
|
%
|
0.3
|
%
|
pts.
|
$
|
194.79
|
|
1.3
|
%
|
|||||
|
North American
Full-Service (3) |
$
|
166.86
|
|
1.8
|
%
|
77.4
|
%
|
0.4
|
%
|
pts.
|
$
|
215.49
|
|
1.2
|
%
|
|||||
|
Courtyard
|
$
|
104.04
|
|
—
|
%
|
74.0
|
%
|
(0.3
|
)%
|
pts.
|
$
|
140.62
|
|
0.4
|
%
|
|||||
|
Residence Inn
|
$
|
127.37
|
|
2.5
|
%
|
81.0
|
%
|
1.0
|
%
|
pts.
|
$
|
157.18
|
|
1.3
|
%
|
|||||
|
Composite North American
Limited-Service (4) |
$
|
109.32
|
|
0.9
|
%
|
76.2
|
%
|
—
|
%
|
pts.
|
$
|
143.55
|
|
0.9
|
%
|
|||||
|
North American - All
(5)
|
$
|
148.99
|
|
1.6
|
%
|
77.0
|
%
|
0.3
|
%
|
pts.
|
$
|
193.40
|
|
1.2
|
%
|
|||||
|
Comparable Systemwide North American Properties
|
||||||||||||||||||||
|
RevPAR
|
Occupancy
|
Average Daily Rate
|
||||||||||||||||||
|
Nine Months Ended September 30, 2017
|
Change vs. Nine Months Ended September 30, 2016
|
Nine Months Ended September 30, 2017
|
Change vs. Nine Months Ended September 30, 2016
|
Nine Months Ended September 30, 2017
|
Change vs. Nine Months Ended September 30, 2016
|
|||||||||||||||
|
JW Marriott
|
$
|
177.45
|
|
2.8
|
%
|
78.2
|
%
|
0.9
|
%
|
pts.
|
$
|
227.03
|
|
1.6
|
%
|
|||||
|
The Ritz-Carlton
|
$
|
260.23
|
|
4.0
|
%
|
74.6
|
%
|
1.4
|
%
|
pts.
|
$
|
348.69
|
|
2.0
|
%
|
|||||
|
W Hotels
|
$
|
241.42
|
|
(1.1
|
)%
|
82.5
|
%
|
—
|
%
|
pts.
|
$
|
292.55
|
|
(1.0
|
)%
|
|||||
|
Composite North American
Luxury (1) |
$
|
231.91
|
|
2.3
|
%
|
78.1
|
%
|
0.9
|
%
|
pts.
|
$
|
297.12
|
|
1.0
|
%
|
|||||
|
Marriott Hotels
|
$
|
128.64
|
|
0.9
|
%
|
74.0
|
%
|
0.1
|
%
|
pts.
|
$
|
173.79
|
|
0.7
|
%
|
|||||
|
Sheraton
|
$
|
117.14
|
|
0.9
|
%
|
74.4
|
%
|
(0.1
|
)%
|
pts.
|
$
|
157.40
|
|
1.1
|
%
|
|||||
|
Westin
|
$
|
161.25
|
|
1.7
|
%
|
78.0
|
%
|
(0.3
|
)%
|
pts.
|
$
|
206.73
|
|
2.1
|
%
|
|||||
|
Composite North American
Upper Upscale (2) |
$
|
133.53
|
|
1.4
|
%
|
75.0
|
%
|
0.1
|
%
|
pts.
|
$
|
178.02
|
|
1.3
|
%
|
|||||
|
North American
Full-Service (3) |
$
|
143.82
|
|
1.5
|
%
|
75.3
|
%
|
0.2
|
%
|
pts.
|
$
|
190.94
|
|
1.3
|
%
|
|||||
|
Courtyard
|
$
|
104.03
|
|
0.7
|
%
|
74.4
|
%
|
0.2
|
%
|
pts.
|
$
|
139.85
|
|
0.4
|
%
|
|||||
|
Residence Inn
|
$
|
118.64
|
|
1.4
|
%
|
80.4
|
%
|
—
|
%
|
pts.
|
$
|
147.62
|
|
1.4
|
%
|
|||||
|
Fairfield Inn & Suites
|
$
|
82.86
|
|
2.8
|
%
|
72.8
|
%
|
1.4
|
%
|
pts.
|
$
|
113.84
|
|
0.8
|
%
|
|||||
|
Composite North American
Limited-Service (4) |
$
|
100.33
|
|
1.4
|
%
|
75.8
|
%
|
0.4
|
%
|
pts.
|
$
|
132.44
|
|
0.9
|
%
|
|||||
|
North American - All
(5)
|
$
|
119.67
|
|
1.5
|
%
|
75.6
|
%
|
0.3
|
%
|
pts.
|
$
|
158.38
|
|
1.1
|
%
|
|||||
|
(1)
|
Includes
JW Marriott
,
The Ritz-Carlton
,
W Hotels
,
The Luxury Collection
,
St. Regis
, and
EDITION
.
|
|
(2)
|
Includes
Marriott Hotels
,
Sheraton
,
Westin
,
Renaissance Hotels
,
Autograph Collection Hotels
,
Delta Hotels
,
Gaylord Hotels
,
Le Méridien
, and
Tribute Portfolio
.
|
|
(3)
|
Includes Composite North American Luxury and Composite North American Upper Upscale.
|
|
(4)
|
Includes
Courtyard
,
Residence Inn
,
Fairfield Inn & Suites
,
SpringHill Suites
,
Four Points
,
TownePlace Suites
, and
AC Hotels by Marriott
. Systemwide also includes
Aloft Hotels
and
Element Hotels
.
|
|
(5)
|
Includes North American Full-Service and Composite North American Limited-Service.
|
24
|
Comparable Company-Operated International Properties
|
||||||||||||||||||||
|
RevPAR
|
Occupancy
|
Average Daily Rate
|
||||||||||||||||||
|
Nine Months Ended September 30, 2017
|
Change vs. Nine Months Ended September 30, 2016
|
Nine Months Ended September 30, 2017
|
Change vs. Nine Months Ended September 30, 2016
|
Nine Months Ended September 30, 2017
|
Change vs. Nine Months Ended September 30, 2016
|
|||||||||||||||
|
Greater China
|
$
|
87.22
|
|
8.2
|
%
|
70.5
|
%
|
6.7
|
%
|
pts.
|
$
|
123.64
|
|
(2.1
|
)%
|
|||||
|
Rest of Asia Pacific
|
$
|
116.18
|
|
6.2
|
%
|
75.0
|
%
|
3.5
|
%
|
pts.
|
$
|
155.00
|
|
1.2
|
%
|
|||||
|
Asia Pacific
|
$
|
97.45
|
|
7.3
|
%
|
72.1
|
%
|
5.6
|
%
|
pts.
|
$
|
135.16
|
|
(1.0
|
)%
|
|||||
|
Caribbean & Latin America
|
$
|
127.04
|
|
3.0
|
%
|
65.7
|
%
|
2.3
|
%
|
pts.
|
$
|
193.34
|
|
(0.6
|
)%
|
|||||
|
Europe
|
$
|
141.85
|
|
7.3
|
%
|
74.1
|
%
|
2.2
|
%
|
pts.
|
$
|
191.47
|
|
4.0
|
%
|
|||||
|
Middle East & Africa
|
$
|
100.74
|
|
0.2
|
%
|
64.4
|
%
|
1.3
|
%
|
pts.
|
$
|
156.44
|
|
(1.8
|
)%
|
|||||
|
Other International
(1)
|
$
|
125.08
|
|
4.5
|
%
|
69.3
|
%
|
2.0
|
%
|
pts.
|
$
|
180.52
|
|
1.5
|
%
|
|||||
|
International - All
(2)
|
$
|
111.22
|
|
5.7
|
%
|
70.7
|
%
|
3.8
|
%
|
pts.
|
$
|
157.32
|
|
0.1
|
%
|
|||||
|
Worldwide
(3)
|
$
|
130.49
|
|
3.3
|
%
|
73.9
|
%
|
2.0
|
%
|
pts.
|
$
|
176.50
|
|
0.5
|
%
|
|||||
|
Comparable Systemwide International Properties
|
||||||||||||||||||||
|
RevPAR
|
Occupancy
|
Average Daily Rate
|
||||||||||||||||||
|
Nine Months Ended September 30, 2017
|
Change vs. Nine Months Ended September 30, 2016
|
Nine Months Ended September 30, 2017
|
Change vs. Nine Months Ended September 30, 2016
|
Nine Months Ended September 30, 2017
|
Change vs. Nine Months Ended September 30, 2016
|
|||||||||||||||
|
Greater China
|
$
|
87.34
|
|
8.4
|
%
|
70.0
|
%
|
6.7
|
%
|
pts.
|
$
|
124.80
|
|
(2.1
|
)%
|
|||||
|
Rest of Asia Pacific
|
$
|
115.61
|
|
5.0
|
%
|
74.2
|
%
|
2.6
|
%
|
pts.
|
$
|
155.72
|
|
1.2
|
%
|
|||||
|
Asia Pacific
|
$
|
99.39
|
|
6.7
|
%
|
71.8
|
%
|
5.0
|
%
|
pts.
|
$
|
138.42
|
|
(0.7
|
)%
|
|||||
|
Caribbean & Latin America
|
$
|
102.72
|
|
3.4
|
%
|
63.9
|
%
|
1.9
|
%
|
pts.
|
$
|
160.73
|
|
0.3
|
%
|
|||||
|
Europe
|
$
|
124.53
|
|
7.9
|
%
|
72.0
|
%
|
3.1
|
%
|
pts.
|
$
|
173.07
|
|
3.3
|
%
|
|||||
|
Middle East & Africa
|
$
|
96.97
|
|
0.5
|
%
|
64.3
|
%
|
1.5
|
%
|
pts.
|
$
|
150.86
|
|
(1.8
|
)%
|
|||||
|
Other International
(1)
|
$
|
112.71
|
|
5.3
|
%
|
68.2
|
%
|
2.4
|
%
|
pts.
|
$
|
165.18
|
|
1.6
|
%
|
|||||
|
International - All
(2)
|
$
|
106.90
|
|
5.9
|
%
|
69.8
|
%
|
3.5
|
%
|
pts.
|
$
|
153.17
|
|
0.5
|
%
|
|||||
|
Worldwide
(3)
|
$
|
115.99
|
|
2.6
|
%
|
73.9
|
%
|
1.2
|
%
|
pts.
|
$
|
156.96
|
|
0.9
|
%
|
|||||
|
(1)
|
Includes
Caribbean & Latin America
,
Europe
, and
Middle East & Africa
.
|
|
(2)
|
Includes
Asia Pacific
and Other International.
|
|
(3)
|
Includes North American - All and International - All.
|
CONSOLIDATED RESULTS
The following discussion presents an analysis of our consolidated results of operations for the
2017 third quarter
compared to the
2016 third quarter
and the
2017 first three quarters
compared to the
2016 first three quarters
. In accordance with GAAP, our Income Statements include Legacy-Starwood’s results of operations from the Merger Date. All references to the effect of the Starwood Combination on our
2017 third quarter
and
2017 first three quarters
results refer to the incremental amounts contributed by Legacy-Starwood operations over the effect of Legacy-Starwood operations on our results for the eight-day period from the Merger Date through September 30, 2016.
Fee Revenues
|
Three Months Ended
|
Nine Months Ended
|
||||||||||||||||||||||||||||
|
($ in millions)
|
September 30, 2017
|
September 30, 2016
|
Change 2017 vs. 2016
|
September 30, 2017
|
September 30, 2016
|
Change 2017 vs. 2016
|
|||||||||||||||||||||||
|
Base management fees
|
$
|
269
|
|
$
|
180
|
|
$
|
89
|
|
49
|
%
|
$
|
818
|
|
$
|
538
|
|
$
|
280
|
|
52
|
%
|
|||||||
|
Franchise fees
|
426
|
|
290
|
|
136
|
|
47
|
%
|
1,207
|
|
813
|
|
394
|
|
48
|
%
|
|||||||||||||
|
Incentive management fees
|
136
|
|
81
|
|
55
|
|
68
|
%
|
437
|
|
276
|
|
161
|
|
58
|
%
|
|||||||||||||
|
$
|
831
|
|
$
|
551
|
|
$
|
280
|
|
51
|
%
|
$
|
2,462
|
|
$
|
1,627
|
|
$
|
835
|
|
51
|
%
|
||||||||
25
Third Quarter
. The
$89 million
increase
in base management fees primarily reflected $86 million from the Starwood Combination and $4 million from Legacy-Marriott RevPAR and unit growth.
The
$136 million
increase
in franchise fees primarily reflected $109 million from the Starwood Combination, $17 million from Legacy-Marriott unit growth, $7 million of higher Legacy-Marriott branding fees, and $3 million from Legacy-Marriott RevPAR growth.
The
$55 million
increase
in incentive management fees primarily reflected $56 million from the Starwood Combination.
In the
2017 third quarter
, we earned incentive management fees from
64 percent
of our managed properties. In North America, we earned incentive management fees from
55 percent
of our managed properties, and outside North America, we earned incentive management fees from
72 percent
of our managed properties. In addition,
64 percent
of our incentive management fees were earned at properties outside of North America.
First Three Quarters
. The
$280 million
increase
in base management fees primarily reflected $269 million from the Starwood Combination and $14 million from Legacy-Marriott RevPAR and unit growth, partially offset by $3 million from Legacy-Marriott net unfavorable foreign exchange rates.
The
$394 million
increase
in franchise fees primarily reflected $320 million from the Starwood Combination, $45 million from Legacy-Marriott unit growth, $12 million from Legacy-Marriott RevPAR growth, $11 million of higher Legacy-Marriott branding fees, and $7 million of higher Legacy-Marriott relicensing fees.
The
$161 million
increase
in incentive management fees primarily reflected $158 million from the Starwood Combination.
In the
2017 first three quarters
, we earned incentive management fees from
70 percent
of our managed properties. In North America, we earned incentive management fees from
61 percent
of our managed properties, and outside North America, we earned incentive management fees from
78 percent
of our managed properties. In addition,
60 percent
of our incentive management fees were earned at properties outside of North America.
Owned, Leased, and Other
|
Three Months Ended
|
Nine Months Ended
|
||||||||||||||||||||||||||||
|
($ in millions)
|
September 30, 2017
|
September 30, 2016
|
Change 2017 vs. 2016
|
September 30, 2017
|
September 30, 2016
|
Change 2017 vs. 2016
|
|||||||||||||||||||||||
|
Owned, leased, and other revenue
|
$
|
452
|
|
$
|
239
|
|
$
|
213
|
|
89
|
%
|
$
|
1,349
|
|
$
|
650
|
|
$
|
699
|
|
108
|
%
|
|||||||
|
Owned, leased, and other - direct expenses
|
356
|
|
194
|
|
162
|
|
84
|
%
|
1,069
|
|
533
|
|
536
|
|
101
|
%
|
|||||||||||||
|
$
|
96
|
|
$
|
45
|
|
$
|
51
|
|
113
|
%
|
$
|
280
|
|
$
|
117
|
|
$
|
163
|
|
139
|
%
|
||||||||
Third Quarter
. Owned, leased, and other revenue, net of direct expenses
increased
by
$51 million
, primarily due to $62 million from the Starwood Combination, partially offset by $9 million of net lower Legacy-Marriott owned and leased profits, primarily driven by
lower RevPAR in Brazil
and properties under renovation.
First Three Quarters
. Owned, leased, and other revenue, net of direct expenses
increased
by
$163 million
, primarily due to $166 million from the Starwood Combination and $5 million of business interruption insurance proceeds, partially offset by $4 million of net lower Legacy-Marriott owned and leased profits, primarily driven by lower RevPAR in Brazil and properties under renovation.
Cost Reimbursements
|
Three Months Ended
|
Nine Months Ended
|
||||||||||||||||||||||||||||
|
($ in millions)
|
September 30, 2017
|
September 30, 2016
|
Change 2017 vs. 2016
|
September 30, 2017
|
September 30, 2016
|
Change 2017 vs. 2016
|
|||||||||||||||||||||||
|
Cost reimbursements revenue
|
$
|
4,380
|
|
$
|
3,152
|
|
$
|
1,228
|
|
39
|
%
|
$
|
13,208
|
|
$
|
9,339
|
|
$
|
3,869
|
|
41
|
%
|
|||||||
|
Reimbursed costs
|
4,380
|
|
3,152
|
|
1,228
|
|
39
|
%
|
13,208
|
|
9,339
|
|
3,869
|
|
41
|
%
|
|||||||||||||
26
The increases in cost reimbursements revenue and reimbursed costs for the third quarter and first three quarters primarily reflected the Starwood Combination, loyalty program activity, and growth across our system.
Other Operating Expenses
|
Three Months Ended
|
Nine Months Ended
|
||||||||||||||||||||||||||||
|
($ in millions)
|
September 30, 2017
|
September 30, 2016
|
Change 2017 vs. 2016
|
September 30, 2017
|
September 30, 2016
|
Change 2017 vs. 2016
|
|||||||||||||||||||||||
|
Depreciation, amortization, and other
|
$
|
68
|
|
$
|
36
|
|
$
|
32
|
|
89
|
%
|
$
|
218
|
|
$
|
97
|
|
$
|
121
|
|
125
|
%
|
|||||||
|
General, administrative, and other
|
199
|
|
161
|
|
38
|
|
24
|
%
|
635
|
|
470
|
|
165
|
|
35
|
%
|
|||||||||||||
|
Merger-related costs and charges
|
28
|
|
228
|
|
(200
|
)
|
(88
|
)%
|
100
|
|
250
|
|
(150
|
)
|
(60
|
)%
|
|||||||||||||
Third Quarter
. Depreciation, amortization, and other expenses
increased
by
$32 million
, primarily reflecting depreciation and amortization on assets acquired in the Starwood Combination.
General, administrative, and other expenses
increased
by
$38 million
, primarily due to the Starwood Combination.
Merger-related costs and charges
decreased
by
$200 million
. For more information, see Footnote
3
“
Merger-related costs and charges
.”
First Three Quarters
. Depreciation, amortization, and other expenses
increased
by
$121 million
, primarily reflecting depreciation and amortization on assets acquired in the Starwood Combination.
General, administrative, and other expenses
increased
by
$165 million
, primarily due to the Starwood Combination, $12 million of higher development expenses, and $4 million from net unfavorable foreign exchange rates.
Merger-related costs and charges
decreased
by
$150 million
. For more information, see Footnote
3
“
Merger-related costs and charges
.”
Non-Operating Income (Expense)
|
Three Months Ended
|
Nine Months Ended
|
||||||||||||||||||||||||||||
|
($ in millions)
|
September 30, 2017
|
September 30, 2016
|
Change 2017 vs. 2016
|
September 30, 2017
|
September 30, 2016
|
Change 2017 vs. 2016
|
|||||||||||||||||||||||
|
Gains and other income, net
|
$
|
6
|
|
$
|
3
|
|
$
|
3
|
|
100
|
%
|
$
|
31
|
|
$
|
3
|
|
$
|
28
|
|
933
|
%
|
|||||||
|
Interest expense
|
(73
|
)
|
(55
|
)
|
18
|
|
33
|
%
|
(216
|
)
|
(159
|
)
|
57
|
|
36
|
%
|
|||||||||||||
|
Interest income
|
9
|
|
9
|
|
—
|
|
—
|
%
|
24
|
|
22
|
|
2
|
|
9
|
%
|
|||||||||||||
|
Equity in earnings
|
6
|
|
3
|
|
3
|
|
100
|
%
|
29
|
|
8
|
|
21
|
|
263
|
%
|
|||||||||||||
Third Quarter
. Interest expense
increased
by
$18 million
, primarily due to an increase in debt as a result of the Starwood Combination and higher commercial paper borrowings, partially offset by $5 million of lower interest expense due to the maturity of Series I Notes in the 2017 second quarter.
First Three Quarters
.
Gains and other income, net
increased
by
$28 million
, primarily due to the gain on the sale of a North American Full-Service hotel in the 2017 second quarter.
Interest expense
increased
by
$57 million
, primarily due to an increase in debt as a result of the Starwood Combination, higher commercial paper borrowings, and higher interest on Senior Notes issuances net of maturities, partially offset by a $13 million favorable variance to the bridge term loan facility commitment costs that we incurred in 2016.
Interest income
increased
by
$2 million
, primarily due to issuances of new loans, partially offset by $6 million lower interest income on a repaid loan.
Equity in earnings
increased
by
$21 million
, primarily due to the Starwood Combination.
27
Income Taxes
|
Three Months Ended
|
Nine Months Ended
|
||||||||||||||||||||||||||||
|
($ in millions)
|
September 30, 2017
|
September 30, 2016
|
Change 2017 vs. 2016
|
September 30, 2017
|
September 30, 2016
|
Change 2017 vs. 2016
|
|||||||||||||||||||||||
|
Provision for income taxes
|
$
|
(188
|
)
|
$
|
(61
|
)
|
$
|
127
|
|
208
|
%
|
$
|
(486
|
)
|
$
|
(265
|
)
|
$
|
221
|
|
83
|
%
|
|||||||
Third Quarter
.
Provision for income taxes
increased
by
$127 million
, primarily due to the Starwood Combination ($164 million), partially offset by tax benefits related to the change in jurisdictional mix of earnings ($27 million), and the adoption of ASU 2016-09 (
$6 million
).
First Three Quarters
.
Provision for income taxes
increased
by
$221 million
, primarily due to the Starwood Combination ($315 million), an unfavorable comparison to the 2016 release of a valuation allowance ($15 million), and the gain on sale of a North American Full-Service hotel ($9 million). The increase was partially offset by a tax benefit from the adoption of ASU 2016-09 (
$62 million
), a change in the jurisdictional mix of earnings ($36 million), and the release of a tax reserve due to a favorable settlement of an uncertain tax position ($12 million).
BUSINESS SEGMENTS
The following discussion presents our analysis of the operating results of our reportable business segments for the
2017 third quarter
compared to the
2016 third quarter
and
the
2017 first three quarters
compared to the
2016 first three quarters
. References to the effect of the Starwood Combination on our
2017 third quarter
and
2017 first three quarters
results refer to amounts contributed by Legacy-Starwood operations in 2017, as we did not allocate any Legacy-Starwood results to our segments for the eight days ended September 30, 2016. See Footnote
11
“
Business Segments
” for other information about each segment, including a reconciliation of segment profits to net income.
North American Full-Service
Since the end of the
2016 third quarter
, across our North American Full-Service segment, we added
53
properties (
14,156
rooms), and
nine
properties (
1,729
rooms) left our system.
|
Three Months Ended
|
Nine Months Ended
|
||||||||||||||||||||||||||||
|
($ in millions)
|
September 30, 2017
|
September 30, 2016
|
Change 2017 vs. 2016
|
September 30, 2017
|
September 30, 2016
|
Change 2017 vs. 2016
|
|||||||||||||||||||||||
|
Segment revenues
|
$
|
3,436
|
|
$
|
2,222
|
|
$
|
1,214
|
|
55
|
%
|
$
|
10,631
|
|
$
|
6,903
|
|
$
|
3,728
|
|
54
|
%
|
|||||||
|
Segment profits
|
$
|
258
|
|
$
|
148
|
|
$
|
110
|
|
74
|
%
|
$
|
879
|
|
$
|
506
|
|
$
|
373
|
|
74
|
%
|
|||||||
Third Quarter
.
North American Full-Service segment profits
increased
by
$110 million
, primarily due to the following changes:
|
•
|
$97 million
of
higher
base management and franchise fees, primarily reflecting $98 million from the Starwood Combination;
|
|
•
|
$8 million
of
higher
incentive management fees, primarily driven by $14 million from the Starwood Combination, partially offset by $4 million of lower Legacy-Marriott fees due to lower net house profits at several managed hotels;
|
|
•
|
$19 million
of
higher
owned, leased, and other revenue, net of direct expenses, primarily reflecting $20 million from the Starwood Combination; and
|
|
•
|
$12 million
of
higher
depreciation, amortization, and other expenses, primarily due to the Starwood Combination.
|
Cost reimbursements revenue and expenses for our North American Full-Service segment properties totaled
$2,996 million
in the
2017 third quarter
, compared to
$1,991 million
in the
2016 third quarter
.
28
First Three Quarters
. North American Full-Service segment profits
increased
by
$373 million
, primarily due to the following changes:
|
•
|
$285 million
of
higher
base management and franchise fees, primarily reflecting $286 million from the Starwood Combination, $10 million of higher Legacy-Marriott unit growth, and $3 million of stronger RevPAR at Legacy-Marriott hotels, partially offset by $12 million of lower Legacy-Marriott residential branding fees;
|
|
•
|
$33 million
of
higher
incentive management fees, primarily driven by $32 million from the Starwood Combination;
|
|
•
|
$74 million
of
higher
owned, leased, and other revenue, net of direct expenses, primarily reflecting $69 million from the Starwood Combination and $5 million of business interruption insurance proceeds;
|
|
•
|
$42 million
of
higher
depreciation, amortization, and other expenses, primarily due to the Starwood Combination;
|
|
•
|
$8 million
of
higher
general, administrative, and other expenses, primarily due to the Starwood Combination;
|
|
•
|
$22 million
of
higher
gains and other income, net, primarily due to the gain on sale of a North American Full-Service hotel in the 2017 second quarter; and
|
|
•
|
$10 million
of
higher
equity in earnings, primarily due to the Starwood Combination.
|
Cost reimbursements revenue and expenses for our North American Full-Service segment properties totaled
$9,196 million
in the
2017 first three quarters
, compared to
$6,149 million
in the
2016 first three quarters
.
North American Limited-Service
Since the end of the
2016 third quarter
, across our North American Limited-Service segment, we added
259
properties (
31,478
rooms), and
23
properties (
2,507
rooms) left our system.
|
Three Months Ended
|
Nine Months Ended
|
||||||||||||||||||||||||||||
|
($ in millions)
|
September 30, 2017
|
September 30, 2016
|
Change 2017 vs. 2016
|
September 30, 2017
|
September 30, 2016
|
Change 2017 vs. 2016
|
|||||||||||||||||||||||
|
Segment revenues
|
$
|
1,061
|
|
$
|
936
|
|
$
|
125
|
|
13
|
%
|
$
|
3,017
|
|
$
|
2,675
|
|
$
|
342
|
|
13
|
%
|
|||||||
|
Segment profits
|
$
|
228
|
|
$
|
193
|
|
$
|
35
|
|
18
|
%
|
$
|
629
|
|
$
|
539
|
|
$
|
90
|
|
17
|
%
|
|||||||
Third Quarter
.
North American Limited-Service segment profits
increased
by
$35 million
, primarily due to
$33 million
of
higher
base management and franchise fees driven by $16 million from the Starwood Combination and $11 million from higher Legacy-Marriott unit growth.
Cost reimbursements revenue and expenses for our North American Limited-Service segment properties totaled
$787 million
in the
2017 third quarter
, compared to
$701 million
in the
2016 third quarter
.
First Three Quarters
.
North American Limited-Service segment profits
increased
by
$90 million
, primarily due to the following changes:
|
•
|
$95 million
of
higher
base management and franchise fees, primarily reflecting $47 million from the Starwood Combination, $31 million from higher Legacy-Marriott unit growth, $9 million of higher Legacy-Marriott relicensing fees, and $5 million from Legacy-Marriott RevPAR growth;
|
|
•
|
$6 million
of
lower
incentive management fees, primarily driven by lower net house profits at a few Legacy-Marriott portfolios of managed hotels; and
|
|
•
|
$5 million
of
higher
depreciation, amortization, and other expenses, primarily due to the Starwood Combination.
|
29
Cost reimbursements revenue and expenses for our North American Limited-Service segment properties totaled
$2,254 million
in the
2017 first three quarters
, compared to
$2,011 million
in the
2016 first three quarters
.
Asia Pacific
Since the end of the
2016 third quarter
, across our Asia Pacific segment, we added
70
properties (
18,477
rooms), and
11
properties (
4,336
rooms) left our system.
|
Three Months Ended
|
Nine Months Ended
|
||||||||||||||||||||||||||||
|
($ in millions)
|
September 30, 2017
|
September 30, 2016
|
Change 2017 vs. 2016
|
September 30, 2017
|
September 30, 2016
|
Change 2017 vs. 2016
|
|||||||||||||||||||||||
|
Segment revenues
|
$
|
337
|
|
$
|
141
|
|
$
|
196
|
|
139
|
%
|
$
|
968
|
|
$
|
428
|
|
$
|
540
|
|
126
|
%
|
|||||||
|
Segment profits
|
$
|
88
|
|
$
|
24
|
|
$
|
64
|
|
267
|
%
|
$
|
237
|
|
$
|
78
|
|
$
|
159
|
|
204
|
%
|
|||||||
Third Quarter
.
Asia Pacific segment profits
increased
by
$64 million
, primarily due to the following changes:
|
•
|
$38 million
of
higher
base management and franchise fees, primarily due to $30 million from the Starwood Combination, $4 million of higher Legacy-Marriott residential branding fees, and $3 million from Legacy-Marriott RevPAR and unit growth;
|
|
•
|
$30 million
of
higher
incentive management fees, primarily due to $27 million from the Starwood Combination;
|
|
•
|
$9 million
of
higher
owned, leased, and other revenue, net of direct expenses, primarily due to the Starwood Combination;
|
|
•
|
$5 million
of
higher
depreciation, amortization, and other expenses, primarily due to the Starwood Combination; and
|
|
•
|
$10 million
of
higher
general, administrative, and other expenses, primarily due to the Starwood Combination.
|
Cost reimbursements revenue and expenses for our Asia Pacific segment properties totaled
$174 million
in the
2017 third quarter
, compared to
$77 million
in the
2016 third quarter
.
First Three Quarters
.
Asia Pacific segment profits
increased
by
$159 million
, primarily due to the following changes:
|
•
|
$100 million
of
higher
base management and franchise fees, primarily due to $85 million from the Starwood Combination, $8 million of higher Legacy-Marriott branding fees, and $7 million from Legacy-Marriott RevPAR and unit growth;
|
|
•
|
$85 million
of
higher
incentive management fees, primarily due to $76 million from the Starwood Combination and $8 million from higher net house profits and unit growth at Legacy-Marriott managed hotels;
|
|
•
|
$22 million
of
higher
owned, leased, and other revenue, net of direct expenses, primarily due to $25 million from the Starwood Combination;
|
|
•
|
$22 million
of
higher
depreciation, amortization, and other expenses, primarily due to the Starwood Combination;
|
|
•
|
$33 million
of
higher
general, administrative, and other expenses, primarily due to the Starwood Combination; and
|
|
•
|
$7 million
of
higher
equity in earnings, primarily due to the Starwood Combination.
|
Cost reimbursements revenue and expenses for our Asia Pacific segment properties totaled
$509 million
in the
2017 first three quarters
, compared to
$238 million
in the
2016 first three quarters
.
30
Other International
Since the end of the
2016 third quarter
, across our Other International regions, we added
71
properties (
12,624
rooms), and
22
properties (
3,528
rooms) left our system.
|
Three Months Ended
|
Nine Months Ended
|
||||||||||||||||||||||||||||
|
($ in millions)
|
September 30, 2017
|
September 30, 2016
|
Change 2017 vs. 2016
|
September 30, 2017
|
September 30, 2016
|
Change 2017 vs. 2016
|
|||||||||||||||||||||||
|
Segment revenues
|
$
|
688
|
|
$
|
404
|
|
$
|
284
|
|
70
|
%
|
$
|
1,966
|
|
$
|
1,244
|
|
$
|
722
|
|
58
|
%
|
|||||||
|
Segment profits
|
$
|
120
|
|
$
|
43
|
|
$
|
77
|
|
179
|
%
|
$
|
304
|
|
$
|
139
|
|
$
|
165
|
|
119
|
%
|
|||||||
Third Quarter
.
Other International profits
increased
by
$77 million
, primarily due to the following changes:
|
•
|
$41 million
of
higher
base management and franchise fees, primarily due to $37 million from the Starwood Combination and $5 million from Legacy-Marriott RevPAR and unit growth;
|
|
•
|
$22 million
of
higher
incentive management fees, primarily due to $19 million from the Starwood Combination;
|
|
•
|
$28 million
of
higher
owned, leased, and other revenue, net of direct expenses, primarily reflecting $34 million from the Starwood Combination, partially offset by lower Legacy-Marriott profits due to properties under renovation in Europe ($4 million) and
lower RevPAR in Brazil
($4 million);
|
|
•
|
$10 million
of
higher
depreciation, amortization, and other expenses, primarily due to the Starwood Combination;
|
|
•
|
$12 million
of
higher
general, administrative, and other expenses, primarily due to the Starwood Combination; and
|
|
•
|
$8 million
of
higher
gains and other income, net, primarily due to the Starwood Combination.
|
Cost reimbursements revenue and expenses for our Other International properties totaled
$378 million
in the
2017 third quarter
, compared to
$252 million
in the
2016 third quarter
.
First Three Quarters
.
Other International profits increased by
$165 million
, primarily due to the following changes:
|
•
|
$105 million
of
higher
base management and franchise fees, primarily due to $99 million from the Starwood Combination and $11 million from Legacy-Marriott RevPAR and unit growth, partially offset by the impact of $4 million from unfavorable foreign exchange rates;
|
|
•
|
$54 million
of
higher
incentive management fees, primarily due to $54 million from the Starwood Combination;
|
|
•
|
$65 million
of
higher
owned, leased, and other revenue, net of direct expenses, primarily reflecting $73 million from the Starwood Combination, partially offset by lower Legacy-Marriott profits due to
lower RevPAR in Brazil
($6 million) and properties under renovation in Europe ($5 million);
|
|
•
|
$36 million
of
higher
depreciation, amortization, and other expenses, primarily due to the Starwood Combination;
|
|
•
|
$35 million
of
higher
general, administrative, and other expenses, primarily due to the Starwood Combination; and
|
|
•
|
$8 million
of
higher
gains and other income, net, primarily due to the Starwood Combination.
|
Cost reimbursements revenue and expenses for our Other International properties totaled
$1,094 million
in the
2017 first three quarters
, compared to
$784 million
in the
2016 first three quarters
.
31
SHARE-BASED COMPENSATION
We award: (1) restricted stock units (“RSUs”) of our common stock; (2) stock appreciation rights (“SARs”) for our common stock; (3) stock options to purchase our common stock; and (4) deferred stock units. We also issue performance-based RSUs (“PSUs”) to named executive officers and some of their direct reports. See Footnote
5
“
Share-Based Compensation
” for more information.
NEW ACCOUNTING STANDARDS
See Footnote
1
“
Basis of Presentation
” for information on our anticipated adoption of recently issued accounting standards.
LIQUIDITY AND CAPITAL RESOURCES
Cash Requirements and Our Credit Facility
We are party to the Credit Facility that provides for up to $4,000 million of aggregate effective borrowings to support our commercial paper program and general corporate needs, including working capital, capital expenditures, share repurchases, letters of credit, and acquisitions. Borrowings under the Credit Facility generally bear interest at LIBOR (the London Interbank Offered Rate) plus a spread, based on our public debt rating. We also pay quarterly fees on the Credit Facility at a rate based on our public debt rating. While any outstanding commercial paper borrowings and/or borrowings under our Credit Facility generally have short-term maturities, we classify the outstanding borrowings as long-term based on our ability and intent to refinance the outstanding borrowings on a long-term basis. The Credit Facility expires on June 10, 2021.
The Credit Facility contains certain covenants, including a single financial covenant that limits our maximum leverage (consisting of the ratio of Adjusted Total Debt to Consolidated Earnings Before Interest Expense, Taxes, Depreciation, and Amortization (“EBITDA”), each as defined in the Credit Facility) to not more than 4 to 1. Our outstanding public debt does not contain a corresponding financial covenant or a requirement that we maintain certain financial ratios. We currently satisfy the covenants in our Credit Facility and public debt instruments, including the leverage covenant under the Credit Facility, and do not expect the covenants will restrict our ability to meet our anticipated borrowing and guarantee levels or increase those levels should we decide to do so in the future.
We believe the Credit Facility and our access to capital markets, together with cash we expect to generate from operations, remain adequate to meet our short-term and long-term liquidity requirements, finance our long-term growth plans, meet debt service, and fulfill other cash requirements.
We issue commercial paper in the United States. We do not have purchase commitments from buyers for our commercial paper; therefore, our ability to issue commercial paper is subject to market demand. We classify any outstanding commercial paper and Credit Facility borrowings as long-term based on our ability and intent to refinance them on a long-term basis. We reserve unused capacity under our Credit Facility to repay outstanding commercial paper borrowings in the event that the commercial paper market is not available to us for any reason when outstanding borrowings mature. We do not expect that fluctuations in the demand for commercial paper will affect our liquidity, given our borrowing capacity under the Credit Facility.
At
September 30, 2017
, our available borrowing capacity amounted to
$1,715 million
and reflected borrowing capacity of
$1,207 million
under our Credit Facility and our cash balance of
$508 million
. We calculated that borrowing capacity by taking
$4,000 million
of effective aggregate bank commitments under our Credit Facility and subtracting
$2,793 million
of outstanding commercial paper (there being no outstanding letters of credit under our Credit Facility).
We monitor the status of the capital markets and regularly evaluate the effect that changes in capital market conditions may have on our ability to execute our announced growth plans. We expect to continue meeting part of our financing and liquidity needs, primarily through commercial paper borrowings, issuances of Senior Notes, and access to long-term committed credit facilities. If conditions in the lodging industry deteriorate, or if disruptions in the capital markets take place as they did in the immediate aftermath of both the 2008 worldwide financial crisis and the events of September 11, 2001, we may be unable to place some or all of our commercial paper on a
32
temporary or extended basis and may have to rely more on borrowings under the Credit Facility, which we believe will be adequate to fund our liquidity needs, including repayment of debt obligations, but which may or may not carry a higher cost than commercial paper. Since we continue to have ample flexibility under the Credit Facility’s covenants, we expect that undrawn bank commitments under the Credit Facility will remain available to us even if business conditions were to deteriorate markedly.
Our financial objectives include diversifying our financing sources, optimizing the mix and maturity of our long-term debt, and reducing our working capital. At the end of the
2017 third quarter
, our long-term debt had a weighted average interest rate of
2.8 percent
and a weighted average maturity of approximately
5.2
years. The ratio of fixed-rate long-term debt to total long-term debt was
0.7
to 1.0 at the end of the
2017 third quarter
.
Cash and cash equivalents totaled
$508 million
at
September 30, 2017
,
a decrease
of
$350 million
from year-end
2016
, reflecting cash outflows associated with the following: purchase of treasury stock (
$2,105 million
), dividend payments (
$362 million
), repayment of Series I Notes (
$293 million
), capital expenditures (
$155 million
), financing outflows for employee share-based compensation withholding taxes (
$144 million
), and contract acquisition costs (
$129 million
). The following cash inflows partially offset these cash outflows: net cash provided by operating activities (
$1,916 million
), proceeds from the sale of two North American Full-Service hotels (
$475 million
), higher commercial paper borrowings (
$455 million
), and loan collections, net of advances (
$6 million
).
Our ratio of current assets to current liabilities was
0.5
to 1.0 at the end of the
2017 third quarter
. We minimize working capital through cash management, strict credit-granting policies, and aggressive collection efforts. We also have significant borrowing capacity under our Credit Facility should we need additional working capital.
We made capital expenditures of
$155 million
in the
2017 first three quarters
and
$132 million
in the
2016 first three quarters
. The increase in capital expenditures from the
2016 first three quarters
is primarily due to improvements to hotels acquired in the Starwood Combination and improvements to our worldwide systems, partially offset by lower spending at a North American Full-Service owned hotel. See our Statements of Cash Flows for information on investment spending for the
2017 first three quarters
. We expect consolidated investment spending for the
2017
full year will total approximately
$550 million
to
$650 million
, including approximately
$175 million
for maintenance capital spending. Consolidated investment spending also includes other capital expenditures, loan advances, contract acquisition costs, acquisitions, and equity and other investments.
Over time, we have sold hotels, both completed and under development, subject to long-term management agreements. The ability of third-party purchasers to raise the debt and equity capital necessary to acquire such properties depends in part on the perceived risks inherent in the lodging industry and other constraints inherent in the capital markets as a whole. We monitor the status of the capital markets and regularly evaluate the potential impact of changes in capital market conditions on our business operations. In the Starwood Combination, we acquired various hotels and joint venture interests in various hotels, which we have sold or may seek to sell. We also expect to continue making selective and opportunistic investments to add units to our lodging business, which may include new construction, loans, and noncontrolling equity investments.
Share Repurchases
We purchased
7.8 million
shares of our common stock during the
2017 third quarter
, at an average price of
$103.01
per share. As of
September 30, 2017
,
9.6 million
shares remained available for repurchase under authorizations from our Board of Directors.
Dividends
Our Board of Directors declared the following quarterly cash dividends in 2017: (1) $0.30 per share declared on February 10, 2017 and paid March 31, 2017 to shareholders of record on February 24, 2017, (2)
$0.33
per share declared on
May 5, 2017
and paid June 30, 2017 to shareholders of record on May 19, 2017, and (3)
$0.33
per share declared on
August 10, 2017
and paid September 29, 2017 to shareholders of record on August 24, 2017.
33
Contractual Obligations and Off-Balance Sheet Arrangements
As of the end of the
2017 third quarter
, there have been no significant changes to our “Contractual Obligations” table, “Other Commitments” table, or “Letters of Credit” paragraph in Part II, Item 7, “Management’s Discussion and Analysis of Financial Condition and Results of Operations,” of our
2016
Form 10-K, other than those referenced below.
See the “
Dispositions and Planned Dispositions
” caption of Footnote
2
“
Acquisitions and Dispositions
” for information about changes in our future minimum operating lease obligations.
See the “
Guarantees
” and “
Contingent Purchase Obligations
” captions of Footnote
7
“
Commitments and Contingencies
” for information about our commitments.
See Footnote
8
“
Long-Term Debt
” for changes in our long-term debt balances.
CRITICAL ACCOUNTING POLICIES AND ESTIMATES
Our preparation of financial statements in accordance with GAAP requires management to make estimates and assumptions that affect reported amounts and related disclosures. We have discussed those policies and estimates that we believe are critical and require the use of complex judgment in their application in our
2016
Form 10-K. Since the date of our
2016
Form 10-K, we have made no material changes to our critical accounting policies or the methodologies or assumptions that we apply under them.
Item 3.
Quantitative and Qualitative Disclosures About Market Risk
Our exposure to market risk has not materially changed since
December 31, 2016
.
Item 4.
Controls and Procedures
Disclosure Controls and Procedures
As of the end of the period covered by this quarterly report, we evaluated, under the supervision and with the participation of our management, including our Chief Executive Officer and Chief Financial Officer, the effectiveness of our disclosure controls and procedures (as such term is defined in Rules 13a-15(e) and 15d-15(e) of the Securities Exchange Act of 1934 (the “Exchange Act”)). Management necessarily applied its judgment in assessing the costs and benefits of those controls and procedures, which by their nature, can provide only reasonable assurance about management’s control objectives. You should note that the design of any system of controls is based in part upon certain assumptions about the likelihood of future events, and we cannot assure you that any design will succeed in achieving its stated goals under all potential future conditions, regardless of how remote. Based upon this evaluation, our Chief Executive Officer and the Chief Financial Officer concluded that our disclosure controls and procedures were effective and operating to provide reasonable assurance that we record, process, summarize, and report the information we are required to disclose in the reports that we file or submit under the Exchange Act within the time periods specified in the rules and forms of the SEC, and to provide reasonable assurance that we accumulate and communicate such information to our management, including our Chief Executive Officer and Chief Financial Officer, as appropriate to allow timely decisions about required disclosure.
Internal Control Over Financial Reporting
We made no changes in internal control over financial reporting during the
2017 third quarter
that materially affected, or are reasonably likely to materially affect, our internal control over financial reporting.
34
Item 1.
Legal Proceedings
From time to time, we are subject to legal proceedings and claims in the ordinary course of business, including adjustments proposed during governmental examinations of the various tax returns we file. While management presently believes that the ultimate outcome of these proceedings, individually and in aggregate, will not materially harm our financial position, cash flows, or overall trends in results of operations, legal proceedings are inherently uncertain, and unfavorable rulings could, individually or in aggregate, have a material adverse effect on our business, financial condition, or operating results.
Item 1A.
Risk Factors
Risks and Uncertainties
We are subject to various risks that could have a negative effect on us or on our financial condition. You should understand that these risks could cause results to differ materially from those we express in forward-looking statements contained in this report or in other Company communications. Because there is no way to determine in advance whether, or to what extent, any present uncertainty will ultimately impact our business, you should give equal weight to each of the following:
Our industry is highly competitive, which may impact our ability to compete successfully with other hotel properties and home and apartment sharing services for customers.
We operate in markets that contain many competitors. Each of our hotel brands competes with major hotel chains, as well as home and apartment sharing services, in national and international venues and with independent companies in regional markets. Our ability to remain competitive and to attract and retain business and leisure travelers depends on our success in distinguishing the quality, value, and efficiency of our lodging products and services, including our
Loyalty Programs
and consumer-facing technology platforms and services, from those offered by others. If we cannot compete successfully in these areas, our operating margins could contract, our market share could decrease, and our earnings could decline. Further, new lodging supply in individual markets could have a negative impact on the hotel industry and hamper our ability to increase room rates or occupancy in those markets.
Economic uncertainty could continue to impact our financial results and growth.
Weak economic conditions in some parts of the world, the strength or continuation of recovery in countries that have experienced improved economic conditions, changes in oil prices and currency values, potential disruptions in the U.S. economy generally and the travel business in particular that might result from the new U.S. administration’s policies in such areas as trade, travel, immigration, healthcare, and related issues, political instability in some areas, and the uncertainty over how long any of these conditions will continue, could continue to have a negative impact on the lodging industry. U.S. government travel is also a significant part of our business, and this aspect of our business may continue to suffer due to U.S. federal spending cuts, or government hiring restrictions and any further limitations that may result from presidential or congressional action or inaction. As a result of such current economic conditions and uncertainty, we continue to experience weakened demand for our hotel rooms in some markets. Recent improvements in demand trends in other markets may not continue, and our future financial results and growth could be further harmed or constrained if the recovery stalls or conditions worsen.
Risks Relating to Our Integration of Starwood
The continued diversion of resources and management’s attention to the integration of Starwood could still adversely affect our day-to-day business.
While
the integration of Starwood is well underway, it places a significant burden on our management and internal resources and will continue to do so for some time. The diversion of management’s attention away from day-to-day business concerns and any difficulties we encounter as the integration process continues could adversely affect our financial results.
Some of the anticipated benefits of combining Starwood and Marriott may still not be realized.
We decided to acquire Starwood with the expectation that the Starwood Combination will result in various benefits, including, among other things, operating efficiencies. Although we have already achieved some
of those anticipated benefits,
35
others remain subject to a number of uncertainties, including whether we can continue to integrate the business of Starwood in an efficient and effective manner and whether, and on what terms, we can reach agreement with the companies that issue our branded credit cards and the timeshare companies with whom we do business to allow us to move to a single unified reservation system and loyalty platform.
The integration process could take longer than we anticipate and involve unanticipated costs. Disruptions of each legacy company’s ongoing businesses, processes, and systems could adversely affect the combined company. We also may still encounter difficulties harmonizing our different reservations and other systems and business practices as the integration process continues. As a result of these or other factors, we cannot assure you when or that we will be able to fully realize additional benefits from the Starwood Combination in the form of eliminating duplicative costs, or achieving other operating efficiencies, cost savings, or benefits.
We may not be able to retain Legacy-Starwood personnel successfully.
The success of the Starwood Combination will depend in part on our ability to retain the talents and dedication of key Legacy-Starwood employees. It remains possible that these employees may decide not to remain with us. If key Legacy-Starwood employees who we would like to retain terminate their employment, the loss of institutional knowledge and key business relationships could cause our business to suffer.
Risks Relating to Our Business
Operational Risks
Premature termination of our management or franchise agreements could hurt our financial performance.
Our hotel management and franchise agreements may be subject to premature termination in certain circumstances, such as the bankruptcy of a hotel owner or franchisee, or a failure under some agreements to meet specified financial or performance criteria that are subject to the risks described in this section, which we fail or elect not to cure. In addition, some courts have applied principles of agency law and related fiduciary standards to managers of third-party hotel properties, including us (or have interpreted hotel management agreements as “personal services contracts”). This means, among other things, that property owners may assert the right to terminate management agreements even where the agreements provide otherwise, and some courts have upheld such assertions about our management agreements and may do so in the future. If terminations occur for these or other reasons, we may need to enforce our right to damages for breach of contract and related claims, which may cause us to incur significant legal fees and expenses. Any damages we ultimately collect could be less than the projected future value of the fees and other amounts we would have otherwise collected under the management agreement. A significant loss of agreements due to premature terminations could hurt our financial performance or our ability to grow our business.
Our lodging operations are subject to global, regional, and national conditions.
Because we conduct our business on a global platform, changes in global and regional economies impact our activities. In recent years, decreases in travel resulting from weak economic conditions and the heightened travel security measures that have resulted from the threat of further terrorism have hurt our business. Our future performance could be similarly affected by the economic and political environment in each of our operating regions, the resulting unknown pace of both business and leisure travel, and any future incidents or changes in those regions.
The growing significance of our operations outside of the United States, including as a result of the Starwood Combination, makes us increasingly susceptible to the risks of doing business internationally, which could lower our revenues, increase our costs, reduce our profits, disrupt our business, or damage our reputation.
At the end of the
2017 third quarter
, we operated or franchised hotels and resorts in
126
countries and territories. The properties we operate or franchise outside of the United States represented more than
36
percent of the rooms in our system at the end of the
2017 third quarter
. We expect that our international operations, and resulting revenues, will continue to grow. As a result, we are increasingly exposed to the challenges and risks of doing business outside the United States, many of which are outside of our control, and which could reduce our revenues or profits, increase our costs, result in significant liabilities or sanctions, otherwise disrupt our business, or damage our reputation. These challenges include: (1) compliance with complex and changing laws, regulations, and government policies that may impact our operations, such as foreign ownership restrictions, import and export controls, and trade restrictions; (2) compliance with U.S. and foreign laws that affect the activities of companies abroad, such as competition laws,
36
currency regulations, and other laws affecting dealings with certain nations; (3) limitations on our ability to repatriate non-U.S. earnings in a tax effective manner, or in some cases at all due to foreign exchange restrictions; (4) the difficulties involved in managing an organization doing business in many different countries; (5) uncertainties as to the enforceability of contract and intellectual property rights under local laws; (6) rapid changes in government policy, political or civil unrest in the Middle East and elsewhere, acts of terrorism, or the threat of international boycotts or U.S. anti-boycott legislation; and (7) currency exchange rate fluctuations, which may impact the results and cash flows of our international operations.
Any failure by our international operations to comply with anti-corruption laws or trade sanctions could increase our costs, reduce our profits, limit our growth, harm our reputation, or subject us to broader liability.
We are subject to restrictions imposed by the U.S. FCPA and anti-corruption laws and regulations of other countries applicable to our operations, such as the UK Bribery Act. Anti-corruption laws and regulations generally prohibit companies and their intermediaries from making improper payments to government officials or other persons in order to receive or retain business. These laws also require us to maintain adequate internal controls and accurate books and records. As a result of the Starwood Combination, we now have more properties in countries outside of the U.S., including in many parts of the world where corruption is common, and our compliance with anti-corruption laws may potentially conflict with local customs and practices. The compliance programs, internal controls and policies we and, prior to the Merger Date, Starwood, maintain and enforce to promote compliance with applicable anti-bribery and anti-corruption laws may not prevent our associates, contractors or agents from acting in ways prohibited by these laws and regulations. We are also subject to trade sanctions administered by the Office of Foreign Assets Control and the U.S. Department of Commerce. Our compliance programs and internal controls also may not prevent conduct that is prohibited under these rules. The United States may impose additional sanctions at any time against any country in which or with whom we do business. Depending on the nature of the sanctions imposed, our operations in the relevant country could be restricted or otherwise adversely affected. Any violations of anti-corruption laws and regulations or trade sanctions could result in significant civil and criminal penalties, reduce our profits, disrupt or have a material adverse effect on our business, damage our reputation, or result in lawsuits being brought against the Company or its officers or directors. In addition, the operation of these laws or an imposition of further restrictions in these areas could increase our cost of operations, reduce our profits or cause us to forgo development opportunities, or cease operations in certain countries, that would otherwise support growth.
In connection with the Starwood Combination, we are currently assessing various regulatory compliance matters at several foreign Legacy-Starwood locations, including compliance with the U.S. FCPA. The results of this assessment may give rise to contingencies that could require us to accrue expenses, the amounts of which we are not able to currently estimate.
Exchange rate fluctuations and foreign exchange hedging arrangements could result in significant foreign currency gains and losses and affect our business results.
We earn revenues and incur expenses in foreign currencies as part of our operations outside of the United States. Accordingly, fluctuations in currency exchange rates may significantly increase the amount of U.S. dollars required for foreign currency expenses or significantly decrease the U.S. dollars we receive from foreign currency revenues. We are also exposed to currency translation risk because the results of our business outside of the U.S. are generally reported in local currency, which we then translate to U.S. dollars for inclusion in our consolidated financial statements. As a result, changes between the foreign exchange rates and the U.S. dollar affect the amounts we record for our foreign assets, liabilities, revenues and expenses, and could have a negative effect on our financial results. We expect that our exposure to foreign currency exchange rate fluctuations will grow as the relative contribution of our non-U.S. operations increases. Our efforts to mitigate some of our foreign currency exposure by entering into foreign exchange hedging agreements with financial institutions to reduce exposures to some of the principal currencies in which we receive management and franchise fees may not be successful. In addition, these hedging agreements also do not cover all currencies in which we do business, do not eliminate foreign currency risk entirely for the currencies that they do cover, and involve costs and risks of their own in the form of transaction costs, credit requirements and counterparty risk.
Some of our management agreements and related contracts require us to make payments to owners if the hotels do not achieve specified levels of operating profit.
Some of our contracts with hotel owners require that we
37
fund shortfalls if the hotels do not attain specified levels of operating profit. We may not be able to recover any fundings of such performance guarantees, which could lower our profits and reduce our cash flows.
Our new programs and new branded products may not be successful.
We cannot assure you that recently launched, newly acquired, or recently announced brands, such as EDITION, AC Hotels by Marriott in the Americas, Protea Hotels, Moxy Hotels, Delta Hotels, and those we acquired as a result of the Starwood Combination, our recently announced investments in PlacePass and the joint venture with Alibaba, or any other new programs or products we may launch in the future, will be accepted by hotel owners, potential franchisees, or the traveling public or other customers. We also cannot be certain that we will recover the costs we incurred in developing or acquiring the brands or any new programs or products, or that the brands or any new programs or products will be successful. In addition, some of our new or newly acquired brands involve or may involve cooperation and/or consultation with one or more third parties, including some shared control over product design and development, sales and marketing, and brand standards. Disagreements with these third parties could slow the development of these new brands and/or impair our ability to take actions we believe to be advisable for the success and profitability of such brands.
Risks relating to natural or man-made disasters, contagious disease, terrorist activity, and war could reduce the demand for lodging, which may adversely affect our revenues.
So called “Acts of God,” such as hurricanes, earthquakes, tsunamis, and other natural disasters, such as 2017 hurricanes Harvey, Irma, and Maria, that caused severe damage in Houston, the Florida Keys, Puerto Rico, the U.S. Virgin Islands, and many other Caribbean islands, the earthquake and tsunami in Japan, and man-made disasters in recent years as well as the potential spread of contagious diseases such as MERS (Middle East Respiratory Syndrome), Zika virus, and Ebola in locations where we own, manage, or franchise significant properties and areas of the world from which we draw a large number of customers, could cause a decline in business or leisure travel and reduce demand for lodging. Actual or threatened war, terrorist activity, political unrest, or civil strife, such as recent events in Las Vegas, Fort Lauderdale, Orlando, Barcelona, Berlin, Brussels, London, Manchester, Paris, Turkey, Ukraine and Russia, the Middle East, and other geopolitical uncertainty could have a similar effect. Any one or more of these events may reduce the overall demand for hotel rooms and corporate apartments or limit the prices that we can obtain for them, both of which could adversely affect our profits. If a terrorist event were to involve one or more of our branded properties, demand for our hotels in particular could suffer, which would further hurt our revenues and profits.
Disagreements with owners of hotels that we manage or franchise may result in litigation or may delay implementation of product or service initiatives.
Consistent with our focus on management and franchising, we own very few of our lodging properties. The nature of our responsibilities under our management agreements to manage each hotel and enforce the standards required for our brands under both management and franchise agreements may be subject to interpretation and will from time to time give rise to disagreements, which may include disagreements over the need for or payment for new product, service or systems initiatives, the timing and amount of capital investments, and reimbursement for certain system initiatives and costs. Such disagreements may be more likely when hotel returns are weaker. We seek to resolve any disagreements in order to develop and maintain positive relations with current and potential hotel owners and joint venture partners, but we are not always able to do so. Failure to resolve such disagreements has resulted in litigation, and could do so in the future. If any such litigation results in an adverse judgment, settlement, or court order, we could suffer significant losses, our profits could be reduced, or our future ability to operate our business could be constrained.
Our business depends on the quality and reputation of our brands, and any deterioration in the quality or reputation of these brands could have an adverse impact on our market share, reputation, business, financial condition, or results of operations.
Events that may be beyond our control could affect the reputation of one or more of our properties or more generally impact the reputation of our brands. Many other factors also can influence our reputation and the value of our brands, including service, food quality and safety, availability and management of scarce natural resources, supply chain management, diversity, human rights, and support for local communities. If the reputation or perceived quality of our brands declines, our market share, reputation, business, financial condition, or results of operations could be affected.
If our brands, goodwill or other intangible assets become impaired, we may be required to record significant non-cash charges to earnings.
As of
September 30, 2017
, we had
$17.9 billion
of goodwill and other intangible
38
assets, including
$15.4 billion
attributable to the Starwood Combination. We review goodwill and indefinite-lived intangible assets for impairment annually or whenever events or circumstances indicate impairment may have occurred. Estimated fair values of our brands or reporting units could change if, for example, there are changes in the business climate, unanticipated changes in the competitive environment, adverse legal or regulatory actions or developments, changes in customers’ perception of and the reputation of the Legacy-Starwood brands, or changes in interest rates, operating cash flows, or market capitalization. Because of the significance of our goodwill and other intangible assets, any future impairment of these assets could require material non-cash charges to our results of operations, which could have a material adverse effect on our financial condition and results of operations.
Actions by our franchisees and licensees could adversely affect our image and reputation.
We franchise and license many of our brand names and trademarks to third parties in connection with lodging, timeshare, residential services, and our credit card programs. Under the terms of their agreements with us, our franchisees and licensees interact directly with customers and other third parties under our brand and trade names. If these franchisees or licensees fail to maintain or act in accordance with applicable brand standards; experience operational problems, including any data breach involving customer information; or project a brand image inconsistent with ours, our image and reputation could suffer. Although our franchise and license agreements provide us with recourse and remedies in the event of a breach by the franchisee or licensee, including termination of the agreements under certain circumstances, pursuing any such recourse, remedy, or termination could be expensive and time consuming
.
In addition, we cannot assure you that a court would ultimately enforce our contractual termination rights in every instance.
Damage to, or losses involving, properties that we own, manage, or franchise may not be covered by insurance, or the cost of such insurance could increase.
Marriott procures on behalf of or requires our managed hotel owners to procure comprehensive property and liability insurance policies for our managed, leased, and owned properties with coverage features and insured limits that we believe are customary, and require our franchisees to maintain similar levels of insurance. Market forces beyond our control may nonetheless limit the scope of the insurance coverage we or our franchisees can obtain, or our or their ability to obtain coverage at reasonable rates. Certain types of losses, generally of a catastrophic nature, such as earthquakes, hurricanes, and floods, or terrorist acts, or liabilities that result from breaches in the security of our information systems, may result in high deductibles, low limits, or may be uninsurable or too expensive to justify obtaining insurance. As a result, we and our franchisees may not be successful in obtaining insurance without increases in cost or decreases in coverage levels, and we expect substantial increases in property insurance costs in 2018 and possibly future years as a result of the severe and widespread damage caused by the 2017 Atlantic hurricane season. In addition, in the event of a substantial loss, the insurance coverage we or our franchisees carry may not be sufficient to pay the full market value or replacement cost of any lost investment or in some cases could result in certain losses being totally uninsured. As a result, we could lose some or all of any capital that we have invested in a property, as well as the anticipated future revenue from the property, and we could remain obligated for guarantees, debt, or other financial obligations for the property.
Development and Financing Risks
While
we are predominantly a manager and franchisor of hotel properties, our hotel owners depend on capital to buy, develop, and improve hotels, and our hotel owners may be unable to access capital when necessary.
In order to fund new hotel investments, as well as refurbish and improve existing hotels, both we and current and potential hotel owners must periodically spend money. The availability of funds for new investments and improvement of existing hotels by our current and potential hotel owners depends in large measure on capital markets and liquidity factors, over which we can exert little control. The difficulty of obtaining financing on attractive terms may be constrained by the capital markets for hotel and real estate investments. In addition, owners of existing hotels that we franchise or manage may have difficulty meeting required debt service payments or refinancing loans at maturity.
Our growth strategy depends upon third-party owners/operators, and future arrangements with these third parties may be less favorable.
Our growth strategy for development of additional lodging facilities entails entering into and maintaining various arrangements with property owners. The terms of our management agreements, franchise agreements, and leases for each of our lodging facilities are influenced by contract terms offered by our
39
competitors, among other things. We cannot assure you that any of our current arrangements will continue or that we will be able to enter into future collaborations, renew agreements, or enter into new agreements in the future on terms that are as favorable to us as those that exist today.
Our ability to grow our management and franchise systems is subject to the range of risks associated with real estate investments.
Our ability to sustain continued growth through management or franchise agreements for new hotels and the conversion of existing facilities to managed or franchised Marriott brands is affected, and may potentially be limited, by a variety of factors influencing real estate development generally. These include site availability, financing, planning, zoning and other local approvals, and other limitations that may be imposed by market and submarket factors, such as projected room occupancy, changes in growth in demand compared to projected supply, territorial restrictions in our management and franchise agreements, costs of construction, and anticipated room rate structure.
Our development activities expose us to project cost, completion, and resale risks.
We develop new hotel and residential properties, both directly and through partnerships, joint ventures, and other business structures with third parties. As demonstrated by the impairment charges that we recorded in 2015 and 2014 in connection with our development and construction of three EDITION hotels and residences, our ongoing involvement in the development of properties presents a number of risks, including that: (1) continued weakness in the capital markets may limit our ability, or that of third parties with whom we do business, to raise capital for completion of projects that have commenced or for development of future properties; (2) properties that we develop could become less attractive due to decreases in demand for hotel and residential properties, market absorption or oversupply, with the result that we may not be able to sell such properties for a profit or at the prices or selling pace we anticipate, potentially requiring additional changes in our pricing strategy that could result in further charges; (3) construction delays, cost overruns, lender financial defaults, or so called “Acts of God” such as earthquakes, hurricanes, floods, or fires may increase overall project costs or result in project cancellations; and (4) we may be unable to recover development costs we incur for any projects that we do not pursue to completion.
Our owned properties and other real estate investments subject us to numerous risks
. Although we had relatively few owned and leased properties at the end of the
2017 third quarter
, we acquired a significant number of those properties as part of the Starwood Combination, and such properties are subject to the risks that generally relate to investments in real property. Although we intend to sell most of our owned and leased properties over the next two years, equity real estate investments can be difficult to sell quickly, and we may not be able to do so at prices we find acceptable or at all. Moreover, the investment returns available from equity investments in real estate depend in large part on the amount of income earned and capital appreciation generated by the related properties, and the expenses incurred. A variety of other factors also affect income from properties and real estate values, including governmental regulations, insurance, zoning, tax and eminent domain laws, interest rate levels, and the availability of financing. For example, new or existing real estate zoning or tax laws can make it more expensive and/or time-consuming to develop real property or expand, modify, or renovate hotels. When interest rates increase, the cost of acquiring, developing, expanding, or renovating real property increases and real property values may decrease as the number of potential buyers decreases. Similarly, as financing becomes less available, it becomes more difficult both to acquire and to sell real property. Finally, under eminent domain laws, governments can take real property. Sometimes this taking is for less compensation than the owner believes the property is worth. Despite our asset-light strategy, our real estate properties could be impacted by any of these factors, resulting in a material adverse impact on our results of operations or financial condition. If our properties do not generate revenue sufficient to meet operating expenses, including needed capital expenditures, our income will be adversely affected.
Development activities that involve our co-investment with third parties may result in disputes that could increase project costs, impair project operations, or increase project completion risks.
Partnerships, joint ventures, and other business structures involving our co-investment with third parties which we have entered into or acquired as part of the Starwood Combination generally include some form of shared control over the operations of the business and create added risks, including the possibility that other investors in such ventures could become bankrupt or otherwise lack the financial resources to meet their obligations, or could have or develop business interests, policies, or objectives that are inconsistent with ours. Actions by another investor may present additional risks of project delay, increased project costs, or operational difficulties following project completion. Such disputes may also be more likely in difficult business environments.
40
Investing through partnerships or joint ventures decreases our ability to manage risk.
In addition to acquiring or developing hotels and resorts or acquiring companies that complement our business directly, Starwood, and to the lesser extent Marriott, has from time to time invested, and we may continue to invest, as a co-venturer. Such arrangements often have shared control over the operation of the assets. Therefore, such investments may involve risks such as the possibility that the co-venturer might become bankrupt or not have the financial resources to meet its obligations. Should a venture partner become bankrupt we could become liable for our partner’s share of venture’s liabilities. Also, our venture partner may have economic or business interests or goals that are inconsistent with our economic or business interests or goals, may be in a position to take action contrary to our instructions, or may make requests contrary to our policies or objectives. Further, we may be unable to take action without the approval of our venture partners and, alternatively, our venture partners could take actions binding on the venture or partnership without our consent. Therefore, actions by a co-venturer might subject the assets owned by the venture or partnership to additional risk. We cannot assure you that our investments through partnerships or joint ventures will be successful despite these risks.
Risks associated with development and sale of residential properties associated with our lodging properties or brands may reduce our profits.
In certain hotel and timeshare projects we participate, directly or through noncontrolling interests and/or licensing agreements, in the development and sale of residential properties associated with our brands, including residences and condominiums under our JW Marriott, The Ritz-Carlton, The Ritz-Carlton Reserve, W Hotels, The Luxury Collection, St. Regis, EDITION, Bulgari Hotels & Resorts, Marriott Hotels, Sheraton, Westin, and Autograph Collection Hotels brand names and trademarks. Such projects pose further risks beyond those generally associated with our lodging business, which may reduce our profits or compromise our brand equity, including the following: (1) weakness in residential real estate and demand generally may reduce our profits and could make it more difficult to convince future hotel development partners of the value added by our brands; (2) increases in interest rates, reductions in mortgage availability, or increases in the costs of residential ownership could prevent potential customers from buying residential products or reduce the prices they are willing to pay; and (3) residential construction may be subject to warranty and liability claims, and the costs of resolving such claims may be significant.
Some hotel openings in our existing development pipeline and approved projects may be delayed or not result in new hotels, which could adversely affect our growth prospects.
We report a significant number of hotels in our development pipeline, including hotels under construction and under signed contracts, as well as hotels approved for development but not yet under signed contracts. The eventual opening of such pipeline hotels and, in particular, the hotels approved for development that are not yet under contract, is subject to numerous risks, including in some cases the owner’s or developer’s ability to obtain adequate financing or governmental or regulatory approvals. Accordingly, we cannot assure you that our development pipeline, and in particular hotels not yet under contract, will result in new hotels that enter our system, or that those hotels will open when we anticipate.
If we incur losses on loans or loan guarantees that we have made to third parties, our profits could decline.
At times, we make loans for hotel development or renovation expenditures in connection with entering into or amending management or franchise agreements. From time to time we also provide third-party lenders financial guarantees for the timely repayment of all or a portion of debt related to hotels that we manage or franchise, generally subject to an obligation that the owner reimburse us for any fundings. We could suffer losses if hotel owners or franchisees default on loans that we provide or fail to reimburse us for loan guarantees that we have funded.
If owners of hotels that we manage or franchise cannot repay or refinance mortgage loans secured by their properties, our revenues and profits could decrease and our business could be harmed.
The owners of many of our managed or franchised properties have pledged their hotels as collateral for mortgage loans that they entered into when those properties were purchased or refinanced. If those owners cannot repay or refinance maturing indebtedness on favorable terms or at all, the lenders could declare a default, accelerate the related debt, and repossess the property. Such sales or repossessions could, in some cases, result in the termination of our management or franchise agreements and eliminate our anticipated income and cash flows, which could negatively affect our results of operations.
41
Technology, Information Protection, and Privacy Risks
A failure to keep pace with developments in technology could impair our operations or competitive position.
The lodging industry continues to demand the use of sophisticated technology and systems, including those used for our reservation, revenue management, and property management systems, our
Loyalty Programs
, and technologies we make available to our guests. These technologies and systems must be refined, updated, and/or replaced with more advanced systems on a regular basis, and if we cannot do so as quickly as our competitors or within budgeted costs and time frames, our business could suffer. We also may not achieve the benefits that we anticipate from any new technology or system, and a failure to do so could result in higher than anticipated costs or could impair our operating results.
An increase in the use of third-party Internet services to book online hotel reservations could adversely impact our business.
Some of our hotel rooms are booked through Internet travel intermediaries such as Expedia.com
®
, Priceline.com
®
, Booking.com™, Travelocity.com
®
, and Orbitz.com
®
, as well as lesser-known online travel service providers. These intermediaries initially focused on leisure travel, but now also provide offerings for corporate travel and group meetings. Although Marriott’s and Starwood’s respective Best Rate Guarantee programs have helped prevent customer preference shift to the intermediaries and greatly reduced the ability of intermediaries to undercut the published rates at our hotels, intermediaries continue to use a variety of aggressive online marketing methods to attract customers, including the purchase, by certain companies, of trademarked online keywords such as “Marriott” from Internet search engines such as Google
®
, Bing
®
, Yahoo
®
, and Baidu
®
to steer customers toward their websites (a practice that has been challenged by various trademark owners in federal court). Although Marriott has successfully limited these practices through contracts with key online intermediaries, the number of intermediaries and related companies that drive traffic to intermediaries’ websites is too large to permit us to eliminate this risk entirely. Our business and profitability could be harmed if online intermediaries succeed in significantly shifting loyalties from our lodging brands to their travel services, diverting bookings away from Marriott and Starwood direct online channels, or through their fees increasing the overall cost of Internet bookings for our hotels. In addition, if we fail to reach satisfactory agreements with intermediaries as our contracts with them come up for periodic renewal, our hotels might no longer appear on their websites and we could lose business as a result.
We are exposed to risks and costs associated with protecting the integrity and security of internal and customer data
. Our businesses process, use, and transmit large volumes of internal employee and customer data, including credit card numbers and other personal information in various information systems that we maintain and in those maintained by third parties, including our owners, franchisees and licensees, as well as our service providers, in areas such as human resources outsourcing, website hosting, and various forms of electronic communications. The integrity and protection of that customer, employee, and company data is critical to our business. If that data is inaccurate or incomplete, we could make faulty decisions.
Our customers and employees also have a high expectation that we, as well as our owners, franchisees, licensees, and service providers, will adequately protect their personal information. The information, security, and privacy requirements imposed by governmental regulation and the requirements of the payment card industry are also increasingly demanding, in both the United States and other jurisdictions where we operate. Our systems and the systems maintained or used by our owners, franchisees, licensees, and service providers may not be able to satisfy these changing requirements and employee and customer expectations, or may require significant additional investments or time in order to do so.
Cyber-attacks could have a disruptive effect on our business
. Efforts to hack or breach security measures, failures of systems or software to operate as designed or intended, viruses, “ransomware” or other malware, operator error, or inadvertent releases of data may materially impact our, including our owners’, franchisees’, licensees’, or service providers’, information systems and records. Our reliance on computer, Internet-based and mobile systems and communications and the frequency and sophistication of efforts by hackers to gain unauthorized access or prevent authorized access to such systems have increased significantly in recent years. A significant theft, loss, loss of access to, or fraudulent use of customer, employee, or company data could adversely impact our reputation and could result in remedial and other expenses, fines, or litigation. Breaches in the security of our information systems or those of our owners, franchisees, licensees, or service providers or other disruptions
42
in data services could lead to an interruption in the operation of our systems, resulting in operational inefficiencies and a loss of profits. In addition, although we carry cyber/privacy liability insurance that is designed to protect us against certain losses related to cyber risks, such insurance coverage may be insufficient to cover all losses or all types of claims that may arise in connection with cyber-attacks, security breaches, and other related breaches. Furthermore, in the future such insurance may not be available to us on commercially reasonable terms, or at all.
Changes in privacy law could increase our operating costs and adversely affect our ability to market our products effectively.
We are subject to numerous laws, regulations, and contractual obligations designed to protect personal information, including foreign data protection laws, various U.S. federal and state laws, and credit card industry security standards and other applicable information privacy and security standards. Compliance with changes in applicable privacy regulations may increase our operating costs.
Additionally, we rely on a variety of direct marketing techniques, including email marketing, online advertising, and postal mailings. Any further restrictions in laws such as the CANSPAM Act, and various U.S. state laws, or new federal laws on marketing and solicitation or international data protection laws that govern these activities could adversely affect the continuing effectiveness of email, online advertising, and postal mailing techniques and could force further changes in our marketing strategy. If this occurs, we may not be able to develop adequate alternative marketing strategies, which could impact the amount and timing of our sales of certain products. We also obtain access to potential customers from travel service providers or other companies with whom we have substantial relationships and market to some individuals on these lists directly or by including our marketing message in the other company’s marketing materials. If access to these lists was prohibited or otherwise restricted, our ability to develop new customers and introduce them to our products could be impaired.
Any disruption in the functioning of our reservation systems, such as in connection with our integration of Starwood, could adversely affect our performance and results.
We manage global reservation systems that communicate reservations to our branded hotels that individuals make directly with us online, through our mobile apps, or through our telephone call centers, or through intermediaries like travel agents, Internet travel websites, and other distribution channels. The cost, speed, accuracy and efficiency of our reservation systems are critical aspects of our business and are important considerations for hotel owners when choosing our brands. Our business may suffer if we fail to maintain, upgrade, or prevent disruption to our reservation systems. In addition, the risk of disruption in the functioning of our global reservation systems could increase in connection with the systems integration that we anticipate undertaking as part of our integration of Starwood. Disruptions in or changes to our reservation systems could result in a disruption to our business and the loss of important data.
Other Risks
Changes in laws and regulations could reduce our profits or increase our costs.
We are subject to a wide variety of laws, regulations, and policies in jurisdictions around the world, including those for financial reporting, taxes, healthcare, climate change, and the environment. Changes to these laws, regulations, or policies, including those associated with health care, tax or financial reforms, climate change and the environment, could reduce our profits. We also anticipate that many of the jurisdictions where we do business will continue to review taxes and other revenue raising measures, and any resulting changes could impose new restrictions, costs, or prohibitions on our current practices or reduce our profits. In particular, governments may revise tax laws, regulations, or official interpretations in ways that could significantly impact us, including modifications that could reduce the profits that we can effectively realize from our non-U.S. operations, or that could require costly changes to those operations, or the way in which they are structured. For example, most U.S. company effective tax rates reflect the fact that income earned and reinvested outside the United States is generally taxed at local rates, which are often much lower than U.S. tax rates. If changes in tax laws, regulations, or interpretations significantly increase the tax rates on non-U.S. income, our effective tax rate could increase and our profits could be reduced. If such increases resulted from our status as a U.S. company, those changes could place us at a disadvantage to our non-U.S. competitors if those competitors remain subject to lower local tax rates.
If we cannot attract and retain talented associates, our business could suffer.
We compete with other companies both within and outside of our industry for talented personnel. If we cannot recruit, train, develop, and retain sufficient numbers of talented associates, we could experience increased associate turnover, decreased guest
43
satisfaction, low morale, inefficiency, or internal control failures. Insufficient numbers of talented associates could also limit our ability to grow and expand our businesses. Any shortage of skilled labor could also require higher wages that would increase our labor costs, which could reduce our profits.
Delaware law and our governing corporate documents contain, and our Board of Directors could implement, anti-takeover provisions that could deter takeover attempts.
Under the Delaware business combination statute, a shareholder holding 15 percent or more of our outstanding voting stock could not acquire us without Board of Director consent for at least three years after the date the shareholder first held 15 percent or more of the voting stock. Our governing corporate documents also, among other things, require supermajority votes for mergers and similar transactions. In addition, our Board of Directors could, without shareholder approval, implement other anti-takeover defenses, such as a shareholder rights plan.
Item 2.
Unregistered Sales of Equity Securities and Use of Proceeds
|
(a)
|
Unregistered Sale of Securities
|
None.
|
(b)
|
Use of Proceeds
|
None.
|
(c)
|
Issuer Purchases of Equity Securities
|
|
(in millions, except per share amounts)
Period
|
Total Number
of Shares
Purchased
|
Average Price
per Share
|
Total Number of
Shares Purchased as Part of Publicly
Announced Plans or
Programs (1) |
Maximum Number
of Shares That May Yet Be Purchased
Under the Plans or
Programs (1) |
|||||||||
|
July 1, 2017 - July 31, 2017
|
2.0
|
|
$
|
101.50
|
|
2.0
|
|
15.4
|
|
||||
|
August 1, 2017 - August 31, 2017
|
2.5
|
|
$
|
100.09
|
|
2.5
|
|
12.9
|
|
||||
|
September 1, 2017 - September 30, 2017
|
3.3
|
|
$
|
106.07
|
|
3.3
|
|
9.6
|
|
||||
|
(1)
|
On February 11, 2016, we announced that our Board of Directors increased the authorization to repurchase our common stock by 25 million shares as part of an ongoing share repurchase program. As of
September 30, 2017
,
9.6 million
shares remained available for repurchase under Board approved authorizations. We may repurchase shares in the open market or in privately negotiated transactions.
|
44
Item 6.
Exhibits
|
Exhibit
No.
|
Description
|
Incorporation by Reference
(where a report is indicated below, that
document has been previously filed with
the SEC and the applicable exhibit is
incorporated by reference thereto)
|
||
|
3.1
|
Restated Certificate of Incorporation.
|
|||
|
3.2
|
Amended and Restated Bylaws.
|
|||
|
12
|
Statement of Computation of Ratio of Earnings to Fixed Charges.
|
|||
|
31.1
|
Certification of Chief Executive Officer Pursuant to Rule 13a-14(a).
|
|||
|
31.2
|
Certification of Chief Financial Officer Pursuant to Rule 13a-14(a).
|
|||
|
32
|
Section 1350 Certifications.
|
|||
|
101.INS
|
XBRL Instance Document.
|
Submitted electronically with this report.
|
||
|
101.SCH
|
XBRL Taxonomy Extension Schema Document.
|
Submitted electronically with this report.
|
||
|
101.CAL
|
XBRL Taxonomy Calculation Linkbase Document.
|
Submitted electronically with this report.
|
||
|
101.DEF
|
XBRL Taxonomy Extension Definition Linkbase Document.
|
Submitted electronically with this report.
|
||
|
101.LAB
|
XBRL Taxonomy Label Linkbase Document.
|
Submitted electronically with this report.
|
||
|
101.PRE
|
XBRL Taxonomy Presentation Linkbase Document.
|
Submitted electronically with this report.
|
||
We have submitted electronically the following documents formatted in XBRL (Extensible Business Reporting Language) as Exhibit 101 to this report: (i) the Condensed Consolidated Statements of Income for the
three and nine months ended
September 30, 2017
and
September 30, 2016
; (ii) the Condensed Consolidated Statements of Comprehensive Income for the
three and nine months ended
September 30, 2017
and
September 30, 2016
; (iii) the Condensed Consolidated Balance Sheets at
September 30, 2017
and
December 31, 2016
; and (iv) the Condensed Consolidated Statements of Cash Flows for the
nine months ended
September 30, 2017
and
September 30, 2016
.
45
SIGNATURE
Pursuant to the requirements of the Securities Exchange Act of 1934, the registrant has duly caused this report to be signed on its behalf by the undersigned thereunto duly authorized.
|
MARRIOTT INTERNATIONAL, INC.
|
|
8
th
day of November, 2017
|
|
|
|
/s/ Bao Giang Val Bauduin
|
|
Bao Giang Val Bauduin
|
|
Controller and Chief Accounting Officer
(Duly Authorized Officer) |
46
TABLE OF CONTENTS
Part I Financial InformationItem 1. Financial StatementsItem 2. Management S Discussion and Analysis Of Financial Condition and Results Of OperationsItem 3. Quantitative and Qualitative Disclosures About Market RiskItem 4. Controls and ProceduresPart II Other InformationItem 1. Legal ProceedingsItem 1A. Risk FactorsItem 2. Unregistered Sales Of Equity Securities and Use Of ProceedsItem 6. Exhibits